Embed Size (px)
Citation preview
Mapping the UK interbank system
Sam Langfield, (1)
Zijun Liu (2)
and Tomohiro Ota (3)
Abstract
This paper describes the features of the UK interbank system, using a new regulatory dataset on
interbank exposures broken down by counterparty and instrument. To our knowledge, this
dataset is the most granular representation of a large interbank market available worldwide. We
show that the system clearly exhibits a 'hub and spoke', or core-periphery, structure. Most of the
176 banks resident in the UK are counterparties to a handful of core banks. But structure varies
significantly by asset class. We interpret these findings in light of existing theories regarding the
formation of networks and their resilience.
___________________________________________________________________________________
(1) UK Financial Services Authority and European Systemic Risk Board Secretariat. Email: [email protected]
(2) UK Financial Services Authority. Email: [email protected]
(3) Bank of England. Email: [email protected]
The views expressed in this paper are those of the authors, and not necessarily those of the Bank of England, Financial Services Authority, or
European Systemic Risk Board.
We are grateful to Omer Bugarinovic for excellent research assistance. The following people provided valuable contributions and comments:
Piergiorgio Alessandri, Andrew Bailey, Giovanni Bassani, David Baumslag, Mario Eboli, Sanjeev Goyal, Eliza Hammel, Anna Jernova, Sujit Kapadia, Dror Kenett, Jakob Lund, Marco Marinopiccoli, Matteo Marsili, Jack McKeown, Paolo Mistrulli, Claus Puhr, Ben Richardson, David
Rule, Gerhard Ruenstler, Andrei Sarychev and Martin Scheicher; and seminar participants at the Bank of England, Financial Services Authority,
the Latsis Symposium 2012 at Zurich ETH, and the Analysis Working Group of the European Systemic Risk Board. We would also like to thank Ben Craig and Goetz von Peter for sharing code; and Samantha Cook, Kristian Dupont and Kimmo Soramäki of Financial Network Analysis for
developing superb networks graphing software. Any errors are the authors’.
2
Contents
1 Introduction 3
2 Data 4
3 Description of the Interbank Market 8
3.1 The Interbank Market by Instrument 9
3.2 The Interbank Market by Bank Sector and Country 11
3.3 The Interbank Market by Banks’ Market Risks 14
4 Method 20
4.1 The Complexities of Financial Networks 20
4.2 Defining Network Metrics 22
5 Network Properties of the Interbank System 24
5.1 Network Statistics 24
5.2 Structure of the Interbank System 27
6 Interpretation 33
6.1 Theory of Network Formation 33
6.2 Financial Stability Implications 35
Appendix: Network Graphs 38
References 41
Summary
<Summary text – maximum length two pages>
3
‘Focus on the wood, not the trees.’1
1 Introduction
Before 2007, financial regulation erred by insufficiently focusing on the stability of the financial
system as a whole. The Turner Review identified deficient macroprudential regulation as ‘far
more important to the origins of the crisis than any specific failure in supervisory process’ (FSA,
2009). One tenet of macroprudential regulation is that the structure of the financial system –
particularly how banks are connected – matters for the ability of the system to contain shocks
(Allen and Gale, 2000; Freixas, Parigi and Rochet, 2000). On one hand, structure might enable
intermediaries to pool risk, thus reducing aggregate damage by distributing the effect of shocks
more evenly across the system. On the other hand, structure might propagate and amplify
shocks, leading to second-round effects which dwarf initial costs. Before the crisis, regulators
and market participants placed too much faith on the benefits of risk sharing, without due
consideration of the costs of risk propagation.
Structure matters for systemic resilience. But the precise structure of the UK interbank system
was hitherto only partially observed. This paper fills that gap. In particular, we make four
contributions to collective understanding of the UK interbank system. First, the paper is based
on a newly available regulatory dataset on interbank exposures broken down by counterparty
and instrument. Due to data constraints, previous studies could analyse interbank markets only
by making strong assumptions regarding unobserved relationships. Second, we describe the
structure of the interbank system along three dimensions: by instrument; by bank sector; and by
banks’ market risks. Third, we adapt network theory to four complexities inherent in financial
markets: directed links; weighted links; multiple links; and node-heterogeneity. Fourth, analysis
reveals that the network of interbank exposures closely approximates a ‘hub and spoke’, or core-
periphery, structure. Most banks are connected to a handful of core banks, which are strongly
connected to each other.
We are motivated by three considerations. First, ‘network information is a classic public good’
(Haldane, 2009). Such information allows financial players to better understand the system in
which they operate. Battiston et al (2009) purport tension between individual risk and systemic
1 Mervyn King (2012), BBC Today Programme Lecture.
4
risk, since individual entities do not internalise their impact on the wider system. The first step
towards internalising externalities consists in reducing information gaps with respect to those
externalities. Second, information contained in this paper will inform ongoing policy debate
regarding banking structure (ICB, 2011), counterparty clearing houses (Tucker, 2011) and
capital surcharges for systemically important banks (BCBS, 2011). Third, this paper lies at the
intersection of literature on networks and banking. Papers on financial networks have ballooned
in quantity over recent years, but conclusive insights remain elusive. Our paper contributes
much-needed evidence regarding the structure of the UK interbank system.
The paper is structured as follows. In the next section, we describe the new regulatory dataset. In
the third section, we describe the general features of those data. The fourth section details our
method, which accounts for certain complexities inherent in financial networks. Results are
presented in section five, in which we first discuss network statistics, and then establish the
closeness of the UK interbank system to a core-periphery model. The sixth section provides
economic interpretation of these results, in light of existing theories regarding network
formation and the resilience of systemic structures.
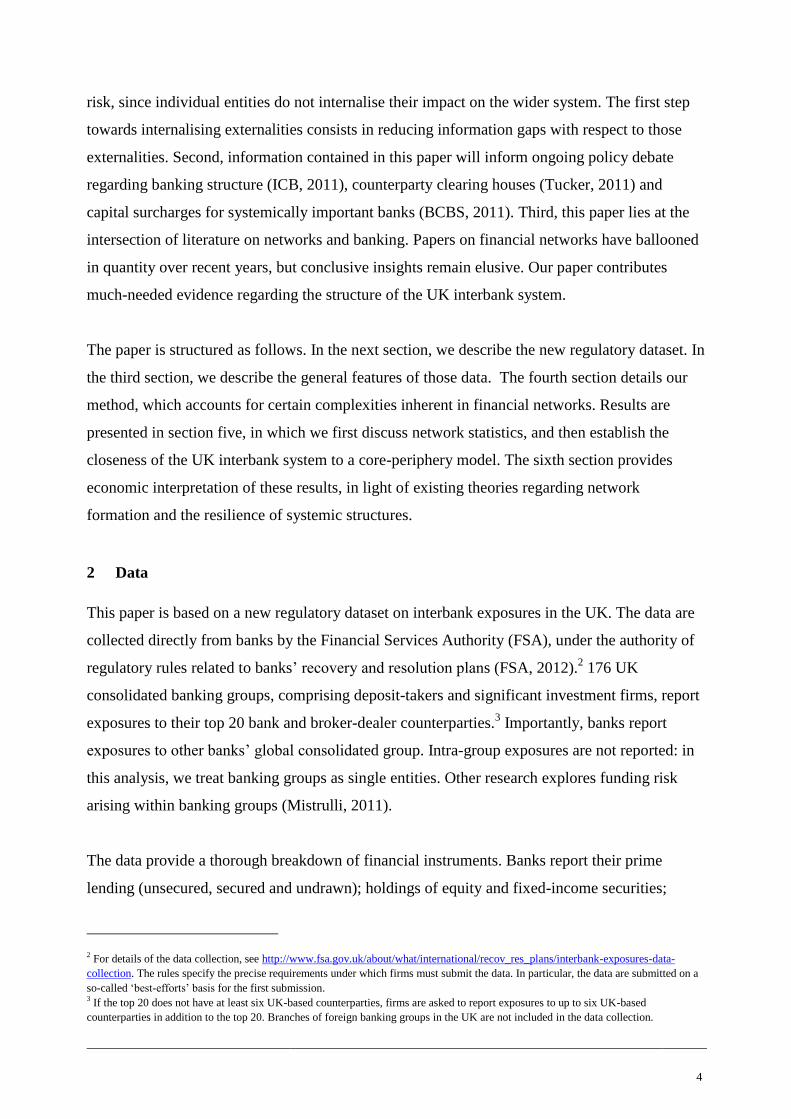
2 Data
This paper is based on a new regulatory dataset on interbank exposures in the UK. The data are
collected directly from banks by the Financial Services Authority (FSA), under the authority of
regulatory rules related to banks’ recovery and resolution plans (FSA, 2012).2 176 UK
consolidated banking groups, comprising deposit-takers and significant investment firms, report
exposures to their top 20 bank and broker-dealer counterparties.3 Importantly, banks report
exposures to other banks’ global consolidated group. Intra-group exposures are not reported: in
this analysis, we treat banking groups as single entities. Other research explores funding risk
arising within banking groups (Mistrulli, 2011).
The data provide a thorough breakdown of financial instruments. Banks report their prime
lending (unsecured, secured and undrawn); holdings of equity and fixed-income securities;
2 For details of the data collection, see http://www.fsa.gov.uk/about/what/international/recov_res_plans/interbank-exposures-data-
collection. The rules specify the precise requirements under which firms must submit the data. In particular, the data are submitted on a
so-called ‘best-efforts’ basis for the first submission. 3 If the top 20 does not have at least six UK-based counterparties, firms are asked to report exposures to up to six UK-based
counterparties in addition to the top 20. Branches of foreign banking groups in the UK are not included in the data collection.
5
credit default swaps bought and sold; securities lending and borrowing (gross and net of
collateral); repo and reverse repo (gross and net of collateral); derivatives exposures (with
breakdown by asset class);4 settlement and clearing lines; asset-backed securities; covered
bonds; and short-term lending with respect to other banks and broker dealers. Moreover, banks
report exposures with breakdown by the maturity of the instrument.5 Banks’ internal risk
management limits with respect to counterparties and instruments are also supplied.
Of the 176 UK incorporated banks in the dataset, 48 are UK banks; 47 are UK building
societies; 14 are the UK regulated entities of investment banks; and 67 are the UK regulated
entities of other banks resident outside of the UK. Additionally, there are 314 non-UK banks in
the dataset, because the 176 UK incorporated banks report their exposures to other banks’ global
consolidated group. These 314 non-UK banks do not submit their own exposures to the FSA,
but are counterparties to at least one of the 176 reporting banks.
We match the 490 banks with balance-sheet data obtained from two sources. First, for each of
the 176 reporting banks, we obtain other regulatory data on the balance sheets of UK
consolidated groups. Second, we match the full sample of 490 banks with public balance-sheet
data obtained from Bloomberg, Capital IQ and Bureau van Dijk’s Bankscope database. After
thorough matching, we obtain complete balance-sheet information for 343 of the 490 banks:
some very small banks could not be matched. The value of reporting banks’ exposures to the
147 banks for which we could not obtain public balance-sheet data is just £12.3bn, or 4.6% of
total interbank exposures.
The resulting dataset consists of matrices with dimensions 176 x 490, containing observations
on interbank exposures; supplemented by observations on the balance sheets of 343 banks.
Diagonal elements in the former matrix are equal to zero, since banks do not report intragroup
positions. High-impact banks (of which there are 91) submit interbank exposures under 163
variables (comprising different instruments and maturities). The remaining 85 reporting banks
submit a reduced template with 58 variables.6 The full dataset therefore comprises [(163 x 91) +
4 The breakdown covers interest rate derivatives; credit derivatives; equity derivatives; foreign-currency derivatives; commodities
derivatives; and other derivatives. In the case of derivatives, requested types of exposure include net mark-to-market (before and after
collateral); exposure at default; potential future exposure; and trade count. 5 Categories of maturities are open; less than three months; between three months and one year; between one year and five years; and
more than five years. Derivatives are not reported with a maturity breakdown. 6 Definitions of high- and low-impact banks are based on the FSA’s definition. This definition is based on size and other variables.
6
(58 x 85)] x 490 = 9.7 million elements in the cross-section. In practice, the matrices are sparse.
Most banks are small players in the interbank market: 3.2% of all possible links are complete.
But most links are relatively small. In weighted terms, the network is 0.00003% complete.7
The new regulatory dataset on interbank exposures has clear advantages over those analysed in
the extant literature, in terms of both coverage and granularity. In the UK, prior research has
used data from the large exposures regime (Wells, 2004; Alessandri et al, 2009). This regime
requires banks to report exposures to counterparties when the value of that exposure exceeds
10% of regulatory capital. In the new regulatory dataset, 81.5% of observations, amounting to
£200bn (or 75.8%) of interbank exposures, fall below 10% of own regulatory capital, and
therefore would be ignored by the large exposures regime. Previously, analysts often filled gaps
in observed networks using techniques such as maximum entropy, which spreads residual
exposures evenly across remaining counterparties (Upper and Worms, 2004; Wells, 2004;
Degryse and Nguyen, 2007; Alessandri et al, 2009). Using real data, Mistrulli (2011) shows that
maximum entropy techniques tend to underestimate the extent of contagion in the case of
interbank markets, although van Lelyveld and Liedorp (2006) consider the approach adequate.
Either way, observing the network of interbank exposures directly, as we do with the new
regulatory dataset, is a great improvement.
In order to implement maximum entropy, partially observed bilateral data must be combined
with complete aggregate data. In the UK, the Bank of England collects data on the balance
sheets of UK monetary and financial institutions (MFIs). The data aggregate all inter-MFI
exposures, but with no counterparty breakdown. Most of the interbank activity recorded in these
data refers to transfers within banking groups, which often occur as part of banks’ day-to-day
asset-liability management. In particular, some banks located in the UK typically ‘upstream’
funding to parent entities resident outside of the UK. Unsecured lending by UK MFIs to UK-
resident banks, excluding intra-group transactions, amounted to £95.3bn, or 1.1% of total assets,
in Q4 2011.Including intra-group transactions, the number is £625.7bn, or 7.7% of total assets.
The new regulatory interbank exposures data show that unsecured lending by UK banks to other
banks globally totalled £58.9bn at the end of Q4 2011. Of this, £40.1bn (68%) is lent by UK
7 Weighted network completeness is defined as
∑
in the exposures network. Component terms are defined in section 4.2.
7
banks to other UK-resident banks.8 Notably, the scale of interbank unsecured lending (excluding
intra-group) has reduced significantly since 2007, from over 2% of total assets in 2007 to around
1% in 2011. Over the same period, intragroup unsecured lending has increased (see figure A3 in
the appendix).
Interbank exposures data have been studied in some other European countries. Centralised credit
registers of banks’ loan- or borrower-level exposures are maintained in Austria, Belgium,
France, Germany, Italy, Lithuania, Portugal and Spain (ECB, 2003). Some of these credit
registers have been used to observe interbank networks. Cocco, Gomes and Martins (2009)
extract overnight interbank loan data from the Banco de Portugal’s Central de
Responsabilidades de Crédito to analyse borrower-lender relationships. Iazzetta and Manna
(2009) exploit data from the Centrale dei Rischi of the Banca d’Italia to describe the network
topology of the Italian interbank market. Craig and von Peter (2010) use the Deutsche
Bundesbank’s Gross- und Millionenkreditstatistik to show that the German interbank is tiered,
with a small number of core banks intermediating between peripheral banks.
For the purposes of financial network analysis, the credit registers used in these three papers
have pros and cons compared with the new regulatory dataset on UK interbank exposures. In
particular, the credit registers benefit from longer time series. The Portuguese data start in 1997;
the Italian data in 1990; and the German data in 1999. With such data, one can observe variation
over time in borrower-lender relationships; portfolios by asset class; and overall network
structure. Panel data structure also facilitates more robust causal inference, deployed for
example in Cocco, Gomes and Martins (2009).
But the new regulatory dataset on UK interbank exposures is much richer in the cross-section.
The European credit registers typically record only unsecured and secured lending. But these
categories comprise just 28% of interbank exposures in our dataset, since the latter contains
more asset classes. Breakdown by asset class permits us to distinguish instruments which imply
that bank i is exposed to bank j from instruments which imply that bank i funds bank j. This
distinction is a key innovation of our paper.
8 The discrepancy between the Bank of England’s MFI data and the new regulatory interbank data is mainly due to technical differences
in definition and scope. For example, deposit-taking branches of foreign banking groups are included in the Bank of England MFI
dataset but not in the new regulatory dataset.
8
There are two limitations of the new regulatory dataset on UK interbank exposures. The first
limitation is that banks report only those positions held on their UK consolidated balance sheet.
We therefore do not observe interbank positions held by UK banks off their UK consolidated
balance sheet – just as all national datasets only record exposures held nationally. 101 of the 176
reporting banks are resident in the UK. For these 101 UK-resident banks, total assets of the UK
consolidated group account for 90.1% of total assets of the global consolidated group on
average. For the remaining 75 reporting banks not resident in the UK, the UK consolidated
group accounts for 40.6% of total global assets on average. In addition, we do not observe
interbank positions held by banks with no regulated entity in the UK. This unobserved portion
of the full global network of interbank exposures is most substantial. From the point of view of
UK financial stability, one would ideally observe interbank funding obtained by UK banks from
banks not regulated in the UK. This data constraint will be relaxed for globally systemically
important banks by the Financial Stability Board’s forthcoming data collection.9
The second limitation is that UK banks report exposures to their top 20 bank and broker-dealer
counterparties. Exposures to counterparties beyond the top 20 are not observed. In the data
submitted at the end of 2011, 62 of the 176 UK banks reported exposures to fully 20
counterparties. The total value of the 20th exposure across these 62 banks was £2.3bn, or 0.9%
of total market size. However, this £2.3bn is not evenly distributed across the 62 banks and it is
likely that a few very large banks will have some significant counterparty exposures not
captured in the top 20. Additionally, only a few of the 176 UK banks reported exposures to fully
six additional UK counterparties. So our dataset captures the majority of the UK-to-UK
interbank market (excluding foreign branches) and UK banks’ exposures to non-reporting
foreign banks except for a few very large banks.
3 Description of the Interbank Market
The UK banking sector is one of the largest in the world. UK banks’ claims are worth over £8tn:
more than 500% of annual UK output. Size ballooned over the pre-crisis years. Between 2005
and 2008, UK banks’ credit claims on the real economy rose by around 50%, while intra-
financial sector assets increased 260%. The sector is also very concentrated. The largest six
banking groups account for over 80% of UK consumer lending and deposits.
9 See http://www.financialstabilityboard.org/publications/r_120328l.pdf.

9
Banks intermediate savings and investment in the real economy. Banks also intermediate credit
between themselves. In doing so, they form a network of connections: that is, the interbank
system. At the end of 2011, UK banks reported interbank exposures of £264bn, representing
3.1% of total assets and 78.5% of core tier one capital of the UK consolidated groups of
reporting banks. In the dataset, we also observe £192bn of interbank funding, representing 0.4%
of the total global consolidated liabilities of both reporting and non-reporting banks.
3.1 The Interbank Market by Instrument
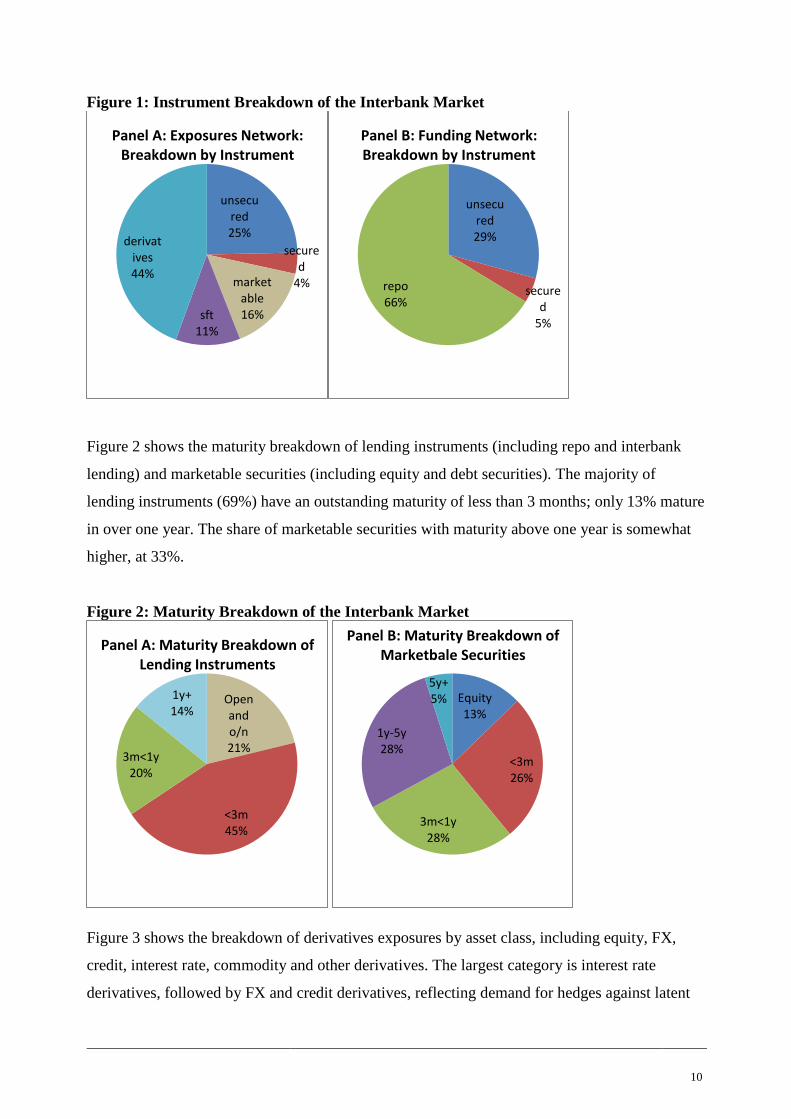
We divide links into two categories: exposures and funding (see figure 1). The exposures
network is relevant for solvency: it includes unsecured interbank lending, marketable securities,
net CDS sold, securities financing transactions (after collateral), and off-balance sheet
derivatives exposures. The funding network is relevant for liquidity: it includes unsecured
interbank lending and repos (before collateral). Debt instruments are not included in the funding
network, because exposures reported by banks are net of longs and shorts and so might not be
equal to the actual amount of funding provided. More details on these categories are provided in
section 4.1.
Derivatives are the largest category of exposures, accounting for 44%. Derivatives are measured
by exposure at default (EAD), which incorporates an estimate of potential future exposure. In
contrast, other exposures in interbank lending and marketable securities are measured by mark-
to-market value.10
Securities financing transactions, which are measured net of collateral
received, account for 11% of total exposures. When measured before collateral in the funding
network, repos are the largest category, accounting for 66%.
10 The mark-to-market value of derivatives after collateral measures the exposure if the counterparty defaults today. However, the mark-
to-market value of derivatives is very sensitive to the market value of the underlying instruments and can exhibit large fluctuations
within a short time period. Therefore, regulatory measures of derivatives exposures (EAD) include the currency mark-to-market value
as well as an estimate of potential future exposure. The latter is typically six times the current mark-to-market value based on our
dataset.
10
Figure 1: Instrument Breakdown of the Interbank Market
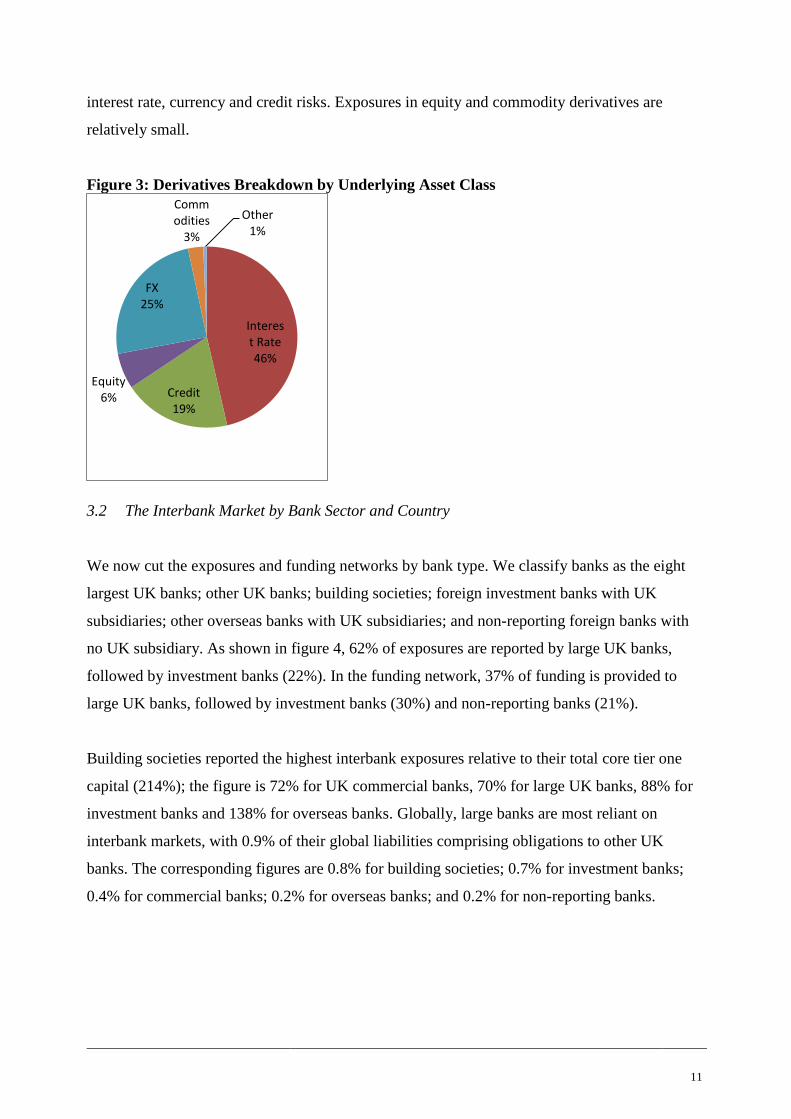
Figure 2 shows the maturity breakdown of lending instruments (including repo and interbank
lending) and marketable securities (including equity and debt securities). The majority of
lending instruments (69%) have an outstanding maturity of less than 3 months; only 13% mature
in over one year. The share of marketable securities with maturity above one year is somewhat
higher, at 33%.
Figure 2: Maturity Breakdown of the Interbank Market
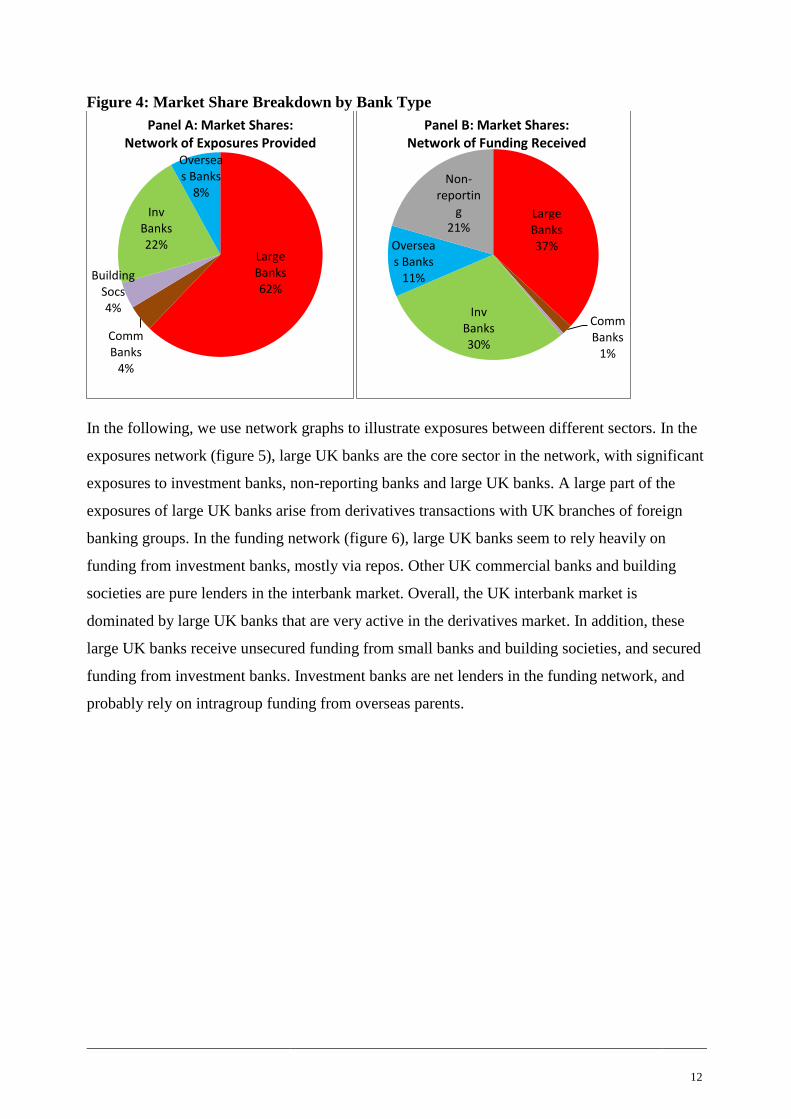
Figure 3 shows the breakdown of derivatives exposures by asset class, including equity, FX,
credit, interest rate, commodity and other derivatives. The largest category is interest rate
derivatives, followed by FX and credit derivatives, reflecting demand for hedges against latent
unsecured 25%
secured
4% marketable 16% sft
11%
derivatives 44%
Panel A: Exposures Network: Breakdown by Instrument
unsecured 29%
secured
5%
repo 66%
Panel B: Funding Network: Breakdown by Instrument
Open and o/n 21%
<3m 45%
3m<1y 20%
1y+ 14%
Panel A: Maturity Breakdown of Lending Instruments
Equity 13%
<3m 26%
3m<1y 28%
1y-5y 28%
5y+ 5%
Panel B: Maturity Breakdown of Marketbale Securities
11
interest rate, currency and credit risks. Exposures in equity and commodity derivatives are
relatively small.
Figure 3: Derivatives Breakdown by Underlying Asset Class
3.2 The Interbank Market by Bank Sector and Country
We now cut the exposures and funding networks by bank type. We classify banks as the eight
largest UK banks; other UK banks; building societies; foreign investment banks with UK
subsidiaries; other overseas banks with UK subsidiaries; and non-reporting foreign banks with
no UK subsidiary. As shown in figure 4, 62% of exposures are reported by large UK banks,
followed by investment banks (22%). In the funding network, 37% of funding is provided to
large UK banks, followed by investment banks (30%) and non-reporting banks (21%).
Building societies reported the highest interbank exposures relative to their total core tier one
capital (214%); the figure is 72% for UK commercial banks, 70% for large UK banks, 88% for
investment banks and 138% for overseas banks. Globally, large banks are most reliant on
interbank markets, with 0.9% of their global liabilities comprising obligations to other UK
banks. The corresponding figures are 0.8% for building societies; 0.7% for investment banks;
0.4% for commercial banks; 0.2% for overseas banks; and 0.2% for non-reporting banks.
Interest Rate 46%
Credit 19%
Equity 6%
FX 25%
Commodities
3%
Other 1%
12
Figure 4: Market Share Breakdown by Bank Type
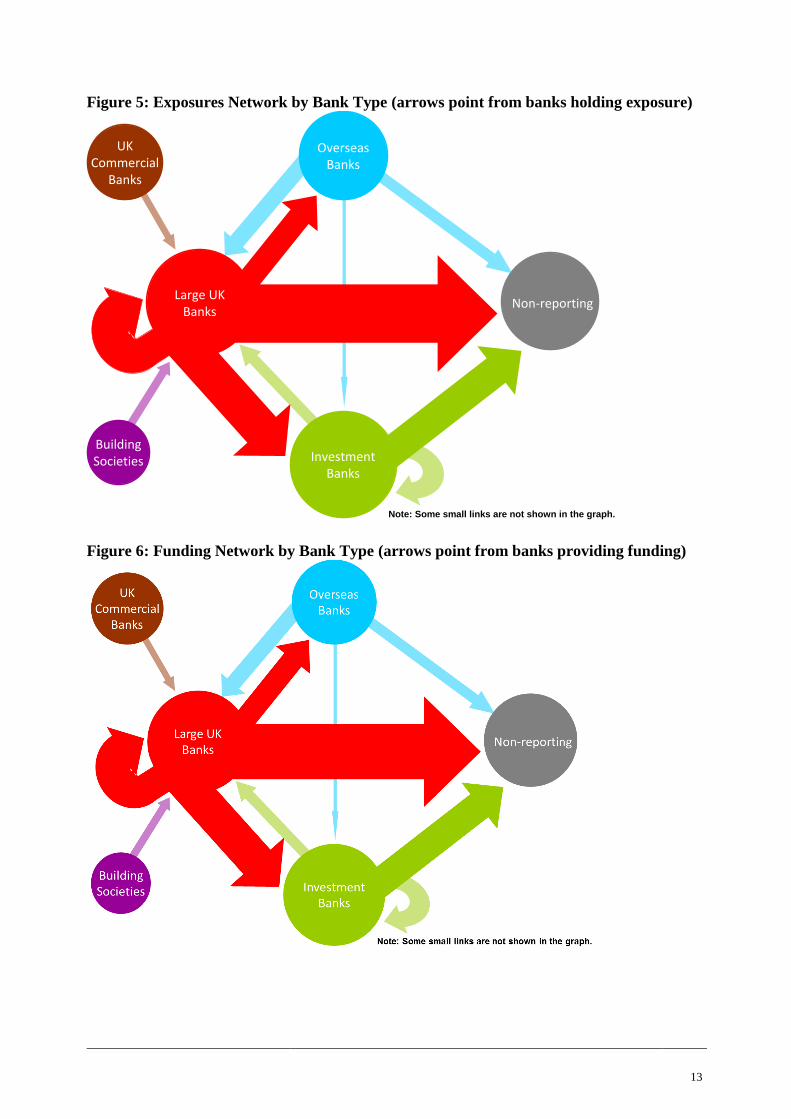
In the following, we use network graphs to illustrate exposures between different sectors. In the
exposures network (figure 5), large UK banks are the core sector in the network, with significant
exposures to investment banks, non-reporting banks and large UK banks. A large part of the
exposures of large UK banks arise from derivatives transactions with UK branches of foreign
banking groups. In the funding network (figure 6), large UK banks seem to rely heavily on
funding from investment banks, mostly via repos. Other UK commercial banks and building
societies are pure lenders in the interbank market. Overall, the UK interbank market is
dominated by large UK banks that are very active in the derivatives market. In addition, these
large UK banks receive unsecured funding from small banks and building societies, and secured
funding from investment banks. Investment banks are net lenders in the funding network, and
probably rely on intragroup funding from overseas parents.
Large Banks 62%
Comm Banks
4%
Building Socs 4%
Inv Banks 22%
Overseas Banks
8%
Panel A: Market Shares: Network of Exposures Provided
Large Banks 37%
Comm Banks
1%
Inv Banks 30%
Overseas Banks
11%
Non-reportin
g 21%
Panel B: Market Shares: Network of Funding Received
13
Figure 5: Exposures Network by Bank Type (arrows point from banks holding exposure)
Figure 6: Funding Network by Bank Type (arrows point from banks providing funding)
Investment Banks
BuildingSocieties
OverseasBanks
Large UK Banks
Non-reporting
Note: Some small links are not shown in the graph.
UKCommercial
Banks
14
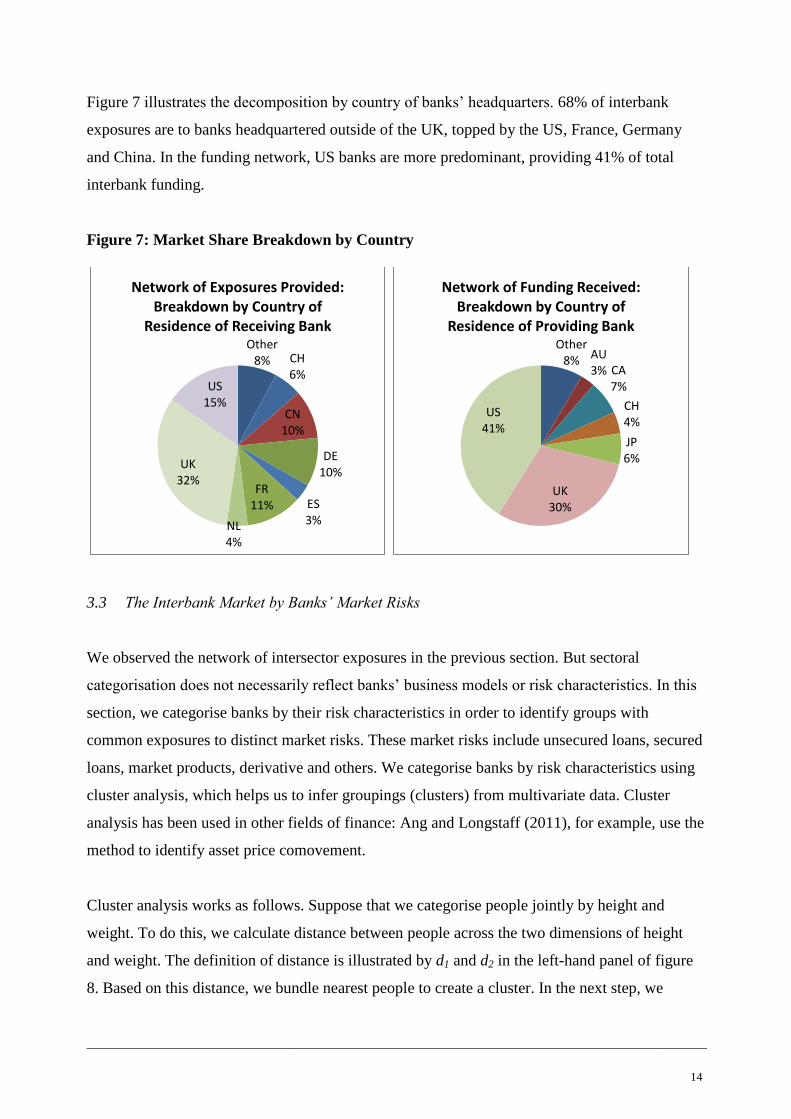
Figure 7 illustrates the decomposition by country of banks’ headquarters. 68% of interbank
exposures are to banks headquartered outside of the UK, topped by the US, France, Germany
and China. In the funding network, US banks are more predominant, providing 41% of total
interbank funding.
Figure 7: Market Share Breakdown by Country
3.3 The Interbank Market by Banks’ Market Risks
We observed the network of intersector exposures in the previous section. But sectoral
categorisation does not necessarily reflect banks’ business models or risk characteristics. In this
section, we categorise banks by their risk characteristics in order to identify groups with
common exposures to distinct market risks. These market risks include unsecured loans, secured
loans, market products, derivative and others. We categorise banks by risk characteristics using
cluster analysis, which helps us to infer groupings (clusters) from multivariate data. Cluster
analysis has been used in other fields of finance: Ang and Longstaff (2011), for example, use the
method to identify asset price comovement.
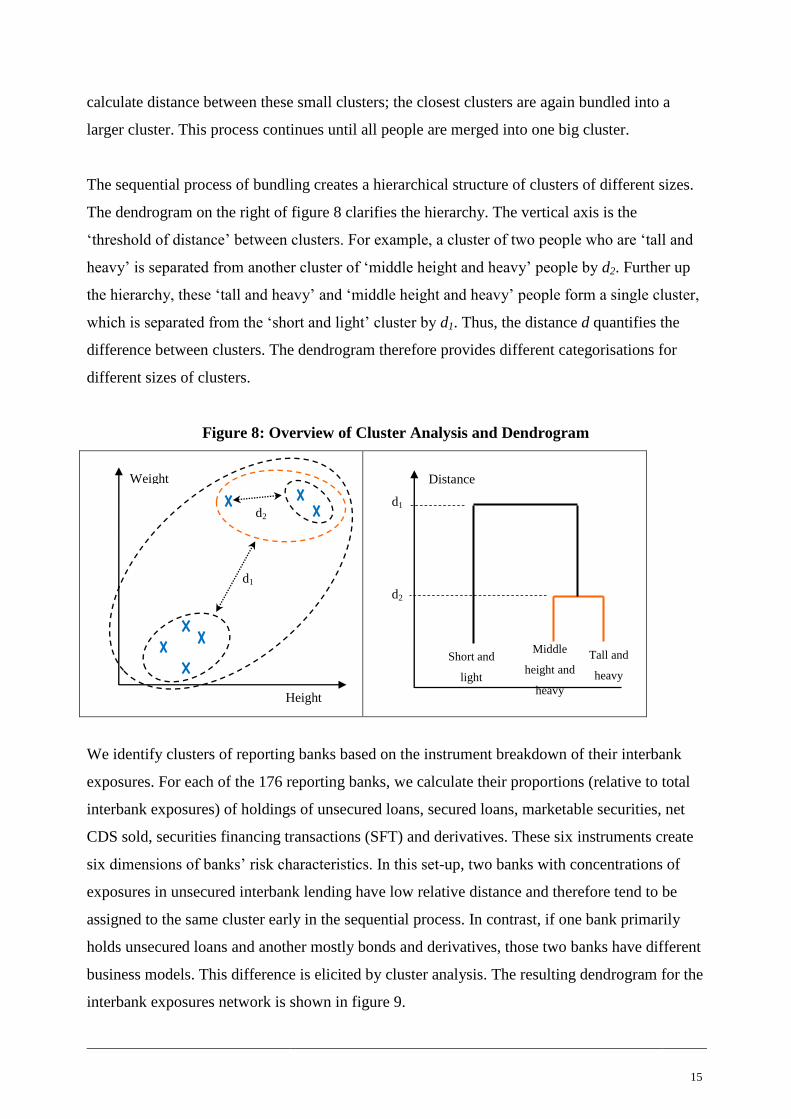
Cluster analysis works as follows. Suppose that we categorise people jointly by height and
weight. To do this, we calculate distance between people across the two dimensions of height
and weight. The definition of distance is illustrated by d1 and d2 in the left-hand panel of figure
8. Based on this distance, we bundle nearest people to create a cluster. In the next step, we
Other 8% CH
6%
CN 10%
DE 10%
ES 3%
FR 11%
NL 4%
UK 32%
US 15%
Network of Exposures Provided: Breakdown by Country of
Residence of Receiving Bank Other
8% AU 3% CA
7%
CH 4%
JP 6%
UK 30%
US 41%
Network of Funding Received: Breakdown by Country of
Residence of Providing Bank
15
calculate distance between these small clusters; the closest clusters are again bundled into a
larger cluster. This process continues until all people are merged into one big cluster.
The sequential process of bundling creates a hierarchical structure of clusters of different sizes.
The dendrogram on the right of figure 8 clarifies the hierarchy. The vertical axis is the
‘threshold of distance’ between clusters. For example, a cluster of two people who are ‘tall and
heavy’ is separated from another cluster of ‘middle height and heavy’ people by d2. Further up
the hierarchy, these ‘tall and heavy’ and ‘middle height and heavy’ people form a single cluster,
which is separated from the ‘short and light’ cluster by d1. Thus, the distance d quantifies the
difference between clusters. The dendrogram therefore provides different categorisations for
different sizes of clusters.
Figure 8: Overview of Cluster Analysis and Dendrogram
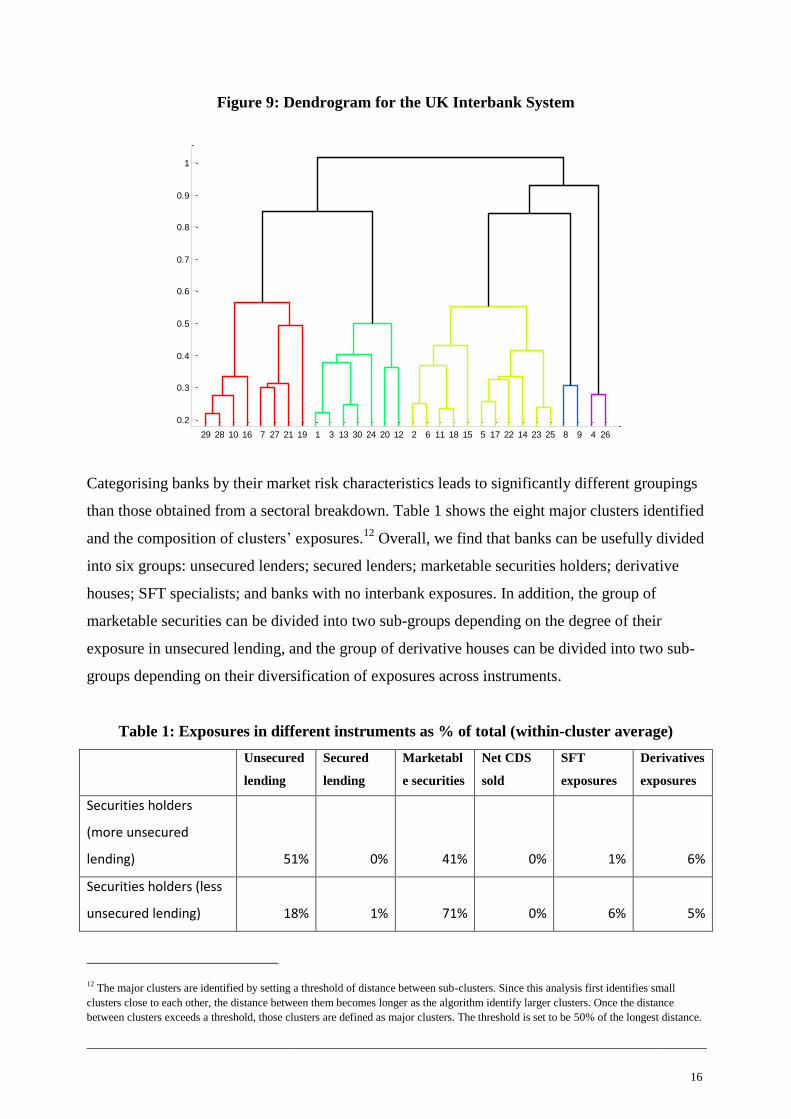
We identify clusters of reporting banks based on the instrument breakdown of their interbank
exposures. For each of the 176 reporting banks, we calculate their proportions (relative to total
interbank exposures) of holdings of unsecured loans, secured loans, marketable securities, net
CDS sold, securities financing transactions (SFT) and derivatives. These six instruments create
six dimensions of banks’ risk characteristics. In this set-up, two banks with concentrations of
exposures in unsecured interbank lending have low relative distance and therefore tend to be
assigned to the same cluster early in the sequential process. In contrast, if one bank primarily
holds unsecured loans and another mostly bonds and derivatives, those two banks have different
business models. This difference is elicited by cluster analysis. The resulting dendrogram for the
interbank exposures network is shown in figure 9.
d2
d1
Weight
Height
Distance
d1
d2
Tall and
heavy
Middle
height and
heavy
Short and
light
16
Figure 9: Dendrogram for the UK Interbank System
Categorising banks by their market risk characteristics leads to significantly different groupings
than those obtained from a sectoral breakdown. Table 1 shows the eight major clusters identified
and the composition of clusters’ exposures.12
Overall, we find that banks can be usefully divided
into six groups: unsecured lenders; secured lenders; marketable securities holders; derivative
houses; SFT specialists; and banks with no interbank exposures. In addition, the group of
marketable securities can be divided into two sub-groups depending on the degree of their
exposure in unsecured lending, and the group of derivative houses can be divided into two sub-
groups depending on their diversification of exposures across instruments.
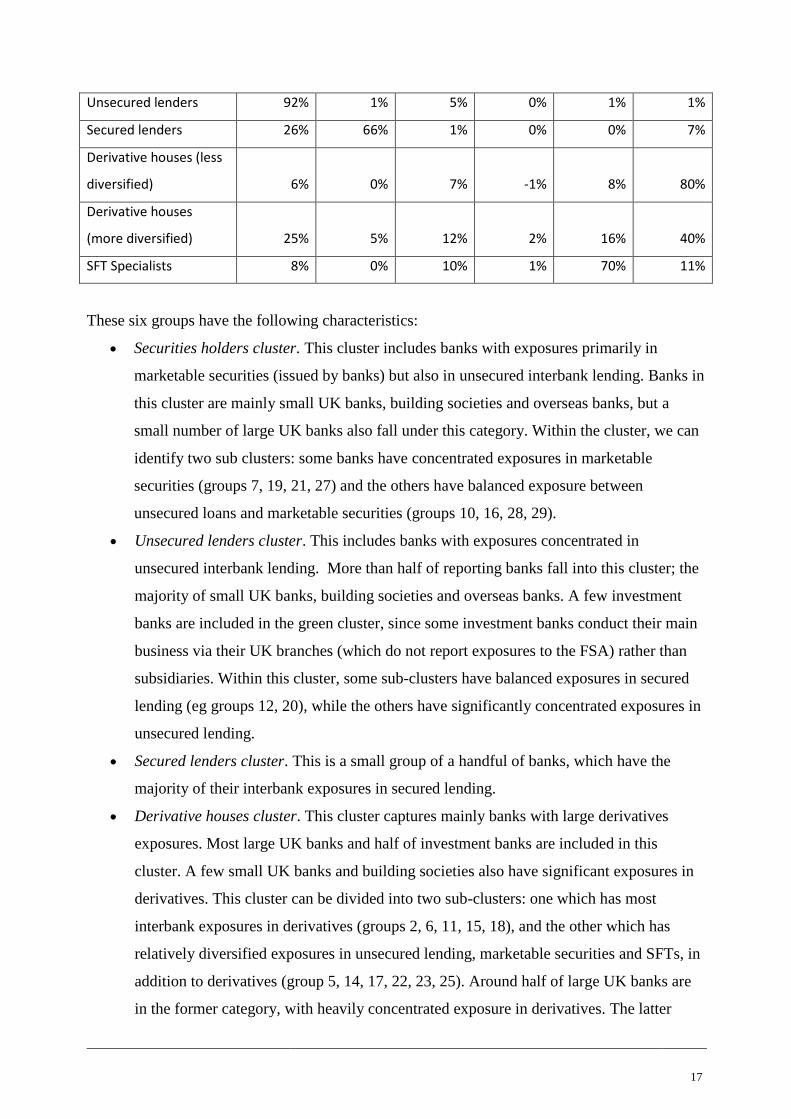
Table 1: Exposures in different instruments as % of total (within-cluster average)
Unsecured
lending
Secured
lending
Marketabl
e securities
Net CDS
sold
SFT
exposures
Derivatives
exposures
Securities holders
(more unsecured
lending) 51% 0% 41% 0% 1% 6%
Securities holders (less
unsecured lending) 18% 1% 71% 0% 6% 5%
12 The major clusters are identified by setting a threshold of distance between sub-clusters. Since this analysis first identifies small
clusters close to each other, the distance between them becomes longer as the algorithm identify larger clusters. Once the distance
between clusters exceeds a threshold, those clusters are defined as major clusters. The threshold is set to be 50% of the longest distance.
29 28 10 16 7 27 21 19 1 3 13 30 24 20 12 2 6 11 18 15 5 17 22 14 23 25 8 9 4 26
0.2
0.3
0.4
0.5
0.6
0.7
0.8
0.9
1
17
Unsecured lenders 92% 1% 5% 0% 1% 1%
Secured lenders 26% 66% 1% 0% 0% 7%
Derivative houses (less
diversified) 6% 0% 7% -1% 8% 80%
Derivative houses
(more diversified) 25% 5% 12% 2% 16% 40%
SFT Specialists 8% 0% 10% 1% 70% 11%
These six groups have the following characteristics:
Securities holders cluster. This cluster includes banks with exposures primarily in
marketable securities (issued by banks) but also in unsecured interbank lending. Banks in
this cluster are mainly small UK banks, building societies and overseas banks, but a
small number of large UK banks also fall under this category. Within the cluster, we can
identify two sub clusters: some banks have concentrated exposures in marketable
securities (groups 7, 19, 21, 27) and the others have balanced exposure between
unsecured loans and marketable securities (groups 10, 16, 28, 29).
Unsecured lenders cluster. This includes banks with exposures concentrated in
unsecured interbank lending. More than half of reporting banks fall into this cluster; the
majority of small UK banks, building societies and overseas banks. A few investment
banks are included in the green cluster, since some investment banks conduct their main
business via their UK branches (which do not report exposures to the FSA) rather than
subsidiaries. Within this cluster, some sub-clusters have balanced exposures in secured
lending (eg groups 12, 20), while the others have significantly concentrated exposures in
unsecured lending.
Secured lenders cluster. This is a small group of a handful of banks, which have the
majority of their interbank exposures in secured lending.
Derivative houses cluster. This cluster captures mainly banks with large derivatives
exposures. Most large UK banks and half of investment banks are included in this
cluster. A few small UK banks and building societies also have significant exposures in
derivatives. This cluster can be divided into two sub-clusters: one which has most
interbank exposures in derivatives (groups 2, 6, 11, 15, 18), and the other which has
relatively diversified exposures in unsecured lending, marketable securities and SFTs, in
addition to derivatives (group 5, 14, 17, 22, 23, 25). Around half of large UK banks are
in the former category, with heavily concentrated exposure in derivatives. The latter
18
more balanced category consists of most investment banks and a small number of large
UK banks.
Ssecurities financing transactions (SFT) specialists cluster. This is a small group of SFT
specialists. Due to the secured nature of SFTs, exposures arising from SFTs are typically
much smaller than those from other instruments, despite the large scale of the activity.
There are around 20 banks with no interbank exposures, which are not categorised in any
of the clusters above.
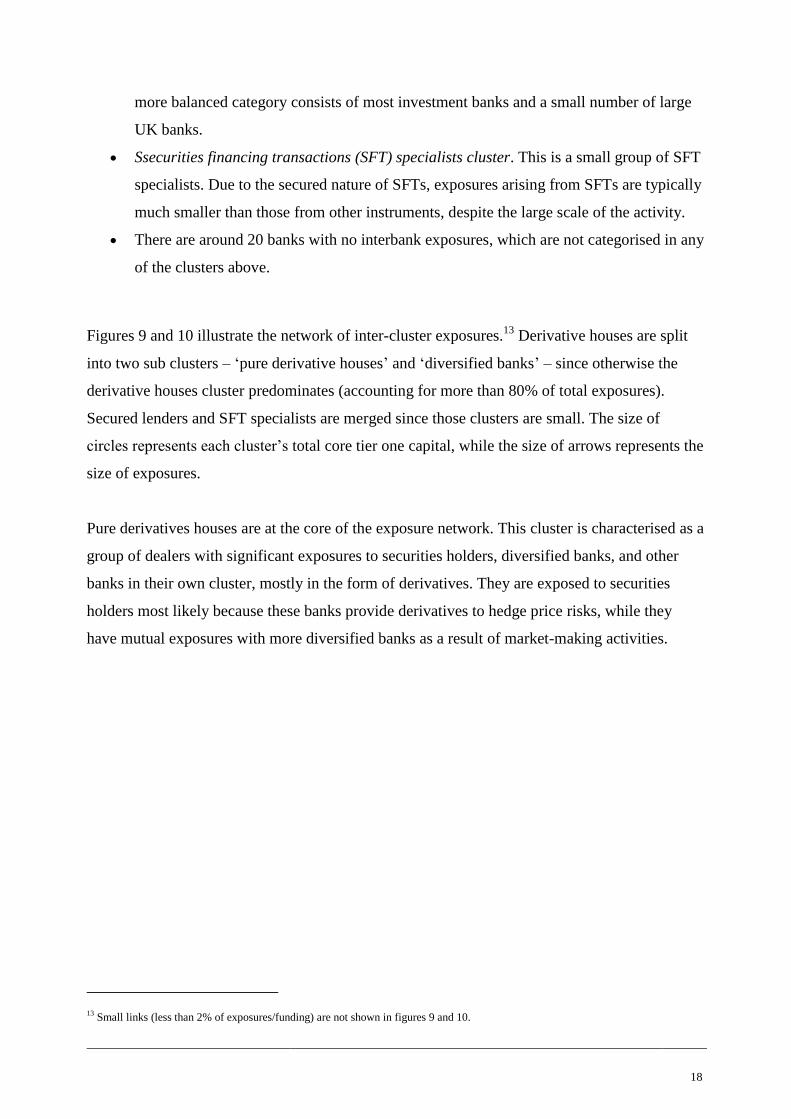
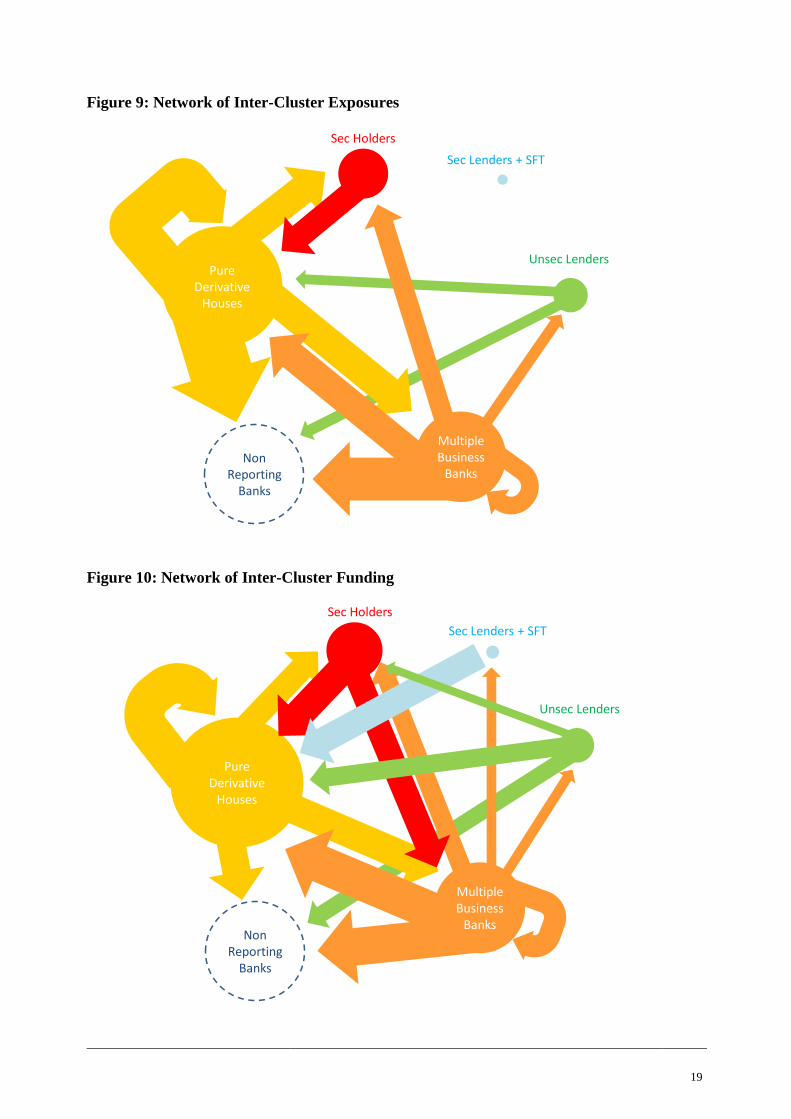
Figures 9 and 10 illustrate the network of inter-cluster exposures.13
Derivative houses are split
into two sub clusters – ‘pure derivative houses’ and ‘diversified banks’ – since otherwise the
derivative houses cluster predominates (accounting for more than 80% of total exposures).
Secured lenders and SFT specialists are merged since those clusters are small. The size of
circles represents each cluster’s total core tier one capital, while the size of arrows represents the
size of exposures.
Pure derivatives houses are at the core of the exposure network. This cluster is characterised as a
group of dealers with significant exposures to securities holders, diversified banks, and other
banks in their own cluster, mostly in the form of derivatives. They are exposed to securities
holders most likely because these banks provide derivatives to hedge price risks, while they
have mutual exposures with more diversified banks as a result of market-making activities.
13 Small links (less than 2% of exposures/funding) are not shown in figures 9 and 10.
19
Figure 9: Network of Inter-Cluster Exposures
Figure 10: Network of Inter-Cluster Funding
Pure Derivative
Houses
Unsec Lenders
MultipleBusiness
Banks
Sec Holders
Sec Lenders + SFT
Non Reporting
Banks
Pure Derivative
Houses
Unsec Lenders
MultipleBusiness
Banks
Sec Holders
Sec Lenders + SFT
Non Reporting
Banks
20
These two sub-clusters of derivative houses also have different funding structures. All domestic
unsecured funding is concentrated in the pure derivative houses, which are net borrowers in the
network. Diversified banks, on the other hand, are net lenders: foreign investment banks in the
cluster probably obtain funding from other countries, including their parents. The diversified
banks also provide significant quantity of secured funding to pure derivative houses. If the UK
were to experience liquidity shortage triggered in foreign countries, this cluster would act as the
transmission mechanism. The shock would then propagate to all clusters since these diversified
banks provide liquidity to all clusters. Considering the connection to the international market,
the diversified banks are a key cluster in the UK funding network. Note also the intensive
mutual finance between securities holders, pure derivative houses and diversified banks. These
three clusters form a ‘core’ of the UK funding market, and their interdependence merits further
analysis.
4 Method
4.1 The Complexities of Financial Networks
The new regulatory dataset is complex. We adapt our analysis to four complexities specific to
financial networks: directed links; weighted links; multiple links; and node heterogeneity.
First Complexity: Directed Links
A given link between two banks has a single direction. For example, if bank i lends money to
bank j, the link is directed from bank i to bank j. In networks jargon: the link is outgoing from
bank i and ingoing to bank j.15
Each link is outgoing from one bank and ingoing to another. In
the prior example, one could say that bank i provides a loan to bank j, and that bank j receives a
loan from bank i. However, it is not always true that both the outgoing and ingoing sides of a
given link are economically interesting. Consider that bank i additionally sells to a third party
credit protection against bank j’s default. In this case, bank i assumes exposure to bank j, but
bank j does not receive funding from bank i. Here, one should consider only the outgoing side of
the link from bank i, and ignore the ingoing side of the link to bank j. In general, the economic
15 Note that there is inconsistency in the extant literature regarding interpretation of outgoing and ingoing links. Some papers, such as
Boss et al (2004), define bank i’s exposure to bank j as an ingoing link of bank i from j (ie bank i lends money to bank j). On the other
hand, Iori et al (2008) defines bank i’s exposure to bank j as an outgoing link of bank i, as bank i lends money to bank j. We use the
latter definition, since we consider it more intuitive.
21
relevance of the outgoing and ingoing sides of a given link depends on the type of financial
instrument which characterises the link.
Second Complexity: Multiple Links
The new regulatory dataset on interbank exposures provides a comprehensive breakdown of
financial instruments. Large banks report interbank exposures under 163 types of instruments;
smaller banks report 58 types. Multiple potential links between two given nodes amount to a
multiplicity of networks. As a first step, we render the data more tractable by defining a total
exposures network and a total funding network as follows. In sections 5.2 and 5.3, we extend the
analysis to consider instrument categories separately.
16
Recall that each link is outgoing from one bank and ingoing to another. To sharpen our
exposition, we focus only on the outgoing side of links in the exposures network, and on the
ingoing side of links in the funding network. In doing so, we hone in on those banks which hold
interbank claims and those banks which borrow from other banks. Alternative analysis could
consider also the ingoing side of links in the exposures network and the outgoing side of links in
the funding network. For example, measures of a bank’s systemic importance could depend on
the extent to which other banks are exposed to that bank, and on the extent to which that bank
funds other banks. We leave such extensions to future research.
16 We did not include debt instruments in the funding network, because the exposures reported by banks are net of longs and shorts and
hence may not be equal to the actual amount of funding provided.
22
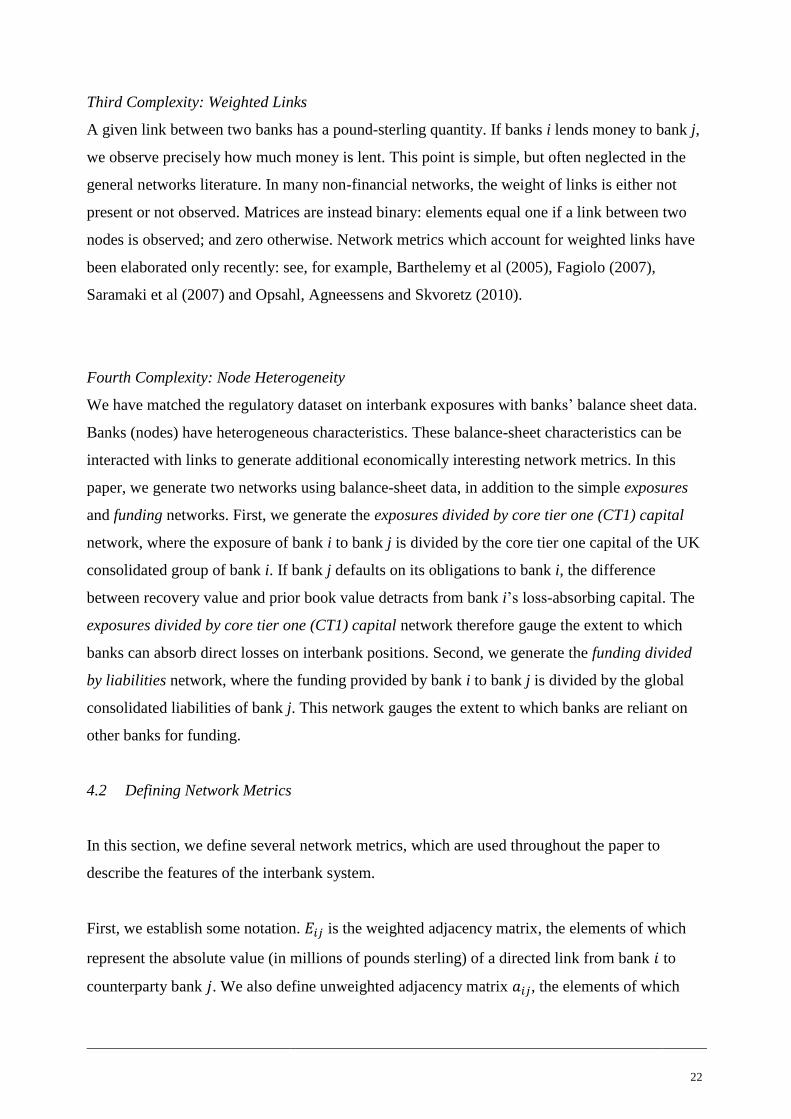
Third Complexity: Weighted Links
A given link between two banks has a pound-sterling quantity. If banks i lends money to bank j,
we observe precisely how much money is lent. This point is simple, but often neglected in the
general networks literature. In many non-financial networks, the weight of links is either not
present or not observed. Matrices are instead binary: elements equal one if a link between two
nodes is observed; and zero otherwise. Network metrics which account for weighted links have
been elaborated only recently: see, for example, Barthelemy et al (2005), Fagiolo (2007),
Saramaki et al (2007) and Opsahl, Agneessens and Skvoretz (2010).
Fourth Complexity: Node Heterogeneity
We have matched the regulatory dataset on interbank exposures with banks’ balance sheet data.
Banks (nodes) have heterogeneous characteristics. These balance-sheet characteristics can be
interacted with links to generate additional economically interesting network metrics. In this
paper, we generate two networks using balance-sheet data, in addition to the simple exposures
and funding networks. First, we generate the exposures divided by core tier one (CT1) capital
network, where the exposure of bank i to bank j is divided by the core tier one capital of the UK
consolidated group of bank i. If bank j defaults on its obligations to bank i, the difference
between recovery value and prior book value detracts from bank i’s loss-absorbing capital. The
exposures divided by core tier one (CT1) capital network therefore gauge the extent to which
banks can absorb direct losses on interbank positions. Second, we generate the funding divided
by liabilities network, where the funding provided by bank i to bank j is divided by the global
consolidated liabilities of bank j. This network gauges the extent to which banks are reliant on
other banks for funding.
4.2 Defining Network Metrics
In this section, we define several network metrics, which are used throughout the paper to
describe the features of the interbank system.
First, we establish some notation. is the weighted adjacency matrix, the elements of which
represent the absolute value (in millions of pounds sterling) of a directed link from bank to
counterparty bank . We also define unweighted adjacency matrix , the elements of which

23
take the value 1 if and 0 otherwise. We can therefore define Market Size as the total
strength of all links in the network. Since 176 banks report exposures to up to 26 counterparties,
we compute
∑∑
Counting the number of links gives the unweighted degree. We define Unweighted Degree for
both outgoing and ingoing links:
∑
∑
But each link takes a pound-sterling quantity. We compute bank-level Strength by summing the
strength of individual links:
∑
∑
In much of this paper, we normalise Strength by Market Size. The result is Market Share:
Finally, we can measure the extent to which a bank is reliant on a small number of other banks,
or whether its interbank positions are diversified across many counterparties. We define Relative
Strength Concentration as:
∑
∑
24
5 Network Properties of the Interbank System
Our aim is to establish a set of stylised facts about the systemic properties of the UK banking
system. In doing so, we draw on the budding literature on (financial) network analysis.
5.1 Network Statistics
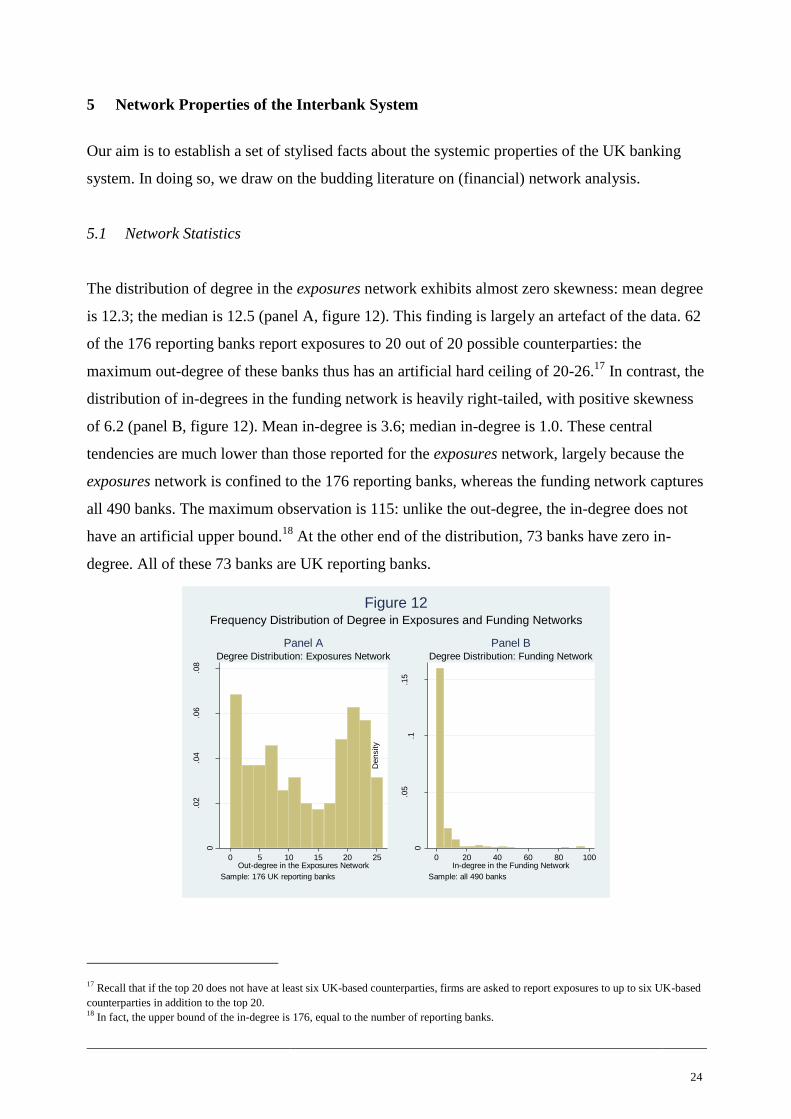
The distribution of degree in the exposures network exhibits almost zero skewness: mean degree
is 12.3; the median is 12.5 (panel A, figure 12). This finding is largely an artefact of the data. 62
of the 176 reporting banks report exposures to 20 out of 20 possible counterparties: the
maximum out-degree of these banks thus has an artificial hard ceiling of 20-26.17
In contrast, the
distribution of in-degrees in the funding network is heavily right-tailed, with positive skewness
of 6.2 (panel B, figure 12). Mean in-degree is 3.6; median in-degree is 1.0. These central
tendencies are much lower than those reported for the exposures network, largely because the
exposures network is confined to the 176 reporting banks, whereas the funding network captures
all 490 banks. The maximum observation is 115: unlike the out-degree, the in-degree does not
have an artificial upper bound.18
At the other end of the distribution, 73 banks have zero in-
degree. All of these 73 banks are UK reporting banks.
17 Recall that if the top 20 does not have at least six UK-based counterparties, firms are asked to report exposures to up to six UK-based
counterparties in addition to the top 20. 18
In fact, the upper bound of the in-degree is 176, equal to the number of reporting banks.
0
.02
.04
.06
.08
Density
0 5 10 15 20 25Out-degree in the Exposures Network
Sample: 176 UK reporting banks
Degree Distribution: Exposures Network
Panel A
0
.05
.1.1
5
Density
0 20 40 60 80 100In-degree in the Funding Network
Sample: all 490 banks
Degree Distribution: Funding Network
Panel B
Frequency Distribution of Degree in Exposures and Funding Networks
Figure 12
25
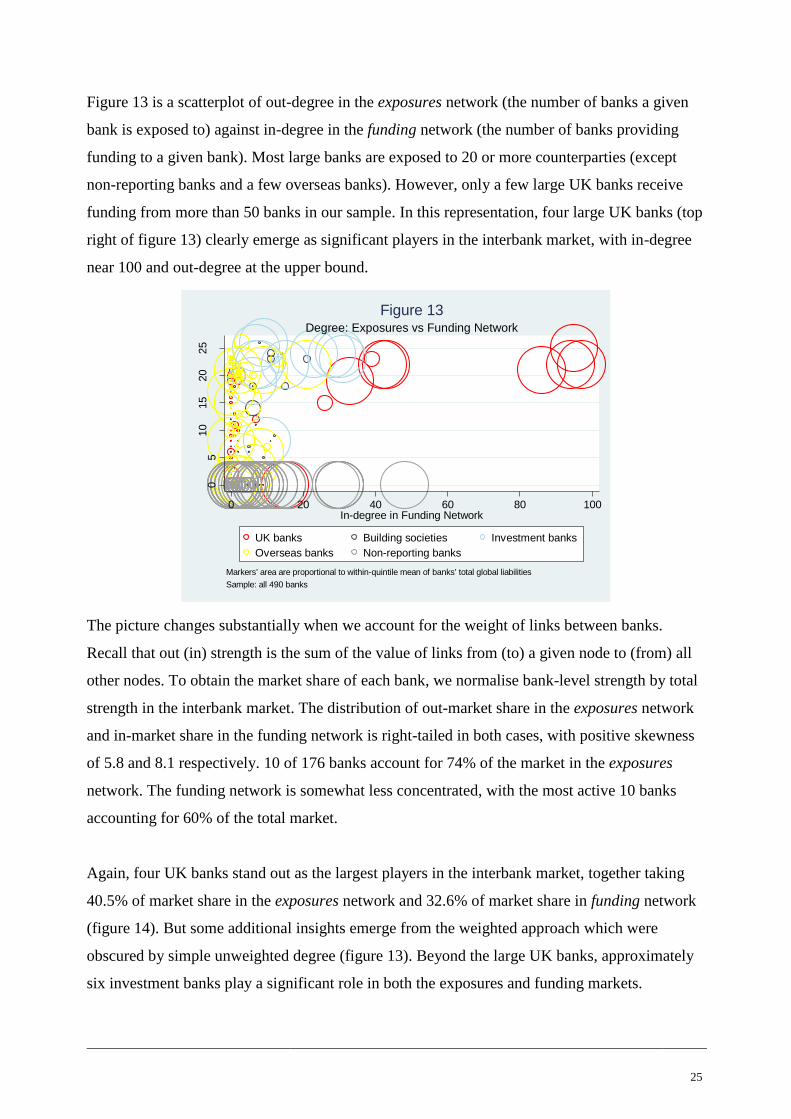
Figure 13 is a scatterplot of out-degree in the exposures network (the number of banks a given
bank is exposed to) against in-degree in the funding network (the number of banks providing
funding to a given bank). Most large banks are exposed to 20 or more counterparties (except
non-reporting banks and a few overseas banks). However, only a few large UK banks receive
funding from more than 50 banks in our sample. In this representation, four large UK banks (top
right of figure 13) clearly emerge as significant players in the interbank market, with in-degree
near 100 and out-degree at the upper bound.
The picture changes substantially when we account for the weight of links between banks.
Recall that out (in) strength is the sum of the value of links from (to) a given node to (from) all
other nodes. To obtain the market share of each bank, we normalise bank-level strength by total
strength in the interbank market. The distribution of out-market share in the exposures network
and in-market share in the funding network is right-tailed in both cases, with positive skewness
of 5.8 and 8.1 respectively. 10 of 176 banks account for 74% of the market in the exposures
network. The funding network is somewhat less concentrated, with the most active 10 banks
accounting for 60% of the total market.
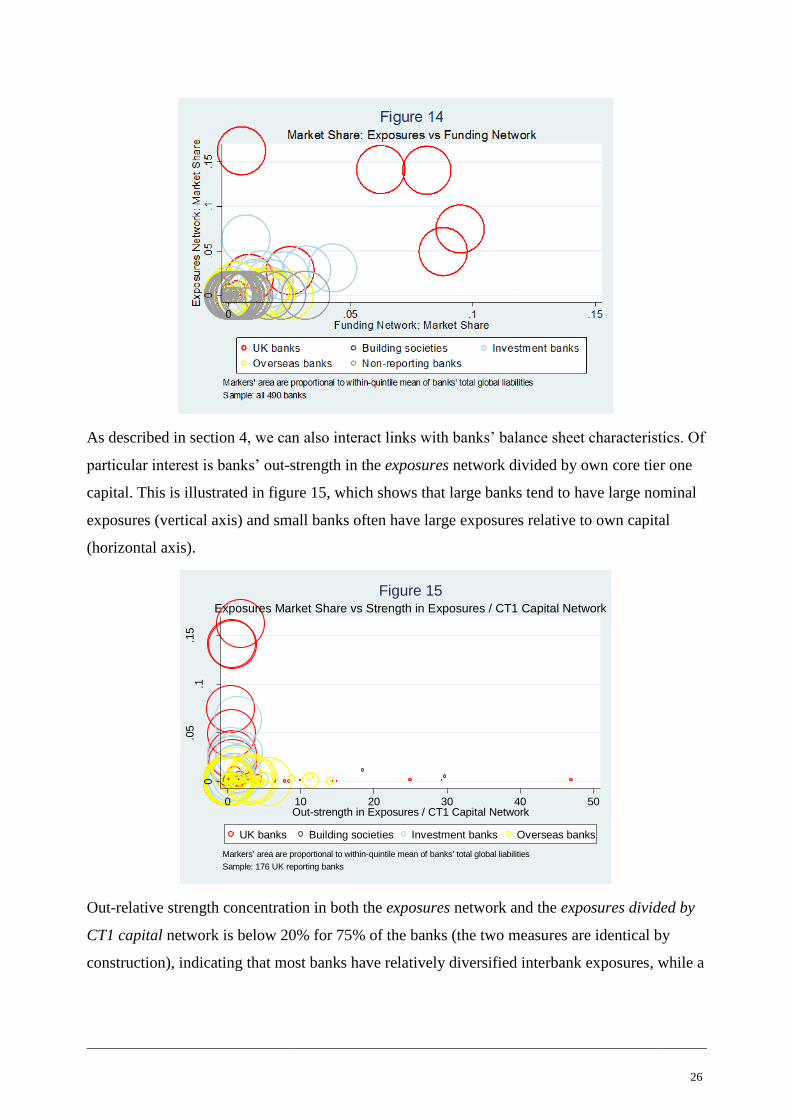
Again, four UK banks stand out as the largest players in the interbank market, together taking
40.5% of market share in the exposures network and 32.6% of market share in funding network
(figure 14). But some additional insights emerge from the weighted approach which were
obscured by simple unweighted degree (figure 13). Beyond the large UK banks, approximately
six investment banks play a significant role in both the exposures and funding markets.
05
10
15
20
25
Out-
degre
e in E
xposure
s N
etw
ork
0 20 40 60 80 100In-degree in Funding Network
UK banks Building societies Investment banks
Overseas banks Non-reporting banks
Markers' area are proportional to within-quintile mean of banks' total global liabilities
Sample: all 490 banks
Degree: Exposures vs Funding Network
Figure 13
26
As described in section 4, we can also interact links with banks’ balance sheet characteristics. Of
particular interest is banks’ out-strength in the exposures network divided by own core tier one
capital. This is illustrated in figure 15, which shows that large banks tend to have large nominal
exposures (vertical axis) and small banks often have large exposures relative to own capital
(horizontal axis).
Out-relative strength concentration in both the exposures network and the exposures divided by
CT1 capital network is below 20% for 75% of the banks (the two measures are identical by
construction), indicating that most banks have relatively diversified interbank exposures, while a
0
.05
.1.1
5
Out-
Mark
et
Share
in E
xposure
s N
etw
ork
0 10 20 30 40 50Out-strength in Exposures / CT1 Capital Network
UK banks Building societies Investment banks Overseas banks
Markers' area are proportional to within-quintile mean of banks' total global liabilities
Sample: 176 UK reporting banks
Exposures Market Share vs Strength in Exposures / CT1 Capital Network
Figure 15
27
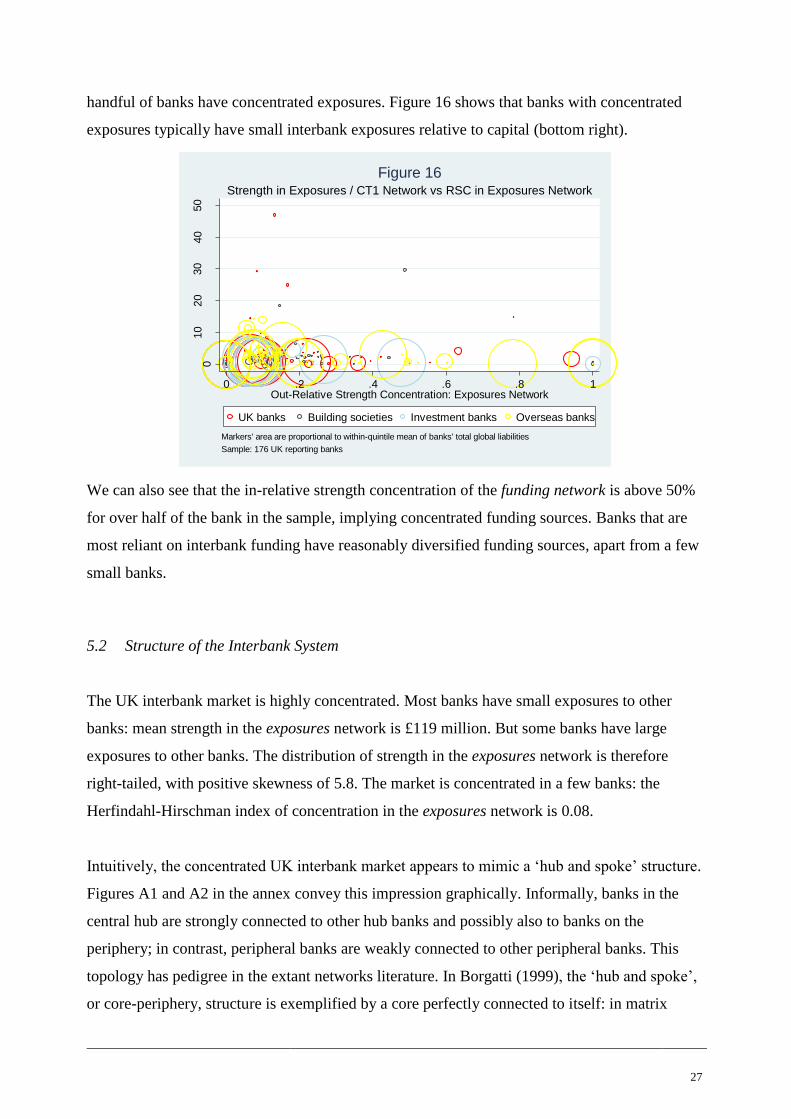
handful of banks have concentrated exposures. Figure 16 shows that banks with concentrated
exposures typically have small interbank exposures relative to capital (bottom right).
We can also see that the in-relative strength concentration of the funding network is above 50%
for over half of the bank in the sample, implying concentrated funding sources. Banks that are
most reliant on interbank funding have reasonably diversified funding sources, apart from a few
small banks.
5.2 Structure of the Interbank System
The UK interbank market is highly concentrated. Most banks have small exposures to other
banks: mean strength in the exposures network is £119 million. But some banks have large
exposures to other banks. The distribution of strength in the exposures network is therefore
right-tailed, with positive skewness of 5.8. The market is concentrated in a few banks: the
Herfindahl-Hirschman index of concentration in the exposures network is 0.08.
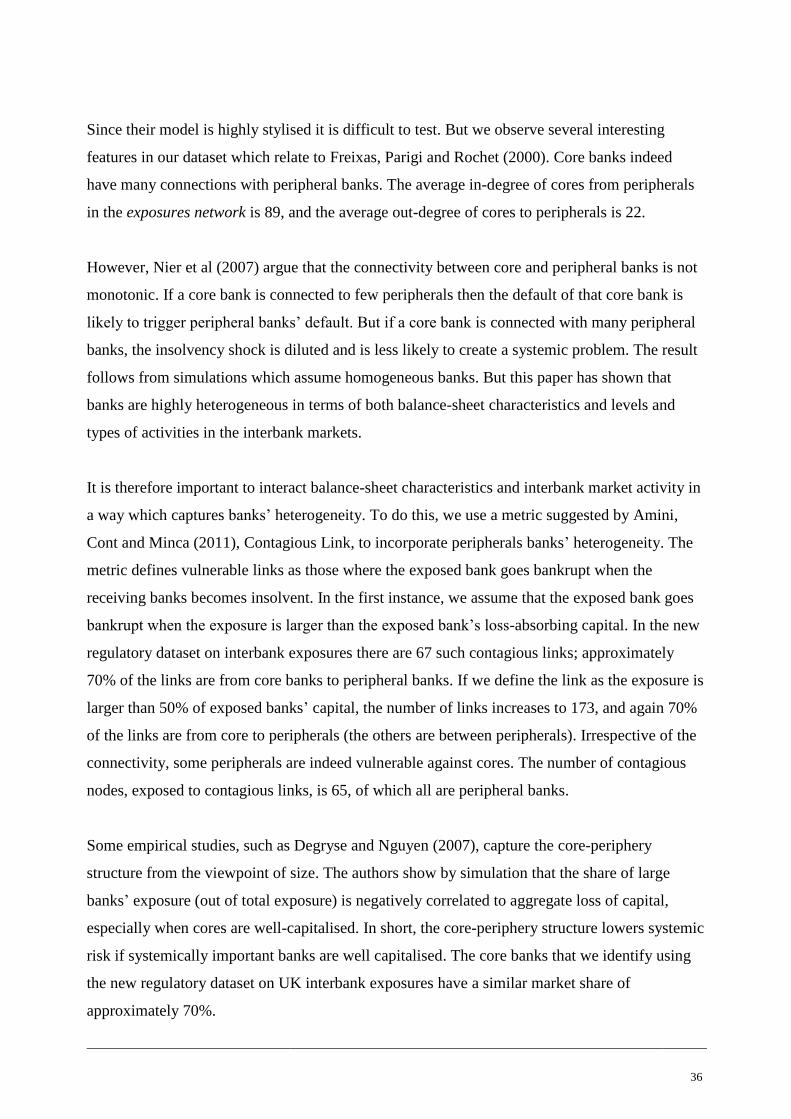
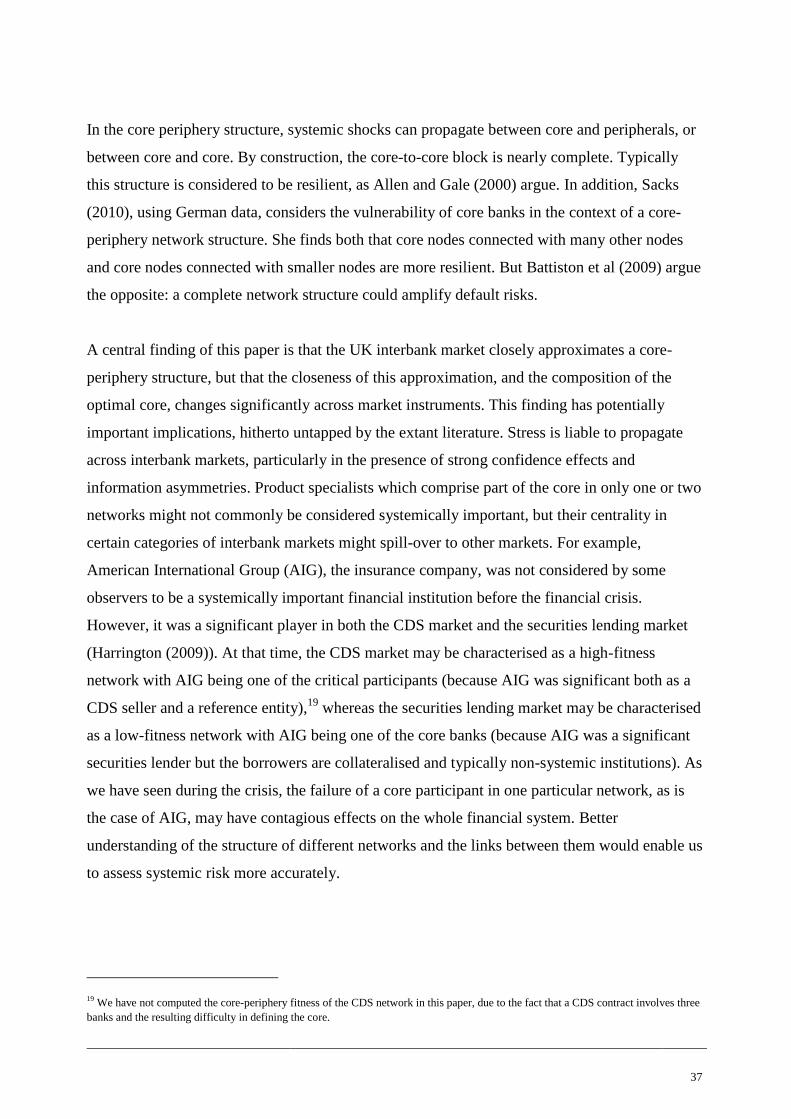
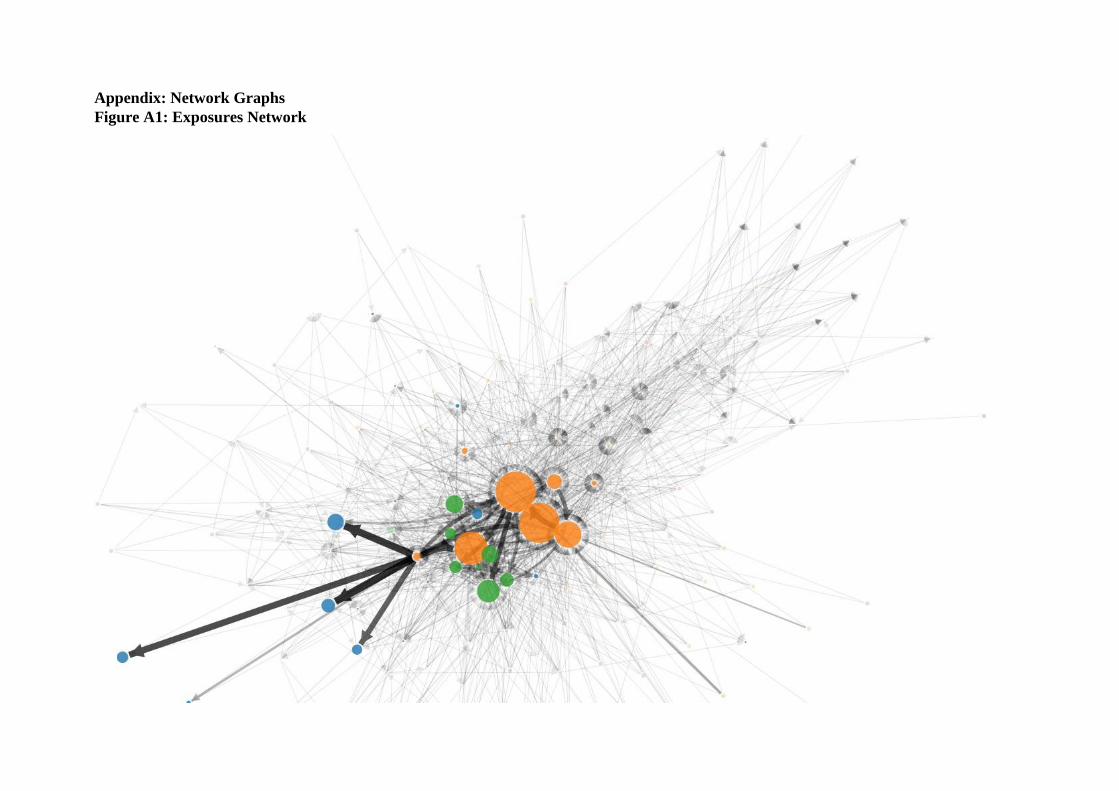
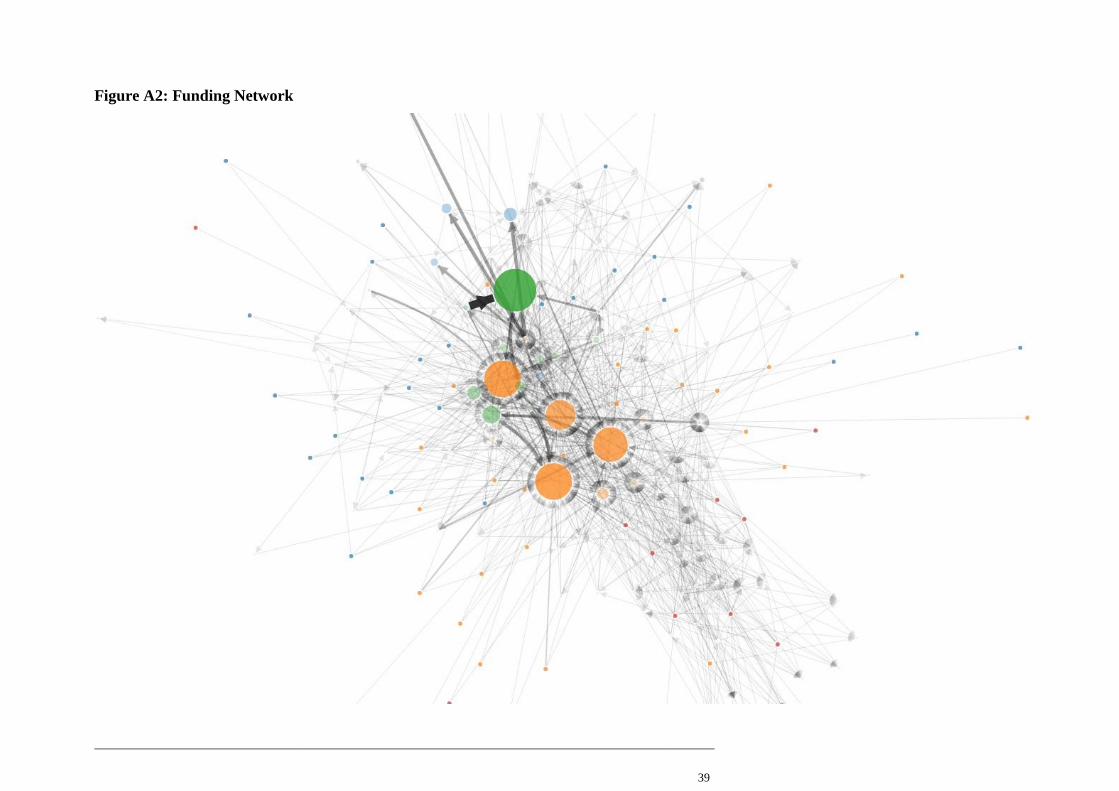
Intuitively, the concentrated UK interbank market appears to mimic a ‘hub and spoke’ structure.
Figures A1 and A2 in the annex convey this impression graphically. Informally, banks in the
central hub are strongly connected to other hub banks and possibly also to banks on the
periphery; in contrast, peripheral banks are weakly connected to other peripheral banks. This
topology has pedigree in the extant networks literature. In Borgatti (1999), the ‘hub and spoke’,
or core-periphery, structure is exemplified by a core perfectly connected to itself: in matrix
010
20
30
40
50
Out-
Str
ength
: E
xposure
/ C
T1 N
etw
ork
0 .2 .4 .6 .8 1Out-Relative Strength Concentration: Exposures Network
UK banks Building societies Investment banks Overseas banks
Markers' area are proportional to within-quintile mean of banks' total global liabilities
Sample: 176 UK reporting banks
Strength in Exposures / CT1 Network vs RSC in Exposures Network
Figure 16
28
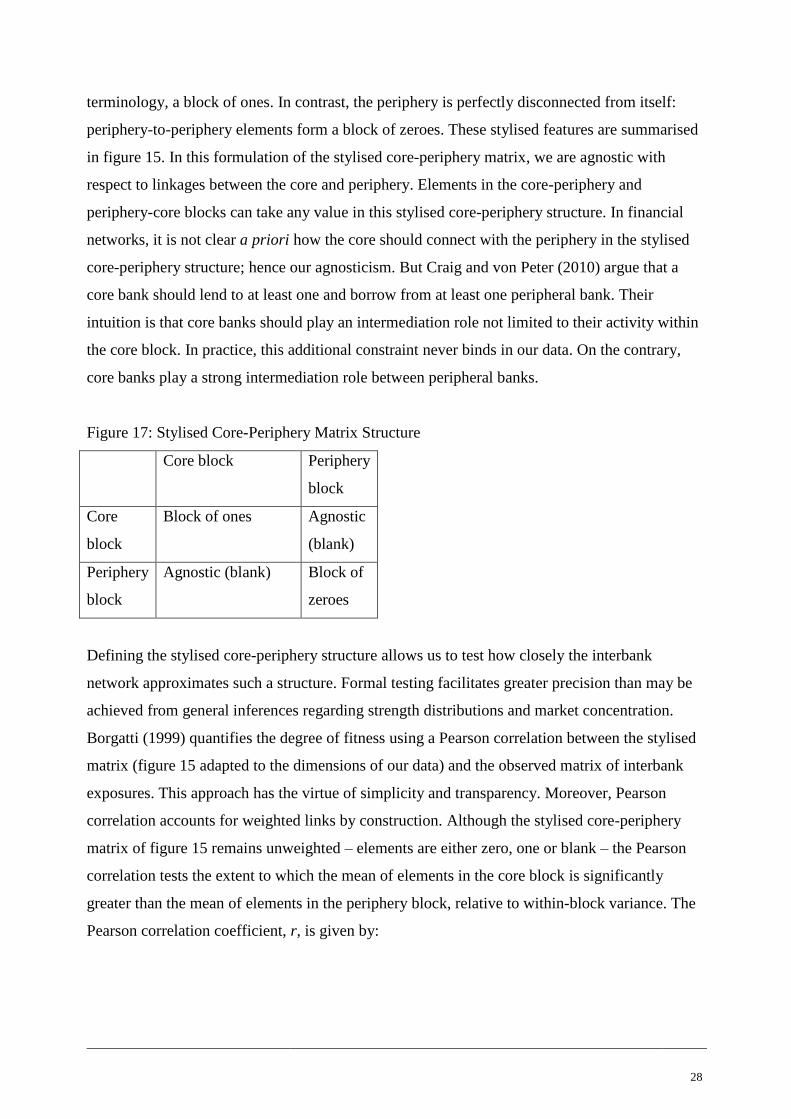
terminology, a block of ones. In contrast, the periphery is perfectly disconnected from itself:
periphery-to-periphery elements form a block of zeroes. These stylised features are summarised
in figure 15. In this formulation of the stylised core-periphery matrix, we are agnostic with
respect to linkages between the core and periphery. Elements in the core-periphery and
periphery-core blocks can take any value in this stylised core-periphery structure. In financial
networks, it is not clear a priori how the core should connect with the periphery in the stylised
core-periphery structure; hence our agnosticism. But Craig and von Peter (2010) argue that a
core bank should lend to at least one and borrow from at least one peripheral bank. Their
intuition is that core banks should play an intermediation role not limited to their activity within
the core block. In practice, this additional constraint never binds in our data. On the contrary,
core banks play a strong intermediation role between peripheral banks.
Figure 17: Stylised Core-Periphery Matrix Structure
Core block Periphery
block
Core
block
Block of ones Agnostic
(blank)
Periphery
block
Agnostic (blank) Block of
zeroes
Defining the stylised core-periphery structure allows us to test how closely the interbank
network approximates such a structure. Formal testing facilitates greater precision than may be
achieved from general inferences regarding strength distributions and market concentration.
Borgatti (1999) quantifies the degree of fitness using a Pearson correlation between the stylised
matrix (figure 15 adapted to the dimensions of our data) and the observed matrix of interbank
exposures. This approach has the virtue of simplicity and transparency. Moreover, Pearson
correlation accounts for weighted links by construction. Although the stylised core-periphery
matrix of figure 15 remains unweighted – elements are either zero, one or blank – the Pearson
correlation tests the extent to which the mean of elements in the core block is significantly
greater than the mean of elements in the periphery block, relative to within-block variance. The
Pearson correlation coefficient, r, is given by:
29
∑ ∑
√∑ ∑
√∑ ∑
where denotes the elements in the stylised core-periphery matrix.
The next step is to define the composition of the core and periphery blocks. We exploit an
algorithm developed by Borgatti, Everett and Freeman (2002). In short, the (genetic) algorithm
searches for a core-periphery division of banks to maximise fitness between the observed matrix
of interbank exposures (thus divided into core and periphery) and the stylised core-periphery
structure. The resulting categorisation of core and periphery is therefore optimal, in the sense
that it is the categorisation which for that observed matrix approximates most closely the
stylised core-periphery structure.
We implement the algorithm on the exposures network for a square 176x176 matrix. That is, we
drop exposures from reporting banks to non-reporting banks. For this network, the algorithm
finds the optimal core to comprise seven banks; the remaining 169 banks therefore comprise the
periphery. Fitness between the exposures network and the stylised core-periphery structure is
0.672, suggesting economically significant fitness. In contrast, the funding network comprises
an optimal core of nine banks and exhibits fitness of 0.385 with respect to the stylised core-
periphery structure.
We can investigate coreness in more detail by implementing the algorithm on different link
types. The results indicate that the closeness of the observed unsecured lending and repo
networks to the stylised core-periphery structure is relatively low, with fitness of 0.415 and
0.362 respectively. Given that repo is 66% of the total funding network (figure 1), fitness of
0.362 drives relatively low fitness of 0.385 in the overall funding network. In contrast, fitness in
the derivatives and marketable securities networks, which comprise part of the overall exposures
network, is relatively high, at 0.577 and 0.639 respectively. We interpret these results in section
6.1.
30
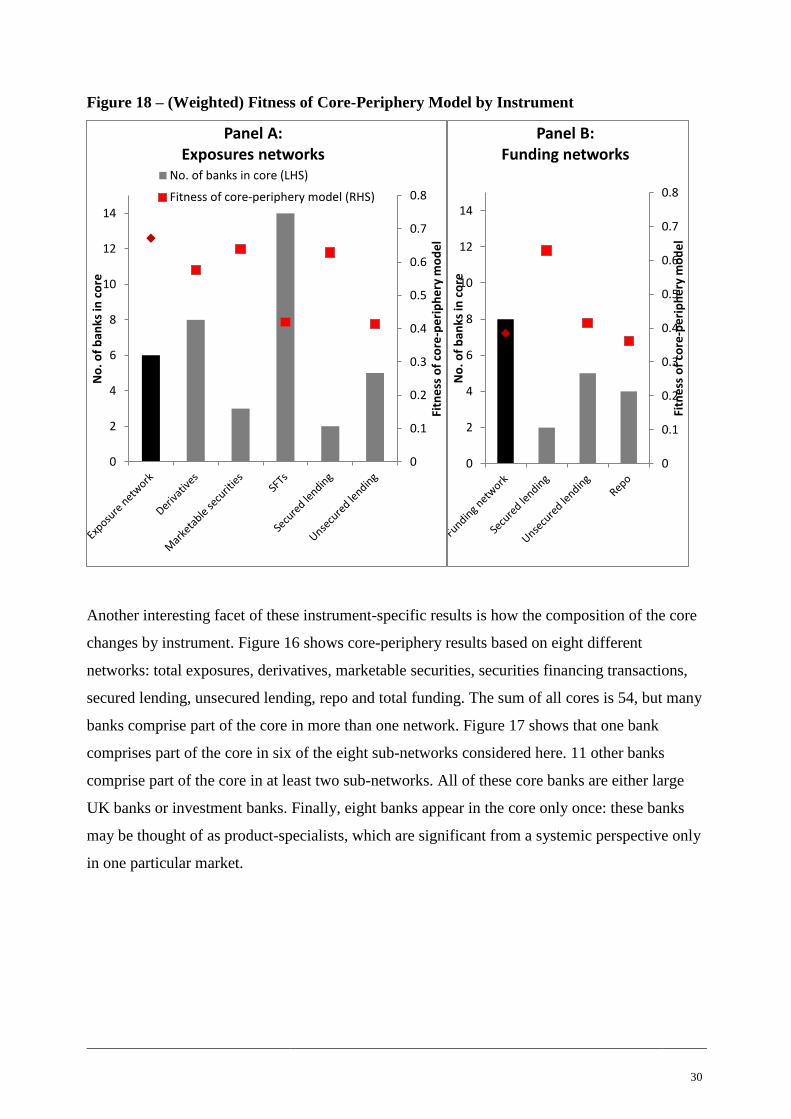
Figure 18 – (Weighted) Fitness of Core-Periphery Model by Instrument
Another interesting facet of these instrument-specific results is how the composition of the core
changes by instrument. Figure 16 shows core-periphery results based on eight different
networks: total exposures, derivatives, marketable securities, securities financing transactions,
secured lending, unsecured lending, repo and total funding. The sum of all cores is 54, but many
banks comprise part of the core in more than one network. Figure 17 shows that one bank
comprises part of the core in six of the eight sub-networks considered here. 11 other banks
comprise part of the core in at least two sub-networks. All of these core banks are either large
UK banks or investment banks. Finally, eight banks appear in the core only once: these banks
may be thought of as product-specialists, which are significant from a systemic perspective only
in one particular market.
0
0.1
0.2
0.3
0.4
0.5
0.6
0.7
0.8
0
2
4
6
8
10
12
14
Fitn
ess
of
core
-pe
rip
he
ry m
od
el
No
. of
ban
ks in
co
re
Panel A: Exposures networks
No. of banks in core (LHS)
Fitness of core-periphery model (RHS)
0
0.1
0.2
0.3
0.4
0.5
0.6
0.7
0.8
0
2
4
6
8
10
12
14
Fitn
ess
of
core
-pe
rip
he
ry m
od
el
No
. of
ban
ks in
co
re
Panel B: Funding networks
31
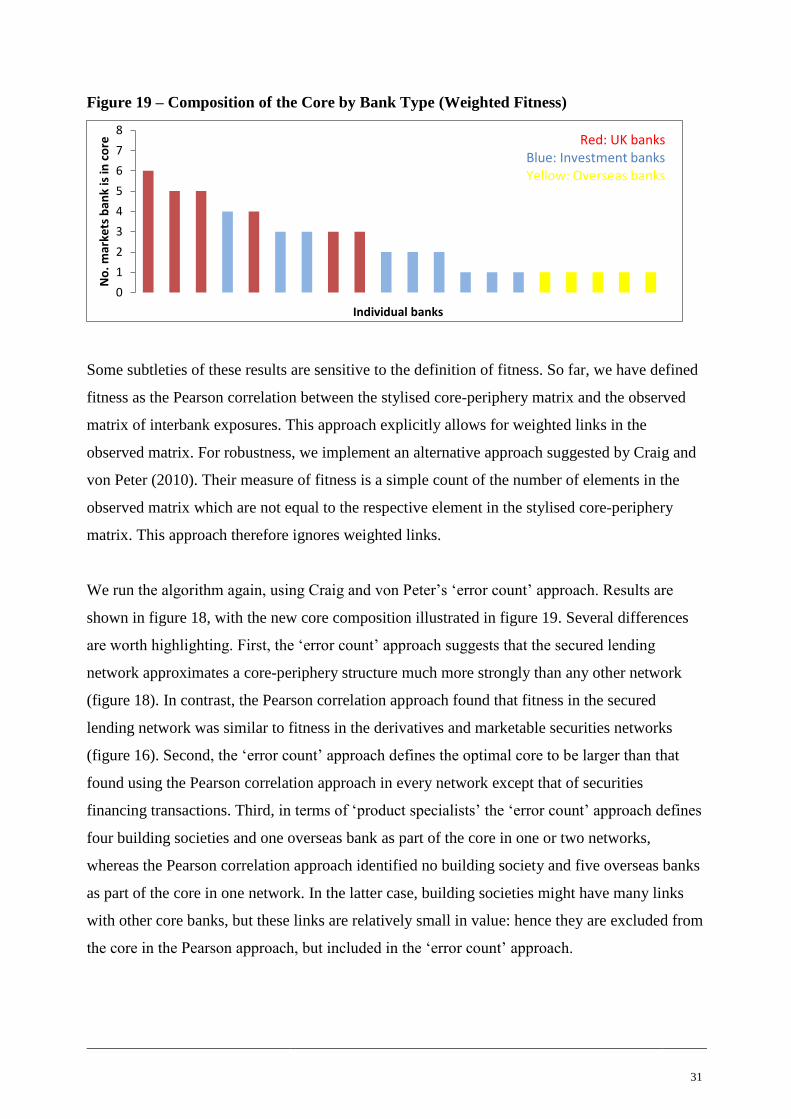
Figure 19 – Composition of the Core by Bank Type (Weighted Fitness)
Some subtleties of these results are sensitive to the definition of fitness. So far, we have defined
fitness as the Pearson correlation between the stylised core-periphery matrix and the observed
matrix of interbank exposures. This approach explicitly allows for weighted links in the
observed matrix. For robustness, we implement an alternative approach suggested by Craig and
von Peter (2010). Their measure of fitness is a simple count of the number of elements in the
observed matrix which are not equal to the respective element in the stylised core-periphery
matrix. This approach therefore ignores weighted links.
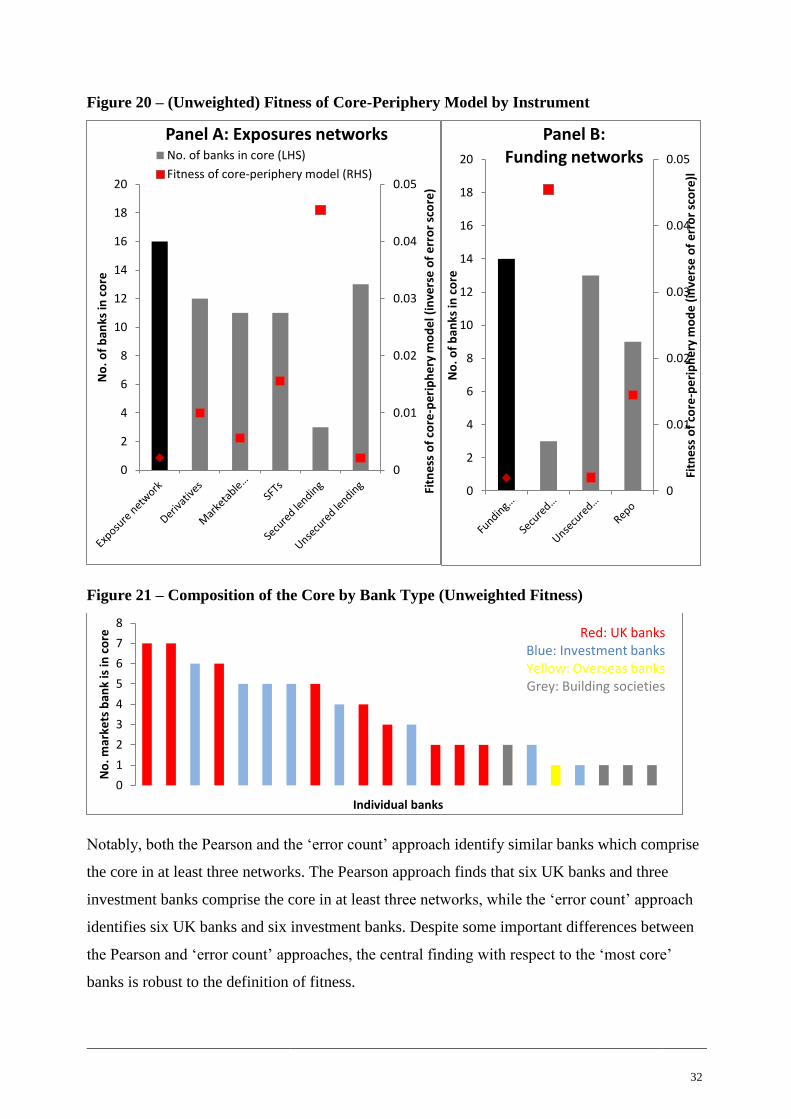
We run the algorithm again, using Craig and von Peter’s ‘error count’ approach. Results are
shown in figure 18, with the new core composition illustrated in figure 19. Several differences
are worth highlighting. First, the ‘error count’ approach suggests that the secured lending
network approximates a core-periphery structure much more strongly than any other network
(figure 18). In contrast, the Pearson correlation approach found that fitness in the secured
lending network was similar to fitness in the derivatives and marketable securities networks
(figure 16). Second, the ‘error count’ approach defines the optimal core to be larger than that
found using the Pearson correlation approach in every network except that of securities
financing transactions. Third, in terms of ‘product specialists’ the ‘error count’ approach defines
four building societies and one overseas bank as part of the core in one or two networks,
whereas the Pearson correlation approach identified no building society and five overseas banks
as part of the core in one network. In the latter case, building societies might have many links
with other core banks, but these links are relatively small in value: hence they are excluded from
the core in the Pearson approach, but included in the ‘error count’ approach.
0
1
2
3
4
5
6
7
8
No
. mar
kets
ban
k is
in c
ore
Individual banks
Red: UK banks Blue: Investment banks Yellow: Overseas banks
32
Figure 20 – (Unweighted) Fitness of Core-Periphery Model by Instrument
Figure 21 – Composition of the Core by Bank Type (Unweighted Fitness)
Notably, both the Pearson and the ‘error count’ approach identify similar banks which comprise
the core in at least three networks. The Pearson approach finds that six UK banks and three
investment banks comprise the core in at least three networks, while the ‘error count’ approach
identifies six UK banks and six investment banks. Despite some important differences between
the Pearson and ‘error count’ approaches, the central finding with respect to the ‘most core’
banks is robust to the definition of fitness.
0
0.01
0.02
0.03
0.04
0.05
0
2
4
6
8
10
12
14
16
18
20
Fitn
ess
of
core
-pe
rip
he
ry m
od
el (
inve
rse
of
err
or
sco
re)
No
. of
ban
ks in
co
re
Panel A: Exposures networks No. of banks in core (LHS)
Fitness of core-periphery model (RHS)
0
0.01
0.02
0.03
0.04
0.05
0
2
4
6
8
10
12
14
16
18
20
Fitn
ess
of
core
-pe
rip
he
ry m
od
e (
inve
rse
of
err
or
sco
re)l
No
. of
ban
ks in
co
re
Panel B: Funding networks
0
1
2
3
4
5
6
7
8
No
. mar
kets
ban
k is
in c
ore
Individual banks
Red: UK banks Blue: Investment banks Yellow: Overseas banks Grey: Building societies
33
6 Interpretation
We have observed that the UK interbank system clearly exhibits a 'hub and spoke', or core-
periphery, structure. In this section, we draw on the extant banking and networks literature to
explain why such a network structure might emerge from interbank transactions, and to infer
implications for the stability of the financial system as a whole.
6.1 Theory of Network Formation
Incompleteness and high concentration is a common feature of modern banking systems,
including Belgium (Degryse and Nguyen, 2010), Germany (Sacks, 2010; Craig and von Peter,
2010) and Italy (Fricke and Lux, 2012). Degryse and Nguyen (2010) and Mistrulli (2011) show
that the core periphery structure emerged in the middle of 1990s, from a near-complete network
structure. This is the first paper to reveal the core periphery network structure of the UK
interbank system directly.
Although the core periphery structure has been observed in many banking systems, theoretical
literature studying the economics of network formation remains scarce. Nevertheless, we can
leverage insights from broader fields of banking theory. From the viewpoint of costly state
verification, it is optimal to delegate monitoring activities to one agent who becomes a
monitoring specialist. Thus banks specialise in monitoring activities, rather than all depositors
(Diamond, 1984). In a similar vein, centralised intermediation in the interbank market could
reflect optimal specialisation in monitoring activity. As Diamond and Dybvig (1983) argue,
banks collecting deposits from many depositors can achieve socially optimal intertemporal
consumption allocation, when depositors do not know their optimal consumption timing ex ante.
Even though those studies consider the relationship between banks and depositors, it is not
unrealistic to assume that we can observe a similar relationship between core banks and
peripheral banks, given the complexity of financial markets. And it is also not unrealistic to
consider that core banks would have similar vulnerability to banks being exposed to depositors’
run, a la the roll-over risk discussed by Acharya, Gale and Yorulmazer (2011).
The theory of finance also discusses the core-periphery structure of financial markets in the
context of price-setting behaviour of market-makers. This body of literature typically assumes a
monopolistic specialist filling a gap between demand and supply: Garman (1976) considers a

34
market maker broking final buyers and sellers arriving randomly (the so-called inventory
management approach); Glosten and Milgrom (1985) consider a dealer broking between
informed traders and uninformed traders (the asymmetric information approach). More recently,
Duffie, Garleanu and Pederson (2005) discuss the relationship between the bid-ask spread and
the cost of searching counterparties in the over-the-counter derivatives markets. They argue that
smaller investors tend to have few connections with other banks, which lowers searching
efficiency when they want to trade, and receive less favourable prices.
The centralised network can be explained with reference to post-trade activities. If all traders
clear their trades via a central agent (a so-called central clearing counterparty), the traders can
net out more offsetting counterparty exposures than if they were to clear trades bilaterally
(Duffie and Zhu, 2010).
In general, the ‘star-shape’ network structure is thought to be efficient and stable. Jackson and
Wolinsky (1996) show that the star-shape network is efficient if the cost of making links is
intermediate. At the extremes, a complete network structure is efficient if the cost of forming
links is sufficiently low; while a perfectly incomplete network structure is optimal if this cost is
prohibitively high. Many relatively minor transaction costs in financial markets, such as
settlement operations, could help to explain the formation of star-shape networks. In addition,
Bala and Goyal (2000) argue that network structure converges to the star-shape from arbitrary
networks in the context of social learning.
Moreover, we have seen in Section 5.2 that the fitness between the stylised core-periphery
structure and different observed networks varies substantially by instrument. This may be
largely explained by the microstructure of the different networks. For example, in the
derivatives network, dealer banks tend to have large mutual exposures (that is, high core-to-core
fitness), since both parties of a derivatives transaction often have large uncollateralised
exposures to each other (despite having collateral agreements in place), whereas non-dealer
banks typically do not have derivatives exposures between themselves (that is, high periphery-
to-periphery fitness). Given that derivatives account for 44% of total interbank exposures, this
implies a high fitness in the exposures network. On the other hand, funding instruments (except
secured lending which account for only 5% of the funding network) tend to have a different
pattern. First, the number of banks borrowing via unsecured lending or repos is relatively large,
partly due to the need of both lenders and borrowers to diversify their exposures and funding
35
sources (that is, low coreness for core banks). Second, most banks do not have mutual funding
arrangements as funding flow is typically one-way (that is, low core-to-core fitness). Therefore
the funding network has a relatively low fitness with the stylised core-periphery structure as
compared to the exposures network.
6.2 Financial Stability Implications
Although the core-periphery structure has been observed in several interbank systems,
theoretical literature studying vulnerabilities underlying such structure remains relatively scarce.
Exceptions are Allen and Gale (2000), Freixas, Parigi and Rochet (2000) and Battiston et al
(2009). But the conclusions of these papers vary, such that the extant literature is ambiguous
with respect to the qualitative relationship between a core-periphery network structure and the
resilience of the system. It is therefore difficult to extract straightforward implications. For
example, Allen and Gale (2000) show the risk of contagion in incomplete networks; while
Battiston et al (2009) argue that a highly connected network could amplify the effect of an initial
negative shock, triggering systemic risk. In this vein, Gai and Kapadia (2010) find that while the
probability of contagion is decreasing in connectivity, the impact of contagion should it occur is
increasing in connectivity.
Freixas, Parigi and Rochet (2000) is one of few theoretical studies considering the core-
periphery structure explicitly. They consider a stylised structure in which two peripheral banks
connect with a ‘money centre’ bank, and find three different patterns of contagion. First, no
contagion occurs if banks’ debt is sufficiently small. Second, if the debt size is large, then the
insolvency of the money centre bank renders the other two banks insolvent, but not vice versa:
the core bank is resilient against a peripheral bank’s default. Third, if debt is sufficiently large, a
peripheral bank’s insolvency triggers all banks’ default.
The the core bank’s relative resilience is explained as follows. In the model of Freixas, Parigi
and Rochet (2000), banks are connected by commitment lines; insolvency shocks are propagated
across banks since depositors of failed banks withdraw cash from connected banks. This
withdrawal forces connected banks to fire-sale assets at a loss, which triggers their own
depositors’ run. When a peripheral bank goes bankrupt, the withdrawal from the core bank (and
the loss from fire-sale) is contained since the line is diversified to two banks. The peripheral
banks are thoroughly exposed to the core bank and thus vulnerable to its failure.
36
Since their model is highly stylised it is difficult to test. But we observe several interesting
features in our dataset which relate to Freixas, Parigi and Rochet (2000). Core banks indeed
have many connections with peripheral banks. The average in-degree of cores from peripherals
in the exposures network is 89, and the average out-degree of cores to peripherals is 22.
However, Nier et al (2007) argue that the connectivity between core and peripheral banks is not
monotonic. If a core bank is connected to few peripherals then the default of that core bank is
likely to trigger peripheral banks’ default. But if a core bank is connected with many peripheral
banks, the insolvency shock is diluted and is less likely to create a systemic problem. The result
follows from simulations which assume homogeneous banks. But this paper has shown that
banks are highly heterogeneous in terms of both balance-sheet characteristics and levels and
types of activities in the interbank markets.
It is therefore important to interact balance-sheet characteristics and interbank market activity in
a way which captures banks’ heterogeneity. To do this, we use a metric suggested by Amini,
Cont and Minca (2011), Contagious Link, to incorporate peripherals banks’ heterogeneity. The
metric defines vulnerable links as those where the exposed bank goes bankrupt when the
receiving banks becomes insolvent. In the first instance, we assume that the exposed bank goes
bankrupt when the exposure is larger than the exposed bank’s loss-absorbing capital. In the new
regulatory dataset on interbank exposures there are 67 such contagious links; approximately
70% of the links are from core banks to peripheral banks. If we define the link as the exposure is
larger than 50% of exposed banks’ capital, the number of links increases to 173, and again 70%
of the links are from core to peripherals (the others are between peripherals). Irrespective of the
connectivity, some peripherals are indeed vulnerable against cores. The number of contagious
nodes, exposed to contagious links, is 65, of which all are peripheral banks.
Some empirical studies, such as Degryse and Nguyen (2007), capture the core-periphery
structure from the viewpoint of size. The authors show by simulation that the share of large
banks’ exposure (out of total exposure) is negatively correlated to aggregate loss of capital,
especially when cores are well-capitalised. In short, the core-periphery structure lowers systemic
risk if systemically important banks are well capitalised. The core banks that we identify using
the new regulatory dataset on UK interbank exposures have a similar market share of
approximately 70%.
37
In the core periphery structure, systemic shocks can propagate between core and peripherals, or
between core and core. By construction, the core-to-core block is nearly complete. Typically
this structure is considered to be resilient, as Allen and Gale (2000) argue. In addition, Sacks
(2010), using German data, considers the vulnerability of core banks in the context of a core-
periphery network structure. She finds both that core nodes connected with many other nodes
and core nodes connected with smaller nodes are more resilient. But Battiston et al (2009) argue
the opposite: a complete network structure could amplify default risks.
A central finding of this paper is that the UK interbank market closely approximates a core-
periphery structure, but that the closeness of this approximation, and the composition of the
optimal core, changes significantly across market instruments. This finding has potentially
important implications, hitherto untapped by the extant literature. Stress is liable to propagate
across interbank markets, particularly in the presence of strong confidence effects and
information asymmetries. Product specialists which comprise part of the core in only one or two
networks might not commonly be considered systemically important, but their centrality in
certain categories of interbank markets might spill-over to other markets. For example,
American International Group (AIG), the insurance company, was not considered by some
observers to be a systemically important financial institution before the financial crisis.
However, it was a significant player in both the CDS market and the securities lending market
(Harrington (2009)). At that time, the CDS market may be characterised as a high-fitness
network with AIG being one of the critical participants (because AIG was significant both as a
CDS seller and a reference entity),19
whereas the securities lending market may be characterised
as a low-fitness network with AIG being one of the core banks (because AIG was a significant
securities lender but the borrowers are collateralised and typically non-systemic institutions). As
we have seen during the crisis, the failure of a core participant in one particular network, as is
the case of AIG, may have contagious effects on the whole financial system. Better
understanding of the structure of different networks and the links between them would enable us
to assess systemic risk more accurately.
19 We have not computed the core-periphery fitness of the CDS network in this paper, due to the fact that a CDS contract involves three
banks and the resulting difficulty in defining the core.
Appendix: Network Graphs
Figure A1: Exposures Network
39
Figure A2: Funding Network
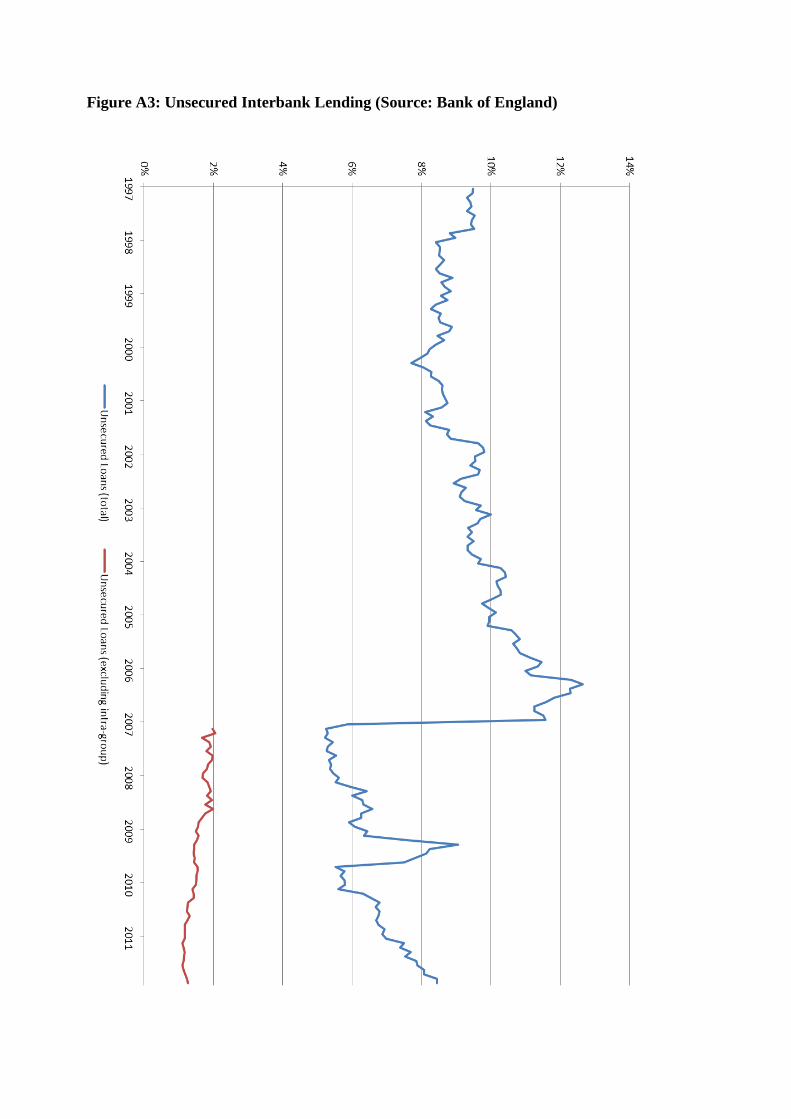
Figure A3: Unsecured Interbank Lending (Source: Bank of England)
References
Acharya, V, Gale, D and Yorulmazer, T (2011), ‘Rollover Risk and Market Freezes’, Journal
of Finance, vol. 66(4), pp.1177-1209.
Alessandri, P, Gai, P, Kapadia, S, Mora, N and Puhr, C (2009), ‘Towards a Framework for
Quantifying Systemic Stability’, International Journal of Central Banking, September.
Allen, F and D Gale (2000), ‘Financial Contagion’, Journal of Political Economy, vol 108, no
1, pp 1-33.
Amini, H, Cont, R and Minca, A (2011), ‘Resilience to contagion in financial networks’,
mimeo.
Ang, A and Longstaff, F A (2011), ‘Systemic Sovereign Credit Risk: Lessons from the U.S.
and Europe’, NBER Working Paper no.16982.
Bala, V and Goyal, S (2000), ‘A Noncooperative Model of Network Formation’,
Econometrica, vol. 68(5), pp.1181-1230, September.
Barthelemy, M, Barrat, A, Pastor-Satorras, R and Vespignani, A (2005), ‘Characterization
and modelling of weighted networks’, Physica A, 346, pp 34-43.
Basel Committee on Banking Supervision (2011), ‘Global systemically important banks:
assessment methodology and the additional loss absorbency requirement’.
Battiston, S., Gatti, D., Gallegati, M., Greenwald, B. and Stiglitz, J.E. (2009), ‘Liaisons
Dangereuses: Increasing Connectivity, Risk Sharing, and Systemic Risk’, NBER Working Paper
no.15611.
Becher, C, Millard, S and Soromaki, K (2008), ‘The network topology of CHAPS Sterling’,
Bank of England Working Paper No 355.
Borgatti, S.P. and Everett, M.G. (1999), ‘Models of core/periphery structures’, Social
Networks 21 375-395
Borgatti, S.P., Everett, M.G. and Freeman, L.C. (2002), Ucinet for Windows: Software for
Social Network Analysis. Harvard, MA: Analytic Technologies.
Boss, M, Elsinger, H, Summer, M and Thurner, S (2004), ‘Network topology of the
interbank market’, Quantitative Finance, 4:6, 677-684.
Cocco, F, Gomes, F and Martins, N (2009), ‘Lending relationships in the interbank market’,
Journal of Financial Intermediation, 18, 24-48.
Cont, R and Kokholm, T. (2012), ‘Central clearing of OTC derivatives: bilateral vs
multilateral netting’, mimeo.
Craig, B. and von Peter, G (2010), ‘Interbank tiering and money center banks’, BIS Working
Paper no.322.
42
Degryse, H and Nguyen, G (2007), ‘Interbank Exposures: An Empirical Examination of
Contagion Risk in the Belgian Banking System’, International Journal of Central Banking,
June.
Diamond, D and Dybvig, P (1983), ‘Bank Runs, Deposit Insurance, and Liquidity’, Journal of
Political Economy, vol.91, no.3 (June, 1983), pp.401-419.
Diamond, D (1984), ‘Financial Intermediation and Delegated Monitoring’, Review of Economic
Studies, 51 (3): 393-414.
Duffie, D., Garleanu, N. and Pederson, L. H. (2005), ‘Over-the-counter Markets’,
Econometrica, vol.73, no.6, 1815-1847.
Duffie, D. and Zhu, H. (2011), ‘Does a central clearing counterparty reduce counterparty
risk?’, Review of Asset Pricing Studies, vol.1 no.1, pp.74-95.
European Central Bank (2003), ‘Memorandum of understanding on the exchange of
information among national central credit registers for the purpose of passing it on to reporting
institutions’.
Fagiolo, E (2007), ‘Clustering in complex directed networks’, Physical Review E 76 026107.
Financial Services Authority (2009), ‘The Turner Review: A regulatory response to the global
financial crisis’.
Financial Services Authority (2012), ‘DRAFT: Amendments to Financial Stability and Market
Confidence Sourcebook (FINMAR)’.
Freixas, X, Parigi, B and Rochet, J-C (2000), ‘Systemic risk, interbank relations, and liquidity
provision by the central bank’, Journal of Money, Credit and Banking, vol.32, no.3, part 2.
Fricke, D and Lux, T (2012), ‘Core-Periphery Structure in the Overnight Money Market:
Evidence from the e-MID Trading Platform’, Kiel Working Paper No.1759.
Gai, P and Kapadia, S (2010), ‘Contagion in financial networks’, Proc. R. Soc., 466, pp.2401-
2423.
Garman, M B (1976), ‘Market microstructure’, Journal of Financial Economics, 3, pp.257-75.
Glosten, L R and Milgrom, P R (1985), ‘Bid, ask, and transaction prices in a specialist market
with heterogeneously informed traders’, Journal of Financial Economics, 14, pp.71-100.
Haldane, A (2009), ‘Rethinking the financial network’, speech delivered at the Financial
Student Association, Amsterdam.
Harrington, S. E. (2009), ‘The Financial Crisis, Systemic Risk, and the Future of Insurance
Regulation’, Journal of Risk & Insurance, 76 (4), 785-819 (35).
Iazzetta, C and Manna, M (2009), ‘The topology of the interbank market: developments in
Italy since 1990’, Banca d’Italia Temi di discussione no.711.
Independent Commission on Banking (2011), ‘Final Report Recommendations’.
43
Iori, G, De Masi, G, Precup, O V, Gabbi, G and Calderelli, G (2008), ‘A network analysis of
the italian overnight money market’, Journal of Economic Dynamics and Control, vol.32
no.1,pp. 259-278.
Jackson, M O and Wolinsky, A (1996), ‘A Strategic Model of Social and Economic
Networks’, Journal of Economic Theory, 71, pp.44-74.
van Lelyveld, I and Liedorp, F (2006), ‘Interbank Contagion in the Dutch Banking Sector: A
Sensitivity Analysis’, International Journal of Central Banking, June.
Mistrulli, P E (2011), ‘Assessing financial contagion in the interbank market: Maximum
entropy versus observed interbank lending patterns’, Journal of Banking & Finance vol.35,
issue 5, May, pp.1114-1127.
Nier, E, Yang, J, Yorulmazer, T and Alentorn, A (2007), ‘Network models and financial
stability’, Journal of Economic Dynamics & Control, 31, pp.2033-2060.
Opsahl, T, Agneessens, F and Skvoretz, J (2010), ‘Node centrality in weighted networks:
Generalizing degree and shortest paths’, Social Networks, volume 32, issue 3, pp.245-251.
Sacks, A (2010), ‘Completeness, interconnectedness and distribution of interbank exposures – a
parameterized analysis of the stability of financial networks’, Discussion Paper Series 2:
Banking and Financial Studies, Bundesbank.
Saramaki, J, Kivela, M, Onnela, J-P, Kaski, K and Kertesz, J (2007), ‘Generalizations of the
clustering coefficient to weighted complex networks’, Physical Review E, 75, 027105
Soromaki, K, Bech, M, Arnold, J, Glass, R and Beyeler, W (2007), ‘The topology of
interbank payment flows’, Physica A 379 317-333.
Tucker, P (2011), ‘Clearing houses as system risk managers’. Speech given at the DTCC-CSFI
Post Trade Fellowship Launch, London.
Upper, C and Worms, A (2004), ‘Estimating bilateral exposures in the German interbank
market: Is there a danger of contagion?’, European Economic Review 48 827-849.
Wells, S (2004), ‘Financial interlinkages in the UK’s interbank market and the risk of
contagion’, Bank of England Working Paper no.230.