Embed Size (px)
Citation preview
Mapping Of Basement Faults With Gravity And Magnetic Data In Northern Alberta
Henry Lyatsky, Dinu Pana, Reg Olson and Lorraine Godwin
4827 Nipawin Cres. NW, Calgary, AB, T2K 2H8 [email protected]
ABSTRACT Predictive exploration methods are possible due to the linear alignment of many oil and gas fields in the Alberta Basin. In the Athabasca Basin, fault networks may be of interest for uranium exploration. Knowledge of basement structure is important in the exploration for diamonds. The large, fault-related Pine Point Mississippi-Valley-type mineral deposit in the Phanerozoic sedimentary cover lies in the Northwest Territories only a short distance north of the Alberta border. Two fundamentally different types of crystalline-basement structures, formed in different tectonic conditions, are recognized in the Alberta Basin: 1) Archean and Early Proterozoic (Hudsonian and older) ductile orogenic structures, and 2) Middle Proterozoic to Recent cratonic ones. The influence of ancient ductile structures on the Alberta Basin is largely confined to the control on Early Paleozoic depositional and drape patterns by the Precambrian erosional basement relief, which is to some extent related to the lithology distribution controlled by ductile ancient structures. Steep, brittle cratonic basement faults in the western Canadian platforms are much more subtle than their huge equivalents in the U.S. Cordilleran foreland. Brittle faults and fractures partly follow the older orgenic structures, but commonly cut across them. Even when sub-resolution seismically (?), brittle faults exerted considerable syn-depositional and post-depositional influence on the sedimentary cover. The basement-cover relationship is not 1:1, and basement-control mechanisms vary. The control was partial, episodic, locally variable, and commonly passive and indirect, particularly where zero-offset fractures affected fluid flow, salt dissolution and carbonate alteration. Steep, straight faults are commonly expressed as subtle potential-field lineaments, which can be gradient zones, alignments of separate local anomalies of various types and shapes, aligned breaks or discontinuities in the anomaly pattern, and so on. Many large magnetic and gravity anomalies represent the ductile, ancient, healed basement structures, obscuring the desirable subtle features. Subtlety of the desirable lineaments necessitates detailed data processing, using a wide range of anomaly-enhancement techniques and display parameters. The
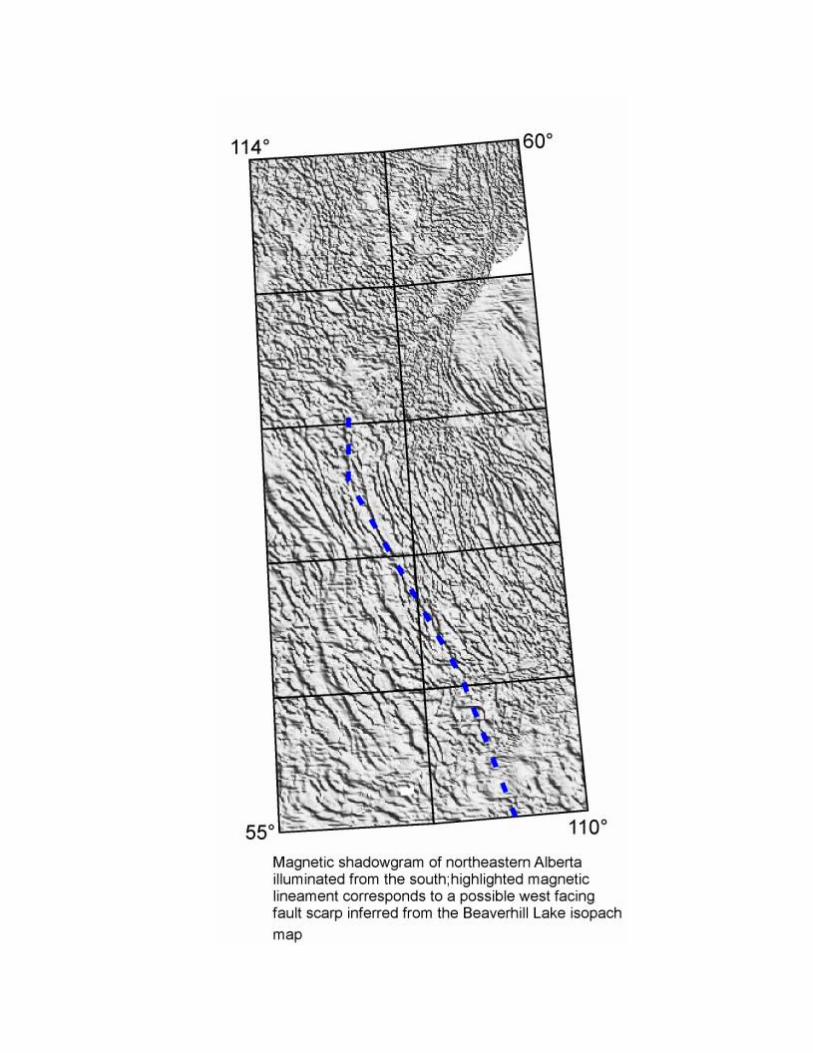
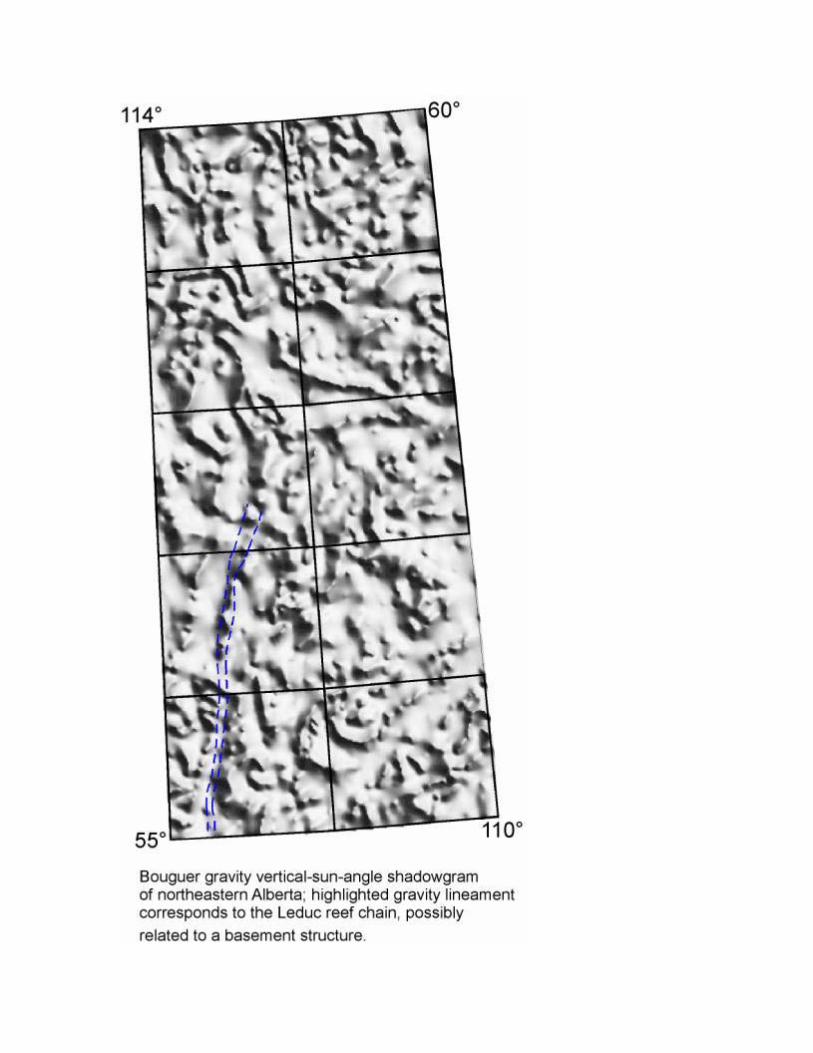
final choice of processing steps depends on which aspects of the anomalies one aims to enhance, as well as on experimentation with various techniques. Not a panacea, data processing is a necessary evil. Because the signal and noise anomaly characteristics commonly overlap, complete separation between them may be impossible. Noise artifacts may actually be introduced. Unexpected consequences and processing side-effects are normal. As well, it may be hard to know in advance which of the many anomalies are desirable. The processed and enhanced anomalies should ideally be easy to relate back to the original anomaly shapes. We kept the data processing to a minimum, avoided ill-described “black-box” techniques, and relied on mathematically simple and intuitive procedures. Geosoft’s Oasis montaj processing software was used. The Bouguer gravity data were supplied by the Geological Survey of Canada (GSC). Gravity data in the Alberta and Williston basins are sensitive to local vertical offsets across high-angle faults, where rocks with different densities are juxtaposed. Yet high densities in some Paleozoic sedimentary rocks just above the basement may smear out the subtle gravity signatures of basement faults. Notably, in the Peace River Arch in northwestern Alberta, where vertical basement-fault offsets reach tens and hundreds of meters, the associated gravity anomalies are not strong. The total-field magnetic data were also supplied by the GSC, with the International Geomagnetic Reference Field removed. The sedimentary cover in Alberta is generally considered to be almost non-magnetic, and the anomalies are sourced overwhelmingly in the crystalline basement. Local intra-sedimentary anomaly sources may be related to depositional concentrations of magnetic minerals in some clastic rocks, or to secondary magnetization of sedimentary rocks by circulating brines. Gravity and magnetic data in northern Alberta were compiled by the GSC from surveys recorded at different times, sometimes with different parameters, technologies and specifications. The GSC gravity-data standard of one station per 10 km is usually not maintained in northern Alberta, but even in sparse data, long lineaments can be detected with careful anomaly enhancement. Detailed, good-quality regional aeromagnetic data are available from the GSC in northeastern Alberta. Bouguer gravity values decline gradually to the southwest as the Alberta Basin deepens. Because the depth to magnetic sources increases with basement depth, the shortest-wavelength magnetic anomalies are found in northeastern Alberta, where the basement is at shallow or zero depth.
Gridding of the data had to be tight enough to capture the anomaly details where the data were recorded at a close spacing, without needlessly creating enormous data files. For the gravity data, the optimal grid-cell size was chosen to be 1000 m; for the magnetic data, 400 m. Short-wavelength noise in the data, such as gridding artifacts, cultural noise or flight-line corrugation, may interfere with geologically meaningful lineaments, and is magnified when the subtle and short-wavelength anomalies are enhanced. This noise should be suppressed before processing, albeit at a price of sacrificing some useful anomaly information. Three noise-suppression techniques were considered: bandpass wavelength filtering, slight upward continuation, or smoothing with convolution filters. Bandpass filtering requires assuming the cut-off wavelengths, can smear the separation due to non-vertical filter roll-off, and can contaminate the data by Gibbs ringing. By experimentation, upward continuation (usually by one cell size) was found to be the most effective for the gravity data in the study area, and two passes of the Hanning convolution filter for the magnetic data. Horizontal-gradient maps are vivid, simple and intuitive derivative products which reveal the anomaly texture and highlight anomaly-pattern discontinuities. These maps contour the steepness of the anomaly relief’s slope. Horizontal-gradient maxima occur over the steepest parts of potential-field anomalies, and minima over the flattest parts. Short-wavelength anomalies are also enhanced. Vertical-derivative (vertical-gradient) maps accentuate short-wavelength components of the anomaly field, while de-emphasizing long-wavelength components. The vertical gradient can be thought of as the rate of change of anomaly values as the potential-field data are upward continued. Such maps are not intuitive, and they may be harder than horizontal-gradient maps to relate to the original anomaly shapes. Nonetheless, vertical-gradient maps help highlight the details, discontinuities and breaks in anomaly texture. The vertical-gradient procedure was found to be effective for enhancement of magnetic anomalies. The gravity data were too sparse to greatly benefit from such processing, which boosted the gridding artifacts. Total-gradient (or analytic-signal) maps help to reveal the anomaly texture and to highlight discontinuities. Short-wavelength anomalies are enhanced. Total-gradient maps are not intuitive because they incorporate the vertical derivative. Yet, analytic-signal maps are often effective at highlighting geologically meaningful subtle and local anomalies. To highlight the local anomaly details, automatic gain control (AGC) boosts amplitudes in areas with smooth anomalies, without sacrificing the long-wavelength information. Gain is estimated with a sliding square filter window, centered on each grid node in turn. Experimentation determines the optimal window size for each data set. A maximum gain correction is specified to
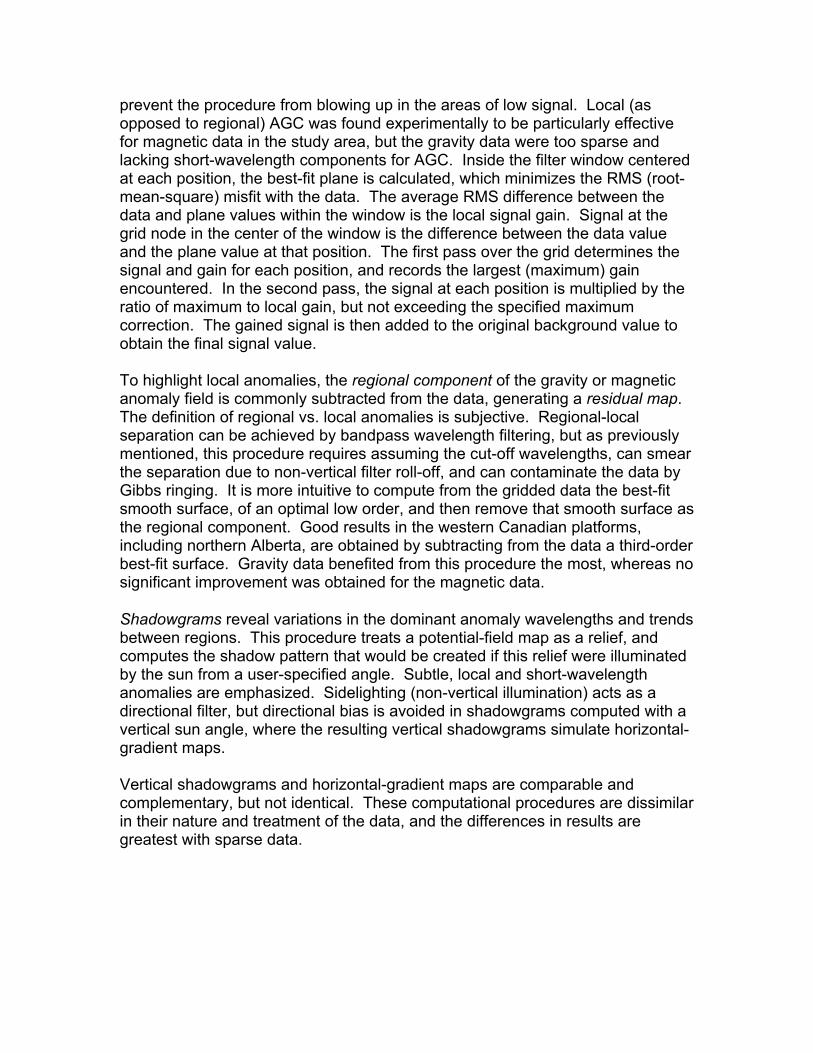
prevent the procedure from blowing up in the areas of low signal. Local (as opposed to regional) AGC was found experimentally to be particularly effective for magnetic data in the study area, but the gravity data were too sparse and lacking short-wavelength components for AGC. Inside the filter window centered at each position, the best-fit plane is calculated, which minimizes the RMS (root-mean-square) misfit with the data. The average RMS difference between the data and plane values within the window is the local signal gain. Signal at the grid node in the center of the window is the difference between the data value and the plane value at that position. The first pass over the grid determines the signal and gain for each position, and records the largest (maximum) gain encountered. In the second pass, the signal at each position is multiplied by the ratio of maximum to local gain, but not exceeding the specified maximum correction. The gained signal is then added to the original background value to obtain the final signal value. To highlight local anomalies, the regional component of the gravity or magnetic anomaly field is commonly subtracted from the data, generating a residual map. The definition of regional vs. local anomalies is subjective. Regional-local separation can be achieved by bandpass wavelength filtering, but as previously mentioned, this procedure requires assuming the cut-off wavelengths, can smear the separation due to non-vertical filter roll-off, and can contaminate the data by Gibbs ringing. It is more intuitive to compute from the gridded data the best-fit smooth surface, of an optimal low order, and then remove that smooth surface as the regional component. Good results in the western Canadian platforms, including northern Alberta, are obtained by subtracting from the data a third-order best-fit surface. Gravity data benefited from this procedure the most, whereas no significant improvement was obtained for the magnetic data. Shadowgrams reveal variations in the dominant anomaly wavelengths and trends between regions. This procedure treats a potential-field map as a relief, and computes the shadow pattern that would be created if this relief were illuminated by the sun from a user-specified angle. Subtle, local and short-wavelength anomalies are emphasized. Sidelighting (non-vertical illumination) acts as a directional filter, but directional bias is avoided in shadowgrams computed with a vertical sun angle, where the resulting vertical shadowgrams simulate horizontal-gradient maps. Vertical shadowgrams and horizontal-gradient maps are comparable and complementary, but not identical. These computational procedures are dissimilar in their nature and treatment of the data, and the differences in results are greatest with sparse data.
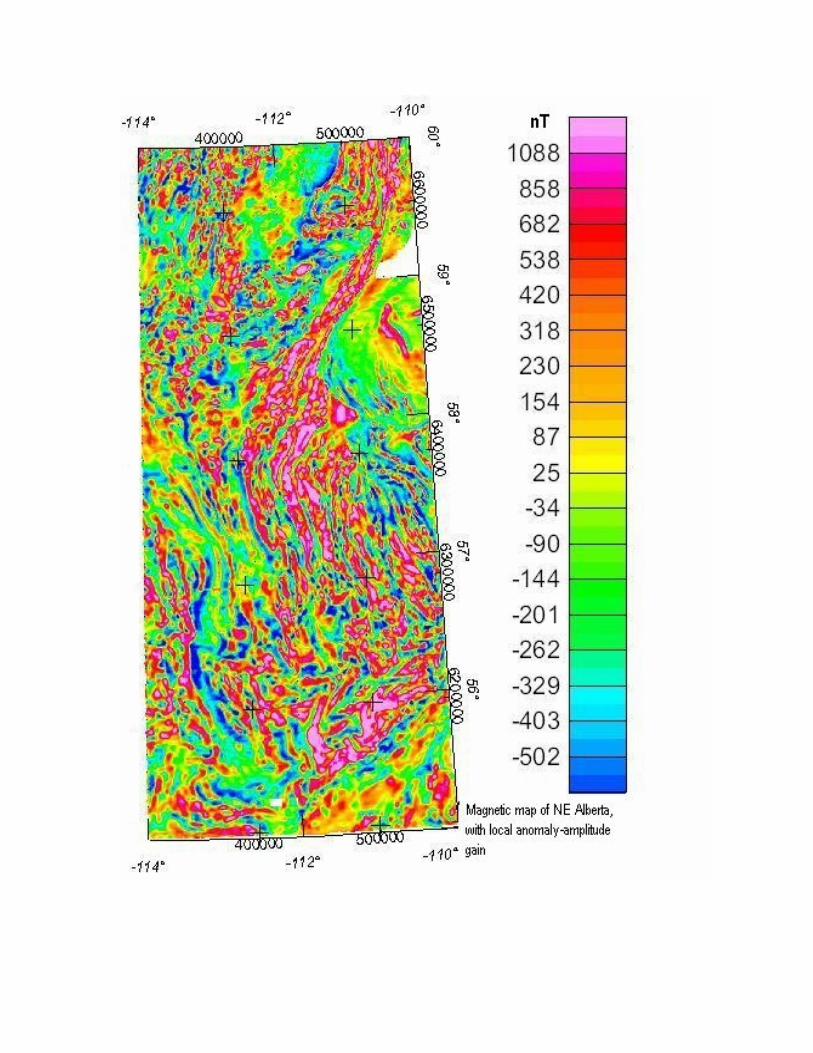
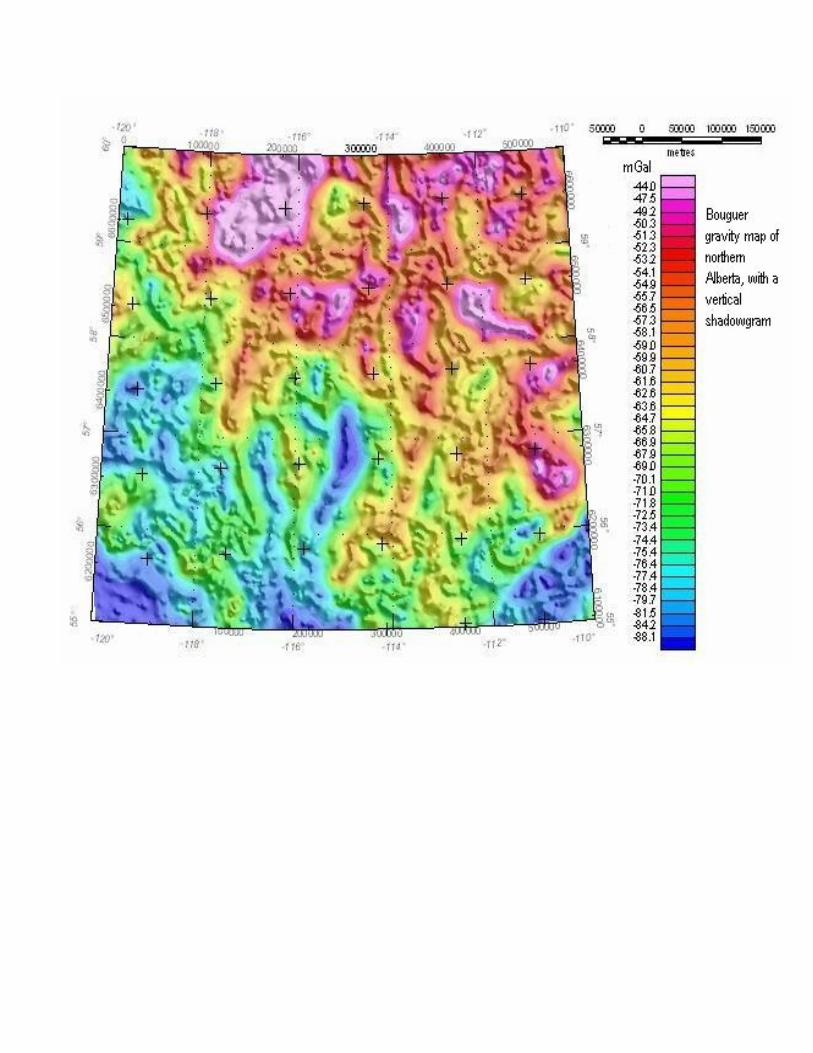
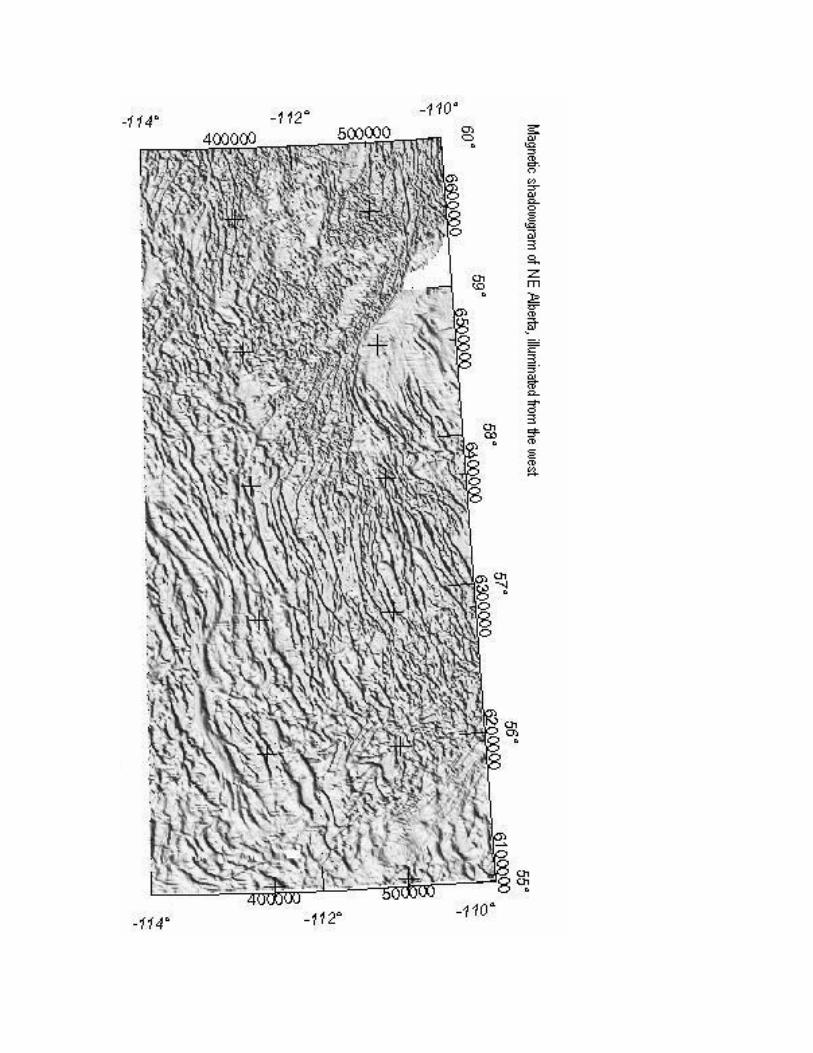
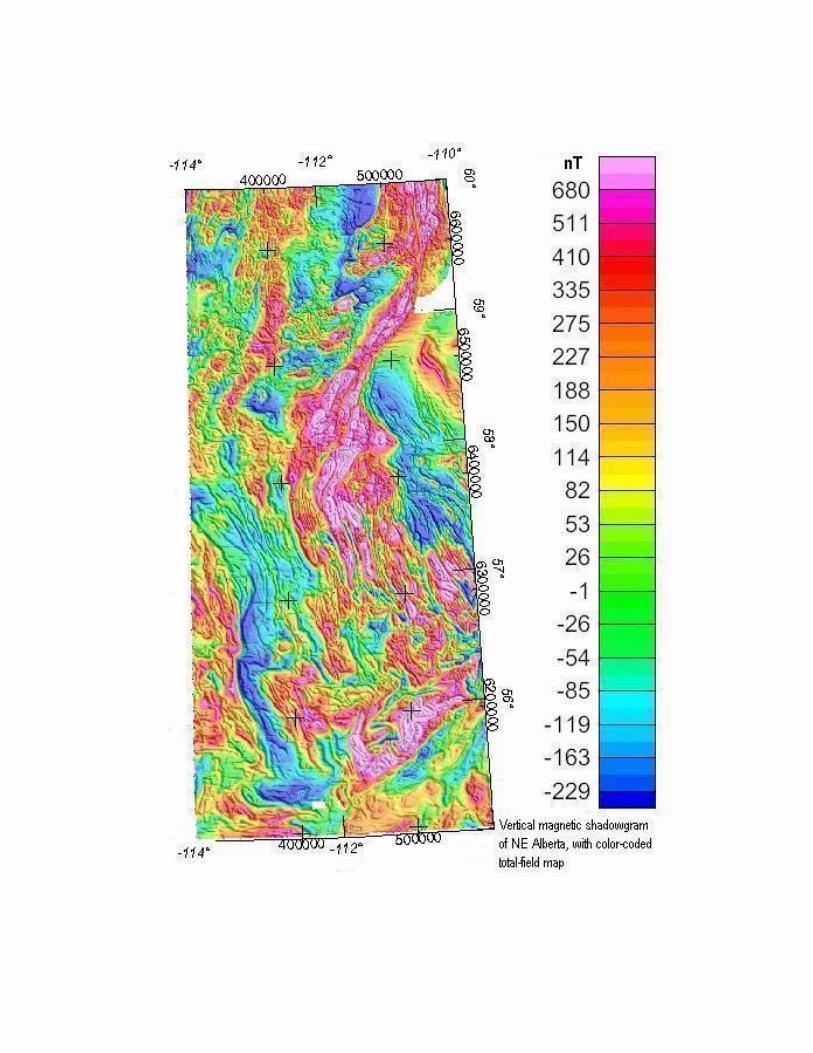
Sidelighting enhances anomalies non-parallel to the “sun” azimuth, and many shadowgrams with various sun angles were needed to reveal variously oriented anomalies. The optimal “sun” inclination for the gravity data was found experiementally to be 45° from the horizon, and for the magnetic data 30°. Sweeps of shadowgrams were generated for the gravity and magnetic data, with the “sun” illumination from the north, northeast, east, southeast, south, southwest, west and northwest. The large-scale regional anomaly pattern is revealed by upward continuation. Comparing the upward-continued gravity data with the raw data shows which of the anomalies survive the filtering, and thus can be inferred to potentially have big rock sources. Principal orientation of geologic features in the crust is revealed by the orientation of potential-field anomalies in upward-continued maps. Upward continuation uses wavelength filtering to simulate the appearance of potential-field maps if the data were recorded at a higher altitude. Short-wavelength anomalies are suppressed preferentially. Upward continuation is intuitive, as it is easy to understand and avoids the bandpass-filtering pitfalls. The bulk structure of the upper crust (where the brittle faults reside, above the brittle-ductile transition) is often revealed by upward continuing potential-field data to around 20 km. Because the gravity data in northern Alberta are sparse and have a diminished short-wavelength component to begin with, best results were obtained with upward continuation to only 15 km. A 20-km nominal altitude was found to be effective with the magnetic data. Visual identification of lineaments is the most relaible when done by an experienced interpreter familiar with both the geologic targets and the local specifics of the anomaliy field. Automatic anomaly-identification techniques rely on advance parameterization of desirable anomalies that may be too rigid to generate the most geologically meaningful anomaly picks. A good visual method to identify subtle lineaments is to view maps at a low angle on a table. Rotating the map on the table, to change the interpreter’s viewing direction, reveals features with various orientations. Viewing a map from above helps to see the distribution of anomaly patterns and domains. Particularly valuable are the aligned slight disruptions of an otherwise consistent anomaly field. Because the brittle cratonic faults commonly run through the ancient ductile basement structures without causing significant offsets, such razor-sharp but extremely subtle disruptions of the anomaly pattern are a prime target for interpretation. More vivid discontinuities, across which the overall anomaly pattern noticeably changes, may be related to the ancient ductile structures. These large discontinuities should be noted, nevertheless, because some of the large brittle structures are aligned with large ductile ones. Any linear potential-field feature

that runs for hundreds of kilometers, across large parts of the study region, is also of interest. Such straight regional features commonly represent major crustal shear zones and faults. The potential-field manifestation of a fault may vary along its trend, depending on the specific anomaly sources the fault runs through or past. An alignment of discontinuous, multiple local anomalies should therefore be of interest.