Embed Size (px)
Citation preview
Map Measurement and Transformation
Longley et al., ch. 13
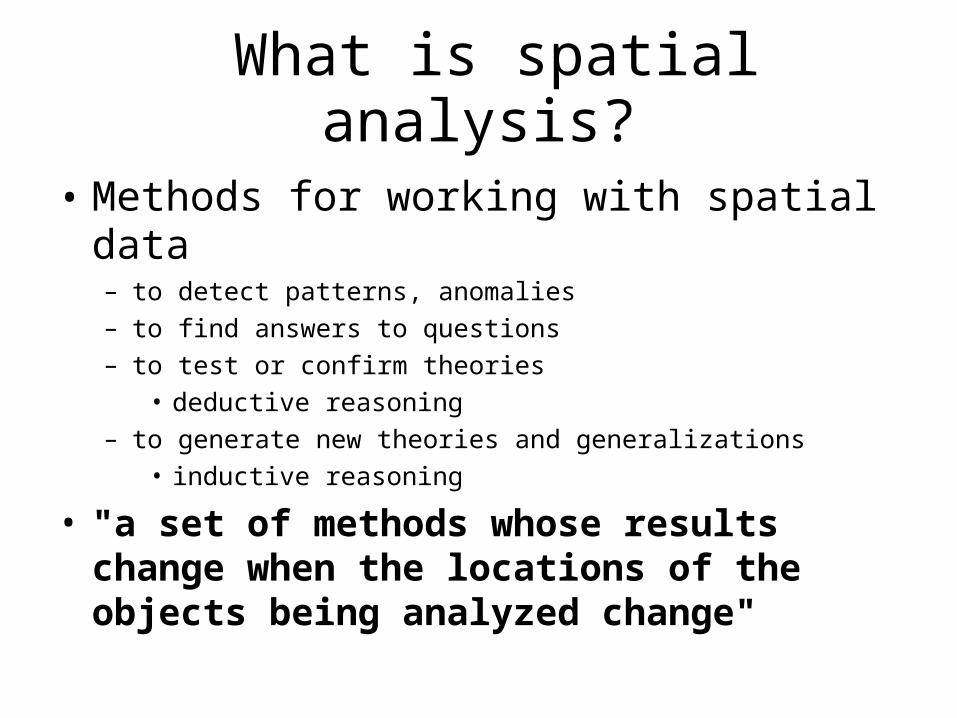
What is spatial analysis?
• Methods for working with spatial data – to detect patterns, anomalies– to find answers to questions – to test or confirm theories
• deductive reasoning– to generate new theories and generalizations
• inductive reasoning
• "a set of methods whose results change when the locations of the objects being analyzed change"
What is Spatial Analysis (cont.)
• Methods for adding value to data – in doing scientific research – in trying to convince others
• Turning raw data into useful information
• A collaboration between human and machine – Human directs, makes interpretations and
inferences– Machine does tedious, complex stuff
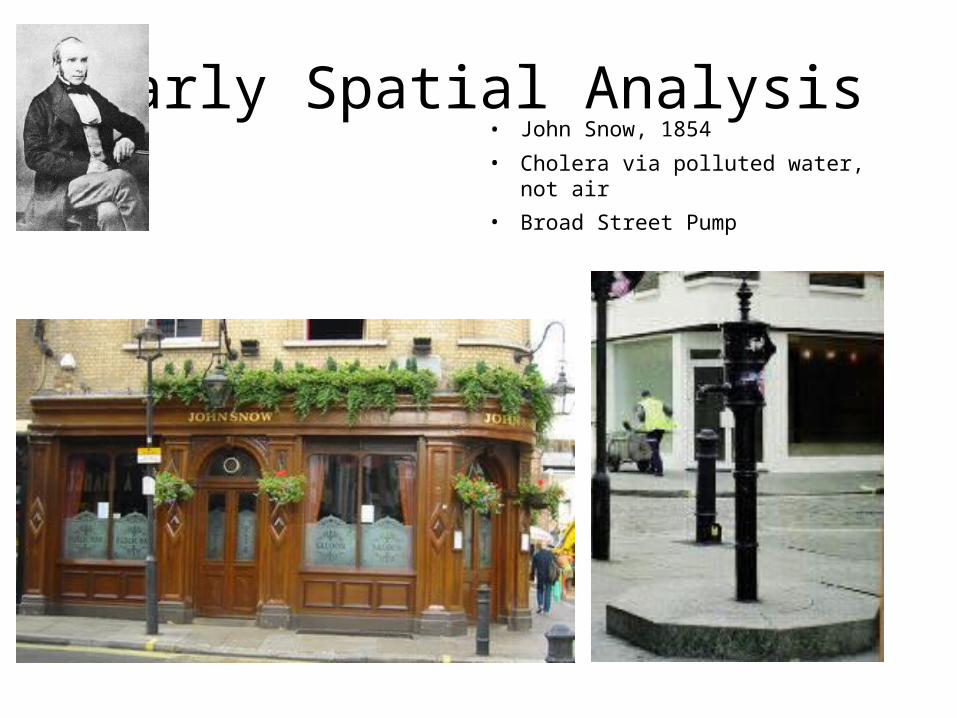
Early Spatial Analysis• John Snow, 1854
• Cholera via polluted water, not air
• Broad Street Pump

John Snow’s Map
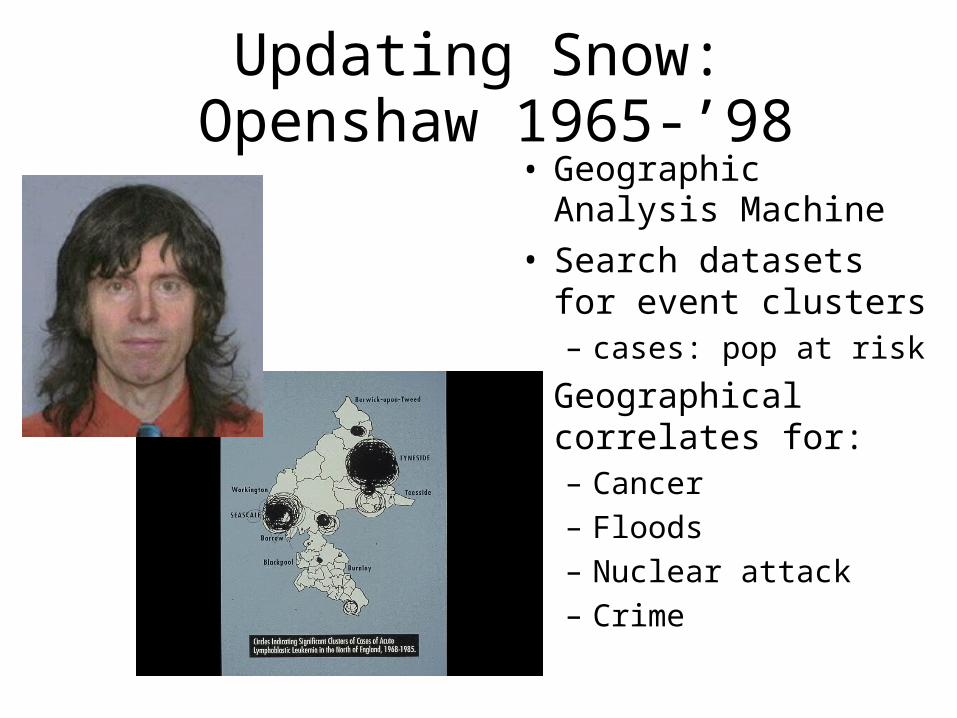
Updating Snow: Openshaw 1965-’98
• Geographic Analysis Machine
• Search datasets for event clusters – cases: pop at risk
• Geographical correlates for:– Cancer– Floods– Nuclear attack– Crime
Objectives of Spatial Analysis
• Queries and reasoning
• Measurements – Aspects of geographic data, length, area, etc.
• Transformations – New data, raster to vector, geometric rules
• Descriptive summaries – Essence of data in a few parameters
• Optimization - ideal locations, routes
• Hypothesis testing – from a sample to entire population
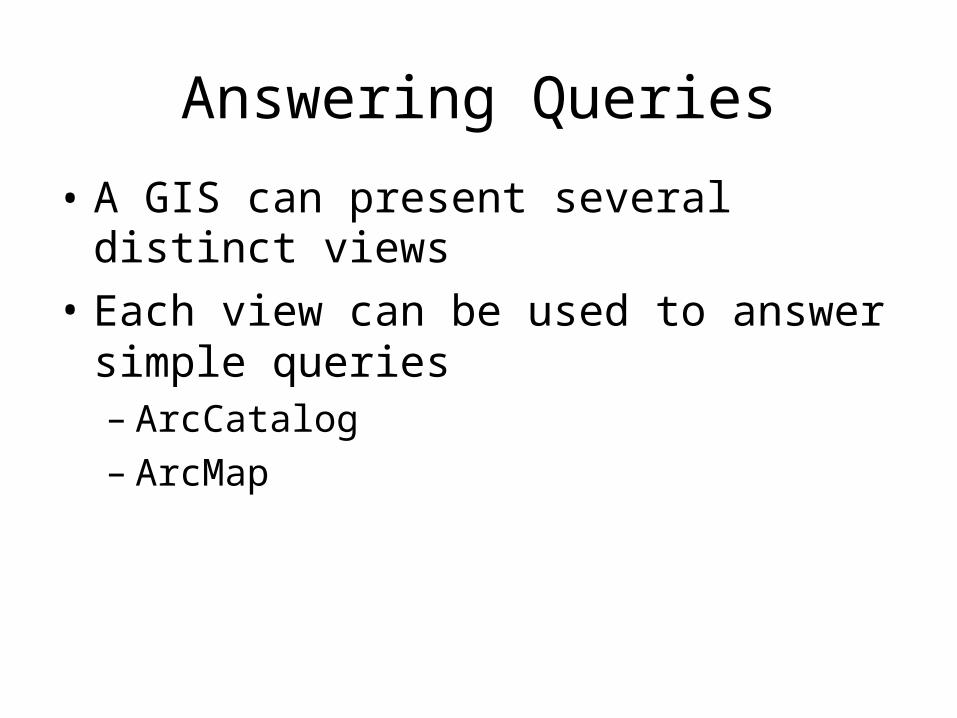
Answering Queries
• A GIS can present several distinct views
• Each view can be used to answer simple queries– ArcCatalog– ArcMap
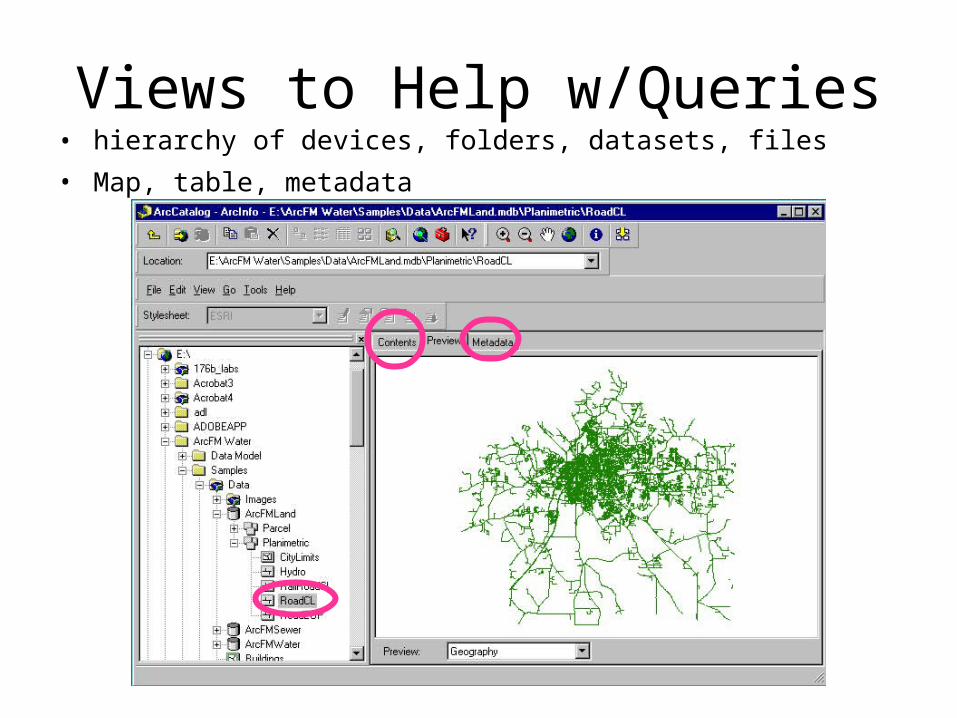
Views to Help w/Queries• hierarchy of devices, folders, datasets, files
• Map, table, metadata
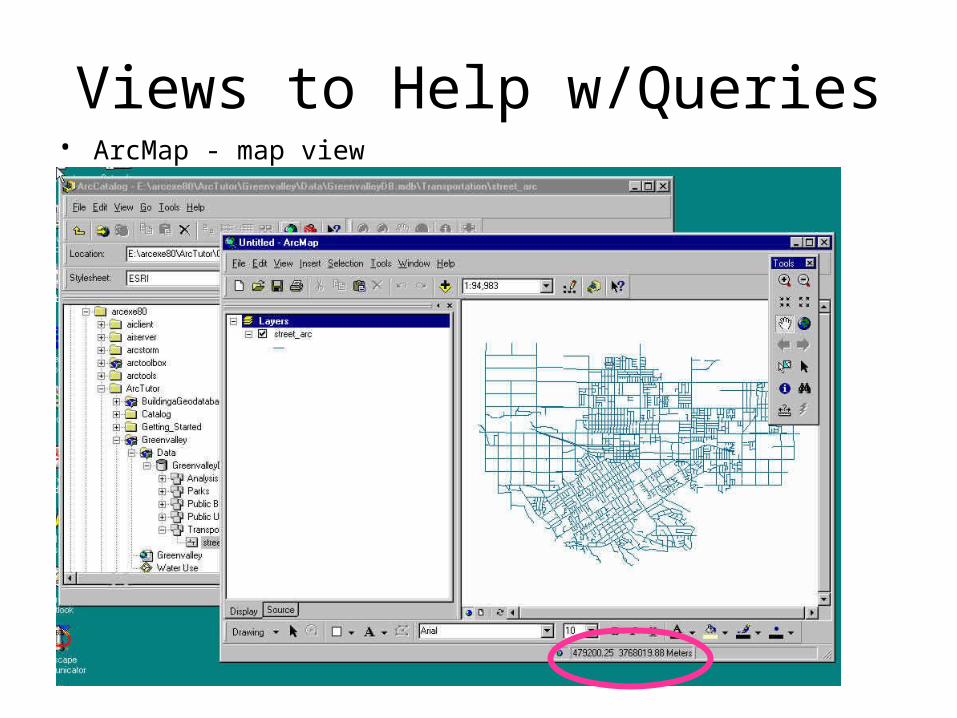
Views to Help w/Queries• ArcMap - map view
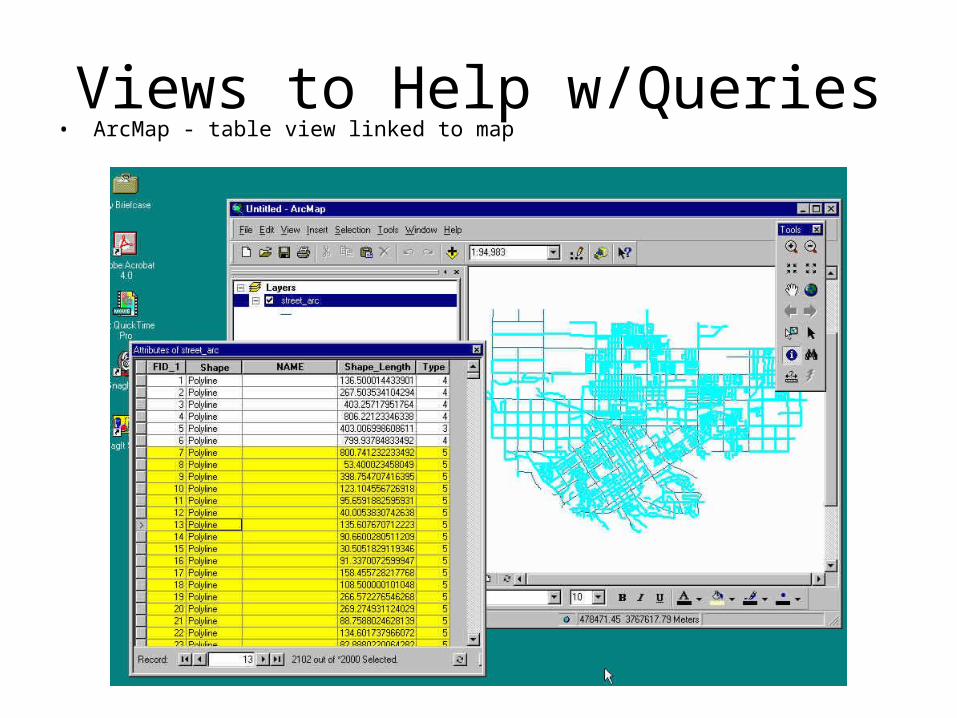
Views to Help w/Queries• ArcMap - table view linked to map
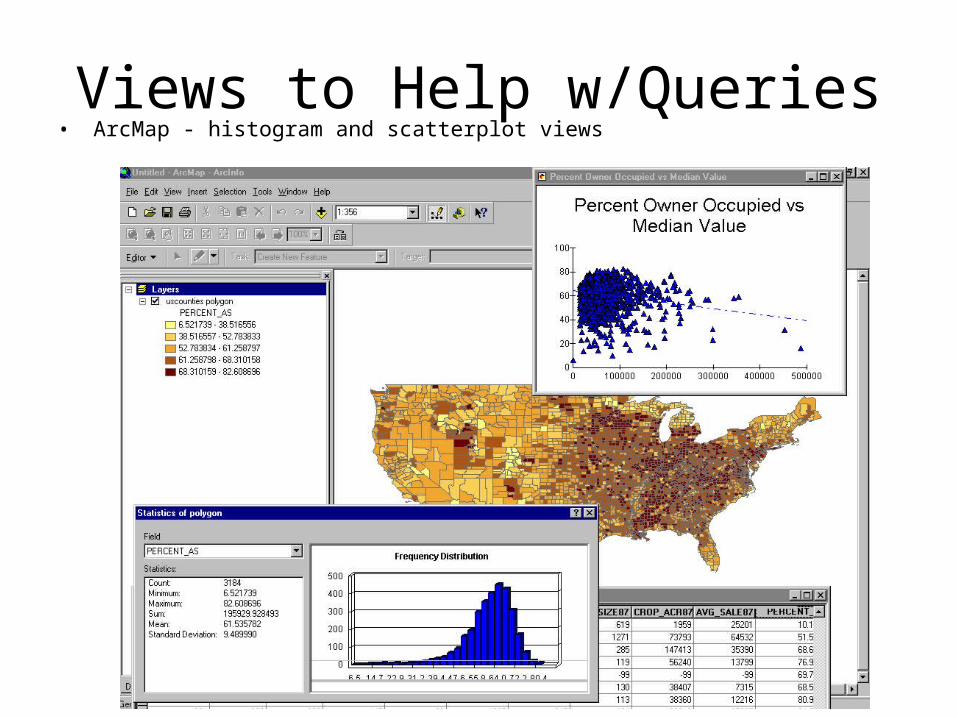
Views to Help w/Queries• ArcMap - histogram and scatterplot views

Exploratory Data Analysis ( EDA )
• Interactive methods to explore spatial data
• Use of linked views
• Finding anomalies, outliers
• In images, finding particular features
• Data mining large masses of data – e.g., credit card companies – anomalous behavior in space and time
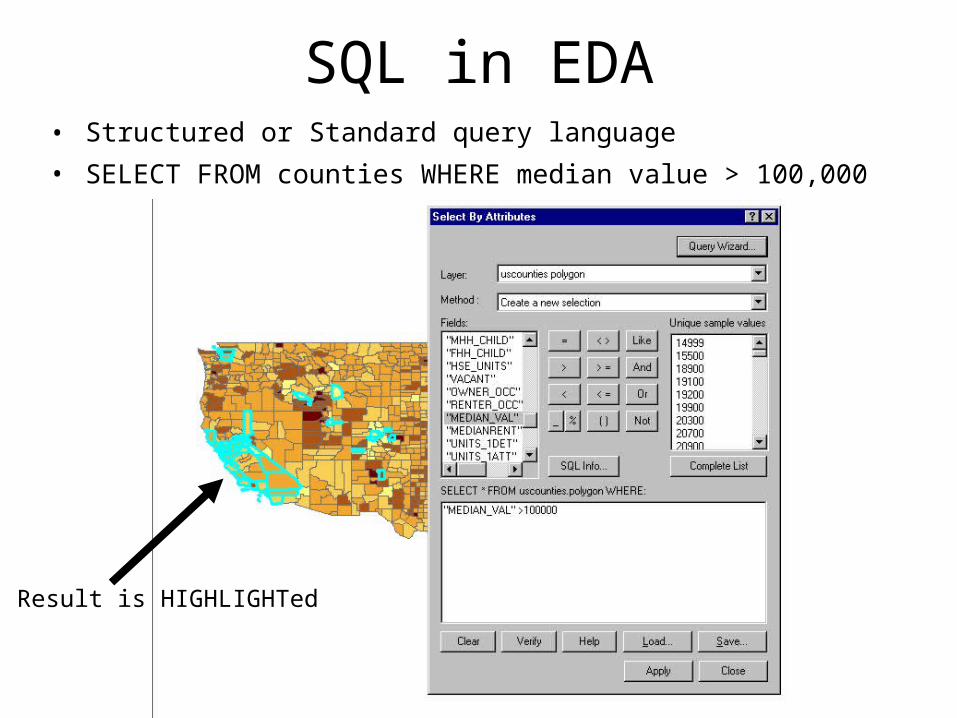
SQL in EDA• Structured or Standard query language
• SELECT FROM counties WHERE median value > 100,000
Result is HIGHLIGHTed

Spatial Reasoning with GIS• GIS would be easier to use if it could "think"
and "talk" more like humans – or if there could be smooth transitions between
our vague world and its precise world– Google Maps
• In our vague world, terms like “near”, far”, “south of”, etc. are context-specific – From Santa Barbara: LA is far from SB– From London: LA is right next to SB

Measurement with GIS
• Often difficult to make by hand from maps – measuring the length of a complex feature – measuring area – how did we measure area before GIS?
• Distance and length– calculation from metric coordinates– straight-line distance on a plane
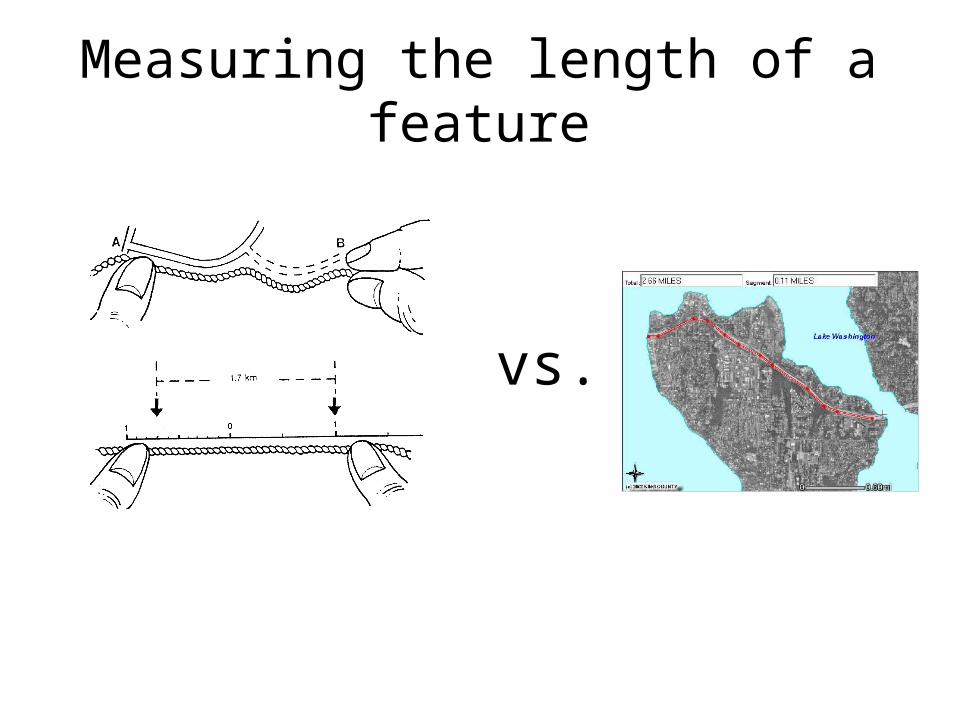
Measuring the length of a feature
vs.
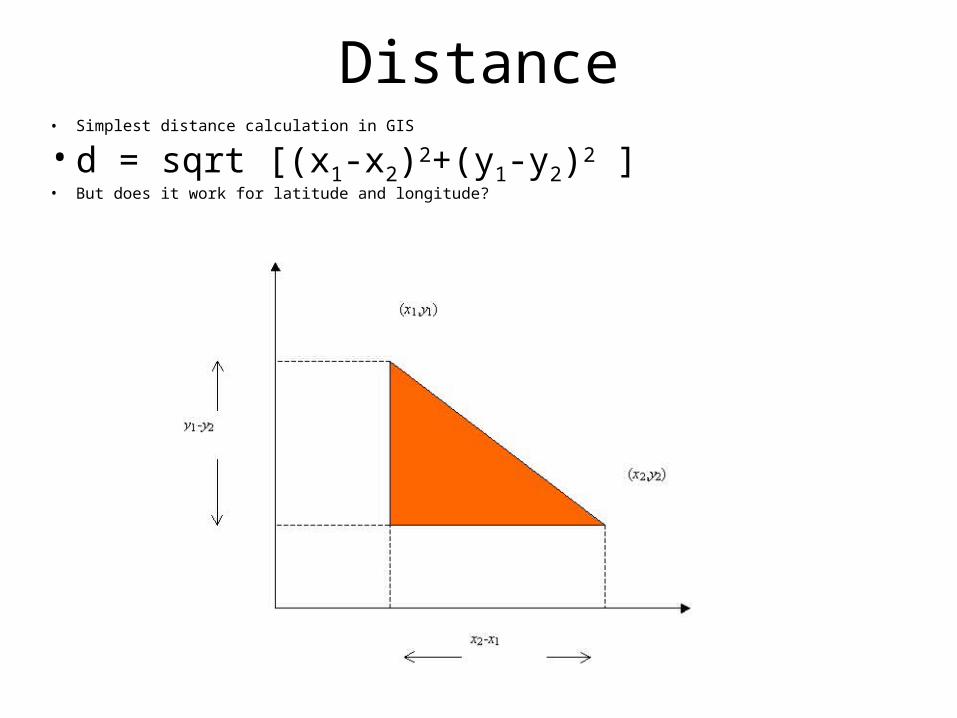
Distance• Simplest distance calculation in GIS
• d = sqrt [(x1-x2)2+(y1-y2)2 ] • But does it work for latitude and longitude?

Spherical (not spheroidal) geometry• Note: a and b are distinct from A (alpha) and B (beta).• 1. Find distances a and b in degrees from the pole P.• 2. Find angle P by arithmetic comparison of longitudes.
– (If angle P is greater than 180 degrees subtract angle P from 360 degrees.)
– Subtract result from 180 degrees to find angle y. – 3. Solve for 1/2 ( a - b ) and 1/2 ( a + b ) as follows:
tan 1/2 ( a - b ) = - { [ sin 1/2 ( a - b ) ] / [ sin 1/2 ( a + b ) ] } tan 1/2 y tan 1/2 ( a + b ) = - { [ cos 1/2 ( a - b ) ] / [ cos 1/2 ( a + b ) ] } tan 1/2 y
• 4. Find c as follows: – tan 1/2 c = { [ sin 1/2 ( a + b ) ] x [ tan 1/2 ( a - b ) ] } / sin 1/2 ( a - b )
• 5. Find angles A and B as follows: – A = 180 - [ ( 1/2 a + b ) + ( 1/2 a - b ) ] – B = 180 - [ ( 1/2 a + b ) - ( 1/2 a - b ) ]
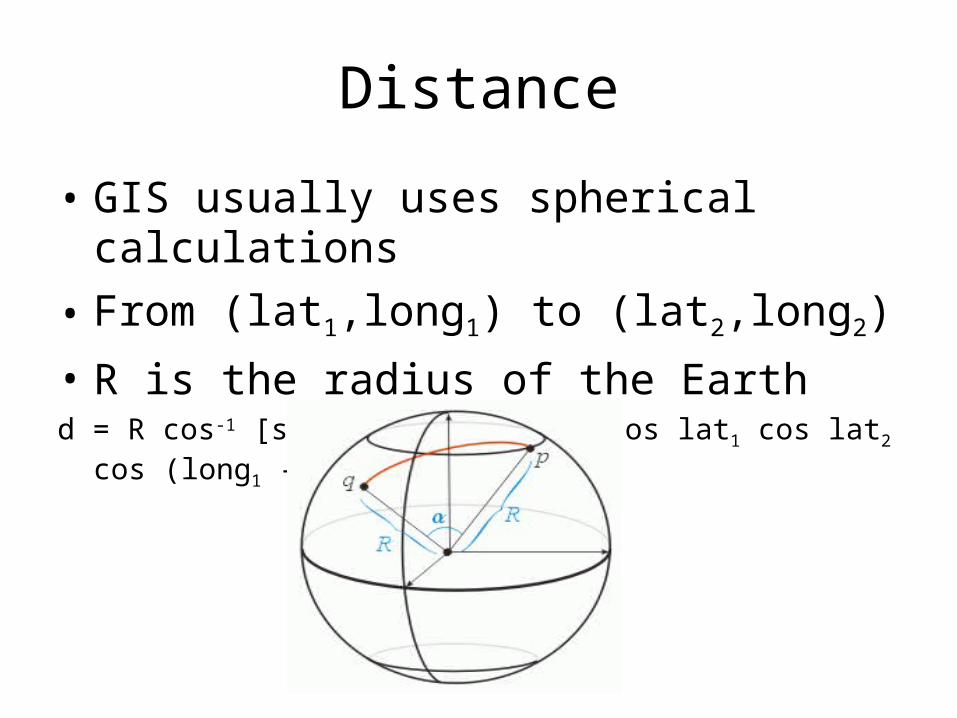
Distance
• GIS usually uses spherical calculations
• From (lat1,long1) to (lat2,long2)
• R is the radius of the Earthd = R cos-1 [sin lat1 sin lat2 + cos lat1 cos lat2 cos (long1 - long2)]
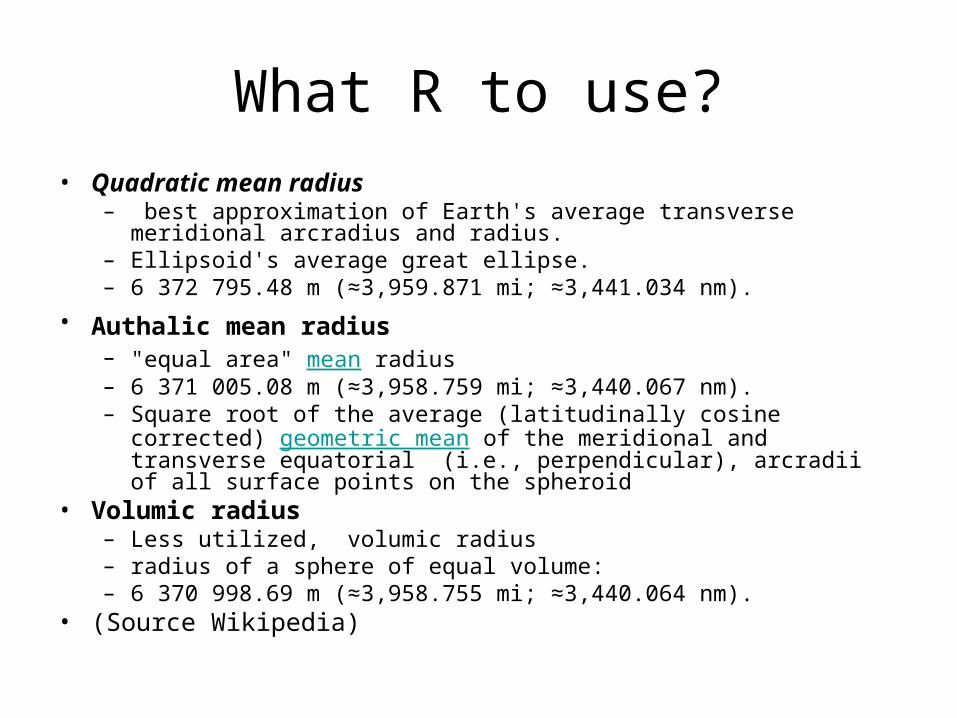
What R to use?• Quadratic mean radius
– best approximation of Earth's average transverse meridional arcradius and radius.
– Ellipsoid's average great ellipse.– 6 372 795.48 m (≈3,959.871 mi; ≈3,441.034 nm).
• Authalic mean radius – "equal area" mean radius – 6 371 005.08 m (≈3,958.759 mi; ≈3,440.067 nm). – Square root of the average (latitudinally cosine corrected)
geometric mean of the meridional and transverse equatorial (i.e., perpendicular), arcradii of all surface points on the spheroid
• Volumic radius– Less utilized, volumic radius– radius of a sphere of equal volume:– 6 370 998.69 m (≈3,958.755 mi; ≈3,440.064 nm).
• (Source Wikipedia)
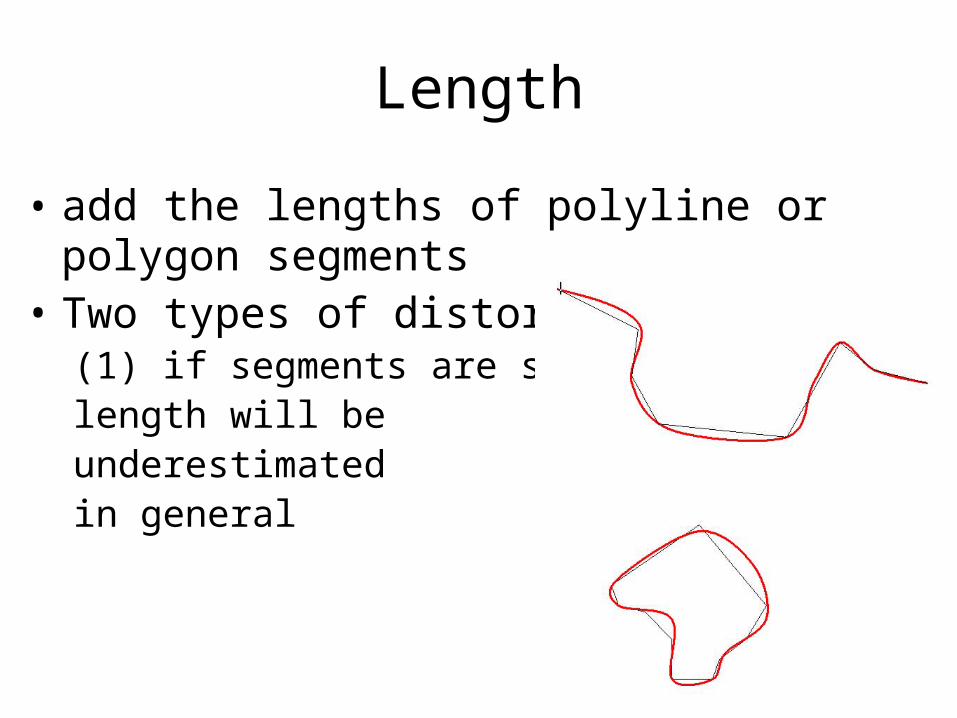
Length
• add the lengths of polyline or polygon segments
• Two types of distortions(1) if segments are straight,length will be underestimated in general
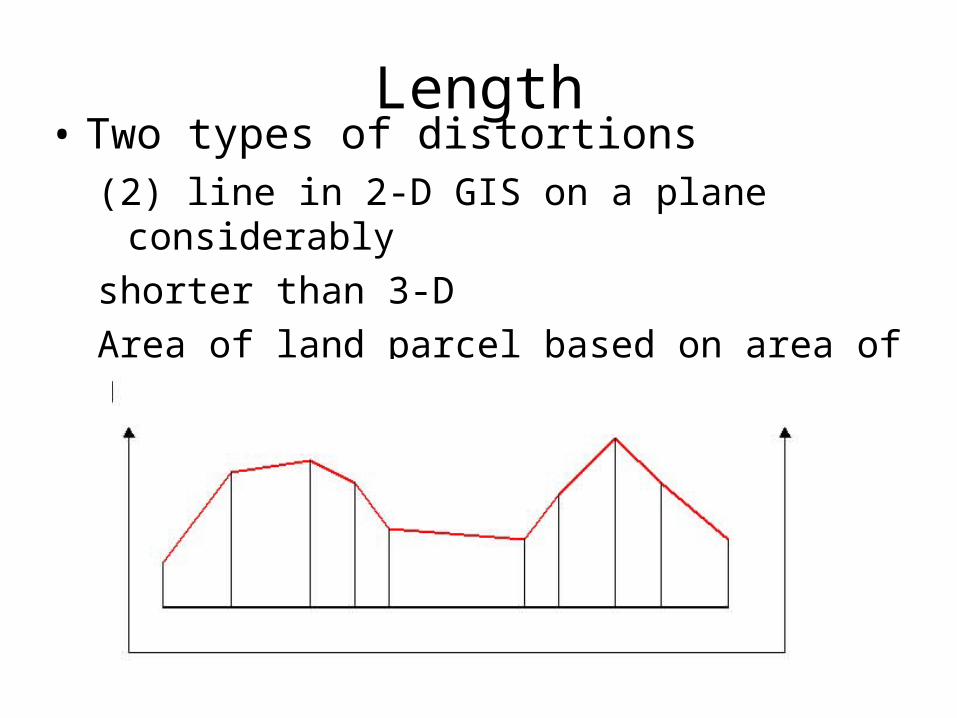
Length• Two types of distortions
(2) line in 2-D GIS on a plane considerably
shorter than 3-D
Area of land parcel based on area of horiz. projection, not true surface area
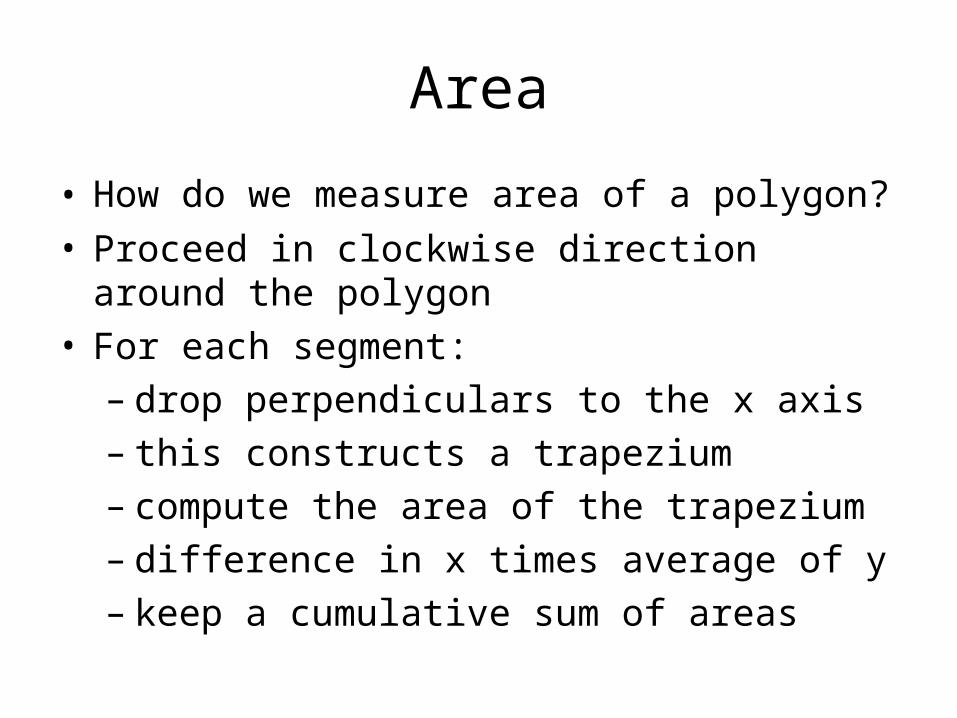
Area
• How do we measure area of a polygon?
• Proceed in clockwise direction around the polygon
• For each segment:– drop perpendiculars to the x axis – this constructs a trapezium – compute the area of the trapezium – difference in x times average of y– keep a cumulative sum of areas

Area (cont.)
• Green, orange, blue trapezia
• Areas = differences in x times averages of y• Subtract 4th to get area of polygon
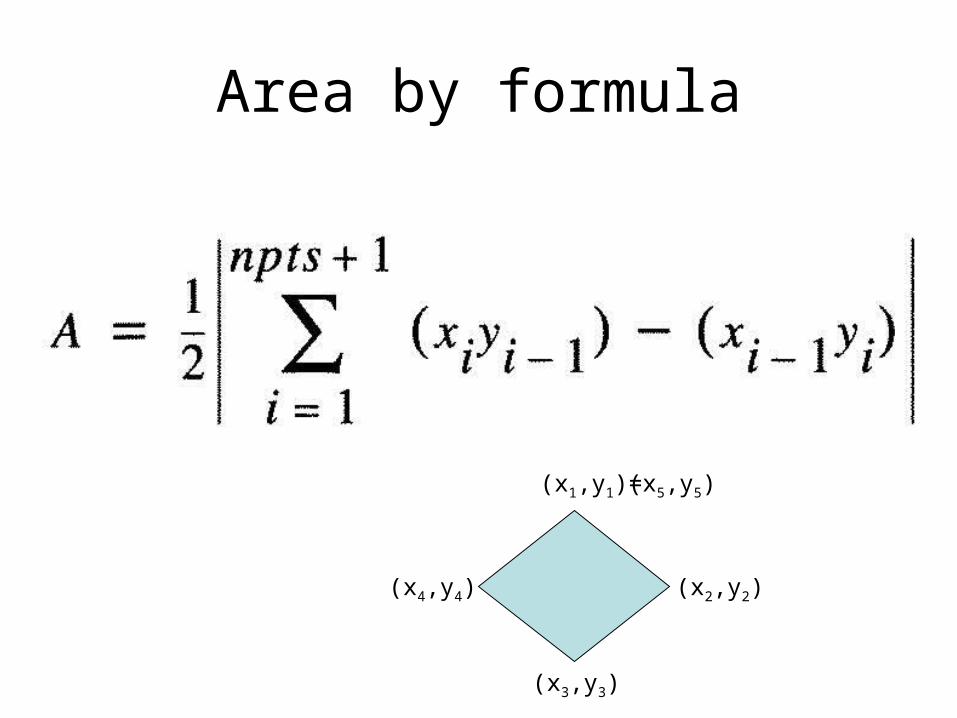
Area by formula
(x1,y1)=
(x3,y3)
(x2,y2)(x4,y4)
(x5,y5)

Applying the Algorithm to a Coverage
• For each polygon
• For each arc:– proceed segment by segment from
FNODE to TNODE – add trapezia areas to R polygon area – subtract from L polygon area
• On completing all arcs, totals
are correct area
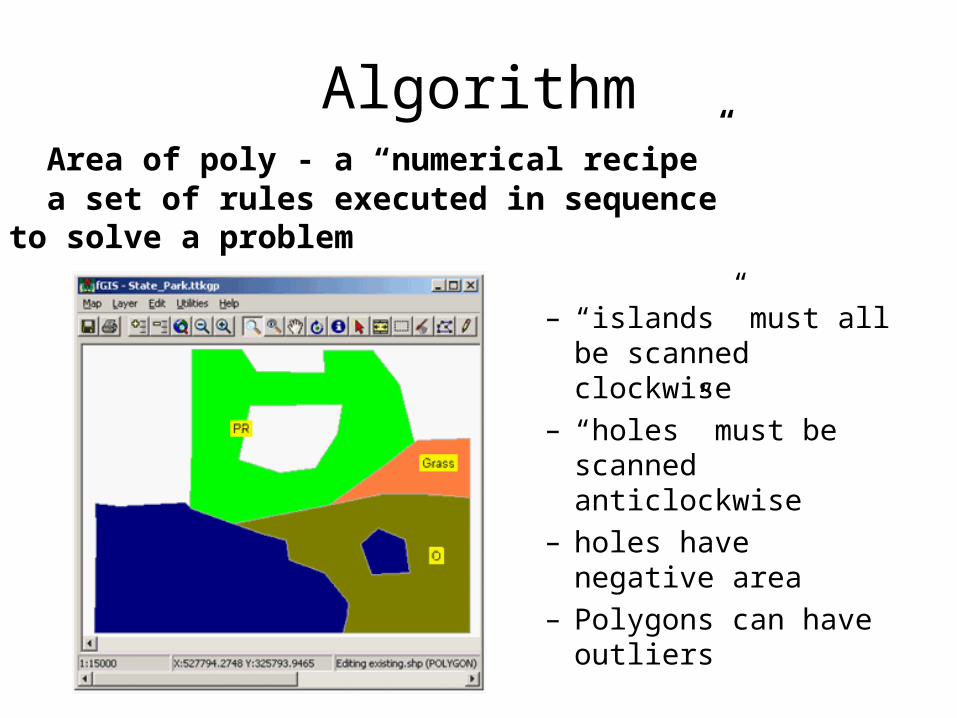
Algorithm
– “islands” must all be scanned clockwise
– “holes” must be scanned anticlockwise
– holes have negative area
– Polygons can have outliers
• Area of poly - a “numerical recipe”• a set of rules executed in sequence to solve a problem
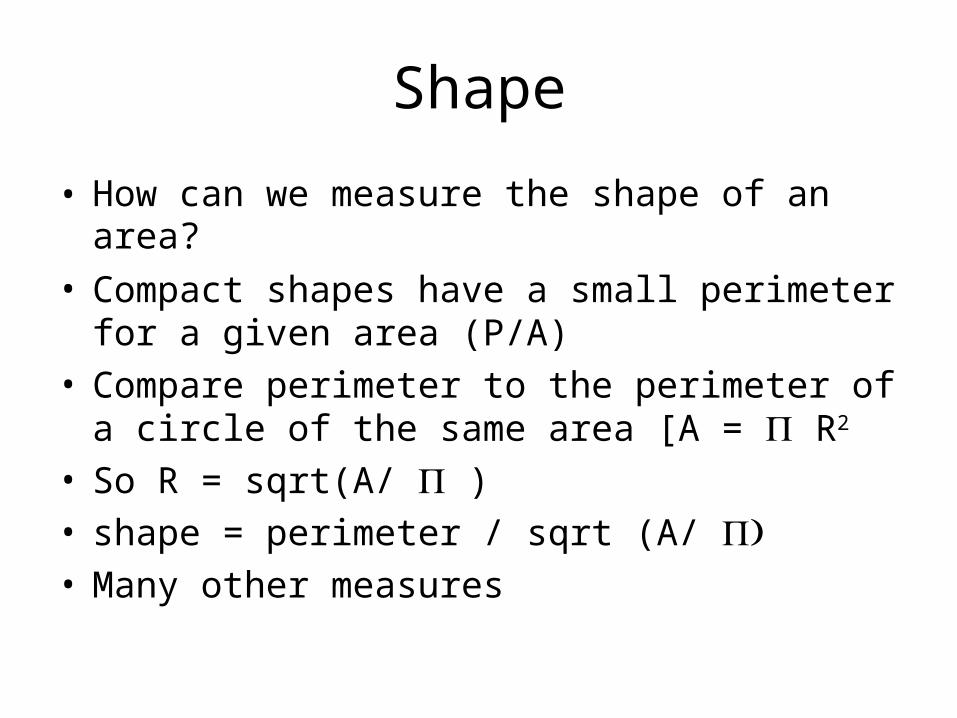
Shape
• How can we measure the shape of an area?
• Compact shapes have a small perimeter for a given area (P/A)
• Compare perimeter to the perimeter of a circle of the same area [A = R2
• So R = sqrt(A/ )• shape = perimeter / sqrt (A/ • Many other measures
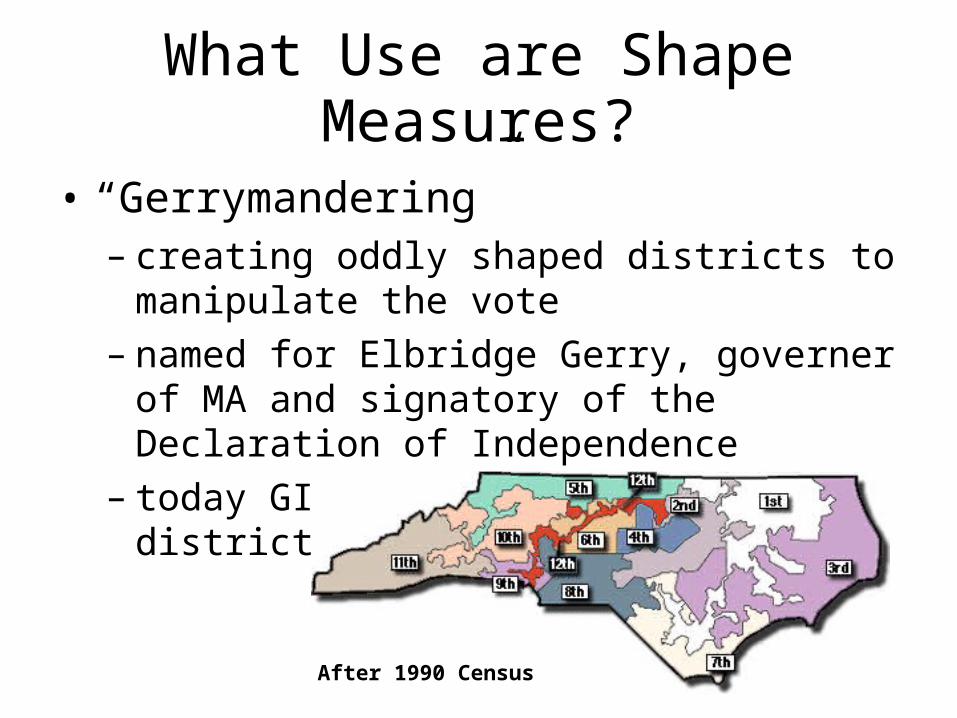
What Use are Shape Measures?
• “Gerrymandering”– creating oddly shaped districts to manipulate
the vote – named for Elbridge Gerry, governer of MA
and signatory of the Declaration of Independence
– today GIS is used to design districts
After 1990 Census
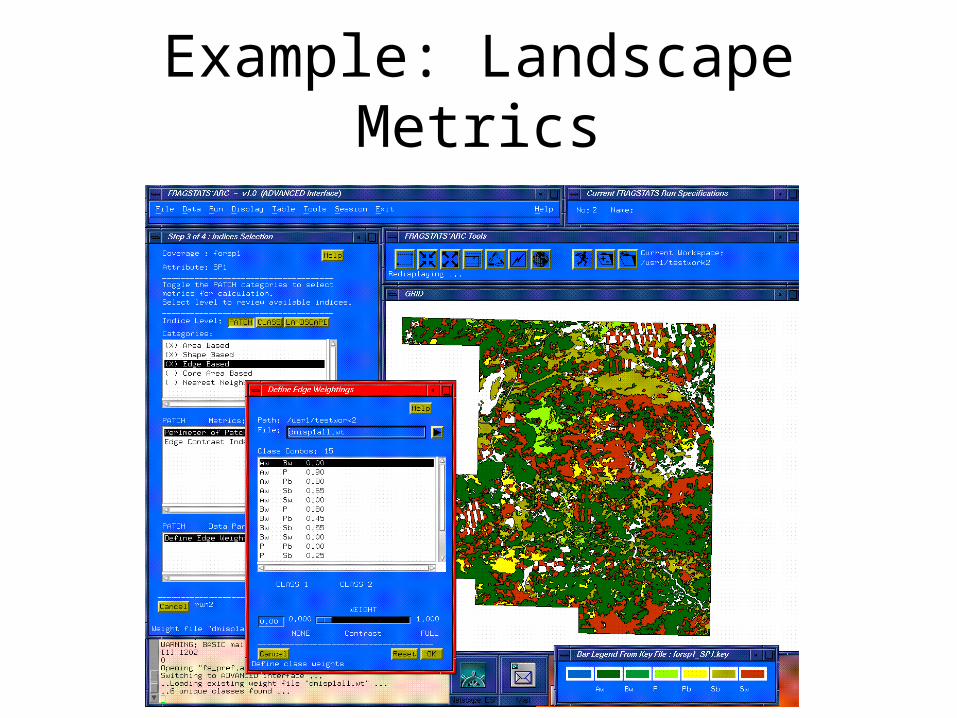
Example: Landscape Metrics

Slope and Aspect• measured from an elevation or bathymetry
raster – compare elevations of points in a 3x3 (Moore)
neighborhood – slope and aspect at one point estimated from
elevations of it and surrounding 8 points• number points row by row, from top left from 1 to 9
1 2 3
4 5 6
7 8 9

Slope and Aspect

Slope Calculation• b = (z3 + 2z6 + z9 - z1 - 2z4 - z7) / 8r
• c = (z1 + 2z2 + z3 - z7 - 2z8 - z9) / 8r– b denotes slope in the x direction – c denotes slope in the y direction – r is the spacing of points (30 m)
• find the slope that fits best to the 9 elevations • minimizes the total of squared differences
between point elevation and the fitted slope • weighting four closer neighbors higher
• tan (slope) = sqrt (b2 + c2)

Slope Definitions
• Slope defined as an angle• … or rise over horizontal run• … or rise over actual run• Or in percent• various methods
– important to know how your favorite GIS calculates slope
– Different algorithms create different slopes/aspects
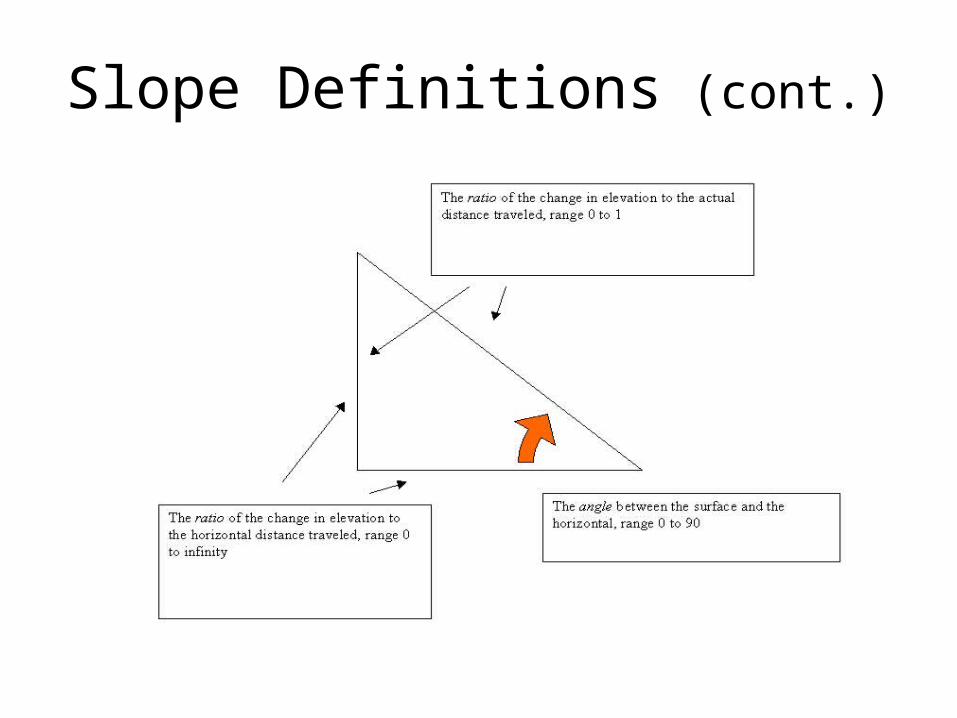
Slope Definitions (cont.)

Aspect
• tan (aspect) = b/c
• Angle between vertical and direction of steepest slope
• Measured clockwise
• Add 180 to aspect if c is positive, 360 to aspect if c is negative and b is positive
Transformations
• Buffering (Point, Line, Area)
• Point-in-polygon
• Polygon Overlay
• Spatial Interpolation– Theissen polygons– Inverse-distance weighting– Kriging– Density estimation

Basic Approach
Map
Transformation
New map
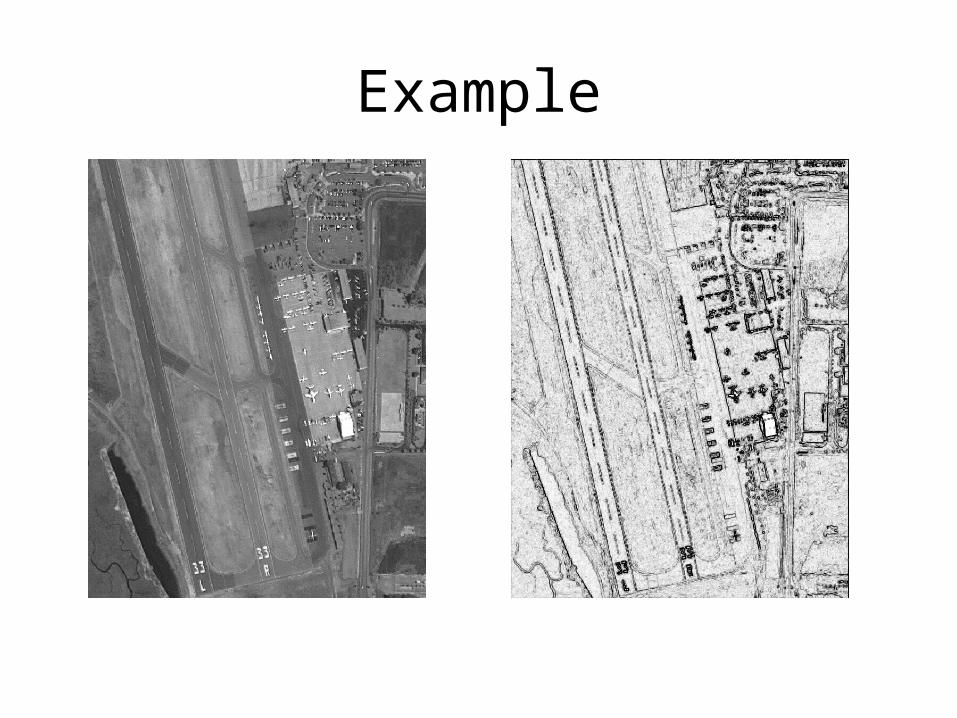
Example