Embed Size (px)
Citation preview
sustainability
Article
Manufacturer’s Sharing Servitization Transformation andProduct Pricing Strategy
Zhenfeng Liu 1,* , Ya Xiao 1 and Jian Feng 2
�����������������
Citation: Liu, Z.; Xiao, Y.; Feng, J.
Manufacturer’s Sharing Servitization
Transformation and Product Pricing
Strategy. Sustainability 2021, 13, 1503.
https://doi.org/10.3390/su13031503
Academic Editor: Marc A. Rosen
Received: 16 November 2020
Accepted: 20 January 2021
Published: 1 February 2021
Publisher’s Note: MDPI stays neutral
with regard to jurisdictional claims in
published maps and institutional affil-
iations.
Copyright: © 2021 by the authors.
Licensee MDPI, Basel, Switzerland.
This article is an open access article
distributed under the terms and
conditions of the Creative Commons
Attribution (CC BY) license (https://
creativecommons.org/licenses/by/
4.0/).
1 School of Economics and Management, Shanghai Maritime University, Shanghai 201306, China;[email protected]
2 China Institute of FTZ Supply Chain, Shanghai Maritime University, Shanghai 201306, China;[email protected]
* Correspondence: [email protected]
Abstract: The sharing market includes the idle product sharing by the owner and the firm’s newproduct sharing. Companies participating in the sharing economy choose to withdraw from themarket because it is always difficult to make a profit, due to heavy asset investment, but there is nosuch worry for owners who do not need cost input. At the same time, we have observed that thesharing products launched by companies are difficult to meet the rental needs of consumers. Basedon the above findings, we have constructed a model where there is a market where a monopolisticmanufacturer sells and rents out at the same time, and owners who purchased new products canchoose to rent out products when they are idle. Because of the uncoordinated supply and demandmatching of the sharing market and the excessively high unit cost input, our research found that:(1) the barriers for the manufacturer to enter the sharing market are always high—for example, themanufacturer will choose to enter the sharing market only when consumers have a high rate ofavailability of sharing products. Only when the cost of products in the sharing market is not low willthe manufacturer choose to provide sharing services; (2) the competition between the two productsin the sharing market weakens the demand cannibalize in the sales market; (3) the manufacturerenters the sharing market to promote the owner’s income. The owner’s earnings will increase withthe rising of sharing products’ availability.
Keywords: sharing economy; product launching; pricing strategy; sharing service transformation
1. Introduction
With the development of information technology and policy support, the sharingeconomy has achieved sound results over the last few years. According to the PwC (PriceWaterhouse Coopers Consulting), five key sharing sectors—travel, car-sharing, finance,staffing, music, and video streaming—have the potential to increase global revenues toaround $335 billion by 2025 [1]. Take an example, more than 19% of consumers are involvedin sharing in the automotive and transport industry [2]. The boom of the sharing economyhas attracted many firms to enter the sharing market. In addition, the huge demand inthe sharing market is also an important reason for attracting many companies to join thesharing market. Several carmakers, such as Mercedes-Benz, General Motors, BMW, andTesla, have introduced a sharing program to increase market share [3]. In China, GoFun, acar-sharing app launched by Shouqi Group, has increased from 1.53 million to 2.13 millionduring the past year in terms of monthly user activity. According to iiMedia Research,China’s car-sharing market reached ¥5.43 billion in 2019 [4].
Although consumers’ demands and firms’ willingness to participate in sharing arevery strong, these manufacturers are retreating from the sharing market. For example,German carmaker Daimler has pulled its car-sharing program (Car2Go) out of Chinaas of 30 June 2019 [5], and ceased operations in London, Brussels, Florence, and NorthAmerican up to 29 February 2020 [6]. Maven, GM’s sharing travel brand, announced its
Sustainability 2021, 13, 1503. https://doi.org/10.3390/su13031503 https://www.mdpi.com/journal/sustainability
Sustainability 2021, 13, 1503 2 of 20
withdrawal from eight cities, including Chicago, New York, and Boston, on 15 April 2020 [7].Furthermore, the COVID-19 pandemic has accelerated this trend [8,9]. Due to its intensiveasset investment and difficulty to profit in the short term, the car-sharing business hassuffered from development restrictions, which is attributable to the following three reasons.The first is the absence of necessary investment and product type. For instance, Daimleronly offered some 800 vehicles, basically two-seat smart cars, in Chongqing in China.The second is the rising operation costs, including the fixed costs of production, platformconstruction, product depreciation, technology upgrade, maintenance, and insurance forthe customers’ safety. Sharenow stated in a statement that the service in North America wassuspended, due to the lack of stability in the global travel pattern and the high operatingcosts in North America. Third, it is unable to continue operations in a sustainable mannerfor product sharing owing to low adoption rates. Although Car2go has only launched 800vehicles in Chongqing, it has more than 250,000 registered users. Motivated by the aboverealities and difficulties of the manufacturer’s entering the sharing market, this paper aimsto study the product competition between the sales market and the sharing market. Inthe sharing market, there exists competition between the manufacturer and owner forthe sharing products. We develop a game-theoretic model with two markets and threekinds of products. A monopoly manufacturer sells a new product in the sales market.Then, the manufacturer considers to provide a sharing service and meet the consumers’usage needs in the sharing market. Meanwhile, there exists an idle product providedby an owner in the sharing market. The sharing products’ demand is affected by theconsumer’s sharing preference and the availability rate of the sharing product. To meet thisdemand, the manufacturer launches a certain number of sharing products. The launchingsize determines the availability of sharing products and affects the manufacturer’s costinvestment in entering the sharing market. The purpose of the present research is to studywhich factors restrict manufacturers from entering the sharing market. In particular, weposed the following research questions. (i) What is the barrier for the manufacturer to enterthe sharing market? Or why are these manufacturers exiting the sharing market? (ii) Then,how does the manufacturer’s sharing service affect the competition between the salesmarket and the sharing market? (iii) How does the manufacturer’s entering the sharingmarket affect the operation strategies of the manufacturer and the owner? To answer thesequestions, we develop a simple model in which there exists a sales market with an ownerpurchasing a new product from a monopoly manufacturer and a sharing market withconsumers renting an idle product from the owner or the product from the manufacturer.The manufacturer decides whether to provide a rental service and the launching size ofsharing products. The owner decides whether or not to rent out the idle product thatthey previously purchased from the manufacturer. Consumers make a purchase or rentdecision according to the net utility of different products/services. And their decisionsaffect the manufacturer’s price, demand, and profit. We derived the equilibrium outcomeof the manufacturer’s and consumer’s decisions for two scenarios: Without and withmanufacturer’s product sharing.
Our analysis has generated several insights. It is found that the entry barrier for themanufacturer’s product sharing is high. The manufacturer can enter the sharing market ifconsumers’ rental demands are easily met. In other words, as long as the manufacturerlaunches a certain scale of sharing products to meet consumers’ rental demand, it canenter the sharing market. Otherwise, the manufacturer’s demand for product sharingwill be negative. Once the manufacturer enters the sharing market, it can increase themarket demands and the manufacturer’s profits. Under providing sharing services, themanufacturer’s profit is affected by the production cost rather than the operation cost andthe availability of the sharing product. Another finding is that the high availability ofsharing products makes the sharing market seriously cannibalize the sales market. Oncethe manufacturer enters the sharing market, the competition between two products in thesharing market weakens the cannibalization of the sales market. The owner’s earnings willincrease with the rising of sharing products’ availability. Finally, we simulated the special
Sustainability 2021, 13, 1503 3 of 20
scenario for the COVID-19 period. The rest of this paper is organized as follows. We reviewthe related literature in Section 2. Section 3 introduces our assumptions and explainsthe decision model. Section 4 analyzes the manufacturer’s and consumer’s decisionsfor two scenarios, without and with manufacturer’s product sharing. Finally, Section 5summarizes conclusions and provides directions for future research. All proofs of theresults are provided in the Appendices A and B.
2. Literature Review
Extant research on the sharing economy has been conducted by scholars in recentyears [10–13]. According to Ranjbari et al. [14], the sharing economy was an economicsystem, whose intermediary companies utilized online platforms to facilitate and lowerthe cost of the for-profit transactions of giving temporary access—without the transferof ownership—to idle resources of consumers in the peer-to-peer networks that it hadcreated, because of the trust built among its members, who might be individuals orbusinesses [15,16]. Besides idle resource sharing, we also considered new product sharingas a kind of sharing economy, the sharing of new products shows consumers the functionsof the products and provides services in exchange for profit. Therefore, the sharingeconomy was broadly divided into two categories in this research. One is C2C (consumerto consumer) or P2P (peer to peer) sharing, such as Uber, Airbnb, Lyft, etc. The other isB2C (business to consumer) sharing, like Car2go, Hellobike, etc.
First, from the perspective of C2C or P2P sharing, scholars considered that the sharingeconomy was a typical disruptive innovation and often cheaper than those of the traditionalindustries [17–19]. Related research mainly elaborated on the impact of idle product sharingon traditional industries or consumers. Fraiberger and Sundararajan analyzed data fromboth secondary markets and P2P car-sharing markets and found that the sharing economyimproved consumer welfare [20]. Fradkin used the setting of Airbnb to investigate therental price in the sharing market and the role of search engine design in reducing thetransaction costs and improving market matching efficiency [21]. Benjaafa et al. developedan equilibrium model of peer-to-peer product sharing and found that consumers benefitedfrom sharing, with individuals who, in the absence of sharing, were indifferent betweenowning and not owning, benefitting the most [22]. Abhishek et al. analyzed the interactionof a P2P sharing market and a manufacturer. The analysis highlighted the important roleof consumer heterogeneity in usage rates in determining to sell or rent out products thatwould be preferred by the manufacturer and show that the firm is never better off withP2P when usage rates in the market are too low [23]. However, this study only consideredidle products’ consumer heterogeneity. Different from them, we analyzed the consumerheterogeneity of both idle product sharing and new product sharing.
Although these aforementioned studies discuss how the sharing economy affects thetraditional industries, scholars have begun to study the impact of the sharing economy onthe manufacturer. Then, from the perspective of B2C sharing, some authors have focused onnew product sharing [24–29]. Compared with idle products, new product sharing involvedthe manufacturer and the consumer. The manufacturer had to invest more operation costsand could not profit in a short time. The manufacturer would take a series of measures toadjust their operating strategies in response to the changes brought about by the sharingmarket. Therefore, the authors analyzed the impacts of product sharing with the traditionalmanufacturer [24–26], and whether the manufacturer entered the sharing market [27,28].For instance, Nishino et al. studied the influence of consumers’ willingness to use on thetype of research and the development of sharing products by the manufacturer. It showedthat consumers presented the inclination of sharing products actively. The manufacturershould choose a high R&D level to lengthen product durability and set a high price so thatthe manufacturer could deal with sharing services [30]. Ke et al. studied the comparativeanalysis of sharing channels and sales channels for an automobile manufacturer. Theyfound that the production cost was sufficiently high, and the introduction of the sharingmodel would make both sales and sharing markets profitable [27]. Tian and Jiang [25],
Sustainability 2021, 13, 1503 4 of 20
and Weber [31] showed that manufacturer benefited from high-cost products in the idleproduct sharing market rather than low-cost products. Based on Tian and Jiang [25],Liu et al. analyzed the effects of the sharing economy on sequential innovation productsand revealed that the sharing market increased or decreased the manufacturer’s profit, andthis was mainly determined by the moral hazard cost and the salvage value of sharingproducts [26]. Schmidt exploited a difference-in-difference methodology and obtainedthat car manufacturer’s participation in the sharing economy would reduce new carsales [32]. Next, the manufacturer adjusted its operation strategies to respond to the sharingeconomy [3,29]. Li et al. studied the profit maximization factors that the manufacturerchose to cooperate with different platforms. The analysis of this paper showed that thevalue perception factor was higher or the marginal cost was lower, the manufacturer shouldchoose to cooperate with the B2C platform. If the value perception factor was in the middlerange and the marginal cost was higher, the manufacturer should choose the P2P platform.If the value perception factor was low and the marginal cost was high, the manufacturershould not cooperate with any sharing platform. At the same time, the manufacturercoordinated supply-demand matching through the homogeneity of consumer usage [33].The difference was that our research considered the impact of consumer heterogeneityon the manufacturer’s sharing services and focused on coordinating the supply-demandmatching of the sharing market via the availability of sharing products. However, productlaunching strategy is another important agenda for the manufacturer’s product sharing.Chardon et al. considered that increasing system size did not increase the performance ofbike-sharing systems [34]. This means that the system size of sharing products is not asmore as possible. In contrast, Kabra et al. estimated the impact of two facets of productlaunching (accessibility and availability) on bike-sharing ridership [35]. They found that anincrease in bike availability can increase bike-sharing system use. Bellos et al. characterizedthat the carmaker could benefit from providing car-sharing, identified the product typethat benefits the most, and determined how car-sharing affects the manufacturer’s productline design [34]. They determined that the launching size of car-sharing was related tothe availability of sharing products and customer demand in the sharing market. Thesestudies have provided insights into the model construction of product launching strategyin this research.
Our research is different from previous studies and focuses on the manufacturer’sentry barrier in the sharing market and competition between two markets by combiningthe sharing products’ availability, the consumer’s sharing preference, and operation costsof sharing products. Furthermore, this research studies the manufacturer’s sales strategiesand customers’ behavior. Our research is most related to Jiang et al. [29] and Bellos et al. [36].They both considered the manufacturer’s pricing decision when choosing a business model,and discussed the relationship between the manufacturer’s sales/sharing strategies andthe marginal/transaction costs in the context of the sharing economy. However, differentfrom Jiang et al. [29], we accurately simulated the manufacturer’s launching size of sharingproducts via the availability and considered supply-demand matching in the sharingmarket. Then, we focused on the competition between the sharing market and the salesmarket. We analyzed the impact of sharing products’ availability on the manufacturer’slaunching size and market demand in the sharing market. This is also different fromBellos et al. [36].
3. Model3.1. Assumptions
Before presenting our model, we first discuss key assumptions specific to our productsharing environment. We refer to the firm that produces a new product as the manufacturerand the consumer that rent out an idle product that was purchased and used by her asthe owner.
Assumption 1. The manufacturer considers selling the product priority.
Sustainability 2021, 13, 1503 5 of 20
We suppose that a monopoly manufacturer launches a new product at a constantproduction cost c and sells it at price pB. Considering the manufacturer’s entering thesharing market, we assume that the manufacturer only rents out the new products via theB2C product-sharing platform. Since new product sharing can serve as a form of marketing,promoting the product by allowing the consumer to experience it before making the largepurchase is necessary to acquire something [3,36]. For the new product sharing, themanufacturer rents it out to consumers at a rental cost α + g and price p1 (p1 < pB). αrepresents the moral hazard cost and the hassle cost of delivering and picking up thesharing product [24]. The moral hazard cost refers to some extra cost resulted from alessor’s concern about damage to a sharing product, due to unobservable actions by arenter [37]. g represents the operation costs, including the sharing product’s maintenancecost and the B2C platform’s management cost during the sharing process.
Assumption 2. The owner may rent out idle products when their profit not negative.
When owners’ purchased products are lying idle, they might consider renting themout or not. During a period of low self-use value, the owner can earn a rental fee by rentingout her idle product through a C2C product-sharing platform, forgoing her self-use of theproduct [23]. For the idle product, the owner rents it out at a rental cost β and price p2(p2 < pB). β represents the owner’s transaction cost, including moral hazard cost, platformfee, and the hassle cost of delivering and picking up the product [38–42].
Assumption 3. Consumer’s valuation is heterogeneous and uniformly distributed in the interval[0, 1].
Without loss of generality, we normalize the total number of consumers to one. Weassume that the ith consumer’s valuation is distributed uniformly in the interval [0, 1],i.e., vi~U [0, 1]. We assume that the consumer’s preference for the sharing product isη (η > 0). η refers to the probability that consumers will not purchase, but have needsfor using it. Thereinto, the consumer’s preference for manufacturer’s sharing productis denoted η1 and for owner is denoted η2. We assume that the availability rate of thesharing product is ϕ∈[0, 1]. ϕ represents the probability that consumers will be able to renta sharing product in the sharing market to meet their demands when they need to useit [36]. At the same time, the manufacturer can adjust the matching degree of supply anddemand in the sharing market according to consumers’ demand. There are two specialcases here, too. If ϕ = 0, consumers have no product to rent, and therefore, sharing doesnot occur. If ϕ = 1, consumers can rent sharing products at any time.
3.2. Consumers’ Purchasing/Renting Decisions
In the sales market, there are new products sold by the manufacturer. Besides, thereare new products and idle products in the sharing market. A consumer can either buy anew product from the manufacturer or rent a sharing product from the owner instead ofbuying and owning the product herself. When the consumer purchases the new product inthe sales market, she not only obtains the product’s ownership, but also earns the expectedincome of renting the product out in the sharing market once it is idle. When the consumerrents the product in the sharing market, she just obtains the product’s right to use. Weconsider a consumer utility model where the net utility is assumed to be of the form uij(j∈{B, 1, 2}). The net utility is related to the consumer’s valuation and the product’s price.Therefore, the consumers’ net utility is as follows.
(1) Purchase the new product.
uiB = vi − pB + ϕη2(p2 − β) (1)
where the owner’s expected income is ϕη2(p2 − β).(2) Rent the new product from the manufacturer.
ui1 = ϕη1(vi − p1) (2)
Sustainability 2021, 13, 1503 6 of 20
(3) Share the idle product from the owner.
ui2 = ϕη2(vi − p2) (3)
(4) Do not purchase or rent any product, and the consumer’s net utility is zero.As a consequence, the manufacturer’s profits are derived from both the sales market
and the sharing market.
πM = (pB − c)dB + ϕη1(p1 − α− g)d1 − cS(ϕ) (4)
Owners’ earnings from the sharing market are
πO = ϕη2(p2 − β)d2 (5)
Thereinto, consumers’ demand in the market is denoted as dj (j∈{B, 1, 2}). To meetconsumers’ demand in the sharing market, the manufacturer’s lunch size of sharingproducts is S(ϕ).
The timing of events in the core model is as follows. First, a profit-maximizingmanufacturer decides whether to enter the sharing market. Then, the manufacturer setsthe product’s price pB and p1, and the number of sharing products S(ϕ). Third, the ownerwho previously purchased a new product decides whether to rent it out and sets theidle product’s price p2. Forth, consumers choose one of the products to maximize theirnet utility.
We summarize the notations in this paper, as shown in Table 1.
Table 1. Notations and definitions are used in the model.
i ith Consumer, i = 1, 2, 3 . . .
j Products, j = B (buying a new product from manufacturer), 1 (renting productfrom manufacturer), 2 (renting product from the owner).
Vi ith consumer’s valuation for purchasing/renting product, vi~U [0, 1].
ui,j ith consumer’s utility of choosing product j.
pj Price of product j.
ηj Consumer’s preference for sharing product.
dj The demand for product j.
c Product’s production cost.
α The transaction cost of sharing product’s in B2C sharing market.
g The operation cost of sharing product’s in B2C sharing market.
β The transaction cost of sharing product’s in C2C platform.
ϕ Sharing a product’s availability rate, ϕ∈[0, 1].
S(ϕ) The number of sharing products from the manufacturer.
πM The manufacturer’s total profit.
πO Owner’s earnings.
NR The manufacturer does not enter the sharing market, denoted as a superscript NR.
RS Manufacturer enters the sharing market, denoted as a superscript RS.
-S Sales market, denoted as a superscript -S.
-R Sharing market, denoted as a superscript -R.
Sustainability 2021, 13, 1503 7 of 20
4. Equilibrium Analysis4.1. No Product Sharing for Manufacturer
In this scenario, the manufacturer only sells new products in the sales market. Theconsumer can either purchase a new product from the manufacturer or rent an idle productfrom the owner. The sales market and the sharing market exist simultaneously onlyif uiB ≥ ui2 ≥ 0. Since if uiB < ui2, the consumer will rent the sharing product insteadof buying the new product. However, the manufacturer will not adopt such a pricingstrategy to encourage the consumer to rent the idle product. Then, we easily obtain
vi ≥pNR
B −ϕη2(pNR2 −β)−ϕη2 pNR
21−ϕη2
from the formula uiB ≥ ui2 ≥ 0. Furthermore, vi is uniformlydistributed in the interval [0, 1], so the sales market demand is given as follows.
dB =∫ 1
vi
f (vi)dvi = 1−pNR
B − ϕη2(pNR2 − β)− ϕη2 pNR
21− ϕη2
(6)
In the sharing market, we get vi ≥ pNR2 under ui2 = ϕη2(vi − pNR
2 ) ≥ 0. Therefore,the demand for owners’ idle products in the sharing market is obtained as follows.
d2 =∫ vi
pNR2
f (vi)dvi =pNR
B − ϕη2(pNR2 − β)− ϕη2 pNR
21− ϕη2
− pNR2 (7)
Substituting dB and d2 in Equations (4) and (5), we obtain
πNRM =
(pNR
B − c)
dB =(
pNRB − c
)(1−
pNRB − ϕη2
(pNR
2 − β)− ϕη2 pNR
21− ϕη2
)(8)
πNRO = ϕη2
(pNR
2 − β)( pNR
B − ϕη2(pNR2 − β)− ϕη2 pNR
21− ϕη2
− pNR2
)(9)
4.2. Product Sharing for Manufacturer
In this scenario, the manufacturer enters the sharing market. Since consumers’ de-mand is random in the sharing market, S(ϕ) is assumed to represent the number of themanufacturer’s sharing products required to meet a service level ϕ. We assume that con-sumers’ requests do not overlap and refer to Bellos et al. (2017), who calculate the numberof sharing products launched by the manufacturer in the sharing market. Then, the numberof sharing products is as follows.
S(ϕ) = ϕd1η1 (10)
Under manufacturer’s entering the sharing market, there exists new products sold inthe sales market, as well as new products and idle products in the sharing market. When uiB≥ ui1 ≥ 0 and uiB ≥ ui2 ≥ 0, consumers will purchase the new product in the sales market.Otherwise, consumers will not purchase any product, so that the sharing market will notexist. Also, to ensure that the consumer prior rent sharing product from the manufacturerinstead of the owner, only if ui1 ≥ ui2 ≥ 0. Then, we obtain vi ≥
pB−ϕη2(p2−β)−ϕη1 p11−ϕη1
fromthe formula uiB ≥ ui1. So sales market demand under manufacturer’s product sharing isgiven as follows.
dB =∫ 1
vi
f (vi)dvi = 1− pB − ϕη2(p2 − β)− ϕη1 p1
1− ϕη1(11)
Given ui1 ≥ ui2, we get vi ≥η1 p1−η2 p2
η1−η2and d1.
d1 =pB − ϕη2(p2 − β)− ϕη1 p1
1− ϕη1− η1 p1 − η2 p2
η1 − η2(12)
Sustainability 2021, 13, 1503 8 of 20
Since ui2 ≥ 0, we easily obtain
d2 =η1 p1 − η1 p2
η1 − η2(13)
Substituting d1 in Equation (10), we obtain
S(ϕ) = ϕd1η1 = ϕη1
(pB − ϕη2(p2 − β)− ϕη1 p1
1− ϕη1− η1 p1 − η2 p2
η1 − η2
)(14)
When the manufacturer enters the sharing market, the total profit comes from themanufacturer’s selling products and renting out products. Substituting dB, d1, and d2 inEquations (4) and (5), we obtain
πRSM = πRS−S
M + πRS−RM = (pB − c)
(1− pB−ϕη2(p2−β)−ϕη1 p1
1−ϕη1
)+ ϕη1(p1 − α− g)
(pB−ϕη2(p2−β)−ϕη1 p1
1−ϕη1− η1 p1−η2 p2
η1−η2
)− cϕη1
(pB−ϕη2(p2−β)−ϕη1 p1
1−ϕη1− η1 p1−η2 p2
η1−η2
) (15)
πRO = ϕη2(p2 − β)
(η1 p1 − η1 p2
η1 − η2
)(16)
Equation (10) shows that the sharing products launched in the sharing market bythe manufacturer are positively correlated with the availability rate of sharing products,which increases the manufacturer’s launching costs c·S(ϕ) in the sharing market. Thus, wemainly analyze the impact of availability rate ϕ and product cost c on the manufacturer’sdecision-making.
4.3. Main Results
To ensure the maximization of all players’ profits, we obtain the feedback equilibriumsolutions by using backward induction (see Appendix A for details).
We obtain Proposition 1 and Lemma 1 through analyzing the subgame equilibriumsolution of scenario NR (see Appendix B for details, similarly hereinafter). In the NRscenario, the manufacturer does not provide sharing services and only sells the newproducts to compete with the rental of idle products in the sharing market. If one of twoproducts’ demands is negative, the duopoly will degenerate to a monopoly with either thenew product or the idle product.
Proposition 1. When the manufacturer does not enter the sharing market:
(1) Only if (1− ϕ2) < c ≤ 1 and −1+ϕ2+cϕ2 < β < c do consumers purchase new products in
the sales market or rent idle products in the sharing market.
(2) If (1− ϕ2) < c ≤ 1 and 0 ≤ β < −1+ϕ2+cϕ2 , consumers only rent idle products in the
sharing market, but the manufacturer withdraws from the sales market.
The sharing products with high or low production costs have different degrees incannibalizing the manufacturer’s sales market, which has become a consensus [3,24,26].When the production cost is low, though the sharing market hurts the manufacturer’sprofits [24], the manufacturer is still selling new products in the sales market. And themarket demand is not affected by the transaction cost in the sharing market. However,when the production cost is not low, the members’ decision-making is also influenced bythe transaction cost. If the transaction cost is high, sharing products with high-rent haveno significant impact on the manufacturer’s sales. This makes it difficult for consumers toobtain the expected income of renting out the idle product that was purchased and used byher as the owner. Conversely, if the transaction cost is low, the lower rental price attractsmore consumers in the sharing market, which greatly cannibalizes the manufacturer’s sales
Sustainability 2021, 13, 1503 9 of 20
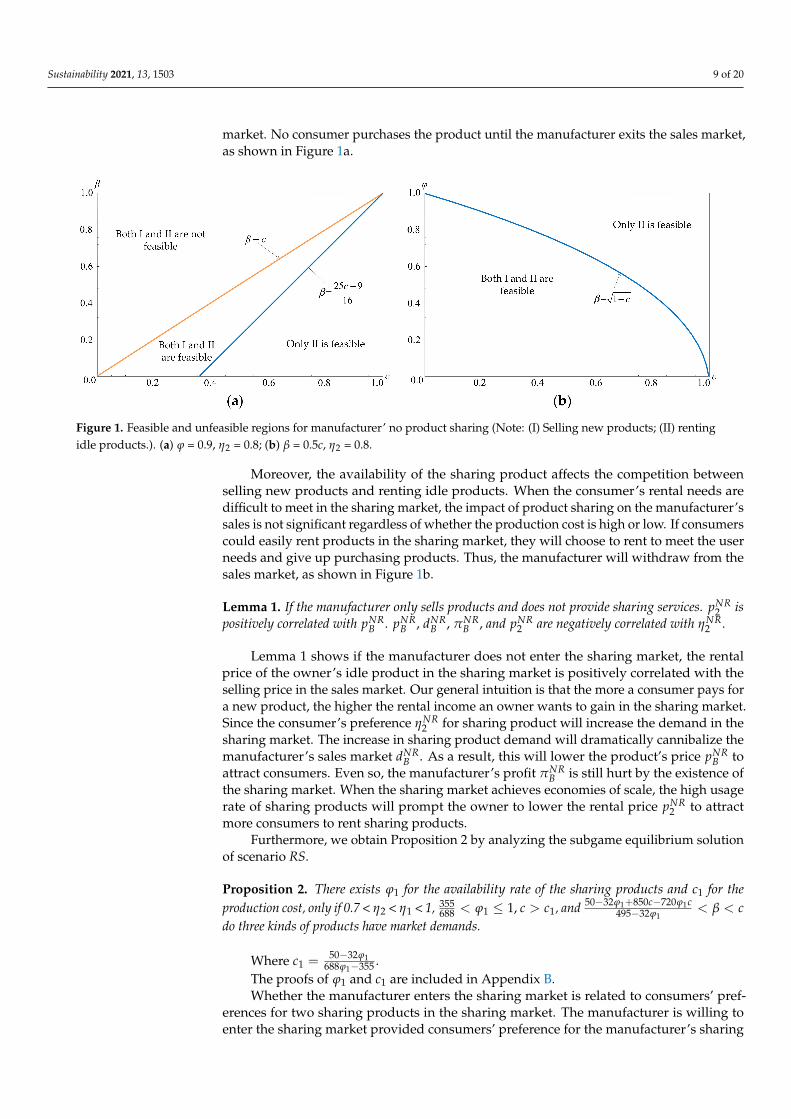
market. No consumer purchases the product until the manufacturer exits the sales market,as shown in Figure 1a.
Figure 1. Feasible and unfeasible regions for manufacturer’ no product sharing (Note: (I) Selling new products; (II) rentingidle products.). (a) ϕ = 0.9, η2 = 0.8; (b) β = 0.5c, η2 = 0.8.
Moreover, the availability of the sharing product affects the competition betweenselling new products and renting idle products. When the consumer’s rental needs aredifficult to meet in the sharing market, the impact of product sharing on the manufacturer’ssales is not significant regardless of whether the production cost is high or low. If consumerscould easily rent products in the sharing market, they will choose to rent to meet the userneeds and give up purchasing products. Thus, the manufacturer will withdraw from thesales market, as shown in Figure 1b.
Lemma 1. If the manufacturer only sells products and does not provide sharing services. pNR2 is
positively correlated with pNRB . pNR
B , dNRB , πNR
B , and pNR2 are negatively correlated with ηNR
2 .
Lemma 1 shows if the manufacturer does not enter the sharing market, the rentalprice of the owner’s idle product in the sharing market is positively correlated with theselling price in the sales market. Our general intuition is that the more a consumer pays fora new product, the higher the rental income an owner wants to gain in the sharing market.Since the consumer’s preference ηNR
2 for sharing product will increase the demand in thesharing market. The increase in sharing product demand will dramatically cannibalize themanufacturer’s sales market dNR
B . As a result, this will lower the product’s price pNRB to
attract consumers. Even so, the manufacturer’s profit πNRB is still hurt by the existence of
the sharing market. When the sharing market achieves economies of scale, the high usagerate of sharing products will prompt the owner to lower the rental price pNR
2 to attractmore consumers to rent sharing products.
Furthermore, we obtain Proposition 2 by analyzing the subgame equilibrium solutionof scenario RS.
Proposition 2. There exists ϕ1 for the availability rate of the sharing products and c1 for theproduction cost, only if 0.7 < η2 < η1 < 1, 355
688 < ϕ1 ≤ 1, c > c1, and 50−32ϕ1+850c−720ϕ1c495−32ϕ1
< β < cdo three kinds of products have market demands.
Where c1 = 50−32ϕ1688ϕ1−355 .
The proofs of ϕ1 and c1 are included in Appendix B.Whether the manufacturer enters the sharing market is related to consumers’ pref-
erences for two sharing products in the sharing market. The manufacturer is willing toenter the sharing market provided consumers’ preference for the manufacturer’s sharing
Sustainability 2021, 13, 1503 10 of 20
product is high. The phenomenon is attributable to the following three reasons. First,compared with the owner’s idle product, the manufacturer invests more heavy assets if itenters the sharing market. Only consumers’ higher preferences can drive the manufacturerto share products. Second, the performance, operational status, and platform service levelof the manufacturer’s sharing product are better than the owner’s idle product. Third, themanufacturer’s marketing strategies, such as advertising and e-commerce APP and brandloyalty, indirectly improve consumer’s preference for the manufacturer’s sharing product.In particular, only if the consumer’s preference 0.7 < η2 < η1 < 1 does the manufacturerprovides sharing services. Therefore, we hereafter assume that η1 = 0.9 and η2 = 0.8.
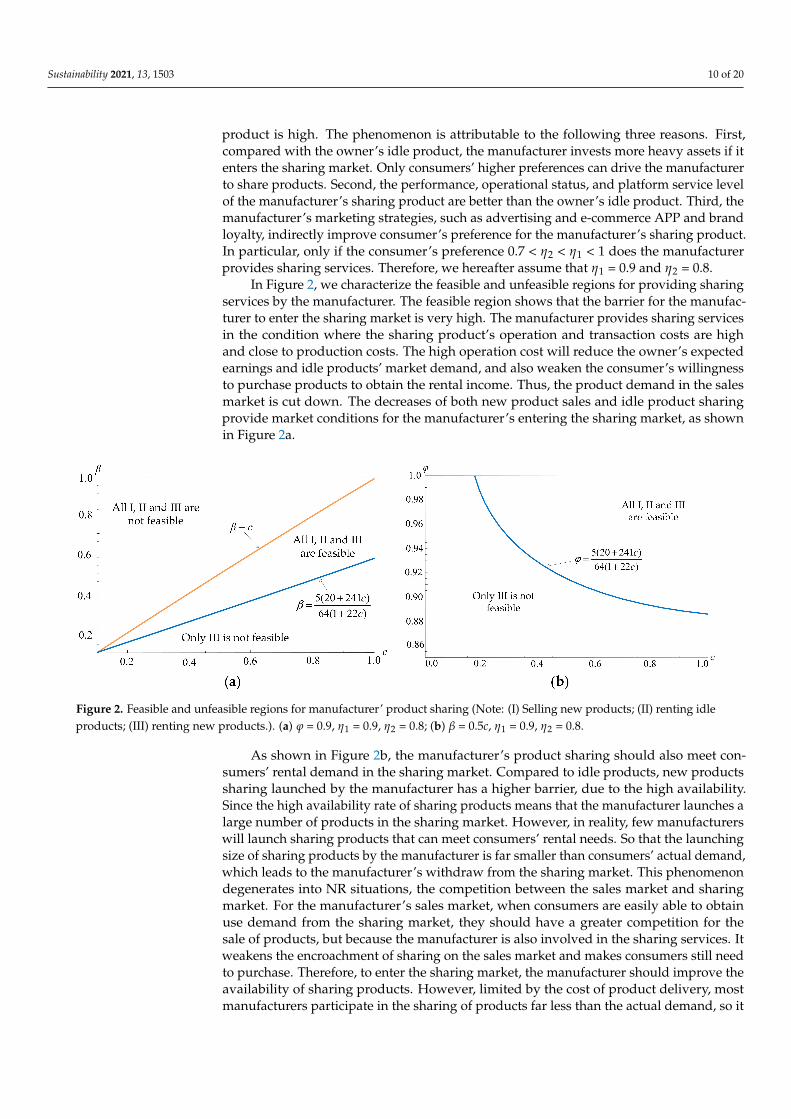
In Figure 2, we characterize the feasible and unfeasible regions for providing sharingservices by the manufacturer. The feasible region shows that the barrier for the manufac-turer to enter the sharing market is very high. The manufacturer provides sharing servicesin the condition where the sharing product’s operation and transaction costs are highand close to production costs. The high operation cost will reduce the owner’s expectedearnings and idle products’ market demand, and also weaken the consumer’s willingnessto purchase products to obtain the rental income. Thus, the product demand in the salesmarket is cut down. The decreases of both new product sales and idle product sharingprovide market conditions for the manufacturer’s entering the sharing market, as shownin Figure 2a.
Figure 2. Feasible and unfeasible regions for manufacturer’ product sharing (Note: (I) Selling new products; (II) renting idleproducts; (III) renting new products.). (a) ϕ = 0.9, η1 = 0.9, η2 = 0.8; (b) β = 0.5c, η1 = 0.9, η2 = 0.8.
As shown in Figure 2b, the manufacturer’s product sharing should also meet con-sumers’ rental demand in the sharing market. Compared to idle products, new productssharing launched by the manufacturer has a higher barrier, due to the high availability.Since the high availability rate of sharing products means that the manufacturer launches alarge number of products in the sharing market. However, in reality, few manufacturerswill launch sharing products that can meet consumers’ rental needs. So that the launchingsize of sharing products by the manufacturer is far smaller than consumers’ actual demand,which leads to the manufacturer’s withdraw from the sharing market. This phenomenondegenerates into NR situations, the competition between the sales market and sharingmarket. For the manufacturer’s sales market, when consumers are easily able to obtainuse demand from the sharing market, they should have a greater competition for thesale of products, but because the manufacturer is also involved in the sharing services. Itweakens the encroachment of sharing on the sales market and makes consumers still needto purchase. Therefore, to enter the sharing market, the manufacturer should improve theavailability of sharing products. However, limited by the cost of product delivery, mostmanufacturers participate in the sharing of products far less than the actual demand, so it
Sustainability 2021, 13, 1503 11 of 20
will lead to the situation that manufacturers cannot gain revenue in the sharing market,one after another out of the market.
We hereafter assume that η1 = 0.9 and η2 = 0.8 and analyze the impact of availabilityrate ϕ and product cost c on the manufacturer’s decision-making of entering the sharingmarket. We obtain Proposition 3 based on the analysis of the revenue of the manufacturer’ssharing market under whether the manufacturer’s entering the sharing market.
Proposition 3. There exists a threshold c2 for the production cost, and when c∈(c1, c2), themanufacturer does not profit in the sharing market (i.e., πRS−R
M < 0). When c∈[c2, 1], themanufacturer profits in the sharing market (i.e., πRS−R
M ≥ 0).
Where c2 = 110−99ϕ−450g+431ϕg−450α+431ϕα+360β−332ϕβ470−431ϕ .
The proof of c2 is included in Appendix B.Different from the owner’s idle goods, the production cost, the operation cost, and the
opportunity cost of the sharing products provided by the manufacturer are higher. Ourgeneral intuition is, under the condition of equal price, that the lower the production costof the manufacturer’s sharing product is, the higher its profit is. However, Proposition 3shows that the manufacturer offers higher-cost sharing products to benefit in the sharingmarket. This is because the high-cost product raises the barrier for consumers to purchaseso that the holding cost is too high. Therefore, consumers are willing to rent sharingproducts instead of purchasing them, even if there are sharing platform’s operation cost,and transaction cost. Besides, there is no obvious difference in the consumer’s experiencebetween the manufacturer’s low-cost sharing products and the owner’s idle goods. Themanufacturer cannot obtain spillover benefits by providing low-cost sharing products,let alone recover the launching cost. As a consequence, the manufacturer tends to sharehigh-cost products for obtaining higher rental income and marginal profit.
Proposition 3 shows that the manufacturer does not enter the sharing market becauseof launching a large number of products, which results in a high entry barrier and highoperation costs. Once the manufacturer enters the sharing market, the availability affectsthe demand for the sharing products from Proposition 2. However, Proposition 3 showsthat whether the manufacturer can obtain a positive profit in the sharing market hasno significant impact with the availability rate of the sharing product. The reason isthat the high demand and revenue brought by the high availability rate offset the highproduction cost. Conversely, although the low availability rate reduces the operation cost,the manufacturer cannot meet the rental demand of consumers, and thus, reduces theprofit.
Furthermore, we analyze the equilibrium outcomes of the manufacturer’s sales marketfor two scenarios based on whether the manufacturer’s entering the sharing market, asshown in Proposition 4.
Proposition 4. (1) There exists the threshold ϕ1 for the availability rate of the sharing products.When ϕ∈(ϕ1, 1], pNR
B < pRS−SB , dNR
B < dRS−SB , and πNR
M < πRS−SM .
(2) Under entering the sharing market, the manufacturer’s sales profit increases at the avail-ability rate of the sharing products. Otherwise, the manufacturer’s sales profit decreases (i.e.,∂πRS−S
M∂ϕ > 0 >
∂πNRM
∂ϕ ).
If the manufacturer does not enter the sharing market, the high availability rate of thesharing product will lead to the sales market being disappeared in Proposition 2. Accordingto Proposition 3, once the manufacturer provides sharing services, the competition betweentwo products in the sharing market weakens the cannibalization of the sales market.Proposition 3 shows, at this time, consumers can still purchase products in the sales market.Therefore, when the manufacturer provides sharing services, it will adopt a high pricingstrategy in the sales market to consolidate the demand for high-end consumers. Moreover,when the manufacturer chooses to provide sharing services and if the sharing market runs
Sustainability 2021, 13, 1503 12 of 20
efficiently (ϕ∈(ϕ1, 1]), product sharing is lucrative for the manufacturer who is willing toraise sales price (pRS−S
B > pNRB ) and make the product more scarce to promote consumers’
renting demands and increase the total revenue of both the sharing market and the salesmarket. Thus, with the product’s sales price and demand raising, the manufacturer’ssales profit is monotonically increasing with the availability rate of the sharing products,
i.e., ∂πRS−SM∂ϕ > 0. However, without providing sharing services, the high availability rate
of the sharing products will cannibalize the manufacturer’s sales market, i.e., ∂πNRM
∂ϕ < 0.Therefore, the manufacturer’s entry in the sharing market is beneficial to the sales market.
Proposition 5. There exists a threshold c3 for the production cost, and when c∈(c1, c3], themanufacturer will not benefit from the product sharing (i.e., πRS
M ≤ πNRM ). When c∈(c3, 1],
entering the sharing market will benefit the manufacturer (i.e., πRSM > πNR
M ). The manufacturer’sentry is a dominant decision.
The proof of c3 is included in Appendix B.Proposition 5 shows the manufacturer’s total profits in both the sales market and the
sharing market under whether the manufacturer’s entering the sharing market. As weall know in Proposition 3, the manufacturer does not profit in the sharing market if theproduction cost is low. However, the profit in the sales market increases, making up forthe loss in the sharing market. When the production cost is not too high (c∈(c1, c3]), themanufacturer’s equilibrium decision is not to enter the sharing market, i.e., πRS
M ≤ πNRM .
The manufacturer is willing to enter the sharing market because of the high adoption rateand the low idle cost of the sharing product. When the production cost is high, as shownin Proposition 4, the manufacturer can benefit from both selling products and renting outthem. Thus, entering the sharing market is the manufacturer’s dominant decision.
Next, we analyze the owner’s equilibrium outcomes for two scenarios based onwhether the manufacturer’s entering the sharing market, as shown in Proposition 6.
Proposition6. When ϕ∈(ϕ1, 1], the manufacturer’s entering the sharing market raises the price(pNR
2 < pRS−R2 ) and the demand for idle products (dNR
2 < dRS2 ) and increases the owner’s earnings
(πNRO < πRS
O ).
Proposition 6 shows that the manufacturer’s entering the sharing market will promotethe idle product’s sharing. As shown in Proposition 2, the manufacturer is willing to sharenew products under a higher availability, which also cannibalize the sales demand. Inother words, if the sharing market runs efficiently, it has been proved that the sales pricewould raise the barrier for consumers to purchase in Proposition 4. Consumers are morewilling to rent products in the sharing market. The rental price in the sharing market isalso raised by the owner.
According to Proposition 6, the idle product’s demands and the owner’s earningsincrease with the manufacturer’s entering the sharing market. This is contrary to ourgeneral intuition. One may intuit that the manufacturer’s sharing products enhancecompetition and cannibalize the owner’s earnings in the sharing market. In contrast,the manufacturer’s product sharing expands sharing demands, and the heterogeneity ofsharing products provided by both the manufacturer and the owner makes the competitionless obvious.
4.4. Numerical Analysis
To further compare and analyze the impact of the availability rate of the sharingproduct on the manufacturer’s profits, we conduct a numerical analysis. In our numericalstudy, we consider β = α + g = 0.5c and two values of the availability rate of sharingproducts (ϕ = 0.6 and ϕ = 0.9), as shown in Figure 3.
Sustainability 2021, 13, 1503 13 of 20
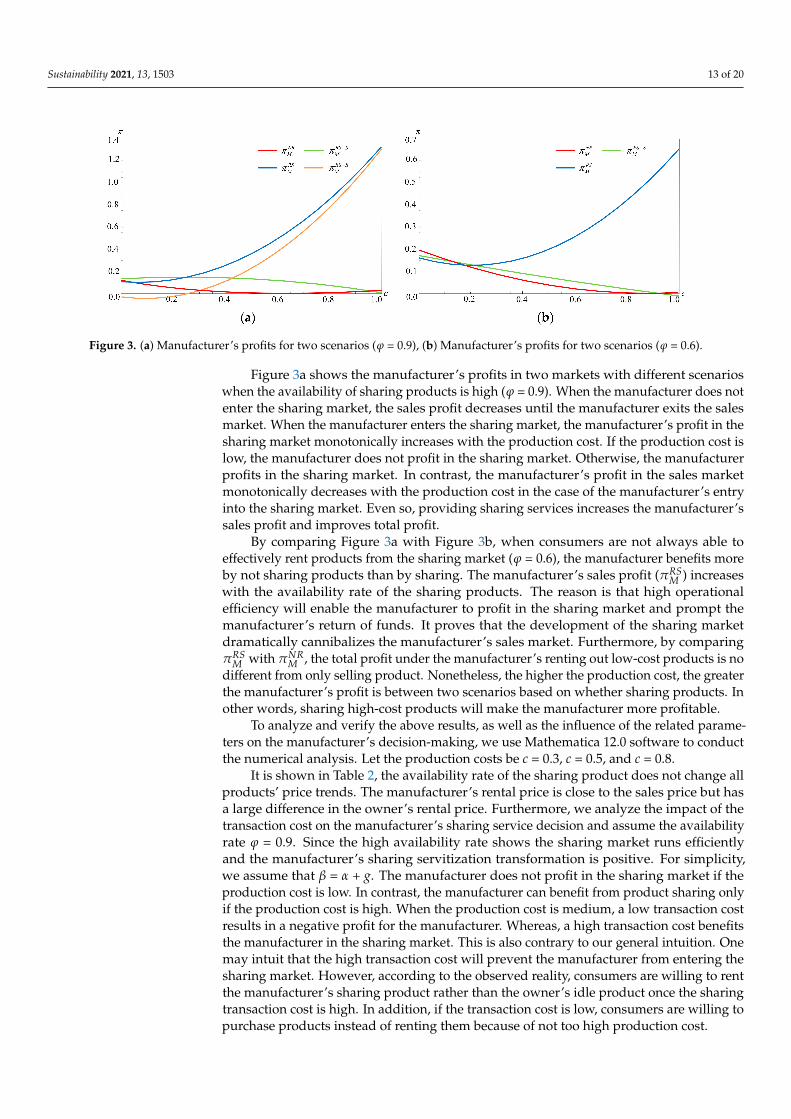
Figure 3. (a) Manufacturer’s profits for two scenarios (ϕ = 0.9), (b) Manufacturer’s profits for two scenarios (ϕ = 0.6).
Figure 3a shows the manufacturer’s profits in two markets with different scenarioswhen the availability of sharing products is high (ϕ = 0.9). When the manufacturer does notenter the sharing market, the sales profit decreases until the manufacturer exits the salesmarket. When the manufacturer enters the sharing market, the manufacturer’s profit in thesharing market monotonically increases with the production cost. If the production cost islow, the manufacturer does not profit in the sharing market. Otherwise, the manufacturerprofits in the sharing market. In contrast, the manufacturer’s profit in the sales marketmonotonically decreases with the production cost in the case of the manufacturer’s entryinto the sharing market. Even so, providing sharing services increases the manufacturer’ssales profit and improves total profit.
By comparing Figure 3a with Figure 3b, when consumers are not always able toeffectively rent products from the sharing market (ϕ = 0.6), the manufacturer benefits moreby not sharing products than by sharing. The manufacturer’s sales profit (πRS
M ) increaseswith the availability rate of the sharing products. The reason is that high operationalefficiency will enable the manufacturer to profit in the sharing market and prompt themanufacturer’s return of funds. It proves that the development of the sharing marketdramatically cannibalizes the manufacturer’s sales market. Furthermore, by comparingπRS
M with πNRM , the total profit under the manufacturer’s renting out low-cost products is no
different from only selling product. Nonetheless, the higher the production cost, the greaterthe manufacturer’s profit is between two scenarios based on whether sharing products. Inother words, sharing high-cost products will make the manufacturer more profitable.
To analyze and verify the above results, as well as the influence of the related parame-ters on the manufacturer’s decision-making, we use Mathematica 12.0 software to conductthe numerical analysis. Let the production costs be c = 0.3, c = 0.5, and c = 0.8.
It is shown in Table 2, the availability rate of the sharing product does not change allproducts’ price trends. The manufacturer’s rental price is close to the sales price but hasa large difference in the owner’s rental price. Furthermore, we analyze the impact of thetransaction cost on the manufacturer’s sharing service decision and assume the availabilityrate ϕ = 0.9. Since the high availability rate shows the sharing market runs efficientlyand the manufacturer’s sharing servitization transformation is positive. For simplicity,we assume that β = α + g. The manufacturer does not profit in the sharing market if theproduction cost is low. In contrast, the manufacturer can benefit from product sharing onlyif the production cost is high. When the production cost is medium, a low transaction costresults in a negative profit for the manufacturer. Whereas, a high transaction cost benefitsthe manufacturer in the sharing market. This is also contrary to our general intuition. Onemay intuit that the high transaction cost will prevent the manufacturer from entering thesharing market. However, according to the observed reality, consumers are willing to rentthe manufacturer’s sharing product rather than the owner’s idle product once the sharingtransaction cost is high. In addition, if the transaction cost is low, consumers are willing topurchase products instead of renting them because of not too high production cost.
Sustainability 2021, 13, 1503 14 of 20
Table 2. The numerical analysis.
C pRS−R1 pRS−S
B pRS−R2 pNR
2 pNRB dRS−R
1 dRS−SB dRS−R
2 dNRB dNR
2 πRSM πRS−R
M πRS−SM πNR
M πNRO πRS
O
ϕ = 0.9,β = 0.5c
0.3 0.426 0.458 0.288 0.231 0.430 - 0.932 1.244 0.205 0.658 0.175 - 0.147 0.035 0.029 0.1240.5 0.616 0.626 0.438 0.339 0.556 0.07 1.139 1.690 0.008 0.810 0.360 0.228 0.132 0.006 0.035 0.2290.8 0.852 0.924 0.662 0.500 0.744 0.045 1.449 2.360 - 1.038 0.851 0.775 0.076 - 0.044 0.446
ϕ = 0.6,β = 0.5c
0.3 0.407 0.509 0.279 0.286 0.552 - 0.505 1.159 0.310 0.489 0.127 - 0.106 0.083 0.018 0.0400.5 0.597 0.641 0.423 0.390 0.664 - 0.487 1.560 0.183 0.568 0.191 - 0.069 0.035 0.018 0.0650.8 0.880 0.839 0.640 0.546 0.831 - 0.460 2.162 - 0.687 0.408 - 0.018 - 0.018 0.113
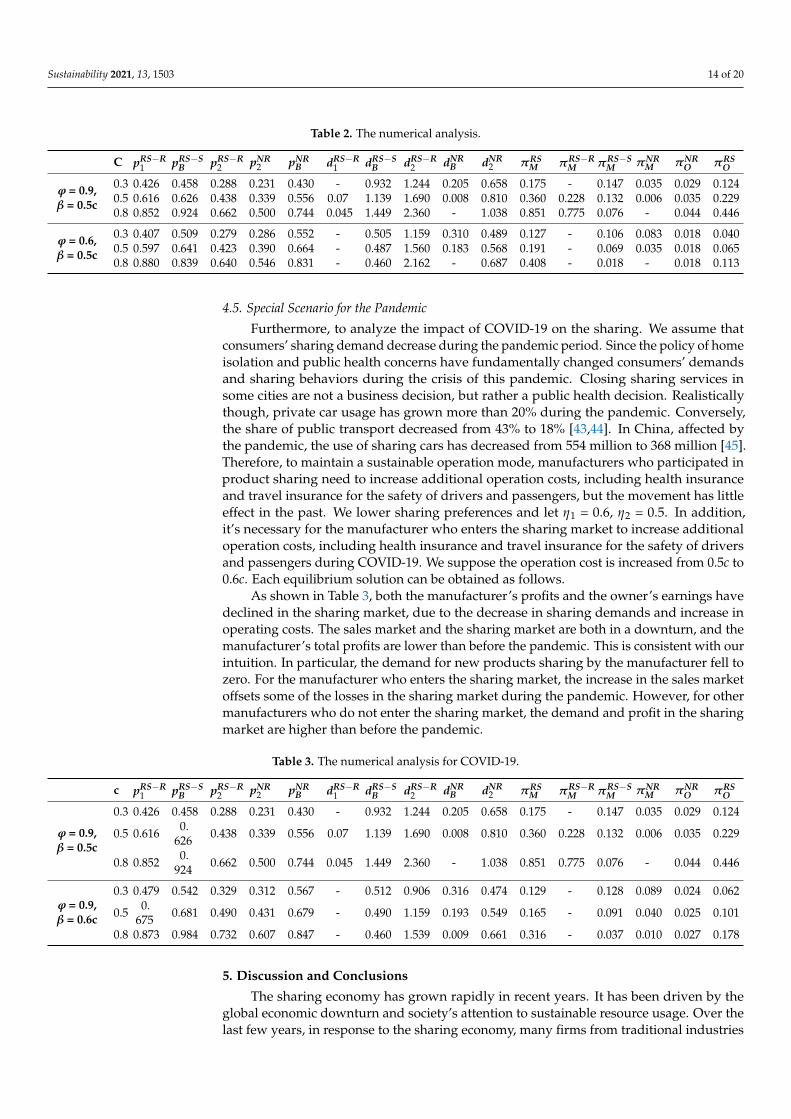
4.5. Special Scenario for the Pandemic
Furthermore, to analyze the impact of COVID-19 on the sharing. We assume thatconsumers’ sharing demand decrease during the pandemic period. Since the policy of homeisolation and public health concerns have fundamentally changed consumers’ demandsand sharing behaviors during the crisis of this pandemic. Closing sharing services insome cities are not a business decision, but rather a public health decision. Realisticallythough, private car usage has grown more than 20% during the pandemic. Conversely,the share of public transport decreased from 43% to 18% [43,44]. In China, affected bythe pandemic, the use of sharing cars has decreased from 554 million to 368 million [45].Therefore, to maintain a sustainable operation mode, manufacturers who participated inproduct sharing need to increase additional operation costs, including health insuranceand travel insurance for the safety of drivers and passengers, but the movement has littleeffect in the past. We lower sharing preferences and let η1 = 0.6, η2 = 0.5. In addition,it’s necessary for the manufacturer who enters the sharing market to increase additionaloperation costs, including health insurance and travel insurance for the safety of driversand passengers during COVID-19. We suppose the operation cost is increased from 0.5c to0.6c. Each equilibrium solution can be obtained as follows.
As shown in Table 3, both the manufacturer’s profits and the owner’s earnings havedeclined in the sharing market, due to the decrease in sharing demands and increase inoperating costs. The sales market and the sharing market are both in a downturn, and themanufacturer’s total profits are lower than before the pandemic. This is consistent with ourintuition. In particular, the demand for new products sharing by the manufacturer fell tozero. For the manufacturer who enters the sharing market, the increase in the sales marketoffsets some of the losses in the sharing market during the pandemic. However, for othermanufacturers who do not enter the sharing market, the demand and profit in the sharingmarket are higher than before the pandemic.
Table 3. The numerical analysis for COVID-19.
c pRS−R1 pRS−S
B pRS−R2 pNR
2 pNRB dRS−R
1 dRS−SB dRS−R
2 dNRB dNR
2 πRSM πRS−R
M πRS−SM πNR
M πNRO πRS
O
ϕ = 0.9,β = 0.5c
0.3 0.426 0.458 0.288 0.231 0.430 - 0.932 1.244 0.205 0.658 0.175 - 0.147 0.035 0.029 0.124
0.5 0.616 0.626 0.438 0.339 0.556 0.07 1.139 1.690 0.008 0.810 0.360 0.228 0.132 0.006 0.035 0.229
0.8 0.852 0.924 0.662 0.500 0.744 0.045 1.449 2.360 - 1.038 0.851 0.775 0.076 - 0.044 0.446
ϕ = 0.9,β = 0.6c
0.3 0.479 0.542 0.329 0.312 0.567 - 0.512 0.906 0.316 0.474 0.129 - 0.128 0.089 0.024 0.062
0.5 0.675 0.681 0.490 0.431 0.679 - 0.490 1.159 0.193 0.549 0.165 - 0.091 0.040 0.025 0.101
0.8 0.873 0.984 0.732 0.607 0.847 - 0.460 1.539 0.009 0.661 0.316 - 0.037 0.010 0.027 0.178
5. Discussion and Conclusions
The sharing economy has grown rapidly in recent years. It has been driven by theglobal economic downturn and society’s attention to sustainable resource usage. Over thelast few years, in response to the sharing economy, many firms from traditional industries
Sustainability 2021, 13, 1503 15 of 20
have provided sharing services in addition to selling to consumers. Nonetheless, thisphenomenon is changing. These firms are exiting the sharing market and ending sharingservices because of the rising operation costs and low adoption rates of sharing products.This research developed an analytical framework to examine these influence factors thatrestrict the manufacturer from providing sharing services and derive the equilibriumoutcome of these factors influencing the manufacturer’s and consumer’s decisions for twoscenarios: Without and with manufacturer’s providing sharing services.
Our analysis has generated a number of insights. First, this research has treatedthe sharing market entry decision is equivalent to gaining a nonnegative market share.The manufacturer is facing a higher entry barrier when entering the sharing market andproviding sharing services. One factor that affects the manufacturer’s entry into the sharingmarket is the launching size of sharing products. However, in reality, few manufacturerswill launch sharing products that can meet consumers’ rental needs. So that the launchingsize of sharing products by the manufacturer only accounts for 2–10% of demand and is farlower than consumers’ actual demand, which leads to the manufacturer’ withdrawal fromthe sharing market. Another factor that affects the manufacturer’s entry is the operationcost in the sharing market. So long as the operation and transaction costs are high and closeto the production cost, the manufacturer has positive demand in the sharing market. Thehigh operation cost will reduce the owner’s expected earnings and idle products’ marketdemand, and also weaken the consumer’s willingness to purchase products to obtainthe rental income [24]. Thus, the product demand in the sales market is cut down. Thedecreases of both new product sales and idle product sharing provide market conditions forthe manufacturer’s entering the sharing market. Moreover, once the manufacturer entersthe sharing market and provides sharing services, the manufacturer’s market demand andprofits have been improved.
Second, the manufacturer’s product sharing decisions change the competition ofproduct sharing for the sales, especially when consumers can easily obtain the satisfactionof rental needs in the sharing market. When the manufacturer does not enter the sharingmarket, the sharing product’s cost-effectiveness will cause consumers to give up productownership as the increase in availability and the decrease in transaction cost. No consumerpurchases the product until the manufacturer exits the sales market. Once the entry barrierto the sharing market has been crossed, the manufacturer who was forced to withdrawfrom the sales market will enter the sharing market. Instead, once the manufacturer entersthe sharing market, the competition between two products in the sharing market weakensthe cannibalization of the sales market. Consumers can still purchase products into thesales market. Therefore, the manufacturer’s entry into the sharing market will achievesustainable development facing the emerging sharing economy.
Third, the manufacturer’s profits in the sharing market are mainly related to theproduction cost. Only if the manufacturer rents out the high-cost product can it obtainpositive profits [25,26,29]. However, the relationship between the manufacturer’s profitsand the launching size of the sharing products is not significant. Since the launchingsize only determines the manufacturer’s operation cost in the sharing market. The highdemand and revenue brought by the high availability rate offset the high productioncost. Similarly, both the operation cost and the transaction cost in the sharing markethave no significant impact on the manufacturer’s market demands and profits. This ismainly because the high entry barrier to the sharing market weakens the impact of otherparameters on the manufacturer.
Finally, the manufacturer’s entering the sharing market can enable firms to obtainsustainable development and also promote the sales market. It has raised the price,maintained the demand, and improved the profit in the sales market. The manufacturer’sentry increases the price of products, maintain the demand for product sales, and alsoimprove the profit of the product sales market. Meanwhile, it is also of positive significanceto the owner in the sharing market, increases the product rental price and use demand
Sustainability 2021, 13, 1503 16 of 20
of the idle product sharing market, and improves the owner’s profit. It is the same forthe owner.
The above-mentioned discussion and conclusions show that the sharing economy haschanged the way consumers obtain ownership, and affected consumers’ purchase decision-making, and the manufacturer’s operating strategies in traditional industries. Althoughthe entry barrier is high, entering the sharing market can improve the manufacturer’sprofits, weaken the threat of the sharing economy on traditional industries, and achievesustainable development. The development of the sharing economy does not necessarilyaim at reducing the operation cost and the transaction cost. The sharing economy lies inimproving sharing services to meet consumers’ rental demand to the maximum extent.
In particular, we simulated the special scenario for the COVID-19 period, where boththe manufacturer’s profits and the owner’s earnings have declined in the sharing market,due to the decrease in sharing demands and increase in operating costs. The sales marketand the sharing market are both in a downturn, the manufacturer’s total profits are lowerthan before the pandemic. This is consistent with our intuition. For the manufacturer whoenters the sharing market, the increase in the sales market offsets some of the losses in thesharing market during the pandemic. However, for other manufacturers who do not enterthe sharing market, the demand and profit in the sharing market are higher than beforethe pandemic.
6. Limitations
We have simplified our model specifications to derive meaningful analytical results.The generalizability of these results is subject to certain limitations and can be relaxed todeal with more complex situations. First, we examined only a monopoly manufacturer thatsold products. In reality, multiple manufacturers participating in the sharing economy willproduce multi-channel competition. It will be interesting to introduce competitive man-ufacturers in future research. Second, further research should be undertaken to examinethe sharing platforms, including the self-built platform and the third-party platform, andexplore the members’ decision-making of the multi-channel supply chain.
Author Contributions: Conceptualization, J.F.; formal analysis, Y.X.; methodology, J.F.; projectadministration, Z.L.; resources, J.F.; supervision, Z.L.; writing—original draft, Y.X.; writing—reviewand editing, Z.L. All authors have read and agreed to the published version of the manuscript.
Funding: This research was funded by Innovation Method Fund of China with grant number2018IM020300, 2019IM020200; and Shanghai Science and Technology Program (Project No. 20040501300).
Institutional Review Board Statement: Not applicable.
Informed Consent Statement: Not applicable.
Data Availability Statement: MDPI Research Data Policies.
Conflicts of Interest: The authors declare that there is no conflict of interest regarding the publicationof this paper.
Appendix A
In this appendix, we solve the manufacturer’s or owner’s profit-maximization prob-lems. We obtain feedback equilibrium solutions using backwards induction.
Under manufacturer’s entering the sharing market, the manufacturer’s profits are
πNRM =
(pNR
B − c)dB =
(pNR
B − c)(1− pNR
B −ϕη2(pNR2 −β)−ϕη2 pNR
21−ϕη2
) and the owner’s earnings
are πNRO = ϕη2
(pNR
2 − β)(
pNRB −ϕη2(pNR
2 −β)−ϕη2 pNR2
1−ϕη2− pNR
2 ).
According to the backwards induction, ∂πNRO
∂pNR2
= − ϕη2(β+2ϕη2(β−pNR2 )−2pNR
2 +pNRB )
−1+ϕη2≥ 0;
∂2πNRO
∂(pNR2 )
2 = 2ϕη2(−1− 2ϕη21−ϕη2
) < 0. Let ∂πNRO
∂pNR2
= − ϕη2(β+2ϕη2(β−pNR2 )−2pNR
2 +pNRB )
−1+ϕη2= 0, we obtain
Sustainability 2021, 13, 1503 17 of 20
pNR2 =
β+2ϕβη2+pNRB
2+2ϕη2; then we substitute pNR
2 =β+2ϕβη2+pNR
B2+2ϕη2
into πNRM =
(pNR
B − c)dB =(
pNRB − c
)(1− pNR
B −ϕη2(pNR2 −β)−ϕη2 pNR
21−ϕη2
), we get πNRM = − (c−pNR
B )(−1−ϕ2(−1+β)η22+pNR
B )−1+ϕ2η2
2. ∂πNR
M∂pNR
B
= − 1+c+ϕ2(−1+β)η22−2ps
−1+ϕ2η22
≥ 0, ∂2πNRM
∂(pNRB )
2 = 2−1+ϕ2η2
2< 0, let ∂πNR
M∂pNR
B= − 1+c+ϕ2(−1+β)η2
2−2ps
−1+ϕ2η22
= 0,
we obtain pNRB = 1
2(1 + c + ϕ2(−1 + β)η2
2). Next, we substitute pNR
B into pNR2 , we get
pNR2 = 1+c+2β+ϕη2(4β+ϕ(−1+β)η2)
4+4ϕη2.
We substitute pNR2 and pNR
B into dNRB , πNR
M , and πNRO , then we obtain dNR
B =
−1+c−ϕ2(−1+β)η22
−2+2ϕ2η22
, πNRM =
(1−c+ϕ2(−1+β)η22)
2
4−4ϕ2η22
, πNRO = − ϕη2(1+c−2β+ϕ2(−1+β)η2
2)2
16(−1+ϕ2η22)
.
When the manufacturer both sells products and provides sharing services, we de-scribe πRS
M = πRS−SM + πRS−R
M = (pB − c)dB + ϕη1(p1 − g− α)d1 − cS(ϕ) = (pB − c)(1− pB−ϕη2(p2−β)−ϕη1p1
1−ϕη1
)+ ϕη1(p1 − g− α)
(pB−ϕη2(p2−β)−ϕη1 p1
1−ϕη1− η1 p1−η2 p2
η1−η2
)− c(
ϕ( pB−ϕη2(p2−β)−ϕη1 p11−ϕη1
− η1 p1−η2 p2η1−η2
)η1
). We get the owner’s earnings πR
O = ϕη2(p2 − β)
( η1 p1−η2 p2η1−η2
− p2). Then according to the backwards induction, ∂πRO
∂p2=ϕη1η2(β+p1−2p2)
η1−η2≥ 0,
we set ∂πRO
∂p2= ϕη1η2(β+p1−2p2)
η1−η2= 0, and obtain p2 = 1
2 (β + p1) = 12 (β + p1). Then we
substitude p2 = 12 (β + p1) = 1
2 (β + p1) into πRSM and obtain πR
M = 12(−1+ϕd1)(η1−η2)
(−ϕcη1(
ϕη22(β− p1)− η2(β + p1 − 2pB) + 2η1(p1 − pB)
)+ (η1 − η2)(2 + 2ϕη1(−1 + p1)
+ϕη2(−β + p1)− 2pB)(c− pB) + ϕη1(g + α− pB)(η2(β + p1 + ϕη2(−β + p1)− 2pB)+2η1(−p1 + pB))), which is a function of p1 and pB. We obtain∂πRS
M∂p1
=ϕ(η2
2(−c+pB)−2η21(g+α−2p1+2pB)+η1η2(g+α−β+ϕη2(c+g+α+β−2p1)−2p1+3pB))
2(−1+ϕη1)(η1−η2)≥ 0,
∂πRSM
∂pB= 2ϕη1(1+c+g+α−2p1)+ϕη2(β−p1)−2(1+c−2pB)
−2+2ϕη1≥ 0, ∂2πRS
M∂(p1)
2 = − ϕη1(−2η1+η2+ϕη22)
(−1+ϕη1)(η1−η2)< 0,
∂2πRSM
∂(pB)2 = 2
−1+ϕη1< 0. We let
∂πRSM
∂p1=
ϕ(η22(−c+pB)−2η2
1(g+α−2p1+2pB)+η1η2(g+α−β+ϕη2(c+g+α+β−2p1)−2p1+3pB))2(−1+ϕη1)(η1−η2)
= 0,∂πRS
M∂pB
= 2ϕη1(1+c+g+α−2pr1)+ϕη2(β−pr1)−2(1+c−2ps)−2+2ϕη1
= 0. Then we obtain p1 = (8ϕ(1 + c+g+ α)η3
1 − 2η21(4(1 + c + g + α) + ϕ(3(1 + c + g + α)− 2β)η2)− η2
2(−2 + 2c + ϕβη2)+ η1η2(6 + 6c + 4g + 4α− 4β + ϕ(2(−1 + c + g + α) + β)η2))/(16ϕη3
1 − ϕη32 − 8η2
1(2 + ϕη2)+η1η2(8 + ϕη2)), pB = (8(1 + c)η2
1(−1 + ϕη1)− 2η1(−2(1 + c) + ϕ(2 + 2c + g + α)η1)η2 +ϕη1(4 + g + α− 3β + 4ϕ(−1 + β)η1)η
22 + ϕ(−c + ϕ(c + g + α− β)η1)η
32)/(16ϕη3
1 − ϕη32
−8η21(2 + ϕη2)+ η1η2(8 + ϕη2)). We substitude p1 and pB into p2 = 1
2 (β + p1) =12 (β + p1)
and obtain p2 = 12 (β + (8(1 + c + g + α)η2
1(−1 + ϕη1) + 2η1(3 + 3c + 2g + 2α − 2β −ϕ(3(1 + c + g + α)− 2β)η1)η2 + (2− 2c + ϕ(2(−1 + c + g + α) + β)η1)η
22 − ϕβη3
2)/(16ϕη3
1 − ϕη32 − 8η2
1(2 + ϕη2) + η1η2(8 + ϕη2))). Next, we substitude the optimal price p1,
pB, and p2 into πRSM and πR
O; we get πRSM = (η1(4ϕ(−1 + c− g− α)(−1 + c + g + α)η3
1 +
η22(2− 2c + ϕ(c + g + α− β)η2)(−1 + c + ϕ(−1 + β)η2)+ 2η2
1(−2(−1 + c)2− ϕ(3+ 3c2 +g + α + c(−6 + g + α)− 2(g + α)(g + α + β))η2 + ϕ2(−1 + c + g + α)(1 + c + g + α− 2β)
η22) + η1η2(6(−1 + c)2 + ϕη2(4 + 3g + 3α − c(5 + g + α− 5β) − 3β − (g + α + β)2 −
ϕ(1 + c + g + α− 2β)(−2 + c + g + α + β)η2))))/((η1 − η2)(16ϕη31 − ϕη3
2 − 8η21(2 + ϕη2)
+ η1η2(8 + ϕη2))), and πRO = (ϕη1η2(−4ϕ(1 + c + g + α− 2β)η3
1 + (−1 + c)η22 +
(1 + c + g + α− 2β)η21(4 + 3ϕη2)− η1η2(3 + 3c + 2g + 2α− 6β + ϕ(−1 + c + g + α)η2))
2)
/((η1 − η2)(16ϕη3
1 − ϕη32 − 8η2
1(2 + ϕη2) + η1η2(8 + ϕη2))2).
Appendix B
This appendix contains all proofs of the propositions in the paper.
Proof of Proposition 1. Let pNRB = 1
2(1 + c + ϕ2(−1 + β)η2
2)≥ 0, pNR
2
= 1+c+2β+ϕη2(4β+ϕ(−1+β)η2)4+4ϕη2
≥ 0, dNRB =
−1+c−ϕ2(−1+β)η22
−2+2ϕ2η22
≥ 0, dNR2 = − 10+8c+ϕ2(−10+c)d2
240(−1+ϕd2)
≥
Sustainability 2021, 13, 1503 18 of 20
0. We obtain 1− ϕ2 < c ≤ 1 and −1+ϕ2+cϕ2 < β < c. If dNR
B =−1+c−ϕ2(−1+β)η2
2−2+2ϕ2η2
2< 0, and
dNR2 = − 10+8c+ϕ2(−10+c)d2
240(−1+ϕd2)
≥ 0, we obtain 1− ϕ2 < c ≤ 1 and 0 ≤ β < −1+ϕ2+cϕ2 .
Proof of Lemma 1. pNR2 =
β+2ϕβd2+pNRB
2+2ϕη2, ∂pNR
2∂pNR
B= 1
2+2ϕη2> 0; ∂pNR
Bη2
= ϕ2(−1 + β)η2 < 0; ∂pNR2
η2= ϕ(β−ps)
2(1+ϕη2)2 < 0, ∂dNR
Bη2
= − 9ϕ2cη2
10(−1+ϕ2η22)
2 <0; ∂πNRM
η2
= − ϕ2η2(1−c+ϕ2(−1+β)η22)(1+c−2β+ϕ2(−1+β)η2
2)2(−1+ϕ2η2
2)2 < 0.
Proof of Proposition 2.∂πRS
M∂p1
=ϕ(η2
2(−c+pB)−2η21(g+α−2p1+2pB)+η1η2(g+α−β+ϕη2(c+g+α+β−2p1)−2p1+3pB))
2(−1+ϕη1)(η1−η2)≥ 0,
∂πRSM
∂pB= 2ϕη1(1+c+g+α−2p1)+ϕη2(β−p1)−2(1+c−2pB)
−2+2ϕη1≥ 0, ∂2πRS
M∂(p1)
2 = − ϕη1(−2η1+η2+ϕη22)
(−1+ϕη1)(η1−η2)< 0,
∂2πRSM
∂(pB)2 = 2
−1+ϕη1< 0 and ∂2πRS
M∂p1∂pB
= ϕ(4η1+η2)2−2ϕη1
. According to Hessian Matrix(∂2πRS
M∂(p1)
2
)(∂2πRS
M∂(pB)
2
)−(
∂2πRSM
∂p1∂pB
)2=
ϕ(−8η1(−1+ϕη1)−ϕη22+
8η21(−1+ϕη1)−η1+η2
)
4(−1+ϕη1)2 > 0,
dRS−SB = (η1(8η1(−1 + c− ϕ(−1 + c + g + α)η1) + 2(2− 2c + ϕ(−3 + c + g + α + 2β)η1)
η2 + ϕ(2 + c + g + α− 3β)η22))/
(16ϕη3
1 − ϕη32 − 8η2
1(2 + ϕη2) + η1η2(8 + ϕη2))≥ 0,
dRS−RB = (8(g + α)η3
1 + 2η21η2(1 + c− 4g− 4α− 2β− 2ϕ(c + g + α− β)η2) + η1η2
2(−3 + c + 2g + 2α + 2β + ϕ(−1 + 2c + 2g + 2α− β)η2) − η3
2(−1 + c + ϕ(−1 + β)η2))/((η1 − η2)
(16ϕη3
1 − ϕη32 − 8η2
1(2 + ϕη2) + η1η2(8 + ϕη2)))
≥ 0, and d2 =(η1(4ϕ(1 + c + g + α− 2β)η3
1 − (−1 + c)η22 − (1 + c + g + α− 2β)η2
1(4 + 3ϕη2)+η1η2(3 + 3c + 2g + 2α− 6β + ϕ(−1 + c + g + α)η2)))/((η1 − η2)(16ϕη3
1 − ϕη32 − 8η2
1(2 + ϕη2) + η1η2(8 + ϕη2))) ≥ 0. We let β = α + g and obtain 0.7 < η2 < η1 < 1,355688 < ϕ1 ≤ 1, c> 50−32ϕ1
688ϕ1−355 , and ( 50−32ϕ1+850c−720ϕ1c495−32ϕ1
< β < c. Let c1 = 50−32ϕ1688ϕ1−355 .
Proof of Proposition 3. We substitude the optimal price p1, pB, p2 into πRS−RM , πRS−R
M =(ϕη1(−8(g + α)η3
1 + 2η21η2(−1− c + 4g + 4α + 2β + 2ϕ(c + g + α− β)η2)− η1η2
2(−3+ c+2g + 2α + 2β + ϕ(−1 + 2c + 2g + 2α− β)η2) + η3
2(−1 + c + ϕ(−1 + β)η2))(8ϕ(−1 + c + g + α)η3
1 − η22(2− 2c + ϕ(c + g + α− β)η2) − η1η2(−2(−3 + c + 2g + 2α +
2β) + ϕ(−2 + c + g + α + β)η2)− 2η21(4(−1 + c + g + α) + ϕ(−3 + c + g + α + 2β)η2)))/
((η1 − η2)(16ϕη3
1 − ϕη32 − 8η2
1(2 + ϕη2) + η1η2(8 + ϕη2))2). We assume η1 = 0.9 and η2 =
0.8, then πRS−RM = 1
20(450−409ϕ)2 9ϕ(16ϕ(2 + 45c + 45g + 45α− 47β)− 25(2 + 34c + 45g +
45α − 36β))(ϕ(−99 + 431c + 431g + 431α− 332β)− 10(−11 + 47c + 45g + 45α− 36β)).We let πRS−R
M = 0 and obtain c2 = 110−99−450g+431ϕg−450α+431ϕα+360β−332ϕβ470−431ϕ .
Proof of Proposition 4. pNRB = 1+c
2 + 825 ϕ2(−1 + β),
pB = −2250(1+c)+ϕ[1705c−45(−77+10g+10α+24β)+144ϕ[−9+2c+2g+2α+7β]]−4500+4090ϕ . We let dNR
B − dB =
ϕ(8ϕ(−4050c+4541ϕc+10ϕ(22+495g+495α−108β))−125(22+86c+495g+495α−108β))10(−450+409ϕ)(−25+16ϕ2)
> 0. We let ∂πNRM
∂ϕ =
− 8ϕ(−25(−1+c)+16ϕ2(−1+β))(25(1+c−2β)+16ϕ2(−1+β))25(25−16ϕ2)
2 < 0 and ∂πRS−SM∂ϕ = 1
20(450−409ϕ)3
81(−21600ϕ2(−43 + 55c + 55g + 55α− 12β)(−9 + 2c + 2g + 2α + 7β) + 6544ϕ3(−43 +55c + 55g + 55α− 12β)(−9 + 2c + 2g + 2α + 7β)− 12500(−1 + c)(−262 + 154c + 585g +585α + 108β) + 250ϕ(36438 + 14058c2 − 63145g− 63145α− 17196β + 36(55(g + α)− 12β)(5(g + α) + 12β) + c(−55680 + 41545g + 41545α + 27564β))) > 0.
Proof of Proposition 5. πNRM =
(pNR
B − c)dB =
(pNR
B − c)(1− pNR
B −η2(pNR2 −β)−ϕη2 pNR
21−ϕη2
) =
(−1+c− 1625 ϕ2(−1+β))
2
4− 64ϕ225
, πRSM = πRS−S
M + πRS−RM = (pB − c)dB + ϕη1(p1 − g− α)d1 − cS(ϕ) =
Sustainability 2021, 13, 1503 19 of 20
(pB − c)(
1− pB−ϕη2(p2−β)−ϕη1 p11−ϕη1
)+ ϕη1(p1 − g− α)
(pB−ϕη2(p2−β)−ϕη1 p1
1−ϕη1− η1 p1−η2 p2
η1−η2
)−
c(
ϕ(
pB−η2(p2−β)−ϕη1 p11−ϕη1
− η1 p1−η2 p2η1−η2
)η1
)= 1−9000+8180ϕ 9(−250(−1 + c)2 + 5ϕ(77− 115c2−
20g− 20α− 2c(53 + 170g + 170α− 168β)− 9(5(g + α)− 4β)2 − 48β) + 16ϕ2(−9 + 45c2 +
4g + 4α + 45(g + α)2 + c(4 + 90g + 90α− 94β) + 14β− 94(g + α)β + 40β2)).We let πNR
M − πRSM = 0 and obtain c3 which is omitted hear.
Proof of Proposition 6. From Appendix A, we get pNRr2 = 1+c+2β+ϕη2(4β+ϕ(−1+β)η2)
4+4ϕη2=
1+c+2β+ 1625 ϕ(ϕ(−1+β)+5β)
4+ 16ϕ5
, and pr2 = 12 (β + (8(1 + c + g + α)η2
1(−1 + ϕη1) + 2η1(3 + 3c +
2g+ 2α− 2β− ϕ(3(1 + c + g + α)− 2β)η1)η2 +(2− 2c + ϕ(2(−1 + c + g + α) + β)η1)η22−
ϕβη32)/(16ϕη3
1 − ϕη32 − 8η2
1(2 + ϕη2) + η1η2(8 + ϕη2))) =
−10(11+43c+45g+45α+126β)+ϕ(99+387c+387g+387α+1150β)4(−450+409ϕ)
. We easily get dNR2 − d2 =
−((3272ϕ3(−10 + c) − 25ϕ(31259c + 5(1274 + 6723g + 6723α− 8262β)) + 900ϕ2
(139 + 383c + 387g + 387α− 486β) + 33750(2 + 13c + 15g + 15α− 18β))/(100(−5 + 4ϕ)
(−450 + 409ϕ))) > 0, πNRO − πR
O = 116 ϕη2(−
(1+c−2β+ϕ2(−1+β)η22)
2
−1+ϕ2η22
− (16η1(−4ϕ
(1 + c + g + α− 2β)η31 + (−1 + c)η2
2 + (1 + c + g + α− 2β)η21(4 + 3ϕη2) − η1η2(3 + 3c +
2g + 2α − 6β + ϕ(−1 + c + g + α)η2))2)/((η1−η2)(16ϕη3
1 − ϕη32 − 8η2
1(2 + ϕη2) + η1η2
(8 + ϕη2))2)) = 1
20 ϕ(− 9(9ϕ(11+43c+43g+43α−54β)−10(11+43c+45g+45α−54β))2
(450−409ϕ)2 −
(1+c+ 1625 ϕ2(−1+β)−2β)
2
−1+ 16ϕ225
) > 0.
The proof of relevant transaction costs. We let πRS−RM = (−209+821c+9β)(106+1010c+1269β)
828100= 0 and obtain β = 1
9 (209− 821c) < c.
References1. PwC. “The Sharing Economy.” PwC Consumer Intelligence Series. 2015. Available online: https://www.pwc.com/us/en/
technology/publications/assets/pwc-consumer-intelligence-series-the-sharing-economy.pdf (accessed on 12 October 2020).2. PwC. Share Economy 2017: The New Business Model. 2018. Available online: https://www.pwc.de/share-economy (accessed
on 12 October 2020).3. Feng, J.; Liu, B.; Liu, Z. Manufacturer’s business strategy: Interaction of sharing economy and product rollover. Complexity 2020,
3, 1–18. [CrossRef]4. iiMedia Research. 2018–2019 China Shared Economy Industry Panorama Research Report. 2019. Available online: https:
//www.iimedia.cn/c400/66502.html (accessed on 15 December 2020).5. Li, F. Daimler Pulls Plug on Car-Sharing Program. Available online: https://global.chinadaily.com.cn/a/201906/03/WS5cf49491
a310a4317f1d8073.html (accessed on 15 October 2020).6. SHARE NOW. Service Ending February 29th. Available online: https://www.share-now.com/ca/en/important-update/
(accessed on 15 October 2020).7. Brown, L.S. GM’s Car-Sharing Service, Maven, Shuts Down after Four Years. Available online: https://www.caranddriver.com/
news/a32235218/gm-maven-car-sharing-closes/ (accessed on 15 December 2020).8. Hossain, M. The effect of the Covid-19 on sharing economy activities. J. Clean. Prod. 2021, 280, 124782. [CrossRef] [PubMed]9. Zhang, D. Pandemic Hinders Growth of Car-Sharing Business. Available online: https://www.chinadaily.com.cn/a/202007/13/
WS5f0bc279a310834817258f3b.html (accessed on 15 October 2020).10. Belk, R. You are what you can access: Sharing and collaborative consumption online. J. Bus. Res. 2014, 67, 1595–1600. [CrossRef]11. Plewnia, F.; Guenther, E. Mapping the sharing economy for sustainability research. Manag. Decis. 2018, 56, 570–583. [CrossRef]12. Laurenti, R.; Singh, J.; Cotrim, J.M.O.; Toni, M.; Sinha, R. Characterizing the sharing economy state of the research: A systematic
map. Sustainability 2019, 11, 5729. [CrossRef]13. Hossain, M. Sharing economy: A comprehensive literature review. Int. J. Hosp. Manag. 2020, 87, 102470. [CrossRef]14. Ranjbari, M.; Morales-Alonso, G.; Carrasco-Gallego, R. Conceptualizing the sharing economy through presenting a comprehensive
framework. Sustainability 2018, 10, 2336. [CrossRef]15. Sun, J.; Lv, X. Feeling dark, seeing dark: Mind–body in dark tourism. Ann. Tourism Res. 2021, 86, 103087. [CrossRef]16. Xiong, Z.; Xiao, N.; Xu, F.; Zhang, X.; Xu, Q.; Zhang, K.; Ye, C. An equivalent exchange based data forwarding incentive scheme
for socially aware networks. J. Signal Processi. Syst. 2020, 11, 1–15. [CrossRef]
Sustainability 2021, 13, 1503 20 of 20
17. Laurell, C.; Sandström, C. Comparing coverage of disruptive change in social and traditional media: Evidence from the sharingeconomy. Technol. Forecast. Soc. Chang. 2018, 129, 339–344. [CrossRef]
18. Lv, X.; Li, H.; Xia, L. Effects of haptic cues on consumers’ online hotel booking decisions: The mediating role of mental imagery.Tourism Manage. 2020, 77, 104025. [CrossRef]
19. Lv, X.; Liu, Y.; Luo, J.; Liu, Y.; Li, C. Does a cute artificial intelligence assistant soften the blow? The impact of cuteness on customertolerance of assistant service failure. Ann. Tourism Res. 2021, 87, 103114. [CrossRef]
20. Fraiberger, S.P.; Sundararajan, A. Peer-to-peer rental markets in the sharing economy. Work. Paper 2015. [CrossRef]21. Fradkin, A. Search, matching, and the role of digital marketplace design in enabling trade: Evidence from Airbnb. Work. Paper
2017. [CrossRef]22. Benjaafar, S.; Kong, G.; Li, X.; Courcoubetis, C. Peer-to-peer product sharing: Implications for ownership, usage, and social
welfare in the sharing economy. Manag. Sci. 2018, 65, 477–493. [CrossRef]23. Abhishek, V.; Guajardo, J.; Zhang, Z. Business Models in the Sharing Economy: Manufacturing Durable Goods in the Presence of
Peer-to-Peer Rental Markets. 2020. Available online: https://ssrn.com/abstract=2891908 (accessed on 10 February 2020).24. Jiang, B.; Tian, L. Collaborative consumption: Strategic and economic implications of product sharing. Manag. Sci. 2018, 64,
1171–1188. [CrossRef]25. Tian, L.; Jiang, B. Effects of consumer-to-consumer product sharing on distribution channel. Prod. Oper. Manag. 2018, 27, 350–367.
[CrossRef]26. Liu, Z.; Feng, J.; Wang, J. Effects of the sharing economy on sequential innovation products. Complexity 2019, 2019, 3089641.
[CrossRef]27. Ke, H.; Chai, S.; Cheng, R. Selling or sharing: Business model selection problem for an automobile manufacturer with uncertain
information. J. Intell. Fuzzy Syst. 2018, 36, 1–16. [CrossRef]28. Razeghian, M.; Weber, T.A. The advent of the sharing culture and its effect on product pricing. Electron. Commer. Res. Appl. 2019,
33, 100801. [CrossRef]29. Jiang, B.; Tian, L.; Xu, Y. Manufacturer’s entry in the product-sharing market. Manuf. Serv. Oper. Manag. 2019. [CrossRef]30. Nishino, N.; Takenaka, T.; Takahashi, H. Manufacturer’s strategy in a sharing economy. CIRP Ann. 2017, 1, 409–412. [CrossRef]31. Weber, T.A. Product pricing in a peer-to-peer economy. J. Manag. Inf. Syst. 2016, 33, 573–596. [CrossRef]32. Schmidt, P. The effect of car sharing on car sales. Int. J. Ind. Organ. 2020, 71, 102622. [CrossRef]33. Li, Y.; Bai, X.; Xue, K. Business modes in the sharing economy: How does the OEM cooperate with third-party sharing platforms?
Int. J. Prod. Econ. 2020, 221, 107467. [CrossRef]34. Chardon, C.M.; Caruso, G.; Thomas, I. Bicycle sharing system ‘success’ determinants. Transp. Res. Part A Policy Pract. 2017, 100,
202–214. [CrossRef]35. Kabra, A.; Belavina, E.; Girotra, K. Bike-share systems: Accessibility and availability. Work. Paper 2018. [CrossRef]36. Bellos, I.; Ferguson, M.; Toktay, L.B. The car sharing economy: Interaction of business model choice and product line design.
Manuf. Serv. Oper. Manag. 2017, 19, 185–201. [CrossRef]37. Weber, T.A. Intermediation in a sharing economy: Insurance, moral hazard, and rent extraction. J. Manag. Inf. Syst. 2014, 31,
35–71. [CrossRef]38. Liu, Z.; Feng, J.; Liu, B. Pricing and Service Level Decisions under a Sharing Product and Consumers’ Variety-Seeking Behavior.
Sustainability 2019, 11, 6951. [CrossRef]39. Zhu, J.; Shi, Q.; Wu, P.; Sheng, Z.; Wang, X. Complexity analysis of prefabrication contractors’ dynamic price competition in mega
projects with different competition strategies. Complexity 2018, 5928235. [CrossRef]40. Qu, S.; Han, Y.; Wu, Z.; Raza, H. Consensus modeling with asymmetric cost based on data-driven robust optimization. Group
Decis. Negot. 2020, 1–38. [CrossRef]41. Cao, L. Changing port governance model: Port spatial structure and trade efficiency. J. Coastal Res. 2020, 95(S1), 963–968.
[CrossRef]42. Liu, B.; Yang, G.; Zhang, Q. Pricing decisions and innovation strategies choice in supply chain with competing manufacturers
and common supplier. Sustainability 2020, 12, 8855. [CrossRef]43. Zhao, X.; Ye, Y.; Ma, J.; Shi, P.; Chen, H. Construction of electric vehicle driving cycle for studying electric vehicle energy
consumption and equivalent emissions. Environ. Sci. Pollut. R. 2020, 27, 37395–37409. [CrossRef] [PubMed]44. Bucsky, P. Modal share changes due to COVID-19: The case of Budapest. Transp. Res. Interdiscip. Perspect. 2020, 8, 100141.45. Aurora Mobile. Report on the Development Trend of Car-Sharing in 2020. 2020. Available online: https://www.jiguang.cn/
reports/494 (accessed on 15 December 2020).