Embed Size (px)
Citation preview
Manfredi, G., Prota, A., Verderame, G. M., De Luca, F., & Ricci, P. (2014).2012 Emilia earthquake, Italy: reinforced concrete buildings response.Bulletin of Earthquake Engineering, 12(5), 2275-2298.https://doi.org/10.1007/s10518-013-9512-x
Peer reviewed version
Link to published version (if available):10.1007/s10518-013-9512-x
Link to publication record in Explore Bristol ResearchPDF-document
University of Bristol - Explore Bristol ResearchGeneral rights
This document is made available in accordance with publisher policies. Please cite only the publishedversion using the reference above. Full terms of use are available:http://www.bristol.ac.uk/pure/about/ebr-terms
1
2012 Emilia earthquake, Italy:
Reinforced Concrete buildings response
Manfredi Gaetano, Prota Andrea, Verderame Gerardo M.1,
De Luca Flavia, Ricci Paolo
Università degli Studi di Napoli Federico II, DIST, Via Claudio 21, 80125 Napoli
Abstract
Data of the Italian National Institute of Statistics are collected aimed at characterizing
Reinforced Concrete (RC) building stock of the area struck by the 2012 Emilia earthquake
(number of storeys, age of construction, structural typology). Damage observations, collected
right after the event in reconnaissance reports, are shown and analyzed emphasizing typical
weaknesses of RC buildings in the area.
The evolution of seismic classification for Emilia region and RC buildings’ main characteristics
represent the input data for the assessment of non-structural damage of infilled RC buildings,
through a simplified approach (FAST method), based on EMS-98 damage scale. Peak Ground
Acceleration (PGA) capacities for the first three damage states of EMS-98 are compared with
registered PGA in the epicentral area. Observed damage and damage states evaluated for the
PGA of the event, in the epicentral area, are finally compared. The comparison led to a fair
agreement between observed and numerical data.
Keywords: Emilia earthquake, infilled RC buildings, damage states, non-structural damage, FAST
method
1. INTRODUCTION
On the 20th of May 2012 a magnitude (Mw) 6.0 earthquake struck the Emilia region; the
seismic sequence was characterized by seven events with Mw higher than 5.0. The area struck by
the earthquake was very large, including the provinces of Modena, Ferrara, Rovigo, and Mantova.
Peak Ground Acceleration (PGA) registered at the closest station (epicentral distance equal to 16
km) during the mainshock was equal to 0.27g (Chioccarelli et al, 2012). Most of observed damage
involved masonry buildings, precast industrial structures, and, in some cases, Reinforced Concrete
(RC) structures; as it is documented by reconnaissance reports (EPICentre Field Observation
Report No. EPI-FO-200512, 2012; EPICentre Field Observation Report No. EPI-FO-290512,
2012; Parisi et al., 2012; Liberatore et al., 2013, among others). The 20th of May mainshock was
followed by another significant event on the 29th of May (Mw=5.8, according to INGV).
Most of the structures in the area struck by the earthquake are designed for gravity loads only.
This observation is based on building stock’s age of construction data of the Italian National
Institute of Statistics (ISTAT) and considering the evolution of the seismic classification of Emilia
region (see sections 2 and 3). RC buildings represent less than 20% of the whole building stock in
the region and number of storeys data emphasizes that most of them are low/mid-rise buildings.
Photographic documentation on RC buildings showed that most of observed damage involved
non-structural elements such as masonry infills. In few cases brittle failures in RC elements, either
caused by local interaction with infills, or by poor reinforcement detailing, were the main cause of
severe structural damage, see section 4.
Preliminarily, a code based seismic assessment is provided trough a spectral based approach
on bare RC buildings, leading to code-based bounds for spectral acceleration capacities to be
compared with spectra of the records at the station closest to the epicentre of the mainshock event,
see section 5. Results of code assessment on bare RC structures cannot be compared with observed
damage data, given the key role played by masonry infills and not taken into account in such
procedure.
1 Corresponding author
2
Hence, a damage assessment procedure (FAST method), on infilled RC buildings, is described
and applied for the case of Emilia building stock. FAST damage assessment procedure belongs to
the wider family of vulnerability assessment methodologies based on spectral displacements (e.g.,
NIBS 1997, 1998, 2002; Kircher et al., 1997; Erdik et al., 2004, among others). Damage states are
classified according to the 1998 European Macroseismic Scale (Grunthal, 1998), similarly to other
vulnerability approaches available in literature in recent years (e.g., Tertulliani et al. 2011; Achs
and Adam 2012, among others). Results in terms of PGA capacities for damage states (DS)
influenced by infills (DS1 up to DS3) are carried out, and compared with PGA recorded in the
epicentral area during the 20th of May mainshock. Damage to infilled RC buildings, in the
epicentral area, was considered as benchmark for FAST simplified damage assessment procedure,
leading to a fair agreement between numerical and observed data, see section 6. FAST method was
already employed for Lorca 2011, Spain, earthquake (De Luca et al., 2013a). Poor input data
necessary for its employment and its simple application make it a suitable tool for damage
mapping in the phase of emergency management right after seismic events (e.g., Goretti and Di
Pasquale, 2006).
2. EMILIA BUILDING STOCK: ISTAT DATA
ISTAT (Istituto Nazionale di Statistica, Italian National Institute of Statistics) survey is a
nation-wide census that provides information on citizens, buildings and dwellings. In particular, in
the “14th general census of the population and dwellings” (14° Censimento generale della
popolazione e delle abitazioni, ISTAT 2001) information about the number of storeys, as well as
characteristic of residential buildings, and in some cases even those non residential, are provided.
Collected information concerns category of use (industrial or residential), structural typology
(masonry, reinforced concrete, …), number of storeys, and age of construction. ISTAT data
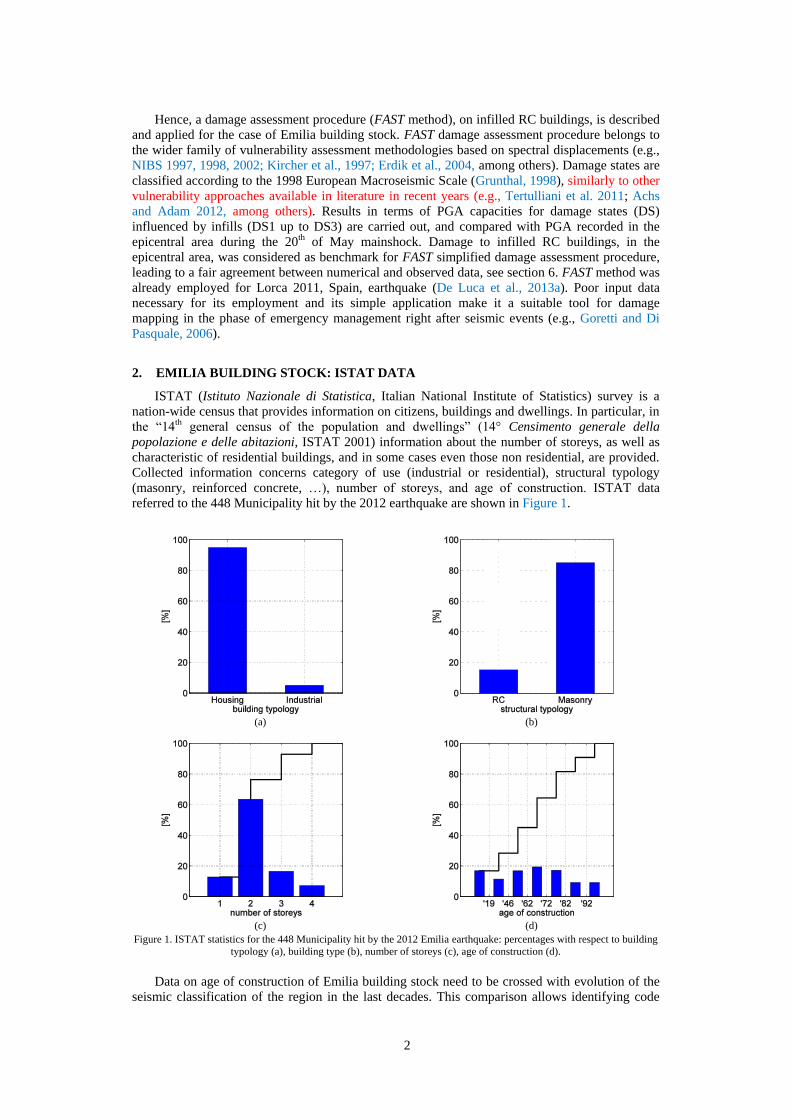
referred to the 448 Municipality hit by the 2012 earthquake are shown in Figure 1.
(a) (b)
(c) (d)
Figure 1. ISTAT statistics for the 448 Municipality hit by the 2012 Emilia earthquake: percentages with respect to building
typology (a), building type (b), number of storeys (c), age of construction (d).
Data on age of construction of Emilia building stock need to be crossed with evolution of the
seismic classification of the region in the last decades. This comparison allows identifying code
3
provisions according to which buildings have been designed, see section 3. Nevertheless, due to
confidentiality requirements, these statistics are collected in aggregate manner; for example, it is
not possible to get the number of RC buildings in a census tract (the spatial unit of ISTAT survey)
dated back to a specific age of construction and characterized by a given number of storeys.
Emilia–Romagna is one of the richest, most developed regions in Europe. Bologna, its
principal city, has one of Italy's highest quality of life indices and advanced social services. Data in
Figure 1a show that the category of use of almost 5% of the whole building stock is constituted by
buildings or group of buildings used as hotels, offices, commerce and industry, communications
and transport. RC buildings represent less than 20% of the whole building stock, (Figure 1b).
Storey distribution in Figure 1c emphasizes that two storey buildings represents about 60% of the
whole building stock. Age of construction data show that most of building stock (more than 80%)
have been realized before 1982, see Figure 1d.
Data in Figure 1 allow inferring that RC building stock is characterized mostly by low to
medium rise buildings and the main part of them was realized between 1960 and 1980. The
inferred information on the building stock can be compared to the corresponding information
collected for L’Aquila (Abruzzo) area after the 2009 earthquake (e.g., Ricci et al., 2011a). The
comparison of Emilia and Abruzzo building stock data emphasizes a similar number of RC
building (approximately equal to 20%) and similar distribution of number of storeys and age of
construction. On the other hand, given the different evolution of the seismic classification, similar
building stock characteristics can lead to different design approaches, and to different structural
performances.
3. EVOLUTION OF THE SEISMIC CLASSIFICATION IN THE EMILIA REGION
Seismic classification in Italy and, in general, in all seismically prone areas, is quite often a
result of disastrous earthquakes. In Italy, the first classification was released in 1909, after the
disastrous earthquake of Reggio Calabria and Messina in 1908. After this first classification every
five or ten years a new update of seismic classification and code provisions were provided (Lai et
al., 2009).
In recent years, four are the fundamental dates for the evolution of the seismic classification in
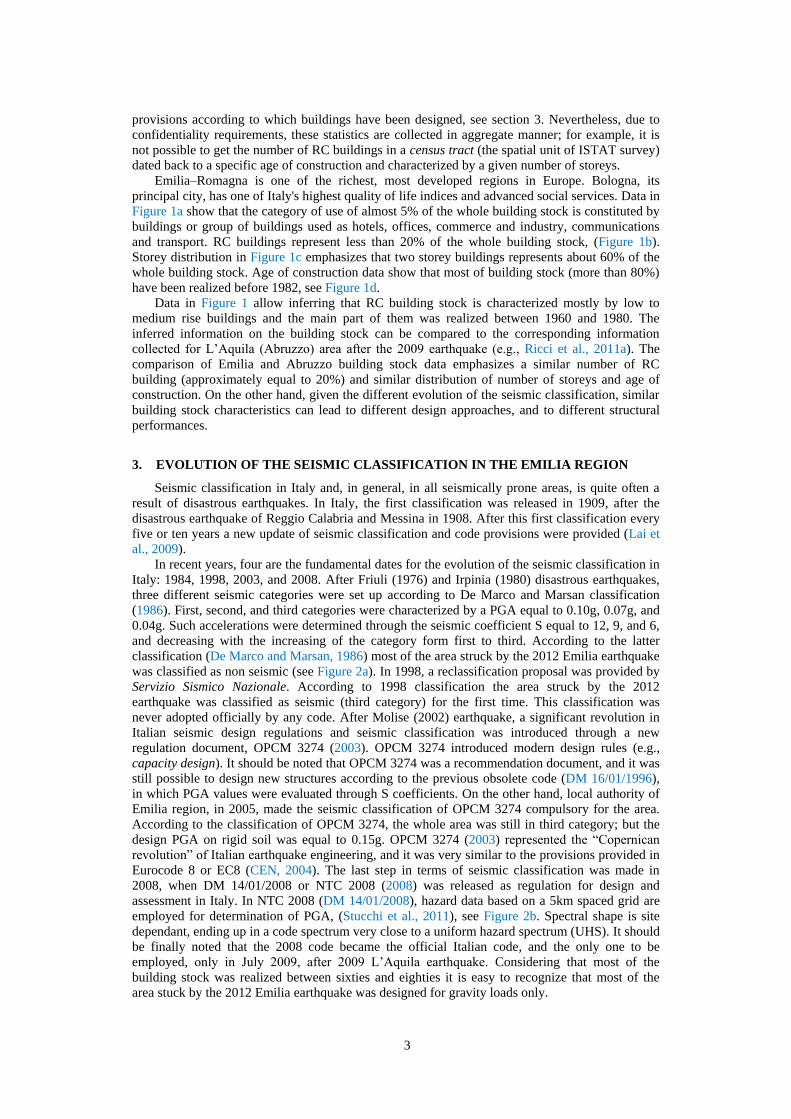
Italy: 1984, 1998, 2003, and 2008. After Friuli (1976) and Irpinia (1980) disastrous earthquakes,
three different seismic categories were set up according to De Marco and Marsan classification
(1986). First, second, and third categories were characterized by a PGA equal to 0.10g, 0.07g, and
0.04g. Such accelerations were determined through the seismic coefficient S equal to 12, 9, and 6,
and decreasing with the increasing of the category form first to third. According to the latter
classification (De Marco and Marsan, 1986) most of the area struck by the 2012 Emilia earthquake
was classified as non seismic (see Figure 2a). In 1998, a reclassification proposal was provided by
Servizio Sismico Nazionale. According to 1998 classification the area struck by the 2012
earthquake was classified as seismic (third category) for the first time. This classification was
never adopted officially by any code. After Molise (2002) earthquake, a significant revolution in
Italian seismic design regulations and seismic classification was introduced through a new
regulation document, OPCM 3274 (2003). OPCM 3274 introduced modern design rules (e.g.,
capacity design). It should be noted that OPCM 3274 was a recommendation document, and it was
still possible to design new structures according to the previous obsolete code (DM 16/01/1996),
in which PGA values were evaluated through S coefficients. On the other hand, local authority of
Emilia region, in 2005, made the seismic classification of OPCM 3274 compulsory for the area.
According to the classification of OPCM 3274, the whole area was still in third category; but the
design PGA on rigid soil was equal to 0.15g. OPCM 3274 (2003) represented the “Copernican
revolution” of Italian earthquake engineering, and it was very similar to the provisions provided in
Eurocode 8 or EC8 (CEN, 2004). The last step in terms of seismic classification was made in
2008, when DM 14/01/2008 or NTC 2008 (2008) was released as regulation for design and
assessment in Italy. In NTC 2008 (DM 14/01/2008), hazard data based on a 5km spaced grid are
employed for determination of PGA, (Stucchi et al., 2011), see Figure 2b. Spectral shape is site
dependant, ending up in a code spectrum very close to a uniform hazard spectrum (UHS). It should
be finally noted that the 2008 code became the official Italian code, and the only one to be
employed, only in July 2009, after 2009 L’Aquila earthquake. Considering that most of the
building stock was realized between sixties and eighties it is easy to recognize that most of the
area stuck by the 2012 Emilia earthquake was designed for gravity loads only.
4
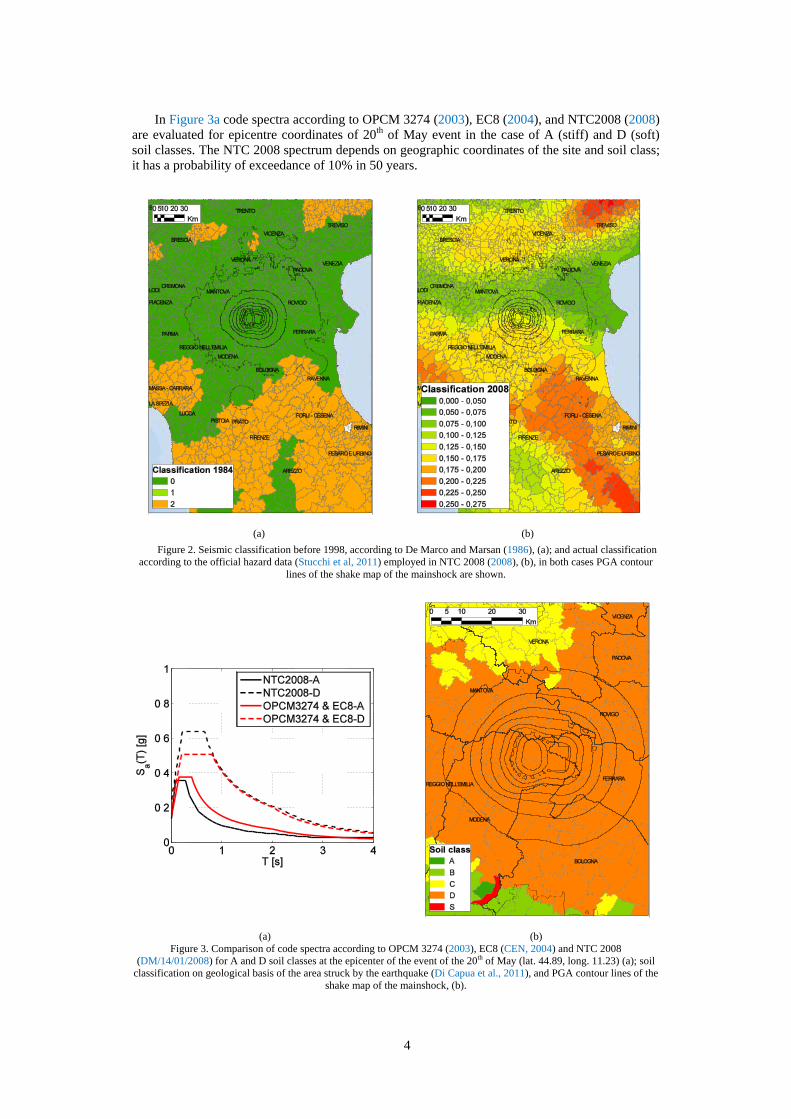
In Figure 3a code spectra according to OPCM 3274 (2003), EC8 (2004), and NTC2008 (2008)
are evaluated for epicentre coordinates of 20th of May event in the case of A (stiff) and D (soft)
soil classes. The NTC 2008 spectrum depends on geographic coordinates of the site and soil class;
it has a probability of exceedance of 10% in 50 years.
(a) (b)
Figure 2. Seismic classification before 1998, according to De Marco and Marsan (1986), (a); and actual classification
according to the official hazard data (Stucchi et al, 2011) employed in NTC 2008 (2008), (b), in both cases PGA contour
lines of the shake map of the mainshock are shown.
(a) (b)
Figure 3. Comparison of code spectra according to OPCM 3274 (2003), EC8 (CEN, 2004) and NTC 2008
(DM/14/01/2008) for A and D soil classes at the epicenter of the event of the 20th of May (lat. 44.89, long. 11.23) (a); soil
classification on geological basis of the area struck by the earthquake (Di Capua et al., 2011), and PGA contour lines of the
shake map of the mainshock, (b).
5
OPCM 3274 and EC8 spectra depends on seismic category and soil class. Soil classes from A
to E are classified according to the value of the average shear wave velocity in the top 30 meters of
soil layers. OPCM 3274, EC8, and NTC 2008 share same soil classification. PGA on A soil class
is equal to 0.138g according to NTC 2008, while it is equal to 0.15g in the case of OPCM and
EC8. Soil amplification factor for D soil type is 1.8 in the case of NTC 2008 and 1.35 in the case
of EC8 (type 1) and OPCM 3274.
Soil class D is the most frequent class in the whole epicentral area, see Figure 3b. Soil
classification was taken from SEE-GeoForm project (Di Capua et al., 2011), which provides an
open source WebGis toolbox giving geological, geomorphologic, geotechnical and geophysics
data nationwide. In the following all spectral based approaches are carried out considering EC8 spectra for D
soil class, see Figure 3a. In fact, the area struck by the earthquake was very large and site-
dependent characteristic of NTC 2008 spectra is not well suited for simplified large-scale
approaches provided in the following.
4. EVENT AND DAMAGE
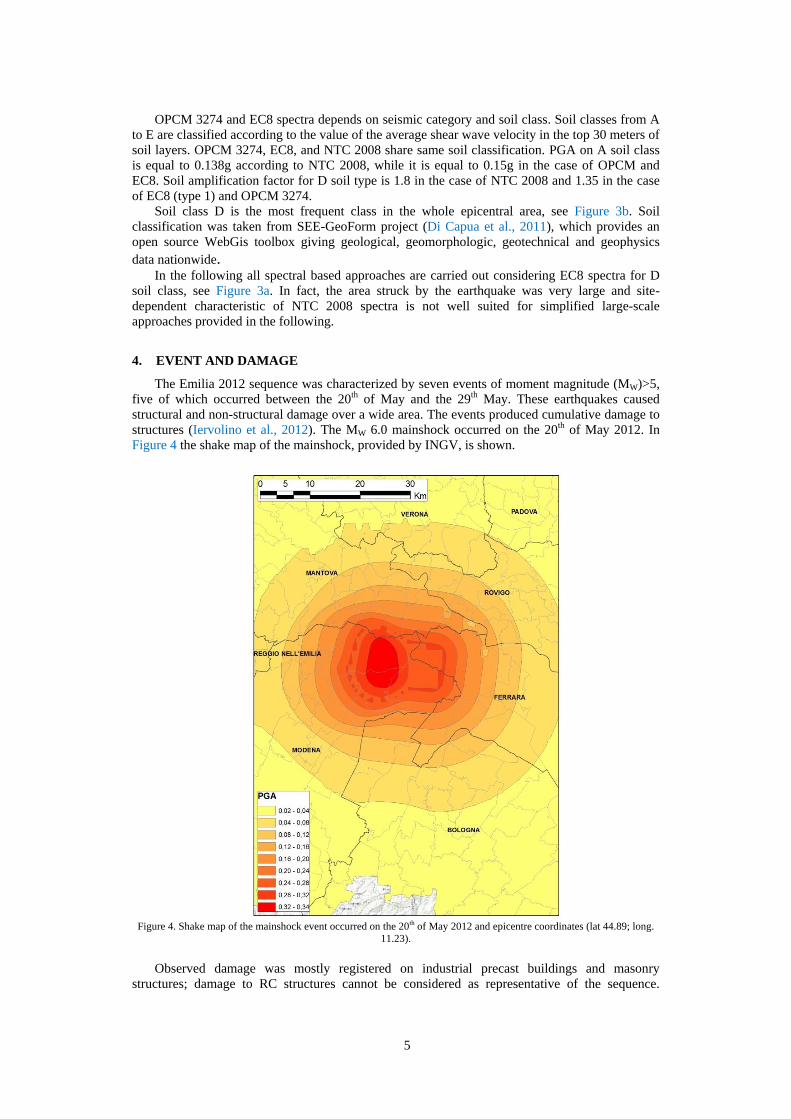
The Emilia 2012 sequence was characterized by seven events of moment magnitude (MW)>5,
five of which occurred between the 20th of May and the 29th May. These earthquakes caused
structural and non-structural damage over a wide area. The events produced cumulative damage to
structures (Iervolino et al., 2012). The MW 6.0 mainshock occurred on the 20th of May 2012. In
Figure 4 the shake map of the mainshock, provided by INGV, is shown.
Figure 4. Shake map of the mainshock event occurred on the 20th of May 2012 and epicentre coordinates (lat 44.89; long.
11.23).
Observed damage was mostly registered on industrial precast buildings and masonry
structures; damage to RC structures cannot be considered as representative of the sequence.
6
According to data collected during field surveys right after the events of the 20th and the 29th of
May (e.g., EPICentre Field Observation Report No. EPI-FO-200512, 2012; EPICentre Field
Observation Report No. EPI-FO-290512, 2012; Parisi et al., 2012; Liberatore et al., 2013), it can
be observed that RC buildings were characterized by slight or moderate damage and, seldom,
structural collapses (EPICentre Field Observation Report No. EPI-FO-290512, 2012) were
observed.
A preliminary analysis of structural typologies and observed damage represents the first step
towards a quantitative study of RC buildings performance during the 2012 Emilia earthquake.
Most of observed damage affected non-structural elements. Rarely structural elements showed
significant damage, and in most cases brittle failures occurred. Most of damage to RC structures
was observed in the area close to the epicentres of the events of the 20th of May and the 29th of
May, close to the towns of Mirandola, Cavezzo, and San Felice sul Panaro. In Figures 5 to 9, an
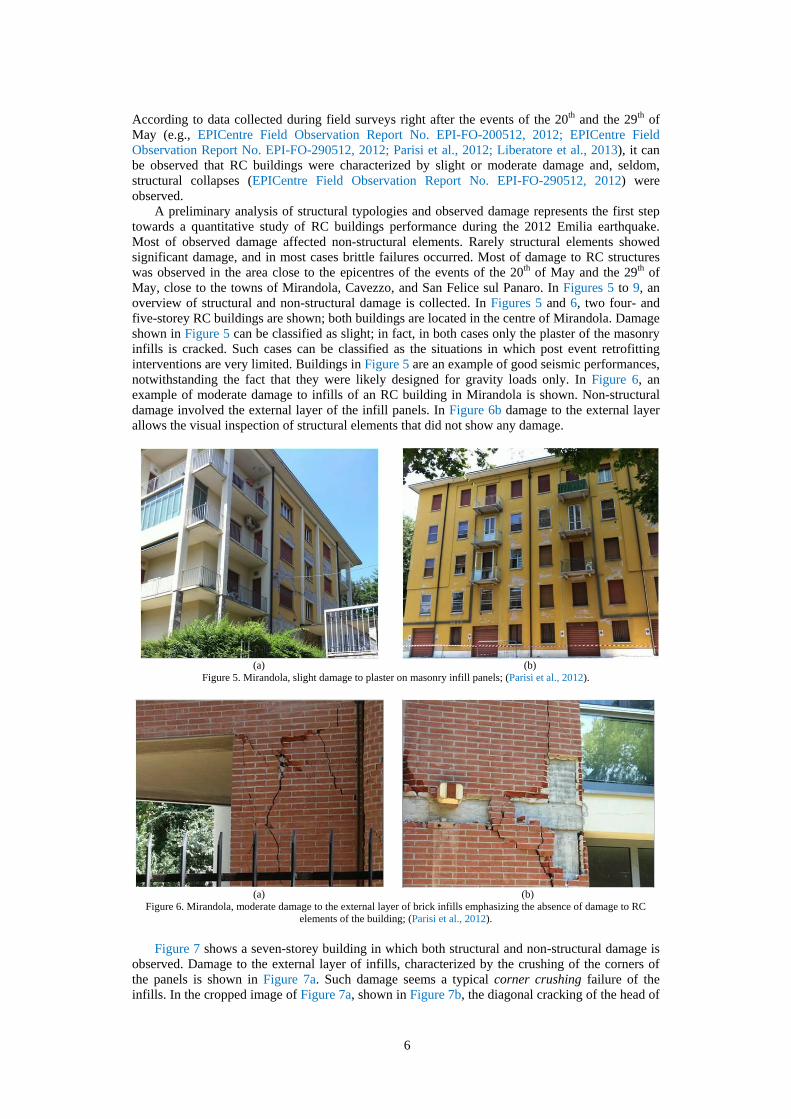
overview of structural and non-structural damage is collected. In Figures 5 and 6, two four- and
five-storey RC buildings are shown; both buildings are located in the centre of Mirandola. Damage
shown in Figure 5 can be classified as slight; in fact, in both cases only the plaster of the masonry
infills is cracked. Such cases can be classified as the situations in which post event retrofitting
interventions are very limited. Buildings in Figure 5 are an example of good seismic performances,
notwithstanding the fact that they were likely designed for gravity loads only. In Figure 6, an
example of moderate damage to infills of an RC building in Mirandola is shown. Non-structural
damage involved the external layer of the infill panels. In Figure 6b damage to the external layer
allows the visual inspection of structural elements that did not show any damage.
(a) (b)
Figure 5. Mirandola, slight damage to plaster on masonry infill panels; (Parisi et al., 2012).
(a) (b)
Figure 6. Mirandola, moderate damage to the external layer of brick infills emphasizing the absence of damage to RC
elements of the building; (Parisi et al., 2012).
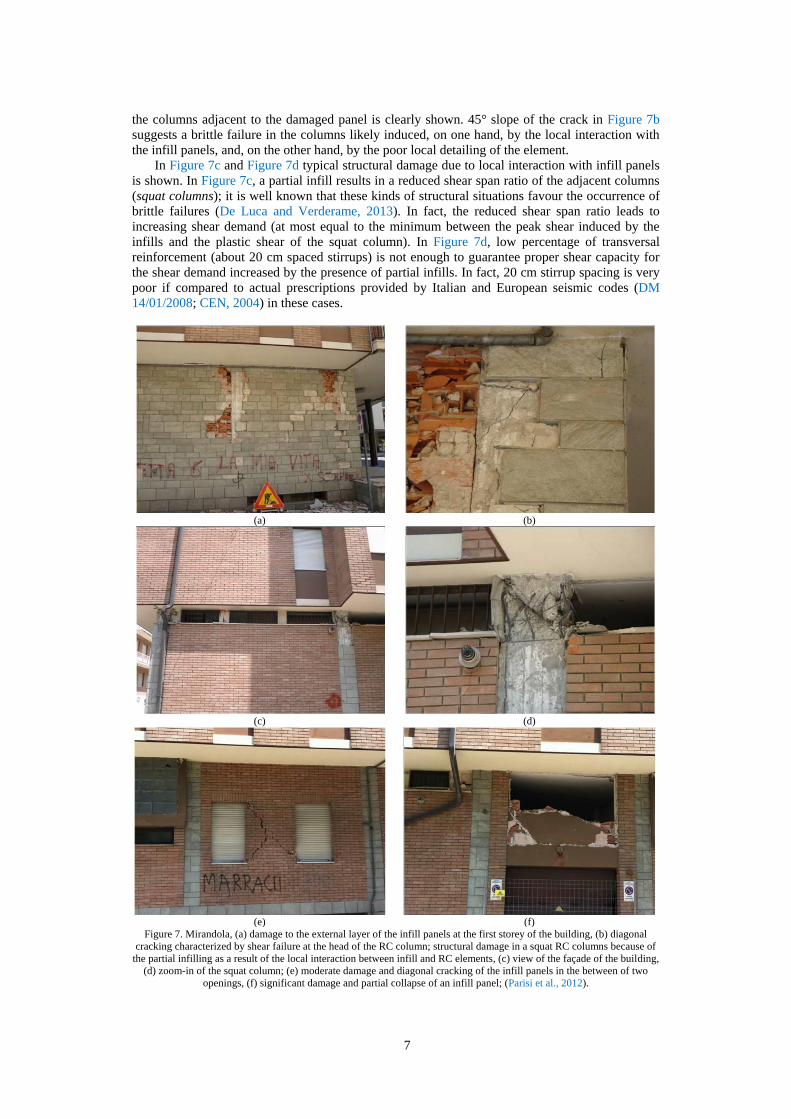
Figure 7 shows a seven-storey building in which both structural and non-structural damage is
observed. Damage to the external layer of infills, characterized by the crushing of the corners of
the panels is shown in Figure 7a. Such damage seems a typical corner crushing failure of the
infills. In the cropped image of Figure 7a, shown in Figure 7b, the diagonal cracking of the head of
7
the columns adjacent to the damaged panel is clearly shown. 45° slope of the crack in Figure 7b
suggests a brittle failure in the columns likely induced, on one hand, by the local interaction with
the infill panels, and, on the other hand, by the poor local detailing of the element.
In Figure 7c and Figure 7d typical structural damage due to local interaction with infill panels
is shown. In Figure 7c, a partial infill results in a reduced shear span ratio of the adjacent columns
(squat columns); it is well known that these kinds of structural situations favour the occurrence of
brittle failures (De Luca and Verderame, 2013). In fact, the reduced shear span ratio leads to
increasing shear demand (at most equal to the minimum between the peak shear induced by the
infills and the plastic shear of the squat column). In Figure 7d, low percentage of transversal
reinforcement (about 20 cm spaced stirrups) is not enough to guarantee proper shear capacity for
the shear demand increased by the presence of partial infills. In fact, 20 cm stirrup spacing is very
poor if compared to actual prescriptions provided by Italian and European seismic codes (DM
14/01/2008; CEN, 2004) in these cases.
(a) (b)
(c) (d)
(e) (f)
Figure 7. Mirandola, (a) damage to the external layer of the infill panels at the first storey of the building, (b) diagonal
cracking characterized by shear failure at the head of the RC column; structural damage in a squat RC columns because of
the partial infilling as a result of the local interaction between infill and RC elements, (c) view of the façade of the building,
(d) zoom-in of the squat column; (e) moderate damage and diagonal cracking of the infill panels in the between of two
openings, (f) significant damage and partial collapse of an infill panel; (Parisi et al., 2012).
8
In Figure 7e and Figure 7f two examples of moderate and significant damage to infill panels
are shown, respectively. In Figure 7e, diagonal cracking of an infill panel between two openings is
shown. Such kind of damage is very similar to the typical failure mode of structural masonry
panels in masonry structures. The situation of a partially collapsed infill in Figure 7f recalls the
typical collapse mechanism of sliding shear, characterized by cracking in the middle of the panel
and consequent out-of-plane failure of the top part of the infill (Shing and Mehrabi, 2002).
The seven-storey building in Mirandola shown in Figure 7 is characterized by significantly
different seismic performances with respect to the buildings in Figure 5 and Figure 6,
characterized by four and five storeys, respectively. The three buildings in Figures 5 to 7 are
located in the same neighbourhood of Mirandola, as it can be seen from data in Parisi et al. (2012).
Hence it can be reasonably assumed that there were no significant differences in local
amplification of seismic action for the buildings, and they were designed and realized according to
the same regulations.
Different performances of the three buildings can be related to different heights (e.g., number
of storeys), and consequently to their different fundamental periods, in analogy with findings of
other vulnerability studies available in literature (e.g., Giovinazzi and Lagomarino, 2006; Borzi et
al., 2008; Ricci, 2010). On the other hand, the latter observation, based on three buildings, is not
enough to represent a general trend.
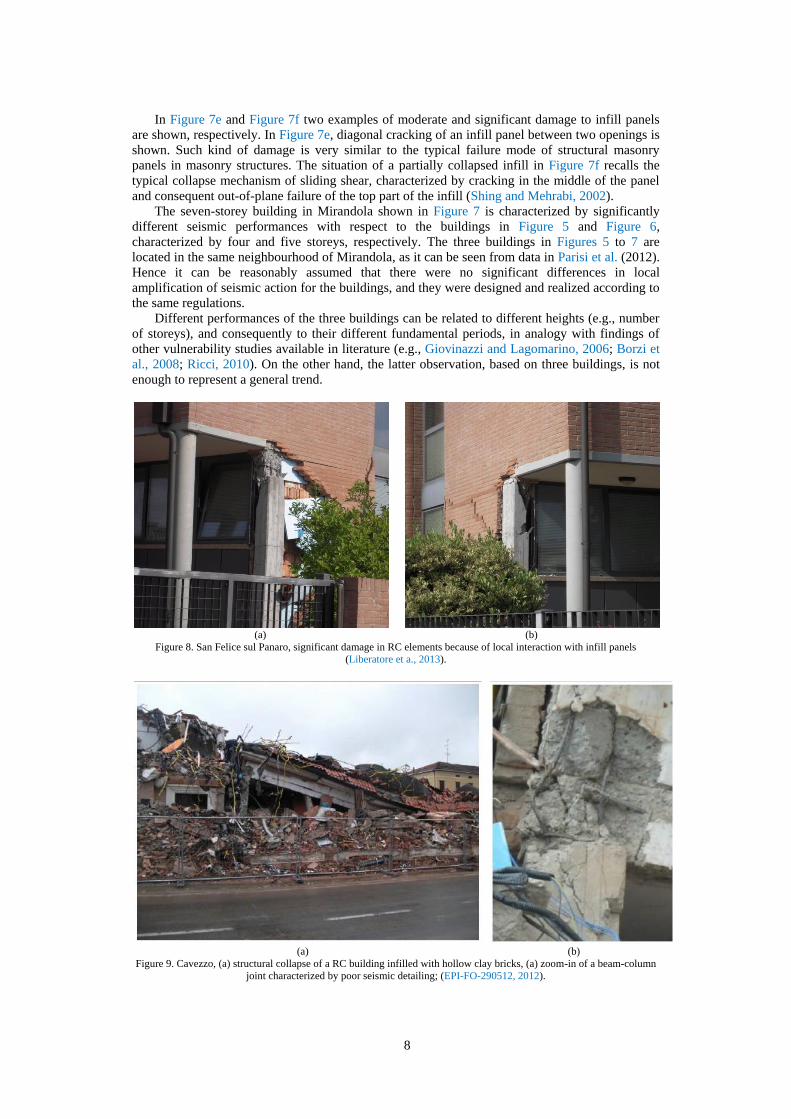
(a) (b)
Figure 8. San Felice sul Panaro, significant damage in RC elements because of local interaction with infill panels
(Liberatore et a., 2013).
(a) (b)
Figure 9. Cavezzo, (a) structural collapse of a RC building infilled with hollow clay bricks, (a) zoom-in of a beam-column
joint characterized by poor seismic detailing; (EPI-FO-290512, 2012).
9
Figure 8 shows the first storey of a three-storey building in San Felice sul Panaro
characterized by an irregular distribution of the infill panels in height and plan (Liberatore et al.
2013). Views of the structure in Figures 8a and 8b suggests a collapse mode induced by the local
interaction between infills and RC elements. Such kind of collapse, as it was already emphasized
by Liberatore et al. (2013), is similar to damage observed after the 2009 L’Aquila earthquake (e.g.,
Verderame et al. 2011). The local interaction between infills and structural elements has increased
the shear demand and, at the same time, poor seismic detailing of transversal reinforcement has
contributed to an inadequate capacity against brittle failures, in both cases of conventional shear
failures and sliding shear failures in the RC elements.
Finally, Figure 9 shows one of the very few examples of structural collapses that involved RC
frame buildings after the 2012 Emilia sequence (EPI-FO-290512 2012). Even if the state of the
building (see Figure 9a) does not allow any inference on the likely causes of the collapse, the
detail, in Figure 9b, emphasizes absence of stirrups in the beam-column joints.
5. CODE BASED SEISMIC ASSESSMENT
Information collected in Section 2 and 3 allow a characterization of building stock in terms of
number of storeys and design approach. A preliminary code-based seismic assessment is carried
out through this information. The procedure provided herein is based on a spectral based approach
similar to that employed in HAZUS (NIBS, 1997, 1999, 2002).
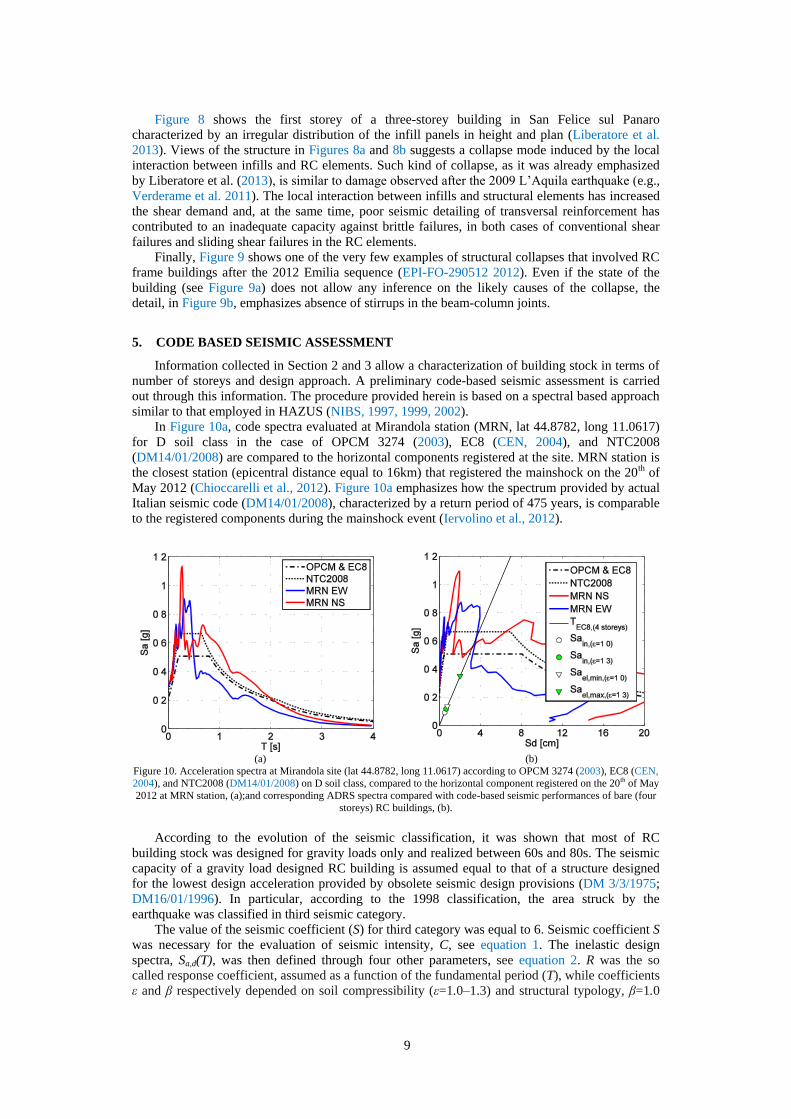
In Figure 10a, code spectra evaluated at Mirandola station (MRN, lat 44.8782, long 11.0617)
for D soil class in the case of OPCM 3274 (2003), EC8 (CEN, 2004), and NTC2008
(DM14/01/2008) are compared to the horizontal components registered at the site. MRN station is
the closest station (epicentral distance equal to 16km) that registered the mainshock on the 20th of
May 2012 (Chioccarelli et al., 2012). Figure 10a emphasizes how the spectrum provided by actual
Italian seismic code (DM14/01/2008), characterized by a return period of 475 years, is comparable
to the registered components during the mainshock event (Iervolino et al., 2012).
(a) (b)
Figure 10. Acceleration spectra at Mirandola site (lat 44.8782, long 11.0617) according to OPCM 3274 (2003), EC8 (CEN,
2004), and NTC2008 (DM14/01/2008) on D soil class, compared to the horizontal component registered on the 20th of May
2012 at MRN station, (a);and corresponding ADRS spectra compared with code-based seismic performances of bare (four
storeys) RC buildings, (b).
According to the evolution of the seismic classification, it was shown that most of RC
building stock was designed for gravity loads only and realized between 60s and 80s. The seismic
capacity of a gravity load designed RC building is assumed equal to that of a structure designed
for the lowest design acceleration provided by obsolete seismic design provisions (DM 3/3/1975;
DM16/01/1996). In particular, according to the 1998 classification, the area struck by the
earthquake was classified in third seismic category.
The value of the seismic coefficient (S) for third category was equal to 6. Seismic coefficient S
was necessary for the evaluation of seismic intensity, C, see equation 1. The inelastic design
spectra, Sa,d(T), was then defined through four other parameters, see equation 2. R was the so
called response coefficient, assumed as a function of the fundamental period (T), while coefficients
ε and β respectively depended on soil compressibility (ε=1.0–1.3) and structural typology, β=1.0
10
for moment resisting frame (MRF), and β=1.2 for shear wall (SW) structures. Finally, I was the
importance factor of the building according to its category of use, see Ricci et al. (2011a) for
further details.
2 100 6 2 100 0 04 C S . (1)
2 3
1 0 0 8
0 862 0 8
a ,d
R . for T . sS T g C R I
R . T for T . s (2)
According to equations 1 and 2, it can be assumed, for low-mid rise (see Figure 1c) RC MRF
buildings, a fundamental period lower than 0.8s and, consequently, R=1.0, =1.0 and I=1.0.
Considering that soil class D is dominant in the area, factor should be considered equal to 1.3.
On the other hand, it is not sure that compressibility of the soil was properly considered at the age
of construction. Hence, in the following, both the cases of equal to 1.0 and 1.3 are going to be
considered. In the case of =1.0, Sd(T) is equal to 0.04g, while for =1.3, Sd(T) is equal to 0.052g.
On the other hand, once in 1996 limit state design was firstly introduced in Italy as an alternative
to allowable working stress approach (Coignet and De Tedesco, 1894; Park and Paulay, 1975) as a
possible design alternative, the spectral acceleration was characterized by 50% amplification.
Finally, in the case of limit state design, the seismic capacity for low-medium rise building can be
assumed equal to 0.06g and 0.078g, for =1.0 and =1.3, respectively.
It should be noted that in every design procedure (in both cases of allowable working stress
and limit state approaches) design material strengths are derived from characteristic strengths,
while building performance in the assessment framework should be evaluated considering mean
strength. In particular, the ratio between mean and design strength values represents an
overstrength contribution to the minimum inelastic acceleration capacity of existing buildings.
According to previous studies available in literature (e.g., Borzi and Elnashai, 2000; Galasso et al.,
2011), the so called material overstrength factor can be assumed equal to 1.50, finally leading to
the evaluation of the inelastic acceleration capacity (Sa,in). In the case of low-medium rise
buildings designed in the Emilia region Sa,in can be assumed equal to 0.09g (=0.06g×1.50) and
0.117g(=0.078g×1.50).
Assuming the extreme values of the behaviour factor range suggested by the Italian seismic
regulation for existing buildings (Circolare 617, 02/02//2009), respectively equal to 1.50 and 3.00,
it is possible to obtain the minimum and the maximum elastic spectral acceleration capacities
(Sael,min; Sael,max) according to a code-based framework, multiplying the inelastic acceleration and
the behaviour factor. For the specific Sain considered above, and equal to 0.09g and 0.117g,
Sael,min,(=1.0)=0.135g and Sael,max,(=1.0)=0.27g, while for =1.3, Sael,min,( =1.3)=0.175g and Sael,max,(
=1.3)=0.35g, respectively.
In Figure 10b, the inelastic spectral acceleration values and lower and upper bounds of elastic
acceleration values (Sael,min,(=1.0) and Sael,max,( =1.3)) are represented in the acceleration displacement
response spectra (ADRS) format along the slope characterizing the fundamental period (TEC8) of
four-storey buildings. TEC8 is evaluated according to Eurocode 8 formulation and equal to 0.48s;
the interstorey height (3.0m) and the number of storeys (4) have been selected considering
frequent characteristics of RC buildings in the area of Mirandola. Sael,min,(=1.0) and Sael,max,( =1.3) are
compared with code ADRS for EC8, OPCM, and NTC2008. Finally, Sael,min,(=1.0) and Sael,max,( =1.3)
are compared to the ADRS of the two horizontal components registered at MRN station on the 20th
of May. Comparisons in Figure 10b emphasize that code based seismic performances are strictly
lower than registered demand and that evaluated according to codes.
Notwithstanding the fact that code-based approaches still represent a lower boundary for
seismic capacity, observed damage, shown in the above section, suggest that such performance
estimation for bare structures is very conservative and it cannot be considered a benchmark for the
comparison with data from field surveys (excluding the occurrence of brittle failures). In fact, a
code-based assessment cannot account for masonry infill structural contribution (Gómez-Martínez
et al., 2012; Ricci et al. 2013).
11
6. DAMAGE ASSESSMENT OF INFILLED RC BUILDINGS
A simplified damage assessment procedure for infilled RC MRF buildings is described,
accounting for the presence of infills. FAST vulnerability approach allows a preliminary damage
assessment thanks to:
(i) a simplified evaluation of a capacity curve of an infilled RC building (Gómez-
Martínez et al., 2012);
(ii) an approximate mechanical interpretation of Damage States according to EMS-98
scale (Grunthal, 1998);
(iii) evaluation of seismic capacity through an intensity measure (elastic spectral
acceleration or PGA) defining the IN2 curve (Dolšek and Fajfar, 2005) corresponding
to the capacity curve defined in (i).
FAST approach is a rapid large-scale assessment method (Verderame et al., 2012a; Gómez-
Martínez et al., 2012; De Luca et al., 2013a). The application of such methodology asks for very
basic information and data on the building stock of the area to be studied: number of storeys, age
of construction, design code (e.g., according to the evolution of the seismic classification), typical
structural and nonstructural material properties at the time of construction (e.g., Verderame et al.,
2001; Verderame et al, 2012b; Circolare 617, 02/02//2009). FAST approach has been validated
through detailed damage assessment, showing a fair agreement with observed damage data
(Verderame et al., 2012a).
6.1 Simplified evaluation of capacity curve of infilled RC buildings
It is well known that structural contribution of infills provides an increase in lateral strength
and stiffness of the building (resulting in a decrease in fundamental period), but also leads to a
global strength degradation after the attainment of the maximum resistance, given their brittle
behavior (see Figure 11a). The structural behavior described above is mainly representative of
uniformly infilled existing buildings (Dolšek and Fajfar, 2001, Ricci et al. 2013).
The simplified capacity curve of a uniformly infilled RC MRF building can be represented by a
quadrilinear backbone (Dolšek and Fajfar, 2005) characterized by an initial elastic plastic
backbone (with the plateau at the maximum base shear strength Vmax), followed by a softening
branch up to the minimum base shear strength (Vmin). According to FAST approach, the simplified
capacity curve has a softening branch characterized by a drop, (see the dashed line in Figure 11b).
The latter is an additional simplifying hypothesis with respect to the idealized backbone provided
by Dolšek and Fajfar (2005), and represents the limit situation in which softening slope is infinite
(significant brittle behavior of infills). Even if more accurate piecewise linear approximations of
the capacity curve are available in literature (De Luca et al. 2013b), Dolšek and Fajfar’s
quadrilinear idealization is made for the R--T relationship that is going to be employed; so it is
well suited for the framework of this study (see section 6.2).
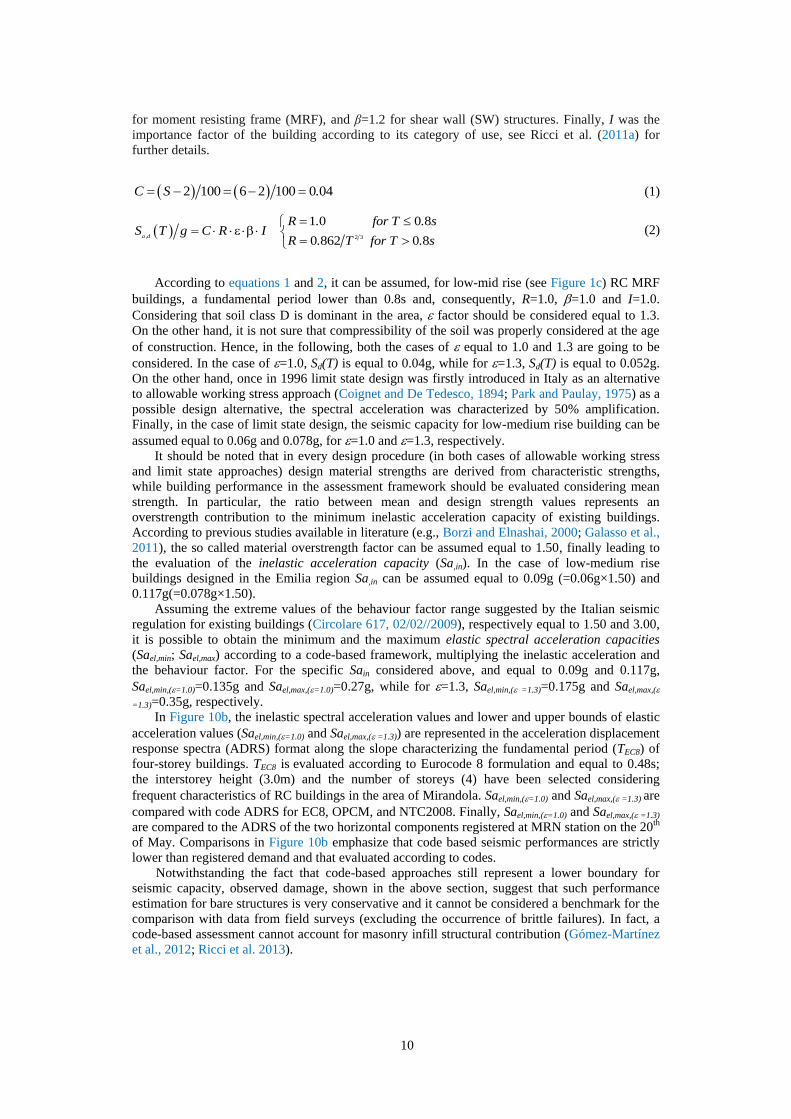
Figure 11 shows the ideal steps of FAST approach leading to the definition of the capacity
curve in ADRS format (see Figure 11c). In Figure 11a, the typical shape of a pushover curve on
infilled RC structures is shown with a qualitative example of the contribution provided by infills
and RC frames. The idealized capacity curve is shown in Figure 11b and 11c, respectively in base
shear-top displacement format and ADRS format.
(a) (b) (c)
Figure 11. Example of infilled RC frame pushover curve (a), its quadrilinear idealization in base shear-displacement format
(V-) in which the dashed line indicates the approximation introduced in FAST approach (b), the capacity curve in the
ADRS format (c).
12
The simplified capacity curve of infilled RC structures asks for the definition of four
characteristic parameters. According to the representation in Figure 11c, the capacity curve in
ADRS format can be defined through the definition of four parameters:
Cs,max, the inelastic acceleration of the equivalent single degree of freedom (SDOF) at the
attainment of the maximum strength Vmax;
Cs,min, the inelastic acceleration of the equivalent SDOF at the attainment of the plastic
mechanism of the RC structure (all the infills of the storeys involved in the mechanism
have attained their residual strength max,inf
V );
s, the available ductility up to the beginning of the degradation of the infills;
T, the equivalent elastic period computed from the fundamental period To of the infilled RC
building.
Equations 3 and 4 show the formulations assumed for the definition of the first two
parameters. The value of s was assumed equal to 2.5. This assumption was made through the
comparison of detailed assessment studies available in literature on gravity load designed
buildings (Ricci, 2010; Verderame et al., 2012a).
1 1 1 1 1 1
y max,inf y max inf max inf b max infmax
s ,max s s
b
V V V A AVC C C
m m m ( N m A ) N m (3)
1 1 1 1 1 1
y max,inf y max inf max inf b max infmin
s ,min s s
b
V V V A AVC C C
m m m ( N m A ) N m (4)
where:
Vmax,inf is the maximum base shear provided by the infills, see Figure 11a;
Vmin is the base shear at the attainment of the plastic mechanism of the RC structure, see
Figure 11a;
1 is the first mode participation factor;
m1 is the mass of the equivalent SDOF (the generalized mass corresponding to the first
vibration mode);
N is the number of storeys;
m is the average mass of each storey normalized by the building area (e.g., equal to 0.8t/m2
for residential buildings);
is a coefficient for the evaluation of the first mode participant mass respect to the total
mass of the multiple degree of freedom, MDOF, equal to 0.85 for buildings with more
than three storeys (CEN, 2004);
max is the maximum shear stress of the infills according to Fardis (1997);
inf is the ratio between the infill area (evaluated along one of the principal directions of the
building) and the building area Ab;
are coefficients that account, respectively, for RC elements’ strength contribution at the
attainment of Vmax,inf and for the residual strength contribution of the infills at the
attainment of the plastic mechanism of the RC structure, see Figure 11a.
Equations 3 and 4 are evaluated in the hypothesis of the attainment of a soft storey plastic
mechanism of the structures at the first storey. In fact, in the case of existing buildings (not
capacity designed), column-sway storey collapse mechanisms are likely to occur, especially if
infills are present, due to their relatively high strength contribution compared with RC structural
elements. In particular, for uniformly infilled RC buildings, the strength contribution of infill
elements leads to an approximately uniform distribution of storey shear strength along the height
of the building; thus, damage is concentrated at the first storey, where the shear demand is higher
(Dolce et al., 2005). The subsequent drop in strength, caused by the brittle nature of infills, finally
leads to the development of a soft storey ductile mechanism, with a residual strength mainly
provided by RC columns at ground level.
The last parameter to be evaluated for the definition of the capacity curve is the equivalent
elastic period T, defined in analogy with the original approach by Dolšek and Fajfar (2005). The
first branch of the curve (Figure 11b) represents both the initial elastic and the post-cracking
13
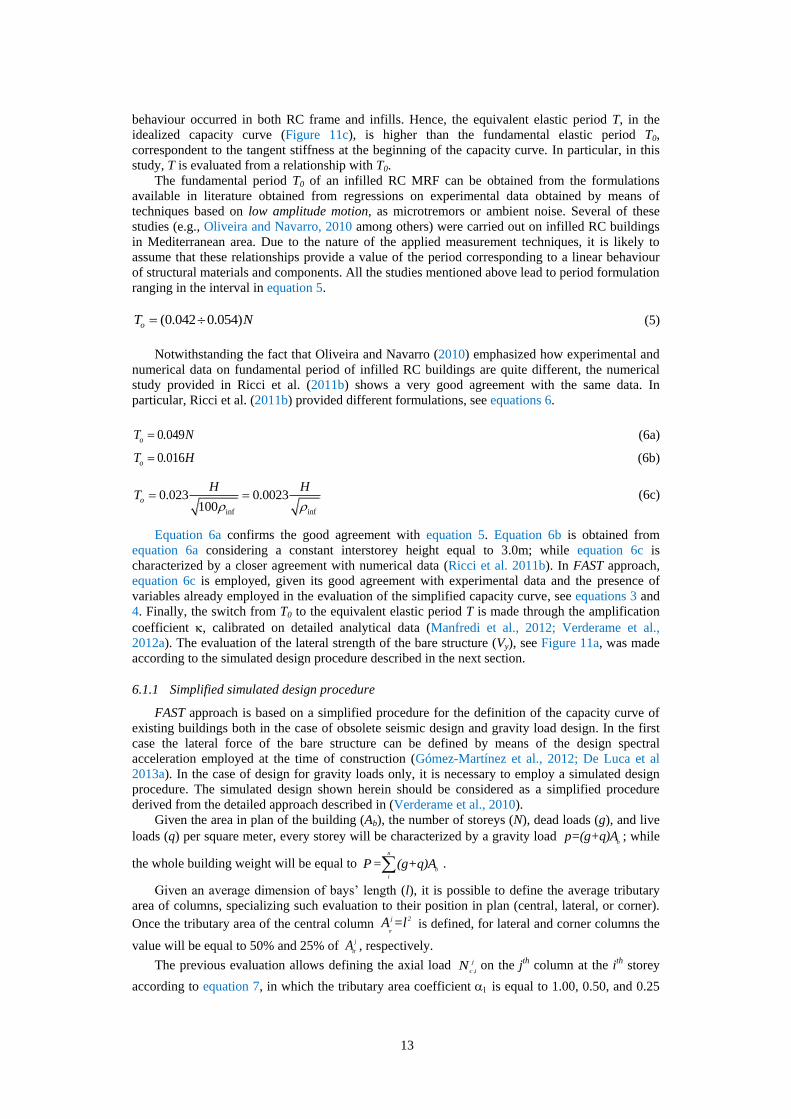
behaviour occurred in both RC frame and infills. Hence, the equivalent elastic period T, in the
idealized capacity curve (Figure 11c), is higher than the fundamental elastic period T0,
correspondent to the tangent stiffness at the beginning of the capacity curve. In particular, in this
study, T is evaluated from a relationship with T0.
The fundamental period T0 of an infilled RC MRF can be obtained from the formulations
available in literature obtained from regressions on experimental data obtained by means of
techniques based on low amplitude motion, as microtremors or ambient noise. Several of these
studies (e.g., Oliveira and Navarro, 2010 among others) were carried out on infilled RC buildings
in Mediterranean area. Due to the nature of the applied measurement techniques, it is likely to
assume that these relationships provide a value of the period corresponding to a linear behaviour
of structural materials and components. All the studies mentioned above lead to period formulation
ranging in the interval in equation 5.
(0.042 0.054)oT N (5)
Notwithstanding the fact that Oliveira and Navarro (2010) emphasized how experimental and
numerical data on fundamental period of infilled RC buildings are quite different, the numerical
study provided in Ricci et al. (2011b) shows a very good agreement with the same data. In
particular, Ricci et al. (2011b) provided different formulations, see equations 6.
0 049oT . N (6a)
0 016oT . H (6b)
inf inf
0.023 0.0023100
o
H HT
(6c)
Equation 6a confirms the good agreement with equation 5. Equation 6b is obtained from
equation 6a considering a constant interstorey height equal to 3.0m; while equation 6c is
characterized by a closer agreement with numerical data (Ricci et al. 2011b). In FAST approach,
equation 6c is employed, given its good agreement with experimental data and the presence of
variables already employed in the evaluation of the simplified capacity curve, see equations 3 and
4. Finally, the switch from T0 to the equivalent elastic period T is made through the amplification
coefficient , calibrated on detailed analytical data (Manfredi et al., 2012; Verderame et al.,
2012a). The evaluation of the lateral strength of the bare structure (Vy), see Figure 11a, was made
according to the simulated design procedure described in the next section.
6.1.1 Simplified simulated design procedure
FAST approach is based on a simplified procedure for the definition of the capacity curve of
existing buildings both in the case of obsolete seismic design and gravity load design. In the first
case the lateral force of the bare structure can be defined by means of the design spectral
acceleration employed at the time of construction (Gómez-Martínez et al., 2012; De Luca et al
2013a). In the case of design for gravity loads only, it is necessary to employ a simulated design
procedure. The simulated design shown herein should be considered as a simplified procedure
derived from the detailed approach described in (Verderame et al., 2010).
Given the area in plan of the building (Ab), the number of storeys (N), dead loads (g), and live
loads (q) per square meter, every storey will be characterized by a gravity load b
p=(g+q)A ; while
the whole building weight will be equal to n
b
i
P= (g+q)A .
Given an average dimension of bays’ length (l), it is possible to define the average tributary
area of columns, specializing such evaluation to their position in plan (central, lateral, or corner).
Once the tributary area of the central column tr
j 2A =l is defined, for lateral and corner columns the
value will be equal to 50% and 25% of j
trA , respectively.
The previous evaluation allows defining the axial load j
c ,iN on the jth column at the ith storey
according to equation 7, in which the tributary area coefficient is equal to 1.00, 0.50, and 0.25
14
in the case of central, lateral, and corner columns, respectively. The section area of the columns, j
c ,iA , (making the simplified hypothesis of square sections, with width and height equal to a) can be
evaluated as a function of the concrete allowable stress c
as shown in equation 8.
2
1 1tr
n n
j j
c ,i
i i
N ( g q ) A ( g q ) l (7)
2
1
2 c ,i
n
j
j i
c ,i
c c
( g q ) lNA a
(8)
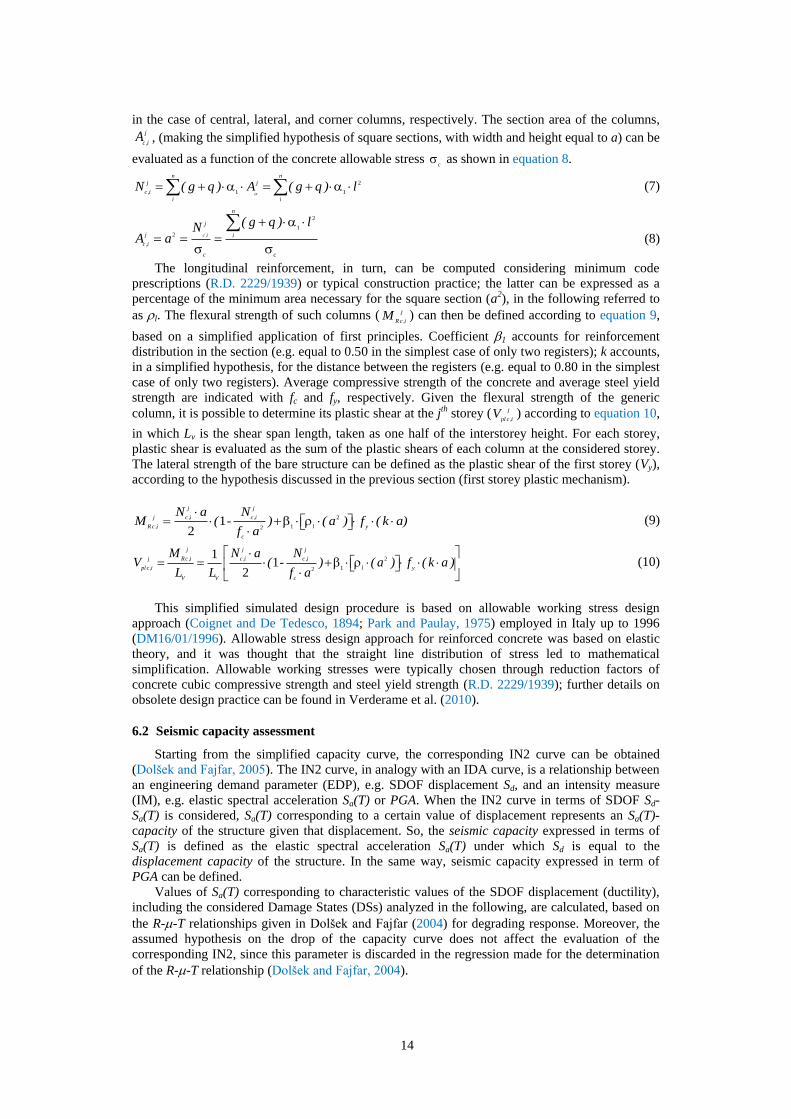
The longitudinal reinforcement, in turn, can be computed considering minimum code
prescriptions (R.D. 2229/1939) or typical construction practice; the latter can be expressed as a
percentage of the minimum area necessary for the square section (a2), in the following referred to
as l. The flexural strength of such columns ( j
Rc ,iM ) can then be defined according to equation 9,
based on a simplified application of first principles. Coefficient 1 accounts for reinforcement
distribution in the section (e.g. equal to 0.50 in the simplest case of only two registers); k accounts,
in a simplified hypothesis, for the distance between the registers (e.g. equal to 0.80 in the simplest
case of only two registers). Average compressive strength of the concrete and average steel yield
strength are indicated with fc and fy, respectively. Given the flexural strength of the generic
column, it is possible to determine its plastic shear at the jth storey ( j
pl c ,iV ) according to equation 10,
in which Lv is the shear span length, taken as one half of the interstorey height. For each storey,
plastic shear is evaluated as the sum of the plastic shears of each column at the considered storey.
The lateral strength of the bare structure can be defined as the plastic shear of the first storey (Vy),
according to the hypothesis discussed in the previous section (first storey plastic mechanism).
2
121
2
j j
c ,i c ,ij
Rc ,i l y
c
N a NM ( - ) ( a ) f ( k a)
f a
(9)
2
12
11
2
j j j
Rc ,i c ,i c ,ij
pl c ,i l y
V V c
M N a NV ( - ) ( a ) f ( k a )
L L f a (10)
This simplified simulated design procedure is based on allowable working stress design
approach (Coignet and De Tedesco, 1894; Park and Paulay, 1975) employed in Italy up to 1996
(DM16/01/1996). Allowable stress design approach for reinforced concrete was based on elastic
theory, and it was thought that the straight line distribution of stress led to mathematical
simplification. Allowable working stresses were typically chosen through reduction factors of
concrete cubic compressive strength and steel yield strength (R.D. 2229/1939); further details on
obsolete design practice can be found in Verderame et al. (2010).
6.2 Seismic capacity assessment
Starting from the simplified capacity curve, the corresponding IN2 curve can be obtained
(Dolšek and Fajfar, 2005). The IN2 curve, in analogy with an IDA curve, is a relationship between
an engineering demand parameter (EDP), e.g. SDOF displacement Sd, and an intensity measure
(IM), e.g. elastic spectral acceleration Sa(T) or PGA. When the IN2 curve in terms of SDOF Sd-
Sa(T) is considered, Sa(T) corresponding to a certain value of displacement represents an Sa(T)-
capacity of the structure given that displacement. So, the seismic capacity expressed in terms of
Sa(T) is defined as the elastic spectral acceleration Sa(T) under which Sd is equal to the
displacement capacity of the structure. In the same way, seismic capacity expressed in term of
PGA can be defined.
Values of Sa(T) corresponding to characteristic values of the SDOF displacement (ductility),
including the considered Damage States (DSs) analyzed in the following, are calculated, based on
the R--T relationships given in Dolšek and Fajfar (2004) for degrading response. Moreover, the
assumed hypothesis on the drop of the capacity curve does not affect the evaluation of the
corresponding IN2, since this parameter is discarded in the regression made for the determination
of the R--T relationship (Dolšek and Fajfar, 2004).
15
The evaluation of the SDOF displacement corresponding to a specified DS level (Sd|DSi) can be
made as function of the interstorey drift ratio (IDR) at which the specific DS is attained. In fact,
once the IDR|DSi is computed, the roof displacement ∆|DSi of the MDOF can be defined through the
evaluation of the deformed shape. SDOF displacement Sd|DSi is obtained from roof displacement
∆|DSi through the first mode participation factor1 evaluated in a simplified manner according to
the tabulated values of the so called coefficient C0 (equivalent to 1) in (ASCE/SEI 41-06, 2007).
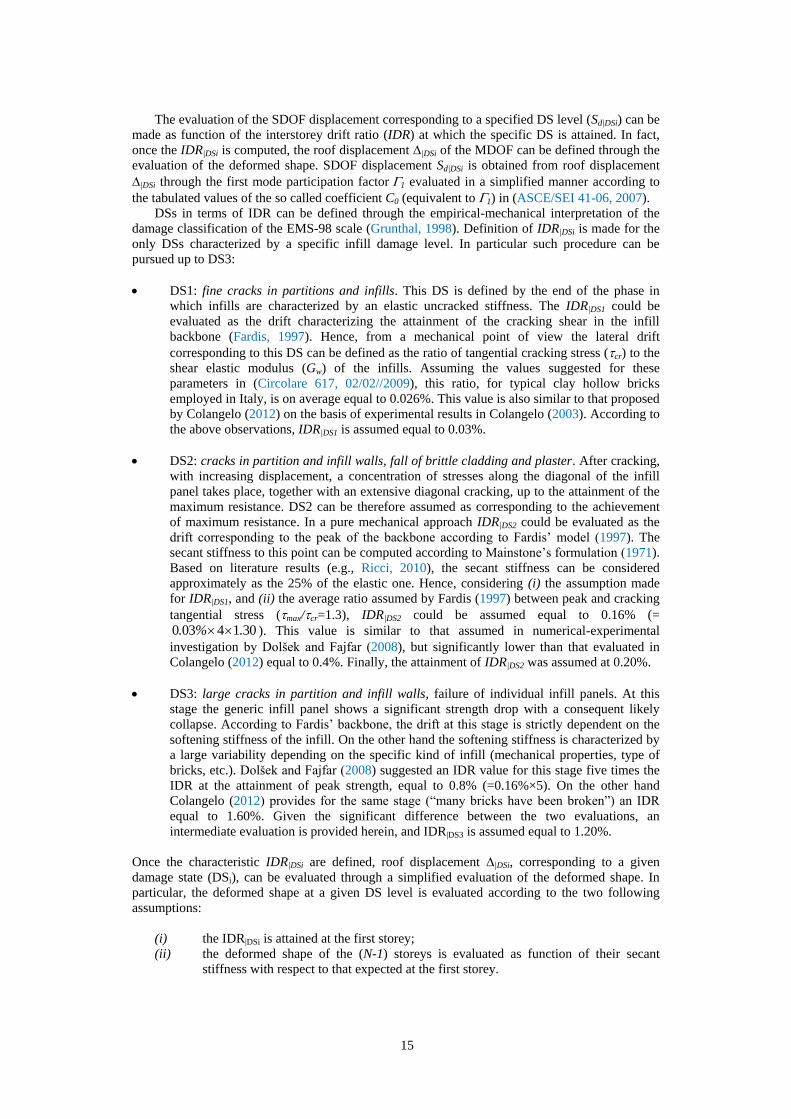
DSs in terms of IDR can be defined through the empirical-mechanical interpretation of the
damage classification of the EMS-98 scale (Grunthal, 1998). Definition of IDR|DSi is made for the
only DSs characterized by a specific infill damage level. In particular such procedure can be
pursued up to DS3:
DS1: fine cracks in partitions and infills. This DS is defined by the end of the phase in
which infills are characterized by an elastic uncracked stiffness. The IDR|DS1 could be
evaluated as the drift characterizing the attainment of the cracking shear in the infill
backbone (Fardis, 1997). Hence, from a mechanical point of view the lateral drift
corresponding to this DS can be defined as the ratio of tangential cracking stress (cr) to the
shear elastic modulus (Gw) of the infills. Assuming the values suggested for these
parameters in (Circolare 617, 02/02//2009), this ratio, for typical clay hollow bricks
employed in Italy, is on average equal to 0.026%. This value is also similar to that proposed
by Colangelo (2012) on the basis of experimental results in Colangelo (2003). According to
the above observations, IDR|DS1 is assumed equal to 0.03%.
DS2: cracks in partition and infill walls, fall of brittle cladding and plaster. After cracking,
with increasing displacement, a concentration of stresses along the diagonal of the infill
panel takes place, together with an extensive diagonal cracking, up to the attainment of the
maximum resistance. DS2 can be therefore assumed as corresponding to the achievement
of maximum resistance. In a pure mechanical approach IDR|DS2 could be evaluated as the
drift corresponding to the peak of the backbone according to Fardis’ model (1997). The
secant stiffness to this point can be computed according to Mainstone’s formulation (1971).
Based on literature results (e.g., Ricci, 2010), the secant stiffness can be considered
approximately as the 25% of the elastic one. Hence, considering (i) the assumption made
for IDR|DS1, and (ii) the average ratio assumed by Fardis (1997) between peak and cracking
tangential stress (max/cr=1.3), IDR|DS2 could be assumed equal to 0.16% (=
0 03 4 1 30. % . ). This value is similar to that assumed in numerical-experimental
investigation by Dolšek and Fajfar (2008), but significantly lower than that evaluated in
Colangelo (2012) equal to 0.4%. Finally, the attainment of IDR|DS2 was assumed at 0.20%.
DS3: large cracks in partition and infill walls, failure of individual infill panels. At this
stage the generic infill panel shows a significant strength drop with a consequent likely
collapse. According to Fardis’ backbone, the drift at this stage is strictly dependent on the
softening stiffness of the infill. On the other hand the softening stiffness is characterized by
a large variability depending on the specific kind of infill (mechanical properties, type of
bricks, etc.). Dolšek and Fajfar (2008) suggested an IDR value for this stage five times the
IDR at the attainment of peak strength, equal to 0.8% (=0.16%×5). On the other hand
Colangelo (2012) provides for the same stage (“many bricks have been broken”) an IDR
equal to 1.60%. Given the significant difference between the two evaluations, an
intermediate evaluation is provided herein, and IDR|DS3 is assumed equal to 1.20%.
Once the characteristic IDR|DSi are defined, roof displacement ∆|DSi, corresponding to a given
damage state (DSi), can be evaluated through a simplified evaluation of the deformed shape. In
particular, the deformed shape at a given DS level is evaluated according to the two following
assumptions:
(i) the IDR|DSi is attained at the first storey;
(ii) the deformed shape of the (N-1) storeys is evaluated as function of their secant
stiffness with respect to that expected at the first storey.
16
Finally, roof displacement ∆|DSi is divided by the first mode participation factor1 (ASCE/SEI
41-06, 2007), obtaining SDOF displacement Sd|DSi.
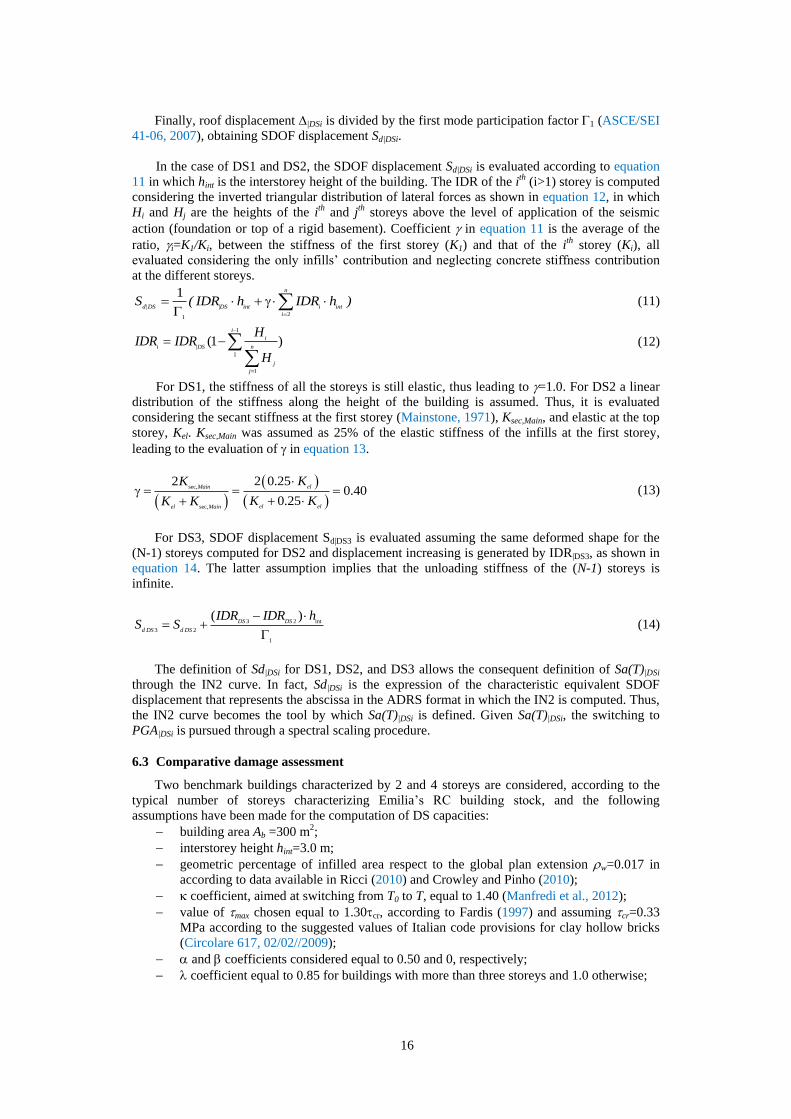
In the case of DS1 and DS2, the SDOF displacement Sd|DSi is evaluated according to equation
11 in which hint is the interstorey height of the building. The IDR of the ith (i>1) storey is computed
considering the inverted triangular distribution of lateral forces as shown in equation 12, in which
Hi and Hj are the heights of the ith and jth storeys above the level of application of the seismic
action (foundation or top of a rigid basement). Coefficient in equation 11 is the average of the
ratio, i=K1/Ki, between the stiffness of the first storey (K1) and that of the ith storey (Ki), all
evaluated considering the only infills’ contribution and neglecting concrete stiffness contribution
at the different storeys.
21
1
n
d|DS |DS int i int
i
S ( IDR h IDR h ) (11)
1
|
1
1
(1 )
i
i
ni DS
j
j
HIDR IDR
H
(12)
For DS1, the stiffness of all the storeys is still elastic, thus leading to =1.0. For DS2 a linear
distribution of the stiffness along the height of the building is assumed. Thus, it is evaluated
considering the secant stiffness at the first storey (Mainstone, 1971), Ksec,Main, and elastic at the top
storey, Kel. Ksec,Main was assumed as 25% of the elastic stiffness of the infills at the first storey,
leading to the evaluation of in equation 13.
sec,
sec,
2 0.2520.40
0.25
elMain
el elel Main
KK
K KK K
(13)
For DS3, SDOF displacement Sd|DS3 is evaluated assuming the same deformed shape for the
(N-1) storeys computed for DS2 and displacement increasing is generated by IDR|DS3, as shown in
equation 14. The latter assumption implies that the unloading stiffness of the (N-1) storeys is
infinite.
3 2 int
3 2
1
( )
DS DS
d DS d DS
IDR IDR hS S (14)
The definition of Sd|DSi for DS1, DS2, and DS3 allows the consequent definition of Sa(T)|DSi
through the IN2 curve. In fact, Sd|DSi is the expression of the characteristic equivalent SDOF
displacement that represents the abscissa in the ADRS format in which the IN2 is computed. Thus,
the IN2 curve becomes the tool by which Sa(T)|DSi is defined. Given Sa(T)|DSi, the switching to
PGA|DSi is pursued through a spectral scaling procedure.
6.3 Comparative damage assessment
Two benchmark buildings characterized by 2 and 4 storeys are considered, according to the
typical number of storeys characterizing Emilia’s RC building stock, and the following
assumptions have been made for the computation of DS capacities:
building area Ab =300 m2;
interstorey height hint=3.0 m;
geometric percentage of infilled area respect to the global plan extension w=0.017 in
according to data available in Ricci (2010) and Crowley and Pinho (2010);
coefficient, aimed at switching from T0 to T, equal to 1.40 (Manfredi et al., 2012);
value of max chosen equal to 1.30cr, according to Fardis (1997) and assuming cr=0.33
MPa according to the suggested values of Italian code provisions for clay hollow bricks
(Circolare 617, 02/02//2009);
and coefficients considered equal to 0.50 and 0, respectively;
coefficient equal to 0.85 for buildings with more than three storeys and 1.0 otherwise;
17
average storey mass normalized by the building area m assumed equal to 0.8 t/m2 (for
residential buildings).
Moreover, for the evaluation of the plastic shear strength of the first storey (Vy), further
assumptions have been considered: bays’ length l =4.50m; average concrete compressive strength
fc= 25 MPa (Verderame et al. 2001); average steel yield strength fy= 370 MPa (Verderame et al.
2012b), and concrete allowable stress c=5 MPa.
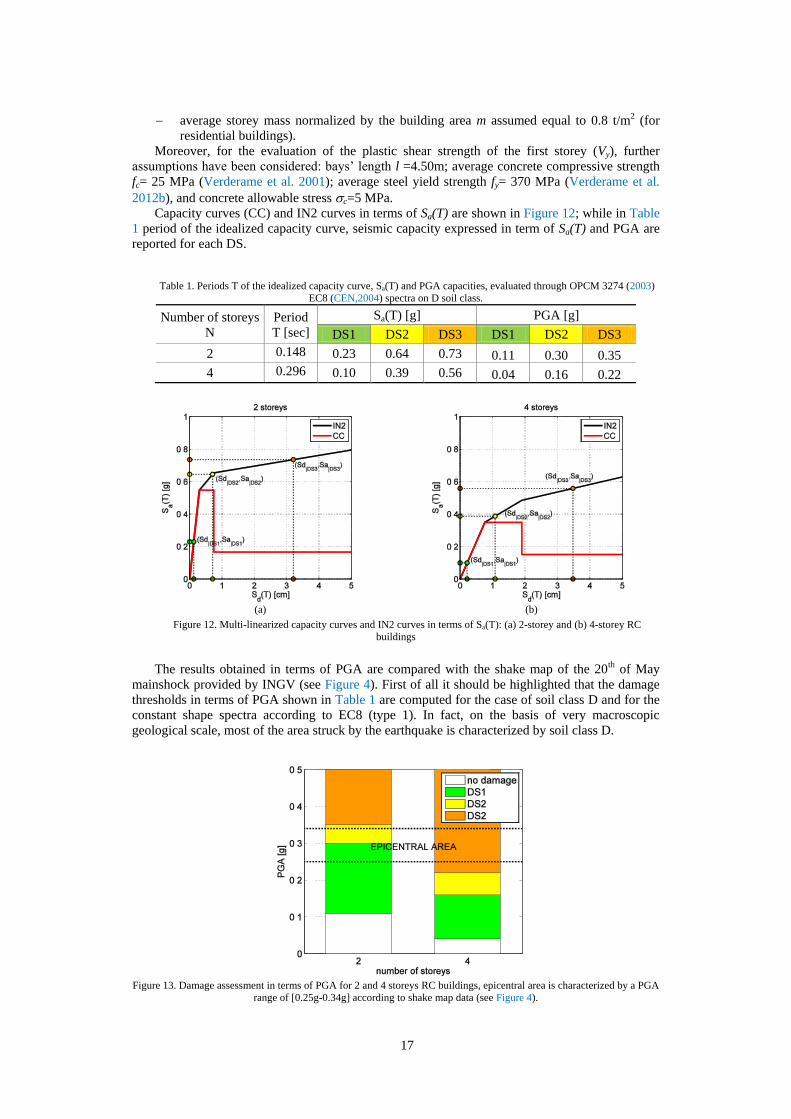
Capacity curves (CC) and IN2 curves in terms of Sa(T) are shown in Figure 12; while in Table
1 period of the idealized capacity curve, seismic capacity expressed in term of Sa(T) and PGA are
reported for each DS.
Table 1. Periods T of the idealized capacity curve, Sa(T) and PGA capacities, evaluated through OPCM 3274 (2003)
EC8 (CEN,2004) spectra on D soil class.
Number of storeys
N
Period
T [sec]
Sa(T) [g] PGA [g]
DS1 DS2 DS3 DS1 DS2 DS3
2 0.148 0.23 0.64 0.73 0.11 0.30 0.35
4 0.296 0.10 0.39 0.56 0.04 0.16 0.22
(a) (b)
Figure 12. Multi-linearized capacity curves and IN2 curves in terms of Sa(T): (a) 2-storey and (b) 4-storey RC
buildings
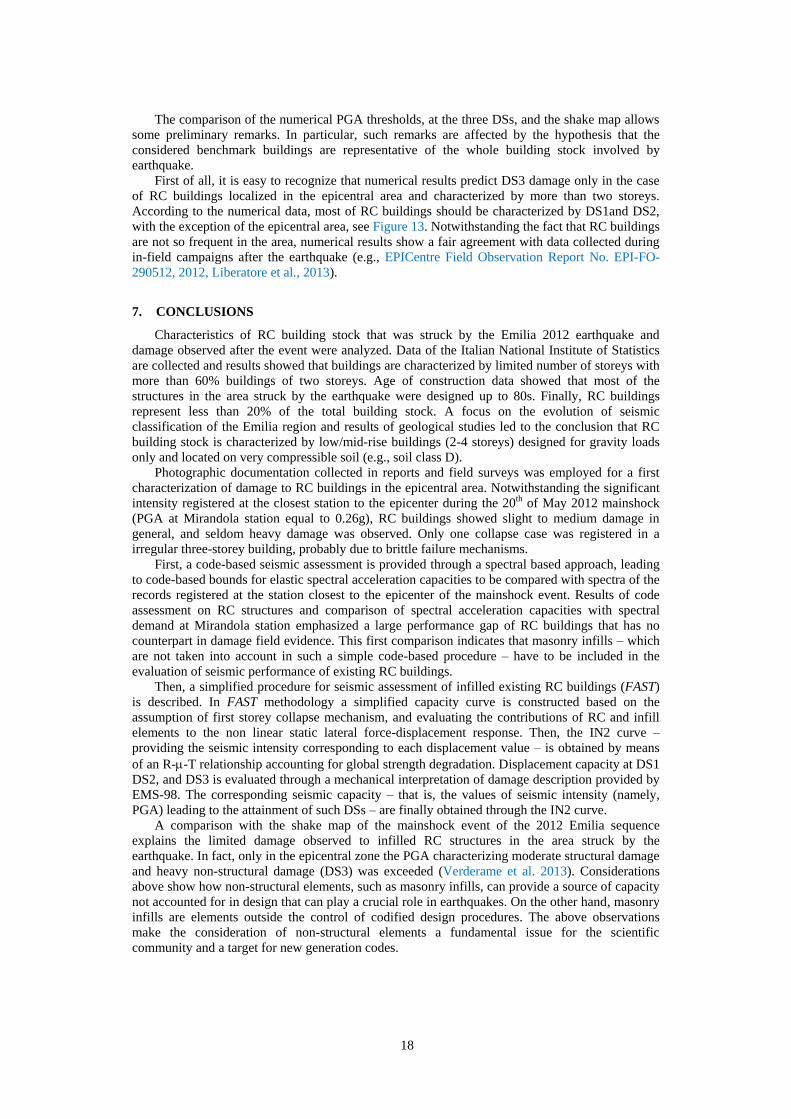
The results obtained in terms of PGA are compared with the shake map of the 20th of May
mainshock provided by INGV (see Figure 4). First of all it should be highlighted that the damage
thresholds in terms of PGA shown in Table 1 are computed for the case of soil class D and for the
constant shape spectra according to EC8 (type 1). In fact, on the basis of very macroscopic
geological scale, most of the area struck by the earthquake is characterized by soil class D.
Figure 13. Damage assessment in terms of PGA for 2 and 4 storeys RC buildings, epicentral area is characterized by a PGA
range of [0.25g-0.34g] according to shake map data (see Figure 4).
18
The comparison of the numerical PGA thresholds, at the three DSs, and the shake map allows
some preliminary remarks. In particular, such remarks are affected by the hypothesis that the
considered benchmark buildings are representative of the whole building stock involved by
earthquake.
First of all, it is easy to recognize that numerical results predict DS3 damage only in the case
of RC buildings localized in the epicentral area and characterized by more than two storeys.
According to the numerical data, most of RC buildings should be characterized by DS1and DS2,
with the exception of the epicentral area, see Figure 13. Notwithstanding the fact that RC buildings
are not so frequent in the area, numerical results show a fair agreement with data collected during
in-field campaigns after the earthquake (e.g., EPICentre Field Observation Report No. EPI-FO-
290512, 2012, Liberatore et al., 2013).
7. CONCLUSIONS
Characteristics of RC building stock that was struck by the Emilia 2012 earthquake and
damage observed after the event were analyzed. Data of the Italian National Institute of Statistics
are collected and results showed that buildings are characterized by limited number of storeys with
more than 60% buildings of two storeys. Age of construction data showed that most of the
structures in the area struck by the earthquake were designed up to 80s. Finally, RC buildings
represent less than 20% of the total building stock. A focus on the evolution of seismic
classification of the Emilia region and results of geological studies led to the conclusion that RC
building stock is characterized by low/mid-rise buildings (2-4 storeys) designed for gravity loads
only and located on very compressible soil (e.g., soil class D).
Photographic documentation collected in reports and field surveys was employed for a first
characterization of damage to RC buildings in the epicentral area. Notwithstanding the significant
intensity registered at the closest station to the epicenter during the 20th of May 2012 mainshock
(PGA at Mirandola station equal to 0.26g), RC buildings showed slight to medium damage in
general, and seldom heavy damage was observed. Only one collapse case was registered in a
irregular three-storey building, probably due to brittle failure mechanisms.
First, a code-based seismic assessment is provided through a spectral based approach, leading
to code-based bounds for elastic spectral acceleration capacities to be compared with spectra of the
records registered at the station closest to the epicenter of the mainshock event. Results of code
assessment on RC structures and comparison of spectral acceleration capacities with spectral
demand at Mirandola station emphasized a large performance gap of RC buildings that has no
counterpart in damage field evidence. This first comparison indicates that masonry infills – which
are not taken into account in such a simple code-based procedure – have to be included in the
evaluation of seismic performance of existing RC buildings.
Then, a simplified procedure for seismic assessment of infilled existing RC buildings (FAST)
is described. In FAST methodology a simplified capacity curve is constructed based on the
assumption of first storey collapse mechanism, and evaluating the contributions of RC and infill
elements to the non linear static lateral force-displacement response. Then, the IN2 curve –
providing the seismic intensity corresponding to each displacement value – is obtained by means
of an R--T relationship accounting for global strength degradation. Displacement capacity at DS1
DS2, and DS3 is evaluated through a mechanical interpretation of damage description provided by
EMS-98. The corresponding seismic capacity – that is, the values of seismic intensity (namely,
PGA) leading to the attainment of such DSs – are finally obtained through the IN2 curve.
A comparison with the shake map of the mainshock event of the 2012 Emilia sequence
explains the limited damage observed to infilled RC structures in the area struck by the
earthquake. In fact, only in the epicentral zone the PGA characterizing moderate structural damage
and heavy non-structural damage (DS3) was exceeded (Verderame et al. 2013). Considerations
above show how non-structural elements, such as masonry infills, can provide a source of capacity
not accounted for in design that can play a crucial role in earthquakes. On the other hand, masonry
infills are elements outside the control of codified design procedures. The above observations
make the consideration of non-structural elements a fundamental issue for the scientific
community and a target for new generation codes.
19
ACKNOWLEDGEMENTS
The work presented has been developed in cooperation with Rete dei Laboratori Universitari di Ingegneria
Sismica—ReLUIS—Linea 1.1.2. for the research program funded by the Dipartimento della Protezione Civile
(2010–2013). The authors also thank the two anonymous reviewers for their helpful reviews of the
manuscript.
REFERENCES
Achs G and Adam C (2012) Rapid seismic evaluation of historic brick-masonry buildings in Vienna (Austria) based on
visual screening. Bulletin of Earthquake Engineering, 10:1833-1856
American Society of Civil Engineers (ASCE), Seismic Rehabilitation of Existing Buildings, ASCE/SEI 41-06, Reston,
Virginia, 2007.
Borzi B., Crowley H., Pinho R. (2008) The Influence of Infill Panels on Vulnerability Curves for RC Buildings, Proceeding
of 14th World Conference on Earthquake Engineering, Bejing 2008
Borzi B., Elnashai A. (2000). Refined force reduction factor for seismic design. Engineering Structures 22:1244-1260.
CEN, 2004. European Standard EN1998-1:2004. Eurocode 8: Design of structures for earthquake resistance. Part 1: general
rules, seismic actions and rules for buildings. Comité Européen de Normalisation, Brussels.
Chioccarelli E, De Luca F, Iervolino I. (2012), Preliminary study of Emilia (May 20th 2012) earthquake ground motion
records V2.11, available at http://www.reluis.it.
Circolare del Ministero dei Lavori Pubblici n. 617 del 2/2/2009 (2009) Istruzioni per l’applicazione delle “Nuove norme
tecniche per le costruzioni” di cui al D.M. 14 gennaio 2008. G.U. n. 47 del 26/2/2009 (in Italian).
Coignet, E., and de Tedesco, N. (1894). Du calcul des ouvrages en ciment avec ossature métallique. Bullettin de la Société
des Ingénieurs Civils de France, I, 39–41 (in French).
Colangelo, F. (2003). Experimental evaluation of member-by-member models and damage indices for infilled frames.
Journal of Earthquake Engineering 7(1):25-50.
Colangelo F. (2012). A simple model to include fuzziness in the seismic fragility curve and relevant effect compared with
randomness. Earthquake Engineering and Structural Dynamics, 41, 969-986.
Decreto Ministeriale n. 40 del 3/3/1975 (1975) Approvazione delle norme tecniche per le costruzioni in zone
sismiche. G.U. n. 93 dell’8/4/1975 (in Italian).
Decreto Ministeriale del 16/1/1996 (1996) Norme tecniche per le costruzioni in zone sismiche. Gazzetta Ufficiale della
Repubblica Italiana, 29 del 5/2/1996 (in Italian).
Decreto Ministeriale del 14/1/2008. Approvazione delle nuove norme tecniche per le costruzioni. G.U. n. 29 del 4/2/2008,
(in Italian).
De Luca F. and Verderame G.M. (2013). A practice-oriented approach for the assessment of brittle failures in existing RC
elements, Engineering Structures, 48:373-388.
De Luca F., Verderame G.M., Gómez-Martínez F., Pérez-García A. (2013a). The structural role played by masonry infills
on RC building performances after the 2011 Lorca, Spain, earthquake, Bulletin of Earthquake Engineering, DOI
10.1007/s10518-013-9500-1
De Luca F, Vamvatsikos D, Iervolino I (2013b) Near-optimal piecewise linear fits of static pushover capacity curves for
equivalent SDOF analysis. Earthquake Engineering and Structural Dynamics 42(4):523–543
De Marco R., Marsan P. (Eds.). (1986). Atlante della classificazione sismica del territorio nazionale, Servizio Sismico del
Consiglio Superiore dei Lavori Pubblici, Istituto Poligrafico e Zecca dello Stato Italiano, Roma.
Di Capua G., Peppoloni S., Amanti M., Cipolloni C., Conte G., Avola D., Del Buono A., Negri Arnoldi C., Borgomeo E.,
(2011). Il Progetto SEE-GeoForm: uno strumento per la consultazione di dati geologici e di pericolosità sismica riferiti
all’intero territorio nazionale. XIV Convegno di Ingegneria Sismica (ANIDIS), Bari 18-22 Settembre 2011. (in Italian)
Dolce M., Cardone D., Ponzo F.C., Valente C., (2005). Shaking table tests on reinforced concrete frames without and with
passive control systems. Earthquake Engineering and Structural Dynamics, 34:1687-1717.
Dolšek, M., Fajfar, P. (2001). Soft storey effects in uniformly infilled reinforced concrete frames. Journal of Earthquake
Engineering 5(1):1-12.
Dolšek, M., Fajfar, P. (2004). Inelastic spectra for infilled reinforced concrete frames. Earthquake Engineering and
Structural Dynamics, 33(15):1395-1416.
Dolšek, M., Fajfar, P. (2005). Simplified non-linear seismic analysis of infilled reinforced concrete frames. Earthquake
engineering and Structural Dynamics 34:49-66.
Dolšek, M., Fajfar, P. (2008). The effect of masonry infills on the seismic response of a four storey reinforced concrete
frame—a probabilistic assessment. Engineering Structures 30(11):3186-3192.
EPICentre Field Observation Report No. EPI-FO-200512 (2012), The 20th May 2012 EmiliaRomagna Earthquake,
[available at http://www.ucl.ac.uk/~ucestor/research-earthquake/EPICentre_Report_EPI-FO-200512-v2.pdf ].
20
EPICentre Field Observation Report No. EPI-FO-290512 (2012), The 29th May 2012 EmiliaRomagna Earthquake,
[available at http://www.ucl.ac.uk/~ucestor/research-earthquake/EPICentre_Report_EPI-FO-290512.pdf].
Erdik M., Durukal E., Siyahi B., Fahjan Y., Sesetyan K., Demircioglu M., Akman H., (2004). Earthquake risk mitigation in
Istanbul. Chapter 7. IN: Mulargia F. And Geller R.J. Editors, Earthquake science and seismic risk reduction. Kluwer.
Fardis, M.N. (1997). Experimental and numerical investigations on the seismic response of RC infilled frames and
recommendations for code provisions. Report ECOEST-PREC8 No. 6. Prenormative research in support of Eurocode 8.
Galasso C., Cosenza E., Maddaloni G. (2011). Statistical analysis of reinforcing steel properties for seismic design of RC
structures. Proceedings of the 14th European Conference on Earthquake Engineering, August 30-September 3, Ohrid,
Republic of Macedonia.
Giovinazzi S., Lagomarsino S., (2006). Macroseismic and mechanical models for the vulnerability and damage assessment
of current buildings. Bulletin of Earthquake Engineering, 4:415-443.
Gómez-Martínez F., Pérez-García A., De Luca F., Verderame G.M., Manfredi G (2012). Preliminary study of the structural
role played by masonry infills on RC building performances after the 2011 Lorca, Spain, earthquake. 15 World
Conference on Earthquake Engineering, 24-28 September, Lisbon, Portugal, 2012 (n° 5090).
Goretti A. and Di Pasquale G., (2006). Technical emergency management. In: Oliveira C.S., Roca A., and Goula X.
Editors; Assessing and managing earthquake risk, Springer, chapter 16.
Grünthal, G. ed. 1998. ‘European Macroseismic Scale 1998 (EMS–98)’, Cahiers du Centre Européen de Géodynamique et
de Séismologie 15, Helfent-Betrange (Luxembourg).
Iervolino I., De Luca F., Chioccarelli E. (2012) Engineering seismic demand in the 2012 Emilia sequence: preliminary
analysis and model compatibility assessment. Annals of Geophysics, 55(4):639-645.
Kircher C.A., Nassar A.A:, Kutsu O., Holmes W.T., (1997). Development of building damage functions for earthquake loss
estimation. Earthquake Spectra, 13(4):663-681.
Lai C, Foti S, Rota M. (2009). Input sismico e stabilità geotecnica dei siti in costruzione. IUSS Press, Pavia, Italy.
Liberatore L., Sorrentino L., Liberatore D., Decanini L.D. (2013) Performance of reinforced concrete residential buildings
during the Emilia (Italy) 2012 Earthquakes. SE-50EEE International Conference on Earthquake Engineering, 29-31
May 2013, Skopje, Macedonia. Paper 409.
Mainstone R.J. (1971). On the stiffnesses and strengths of infilled frames. Proceedings of the Institution of Civil
Engineering, Supplement IV, 57-90.
Manfredi G., Ricci P., Verderame G.M. (2012), Influence of Infill Panels and Their Distribution on Seismic Behavior of
Existing Reinforced Concrete Buildings, The Open Construction and Building Technology Journal, 2012, 6, (Suppl 1-
M1).
NIBS, National Institute of Building Science (1997, 1999, 2002). Earthquake loss estimation methodology. HAZUS.
Technical manuals. Federal Emergency Management Agency (FEMA) Washington, Vol. 1, 2, 3.
(http://www.fema.gov/hazus/).
Oliveira CS, Navarro M., (2010) Fundamental periods of vibration of RC buildings in Portugal from in-situ experimental
and numerical techniques. Bulletin of Earthquake Engineering, 8(3):609–42.
Ordinanza del Presidente del Consiglio dei Ministri n. 3274 del 20/3/2003 (2003) Primi elementi in materia di criteri
generali per la classificazione sismica del territorio nazionale e di normative tecniche per le costruzioni in zona
sismica. G.U. n. 105 dell’8/5/2003 (in Italian).
Parisi F., De Luca F., Petruzzelli F., De Risi R., Chioccarelli E., Iervolino I. (2012) Field inspection after the May 20th and
29th 2012 Emilia-Romagna earthquakes, available at http://www.reluis.it.
Park R, Paulay T. (1975). Reinforced Concrete Structures. Wiley: New York.
Regio Decreto Legge n. 2229 del 16/11/1939. Norme per la esecuzione delle opere in conglomerate cementizio semplice od
armato. G.U. n. 92 del 18/04/1940. (in Italian)
Ricci, P. (2010). Seismic vulnerability of existing RC buildings. Ph.D. Thesis. University of Naples Federico II, Naples,
Italy.
Ricci, P., De Luca, F., Verderame, G.M. (2011a). 6th April 2009 L’Aquila earthquake, Italy: reinforced concrete building
performance. Bulletin of Earthquake Engineering 9(1):285-305.
Ricci, P., Verderame G.M., Manfredi G., (2011b). Analytical investigation of elastic period of infilled RC MRF buildings,
Engineering Structures 33(2):308-319.
Ricci, P., De Risi M.T., Verderame G.M., Manfredi G., (2013), Influence of infill distribution and design typology on
seismic performance of low- and mid-rise RC buildings. Bulletin of Earthquake Engineering DOI 10.1007/s10518-
013-9453-4.
Shing, P. B. and Mehrabi A. B. (2002) “Behaviour and analysis of masonry-infilled frames”, Progress in Structural
Engineering and Materials; 4:320–331.
Stucchi M, Meletti C, Montaldo V, Crowley H, Calvi GM, Boschi E. (2011). Seismic Hazard Assessment (2003-2009) for
the Italian Building Code, Bulletin of the Seismological Society of America 2011; 101(4):1885-1911.
Tertulliani A et al (2011) An application of EMS98 in a medium-sized city: the case of L'Aquila (Central Italy) after the
April 6, 2009 Mw 6.3 earthquake. Bulletin of Earthquake Engineering 9:67-80

21
Verderame GM, Stella A., Cosenza E. (2001). Le proprietà meccaniche degli acciai impiegati nelle strutture in c.a.
realizzate negli anni 60’. X Convegno nazionale “L’Ingegneria Sismica in Italia”, Potenza-Matera, 9-13 September.
Verderame G.M., Polese M., Mariniello C., Manfredi G. (2010). A simulated design procedure for the assessment of
seismic capacity of existing reinforced concrete buildings, Advances in Engineering Software, 41:323–335.
Verderame G.M., De Luca F., Ricci P., Manfredi G. (2011) Preliminary analysis of a soft-storey mechanism after the 2009
L’Aquila earthquake. Earthquake Engineering and Structural Dynamics, 40(8):925-944.
Verderame G.M., De Luca F., De Risi M.T., Del Gaudio C., Ricci (2012a) P., A three level vulnerability approach for
damage assessment of infilled RC buildings: The Emilia 2012 case (V 1.0), available at http://www.reluis.it/.
Verderame, G.M., Ricci, P., Esposito, M., Manfredi, G. (2012b). STIL v1.0 – Software per la caratterizzazione delle
proprietà meccaniche degli acciai da c.a. tra il 1950 e il 2000, available at http://www.reluis.it/.
Verderame G.M., Ricci P., De Luca F., Del Gaudio C., De Risi M.T. (2013), Seismic response of RC buildings during the
2012 Emilia (Italy) sequence. Soil Dynamics and Earthquake Engineering (under review).