Embed Size (px)
Citation preview

MANAGING THE CPI AND PPI PROCESSES UNDER ISO 9000
Instituto Nacional de Estadística y Geografía
México
May 2014
Outline
Introduction
Quality management system
Process approach
Documental structure
Continual improvement
Analysis tools
Quality policy
Introduction
According to the provisions of article 59, subparagraph III, of the law on the national system of statistical and geographic information (LSNIEG), published in the official journal of the Federation on 16 April 2008, INEGI is exclusive to develop the national consumer and producer prices indexes. This attribution entered into force on July 15, 2011. The Bank of Mexico certified the process of generation of price indices. The INEGI, continued with the certification of the process of generation of price indices and added to the quality management system, the process for the generation of purchasing power parities prices studies, sponsored by OECD.
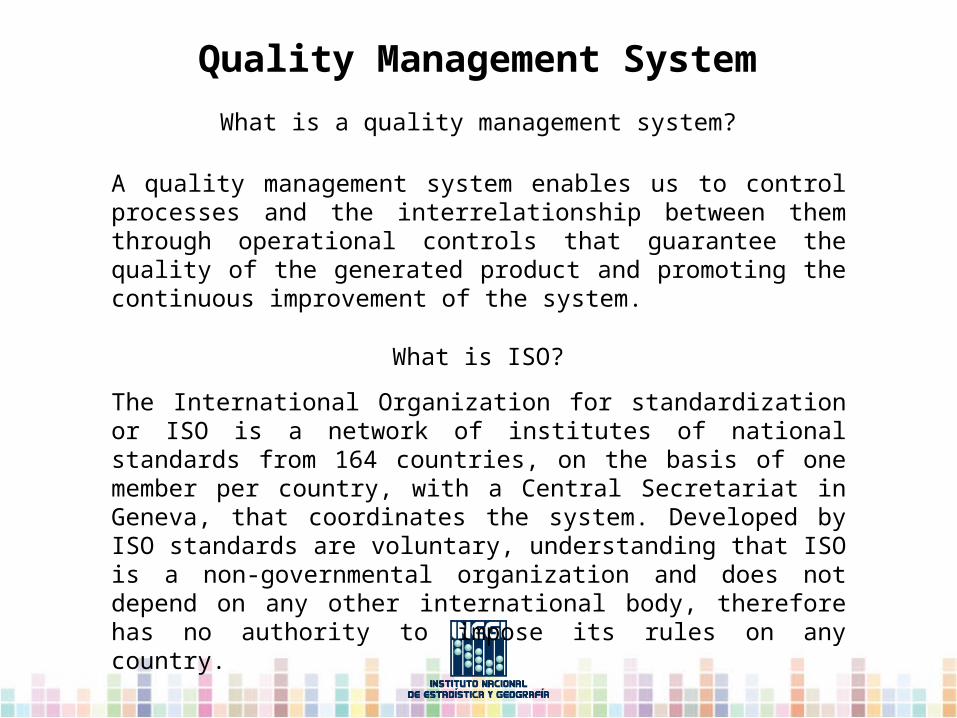
What is a quality management system?
A quality management system enables us to control processes and the interrelationship between them through operational controls that guarantee the quality of the generated product and promoting the continuous improvement of the system.
What is ISO?
The International Organization for standardization or ISO is a network of institutes of national standards from 164 countries, on the basis of one member per country, with a Central Secretariat in Geneva, that coordinates the system. Developed by ISO standards are voluntary, understanding that ISO is a non-governmental organization and does not depend on any other international body, therefore has no authority to impose its rules on any country.
Quality Management System
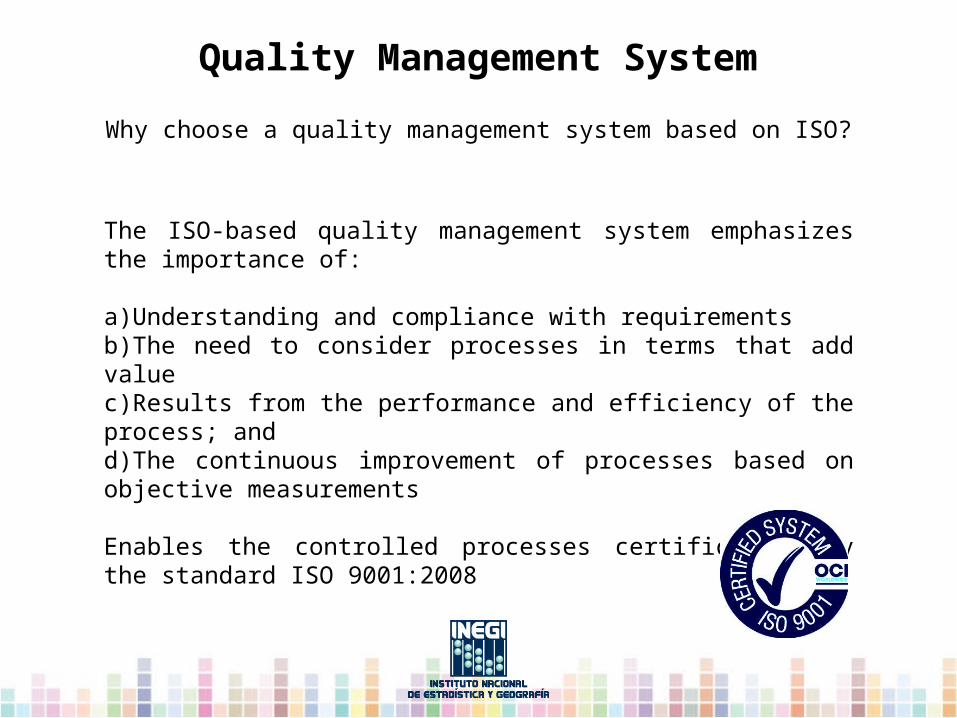
The ISO-based quality management system emphasizes the importance of:
a)Understanding and compliance with requirementsb)The need to consider processes in terms that add valuec)Results from the performance and efficiency of the process; and d)The continuous improvement of processes based on objective measurements Enables the controlled processes certification by the standard ISO 9001:2008
Why choose a quality management system based on ISO?
Quality Management System

Diagram of the interaction between the processes of the QMS of the address General Deputy of price indexes
Process approach
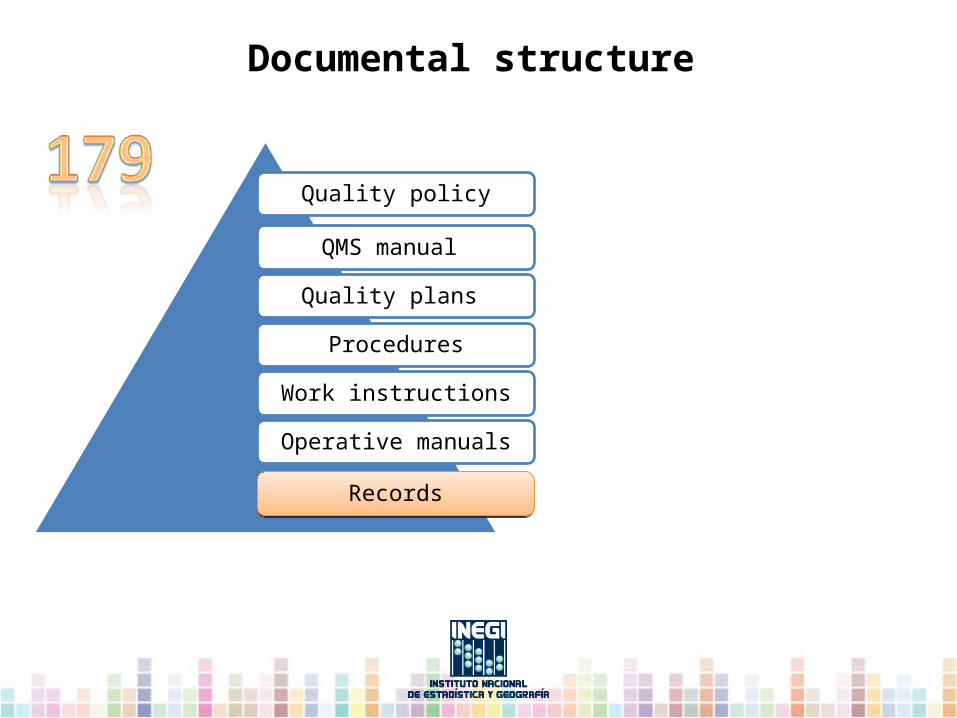
Quality policy
Manual del SGC
Quality Plans
Procedures
Work instructions
Operative manuals
Records
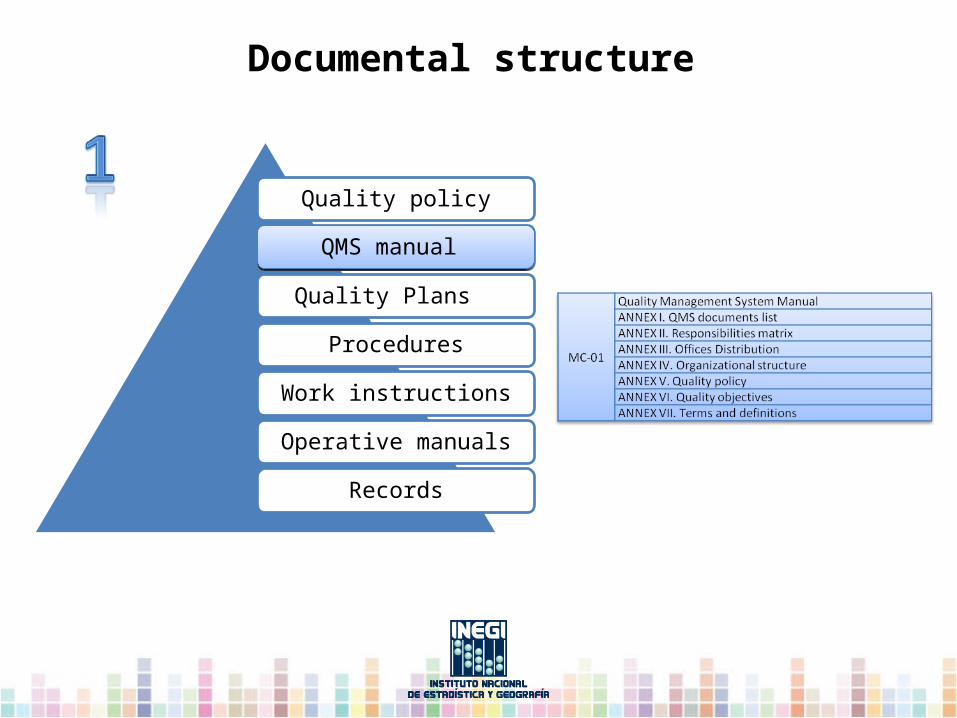
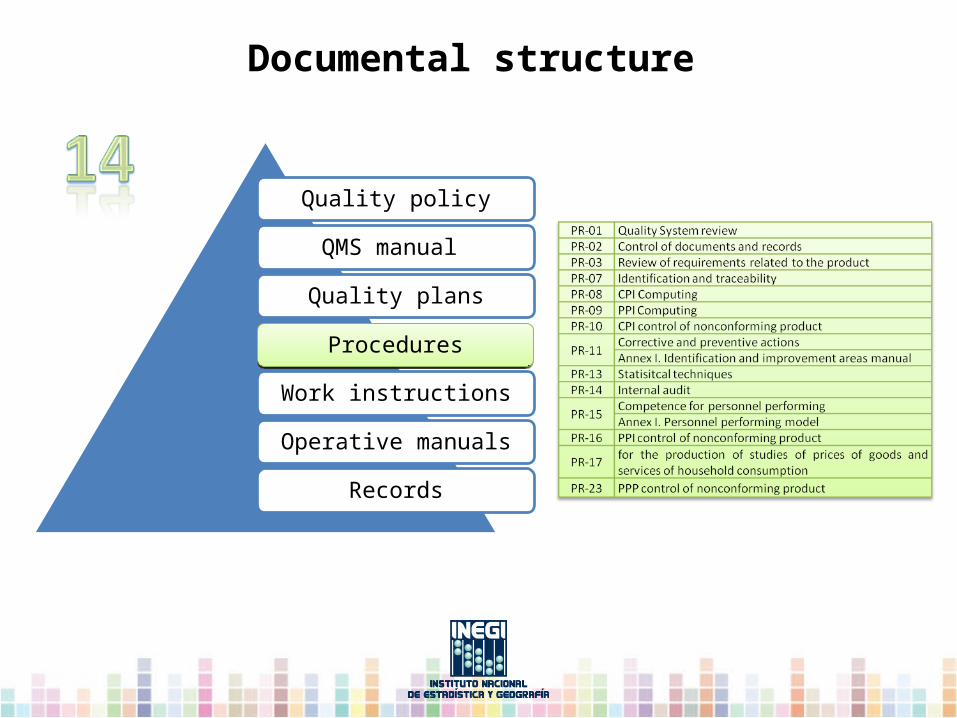
Documental structure
QMS manual QMS manual
Quality policy
QMS manual
Procedures
Work instructions
Operative manuals
Records
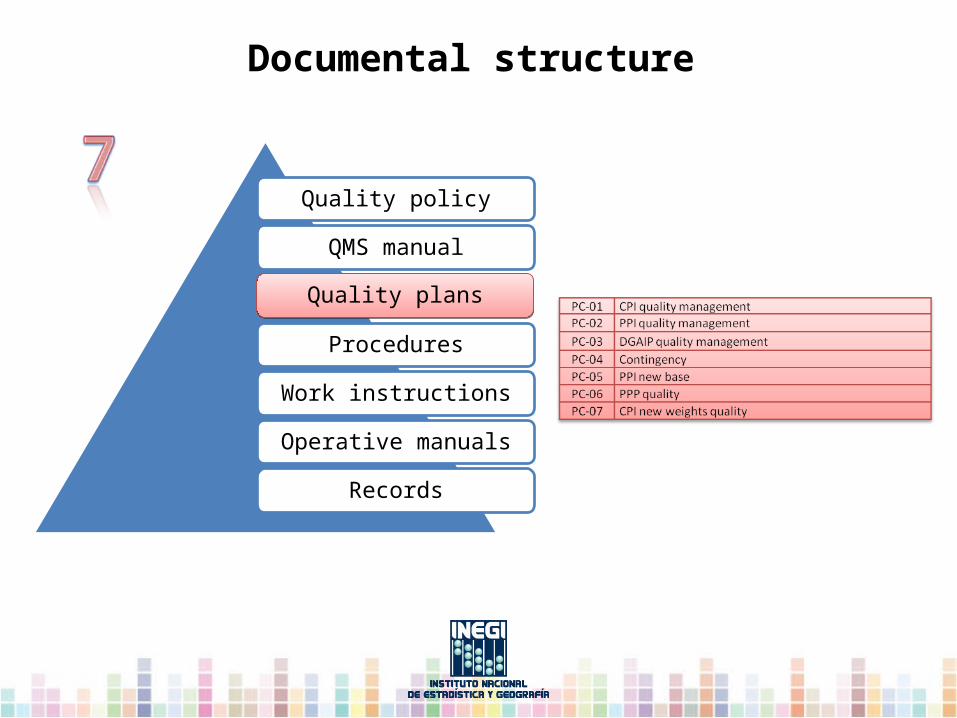
Quality plansQuality plans
Documental structure

CPI Management PlanProcess: CPI calculus Client: INEGI’s President
Economic Statistics General Director
Process responsible: CPI Sub directors
Characteristics Result: Opportunity in delivery time.
Process Result: Monthly Press Bulletin (FO-017), Fortnightly Press Bulletin (FO-016), Fortnightly information of national price index sent for publication. (FO-041), Monthly information of national price index sent for publication (FO-042). Average pricing sent for publication (FO-043), Chaining (FO-070) and Expansions and eliminations (FO-071) Update of the economic information bank (BIE) Indicator: Opportunity: That the publication of the news release is exactly at 8:00 of the day after which was presented to the Economic Statistics General Director. Comparison of weighting tables and results. See picture of our quality objectives in MC-01
Infrastructure: Places to work, Computer equipment (with software according activities), Telephone service, Internet, e-mail, Outlook Labor environment: adequate lighting
Activity No. 1 Compilate, investigate, analyze, capture and send prices information.
Responsable Prices Investigator (PI) Result Specific prices file for Price Investigator.
I. Required resources
81 Prices Investigators (sharing with PPI), 11 PI exclusive for CPI and 4 Flying Investigators to cover PI’s absences.
2,600 letter size sheets monthly; two toner cartridges annually by price investigator (shared with PPI)
Computer resources will be considered in the following way: 1 computer by PI; 1 printer, 1 scanner, and 1 phone by city. In the specific case of the Mexico City metropolitan Area, the PI will have 2 printers and a multifunctional.
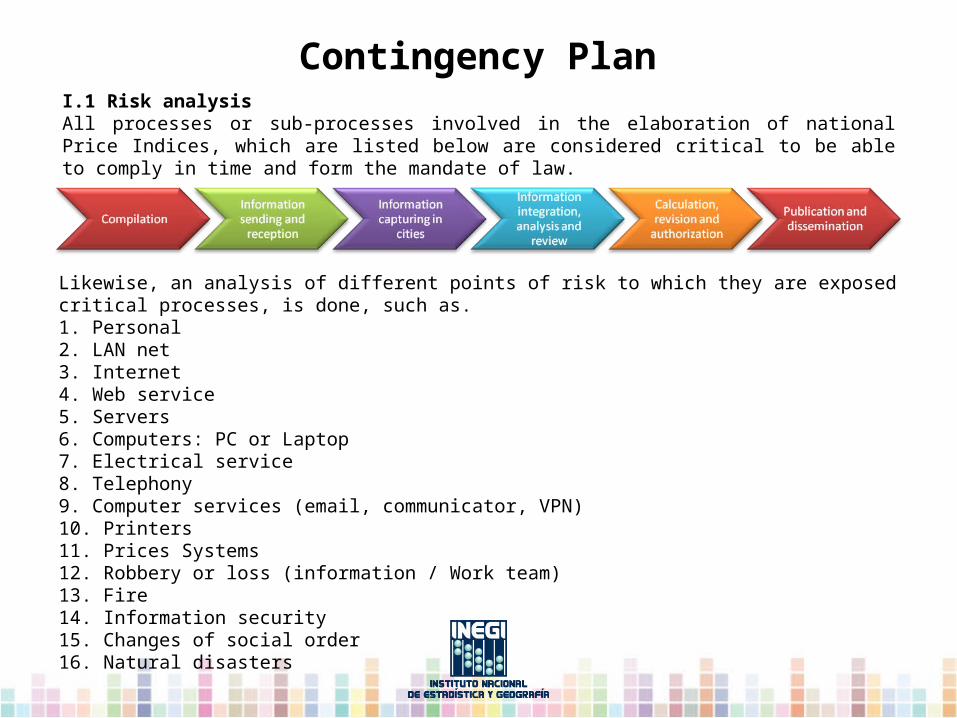
Contingency PlanI.1 Risk analysisAll processes or sub-processes involved in the elaboration of national Price Indices, which are listed below are considered critical to be able to comply in time and form the mandate of law.
Likewise, an analysis of different points of risk to which they are exposed critical processes, is done, such as.1. Personal2. LAN net3. Internet4. Web service5. Servers6. Computers: PC or Laptop7. Electrical service8. Telephony9. Computer services (email, communicator, VPN)10. Printers11. Prices Systems12. Robbery or loss (information / Work team)13. Fire14. Information security15. Changes of social order16. Natural disasters
Quality policy
QMS manual
Quality plans
Work instructions
Operative manuals
Records
ProceduresProcedures
Documental structure
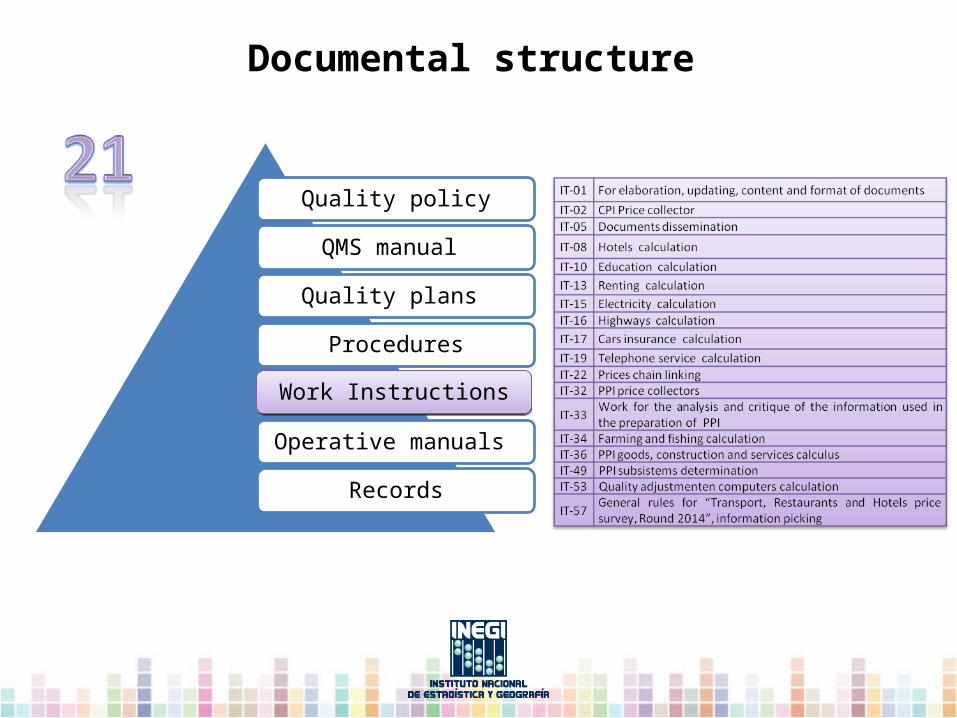
Quality policy
QMS manual
Quality plans
Procedures
Operative manuals
Records
Work InstructionsWork Instructions
Documental structure
Quality policy
QMS Manual
Quality plans
Procedures
Work Instructions
Manuals operativos
Records
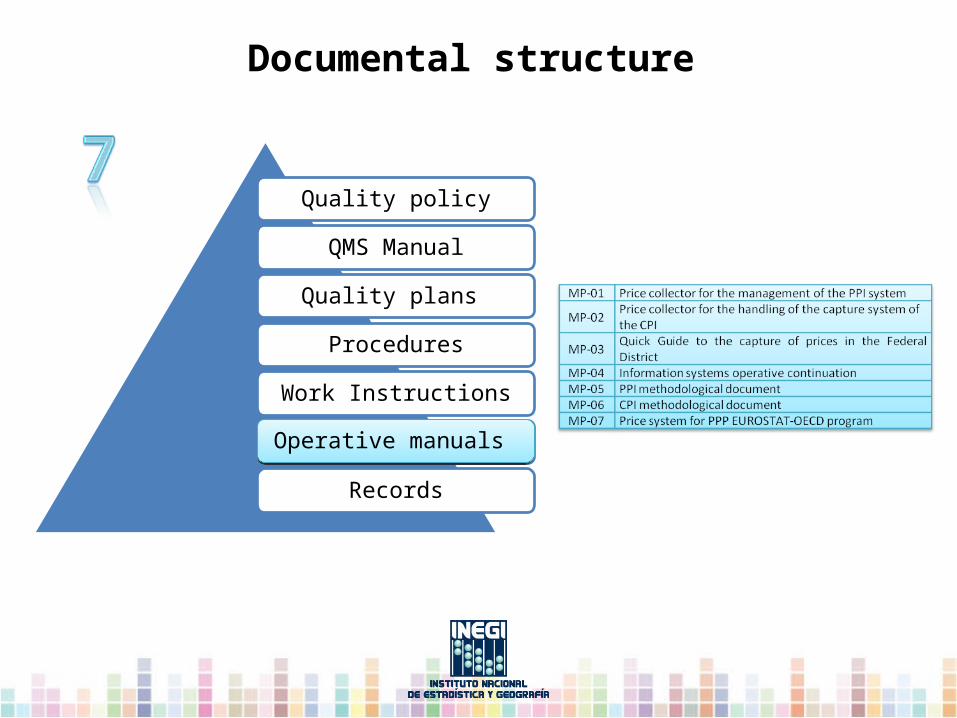
Operative manuals Operative manuals
Documental structure
Quality policy
QMS manual
Quality plans
Procedures
Work instructions
Operative manuals
RecordsRecords
Documental structure

(1) Management responsibility
(2) Provision of resources
(4) Measurement, analysis and
improvement processes
Requirements
Satisfaction
Information and communication
technology direction(DTIC)
Deputy DG of (DGAI)
Administrative direction from
DGEE (DA)
1. Customer requirements2. Product requirements3. Applicable Regulations4. International recommendations5. México national account system6. Generics weights7. Geographic and economic covering 8. Number of collected CPI and PPI prices9. calculus formula10. Goods and services classification11. CPI data base12. OECD requirements
INPUTS
Continual improvement
QMS processes
Operative processes
CustomersINEGI Presidency
DGEEOECD
External processes:
State coordination's
Deputy DG of economic studies
Regional Directions
Information Analysis and
criticism Calculus Revision and Authorization
(3) CPI and PPI elaboration
Market research Prices collection
Study preparation
(3.1) PPP studies elaboration
OECD
PRODUCTOS
Consumer Price Indices (CPI)Producer Price Indices (PPI)
Purchasing power parity studies (PPP)
PRODUCTS
Information recompilation,
verification and sending
CPI and PPI methodology
design
Validation Revision and Authorization
ENIGH
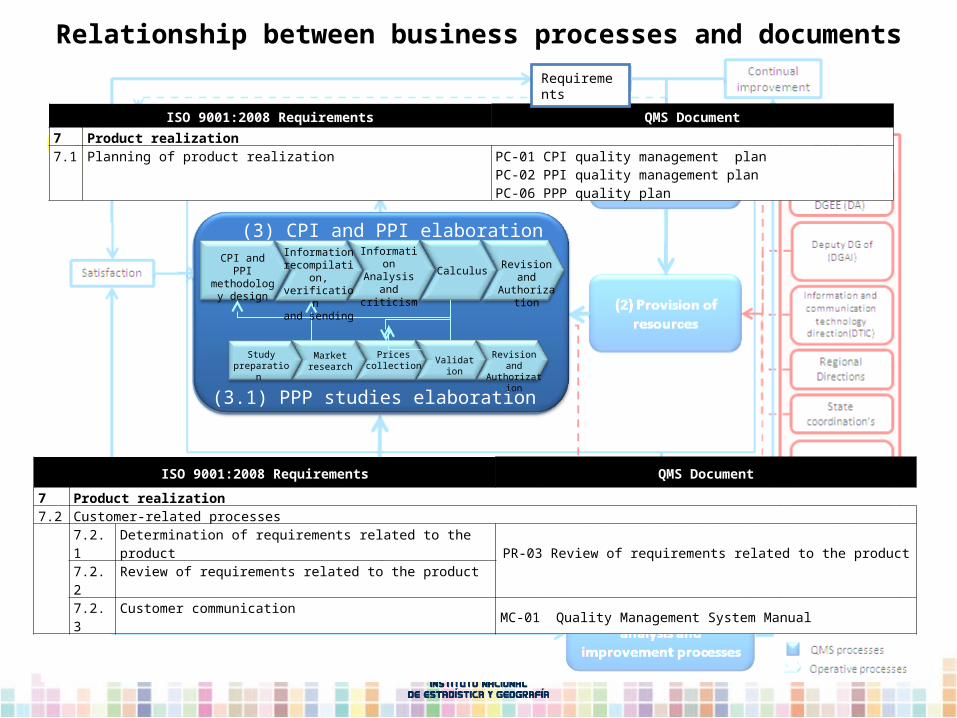
Relationship between business processes and documents
Information Analysis and
criticism Calculus Revision and Authorization
(3) CPI and PPI elaboration
Market research Prices collection
Study preparation
(3.1) PPP studies elaboration
Information recompilation,
verification and sending
CPI and PPI methodology
design
Validation Revision and Authorization
ISO 9001:2008 Requirements QMS Document
7 Product realization7.1 Planning of product realization PC-01 CPI quality management plan
PC-02 PPI quality management planPC-06 PPP quality plan
ISO 9001:2008 Requirements QMS Document
7 Product realization7.2 Customer-related processes 7.2.1 Determination of requirements related to the product PR-03 Review of requirements related to the product
7.2.2 Review of requirements related to the product 7.2.3 Customer communication MC-01 Quality Management System Manual
Requirements
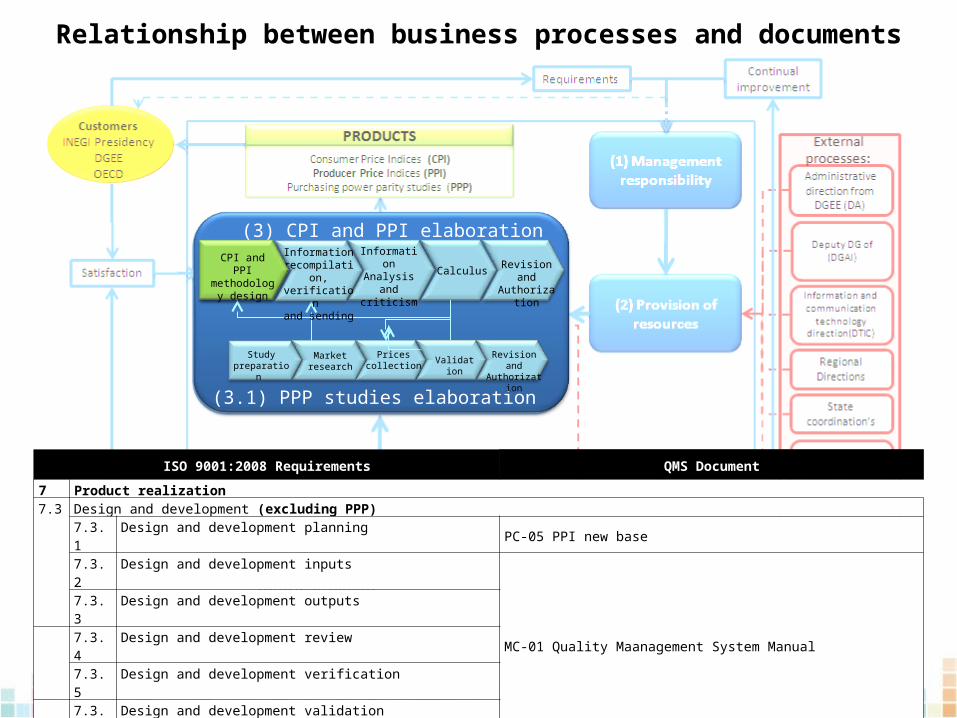
Relationship between business processes and documents
Information Analysis and
criticism Calculus Revision and Authorization
(3) CPI and PPI elaboration
Market research Prices collection
Study preparation
(3.1) PPP studies elaboration
Information recompilation,
verification and sending
Validation Revision and Authorization
ISO 9001:2008 Requirements QMS Document
7 Product realization7.3 Design and development (excluding PPP) 7.3.1 Design and development planning PC-05 PPI new base 7.3.2 Design and development inputs
MC-01 Quality Maanagement System Manual 7.3.3 Design and development outputs 7.3.4 Design and development review 7.3.5 Design and development verification 7.3.6 Design and development validation 7.3.7 Control of design and development changes MP-05 PPI Methodological document
MP-06 CPI Methodological document
CPI and PPI methodology
design
Relationship between business processes and documents
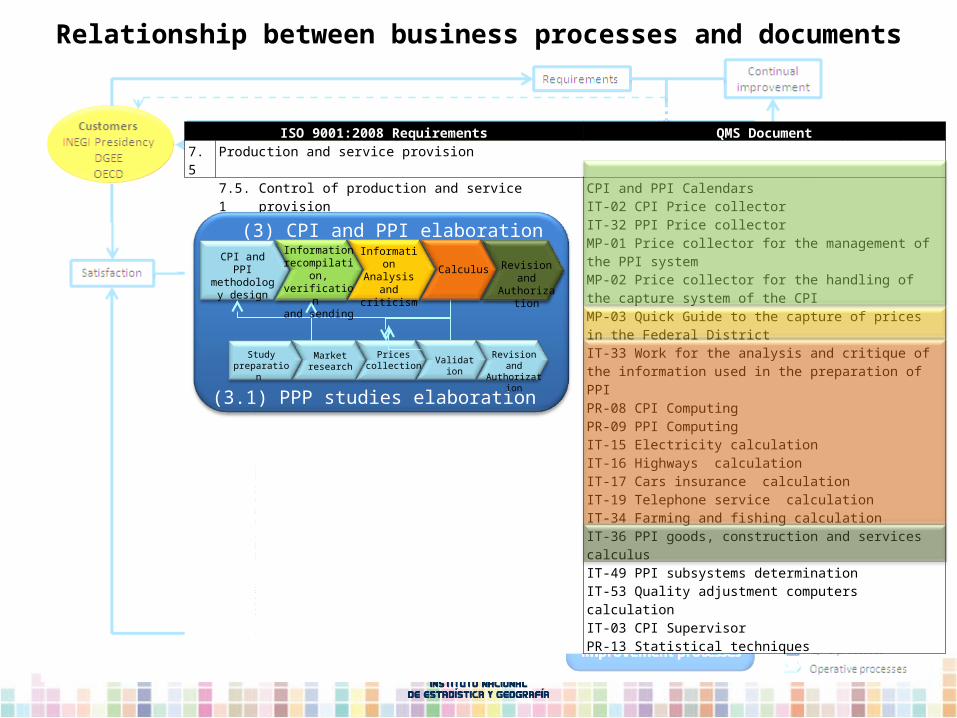
ISO 9001:2008 Requirements QMS Document7.5 Production and service provision 7.5.1 Control of production and service provision CPI and PPI Calendars
IT-02 CPI Price collectorIT-32 PPI Price collectorMP-01 Price collector for the management of the PPI systemMP-02 Price collector for the handling of the capture system of the CPIMP-03 Quick Guide to the capture of prices in the Federal DistrictIT-33 Work for the analysis and critique of the information used in the preparation of PPIPR-08 CPI ComputingPR-09 PPI ComputingIT-15 Electricity calculationIT-16 Highways calculationIT-17 Cars insurance calculationIT-19 Telephone service calculationIT-34 Farming and fishing calculationIT-36 PPI goods, construction and services calculusIT-49 PPI subsystems determinationIT-53 Quality adjustment computers calculationIT-03 CPI SupervisorPR-13 Statistical techniques
(3) CPI and PPI elaboration
Market research Prices collection
Study preparation
(3.1) PPP studies elaboration
CPI and PPI methodology
design
Validation Revision and Authorization
Information recompilation,
verification and sending
Information Analysis and
criticism Calculus Revision and
Authorization
Relationship between business processes and documents
Continual improvement
QMS continual improvement, is based on
Quality policyQuality objectivesAuditing resultsAnalysis of dataCorrective actionsPreventive actions; and Management review
Continual improvement
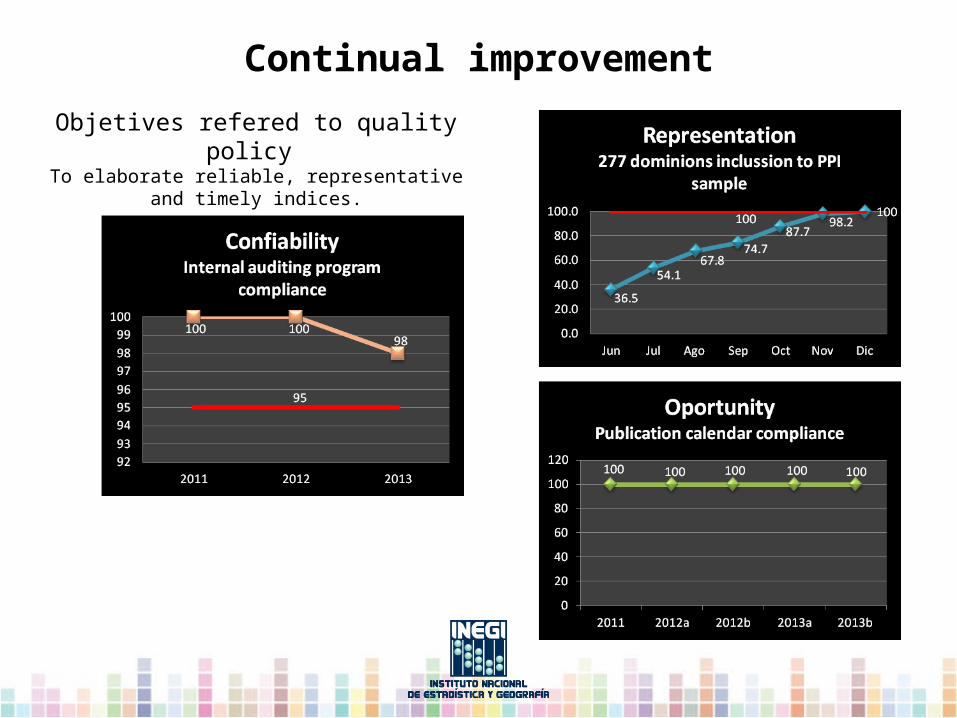
Objetives refered to quality policy To elaborate reliable, representative and timely indices.
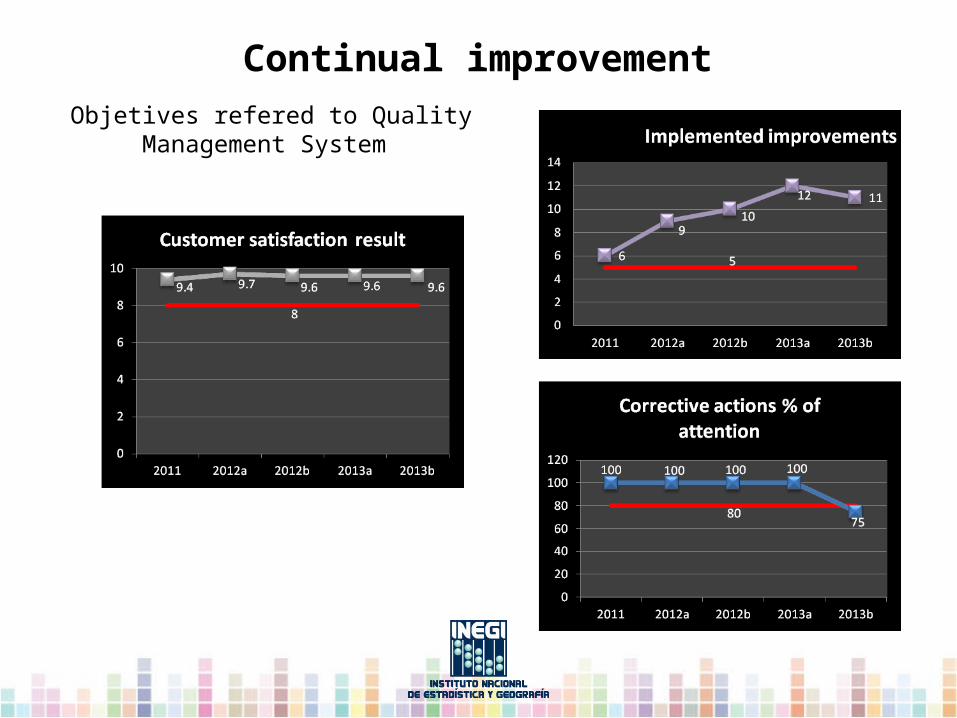
Continual improvementObjetives refered to Quality Management
System
Continual improvement
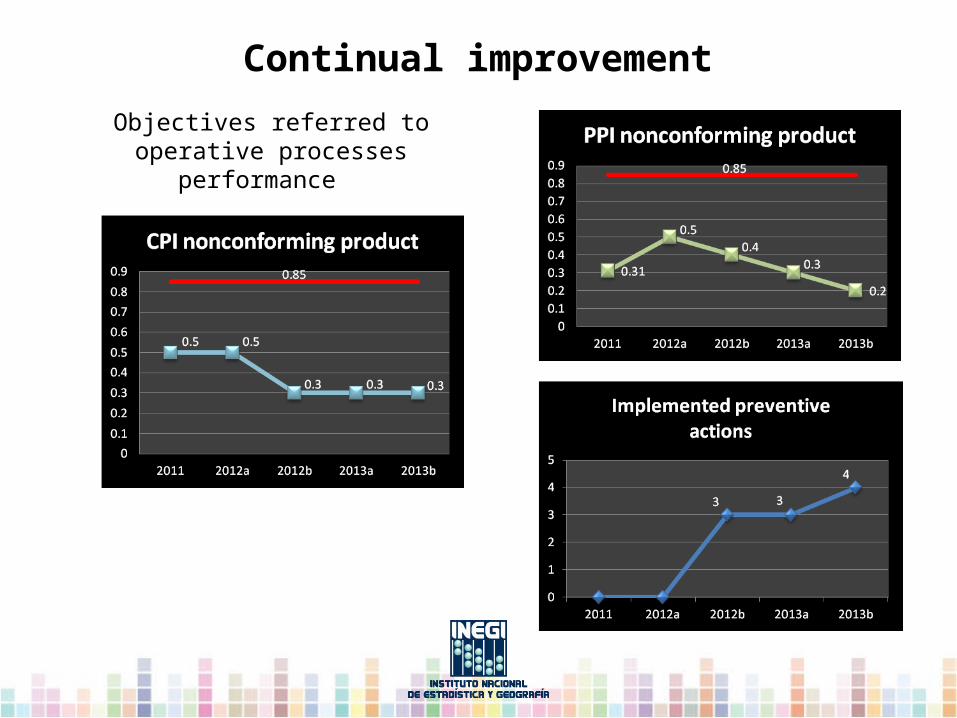
Objectives referred to operative processes performance
Continual improvement has been progressively in the DGAIP. Just six months after implemented the quality management system, in December had implemented six improvements for the verification of the results of the CPI before its broadcast, the most important, was the creation of an alternate application to check the partial results that throws the system of calculation of the CPI.
19 Improvement actions were implemented in the year 2012. To the creation of tools for the dissemination of information, should be mentioned because of its relevance as these served as the basis for which will be incorporated in 2013 in the dissemination of the studies of purchasing power parities.
Improvement actions at Deputy DG of Price Indices
Continual improvement
The improvements related to dissemination tools were: the elaboration of the inflation calculator, Kaleidoscope, dynamic graphics, map of prices, consultation of average prices and inflation Simulator.
Likewise in 2012 it should highlight the inclusion of the design of the CPI and the process of purchasing power parities to quality management system.
In 2013, we have registered 23 improvements, which are the inclusion of the design of the CPI to the quality management system, as well as the generation of a comprehensive system to capture and calculate the national indexes of prices and purchasing power parities studies.
Continual improvement
Improvement actions at Deputy DG of Price Indices
They should be mentioned among the most important improvements that have been incorporated in the quality management system:
Update the weights without change of base year for CPI
Change of base year to june 2012 for PPI
Continual improvement
Methodological improvement

Caleidoscopio
http://www.inegi.org.mx/est/contenidos/Proyectos/INP/Caleidoscopio.aspx
October 2013General variation
Food, beverages and tobacco
Variation
Housing
Furnishing, household equipment and domestic accessories
Health and personal care
Other services
Transport
Education and recreation
CONSUMER PRICE INDICE
Analysis tools
Kaleidoscope
Variation
Variation
Variation
Variation
Variation
Variation
Variation
Anual Variations
and accessoriesClothing, footwear
Less variation Most variation
Analysis tools
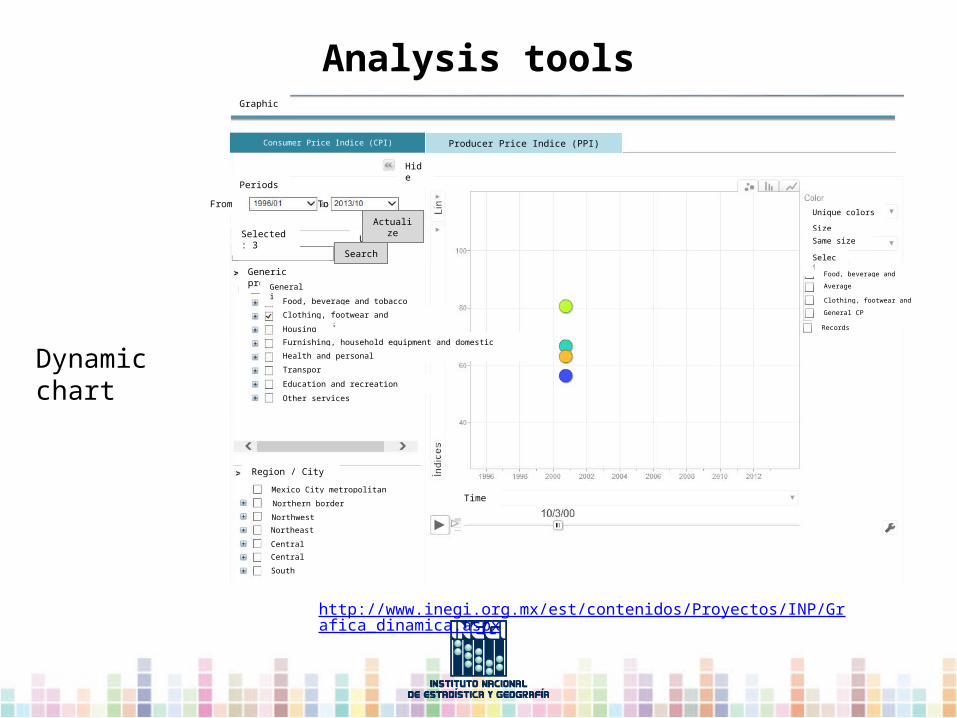
http://www.inegi.org.mx/est/contenidos/Proyectos/INP/Grafica_dinamica.aspx
Graphic
Consumer Price Indice (CPI) Producer Price Indice (PPI)
Periods
From To
Selected: 3 Unmarked all
Search
Generic product
General indice
Food, beverage and tobacco
Clothing, footwear and accessories
Housing
Furnishing, household equipment and domestic accessories
Health and personal care
Transport
Education and recreation
Other services
Region / City
Mexico City metropolitan area
Northern border
Northwest
Northeast
Central north
Central south
South
Time
Unique colors
Size
Same size
Select
Food, beverage and tobacco
Average
Clothing, footwear and accessories
General CP
Records
Hide
Dynamic chart
Actualize
Analysis tools
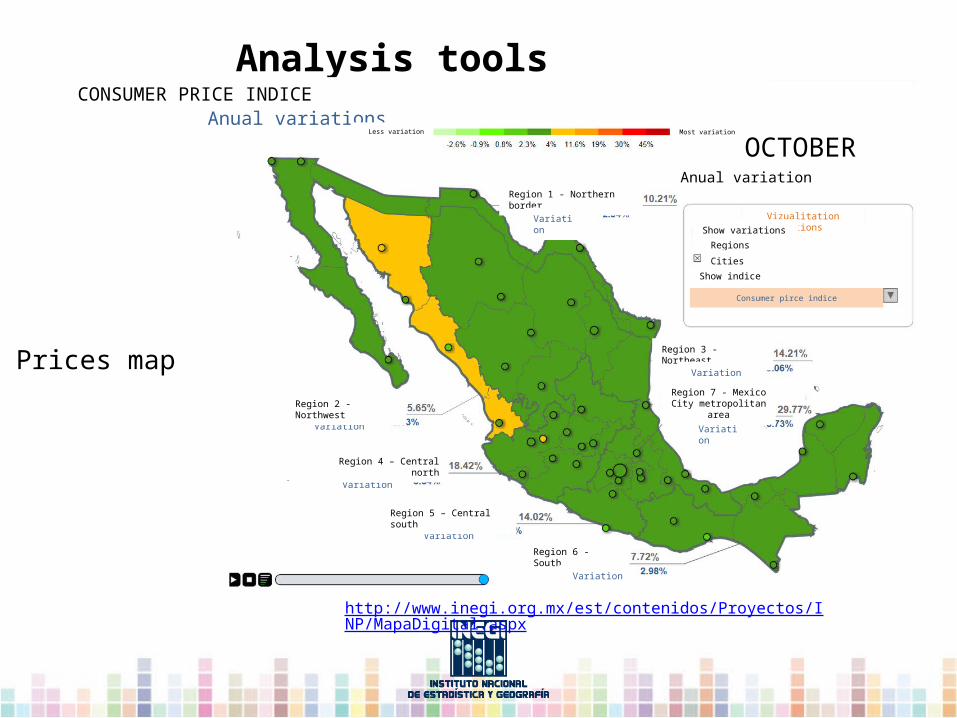
Prices map
http://www.inegi.org.mx/est/contenidos/Proyectos/INP/MapaDigital.aspx
CONSUMER PRICE INDICE Anual variations
Less variation Most variation
OCTOBER 2013Anual variation
Region 1 - Northern border
Variation Vizualitation options
Show variations in:
Regions
Cities
Show indice
Consumer pirce indice
Region 3 - Northeast
Variation
Region 7 - Mexico City metropolitan area
Variation
Region 6 - South
Variation
Variation
Variation
Variation
Region 5 – Central south
Region 4 – Central north
Region 2 - Northwest

Analysis tools
http://www.inegi.org.mx/est/contenidos/Proyectos/INP/simulador.aspx
Inflation simulator
Inflation simulator
1. Food, beverages and tobacco
TOTAL
2. Clothing, footwear and accessories
3. Housing
4. Furnishing and household equipment
5. Health and personal care
6. Transport
7. Education and recreation
8. Other services
Expand all Contract all Expense % CPI
1. In the section on the left, you can enter your average monthly expenses in pesos or in percentage, for each of the 8 groups. If you wish you can open each group (by clicking on the plus sign) and enter your expenses at the level of the subgroups (36) and even do it at the level of generic (283).
2. You can open all groups to generic level by clicking the EXPAND ALL option that appears in the left pane, or can see only 8 groups by clicking the COLLAPSE ALL option.
3. You can see the summary of expenditures entered on the DATA tab.
4. The result of the simulation can be comparatively with the CPI for each of the 8 groups under the GRAPHICS tab.
5. If desired can load predefined eyelashes simulations: EXAMPLE 1, EXAMPLE 2 AND EXAMPLE 3.
Initiate quantities
Introduction Data Graphics Example 1 Example 2 Example 3
Introduction to the simulator use
Quality Policy
Develop national index of prices to the consumer and producer, as well as studies of prices program of parities of power purchase, Reliable, Representative and Timely, using recognized methodologies and the continuous improvement of the processes, in order to meet the demands of statistical information of its customers.
![Presentación de PowerPoint · Instituto Nacional de Estadística y Geografía [INEGI] (2018). Características de las defunciones registradas en México durante 2017 FAO, FIDA, UNICEF,](https://img.pdfslide.us/doc/110x75/5e8b10ee9c80050b621477a9/presentacin-de-instituto-nacional-de-estadstica-y-geografa-inegi-2018.jpg)


![INSTITUTO NACIONAL DE ESTADÍSTICA Y GEOGRAFÍA Catálogo ... · juan vergara colima vergara]julia vaca julio borja colima colimajusto acevedo la avestruz colima colimala barrosa](https://img.pdfslide.us/doc/110x75/5e2cfecd76f9ab3b8a6d196e/instituto-nacional-de-estadstica-y-geografa-catlogo-juan-vergara-colima.jpg)