Embed Size (px)
Citation preview
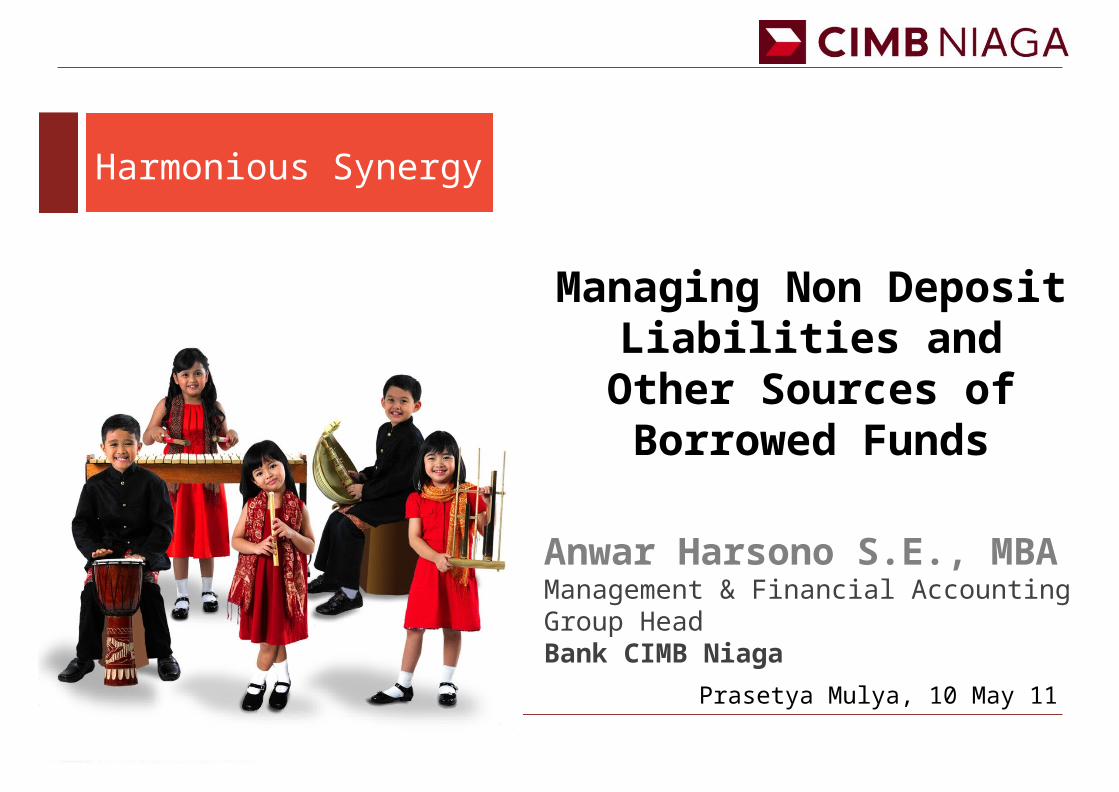
Managing Non Deposit Liabilities and Other Sources
of Borrowed Funds
Anwar Harsono S.E., MBAManagement & Financial Accounting Group HeadBank CIMB Niaga
Prasetya Mulya, 10 May 11
Harmonious Synergy
2
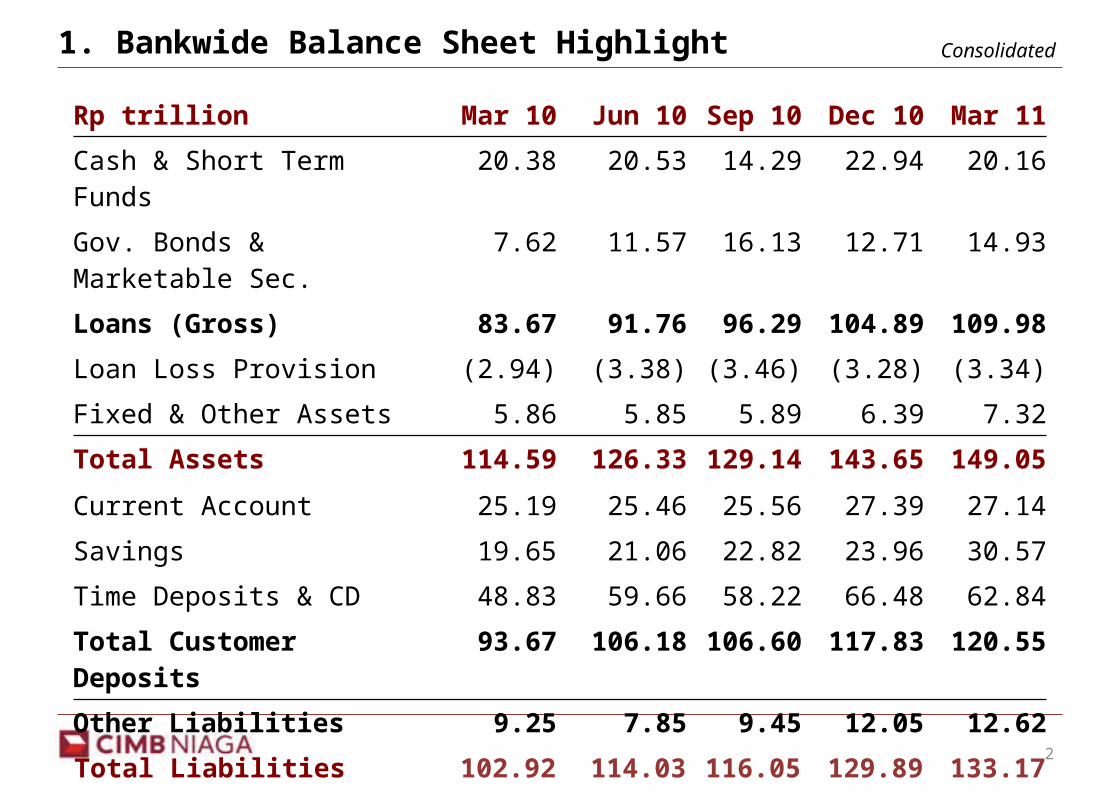
1. Bankwide Balance Sheet Highlight
Rp trillion Mar 10 Jun 10 Sep 10 Dec 10 Mar 11Cash & Short Term Funds 20.38 20.53 14.29 22.94 20.16Gov. Bonds & Marketable Sec. 7.62 11.57 16.13 12.71 14.93Loans (Gross) 83.67 91.76 96.29 104.89 109.98Loan Loss Provision (2.94) (3.38) (3.46) (3.28) (3.34)Fixed & Other Assets 5.86 5.85 5.89 6.39 7.32Total Assets 114.59 126.33 129.14 143.65 149.05
Current Account 25.19 25.46 25.56 27.39 27.14Savings 19.65 21.06 22.82 23.96 30.57Time Deposits & CD 48.83 59.66 58.22 66.48 62.84Total Customer Deposits 93.67 106.18 106.60 117.83 120.55Other Liabilities 9.25 7.85 9.45 12.05 12.62Total Liabilities 102.92 114.03 116.05 129.89 133.17Equity 11.7 12.30 13.10 13.77 15.88
Consolidated
3
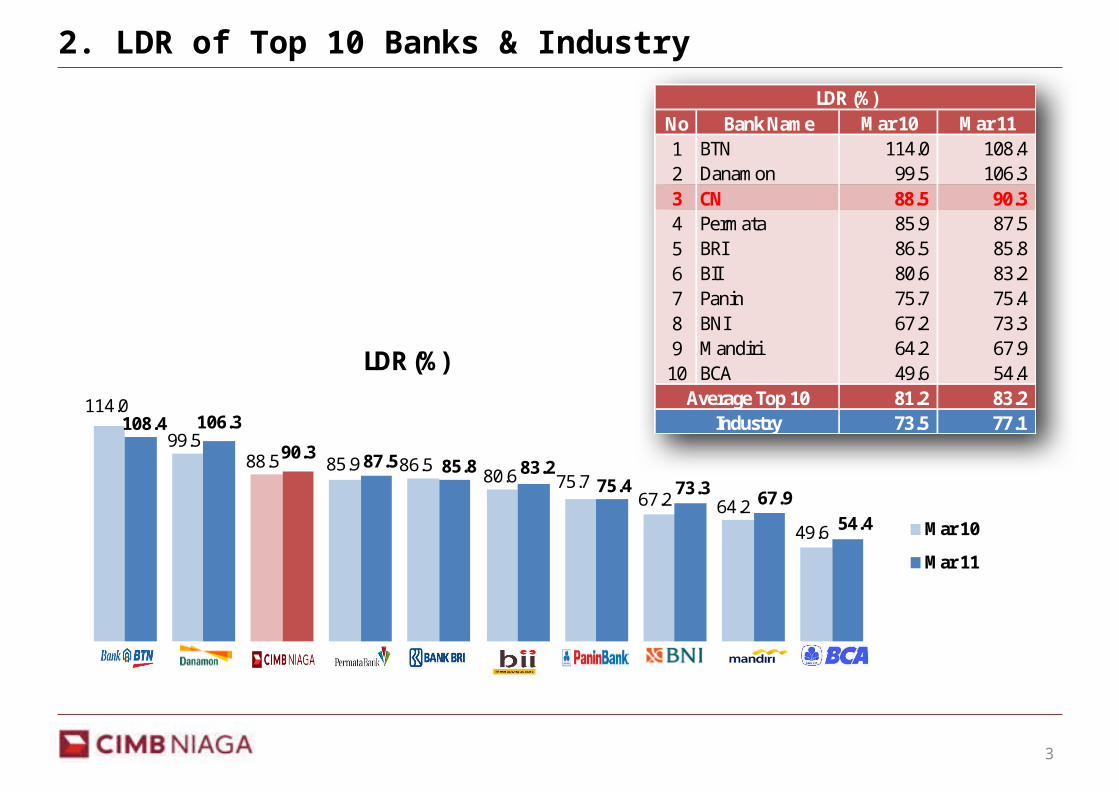
2. LDR of Top 10 Banks & Industry
114.0
99.588.5 85.9 86.5
80.6 75.767.2 64.2
49.6
108.4 106.3
90.3 87.5 85.8 83.275.4 73.3 67.9
54.4 Mar 10
Mar 11
LDR (%)
No Bank Name Mar 10 Mar 111 BTN 114.0 108.4 2 Danamon 99.5 106.3 3 CN 88.5 90.3 4 Permata 85.9 87.5 5 BRI 86.5 85.8 6 BII 80.6 83.2 7 Panin 75.7 75.4 8 BNI 67.2 73.3 9 Mandiri 64.2 67.9
10 BCA 49.6 54.4 81.2 83.2 73.5 77.1
LDR (%)
Average Top 10Industry
4
Customer Relationship Doctrine:the first priority of a lending institution is to make loans to all those customers
from whom the lender expects to receive positive net earnings.
The customer relationship doctrine spawned the liquidity management strategy known as ‘Liability Management’.
Liability Management consists of buying funds, mainly from other financial institutions, in order to cover good quality credit requests and satisfy any legal reserve requirements on deposits and other borrowings that law or regulation may require.
The hallmark of liability management are:1) Buying funds by selling liabilities in the money market2) Using price (the interest rate offered) as the control lever to regulate the volume and
timing of incoming funds.
3. Customer Relationship Doctrine
5
4. Source of Loanable Funds
Source of Loanable Funds:• Customer Deposits• Non Customer Deposit Liabilities
Short-term Long-term
• Equity
6
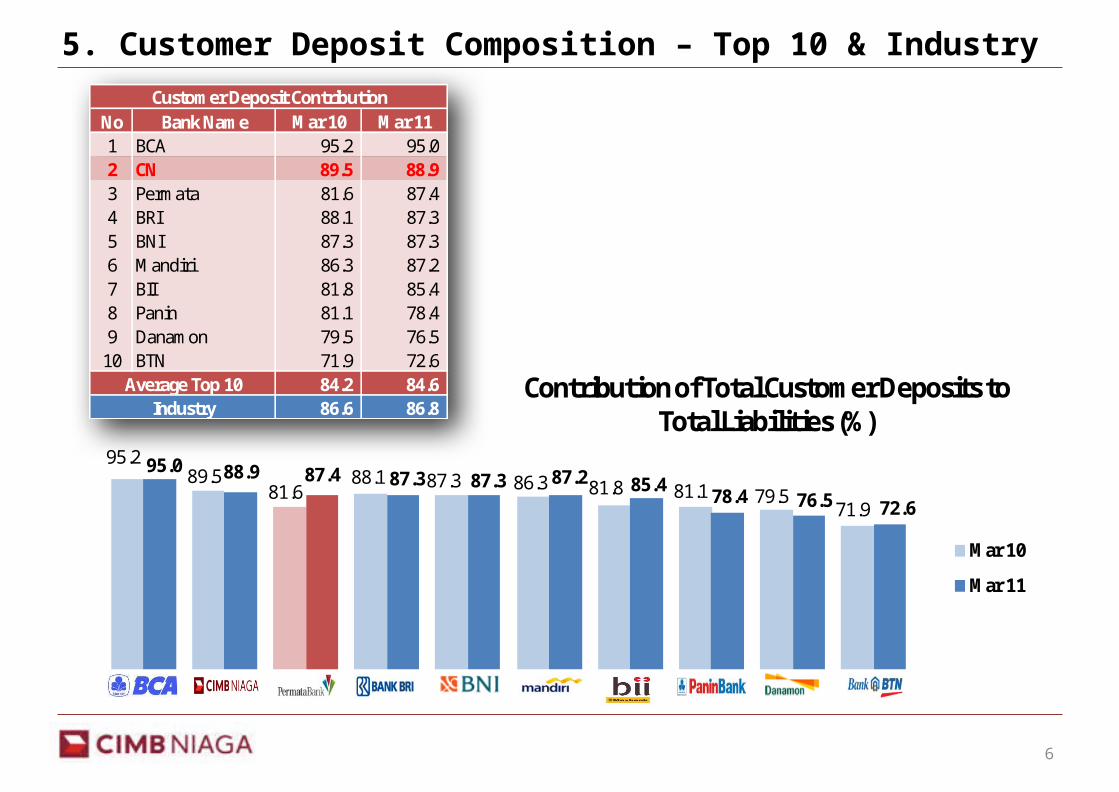
5. Customer Deposit Composition – Top 10 & Industry
95.289.5
81.688.1 87.3 86.3 81.8 81.1 79.5
71.9
95.0 88.9 87.4 87.3 87.3 87.2 85.478.4 76.5 72.6
Mar 10
Mar 11
Contribution of Total Customer Deposits to Total Liabilities (%)
No Bank Name Mar 10 Mar 111 BCA 95.2 95.0 2 CN 89.5 88.9 3 Permata 81.6 87.4 4 BRI 88.1 87.3 5 BNI 87.3 87.3 6 Mandiri 86.3 87.2 7 BII 81.8 85.4 8 Panin 81.1 78.4 9 Danamon 79.5 76.5
10 BTN 71.9 72.6 84.2 84.6 86.6 86.8
Customer Deposit Contribution
Average Top 10Industry
7
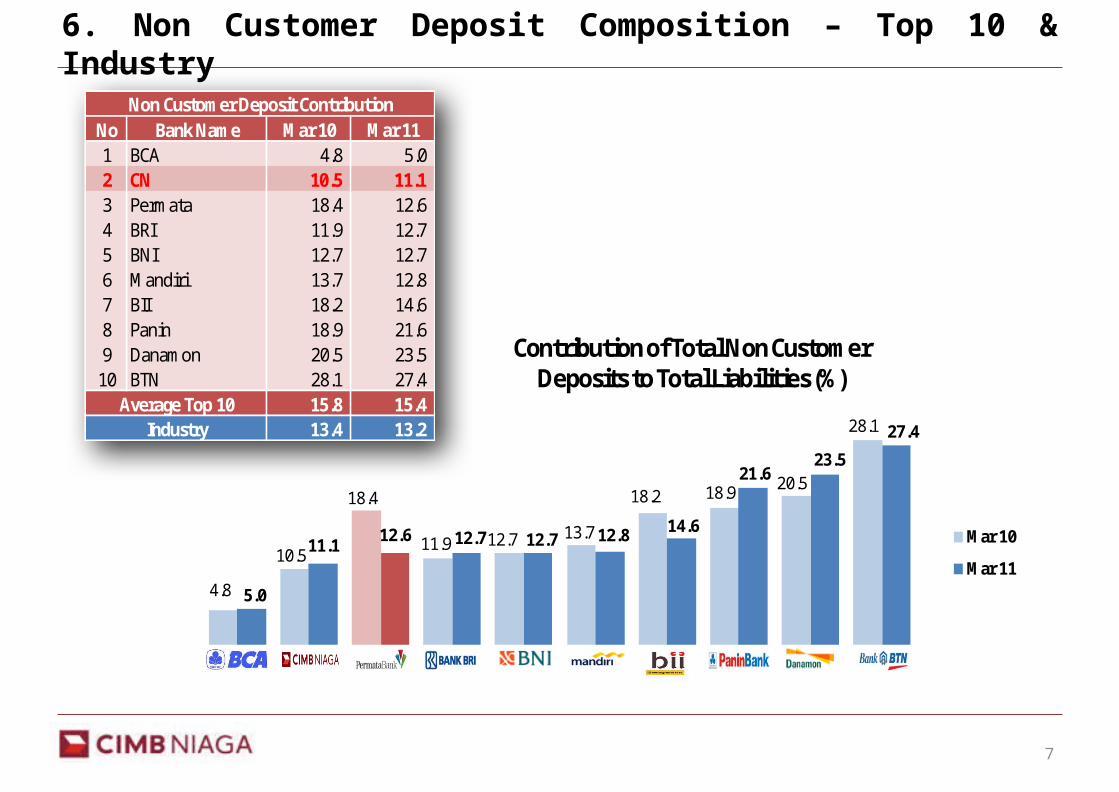
6. Non Customer Deposit Composition – Top 10 & Industry
No Bank Name Mar 10 Mar 111 BCA 4.8 5.0 2 CN 10.5 11.1 3 Permata 18.4 12.6 4 BRI 11.9 12.7 5 BNI 12.7 12.7 6 Mandiri 13.7 12.8 7 BII 18.2 14.6 8 Panin 18.9 21.6 9 Danamon 20.5 23.5
10 BTN 28.1 27.4 15.8 15.4 13.4 13.2
Non Customer Deposit Contribution
Average Top 10Industry
4.8
10.5
18.4
11.9 12.7 13.7
18.2 18.9 20.5
28.1
5.0
11.112.6 12.7 12.7 12.8 14.6
21.623.5
27.4
Mar 10
Mar 11
Contribution of Total Non Customer Deposits to Total Liabilities (%)
8
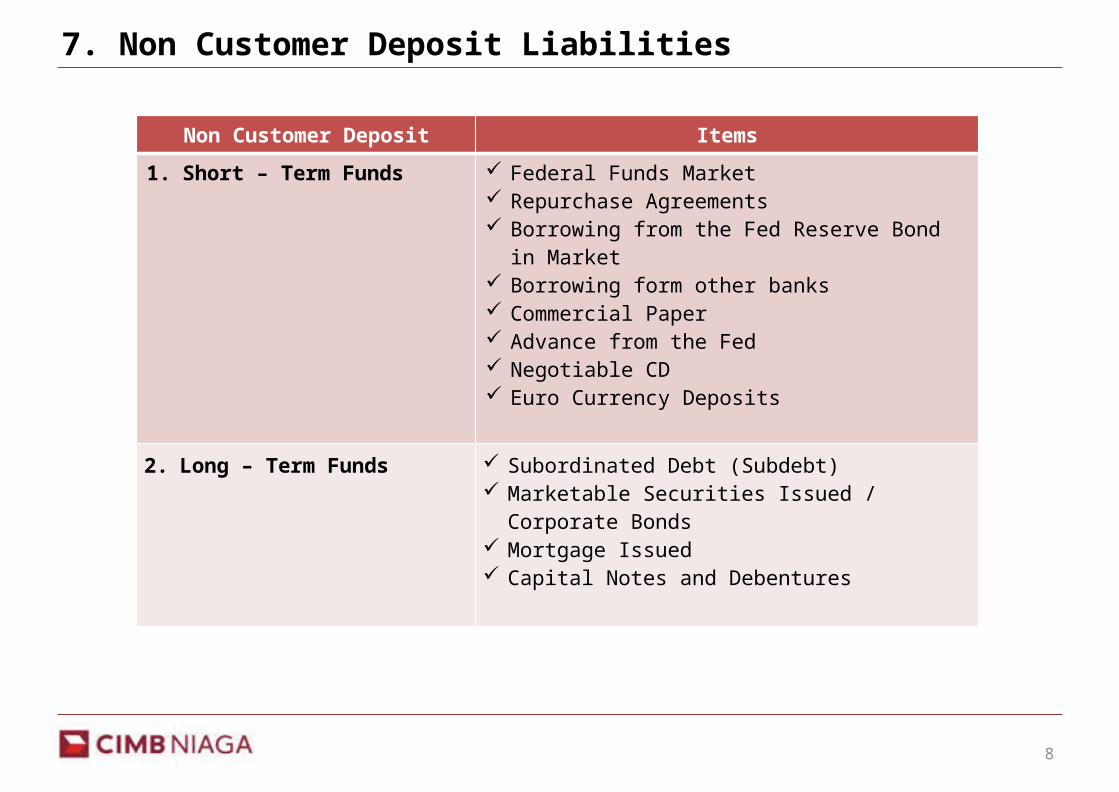
7. Non Customer Deposit Liabilities
Non Customer Deposit Items
1. Short – Term Funds Federal Funds Market Repurchase Agreements Borrowing from the Fed Reserve Bond in Market Borrowing form other banks Commercial Paper Advance from the Fed Negotiable CD Euro Currency Deposits
2. Long – Term Funds Subordinated Debt (Subdebt) Marketable Securities Issued / Corporate Bonds Mortgage Issued Capital Notes and Debentures
9
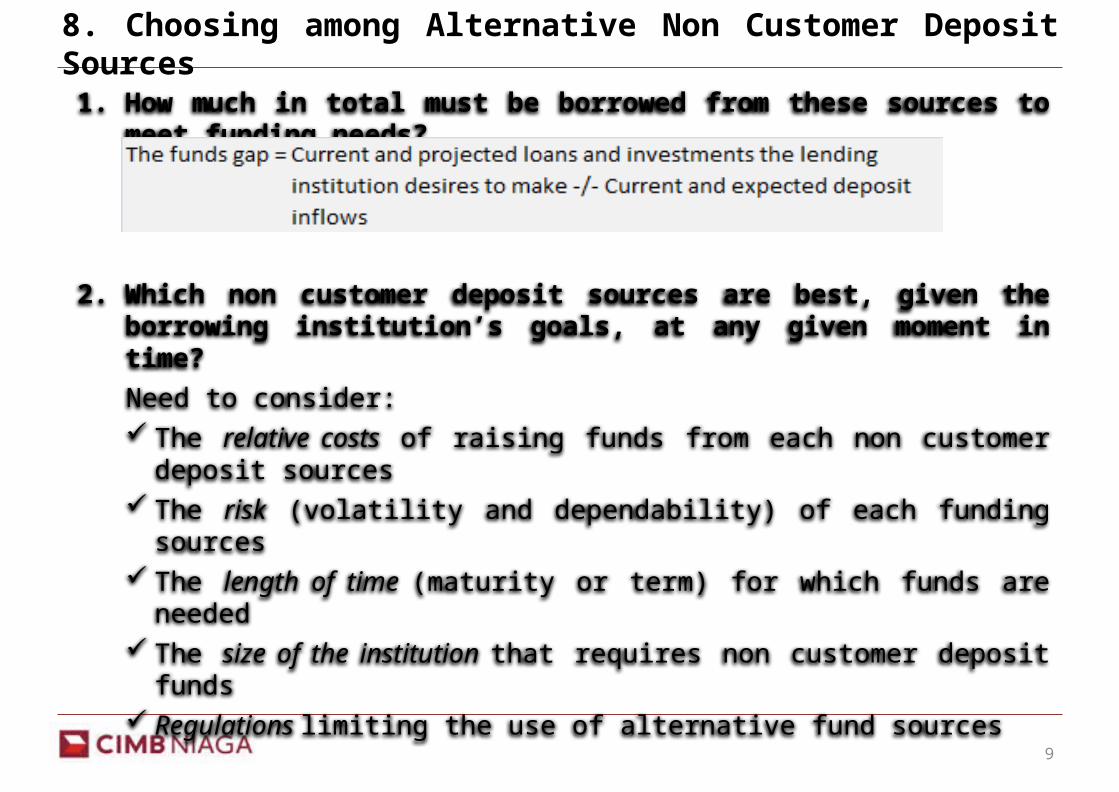
8. Choosing among Alternative Non Customer Deposit Sources
1. How much in total must be borrowed from these sources to meet funding needs?
2. Which non customer deposit sources are best, given the borrowing institution’s goals, at any given moment in time?Need to consider: The relative costs of raising funds from each non customer deposit sources The risk (volatility and dependability) of each funding sources The length of time (maturity or term) for which funds are needed The size of the institution that requires non customer deposit funds Regulations limiting the use of alternative fund sources
10
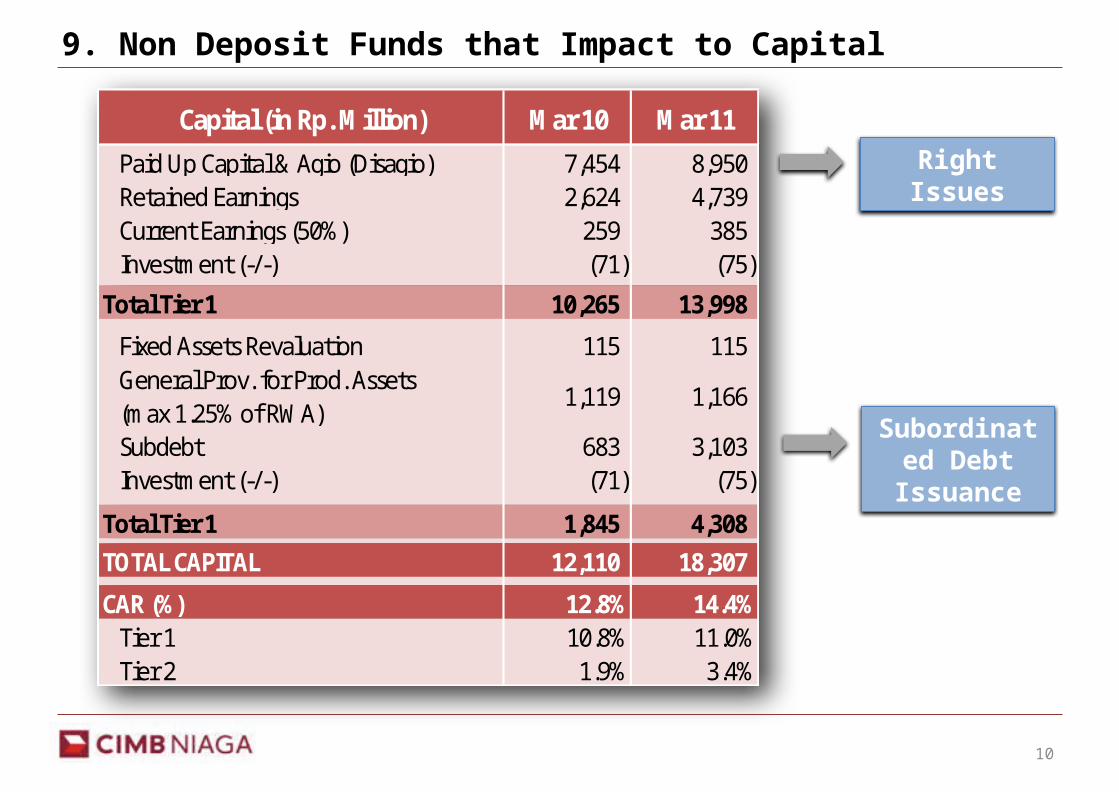
9. Non Deposit Funds that Impact to Capital
Capital (in Rp. Million) Mar 10 Mar 11
Paid Up Capital & Agio (Disagio) 7,454 8,950 Retained Earnings 2,624 4,739 Current Earnings (50%) 259 385 Investment (-/-) (71) (75)
Total Tier 1 10,265 13,998
Fixed Assets Revaluation 115 115 General Prov. for Prod. Assets (max 1.25% of RWA)
1,119 1,166
Subdebt 683 3,103 Investment (-/-) (71) (75)
Total Tier 1 1,845 4,308 TOTAL CAPITAL 12,110 18,307
CAR (%) 12.8% 14.4% Tier 1 10.8% 11.0% Tier 2 1.9% 3.4%
Right Issues
Subordinated Debt Issuance
11
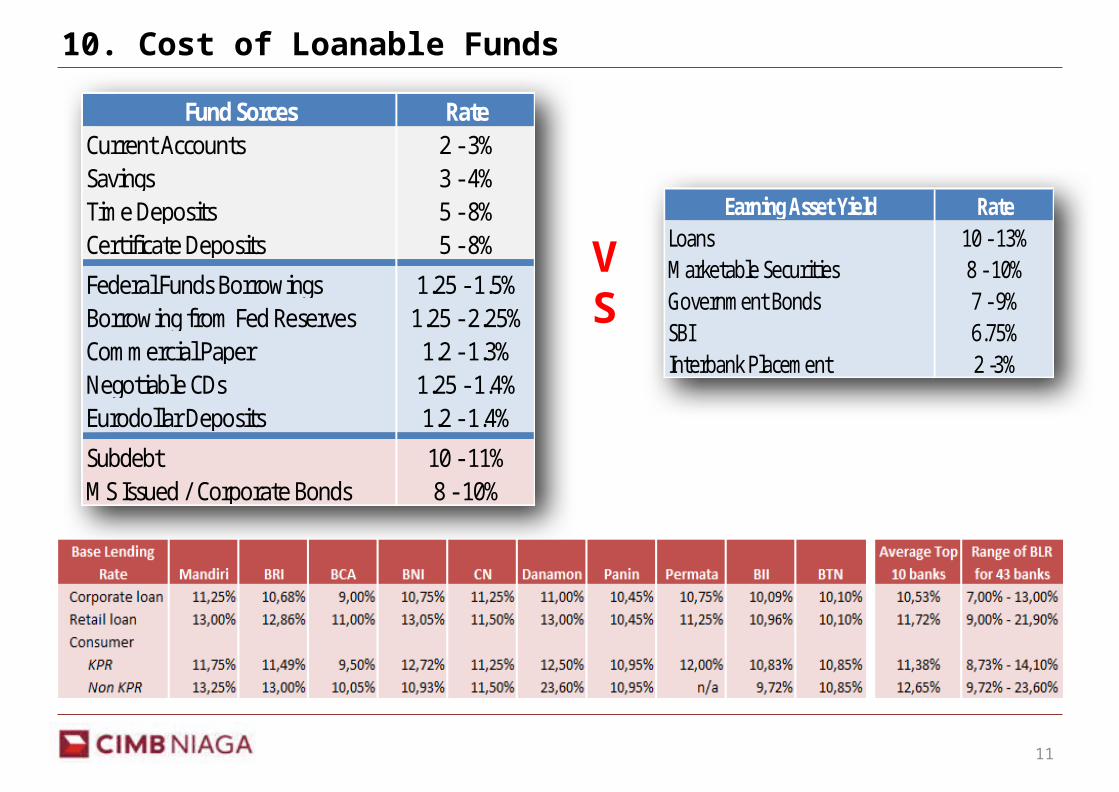
10. Cost of Loanable Funds
Fund Sorces RateCurrent Accounts 2 - 3%Savings 3 - 4%Time Deposits 5 - 8%Certificate Deposits 5 - 8%
Federal Funds Borrowings 1.25 - 1.5%Borrowing from Fed Reserves 1.25 - 2.25%Commercial Paper 1.2 - 1.3%Negotiable CDs 1.25 - 1.4%Eurodollar Deposits 1.2 - 1.4%
Subdebt 10 - 11%MS Issued / Corporate Bonds 8 - 10%
Earning Asset Yield RateLoans 10 - 13%Marketable Securities 8 - 10%Government Bonds 7 - 9%SBI 6.75%Interbank Placement 2 -3%
VS
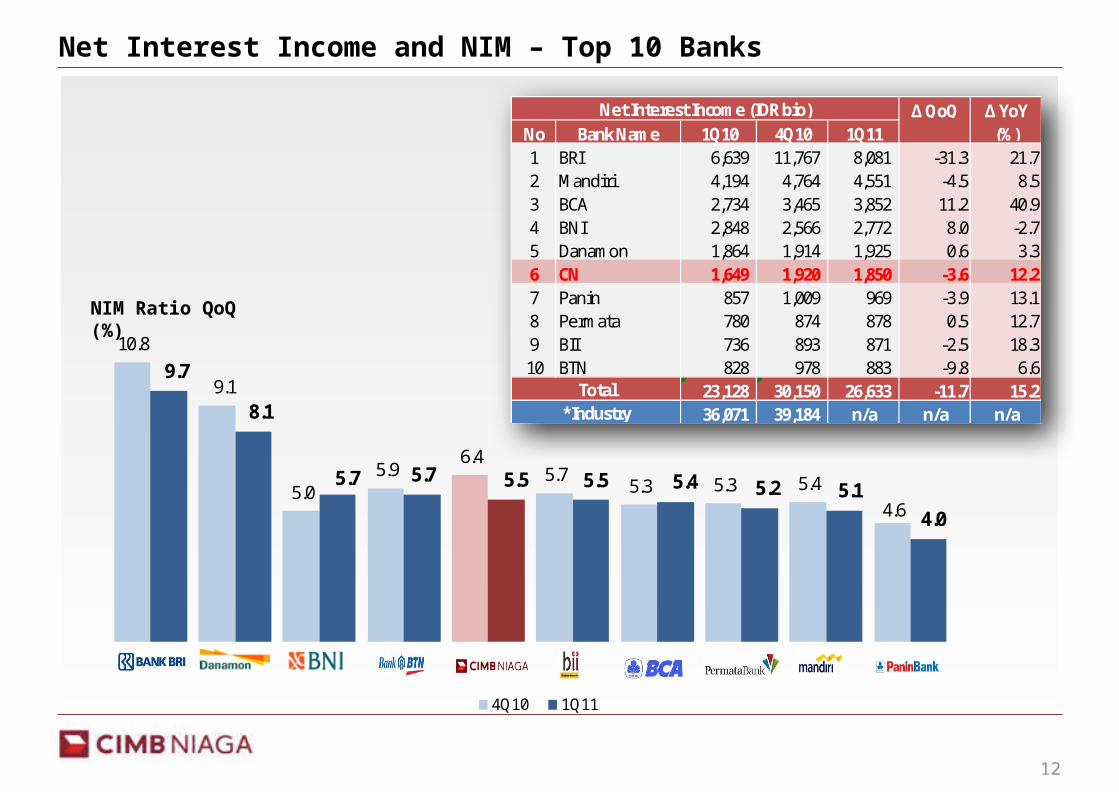
10.8
9.1
5.0 5.9
6.4 5.7
5.3 5.3 5.4 4.6
9.7
8.1
5.7 5.7 5.5 5.5 5.4 5.2 5.1 4.0
4Q10 1Q11
Net Interest Income and NIM – Top 10 Banks
12
NIM Ratio QoQ (%)
∆ QoQ No Bank Name 1Q10 4Q10 1Q111 BRI 6,639 11,767 8,081 -31.3 21.72 Mandiri 4,194 4,764 4,551 -4.5 8.53 BCA 2,734 3,465 3,852 11.2 40.94 BNI 2,848 2,566 2,772 8.0 -2.75 Danamon 1,864 1,914 1,925 0.6 3.36 CN 1,649 1,920 1,850 -3.6 12.27 Panin 857 1,009 969 -3.9 13.18 Permata 780 874 878 0.5 12.79 BII 736 893 871 -2.5 18.310 BTN 828 978 883 -9.8 6.6
23,128 30,150 26,633 -11.7 15.236,071 39,184 n/a n/a n/a
Total*Industry
Net Interest Income (IDR bio) ∆ YoY (%)
Thank You
Harmonious Synergy