Embed Size (px)
Citation preview
Page 1
Management’s Discussion and Analysis For the three and nine-month periods ended August 31, 2018
General
This Management's Discussion and Analysis of the financial position and financial performance ("MD&A") of MTY Food Group Inc. ("MTY") is supplementary information and should be read in conjunction with the Company’s consolidated financial statements and accompanying notes for the fiscal year ended November 30, 2017. In the MD&A, MTY Food Group Inc., MTY, or the Company, designates, as the case may be, MTY Food Group Inc. and its Subsidiaries, or MTY Food Group Inc., or one of its subsidiaries. The disclosures and values in this MD&A were prepared in accordance with International Financial Reporting Standards (IFRS) and with current issued and adopted interpretations applied to fiscal years beginning on or after December 1, 2017. This MD&A was prepared as of October 9, 2018. Supplementary information about MTY, including its latest annual and quarterly reports, and press releases, is available on SEDAR’s website at www.sedar.com. Forward looking statements and use of estimates
This MD&A and, in particular, but without limitation, the sections of this MD&A entitled Outlook, Same-Store Sales, Contingent Liabilities and Subsequent Event, contain forward-looking statements. These forward-looking statements include, but are not limited to, statements relating to certain aspects of the business outlook of the Company during the course of 2018. Forward-looking statements also include any other statements that do not refer to independently verifiable historical facts. A statement made is forward-looking when it uses what is known and expected today to make a statement about the future. Forward-looking statements may include words such as aim, anticipate, assumption, believe, could, expect, goal, guidance, intend, may, objective, outlook, plan, project, seek, should, strategy, strive, target and will. All such forward-looking statements are made pursuant to the ‘safe harbour’ provisions of applicable Canadian securities laws. Unless otherwise indicated, forward-looking statements in this MD&A describe the Company’s expectations at October 9, 2018 and, accordingly, are subject to change after such date. Except as may be required by Canadian securities laws, the Company does not undertake any obligation to update or revise any forward-looking statements, whether as a result of new information, future events or otherwise. Forward-looking statements, by their very nature, are subject to inherent risks and uncertainties and are based on several assumptions which give rise to the possibility that actual results or events could differ materially from the expectations expressed in or implied by such forward-looking statements and that the business
Page 2
outlook, objectives, plans and strategic priorities may not be achieved. As a result, the Company cannot guarantee that any forward-looking statement will materialize and readers are cautioned not to place undue reliance on these forward-looking statements. Forward-looking statements are provided in this MD&A for the purpose of giving information about management’s current strategic priorities, expectations and plans and allowing investors and others to get a better understanding of the business outlook and operating environment. Readers are cautioned, however, that such information may not be appropriate for other purposes. Forward-looking statements made in this MD&A are based on a number of assumptions that are believed to be reasonable on October 9, 2018. Refer, in particular, to the section of this MD&A entitled Risks and Uncertainties for a description of certain key economic, market and operational assumptions the Company has used in making forward-looking statements contained in this MD&A. If the assumptions turn out to be inaccurate, the actual results could be materially different from what is expected. In preparing the consolidated financial statements in accordance with IFRS and the MD&A, management must exercise judgment when applying accounting policies and use assumptions and estimates that have an impact on the amounts of assets, liabilities, sales and expenses reported and on contingent liabilities and contingent assets information provided. Unless otherwise indicated in this MD&A, the strategic priorities, business outlooks and assumptions described in the previous MD&A remain substantially unchanged. Important risk factors that could cause actual results or events to differ materially from those expressed in or implied by the above-mentioned forward-looking statements and other forward-looking statements included in this MD&A include, but are not limited to: the intensity of competitive activity, and the resulting impact on the ability to attract customers’ disposable income; the Company’s ability to secure advantageous locations and renew existing leases at sustainable rates; the arrival of foreign concepts, the ability to attract new franchisees; changes in customer tastes, demographic trends and in the attractiveness of concepts, traffic patterns, occupancy cost and occupancy level of malls and office towers; general economic and financial market conditions, the level of consumer confidence and spending, and the demand for, and prices of, the products; the ability to implement strategies and plans in order to produce the expected benefits; events affecting the ability of third-party suppliers to provide essential products and services; labour availability and cost; stock market volatility; volatility in foreign exchange rates or borrowing rates; foodborne illness; operational constraints and the event of the occurrence of epidemics, pandemics and other health risks. These and other risk factors that could cause actual results or events to differ materially from the expectations expressed in or implied by these forward-looking statements are discussed in this MD&A. Readers are cautioned that the risks described above are not the only ones that could impact the Company. Additional risks and uncertainties not currently known or that are currently deemed to be immaterial may also have a material adverse effect on the business, financial condition or results of operations. Except as otherwise indicated by the Company, forward-looking statements do not reflect the potential impact of any non-recurring or other special items or of any dispositions, monetizations, mergers, acquisitions, other business combinations or other transactions that may be announced or that may occur after October 9, 2018. The financial impact of these transactions and non-recurring and other special items can be complex and depends on the facts particular to each of them. The Company therefore cannot describe the expected impact in a meaningful way or in the same way that present known risks affecting our business.
Page 3
Compliance with International Financial Reporting Standards
Unless otherwise indicated, the financial information presented below, including tabular amounts, is prepared in accordance with International Financial Reporting Standards (“IFRS”). MTY uses earnings before interest, taxes, depreciation and amortization (“EBITDA”), because this measure enables management to assess the Company’s operational performance. The Company also discloses same-store sales growth, which are defined as comparative sales generated by stores that have been open for at least thirteen months or that have been acquired more than thirteen months ago. Same stores sales growth provides information on the comparative performance of the restaurants in our network from one period to the next. Similarly, the Company uses system sales to evaluate the size and performance of MTY’s network, as well as to indicate its income-generation potential. System sales include the sales of existing restaurants, of the ones that have closed or have opened during the period, as well as the sales of new concepts acquired from the closing date of the transaction and forward. These measures are widely accepted financial indicators but are not a measurement determined in accordance with IFRS and may not be comparable to those presented by other companies. These non-IFRS measures are intended to provide additional information about the performance of MTY, and should not be considered in isolation or as a substitute for measure of performance prepared in accordance with IFRS. The Company uses these measures to evaluate the performance of the business as they reflect its ongoing operations. Management believes that certain investors and analysts use EBITDA to measure a company’s ability to meet payment obligations or as a common measurement to value companies in the industry. Similarly, same-store sales growth and system sales provide additional information to investors about the performance of the network that is not available under IFRS. Both measures are components in the determination of short-term incentive compensation for some employees. Highlights of significant events during the nine-month period
Acquisition of the limited liability interests in CB Franchise Systems LLC and Built Franchise Systems LLC
On December 1, 2017, the Company announced that it had completed the acquisition of the limited liability company interests in CB Franchise Systems LLC and Built Franchise Systems LLC. The purchase price was $31.0 million (US$ 24.3 million) of which $28.3 million (US$ 22.3 million) was paid at closing. At closing 41 franchised and 3 corporately owned restaurants were in operation. Completion of combination agreement with Imvescor On March 1, 2018, the Company, through the merger of a wholly-owned subsidiary with Imvescor Restaurant Group Inc. (“IRG”), acquired all the outstanding shares of IRG. The total consideration for the transaction was $250.2 million, of which $53.1 million was settled in cash and the remaining in shares. At closing IRG operated 5 brands in Canada and had 261 locations in operation.
Page 4
Acquisition of the assets of Grabbagreen®
On March 15, 2018, one of the Company’s wholly-owned subsidiaries acquired the assets of Grabbagreen®. The total consideration amounted to $3.4 million (US$ 2.6 million), of which $3.1 million (US$ 2.4 million) was paid on closing. At closing, there were 27 locations in operation in the United States. Acquisition of the assets of Timothy’s World Coffee® and Mmmuffins® On April 4, 2018, one of the Company’s wholly-owned subsidiaries acquired the assets of Timothy’s World Coffee® and Mmmuffins®. The total consideration amounted to $1.5 million, of which $1.2 million was paid on closing. At closing, there were 39 locations in operation in Canada. Core business
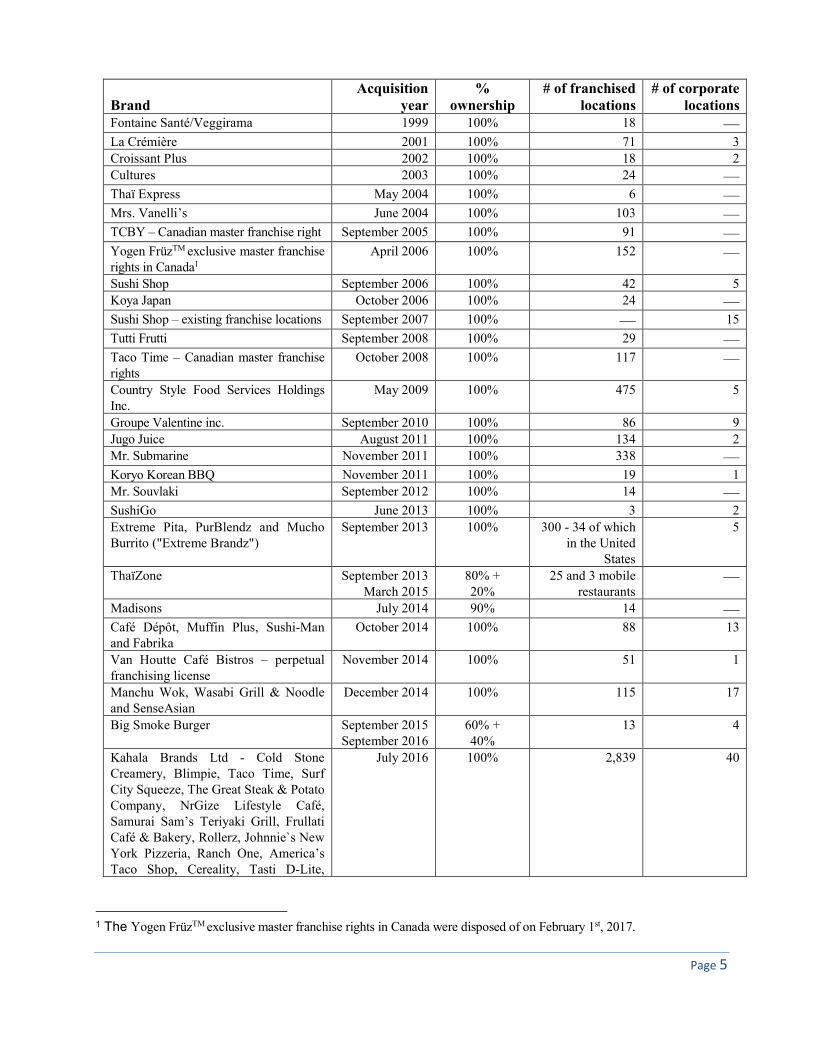
MTY franchises and operates quick-service and casual dining restaurants under the following banners: Tiki-Ming, Sukiyaki, La Crémière, Au Vieux Duluth Express, Panini Pizza Pasta, Villa Madina, Cultures, Thaï Express, Vanellis, Kim Chi, “TCBY”, Sushi Shop, Koya Japan, Vie & Nam, Tandori, O’Burger, Tutti Frutti, Taco Time, Country Style, Buns Master, Valentine, Jugo Juice, Mr. Sub, Koryo Korean Barbeque, Mr. Souvlaki, Sushi Go, Mucho Burrito, Extreme Pita, PurBlendz, ThaïZone, Madisons New York Grill & Bar, Café Dépôt, Muffin Plus, Sushi-Man, Fabrika, Van Houtte, Manchu Wok, Wasabi Grill & Noodle, Tosto, Big Smoke Burger, Cold Stone Creamery, Blimpie, Surf City Squeeze, The Great Steak & Potato Company, NrGize Lifestyle Café, Samurai Sam’s Teriyaki Grill, Frullati Café & Bakery, Rollerz, Johnnie`s New York Pizzeria, Ranch One, America’s Taco Shop, Cereality, Tasti D-Lite, Planet Smoothie, Maui Wowi, Pinkberry, Baja Fresh Mexican Grill, La Salsa Fresh Mexican Grill, La Diperie, Steak Frites St-Paul, Giorgio Ristorante, The Works Gourmet Burger Bistro, Houston Avenue Bar & Grill and Industria Pizzeria + Bar, Dagwoods Sandwiches and Salads, The Counter Custom Burgers, Built Custom Burgers, Baton Rouge, Pizza Delight, Scores, Toujours Mikes, Ben & Florentine, Grabbagreen, Timothy’s World Coffee, and Mmmuffins. As at August 31, 2018, MTY had 5,690 locations in operation, of which 5,615 were franchised or under operator agreements and the remaining 75 locations were operated by MTY. MTY’s locations can be found in: i) mall and office tower food courts and shopping malls; ii) street front; and, iii) non-traditional format within airports, petroleum retailers, convenience stores, cinemas, amusement parks, in other venues or retailers shared sites, hospitals, universities and food-truck carts. The street front locations are mostly made up of the Country Style, La Crémière, Sushi Shop, Taco Time, Tutti Frutti, Valentine, Mr. Sub, ThaïZone, Extreme Pita, Mucho Burrito, Madisons, Houston Avenue Bar & Grill, Industria Pizzeria + Bar, Steak Frites St-Paul, Giorgio Ristorante, The Works Gourmet Burger Bistro, Blimpie, Cold Stone Creamery, Baja Fresh Mexican Grill, The Counter Custom Burgers, Built Custom Burgers, Baton Rouge, Scores, Pizza Delight, Toujours Mikes, Ben & Florentine and Grabbagreen. La Crémière, “TCBY” and La Diperie operate primarily from April to September and the other banners generally operate year-round. MTY has developed several quick service restaurant concepts: Tiki-Ming (Chinese cuisine), was its first banner, followed by Sukiyaki (a Japanese delight), Franx Supreme (hot dog/hamburger), Panini Pizza Pasta, Chick’n’Chick, Caferama, Carrefour Oriental, Villa Madina, Kim Chi, Vie & Nam, Tandori, O’Burger and Tosto. Other banners added through acquisitions include:
Page 5
Brand Acquisition
year %
ownership # of franchised
locations # of corporate
locations Fontaine Santé/Veggirama 1999 100% 18 —
La Crémière 2001 100% 71 3
Croissant Plus 2002 100% 18 2
Cultures 2003 100% 24 —
Thaï Express May 2004 100% 6 —
Mrs. Vanelli’s June 2004 100% 103 —
TCBY – Canadian master franchise right September 2005 100% 91 —
Yogen FrüzTM exclusive master franchise rights in Canada1
April 2006 100% 152 —
Sushi Shop September 2006 100% 42 5
Koya Japan October 2006 100% 24 —
Sushi Shop – existing franchise locations September 2007 100% — 15
Tutti Frutti September 2008 100% 29 —
Taco Time – Canadian master franchise rights
October 2008 100% 117 —
Country Style Food Services Holdings Inc.
May 2009 100% 475 5
Groupe Valentine inc. September 2010 100% 86 9
Jugo Juice August 2011 100% 134 2
Mr. Submarine November 2011 100% 338 —
Koryo Korean BBQ November 2011 100% 19 1
Mr. Souvlaki September 2012 100% 14 —
SushiGo June 2013 100% 3 2
Extreme Pita, PurBlendz and Mucho Burrito ("Extreme Brandz")
September 2013 100% 300 - 34 of which in the United
States
5
ThaïZone September 2013 March 2015
80% + 20%
25 and 3 mobile restaurants
—
Madisons July 2014 90% 14 —
Café Dépôt, Muffin Plus, Sushi-Man and Fabrika
October 2014 100% 88 13
Van Houtte Café Bistros – perpetual franchising license
November 2014 100% 51 1
Manchu Wok, Wasabi Grill & Noodle and SenseAsian
December 2014 100% 115 17
Big Smoke Burger September 2015 September 2016
60% + 40%
13 4
Kahala Brands Ltd - Cold Stone Creamery, Blimpie, Taco Time, Surf City Squeeze, The Great Steak & Potato Company, NrGize Lifestyle Café, Samurai Sam’s Teriyaki Grill, Frullati Café & Bakery, Rollerz, Johnnie`s New York Pizzeria, Ranch One, America’s Taco Shop, Cereality, Tasti D-Lite,
July 2016 100% 2,839 40
1 The Yogen FrüzTM exclusive master franchise rights in Canada were disposed of on February 1st, 2017.
Page 6
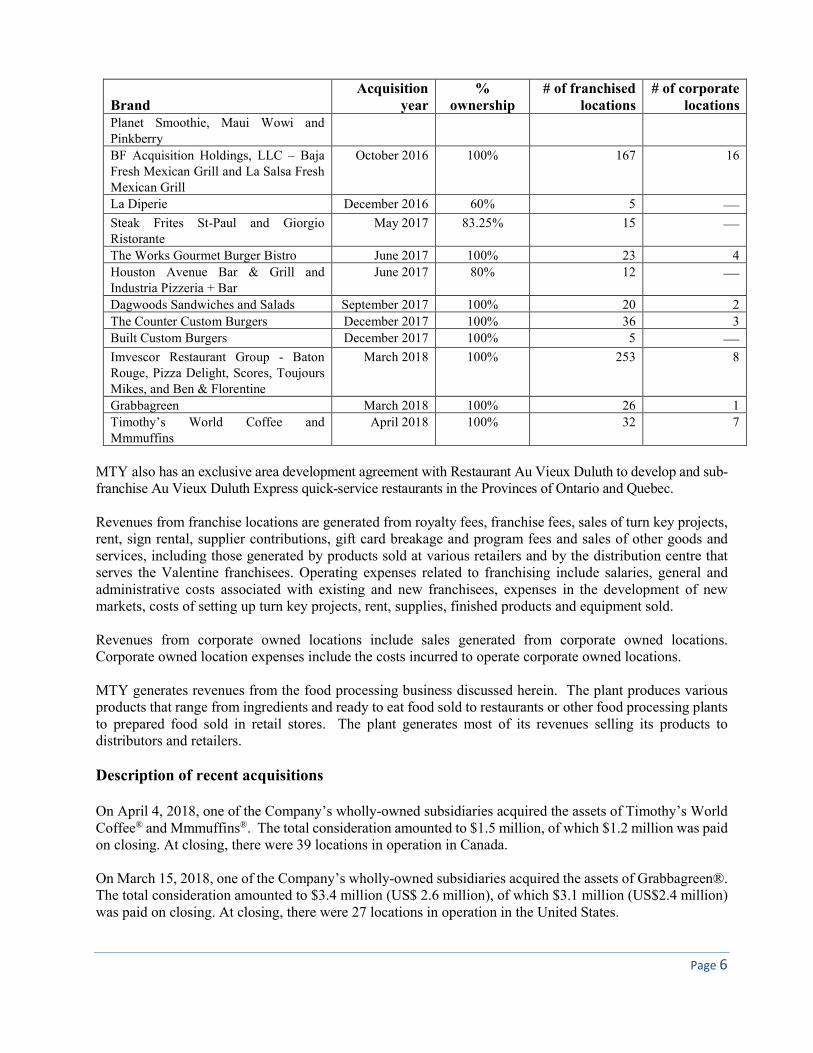
Brand Acquisition
year %
ownership # of franchised
locations # of corporate
locations Planet Smoothie, Maui Wowi and Pinkberry
BF Acquisition Holdings, LLC – Baja Fresh Mexican Grill and La Salsa Fresh Mexican Grill
October 2016 100% 167 16
La Diperie December 2016 60% 5 —
Steak Frites St-Paul and Giorgio Ristorante
May 2017 83.25% 15 —
The Works Gourmet Burger Bistro June 2017 100% 23 4
Houston Avenue Bar & Grill and Industria Pizzeria + Bar
June 2017 80% 12 —
Dagwoods Sandwiches and Salads September 2017 100% 20 2
The Counter Custom Burgers December 2017 100% 36 3
Built Custom Burgers December 2017 100% 5 —
Imvescor Restaurant Group - Baton Rouge, Pizza Delight, Scores, Toujours Mikes, and Ben & Florentine
March 2018 100% 253 8
Grabbagreen March 2018 100% 26 1
Timothy’s World Coffee and Mmmuffins
April 2018 100% 32 7
MTY also has an exclusive area development agreement with Restaurant Au Vieux Duluth to develop and sub-franchise Au Vieux Duluth Express quick-service restaurants in the Provinces of Ontario and Quebec. Revenues from franchise locations are generated from royalty fees, franchise fees, sales of turn key projects, rent, sign rental, supplier contributions, gift card breakage and program fees and sales of other goods and services, including those generated by products sold at various retailers and by the distribution centre that serves the Valentine franchisees. Operating expenses related to franchising include salaries, general and administrative costs associated with existing and new franchisees, expenses in the development of new markets, costs of setting up turn key projects, rent, supplies, finished products and equipment sold. Revenues from corporate owned locations include sales generated from corporate owned locations. Corporate owned location expenses include the costs incurred to operate corporate owned locations. MTY generates revenues from the food processing business discussed herein. The plant produces various products that range from ingredients and ready to eat food sold to restaurants or other food processing plants to prepared food sold in retail stores. The plant generates most of its revenues selling its products to distributors and retailers. Description of recent acquisitions On April 4, 2018, one of the Company’s wholly-owned subsidiaries acquired the assets of Timothy’s World Coffee® and Mmmuffins®. The total consideration amounted to $1.5 million, of which $1.2 million was paid on closing. At closing, there were 39 locations in operation in Canada. On March 15, 2018, one of the Company’s wholly-owned subsidiaries acquired the assets of Grabbagreen®. The total consideration amounted to $3.4 million (US$ 2.6 million), of which $3.1 million (US$2.4 million) was paid on closing. At closing, there were 27 locations in operation in the United States.
Page 7
On March 1, 2018, the Company, through the merger of a wholly-owned subsidiary with Imvescor Restaurant Group Inc. (“IRG”), acquired all the outstanding shares of IRG. The total consideration for the transaction was $250.2 million, of which $53.1 million was settled in cash and the remaining in shares. At closing IRG operated 5 brands in Canada and had 261 locations in operation.
On December 1, 2017, the Company announced that it had completed the acquisition of the limited liability company interests in CB Franchise Systems LLC and Built Franchise Systems LLC. The purchase price was $31.0 million (US$ 24.3 million) of which $28.3 million (US$ 22.3 million) was settled in cash. At closing 41 franchised and 3 corporately owned restaurants were in operation. The network has locations in the United States of America, Canada, Ghana, Ireland, Japan, Mexico, Saudi Arabia and the United Kingdom.
On September 29, 2017, the Company announced it had completed the acquisition of the assets of Dagwoods Sandwiches and Salads. The purchase price was $3.0 million of which $2.6 million was settled in cash. At closing, there were 22 locations in operation, all of them located in Canada.
On June 16, 2017, the Company announced it had completed through its 80% controlling interest in a subsidiary the acquisition of the assets of Houston Avenue Bar & Grill (“Houston”) and Industria Pizzeria + Bar (“Industria”). The Company’s share of the purchase consideration was $16.8 million of which $12.8 million was settled in cash. At closing nine Houston and three Industria were in operation. All locations are located in Canada.
On June 9, 2017, the Company announced it had completed the acquisition of the assets of The Works Gourmet Burger Bistro. The purchase price was $8.2 million of which $7.1 million was settled in cash. At closing, there were 27 locations in operation, all of them located in Canada.
On May 8, 2017, the Company announced that it had completed the acquisition of the assets of Steak Frites St-Paul and Giorgio Ristorante for an amount of $0.4 million, of which $0.3 million was paid from cash on hand. At closing, six Giorgio Ristorante and nine Steak Frites were in operation. All locations are located in Canada.
On April 19, 2017, the Company acquired the remaining non-controlling shareholder interest in 7687567 Canada Inc. (Lucky 8) for a non-material cash consideration.
On December 9, 2016, the Company announced that it had completed through its 60% controlling interest in a subsidiary the acquisition of the assets of La Diperie. The Company’s share of the purchase consideration amounted to $0.9 million, satisfied by the payment of $0.8 million cash. At closing, La Diperie operated 5 stores in Canada.
Page 8
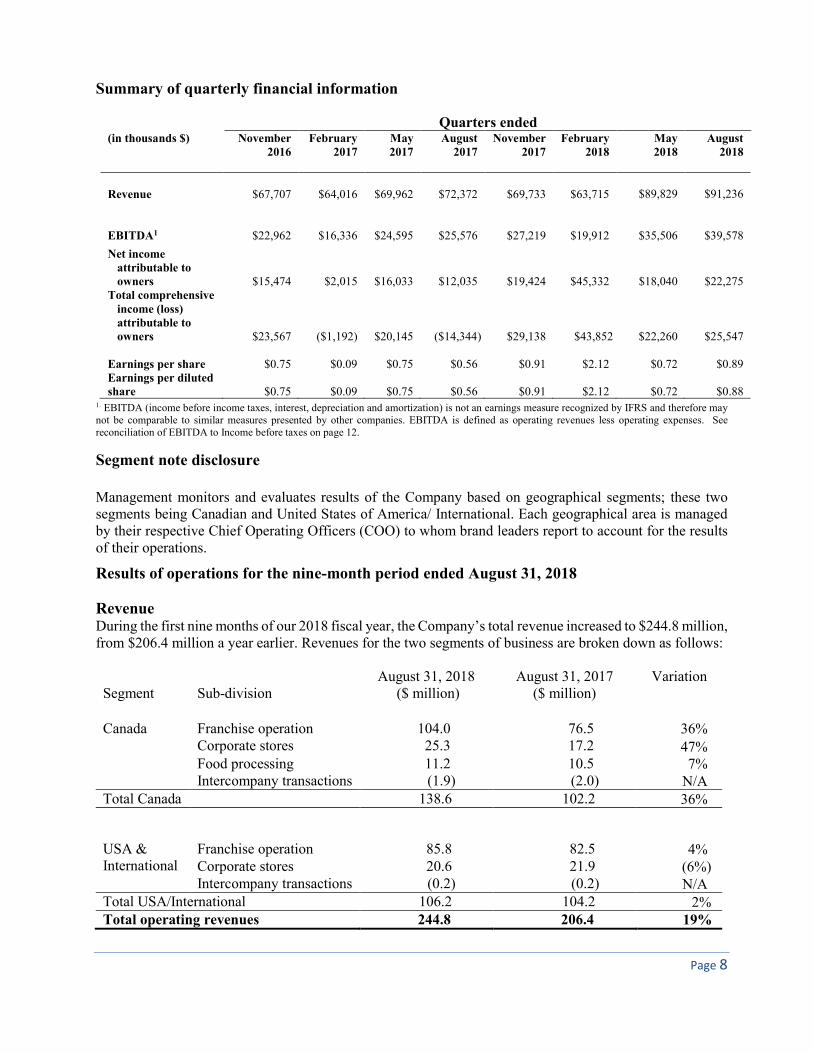
Summary of quarterly financial information
1. EBITDA (income before income taxes, interest, depreciation and amortization) is not an earnings measure recognized by IFRS and therefore may not be comparable to similar measures presented by other companies. EBITDA is defined as operating revenues less operating expenses. See reconciliation of EBITDA to Income before taxes on page 12.
Segment note disclosure Management monitors and evaluates results of the Company based on geographical segments; these two segments being Canadian and United States of America/ International. Each geographical area is managed by their respective Chief Operating Officers (COO) to whom brand leaders report to account for the results of their operations.
Results of operations for the nine-month period ended August 31, 2018 Revenue During the first nine months of our 2018 fiscal year, the Company’s total revenue increased to $244.8 million, from $206.4 million a year earlier. Revenues for the two segments of business are broken down as follows: Segment
Sub-division
August 31, 2018 ($ million)
August 31, 2017 ($ million)
Variation
Canada Franchise operation 104.0 76.5 36% Corporate stores 25.3 17.2 47% Food processing 11.2 10.5 7% Intercompany transactions (1.9) (2.0) N/A Total Canada 138.6 102.2 36%
USA & International
Franchise operation 85.8 82.5 4% Corporate stores 20.6 21.9 (6%)
Intercompany transactions (0.2) (0.2) N/A Total USA/International 106.2 104.2 2% Total operating revenues 244.8 206.4 19%
Quarters ended (in thousands $)
November
2016 February
2017 May 2017
August 2017
November 2017
February 2018
May 2018
August 2018
Revenue $67,707 $64,016 $69,962 $72,372 $69,733 $63,715
$89,829
$91,236
EBITDA1 $22,962 $16,336 $24,595 $25,576 $27,219 $19,912
$35,506
$39,578
Net income attributable to owners $15,474 $2,015 $16,033 $12,035 $19,424 $45,332
$18,040
$22,275 Total comprehensive
income (loss) attributable to owners $23,567 ($1,192) $20,145 ($14,344) $29,138 $43,852
$22,260
$25,547
Earnings per share $0.75 $0.09 $0.75 $0.56 $0.91 $2.12
$0.72
$0.89 Earnings per diluted share $0.75 $0.09 $0.75 $0.56 $0.91 $2.12
$0.72
$0.88
Page 9
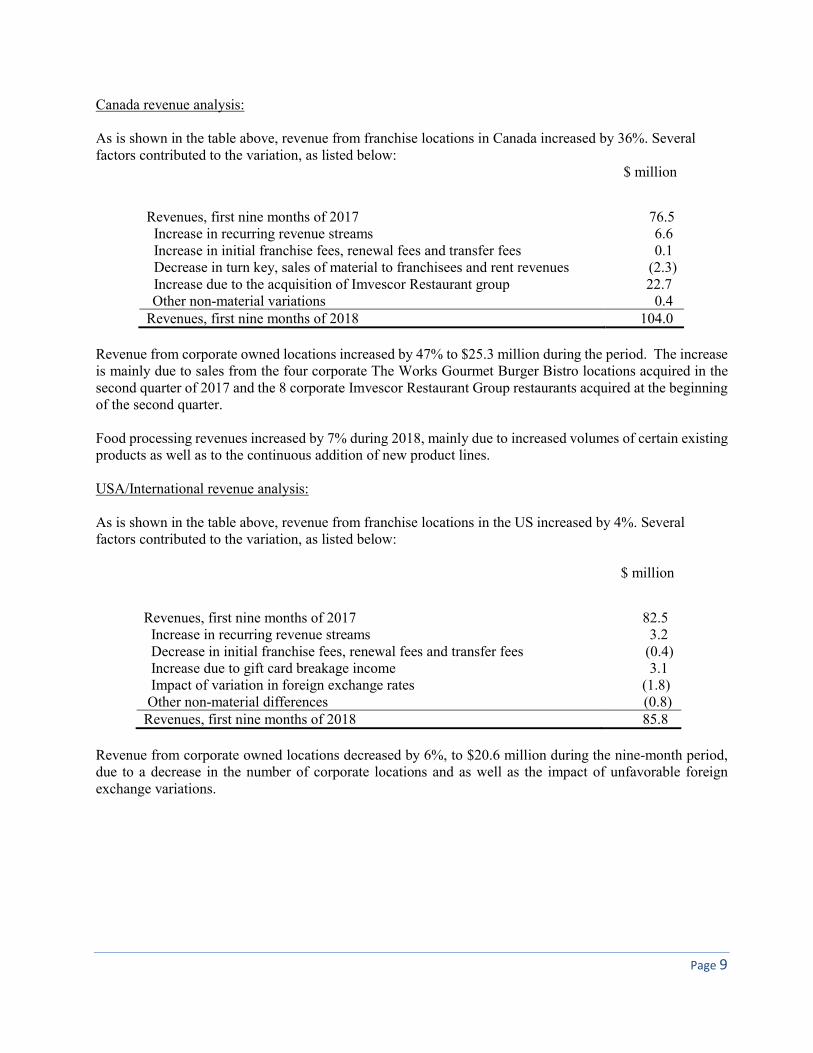
Canada revenue analysis: As is shown in the table above, revenue from franchise locations in Canada increased by 36%. Several factors contributed to the variation, as listed below:
$ million
Revenues, first nine months of 2017 76.5 Increase in recurring revenue streams 6.6 Increase in initial franchise fees, renewal fees and transfer fees 0.1 Decrease in turn key, sales of material to franchisees and rent revenues (2.3) Increase due to the acquisition of Imvescor Restaurant group 22.7 Other non-material variations 0.4 Revenues, first nine months of 2018 104.0
Revenue from corporate owned locations increased by 47% to $25.3 million during the period. The increase is mainly due to sales from the four corporate The Works Gourmet Burger Bistro locations acquired in the second quarter of 2017 and the 8 corporate Imvescor Restaurant Group restaurants acquired at the beginning of the second quarter. Food processing revenues increased by 7% during 2018, mainly due to increased volumes of certain existing products as well as to the continuous addition of new product lines. USA/International revenue analysis: As is shown in the table above, revenue from franchise locations in the US increased by 4%. Several factors contributed to the variation, as listed below:
$ million
Revenues, first nine months of 2017 82.5 Increase in recurring revenue streams 3.2 Decrease in initial franchise fees, renewal fees and transfer fees (0.4) Increase due to gift card breakage income 3.1 Impact of variation in foreign exchange rates (1.8) Other non-material differences (0.8) Revenues, first nine months of 2018 85.8
Revenue from corporate owned locations decreased by 6%, to $20.6 million during the nine-month period, due to a decrease in the number of corporate locations and as well as the impact of unfavorable foreign exchange variations.
Page 10
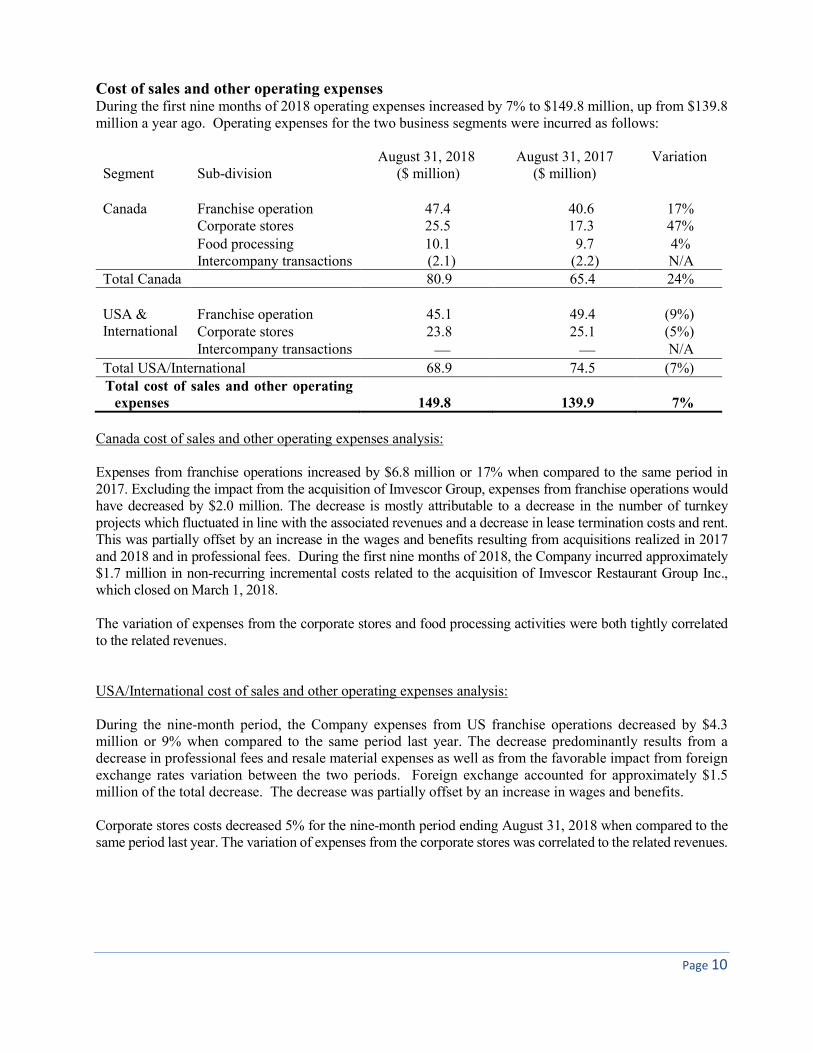
Cost of sales and other operating expenses During the first nine months of 2018 operating expenses increased by 7% to $149.8 million, up from $139.8 million a year ago. Operating expenses for the two business segments were incurred as follows: Segment
Sub-division
August 31, 2018 ($ million)
August 31, 2017 ($ million)
Variation
Canada Franchise operation 47.4 40.6 17% Corporate stores 25.5 17.3 47% Food processing 10.1 9.7 4% Intercompany transactions (2.1) (2.2) N/A Total Canada 80.9 65.4 24% USA & International
Franchise operation 45.1 49.4 (9%) Corporate stores 23.8 25.1 (5%)
Intercompany transactions — — N/A
Total USA/International 68.9 74.5 (7%) Total cost of sales and other operating
expenses 149.8 139.9 7%
Canada cost of sales and other operating expenses analysis: Expenses from franchise operations increased by $6.8 million or 17% when compared to the same period in 2017. Excluding the impact from the acquisition of Imvescor Group, expenses from franchise operations would have decreased by $2.0 million. The decrease is mostly attributable to a decrease in the number of turnkey projects which fluctuated in line with the associated revenues and a decrease in lease termination costs and rent. This was partially offset by an increase in the wages and benefits resulting from acquisitions realized in 2017 and 2018 and in professional fees. During the first nine months of 2018, the Company incurred approximately $1.7 million in non-recurring incremental costs related to the acquisition of Imvescor Restaurant Group Inc., which closed on March 1, 2018. The variation of expenses from the corporate stores and food processing activities were both tightly correlated to the related revenues. USA/International cost of sales and other operating expenses analysis: During the nine-month period, the Company expenses from US franchise operations decreased by $4.3 million or 9% when compared to the same period last year. The decrease predominantly results from a decrease in professional fees and resale material expenses as well as from the favorable impact from foreign exchange rates variation between the two periods. Foreign exchange accounted for approximately $1.5 million of the total decrease. The decrease was partially offset by an increase in wages and benefits. Corporate stores costs decreased 5% for the nine-month period ending August 31, 2018 when compared to the same period last year. The variation of expenses from the corporate stores was correlated to the related revenues.
Page 11
Earnings before interest, taxes, depreciation and amortization (EBITDA)
Nine months ended August 31, 2018
(In millions $) Canada USA &
International
Total
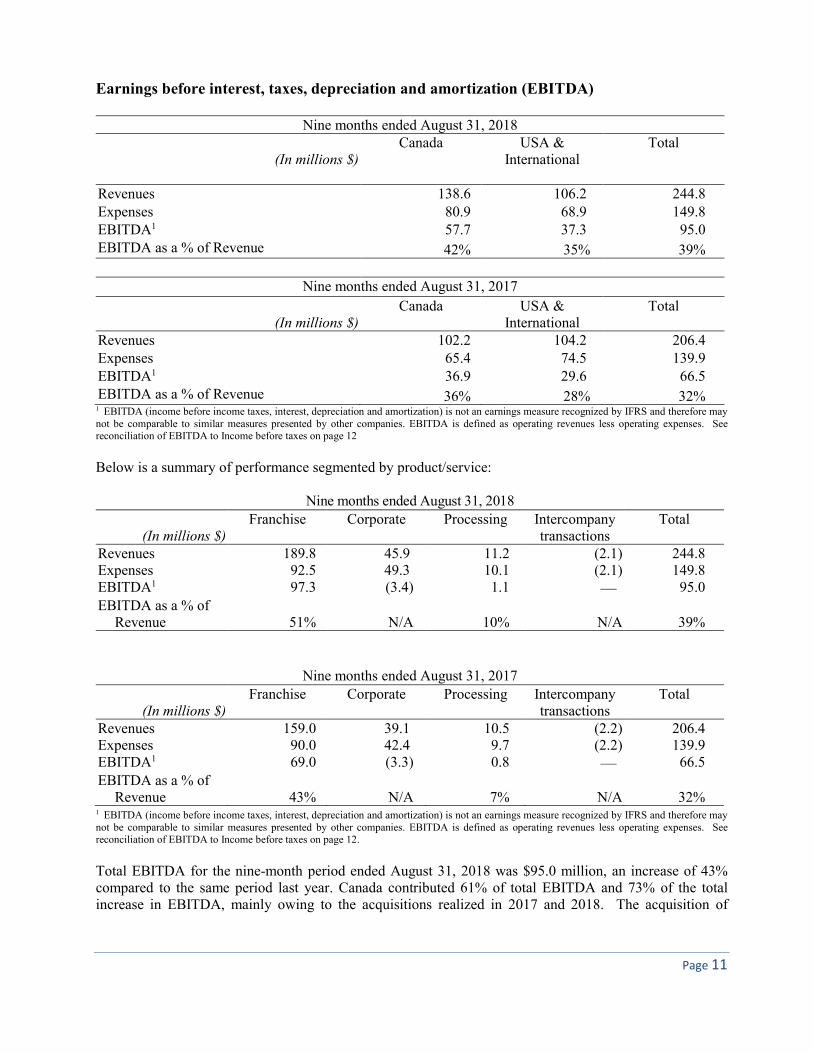
Revenues 138.6 106.2 244.8 Expenses 80.9 68.9 149.8 EBITDA1 57.7 37.3 95.0 EBITDA as a % of Revenue 42% 35% 39%
Nine months ended August 31, 2017
(In millions $)
Canada USA & International
Total
Revenues 102.2 104.2 206.4 Expenses 65.4 74.5 139.9 EBITDA1 36.9 29.6 66.5 EBITDA as a % of Revenue 36% 28% 32%
1 EBITDA (income before income taxes, interest, depreciation and amortization) is not an earnings measure recognized by IFRS and therefore may not be comparable to similar measures presented by other companies. EBITDA is defined as operating revenues less operating expenses. See reconciliation of EBITDA to Income before taxes on page 12 Below is a summary of performance segmented by product/service:
Nine months ended August 31, 2018
(In millions $)
Franchise
Corporate Processing Intercompany transactions
Total
Revenues 189.8 45.9 11.2 (2.1) 244.8 Expenses 92.5 49.3 10.1 (2.1) 149.8 EBITDA1 97.3 (3.4) 1.1 — 95.0
EBITDA as a % of Revenue 51% N/A 10% N/A 39%
Nine months ended August 31, 2017
(In millions $)
Franchise Corporate Processing Intercompany transactions
Total
Revenues 159.0 39.1 10.5 (2.2) 206.4 Expenses 90.0 42.4 9.7 (2.2) 139.9 EBITDA1 69.0 (3.3) 0.8 — 66.5
EBITDA as a % of Revenue 43% N/A 7% N/A 32%
1 EBITDA (income before income taxes, interest, depreciation and amortization) is not an earnings measure recognized by IFRS and therefore may not be comparable to similar measures presented by other companies. EBITDA is defined as operating revenues less operating expenses. See reconciliation of EBITDA to Income before taxes on page 12.
Total EBITDA for the nine-month period ended August 31, 2018 was $95.0 million, an increase of 43% compared to the same period last year. Canada contributed 61% of total EBITDA and 73% of the total increase in EBITDA, mainly owing to the acquisitions realized in 2017 and 2018. The acquisition of
Page 12
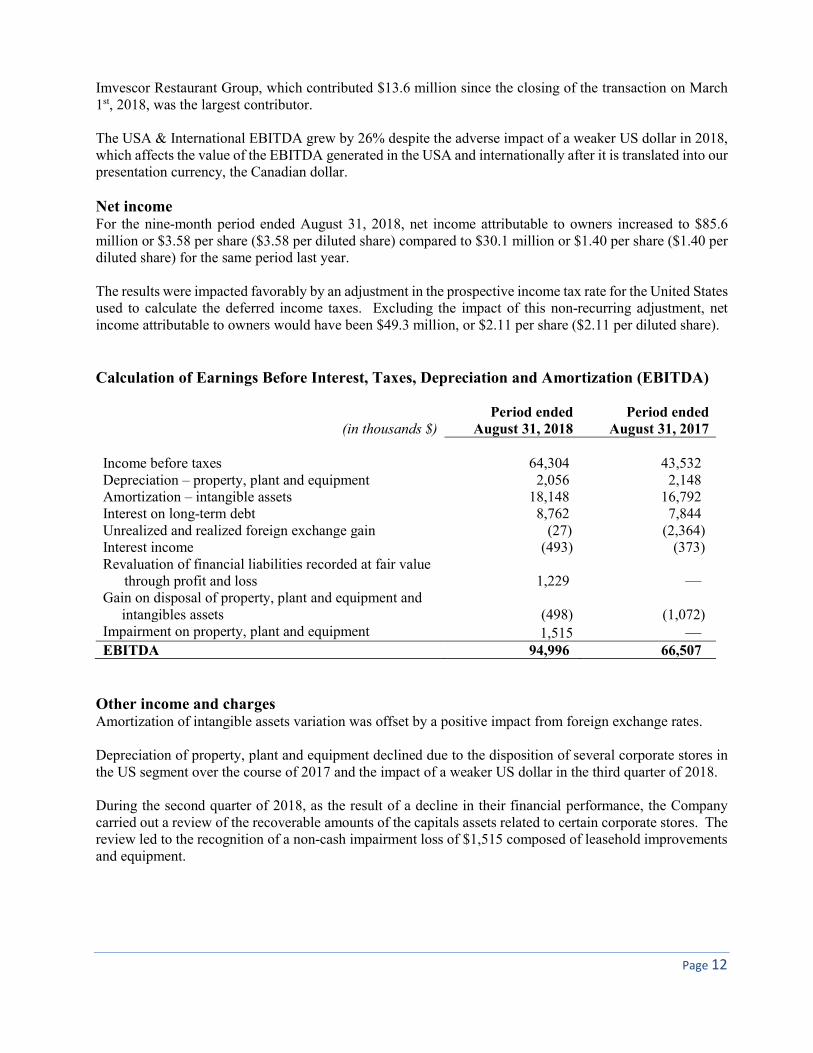
Imvescor Restaurant Group, which contributed $13.6 million since the closing of the transaction on March 1st, 2018, was the largest contributor. The USA & International EBITDA grew by 26% despite the adverse impact of a weaker US dollar in 2018, which affects the value of the EBITDA generated in the USA and internationally after it is translated into our presentation currency, the Canadian dollar. Net income For the nine-month period ended August 31, 2018, net income attributable to owners increased to $85.6 million or $3.58 per share ($3.58 per diluted share) compared to $30.1 million or $1.40 per share ($1.40 per diluted share) for the same period last year. The results were impacted favorably by an adjustment in the prospective income tax rate for the United States used to calculate the deferred income taxes. Excluding the impact of this non-recurring adjustment, net income attributable to owners would have been $49.3 million, or $2.11 per share ($2.11 per diluted share). Calculation of Earnings Before Interest, Taxes, Depreciation and Amortization (EBITDA)
(in thousands $) Period ended
August 31, 2018 Period ended
August 31, 2017 Income before taxes 64,304 43,532 Depreciation – property, plant and equipment 2,056 2,148 Amortization – intangible assets 18,148 16,792 Interest on long-term debt 8,762 7,844 Unrealized and realized foreign exchange gain (27) (2,364) Interest income (493) (373) Revaluation of financial liabilities recorded at fair value
through profit and loss 1,229 — Gain on disposal of property, plant and equipment and
intangibles assets (498) (1,072) Impairment on property, plant and equipment 1,515 — EBITDA 94,996 66,507
Other income and charges Amortization of intangible assets variation was offset by a positive impact from foreign exchange rates. Depreciation of property, plant and equipment declined due to the disposition of several corporate stores in the US segment over the course of 2017 and the impact of a weaker US dollar in the third quarter of 2018. During the second quarter of 2018, as the result of a decline in their financial performance, the Company carried out a review of the recoverable amounts of the capitals assets related to certain corporate stores. The review led to the recognition of a non-cash impairment loss of $1,515 composed of leasehold improvements and equipment.
Page 13
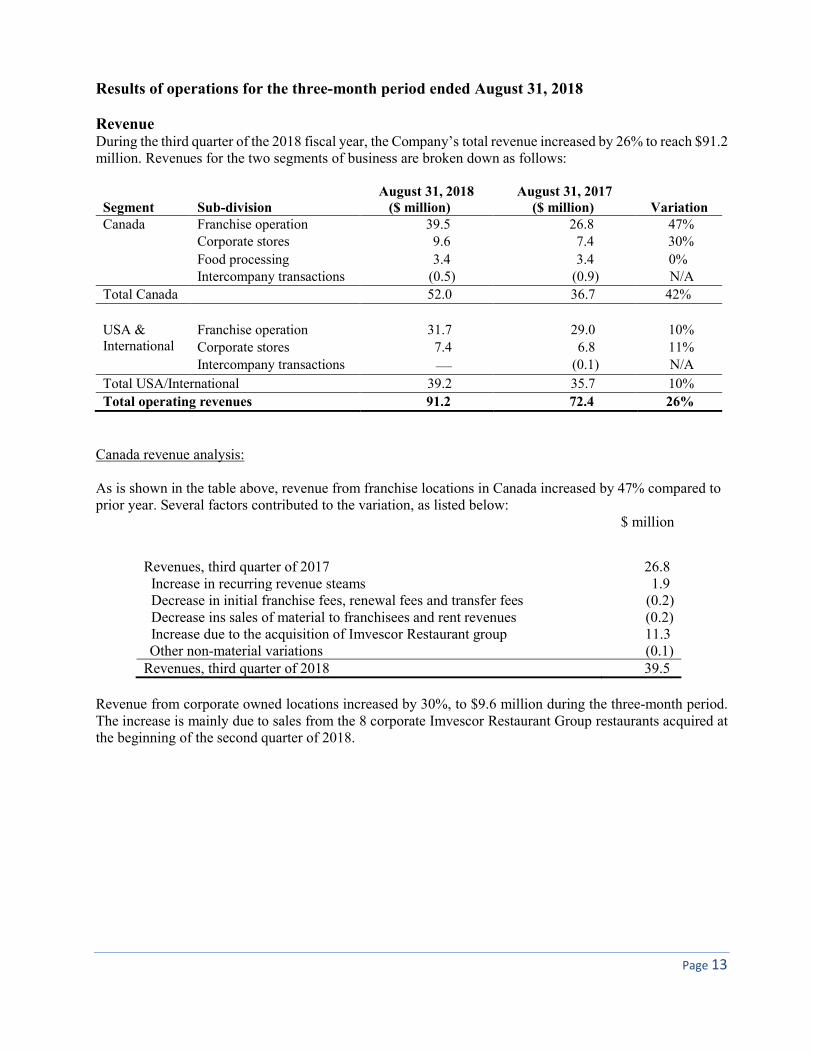
Results of operations for the three-month period ended August 31, 2018 Revenue During the third quarter of the 2018 fiscal year, the Company’s total revenue increased by 26% to reach $91.2 million. Revenues for the two segments of business are broken down as follows:
Segment Sub-division August 31, 2018 ($ million)
August 31, 2017 ($ million) Variation
Canada Franchise operation 39.5 26.8 47% Corporate stores 9.6 7.4 30%
Food processing 3.4 3.4 0% Intercompany transactions (0.5) (0.9) N/A
Total Canada 52.0 36.7 42%
USA & International
Franchise operation 31.7 29.0 10% Corporate stores 7.4 6.8 11%
Intercompany transactions — (0.1) N/A
Total USA/International 39.2 35.7 10%
Total operating revenues 91.2 72.4 26%
Canada revenue analysis: As is shown in the table above, revenue from franchise locations in Canada increased by 47% compared to prior year. Several factors contributed to the variation, as listed below:
$ million
Revenues, third quarter of 2017 26.8 Increase in recurring revenue steams 1.9 Decrease in initial franchise fees, renewal fees and transfer fees (0.2) Decrease ins sales of material to franchisees and rent revenues (0.2) Increase due to the acquisition of Imvescor Restaurant group 11.3 Other non-material variations (0.1) Revenues, third quarter of 2018 39.5
Revenue from corporate owned locations increased by 30%, to $9.6 million during the three-month period. The increase is mainly due to sales from the 8 corporate Imvescor Restaurant Group restaurants acquired at the beginning of the second quarter of 2018.
Page 14
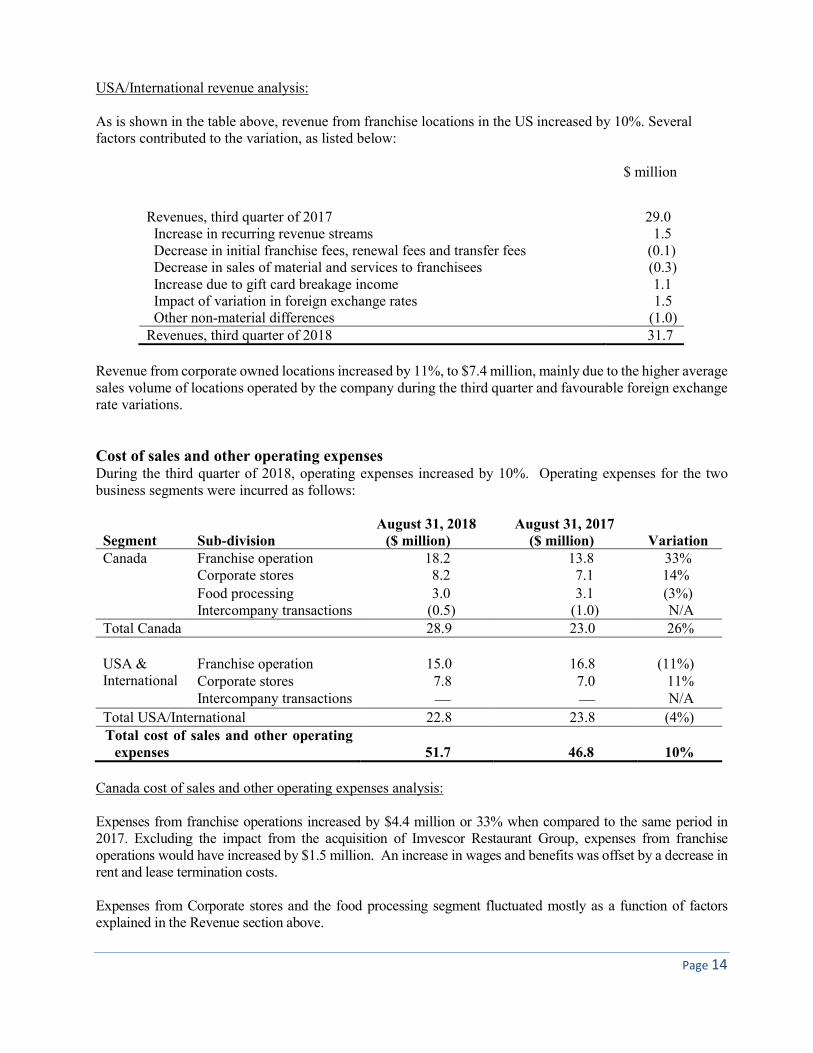
USA/International revenue analysis: As is shown in the table above, revenue from franchise locations in the US increased by 10%. Several factors contributed to the variation, as listed below:
$ million
Revenues, third quarter of 2017 29.0 Increase in recurring revenue streams 1.5 Decrease in initial franchise fees, renewal fees and transfer fees (0.1) Decrease in sales of material and services to franchisees (0.3) Increase due to gift card breakage income 1.1 Impact of variation in foreign exchange rates 1.5 Other non-material differences (1.0) Revenues, third quarter of 2018 31.7
Revenue from corporate owned locations increased by 11%, to $7.4 million, mainly due to the higher average sales volume of locations operated by the company during the third quarter and favourable foreign exchange rate variations. Cost of sales and other operating expenses During the third quarter of 2018, operating expenses increased by 10%. Operating expenses for the two business segments were incurred as follows:
Segment Sub-division August 31, 2018 ($ million)
August 31, 2017 ($ million) Variation
Canada Franchise operation 18.2 13.8 33% Corporate stores 8.2 7.1 14% Food processing 3.0 3.1 (3%) Intercompany transactions (0.5) (1.0) N/A Total Canada 28.9 23.0 26% USA & International
Franchise operation 15.0 16.8 (11%) Corporate stores 7.8 7.0 11%
Intercompany transactions — — N/A
Total USA/International 22.8 23.8 (4%) Total cost of sales and other operating
expenses 51.7 46.8 10%
Canada cost of sales and other operating expenses analysis: Expenses from franchise operations increased by $4.4 million or 33% when compared to the same period in 2017. Excluding the impact from the acquisition of Imvescor Restaurant Group, expenses from franchise operations would have increased by $1.5 million. An increase in wages and benefits was offset by a decrease in rent and lease termination costs. Expenses from Corporate stores and the food processing segment fluctuated mostly as a function of factors explained in the Revenue section above.
Page 15
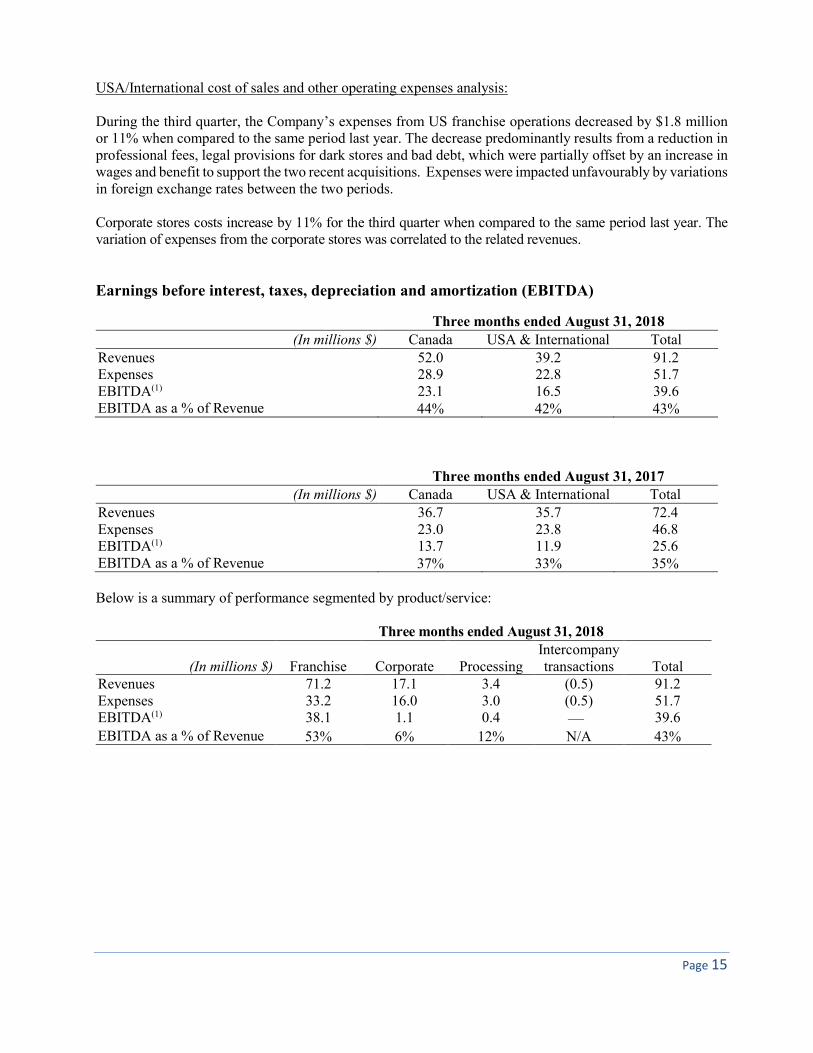
USA/International cost of sales and other operating expenses analysis: During the third quarter, the Company’s expenses from US franchise operations decreased by $1.8 million or 11% when compared to the same period last year. The decrease predominantly results from a reduction in professional fees, legal provisions for dark stores and bad debt, which were partially offset by an increase in wages and benefit to support the two recent acquisitions. Expenses were impacted unfavourably by variations in foreign exchange rates between the two periods. Corporate stores costs increase by 11% for the third quarter when compared to the same period last year. The variation of expenses from the corporate stores was correlated to the related revenues. Earnings before interest, taxes, depreciation and amortization (EBITDA)
Three months ended August 31, 2017 (In millions $) Canada USA & International Total
Revenues 36.7 35.7 72.4 Expenses 23.0 23.8 46.8 EBITDA(1) 13.7 11.9 25.6 EBITDA as a % of Revenue 37% 33% 35% Below is a summary of performance segmented by product/service: Three months ended August 31, 2018
(In millions $) Franchise Corporate Processing Intercompany transactions Total
Revenues 71.2 17.1 3.4 (0.5) 91.2 Expenses 33.2 16.0 3.0 (0.5) 51.7 EBITDA(1) 38.1 1.1 0.4 — 39.6 EBITDA as a % of Revenue 53% 6% 12% N/A 43%
Three months ended August 31, 2018 (In millions $) Canada USA & International Total
Revenues 52.0 39.2 91.2 Expenses 28.9 22.8 51.7 EBITDA(1) 23.1 16.5 39.6 EBITDA as a % of Revenue 44% 42% 43%
Page 16
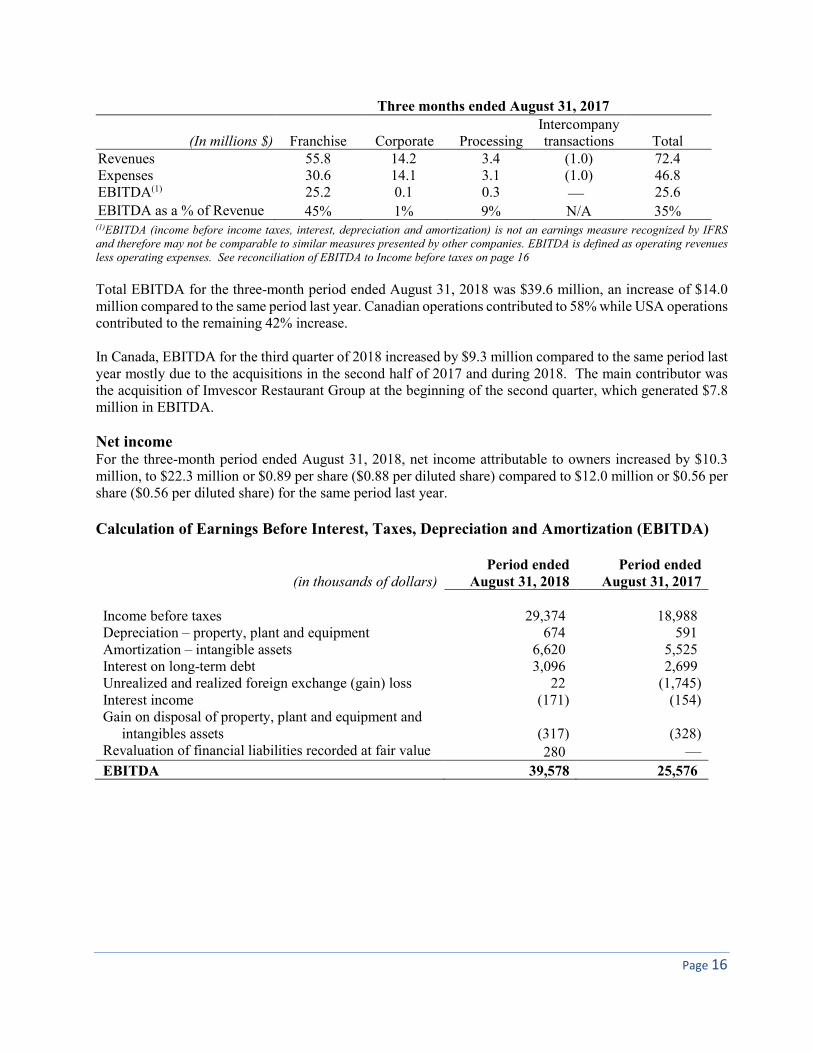
Three months ended August 31, 2017
(In millions $) Franchise Corporate Processing Intercompany transactions Total
Revenues 55.8 14.2 3.4 (1.0) 72.4 Expenses 30.6 14.1 3.1 (1.0) 46.8 EBITDA(1) 25.2 0.1 0.3 — 25.6
EBITDA as a % of Revenue 45% 1% 9% N/A 35% (1)EBITDA (income before income taxes, interest, depreciation and amortization) is not an earnings measure recognized by IFRS and therefore may not be comparable to similar measures presented by other companies. EBITDA is defined as operating revenues less operating expenses. See reconciliation of EBITDA to Income before taxes on page 16
Total EBITDA for the three-month period ended August 31, 2018 was $39.6 million, an increase of $14.0 million compared to the same period last year. Canadian operations contributed to 58% while USA operations contributed to the remaining 42% increase. In Canada, EBITDA for the third quarter of 2018 increased by $9.3 million compared to the same period last year mostly due to the acquisitions in the second half of 2017 and during 2018. The main contributor was the acquisition of Imvescor Restaurant Group at the beginning of the second quarter, which generated $7.8 million in EBITDA. Net income For the three-month period ended August 31, 2018, net income attributable to owners increased by $10.3 million, to $22.3 million or $0.89 per share ($0.88 per diluted share) compared to $12.0 million or $0.56 per share ($0.56 per diluted share) for the same period last year. Calculation of Earnings Before Interest, Taxes, Depreciation and Amortization (EBITDA)
(in thousands of dollars) Period ended
August 31, 2018 Period ended
August 31, 2017 Income before taxes 29,374 18,988 Depreciation – property, plant and equipment 674 591 Amortization – intangible assets 6,620 5,525 Interest on long-term debt 3,096 2,699 Unrealized and realized foreign exchange (gain) loss 22 (1,745) Interest income (171) (154) Gain on disposal of property, plant and equipment and
intangibles assets (317) (328) Revaluation of financial liabilities recorded at fair value 280 —
EBITDA 39,578 25,576
Page 17
Other income and charges Foreign exchange significantly varied due to the foreign exchange impact on the revaluation of a loan of one of its subsidiaries that is no longer being revalued in the statement of income. Interest on long-term debt increased to $3.1 million from $2.7 million during the three-month period as a result of the interest on the credit facilities, from which the company has drawn additional funds since the third quarter of 2017. Depreciation and amortization both increased significantly due to recent acquisitions, most notably that of Imvescor Restaurant Group which resulted in an increase in capital assets and amortizable franchise rights.
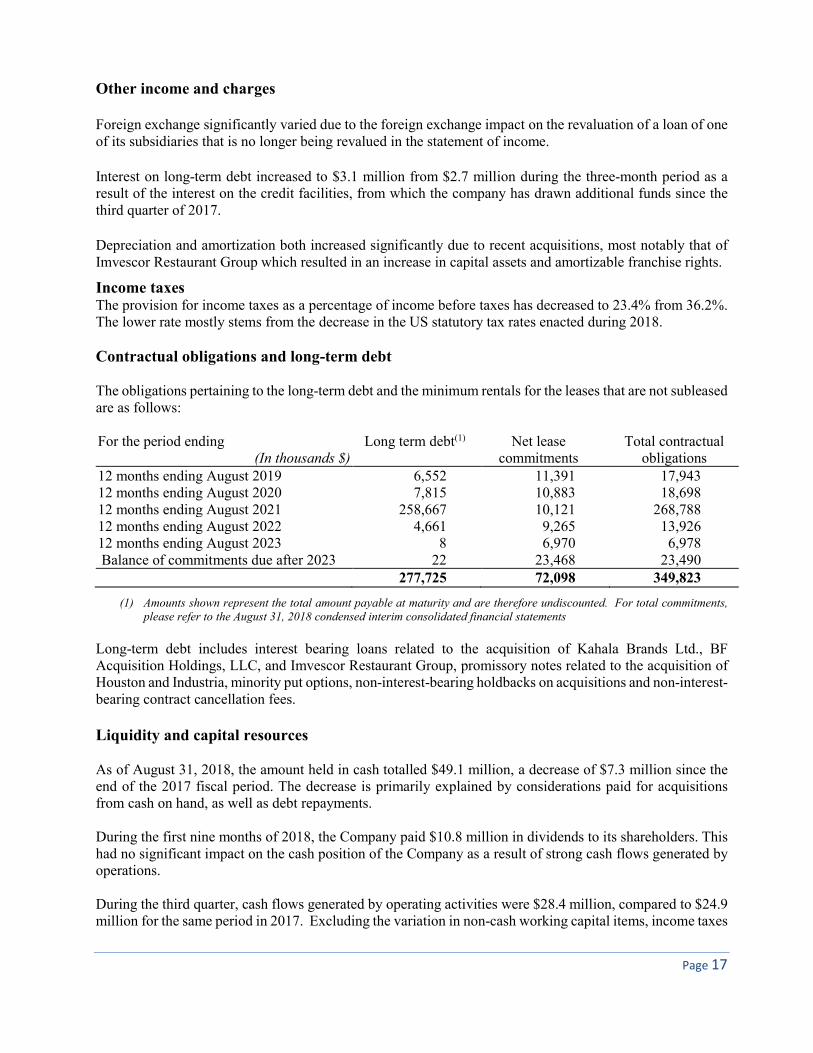
Income taxes The provision for income taxes as a percentage of income before taxes has decreased to 23.4% from 36.2%. The lower rate mostly stems from the decrease in the US statutory tax rates enacted during 2018. Contractual obligations and long-term debt The obligations pertaining to the long-term debt and the minimum rentals for the leases that are not subleased are as follows: For the period ending
(In thousands $) Long term debt(1) Net lease
commitments Total contractual
obligations 12 months ending August 2019 6,552 11,391 17,943 12 months ending August 2020 7,815 10,883 18,698 12 months ending August 2021 258,667 10,121 268,788 12 months ending August 2022 4,661 9,265 13,926 12 months ending August 2023 8 6,970 6,978 Balance of commitments due after 2023 22 23,468 23,490
277,725 72,098 349,823
(1) Amounts shown represent the total amount payable at maturity and are therefore undiscounted. For total commitments, please refer to the August 31, 2018 condensed interim consolidated financial statements
Long-term debt includes interest bearing loans related to the acquisition of Kahala Brands Ltd., BF Acquisition Holdings, LLC, and Imvescor Restaurant Group, promissory notes related to the acquisition of Houston and Industria, minority put options, non-interest-bearing holdbacks on acquisitions and non-interest-bearing contract cancellation fees. Liquidity and capital resources As of August 31, 2018, the amount held in cash totalled $49.1 million, a decrease of $7.3 million since the end of the 2017 fiscal period. The decrease is primarily explained by considerations paid for acquisitions from cash on hand, as well as debt repayments. During the first nine months of 2018, the Company paid $10.8 million in dividends to its shareholders. This had no significant impact on the cash position of the Company as a result of strong cash flows generated by operations. During the third quarter, cash flows generated by operating activities were $28.4 million, compared to $24.9 million for the same period in 2017. Excluding the variation in non-cash working capital items, income taxes
Page 18
and interest paid, operations generated $38.1 million in cash flows, compared to $27.3 million in 2017, which represents an increase of 39% compared to the same period last year. The increase is mostly due to the increase in EBITDA detailed above. The revolving credit facility has an authorized amount of $500,000 (November 30, 2017 - $305,000), of which $255,522 was drawn at August 31, 2018 (November 30, 2017 - $210,522).
The facility has the following financial covenants:
The Debt to EBITDA ratio must be less than 3.00:1.00. The interest and rent coverage ratio must be at 2.00:1.00 at all times.
The credit agreement also contains various limitations on distributions and on the usage of the proceeds from the disposal of assets which are not expected to impact the Company during the term of the credit agreement. The revolving facility is repayable without penalty with the balance due on the date of maturity July 21, 2021. At quarter end, the Company was in compliance with the covenants of the credit agreement. Financial position Accounts receivable at the end of the period were $44.1 million, compared to $34.2 million at the end of the 2017 fiscal period. The increase is entirely attributable to the acquisition of IRG. Intangible assets grew by $214.0 million. The increase is due to the acquisition of The Counter and Built Custom Burgers, Imvescor Restaurant Group, Grabbagreen and Timothy’s World Coffee and Mmmuffins during the period. The increase caused by the acquisitions was partially offset by the impact of foreign exchange variations and by the amortization expense recorded during the period. Accounts payable and accrued liabilities increased to $69.6 million as at August 31, 2018, from $57.6 million as at November 30, 2017. The majority of the $12.0 million increase is due to the acquisition of Imvescor with the remaining variance due to the timing of cash payments to suppliers. Provisions, which are composed of litigation and dispute, closed store and gift card provisions, increased to $80.9 million as at August 31, 2018 from $75.3 million as at November 30, 2017. The increase is mainly due to the gift card liability from the acquisition of Imvescor Restaurant Group and as well as an increase in lease termination provisions.
Long-term debt increased by $45.7 million. The increase is attributable to the additional funds required for the acquisition of Imvescor Restaurant Group Inc. and to the holdbacks payable in relation to the acquisitions of The Counter and Built Custom Burgers, Grabbagreen, Timothy’s World Coffee and Mmmuffins.
Deferred income tax balances were remeasured during the first quarter of 2018 using the new U.S statutory federal income tax rate, which decreased from 35% to 21%. This resulted in a decrease of the Company’s net liability by $36.3 million. This net tax benefit is estimated based on the initial analysis of the “U.S. Tax Cuts and Job Act”, and given the complexity of this act, this estimate is subject to adjustment when further guidance becomes available.
Further details on the above statement of financial position items can be found in the notes to the August 31, 2018 condensed interim consolidated financial statements.
Page 19
Capital stock During the first nine months of 2018 the Company issued 3,785,996 shares in connection with the acquisition of Imvescor Restaurant Group. The Company did not redeem any shares. Location information MTY’s locations can be found in: i) food courts and shopping malls; ii) street front; and iii) non-traditional format within petroleum retailers, convenience stores, cinemas, amusement parks, in other venues or retailer shared sites, hospitals, universities and airports. The non-traditional locations are typically smaller in size, require lower investment and generate lower revenue than the shopping malls, food courts and street front locations.
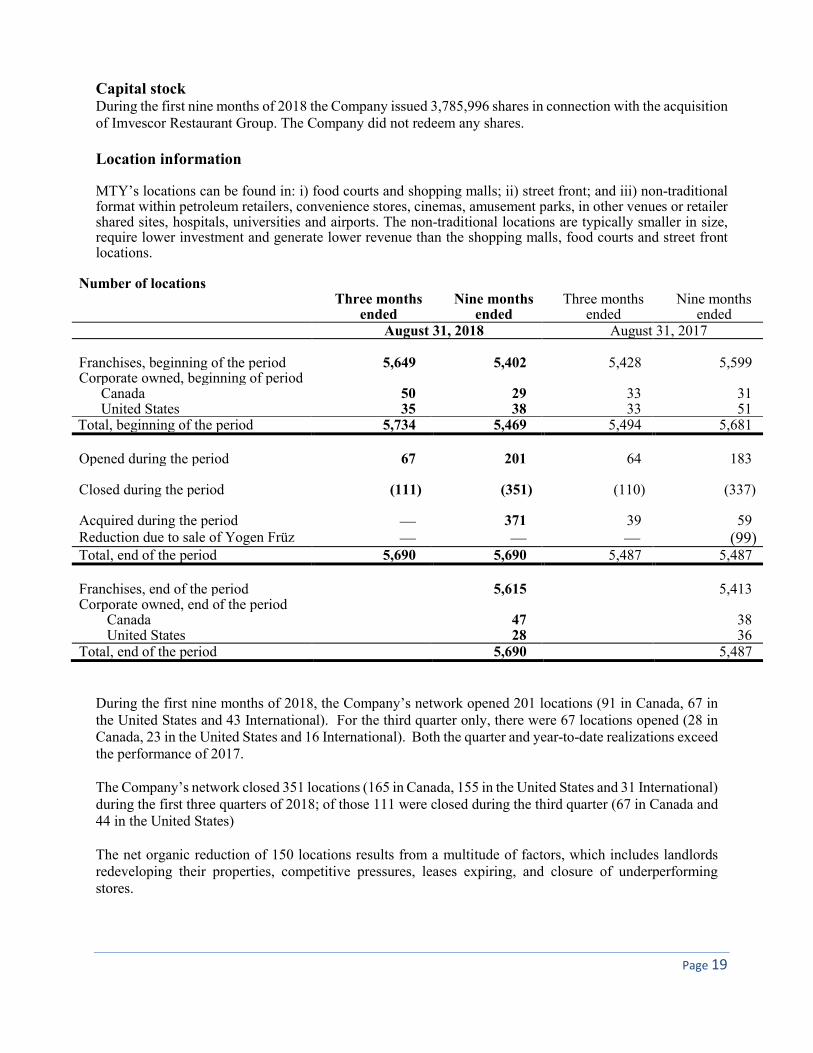
Number of locations Three months
ended Nine months
ended Three months
ended Nine months
ended August 31, 2018 August 31, 2017
Franchises, beginning of the period 5,649 5,402 5,428 5,599 Corporate owned, beginning of period
Canada 50 29 33 31 United States 35 38 33 51
Total, beginning of the period 5,734 5,469 5,494 5,681
Opened during the period 67 201 64 183 Closed during the period (111) (351) (110) (337)
Acquired during the period — 371 39 59 Reduction due to sale of Yogen Früz — — — (99) Total, end of the period 5,690 5,690 5,487 5,487 Franchises, end of the period 5,615 5,413 Corporate owned, end of the period
Canada 47 38 United States 28 36
Total, end of the period 5,690 5,487
During the first nine months of 2018, the Company’s network opened 201 locations (91 in Canada, 67 in the United States and 43 International). For the third quarter only, there were 67 locations opened (28 in Canada, 23 in the United States and 16 International). Both the quarter and year-to-date realizations exceed the performance of 2017. The Company’s network closed 351 locations (165 in Canada, 155 in the United States and 31 International) during the first three quarters of 2018; of those 111 were closed during the third quarter (67 in Canada and 44 in the United States) The net organic reduction of 150 locations results from a multitude of factors, which includes landlords redeveloping their properties, competitive pressures, leases expiring, and closure of underperforming stores.
Page 20
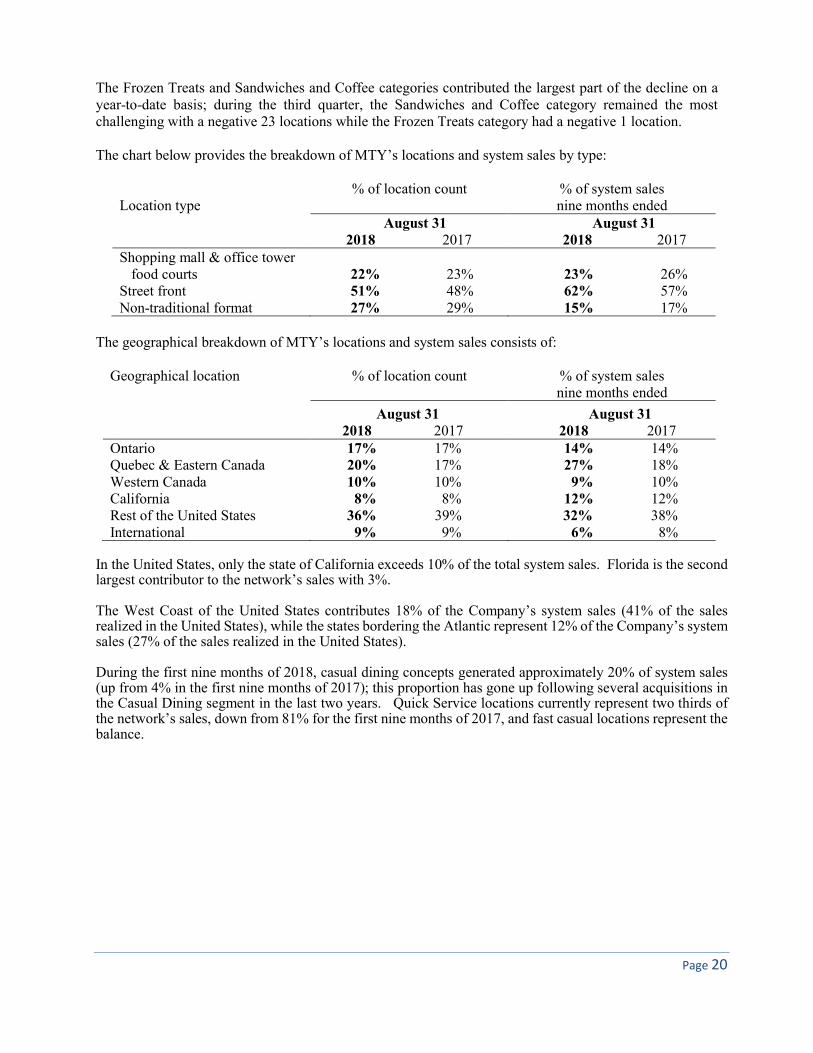
The Frozen Treats and Sandwiches and Coffee categories contributed the largest part of the decline on a year-to-date basis; during the third quarter, the Sandwiches and Coffee category remained the most challenging with a negative 23 locations while the Frozen Treats category had a negative 1 location. The chart below provides the breakdown of MTY’s locations and system sales by type:
Location type % of location count
% of system sales nine months ended
August 31 2018 2017
August 31 2018 2017
Shopping mall & office tower food courts 22% 23% 23% 26%
Street front 51% 48% 62% 57% Non-traditional format 27% 29% 15% 17%
The geographical breakdown of MTY’s locations and system sales consists of:
Geographical location % of location count
% of system sales nine months ended
August 31 2018 2017
August 31 2018 2017
Ontario 17% 17% 14% 14% Quebec & Eastern Canada 20% 17% 27% 18% Western Canada 10% 10% 9% 10% California 8% 8% 12% 12% Rest of the United States 36% 39% 32% 38% International 9% 9% 6% 8%
In the United States, only the state of California exceeds 10% of the total system sales. Florida is the second largest contributor to the network’s sales with 3%. The West Coast of the United States contributes 18% of the Company’s system sales (41% of the sales realized in the United States), while the states bordering the Atlantic represent 12% of the Company’s system sales (27% of the sales realized in the United States). During the first nine months of 2018, casual dining concepts generated approximately 20% of system sales (up from 4% in the first nine months of 2017); this proportion has gone up following several acquisitions in the Casual Dining segment in the last two years. Quick Service locations currently represent two thirds of the network’s sales, down from 81% for the first nine months of 2017, and fast casual locations represent the balance.
Page 21
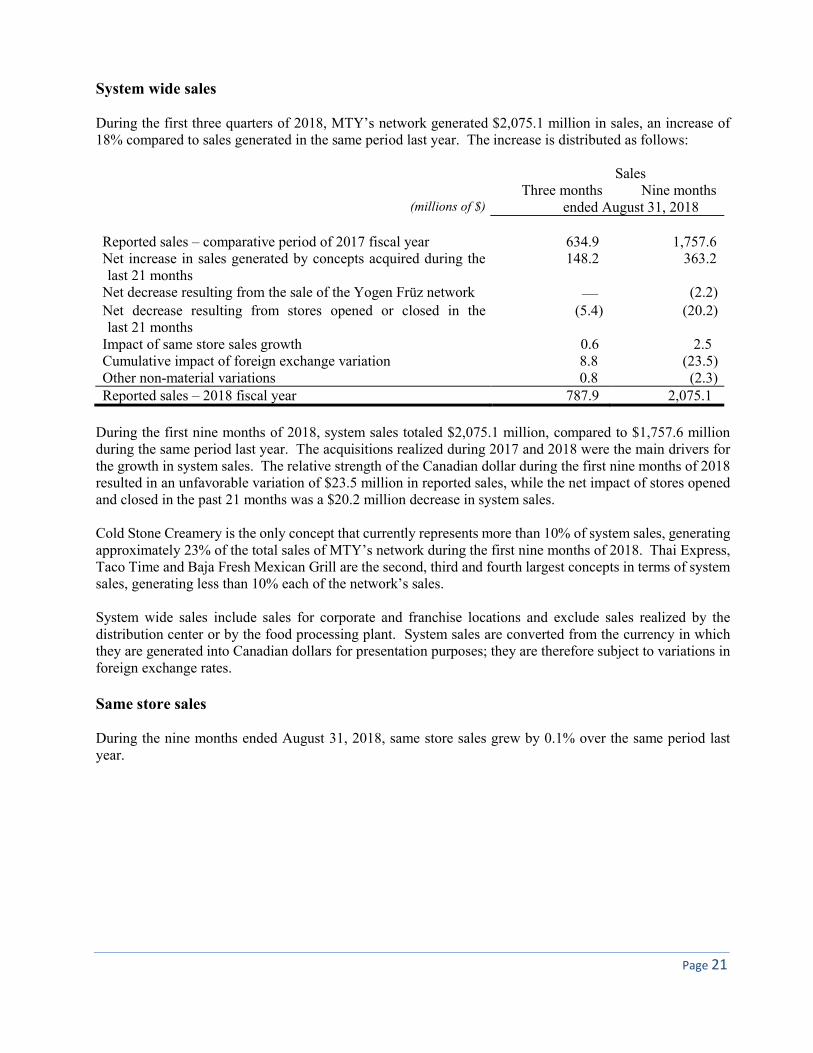
System wide sales During the first three quarters of 2018, MTY’s network generated $2,075.1 million in sales, an increase of 18% compared to sales generated in the same period last year. The increase is distributed as follows: Sales Three months Nine months
(millions of $) ended August 31, 2018 Reported sales – comparative period of 2017 fiscal year 634.9 1,757.6 Net increase in sales generated by concepts acquired during the last 21 months
148.2 363.2
Net decrease resulting from the sale of the Yogen Früz network — (2.2) Net decrease resulting from stores opened or closed in the last 21 months
(5.4) (20.2)
Impact of same store sales growth 0.6 2.5 Cumulative impact of foreign exchange variation 8.8 (23.5) Other non-material variations 0.8 (2.3) Reported sales – 2018 fiscal year 787.9 2,075.1
During the first nine months of 2018, system sales totaled $2,075.1 million, compared to $1,757.6 million during the same period last year. The acquisitions realized during 2017 and 2018 were the main drivers for the growth in system sales. The relative strength of the Canadian dollar during the first nine months of 2018 resulted in an unfavorable variation of $23.5 million in reported sales, while the net impact of stores opened and closed in the past 21 months was a $20.2 million decrease in system sales. Cold Stone Creamery is the only concept that currently represents more than 10% of system sales, generating approximately 23% of the total sales of MTY’s network during the first nine months of 2018. Thai Express, Taco Time and Baja Fresh Mexican Grill are the second, third and fourth largest concepts in terms of system sales, generating less than 10% each of the network’s sales. System wide sales include sales for corporate and franchise locations and exclude sales realized by the distribution center or by the food processing plant. System sales are converted from the currency in which they are generated into Canadian dollars for presentation purposes; they are therefore subject to variations in foreign exchange rates. Same store sales During the nine months ended August 31, 2018, same store sales grew by 0.1% over the same period last year.
Page 22
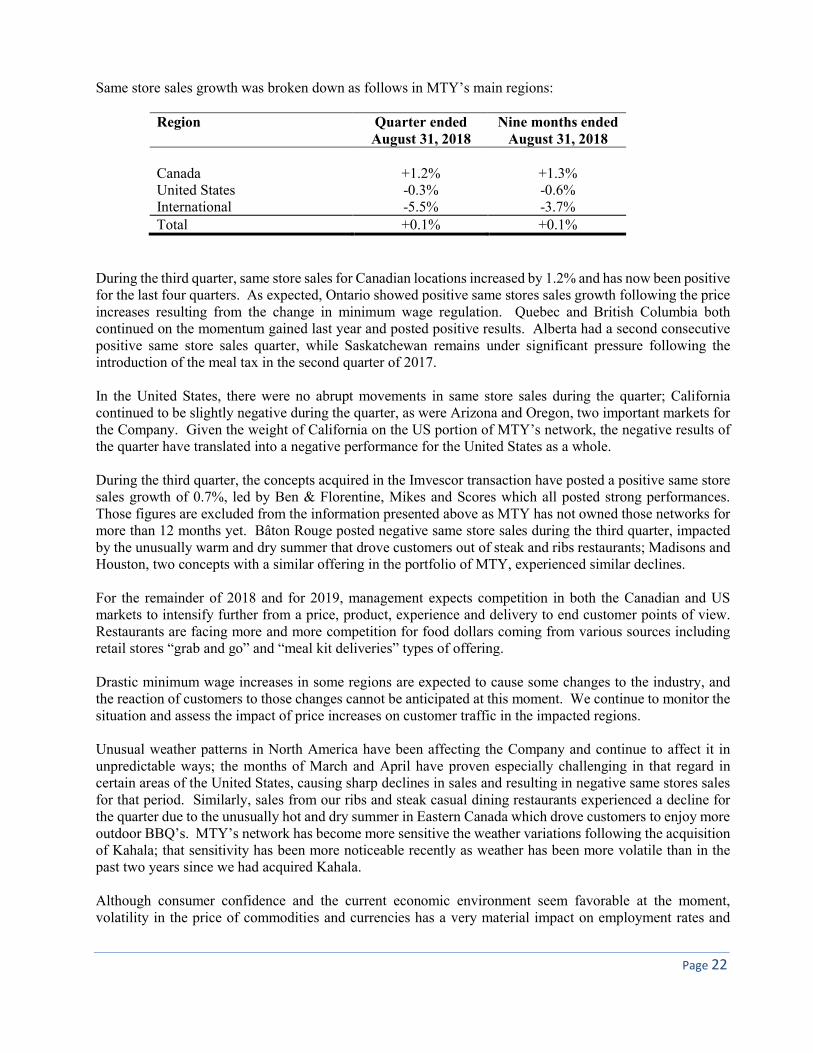
Same store sales growth was broken down as follows in MTY’s main regions:
Region Quarter ended August 31, 2018
Nine months ended August 31, 2018
Canada +1.2% +1.3% United States -0.3% -0.6% International -5.5% -3.7% Total +0.1% +0.1%
During the third quarter, same store sales for Canadian locations increased by 1.2% and has now been positive for the last four quarters. As expected, Ontario showed positive same stores sales growth following the price increases resulting from the change in minimum wage regulation. Quebec and British Columbia both continued on the momentum gained last year and posted positive results. Alberta had a second consecutive positive same store sales quarter, while Saskatchewan remains under significant pressure following the introduction of the meal tax in the second quarter of 2017. In the United States, there were no abrupt movements in same store sales during the quarter; California continued to be slightly negative during the quarter, as were Arizona and Oregon, two important markets for the Company. Given the weight of California on the US portion of MTY’s network, the negative results of the quarter have translated into a negative performance for the United States as a whole. During the third quarter, the concepts acquired in the Imvescor transaction have posted a positive same store sales growth of 0.7%, led by Ben & Florentine, Mikes and Scores which all posted strong performances. Those figures are excluded from the information presented above as MTY has not owned those networks for more than 12 months yet. Bâton Rouge posted negative same store sales during the third quarter, impacted by the unusually warm and dry summer that drove customers out of steak and ribs restaurants; Madisons and Houston, two concepts with a similar offering in the portfolio of MTY, experienced similar declines. For the remainder of 2018 and for 2019, management expects competition in both the Canadian and US markets to intensify further from a price, product, experience and delivery to end customer points of view. Restaurants are facing more and more competition for food dollars coming from various sources including retail stores “grab and go” and “meal kit deliveries” types of offering. Drastic minimum wage increases in some regions are expected to cause some changes to the industry, and the reaction of customers to those changes cannot be anticipated at this moment. We continue to monitor the situation and assess the impact of price increases on customer traffic in the impacted regions. Unusual weather patterns in North America have been affecting the Company and continue to affect it in unpredictable ways; the months of March and April have proven especially challenging in that regard in certain areas of the United States, causing sharp declines in sales and resulting in negative same stores sales for that period. Similarly, sales from our ribs and steak casual dining restaurants experienced a decline for the quarter due to the unusually hot and dry summer in Eastern Canada which drove customers to enjoy more outdoor BBQ’s. MTY’s network has become more sensitive the weather variations following the acquisition of Kahala; that sensitivity has been more noticeable recently as weather has been more volatile than in the past two years since we had acquired Kahala. Although consumer confidence and the current economic environment seem favorable at the moment, volatility in the price of commodities and currencies has a very material impact on employment rates and
Page 23
disposable income for MTY’s customers, resulting in uncertainty with respect to the future. Political uncertainty, including the result of the NAFTA negotiations, could also have impacts that cannot be foreseen at the moment. Stock options During the period, no options were granted. As at August 31, 2018 there were 200,000 options outstanding and none that are exercisable. Subsequent Events
Acquisition of sweetFrog On September 26, 2018, the Company announced that one of its wholly-owned subsidiaries had acquired substantially all of the assets of the sweetFrog Premium Frozen Yogurt franchise system ("sweetFrog") for a consideration of approximately US$35 million. A total of approximately US $28.9 million was paid on closing, financed from MTY's cash on hand and existing credit facilities, while US $2.6 million in liabilities was assumed and US $3.5 million was held back. Seasonality Results of operations for any interim period are not necessarily indicative of the results of operations for the full year. The Company expects that seasonality will be a material factor in the quarterly variation of its results. During January and February sales are historically lower than average due to weather conditions. Sales are historically above average during May to August; given the addition of Cold Stone Creamery, which is now MTY’s largest concept and which is also extremely seasonal, this pattern is expected to be more important in the future. This is generally as a result of higher traffic in the street front locations, higher sales from seasonal locations only operating during the summer months and higher sales from shopping centre locations. Sales for shopping mall locations are also higher than average in December during the holiday shopping period.
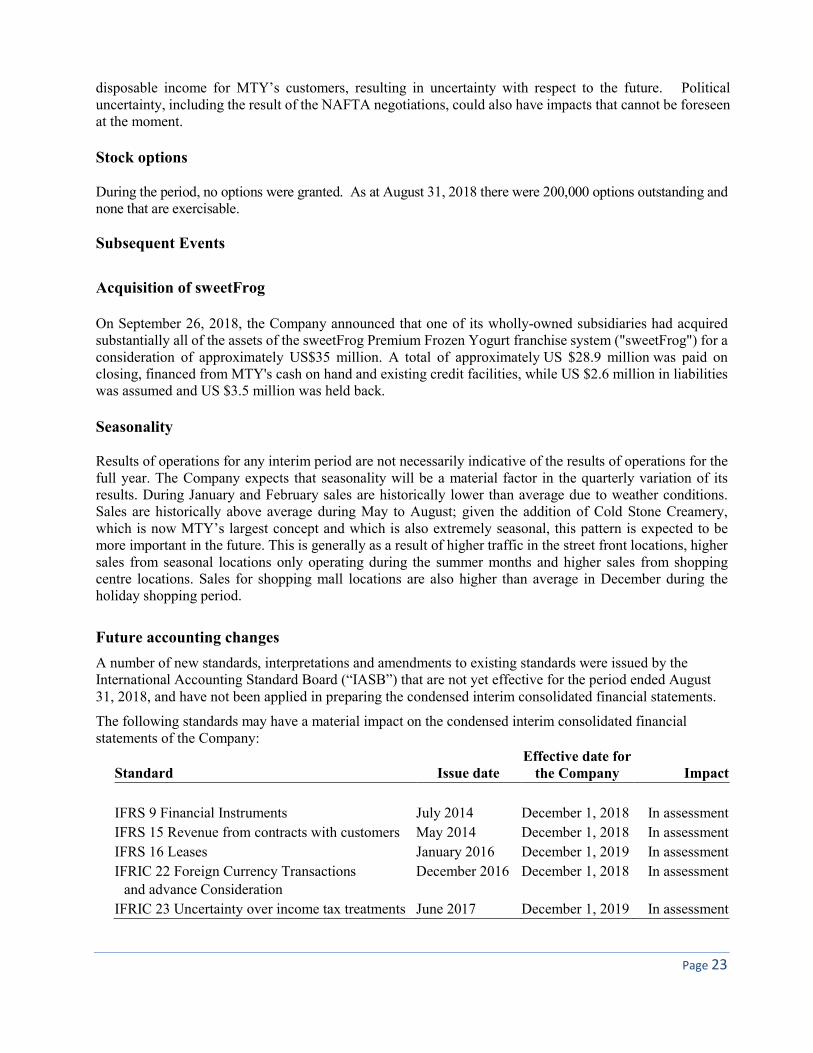
Future accounting changes
A number of new standards, interpretations and amendments to existing standards were issued by the International Accounting Standard Board (“IASB”) that are not yet effective for the period ended August 31, 2018, and have not been applied in preparing the condensed interim consolidated financial statements.
The following standards may have a material impact on the condensed interim consolidated financial statements of the Company:
Standard Issue date Effective date for
the Company Impact
IFRS 9 Financial Instruments July 2014 December 1, 2018 In assessment
IFRS 15 Revenue from contracts with customers May 2014 December 1, 2018 In assessment
IFRS 16 Leases January 2016 December 1, 2019 In assessment
IFRIC 22 Foreign Currency Transactions and advance Consideration
December 2016 December 1, 2018 In assessment
IFRIC 23 Uncertainty over income tax treatments June 2017 December 1, 2019 In assessment
Page 24
IFRS 9 introduces a revised approach for the classification of financial assets based on how an entity manages financial assets and the characteristics of the contractual cash flows of the financial assets replacing the multiple rules in IAS 39. Most of the requirements in IAS 39 for classification and measurement of financial liabilities have been carried forward in IFRS 9. IFRS 9 also introduces a new hedge accounting model that is more closely aligned with risk-management activities and a new expected credit loss model for calculating impairment on financial assets replacing the incurred loss model in IAS 39
IFRS 15 replaces the following standards: IAS 11 Construction Contracts, IAS 18 Revenue, IFRIC 13 Customer Loyalty Programmes, IFRIC 15 Agreements for the Construction of Real Estate, IFRIC 18 Transfers of Assets from Customers and SIC-31 Revenue – Barter Transactions Involving Advertising Services. This new standard sets out the requirements for recognizing and disclosing revenue that apply to all contracts with customers. The core principle of IFRS 15 is that an entity recognizes revenue to depict the transfer of promised goods or services to customers in an amount that reflects the consideration to which the entity expects to be entitled in exchange for those goods and services. IFRS 15 also includes a cohesive set of disclosure requirements that would result in an entity providing comprehensive information about the nature, amount, timing and uncertainty of revenue and cash flows arising from the entity’s contracts with customers The Company intends to adopt IFRS 15 and the clarifications in its financial statements for the annual period beginning on December 1, 2018.
The Company is currently assessing the impact of adopting this standard has identified changes that will impact its consolidated financial statements. The Company has determined that the new standard will change the way the company recognizes franchise fees and renewal fees. Under the current guidance the Company recognizes these fees when we have performed all material obligations and services. Under the new guidance the Company will defer the initial franchise fee and renewal fees and recognize over the term of the related franchise agreement. This will have no impact on the amount or timing of cash flows. Moreover, under the current guidance the Company does not reflect promotional fund collected from franchisees and the related promotional expenditures in our consolidated statement of income. Upon adoption the promotional funds collected, and the related expenditures will be reported on a gross basis in the consolidated statement of income. To the extent that promotional funds received exceed the related promotional expenditures, the excess contributions are recorded in accounts payable and accrued liabilities. The Company is still evaluating the impact of adopting this standard, which may result in additional changes to be identified to accounting policies upon adoption.
On January 13, 2016, the IASB issued IFRS 16 that provides a comprehensive model for the identification of lease arrangements and their treatment in the financial statements of both lessees and lessors. It supersedes IAS 17 Leases and its associated interpretive guidance. Significant changes were made to lessee accounting with the distinction between operating and finance leases removed and assets and liabilities recognized in respect of all leases (subject to limited exceptions for short-term leases and leases of low value assets). In contrast, IFRS 16 does not include significant changes to the requirements for lessors. IFRS 16 is effective January 1, 2019 with earlier application permitted for companies that have also adopted IFRS 15, Revenue from Contracts with Customers.
In December 2016, the IASB issued IFRIC 22 which provides an interpretation on how to determine the date of the transaction when applying the standard on foreign currency transactions, IAS 21. The interpretation applies where an entity pays or receives consideration in advance for foreign currency-denominated contracts. The date of the transaction determines the exchange rate to be used on initial recognition of the related asset, expense or income. This Interpretation provides guidance for when a single payment or receipt is made, as well as for situations where multiple payments or receipts are made and aims to reduce diversity in practice. This standard is effective for annual reporting periods beginning on or after January 1, 2018.
Page 25
IFRIC 23 clarifies the accounting for uncertainties in income taxes.
The Company is in the process of assessing the impact of these standards on its consolidated financial statements. Although the extent of the impact has not yet been determined, the Company expects that the adoption of IFRS 16 will result in material changes to its consolidated statement of income and consolidated statement of financial position.
Liquidity Risk Liquidity risk refers to the possibility of the Company not being able to meet its financial obligations when they become due. The Company has contractual and fiscal obligations as well as financial liabilities and is therefore exposed to liquidity risk. Such risk can result, for example, from a market disruption or a lack of liquidity. The Company actively maintains credit facilities to ensure it has sufficient available funds to meet current and foreseeable financial requirements at a reasonable cost.
As at August 31, 2018, the Company had an authorized revolving credit facility for which the available amount may not exceed $500 million to ensure that sufficient funds are available to meet its financial requirements. The terms and conditions related to this revolving credit facility are described in note 8 of the interim condensed consolidated financial statement as at August 31, 2018.
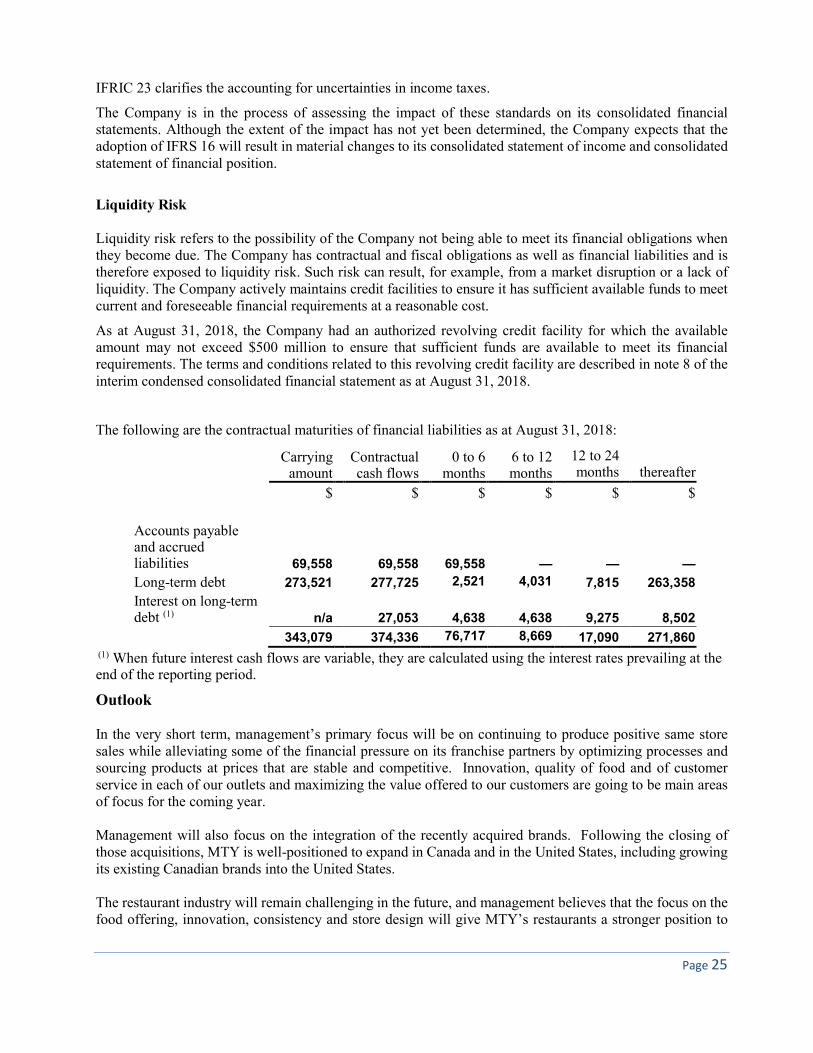
The following are the contractual maturities of financial liabilities as at August 31, 2018:
Carrying
amount Contractual cash flows
0 to 6 months
6 to 12 months
12 to 24 months
thereafter
$ $ $ $ $ $
Accounts payable and accrued liabilities 69,558 69,558 69,558 — —
—
Long-term debt 273,521 277,725 2,521 4,031 7,815 263,358
Interest on long-term debt (1) n/a 27,053 4,638 4,638 9,275 8,502
343,079 374,336 76,717 8,669 17,090 271,860 (1) When future interest cash flows are variable, they are calculated using the interest rates prevailing at the end of the reporting period.
Outlook In the very short term, management’s primary focus will be on continuing to produce positive same store sales while alleviating some of the financial pressure on its franchise partners by optimizing processes and sourcing products at prices that are stable and competitive. Innovation, quality of food and of customer service in each of our outlets and maximizing the value offered to our customers are going to be main areas of focus for the coming year. Management will also focus on the integration of the recently acquired brands. Following the closing of those acquisitions, MTY is well-positioned to expand in Canada and in the United States, including growing its existing Canadian brands into the United States. The restaurant industry will remain challenging in the future, and management believes that the focus on the food offering, innovation, consistency and store design will give MTY’s restaurants a stronger position to
Page 26
face challenges. Given this difficult competitive context in which more restaurants compete for a finite amount of consumer dollars, each concept needs to preserve and improve the relevance of its offer to consumers. Management will maintain its focus on maximizing shareholder value by adding new locations of some of its existing concepts and remains committed to seek potential acquisitions to increase its market share. Controls and Procedures
Disclosure controls and procedures
Disclosure controls and procedures are designed to provide reasonable assurance that information required to be disclosed in reports filed with the securities regulatory authorities are recorded, processed, summarized and reported in a timely fashion. The disclosure controls and procedures are designed to ensure that information required to be disclosed by the Company in such reports is then accumulated and communicated to the Company’s management to ensure timely decisions regarding required disclosure. Management regularly reviews disclosure controls and procedures; however, they cannot provide an absolute level of assurance because of the inherent limitations in control systems to prevent or detect all misstatements due to error or fraud. The Company’s Chief Executive Officer and the Chief Financial Officer have concluded that the design of the disclosure controls and procedures (“DC&P”) as at August 31, 2018 provide reasonable assurance that significant information relevant to the Company, including that of its subsidiaries, is reported to them during the preparation of disclosure documents.
Internal controls over financial reporting The Chief Executive Officer and the Chief Financial Officer are responsible for establishing and maintaining internal controls over financial reporting. The Company’s internal controls over financial reporting is designed to provide reasonable assurance regarding the reliability of financial reporting and the preparation of financial statements for external purposes in accordance with IFRS. As at August 31, 2017, the Chief Executive Officer and the Chief Financial Officer along with management concluded that the Company’s internal controls over financial reporting were not effective due to a material weakness identified surrounding internal controls over accounting for non-routine and complex transactions, including the accounting for purchase price allocations following acquisitions of businesses. The Company’s review process allowed errors in the calculation of the fair value of the gift card liability to go undetected, resulting in a material misstatement of certain revenue and expense items subsequent to the acquisition of Kahala in 2016. In the third quarter of 2018, the board of directors, Chief Executive Officer, and Chief Financial Officer decided along with management that going forward all material purchase price allocations would be audited by an independent auditor to ensure the accuracy of the fair valuation of acquisitions. Since the change in internal controls, no material acquisition was undertaken and as such the control has not yet been tested. Management continues to execute its remediation plan to address these material weaknesses identified in the internal controls over financial reporting. Management has added resources and tools in the internal audit department to test and assess the control environment in the existing and newly acquired businesses and has sought external help for the review of certain areas of the control environment in order to develop an adequate action plan focusing on the deficiencies that have the highest likelihood of causing material misstatements. Management has taken certain actions to begin remediating these material weaknesses including the
Page 27
implementation of new controls with regards to the review procedures surrounding complex transactions and evaluations by third party specialists. The controls have been performed over the period; however, they have not been fully tested. Material weaknesses cannot be considered remediated until the remedial controls operate for a sufficient period of time and management has concluded through testing, that these controls are operating effectively. Notwithstanding the outstanding assessment regarding the remediation actions as described above, the Chief Executive Officer and the Chief Financial Officer, together with Management have concluded the financial statements included in this report present in all material respects its financial position, results of operations, capital position and cash flows for the periods presented in accordance with IFRS The Chief Executive Officer and the Chief Financial Officer, together with Management, have concluded after having conducted an evaluation and to the best of their knowledge that, as at August 31, 2018, no change in the Company’s internal controls over financial reporting occurred that could have materially affected or is reasonably likely to materially affect the Company’s internal controls over financial reporting. Limitations of Controls and Procedures Management, including the President and Chief Executive Officer and Chief Financial Officer, believes that any disclosure controls and procedures or internal controls over financial reporting, no matter how well conceived and operated, can provide only reasonable, not absolute, assurance that the objectives of the control system are met. Further, the design of a control system must reflect the fact that there are resource constraints, and the benefits of controls must be considered relative to their costs. Because of the inherent limitations in all control systems, they cannot provide absolute assurance that all control issues and instances of fraud, if any, within the Company have been prevented or detected. These inherent limitations include the realities judgments in decision-making can be faulty, and that breakdowns can occur because of simple errors or mistakes. Additionally, controls can be circumvented by the individual acts of some persons, by collusion of two or more people, or by unauthorized override of the control. The design of any control system of controls also is based in part upon certain assumptions about the likelihood of future events, and there can be no assurance that any design will succeed in achieving its stated goals under all potential future conditions. Accordingly, because of the inherent limitations in a cost-effective control system, misstatements due to error or fraud may occur and not be detected.
Page 28
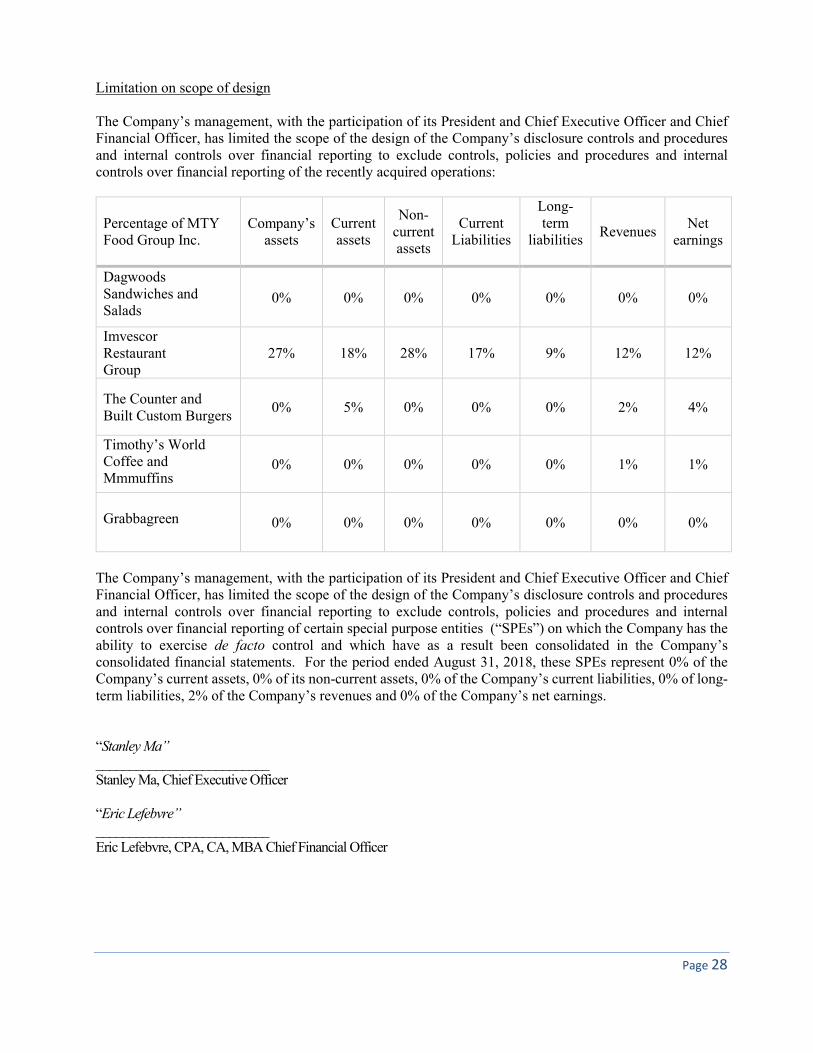
Limitation on scope of design The Company’s management, with the participation of its President and Chief Executive Officer and Chief Financial Officer, has limited the scope of the design of the Company’s disclosure controls and procedures and internal controls over financial reporting to exclude controls, policies and procedures and internal controls over financial reporting of the recently acquired operations:
Percentage of MTY Food Group Inc.
Company’s assets
Current assets
Non-current assets
Current
Liabilities
Long-term
liabilities Revenues
Net earnings
Dagwoods Sandwiches and Salads
0% 0% 0% 0% 0% 0% 0%
Imvescor Restaurant Group
27% 18% 28% 17% 9% 12% 12%
The Counter and Built Custom Burgers
0% 5% 0% 0% 0% 2% 4%
Timothy’s World Coffee and Mmmuffins
0% 0% 0% 0% 0% 1% 1%
Grabbagreen 0% 0% 0% 0% 0% 0% 0%
The Company’s management, with the participation of its President and Chief Executive Officer and Chief Financial Officer, has limited the scope of the design of the Company’s disclosure controls and procedures and internal controls over financial reporting to exclude controls, policies and procedures and internal controls over financial reporting of certain special purpose entities (“SPEs”) on which the Company has the ability to exercise de facto control and which have as a result been consolidated in the Company’s consolidated financial statements. For the period ended August 31, 2018, these SPEs represent 0% of the Company’s current assets, 0% of its non-current assets, 0% of the Company’s current liabilities, 0% of long-term liabilities, 2% of the Company’s revenues and 0% of the Company’s net earnings. “Stanley Ma” __________________________ Stanley Ma, Chief Executive Officer “Eric Lefebvre” __________________________ Eric Lefebvre, CPA, CA, MBA Chief Financial Officer