Embed Size (px)
Citation preview
International Journal of Academic Research in Business and Social Sciences 2016, Vol. 6, No. 11
ISSN: 2222-6990
486
Management of Accounts Receivables in Utility Companies: A focus on Electricity Company of Ghana
(E.C.G.)
Ernest Appiah Darko Department of Accountancy and Accounting Information Systems Faculty of Business and Management Studies, Kumasi polytechnic
Email: [email protected]
Samuel Adarkwah Department of Accountancy and Accounting Information Systems Faculty of Business and Management Studies, Kumasi Polytechnic
Email: [email protected]
Francis Donkor Department of Accountancy and Accounting Information Systems, Kumasi Polytechnic
Email: [email protected]
Edmund Kyei Department of Accountancy and Accounting Information Systems
Faculty of Business and Management Studies Kumasi Polytechnic
Email: [email protected]
DOI: 10.6007/IJARBSS/v6-i11/2422 URL: http://dx.doi.org/10.6007/IJARBSS/v6-i11/2422
ABSTRACT Almost all standard textbooks on Accounting: Managerial and Financial discuss accounts receivable in varying degrees of depth and scope with" emphasis skewed towards the particular discipline. Financial accounting discusses accounts receivable as information for external users to use to interpret financial statements (Libby; et aI (2001) managerial accounting discusses accounts receivable as a cost to management (Hilton, 2002). Financial management, however, discusses accounts receivables as a current asset requiring short-term investment and financing strategies (Brealy; Myers (2000).This study's objective was to determine the effectiveness of the management of accounts receivable by Electricity Company of Ghana. The study analyzed secondary data from the audited annual reports of the company for a period of four years from 2007 to 2011; the company's billing system, operational reports and primary data from both structured and unstructured questionnaire. The results show that Electricity Company of Ghana
International Journal of Academic Research in Business and Social Sciences 2016, Vol. 6, No. 11
ISSN: 2222-6990
487
has an average accounts receivable days' sales outstanding of 158 days over the study period and unrealistic provision for bad debt of about 5%. The study's conclusions indicate that the company is not very effective in its accounts receivable management. The study, therefore, recommends that the company's business processes should be reviewed, finalised accounts with balances over 150 days be declared bad debts and managed separately from the net realizable accounts receivable. INTRODUCTION
Accounts receivable management has received a great deal of attention in recent times, especially in public utility companies in developing countries. This is partly because the utility companies in developing countries are perceived to be inefficient in the provision of their services, and one major cause is ineffective management of their accounts receivable. Ineffective management of accounts receivable prevents the company from having the essential working capital needed for their routine operations and also to ensure maximization of needed profits. Menke; Fezzari (1994) noted in a report to the. World Bank that "utility companies in developing countries are unable to collect outstanding bills in a timely manner due to inefficiencies in the billing and collection system, or political expediencies prevent the utilities from forcing its customers, particularly government or government - owned entities to pay their bills". This reports asserted that effective management of account receivable is a challenge for electricity companies in developing countries. Vullkania; et al (1999), in an introductory remark to a report titled Action Plans for Improved and Sustained Revenue Collection noted that "Electricity. Company of Ghana (ECG) has been bedevilled by serious cash flow problems for a considerable period due to lack of improved revenue collection "A company, on the other hand, gains substantial benefits if it can effectively manage its accounts receivable. These benefits include increased cash flow, higher credit sales margins, reduced bad debt loss, lower administrative cost in the entire revenue cycle, decreased deductions and concessions losses, enhanced customer service and decreased administrative burden on sales force (Salek, 2005) It is obvious from the foregoing that inability to reduce the amounts of accounts receivable considering the aforementioned mitigating factors may lead to a utility company having liquidity problems, since there will be crippling burden of financing the deficits created by inefficient collection (Munasinghe; and Sanders 1988). Problem Statement Most public utility companies including Electricity Company of Ghana (ECG) have not sought to test whether the credit and collection activities they pursue are effective. Also, most studies have concentrated on the management of working capital as a whole and always focused on a manufacturing company. However, this study concentrates on specific aspect of current asset and takes cognizance of the fact that, the utility company accounts receivable is very much important. ECG among its s strategic issues for the past five years has the objective of "improving revenue Viability of the company with the objectives of collecting recoverable
International Journal of Academic Research in Business and Social Sciences 2016, Vol. 6, No. 11
ISSN: 2222-6990
488
debts"( ECG Corporate Plan 2010-2015) furthermore Ghana Parliament in 2012 noted that "ECG's recovery is necessary for Ghana's the key is the improvement in revenue collection". ECG responded by creating a- Customer Service Directorate charged with the responsibilities of managing the entire commercial functions of the company and in particular to improve revenue collection. Fourteen years after the creation of the Customer Services Directorate, it is very pertinent to determine the effectiveness of the management of accounts receivable by the company. In view of the above, this project sought to investigate the effectiveness of ECG accounts receivables management Strategies. It also sought to determine the level of state-owned institutions indebtedness to the company, staff knowledge of accounts receivable management procedures, the effectiveness of termination of service as a main tool for debt management and recommend new strategies for improving accounts receivable management by ECG. Objectives of the study The broad objective of the study was to find out the effectiveness of the management of accounts receivable by ECG. Specific Objectives The specific objectives of the study were the following:
To find out the trend of the accounts receivable from 2003 – 2007. To determine the level of contribution of various customer classifications to ECG's
accounts receivable. To discuss the effectiveness of existing debt management practices. To determine the level of company's staff knowledge in accounts receivable
management. To determine the effectiveness of termination of service as a debt management tool. To recommend strategies to Improve management of accounts receivable.
LITERATURE REVIEW
The literature review involves analysis of theoretical framework, review of some relevant literature related to the subject. The literature was reviewed under the following headings; overview of accounts receivable, service disconnection and performance measurements. Overview of Accounts Receivable Definition of accounts receivable Almost all standard textbooks on Accounting: Managerial and Financial discuss accounts receivable in varying degrees of depth and scope with" emphasis skewed towards the particular discipline. Financial accounting discusses accounts receivable as information for external users to use to interpret financial statements (Libby; et aI 2001) managerial accounting discusses accounts receivable as a cost to management (Hilton, 2002). Financial management, however, discusses accounts receivables as a current asset requiring short-term investment and financing strategies (Brealy; Myers (2000). Receivable is typically defined as one of a series of accounting transactions dealing with the billing of customers which owed money to a person, company or
International Journal of Academic Research in Business and Social Sciences 2016, Vol. 6, No. 11
ISSN: 2222-6990
489
organisation for goods and services that have been provided to the customer on credit (Larson et al, 1999; Anthony et al, 1999). It is part of the economic resources owned by a company that results from past transactions (Libby; et aI, 2001). Accounts receivable are the amounts due from debtors (customers) to whom goods or services have been sold on credit. These amounts are generally realizable in cash within the accounting period (Brigham et al, 2002). Categorization of Receivables Trade receivables are from normal trading and are classified as notes receivable and accounts receivable. Accounts receivable and notes receivable are the two most common receivables. Notes Receivable is a written promise for the future collection of cash. They normally require payment of interest. They are relatively easy to manage since the laws of contracts may be used to enforce the execution of the contract. Accounts receivable is any amount owed to a business by customers (individuals or organisations) as a result of a purchase of goods or services on a credit basis (Dyckman; et al (2001). The company making the sale does not receive any written orders or promises to pay from the purchaser. The creditor merely enters the amount due in its books. Accounts receivable constitute a major portion of the assets of utility companies and tend to vary directly with sales (Colton (1995) accounts receivable may be sold to finance companies or pledged as collateral to obtain loans from commercial banks or finance companies. Recognizing accounts receivable Three accounting principles are necessary for the recognition of accounts receivable. The matching concept requires that revenue should be recognized in the period in which it occurred and must be matched to the expenses of that period. On a company's balance sheet, accounts receivable is the amount that customers owe a business less an allowance for the portion that probably will not be collected (Anthony; et al (1999). Thus from the realization concept, accounts receivable is shown as the net realizable value (NRV) i.e. the value of an asset that must be realized upon the sale of the asset, less a reasonable prediction of the costs associated with the eventual sale. This is a requirement of Generally Accepted Accounting Principle (GAAP) established by the Financial Accounting Standards Board (F AS B) of the United States (Anthony; et al (1999) to ensure that receivables are not overstated in the balance sheet. The conservation concept allows accountants to recognize revenues (increase in retained earnings) only when they are reasonably certain. Thus, in the income statement a realistic provision must be made for uncollectible billed revenue since it will have an effect on the net profit. A company may declare huge profit and make shareholders and other investor to think it is doing well if it understates its allowance for uncollectible billed revenue. A company, however, is liable for prosecution if it inflates the company's reported earnings. Libby) cited a case from the Wall Street Journal of June 12, 1997 in which the Securities and Exchange Commission in the USA filed a suit against four executives of a company named T2 Medical and won because the company understated its recognized bad debt expense of 5.5 percent of sales from the prior year to 6.6 percent of sales instead of 11 percent of sales. Measurement of uncollectible accounts receivable When credit is extended, some amount of uncollectible receivables is generally inevitable. Companies, according to Dyckman; et al (2001) attempt to develop a credit policy neither too
International Journal of Academic Research in Business and Social Sciences 2016, Vol. 6, No. 11
ISSN: 2222-6990
490
conservative which may lead to excessive loss in sales nor too liberal which may also lead to excessive uncollectible accounts. Accounts receivable are valued at original exchange price between the company and the outside party less adjustments for cash discounts, sales returns, and allowances for uncollectible accounts. The net realizable value which is an approximation is the amount of cash expected to be collected after all the adjustment. Two general approaches to recognizing the cost of uncollectible receivables found in practice are the Direct Write-Off and the Allowance methods. The Direct Write-Off Method is used if the uncollectible accounts are not probable or cannot be estimated. Consequently, no adjustment to income or receivables is made until specific accounts are considered uncollectible. This method however, according to Dyckman; et al (2001) is not allowed because it violates GAAP principle except for companies in the first year of operation. Cost of holding accounts receivable Accounts receivable add cost to a company's operation if they remain unpaid. The true value of accounts receivable is therefore necessary for efficient management and ability to reduce this cost is not only critical for liquidity but a challenge to the company. McCormick (2002) has a study of the carrying costs of accounts receivable and what follows is an excerpt of his work. He identified five carrying costs as time, administrative; financing, bad debt and morale costs. The time cost is the cost most often associated with receivable. Time cost is the present value of money to be paid at a specified point in the future i.e. how much money would have to be invested today, at a given interest rate, to generate a principal-plus-interest amount equal to what will be paid or collected in the future (Ross; et al (2001). A Ghana Cedi received today is worth more than a Ghana Cedi to be received in the future. The value of money is therefore reduced the more days it stays with the debtor. As the receivable ages beyond the normal cycle, the collection process becomes more cost intensive. Administrative cost which includes follow-up letters, telephone calls, transport expenses, additional staff expenses and additional record keeping are costs directly related to the age of receivable beyond the normal collection cycle cost. Benefits of reducing accounts receivable The benefits of effectively managing the account receivable asset according to Salek (2005) include increased cash flow, higher credit sales and margins, reduced bade debt loss, lower administrative cost in the entire revenue cycle, decreased deductions and concessions losses, enhanced customer service, improved staff morale. An organization that is able to achieve excellence accounts receivable management will certainly have enough working capital, is credit worthy, be more profitable, have better motivated staff and will enjoy the benefit of low staff turnover. Service Disconnection One of the most effective and powerful tool for collection of delinquent electricity accounts is disconnection of supply. It, however, can be an unpleasant experience for both the customer and the utility company. While the customer is denied of the service the utility company is also denied revenue. Disconnection involves the interruption of service to a defaulting customer. It is no gainsaying that there are some customers who are unwilling to exercise good faith in
International Journal of Academic Research in Business and Social Sciences 2016, Vol. 6, No. 11
ISSN: 2222-6990
491
attempting to pay for service rendered. Hence, termination is a reasonable practice when all other collections methods have been attempted in good faith and have failed. Disconnection policy according to Vulkania; et al (1999) "demands that where a customer fails to pay a bill within a stipulated credit period, the customer is disconnected. Furthermore, the service is removed and the account retired. Three month after disconnection legal action is instituted against the defaulting customer to recover the arrears". Vulkania; et al (1999) observed that, this policy has not been rigidly adhered to and rigorously enforced. Colton (1995) argued that the reliance placed on the disconnection of service as a collection mechanism is seriously misplaced. A study by Sawyer and Teumin (1990) concluded that, there is little relationship between the use of service disconnections and the success of a utility in collecting bills. Colton (1995) cited example of a customer survey in the US where a utility found that service termination as a collection tool contributed for only 12% payments from its payment troubled customers. Also, empirical analysis by Bureau of consumer Service (1983) concluded that the role of notices and termination is not as vital as has been suggested. In 1992, after another extensive empirical review of collection activities in Pennsylvania, the Bureau of Customer Services reaffirmed its findings a decade earlier. The report acknowledged that termination or the threat of termination causes some customers to make full or partial payments. However, the report noted that neither the volume of termination notices sent nor the number of service terminations completed appears to be significantly related to collections performance. Performance Measurement Accounts receivable management performance ratios Ratio analysis involves measuring the proportional relationship between two or more financial statements items. (Dyckman, Performance ratios sometimes called activity or efficiency ratios measure how effectively a company uses its assets in daily operations. Larson; et al (1999) out that performance ratio is a measure usually of how much revenue is or a certain level of assets. Observed that since accounts receivable analysis encompasses many factors, which sometimes appear to conflict with each other the performance obtained using only one ratio may be deceptive. MAPICS (2004), {Software Company, in its software package for Accounts Receivable Analysis used more than 60 key performance indicators (KPI). This perhaps explained why Massey; (2003) supported a pre-defined formula and weighting system involving three major accounts receivable performance indicator namely Days Sales Outstanding, Percentage of Accounts Receivable greater than 90 days, and percentage of charges written off as bad debt. The following discussions will be confined to the five major accounts receivable indicators mentioned by various writers including Larson; et al (1999), Libby et al (2002) and Anthony et al (1999). The five major account receivable key performance indicator are: the accounts receivable to total revenue ratio, accounts receivable turnover ratio, days' sales outstanding percentage of accounts receivable greater than 90 days and percentage of sales written off as bad debt. These measures are evaluated by comparing them against those of other companies, industry averages or prior performance of the company. Accounts Receivable to Total Revenue Ratio This ratio compares the monetary value of outstanding credit sales to total amount of sales. The average accounts receivable is used to avoid distortions. It is interpreted by converting it to
International Journal of Academic Research in Business and Social Sciences 2016, Vol. 6, No. 11
ISSN: 2222-6990
492
a percentage and represents the percentage of sales or revenue that is outstanding. If the percent increases greatly from one period to another it is unfavourable to the company. A business with a liberal credit policy strict credit terms would have a lower percentage of uncollected revenue than would a business. Accounts Receivable Turnover Ratio This is the ratio of the number of times that accounts receivable amount is collected throughout the year. The ratio is calculated by dividing total credit by accounts receivable. In any business Editing The Days' Sales Outstanding (DSO) This indicator is variously called Days' Receivable: Days' Sales Uncollected, or Accounts Receivable Days', Average Collection Period (ACP) etc. The DSO is used to appraise accounts receivable. It can also be evaluated by comparing with the terms on which the utility company sells its services and is a measure of the number of days it takes to collect a credit account or turn it into cash. DSO is calculated by dividing accounts receivable by average daily sales or revenue to find the number of day's sales that are tied up in receivables. A sudden increase in this ratio is a signal for the company to step up its efforts. Also, the higher the number, the longer it takes to collect one day of revenue. Therefore, if the trend in DSO is up, but the credit policy has not been changed, this would be strong evidence that steps should be taken to expedite the collection of accounts receivable. Percentage of Accounts Receivable greater than 90 days Accounts receivable are classified by how long they are past their due dates. The percentage is calculated by summing up the aged accounts receivable balances over 90 days and dividing the result by the total accounts receivable balances. It gives a measure of the percentage of the accounts receivable which are greater than 90 days. The older the accounts receivable the more difficult it is to collect such receivables, resulting in larger potential write-offs. Percentage of Sales Written off as Bad Debt: This percentage is calculated by dividing the total amount written off as bad debt by the total sales revenue for the period usually a year. World Bank Recommendation In a World Bank: Technical Report Number 243 (2001) the following minimum recommendations were given as a condition for loan, credit or aid disbursements for new projects:
a) Total accounts receivable from governments or government-owned entities do not exceed two months of billing.
b) Total accounts receivable from private customers do not exceed three months of billing c) All customers (government or private) outstanding payments of three months or more
have been disconnected. METHODOLOGY The research would be conducted through survey. Questionnaire will be developed with
International Journal of Academic Research in Business and Social Sciences 2016, Vol. 6, No. 11
ISSN: 2222-6990
493
questions based on accounts receivable to assess the opinions of management, employees and customers in ECG of the Ashanti West quantitative and qualitative approaches through the use of the SPSS software. Statistical test will be run to ensure that results are a function of ECG (Ashanti West) rather than of values that relate to the whole ECG. Scope and coverage of study area EGC was the study case and Ashanti West Region was the study area. The Ashanti West Region was purposely selected because it has all the various categories of customers - industrial, commercial, urban and rural residential customers and especially governments and government related institutions. The region has eight districts as at December 2007 with a customer population of 127,854 and revenue management staff including district managers of 137 (ECG December 2007 Operational Report). The study covered the company's accounts receivable management information from 2003 to 2007. The structured interview involved key revenue management staff from the four of the eight districts in the region while the observation was done in the Effiduasi District of the region which was selected by simple balloting. The ageing of debt and evaluation of disconnection performance were done using data from the Ashanti West Region. It was also the region selected for field activities including evaluation and reporting relating to disconnection of delinquent customers, resolution of disputed and reconciliation of statements. Types of Data The study made use of two main types of data-quantitative and qualitative. The quantitative data focused on issues such as sales revenue, consumer balance, bad debt provision, net account receivable, age of debts, years worked in company etc. The qualitative data involve: issues such as of revenue management staff concerning knowledge of the company's policies and procedures on debt management, possible reasons for non-payments of bills, views on regulatory measures, opinion on effectiveness of disconnection of supply as a debt management tool etc. Sources of Data Data for the study were obtained from both primary and secondary sources. The secondary data were obtained from credible sources as the company's annual report and audited accounts and operational reports submitted to State Enterprises Commission and from the company's Computerized Billing Information System (CBIS). The primary source was used to acquire additional relevant information to complement the already existing one. The main data collection tools used for the study were the administering of questionnaires, unstructured interviews and observations. Secondary source Annual reports and audited accounts The electricity sales figures were obtained from the' company's annual reports and audited accounts from 2003 to 2007. The amount represented actual electricity sold in the year, less net adjustments for over or under billing. The accounts receivable is recorded in the annual reports as consumed balance. This represented amount due to the company from all categories
International Journal of Academic Research in Business and Social Sciences 2016, Vol. 6, No. 11
ISSN: 2222-6990
494
of customers at the end of the year. The figures for the provision of bad debts were also obtained from the annual reports and audited accounts. Customer Based Information System (CBIS) The data for the ageing analysis were obtained from Ashanti West customer database (CBIS). The ageing analysis reports have been classified as ageing of debt by region, tariff class, customer class, account status. The report shows the age of the debt, the amount and the number of customers. The other secondary sources of information include the company's operational reports from 2003 to 2007, and the company's newsletters. Primary source Questionnaire The unit of analysis for this study was made up of management and staff of the company whose normal responsibilities primarily involve revenue management. The revenue employees were purposely selected by job title. The questionnaire was to ascertain relevant issues such as knowledge of revenue management policy and procedures of the company, use of revenue manual, training, effectiveness of disconnection and third party collectors, performance targets and effects of motivational packages as incentives for optimum performance. Semi-structured questionnaires comprising both closed and open questions were used to collect primary data from the sample of 50 employees. The questions were either completed immediately or were completed and returned later. Interviews This was used since not all the primary information needed could be obtained by the questionnaire. The interviews were therefore conducted as a complementary measure. In this regard, key employees at both the regional and district offices were contacted for an in-depth discussion on relevant matters. Observation This was mainly of the participative type. The researcher observed and actually participated in the evaluating and reporting relating to disconnection of slow paying customers and the reconciliation of disputed bills by working with the disconnection unit for a week. Sampling Techniques A sample size of fifty (50) was chosen using the judgmental approach for the key revenue staff for the study. The sample size was sub-divided among four districts selected in the region out of the eight districts and the district office as shown below: South West District 10 Effiduasi District 10 Obuasi District 10 Bekwai District 10 Regional Office 10
The job title of the company's staff was then used to identify employees for the study.
International Journal of Academic Research in Business and Social Sciences 2016, Vol. 6, No. 11
ISSN: 2222-6990
495
Regional Staff: The ten Regional Officers who were purposely selected because they were the supervisors of all commercial activities in the region have been listed below:
Regional Commercial Manager
Revenue Management Officer
Customer Service Engineer
Billing Process Officer
Marketing Officer
Data Base Administrator
Revenue Protection Officer
Customer Relations Officer
Revenue Management Assistant
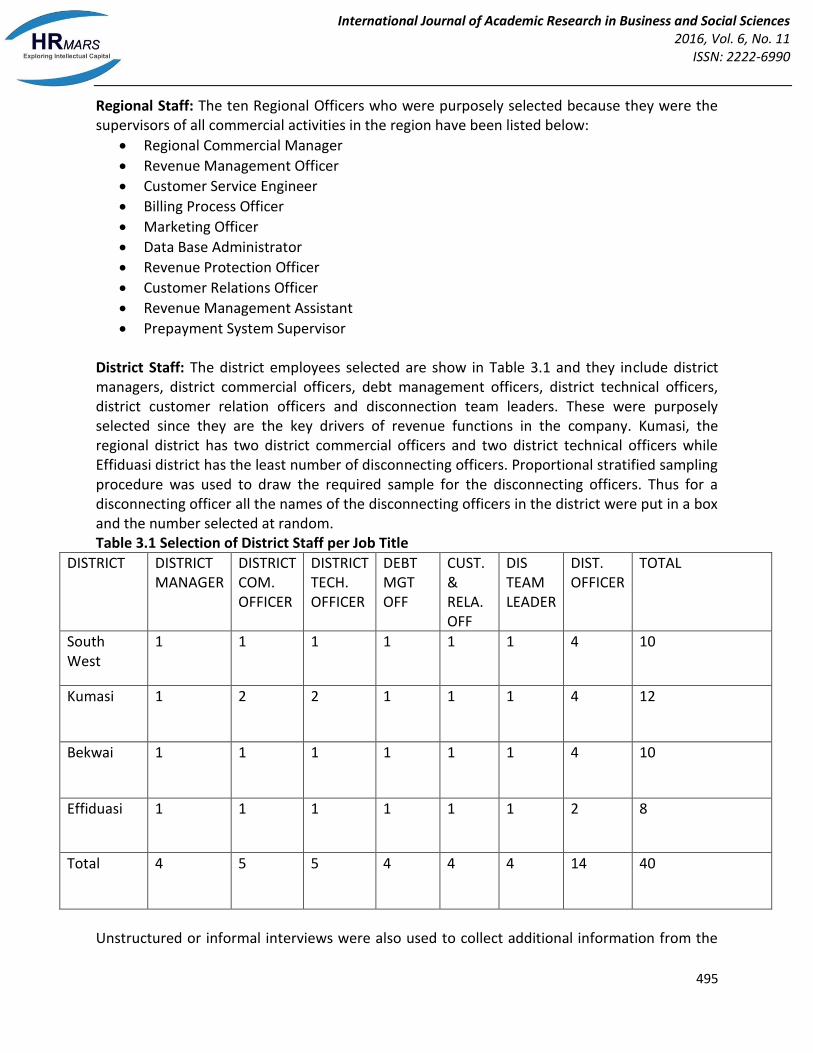
Prepayment System Supervisor District Staff: The district employees selected are show in Table 3.1 and they include district managers, district commercial officers, debt management officers, district technical officers, district customer relation officers and disconnection team leaders. These were purposely selected since they are the key drivers of revenue functions in the company. Kumasi, the regional district has two district commercial officers and two district technical officers while Effiduasi district has the least number of disconnecting officers. Proportional stratified sampling procedure was used to draw the required sample for the disconnecting officers. Thus for a disconnecting officer all the names of the disconnecting officers in the district were put in a box and the number selected at random. Table 3.1 Selection of District Staff per Job Title
DISTRICT DISTRICT MANAGER
DISTRICT COM. OFFICER
DISTRICT TECH. OFFICER
DEBT MGT OFF
CUST. & RELA. OFF
DIS TEAM LEADER
DIST. OFFICER
TOTAL
South West
1 1 1 1 1 1 4 10
Kumasi 1 2 2 1 1 1 4 12
Bekwai 1 1 1 1 1 1 4 10
Effiduasi 1 1 1 1 1 1 2 8
Total 4 5 5 4 4 4 14 40
Unstructured or informal interviews were also used to collect additional information from the
International Journal of Academic Research in Business and Social Sciences 2016, Vol. 6, No. 11
ISSN: 2222-6990
496
following: Divisional Managers (DM) Management Information System, DM Accounts, DM Billing
& Revenue. Regional Directors, Regional Commercial Managers and Revenue Management Officers at the Regional
Office. Divisional Managers, District Commercial Officers and Disconnection Team Leaders at
the district's offices. The study adopted the principle of optimal confidentiality in treating both primary and secondary information.
RESULTS The previous chapters have highlighted the problems and challenges of managing accounts receivable and the costs of its ineffective management by utility companies. This chapter examines the effectiveness of accounts receivable management practices of ECG based on data collected from within and out of ECG, specifically Ashanti West.
Data Analysis Analytical tools Data collected were analyzed using the Statistical Package for Social Science (SPSS) software and Microsoft Excel. Financial ratios were also used to compute various figures for each year in the study period. The accounts receivable performance measurements of the company were obtained from the computed ratios and compared to prior performance and World Bank indicators. The percentage ageing of debt was computed using data from the company's billing system and Microsoft Excel package. Percentages, tables, bar and pie charts were employed in making the analysis, comparison and interpretation easier and convenient. Data Manipulation Quantitative data obtained from audited annual reports from 2009 to 2013 were put in tabular form; Net accounts receivable for each year was obtained by deducting the provision for bad debt for that year from the corresponding consumer balance. Thus, from table 4.12(54) net accounts receivable for 2010 was GHȼ449,932 obtained by subtracting GHȼ50,951 from GH₵500,883. The accounts receivable performance ratios were calculated as follows: Accounts Receivable Turnover Ratio
Accounts Receivable Turnover (ART) = Total Sales Revenue Average Accounts Receivable
Thus using figures from the annual report and audited accounts shown in Table 4.12 (page 54), and inserting them in the formula, the Accounts Receivable Turnover (ART) ratio of the company for the year 2004 was found to be 2.9 times obtained by dividing electricity sales of GHȼ1,008,833 by the average of the closing accounts receivable of the prior year and the closing accounts receivable of year 2004 i.e. ART for 2004 = 1,008,883/ (0.5 (257.149 + 449.932))
International Journal of Academic Research in Business and Social Sciences 2016, Vol. 6, No. 11
ISSN: 2222-6990
497
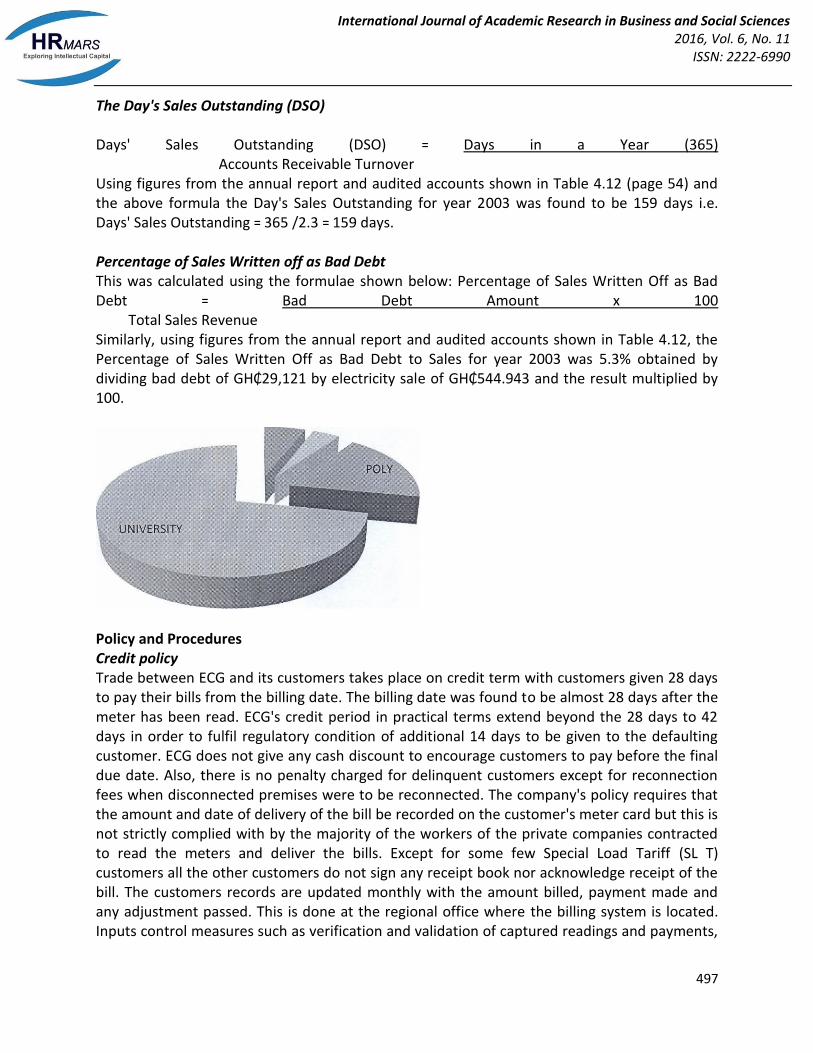
The Day's Sales Outstanding (DSO) Days' Sales Outstanding (DSO) = Days in a Year (365) Accounts Receivable Turnover Using figures from the annual report and audited accounts shown in Table 4.12 (page 54) and the above formula the Day's Sales Outstanding for year 2003 was found to be 159 days i.e. Days' Sales Outstanding = 365 /2.3 = 159 days. Percentage of Sales Written off as Bad Debt This was calculated using the formulae shown below: Percentage of Sales Written Off as Bad Debt = Bad Debt Amount x 100 Total Sales Revenue Similarly, using figures from the annual report and audited accounts shown in Table 4.12, the Percentage of Sales Written Off as Bad Debt to Sales for year 2003 was 5.3% obtained by dividing bad debt of GH₵29,121 by electricity sale of GH₵544.943 and the result multiplied by 100.
Policy and Procedures Credit policy Trade between ECG and its customers takes place on credit term with customers given 28 days to pay their bills from the billing date. The billing date was found to be almost 28 days after the meter has been read. ECG's credit period in practical terms extend beyond the 28 days to 42 days in order to fulfil regulatory condition of additional 14 days to be given to the defaulting customer. ECG does not give any cash discount to encourage customers to pay before the final due date. Also, there is no penalty charged for delinquent customers except for reconnection fees when disconnected premises were to be reconnected. The company's policy requires that the amount and date of delivery of the bill be recorded on the customer's meter card but this is not strictly complied with by the majority of the workers of the private companies contracted to read the meters and deliver the bills. Except for some few Special Load Tariff (SL T) customers all the other customers do not sign any receipt book nor acknowledge receipt of the bill. The customers records are updated monthly with the amount billed, payment made and any adjustment passed. This is done at the regional office where the billing system is located. Inputs control measures such as verification and validation of captured readings and payments,
International Journal of Academic Research in Business and Social Sciences 2016, Vol. 6, No. 11
ISSN: 2222-6990
498
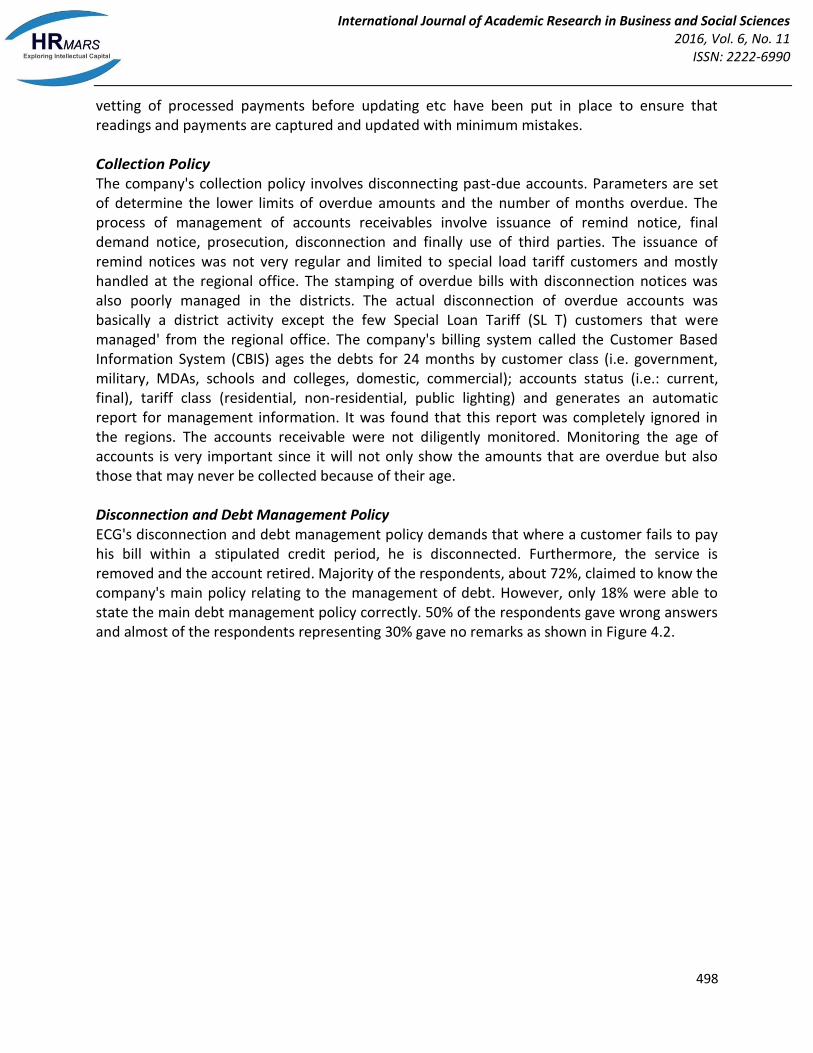
vetting of processed payments before updating etc have been put in place to ensure that readings and payments are captured and updated with minimum mistakes. Collection Policy The company's collection policy involves disconnecting past-due accounts. Parameters are set of determine the lower limits of overdue amounts and the number of months overdue. The process of management of accounts receivables involve issuance of remind notice, final demand notice, prosecution, disconnection and finally use of third parties. The issuance of remind notices was not very regular and limited to special load tariff customers and mostly handled at the regional office. The stamping of overdue bills with disconnection notices was also poorly managed in the districts. The actual disconnection of overdue accounts was basically a district activity except the few Special Loan Tariff (SL T) customers that were managed' from the regional office. The company's billing system called the Customer Based Information System (CBIS) ages the debts for 24 months by customer class (i.e. government, military, MDAs, schools and colleges, domestic, commercial); accounts status (i.e.: current, final), tariff class (residential, non-residential, public lighting) and generates an automatic report for management information. It was found that this report was completely ignored in the regions. The accounts receivable were not diligently monitored. Monitoring the age of accounts is very important since it will not only show the amounts that are overdue but also those that may never be collected because of their age. Disconnection and Debt Management Policy ECG's disconnection and debt management policy demands that where a customer fails to pay his bill within a stipulated credit period, he is disconnected. Furthermore, the service is removed and the account retired. Majority of the respondents, about 72%, claimed to know the company's main policy relating to the management of debt. However, only 18% were able to state the main debt management policy correctly. 50% of the respondents gave wrong answers and almost of the respondents representing 30% gave no remarks as shown in Figure 4.2.
International Journal of Academic Research in Business and Social Sciences 2016, Vol. 6, No. 11
ISSN: 2222-6990
499
Fig. 4.2: Knowledge of Main Debt Management Policy
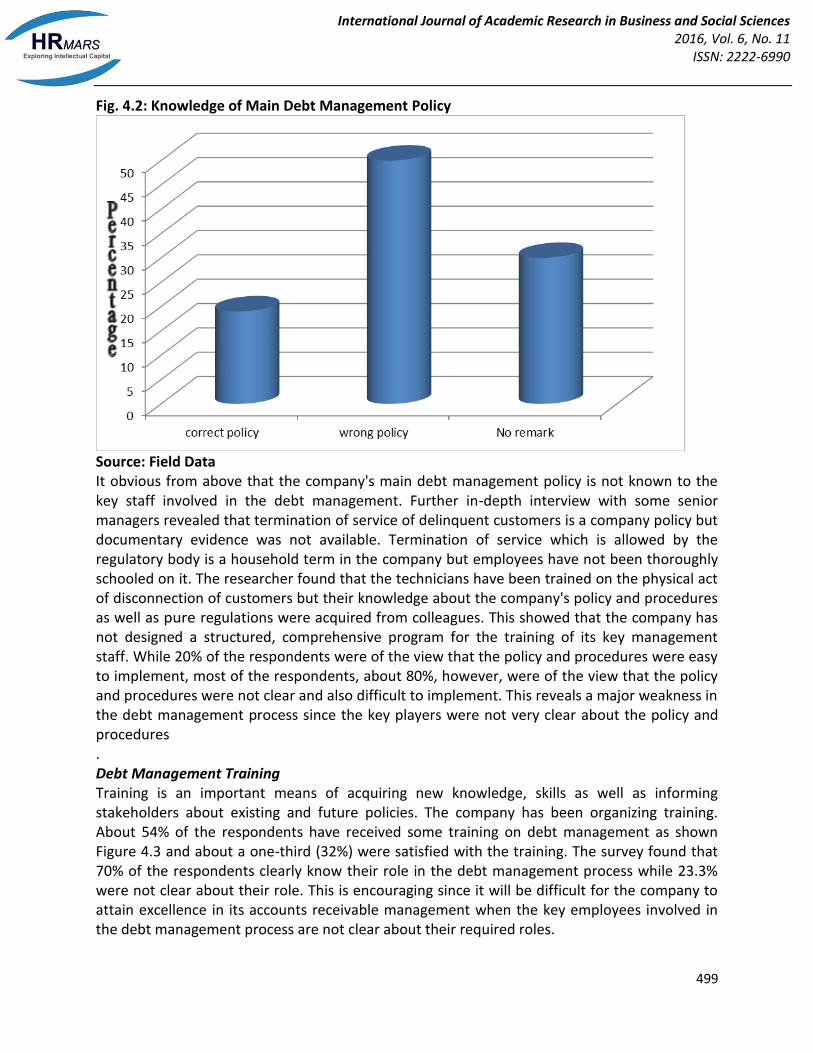
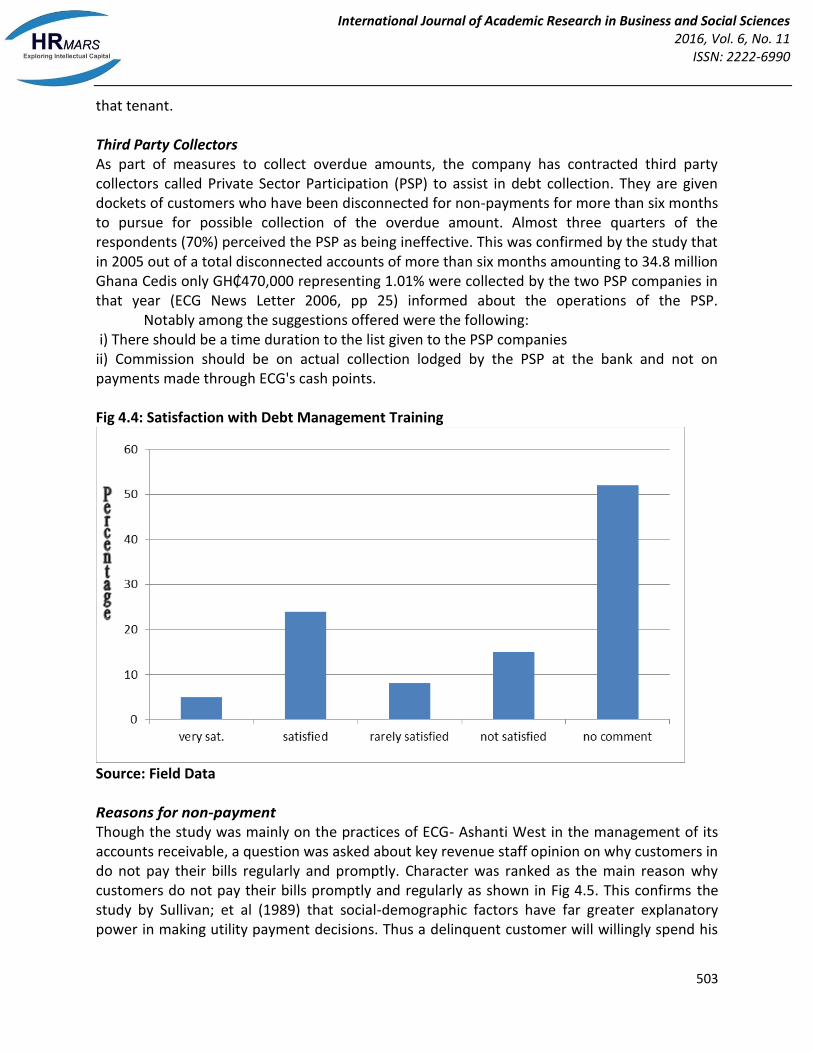
Source: Field Data It obvious from above that the company's main debt management policy is not known to the key staff involved in the debt management. Further in-depth interview with some senior managers revealed that termination of service of delinquent customers is a company policy but documentary evidence was not available. Termination of service which is allowed by the regulatory body is a household term in the company but employees have not been thoroughly schooled on it. The researcher found that the technicians have been trained on the physical act of disconnection of customers but their knowledge about the company's policy and procedures as well as pure regulations were acquired from colleagues. This showed that the company has not designed a structured, comprehensive program for the training of its key management staff. While 20% of the respondents were of the view that the policy and procedures were easy to implement, most of the respondents, about 80%, however, were of the view that the policy and procedures were not clear and also difficult to implement. This reveals a major weakness in the debt management process since the key players were not very clear about the policy and procedures . Debt Management Training Training is an important means of acquiring new knowledge, skills as well as informing stakeholders about existing and future policies. The company has been organizing training. About 54% of the respondents have received some training on debt management as shown Figure 4.3 and about a one-third (32%) were satisfied with the training. The survey found that 70% of the respondents clearly know their role in the debt management process while 23.3% were not clear about their role. This is encouraging since it will be difficult for the company to attain excellence in its accounts receivable management when the key employees involved in the debt management process are not clear about their required roles.
International Journal of Academic Research in Business and Social Sciences 2016, Vol. 6, No. 11
ISSN: 2222-6990
500
Fig 4.3: Debt Management Training
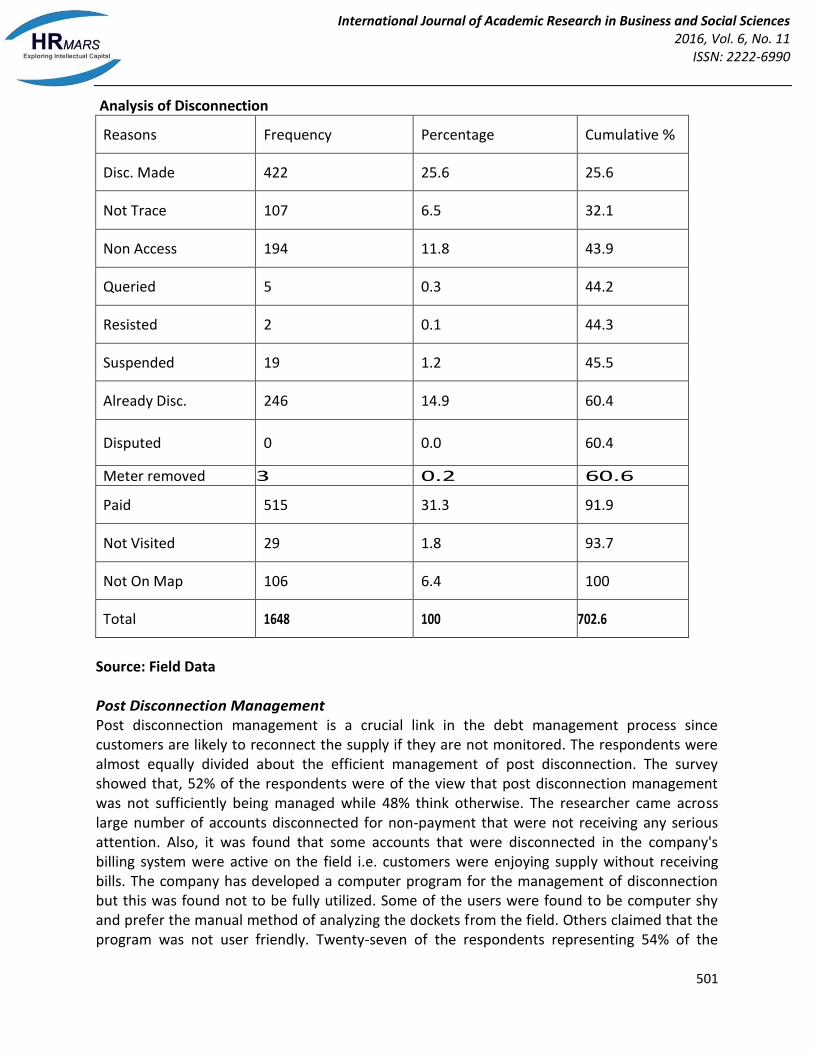
Source: Field Data Accounts Receivable Asset Management Disconnection of supply as the main tool for accounts receivable management supply as a debt management tool while 36% of the respondents were of the view that the company should look for more innovative practices to manage its debts. Some recommended the use of prepayment meters (smart cash meters) as the solution to the company's ineffective debt management practices. Disconnection Management The study found that 64% of the respondents were of the view that disconnection of supply was efficiently managed. The 80% who believed in the effectiveness of disconnection of supply recommended that supervision be intensified, monitoring of disconnected accounts improved and evaluation of disconnecting officers be done regularly. The researcher found that allocation of jobs was poorly organized. It was observed that printing of dockets usually delayed and the disconnection officers habitually leave the company premise very late. Even though they were required to return to the office and submit their reports, some of the disconnecting officers did not comply with the procedures. An analysis of actual disconnections made in a week showed that only 25% of customers due for disconnection were actually disconnected while 75% were not disconnected. Some of the reasons while some defaulters were not disconnected include: 31 % of customers had already paid, 14.9% customers already disconnected and almost 13% of defaulters could neither be traced on the map. The details are shown in Table 4.2 below.
International Journal of Academic Research in Business and Social Sciences 2016, Vol. 6, No. 11
ISSN: 2222-6990
501
Analysis of Disconnection
Reasons Frequency Percentage Cumulative %
Disc. Made 422 25.6 25.6
Not Trace 107 6.5 32.1
Non Access 194 11.8 43.9
Queried 5 0.3 44.2
Resisted 2 0.1 44.3
Suspended 19 1.2 45.5
Already Disc. 246 14.9 60.4
Disputed 0 0.0 60.4
Meter removed 3 0.2 60.6
Paid 515 31.3 91.9
Not Visited 29 1.8 93.7
Not On Map 106 6.4 100
Total 1648 100 702.6
Source: Field Data Post Disconnection Management Post disconnection management is a crucial link in the debt management process since customers are likely to reconnect the supply if they are not monitored. The respondents were almost equally divided about the efficient management of post disconnection. The survey showed that, 52% of the respondents were of the view that post disconnection management was not sufficiently being managed while 48% think otherwise. The researcher came across large number of accounts disconnected for non-payment that were not receiving any serious attention. Also, it was found that some accounts that were disconnected in the company's billing system were active on the field i.e. customers were enjoying supply without receiving bills. The company has developed a computer program for the management of disconnection but this was found not to be fully utilized. Some of the users were found to be computer shy and prefer the manual method of analyzing the dockets from the field. Others claimed that the program was not user friendly. Twenty-seven of the respondents representing 54% of the
International Journal of Academic Research in Business and Social Sciences 2016, Vol. 6, No. 11
ISSN: 2222-6990
502
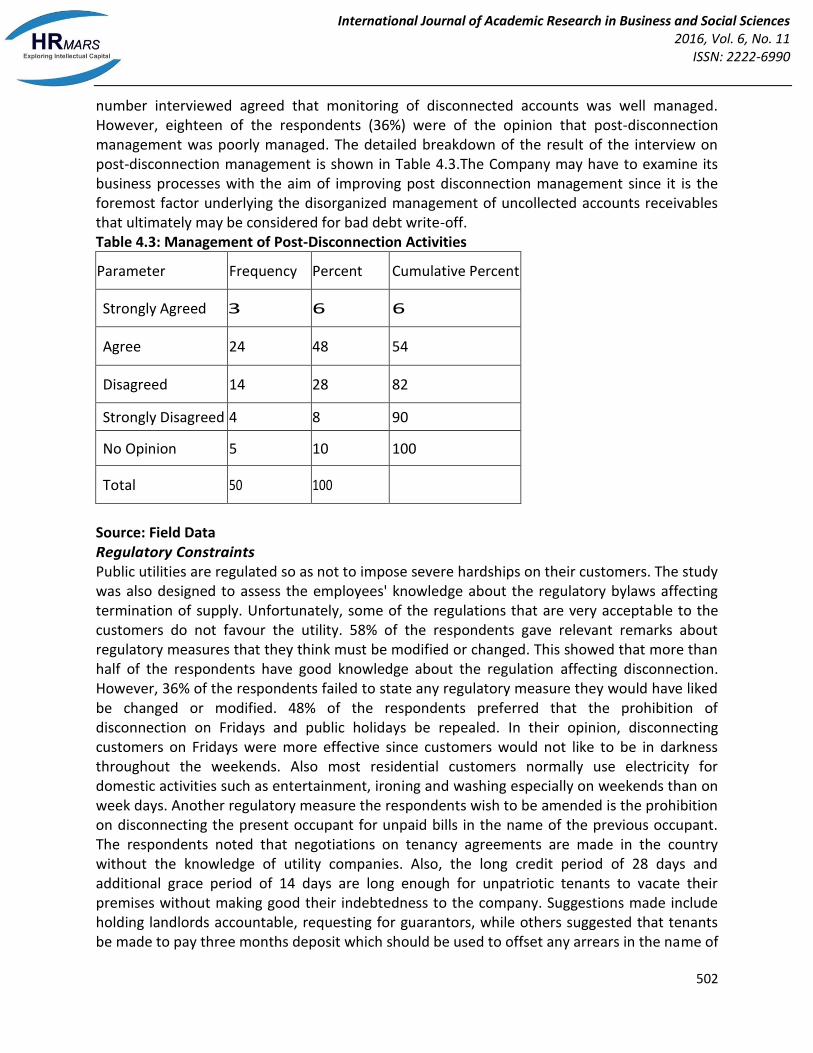
number interviewed agreed that monitoring of disconnected accounts was well managed. However, eighteen of the respondents (36%) were of the opinion that post-disconnection management was poorly managed. The detailed breakdown of the result of the interview on post-disconnection management is shown in Table 4.3.The Company may have to examine its business processes with the aim of improving post disconnection management since it is the foremost factor underlying the disorganized management of uncollected accounts receivables that ultimately may be considered for bad debt write-off. Table 4.3: Management of Post-Disconnection Activities
Parameter Frequency Percent Cumulative Percent
Strongly Agreed 3 6 6
Agree 24 48 54
Disagreed 14 28 82
Strongly Disagreed 4 8 90
No Opinion 5 10 100
Total 50 100
Source: Field Data Regulatory Constraints Public utilities are regulated so as not to impose severe hardships on their customers. The study was also designed to assess the employees' knowledge about the regulatory bylaws affecting termination of supply. Unfortunately, some of the regulations that are very acceptable to the customers do not favour the utility. 58% of the respondents gave relevant remarks about regulatory measures that they think must be modified or changed. This showed that more than half of the respondents have good knowledge about the regulation affecting disconnection. However, 36% of the respondents failed to state any regulatory measure they would have liked be changed or modified. 48% of the respondents preferred that the prohibition of disconnection on Fridays and public holidays be repealed. In their opinion, disconnecting customers on Fridays were more effective since customers would not like to be in darkness throughout the weekends. Also most residential customers normally use electricity for domestic activities such as entertainment, ironing and washing especially on weekends than on week days. Another regulatory measure the respondents wish to be amended is the prohibition on disconnecting the present occupant for unpaid bills in the name of the previous occupant. The respondents noted that negotiations on tenancy agreements are made in the country without the knowledge of utility companies. Also, the long credit period of 28 days and additional grace period of 14 days are long enough for unpatriotic tenants to vacate their premises without making good their indebtedness to the company. Suggestions made include holding landlords accountable, requesting for guarantors, while others suggested that tenants be made to pay three months deposit which should be used to offset any arrears in the name of
International Journal of Academic Research in Business and Social Sciences 2016, Vol. 6, No. 11
ISSN: 2222-6990
503
that tenant. Third Party Collectors As part of measures to collect overdue amounts, the company has contracted third party collectors called Private Sector Participation (PSP) to assist in debt collection. They are given dockets of customers who have been disconnected for non-payments for more than six months to pursue for possible collection of the overdue amount. Almost three quarters of the respondents (70%) perceived the PSP as being ineffective. This was confirmed by the study that in 2005 out of a total disconnected accounts of more than six months amounting to 34.8 million Ghana Cedis only GH₵470,000 representing 1.01% were collected by the two PSP companies in that year (ECG News Letter 2006, pp 25) informed about the operations of the PSP. Notably among the suggestions offered were the following: i) There should be a time duration to the list given to the PSP companies ii) Commission should be on actual collection lodged by the PSP at the bank and not on payments made through ECG's cash points. Fig 4.4: Satisfaction with Debt Management Training
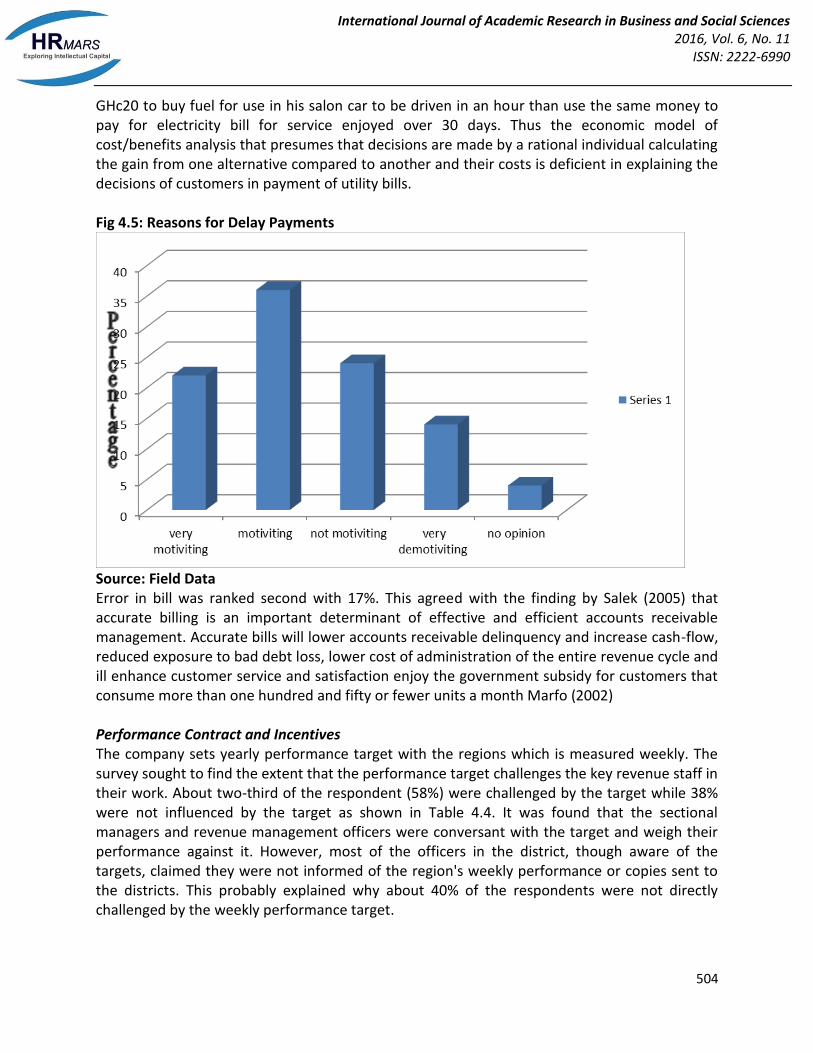
Source: Field Data Reasons for non-payment Though the study was mainly on the practices of ECG- Ashanti West in the management of its accounts receivable, a question was asked about key revenue staff opinion on why customers in do not pay their bills regularly and promptly. Character was ranked as the main reason why customers do not pay their bills promptly and regularly as shown in Fig 4.5. This confirms the study by Sullivan; et al (1989) that social-demographic factors have far greater explanatory power in making utility payment decisions. Thus a delinquent customer will willingly spend his
International Journal of Academic Research in Business and Social Sciences 2016, Vol. 6, No. 11
ISSN: 2222-6990
504
GHc20 to buy fuel for use in his salon car to be driven in an hour than use the same money to pay for electricity bill for service enjoyed over 30 days. Thus the economic model of cost/benefits analysis that presumes that decisions are made by a rational individual calculating the gain from one alternative compared to another and their costs is deficient in explaining the decisions of customers in payment of utility bills. Fig 4.5: Reasons for Delay Payments
Source: Field Data Error in bill was ranked second with 17%. This agreed with the finding by Salek (2005) that accurate billing is an important determinant of effective and efficient accounts receivable management. Accurate bills will lower accounts receivable delinquency and increase cash-flow, reduced exposure to bad debt loss, lower cost of administration of the entire revenue cycle and ill enhance customer service and satisfaction enjoy the government subsidy for customers that consume more than one hundred and fifty or fewer units a month Marfo (2002) Performance Contract and Incentives The company sets yearly performance target with the regions which is measured weekly. The survey sought to find the extent that the performance target challenges the key revenue staff in their work. About two-third of the respondent (58%) were challenged by the target while 38% were not influenced by the target as shown in Table 4.4. It was found that the sectional managers and revenue management officers were conversant with the target and weigh their performance against it. However, most of the officers in the district, though aware of the targets, claimed they were not informed of the region's weekly performance or copies sent to the districts. This probably explained why about 40% of the respondents were not directly challenged by the weekly performance target.
International Journal of Academic Research in Business and Social Sciences 2016, Vol. 6, No. 11
ISSN: 2222-6990
505
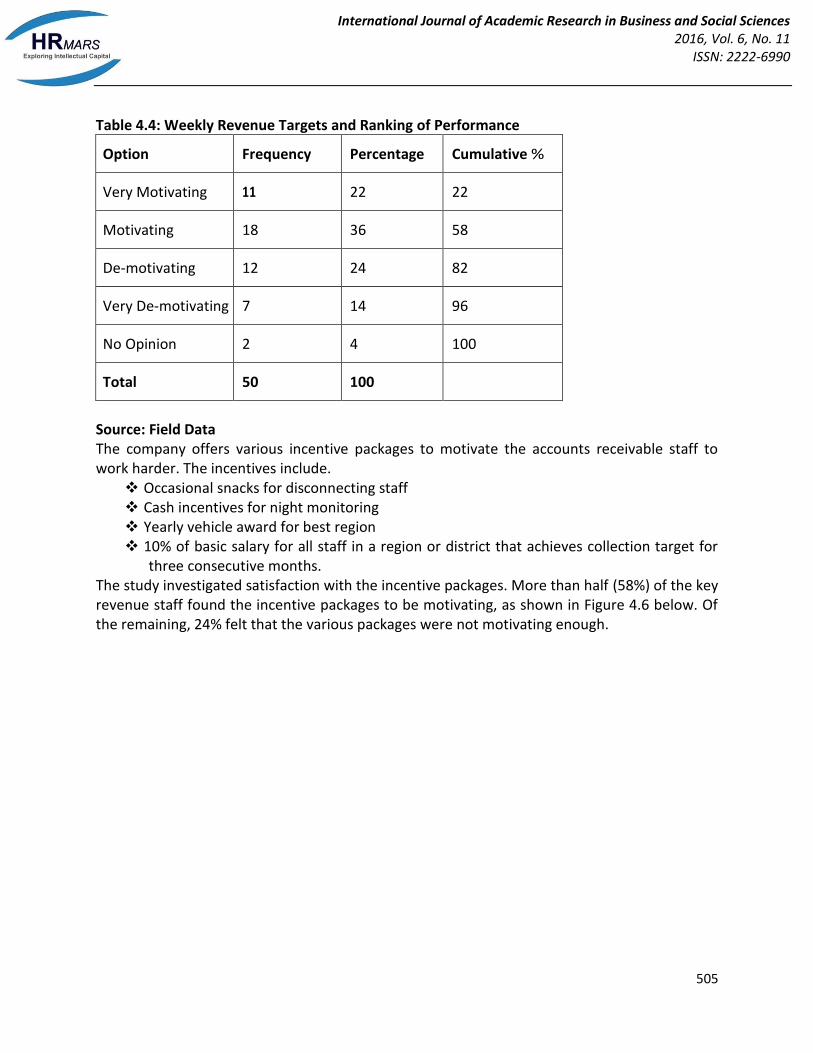
Table 4.4: Weekly Revenue Targets and Ranking of Performance
Option Frequency Percentage Cumulative %
Very Motivating 11 22 22
Motivating 18 36 58
De-motivating 12 24 82
Very De-motivating 7 14 96
No Opinion 2 4 100
Total 50 100
Source: Field Data The company offers various incentive packages to motivate the accounts receivable staff to work harder. The incentives include.
Occasional snacks for disconnecting staff Cash incentives for night monitoring Yearly vehicle award for best region 10% of basic salary for all staff in a region or district that achieves collection target for
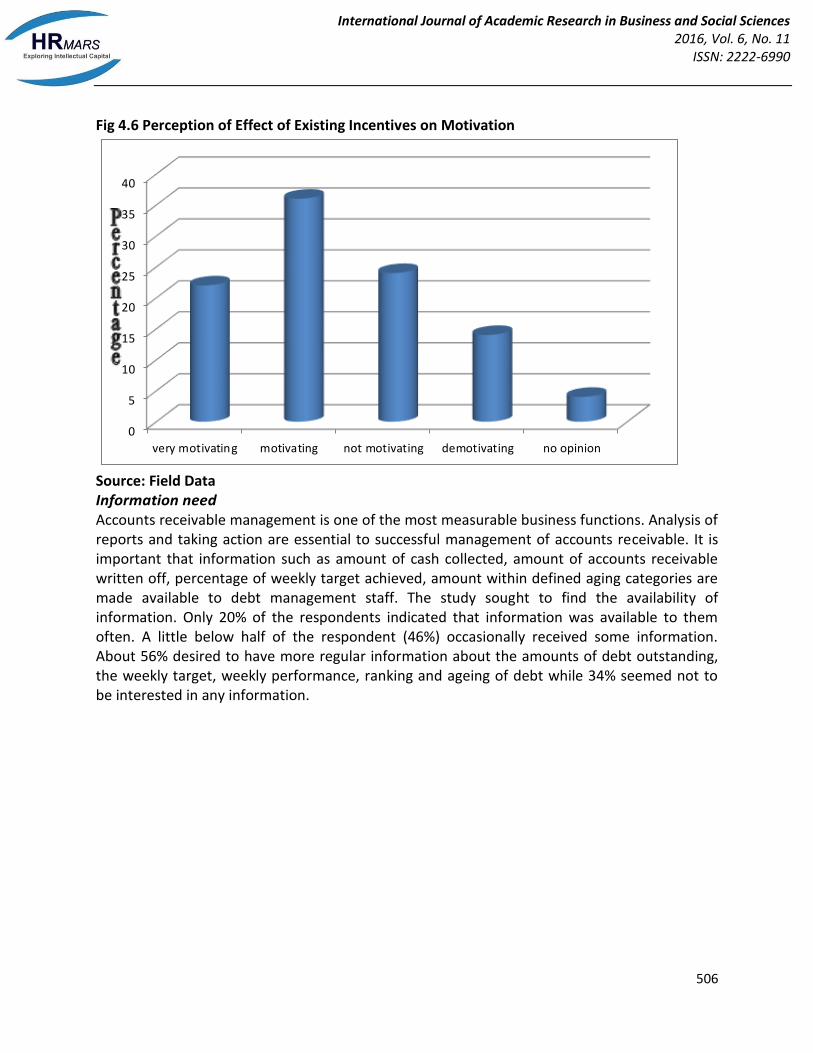
three consecutive months. The study investigated satisfaction with the incentive packages. More than half (58%) of the key revenue staff found the incentive packages to be motivating, as shown in Figure 4.6 below. Of the remaining, 24% felt that the various packages were not motivating enough.
International Journal of Academic Research in Business and Social Sciences 2016, Vol. 6, No. 11
ISSN: 2222-6990
506
Fig 4.6 Perception of Effect of Existing Incentives on Motivation
0
5
10
15
20
25
30
35
40
very motivating motivating not motivating demotivating no opinion
Source: Field Data Information need Accounts receivable management is one of the most measurable business functions. Analysis of reports and taking action are essential to successful management of accounts receivable. It is important that information such as amount of cash collected, amount of accounts receivable written off, percentage of weekly target achieved, amount within defined aging categories are made available to debt management staff. The study sought to find the availability of information. Only 20% of the respondents indicated that information was available to them often. A little below half of the respondent (46%) occasionally received some information. About 56% desired to have more regular information about the amounts of debt outstanding, the weekly target, weekly performance, ranking and ageing of debt while 34% seemed not to be interested in any information.
International Journal of Academic Research in Business and Social Sciences 2016, Vol. 6, No. 11
ISSN: 2222-6990
507
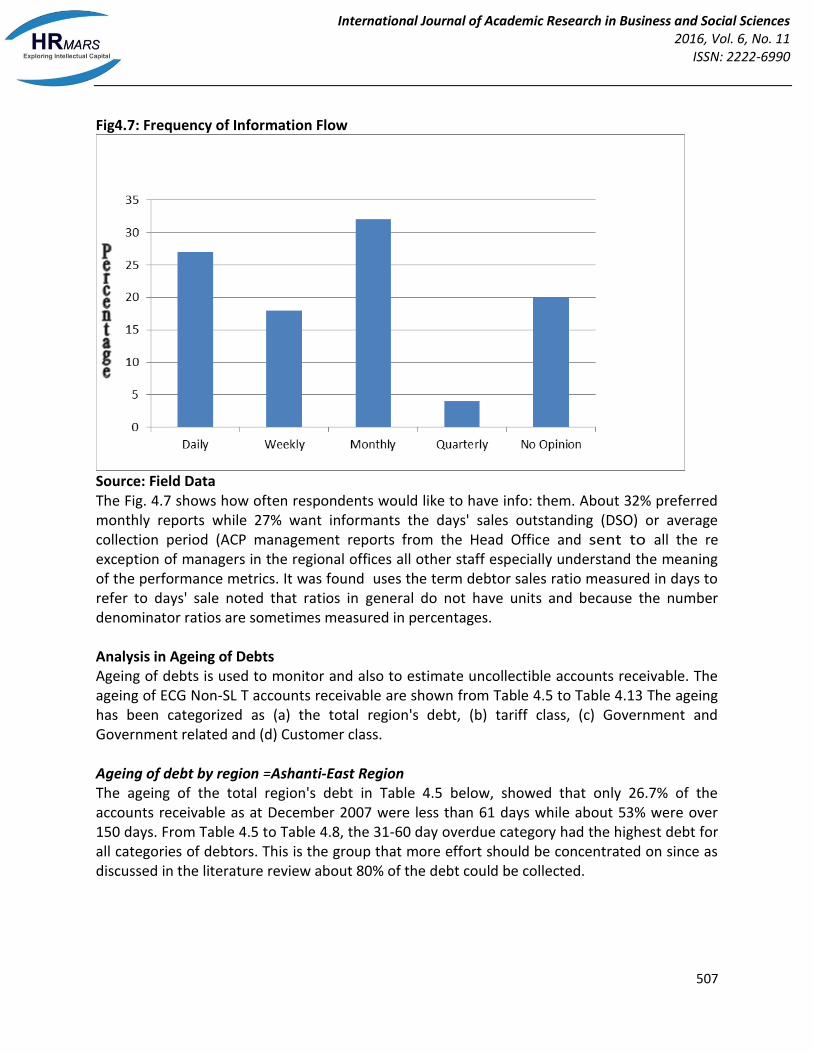
Fig4.7: Frequency of Information Flow
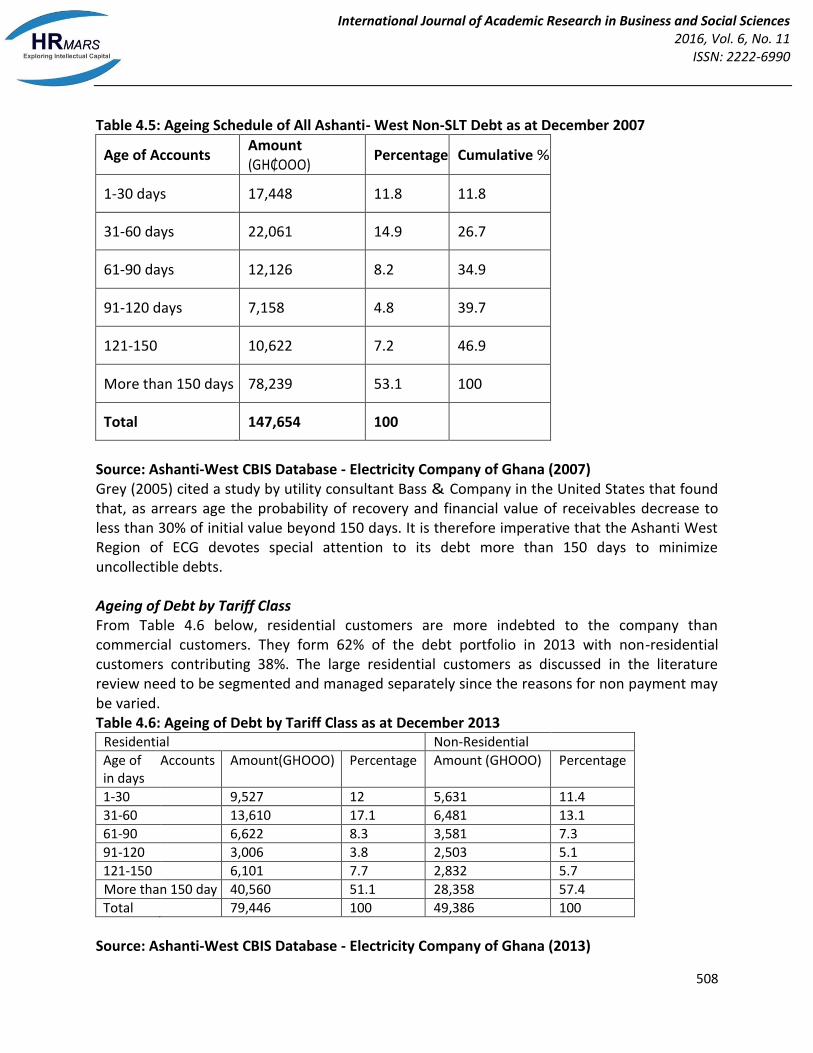
Source: Field Data The Fig. 4.7 shows how often respondents would like to have info: them. About 32% preferred monthly reports while 27% want informants the days' sales outstanding (DSO) or average collection period (ACP management reports from the Head Office and sent to all the re exception of managers in the regional offices all other staff especially understand the meaning of the performance metrics. It was found uses the term debtor sales ratio measured in days to refer to days' sale noted that ratios in general do not have units and because the number denominator ratios are sometimes measured in percentages. Analysis in Ageing of Debts Ageing of debts is used to monitor and also to estimate uncollectible accounts receivable. The ageing of ECG Non-SL T accounts receivable are shown from Table 4.5 to Table 4.13 The ageing has been categorized as (a) the total region's debt, (b) tariff class, (c) Government and Government related and (d) Customer class. Ageing of debt by region =Ashanti-East Region The ageing of the total region's debt in Table 4.5 below, showed that only 26.7% of the accounts receivable as at December 2007 were less than 61 days while about 53% were over 150 days. From Table 4.5 to Table 4.8, the 31-60 day overdue category had the highest debt for all categories of debtors. This is the group that more effort should be concentrated on since as discussed in the literature review about 80% of the debt could be collected.
International Journal of Academic Research in Business and Social Sciences 2016, Vol. 6, No. 11
ISSN: 2222-6990
508
Table 4.5: Ageing Schedule of All Ashanti- West Non-SLT Debt as at December 2007
Age of Accounts , Amount (GH₵OOO)
Percentage Cumulative %
1-30 days 17,448 11.8 11.8
31-60 days 22,061 14.9 26.7
61-90 days 12,126 8.2 34.9
91-120 days 7,158 4.8 39.7
121-150 10,622 7.2 46.9
More than 150 days 78,239 53.1 100
Total 147,654 100
Source: Ashanti-West CBIS Database - Electricity Company of Ghana (2007) Grey (2005) cited a study by utility consultant Bass & Company in the United States that found that, as arrears age the probability of recovery and financial value of receivables decrease to less than 30% of initial value beyond 150 days. It is therefore imperative that the Ashanti West Region of ECG devotes special attention to its debt more than 150 days to minimize uncollectible debts. Ageing of Debt by Tariff Class From Table 4.6 below, residential customers are more indebted to the company than commercial customers. They form 62% of the debt portfolio in 2013 with non-residential customers contributing 38%. The large residential customers as discussed in the literature review need to be segmented and managed separately since the reasons for non payment may be varied. Table 4.6: Ageing of Debt by Tariff Class as at December 2013
Residential Non-Residential
Age of Accounts Amount(GHOOO) Percentage Amount (GHOOO) Percentage in days
1-30 9,527 12 5,631 11.4
31-60 13,610 17.1 6,481 13.1
61-90 6,622 8.3 3,581 7.3
91-120 3,006 3.8 2,503 5.1
121-150 6,101 7.7 2,832 5.7
More than 150 day 40,560 51.1 28,358 57.4
Total 79,446 100 49,386 100
Source: Ashanti-West CBIS Database - Electricity Company of Ghana (2013)
International Journal of Academic Research in Business and Social Sciences 2016, Vol. 6, No. 11
ISSN: 2222-6990
509
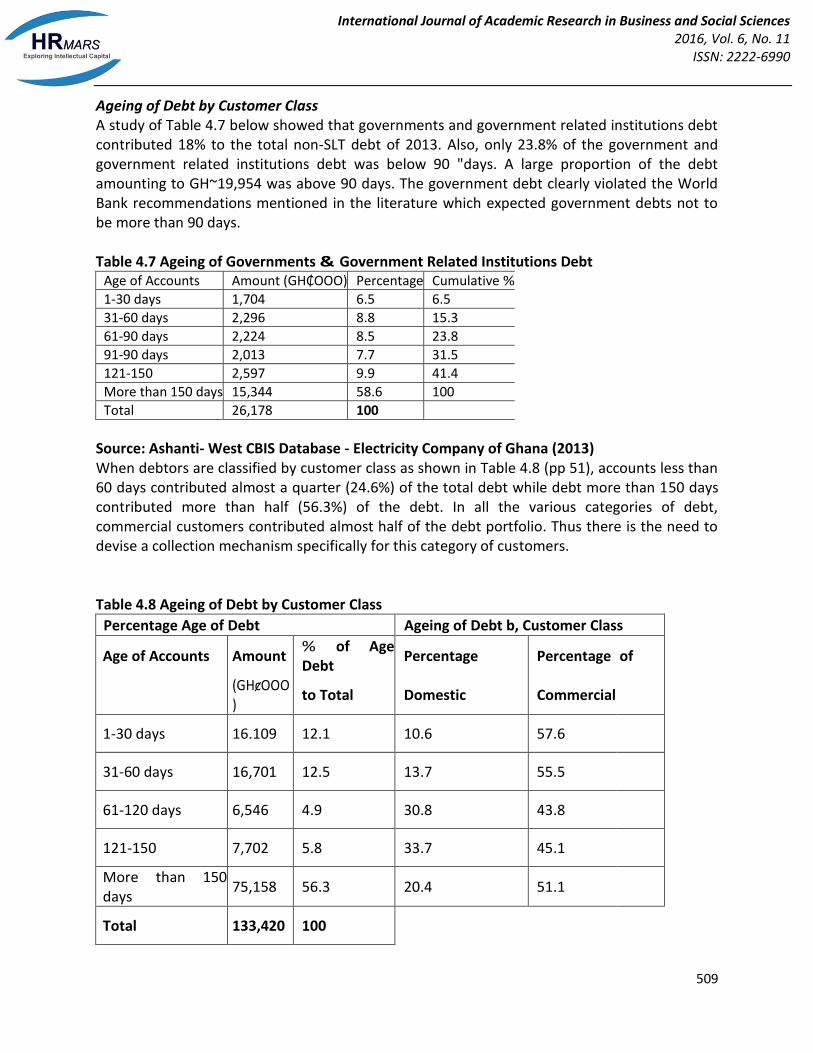
Ageing of Debt by Customer Class A study of Table 4.7 below showed that governments and government related institutions debt contributed 18% to the total non-SLT debt of 2013. Also, only 23.8% of the government and government related institutions debt was below 90 "days. A large proportion of the debt amounting to GH~19,954 was above 90 days. The government debt clearly violated the World Bank recommendations mentioned in the literature which expected government debts not to be more than 90 days. Table 4.7 Ageing of Governments & Government Related Institutions Debt
Age of Accounts Amount (GH₵OOO) Percentage Cumulative %
1-30 days 1,704 6.5 6.5
31-60 days 2,296 8.8 15.3
61-90 days 2,224 8.5 23.8
91-90 days 2,013 7.7 31.5
121-150 2,597 9.9 41.4
More than 150 days 15,344 58.6 100
Total 26,178 100
Source: Ashanti- West CBIS Database - Electricity Company of Ghana (2013) When debtors are classified by customer class as shown in Table 4.8 (pp 51), accounts less than 60 days contributed almost a quarter (24.6%) of the total debt while debt more than 150 days contributed more than half (56.3%) of the debt. In all the various categories of debt, commercial customers contributed almost half of the debt portfolio. Thus there is the need to devise a collection mechanism specifically for this category of customers. Table 4.8 Ageing of Debt by Customer Class
Percentage Age of Debt Ageing of Debt b, Customer Class
Age of Accounts Amount % of Age Debt
Percentage Percentage of
(GHȼOOO)
to Total Domestic Commercial
1-30 days 16.109 12.1 10.6 57.6
31-60 days 16,701 12.5 13.7 55.5
61-120 days 6,546 4.9 30.8 43.8
121-150 7,702 5.8 33.7 45.1
More than 150 days
75,158 56.3 20.4 51.1
Total 133,420 100
International Journal of Academic Research in Business and Social Sciences 2016, Vol. 6, No. 11
ISSN: 2222-6990
510
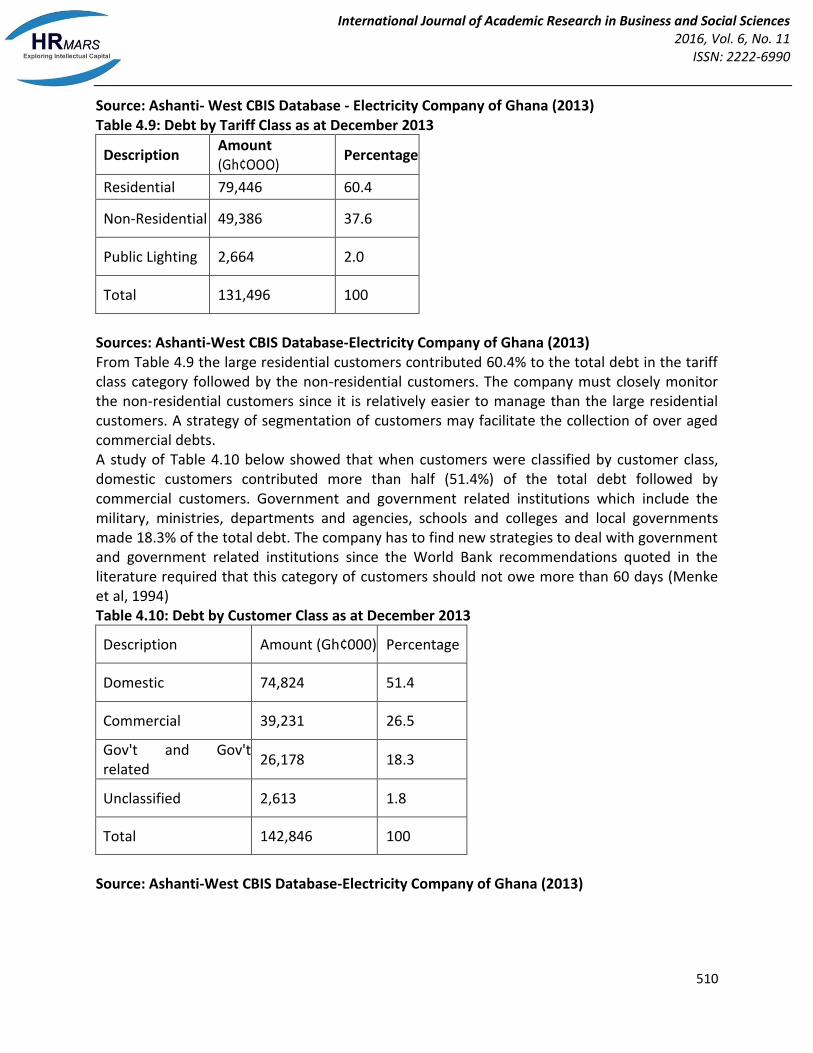
Source: Ashanti- West CBIS Database - Electricity Company of Ghana (2013) Table 4.9: Debt by Tariff Class as at December 2013
Description Amount (Gh¢OOO)
Percentage
Residential 79,446 60.4
Non-Residential 49,386 37.6
Public Lighting 2,664 2.0
Total 131,496 100
Sources: Ashanti-West CBIS Database-Electricity Company of Ghana (2013) From Table 4.9 the large residential customers contributed 60.4% to the total debt in the tariff class category followed by the non-residential customers. The company must closely monitor the non-residential customers since it is relatively easier to manage than the large residential customers. A strategy of segmentation of customers may facilitate the collection of over aged commercial debts. A study of Table 4.10 below showed that when customers were classified by customer class, domestic customers contributed more than half (51.4%) of the total debt followed by commercial customers. Government and government related institutions which include the military, ministries, departments and agencies, schools and colleges and local governments made 18.3% of the total debt. The company has to find new strategies to deal with government and government related institutions since the World Bank recommendations quoted in the literature required that this category of customers should not owe more than 60 days (Menke et al, 1994) Table 4.10: Debt by Customer Class as at December 2013
Description Amount (Gh¢000) Percentage
Domestic 74,824 51.4
Commercial 39,231 26.5
Gov't and Gov't related
26,178 18.3
Unclassified 2,613 1.8
Total 142,846 100
Source: Ashanti-West CBIS Database-Electricity Company of Ghana (2013)
International Journal of Academic Research in Business and Social Sciences 2016, Vol. 6, No. 11
ISSN: 2222-6990
511
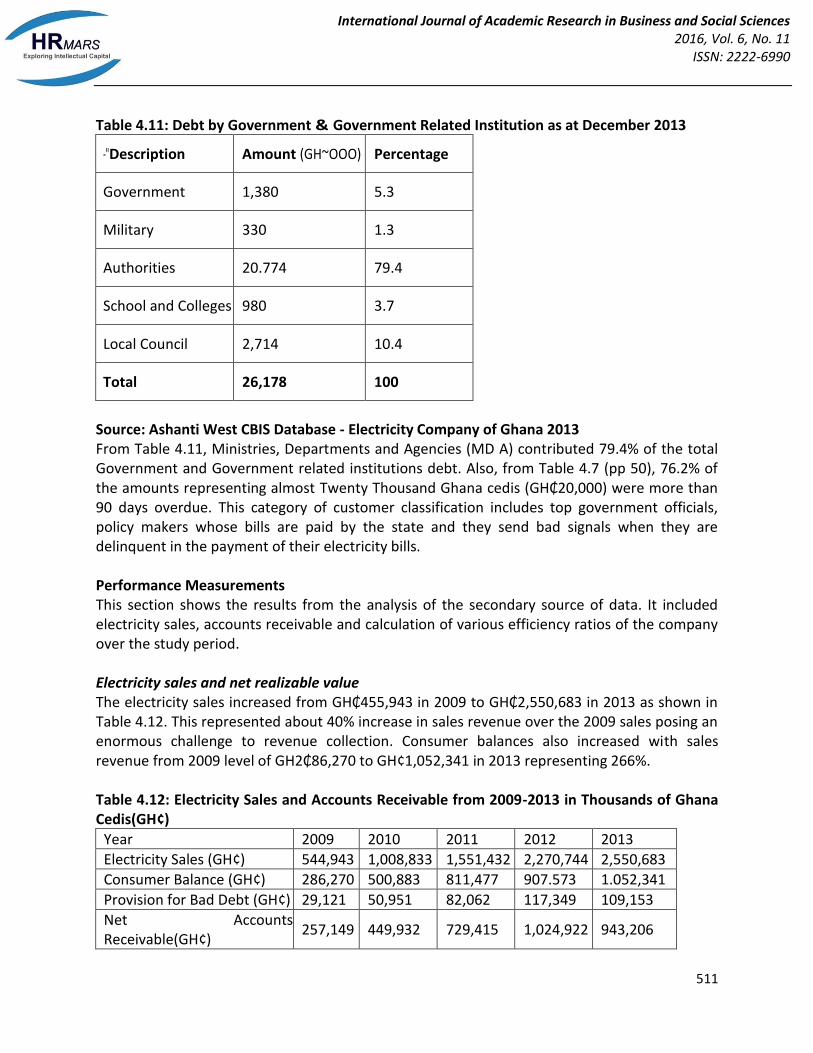
Table 4.11: Debt by Government & Government Related Institution as at December 2013
-"Description Amount (GH~OOO) Percentage
Government 1,380 5.3
Military 330 1.3
Authorities 20.774 79.4
School and Colleges 980 3.7
Local Council 2,714 10.4
Total 26,178 100
Source: Ashanti West CBIS Database - Electricity Company of Ghana 2013 From Table 4.11, Ministries, Departments and Agencies (MD A) contributed 79.4% of the total Government and Government related institutions debt. Also, from Table 4.7 (pp 50), 76.2% of the amounts representing almost Twenty Thousand Ghana cedis (GH₵20,000) were more than 90 days overdue. This category of customer classification includes top government officials, policy makers whose bills are paid by the state and they send bad signals when they are delinquent in the payment of their electricity bills. Performance Measurements This section shows the results from the analysis of the secondary source of data. It included electricity sales, accounts receivable and calculation of various efficiency ratios of the company over the study period. Electricity sales and net realizable value The electricity sales increased from GH₵455,943 in 2009 to GH₵2,550,683 in 2013 as shown in Table 4.12. This represented about 40% increase in sales revenue over the 2009 sales posing an enormous challenge to revenue collection. Consumer balances also increased with sales revenue from 2009 level of GH2₵86,270 to GH¢1,052,341 in 2013 representing 266%. Table 4.12: Electricity Sales and Accounts Receivable from 2009-2013 in Thousands of Ghana Cedis(GH¢)
Year 2009 2010 2011 2012 2013
Electricity Sales (GH¢) 544,943 1,008,833 1,551,432 2,270,744 2,550,683
Consumer Balance (GH¢) 286,270 500,883 811,477 907.573 1.052,341
Provision for Bad Debt (GH¢) 29,121 50,951 82,062 117,349 109,153
Net Accounts Receivable(GH¢)
257,149 449,932 729,415 1,024,922 943,206
International Journal of Academic Research in Business and Social Sciences 2016, Vol. 6, No. 11
ISSN: 2222-6990
512
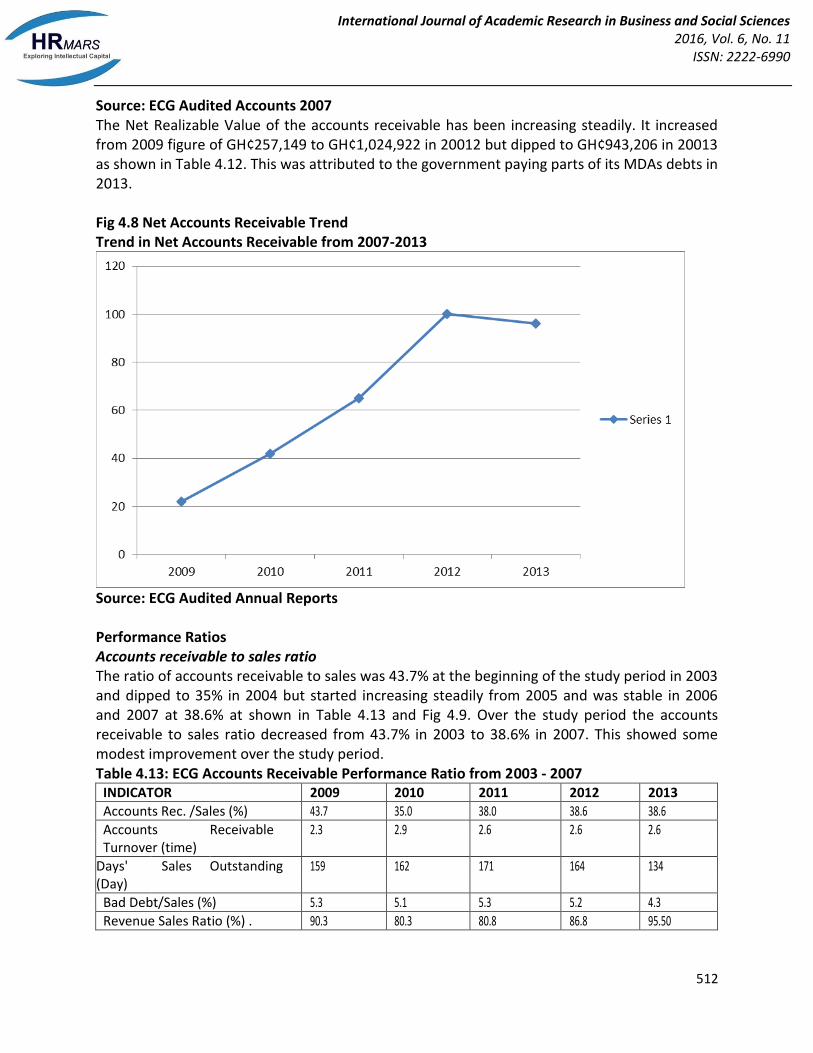
Source: ECG Audited Accounts 2007 The Net Realizable Value of the accounts receivable has been increasing steadily. It increased from 2009 figure of GH¢257,149 to GH¢1,024,922 in 20012 but dipped to GH¢943,206 in 20013 as shown in Table 4.12. This was attributed to the government paying parts of its MDAs debts in 2013. Fig 4.8 Net Accounts Receivable Trend Trend in Net Accounts Receivable from 2007-2013
Source: ECG Audited Annual Reports Performance Ratios Accounts receivable to sales ratio The ratio of accounts receivable to sales was 43.7% at the beginning of the study period in 2003 and dipped to 35% in 2004 but started increasing steadily from 2005 and was stable in 2006 and 2007 at 38.6% at shown in Table 4.13 and Fig 4.9. Over the study period the accounts receivable to sales ratio decreased from 43.7% in 2003 to 38.6% in 2007. This showed some modest improvement over the study period. Table 4.13: ECG Accounts Receivable Performance Ratio from 2003 - 2007
INDICATOR 2009 2010 2011 2012 2013
Accounts Rec. /Sales (%) 43.7 35.0 38.0 38.6 38.6
Accounts Receivable 2.3 2.9 2.6 2.6 2.6 Turnover (time)
Days' Sales Outstanding 159 162 171 164 134 (Day)
Bad Debt/Sales (%) 5.3 5.1 5.3 5.2 4.3
Revenue Sales Ratio (%) . 90.3 80.3 80.8 86.8 95.50
International Journal of Academic Research in Business and Social Sciences 2016, Vol. 6, No. 11
ISSN: 2222-6990
513
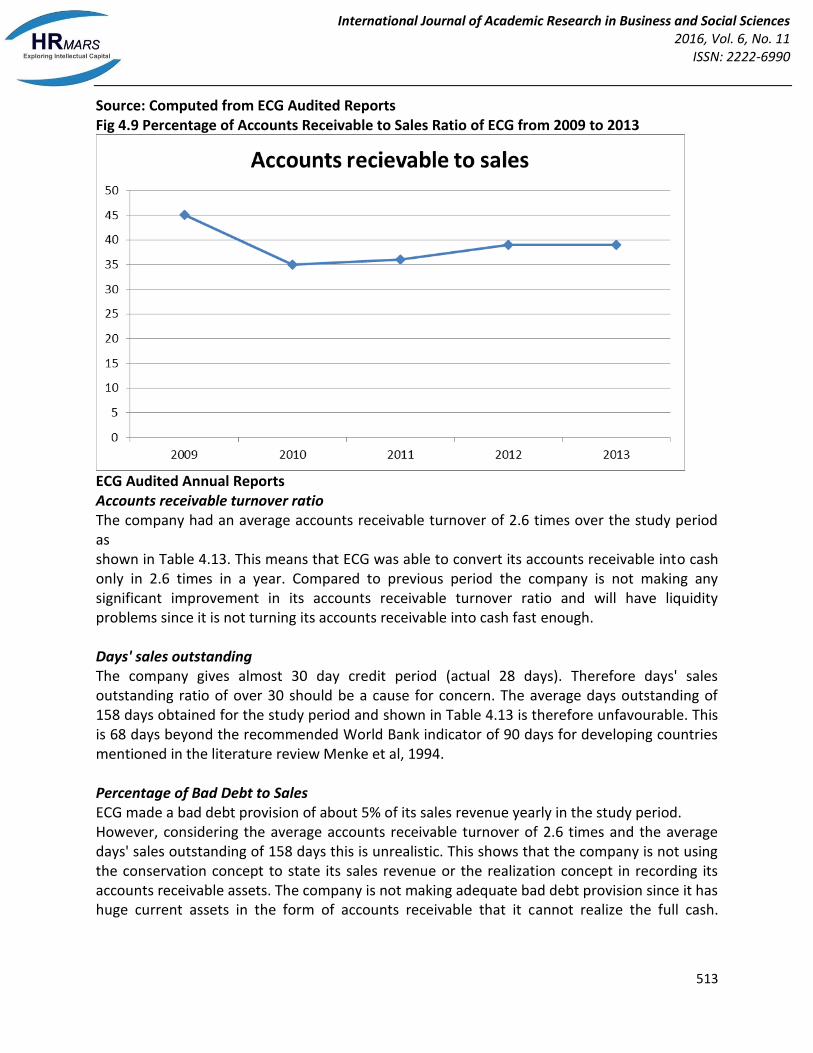
Source: Computed from ECG Audited Reports Fig 4.9 Percentage of Accounts Receivable to Sales Ratio of ECG from 2009 to 2013
ECG Audited Annual Reports Accounts receivable turnover ratio The company had an average accounts receivable turnover of 2.6 times over the study period as shown in Table 4.13. This means that ECG was able to convert its accounts receivable into cash only in 2.6 times in a year. Compared to previous period the company is not making any significant improvement in its accounts receivable turnover ratio and will have liquidity problems since it is not turning its accounts receivable into cash fast enough. Days' sales outstanding The company gives almost 30 day credit period (actual 28 days). Therefore days' sales outstanding ratio of over 30 should be a cause for concern. The average days outstanding of 158 days obtained for the study period and shown in Table 4.13 is therefore unfavourable. This is 68 days beyond the recommended World Bank indicator of 90 days for developing countries mentioned in the literature review Menke et al, 1994. Percentage of Bad Debt to Sales ECG made a bad debt provision of about 5% of its sales revenue yearly in the study period. However, considering the average accounts receivable turnover of 2.6 times and the average days' sales outstanding of 158 days this is unrealistic. This shows that the company is not using the conservation concept to state its sales revenue or the realization concept in recording its accounts receivable assets. The company is not making adequate bad debt provision since it has huge current assets in the form of accounts receivable that it cannot realize the full cash.
International Journal of Academic Research in Business and Social Sciences 2016, Vol. 6, No. 11
ISSN: 2222-6990
514 www.hrmars.com
CONCLUSION This project has sought to shed some light on accounts receivable management practices of ECG by analyzing data collected through survey, and through the review of existing literature. The main objective of the study was to find out the effectiveness of the management of accounts receivable by ECG. The specific objectives were to find the following:
i) The trend of the accounts receivable from 2009 to 2013 ii) The level of contribution of various customer classifications to ECG's accounts
receivable. iii) The effectiveness of existing debt management practices iv) The level of company's staff knowledge in account receivable management v) The effectiveness of termination of service as a debt management tool vi) vi) To recommend strategies to improve management of accounts receivable
Summary of key findings This section highlights the major findings of the project and draws conclusion from the results obtained. The following were the findings: Trend of accounts receivable. The percentage of account receivable to sales decreed from 43.7% in 2009 to 35% in 2010 but increased to 38.6% in 2011 where it remained the same for 2012 and 2013 as shown in Table 58. Thus the study found that the percentage accounts receivable to sale has not been decreasing. The net accounts receivable has been increasing steadily from 2009 to 2012 and decreased only in 2013." ECG is therefore not effectively managing its accounts receivable during the study period. Contribution to accounts receivable by customer classification Inactive customers contributed 30.5% of total debt by customer status in 2013. In classification of debtors by customer class, residential customers contributed more than half of the debt (51.4%) followed by commercial customers with 26.5% and Government and Government related accounts contributing 18.3% of the accounts receivable as shown in Table 4.10. The study thus found that active accounts, residential and commercial customers and government and government related institutions were the major contributors to the accounts receivable. Effectiveness of existing debt management practices Even though prosecution of debtors was widely mentioned among senior officers of the company, it was found that its contribution to debt reduction in the short term was insignificant Third party collectors were found to be ineffective since they collected only about 1 % of accounts disconnected for more than six month during the study period. The study found that the following weaknesses in the business processes adversely affected the effectiveness of the debt management practices:
Some accounts were not properly coded and therefore appeared as unclassified. • Bad debt write-off was not being done systematically • Huge finalized accounts not receiving serious attention
International Journal of Academic Research in Business and Social Sciences 2016, Vol. 6, No. 11
ISSN: 2222-6990
515 www.hrmars.com
• There were error in bills leading to high numbers of disputed bills and adjustments • There were lacks of logistics such as ladder carrying vehicles, sealing climbing belts etc. Staff knowledge in accounts receivable management The study found that most of the revenue management employees (82%) did not know the company's debt management policy. About half of the revenue management employees have copies of the revenue manual which spelt out in detail procedures for using disconnection to recover overdue amounts, but most (72%) were not satisfied with the training. Some key revenue officers were not very clear about their roles
There were transfer of staff to Customer Service section (responsible for debt collection) without adequate training
Most key revenue officers do not have copies of revenue manual Termination of service Though the company is spending a lot of resources in terms of personnel remuneration, incentives, logistics, man-hours etc, termination of service as the main debt management tool was found to be ineffective as evidenced by the high days' sales outstanding of between 171 and 134 days and very low accounts receivable turnover with an average of 2.6 times over the study period (Table 4. 13) It was further found that the implementation of the policy was major problem and the following were some of the causes: • There were poor keeping of customer records in the reconciliation and disconnection offices especially in the districts. • There was poor organization of work for disconnection and reconciliation activities. • There was ineffective supervision of field workers • Post disconnection management was not effectively managed • Study and analysis of collect reports such as age of debt, disconnected accounts etc were not a schedule for any staff.
RECOMMENDATIONS The recommendations are based on (i) weaknesses identified during the study (ii) government and regulatory/ legal system and (iii) best practices in the utility industry. Recommendations in relation to weaknesses identified Credit Analysis and Deposits Absence of credit analysis of customers is factor that is contributing to the high payment default. The company should institute a policy to conduct credit analysis of customers by starting with Special Loan Tariff (SL T) customers. This will enable ECG to know the financial viability of the potential industry. ECG may assist the management by advising them on efficient use of electricity, power factor improvement etc. ECG should require commercial and separate meter customers to pay deposits of three and two months estimated monthly consumption respectively and also provide guarantors to minimize the non payments of bills from these
International Journal of Academic Research in Business and Social Sciences 2016, Vol. 6, No. 11
ISSN: 2222-6990
516 www.hrmars.com
categories of customers. Collaboration with Other Utilities It is very important that the company works closely with other utilities to confirm and exchange customer information such as names, addresses etc. This will assist in tracing not only customers who vacate previous premise with an unpaid bill but also identify high risk customers and thus minimize bad debt loss. Cleaning of Debtors' Data-base 78 Million Ghana Cedis representing 53% of the total debts were more than 150 days overdue. Management must take a bold decision to write off the amounts from the company's books since less than 30% of the value of utility debt over 120 days is normally collected and set up a task force to pursue this debt and clean the debtors' database. This will avoid the company overstating its assets and improve days' sales outstanding and turnover ratios. Automated Reconnection System ECG should implement an automated reconnection system to minimize manual intervention in restoration of power to disconnected accounts. Accounts Receivable Unit The revenue management organization structure the regions and the districts should be reviewed to include accounts receivable unit. The unit should be responsible for the follow-up of accounts over 60 days. It should be streamlined to systematically follow each account flagged for delayed payment to either collect the amount or recommend it for bad debt write-off. Debt Management Processes In improving the management of accounts receivable, management should focus on the processes. The processes can be re-designed to achieve the following benefits: • The removal of non value adding tasks and clarification of roles and responsibilities f debt collection staff • The identification of new and more effective ways of delivering services e.g. live maintenance of high voltage and distribution networks • Allowing staff to apply more initiative and ingenuity to everyday tasks Recommendations pertaining to government arid regulatory/legal system Government Indebtedness Government indebtedness accounted for 18.3% of total debt. This has a major adverse impact on the company's accounts receivable performance indicators. The management of the company in collaboration with the sector ministry should discuss with the Ministry of Finance and the Accountants General to be within the World Bank guidelines that no government or government related institutions should owe more than two months bills.
International Journal of Academic Research in Business and Social Sciences 2016, Vol. 6, No. 11
ISSN: 2222-6990
517 www.hrmars.com
Regulatory Constraints The credit period of 28 days given to all classes of customers should be reviewed. It is recommended that SL T and Commercial customers be given seven (7) days credit period while Domestic customers be given fourteen (14) day credit period. This suggestion considers the fact that utility credit is re repetitive and the current credit period makes it easy for customers to abscond with three or more months unpaid bills. The company should reopen discussion with the PURC with the mm of modifying the regulations that the present occupant of a premise should not be held responsible for an unpaid bill in the name of a former occupant. This is unfavourable to the utility because negotiations for tenancy agreement are conducted without the involvement of the utility company in the country. Alternatively, ECG should insert a clause in the agreement with customers which would compel new occupant to contact the company for a change of customer information. Also, the long credit period makes it easier for tenants to vacate a premise without paying the final bills. ECG should advocate a reduction in the credit period from 42 days to 14 days. Recommendations on Best Practice Re-engineering Accounts Receivable Business Process Best Practice requires a utility company to achieve cost reductions and performance improvements by re-engineering the accounts receivable process. The objective is to obtain the goal of prompt attention to customer complaints, accurate billing, correct and confidential customer records, prompt processing of payments, timely delivery of bill and proactive requests for reconciliation and payments. Conclusion The main objective of the study was to find out how effective is the management of accounts receivable by ECG. The study has shown that ECG has not improved on the effective management of its accounts receivable from 2003 to 2007 since the major indicators such as accounts receivable to sales ratio, days' sales outstanding and the account receiver turnover did not improve during the study period. Also, the work practices Ashanti- West Region in accounts receivable management revealed a lot of challenges yet to be overcome by ECG. The average days sales outstanding of 158 days is very high compared to the World Bank way to avoid future debt collection problems is to address delinquent accounts early, firmly an aggressively. The goal of effective revenue management must be to reduce bad debt, improve cash flow and lower the days' sales outstanding. The ultimate objective of any overdue accoun1 flagged for follow-up should either be the recovery of the amount or written-off as bad debt. Further study could look at the impact of disconnection on accounts receivable management. The study finds disconnection as the main tool for debt management by ECG. However, the finding did not show its impact. Moreover, the disconnection management is also not well managed. REFERENCES Anthoney, R. N.; Hawkins, D. F., Merchant, K.A. (1999). Accounting: Text and cases . 10 ed. Boston. Irwin/McGraw-Hill: Shelsted.
International Journal of Academic Research in Business and Social Sciences 2016, Vol. 6, No. 11
ISSN: 2222-6990
518 www.hrmars.com
Bateman, T.S.; Snell, S. A. (1999). Management: Building competitive advantage . 4th ed. Irwin\McGraw-Hill: Beytein. Brealy, R.A.; Myers, S.C. (2000). Principles of corporate finance (6th ed.) Boston. Irwin\McGraw-Hill: Beytein. Brigham, E.F.; Ehthardt, M.C. (2002). Financial Management, Theory and Practice (10th ed.) Harcourt College Publishers. Colton, R.D. (1995). Credit and collection strategies in a competitive electric utility industry. Dyckman, T.R.; Davis C. r.; Dukes R. L. (2001) Intermediate Accounting (5th ed.) Irwin\McGraw- Hill: Beytein. Electricity Company of Ghana Ltd. (2003). 35th Annual Report & Audited Accounts 2003. Buck Press. Electricity Company of Ghana Ltd. (2004). 36th Annual Report & Audited Accounts 2004. Buck Press. Electricity Company of Ghana Ltd. (2005). 3rd Annual Report & Audited Accounts 2005. Buck Press. Electricity Company of Ghana Ltd. (2006). 38th Annual Report & Audited Accounts 2006. Buck Press. Electricity Company of Ghana Ltd. (2007). 39th Annual Report & Audited Accounts 2007. Buck Press. Emos Consultants. (1994) Review of ECG Prepayment Metering Pilot Program. Francesco, A. M. Gold, B. (2005). International organisational behaviour: Text, cases, exercises (2nd ed.) New Jersey. Pearson\Prentice Hall. Upper Saddle. Hilton, R. W. (2002).Managerial accounting: Creating value In a dynamic business environment.(5th ed.) New York. Irwin\McGraw-Hill: Shelstad. Larson, K.D.; Wild, J.J.; Chiappetta (1999). Fundamental accounting principles (15th ed.) Irwin\McGraw- Hill: Shelstad. Libby, R.; Libby, P.; Short, D. (2001). Financial Accounting.(3rd ed.) Irwin\McGraw-Hill: Beytein. Marfo, Y. O. (2002). Government of Ghana Budget Statement. Ministry of Finance and Economic Planning . Menke, C.; Fezzari, P. G. (1994). Improving electric power utility efficiency: Issues and recommendations. World Bank technical paper number 243 Munasinghe, M.; Saunders, R. J. (1988). Energy Issues in the developing world. World Bank Policy Research Writing Series No. 106 Parking, M. (2004). Economics.(7th ed.) Addition Wesley Ross, S.A.; Westerfield, R.W.; Jordan, B.D. (2001). Essentials of corporate finance(3rd ed.). Irwin\McGraw-Hill: Beytein. Salek; G.John. (2005). Accounts receivable management: Best practices. John Wiley Vukania, D.B.M.; Adjiku, W.; Barfour, A.T.; Afeku, LK; Kyeremanteng, W.K. (1999). Report of the committee on action plans for improved and sustained revenue collection. World Bank Technical Report (2001) Efficiency: Issues and Recommendation. No. 243