Embed Size (px)
Citation preview
Final Report
Management Audit of
Virgin Island Water and
Power Authority
February 10, 2015
February 10, 2015
Chairperson, Noel Loftus VIWAPA Governing Board P.O. Box 1450 Charlotte Amalie, St. Thomas U.S. Virgin Islands 00804-1450
The Honorable Commissioner M. Thomas Jackson Chairman, VIPSC PO Box 40 St Thomas, VI 00804
Dear Gentlemen:
Attached is the completed Management Audit Report and Implementation Plan addressing the Virgin Islands Water & Power Authority in accordance with the agreement included in the June 2009 Global Settlements of Electric System and Water System Rate Cases. This settlement required an independent Management Assessment. Vantage Energy Consulting LLC (Vantage) was retained by contract with VIWAPA on May 5, 2014 and has worked with an Audit Committee consisting of two of the VIPSC Technical Consultants and three VIWAPA management representatives.
We greatly appreciated the effort all WAPA employees and management committed to this audit, as well as the guidance and support by the entire Audit Committee. The report along with a separate Implementation Plan are being provided to you, WAPA management, government representatives and other stakeholders. A copy can also be found on the Vantage web site at www.vantageenergyconsulting.com/reports.
We would be happy to meet with you or your entire group to discuss the report at your convenience. Also, feel free to call with any questions.
Walter P. Drabinski, President Vantage Energy Consultant LLC 20844 4th Ave., West Cudjoe Key, FL 33042 [email protected] 305-394-0784
Management Audit of VIWAPA – Final Report
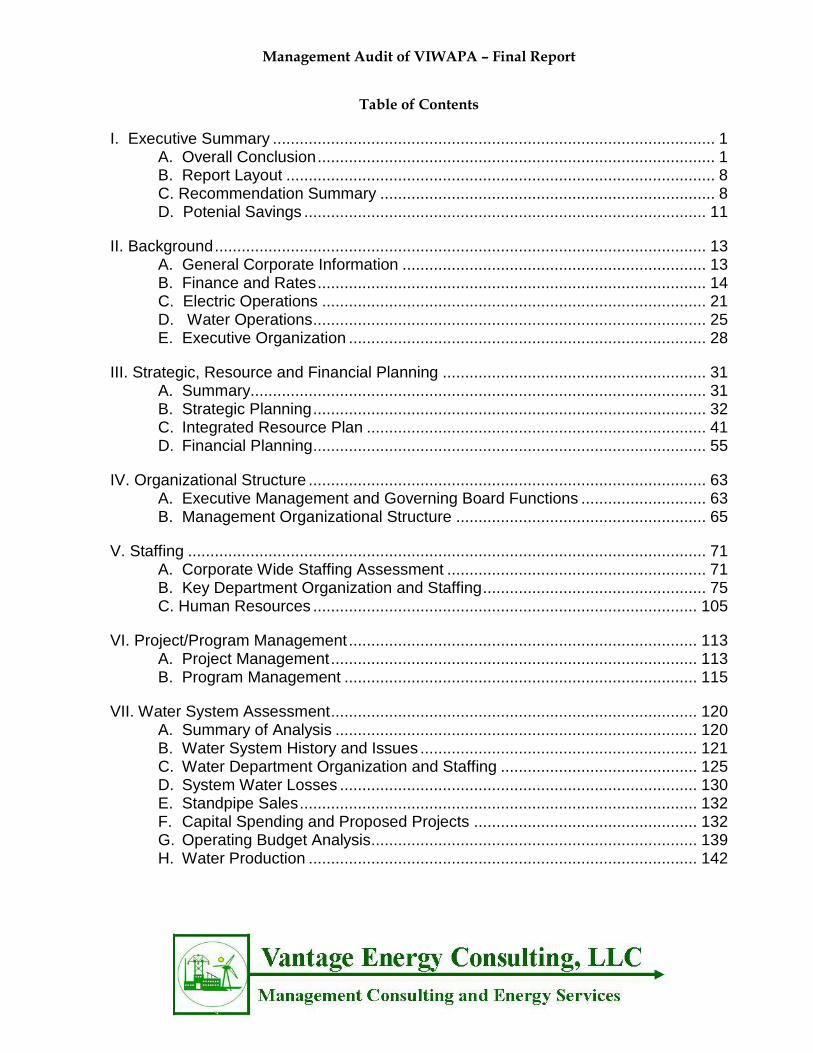
Table of Contents
I. Executive Summary ................................................................................................... 1 A. Overall Conclusion ......................................................................................... 1 B. Report Layout ................................................................................................ 8 C. Recommendation Summary ........................................................................... 8
D. Potenial Savings .......................................................................................... 11
II. Background .............................................................................................................. 13 A. General Corporate Information .................................................................... 13 B. Finance and Rates ....................................................................................... 14 C. Electric Operations ...................................................................................... 21
D. Water Operations ........................................................................................ 25 E. Executive Organization ................................................................................ 28
III. Strategic, Resource and Financial Planning ........................................................... 31
A. Summary...................................................................................................... 31 B. Strategic Planning ........................................................................................ 32 C. Integrated Resource Plan ............................................................................ 41
D. Financial Planning ........................................................................................ 55
IV. Organizational Structure ......................................................................................... 63
A. Executive Management and Governing Board Functions ............................ 63
B. Management Organizational Structure ........................................................ 65
V. Staffing .................................................................................................................... 71 A. Corporate Wide Staffing Assessment .......................................................... 71 B. Key Department Organization and Staffing .................................................. 75
C. Human Resources ...................................................................................... 105
VI. Project/Program Management .............................................................................. 113
A. Project Management .................................................................................. 113 B. Program Management ............................................................................... 115
VII. Water System Assessment .................................................................................. 120
A. Summary of Analysis ................................................................................. 120 B. Water System History and Issues .............................................................. 121 C. Water Department Organization and Staffing ............................................ 125 D. System Water Losses ................................................................................ 130
E. Standpipe Sales ......................................................................................... 132 F. Capital Spending and Proposed Projects .................................................. 132 G. Operating Budget Analysis......................................................................... 139 H. Water Production ....................................................................................... 142

Management Audit of VIWAPA – Final Report
VIII. Revenue Collection Issues ................................................................................. 144 A. Background ................................................................................................ 144 B. Payment Issues ......................................................................................... 148
Management Audit of VIWAPA – Final Report
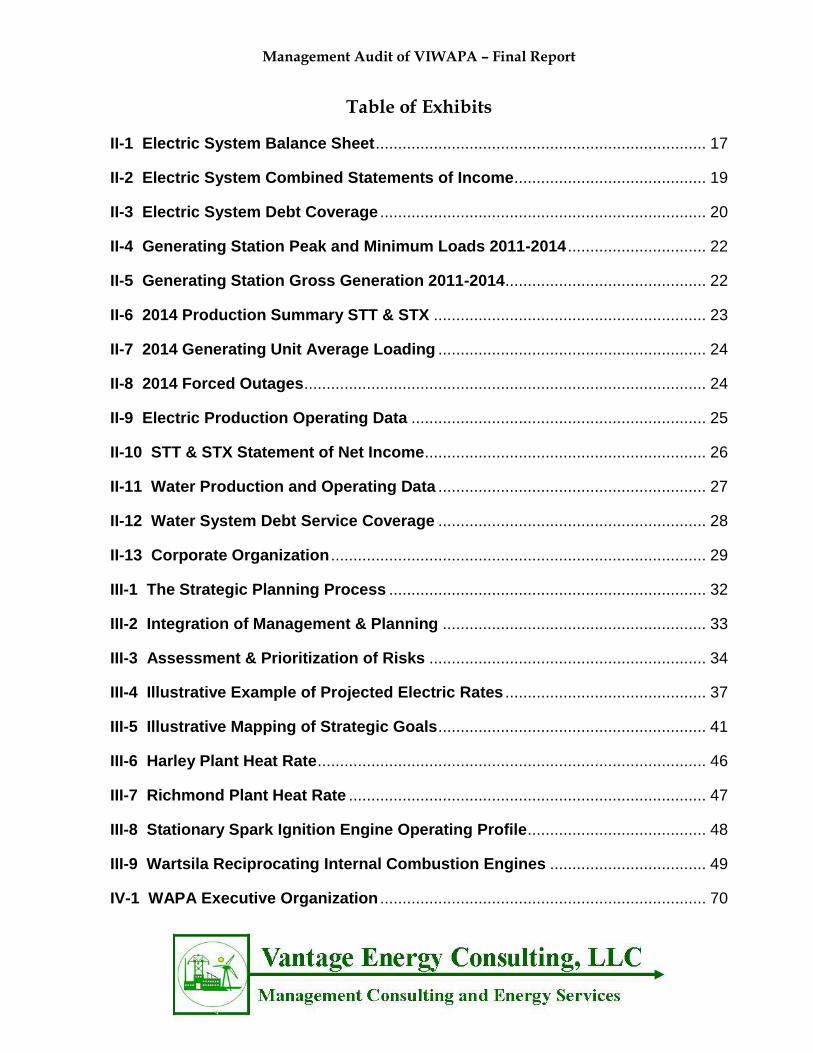
Table of Exhibits
II-1 Electric System Balance Sheet .......................................................................... 17
II-2 Electric System Combined Statements of Income ........................................... 19
II-3 Electric System Debt Coverage ......................................................................... 20
II-4 Generating Station Peak and Minimum Loads 2011-2014 ............................... 22
II-5 Generating Station Gross Generation 2011-2014 ............................................. 22
II-6 2014 Production Summary STT & STX ............................................................. 23
II-7 2014 Generating Unit Average Loading ............................................................ 24
II-8 2014 Forced Outages .......................................................................................... 24
II-9 Electric Production Operating Data .................................................................. 25
II-10 STT & STX Statement of Net Income ............................................................... 26
II-11 Water Production and Operating Data ............................................................ 27
II-12 Water System Debt Service Coverage ............................................................ 28
II-13 Corporate Organization .................................................................................... 29
III-1 The Strategic Planning Process ....................................................................... 32
III-2 Integration of Management & Planning ........................................................... 33
III-3 Assessment & Prioritization of Risks .............................................................. 34
III-4 Illustrative Example of Projected Electric Rates ............................................. 37
III-5 Illustrative Mapping of Strategic Goals ............................................................ 41
III-6 Harley Plant Heat Rate ....................................................................................... 46
III-7 Richmond Plant Heat Rate ................................................................................ 47
III-8 Stationary Spark Ignition Engine Operating Profile ........................................ 48
III-9 Wartsila Reciprocating Internal Combustion Engines ................................... 49
IV-1 WAPA Executive Organization ......................................................................... 70
Management Audit of VIWAPA – Final Report
V-1 WAPA Historical Staffing ................................................................................... 71
V-2 St. Croix Electric System Staffing ..................................................................... 72
V-3 Corporate and St. Thomas Staffing .................................................................. 73
V-4 Water Utility Staffing .......................................................................................... 74
V-5 Richmond Plant – Proposed Staffing Adjustments ......................................... 83
V-6 Harley Plant – Proposed Staffing Adjustments ............................................... 86
V-7 St. Thomas T&D Staffing ................................................................................... 91
V-8 St. Croix T&D Staffing ........................................................................................ 92
V-9 St. Johns T&D Staffing ....................................................................................... 93
V-10 T&D Staffing Adjustments – St. Thomas ....................................................... 94
V-11 T&D Staffing Adjustments – St. Croix ........................................................... 96
V-12 T&D Staffing Adjustments – St. John ............................................................ 98
VI-1 Proposed Project Management Organization ............................................... 115
VII-1 Current Water Rates ....................................................................................... 122
VII-2 Water Production and Operating Data .......................................................... 123
VII-3 STT & STX Statement of Net Income ............................................................ 124
VII-4 Water System Debt Service Coverage .......................................................... 125
VII-5 Distribution Organization – St. Croix ............................................................ 128
VII-6 Distribution Organization – St. Thomas ....................................................... 129
VII-7 Water Distribution Environmental Lab ......................................................... 130
VII-8 St. Croix Water Loss Analysis ....................................................................... 131
VII-9 2011 Water System Financial Forecast ........................................................ 134
VII-10 Projected Operating Expenses .................................................................... 140
VII-11 Water System 2013-14 Actual and 2014-15 Budget ................................... 141

Management Audit of VIWAPA – Final Report
VII-12 Debt Service Coverage Projection .............................................................. 142
VIII-1 Year to Year Electric Revenue ...................................................................... 145
VIII-2 Year toYear MWH Sales ................................................................................ 146
VIII-3 Accounts Recieveable .................................................................................. 147
Management Audit of VIWAPA – Final Report
February 10, 2015
Page 1
I. EXECUTIVE SUMMARY
This report provides the results of a Diagnostic Management Audit of the Virgin Islands Water & Power Authority (WAPA). It was performed under contract with WAPA and directed by an Audit Steering Committee that consisted of representatives of WAPA and the Virgin Islands Public Service Commission (VIPSC). The nature of a diagnostic management audit is that it consists of an initial examination of all aspects of the utilities organization and operations in Phase I and then refines the scope by focusing on a select number of key issues. This report provides our general findings and recommendations associated with the diagnostic audit as well as findings and recommendations associated with the detailed investigation.
We would note for the reader that since the anticipated completion date for the report was September 2014, Year-end data from 2014 (May 31, 2014) was used for this report except for updates of the Levelized Energy Adjustment Clause (LEAC) which has dropped significantly since May 2014. ($0.40 in May versus $0.28 as of 1/7/15)
A. OVERALL CONCLUSION
While the average American pays about 2% of disposable family income toward their electric bill, WAPA electric customers pay up to 9%, with a much lower monthly consumption of electricity. This burden has impacted personal lifestyles as well as business activities and has started to drive customers away, resulting in further cost pressures. Couple these cost issues with the changes the entire electric industry is facing such as wildly fluctuating energy costs, competitive renewable and distributed generation sources, improved economics of energy storage technologies, and increased conservation, and the old utility paradigm of utility structure and planning is threatened. Given the dynamics of the Virgin Islands, WAPA finds itself at a precipice that is more severe than the industry in general. If WAPA continues to make poor decisions that defend past mistakes it could face catastrophic long term problems. The good news is that if the stakeholders make the right decisions, provide adequate capital and make moves to reduce uncollected revenues, there may be a smoother slope to a long-term, modern and efficient utility.
Most key stakeholders and decision makers are aware of the problems, and major actions have been initiated to strengthen WAPA’s financial position and WAPA’s management and Board are instituting plans, which, if properly implemented, will move WAPA in the right direction.
WAPA’s Governing Board has provided management with strong support in its plans to upgrade the production system, convert to Liquid Propane Gas as a primary fuel, implement new technologies, and optimize the operations of many of the support departments at WAPA. However, WAPA’s Board has also approved projects that may not be in the long-term best interests of everyone. Specifically, it appears WAPA is moving forward with the installation of a Heat Recovery Steam Generator for Unit 6B before the Integrated Resources Plan is completed. This could result in either the continuation of a
Management Audit of VIWAPA – Final Report
February 10, 2015
Page 2
system that is simply ineffective or the cost of this piece of equipment may result in additional stranded costs. This report will provide significant detail on why we believe the current generating system is untenable in the long-run.
The VIPSC has acted in a strong, positive manner as well, increasing base rates, providing emergency funds to allow repair of power production equipment and giving WAPA management the latitude they need to implement the necessary changes. With the second base rate hike being implemented in January 2014, financial improvement as measured by coverage ratios should result. The VIPSC is reluctant to raise rates but is provided with the option of either raising rates to support WAPA’s existing generating resources or seeing the system collapse. The VIPSC, through its consultants, has indicated it would like to see rates consistent with prudent utility practices, such as the affirmation by the IRP of the resource plan, and in conformance with the recommendations of this audit.
The Virgin Island’s Senate and Governor have also provided necessary changes in statutes to assure that WAPA has sources of revenue for new equipment and tariffs that reflect the specifics of the WAPA system. We understand that there is currently a move underway to issue new bonds, with a portion going directly to WAPA to offset a portion of the past due amounts.
WAPA has a number of strengths that should assure its long-term viability and success. This includes a talented management team, well trained workforce, a Governing Board that is interested and engaged, a Public Service Commission that is willing to listen to problems and provide regulatory support and a Governor and Senate that has been willing to change laws in order to give WAPA the resources and financial support it needs. That said, WAPA is in a precarious financial position due to a number of factors, some of which are out of its control. Some of these factors are due to poor decisions and some are due to the reaction of its customers to its high cost of service. While the report will provide detailed analysis, and findings and recommendations on all aspects of WAPA operations, we summarize some major findings here. In our opinion, time is critical in making changes at WAPA such that it is the driver of the Virgin Islands economy, not an anchor.
PLANNING
Planning at a utility must start at the highest level, and for WAPA this is a Strategic Plan. WAPA has not completed a strategic plan since 2002, although it made an unsuccessful attempt in 2010. Further, the previous plans were not directly linked to the O&M or Capital Budgets. As WAPA’s system-wide peak load has declined by 18% over the last three years and minimum load declined 15%, WAPA’s ability to operate its generation in a cost effective manner has been severely compromised and has placed a severe burden on its ratepayers. Given the many important projects currently underway, the integration of greater amounts of renewable power by WAPA and others, the need to transform the generation fleet into a more efficient and adaptable configuration, and many other key hurdles that WAPA is facing, a strategic plan, prepared and implemented in an effective manner, is an absolute necessity. As it moves forward with its strategic planning process, WAPA should consider assigning leadership for this process to a qualified full-time
Management Audit of VIWAPA – Final Report
February 10, 2015
Page 3
employee. A mid-2015 date should be set by the Governing Board for completion of the new Strategic Plan.
The entire electric utility industry is facing a dilemma as renewables such as wind, solar and bio-fuels, as well as conservation efforts and distributed generation have made traditional generation planning and reliability efforts difficult. The first reaction of many utilities was to resist the tide of these technologies and consumer actions. However, enlightened utilities have now recognized that their role is to adopt to the needs of their customers, often changing significant portions of their fleet to provide fast response, highly efficient generation sources that enable timely responses in utility supply when wind and solar sources fluctuate or customers opt to leave or re-enter the system. WAPA faces these challenges. Much of the discussion below addresses the need to be open to new ideas and to not defend past decisions that are no longer relevant.
WAPA has selected Black & Veatch to perform an Integrated Resource Plan (IRP) and the results should be available in mid-2015. The IRP must provide a roadmap for responding to both future generation needs and the problem of the current generating equipment which is ill suited for the future of WAPA. This detailed analysis of multiple growth scenarios, fuel options and prices, generating technologies, and continued increases in the use of renewables requires that this plan be thorough, comprehensive and include a wide range of sensitivity analysis relative to alternative fuel prices and growth scenarios and it should be updated every 2-3 years.
Our analysis and discussions with a number of equipment providers suggests the option of replacing or supplementing a large portion of the existing fleet with high efficiency, low cost Reciprocating Internal Combustion Engines (RICE) fired on liquid propane, fuel oil and natural gas should be given particular consideration. The higher efficiency and flexible operation of these units will reduce costs dramatically and permit more use of renewable sources. New RICE units operate at below 9,000 BTU/KWH versus the current fleet average of about 14,000 BTU/KWH. We also recommend consideration of new, competitively priced storage systems that are becoming more realistically priced and are referenced later in this report. It is clear that in the past WAPA made a number of poor decisions on generating unit purchases. WAPA’s insistence on moving forward with these decisions will only add to stranded costs if current equipment is retired.1
There are three reasons why Vantage suggests that replacement of the current generating fleet may be prudent. First, the current combined cycle units, when properly operating are too large to meet the diminished loads during nights and when solar and other renewable sources are in full operation. Second, the performance or heat rate (BTU/kWh) of the existing fleet is not likely to ever reach the efficiency levels previously anticipated. Third, it may be impossible to keep the old units with old components operating at reasonable
1 / The development of LPG and multi-fuel technology for RICE units is developing quickly and issues such as capacity degrades when using LPG are being addressed. Manufacturers have provided information that shows models specifically designed for LPG, with heat rates of 7,900 BTU/KWH and the ability to switch fuels on-the-fly and the IRP should consider all alternatives.
Management Audit of VIWAPA – Final Report
February 10, 2015
Page 4
capacity factors. Our analysis shows that the current generating equipment is not ideally suited for operating as base load and load following units. While combined cycle units are an efficient, flexible option when using larger units, the mix of small combustion turbines, modified heat recovery steam generators and old steam turbines and generators will likely never result in optimum performance. Our analysis and experience in the industry lead us to conclude that WAPA may be fighting a losing battle in its efforts to repair and upgrade these units. Included in our recommendations, is one that delays the installation of the proposed Heat Recovery Steam Generator 6B that was recently purchased and is in need of significant modification before it can even potentially operate. Proceeding with the installation of this unit should be delayed at least until the Integrated Resource Plan is completed.
FINANCIAL REPORTING
WAPA’s financial reports are comprehensive and provide a broad range of useful information for Management and the Governing Board. However, the O&M and Capital Budgets for 2015 may currently be out of date due to the negative financial results of 2014 as well as the recent change in oil prices. Both the electric and water divisions have had deteriorating sales and revenues. The most recent budgets appear to be overly optimistic. While there should be optimism for improved financial performance, now that the LPG project is delayed, the improvements may not come until late in the 2015 fiscal year. Vantage also recommends that there be a feedback loop wherein the expected results of major capital projects are measured to ascertain whether they have met expectations. Management needs to be held accountable for achieving the projected results of large capital projects. Our recommendations related to an expanded Project Management Department will help support this feedback loop.
MANAGEMENT AND GOVERNING BOARD STAFFING AND STRUCTURE
Vantage is pleased to report that WAPA’s senior management team has excellent credentials and is, in general, well qualified for addressing the issues they face. They have appropriate educations from quality institutions and appear to work together in a cohesive manner. Despite the poor reputation that WAPA, as a firm, has among its diverse stakeholder group, the management team is generally held in high regard. The one exception we would note, is that WAPA is lacking a senior officer with strong power generation experience.
A senior officer who has direct experience with complex electric utility systems, generation planning, selection of technologies, and adapting solutions to the complex needs of the Virgin Islands would be a valuable addition to the management team of WAPA. As part of a rate case settlement, WAPA has agreed to add an Independent Advisory Contractor (IAC), which would provide comprehensive, and extensive oversight of every facet of power production, planning, maintenance and training. Vantage concludes that while WAPA’s generation department needs experienced executive oversight, it does not need a program
Management Audit of VIWAPA – Final Report
February 10, 2015
Page 5
as extensive and as expensive as outlined in the IAC Proposal.2 However, if WAPA does not move to add an experienced generation expert and make the bold moves to modernize its generation fleet, then we would recommend that the Governing Board either consider instituting the IAC program as proposed or selling the generation fleet to an Independent Power Producer. Bluntly stated, WAPA Management, its Governing Board, the VIPSC and VI Government must accept the mistakes of the past and recognize sunk costs of poor investments and move forward for the long-term benefit of the ratepayers. 3
The Governing Board is well constituted, has a strong voice in WAPA policy, is active in major decisions and has adequate experience and credentials for the task they must undertake. It is apparent that the Governing Board has invested a great deal of time and energy in trying to move WAPA out of its continuing difficulties. It must now face another set of critically important decisions as it addresses the many issues discussed in this report.
One area of major concern is the organizational structure of the WAPA management team. Our analysis shows that despite past streamlining of the organization, there are still too many direct reports to the Chief Executive Officer. There are too many “Assistant” positions, creating an overly vertical structure. There are some instances where important departments are buried in the organization. Additionally, there is a lack of central focus on the significant amount of project management that will be needed over the next five years. This report proposes a complete restructuring of this organization, moving to a forward looking utility organization that can meet the many challenges WAPA is facing.
STAFFING
Our consultants invested a substantial amount of resources on WAPA’s corporate staffing. Over the last fifteen years, utilities have taken advantage of new technologies, better communications, computers for financial analysis, outage management, supervisory control of the power system, digital control of power plants and automated meter reading. These technologies, along with the pressures of deregulation and downward cost pressure, have resulted in sizable reductions of staff in virtually every department of a modernized utility. WAPA, on the other hand, has seen a significant increase in staffing. In 2001, the actual headcount was 571 employees. The budgeted head count for 2015 is 693. This is a 21% increase in headcount during a period when most utilities reduced staffing by 20% to 30%. Making matters worse, over the last three years, both electric and water output and revenue have decreased with no affiliated reduction in head count. The detailed analysis provided in this report identified a significant number of positions that could be considered for
2 /Vantage and the VIPSC consultants, Georgetown Consulting Group (GCG), have had extensive discussions regarding the need for an IAC as defined in Commission’s recent order. The template for the IAC was the Guam Power Authority which instituted an IAC almost 12 years ago. Our detailed analysis shows that the root cause of problems for Guam and WAPA are different, and based on these differences, we have concluded that a comprehensive IAC, as was proposed is not needed as long as WAPA management and Governing Board take actions to retain an experienced executive to run the system and to modernize the generating fleet.
3 /We note a comment from GCG that the IAC was agreed to in 2011, was funded with almost $4 million in revenue to date, with no move to even hire a power generation expert.
Management Audit of VIWAPA – Final Report
February 10, 2015
Page 6
elimination. While we are not proposing immediate action on all of these positions, we suggest a very detailed analysis be conducted of every department. In fact there are a significant number of vacancies that, if not filled, will help achieve desired reductions.
Technology such as the Reverse Osmosis water plants, Automated Meter Reading (AMR) and Automatic Meter Infrastructure (AMI),4 outage management systems, improved T&D technology, Supervisor Control and Data Acquisition System (SCADA), cell phones, internet communications and video conferencing are only some of the tools that enable a more efficient work force. In its analysis ,WAPA should not only take advantage of attrition, but should also carefully consider whether positions currently occupied by the nearly 125 employees who are eligible for retirement now or in the next few years should be utilized.
PROJECT/PROGRAM MANAGEMENT
Over the next five years, project and program management will be vital to the success of WAPA. A well-managed, technically superior group must be formed to implement the many projects underway or planned. These include the LPG delivery infrastructure, the conversion of existing oil fired units to LPG, the refurbishment of existing generating units, the construction of new units over the next decade, the AMI and AMR installation and implementation, the extensive work on the water system, as well as current and future renewable projects. We recommend that the existing group, while recently increased in size, needs to be upgraded significantly in the future. Surprises, such as the recent delay in the LPG implementation, can be foreseen and avoided with proper project management.
WATER SYSTEM
We have paid particular attention to the Water Department for a number of reasons. It has deteriorating financial results over the last few years, with high rates; has experienced poor public perception due to the colored water issue; has an infrastructure that is 60-80 years old with extremely high water losses; and it is facing a continued loss of large customers. We believe the solution will require a number of bold actions. First, restructure the organization so that it operates as a single entity, reporting directly to the CEO with a strong Chief of Water Operations. Second, get a definitive and clear decision of support from all major stakeholders to either move forward with a massive infrastructure refurbishment to make the necessary improvements in a responsible and manageable way or face the possibility that the Water Department becomes unsustainable and eventually forced to make the necessary improvements in a crisis situation. The recent rate case included a proposed program to resolve the issue, but our analysis suggests even more work may be needed than anticipated.
Some of the problems we discovered indicate that the water department does not have an adequate presence in the corporate organizational structure. Second, the department’s organization is too vertical. Third, it is overstaffed when one considers that water
4 /AMR and AMI are different. AMR consists of remote reading of meters for ease and accuracy of billing. AMI uses real-time data and turn-on/turn-off control to assist in troubleshooting an operating the system.
Management Audit of VIWAPA – Final Report
February 10, 2015
Page 7
production is now the responsibility of Seven Seas and the water operator positions at both the Harley and Richmond Stations can be eliminated. Fourth, on St. Croix, water losses are over 40% resulting in over $2 million per year in unnecessary production costs.5 Fifth, the system is old and beyond its useful life. Much of it was installed 60 to 80 years ago and as a consequence there are poor records of pipe size, locations, valve locations, and metering sites.
Only a small portion of each island is served by the WAPA distribution system. The issue of “Duty to Serve” is not clear in either WAPA policies or existing legislation, and should be reviewed as part of the strategic plan. WAPA essentially serves as a provider of last resort to the many homes and businesses that have cisterns. The current tariff structure does not include a monthly customer base facility charge, which is contrary to traditional regulatory policy. The addition of a monthly base facility charge would contribute relief to economic stress and would provide a source of funds for needed repairs and debt coverage.
Additional consideration was given to the following concerns and observations:
The standpipe business has dropped by almost 64% between 2013 and 2014 with total revenue of only $91 K. It should either be restructured in an economic manner or simply outsourced to others.
The Seven Seas contract provides water through a reverse osmosis technique at a total cost of $3.55 per kgal plus electricity. The current electric cost component of $4.15 per kgal should decrease as the LPG conversion takes place and new technology is added.
The AMI system installation is underway and will provide valuable information to WAPA management, reduce meter reading costs, and allow remote turn-on/turn-off activity. The implementation of AMI will permit the elimination of most meter reader positions.
The burden of the cost of replacing old infrastructure, extending service to new areas of the islands, and the cost of extending service lines for individual customers should be addressed with a formal plan that complies with the recent rate decision to assure that costs are paid by the appropriate party. The total cost to upgrade the current system on all islands and to expand to areas with the potential for profitable sales is almost $70 million for the 2013-2018 period according to a recent analysis. Almost 41% of planned capital projects are covered by grants, with 48% covered by new 2018 bonds, 7% by the Line Loss Surcharge, and 4% by internal Rate Funded sources. (From June 2014 Five Year Plan)
5 / PSC Order 04/2005 Docket 289 establishes specific line loss metrics for water and electric.
Management Audit of VIWAPA – Final Report
February 10, 2015
Page 8
The discolored water issue should have been better anticipated, responded to in a more direct and focused manner, and communicated to the employees and the public in a much more direct, expansive and personal way.
B. REPORT LAYOUT
Chapter I – Executive Summary
Chapter II –Background, Oversight and Results
Chapter III – Strategic, Resource and Financial Planning
Chapter IV – Management and Governing Board Staffing and Structure
Chapter V – Staffing and Human Resources
Chapter VI – Project/Program Management
Chapter VII – Water System Assessment
Chapoter VIII – - Revenue Collection
C. RECOMMENDATION SUMMARY
The following are the general recommendation summary statements developed in this report. Detailed support, including support findings and priorities are provided for each recommendation in the respective chapters. Further, an Implementation Plan is being prepared that provides a framework for implementing each recommendation proposed in the audit that is accepted by WAPA’s Governing Board. The Implementation Plan provides a detailed framework for implementing each recommendation that includes priority, work steps, schedule, responsible person and schedule for completion and an indication as to whether WAPA agrees with the recommendation. It will be provided as a separate document within one month of the final report completion.
Each recommendation statement below has priority based on the following: High Priority - An immediate impact to safety, reliability or significant cost savings; Medium Priority – Long-term cost savings, improved operability, or improved management capability; and, Low Priority – Overall improvement in operations, rate structure and communication of information. The numbering of each recommendation is sequential by Chapter. For example, III-R1 is the first recommendation in Chapter 3. Findings are similarly numbered.
III-R1 Implement a comprehensive strategic planning process with fixed timing for updates, prioritization of initiatives, input from all stakeholders and which should be led by a full time, mid to senior level manager, with the use of outside expertise to facilitate. (Priority: High)
Management Audit of VIWAPA – Final Report
February 10, 2015
Page 9
III-R2 Complete the IRP as defined, assuring input and oversight by both internal and external personnel, in order to assure that the results meet all needs of WAPA as defined in the original IRP proposal. Prior to, or in conjunction with the independent IRP complete American Society of Mechanical Engineers (ASME) performance test on each gas turbine, HRSG and steam turbine to determine baseline heat rates and turndown. (Priority: High)
III-R3 Redevelop the generation fleet so as to meet four key objectives; (1) reliability as measured by Equivalent Forced Outage Rate (EFOR) and availability; (2) efficiency as measured by heat rate (BTU/KWH); (3) operational effectiveness as measured by optimal staffing, reasonable non-fuel O&M budget and comprehensive reporting and monitoring, and (4) organizational effectiveness through the retention of an experienced, senior officer to lead the changes. (Priority: High)
III-R4 Develop a comprehensive Root Cause Analysis program that includes the identification, tracking and correction of the underlying cause of equipment problems and failures. (Priority: Medium)
III-R5 Prepare a revised 2015 Electric O&M Budget and a five year Capital Plan that reflects current data. (Priority: Medium)
III-R6 Develop a more formal process for justification of capital projects and institute a feedback mechanism in which actual impacts or results of a capital project are measured afterwards relative to how they met the goals of the strategic plan. (Priority: Medium)
IV-R1 Address the need for an experienced generation expert who can provide the management team and the plant team with the expertise needed in the upcoming years as WAPA makes its transition to new fuels, technology and the changing dynamics of renewable energy sources. (Priority: High)
IV-R2 Develop a senior management organization that reflects functional reporting relationships, a reasonable span of control, minimal layers, and the recognition of current challenges to WAPA. (Priority: Medium)
V-R1 Conduct a thorough organizational assessment that leads to an optimal organizational structure and right sized staffing plan that can better align the organization with the future needs of WAPA and its customers. (Priority: Medium)
V-R2 Investigate the potential for reducing the size of the Fuels Control Group at each power plant after the completion of the propane conversion project. (Priority: High)
V-R3 Restructure the production maintenance staff at the Richmond and Harley generating plants to focus on core competencies and reduce the maintenance costs of each facility. (Priority: High)
Management Audit of VIWAPA – Final Report
February 10, 2015
Page 10
V-R4 Conduct a bottom up evaluation of T&D on each island that addresses structure and titles, crew sizes, and the number of crews. (Priority: Medium)
V-R5 Perform a bottoms up process evaluation and staffing analysis of Customer Service that considers current and future requirements. (Priority: Medium)
V-R6 Move the support services function under an officer level individual. (Priority: Medium)
V-R7 Conduct a thorough staffing evaluation of the fleet and materials functions.
V-R8 Conduct a thorough review of all business and human resources programs and update those that are out of date or inconsistent with best practices. (Priority: Medium)
VI-R1 Reorganize the Special Projects into a Project Management organization and provide the appropriate project management tools to manage complex multi-discipline projects. (Priority: High)
VI-R2 Review the schedule and progress on the AMI implementation, and determine if the current schedule is feasible. (Priority: Low)
VI-R3 Ensure that the concerns with new system improvement related IT systems are properly addressed, by expanding the responsibility of the Information Technology Organization. (Priority: Low)
VII-R1 Create a position of Chief Water Operations that reports directly to the Chief Executive Officer, with direct control of water related operations, capital
projects, budgeting, and implementation of all strategies. (Priority: High)
VII-R2 Conduct an independent study to determine the risk to the RO system from hurricanes, the cost for backup using the IDE’s versus other options. The study should explicitly address the savings that can be achieved by retiring the IDE’s
and reducing staffing to the level needed post-IDE removal. (Priority: Low)
VII-R3 Consider eliminating the Assistant Superintendent positions as opportunities
occur. (Priority: Medium)
VII-R4 Perform a water loss audit in accordance with IWA/AWWA methodologies (International Water Association/American Water Works Association) as part of its Water Loss Reduction Program. (Priority: High)
VII-R5 WAPA should consider discontinuing standpipe service or if the standpipe
service is considered a vital community service, find ways to reduce costs. (Priority: Low)
VII-R6 Delay the start of the proposed Nazareth Water Line Expansion until a major decision can be made regarding overall line replacement, discolored water
Management Audit of VIWAPA – Final Report
February 10, 2015
Page 11
issues are completely resolved and better estimates on long-term water and
electricity costs are known. (Priority: Medium)
VII-R7 Take steps with the appropriate legislative body and regulators to implement a monthly Base Facility Charge for its different classes of services. (Priority: Medium)
VII-R8 Distinguish between water distribution upgrades and extensions and adopt
associated funding policies. (Priority: Low)
VII-R9 Perform an economic analysis to determine the need for the backup IDE’s. (Priority: Low)
VIII-R1 Continue to inform the Legislature, Governor, and all stakeholders of the magnitude of the non-payment by the government agencies and its potential impact on the financial viability of WAPA. (Priority: Medium)
VIII-R2 Encourage the legislature to establish a direct payment procedure for payment of utility bills by government entities. (Priority: Medium)
VIII-R3 Seek approval, from the Legislature, for a monthly Base Facility Charge for its water rates. (Priority: Medium)
VIII-R4 Establish a vigorous marketing initiative to take advantage of its reduced rates and develop increased electricity sales with pre-existing, existing and new commercial customers. (Priority: Medium)
VIII-R5 Initiate a program to determine if WAPA is collecting all of the revenue to which it is entitled and prepare a plan for remediation. (Priority: High)
VIII-R6 Calculate the actual cost to provide street lighting service and, if appropriate, investigate an alternate cost-based rate structure. (Priority: Medium)
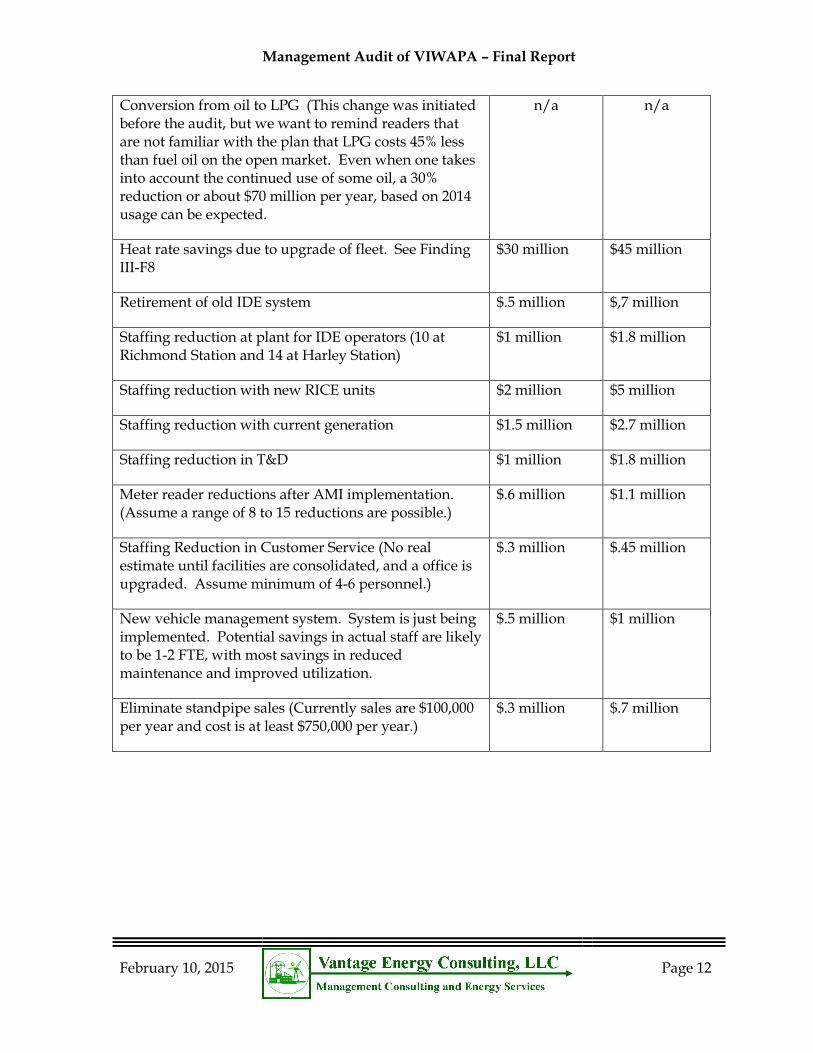
D. POTENIAL SAVINGS
One element of our contract calls for an estimate on potential savings from the implementation of the recommendations in this report. This is a very difficult task given that the implementation plan is not complete and many of the recommendations that require additional analysis have not been addressed. The table below provides a range of estimates and should only be used to get a sense of the potential reductions possible.. In general there are a limited number of areas with the opportunity for savings. These include lower fuel costs, more efficient generating equipment, reduced staffing, lower overhead costs, and lower procurement costs. A more detailed discussion of savings is included in the implementation plan. The table below summarizes our estimates and shows a total potential annual savings of between $38 million and $59 million:
Area of Savings Low Estimate High Estimate
Management Audit of VIWAPA – Final Report
February 10, 2015
Page 12
Conversion from oil to LPG (This change was initiated before the audit, but we want to remind readers that are not familiar with the plan that LPG costs 45% less than fuel oil on the open market. Even when one takes into account the continued use of some oil, a 30% reduction or about $70 million per year, based on 2014 usage can be expected.
n/a n/a
Heat rate savings due to upgrade of fleet. See Finding III-F8
$30 million $45 million
Retirement of old IDE system $.5 million $,7 million
Staffing reduction at plant for IDE operators (10 at Richmond Station and 14 at Harley Station)
$1 million $1.8 million
Staffing reduction with new RICE units $2 million $5 million
Staffing reduction with current generation $1.5 million $2.7 million
Staffing reduction in T&D $1 million $1.8 million
Meter reader reductions after AMI implementation. (Assume a range of 8 to 15 reductions are possible.)
$.6 million $1.1 million
Staffing Reduction in Customer Service (No real estimate until facilities are consolidated, and a office is upgraded. Assume minimum of 4-6 personnel.)
$.3 million $.45 million
New vehicle management system. System is just being implemented. Potential savings in actual staff are likely to be 1-2 FTE, with most savings in reduced maintenance and improved utilization.
$.5 million $1 million
Eliminate standpipe sales (Currently sales are $100,000 per year and cost is at least $750,000 per year.)
$.3 million $.7 million
Management Audit of VIWAPA – Final Report
February 10, 2015
Page 13
II. BACKGROUND
A background section is provided in the report in order to give the reader a basic understanding of WAPA, its system, structure, finances, operating results and challenges. The sources of this information include the monthly production reports, monthly Board financial reports, the annual BDO accounting reports, the five year plans, and our own observations and interview notes. The reports are provided here without analysis and often referenced in the report at other points.
A. GENERAL CORPORATE INFORMATION
The Virgin Islands Water and Power Authority (the Authority or WAPA) is an instrumentality created by the government of the United States Virgin Islands (the Government) in 1964. The Authority was created to operate an electric generation and distribution system, and a water production and distribution system in the United States Virgin Islands.
The Authority is governed by a nine member board, three of whom are appointed by the Governor of the Virgin Islands from his Cabinet, and six of whom are nominated by the Governor of the Virgin Islands and confirmed by the Virgin Islands Legislature.
The Water and Electric Systems are separately financed, and each system's indebtedness is repayable from its net revenues. The Authority is required by its bond resolutions to maintain separate accounting for each system. Each system is a major fund of the Authority for financial reporting purposes.
The Electric System service territory includes the islands of St. Thomas, St. Croix, St. John, and Water Island. The electric generating facilities for St. Thomas, St. John, and Water Island are interconnected, while the St. Croix generating facilities serve on a stand-alone basis. The Authority is the only electric utility that operates in the Virgin Islands. However, there are a growing number of commercial entities that produce electricity for their own use.
The Authority provides electric service to about 55,000 customers (as of June 30, 2014). The Authority also provides water service to about 12,000 customers (as of June 30, 2014).
The Authority's Electric and Water Systems rates are under the jurisdiction of the Virgin Islands Public Services Commission (PSC). The primary responsibility of the PSC is to set just and reasonable rates which are intended to provide revenues to recover operating and maintenance expenses, funds for debt service coverage requirements, and funds for working capital and capital additions. The Authority does not use rate base or rate of return principles for setting rates.
Management Audit of VIWAPA – Final Report
February 10, 2015
Page 14
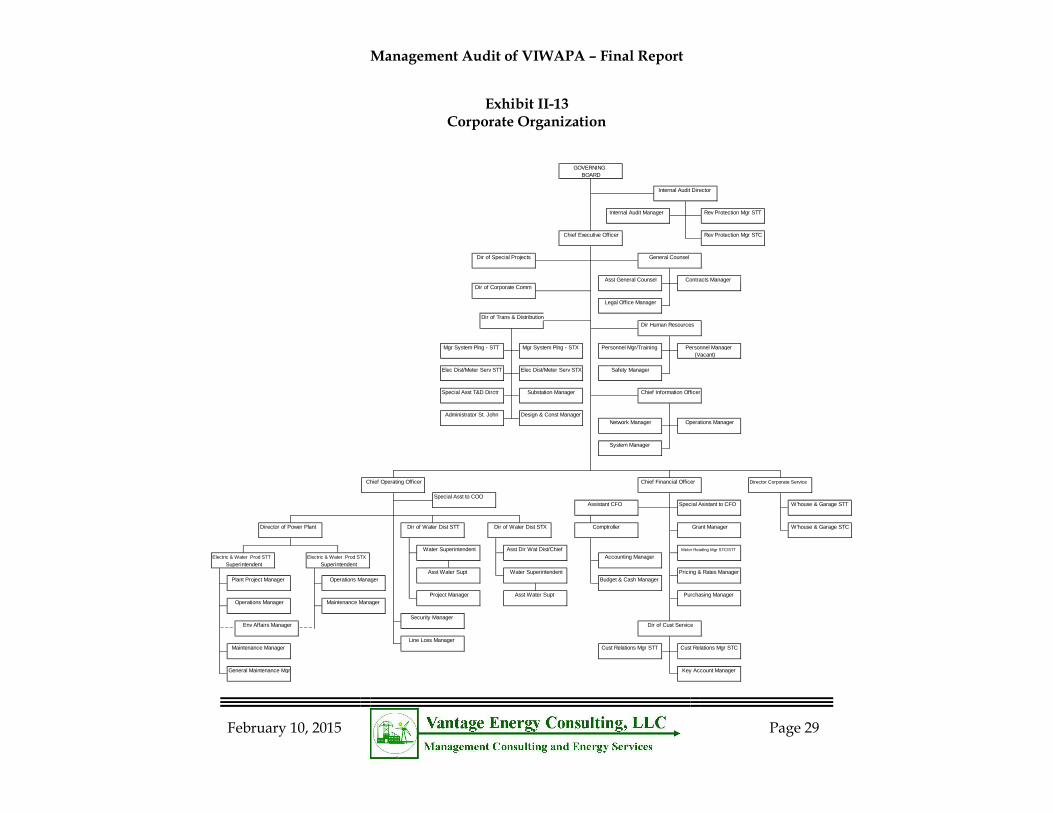
Day to day operations of WAPA is managed by a Chief Executive Officer and a number of direct reports. The key direct reports include the Chief Operating Officer, Director of Transmission & Distribution, General Counsel, Director of Human Resources, Chief Financial Officer, Chief Information Officer, Director of Corporate Communication, Director of Special Projects, and the Internal Audit Director.
The Virgin Islands’ Senate, with approval by the governor, is responsible for establishing tariffs and other laws that dictate how WAPA operates and how it can bill.
The Authority is regulated by the Virgin Islands Public Services Commission (PSC or the Commission). The Commission has the authority to approve, modify, or deny any proposed rate changes made by the Authority. The Authority is subject to the provisions of GASB No. 62, which address accounting rules for regulated operations. This standard allows regulated entities such as the Authority to record certain assets or liabilities as a result of the regulated ratemaking process.
B. FINANCE AND RATES
Currently, the LEAC is $0.279991/kWh and consists of the following components:6
o Fuel ($0.209719) – This is the projected cost of fuel for the six month LEAC period.
o Finance and Regulatory Costs ($0.000430) – This reflects the principal and interest on a general obligation note of $40 million borrowed in 2008 to pay for past-due invoices owed to the fuel supplier and also PSC charges on LEAC related matters approved in Docket 289.
o Ultrapure/RO Charge ($0.002972) – These costs reflect the costs associated with the RO production.
o Under Recovery/Deferred Fuel Costs ($0.014995) – This is the amount paid to the fuel supplier but not yet collected from customers.
o Rate Financing Mechanism ($0.018000) – These costs reflected the operating costs of the leased emergency generating unit plus a source of cash for the rehabilitation of specific generating units, spare parts and the services of an independent advisor. It was discontinued on 1/1/15.
The current LEAC of $0.279991/kWh constitutes a little over 71.4% of the current residential rate of $0.391928/kWh.
WAPA revenues come from two general sources – Base Rates and the Levelized Energy Adjustment Charge (LEAC). Currently, the LEAC collects revenue to pay for
6 /Based on info available January 7, 2015.
Management Audit of VIWAPA – Final Report
February 10, 2015
Page 15
all of the fuel-related expenses incurred by WAPA for both electricity and water
production. In 2014, LEAC payments amounted to $227.3 million for the electric system and $10.2 million for the water system. This amounted to 71% of the total electric revenue collected and 31% of the water revenue. Base rates are set to cover all operating and maintenance expenses, capital expenditures and payment on debt.
LEAC hearings are held every six months for electric and every year for water with the purpose of adjusting rates to account for fluctuations in fuel costs. Base rate hearings are conducted as needed but not less than once every five years.
The Authority complies with all applicable pronouncements of the Governmental Accounting Standards Board (GASB). The operations of the Authority are presented as an enterprise fund and as such, the financial statements are reported using the economic measurement focus and the accrual basis of accounting. Under this basis, revenues are recognized in the period earned and expenses are recognized in the period incurred regardless of the timing of related cash flows. Grants and similar items are recognized as revenue as soon as all eligibility requirements imposed by the provider have been met. The Authority has adopted all applicable GASB statements through No. 64. The adoption of Statement No. 63 in 2013 resulted in a change of presentation as the term "net assets" is changed to "net position" throughout the financial statements.
In accordance with the Electric System Revenue Bond Resolution (Bond Resolution), rates are designed to cover debt service and other operating expense requirements, excluding depreciation and other noncash expense items. This method of rate setting results in costs being included in the determination of rates in different periods than when these costs are recognized for financial statement purposes.
Capital assets are recorded at cost, which includes material, payroll-related costs, overhead, and an allowance for borrowed funds used during construction. Capital expenditures of $1,000 or more are capitalized. Maintenance and repairs are charged to operating expense as incurred. The cost of depreciable plant retired is eliminated from the utility plant accounts, and such costs, plus removal costs less any salvage, are charged to accumulated depreciation.
Depreciation of capital assets is computed using the straight-line method over estimated service lives ranging from 3 to 40 years. Depreciation expense is net of the deferred property-related gain amortization of $0 and $423,000 for the years ended June 30, 2013 and 2012. Depreciation, net of deferred property-related gain amortization, was equivalent to 3.9% of average depreciable property for the both years ended June 30, 2013 and 2012.
As of June 30, 2014 the Electric System had a receivable due from the Water System in the amount of $13.0 million as a result of an intersystem transfer of cash to pay for fuel costs incurred and other allocated operating, maintenance, and

Management Audit of VIWAPA – Final Report
February 10, 2015
Page 16
administrative expenses. This intersystem balance is noninterest-bearing and has no set repayment date. The Authority has classified $12.6 million as of June 30, 2014 as noncurrent because it did not expect to collect such amounts within 12 months of the year’s end.
Approximate accounts receivable, current and non-current, at June 30, 2014, consists of $24.8 million from customers and $40.6 million from the government. Net of other adjustments the total accounts receivable was a total of $57.9 million.
Management Audit of VIWAPA – Final Report
February 10, 2015
Page 17
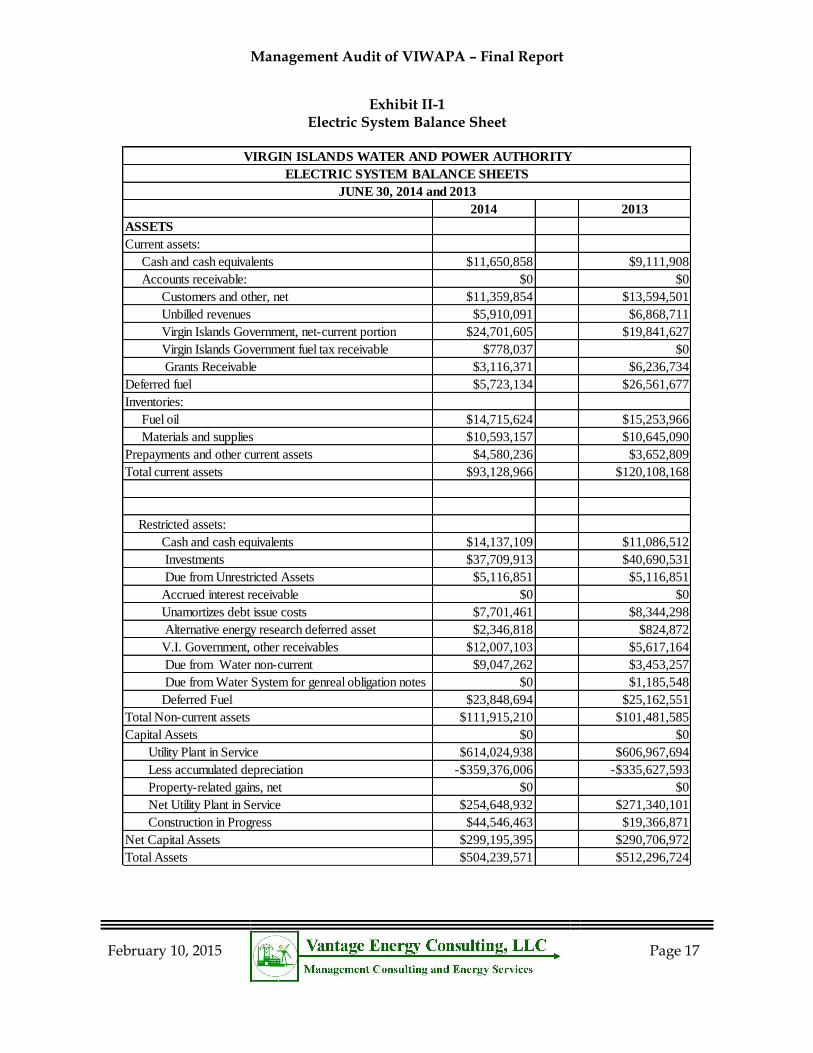
Exhibit II-1 Electric System Balance Sheet
VIRGIN ISLANDS WATER AND POWER AUTHORITY
ELECTRIC SYSTEM BALANCE SHEETS
JUNE 30, 2014 and 2013
2014 2013
ASSETS
Current assets:
Cash and cash equivalents $11,650,858 $9,111,908
Accounts receivable: $0 $0
Customers and other, net $11,359,854 $13,594,501
Unbilled revenues $5,910,091 $6,868,711
Virgin Islands Government, net-current portion $24,701,605 $19,841,627
Virgin Islands Government fuel tax receivable $778,037 $0
Grants Receivable $3,116,371 $6,236,734
Deferred fuel $5,723,134 $26,561,677
Inventories:
Fuel oil $14,715,624 $15,253,966
Materials and supplies $10,593,157 $10,645,090
Prepayments and other current assets $4,580,236 $3,652,809
Total current assets $93,128,966 $120,108,168
Restricted assets:
Cash and cash equivalents $14,137,109 $11,086,512
Investments $37,709,913 $40,690,531
Due from Unrestricted Assets $5,116,851 $5,116,851
Accrued interest receivable $0 $0
Unamortizes debt issue costs $7,701,461 $8,344,298
Alternative energy research deferred asset $2,346,818 $824,872
V.I. Government, other receivables $12,007,103 $5,617,164
Due from Water non-current $9,047,262 $3,453,257
Due from Water System for genreal obligation notes $0 $1,185,548
Deferred Fuel $23,848,694 $25,162,551
Total Non-current assets $111,915,210 $101,481,585
Capital Assets $0 $0
Utility Plant in Service $614,024,938 $606,967,694
Less accumulated depreciation -$359,376,006 -$335,627,593
Property-related gains, net $0 $0
Net Utility Plant in Service $254,648,932 $271,340,101
Construction in Progress $44,546,463 $19,366,871
Net Capital Assets $299,195,395 $290,706,972
Total Assets $504,239,571 $512,296,724
Management Audit of VIWAPA – Final Report
February 10, 2015
Page 18
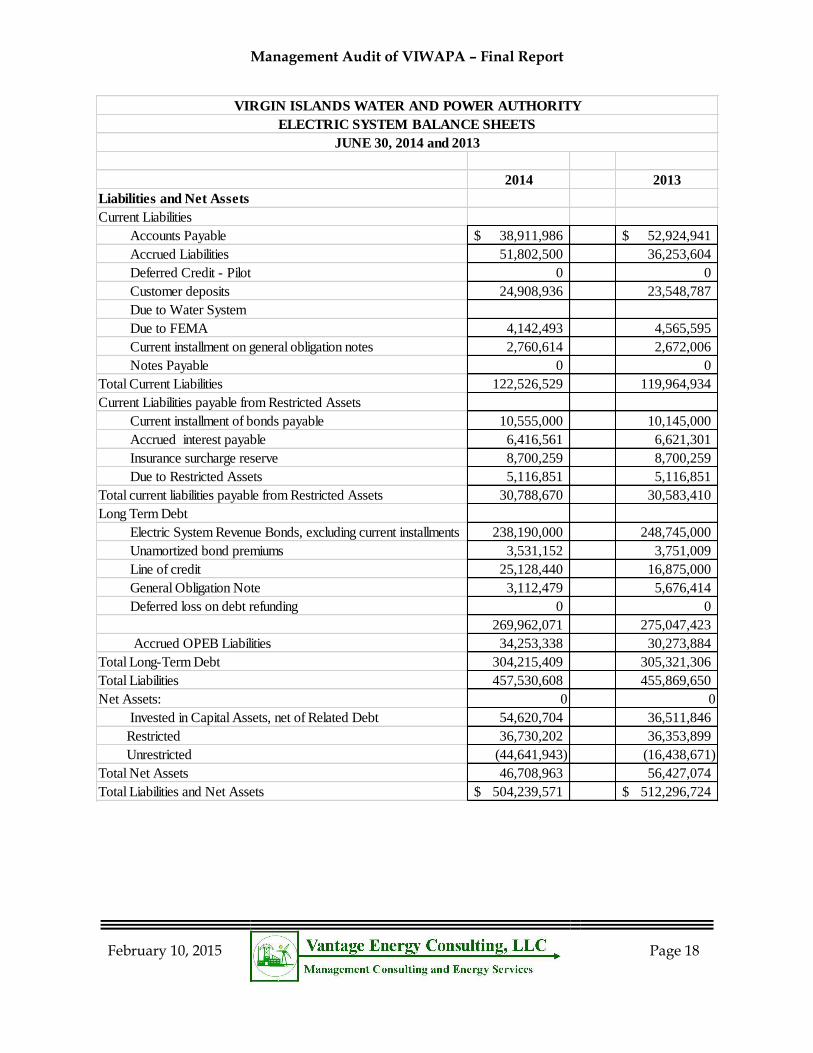
VIRGIN ISLANDS WATER AND POWER AUTHORITY
ELECTRIC SYSTEM BALANCE SHEETS
JUNE 30, 2014 and 2013
2014 2013
Liabilities and Net Assets
Current Liabilities
Accounts Payable 38,911,986$ 52,924,941$
Accrued Liabilities 51,802,500 36,253,604
Deferred Credit - Pilot 0 0
Customer deposits 24,908,936 23,548,787
Due to Water System
Due to FEMA 4,142,493 4,565,595
Current installment on general obligation notes 2,760,614 2,672,006
Notes Payable 0 0
Total Current Liabilities 122,526,529 119,964,934
Current Liabilities payable from Restricted Assets
Current installment of bonds payable 10,555,000 10,145,000
Accrued interest payable 6,416,561 6,621,301
Insurance surcharge reserve 8,700,259 8,700,259
Due to Restricted Assets 5,116,851 5,116,851
Total current liabilities payable from Restricted Assets 30,788,670 30,583,410
Long Term Debt
Electric System Revenue Bonds, excluding current installments 238,190,000 248,745,000
Unamortized bond premiums 3,531,152 3,751,009
Line of credit 25,128,440 16,875,000
General Obligation Note 3,112,479 5,676,414
Deferred loss on debt refunding 0 0
269,962,071 275,047,423
Accrued OPEB Liabilities 34,253,338 30,273,884
Total Long-Term Debt 304,215,409 305,321,306
Total Liabilities 457,530,608 455,869,650
Net Assets: 0 0
Invested in Capital Assets, net of Related Debt 54,620,704 36,511,846
Restricted 36,730,202 36,353,899
Unrestricted (44,641,943) (16,438,671)
Total Net Assets 46,708,963 56,427,074
Total Liabilities and Net Assets 504,239,571$ 512,296,724$
Management Audit of VIWAPA – Final Report
February 10, 2015
Page 19
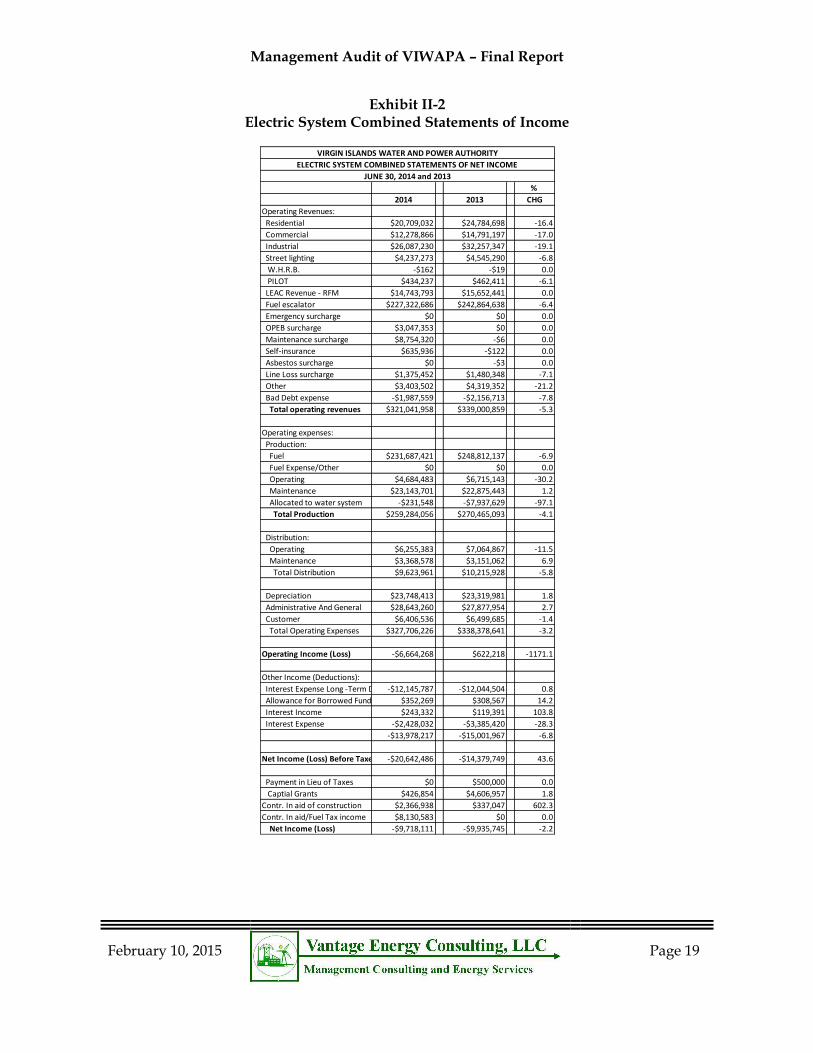
Exhibit II-2 Electric System Combined Statements of Income
%
2014 2013 CHG
Operating Revenues:
Residential $20,709,032 $24,784,698 -16.4
Commercial $12,278,866 $14,791,197 -17.0
Industrial $26,087,230 $32,257,347 -19.1
Street lighting $4,237,273 $4,545,290 -6.8
W.H.R.B. -$162 -$19 0.0
PILOT $434,237 $462,411 -6.1
LEAC Revenue - RFM $14,743,793 $15,652,441 0.0
Fuel escalator $227,322,686 $242,864,638 -6.4
Emergency surcharge $0 $0 0.0
OPEB surcharge $3,047,353 $0 0.0
Maintenance surcharge $8,754,320 -$6 0.0
Self-insurance $635,936 -$122 0.0
Asbestos surcharge $0 -$3 0.0
Line Loss surcharge $1,375,452 $1,480,348 -7.1
Other $3,403,502 $4,319,352 -21.2
Bad Debt expense -$1,987,559 -$2,156,713 -7.8
Total operating revenues $321,041,958 $339,000,859 -5.3
Operating expenses:
Production:
Fuel $231,687,421 $248,812,137 -6.9
Fuel Expense/Other $0 $0 0.0
Operating $4,684,483 $6,715,143 -30.2
Maintenance $23,143,701 $22,875,443 1.2
Allocated to water system -$231,548 -$7,937,629 -97.1
Total Production $259,284,056 $270,465,093 -4.1
Distribution:
Operating $6,255,383 $7,064,867 -11.5
Maintenance $3,368,578 $3,151,062 6.9
Total Distribution $9,623,961 $10,215,928 -5.8
Depreciation $23,748,413 $23,319,981 1.8
Administrative And General $28,643,260 $27,877,954 2.7
Customer $6,406,536 $6,499,685 -1.4
Total Operating Expenses $327,706,226 $338,378,641 -3.2
Operating Income (Loss) -$6,664,268 $622,218 -1171.1
Other Income (Deductions):
Interest Expense Long -Term Debt -$12,145,787 -$12,044,504 0.8
Allowance for Borrowed Funds $352,269 $308,567 14.2
Interest Income $243,332 $119,391 103.8
Interest Expense -$2,428,032 -$3,385,420 -28.3
-$13,978,217 -$15,001,967 -6.8
Net Income (Loss) Before Taxes -$20,642,486 -$14,379,749 43.6
Payment in Lieu of Taxes $0 $500,000 0.0
Captial Grants $426,854 $4,606,957 1.8
Contr. In aid of construction $2,366,938 $337,047 602.3
Contr. In aid/Fuel Tax income $8,130,583 $0 0.0
Net Income (Loss) -$9,718,111 -$9,935,745 -2.2
VIRGIN ISLANDS WATER AND POWER AUTHORITY
ELECTRIC SYSTEM COMBINED STATEMENTS OF NET INCOME
JUNE 30, 2014 and 2013
Management Audit of VIWAPA – Final Report
February 10, 2015
Page 20
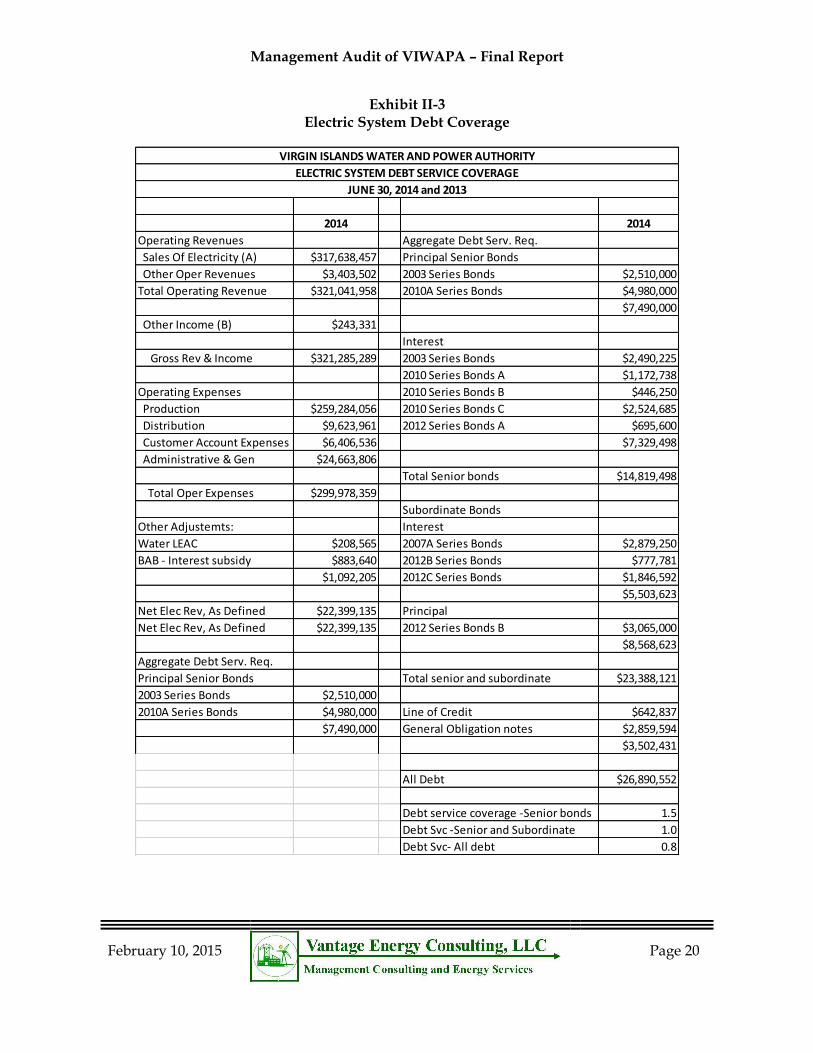
Exhibit II-3 Electric System Debt Coverage
2014 2014
Operating Revenues Aggregate Debt Serv. Req.
Sales Of Electricity (A) $317,638,457 Principal Senior Bonds
Other Oper Revenues $3,403,502 2003 Series Bonds $2,510,000
Total Operating Revenue $321,041,958 2010A Series Bonds $4,980,000
$7,490,000
Other Income (B) $243,331
Interest
Gross Rev & Income $321,285,289 2003 Series Bonds $2,490,225
2010 Series Bonds A $1,172,738
Operating Expenses 2010 Series Bonds B $446,250
Production $259,284,056 2010 Series Bonds C $2,524,685
Distribution $9,623,961 2012 Series Bonds A $695,600
Customer Account Expenses $6,406,536 $7,329,498
Administrative & Gen $24,663,806
Total Senior bonds $14,819,498
Total Oper Expenses $299,978,359
Subordinate Bonds
Other Adjustemts: Interest
Water LEAC $208,565 2007A Series Bonds $2,879,250
BAB - Interest subsidy $883,640 2012B Series Bonds $777,781
$1,092,205 2012C Series Bonds $1,846,592
$5,503,623
Net Elec Rev, As Defined $22,399,135 Principal
Net Elec Rev, As Defined $22,399,135 2012 Series Bonds B $3,065,000
$8,568,623
Aggregate Debt Serv. Req.
Principal Senior Bonds Total senior and subordinate $23,388,121
2003 Series Bonds $2,510,000
2010A Series Bonds $4,980,000 Line of Credit $642,837
$7,490,000 General Obligation notes $2,859,594
$3,502,431
All Debt $26,890,552
Debt service coverage -Senior bonds 1.5
Debt Svc -Senior and Subordinate 1.0
Debt Svc- All debt 0.8
VIRGIN ISLANDS WATER AND POWER AUTHORITY
ELECTRIC SYSTEM DEBT SERVICE COVERAGE
JUNE 30, 2014 and 2013
Management Audit of VIWAPA – Final Report
February 10, 2015
Page 21
C. ELECTRIC OPERATIONS
The Authority has major generation facilities on the islands of St. Thomas and St. Croix, and has limited backup generating facilities on the island of St. John. Except for emergency situations, the electric power and energy requirements of the island of St. John are generated on the island of St. Thomas and transmitted to the island of St. John by means of two underwater cables. Because of distance and the extreme depth of the ocean floor in the waters that separate them, the electric systems on the islands of St. Thomas and St. Croix are not interconnected.
The Authority's generating facilities on the island of St. Thomas are located at the Randolph E. Harley Generating Station at Krum Bay, which is on the southwestern end of the island. All electric generation for the islands of St. Thomas and St. John, and the two smaller islands, Hassel Island and Water Island, are located at this site, except for an emergency diesel-generating unit located on the island of St. John. In addition to generation facilities, the Randolph E. Harley Generating Station site includes water production, fuel oil unloading and storage, transportation, and warehouse facilities.
All of the existing generation facilities on the island of St. Croix are located at the Estate Richmond site on the north shore of the island near Christiansted. In addition to generation facilities, the Estate Richmond site includes water production, fuel oil unloading and storage and warehouse facilities.
On July 25th, 2013, the Governing Board of the Authority voted unanimously to approve a 5-7 year agreement between the Authority and the Vitol Group, a global energy provider to supply propane for power generation in the Territory. The project, which is now scheduled to be completed in the spring of 20157, is designed to reduce the Authority's fuel costs by 30% and therefore intends to allow for significant savings to the Authority's rate payers. The Vitol Group will retain ownership of the propane inventory and supply facilities. WAPA will purchase the propane at a metered location near the plant.
On November 12th, 2013, management and the vendor for the Gas Turbine #25, APR Energy, extended the original lease agreement for an additional twelve months through November 2014 for $7.8 million.8 It was subsequently extended again for 24 months on November 26, 2014.
During the fiscal year ended June 30, 2014, the Authority sold 641,038 mWh of electric energy to ultimate customers and received total operating revenues from sales of $321,041,916. As of June 30, 2014, the Authority provided electric service to 54,917 customers consisting of 45,066 residential, 8,213 commercial, 988 demand-metered (commercial), 55 primary metered large power customers and 595 lighting customers.
7 / The schedule for completion has now been extended.
8 /Vantage has since learned that the lease has been extended by an additional twelve months for a total 24 month extension.
Management Audit of VIWAPA – Final Report
February 10, 2015
Page 22
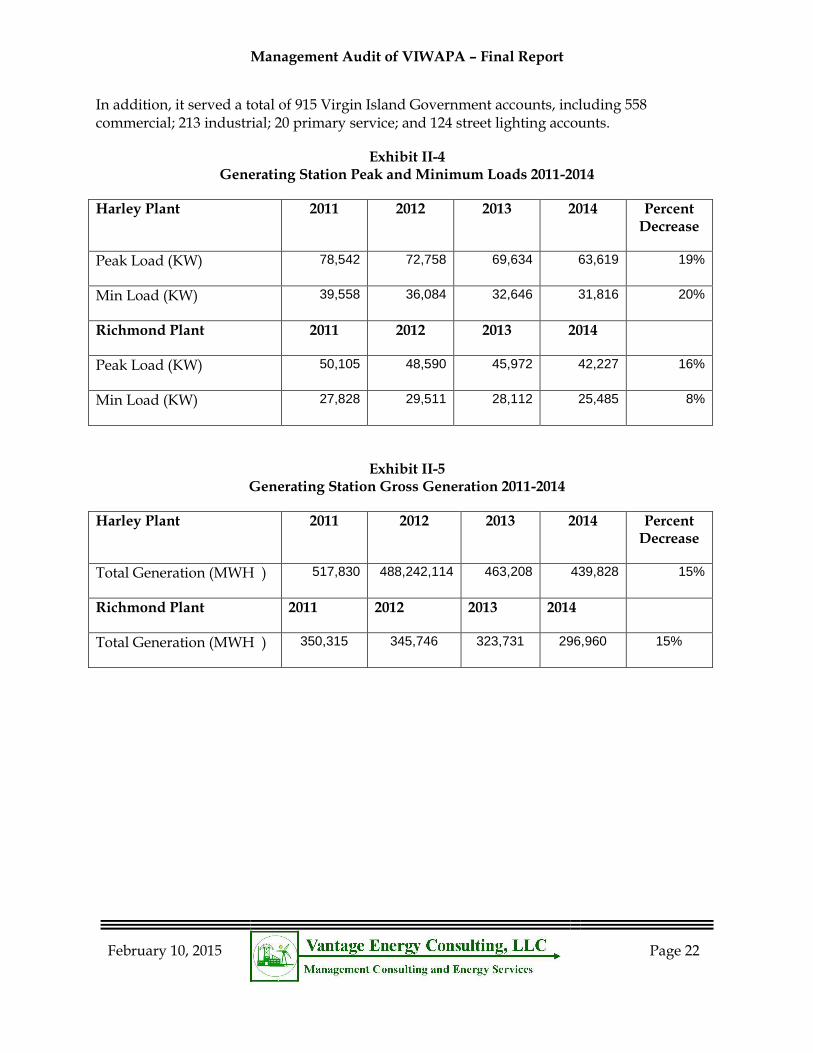
In addition, it served a total of 915 Virgin Island Government accounts, including 558 commercial; 213 industrial; 20 primary service; and 124 street lighting accounts.
Exhibit II-4 Generating Station Peak and Minimum Loads 2011-2014
Harley Plant 2011 2012 2013 2014 Percent Decrease
Peak Load (KW) 78,542 72,758 69,634 63,619 19%
Min Load (KW) 39,558 36,084 32,646 31,816 20%
Richmond Plant 2011 2012 2013 2014
Peak Load (KW) 50,105 48,590 45,972 42,227 16%
Min Load (KW) 27,828 29,511 28,112 25,485 8%
Exhibit II-5 Generating Station Gross Generation 2011-2014
Harley Plant 2011 2012 2013 2014 Percent Decrease
Total Generation (MWH ) 517,830 488,242,114 463,208 439,828 15%
Richmond Plant 2011 2012 2013 2014
Total Generation (MWH ) 350,315 345,746 323,731 296,960 15%
Management Audit of VIWAPA – Final Report
February 10, 2015
Page 23
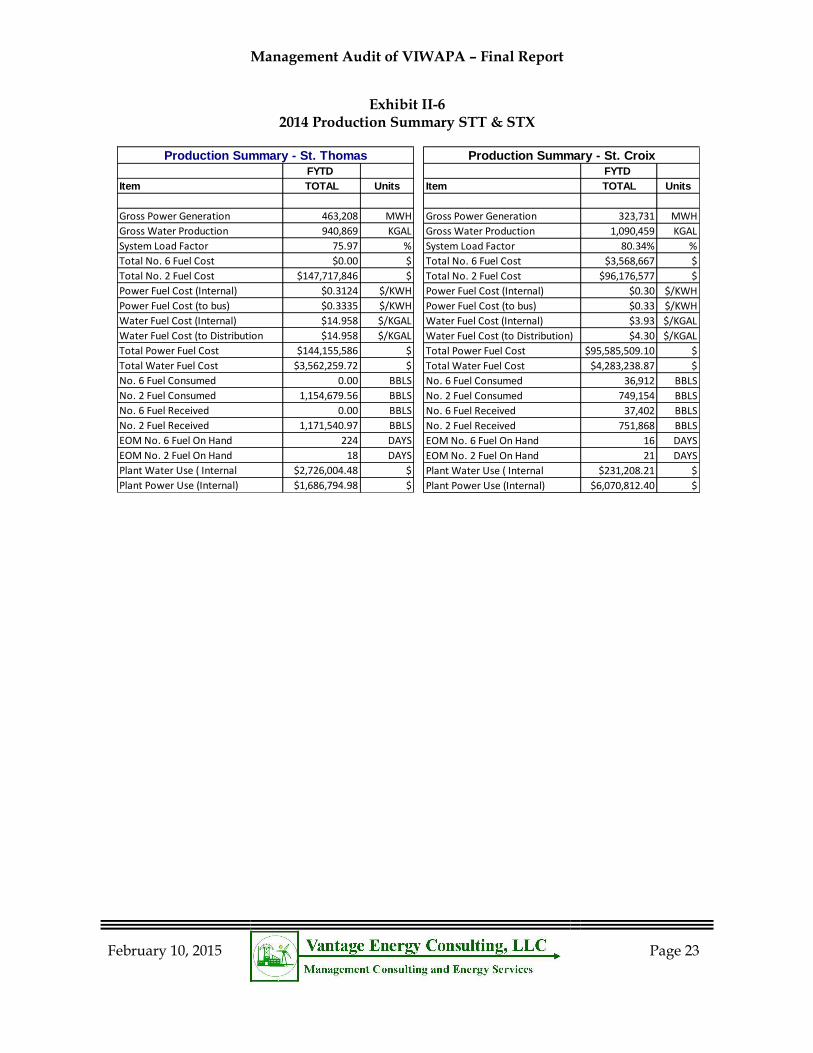
Exhibit II-6 2014 Production Summary STT & STX
FYTD
Item TOTAL Units
Gross Power Generation 463,208 MWH
Gross Water Production 940,869 KGAL
System Load Factor 75.97 %
Total No. 6 Fuel Cost $0.00 $
Total No. 2 Fuel Cost $147,717,846 $
Power Fuel Cost (Internal) $0.3124 $/KWH
Power Fuel Cost (to bus) $0.3335 $/KWH
Water Fuel Cost (Internal) $14.958 $/KGAL
Water Fuel Cost (to Distribution $14.958 $/KGAL
Total Power Fuel Cost $144,155,586 $
Total Water Fuel Cost $3,562,259.72 $
No. 6 Fuel Consumed 0.00 BBLS
No. 2 Fuel Consumed 1,154,679.56 BBLS
No. 6 Fuel Received 0.00 BBLS
No. 2 Fuel Received 1,171,540.97 BBLS
EOM No. 6 Fuel On Hand 224 DAYS
EOM No. 2 Fuel On Hand 18 DAYS
Plant Water Use ( Internal $2,726,004.48 $
Plant Power Use (Internal) $1,686,794.98 $
Production Summary - St. Thomas
FYTD
Item TOTAL Units
Gross Power Generation 323,731 MWH
Gross Water Production 1,090,459 KGAL
System Load Factor 80.34% %
Total No. 6 Fuel Cost $3,568,667 $
Total No. 2 Fuel Cost $96,176,577 $
Power Fuel Cost (Internal) $0.30 $/KWH
Power Fuel Cost (to bus) $0.33 $/KWH
Water Fuel Cost (Internal) $3.93 $/KGAL
Water Fuel Cost (to Distribution) $4.30 $/KGAL
Total Power Fuel Cost $95,585,509.10 $
Total Water Fuel Cost $4,283,238.87 $
No. 6 Fuel Consumed 36,912 BBLS
No. 2 Fuel Consumed 749,154 BBLS
No. 6 Fuel Received 37,402 BBLS
No. 2 Fuel Received 751,868 BBLS
EOM No. 6 Fuel On Hand 16 DAYS
EOM No. 2 Fuel On Hand 21 DAYS
Plant Water Use ( Internal $231,208.21 $
Plant Power Use (Internal) $6,070,812.40 $
Production Summary - St. Croix
Management Audit of VIWAPA – Final Report
February 10, 2015
Page 24
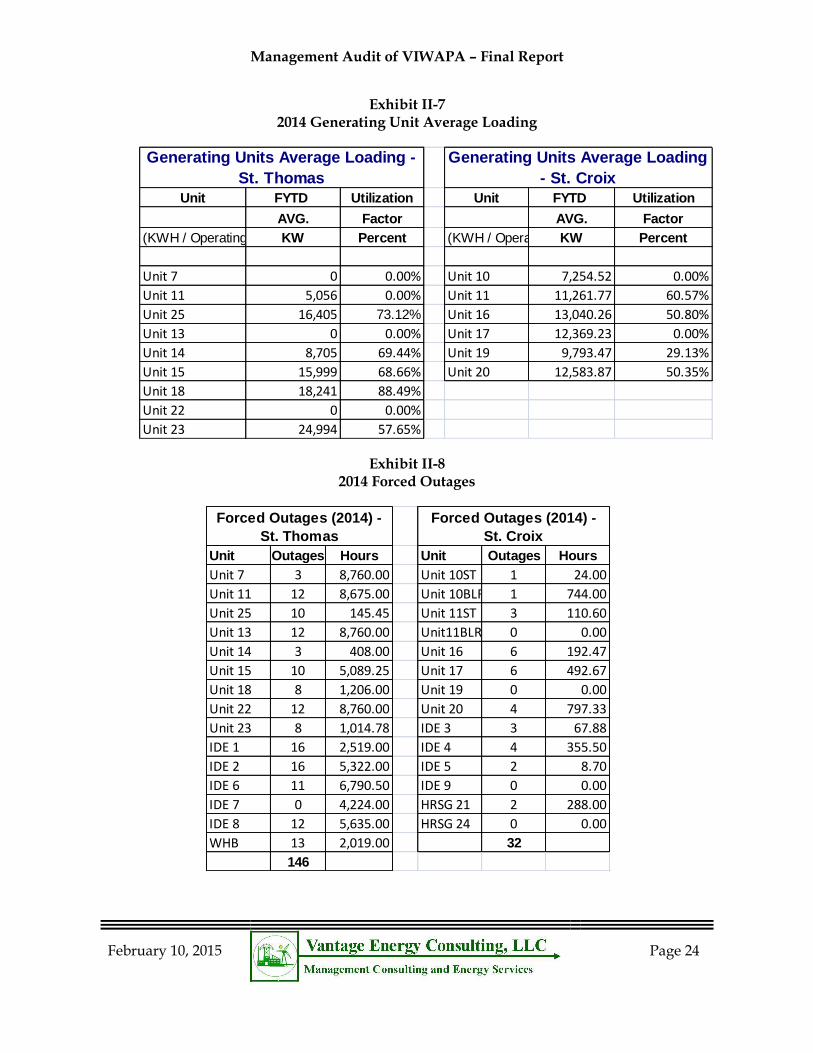
Exhibit II-7 2014 Generating Unit Average Loading
Exhibit II-8 2014 Forced Outages
Unit FYTD Utilization Unit FYTD Utilization
AVG. Factor AVG. Factor
(KWH / Operating Hours)KW Percent (KWH / Operating Hours)KW Percent
Unit 7 0 0.00% Unit 10 7,254.52 0.00%
Unit 11 5,056 0.00% Unit 11 11,261.77 60.57%
Unit 25 16,405 73.12% Unit 16 13,040.26 50.80%
Unit 13 0 0.00% Unit 17 12,369.23 0.00%
Unit 14 8,705 69.44% Unit 19 9,793.47 29.13%
Unit 15 15,999 68.66% Unit 20 12,583.87 50.35%
Unit 18 18,241 88.49%
Unit 22 0 0.00%
Unit 23 24,994 57.65%
Generating Units Average Loading
- St. Croix
Generating Units Average Loading -
St. Thomas
Unit Outages Hours Unit Outages Hours
Unit 7 3 8,760.00 Unit 10ST 1 24.00
Unit 11 12 8,675.00 Unit 10BLR 1 744.00
Unit 25 10 145.45 Unit 11ST 3 110.60
Unit 13 12 8,760.00 Unit11BLR 0 0.00
Unit 14 3 408.00 Unit 16 6 192.47
Unit 15 10 5,089.25 Unit 17 6 492.67
Unit 18 8 1,206.00 Unit 19 0 0.00
Unit 22 12 8,760.00 Unit 20 4 797.33
Unit 23 8 1,014.78 IDE 3 3 67.88
IDE 1 16 2,519.00 IDE 4 4 355.50
IDE 2 16 5,322.00 IDE 5 2 8.70
IDE 6 11 6,790.50 IDE 9 0 0.00
IDE 7 0 4,224.00 HRSG 21 2 288.00
IDE 8 12 5,635.00 HRSG 24 0 0.00
WHB 13 2,019.00 32
146
Forced Outages (2014) -
St. Thomas
Forced Outages (2014) -
St. Croix
Management Audit of VIWAPA – Final Report
February 10, 2015
Page 25
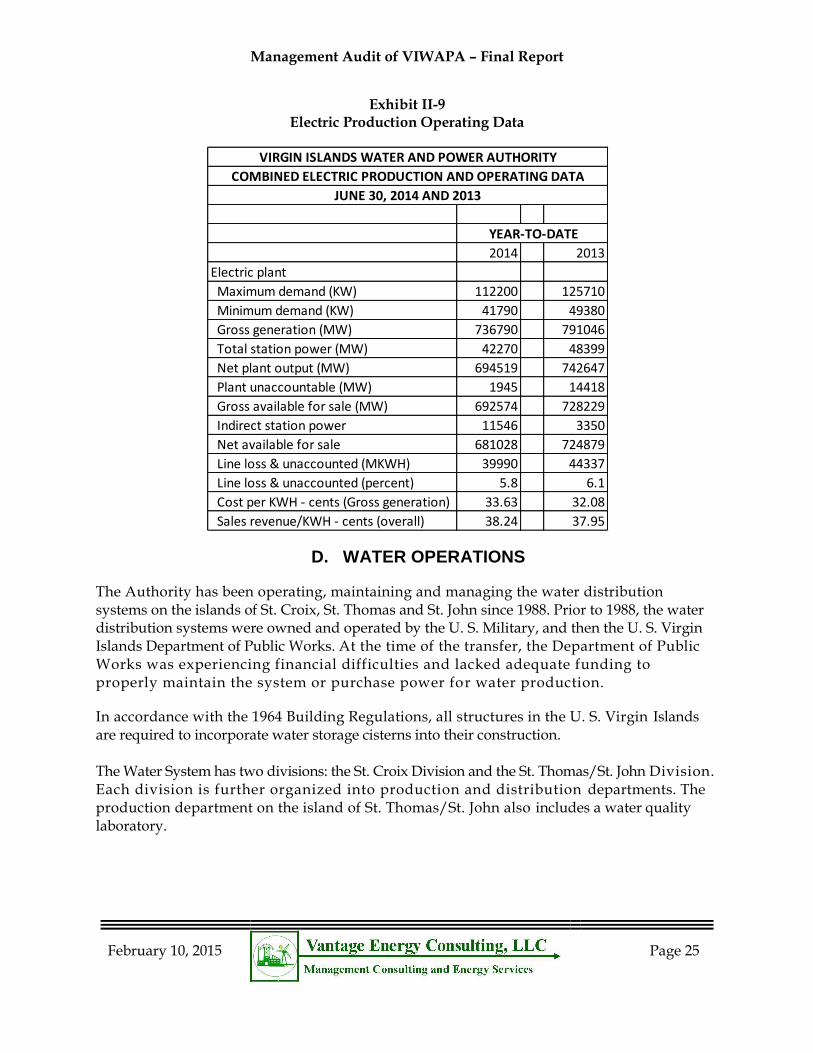
Exhibit II-9 Electric Production Operating Data
D. WATER OPERATIONS
The Authority has been operating, maintaining and managing the water distribution systems on the islands of St. Croix, St. Thomas and St. John since 1988. Prior to 1988, the water distribution systems were owned and operated by the U. S. Military, and then the U. S. Virgin Islands Department of Public Works. At the time of the transfer, the Department of Public Works was experiencing financial difficulties and lacked adequate funding to properly maintain the system or purchase power for water production.
In accordance with the 1964 Building Regulations, all structures in the U. S. Virgin Islands are required to incorporate water storage cisterns into their construction. The Water System has two divisions: the St. Croix Division and the St. Thomas/St. John Division. Each division is further organized into production and distribution departments. The production department on the island of St. Thomas/St. John also includes a water quality laboratory.
2014 2013
Electric plant
Maximum demand (KW) 112200 125710
Minimum demand (KW) 41790 49380
Gross generation (MW) 736790 791046
Total station power (MW) 42270 48399
Net plant output (MW) 694519 742647
Plant unaccountable (MW) 1945 14418
Gross available for sale (MW) 692574 728229
Indirect station power 11546 3350
Net available for sale 681028 724879
Line loss & unaccounted (MKWH) 39990 44337
Line loss & unaccounted (percent) 5.8 6.1
Cost per KWH - cents (Gross generation) 33.63 32.08
Sales revenue/KWH - cents (overall) 38.24 37.95
VIRGIN ISLANDS WATER AND POWER AUTHORITY
COMBINED ELECTRIC PRODUCTION AND OPERATING DATA
JUNE 30, 2014 AND 2013
YEAR-TO-DATE
Management Audit of VIWAPA – Final Report
February 10, 2015
Page 26
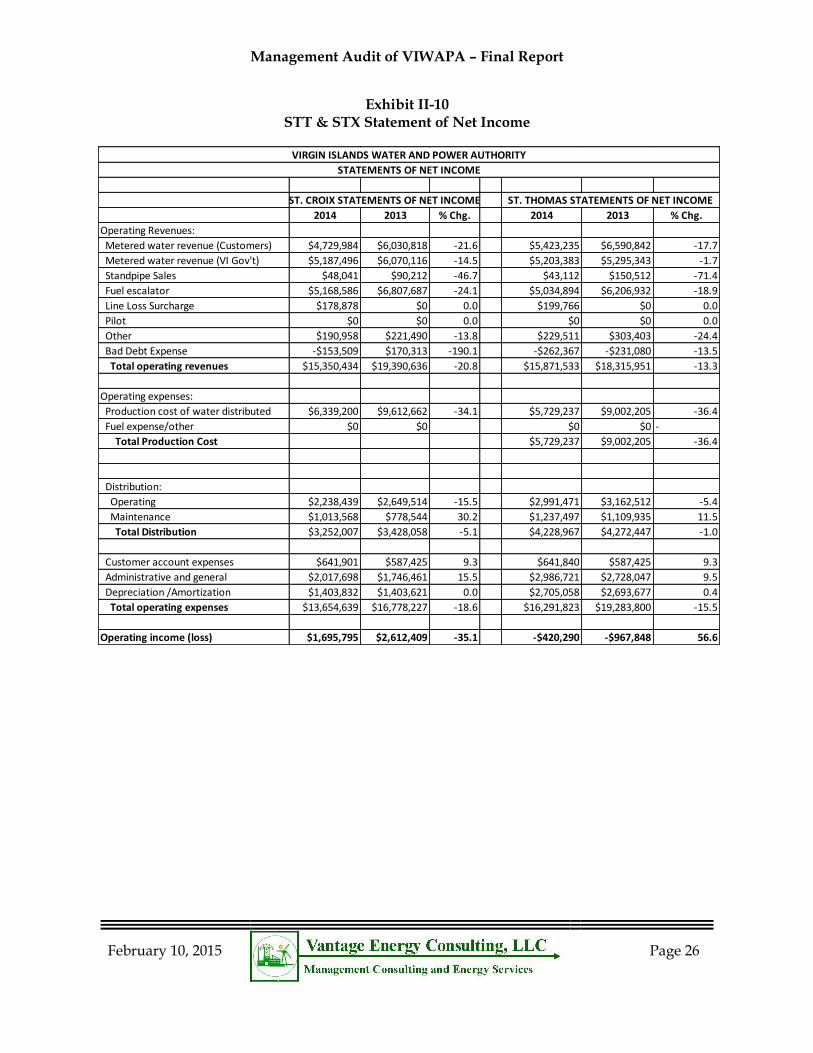
Exhibit II-10 STT & STX Statement of Net Income
2014 2013 % Chg. 2014 2013 % Chg.
Operating Revenues:
Metered water revenue (Customers) $4,729,984 $6,030,818 -21.6 $5,423,235 $6,590,842 -17.7
Metered water revenue (VI Gov't) $5,187,496 $6,070,116 -14.5 $5,203,383 $5,295,343 -1.7
Standpipe Sales $48,041 $90,212 -46.7 $43,112 $150,512 -71.4
Fuel escalator $5,168,586 $6,807,687 -24.1 $5,034,894 $6,206,932 -18.9
Line Loss Surcharge $178,878 $0 0.0 $199,766 $0 0.0
Pilot $0 $0 0.0 $0 $0 0.0
Other $190,958 $221,490 -13.8 $229,511 $303,403 -24.4
Bad Debt Expense -$153,509 $170,313 -190.1 -$262,367 -$231,080 -13.5
Total operating revenues $15,350,434 $19,390,636 -20.8 $15,871,533 $18,315,951 -13.3
Operating expenses:
Production cost of water distributed $6,339,200 $9,612,662 -34.1 $5,729,237 $9,002,205 -36.4
Fuel expense/other $0 $0 $0 $0 -
Total Production Cost $5,729,237 $9,002,205 -36.4
Distribution:
Operating $2,238,439 $2,649,514 -15.5 $2,991,471 $3,162,512 -5.4
Maintenance $1,013,568 $778,544 30.2 $1,237,497 $1,109,935 11.5
Total Distribution $3,252,007 $3,428,058 -5.1 $4,228,967 $4,272,447 -1.0
Customer account expenses $641,901 $587,425 9.3 $641,840 $587,425 9.3
Administrative and general $2,017,698 $1,746,461 15.5 $2,986,721 $2,728,047 9.5
Depreciation /Amortization $1,403,832 $1,403,621 0.0 $2,705,058 $2,693,677 0.4
Total operating expenses $13,654,639 $16,778,227 -18.6 $16,291,823 $19,283,800 -15.5
Operating income (loss) $1,695,795 $2,612,409 -35.1 -$420,290 -$967,848 56.6
ST. CROIX STATEMENTS OF NET INCOME ST. THOMAS STATEMENTS OF NET INCOME
STATEMENTS OF NET INCOME
VIRGIN ISLANDS WATER AND POWER AUTHORITY
Management Audit of VIWAPA – Final Report
February 10, 2015
Page 27
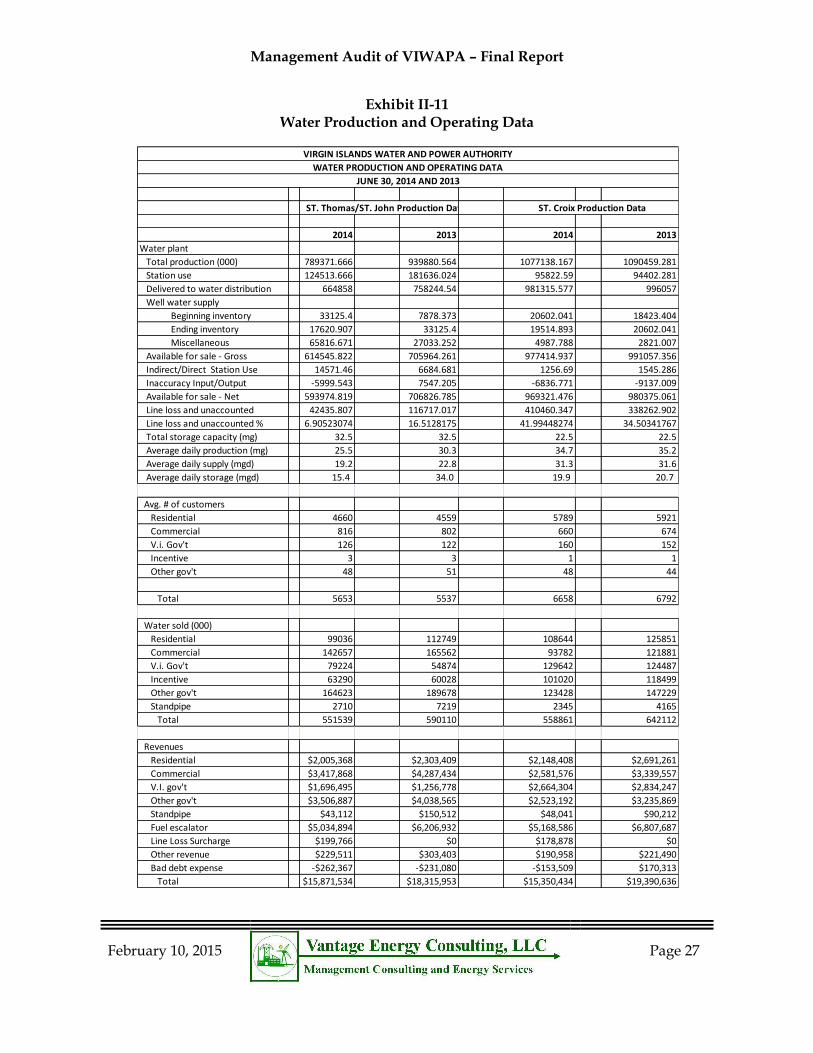
Exhibit II-11 Water Production and Operating Data
2014 2013 2014 2013
Water plant
Total production (000) 789371.666 939880.564 1077138.167 1090459.281
Station use 124513.666 181636.024 95822.59 94402.281
Delivered to water distribution 664858 758244.54 981315.577 996057
Well water supply
Beginning inventory 33125.4 7878.373 20602.041 18423.404
Ending inventory 17620.907 33125.4 19514.893 20602.041
Miscellaneous 65816.671 27033.252 4987.788 2821.007
Available for sale - Gross 614545.822 705964.261 977414.937 991057.356
Indirect/Direct Station Use 14571.46 6684.681 1256.69 1545.286
Inaccuracy Input/Output -5999.543 7547.205 -6836.771 -9137.009
Available for sale - Net 593974.819 706826.785 969321.476 980375.061
Line loss and unaccounted 42435.807 116717.017 410460.347 338262.902
Line loss and unaccounted % 6.90523074 16.5128175 41.99448274 34.50341767
Total storage capacity (mg) 32.5 32.5 22.5 22.5
Average daily production (mg) 25.5 30.3 34.7 35.2
Average daily supply (mgd) 19.2 22.8 31.3 31.6
Average daily storage (mgd) 15.4 34.0 19.9 20.7
Avg. # of customers
Residential 4660 4559 5789 5921
Commercial 816 802 660 674
V.i. Gov't 126 122 160 152
Incentive 3 3 1 1
Other gov't 48 51 48 44
Total 5653 5537 6658 6792
Water sold (000)
Residential 99036 112749 108644 125851
Commercial 142657 165562 93782 121881
V.i. Gov't 79224 54874 129642 124487
Incentive 63290 60028 101020 118499
Other gov't 164623 189678 123428 147229
Standpipe 2710 7219 2345 4165
Total 551539 590110 558861 642112
Revenues
Residential $2,005,368 $2,303,409 $2,148,408 $2,691,261
Commercial $3,417,868 $4,287,434 $2,581,576 $3,339,557
V.I. gov't $1,696,495 $1,256,778 $2,664,304 $2,834,247
Other gov't $3,506,887 $4,038,565 $2,523,192 $3,235,869
Standpipe $43,112 $150,512 $48,041 $90,212
Fuel escalator $5,034,894 $6,206,932 $5,168,586 $6,807,687
Line Loss Surcharge $199,766 $0 $178,878 $0
Other revenue $229,511 $303,403 $190,958 $221,490
Bad debt expense -$262,367 -$231,080 -$153,509 $170,313
Total $15,871,534 $18,315,953 $15,350,434 $19,390,636
ST. Thomas/ST. John Production Data ST. Croix Production Data
VIRGIN ISLANDS WATER AND POWER AUTHORITY
WATER PRODUCTION AND OPERATING DATA
JUNE 30, 2014 AND 2013
Management Audit of VIWAPA – Final Report
February 10, 2015
Page 28
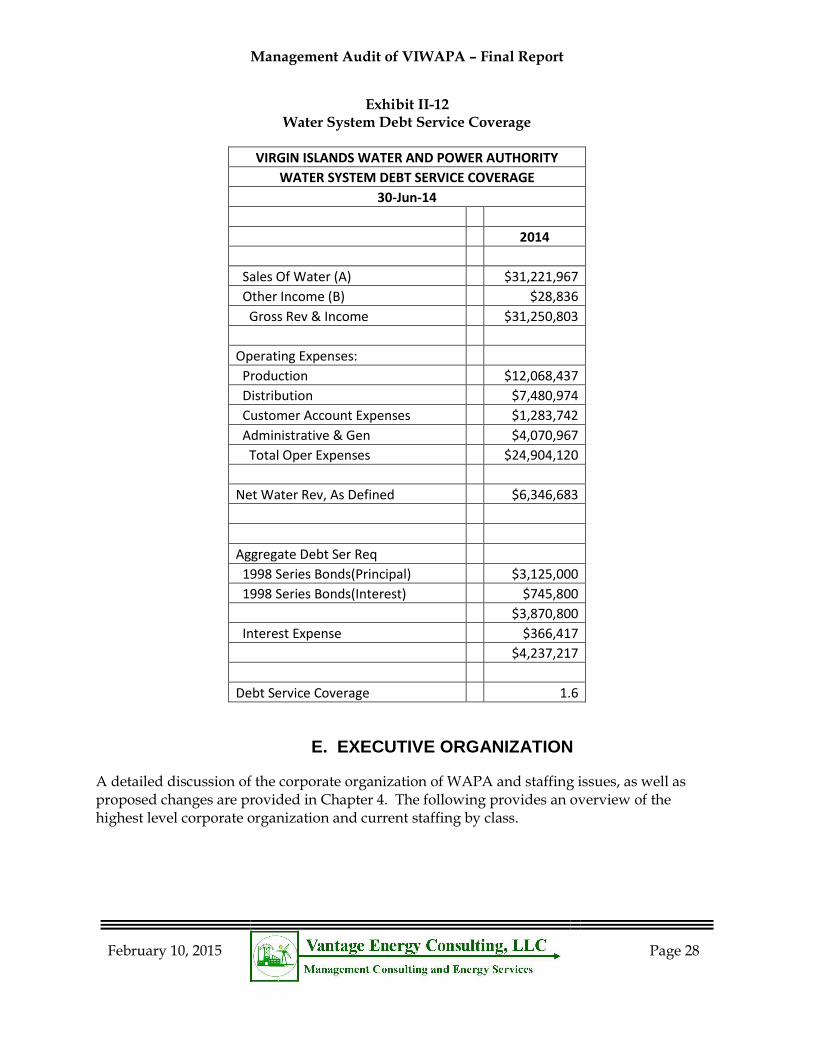
Exhibit II-12 Water System Debt Service Coverage
VIRGIN ISLANDS WATER AND POWER AUTHORITY
WATER SYSTEM DEBT SERVICE COVERAGE
30-Jun-14
2014
Sales Of Water (A) $31,221,967
Other Income (B) $28,836
Gross Rev & Income $31,250,803
Operating Expenses:
Production $12,068,437
Distribution $7,480,974
Customer Account Expenses $1,283,742
Administrative & Gen $4,070,967
Total Oper Expenses $24,904,120
Net Water Rev, As Defined $6,346,683
Aggregate Debt Ser Req
1998 Series Bonds(Principal) $3,125,000
1998 Series Bonds(Interest) $745,800
$3,870,800
Interest Expense $366,417
$4,237,217
Debt Service Coverage 1.6
E. EXECUTIVE ORGANIZATION
A detailed discussion of the corporate organization of WAPA and staffing issues, as well as proposed changes are provided in Chapter 4. The following provides an overview of the highest level corporate organization and current staffing by class.
Management Audit of VIWAPA – Final Report
February 10, 2015
Page 29
Exhibit II-13 Corporate Organization
GOVERNING
BOARD
Internal Audit Director
Internal Audit Manager Rev Protection Mgr STT
Chief Executive Officer Rev Protection Mgr STC
Dir of Special Projects General Counsel
Asst General Counsel Contracts Manager
Dir of Corporate Comm
Legal Office Manager
Dir of Trans & Distribution
Dir Human Resources
Mgr System Plng - STT Mgr System Plng - STX Personnel Mgr/Training Personnel Manager
(Vacant)
Elec Dist/Meter Serv STT Elec Dist/Meter Serv STX Safety Manager
Special Asst T&D Dirctr Substation Manager Chief Information Officer
Administrator St. John Design & Const Manager
Network Manager Operations Manager
System Manager
Chief Operating Officer Chief Financial Officer Director Corporate Service
Gregory Rhymer
Special Asst to COO
Assistant CFO Special Asistant to CFO W'house & Garage STT
Director of Power Plant Dir of Water Dist STT Dir of Water Dist STX Comptroller Grant Manager W'house & Garage STC
Water Superintendent Asst Dir Wat Dist/Chief Meter Reading Mgr STC/STT
Electric & Water Prod STT Electric & Water Prod STX Accounting Manager
Superintendent Superintendent
Asst Water Supt Water Superintendent Pricing & Rates Manager
Plant Project Manager Operations Manager Budget & Cash Manager
Project Manager Asst Water Supt Purchasing Manager
Operations Manager Maintenance Manager
Security Manager
_ _ _ Env Affairs Manager _ _ _ Dir of Cust Service
Line Loss Manager
Maintenance Manager Cust Relations Mgr STT Cust Relations Mgr STC
General Maintenance Mgr Key Account Manager
Management Audit of VIWAPA – Final Report
February 10, 2015
Page 30
III. STRATEGIC, RESOURCE AND FINANCIAL PLANNING
A. SUMMARY
WAPA has not completed a strategic plan since 2002, although it made a failed attempt in 2010. The previous plans were not directly linked to the O&M or Capital budgets. As WAPA’s system-wide peak load has declined by 18% over three years and minimum load declined 15%, WAPA’s ability to schedule generation in a cost effective manner has been severely compromised and has led to higher costs and an increased number of outages. Further, given the many important projects currently underway, the completion of greater amounts of renewable power, the need to transform the generation fleet into a more adaptable configuration, WAPA is facing many key hurdles. There is no doubt that a need for a strategic plan which is prepared and implemented in an effective manner, is an absolute necessity As it moves forward with its strategic planning process, WAPA should consider assigning this process to a qualified fulltime employee with outside facilitation.
WAPA selected Black & Veatch on November 29, 2014 to develop an Integrated Resources Plan (IRP) that will provide a roadmap for responding to future generation needs. This RFP requires detailed analysis of multiple growth scenarios, fuel options and prices, generating technologies, and continued use of renewable energy sources. The WAPA Governing Board and its outside stakeholders must insist that this plan be thorough and include a wide range of options, prices, and growth scenarios. It is essential that the consultant selected to perform the IRP not be wedded to marginal modifications to WAPA’s current generation fleet, but consider a broader spectrum of replacement strategies including smaller scale reciprocating internal combustion engines, demand side management and distributed renewable resources.
In a number of our discussions with WAPA managers, we were told that WAPA is faced with a dilemma, as renewable such as wind, solar and bio-fuels, as well as conservation efforts and self-generation have made meeting load and reserve commitments difficult with the units that are currently available. Many at WAPA feel the answer is to restrict the level of alternative energy sources in order to assure load levels that permit use of the existing WAPA units This is the first reaction of many utilities; resist the tide of renewable, new technologies and consumer actions. However, enlightened utilities have now recognized that their role is to adopt to the needs of their customers, often changing significant portions of their fleet to provide fast startup, highly efficient generation sources that enable timely responses in utility generation when wind and solar sources fluctuate or customers opt to leave or re-enter the system. WAPA faces these challenges and much of the discussion below addresses the need to be open to new ideas and to not defend past decisions that are no longer relevant.
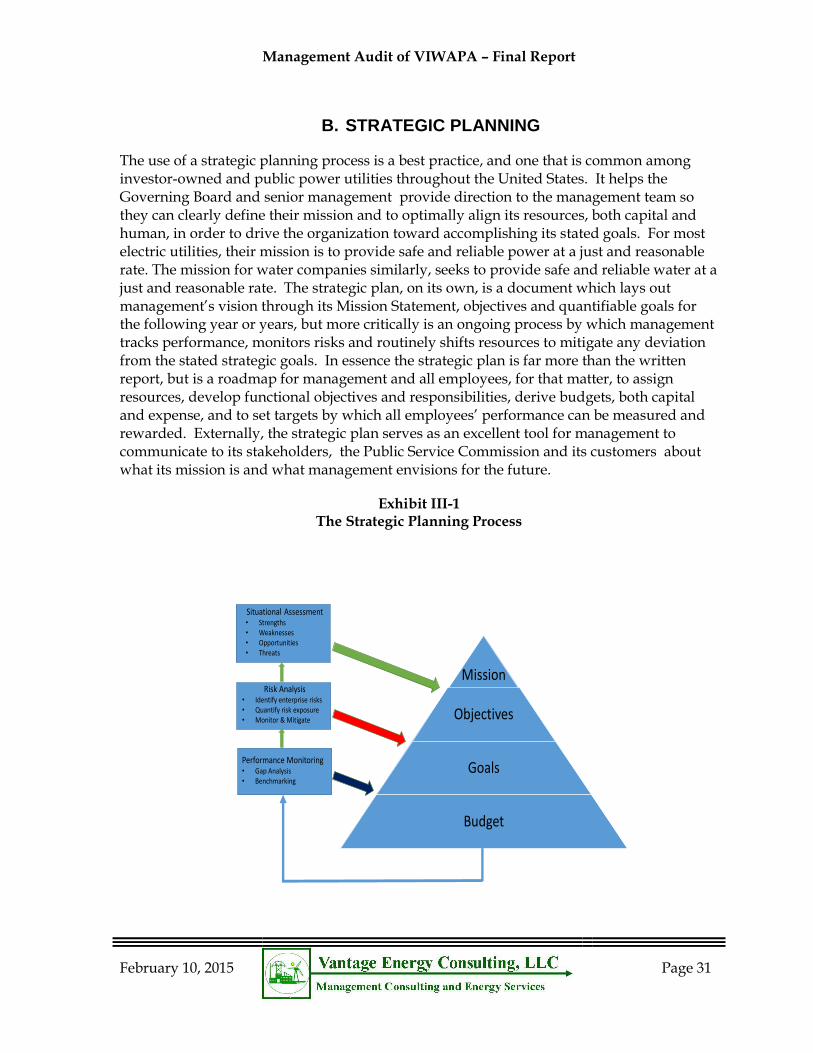
Management Audit of VIWAPA – Final Report
February 10, 2015
Page 31
B. STRATEGIC PLANNING
The use of a strategic planning process is a best practice, and one that is common among investor-owned and public power utilities throughout the United States. It helps the Governing Board and senior management provide direction to the management team so they can clearly define their mission and to optimally align its resources, both capital and human, in order to drive the organization toward accomplishing its stated goals. For most electric utilities, their mission is to provide safe and reliable power at a just and reasonable rate. The mission for water companies similarly, seeks to provide safe and reliable water at a just and reasonable rate. The strategic plan, on its own, is a document which lays out management’s vision through its Mission Statement, objectives and quantifiable goals for the following year or years, but more critically is an ongoing process by which management tracks performance, monitors risks and routinely shifts resources to mitigate any deviation from the stated strategic goals. In essence the strategic plan is far more than the written report, but is a roadmap for management and all employees, for that matter, to assign resources, develop functional objectives and responsibilities, derive budgets, both capital and expense, and to set targets by which all employees’ performance can be measured and rewarded. Externally, the strategic plan serves as an excellent tool for management to communicate to its stakeholders, the Public Service Commission and its customers about what its mission is and what management envisions for the future.
Exhibit III-1 The Strategic Planning Process
Mission
Objectives
Goals
Budget
Situational Assessment• Strengths• Weaknesses• Opportunities• Threats
Performance Monitoring• Gap Analysis• Benchmarking
Risk Analysis• Identify enterprise risks• Quantify risk exposure• Monitor & Mitigate
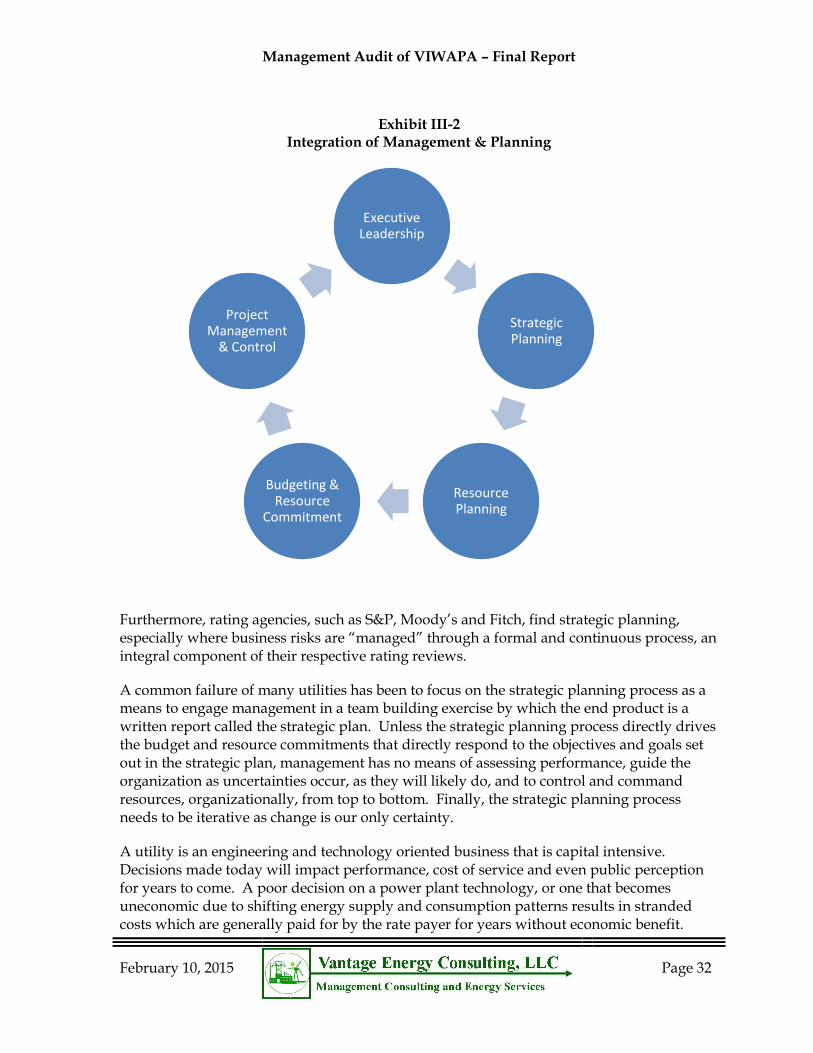
Management Audit of VIWAPA – Final Report
February 10, 2015
Page 32
Exhibit III-2 Integration of Management & Planning
Furthermore, rating agencies, such as S&P, Moody’s and Fitch, find strategic planning, especially where business risks are “managed” through a formal and continuous process, an integral component of their respective rating reviews.
A common failure of many utilities has been to focus on the strategic planning process as a means to engage management in a team building exercise by which the end product is a written report called the strategic plan. Unless the strategic planning process directly drives the budget and resource commitments that directly respond to the objectives and goals set out in the strategic plan, management has no means of assessing performance, guide the organization as uncertainties occur, as they will likely do, and to control and command resources, organizationally, from top to bottom. Finally, the strategic planning process needs to be iterative as change is our only certainty.
A utility is an engineering and technology oriented business that is capital intensive. Decisions made today will impact performance, cost of service and even public perception for years to come. A poor decision on a power plant technology, or one that becomes uneconomic due to shifting energy supply and consumption patterns results in stranded costs which are generally paid for by the rate payer for years without economic benefit.
Executive Leadership
Strategic Planning
Resource Planning
Budgeting & Resource
Commitment
Project Management
& Control
Management Audit of VIWAPA – Final Report
February 10, 2015
Page 33
In conjunction with the strategic plan there should be a resource plan as well. If the strategic plan is at the 1000 foot level of detail, the resource is below 100 feet as it assesses customer demand for electricity for twenty years or more and determines capital decisions for power plants and transmission systems in order to meet the needs of consumers in a reliable and cost effective manner. Contemporary resource plans also consider as an integral part of the resource planning process, both demand side alternatives, such as energy conservation investments and distributed generation like wind and solar, as well as environmental impacts. These enhanced plans are typically called integrated resource plans or IRPs.
Exhibit III-3 Assessment & Prioritization of Risks
There is an old adage called Murphy’s Law which states “Anything that can go wrong will go wrong.” While contemporary risk management recognizes that uncertainty is unavoidable, we can be more precise in measuring those risks in terms of likelihood (probability) and impact (e.g. losses in monetary value and/or loss of life.) Relative to utility planning and management, for both the strategic plan and the IRP, uncertainties should be identified, evaluated and mitigated in the context of the planning process. Clearly, risks that are very likely and could be extremely costly to the utility and its consumers are of the highest priority needing the greatest attention from the executive team. For example, Priority 1 & 2 level risks would drive very specific goals and objectives in the strategic plan and involve senior management on a continuous bases. Lower priority risks, can be delegated to lower
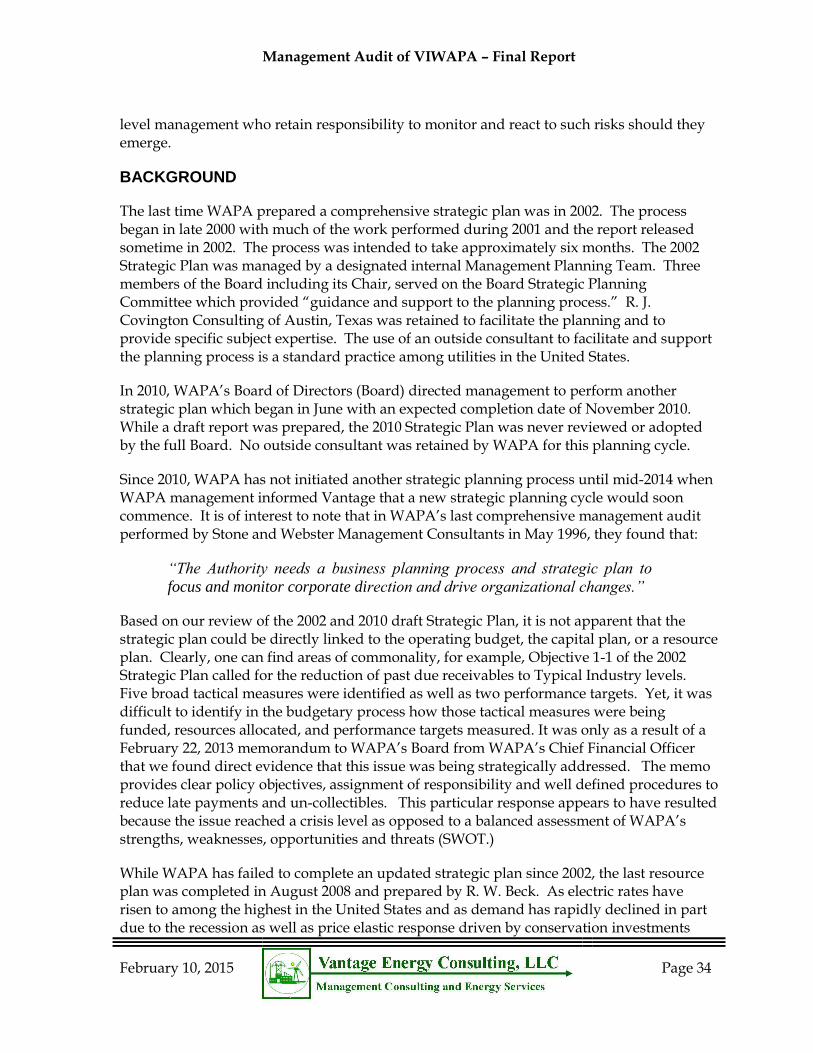
Management Audit of VIWAPA – Final Report
February 10, 2015
Page 34
level management who retain responsibility to monitor and react to such risks should they emerge.
BACKGROUND
The last time WAPA prepared a comprehensive strategic plan was in 2002. The process began in late 2000 with much of the work performed during 2001 and the report released sometime in 2002. The process was intended to take approximately six months. The 2002 Strategic Plan was managed by a designated internal Management Planning Team. Three members of the Board including its Chair, served on the Board Strategic Planning Committee which provided “guidance and support to the planning process.” R. J. Covington Consulting of Austin, Texas was retained to facilitate the planning and to provide specific subject expertise. The use of an outside consultant to facilitate and support the planning process is a standard practice among utilities in the United States.
In 2010, WAPA’s Board of Directors (Board) directed management to perform another strategic plan which began in June with an expected completion date of November 2010. While a draft report was prepared, the 2010 Strategic Plan was never reviewed or adopted by the full Board. No outside consultant was retained by WAPA for this planning cycle.
Since 2010, WAPA has not initiated another strategic planning process until mid-2014 when WAPA management informed Vantage that a new strategic planning cycle would soon commence. It is of interest to note that in WAPA’s last comprehensive management audit performed by Stone and Webster Management Consultants in May 1996, they found that:
“The Authority needs a business planning process and strategic plan to
focus and monitor corporate direction and drive organizational changes.”
Based on our review of the 2002 and 2010 draft Strategic Plan, it is not apparent that the strategic plan could be directly linked to the operating budget, the capital plan, or a resource plan. Clearly, one can find areas of commonality, for example, Objective 1-1 of the 2002 Strategic Plan called for the reduction of past due receivables to Typical Industry levels. Five broad tactical measures were identified as well as two performance targets. Yet, it was difficult to identify in the budgetary process how those tactical measures were being funded, resources allocated, and performance targets measured. It was only as a result of a February 22, 2013 memorandum to WAPA’s Board from WAPA’s Chief Financial Officer that we found direct evidence that this issue was being strategically addressed. The memo provides clear policy objectives, assignment of responsibility and well defined procedures to reduce late payments and un-collectibles. This particular response appears to have resulted because the issue reached a crisis level as opposed to a balanced assessment of WAPA’s strengths, weaknesses, opportunities and threats (SWOT.)
While WAPA has failed to complete an updated strategic plan since 2002, the last resource plan was completed in August 2008 and prepared by R. W. Beck. As electric rates have risen to among the highest in the United States and as demand has rapidly declined in part due to the recession as well as price elastic response driven by conservation investments
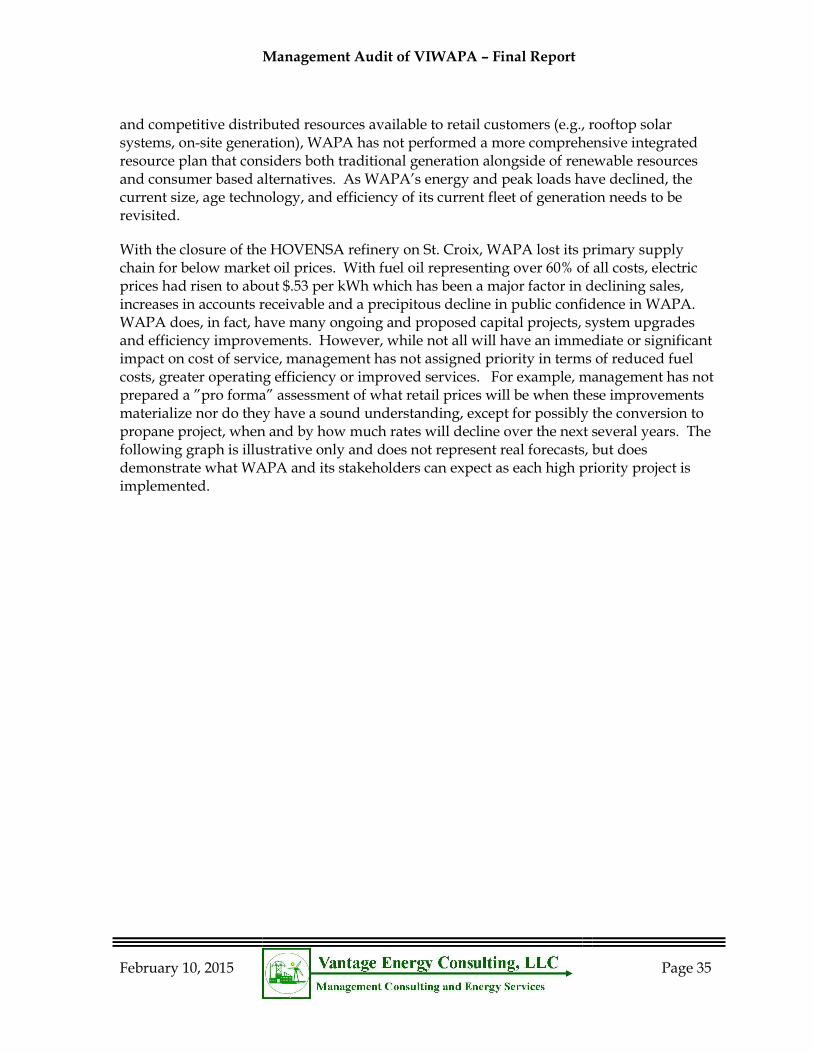
Management Audit of VIWAPA – Final Report
February 10, 2015
Page 35
and competitive distributed resources available to retail customers (e.g., rooftop solar systems, on-site generation), WAPA has not performed a more comprehensive integrated resource plan that considers both traditional generation alongside of renewable resources and consumer based alternatives. As WAPA’s energy and peak loads have declined, the current size, age technology, and efficiency of its current fleet of generation needs to be revisited.
With the closure of the HOVENSA refinery on St. Croix, WAPA lost its primary supply chain for below market oil prices. With fuel oil representing over 60% of all costs, electric prices had risen to about $.53 per kWh which has been a major factor in declining sales, increases in accounts receivable and a precipitous decline in public confidence in WAPA. WAPA does, in fact, have many ongoing and proposed capital projects, system upgrades and efficiency improvements. However, while not all will have an immediate or significant impact on cost of service, management has not assigned priority in terms of reduced fuel costs, greater operating efficiency or improved services. For example, management has not prepared a ”pro forma” assessment of what retail prices will be when these improvements materialize nor do they have a sound understanding, except for possibly the conversion to propane project, when and by how much rates will decline over the next several years. The following graph is illustrative only and does not represent real forecasts, but does demonstrate what WAPA and its stakeholders can expect as each high priority project is implemented.
Management Audit of VIWAPA – Final Report
February 10, 2015
Page 36
Exhibit III-4 Illustrative Example of Projected Electric Rates
STRATEGIC PLANNING HISTORY
III-F1 It is not apparent that the 2002 plan was ever used to develop budgets, direct
capital investments or focus the company on its most critical issues.
The 2002 Strategic Plan which was managed by WAPA staff, but supported by a professional consultant was actually a fairly well written and comprehensive assessment of WAPA’s situation at that time. As WAPA’s first comprehensive strategic plan it identified four specific strategic goals:
Improve the Authority’s financial condition by reducing receivables and operating
expenses and by increasing its revenue-producing potential.
Bring about conditions to craft a positive public image and to improve customer
perceptions of the Authority’s product and service quality.
Develop a corporate culture that fosters employee stability and productivity.
Develop a proactive style of management within the Authority.
The fourth goal also set forth the following strategy:
Develop the methodology and discipline to produce competent business and system plans and incorporate integrated business and systems planning into the day-to-day culture of WAPA.
From this first comprehensive plan prepared over 12 years ago, WAPA management has failed in nearly every respect to achieve the four goals, as well as, its own sound strategic advice.
Management Audit of VIWAPA – Final Report
February 10, 2015
Page 37
The 2010 strategic planning process never produced a strategic plan. Furthermore, it was not driven by a changed management culture or WAPA’s own executive management team. Instead, the planning process was performed by teams of WAPA lower management staff and at the request of one of WAPA’s Board members. No outside consultant was identified. The full Board never reviewed nor considered the 2010 plan.
Referring back to the 2002 plan’s four strategic goals, they represent exactly the same condition or situation that WAPA is in today, except the crisis is worse. Accounts receivable continues to be an albatross for WAPA. It has impacted its credit ratings, access to capital resources, ability to fund necessary maintenance and replace antiquated or obsolete equipment. Operating expenses have increased significantly following the closure of the HOVENSA refinery and the extended outages associated by base load generation. A death spiral effect has begun to impact WAPA’s cost of service as sales and revenues decline due to higher prices, a loss of confidence in WAPA by its stakeholders and emerging competitive alternatives to WAPA itself. This theoretical death spiral results in increases in the bus bar cost per kWh as more fixed costs need to be recovered from a smaller base of sales, units are operated in an inefficient manner, maintenance is either deferred resulting in outages due to failures or nonexistent rolling reserves.
Vantage was recently informed by WAPA that its Board has directed it to initiate another strategic planning process. While the 2002 plan identified four specific strategic goals, we would expect that the 2015 strategic plan would list several additional concerns that need to be remedied which might include:
WAPA’s system wide peak load has declined from a 128,647 MW in 2011 to its
current level of 105,846 MW for FY 2104, an 18% drop over three years. Similarly
minimum load dropped from 67,386 MW to 57,301, or a decrease of 15%. WAPA’s
capacity to schedule generation in a cost effective manner has been severely
compromised for two reasons:
o The capacity of the existing generators is too large to economically operate
and smaller less efficient generation is routinely operated.
o The fleet of combined cycle generation, which is fairly efficient when
operated in the combined cycle mode, can only be run in an inefficient,
simple cycle mode when load conditions are low.
WAPA is required to purchase back a certain amount of electricity produced by
consumer’s using their solar and wind generation systems. WAPA must
compensate the consumers at the same price they would have paid WAPA if they
were purchasing electricity for themselves. This concept is called “net metering” and
is intended to stimulate investment in renewable resources by offering consumers
the opportunity to sell back any surplus electricity its own system produces. The
intended effect is also to help the utility avoid the need to invest in additional
electric generation. For WAPA, however, with its load declining, net metering can
Management Audit of VIWAPA – Final Report
February 10, 2015
Page 38
have a counterintuitive impact as WAPA cuts back production during peak period
when it should be operating its plants in the more efficient combined cycle mode.
(Our analysis of load fluctuations from day to night and over weekends shows that
WAPA must shut down its Heat Recovery Steam Generators, (HRSG) which utilize
waste heat and produce, “almost free” power.)
As WAPA’s business shrinks, it has not effectuated a corresponding reduction in its
labor force. For example, for WAPA’s water business, it has outsourced the
desalination process to Seven Seas in both St. Thomas/St. Johns and St. Croix, but
has yet to fully reduce its labor force to reflect reduced responsibilities and changing
staffing requirements.
The 2002 strategic plan did produce a capital budget which,, in general terms reflected the level of investment WAPA would need to make to achieve its four stated goals. However, there is no evidence that these goals were ever incorporated into the budgetary process such that specific tasks would be properly funded, that responsibility to perform those task were specifically assigned, and that metrics were established which provided management with ongoing feedback as to actual versus budgeted costs, accomplishment of stated tasks and ultimate performance in meeting the objectives for each strategic goal.
While the 2002 Strategic Plan was viewed as a “good start”, it was lacking in three specific areas:
The plan failed to evaluate the risk to WAPA should it fail to accomplish each goal.
There did not appear to be any cost/benefit analysis which would have assisted
management in assigning budget levels and resource commitments to achieve the
goal.
The plan failed to prioritize each goal based on their positive or negative impact on
the organization. As presented in the 2002 plan, each goal seemed to have the same
degree of priority.
There were no progress reports to document and track progress on the
implementation of the Action Plans developed for each strategic goal.
Without a prioritization process, it is difficult for management to focus on its most critical tasks without falling into a crisis management mode such that the most pressing issues drive the most attention from management.
III-R1 Implement a comprehensive strategic planning process with fixed timing for updates, prioritization of initiatives, input from all stakeholders and which should be led by a full time, mid to senior level manager, with the use of outside expertise to facilitate. (Priority: High)
Prepare a new strategic plan by mid-2015. While management has indicated its plan to update the strategic plan by mid-2015, Vantage re-iterates our concern that the strategic planning
Management Audit of VIWAPA – Final Report
February 10, 2015
Page 39
process needs to become institutionalized as an ongoing process of continuous improvement and risk management. Furthermore, annual strategic planning updates should become the prelude to the capital and expense budgeting and resource planning processes.
Assign full time responsibility for the management of the planning process and performance monitoring for the 2014 -2015 Strategic Plan. As far back as the 1996 Stone and Webster Management Audit and the 2002 Strategic Plan, there were recommendations that WAPA change its culture as to the way it plans and manages for the future. As a first step in this change process, we are recommending that strategic planning becomes institutionalized by allocated resources and assigning full time responsibility for strategic planning. This responsibility should extend well beyond the administration of the annual planning process, and include:
Coordination with budget and finance to assure that each strategic goal is properly funded.
Assure that metrics are in place to monitor and control performance.
To routinely report performance and non-compliance to executive management and the Board the strategic planning objectives.
o For high priority initiatives reporting should be at a minimum monthly.
o Significant deviations from the plan’s objectives will necessitate a remedial
action plan.
o Document in the budget process how individual major expenditures, capital
improvements, and proposed staffing further the goals of the strategic plan.
Assign a mid to senior level manager to be the project manager and champion for each strategic objective identified in the strategic plan. It can be assumed that if an issue, whether viewed as a threat or opportunity for WAPA, is defined as a strategic goal, a manager will be assigned responsibility to manage all activities associated with its implementation and performance. Generally, the higher the priority the greater the need for a higher level of management oversight. This manager will work with the Strategic Planning manager to assure compliance to the established program and expected performance.
Develop a process to rationally assign a priority ranking for all initiatives. Based on Vantage’s discussions with management, the Board and various stakeholders, it is likely that the 2014/2015 Strategic Plan will identify more than four strategic goals with ranging priority. As a means to differentiate the resource commitment among these objectives as conditions and events change, the Priority Ranking process will help management avoid a crisis management or knee-jerk reaction to emerging issues without assessing its impact on the strategic objectives. There are numerous ways to assign priority including both quantitative and qualitative assessment. While it is an inexact “science”, the process by which risk probability and impact is derived helps management to consider, communicate and act upon each strategic goal in a rational manner.
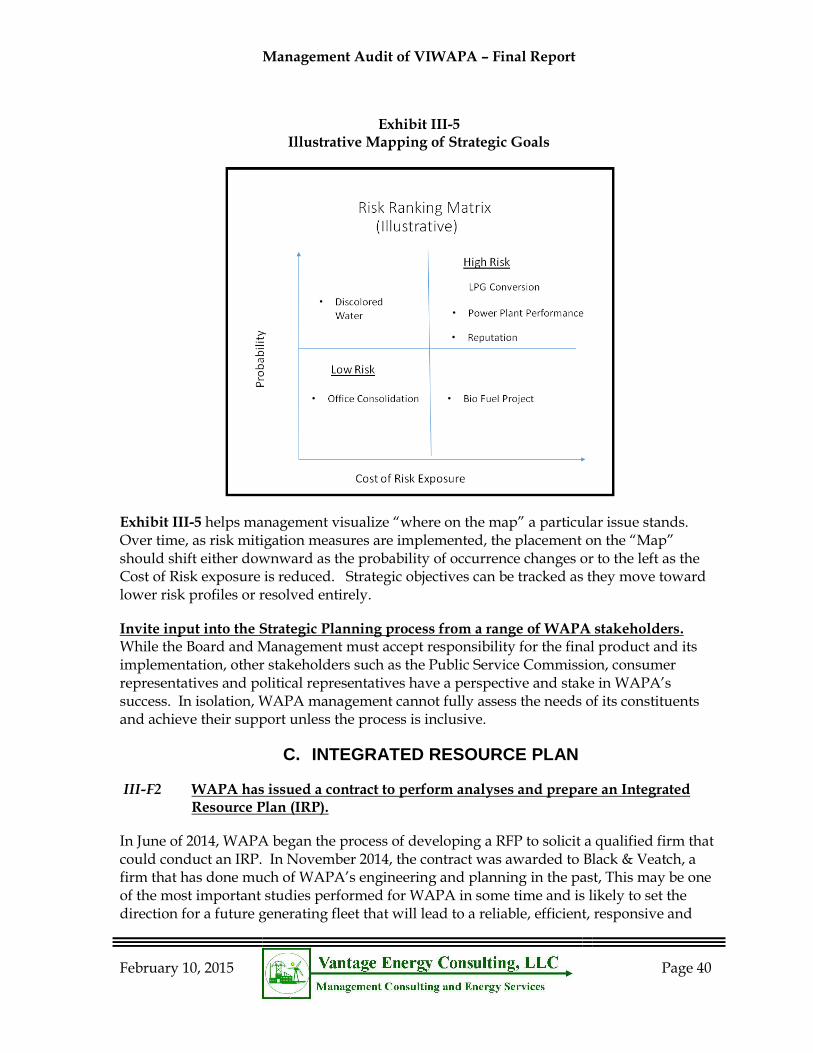
Management Audit of VIWAPA – Final Report
February 10, 2015
Page 40
Exhibit III-5 Illustrative Mapping of Strategic Goals
Exhibit III-5 helps management visualize “where on the map” a particular issue stands. Over time, as risk mitigation measures are implemented, the placement on the “Map” should shift either downward as the probability of occurrence changes or to the left as the Cost of Risk exposure is reduced. Strategic objectives can be tracked as they move toward lower risk profiles or resolved entirely.
Invite input into the Strategic Planning process from a range of WAPA stakeholders. While the Board and Management must accept responsibility for the final product and its implementation, other stakeholders such as the Public Service Commission, consumer representatives and political representatives have a perspective and stake in WAPA’s success. In isolation, WAPA management cannot fully assess the needs of its constituents and achieve their support unless the process is inclusive.
C. INTEGRATED RESOURCE PLAN
III-F2 WAPA has issued a contract to perform analyses and prepare an Integrated Resource Plan (IRP).
In June of 2014, WAPA began the process of developing a RFP to solicit a qualified firm that could conduct an IRP. In November 2014, the contract was awarded to Black & Veatch, a firm that has done much of WAPA’s engineering and planning in the past, This may be one of the most important studies performed for WAPA in some time and is likely to set the direction for a future generating fleet that will lead to a reliable, efficient, responsive and
Management Audit of VIWAPA – Final Report
February 10, 2015
Page 41
environmentally superior generation portfolio. While the conversion to LPG is significant and will reduce fuel costs, what WAPA really needs is a generating fleet that resolves all of the concerns and complaints that it has had to deal with over the past decade or more.
What does an IRP provide?
The answer to this question is at the heart of the project. The RFP for the IRP that was developed in June 2014 lists all of the general areas of analysis. However, we believe it needs to be more direct in instructing the consultant to look at all feasible options for meeting a wide range of scenarios. Currently the RFP requires, with our comments includes the following:
A 20 year IRP that addresses all generation supply on St. Thomas and St. Croix. (Vantage comment: This is appropriate timeframe. STT and STX should have separate plans.)
A thorough examination of WAPA's electrical system, including detailed energy and demand forecasts, an assessment of WAPA's current generating facilities and their potential retirements, and a rigorous evaluation of potential future resource additions to the WAPA system.
A detailed avoided capacity and energy cost projections associated with the recommended resource plan, which will be based on the size, technology, and timing of the resource additions identified.
A requirement that input from both internal and external stakeholders be included in an open and transparent communications process. (Vantage comment: This is appropriate.)
A load forecasting analysis that includes DSM and load shapes. (Vantage comment: This is appropriate.)
Fuel forecasting that considers the modifications WAPA is undergoing to burn LPG, and a relatively small amount of diesel fuel for startup, testing, and emergency purposes, as well as the long term possibility of converting to natural gas.
The IRP states, in general, that potential resources should include all known, feasible, and otherwise reasonable options for meeting WAPA's future energy and conservation needs.
Management Audit of VIWAPA – Final Report
February 10, 2015
Page 42
The IRP should consider energy storage as an alternative as well. There are new solutions on the horizon that may be cost effective for WAPA given both its cost structure and the limited amount of rolling reserves it can efficiently operate.9
The IRP should include both feasibility and cost estimates of potential resources.
The IRP must utilize Production Cost modeling that includes scenario planning, using a modeling platform and methodologies appropriate for island utilities. It further requires that there be a description of a long term, detailed forecasts of expected system costs associated with various potential resource portfolios.
An additional required output of the IRP is detailed avoided capacity and energy cost projections associated with the recommended portfolio, which will be based on
the size, technology, and timing of the potential resource additions identified.
Since the completion of the draft report in September 2014, the IRP Request For Proposal has been issued and a contract has been awarded. Vantage reviewed the RFP and found, that the scope section adequately addresses all of the areas that should be included in an IRP designed specifically for WAPA. The major scope items in the RFP include:
Stakeholder engagement o Internal and external stakeholders
o Communications
Load forecasting o DSM evaluation
o Load shapes
Fuel forecasting
o Though the VIWAPA system is undergoing modifications to burn LPG, it is
anticipated that a relatively small amount of diesel fuel will continue to be
burned for startup, testing, and emergency purposes
o Natural Gas
Potential Resources o All known, feasible, and otherwise reasonable options for meeting
VIWAPA's future energy and conservation needs o Feasibility and cost estimates of potential resources
Production Cost modeling
9 / NEC Energy Solutions to install energy storage system in California. The program will explore how energy
storage can support distribution circuits in the utility's diverse service territory. During the program, the GSS will
not only be used to limit loading of the line under dynamic load scenarios, but also be capable of providing
voltage regulation. http://www.renewableenergyfocus.com/view/39883/nec-energy-solutions-to-install-energy-
storage-system-in-california/#.VAg1c1CZgGM.email
Management Audit of VIWAPA – Final Report
February 10, 2015
Page 43
o Scenario planning
o Description of modeling platform and methodologies appropriate for island utilities
o VIWAPA requires long term, detailed forecasts of expected system costs associated with various potential resource portfolio
o An additional required output of the IRP is detailed avoided capacity and energy cost projections associated with the recommended portfolio, which will be based on the size, technology, and timing of the potential resource additions identified.
III-F3 Accurate information on the potential heat rate and turn down potential of the existing units does exist.
One of the problems that all parties have had to deal with, are the actual expectations of the existing fleet. What heat rate should each unit, as a simple cycle CT or combined cycle unit operate at? What are realistic ranges of output, or turn-down-ratios? Data analysis only portrays a system that is being run inefficiently, with historic heat rates in the 13,000 bTu/kWh to 15,000 bTu/kWh range. The VIPSC consultants insist the numbers should be lower and base LEAC rates on lower than historic expectations. WAPA has overly optimistic expectations as to what heat rates will be when and if they ever get everything working. The bottom line is that without baseline data on each unit, no one really has an accurate number to use in the IRP.
There are guidelines for performance testing that most utilities run on a regular basis or after major overhauls. The following American Society of Mechanical Engineers (ASME) performance test on each gas turbine, HRSG and steam turbine to establish a base-line heat balance and performance profile to support the dispatch ranking of each unit:
Gas Turbines – ASME Gas Turbine Performance Test Code PTC 22
HRSG - ASME HRSG Performance Test Code PTC 4.4
Steam Turbine - ASME Steam Turbine Performance Test Code PTC 6.6
III-R2 Complete the IRP as defined, assuring input and oversight by both internal and external personnel, in order to assure that the results meet all needs of WAPA as defined in the original IRP proposal. Prior to, or in conjunction with the independent IRP complete American Society of Mechanical Engineers (ASME) performance test on each gas turbine, HRSG and steam turbine to determine baseline heat rates and turndown. (Priority: High)
As stated above, we applaud the move to a comprehensive IRP. However we believe it must include the following analysis to assure that it meets the needs of the Virgin Islands.
Management Audit of VIWAPA – Final Report
February 10, 2015
Page 44
Vantage also raises the concern that the current contract amount may not be adequate to conduct a comprehensive IRP.
New generating units, of all sizes, that are not currently being used by WAPA should be considered. This includes Reciprocating Internal Combustion Engines (RICE) of sizes between 5MW and 25MW.
Consideration to replacing all non-optimum, generating units should be considered irrespective of “stranded cost” concerns.
Consider newly emerging storage systems, such as Lithium Storage systems which can cost on the order of $1,000 per KW.10
The potential savings in fuel, LPG or LNG, should be considered through the replacement of the fleet with RICE engines or other technology.
The flexibility to accept all renewable sources, through a reasonable net metering program that currently exists, by using quick start, reliable technologies.
Include discussions and informal buy-in from the PSC, the legislature and the EPA as part of the data collection and analysis process in order to assure that an optimum solution is not ignored because of outdated policies. Each party has a specified regulatory or legal responsibility in assuring the best outcomes.
Consider alternate sites for new technologies, particularly on St. Croix where the current station is on one end of the island. Specifically, either this IRP or follow-up analysis related to system integrity should address a more diverse geographic location for new units.
Complete the following American Society of Mechanical Engineers (ASME) performance test on each gas turbine, HRSG and steam turbine to establish a base-line heat balance and performance profile to support the dispatch ranking of each unit:
o Gas Turbines – ASME Gas Turbine Performance Test Code PTC 22 o HRSG - ASME HRSG Performance Test Code PTC 4.4 o Steam Turbine - ASME Steam Turbine Performance Test Code PTC 6.6
10 / Activity in this area of battery storage is improving. A recent development can be found at http://www.renewableenergyfocus.com/view/39883/nec-energy-solutions-to-install-energy-storage-system-in-california/#.VAg1c1CZgGM.email and a good resource to review is IRENA’s “Electrify Storage and Renewables for Island Power – A Guide For Decision Makers”
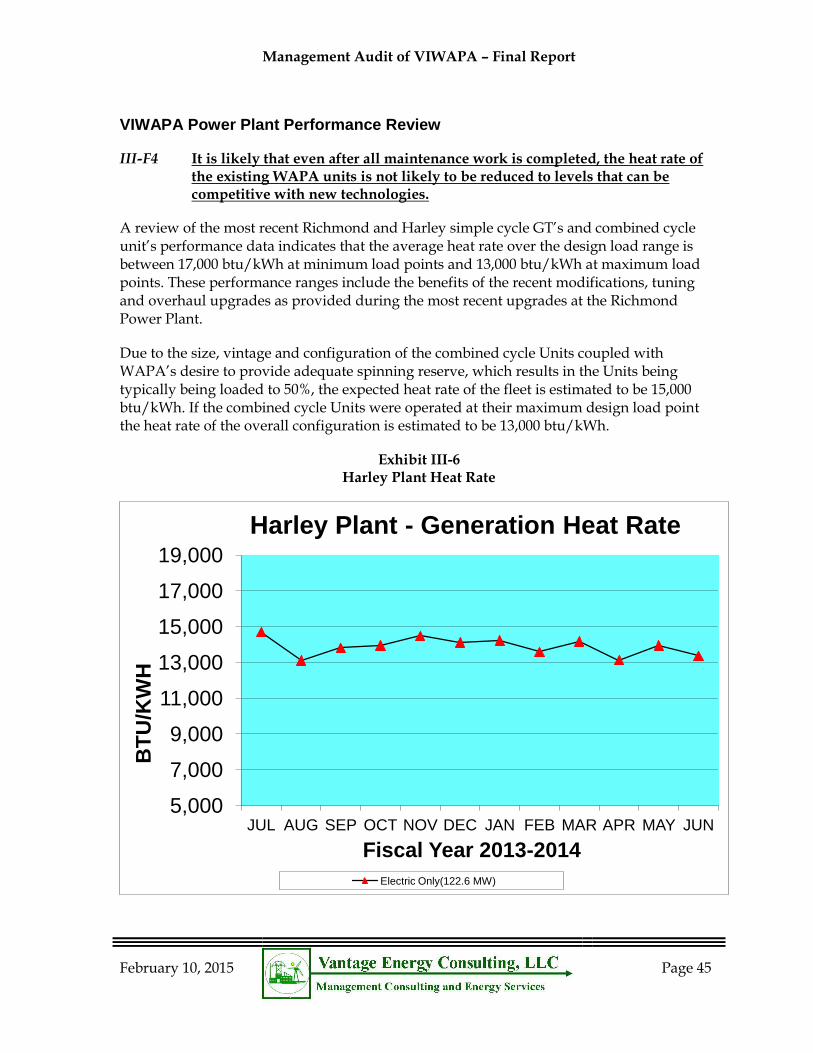
Management Audit of VIWAPA – Final Report
February 10, 2015
Page 45
VIWAPA Power Plant Performance Review
III-F4 It is likely that even after all maintenance work is completed, the heat rate of the existing WAPA units is not likely to be reduced to levels that can be competitive with new technologies.
A review of the most recent Richmond and Harley simple cycle GT’s and combined cycle unit’s performance data indicates that the average heat rate over the design load range is between 17,000 btu/kWh at minimum load points and 13,000 btu/kWh at maximum load points. These performance ranges include the benefits of the recent modifications, tuning and overhaul upgrades as provided during the most recent upgrades at the Richmond Power Plant.
Due to the size, vintage and configuration of the combined cycle Units coupled with WAPA’s desire to provide adequate spinning reserve, which results in the Units being typically being loaded to 50%, the expected heat rate of the fleet is estimated to be 15,000 btu/kWh. If the combined cycle Units were operated at their maximum design load point the heat rate of the overall configuration is estimated to be 13,000 btu/kWh.
Exhibit III-6 Harley Plant Heat Rate
5,000
7,000
9,000
11,000
13,000
15,000
17,000
19,000
JUL AUG SEP OCT NOV DEC JAN FEB MAR APR MAY JUN
BT
U/K
WH
Fiscal Year 2013-2014
Harley Plant - Generation Heat Rate
Electric Only(122.6 MW)
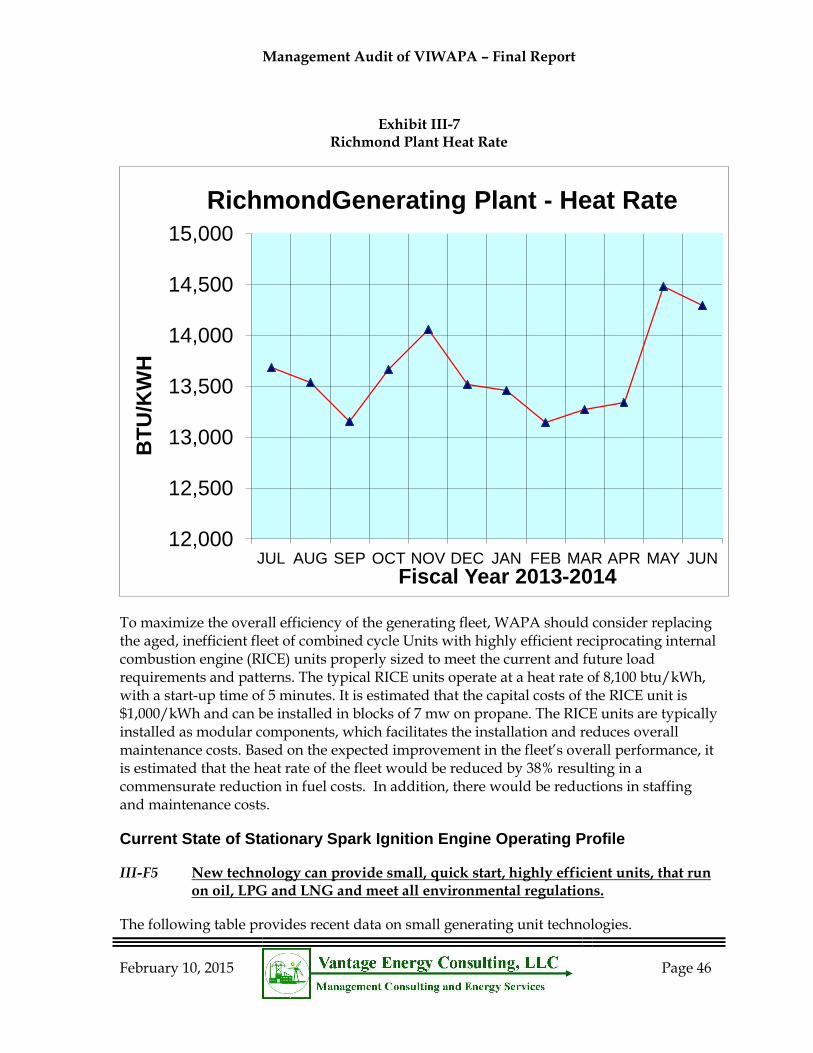
Management Audit of VIWAPA – Final Report
February 10, 2015
Page 46
Exhibit III-7 Richmond Plant Heat Rate
To maximize the overall efficiency of the generating fleet, WAPA should consider replacing the aged, inefficient fleet of combined cycle Units with highly efficient reciprocating internal combustion engine (RICE) units properly sized to meet the current and future load requirements and patterns. The typical RICE units operate at a heat rate of 8,100 btu/kWh, with a start-up time of 5 minutes. It is estimated that the capital costs of the RICE unit is $1,000/kWh and can be installed in blocks of 7 mw on propane. The RICE units are typically installed as modular components, which facilitates the installation and reduces overall maintenance costs. Based on the expected improvement in the fleet’s overall performance, it is estimated that the heat rate of the fleet would be reduced by 38% resulting in a commensurate reduction in fuel costs. In addition, there would be reductions in staffing and maintenance costs.
Current State of Stationary Spark Ignition Engine Operating Profile
III-F5 New technology can provide small, quick start, highly efficient units, that run on oil, LPG and LNG and meet all environmental regulations.
The following table provides recent data on small generating unit technologies.
12,000
12,500
13,000
13,500
14,000
14,500
15,000
JUL AUG SEP OCT NOV DEC JAN FEB MAR APR MAY JUN
BT
U/K
WH
Fiscal Year 2013-2014
RichmondGenerating Plant - Heat Rate
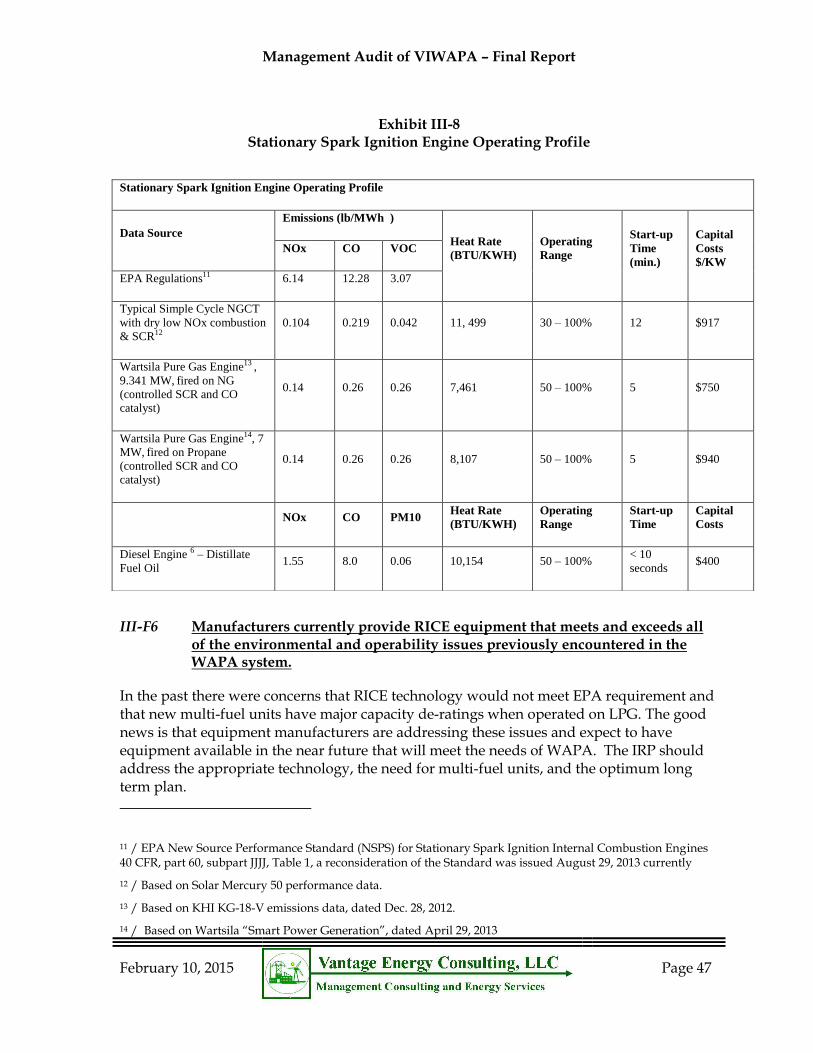
Management Audit of VIWAPA – Final Report
February 10, 2015
Page 47
Exhibit III-8 Stationary Spark Ignition Engine Operating Profile
III-F6 Manufacturers currently provide RICE equipment that meets and exceeds all of the environmental and operability issues previously encountered in the WAPA system.
In the past there were concerns that RICE technology would not meet EPA requirement and that new multi-fuel units have major capacity de-ratings when operated on LPG. The good news is that equipment manufacturers are addressing these issues and expect to have equipment available in the near future that will meet the needs of WAPA. The IRP should address the appropriate technology, the need for multi-fuel units, and the optimum long term plan.
11 / EPA New Source Performance Standard (NSPS) for Stationary Spark Ignition Internal Combustion Engines 40 CFR, part 60, subpart JJJJ, Table 1, a reconsideration of the Standard was issued August 29, 2013 currently
12 / Based on Solar Mercury 50 performance data.
13 / Based on KHI KG-18-V emissions data, dated Dec. 28, 2012.
14 / Based on Wartsila “Smart Power Generation”, dated April 29, 2013
Stationary Spark Ignition Engine Operating Profile
Data Source
Emissions (lb/MWh )
Heat Rate
(BTU/KWH)
Operating
Range
Start-up
Time
(min.)
Capital
Costs
$/KW
NOx CO VOC
EPA Regulations11 6.14 12.28 3.07
Typical Simple Cycle NGCT
with dry low NOx combustion
& SCR12
0.104 0.219 0.042 11, 499 30 – 100% 12 $917
Wartsila Pure Gas Engine13 ,
9.341 MW, fired on NG
(controlled SCR and CO
catalyst)
0.14 0.26 0.26 7,461 50 – 100% 5 $750
Wartsila Pure Gas Engine14, 7
MW, fired on Propane
(controlled SCR and CO
catalyst)
0.14 0.26 0.26 8,107 50 – 100% 5 $940
NOx CO PM10
Heat Rate
(BTU/KWH)
Operating
Range
Start-up
Time
Capital
Costs
Diesel Engine 6 – Distillate
Fuel Oil 1.55 8.0 0.06 10,154 50 – 100%
< 10
seconds $400
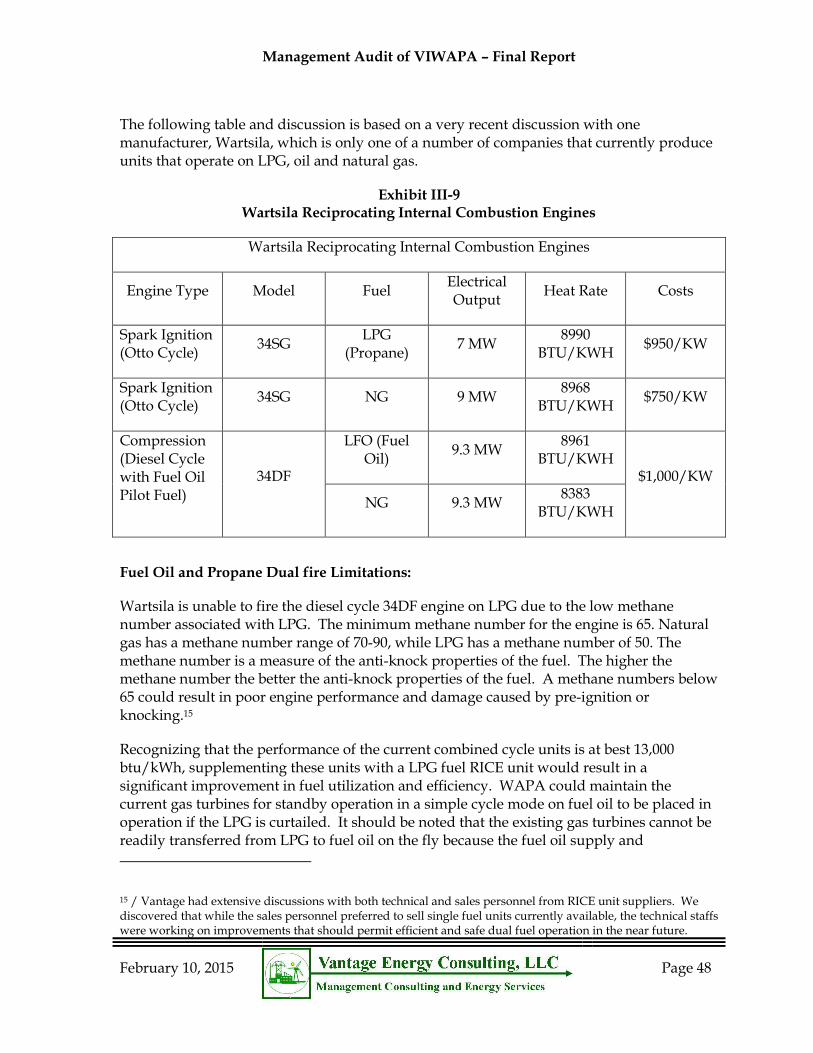
Management Audit of VIWAPA – Final Report
February 10, 2015
Page 48
The following table and discussion is based on a very recent discussion with one manufacturer, Wartsila, which is only one of a number of companies that currently produce units that operate on LPG, oil and natural gas.
Exhibit III-9 Wartsila Reciprocating Internal Combustion Engines
Wartsila Reciprocating Internal Combustion Engines
Engine Type Model Fuel Electrical Output
Heat Rate Costs
Spark Ignition (Otto Cycle)
34SG LPG
(Propane) 7 MW
8990 BTU/KWH
$950/KW
Spark Ignition (Otto Cycle)
34SG NG 9 MW 8968
BTU/KWH $750/KW
Compression (Diesel Cycle with Fuel Oil Pilot Fuel)
34DF
LFO (Fuel Oil)
9.3 MW 8961
BTU/KWH $1,000/KW
NG 9.3 MW 8383
BTU/KWH
Fuel Oil and Propane Dual fire Limitations:
Wartsila is unable to fire the diesel cycle 34DF engine on LPG due to the low methane number associated with LPG. The minimum methane number for the engine is 65. Natural gas has a methane number range of 70-90, while LPG has a methane number of 50. The methane number is a measure of the anti-knock properties of the fuel. The higher the methane number the better the anti-knock properties of the fuel. A methane numbers below 65 could result in poor engine performance and damage caused by pre-ignition or knocking.15
Recognizing that the performance of the current combined cycle units is at best 13,000 btu/kWh, supplementing these units with a LPG fuel RICE unit would result in a significant improvement in fuel utilization and efficiency. WAPA could maintain the current gas turbines for standby operation in a simple cycle mode on fuel oil to be placed in operation if the LPG is curtailed. It should be noted that the existing gas turbines cannot be readily transferred from LPG to fuel oil on the fly because the fuel oil supply and
15 / Vantage had extensive discussions with both technical and sales personnel from RICE unit suppliers. We discovered that while the sales personnel preferred to sell single fuel units currently available, the technical staffs were working on improvements that should permit efficient and safe dual fuel operation in the near future.
Management Audit of VIWAPA – Final Report
February 10, 2015
Page 49
combustion air systems are typically unreliable when operated as a standby fuel. Also if the RICE units are utilized the need for ultra-pure water would be eliminated. Finally, one needs to understand that while multi-fuel flexibility may be desired, well over 90% of all generating units in the USA operate a single fuel units.
Analysis of the Independent Advisory Contractor (IAC) Concept
III-F7 Vantage analysis of the proposed Independent Advisory Contractor (IAC) initiative concludes that it is not the best alternative at this time.
Vantage analyzed the Independent Advisory Contractor (IAC) initiative that was proposed in the last rate case and stipulated as part of a settlement to that rate case, as well as a number of documents that described a similar approach in Guam. More importantly, Vantage has interviewed almost all plant management, analyzed maintenance, outage equipment failure, records of, ages and applicability of unit components and plans for future upgrades. We have reviewed historical heat rates, forced outage rates and other performance data that provides a statistical and non-biased view of the strengths and weaknesses of the WAPA system, policies and procedures, craft, supervisory and management capabilities and the future challenges WAPA is likely to face. Simply stated, we were contracted to perform an independent assessment of WAPA, the first such assessment since the mid-90’s and our conclusions are based on this analysis. The issue of power generation is rightfully a contentious issue. While it can be that WAPA has demonstrated poor judge in its selection of technology in the past, that is not completely fair. Could anyone have predicted the shutdown of the refinery or the surge in renewables and distributed generation that has led to today’s conundrum? Our only objective now is to provide insight based on our analysis and experience that will provide a path forward.
WAPA has competent management team at the plant level and a workforce that is trained and capable. It has the tools to operate the appropriate equipment. What it does not have is a generating fleet that can run effectively and efficiently under today’s requirements. The WAPA generating units are generally too large, include HRSGs that are not well matched, and low pressure steam turbines that are old. The use of an aero-derivative gas turbine for base load operation is also problematic. The net result is that WAPA has an inefficient fleet that is unable to properly respond to the changing mix of load requirements on the two systems that now include significant conservation, and renewables.
We disagree with the application of the IAC at WAPA for a number of reasons. The IAC, although well intentioned will not incent the WAPA leadership team to take the full accountability to effectively operate and maintain the power plants. In addition the structure of the current WAPA generating facilities does not meet the current load demand requirements. It is anticipated that even the best IAC provider would be unable to efficiently and reliably operate the current fleet of CC generation. Also the IAC will not guarantee success. As witnessed in Guam the Cabras Unit 1 steam turbine which experienced a major catastrophic failure of the LP turbine in 2004, shortly after a PMC supervised turbine overhaul in 2003.
Management Audit of VIWAPA – Final Report
February 10, 2015
Page 50
Despite all we state above, if WAPA management and the Governing Board do not make the changes necessary at the senior management level and modify the fleet such that it can operate in today’s environment, either an IAC with broad discretion to operate or the sale to an Independent Power Producer may be warranted.
As an option WAPA could issue an RFP to an internationally recognized IPP for new RICE units, which would include a PPA and rely on the IPP to operate and maintain the new generation. WAPA could then concentrate on the power delivery process. This should be an integral part of the WAPA IRP.
Power Plant Maintenance Tool and Monitoring Systems
In recent years WAPA has invested in a number of tools, control systems, software programs and other items that will assist the operators, maintenance personnel and management of the plants.
New Digital Control System (DCS)
New Baldor Automatic Voltage Regulator (AVR) systems on all generators
New GE Mark VI Turbine Control System for the 2 steam turbines
SCADA interface with new controls in the main control room
Maximo Maintenance Management System
Automated Predicative Maintenance (PDM) system and major equipment condition monitoring system
Refurbishment and Overhaul of the Fleet
WAPA has recently completed or is in the process of completing a refurbishment of the Richmond and Harley power plants to include the following major projects:
Richmond Plant
All turbines have been recently overhauled.
Both HRSG’s have been overhauled and upgraded.
New exciters on the steam turbine generators.
New VFD for the Raw Water Pumps.
New VFD for the Condensate Pumps.
New 34.5KV and 15KV switchgear.
New storm hardened substation.
New underground cables to the GSU’s.
Modify all CT’s to fire either propane or fuel oil.
The Maximo MMS maintenance management system.
Harley Plant
Replace the failed Pratt & Whitney CT with a refurbished GE LM2500.
Management Audit of VIWAPA – Final Report
February 10, 2015
Page 51
Remove the leased GE LM2500 CT that is currently operating as Unit 25.
Remove the oil fired boilers 11 & 13 that will result in an elimination of #6 fuel oil systems.
Install a surplus HRSG 6B with duct burners to recapture heat from CT 22 and CT23. This will provide steam to either steam turbine ST 11 or ST 13.
All turbines to be overhauled.
Modify the existing HRSG to remove the LP section, expand the SH section.
Remove the 1 & 2 IDE desalination systems.
Upgrade the DCS.
Add a new Emerson Vibration Monitoring and condition monitoring system.
Add the Maximo MMS.
Upgrade the DCS.
A new Emerson Vibration Monitoring and condition monitoring system.
The Maximo MMS maintenance management system.
A new GE EX2100 AVR systems on all generators.
Modify all CT’s to fire either propane of fuel oil.
New Generating Units
WAPA is currently installing a new Unit 24 at Harley and the plan for a new 10 MW unit at Richmond in order to improve dispatch flexibility, rolling reserve requirements, and heat rate. If future funds are used for additional high efficiency, new generating units, ultimately a modern fleet devoid of the old steam turbine systems will be in place and WAPA’s management will be in a better position to operate the systems efficiently and effectively.
III-F8 The retention of a spare IDE at the Harley Station does not appear to make economic or operational sense.
WAPA decided to keep one string of IDE at Harley after the Seven Seas’ RO plant went on line as backup. We are not sure this makes sense for a number of reasons. First, there were about eight operators trained and assigned to water operations. Some continued retention and training of these personnel would be needed. Second, there might not be a ready source of steam for the unit. Third, the standby IDE would need to be operated periodically, with associated maintenance. Finally, the space it occupies could be better utilized for other activities. If the concern is that the new RO units are subject to tropical flooding, then they should be hardened to the degree possible. As part of the recommendation below, WAPA should analyze the true value of keeping the backup IDE versus removal for the reasons stated above.
A simple study should look at:
Staffing savings.
Backup operating and maintenance costs.
Availability of steam source based on IRP results.
Management Audit of VIWAPA – Final Report
February 10, 2015
Page 52
Value of land for other uses.
Potential of tropical surge damage to new RO plant and mitigation options and costs.
How do the IDE units further the goals of the strategic plan and are there less expensive alternatives.
While savings cannot be easily estimated, they would likely be between $1 million and $2 million per year.
HEAT RATE SAVINGS ANALYSIS
III-F9 A simple analysis demonstrates the basic economics of converting to LPG and replacing some or all of the current generating fleet with high efficiency technologies.
In order to demonstrate what might occur in the IRP if a broad change out of new technologies occurs, we provide the following example. For our analysis, let’s assume the following:
In fiscal year 2014, WAPA purchased about $225.0 Million in fuel from Trafigura AG.
A conservative reduction in cost due to the conversion to LPG of 30% to 45% will reduce fuel cost by $67.5 to $101 million. (While fuel prices are currently lower than even six months ago, these levels cannot be guaranteed and the percent reduction remains the same.)
Assume that the combined heat rate for the existing WAPA fleet is likely to stay at or above 12,500 BTU/kWh if no major changes are made. We would suggest that hopes to get to lower levels are probably not realistic due to a number of factors that are discussed later.
Assume that the RICE units would achieve a heat rate of 8,500 BTU/kWh. (We would note, that larger (20-30MW), low speed RICE units can achieve heat rates of 7,000 BTU/kWh.)
Based on a reduction from 12,500 BTU/kWh to 8,500 BTU/kWh, we can expect an additional 32% reduction in fuel costs which would amount to $50.4 million.
Given that the cost per MW of RICE units is less than $1 million, the payback for adding 100 megawatts in new generation is less than three years.
The purchase of these new units could be done through the use of future revenues, grants, and an increase in base rates. (Note the monetized cost of 100 MW of new generation would be about $6 million per year, this is offset by reduced fuel costs.)
Management Audit of VIWAPA – Final Report
February 10, 2015
Page 53
In 2014, the total operating budget was $371 million. If one were to reduce this by the fuel cost savings of LPG ($67.5 M) and the heat rate savings from improved heat rates ($50.4 M), while increasing debt by $6 million, the total cost of operations would now be $259 million. This amounts to over a 30% decrease in rates.
There are other benefits associated with a change to smaller more flexible units:
o With smaller units, operating during low load periods, the amount of rotating reserve needed to respond to a single contingency trip will be much smaller.
o The ability to operate the system at very low loads with good system stability will enable increased use of renewables.
This simplistic analysis is only intended to show what might occur if the IRP truly considers all alternate scenarios.
III-R3 Redevelop the generation fleet so as to meet four key objectives; (1) reliability as measured by Equivalent Forced Outage Rate (EFOR) and availability; (2) efficiency as measured by heat rate (BTU/KWH); (3) operational effectiveness as measured by optimal staffing, reasonable non-fuel O&M budget and comprehensive reporting and monitoring, and (4) organizational effectiveness through the retention of an experienced, senior officer to lead the changes. (Priority: High)
This is the most significant and broadest recommendation in this report. It provides the mechanism for moving WAPA forward, shedding itself of past mistakes and developing a generating infrastructure that readily adopts to the changes being driven by conservation, renewables, and alternate fuel supplies.
The implementation of this recommendation starts with the strategic plan. A clear understanding, endorsed by the Governing Board, the VIPSC and the new government must drive the impetus for the changes. The IRP must be the technical backbone of the endeavor, providing details on technology, unit sizing and implementation economics.
A new senior manager is a necessity. Someone who has experience with a broad range of technologies, the management of new unit installation and who is not burdened by past decisions.
III-F6 WAPA does not have a formal process for completing a root cause analysis and tracking availability detractors at the Richmond and Harley power plants.
Vantage conducted interviews with the Richmond and Harley power plant management and results team members and requested records regarding unit forced outages and associated equipment problems. We learned that they are recorded and tracked manually on individual non-integrated spreadsheets with limited ability to identify and track trends or reoccurrences. Our conclusion is that the root cause analysis that is completed is done on
Management Audit of VIWAPA – Final Report
February 10, 2015
Page 54
an informal basis with no formal record or attempt to determine the true underlying cause of the failure of forced outage.
The Authority responded by claiming that it conducts root cost analysis whenever there is an outage. It is protocol and expected by the CEO. While this may be true, our concern is that there is no formal attempt to develop data based analytics that can be used to make long term maintenance decisions. The expanded application of the Maximo Computerized Maintenance Management System would provide a platform for providing a consistent approach to root cause analysis.
III-R4 Develop a comprehensive Root Cause Analysis program that includes the identification, tracking and correction of the underlying cause of equipment problems and failures. (Priority: Medium)
A Root Cause Analysis program seeks to identify the origin of a problem. It uses a specific set of steps, with associated tools, such as a Maintenance Management System to find the primary cause of the problem, which typically includes:
Physical causes
Human causes
System or process causes
An effective Root Cause Analysis program considers all three types of causes. It involves investigating the patterns of negative effects, finding hidden flaws in the system, and discovering specific actions that contributed to the problem. This often means that RCA reveals more than one root cause. A typical Root Cause Analysis program includes the following six steps:
Define the problem.
Collect the data on the maintenance management system (Maximo).
Identify the causal factors (physical, human and/or system).
Identify the root cause.
Recommend and implement solution.
Track and communicate results.
The implementation of a Root Cause Analysis program will directly impact the reliability and availability of the Richmond and Harley units.
D. FINANCIAL PLANNING
Financial planning at WAPA is difficult at best and impossible at times. In order for financial planning to be successful, a number of things must occur. The Finance Department must have accurate and timely data on current sales, revenues, and collections.
Management Audit of VIWAPA – Final Report
February 10, 2015
Page 55
It must have a solid estimate of future costs, particularly those that drive overall results. Tariffs must make sense and be based on sound regulatory tenets; rates must be set based on accurate projections of costs and revenues. O&M Budgets must accurately reflect real expectations of expenses, including the ability to pay for regular expenses on a timely basis. Capital budgets should be developed based on the overall strategic plan, include a quantification that justifies the expenditure and a feedback mechanism that verifies that projected savings, improved operations, regulatory requirements or safety is, in fact, achieved.
In preparing this section of the report, it would have been easy to simply say that the current economic and operational crisis being experienced by WAPA makes financial planning next to impossible and that once the structural problems with costs, revenue, customer base and collections are resolved, a real look at the planning process can take place. However, in order to properly portray WAPA’s problems, a discussion of financial planning with all its problems is warranted.
This section will address a number of basic issues. These include:
The scope, accuracy and timeliness of financial and operational data collection;
the accuracy of the budgeting process given the uncertainty in WAPA’s markets, fuel cost volatility and customer sales elasticity;
the process and feedback associated with capital budgeting; and
finally the capability of the enterprise software used for collecting and managing financial information.
III-F10 The regular internal and external financial and operating statements that WAPA develops internally or through outside firms provide adequate and accurate data for management and the Board to make decisions.
There are a number of operational and financial reports that form the basis of WAPA’s reporting structure. These include:
The Monthly Financial Statements which include updates of electric and water
balance sheets, income statements, notes to financial statements, electric and water
production operating data by island, statements of cash flows, monthly variance
reports, accounts receivable data, electric and water system debt service coverage,
and a summary of all vendor payments exceeding $25,000 for the fiscal year.
St Thomas and St. Croix Monthly Production Reports which include a broad range
of detailed spreadsheets including: feeder outage data; production summary
information; unit heat rate data, unit availability and forced outage data; fuel
consumption and storage summaries; graphs of key data; and the comprehensive
data base.
Management Audit of VIWAPA – Final Report
February 10, 2015
Page 56
III-F11 The monthly variance report provides a very good picture of the actual-to-budget data for the month and the year to date.
This report shows the real problem at WAPA, that is, its inability to meet budget projects. Below is the Year End 2014 Electric and Water variance Reports. A close look at the Electric System Variance Report highlights the economic reality of WAPA better than any other document.
Net income was projected at $2.5 M and was actually a negative $9.7 M. Why did this occur?
Base electricity sales were $59.1 M versus a budget of $77.6 M, or 23.9% below budget amounts. While LEAC portion of $227.3 was $17.4 M lower to offset lower sales, it was only a decrease of 7.1%.
Were it not for Streetlight revenue which while still below cost, did increase from a budget of $1.6 M to $4.2 M, and the OPEB and maintenance surcharges which generated $3.0 M and $8.9 M respectively, the operating revenue would have missed the budget and be significantly more than the $122.3 M shown.
On the expense side, personnel costs were $38.8 M versus the budgeted $33.4 M, or 16% higher than budgeted. While some of this was due to payments for previous years, it was a serious blow to the income statement.
Other line items that impacted the operating expenses, include; major repairs of $10.2 M that were not anticipated; other professional services were $1.3 M above the budget.
Despite the lower operating revenue and related LEAC, Operating Expenses were only $1.1 M below the budgeted amount.
Net income before taxes amounted to (-$20.6) M and was only reduced due to the $2.4 M special items and $8.1 M contribution in aid/fuel tax income.
The Water System Variance Analysis shows a similar set of poor results.
Net income was projected at $11.3 M and was actually a $3.4 M.
Base water sales were $20.5 M versus a budget of $27.4 M, or 25.1% below budget amounts. The LEAC portion of $10.2 was $2.7 M lower to offset lower sales.
Standpipe sales went from a budgeted amount of $682 K to $91 K, a drastic reduction.
Overall operating revenues were 24.1% below the budgeted amount.
On the expense side, personnel costs were $6.0 M versus the budgeted $5.6 M, or 8.8% higher than budgeted. While some of this was due to payments for previous years, it was a serious blow to a sound income statement.
Despite the lower operating revenue and related LEAC, operating expenses were only $6.7 M below the budgeted amount.
Net income before taxes amounted to $.4 M and was impacted by a positive contribution of $2.0 M for contribution in aid of construction, while hurt by capital grants being $6.6 M below the projected level.
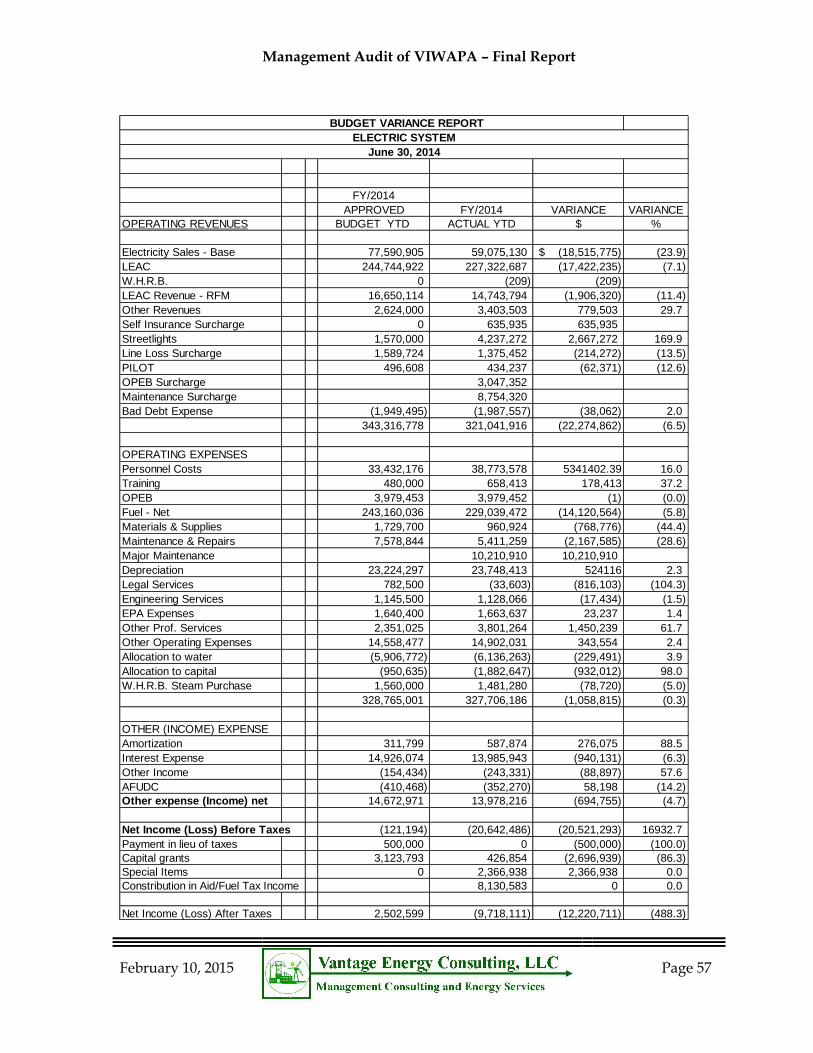
Management Audit of VIWAPA – Final Report
February 10, 2015
Page 57
BUDGET VARIANCE REPORT
ELECTRIC SYSTEM
June 30, 2014
FY/2014
APPROVED FY/2014 VARIANCE VARIANCE
OPERATING REVENUES BUDGET YTD ACTUAL YTD $ %
Electricity Sales - Base 77,590,905 59,075,130 (18,515,775)$ (23.9)
LEAC 244,744,922 227,322,687 (17,422,235) (7.1)
W.H.R.B. 0 (209) (209)
LEAC Revenue - RFM 16,650,114 14,743,794 (1,906,320) (11.4)
Other Revenues 2,624,000 3,403,503 779,503 29.7
Self Insurance Surcharge 0 635,935 635,935
Streetlights 1,570,000 4,237,272 2,667,272 169.9
Line Loss Surcharge 1,589,724 1,375,452 (214,272) (13.5)
PILOT 496,608 434,237 (62,371) (12.6)
OPEB Surcharge 3,047,352
Maintenance Surcharge 8,754,320
Bad Debt Expense (1,949,495) (1,987,557) (38,062) 2.0
343,316,778 321,041,916 (22,274,862) (6.5)
OPERATING EXPENSES
Personnel Costs 33,432,176 38,773,578 5341402.39 16.0
Training 480,000 658,413 178,413 37.2
OPEB 3,979,453 3,979,452 (1) (0.0)
Fuel - Net 243,160,036 229,039,472 (14,120,564) (5.8)
Materials & Supplies 1,729,700 960,924 (768,776) (44.4)
Maintenance & Repairs 7,578,844 5,411,259 (2,167,585) (28.6)
Major Maintenance 10,210,910 10,210,910
Depreciation 23,224,297 23,748,413 524116 2.3
Legal Services 782,500 (33,603) (816,103) (104.3)
Engineering Services 1,145,500 1,128,066 (17,434) (1.5)
EPA Expenses 1,640,400 1,663,637 23,237 1.4
Other Prof. Services 2,351,025 3,801,264 1,450,239 61.7
Other Operating Expenses 14,558,477 14,902,031 343,554 2.4
Allocation to water (5,906,772) (6,136,263) (229,491) 3.9
Allocation to capital (950,635) (1,882,647) (932,012) 98.0
W.H.R.B. Steam Purchase 1,560,000 1,481,280 (78,720) (5.0)
328,765,001 327,706,186 (1,058,815) (0.3)
OTHER (INCOME) EXPENSE
Amortization 311,799 587,874 276,075 88.5
Interest Expense 14,926,074 13,985,943 (940,131) (6.3)
Other Income (154,434) (243,331) (88,897) 57.6
AFUDC (410,468) (352,270) 58,198 (14.2)
Other expense (Income) net 14,672,971 13,978,216 (694,755) (4.7)
Net Income (Loss) Before Taxes (121,194) (20,642,486) (20,521,293) 16932.7
Payment in lieu of taxes 500,000 0 (500,000) (100.0)
Capital grants 3,123,793 426,854 (2,696,939) (86.3)
Special Items 0 2,366,938 2,366,938 0.0
Constribution in Aid/Fuel Tax Income 8,130,583 0 0.0
Net Income (Loss) After Taxes 2,502,599 (9,718,111) (12,220,711) (488.3)
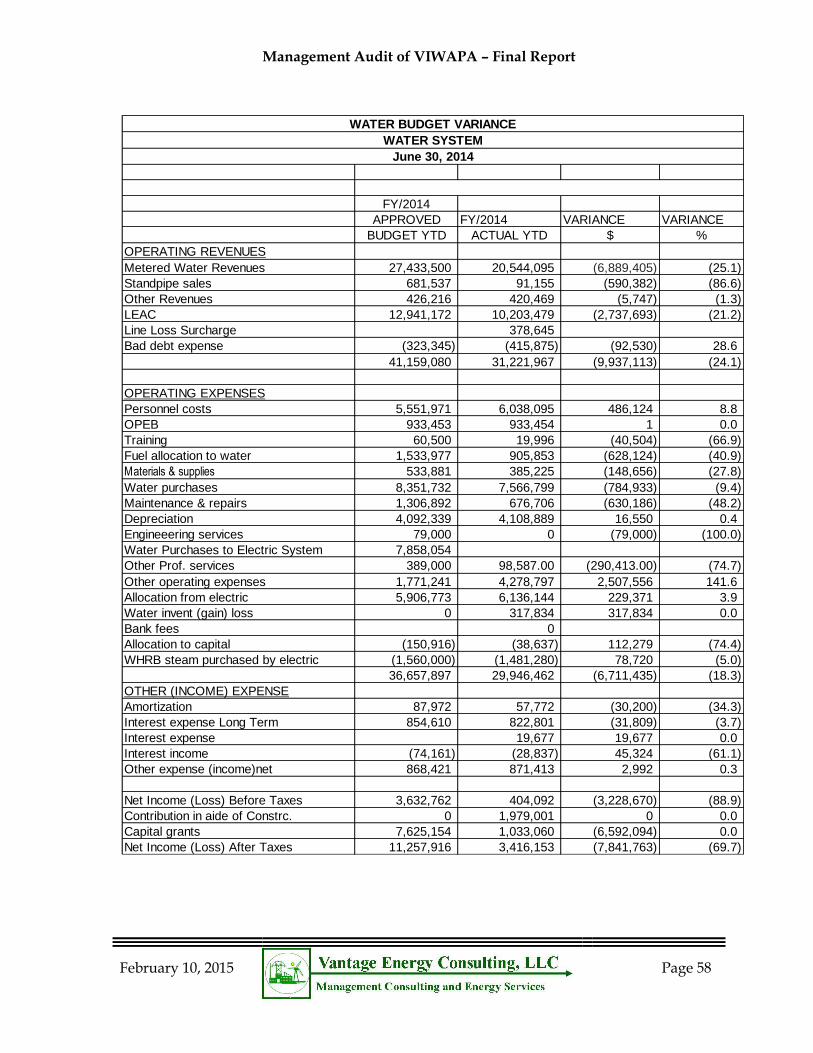
Management Audit of VIWAPA – Final Report
February 10, 2015
Page 58
WATER SYSTEM
June 30, 2014
FY/2014
APPROVED FY/2014 VARIANCE VARIANCE
BUDGET YTD ACTUAL YTD $ %
OPERATING REVENUES
Metered Water Revenues 27,433,500 20,544,095 (6,889,405) (25.1)
Standpipe sales 681,537 91,155 (590,382) (86.6)
Other Revenues 426,216 420,469 (5,747) (1.3)
LEAC 12,941,172 10,203,479 (2,737,693) (21.2)
Line Loss Surcharge 378,645
Bad debt expense (323,345) (415,875) (92,530) 28.6
41,159,080 31,221,967 (9,937,113) (24.1)
OPERATING EXPENSES
Personnel costs 5,551,971 6,038,095 486,124 8.8
OPEB 933,453 933,454 1 0.0
Training 60,500 19,996 (40,504) (66.9)
Fuel allocation to water 1,533,977 905,853 (628,124) (40.9)
Materials & supplies 533,881 385,225 (148,656) (27.8)
Water purchases 8,351,732 7,566,799 (784,933) (9.4)
Maintenance & repairs 1,306,892 676,706 (630,186) (48.2)
Depreciation 4,092,339 4,108,889 16,550 0.4
Engineeering services 79,000 0 (79,000) (100.0)
Water Purchases to Electric System 7,858,054
Other Prof. services 389,000 98,587.00 (290,413.00) (74.7)
Other operating expenses 1,771,241 4,278,797 2,507,556 141.6
Allocation from electric 5,906,773 6,136,144 229,371 3.9
Water invent (gain) loss 0 317,834 317,834 0.0
Bank fees 0
Allocation to capital (150,916) (38,637) 112,279 (74.4)
WHRB steam purchased by electric (1,560,000) (1,481,280) 78,720 (5.0)
36,657,897 29,946,462 (6,711,435) (18.3)
OTHER (INCOME) EXPENSE
Amortization 87,972 57,772 (30,200) (34.3)
Interest expense Long Term 854,610 822,801 (31,809) (3.7)
Interest expense 19,677 19,677 0.0
Interest income (74,161) (28,837) 45,324 (61.1)
Other expense (income)net 868,421 871,413 2,992 0.3
Net Income (Loss) Before Taxes 3,632,762 404,092 (3,228,670) (88.9)
Contribution in aide of Constrc. 0 1,979,001 0 0.0
Capital grants 7,625,154 1,033,060 (6,592,094) 0.0
Net Income (Loss) After Taxes 11,257,916 3,416,153 (7,841,763) (69.7)
WATER BUDGET VARIANCE
Management Audit of VIWAPA – Final Report
February 10, 2015
Page 59
III-F12 Reports generated on an annual basis are the foundation of long term planning.
Annually, WAPA produces an Electric O&M Report, an Electric Capital Report, a Water Department Capital and O&M report. These reports are produced internally. It also receives a report titled “Financial Statements and Supplemental Schedule” for both electric and water areas. These reports are prepared by BDO, which is WAPA’s accounting firm and are issued each December.
III-F13 WAPA generally has to struggle to collect accurate financial information on a timely basis in order to meet corporate and regulatory reporting requirements.
In discussions with the finance and rates personnel it was clear that getting accurate and timely information was often difficult. In many cases, preliminary reports are issued while final operating numbers are generated. There are two reasons for this problem. First, much of the cost data associated with fuel purchases must come from the suppliers, which takes time. Second, WAPA is still using an antiquated system for financial model.img The SunGard System, which runs on a mini computer and is not compatible with many of the new technologies WAPA is introducing, is a major detriment to optimal financial and operational reporting, as well as efficient management of procurement, performance reporting and other metrics that a good utility must have in place.
III-F14 The Water Operating Budget for 2015 is very optimistic, projecting a net income of $10.7 M.
There are a number of components of the budget that will require significant improvements if WAPA is to increase its net income from $ 3.4 M to $10.7 M. Metered water revenues are projected to increase almost 20%, from $20.5 to $25.4 M. Operating expenses increase by about $3 M over 2014 actual, but are still below the 2014 budget amount. Capital Grants are projected to increase from $1.0 M to $9.3 M.
In reviewing the budget data, we noticed on page 50, that the FY 2014 year numbers are not the actual numbers reported. For example, the working papers assume Capital Grants were $8.2 M in 2014, when the actual year-end report stated them as $1.0 M. In 2015 Capital Grants are budgeted at $9.3 M.
III-F15 The Water Capital Budget for 2015 totals $17.6 M, with $9.3 to St. Croix and $8.2 to St. Thomas.
Major elements of the St. Croix capital budget include AMR/AMI deployment at $634 M, paid by grants; the Christiansted Upgrade, with a 2015 cost of $968 M paid by grants; pressure management phase II paid for by grants and the transmission line from Kingshill to Frederiksted for $1.0 M paid through a surcharge. (Note these are the 2015 expenditures not necessarily the total cost of any project.)
Management Audit of VIWAPA – Final Report
February 10, 2015
Page 60
Major elements of the St. Thomas Division capital budget include: Annas Retreat Waterline at cost of $1.1 M paid by grant; GIS and SCADA of $7 M paid by WAPA internal funds, and Nazareth transmission line for $3 M paid by internal funds.
In addition to the actual FY 2015 budget, there is a Water System Business Plan Update from June 2014 that projects capital spending and strategy out five years. This document projects a $60 M capital program for the 2014-19 periods. While we did not perform an in-depth analysis of this update, we did notice that there are many risks that must be addressed. These include:
Sales Levels
Future Credit Worthiness
Participation of Large Users
Recovery of Stand Pipe Sales
Level and Timing of Grant Funds
Payment of Accounts Receivable
Continuation of the Line Loss Surcharge
III-F16 The Electric O&M Budget for 2015 is very optimistic, and does not include the delay of the LPG and final 2014 results in its preparation.
The O&M budget for 2015 is expected to be different than the 2014 actual for a number of reasons. The conversion from oil to liquid propane will reduce fuel costs significantly. Continued maintenance on existing equipment will increase costs. The net result is a planned $2.6 M profit versus a $9.7 M loss in 2014. However, this budget may need to be revised given the delay in the LPG conversion.
III-F17 At the time of this audit, the Electric Capital Budget for 2015 was projected to be $73.3 M with $51.3 million going to Power Production.
A review of the 2015 Capital Budget shows major expenditures in the Power Production area. This includes a $15 M expenditure on a 10MW unit for St. Croix and on St. Thomas there are expenditures of $13.4 M for the Unit 22 replacement, $4.0 M for Unit 21 redesign, and $3.6 M for Unit 23 inspection.
III-R5 Prepare a revised 2015 Electric O&M Budget and a five year Capital Plan that reflects current data. (Priority: Medium)
The 2015 Electric Budget was prepared with April 2014 data and does not account for the delay in the LPG project or recent reduction in oil costs. The 5 year Capital plan is dated and does not reflect many proposed projects.
Management Audit of VIWAPA – Final Report
February 10, 2015
Page 61
III-F18 The analytical and savings support for each capital project in both water and electric use a “Individual Project Detail” form that does not provide much detail.
Perhaps there is other backup to support each capital project; however, what is provided in the actual capital budget is inadequate for an Officer or Board member to make a reasoned evaluation. Generally project descriptions are only a few words. The reason for the request involves checkmarks as to the justification, and the Project Justification simply summarizes internal and external costs over a project time frame. Many are justified with “Unavoidable Replacement” or System Improvement” with no discussion of why it is unavoidable or what and where system improvements are included or identified.
There is no feedback mechanism within the Capital Budget process to measure the effectiveness of the project.
III-R6 Develop a more formal process for justification of capital projects and institute a feedback mechanism in which actual impacts or results of a capital project are measured afterwards relative to how they met the goals of the strategic plan. (Priority: Medium)
It is of vital importance that capital spending have a strategic purpose that can then be measured to see how well it met its objectives. When reasons such as “Cut Cost” or “System Improvement” are used, the actual costs and improvements should be specified in the request. The sponsor of the project should then be required to measure the impact of the project once completed and report on the effectiveness.
Management Audit of VIWAPA – Final Report
February 10, 2015
Page 62
IV. ORGANIZATIONAL STRUCTURE
WAPA is facing significant challenges but also has improvement opportunities afforded by a number of positive developments. WAPA’s transfer from oil to propane is expected to reduce electric rates; the water production facilities on St. Thomas and St. Croix are state of the art; the System Control and Data Acquisition (SCADA), a new Outage Management System (OMS) and an improved distribution system are being rolled out; and an Advanced Metering Infrastructure (AMI) pilot is moving forward. The improvements are all positive but they also have fundamental impacts on the organization in terms of the structure, skill sets and numbers of workers required. WAPA must reevaluate where it needs employees, how they are organized and managed and how many are required for the “new” WAPA.
This Chapter of the report focuses on the organizational and human element of WAPA as a utility. We question the organizational structure, staffing levels, skill sets, and the capability and role of senior management and the Executive Board. We will examine issues including; the power organization, skills, staffing and fundamental ability to operate WAPA’s fleet in a reliable, efficient and cost effective manner. Organizationally, we will offer suggestions on the delivery of critical support functions including their reporting structure. We examine how customer services can leverage technology, cross training and their new facility on St. Thomas to improve service. We will also review the role of WAPA’s Human Resource Department in the future transformation of WAPA into a lean, efficient, effective and reasonably priced utility.
A. EXECUTIVE MANAGEMENT AND GOVERNING BOARD FUNCTIONS
As part of this review, Vantage was asked to review the qualifications of the Executive Management team and the Governing Board. Further, we were asked to assess how well the two groups did their jobs and interfaced with each other. The following is our analysis and conclusions.
IV-F1 WAPA’s senior management team has excellent credentials and is, in general, well qualified for addressing the issues they face.
Our evaluations of the management team consisted of a number of elements.
EDUCATION AND EXPERIENCE
The resumes of the management team and almost all middle management employees are very impressive. Virtually all management employees have bachelor degrees and most have Masters of Business Administration or other advanced degrees. Many of the engineers were educated at prestigious schools and plant personnel also had appropriate degrees.
Management Audit of VIWAPA – Final Report
February 10, 2015
Page 63
RELATED UTILITY EXPERIENCE
One area of concern we have is whether the management team had sufficient direct utility experience that prepared them for their assignments. This is a particularly difficult challenge in the Virgin Islands, since WAPA is the only electric and water utility and most of its employees come from the local community. With the exception of one area, we were pleased with either the direct experience employees had or the tangential experience that enabled them to do an acceptable job. For example, the CEO worked in the US mainland for a medium-sized T&D company; the CFO had excellent educational experience and direct experience working with other large VI agencies. The COO and almost all other directors have extensive experience within WAPA and with other companies.
One area where we paid special attention is the power generation department. Since this is the area with the greatest cost impact and has received the greatest scrutiny lately, we conducted additional interviews of the management team and other company and non-company individuals who interact with them. We were very impressed with the level of experience, education and awareness of industry issues of the Director of Generation, the Plant Managers and their direct reports. Most had either started with WAPA in entry level positions or transferred from other island companies such HOVENSA. They were bright, understood their plants, were willing to listen to new ideas, and had a reasonable sense of technical issues facing both WAPA and the industry.
We do have some level of concern at the senior management level as it relates to understanding the broad view of generation planning, technology and resource integration. Neither the COO nor the Executive Director has direct experience on the generation side of the industry. The COO’s background is in environmental regulation and the Executive Director worked at a T&D company, where energy was purchased and not produced.
EMPLOYEE AND PUBLIC VIEW OF MANAGEMENT
It is interesting that while WAPA’s fees and services are almost universally disliked by members of the public, those with whom we spoke had generally positive views of WAPA management and its employees. Most viewed the management team as trying their best with a difficult hand to play. In our discussions with middle and lower level employees, as well as union representatives, we found that they also believed the senior management team was fair and were doing as good of a job as possible under the circumstances.
IV-F2 WAPA’s Governing Board is well qualified, highly engaged in the many issues facing WAPA and independent in its decision making.
WAPA is governed by a nine member board of public and private sector members. The Governor of the Virgin Islands selects the three public sector members of the Board from his Cabinet. The six private sector board members are nominated by the Governor and confirmed by the V.I. Legislature for three year terms. Private sector members come from each district. All of the Governing Board members had extensive business, legal or government experience.
Management Audit of VIWAPA – Final Report
February 10, 2015
Page 64
Vantage attended one Board meeting in person and monitored one by video. We also reviewed numerous presentations made to the Board by management. Finally, we were given the comments that the Board made regarding our initial diagnostic findings. In every case we found the Board was thoroughly engaged in the process. During meetings, they asked the Management team many probing questions before voting on issues. Many initiatives WAPA has undertaken in the past were based on Board requests, and there are many examples of cases where the Board either did not approve Management’s request or made independent requests themselves.
IV-R1 Address the need for an experienced generation expert who can provide the management team and the plant team with the expertise needed in the upcoming years as WAPA makes its transition to new fuels, technology and the changing dynamics of renewable energy sources. (Priority: High)
As stated above, while WAPA’s management team is, in general, very skilled, it does not have the high level expertise it needs for the upcoming transition. We will discuss this issue in more detail later in the report, but believe this issue can be solved through the hiring of a single person or small team with the requisite expertise to provide sound advice to WAPA over the next five years. This recommendation is in contrast to the current plan for an Independent Advisory Contractor) that would provide extensive oversight and duplicative management function in the generating plants. Our review of this plan is discussed in the section under generation planning.
B. MANAGEMENT ORGANIZATIONAL STRUCTURE
As WAPA moves to address its issues, it is important that the steps taken provide real solutions to its operations and service, but that they also communicate to all of the stakeholders that WAPA is serious about saving money, improving customer service, increasing efficiencies, improving employee morale, and strengthening the tools that management has to build a stronger organization. An organizational structure and staffing levels that are designed to meet the future needs of WAPA are ways of communicating these needs.
WAPA is going through significant changes in power production, water supply, customer service and technology deployment. At the same time, WAPA continues to face financial stress. Both of these factors press towards the need for a complete organizational staffing assessment that evaluates the current status of WAPA staffing, future needs at 1, 5 and 10 years, the gap between current and future needs and finally a road map that defines how WAPA will move from current staffing to that required in the future. This cannot be a simplistic reduction but needs to consider the changing skill set requirements, spans of control, organizational alignment and opportunities to leverage technology. This assessment or “right sizing” may in fact result in the need for additional staffing in certain functions along with the opportunity for reductions elsewhere.
Management Audit of VIWAPA – Final Report
February 10, 2015
Page 65
It will also require that management assess whether it has the right assets in place. WAPA, because it is an island with a relatively small population, has historically used local personnel who were trained and then allowed to rise within the ranks of the Company. While this may be a necessary approach, it also results in some positions with mismatches between the skill set of the incumbent and the needs of the company. A major part of management’s job is to constantly upgrade the team to assure that all areas of the company are properly managed.
ORGANIZATIONAL DEFINITIONS
The appropriate organizational structure is important for several reasons. First, reporting relationships create the pathways for information to flow throughout the organization. The criticality of information is communicated by direct reporting relationships where any possible dilution of a message is reduced. Second, reporting relationships telegraph to internal and external stakeholders the priorities of the leadership. The number of ‘layers’ between an employee and the decision-maker makes a difference. Third, the titles given to jobs are important, and allow for accuracy in understanding roles, business expectations, recruiting, pay, comparable external relationships, and customer service. This is particularly true of managerial positions and titles.
The majority of organizations, utilities included, broadly define the leadership roles as follows, from narrowest to broadest:
Supervisors: These individuals are generally responsible for the implementation of policy and practices of one narrow area of a department, i.e. Plant Maintenance, Accounts Receivable or Accounts Payable. Their role is to assure compliance, monitor transactions, track employee work assignments and time, and other routine tracking. They may have input to new policies and practices, but do not have the authority to make broad decisions. The focus of their work is very much internal and within a narrow scope.
Managers: These individuals generally have broader responsibilities, with more than one Supervisor reporting to them, i.e., the Accounting Department with both Receivables and Payables reporting. This role begins to have some policy-making authority within the confines of the department and will provide input into larger functional area issues. The focus of their work is still internal, still primarily policy implementation, but the scope is somewhat broader.
Directors: These individuals generally have responsibility for multiple departments, all aligned by common work standards and content areas. They have moved into more policy than implementation, decision-making rather than transactional responsibilities. While their focus is still largely internal, they are responsible for the understanding and integration of their work area within the organization as well as bringing industry information relative to their work areas back inside.
Management Audit of VIWAPA – Final Report
February 10, 2015
Page 66
Vice Presidents or Officers: These individuals generally have responsibilities for broad functional areas, set policy and practices, and contribute to the strategic vision. In addition to understanding the fullness of their functional areas to establish priorities and make integrated decisions, their role is to look external to the organization and attend to current and future pressures, opportunities, etc. that will impact their functional area’s operations.
Within organizational structure we found opportunities exist to address the following:
Spans of control that appear either too large or too small;
Reporting relationships that raise questions as to efficiency;
Job titles that are, in some cases, misleading;
Mirror organizations at different sites exist and that may be inefficient;
Skill sets that might be better leveraged functionally across islands; and
High level Assistants and Special Assistant roles are common.
SENIOR MANAGEMENT ORGANIZATION
IV-R2 Develop a senior management organization that reflects functional reporting relationships, a reasonable span of control, minimal layers, and the recognition of current challenges to WAPA. (Priority: Medium)
The current organization for the senior management team is provided in Chapter 2 and shows the large number of direct reports, as well as isolation of some important departments that are facing critical issues. Vantage believes that the Governing Board and the Chief Executive Officer should take a long and hard look at organizational structure, the employees that fill this structure, and the specific expectations of every employee there. Earlier in the report we discuss the need to develop and implement strategic, resource and financial planning tools that will provide a roadmap for management to work toward. Below we offer our guidance as to how the senior management structure should look, with some comments on the expectations of the managers in those roles.
Span of Control – Reduce the number of direct reports. Typically a CEO will have five to eight major departments reporting to the position, with an additional one or two advisory reports. Currently the CEO has the following direct reports:
Chief Financial Officer – Currently responsible for accounting, cash management, grants/grant administration, and customer service. (Currently Customer service reports here, but may be moved to an operational area later as the AMI changes stabilize.)
Chief Operating Officer - Currently responsible for power plants and water production and distribution.
Director of Transmission and Distribution – Responsible for system planning, substation maintenance, line department and meter testing.
Chief Information Officer – Limited to corporate IT issues only.
Management Audit of VIWAPA – Final Report
February 10, 2015
Page 67
Director of Human Resources – Personnel and Safety.
General Counsel – Internal and external legal services.
Director of Corporate Communications – Responsible for coordination of external and internal communications.
Director of Special Projects – Responsible for large projects.
Manager Internal Audit–Reports administratively to CEO and functionally to the Governing Board.
Based on our experience within the utility industry, and more specifically, our understanding of the challenges WAPA is currently facing, we recommend some changes to this organization. The purpose of the changes is to permit the CEO to focus and interact with the department heads who are dealing with critical issues, to provide a higher level of input to the CEO of some key departments and to provide the level of professional oversight other groups need. Our proposal would include:
Chief Financial Officer: Responsibilities would include all aspects of financial operations and management. This would permit the CFO to focus on the financial health of WAPA, its need to prepare accurate and timely budgets and financial forecasts, direct revenue collection, interact with rating agencies and financial institutions, and to work with both the PSC and VI Government to institute sound rates and tariffs. The Customer Service Department should ultimately be moved out of this group. If it is moved, it probably should report to the CAO.
Chief of Electrical Operations: Currently these two departments operated under separate managers. However, the power generation, T&D, engineering, and AMI will work as an integrated operational components in the future. WAPA will be forced to utilize its own generation, increasing levels of both WAPA owned and independent renewable resources, a T&D system that is monitored at both plant and distribution level by a SCADA system and monitored by an Outage Management System (OMS) while utilizing the AMI system for real time feedback on system status. The Chief of Electrical Operations will be the single person responsible for assuring that all of the new technologies, fuel sources, information data flow and most importantly customer operational expectations are met.
Chief of Water Operations – Currently the water system is treated based on the old structure in which the power plant produced water and the distribution department tried to deliver as much as possible. With supply now provided by the Seven Seas contract through a Reverse Osmosis (RO) system, the link to the power plant is effectively severed. (Note, later in the report we suggest that the existing IDE systems be retired.) The water operations at WAPA are small in comparison to the electric, but just as important to the health and economic success of the Virgin Islands. The water production problem has been solved, but the need to replace the old, leaking and constrained infrastructure must be addressed at a high level. The new Chief of Water Operations would be the champion of the many changes that need to take place, reporting directly to the CEO and with clear, focused and
Management Audit of VIWAPA – Final Report
February 10, 2015
Page 68
undivided responsibilities.
Chief Administrative Officer - There are a number of administrative and support functions within any utility that are important, need strategic and tactical direction, and strong, focused leadership. The Chief Administrative Officer would provide the high level leadership needed as WAPA goes through this transition period and relive the CEO of direct day to day responsibility. Vantage suggests that Human Resources, Information Technology, Communications, Safety, Security, Procurement and Warehousing and Fleet Management all report through this position. These are important departments and need direct, full time leadership. It also allows more direct focus on the analysis and transformation that we are proposing in several of the support services areas.
Chief Project Management Officer – Currently there is a Director of Special Projects with a very small team, limited resources and tools. WAPA is facing a huge task of completing a number of large, high cost projects on a tight integrated schedule that must be coordinated and successful if WAPA is to conquer its challenges. The LPG project has already been delayed and its successful completion is the linchpin to WAPA’s future. The refurbishment of the power plants, conversion to LPG of its units and the installation of new technologies will take a significant level of project management that should not be placed on the shoulders of the current power plant management team. The completion of the Maximo MMS, AMI, OMS, and integration of SCADA are all key projects require significant oversight. Finally, the water system on St. Croix and St. Thomas are in dire need of replacement and expansion. This will be an expensive and difficult project and will need very strong project management support. This department requires a senior level manager with broad knowledge of WAPA as well as its contracting and procurement methods.
Chief Legal Counsel - This is a support department to the CEO and needs direct reporting.
Internal Audit Manager – The Internal Audit Department’s integrity is dependent upon their absolute independence from all influence. The department must be assured of the ability to audit and report on sensitive and often provocative topics without fear of intervention by senior management. Therefore, this important function must report directly to the Governing Board.
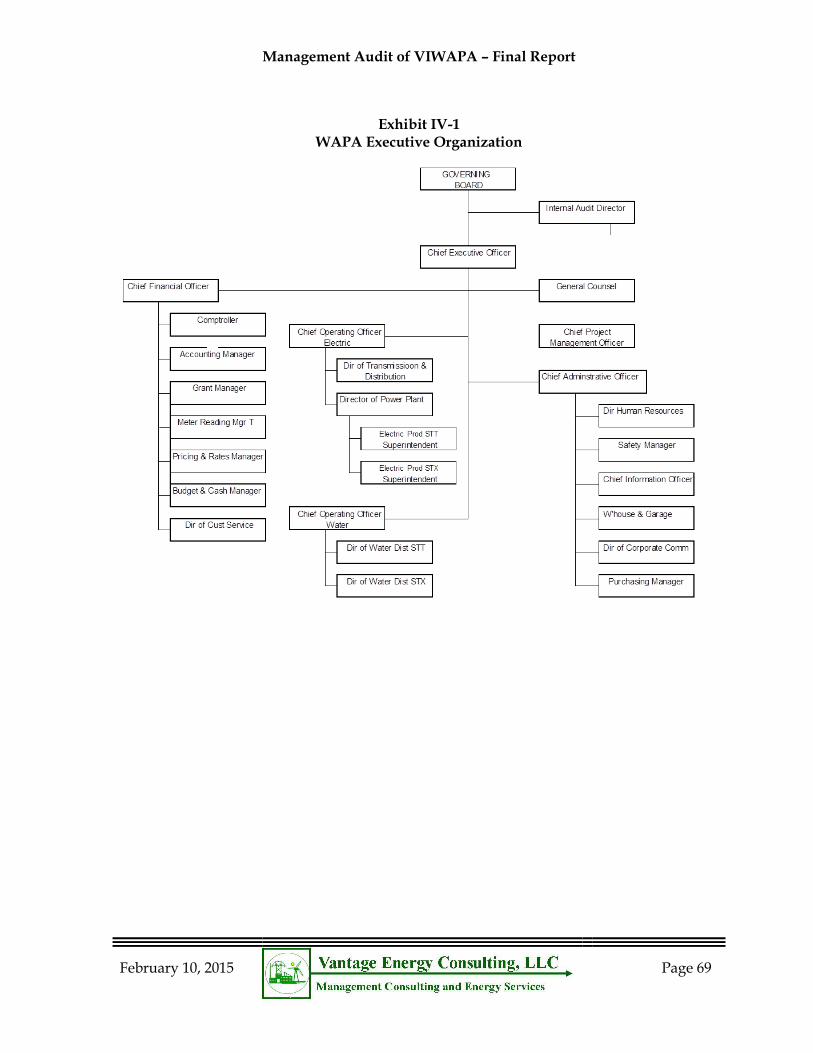
Management Audit of VIWAPA – Final Report
February 10, 2015
Page 69
Exhibit IV-1 WAPA Executive Organization
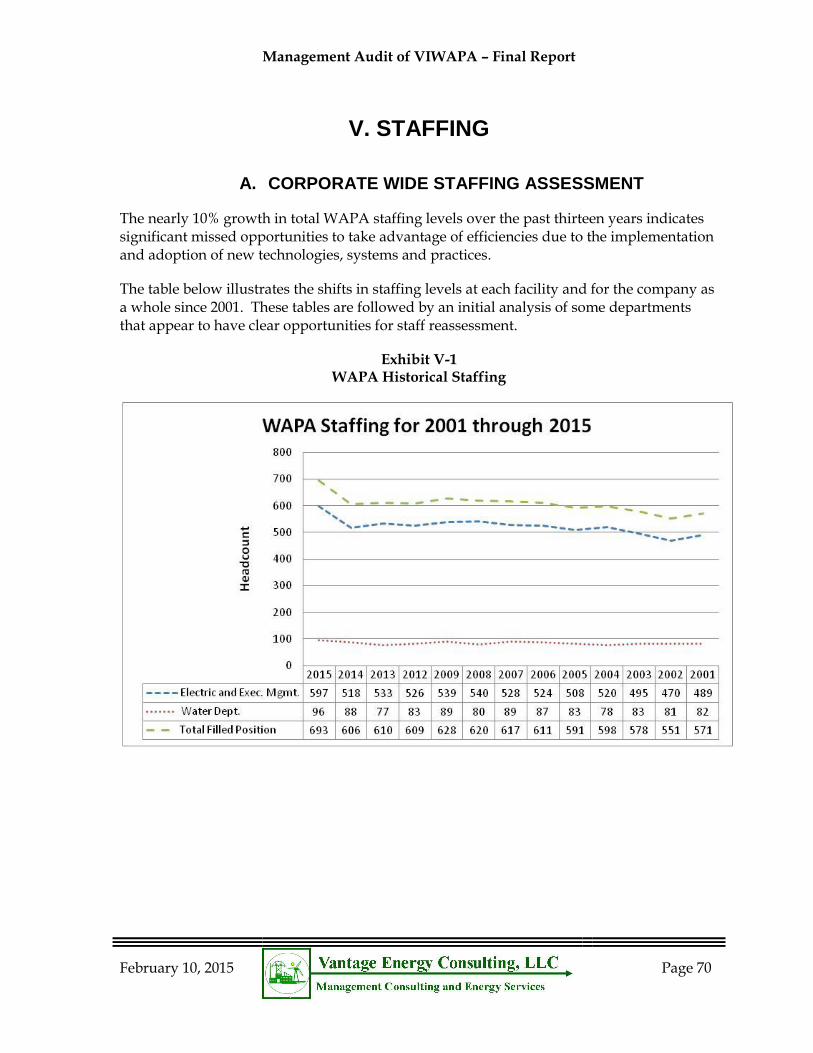
Management Audit of VIWAPA – Final Report
February 10, 2015
Page 70
V. STAFFING
A. CORPORATE WIDE STAFFING ASSESSMENT
The nearly 10% growth in total WAPA staffing levels over the past thirteen years indicates significant missed opportunities to take advantage of efficiencies due to the implementation and adoption of new technologies, systems and practices.
The table below illustrates the shifts in staffing levels at each facility and for the company as a whole since 2001. These tables are followed by an initial analysis of some departments that appear to have clear opportunities for staff reassessment.
Exhibit V-1 WAPA Historical Staffing
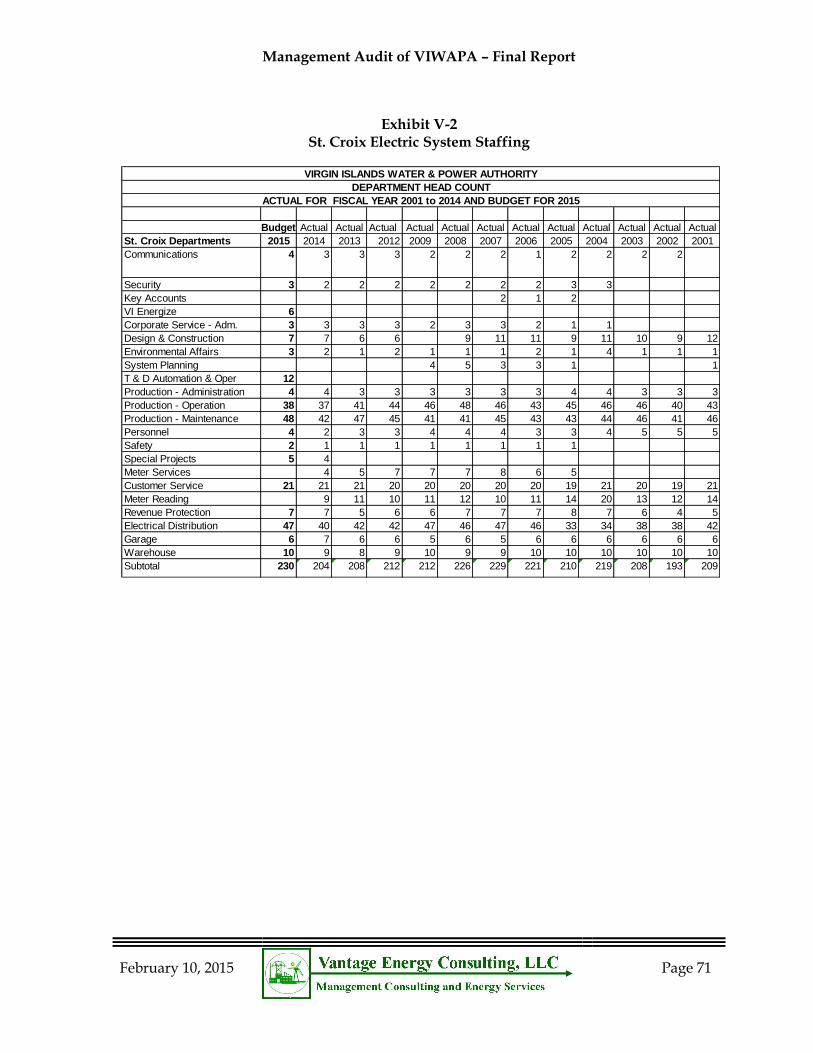
Management Audit of VIWAPA – Final Report
February 10, 2015
Page 71
Exhibit V-2 St. Croix Electric System Staffing
Budget Actual Actual Actual Actual Actual Actual Actual Actual Actual Actual Actual Actual
St. Croix Departments 2015 2014 2013 2012 2009 2008 2007 2006 2005 2004 2003 2002 2001
Communications 4 3 3 3 2 2 2 1 2 2 2 2
Security 3 2 2 2 2 2 2 2 3 3
Key Accounts 2 1 2
VI Energize 6
Corporate Service - Adm. 3 3 3 3 2 3 3 2 1 1
Design & Construction 7 7 6 6 9 11 11 9 11 10 9 12
Environmental Affairs 3 2 1 2 1 1 1 2 1 4 1 1 1
System Planning 4 5 3 3 1 1
T & D Automation & Oper 12
Production - Administration 4 4 3 3 3 3 3 3 4 4 3 3 3
Production - Operation 38 37 41 44 46 48 46 43 45 46 46 40 43
Production - Maintenance 48 42 47 45 41 41 45 43 43 44 46 41 46
Personnel 4 2 3 3 4 4 4 3 3 4 5 5 5
Safety 2 1 1 1 1 1 1 1 1
Special Projects 5 4
Meter Services 4 5 7 7 7 8 6 5
Customer Service 21 21 21 20 20 20 20 20 19 21 20 19 21
Meter Reading 9 11 10 11 12 10 11 14 20 13 12 14
Revenue Protection 7 7 5 6 6 7 7 7 8 7 6 4 5
Electrical Distribution 47 40 42 42 47 46 47 46 33 34 38 38 42
Garage 6 7 6 6 5 6 5 6 6 6 6 6 6
Warehouse 10 9 8 9 10 9 9 10 10 10 10 10 10
Subtotal 230 204 208 212 212 226 229 221 210 219 208 193 209
VIRGIN ISLANDS WATER & POWER AUTHORITY
DEPARTMENT HEAD COUNT
ACTUAL FOR FISCAL YEAR 2001 to 2014 AND BUDGET FOR 2015
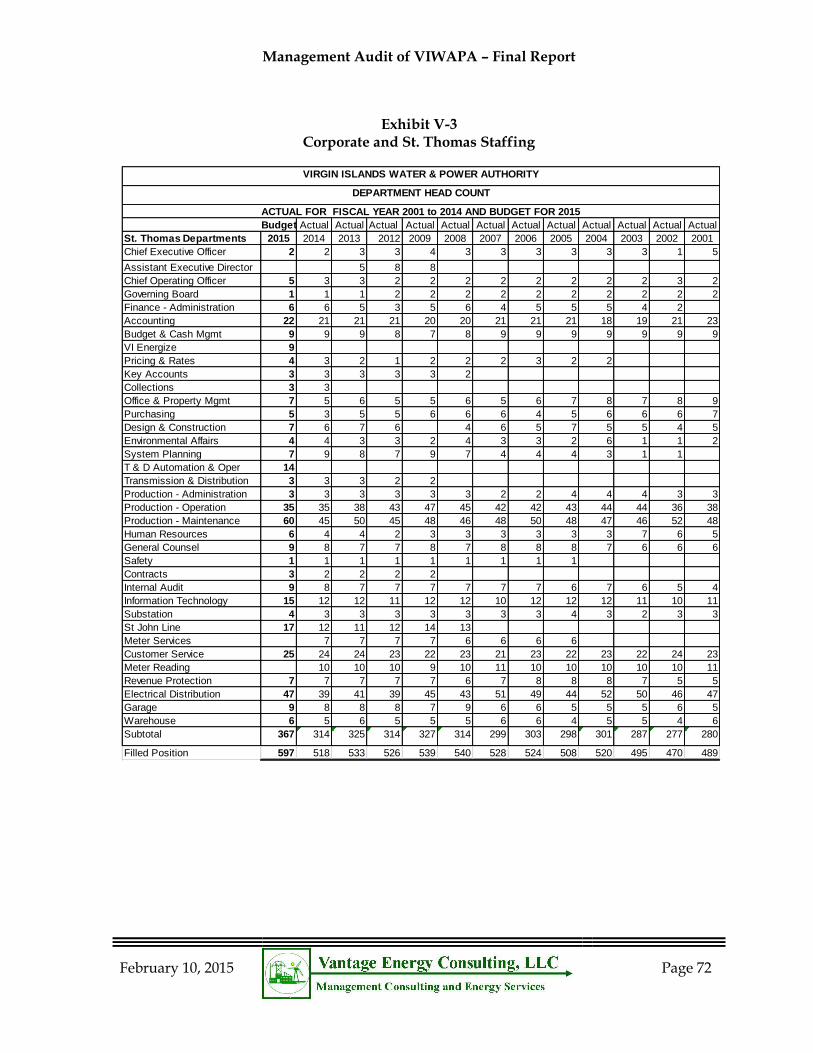
Management Audit of VIWAPA – Final Report
February 10, 2015
Page 72
Exhibit V-3 Corporate and St. Thomas Staffing
Budget Actual Actual Actual Actual Actual Actual Actual Actual Actual Actual Actual Actual
St. Thomas Departments 2015 2014 2013 2012 2009 2008 2007 2006 2005 2004 2003 2002 2001
Chief Executive Officer 2 2 3 3 4 3 3 3 3 3 3 1 5
Assistant Executive Director 5 8 8
Chief Operating Officer 5 3 3 2 2 2 2 2 2 2 2 3 2
Governing Board 1 1 1 2 2 2 2 2 2 2 2 2 2
Finance - Administration 6 6 5 3 5 6 4 5 5 5 4 2
Accounting 22 21 21 21 20 20 21 21 21 18 19 21 23
Budget & Cash Mgmt 9 9 9 8 7 8 9 9 9 9 9 9 9
VI Energize 9
Pricing & Rates 4 3 2 1 2 2 2 3 2 2
Key Accounts 3 3 3 3 3 2
Collections 3 3
Office & Property Mgmt 7 5 6 5 5 6 5 6 7 8 7 8 9
Purchasing 5 3 5 5 6 6 6 4 5 6 6 6 7
Design & Construction 7 6 7 6 4 6 5 7 5 5 4 5
Environmental Affairs 4 4 3 3 2 4 3 3 2 6 1 1 2
System Planning 7 9 8 7 9 7 4 4 4 3 1 1
T & D Automation & Oper 14
Transmission & Distribution 3 3 3 2 2
Production - Administration 3 3 3 3 3 3 2 2 4 4 4 3 3
Production - Operation 35 35 38 43 47 45 42 42 43 44 44 36 38
Production - Maintenance 60 45 50 45 48 46 48 50 48 47 46 52 48
Human Resources 6 4 4 2 3 3 3 3 3 3 7 6 5
General Counsel 9 8 7 7 8 7 8 8 8 7 6 6 6
Safety 1 1 1 1 1 1 1 1 1
Contracts 3 2 2 2 2
Internal Audit 9 8 7 7 7 7 7 7 6 7 6 5 4
Information Technology 15 12 12 11 12 12 10 12 12 12 11 10 11
Substation 4 3 3 3 3 3 3 3 4 3 2 3 3
St John Line 17 12 11 12 14 13
Meter Services 7 7 7 7 6 6 6 6
Customer Service 25 24 24 23 22 23 21 23 22 23 22 24 23
Meter Reading 10 10 10 9 10 11 10 10 10 10 10 11
Revenue Protection 7 7 7 7 7 6 7 8 8 8 7 5 5
Electrical Distribution 47 39 41 39 45 43 51 49 44 52 50 46 47
Garage 9 8 8 8 7 9 6 6 5 5 5 6 5
Warehouse 6 5 6 5 5 5 6 6 4 5 5 4 6
Subtotal 367 314 325 314 327 314 299 303 298 301 287 277 280
Filled Position 597 518 533 526 539 540 528 524 508 520 495 470 489
VIRGIN ISLANDS WATER & POWER AUTHORITY
DEPARTMENT HEAD COUNT
ACTUAL FOR FISCAL YEAR 2001 to 2014 AND BUDGET FOR 2015
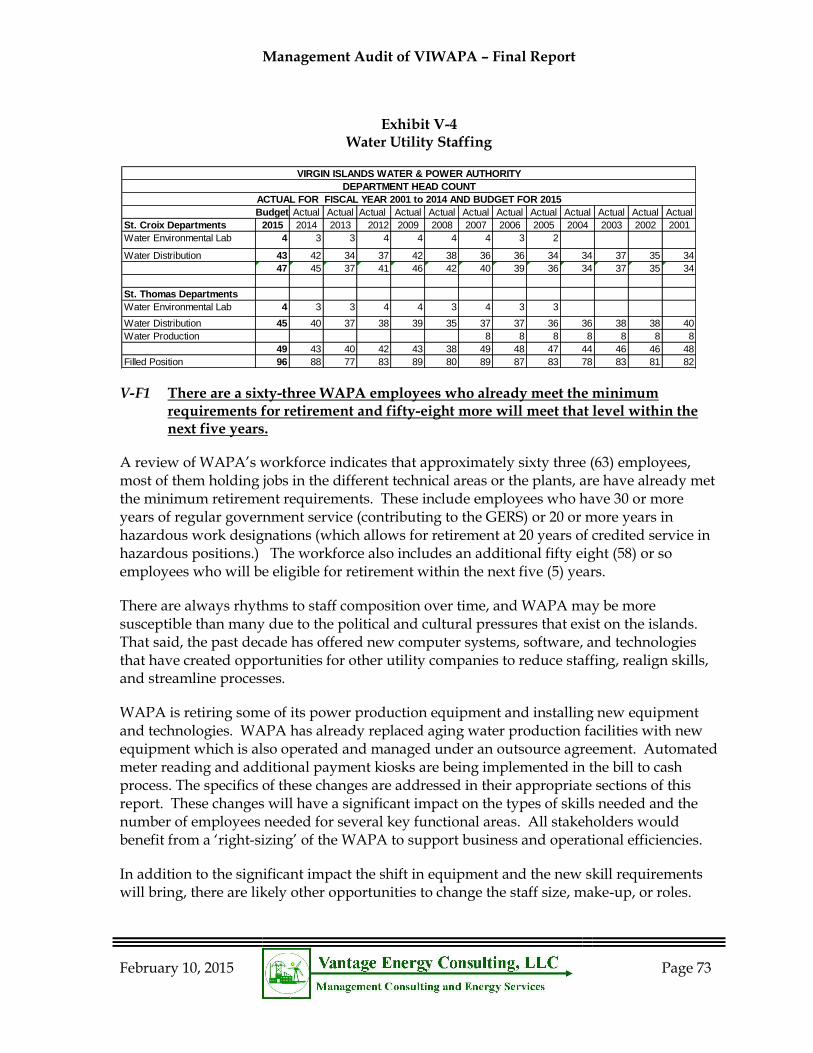
Management Audit of VIWAPA – Final Report
February 10, 2015
Page 73
Exhibit V-4 Water Utility Staffing
V-F1 There are a sixty-three WAPA employees who already meet the minimum requirements for retirement and fifty-eight more will meet that level within the next five years.
A review of WAPA’s workforce indicates that approximately sixty three (63) employees, most of them holding jobs in the different technical areas or the plants, are have already met the minimum retirement requirements. These include employees who have 30 or more years of regular government service (contributing to the GERS) or 20 or more years in hazardous work designations (which allows for retirement at 20 years of credited service in hazardous positions.) The workforce also includes an additional fifty eight (58) or so employees who will be eligible for retirement within the next five (5) years.
There are always rhythms to staff composition over time, and WAPA may be more susceptible than many due to the political and cultural pressures that exist on the islands. That said, the past decade has offered new computer systems, software, and technologies that have created opportunities for other utility companies to reduce staffing, realign skills, and streamline processes.
WAPA is retiring some of its power production equipment and installing new equipment and technologies. WAPA has already replaced aging water production facilities with new equipment which is also operated and managed under an outsource agreement. Automated meter reading and additional payment kiosks are being implemented in the bill to cash process. The specifics of these changes are addressed in their appropriate sections of this report. These changes will have a significant impact on the types of skills needed and the number of employees needed for several key functional areas. All stakeholders would benefit from a ‘right-sizing’ of the WAPA to support business and operational efficiencies.
In addition to the significant impact the shift in equipment and the new skill requirements will bring, there are likely other opportunities to change the staff size, make-up, or roles.
Budget Actual Actual Actual Actual Actual Actual Actual Actual Actual Actual Actual Actual
St. Croix Departments 2015 2014 2013 2012 2009 2008 2007 2006 2005 2004 2003 2002 2001
Water Environmental Lab 4 3 3 4 4 4 4 3 2
Water Distribution 43 42 34 37 42 38 36 36 34 34 37 35 34
47 45 37 41 46 42 40 39 36 34 37 35 34
St. Thomas Departments
Water Environmental Lab 4 3 3 4 4 3 4 3 3
Water Distribution 45 40 37 38 39 35 37 37 36 36 38 38 40
Water Production 8 8 8 8 8 8 8
49 43 40 42 43 38 49 48 47 44 46 46 48
Filled Position 96 88 77 83 89 80 89 87 83 78 83 81 82
VIRGIN ISLANDS WATER & POWER AUTHORITY
DEPARTMENT HEAD COUNT
ACTUAL FOR FISCAL YEAR 2001 to 2014 AND BUDGET FOR 2015
Management Audit of VIWAPA – Final Report
February 10, 2015
Page 74
These include:
The staffing levels raise questions in some areas. For example, the Legal Department appears to have a large staff while still using significant outside counsel services.
Customer Service operates on an island by island basis rather than teaming resources by leveraging technology.
The Human Resources Department appears to have a very small staff that limits its ability to provide strategic services necessary to support and protect the organization.
Based on a review of job titles, there are 140 supervisory or management employees over 486 non-supervisory employees. This ratio is high. The duplication of structures on St. Croix and St. Thomas/St. John islands is one of the reasons for this. Another is the practice of hiring the intended successor for a management position into a managerial assistant role for training purposes. While recognizing that WAPA is a 24-hour operation and the need to run three shifts in some functions, there are still opportunities to broaden the span and eliminate unnecessary levels of management.
V-R1 Conduct a thorough organizational assessment that leads to an optimal organizational structure and right sized staffing plan that can better align the organization with the future needs of WAPA and its customers. (Priority: Medium)
While the full assessment will take time to complete, WAPA does have the ability to realign its senior team and the high level organizational structure immediately. Using the analysis we provide and the descriptions of roles and responsibilities as the basis for job titles, a proposed high level organizational structure that allows for improved lines of communication and functional area efficiencies should result:
B. KEY DEPARTMENT ORGANIZATION AND STAFFING
In addition to the top levels of the organization, significant opportunities exist to reshape the employee population and structure due to new and planned technologies. It is important that WAPA develop an organizational structure that better aligns with the long-term future of WAPA.
Determining the right staffing levels throughout the organization is not a simple endeavor. Normally, an organization has the ability to use information from other utilities to help in the establishment of normative staffing levels. WAPA is obviously challenged in this by the dearth of comparable utility operations. Instead, we recommend a bottoms-up business analysis to provide data on specific activities, customer needs, timing requirements, performance goals and needed skills for each area. This should be done for each function and island. The information gleaned will inform the precise staffing needs based on the current reality rather than the past traditions, and should, as a minimum:
Management Audit of VIWAPA – Final Report
February 10, 2015
Page 75
Immediately implement a hiring freeze and fill only those positions considered critical to daily operations until the organizational assessment and right sizing is complete.
Consider an overall push towards functional organizations rather than island specific management to leverage technology and skilled managers.
The use of roving specialized crews for planned work for construction, plant maintenance and specialized vehicle repairs.
Perform a thorough evaluation of the current organization. WAPA has opportunities for immediate improvements in productivity that can be identified and implemented while an organization assessment is ongoing. These include:
o Identification and elimination of one to one reporting relationships. This should include a corporate assessment of minimal spans of control that will be acceptable.
o A complete evaluation of the functions being performed by all WAPA employees and an elimination of redundant work efforts.
o A determination of whether those functions as currently performed are aligned with current WAPA needs.
o Identification of currently open positions, which can be permanently eliminated.
o Consideration of adopting incentives to encourage employees who are eligible to retire to do so. Future changes to the post-retirement health care benefits may provide an impetus for others to retire when eligible.
o Monitor the workforce for upcoming retirement eligibility, not only to manage staffing changes, but also to assure a smooth transition of skills for successors.
Develop a comprehensive staffing plan that migrates WAPA from the current organization and staffing to the future needs.
o Staffing by new organization units. o Identification of new skill sets required in new positions. o Identify the skill sets of existing staff . o Identify skills gaps between what’s needed and what’s available. o Identify options to close gaps:
Hire (recruitment sources, strategies, costs, opportunities etc.) Train (methods, sources, scalability, T3 opportunities, mentoring, etc.) Buy (engage consultants w/ institutionalization methods) Borrow (interns, external mentors, etc.) Timing of changes required; immediate, one, five, ten years.
o Establish metrics for staffing levels such as employees per customer . o Conduct cost/benefit analysis of each option for each internal sector. o Implement a succession planning program that includes projected
retirements and skill transfer strategies. o Assess the current work processes for efficiencies, shifts in timing, crew sizes,
teaming, cross training, work delivery methods, etc.
Management Audit of VIWAPA – Final Report
February 10, 2015
Page 76
o Redundant or excessive positions should be eliminated, and the employee population assigned, reassigned, retrained, or reduced through appropriate pathways: retirements, early retirement offerings, layoffs, or terminations.
V-F2 The organization is too vertical. There are too many cases where an Assistant Director, Manager or Supervisor reports directly below a Director and has all employees reporting to them.
A review of the various departments indicates an excess layer of management in many parts of the organization. While there used to be a practice of having assistants in line as a way of succession planning, this has been proven to be both expensive and often ineffective. First of all, it isolates the department head from the employees, second it appears to ordain an heir apparent when a vacancy does occur. The following positions appear to warrant examination for possible elimination of excessive layers of management:
Assistant CFO, Comptroller and Accounting Manager are all in a single organization line;
Assistant General Counsel;
Audit Manager and Audit Supervisor are in same line below the Audit Director;
Meter Reading Manager and Supervisor are in same line below the CFO;
T&D on St. John’s appears to have a relatively large contingent of personnel given that there is only about 3,500 meters on the island. The St. John’s Administrator has an Administrative Assistant, Coordinator of the Meter Shop and three Supervisors with crews that total nine employees;
The Warehouse and Garage organization on St. Croix has an Administrator with a Manager Warehouse and Garage. Below that are two Supervisors and, three janitors, five mechanics, a Driver/Messenger and three warehouse administrative personnel;
The Warehouse and Garage organization on St. Thomas has an Administrator with a Manager Warehouse and Garage. Below that are two Supervisors and seven mechanics, a Driver/Messenger and four warehouse administrative personnel; and
Water Distribution on St. Croix and St Thomas both have an Assistant to Director of Water Distribution and an Assistant Superintendent. In addition there is a Superintendent, and Assistant Superintendent, two Water System Supervisors and one Maintenance Supervisor.
POWER PRODUCTION
Vantage consultants did extensive interviews of personnel at the power plants on St. Thomas and St. Croix, visited each facility numerous times, and reviewed many aspects of the system design, plant technology, reliability, maintenance practices, and overall economic performance. We also did an assessment of the management team, their qualifications, and effectiveness.
Management Audit of VIWAPA – Final Report
February 10, 2015
Page 77
Senior management and the Governing Board are currently considering an agreement to retain an Independent Advisory Contractor (IAC) to assist with management of the power plants and related issues. We reviewed the RFP and tried to assess whether the program was necessary as outlined.
V-F3 The management team responsible for power plant operations is capable and, with the installation of the right sized generating technologies and additional oversight, is capable of operating the plants in a reliable and cost effective manner.
There has been extensive discussion about the problems with WAPA’s generating units by the PSC, the Legislature and the public. These are legitimate complaints and concerns and the question now is, can WAPA’s management team operate the fleet properly going forward or does it need extensive oversight by an outside organization? There have been a number of problems at both of the WAPA plants and these problems are discussed below. That said, the CEO has made recent changes in the management leadership, and a great deal of money has been invested in improving reliability and giving the plant personnel the tools they need to be successful.
There are four reasons why Vantage believes the current team can be successful; a strong qualified management team; the acquisition and implementation of the right maintenance and monitoring tools; the refurbishment and overhaul of the fleet; and the likelihood of new generating units that will permit the system to be dispatched and operated in a manner that does not abuse the equipment and lead to early failures.
Management Team
While most of the supervisors and employees at the Harley and Richmond plants, started at beginner’s positions and were trained and promoted from within, there is a reasonable number of managers that came from other large companies and have good ideas to share. The managers, supervisors and employees we met were generally very knowledgeable about their specific plant and responsibilities, although frustrated by the ongoing saga of breakdowns that were experienced.
The management team was open to ideas we raised and did independent research on some of them without being prompted. Data collection and reporting are detailed and appear to be accurate. Once all of the tools discussed below are operational, they will have much better information for decision making.
As stated above, and previously in Chapter 3, while WAPA has many talents, it does not have a senior person who can provide guidance throughout the upcoming transition.
To provide an additional resource to support the operation and maintenance of the Harley power plants in September 2013 WAPA solicited proposals for an
Management Audit of VIWAPA – Final Report
February 10, 2015
Page 78
Independent Advisory Contractor (IAC)16. As defined in the request for proposal the IAC will have the responsibility to provide senior management with recommendations that upon acceptance and timely implementation by WAPA result in the following:
Definitive maintenance management planning processes and creation of a culture of maintenance management;
A program of prudent maintenance management and operating practices inclusive of revisions to system maintenance protocols;
Improvements to unit commitment and economic dispatch practices to insure the most cost effective utilization of units;
Performance based improvements that lead to improved unit availability rates and efficiency;
Measures that improve interim and longer-term unit efficiency and availability of units; and
Measures to restore unit availability and plant reliability in both the near-and long-term such that performance benchmarks are successfully achieved.
The IAC is intended to provide oversight and direction to senior management and shall have no day-to-day operating responsibilities nor shall it be responsible for implementation of its recommendations.
The IAC will provide the following day-to-day professional, technical and maintenance activities that are designed to bring the Harley power plant into compliance with reasonable unit availability and efficiency standards for generating units of their size, vintage and technology.
A Gap Analysis to measure the Harley’s current maintenance, operating and performance practices as compared to industry standards and make recommendations that form a Detail Work Plan (DWP).
An assessment of the current Harley Plant generation maintenance, outage planning and scheduling procedures and make recommendations to align each with industry standards.
An assessment of the Harley Plant outage planning and scheduling program and make recommendations to improve and update the current procedures and train plant manager and planners on the application of industry standard tools and practices.
An assessment of the Harley Plant’s current preventive and predictive maintenance programs and make recommendations to provide a system, program and requisite employee training that is consistent with an industry standard quality improvement program.
16 / Request For Proposals for an Independent Advisory Contractor for the Harley Generating Station PR-10-14, dated September 30, 2013.
Management Audit of VIWAPA – Final Report
February 10, 2015
Page 79
Complete an employee training needs assessment and make recommendation to support a five year personnel development plan for all plant personnel.
Defining and control of Performance Improvement Projects (PIP’s) procedures to include the appropriate justification, implementation and verification for these non-normal operation and maintenance projects.
Defining and control of Capital Improvement Projects (CIP’s) procedures to include the appropriate justification, implementation and verification for these larger capital projects.
Support in the preparation of the PIP and CIP budgets.
A staffing and organization design assessment to include a recommended functional and organizational chart and responsibility matrix for the Harley Plant.
Assist in the implementation of a root cause failure analysis program.
Assist in the development of an industry standard plant performance monitoring and testing program.
Assist in the WAPA environmental compliance program to assure compliance with the WAPA environmental air and water permit requirements.
Assist in the development of an operational and management support system to include the ongoing deployment of the Maximo maintenance management system, a review of the existing operating procedures and transformer maintenance procedures.
Assist in the development of a procurement support procedure to include vendor qualification, procurement practices and emergency procurement practices.
Assist in the development of a spare parts program and integrate it in the Maximo maintenance management system.
Make recommendations to improve the inter-plant communications system to assure all plant employees are aware of the current status of each unit. Also assist in the development of PIP and CIP schedule and budget status communications process.
Based upon a cursory review of the current capabilities of the WAPA personnel the management team and employees have the base skills required to support and further optimize the operation and maintenance of the WAPA generating assists, however additional focused support and direction is required to assure that the WAPA facilities have the Most Effective Organization in place to operate and maintain the generating units. All of the above noted activities can be provided with the support of a highly skilled and experienced team with support of OEM and specialized training and performance vendors to provide the above listed activities in a more efficient less costly manner.
V-F4 The Operations Department staffing at the Richmond and Harley power plants is consistent with the industry standards.
The five shifts, four operators, plus a shift supervisor is supported by a Quality Control Department (QC). The QC department includes a four position boiler water chemistry group, a four position fuel controls group and a two position results group for each plant.
Management Audit of VIWAPA – Final Report
February 10, 2015
Page 80
V-R2 Investigate the potential for reducing the size of the Fuels Control Group at each power plant after the completion of the propane conversion project. (Priority: High)
Once the LPG project is completed, the work requirements for the fuels group should be investigated for possible adjustments.
V-F5 The maintenance staff at the Harley and Richmond power plants appear to be excessive with inadequate focus on the core competency requirements.
The recently completed capital improvements, as noted above, coupled with the support of selected contractors of major systems through master service agreements should enable the Harley and Richmond facilities to focus on their true core competencies. Core competencies are particular strengths relative to other organizations in the power industry which provide the fundamental basis for the provision of added value. Core competencies are difficult to imitate and support the complex harmonization of individual technologies and operational skills.
The core competencies of a typical combined cycle generating facility that is similar to the Richmond and Harley facilities are associated with the operation of the units supported by distributed control system (DCS) and maintenance management system (MMS) technology enablers. These technology enablers are typically maintained by trained and experienced instrument, control and electrical technicians. Recognizing that the logistic associated with maintaining power generating facilities on an island, a small cadre of skilled mechanics and millwrights may augment each power plant’s organization design.
V-R3 Restructure the production maintenance staff at the Richmond and Harley generating plants to focus on core competencies and reduce the maintenance costs of each facility. (Priority: High)
Typically an organization design and right sizing study is required to assure that the plant operation and maintenance processes are analyzed and mapped to maximize the effectiveness of the recent installed technology enablers (i.e. distributed control system, maintenance management system, GE Mark IV turbine controls, and automatic voltage regulator) are deployed to support these processes.
Develop contractual agreements or master service agreements with select major equipment vendors (i.e. turbine/generator, transformer, pump, and valve) service organizations. In addition seek to outsource the following non-core functions:
Welding
Pipe fitting
Insulating
Painting
Structural construction
Mechanical construction

Management Audit of VIWAPA – Final Report
February 10, 2015
Page 81
Electrical construction
Facilities maintenance
The realignment of the Richmond and Harley maintenance department, as detailed on the following plant staffing summaries would result in a reduction of 36 positions for both plants. The majority of the WAPA reductions are associated with the outsourcing of non-core competency activities to local vendors, which would be at a significant lower cost.
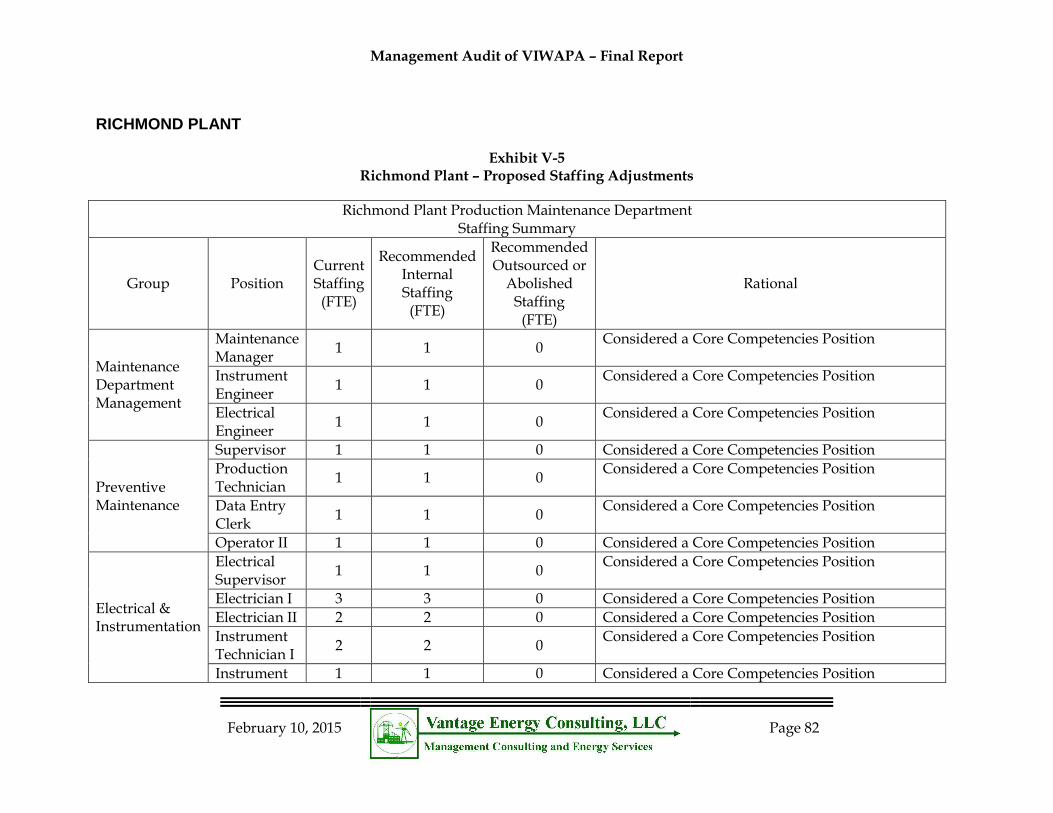
Management Audit of VIWAPA – Final Report
February 10, 2015
Page 82
RICHMOND PLANT
Exhibit V-5 Richmond Plant – Proposed Staffing Adjustments
Richmond Plant Production Maintenance Department Staffing Summary
Group Position Current Staffing (FTE)
Recommended Internal Staffing
(FTE)
Recommended Outsourced or
Abolished Staffing
(FTE)
Rational
Maintenance Department Management
Maintenance Manager
1 1 0 Considered a Core Competencies Position
Instrument Engineer
1 1 0 Considered a Core Competencies Position
Electrical Engineer
1 1 0 Considered a Core Competencies Position
Preventive Maintenance
Supervisor 1 1 0 Considered a Core Competencies Position
Production Technician
1 1 0 Considered a Core Competencies Position
Data Entry Clerk
1 1 0 Considered a Core Competencies Position
Operator II 1 1 0 Considered a Core Competencies Position
Electrical & Instrumentation
Electrical Supervisor
1 1 0 Considered a Core Competencies Position
Electrician I 3 3 0 Considered a Core Competencies Position
Electrician II 2 2 0 Considered a Core Competencies Position
Instrument Technician I
2 2 0 Considered a Core Competencies Position
Instrument 1 1 0 Considered a Core Competencies Position
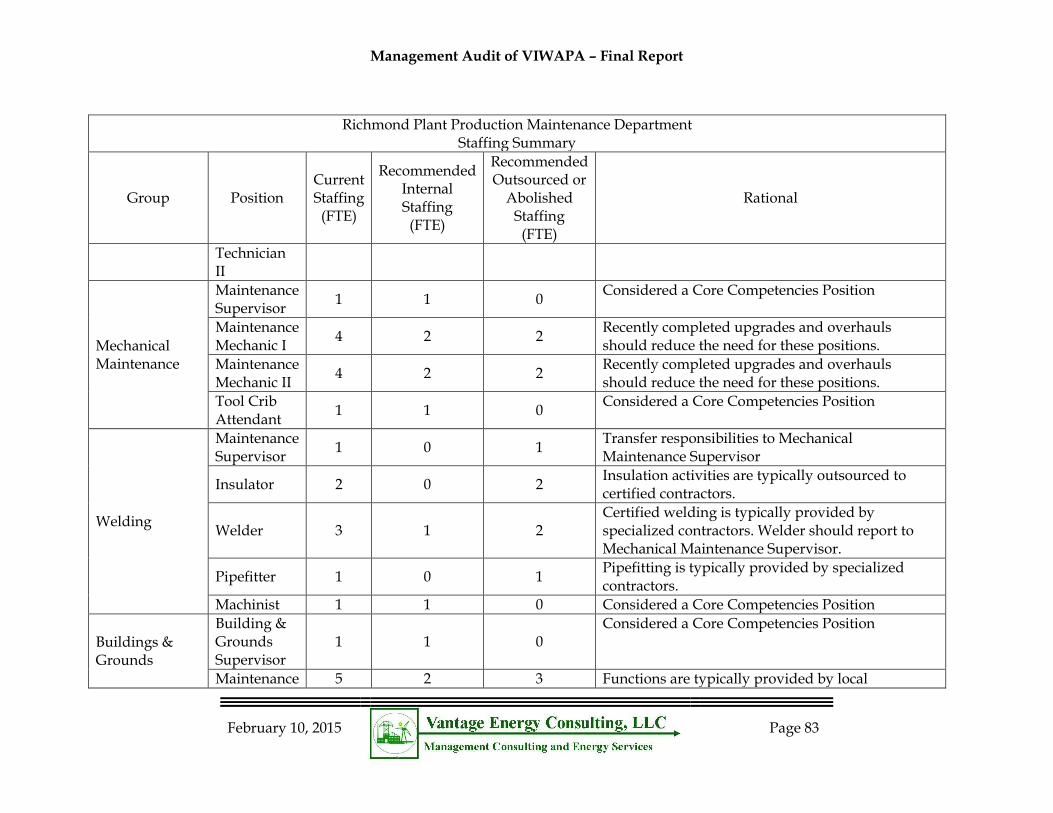
Management Audit of VIWAPA – Final Report
February 10, 2015
Page 83
Richmond Plant Production Maintenance Department Staffing Summary
Group Position Current Staffing (FTE)
Recommended Internal Staffing
(FTE)
Recommended Outsourced or
Abolished Staffing
(FTE)
Rational
Technician II
Mechanical Maintenance
Maintenance Supervisor
1 1 0 Considered a Core Competencies Position
Maintenance Mechanic I
4 2 2 Recently completed upgrades and overhauls should reduce the need for these positions.
Maintenance Mechanic II
4 2 2 Recently completed upgrades and overhauls should reduce the need for these positions.
Tool Crib Attendant
1 1 0 Considered a Core Competencies Position
Welding
Maintenance Supervisor
1 0 1 Transfer responsibilities to Mechanical Maintenance Supervisor
Insulator 2 0 2 Insulation activities are typically outsourced to certified contractors.
Welder 3 1 2 Certified welding is typically provided by specialized contractors. Welder should report to Mechanical Maintenance Supervisor.
Pipefitter 1 0 1 Pipefitting is typically provided by specialized contractors.
Machinist 1 1 0 Considered a Core Competencies Position
Buildings & Grounds
Building & Grounds Supervisor
1 1 0 Considered a Core Competencies Position
Maintenance 5 2 3 Functions are typically provided by local
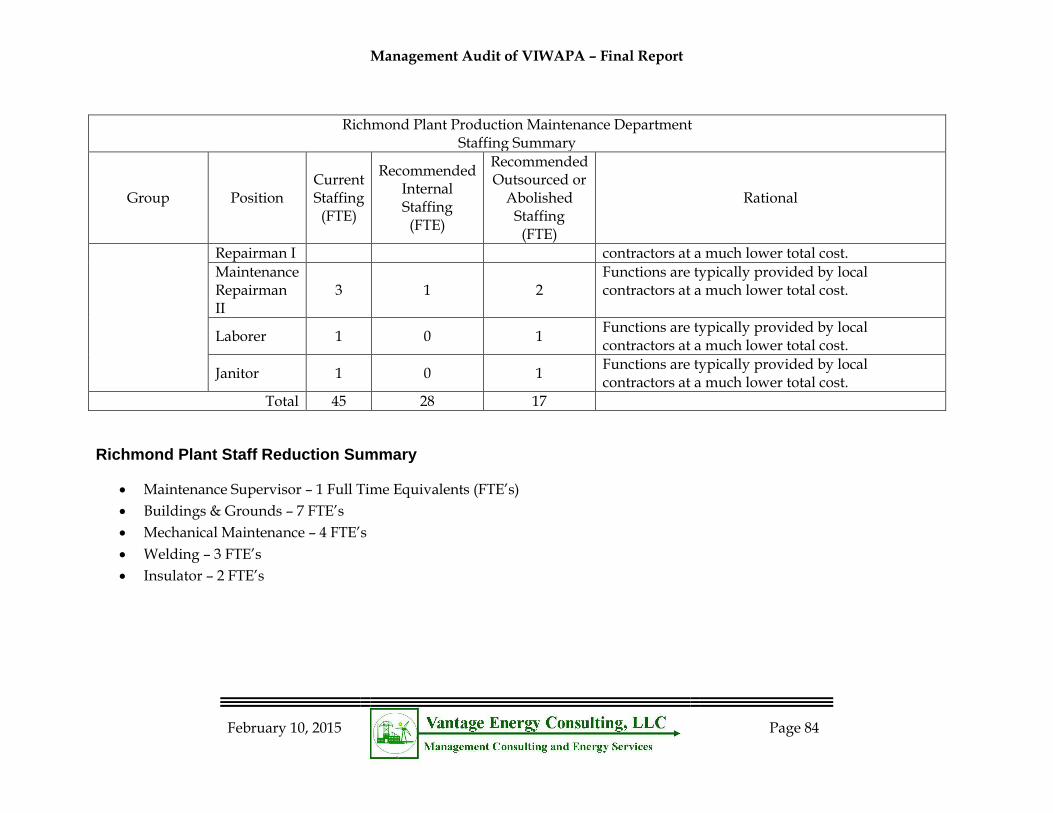
Management Audit of VIWAPA – Final Report
February 10, 2015
Page 84
Richmond Plant Production Maintenance Department Staffing Summary
Group Position Current Staffing (FTE)
Recommended Internal Staffing
(FTE)
Recommended Outsourced or
Abolished Staffing
(FTE)
Rational
Repairman I contractors at a much lower total cost.
Maintenance Repairman II
3 1 2 Functions are typically provided by local contractors at a much lower total cost.
Laborer 1 0 1 Functions are typically provided by local contractors at a much lower total cost.
Janitor 1 0 1 Functions are typically provided by local contractors at a much lower total cost.
Total 45 28 17
Richmond Plant Staff Reduction Summary
Maintenance Supervisor – 1 Full Time Equivalents (FTE’s)
Buildings & Grounds – 7 FTE’s
Mechanical Maintenance – 4 FTE’s
Welding – 3 FTE’s
Insulator – 2 FTE’s
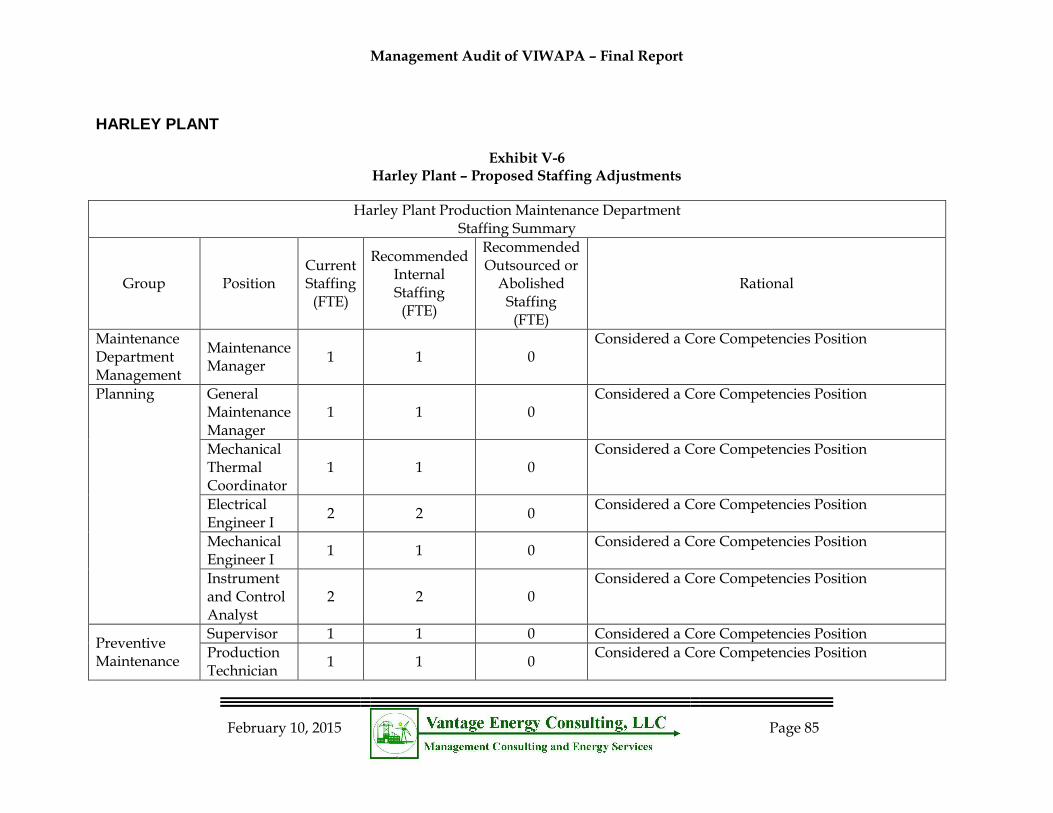
Management Audit of VIWAPA – Final Report
February 10, 2015
Page 85
HARLEY PLANT
Exhibit V-6 Harley Plant – Proposed Staffing Adjustments
Harley Plant Production Maintenance Department Staffing Summary
Group Position Current Staffing
(FTE)
Recommended Internal Staffing
(FTE)
Recommended Outsourced or
Abolished Staffing (FTE)
Rational
Maintenance Department Management
Maintenance Manager
1 1 0 Considered a Core Competencies Position
Planning General Maintenance Manager
1 1 0 Considered a Core Competencies Position
Mechanical Thermal Coordinator
1 1 0 Considered a Core Competencies Position
Electrical Engineer I
2 2 0 Considered a Core Competencies Position
Mechanical Engineer I
1 1 0 Considered a Core Competencies Position
Instrument and Control Analyst
2 2 0 Considered a Core Competencies Position
Preventive Maintenance
Supervisor 1 1 0 Considered a Core Competencies Position
Production Technician
1 1 0 Considered a Core Competencies Position
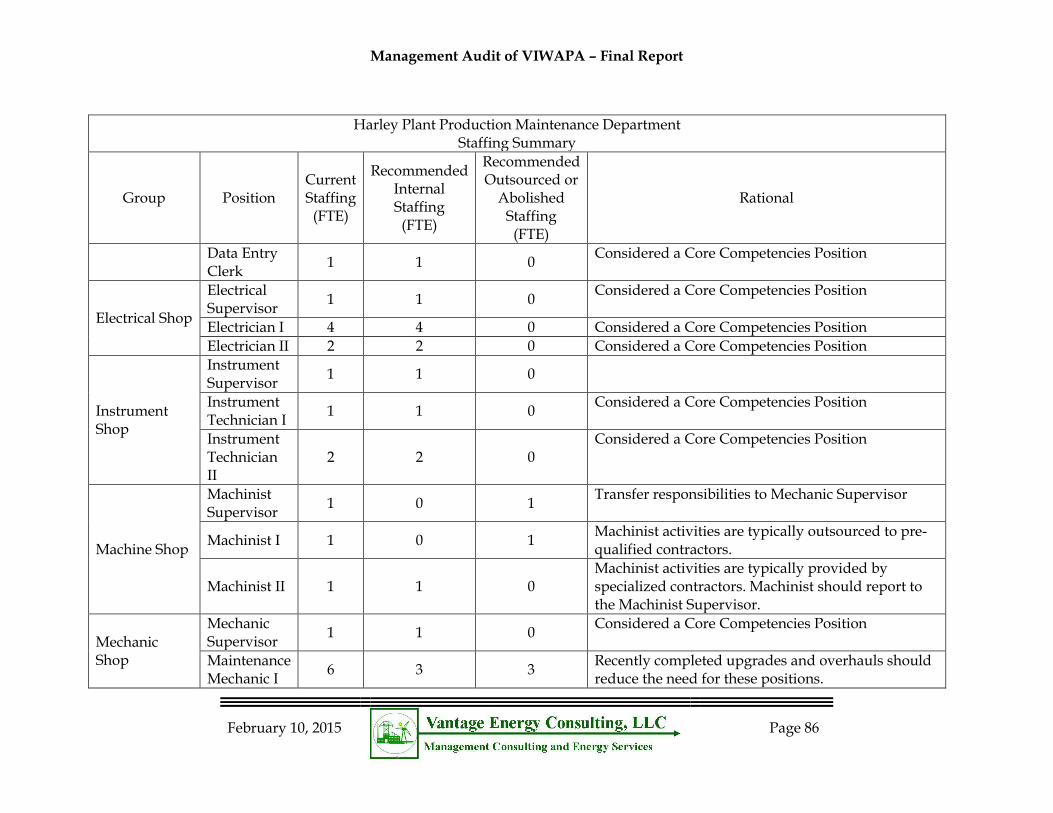
Management Audit of VIWAPA – Final Report
February 10, 2015
Page 86
Harley Plant Production Maintenance Department Staffing Summary
Group Position Current Staffing
(FTE)
Recommended Internal Staffing
(FTE)
Recommended Outsourced or
Abolished Staffing (FTE)
Rational
Data Entry Clerk
1 1 0 Considered a Core Competencies Position
Electrical Shop
Electrical Supervisor
1 1 0 Considered a Core Competencies Position
Electrician I 4 4 0 Considered a Core Competencies Position
Electrician II 2 2 0 Considered a Core Competencies Position
Instrument Shop
Instrument Supervisor
1 1 0
Instrument Technician I
1 1 0 Considered a Core Competencies Position
Instrument Technician II
2 2 0 Considered a Core Competencies Position
Machine Shop
Machinist Supervisor
1 0 1 Transfer responsibilities to Mechanic Supervisor
Machinist I 1 0 1 Machinist activities are typically outsourced to pre-qualified contractors.
Machinist II 1 1 0 Machinist activities are typically provided by specialized contractors. Machinist should report to the Machinist Supervisor.
Mechanic Shop
Mechanic Supervisor
1 1 0 Considered a Core Competencies Position
Maintenance Mechanic I
6 3 3 Recently completed upgrades and overhauls should reduce the need for these positions.
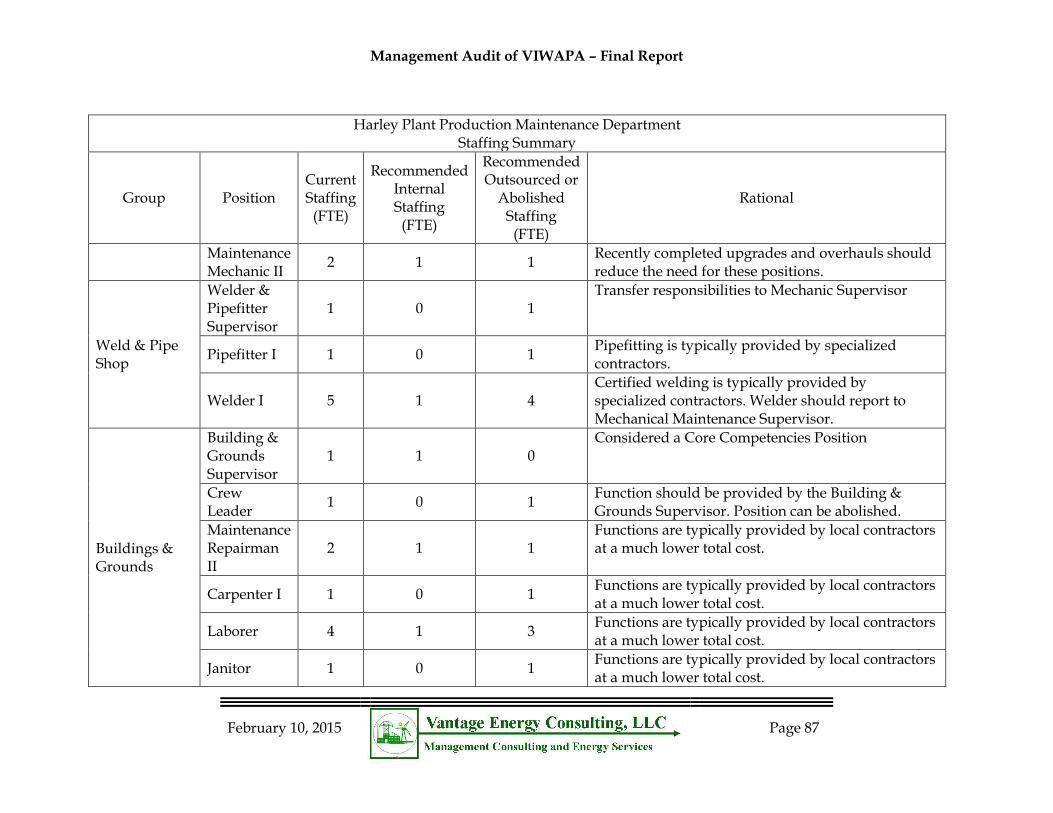
Management Audit of VIWAPA – Final Report
February 10, 2015
Page 87
Harley Plant Production Maintenance Department Staffing Summary
Group Position Current Staffing
(FTE)
Recommended Internal Staffing
(FTE)
Recommended Outsourced or
Abolished Staffing (FTE)
Rational
Maintenance Mechanic II
2 1 1 Recently completed upgrades and overhauls should reduce the need for these positions.
Weld & Pipe Shop
Welder & Pipefitter Supervisor
1 0 1 Transfer responsibilities to Mechanic Supervisor
Pipefitter I 1 0 1 Pipefitting is typically provided by specialized contractors.
Welder I 5 1 4 Certified welding is typically provided by specialized contractors. Welder should report to Mechanical Maintenance Supervisor.
Buildings & Grounds
Building & Grounds Supervisor
1 1 0 Considered a Core Competencies Position
Crew Leader
1 0 1 Function should be provided by the Building & Grounds Supervisor. Position can be abolished.
Maintenance Repairman II
2 1 1 Functions are typically provided by local contractors at a much lower total cost.
Carpenter I 1 0 1 Functions are typically provided by local contractors at a much lower total cost.
Laborer 4 1 3 Functions are typically provided by local contractors at a much lower total cost.
Janitor 1 0 1 Functions are typically provided by local contractors at a much lower total cost.
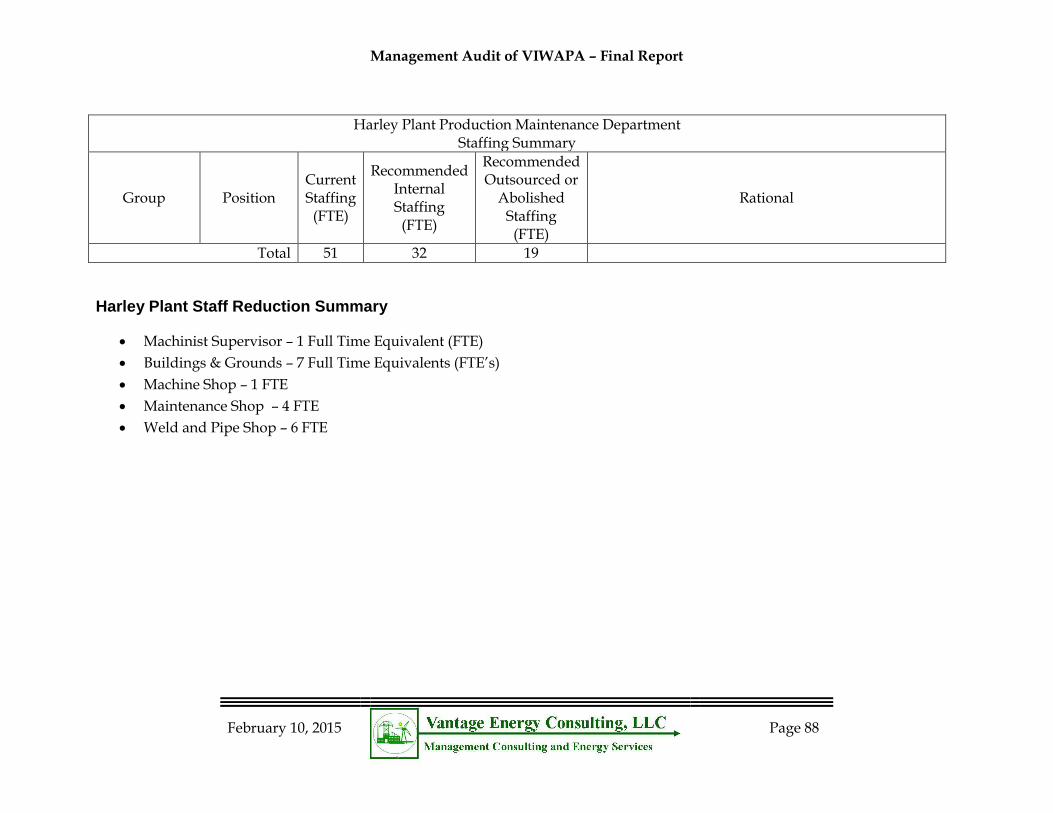
Management Audit of VIWAPA – Final Report
February 10, 2015
Page 88
Harley Plant Production Maintenance Department Staffing Summary
Group Position Current Staffing
(FTE)
Recommended Internal Staffing
(FTE)
Recommended Outsourced or
Abolished Staffing (FTE)
Rational
Total 51 32 19
Harley Plant Staff Reduction Summary
Machinist Supervisor – 1 Full Time Equivalent (FTE)
Buildings & Grounds – 7 Full Time Equivalents (FTE’s)
Machine Shop – 1 FTE
Maintenance Shop – 4 FTE
Weld and Pipe Shop – 6 FTE
Management Audit of VIWAPA – Final Report
February 10, 2015
Page 89
The new organization design will enable all the power plant managers to concentrate resources on the development of a highly skilled Most Effective Organization (MEO) that is focused on the reliability, availability and performance of the current fleet of generating units. A more detailed organization design analysis is required to determine the size and staffing of the MEO.
TRANSMISSION AND DISTRIBUTION
The increased use of technology, better designed heavy equipment, improved communication, GPS/GIS mapping capability, OMS, standardized equipment and procedures have all enabled both crew sizes and total numbers of crews to decrease at utilities throughout the world. Crew sizes at many utilities have been reduced to “two person crews” for normal projects, with combined crews for more extensive work. The number of crews per thousand customers has also decreased across the industry.
V-F6 Based on our review of the T&D staffing of the St. Thomas, St. Croix and St. John line departments, the associated four man line crew is in excess average crew size of three men. Also, there appears to be more line crews than a modern utility would expect, despite the geographic issues WAPA faces.
A preliminary review of WAPA shows the following:
St. Thomas has five T&D crews each with a supervisor and three to five direct reports. It also has a currently vacant position for another supervisor and a Tree Trimming supervisor with two reports, as detailed below.
St. Croix has six supervisors for maintenance, night shifts, tree trimming, and construction. It appears that the titles and organization are different than for St. Thomas, as detailed below.
St. John Line department consists of three line crews; one line crew with a supervisor and five crew members, one with a supervisor and two crew members and one vacant crew position of supervisor and crew member, as detailed below.
This is a ratio of fourteen budgeted supervisors and crews for about 55,000 customers, or about 4,000 customers per crew. On St. Johns, there are only 3,100 customers with three crews.
Based on a review of the American Public Power Association17 survey, the majority of line maintenance is provided on the day shift with on-call line crews available for the back shifts. Also the average number of journeyman linemen per crew is
17 /American Public Power Association Distribution System Reliability & Operations Survey, date November 2012.
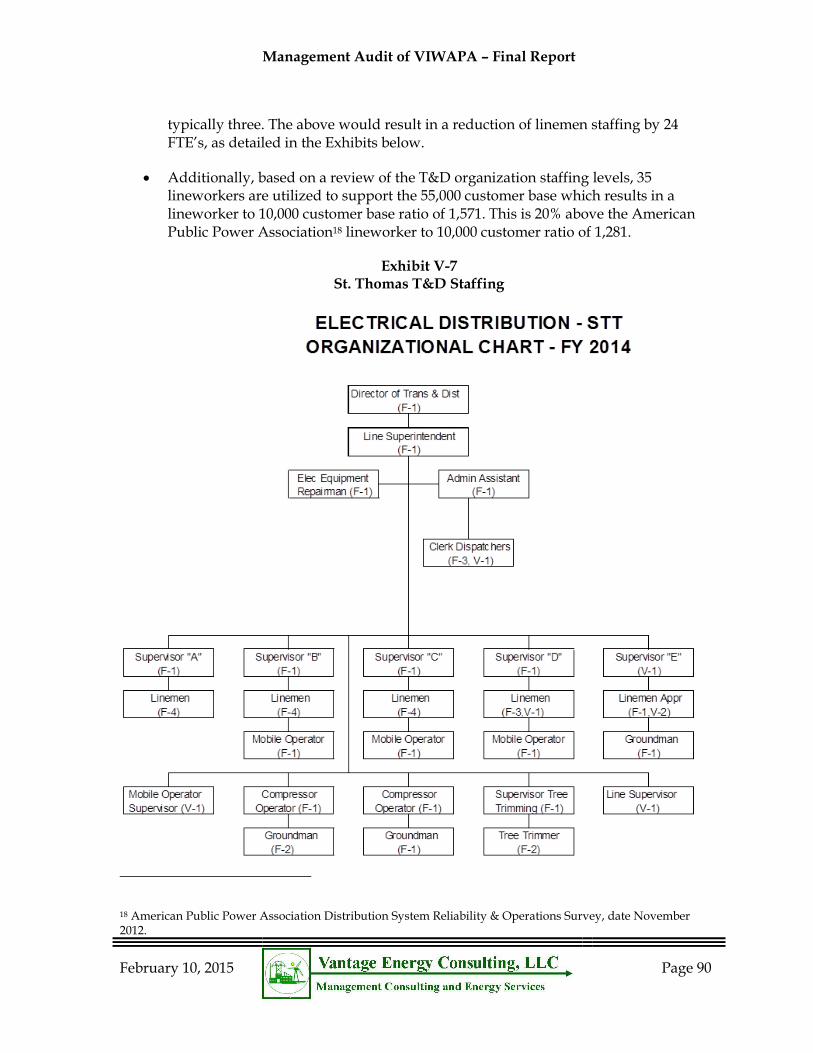
Management Audit of VIWAPA – Final Report
February 10, 2015
Page 90
typically three. The above would result in a reduction of linemen staffing by 24 FTE’s, as detailed in the Exhibits below.
Additionally, based on a review of the T&D organization staffing levels, 35 lineworkers are utilized to support the 55,000 customer base which results in a lineworker to 10,000 customer base ratio of 1,571. This is 20% above the American Public Power Association18 lineworker to 10,000 customer ratio of 1,281.
Exhibit V-7 St. Thomas T&D Staffing
18 American Public Power Association Distribution System Reliability & Operations Survey, date November 2012.
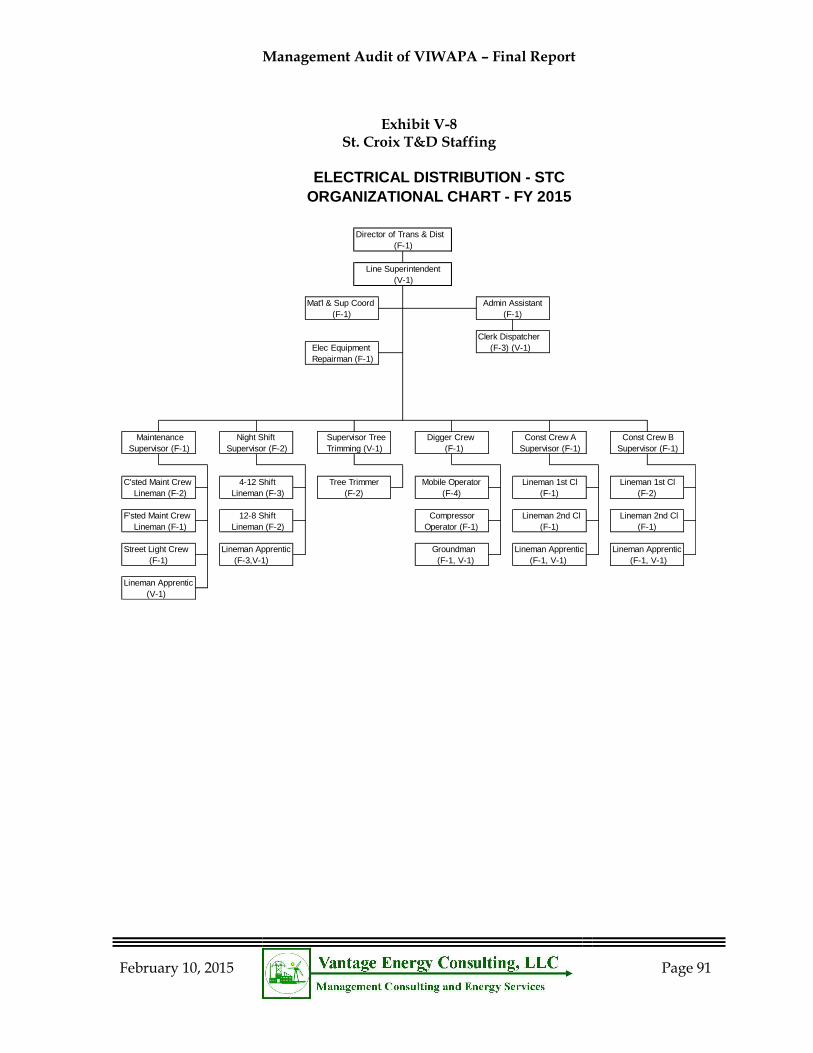
Management Audit of VIWAPA – Final Report
February 10, 2015
Page 91
Exhibit V-8 St. Croix T&D Staffing
ELECTRICAL DISTRIBUTION - STC
ORGANIZATIONAL CHART - FY 2015
Director of Trans & Dist
(F-1)
Line Superintendent
(V-1)
Mat'l & Sup Coord Admin Assistant
(F-1) (F-1)
Clerk Dispatcher
Elec Equipment (F-3) (V-1)
Repairman (F-1)
Maintenance Night Shift Supervisor Tree Digger Crew Const Crew A Const Crew B
Supervisor (F-1) Supervisor (F-2) Trimming (V-1) (F-1) Supervisor (F-1) Supervisor (F-1)
C'sted Maint Crew 4-12 Shift Tree Trimmer Mobile Operator Lineman 1st Cl Lineman 1st Cl
Lineman (F-2) Lineman (F-3) (F-2) (F-4) (F-1) (F-2)
F'sted Maint Crew 12-8 Shift Compressor Lineman 2nd Cl Lineman 2nd Cl
Lineman (F-1) Lineman (F-2) Operator (F-1) (F-1) (F-1)
Street Light Crew Lineman Apprentic Groundman Lineman Apprentic Lineman Apprentic
(F-1) (F-3,V-1) (F-1, V-1) (F-1, V-1) (F-1, V-1)
Lineman Apprentic
(V-1)
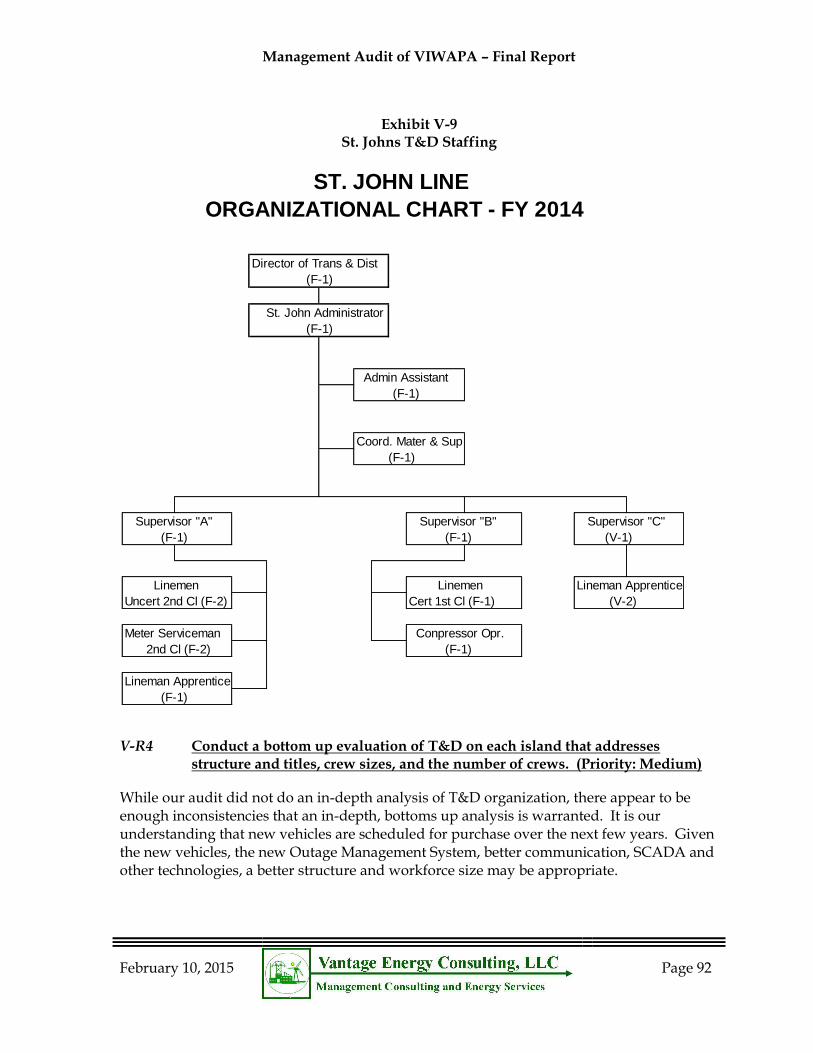
Management Audit of VIWAPA – Final Report
February 10, 2015
Page 92
Exhibit V-9 St. Johns T&D Staffing
V-R4 Conduct a bottom up evaluation of T&D on each island that addresses structure and titles, crew sizes, and the number of crews. (Priority: Medium)
While our audit did not do an in-depth analysis of T&D organization, there appear to be enough inconsistencies that an in-depth, bottoms up analysis is warranted. It is our understanding that new vehicles are scheduled for purchase over the next few years. Given the new vehicles, the new Outage Management System, better communication, SCADA and other technologies, a better structure and workforce size may be appropriate.
ST. JOHN LINE
ORGANIZATIONAL CHART - FY 2014
Director of Trans & Dist
(F-1)
St. John Administrator
(F-1)
Admin Assistant
(F-1) (F-1)
Coord. Mater & Sup
Supervisor "A" Supervisor "B" Supervisor "C"
(F-1) (F-1) (V-1)
Linemen Linemen Lineman Apprentice
Uncert 2nd Cl (F-2) Cert 1st Cl (F-1) (V-2)
Meter Serviceman Conpressor Opr.
2nd Cl (F-2) (F-1)
Lineman Apprentice
(F-1)
(F-1)
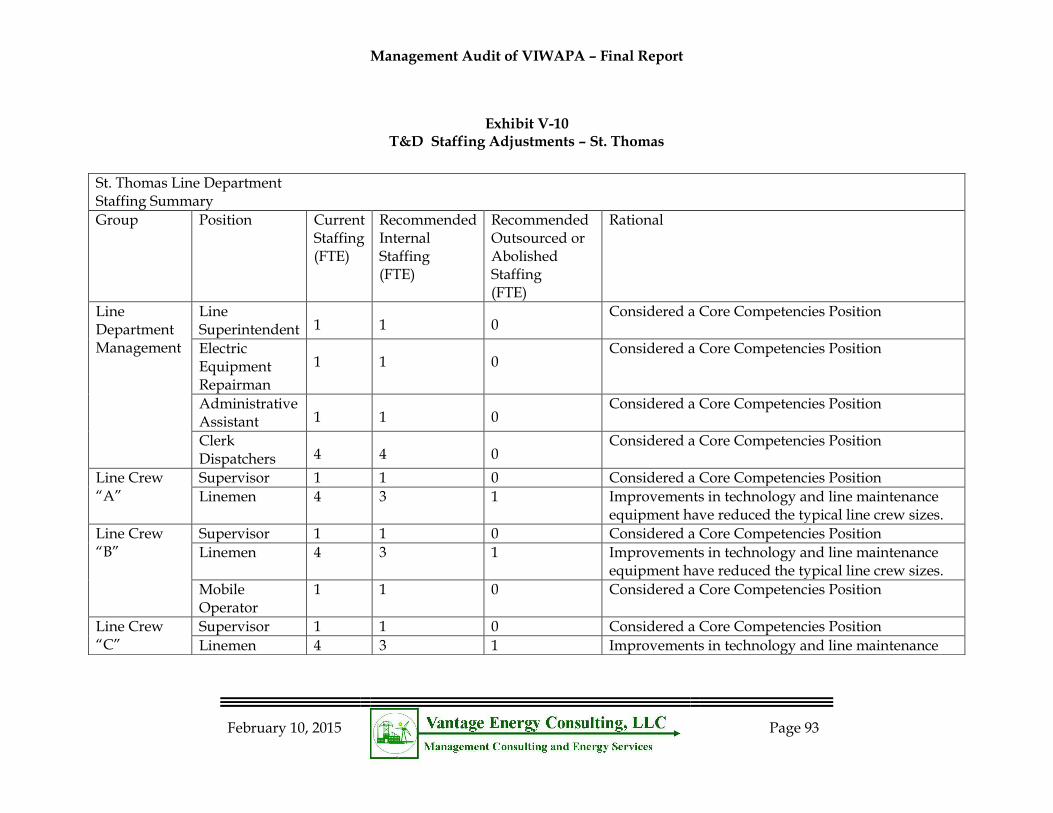
Management Audit of VIWAPA – Final Report
February 10, 2015
Page 93
Exhibit V-10 T&D Staffing Adjustments – St. Thomas
St. Thomas Line Department Staffing Summary
Group Position Current Staffing (FTE)
Recommended Internal Staffing (FTE)
Recommended Outsourced or Abolished Staffing (FTE)
Rational
Line Department Management
Line Superintendent 1 1 0
Considered a Core Competencies Position
Electric Equipment Repairman
1 1 0 Considered a Core Competencies Position
Administrative Assistant 1 1 0
Considered a Core Competencies Position
Clerk Dispatchers 4 4 0
Considered a Core Competencies Position
Line Crew “A”
Supervisor 1 1 0 Considered a Core Competencies Position
Linemen 4 3 1 Improvements in technology and line maintenance equipment have reduced the typical line crew sizes.
Line Crew “B”
Supervisor 1 1 0 Considered a Core Competencies Position
Linemen 4 3 1 Improvements in technology and line maintenance equipment have reduced the typical line crew sizes.
Mobile Operator
1 1 0 Considered a Core Competencies Position
Line Crew “C”
Supervisor 1 1 0 Considered a Core Competencies Position
Linemen 4 3 1 Improvements in technology and line maintenance
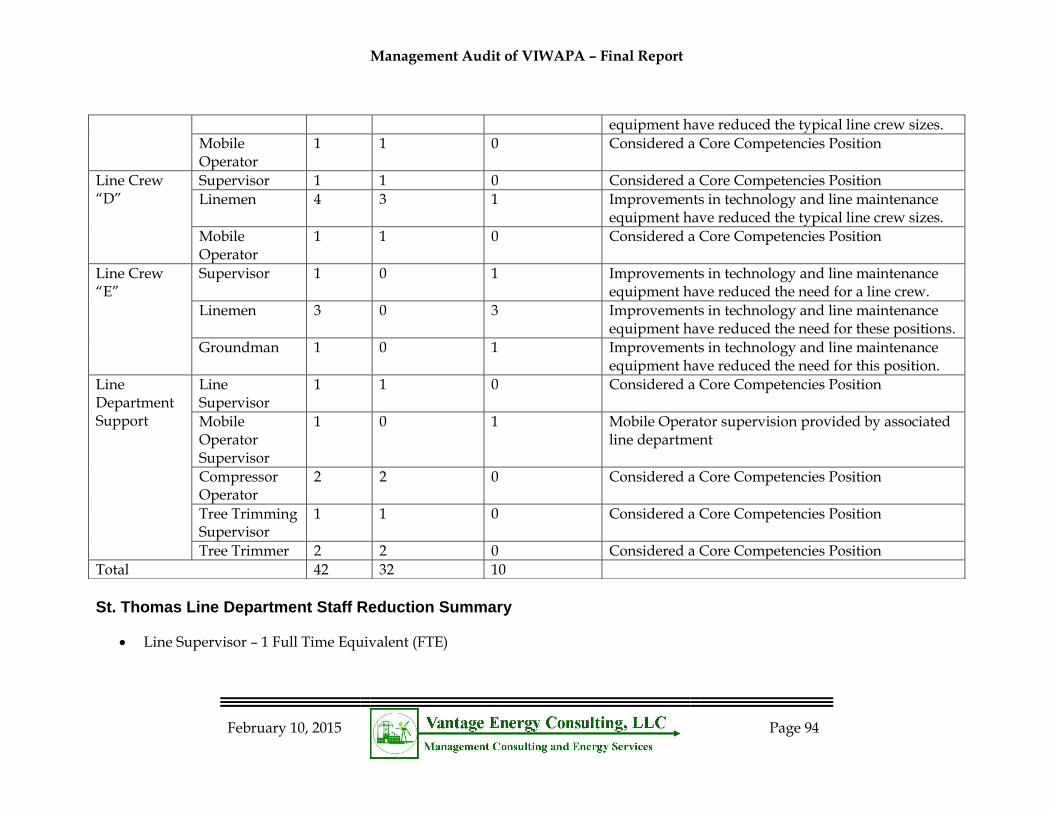
Management Audit of VIWAPA – Final Report
February 10, 2015
Page 94
St. Thomas Line Department Staff Reduction Summary
Line Supervisor – 1 Full Time Equivalent (FTE)
equipment have reduced the typical line crew sizes.
Mobile Operator
1 1 0 Considered a Core Competencies Position
Line Crew “D”
Supervisor 1 1 0 Considered a Core Competencies Position
Linemen 4 3 1 Improvements in technology and line maintenance equipment have reduced the typical line crew sizes.
Mobile Operator
1 1 0 Considered a Core Competencies Position
Line Crew “E”
Supervisor 1 0 1 Improvements in technology and line maintenance equipment have reduced the need for a line crew.
Linemen 3 0 3 Improvements in technology and line maintenance equipment have reduced the need for these positions.
Groundman 1 0 1 Improvements in technology and line maintenance equipment have reduced the need for this position.
Line Department Support
Line Supervisor
1 1 0 Considered a Core Competencies Position
Mobile Operator Supervisor
1 0 1 Mobile Operator supervision provided by associated line department
Compressor Operator
2 2 0 Considered a Core Competencies Position
Tree Trimming Supervisor
1 1 0 Considered a Core Competencies Position
Tree Trimmer 2 2 0 Considered a Core Competencies Position
Total 42 32 10
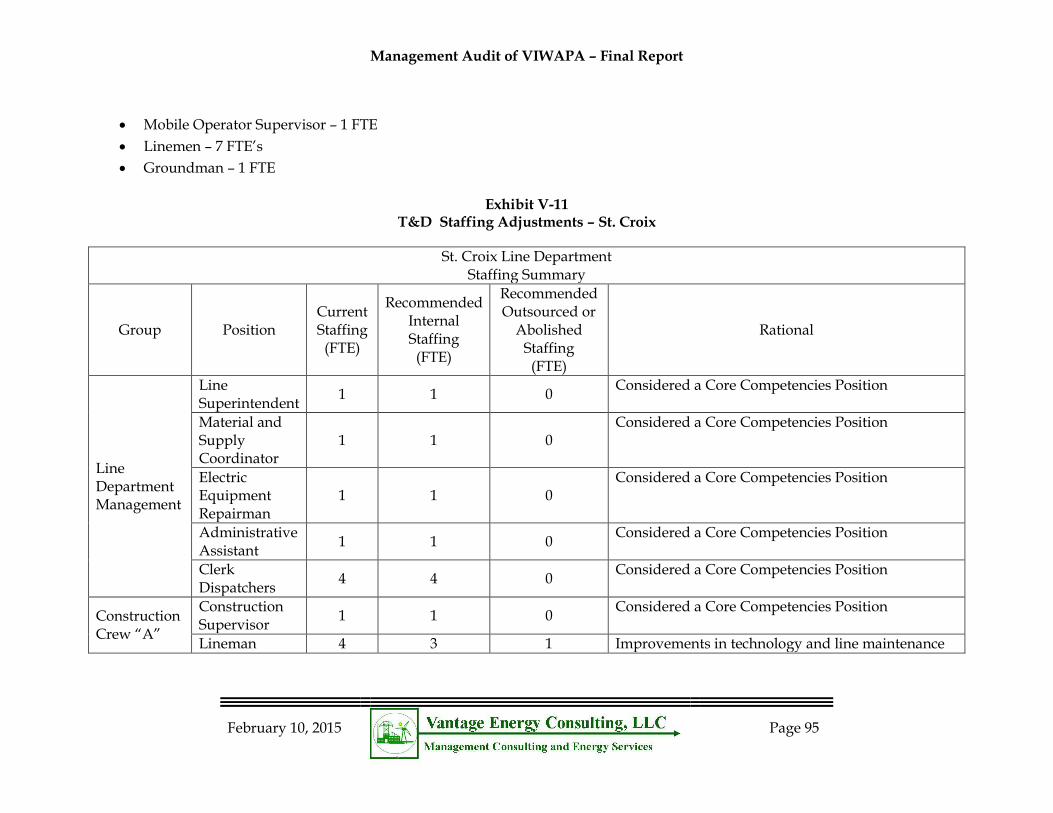
Management Audit of VIWAPA – Final Report
February 10, 2015
Page 95
Mobile Operator Supervisor – 1 FTE
Linemen – 7 FTE’s
Groundman – 1 FTE
Exhibit V-11 T&D Staffing Adjustments – St. Croix
St. Croix Line Department Staffing Summary
Group Position Current Staffing
(FTE)
Recommended Internal Staffing (FTE)
Recommended Outsourced or
Abolished Staffing (FTE)
Rational
Line Department Management
Line Superintendent
1 1 0 Considered a Core Competencies Position
Material and Supply Coordinator
1 1 0 Considered a Core Competencies Position
Electric Equipment Repairman
1 1 0 Considered a Core Competencies Position
Administrative Assistant
1 1 0 Considered a Core Competencies Position
Clerk Dispatchers
4 4 0 Considered a Core Competencies Position
Construction Crew “A”
Construction Supervisor
1 1 0 Considered a Core Competencies Position
Lineman 4 3 1 Improvements in technology and line maintenance
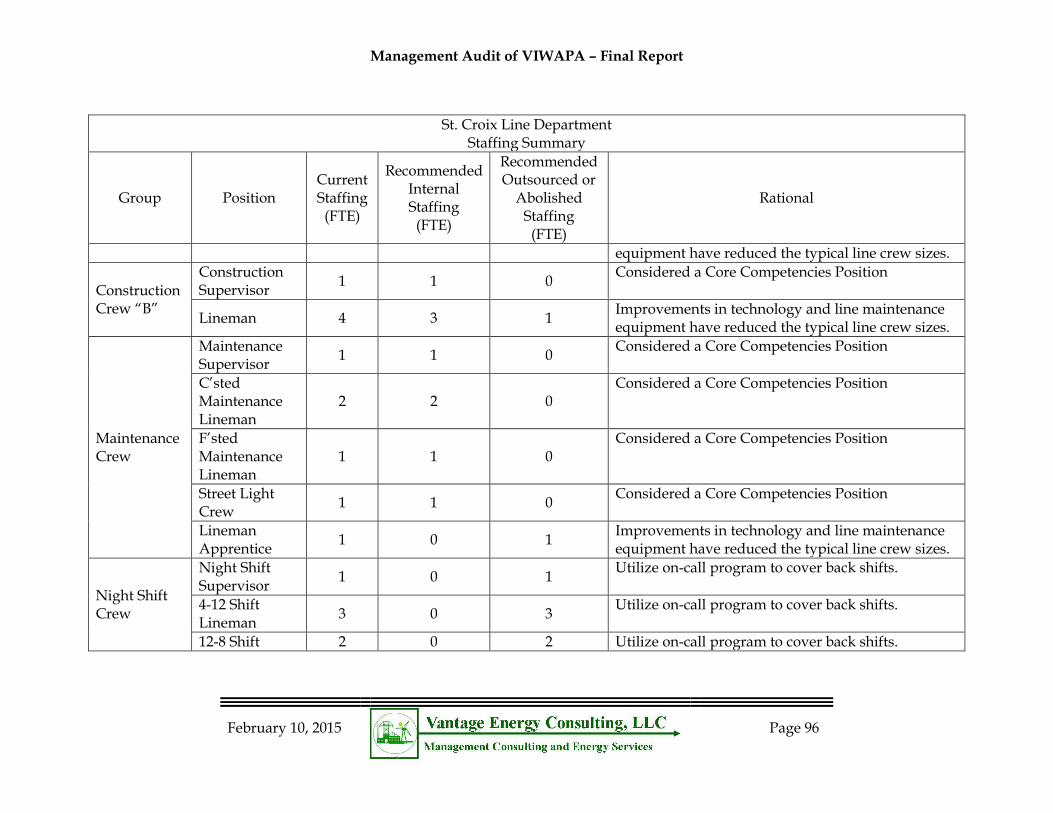
Management Audit of VIWAPA – Final Report
February 10, 2015
Page 96
St. Croix Line Department Staffing Summary
Group Position Current Staffing
(FTE)
Recommended Internal Staffing (FTE)
Recommended Outsourced or
Abolished Staffing (FTE)
Rational
equipment have reduced the typical line crew sizes.
Construction Crew “B”
Construction Supervisor
1 1 0 Considered a Core Competencies Position
Lineman 4 3 1 Improvements in technology and line maintenance equipment have reduced the typical line crew sizes.
Maintenance Crew
Maintenance Supervisor
1 1 0 Considered a Core Competencies Position
C’sted Maintenance Lineman
2 2 0 Considered a Core Competencies Position
F’sted Maintenance Lineman
1 1 0 Considered a Core Competencies Position
Street Light Crew
1 1 0 Considered a Core Competencies Position
Lineman Apprentice
1 0 1 Improvements in technology and line maintenance equipment have reduced the typical line crew sizes.
Night Shift Crew
Night Shift Supervisor
1 0 1 Utilize on-call program to cover back shifts.
4-12 Shift Lineman
3 0 3 Utilize on-call program to cover back shifts.
12-8 Shift 2 0 2 Utilize on-call program to cover back shifts.
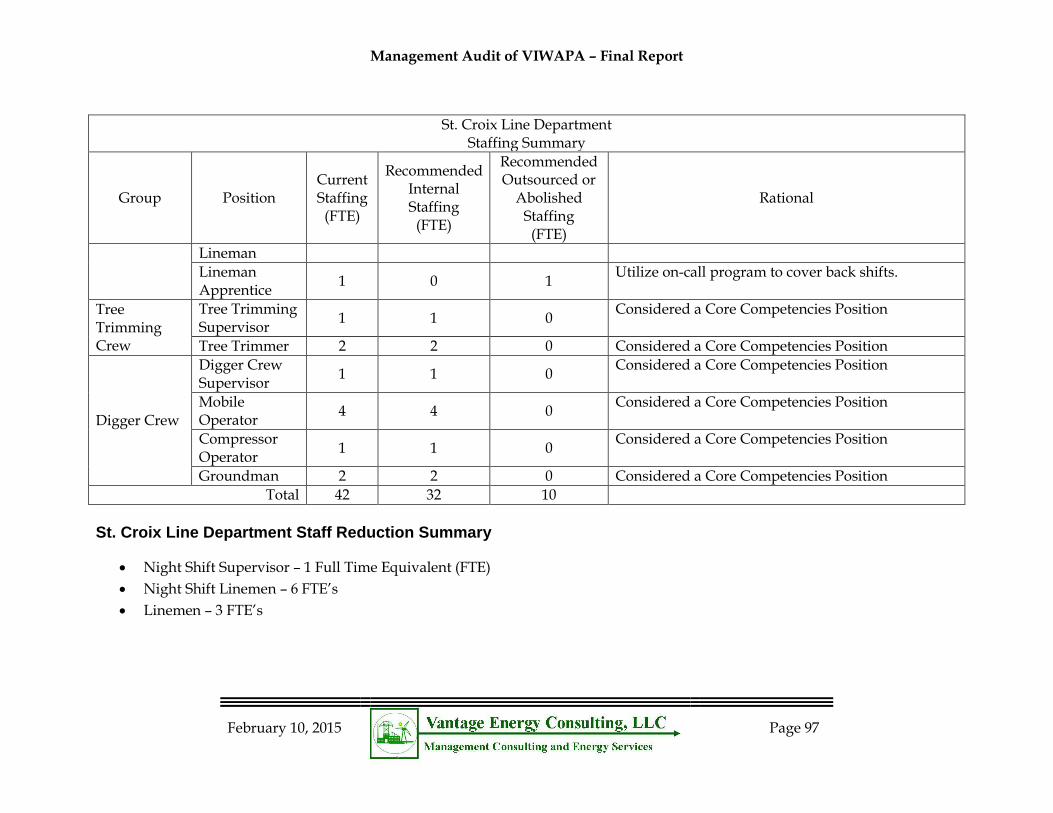
Management Audit of VIWAPA – Final Report
February 10, 2015
Page 97
St. Croix Line Department Staffing Summary
Group Position Current Staffing
(FTE)
Recommended Internal Staffing (FTE)
Recommended Outsourced or
Abolished Staffing (FTE)
Rational
Lineman
Lineman Apprentice
1 0 1 Utilize on-call program to cover back shifts.
Tree Trimming Crew
Tree Trimming Supervisor
1 1 0 Considered a Core Competencies Position
Tree Trimmer 2 2 0 Considered a Core Competencies Position
Digger Crew
Digger Crew Supervisor
1 1 0 Considered a Core Competencies Position
Mobile Operator
4 4 0 Considered a Core Competencies Position
Compressor Operator
1 1 0 Considered a Core Competencies Position
Groundman 2 2 0 Considered a Core Competencies Position
Total 42 32 10
St. Croix Line Department Staff Reduction Summary
Night Shift Supervisor – 1 Full Time Equivalent (FTE)
Night Shift Linemen – 6 FTE’s
Linemen – 3 FTE’s
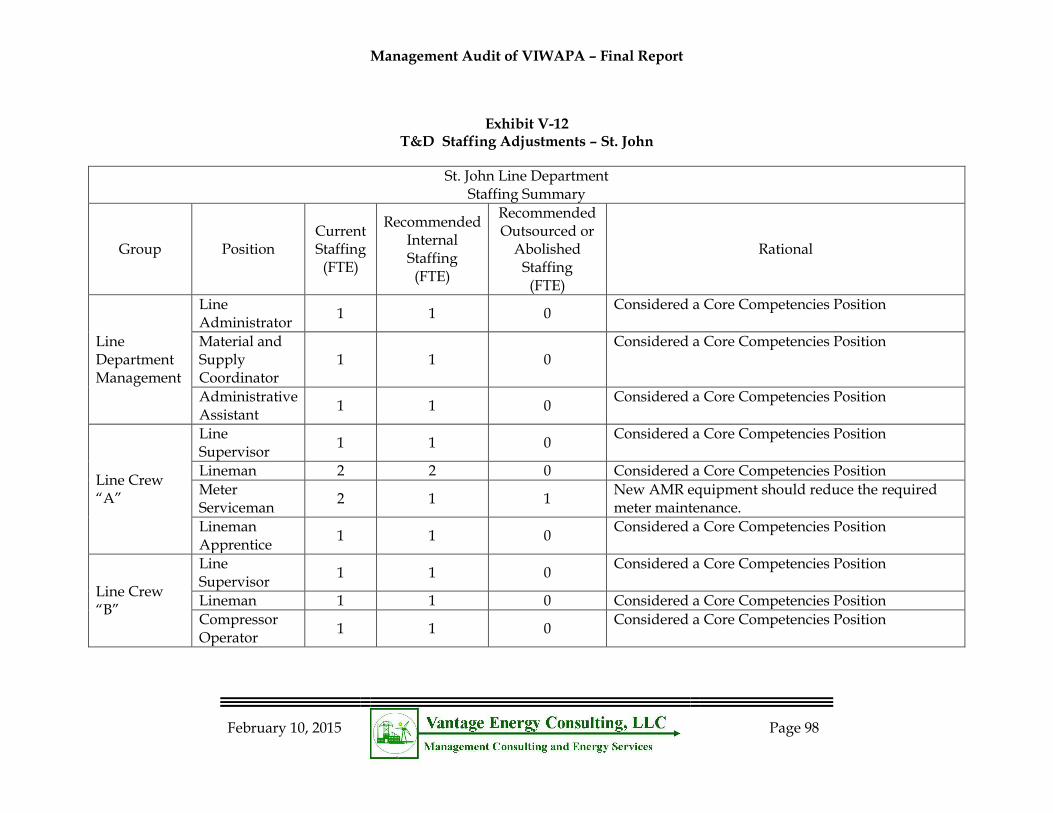
Management Audit of VIWAPA – Final Report
February 10, 2015
Page 98
Exhibit V-12 T&D Staffing Adjustments – St. John
St. John Line Department Staffing Summary
Group Position Current Staffing
(FTE)
Recommended Internal Staffing
(FTE)
Recommended Outsourced or
Abolished Staffing (FTE)
Rational
Line Department Management
Line Administrator
1 1 0 Considered a Core Competencies Position
Material and Supply Coordinator
1 1 0 Considered a Core Competencies Position
Administrative Assistant
1 1 0 Considered a Core Competencies Position
Line Crew “A”
Line Supervisor
1 1 0 Considered a Core Competencies Position
Lineman 2 2 0 Considered a Core Competencies Position
Meter Serviceman
2 1 1 New AMR equipment should reduce the required meter maintenance.
Lineman Apprentice
1 1 0 Considered a Core Competencies Position
Line Crew “B”
Line Supervisor
1 1 0 Considered a Core Competencies Position
Lineman 1 1 0 Considered a Core Competencies Position
Compressor Operator
1 1 0 Considered a Core Competencies Position
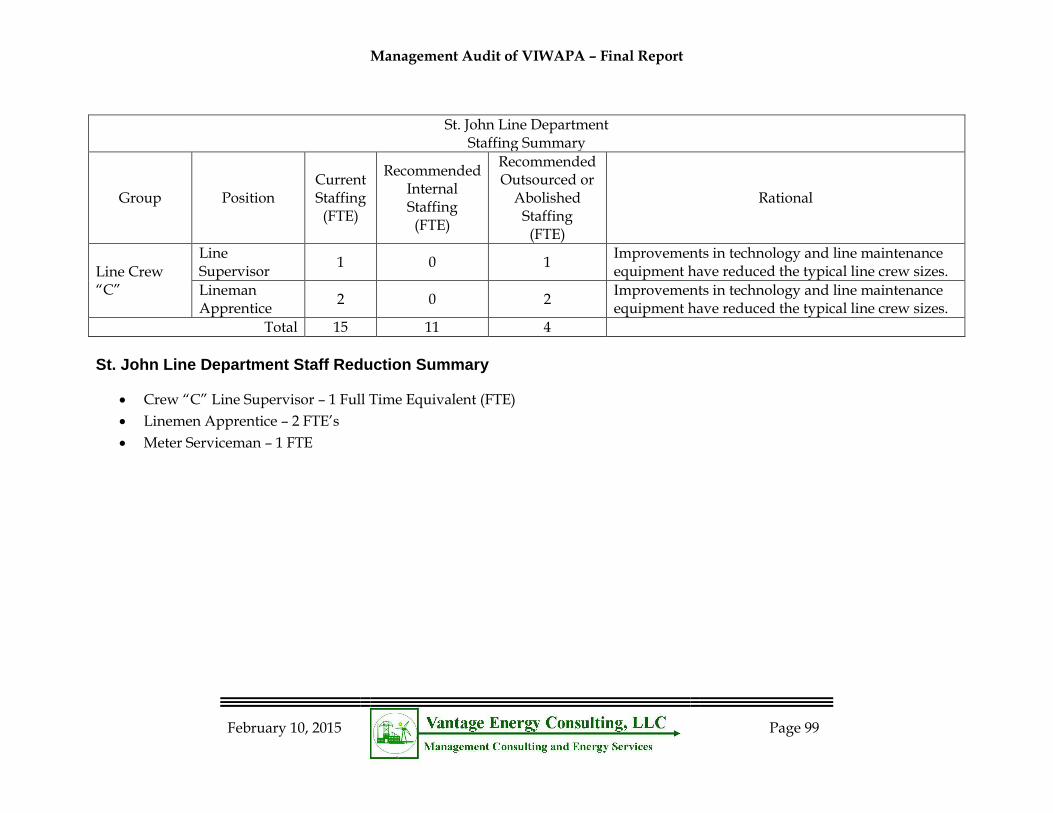
Management Audit of VIWAPA – Final Report
February 10, 2015
Page 99
St. John Line Department Staffing Summary
Group Position Current Staffing
(FTE)
Recommended Internal Staffing
(FTE)
Recommended Outsourced or
Abolished Staffing (FTE)
Rational
Line Crew “C”
Line Supervisor
1 0 1 Improvements in technology and line maintenance equipment have reduced the typical line crew sizes.
Lineman Apprentice
2 0 2 Improvements in technology and line maintenance equipment have reduced the typical line crew sizes.
Total 15 11 4
St. John Line Department Staff Reduction Summary
Crew “C” Line Supervisor – 1 Full Time Equivalent (FTE)
Linemen Apprentice – 2 FTE’s
Meter Serviceman – 1 FTE
Management Audit of VIWAPA – Final Report
February 10, 2015
Page 100
CUSTOMER SERVICE
Customer service is, for most ratepayers, the face of the company. As such it plays a vital role in shaping the customer experiences whether on the phone, in person, or e-mail. Most customers will never experience contact with any utility employee outside of customer services. For this reason we gave considerable attention to the opportunities in customer service. We also recognize inherent difficulties faced by WAPA customer service:
Multiple islands
Cultural differences on St. Croix
Customers who still prefer or require making payments by cash
Topography especially on St. Thomas and St. John. (AMI will be of significant help in this regard)
All of these factors were considered in our review.
V-F7 WAPA customer service is undergoing some significant changes that offer an opportunity for positive improvements.
For example, WAPA is migrating from physical meter reading to automated meter reading. While this reduces the labor component necessary for the actual reads, it does not eliminate it. Companies have found there is still a requirement for rereads, customer requested investigations (high bill complaints) and also the maintenance of the new devices.
Customer Service Management
We found the management of WAPA customer service to be skilled, professional and well informed of industry trends and practices. We do believe there are numerous opportunities to better leverage this management skill set while still recognizing the practicalities of a three-island operation.
Customer Service Staffing
Customer service has a significant employee compliment for an operation of its size. The following shows the 2014 customer service functions as well as those normally associated with customer service:
Meter reading – 21
Customer Service – 43
Revenue Protection – 13
These three functions comprise over 12 percent of the WAPA 2014 budgeted staffing.19
19 WAPA Staffing 2000-2013
Management Audit of VIWAPA – Final Report
February 10, 2015
Page 101
Customer Service Functional Responsibility
Customer service in many utilities is now considered in terms of the portion of customer interface and utility revenue stream that it should control. More specifically, customer service is responsible for what is often termed the “Read to Bill” and “Bill to Collect” portion of the revenue stream. In addition to organization, this type of process organization drives performance metrics which maximize utility revenue.
V-R5 Perform a bottoms up process evaluation and staffing analysis of Customer Service that considers current and future requirements. (Priority: Medium)
While we have recognized the need for this evaluation approach throughout WAPA, there are several factors that we wish to call out for specific inclusion in the customer service review. These include:
Consider the workload changes that will occur as a result of AMI with particular attention to the timing of the changes. This will include the elimination of meter reading routes but must also consider the need to maintain the new devices.
Develop a strategy with goals and objectives for moving additional customers away from in-person cash payments to direct pay, increased use of payment locations and the use of the new kiosks.
Consider additional cross training of customer service reps and utilize teams on a WAPA rather than island by island basis. This may require additional phone lines especially on St. Croix but this is a minimal cost.
Better utilize inter-island transportation. Customer Service representatives, meter readers and revenue protection personnel can be shuttled to separate islands to meet work peaks and valleys if the work load and work force is viewed as a WAPA team rather than an Island work group. Transportation between St. Thomas and St. John is inexpensive and quick. Air travel between St. Thomas and the other islands is more expensive but still far less than the cost of extra personnel. It is likely that WAPA can greatly reduce the cost of this travel through special arrangements with the private carriers.
Take a proactive approach to managing the customer service demand and associated staffing rather than reacting to demand. Customers can be channeled and demand managed while still providing quality service. This includes a number of tools including; better teaming, the use of call backs, improved call volume analysis and outbound communication to customers to encourage timing shifts in their behavior. (i.e. informing customers of less busy times to try and reach a customer service representative.)
Assume responsibility for revenue protection and collections insuring customer service has control and accountability for the entire process from meter reads to revenue collection.
Combine the staffing analysis with the design and layout of all future facilities.
Management Audit of VIWAPA – Final Report
February 10, 2015
Page 102
At a minimum, the meter reading and meter services departments face very significant changes as a result of AMI. These changes will occur regardless of the ultimate reporting relationship established. The meter reading department will transition from physical meter reading to a much smaller, more technically skilled complement of employees who service meters and perform occasional special reads. This assumes that WAPA makes the logical transition of both water and electric meters to AMI in the same geographic area. We anticipate that through read reductions from full AMI implementation20, better teaming and cross training that the current meter reading compliment of twenty-one could be reduced to as low as four individuals. Two would support St. Thomas and St. John and two would support St. Croix. The ramp down to this level requires a controlled and planned approach, which can likely be accomplished through attrition.
The traditional customer service function also has opportunity for long term staffing reductions while also improving service levels. Utilities have long struggled with transitioning customers from a local presence with physical call center offices to more automated and remote interfaces. The economics overwhelmingly support using teams of individuals in call centers to smooth peaks and valleys. For WAPA this model would enable calls coming into WAPA to enter a master multi island queue and then be answered by the first available agent on any of the three islands. This model requires adequate telephony and systems functionality but is otherwise a long proven and relatively simple model to implement. Customer service could likely see a reduction of 10-15 percent in staff over time while maintaining or improving service quality. This would translate to approximately 4-6 FTEs.
SUPPORT FUNCTIONS
Support services perform critical and vital roles in a utility. Yet when they are fragmented and embedded with other organizations including field, plant or financial groups they often lose visibility and focus. The support service functions of Information Technology, Fleet, Materials Management and Purchasing (Supply Chain) require a high level of technical competence and specific managerial skills. These skills are best leveraged under an organization that focuses on delivery of support functions and is accountable to the supported organizations.
V-F8 The support service functions in WAPA are fragmented organizationally.
The support services functions currently report under various organizations and there is no officer level individual responsible for Support Services. Support functions report to the CFO, the CEO and several of the functions report up through another relationship before reaching this level. In addition, the materials and fleet operations are organizationally
20 WAPA may find that even with full AMI implementation, certain locations do not logically or economically lend themselves to AMI. Full implementation means all practical locations.
Management Audit of VIWAPA – Final Report
February 10, 2015
Page 103
combined and do not come under a common executive with the purchasing group until the CEO level.
V-R6 Move the support services function under an officer level individual. (Priority: Medium)
The support services functions of IT, fleet, materials and purchasing should be moved under a single supporting services organization. As part of this reorganization we suggest the following processes be evaluated:
Consolidation of the warehouse management functions and purchasing into a supply chain organization that has better visibility and control of material and supplies.
Expansion of the information technology functional responsibility to better control and oversee systems deployment, systems planning and training.
Explore opportunities for outsourcing of certain functions such as fleet maintenance as the fleet standardization model moves forward.
Eliminate one to one reporting relationships especially in the management ranks.
Reappraise and justify all functions being performed internally.
Evaluate the impact of current changes on the staffing needs. For example, vehicle standardization should lead to productivity improvements.
V-F9 Support services has opportunities for reductions in FTEs through outsourcing and process reevaluation.
The support services functions of fleet and warehousing (material management) has opportunities for efficiency improvements and subsequent FTE reductions. The timing of the opportunities coincides with our recommendation for an officer level position overseeing support and administrative services.
V-R7 Conduct a thorough staffing evaluation of the fleet and materials functions. (Priority: Medium)
Both fleet and materials functions have opportunities for process improvements and FTE reductions. An evaluation of the opportunities should be a primary focus of the new administration and support services organization being recommended by Vantage. While opportunities exist in both areas, the source of the opportunities differs. Fleet performs a great many functions internally and also must deal with an unnecessarily diverse fleet makeup. WAPA has already begun movement towards a fleet standardization policy, which should help with the second of these issues. WAPA should also establish and adhere to a fleet retirement policy that considers the cost/benefit of vehicle retirements by age. The fleet management has collected the necessary information for this assessment.
WAPA should also consider the outsourcing of the entire fleet program from purchase and ownership to maintenance of vehicles.
Management Audit of VIWAPA – Final Report
February 10, 2015
Page 104
The warehouse opportunities stem from improved organization and processes in the materials area. At a minimum, metrics should be established that allow some measurement of the productivity of the warehouse personnel such, as issues/day, turnover per FTE. At present, much of the St. Thomas materials function is actually managed by the electric plant personnel. This should be reevaluated as part of any process improvement. We anticipate a potential savings of at least 1-2 FTEs on St, Thomas. St. Croix already operates with a smaller complement and will likely not see reductions in personnel but could still benefit from a process evaluation.
C. HUMAN RESOURCES
Strong human resources programs are critical to the current and future success of an organization, but are frequently relegated to transactional functions that, while serving an important role of consistent application of policies and regulatory compliance, fall short of the strategic operational impact that could be possible. WAPA has a very small Human Resources Staff that is focused on the basic human resources functions of, staffing, recruiting, labor relations, compensation administrations and safety. There has been little budget allocated for the more forward-looking, progressive functions of providing for professional development of its current talented employees. Nor has there always been alignment of best human resources practices with the priorities of the leadership team. Those two factors together can serve to minimize the impact HR can have on a culture of professionalism across the organization.
This review includes consideration not only of what Human Resources does now and the extent to which those activities are in line with current business practices, but also seeks to shed light on the potential that can be unleashed with enhancements to their current programs.
V-F10 While the Human Resources Department does a fine job managing the basic responsibilities of staffing, pay & benefits administration, employee and labor relations, and safety, it could provide more strategic support if it was better resourced.
RECRUITMENT AND STAFFING PROCESSES
There are 626 WAPA employees, 482 of whom are represented by one of three labor unions. WAPA, like other utilities, tends to have a stable workforce. There are few other comparable employers on the islands to compete with the compensation and career options that WAPA offers.
WAPA has been able to handle shifts in departmental staffing needs through reassignments and attrition, most of which is the result of retirements,21 but it has
21 Interview with HR Manager. 5/11/14
Management Audit of VIWAPA – Final Report
February 10, 2015
Page 105
been through a reactive approach to staffing rather than a strategic plan based on assessment and alignment of needs and skills. This puts stress on the system and introduces risk, especially in times of change such as WAPA will experience.
Individual departments have much autonomy in determining staffing levels and promoting or hiring to fill their needs.
Staffing processes have evolved that address immediate needs, but could be improved with an overall strategy and policies. There are policies that govern some actions while others are quite discretionary, to wit:
o Temporary positions are used quite often and this status can last up to a year. This can be an excellent and cost-effective way to assess skill levels, especially for entry-level employees, to assure best fit for current and future opportunities.
o Performance evaluations after a three months’ probationary period in a position gives the management the flexibility they need to manage their workforce. However, some managers are reluctant to take advantage of this. For entry level positions that require few skills, employees who are retained who are, to greater or lesser degrees, functionally illiterate are challenged when it comes to higher-level responsibilities down the road.
o Entry-level positions are generally filled from the outside, though union contracts require a ten-day internal posting requirement for interested internal candidates.
o Higher-level positions are filled from within where possible; from the outside if necessary. Most supervisory positions are ultimately filled from within. This has implications for the attainment of the critical skills necessary to lead complex organizations with today’s fiscal, regulatory, and technology changes and challenges.
o Union employees are rarely, if ever, fired for poor performance. Again, with seniority clauses in place, this inaction does the company and its customers a disservice. This is compounded by the seniority clause for promotions, which can lead to employees moved into supervisory positions lacking the supervisory and business skills that will make them most successful.
o Some areas face significant challenges in recruiting skilled employees. The journeymen linemen job is one such case.
TRAINING AND DEVELOPMENT
WAPA is one of the largest employers in each of their small island communities. There are limited local places from which they can recruit highly skilled talent. Challenges of recruiting from the mainland exist – it can be difficult to find employees who are willing to relocate to a somewhat isolated, albeit beautiful, place. The options, then, become a) develop internal employees along the entire career path, or b) use consultants for more highly-skilled work, or c) a combination of the two. To date, WAPA tends to take a bit of a combination approach.
Management Audit of VIWAPA – Final Report
February 10, 2015
Page 106
Because of the challenge in recruiting engineering and technical employees, WAPA has a program that supports two talented students to achieve their bachelor’s degree and two for an associate’s degree. These students commit that upon completion of their degrees, they will work for VIWAPA for two years for each year of study. This has recently been expanded from the earlier one year per year of study commitment. All costs must be repaid if the student drops out or fails the programs. This program has assured WAPA has the technical skills to address the engineering challenges going forward.
Management, supervisory, and broad-based communication skills are not routinely made available to employees other than through tuition reimbursement programs or attendance at conferences. Both of these are expensive individualized approaches.
Cross-training for efficiencies is a clear focus in the Finance and Accounting areas and in the plant operations for mechanics. This would be a sound approach to expand across the institution.
V-F11 Changes to the business and human resources practices can help WAPA create and nurture a dynamic culture that supports organizational and individual success.
Research shows that people are highly motivated by three things: autonomy, mastery and a sense of purpose.22 Employees who have a clear understanding of the company’s direction and goals are more able to connect their work with the overall mission of the organization and are more likely to be engaged in its success.
Strategic Alignment
As addressed earlier in this report, WAPA has no strategic plan or specific organizational goals or targets that are identified, communicated, and aligned throughout the company. The top leaders seem to have a clear understanding of what they want to achieve, but those ideas have not been fully communicated to the departments/directors, to the managers, to the individual employees, and tracked throughout the utility. This lack of alignment can a) reduce the effectiveness and productivity as employees are making decisions based on their assumptions of expectations rather than knowledge of expectations and goals, or b) result in employees within the organization inadvertently working at odds with the organizational goals. 23
Individual accountability is of critical importance to the CEO, and the HR Director has been tasked to develop programs that further that goal. Until now, there is not a comprehensive performance assessment process that includes the focus on the organizational and departmental goals by individual employees and measure outcomes against those goals, nor is it consistently administered to all covered
22 Drive, D. Pink, 2009
23 Interview with WAPA CEO 5/11/14
Management Audit of VIWAPA – Final Report
February 10, 2015
Page 107
employees throughout the company. This has ramifications for communicating employee performance expectations, holding employees accountable, and the ability of management to effectively discipline.
There is a sense of entitlement and a lack of urgency that is not limited to WAPA, but is a part of the culture of the workforce.24
COMMUNICATIONS
The communications have been inadequate to provide the scope of information that WAPA and its customers need.
Internal communications are insufficient to keep the workforce informed and engaged in the decisions and direction of the company. WAPA is a critical player in the island economy and community, and the employees are routinely subject to questions and some negativity due to WAPA’s actions. They are poorly equipped to explain the company’s actions or deflect incorrect assumptions when they have not been given sufficient information in a timely manner.
While it is not clear if this is a consistent problem, external communications were seriously lacking when it came to the water quality change. WAPA didn’t share enough or timely information about significant changes in service and quality that the customers would experience. They were silent on dirty water issue until long after customers were angry and concerned. There was a decision not to disclose in the early stages due to the belief that the problem would quickly go away. The messages and the customer concerns were mishandled. Employees were not informed of the impending problem, either.
What is clear is that there is no communications strategy that incorporates the full spectrum of stakeholders, the key messages for each, timing, delivery vehicle, the employee ‘owner’ of the message, use of social media as a strategy, etc., in order to position WAPA for success at all levels.
The Communications Director left and an interim is in place while they seek a new Director. This is a good opportunity to hire someone from the outside who has a clear understanding of the impact internal and external communications, or lack thereof, can have on the morale of the employees and the success of the organization.
HUMAN RESOURCES BUSINESS PRACTICES
The bullets below detail the existing human resources practices that support an engaged and efficient workforce as well as recommendations for expansion, inclusion, and changes.
o HR has recently developed a new performance measurement instrument for the senior leaders; this is a good beginning. The executive leadership needs to hold all individuals accountable for using this tool fully.
24 Interview with H. Hodge, Jr. 5/11/14
Management Audit of VIWAPA – Final Report
February 10, 2015
Page 108
o Contractors are routinely brought in for highly-skilled work. This is totally appropriate when the need for particular high-cost skills is temporary, but the extent of outside contractor use suggests there may be a more permanent need for at least some skill sets. This ought to be explored further to assure contractors and consultants are used for isolated projects rather than to augment the workforce for ongoing needs.
o The policies and procedures manual has not been updated since August, 1995. Company policy manuals are considered to be the primary communication tool to share employee expectations, and outdated manuals put the company in a tenuous position when discrepancies between their expectations and employees’ behavior occur. This needs to be updated, completed, and disseminated throughout the organization.
o The training and development program is uneven in its support of the current and future skill needs of VIWAPA. Maintaining a strong talent base is a challenge, and WAPA has differing degrees of success.
TOTAL COMPENSATION
The compensation structure has not undergone a comprehensive review in more than ten years despite significant economic changes and pay trends for specific jobs25.
Salary increases have been driven by union contracts for the majority of the workforce. For management and confidential employees, there is a merit-based pay system. The economic downturn has impacted that system due to pay freezes instituted by the government.
Of concern is the apparent guiding compensation philosophy and salary structure. No salary ranges were provided for this study, so it’s unclear if none exist or if the data requests have not yet been filled. Even if ranges exist, with no review in more than a decade, and with changes in market conditions for talent, they would be obsolete.
For example, IT and Engineering positions are trending upward, with companies challenged to find the talent they need. This pressure generally results in higher pay levels. Since compensation structures provide the framework for internal movement and career paths as well as single points of pay, their compensation structure needs to be flexible enough to adapt to market changes without losing the integrity of the overall structure. In addition to employee pay determinations, compensation program are used as recruitment, internal movement, and recognition tools that can help an organization recruit and retain the talent it needs.
25 Interview with D. Nibs. 5/11/14
Management Audit of VIWAPA – Final Report
February 10, 2015
Page 109
BENEFITS
The benefits at WAPA are generous. The sick, vacation time and holidays are driven by the policies of government employees, so WAPA has little or no control over this. It does, however, have decision authority over the health care costs. WAPA currently covers 100% of employee and retiree health care costs. Family coverage is paid 100% by the employees. This 100% coverage for employees and retirees is highly unusual in today’s environment. Most utilities long ago began shifting a percentage of health care costs to the employee or retiree. The government currently has a 70/30 split for health care coverage for employees.26
WAPA is currently working with a consultant to develop different scales, and that is a good decision. Particularly with the changes in health care, WAPA must be vigilant in controlling its costs by having employees share responsibility for their health care. While challenges always exist when negotiating cost increases to employees, all three union contracts are either currently in negotiations or are about to be in the very near future. Now’s a good time to include cost sharing options.
The post-retiree health care fund is seriously underfunded and decisions about current retirees as well as future retirees are critical. Most other utilities began shifting some or all of their post-retiree benefits to the retirees in 1993 following the implementation of FASB 106. This should be assessed as part of the broader government retirement changes that are under consideration following the Pension Reform Task Force’s recommendations.27 Establishing a policy of shifting part of this cost to future retirees will help WAPA manage future costs, may positively impact the current financial statements, and may provide incentives for employees who are currently eligible for retirement to retire under the existing policy.
V-R8 Conduct a thorough review of all business and human resources programs and update those that are out of date or inconsistent with best practices. (Priority: Medium)
At a minimum, the following actions are needed:
26 Interview with D. Nibs. 5/11/14
27 Virgin Island Daily News, 5/14/14
Management Audit of VIWAPA – Final Report
February 10, 2015
Page 110
Develop a comprehensive strategic communications plan. A comprehensive communications plan is a critical weapon in the arsenal of highly effective leaders and organizations. WAPA would be well-served to recruit a Communications Director who can steer the company toward greater engagement with its internal and external stakeholders, not only in the way it sends communications out, but also in the way it mines data to help drive decisions going forward.
Commit to raising employee morale. WAPA does community engagement activities, buys employees company tee shirts to build a team spirit, and no doubt engages in other departmental and company-wide events. Certainly all of the WAPA employees that were encountered by this consultant were very friendly and seemed like a wonderful group with whom to work. But morale goes deeper, and requires the company to pay attention to what employees need, what motivates them, what barriers do they encounter, etc., and to take action against those. Consulting facilitation would be beneficial to create a plan to address the many prongs of morale and cultural issues WAPA faces.
The policies and procedures manual needs to be updated, which would require a review of all policies and practices, revisions where necessary, and the production, distribution, and communication of new documents.
Hire a consultant to conduct a comprehensive compensation program evaluation. Working closely with senior management, the consultant would help WAPA create a system that would be sensitive to market fluctuations and support the acquisition of needed talent and the movement and opportunities for internal employees. The assessment would include an articulation of their compensation philosophy that drives their market positioning, external market data for their positions, a review of the internal jobs to assure the written job descriptions accurately reflect the needed skills and experience, an assessment of the internal pay positioning, and strategy to adjust any discrepancies. A tighter compensation process will provide a strong basis for job pricing, employee movement and recruiting, particularly during the upcoming times of change.
The performance evaluation program needs to operate under a policy that is thoughtful and consistently applied. The assessment tool needs to be updated and the results integrated with professional development and internal movement opportunities. Supervisors need to be trained on the new program so that WAPA has accurate evaluation documentation to support any personnel actions going forward.
Review the union contracts for any necessary work rule changes that would create efficiencies in work assignments, crew size, scheduling, etc. Change the language so that promotional opportunities are merit-based rather than seniority-based.
Develop a comprehensive employee development program that speaks to the overarching continuing needs of the organization.
o Tie professional development to the performance assessment program as part of the communications regarding opportunities and expectations of employee engagement.
Management Audit of VIWAPA – Final Report
February 10, 2015
Page 111
o Include leadership skills, professional business skills, interpersonal skills, technical skills, safety training, etc. as appropriate by level and position.
o Supervisory and managerial skills training would be beneficial to those moving into supervisory roles and has not been a focus for the utility. Leadership succession planning tied to professional development along a career path will support the continued success of WAPA during a changing future.
o Leadership and other ‘soft skills’ training ought to be routinely employed to build the capabilities of the broad professional and technical employee populations. UVI is able and willing to partner with WAPA to create custom programs that can be delivered with economies of scale.
o Training – both technical and safety – will need to be enhanced to meet the specifications of the new technologies.
o A knowledge-capture and transfer program would be a cost-effective way to provide a basis for an employee training program.
Review the health care policy for employees and retirees with an eye toward reducing WAPA’s costs. The review of retiree benefits being undertaken at the governmental level provides a good springboard for an internal review of health care policies. Shifting costs to the current employees can be softened by negotiating multiple options for coverage and implementing a well-designed health and wellness program that can motivate employees to continue or adopt healthier lifestyles and reduce their health care needs and costs.
Look at changing the post-retiree health care costs for all new employees. Multiple models exist that range from offering no benefits post-retirement, to covering a capped percentage of the costs, to offering a set dollar amount that can be applied to the coverage. Spouse and family coverage is generally covered fully by the retiree. There is also an opportunity to review the retiree benefits package in totality to see if there are other policies that have lingered beyond competitive positioning.
Management Audit of VIWAPA – Final Report
February 10, 2015
Page 112
VI. PROJECT/PROGRAM MANAGEMENT
A. PROJECT MANAGEMENT
The ultimate success of WAPA will likely depend on how well it manages and implements the many major, simultaneous capital improvement projects it is undertaking. The impact of these changes was discussed in Chapter 3. In this chapter we review our findings and recommendations related to developing and implementing a department that can assume the burden of managing the many projects.
What assets should a Project Management department have in order to be effective?
Leadership - It must first have a leader that understands the fundamental need and urgency of each project under management and how it relates to the strategic objectives of the company. Someone that has sound technical, construction and management skills, and a person who is used to working at both senior levels within WAPA and outside the Company with major vendors, contractors, law firms and technology suppliers.
Technical Expertise - It needs technical specialists. Engineers, schedule and cost control experts, proposal and contract specialists, construction inspectors, report writers and record keeping support.
Project Management Tools – It needs scheduling software, resource management tools, reports preparation software
Currently there are a number of very large projects that must be completed on time and within budget. These include:
Liquid Propane Gas (LPG) – While this project is within six months of completion, it is so critical that the COO has been allocating a great deal of his time to it. The recent announcement that it will be late by a number of months is a blow to both the financial plans of WAPA and its already battered reputation. While this is a turn-key project, WAPA has the ultimate responsibility for its completion.
Power Generation Units – The replacement of unit 23 and the new HRSG at Harley and the budgeted new 10 MW unit at Richmond will all need project management oversight. Should the IRP dictate a more extensive replacement of generating units, this group would be busy for some time.
AMI and AMR installation – Currently there is a pilot program underway to test the functionality of the automatic meter reading devices. Once this is complete, it will be necessary to install over 50,000 electric meters and 12,000 water meters. Asking the operating departments to manage the installation as well as the integration of the data collected into their AMI system may not be effective.
Management Audit of VIWAPA – Final Report
February 10, 2015
Page 113
Water Distribution System – There is a strong likelihood that part or all of the water system on St. Croix will be replaced and/or extended. Similarly, there is likely to be major work on St. Thomas regarding water line replacement and extensions. Professional oversight by the Project Management Department will help to assure a timely and cost effective project.
Liquid Natural Gas – While the LPG program is not yet completed, there is some likelihood that a LNG project may come next. This would be another large project.
Future Renewable Projects – Economics and cost tell us that additional renewable infrastructure is inevitable and WAPA will either be responsible for building or integrating it into its system. It also appears that utility sized energy storage projects are on the horizon and may be cost effective for WAPA given both its cost structure and the limited amount of rolling reserves it can efficiently operate.
VI-F1 The current project management process for managing large capital projects is inadequate.
Given the current number of large capital projects the current Project Management Department is significantly understaffed and lacks sophisticated project management to assure that a given project or series of multiple projects are completed on schedule, within budget and meet the previously expected results. The Project Management function and associated responsibility is typically relegated to power plant managers or the COO. This distracts the individual from its core responsibilities, i.e. operating and/or maintaining the power plant and results in sub-optimal project results. The Project Management team should work closely with the power plant managers and the COO but should be responsible that the projects are managed properly and built in accordance with the plans and specifications.
WAPA utilizes MS Projects to manage the project schedule, and budget. This system lacks the proper level of sophistication to track multiple complex projects, monitor manpower profiles, track construction productivity and monitor budget accuracy.
VI-R1 Reorganize the Special Projects into a Project Management organization and provide the appropriate project management tools to manage complex multi-discipline projects. (Priority: High)
Review the current WAPA Capital Project Procedures and realign the Project Management Organization to assure that the approved capital projects are completed on schedule and under budget. Provide a more sophisticated Project Management technology enabler (i.e. Primavera) to assist in the management of multiple complex projects. Develop a Project Verification Process to measure the success of a given project and assure the previously expected benefits are achieved.
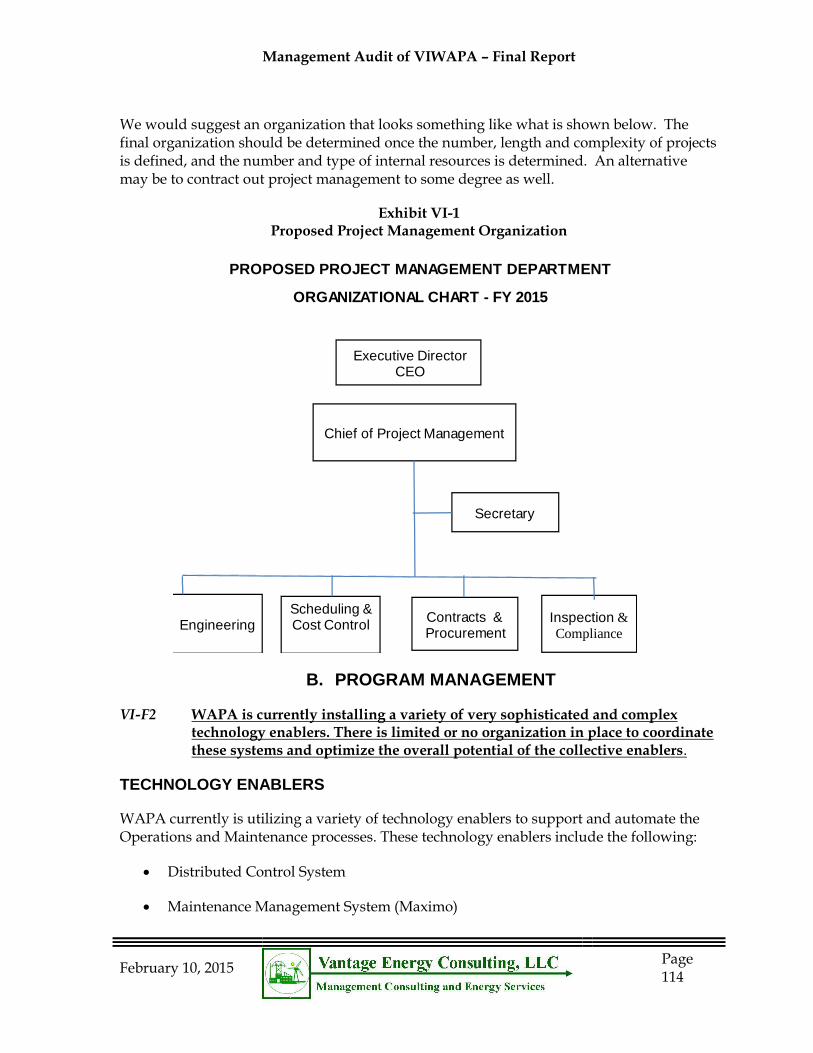
Management Audit of VIWAPA – Final Report
February 10, 2015
Page 114
We would suggest an organization that looks something like what is shown below. The final organization should be determined once the number, length and complexity of projects is defined, and the number and type of internal resources is determined. An alternative may be to contract out project management to some degree as well.
Exhibit VI-1 Proposed Project Management Organization
B. PROGRAM MANAGEMENT
VI-F2 WAPA is currently installing a variety of very sophisticated and complex technology enablers. There is limited or no organization in place to coordinate these systems and optimize the overall potential of the collective enablers.
TECHNOLOGY ENABLERS
WAPA currently is utilizing a variety of technology enablers to support and automate the Operations and Maintenance processes. These technology enablers include the following:
Distributed Control System
Maintenance Management System (Maximo)
PROPOSED PROJECT MANAGEMENT DEPARTMENT
ORGANIZATIONAL CHART - FY 2015
Executive DirectorCEO
Chief of Project Management
Scheduling & Cost Control
Secretary
EngineeringContracts &Procurement
Inspection &
Compliance
Management Audit of VIWAPA – Final Report
February 10, 2015
Page 115
Advanced Metering Infrastructure (Itron/Tantalus)
Outage Management System (ESRI)
Supervisor Control and Data Acquisition System (Power Systems Engineering)
Distributed Control System
The Distributed Control System (DCS) provides the foundation for the interactive control
and monitoring of the Richmond and Harley combined cycle generating facilities. The
primary functions of the DCS are as follows:
Collect and store data from three types of sources;
Make data available to the Operator;
Provide the process control capability;
Provide the Operator with alarm information;
Provide for storage and retrieval of historical data for data trending and
historical data logging and analysis; and
Provide for maintenance and modification to the DCS by Plant Technicians
and Control Engineers.
Maintenance Management System
The heart of a modern power plant maintenance program is imbedded in the Maintenance Management System (MMS). There are many commercially available systems that integrate the maintenance planning and scheduling systems in the overall plant workflow. When properly installed and utilized the MMS is a proven tool to enable the Plant personnel to maximize Unit availability and reliability. A typical MMS includes Asset Tracking, Inventory Tracking and Purchasing, Preventive Maintenance, Predictive Maintenance, Work Order Tracking, Root Cause Analysis and MMS status. See more information below.
Asset Tracking
Maintains information about a facility’s assets (equipment, machines, buildings, fleets, etc.). This includes when the asset was purchased, its expected lifetime, warranty information, the upkeep history, costs, depreciation and more. It may be used by several departments, including accounting and maintenance.
Inventory Tracking and Purchasing
Tracks parts, OEM spare parts, tools and other materials required to perform routine maintenance. This system can be interfaced with major equipment providers.
Management Audit of VIWAPA – Final Report
February 10, 2015
Page 116
Preventive Maintenance
The preventive maintenance system enables the maintenance personnel to schedule tasks based on meter readings, dates, or by setting up custom triggers. Maintenance personnel can view all current and future maintenance activity on a calendar.
Predictive Maintenance
The Predictive Maintenance System is utilized to minimize unexpected failures of selected equipment by monitoring the condition of assets and analyzing historical trends in asset performance. These applications automatically schedule tasks based on performance indicators including thermography, bearing lube oil analysis, vibration, corrosion, pressure and flow. Maintenance personnel can define upper and lower boundaries of these parameters for each asset, and automatically create a work order when a reading falls outside the boundary.
Work Order Tracking
The Work Order Tracking System manages the work order process. This includes scheduling repairs, assigning personnel to the job, reserving materials, recording costs, tracking the cause of the problem, tracking downtime and making recommendations for future action. Other features may include permission and notification settings, department and technician routing, and a portal where customers or other employees can submit work order requests. This system is typically interfaced with the Lock-Out-Tag-Out System.
Root Cause Analysis
WAPA currently conducts an informal root cause analysis for each forced outage. There are no formal reports generated and the results of the associated analysis are not made readily available to the rest of the operating and maintenance team. The Equipment Module in the Maximo MMS includes the ability to build failure core hierarchies and develop an active root cause analysis program.
MMS Status
WAPA has purchased the Maximo MMS and is in the process of installing the system at the Richmond and Harley facilities. The completion of the installation of the MMS continues to be delayed. Recognizing that this is typically a major task that requires dedicated time from a select group of individuals at each facility it is unlikely that this initiative will be completed soon.
Management Audit of VIWAPA – Final Report
February 10, 2015
Page 117
ADVANCED METERING INFRASTRUCTURE
VI-F3 The Advanced Metering Infrastructure currently being installed provides benefits to many areas of the Company.
On March 5, 2014 WAPA contracted with Itron/Tantalus under a $13 M US Department of Agriculture low interest loan. The AMI system is expected to be phased-in and operational by June 2015. The expected benefits of deploying AMI are:
Improved overall operational efficiency,
Reduced energy theft,
Improved billing process,
Reduced line loss with the use of new meters and to have a scalable infrastructure for future applications such as Pre-Pay services and possible scalability for home automation and energy savings programs,
Support of a demand side management program,
Reduced WAPA labor costs associated with the reduction of meter readers, and
Reduced WAPA service employees to suspend and reconnect services.
VI-R2 Review the schedule and progress on the AMI implementation, and determine if the current schedule is feasible. (Priority: Low)
Based on a review of on-going AMI installations in the US the current deployment schedule may be too aggressive and difficult to attain. In addition the AMI needs to be expanded to include an automation of the WAPA water distribution system as part of the overall effort on loss reduction and line replacement prioritization.
Review the current schedule and determine if additional resources are required to meet the completion date.
OUTAGE MANAGEMENT SYSTEM
VI-F4 The Outage Management System currently being installed will provide numerous operational benefits to WAPA and its customers.
WAPA is in the process of implementing an Outage Management System (OMS) as provided by ESRI. The OMS will assist WAPA to better serve customers with electrical outage related issues. An OMS gives the WAPA the ability to efficiently identify and resolve outages, and to generate and report valuable historical information. It also helps the utility inform its customers of the outage situation and restoration status (rather than the customer informing the utility first). An OMS typically works in conjunction with the Geographic Information System (GIS) and the utility’s Customer Information System (CIS) and the Advanced Metering Infrastructure (AMI) system.
Management Audit of VIWAPA – Final Report
February 10, 2015
Page 118
Another key component of the OMS is Interactive Voice Response (IVR), which is an automated call handling system. IVR allows customers to interact with WAPA’S host system via their telephone keypad or by speech recognition, allowing them to get information based on their own inquiries by following the IVR dialogue.
SUPERVISOR CONTROL AND DATA ACQUISITION SYSTEM
VI-F5 The Supervisor Control and Data Acquisition System currently being installed will reduce response time during outages and improve safety.
WAPA has contracted with Power System’s Engineering to implement a Supervisor Control and Data Acquisition System (SCADA). The SCADA system is typically used to automate the power distribution system to assure maximum system safety and reliability.
In an effort to help manage expectations, we want to state that the resources to coordinate and build out the communications infrastructure will require a significant level of effort and complexity. We understand that we will also face a resource challenge at VI WAPA since most of the key VI WAPA subject matter experts will be involved with the AMI, MDM, water SCADA, and DA deployments at the same time.
SYSTEM RELATED INFORMATION TECHNOLOGY
VI-F6 There is no central department for selecting, implementing and maintaining the many complex IT systems being purchased and installed as part of the many new projects.
Almost every system being purchased has a computer backbone that must be installed, maintained and most importantly interfaced with the balance of WAPA IT communications systems.
VI-R3 Ensure that the concerns with new system improvement related IT systems are properly addressed, by expanding the responsibility of the Information Technology Organization. (Priority: Low)
A single department should be charged with the responsibility to ensure that the complex systems being installed are fully integrated into the planning, operations and maintenance processes. In addition, the associated processes should be mapped to assure maximize effectiveness and minimize any redundancies. The actual implementation of each of the above enablers should then be coordinated with impacted departments under the responsibility of the Project Management team.
February 10, 2015
Page 119
VII. WATER SYSTEM ASSESSMENT
A. SUMMARY OF ANALYSIS
This section on WAPA’s water business is being analyzed as a separate section due to the many issues the water system faces. Some of our overall conclusions include:
The water department does not have an adequate presence in the corporate organizational structure.
The water department structures it too vertical, with extra layers of management in the organization.
With the implementation of water production by Seven Seas, the water operator positions at both the Harley and Richmond Stations can be eliminated.
The Seven Seas contract provides water through reverse osmosis at a total cost of $3.55 per kgal plus electricity. The current electric cost component of $4.15 per kgal should decrease as the LPG conversion takes place and new technology is added.
On St. Croix, water losses of over 40% cost consumers over $2 million per year in unnecessary production costs.
The system is old. Much of it was installed 60 to 80 years ago and as a consequence there are poor records of pipe size, locations, valve locations, and metering sites.
Only a small portion of each island is served by the WAPA distribution system.
WAPA essentially serves as a provider of last resort to the many homes and businesses that have cisterns.
The current tariff structure does not include a monthly customer charge within its base rate, which is contrary to traditional regulatory policy. A monthly customer charge (Base Facility Charge) would contribute relief to economic stress and would provide a needed source of funds for debt coverage and for the repair and extension of services.
The burden of the cost of replacing old infrastructure, extending service to new area of the islands, and the cost of extending service lines for individual customers should be addressed to assure that costs are paid by the appropriate party.
The total cost to upgrade the current system on all islands and to expand to areas with the potential for profitable sales is almost $70 million for the 2013-2018 period according to a 2013 analysis.
Almost 41% of planned capital projects are covered by grants, with 48% covered by new 2018 bonds, 7% by the Line Loss Surcharge, and 4% by Internal Rate Funded sources. (From June 2014 Five Year Plan)
The standpipe business has dropped by almost 64% between 2013 and 2014, with total revenue of only $91 K.
The AMI system installation is underway, and will provide valuable information to WAPA management, reduce meter reading costs, and allow remote turn-on/turn-off activity.
The implementation of AMI will permit the significant reduction of customer service meter reader duties and positions.
February 10, 2015
Page 120
The colored water issue should have been better anticipated, responded to in a more direct and focused manner, and communicated to the public in a much more direct, expansive and personal way.
B. WATER SYSTEM HISTORY AND ISSUES
In order to understand the current issues and challenges with the WAPA Water System, it is important to review its history. Some key aspects of the water system include:
WAPA has been operating, maintaining and managing the water distribution systems on the islands of St. Croix, St. Thomas and St. John since 1988. Prior to 1988, the water distribution systems were owned and operated initially by the U. S. military and then the U. S. Virgin Islands Department of Public Works. Water distribution systems in the U. S. Virgin Islands have developed differently than in the United States mainland.
Customer self-reliance best describes the fundamental approach to water supply with WAPA serving as the supplier of last resort for many customers. This was due to the isolation of the islands, severe climatic conditions, and the basic cost of water, recent water quality perceptions, and an economy heavily dependent on tourism.
As a result, nearly all buildings have cisterns28 as an alternate source of water. Due to cost and their historical relegation as a backup or supplemental water distribution system, fire protection is not a primary service provided by WAPA. Territorial regulations and building codes do not require that the water systems be developed for fire protection. Fire hydrants are provided only in limited areas that have the capacity to provide higher flows and pressures.
The water distribution system on each island serves only a portion of the population within the potential limits of its service areas.
Many commercial entities and residential inhabitants only purchase water from the Authority during periods of low rainfall either by direct connection or through independent vendors who deliver potable water by truck to the cisterns.
Prior to 1988, the Department of Public Works of the Government had responsibility for the water distribution system. Since that time, the Authority has been responsible for the operation, maintenance and management of the water distribution systems on the islands of St. Thomas, St. Croix and St. John.
28 / In accordance with the 1964 Building Regulations, all structures in the U. S. Virgin Islands were required to incorporate water storage cisterns into their construction. These cisterns store collected rainwater from roofs for use by the occupants of the building. Once the cistern has been constructed, the cistern water is considerably less expensive than commercially produced and distributed desalinated water.
February 10, 2015
Page 121
The Water System has two divisions: the St. Croix Division and the St. Thomas/St. John Division. Each division is further organized into production and distribution departments. The production department on the island of St. Thomas/St. John also includes a water quality laboratory.
The island of St. Croix is approximately 84 square miles in area, approximately 21 miles in length, and nearly six miles wide in the west to approximately one mile wide in the east end. The long axis runs approximately west to east. Along the northern side of the island and parallel to the coast is a continuous mountain ridge. The peaks generally rise from 600 to 800 feet above the sea level, with the highest peak at approximately 1,100 feet. South of the ridge are gently rolling hills and alluvial plains. The two population centers on the island of St. Croix are Christiansted, on the north coast, and Frederiksted on the west end of the island.
The distribution system on the island of St. Croix consists of approximately 1,000,000 linear feet of 2" to 16" diameter cast iron, ductile iron and newer C-900 PVC plastic pipe. There are five major elevated storage tanks and three minor storage tanks that are used to regulate and supply the system requirements. These storage tanks have a total nominal storage volume of over 23 million gallons ("MG").
The island of St. Thomas is approximately 32 square miles in area, approximately fourteen miles in length and nearly four and a half miles wide at its widest point. The long axis runs nearly west to east. Along the center of the island is a nearly continuous mountain ridge. The peaks generally rise from 600 to 800 feet above the sea level, with the highest peak in the northwest at approximately 1,700 feet. The water distribution system on the island of St. Thomas consists of approximately 304,000 linear feet of 2" to 24" diameter cast iron, ductile iron and newer plastic C-900.
A review of the water production and operating data for 2103 and 2014 provides a current view of the system and many symptoms and results of problems.
Current rates for water are:
Exhibit VII-1 Current Water Rates
Current Charges Small Medium Large
Average Base Rate (1) $12.75 $9.74 $7.23
Existing Water LEAC (2) $10.85 $10.85 $10.85
Total Average Charge $23.60 $20.59 $18.08
Amount based on the average discount applied to the current base
rates, including $2.88 for Base Water Costs.
Amount reflects the existing LEAC Charge in June 2014.
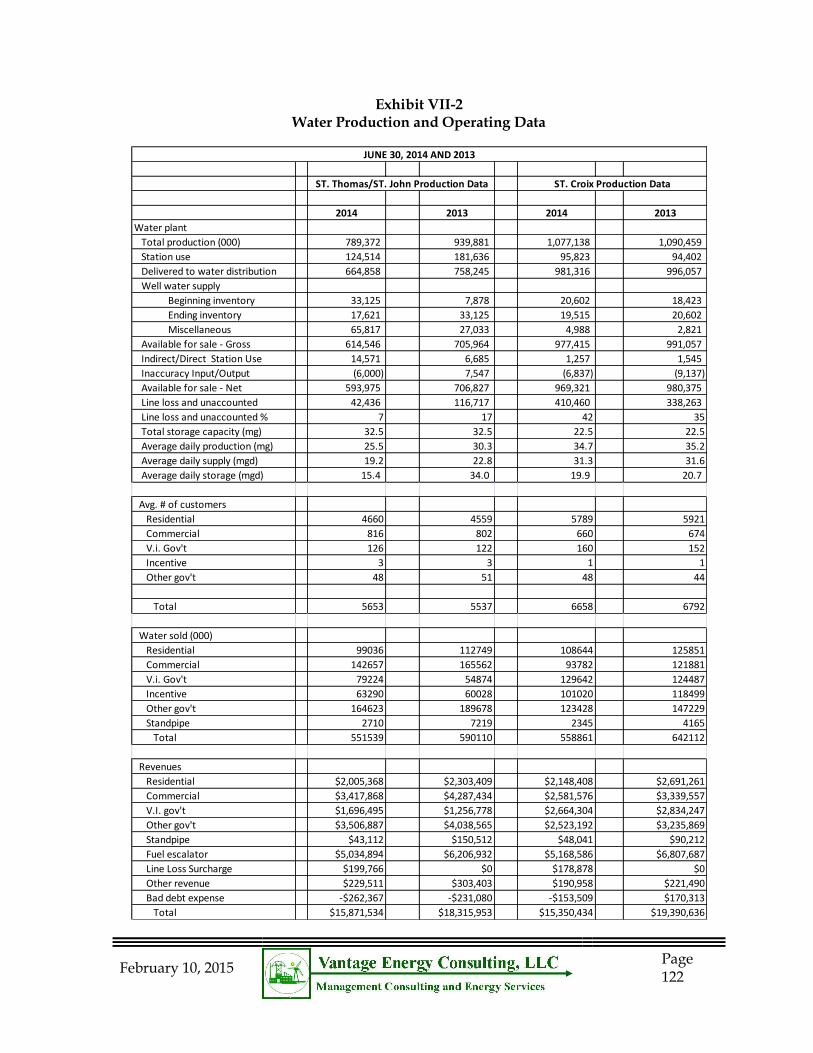
February 10, 2015
Page 122
Exhibit VII-2 Water Production and Operating Data
2014 2013 2014 2013
Water plant
Total production (000) 789,372 939,881 1,077,138 1,090,459
Station use 124,514 181,636 95,823 94,402
Delivered to water distribution 664,858 758,245 981,316 996,057
Well water supply
Beginning inventory 33,125 7,878 20,602 18,423
Ending inventory 17,621 33,125 19,515 20,602
Miscellaneous 65,817 27,033 4,988 2,821
Available for sale - Gross 614,546 705,964 977,415 991,057
Indirect/Direct Station Use 14,571 6,685 1,257 1,545
Inaccuracy Input/Output (6,000) 7,547 (6,837) (9,137)
Available for sale - Net 593,975 706,827 969,321 980,375
Line loss and unaccounted 42,436 116,717 410,460 338,263
Line loss and unaccounted % 7 17 42 35
Total storage capacity (mg) 32.5 32.5 22.5 22.5
Average daily production (mg) 25.5 30.3 34.7 35.2
Average daily supply (mgd) 19.2 22.8 31.3 31.6
Average daily storage (mgd) 15.4 34.0 19.9 20.7
Avg. # of customers
Residential 4660 4559 5789 5921
Commercial 816 802 660 674
V.i. Gov't 126 122 160 152
Incentive 3 3 1 1
Other gov't 48 51 48 44
Total 5653 5537 6658 6792
Water sold (000)
Residential 99036 112749 108644 125851
Commercial 142657 165562 93782 121881
V.i. Gov't 79224 54874 129642 124487
Incentive 63290 60028 101020 118499
Other gov't 164623 189678 123428 147229
Standpipe 2710 7219 2345 4165
Total 551539 590110 558861 642112
Revenues
Residential $2,005,368 $2,303,409 $2,148,408 $2,691,261
Commercial $3,417,868 $4,287,434 $2,581,576 $3,339,557
V.I. gov't $1,696,495 $1,256,778 $2,664,304 $2,834,247
Other gov't $3,506,887 $4,038,565 $2,523,192 $3,235,869
Standpipe $43,112 $150,512 $48,041 $90,212
Fuel escalator $5,034,894 $6,206,932 $5,168,586 $6,807,687
Line Loss Surcharge $199,766 $0 $178,878 $0
Other revenue $229,511 $303,403 $190,958 $221,490
Bad debt expense -$262,367 -$231,080 -$153,509 $170,313
Total $15,871,534 $18,315,953 $15,350,434 $19,390,636
ST. Thomas/ST. John Production Data ST. Croix Production Data
JUNE 30, 2014 AND 2013
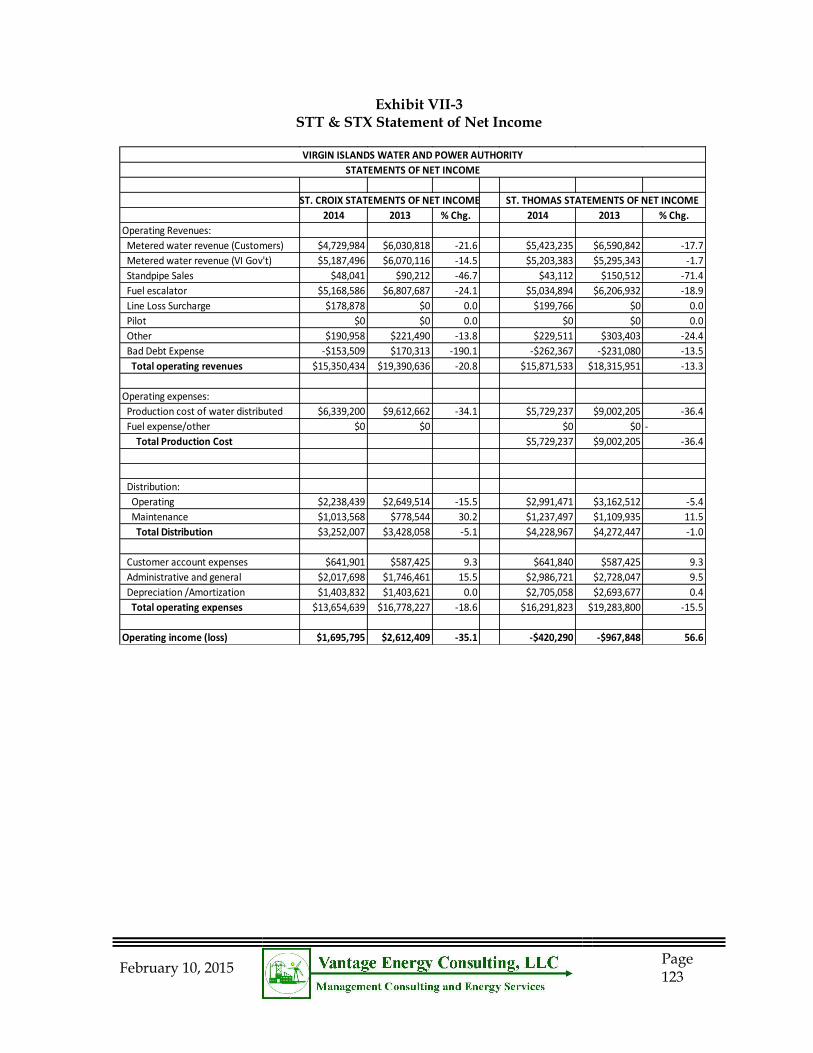
February 10, 2015
Page 123
Exhibit VII-3 STT & STX Statement of Net Income
2014 2013 % Chg. 2014 2013 % Chg.
Operating Revenues:
Metered water revenue (Customers) $4,729,984 $6,030,818 -21.6 $5,423,235 $6,590,842 -17.7
Metered water revenue (VI Gov't) $5,187,496 $6,070,116 -14.5 $5,203,383 $5,295,343 -1.7
Standpipe Sales $48,041 $90,212 -46.7 $43,112 $150,512 -71.4
Fuel escalator $5,168,586 $6,807,687 -24.1 $5,034,894 $6,206,932 -18.9
Line Loss Surcharge $178,878 $0 0.0 $199,766 $0 0.0
Pilot $0 $0 0.0 $0 $0 0.0
Other $190,958 $221,490 -13.8 $229,511 $303,403 -24.4
Bad Debt Expense -$153,509 $170,313 -190.1 -$262,367 -$231,080 -13.5
Total operating revenues $15,350,434 $19,390,636 -20.8 $15,871,533 $18,315,951 -13.3
Operating expenses:
Production cost of water distributed $6,339,200 $9,612,662 -34.1 $5,729,237 $9,002,205 -36.4
Fuel expense/other $0 $0 $0 $0 -
Total Production Cost $5,729,237 $9,002,205 -36.4
Distribution:
Operating $2,238,439 $2,649,514 -15.5 $2,991,471 $3,162,512 -5.4
Maintenance $1,013,568 $778,544 30.2 $1,237,497 $1,109,935 11.5
Total Distribution $3,252,007 $3,428,058 -5.1 $4,228,967 $4,272,447 -1.0
Customer account expenses $641,901 $587,425 9.3 $641,840 $587,425 9.3
Administrative and general $2,017,698 $1,746,461 15.5 $2,986,721 $2,728,047 9.5
Depreciation /Amortization $1,403,832 $1,403,621 0.0 $2,705,058 $2,693,677 0.4
Total operating expenses $13,654,639 $16,778,227 -18.6 $16,291,823 $19,283,800 -15.5
Operating income (loss) $1,695,795 $2,612,409 -35.1 -$420,290 -$967,848 56.6
ST. CROIX STATEMENTS OF NET INCOME ST. THOMAS STATEMENTS OF NET INCOME
STATEMENTS OF NET INCOME
VIRGIN ISLANDS WATER AND POWER AUTHORITY
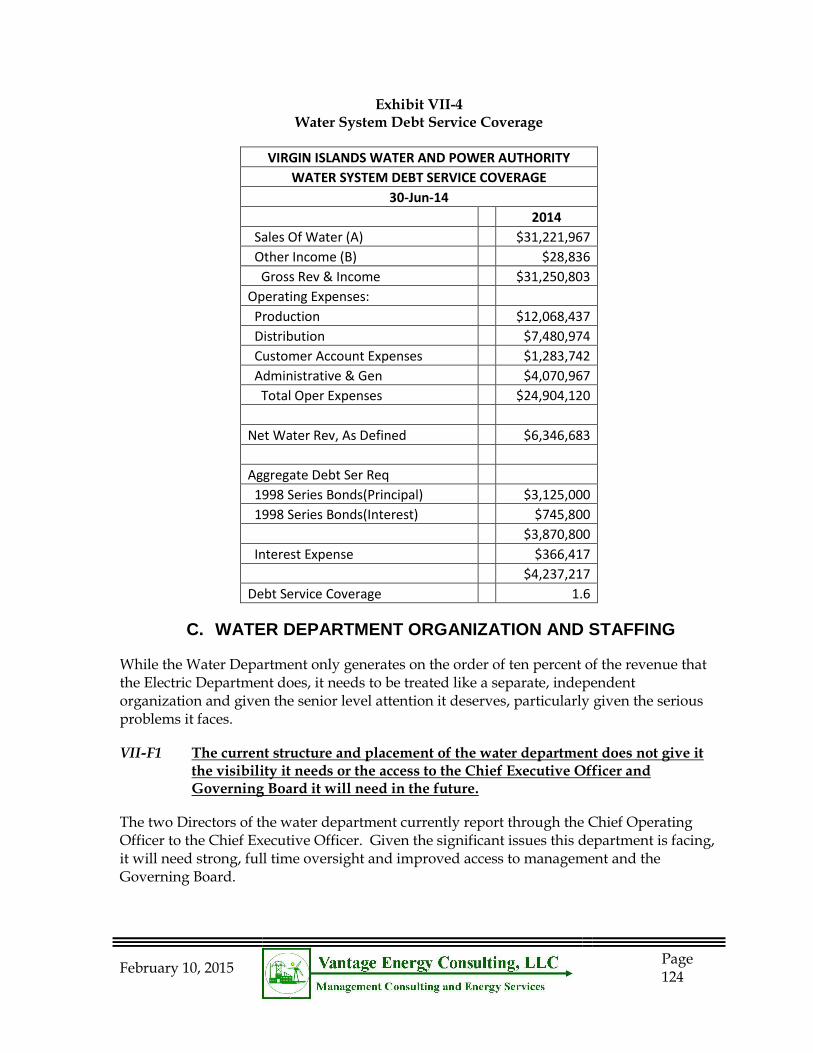
February 10, 2015
Page 124
Exhibit VII-4 Water System Debt Service Coverage
VIRGIN ISLANDS WATER AND POWER AUTHORITY
WATER SYSTEM DEBT SERVICE COVERAGE
30-Jun-14
2014
Sales Of Water (A) $31,221,967
Other Income (B) $28,836
Gross Rev & Income $31,250,803
Operating Expenses:
Production $12,068,437
Distribution $7,480,974
Customer Account Expenses $1,283,742
Administrative & Gen $4,070,967
Total Oper Expenses $24,904,120
Net Water Rev, As Defined $6,346,683
Aggregate Debt Ser Req
1998 Series Bonds(Principal) $3,125,000
1998 Series Bonds(Interest) $745,800
$3,870,800
Interest Expense $366,417
$4,237,217
Debt Service Coverage 1.6
C. WATER DEPARTMENT ORGANIZATION AND STAFFING
While the Water Department only generates on the order of ten percent of the revenue that the Electric Department does, it needs to be treated like a separate, independent organization and given the senior level attention it deserves, particularly given the serious problems it faces.
VII-F1 The current structure and placement of the water department does not give it the visibility it needs or the access to the Chief Executive Officer and Governing Board it will need in the future.
The two Directors of the water department currently report through the Chief Operating Officer to the Chief Executive Officer. Given the significant issues this department is facing, it will need strong, full time oversight and improved access to management and the Governing Board.
February 10, 2015
Page 125
VII-R1 Create a position of Chief Water Operations that reports directly to the Chief Executive Officer, with direct control of water related operations, capital
projects, budgeting, and implementation of all strategies. (Priority: High)
This individual should be a strong manager, capable of addressing the organizational needs of the water department as well as the extensive construction program that is likely to occur. The individual should also have excellent communication skills and be able to work at repairing WAPA’s image that suffers as a result of the discolored water problem and the current high water rate. The Individual should also be part of the team tasked with bringing back old customers that have left the system, working to bring on new customers when extensions are proposed, and dealing with external stakeholders regarding a revised tariff structure.
VII-F2 Currently, there are still positions in place for Water Plant Operations at both Harley and Richmond plants, despite the fact that all water comes from the Seven Seas provider under contract.
Maintaining any IDE water production is difficult to justify given the cost of staffing, O&M and the small probability that the units will ever be needed. It is our understanding that the reason one string of IDE’s is on operational standby is that there is a concern that a hurricane might cause damage to the RO plants. While this is a potential problem, other solutions, such as storm hardening the RO system and pre-arrangements for skid mounted emergency RO units might be a less expensive alternative.
The retirement of the IDE system would make the ten positions at the Richmond Plant and the 12 positions at the Harley Plant excess.
VII-R2 Conduct an independent study to determine the risk to the RO system from hurricanes, the cost for backup using the IDE’s versus other options. The study should explicitly address the savings that can be achieved by retiring the IDE’s
and reducing staffing to the level needed post-IDE removal. (Priority: Low)
Keeping a string of old IDE equipment operable has many costs. A staff of 22 may not be warranted, but even 6-8 staff will cost a lot. Further, a system that does not operate full-time will deteriorate and cost significant sums to maintain with a high probability of failure upon demand.
VII-F3 The Assistant Superintendent positions add an extra level to the management structure.
The practice of having Assistant Manager level positions in the utility industry is no longer used. It adds an extra layer of management to the organization, decreasing communications, adding costs, and by pre-ordaining the heir apparent, eliminating opportunities for advancement of other qualified candidates when a position does arise.

February 10, 2015
Page 126
VII-R3 Consider eliminating the Assistant Superintendent positions as opportunities
occur. (Priority: Medium)
We do not know the current circumstances regarding retirements or the qualifications of the current position holders, so we would simply suggest that management address these changes as opportunities present themselves.
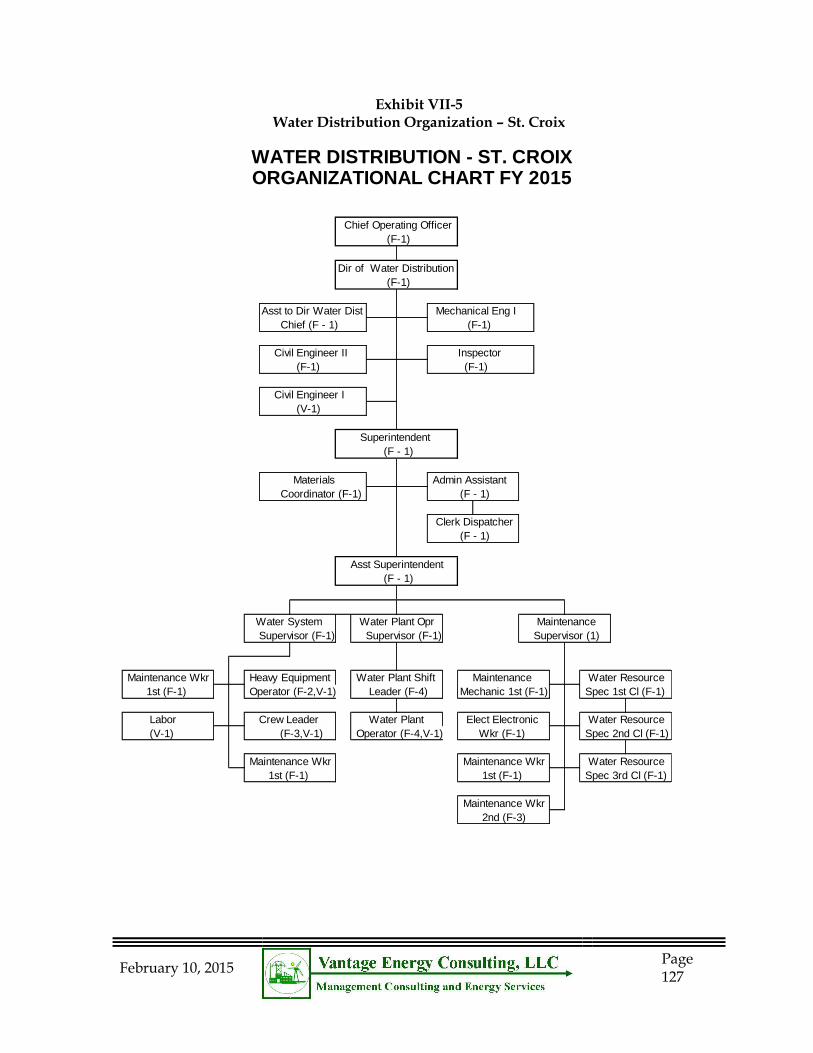
February 10, 2015
Page 127
Exhibit VII-5 Water Distribution Organization – St. Croix
WATER DISTRIBUTION - ST. CROIXORGANIZATIONAL CHART FY 2015
Chief Operating Officer
(F-1)
Dir of Water Distribution
(F-1)
Asst to Dir Water Dist Mechanical Eng I
Chief (F - 1) (F-1)
Civil Engineer II Inspector
(F-1) (F-1)
Civil Engineer I
(V-1)
Superintendent
(F - 1)
Materials Admin Assistant
Coordinator (F-1) (F - 1)
Clerk Dispatcher
(F - 1)
Asst Superintendent
(F - 1)
Water System Water Plant Opr Maintenance
Supervisor (F-1) Supervisor (F-1) Supervisor (1)
Maintenance Wkr Heavy Equipment Water Plant Shift Maintenance Water Resource
1st (F-1) Operator (F-2,V-1) Leader (F-4) Mechanic 1st (F-1) Spec 1st Cl (F-1)
Labor Crew Leader Water Plant Elect Electronic Water Resource
(V-1) (F-3,V-1) Operator (F-4,V-1) Wkr (F-1) Spec 2nd Cl (F-1)
Maintenance Wkr Maintenance Wkr Water Resource
1st (F-1) 1st (F-1) Spec 3rd Cl (F-1)
Maintenance Wkr
2nd (F-3)
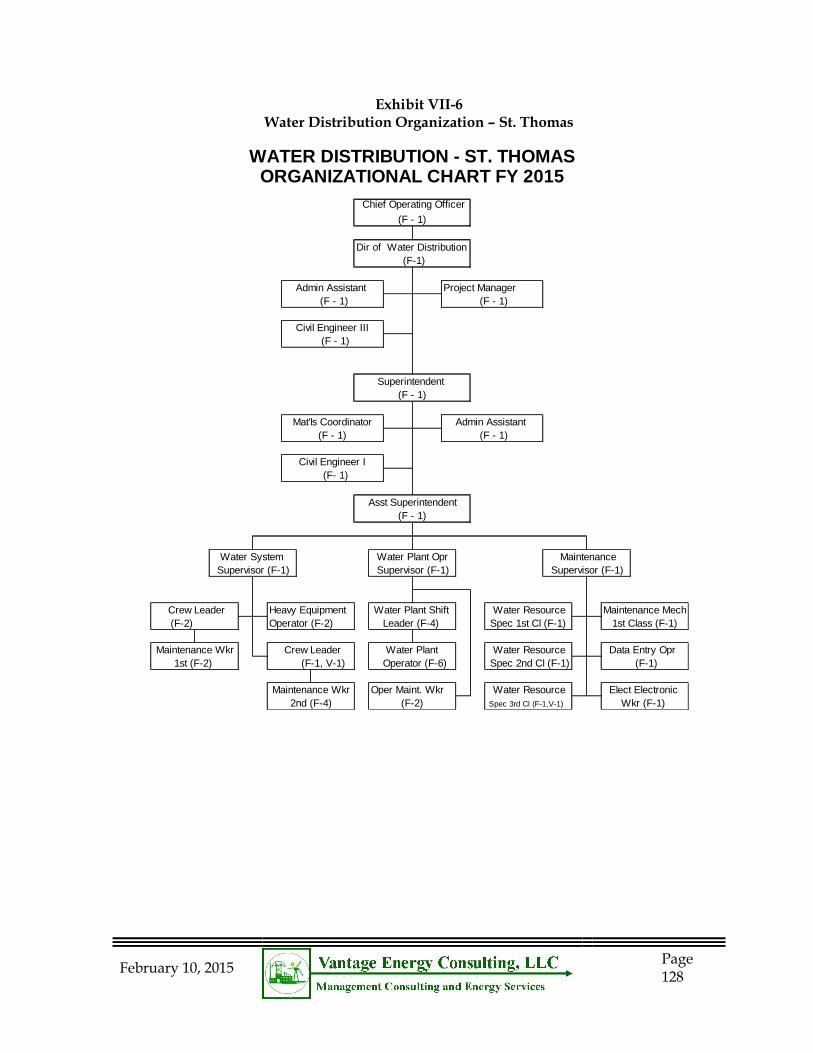
February 10, 2015
Page 128
Exhibit VII-6 Water Distribution Organization – St. Thomas
WATER DISTRIBUTION - ST. THOMASORGANIZATIONAL CHART FY 2015
Dir of Water Distribution
(F-1)
Admin Assistant Project Manager
Mat'ls Coordinator Admin Assistant
Civil Engineer I
Asst Superintendent
Water System Water Plant Opr Maintenance
Supervisor (F-1) Supervisor (F-1) Supervisor (F-1)
Crew Leader Heavy Equipment Water Plant Shift Water Resource Maintenance Mech
(F-2) Operator (F-2) Leader (F-4) Spec 1st Cl (F-1)
Maintenance Wkr Crew Leader Water Plant Water Resource Data Entry Opr
1st (F-2) (F-1, V-1) Operator (F-6) Spec 2nd Cl (F-1) (F-1)
Maintenance Wkr Oper Maint. Wkr Water Resource Elect Electronic
2nd (F-4) (F-2) Spec 3rd Cl (F-1,V-1) Wkr (F-1)
1st Class (F-1)
(F - 1) (F - 1)
(F- 1)
(F - 1)
Superintendent
(F - 1)
(F - 1)
Civil Engineer III
(F - 1)
Chief Operating Officer
(F - 1)
(F - 1)
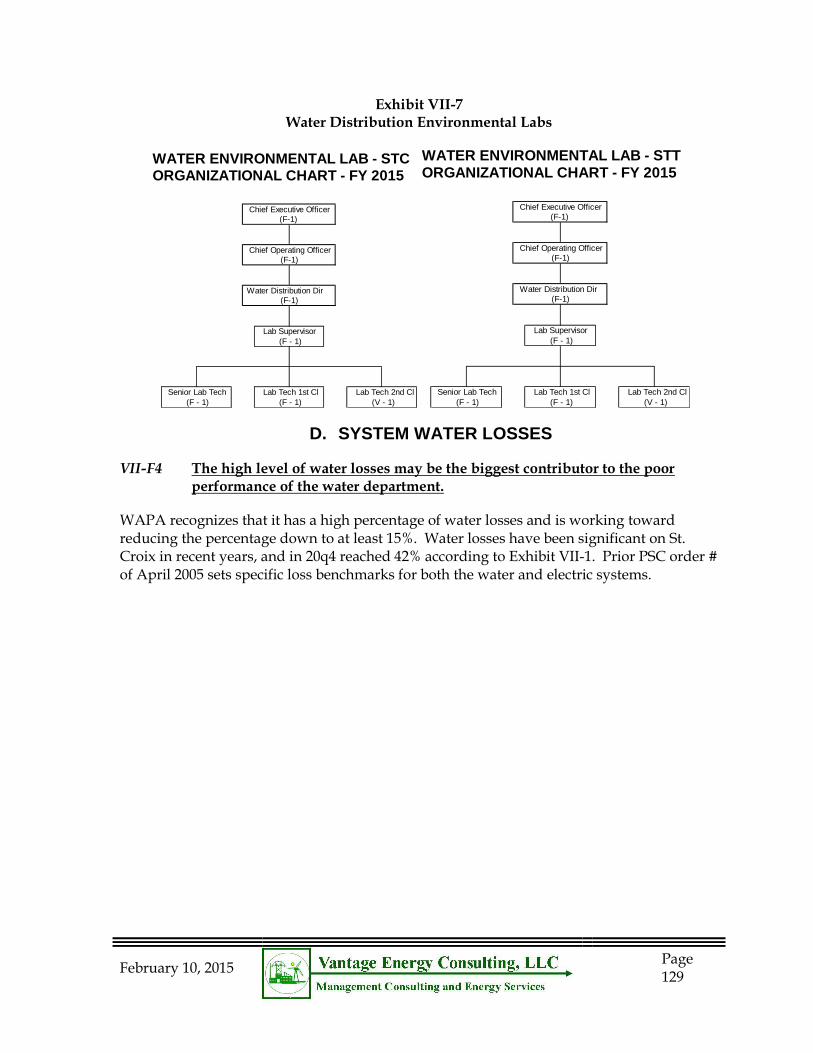
February 10, 2015
Page 129
Exhibit VII-7 Water Distribution Environmental Labs
D. SYSTEM WATER LOSSES
VII-F4 The high level of water losses may be the biggest contributor to the poor performance of the water department.
WAPA recognizes that it has a high percentage of water losses and is working toward reducing the percentage down to at least 15%. Water losses have been significant on St. Croix in recent years, and in 20q4 reached 42% according to Exhibit VII-1. Prior PSC order # of April 2005 sets specific loss benchmarks for both the water and electric systems.
WATER ENVIRONMENTAL LAB - STCORGANIZATIONAL CHART - FY 2015
Chief Executive Officer
(F-1)
Chief Operating Officer
(F-1)
Water Distribution Dir
(F-1)
Lab Supervisor
(F - 1)
Senior Lab Tech Lab Tech 1st Cl Lab Tech 2nd Cl
(F - 1) (F - 1) (V - 1)
WATER ENVIRONMENTAL LAB - STTORGANIZATIONAL CHART - FY 2015
Chief Executive Officer
(F-1)
Chief Operating Officer
(F-1)
Water Distribution Dir
(F-1)
Lab Supervisor
(F - 1)
Senior Lab Tech Lab Tech 1st Cl Lab Tech 2nd Cl
(F - 1) (F - 1) (V - 1)
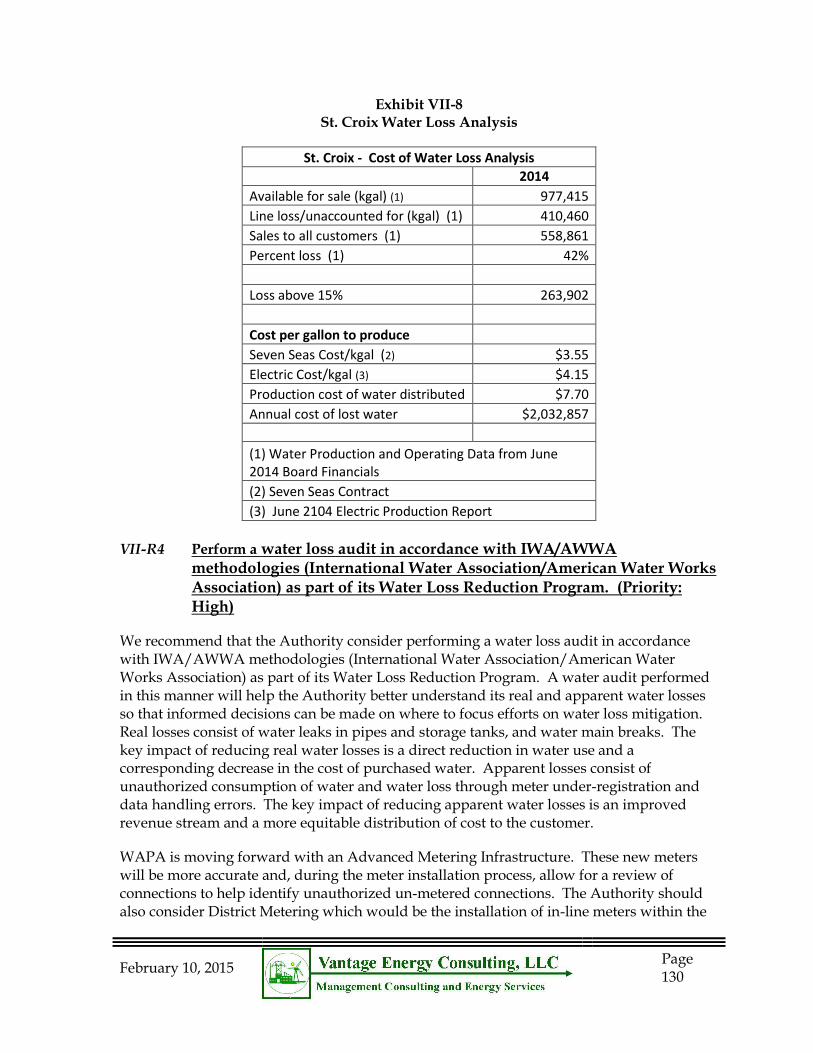
February 10, 2015
Page 130
Exhibit VII-8 St. Croix Water Loss Analysis
St. Croix - Cost of Water Loss Analysis
2014
Available for sale (kgal) (1) 977,415
Line loss/unaccounted for (kgal) (1) 410,460
Sales to all customers (1) 558,861
Percent loss (1) 42%
Loss above 15% 263,902
Cost per gallon to produce
Seven Seas Cost/kgal (2) $3.55
Electric Cost/kgal (3) $4.15
Production cost of water distributed $7.70
Annual cost of lost water $2,032,857
(1) Water Production and Operating Data from June 2014 Board Financials
(2) Seven Seas Contract
(3) June 2104 Electric Production Report
VII-R4 Perform a water loss audit in accordance with IWA/AWWA methodologies (International Water Association/American Water Works Association) as part of its Water Loss Reduction Program. (Priority: High)
We recommend that the Authority consider performing a water loss audit in accordance with IWA/AWWA methodologies (International Water Association/American Water Works Association) as part of its Water Loss Reduction Program. A water audit performed in this manner will help the Authority better understand its real and apparent water losses so that informed decisions can be made on where to focus efforts on water loss mitigation. Real losses consist of water leaks in pipes and storage tanks, and water main breaks. The key impact of reducing real water losses is a direct reduction in water use and a corresponding decrease in the cost of purchased water. Apparent losses consist of unauthorized consumption of water and water loss through meter under-registration and data handling errors. The key impact of reducing apparent water losses is an improved revenue stream and a more equitable distribution of cost to the customer.
WAPA is moving forward with an Advanced Metering Infrastructure. These new meters will be more accurate and, during the meter installation process, allow for a review of connections to help identify unauthorized un-metered connections. The Authority should also consider District Metering which would be the installation of in-line meters within the
February 10, 2015
Page 131
distribution system piping to record flows to discreet areas within the distribution system. Data regarding flows to discreet areas would provide the basis of an assessment of levels of water loss. Real loss can be estimated based on a minimum flow rate for a given area. The Minimum Night Flow (MNF) usually occurs between 2:00 am and 4:00 am. This technique could assist staff in identifying the priority areas for distribution system renewal and replacement projects to reduce real water losses.
A review of large-user meters should be made to make sure they are the proper type and are properly sized for the actual water use by the customer. Meters that are too large will not accurately measure the volume of water being used by the customer. The size of the meter should be compared with the actual historical use data and if warranted, a smaller meter installed. By appropriately sizing meters, potential apparent losses caused by under-metered flows could be reduced.
E. STANDPIPE SALES
VII-F5 Standpipe revenues have fallen dramatically in 2014.
Year-to-date standpipe sales are estimated to decline 64%. According to the O&M report annual costs for standpipe operation are close to $750,000 per year and revenue has dropped to under $100,000 per year. 2014 standpipe sales represent only 5% of the Standpipe Sales in Fiscal Year 2011.
VII-R5 WAPA should consider discontinuing standpipe service or if the standpipe
service is considered a vital community service, find ways to reduce costs. (Priority: Low)
There are private companies providing standpipe services in direct competition with the Authority. If the Authority cannot provide the same level of service at a less expensive price, it should not be in the standpipe business or it could lease its facilities to provide companies that are currently providing standpipe services. If there are residents or businesses that are dependent on the Authority providing the service and it is a benefit to the community, the Authority should aggressively find ways to reduce costs of providing the services such as centralizing the delivery points and automating the service to reduce the labor and maintenance overhead costs of the standpipe facilities.
F. CAPITAL SPENDING AND PROPOSED PROJECTS
WAPA, the Virgin Islands PSC and the Legislature and Governor all need to be on the same page regarding the long term future of the Water Department. WAPA was given responsibility for the Water Department because it was old, in disrepair, did not provide service to a broad range of customers and needed professional management. After almost three decades, it is still facing the same challenges and major decisions on infrastructure need to be made in order to solve its problems.
February 10, 2015
Page 132
Vantage reviewed a June 2014 Five Year Plan as well as a comprehensive capital and O&M analysis that was prepared in 201129. The information raises serious questions about just how WAPA should move forward with a long term strategy for its Water Department. Below Vantage provides excerpts from the 2015 Capital Plan as well as a summary of all projects that were identified in the 2011 analysis. While the 2011 study is dated, it provides the best available view of just how extensive the work requirements in the WAPA Water System may be.
VII-F6 The proposed level of capital expenditure plans provided in the 2015 Water and Operating Budget and the projections provided in a five year plan show significant expenditures in the next five years.
Vantage reviewed the planned capital budget for 2015, as well as the long list of potential projects provided in the five-year plan. The review raised more questions than answers. Given the drop in overall sales in 2014, should WAPA be optimistic about 2015 sales? Is the severe reduction in 2014 standpipe sales an indication that WAPA should exit this business altogether? Should WAPA, with support from the Government and PSC move forward with an aggressive, water reduction program that includes replacement of significant amount of very old piping? Should an expansion into other areas of the service territory be risked given the uncertainty of new large commercial operations becoming customers?
The 2015 capital budget includes major items such as $1.1 M for the Annas Retreat Waterline Phase; $.79 M for Pond Bay Water line; and $3.0 M for Nazareth Transmission Waterline on St. Thomas. On St. Croix the budget figures include $2.3 M for the Christiansted Waterline Upgrade Phase I; $3.1 M for the Pressure Management Phase line; $8 M for LaGrande Princess Rehab and $1.0 M for the Transmission Line from Kingshill to Frederikstedas well as $4 M for a Mid-Island Standpipe. These are significant amounts for dedicated line extension, refurbishment and expansion.
The five year plan, which while dated, does provide a roadmap for all capital expenditures considered through 2018 and estimated to total $70 million of which $18 million has no current funding source.
29 / Information form 7/11/2011 Water System Summary Model
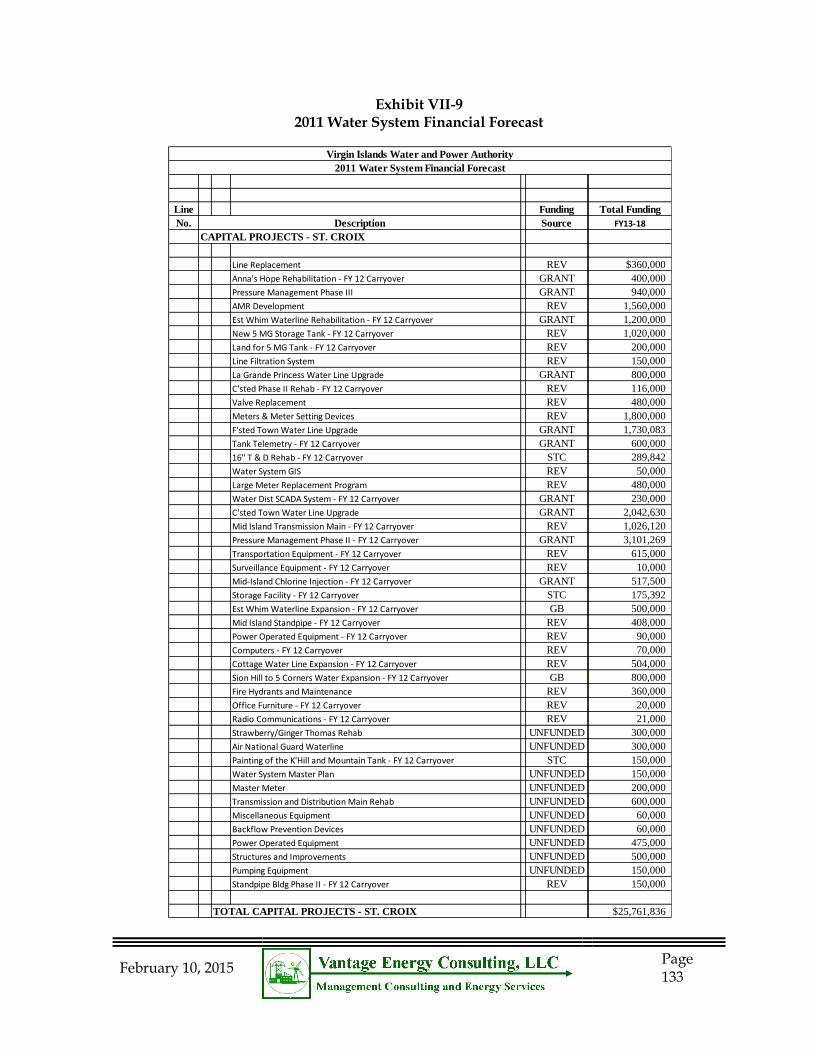
February 10, 2015
Page 133
Exhibit VII-9 2011 Water System Financial Forecast
Line Funding Total Funding
No. Source Agency FY13-18
CAPITAL PROJECTS - ST. CROIX
Line Replacement REV WAPA $360,000
Anna's Hope Rehabilitation - FY 12 Carryover GRANTDPNR/EPA 400,000
Pressure Management Phase III GRANTDPNR/EPA 940,000
AMR Development REV WAPA 1,560,000
Est Whim Waterline Rehabilitation - FY 12 Carryover GRANTDPNR/EPA 1,200,000
New 5 MG Storage Tank - FY 12 Carryover REV WAPA 1,020,000
Land for 5 MG Tank - FY 12 Carryover REV WAPA 200,000
Line Filtration System REV WAPA 150,000
La Grande Princess Water Line Upgrade GRANTUSDA 800,000
C'sted Phase II Rehab - FY 12 Carryover REV WAPA 116,000
Valve Replacement REV WAPA 480,000
Meters & Meter Setting Devices REV WAPA 1,800,000
F'sted Town Water Line Upgrade GRANTDPNR/EPA 1,730,083
Tank Telemetry - FY 12 Carryover GRANTDPNR/EPA 600,000
16" T & D Rehab - FY 12 Carryover STC TAXES 289,842
Water System GIS REV WAPA 50,000
Large Meter Replacement Program REV WAPA 480,000
Water Dist SCADA System - FY 12 Carryover GRANTDPNR/EPA 230,000
C'sted Town Water Line Upgrade GRANTDPNR/EPA 2,042,630
Mid Island Transmission Main - FY 12 Carryover REV WAPA 1,026,120
Pressure Management Phase II - FY 12 Carryover GRANTDPNR/EPA 3,101,269
Transportation Equipment - FY 12 Carryover REV WAPA 615,000
Surveillance Equipment - FY 12 Carryover REV WAPA 10,000
Mid-Island Chlorine Injection - FY 12 Carryover GRANTDPNR/EPA 517,500
Storage Facility - FY 12 Carryover STC TAXES 175,392
Est Whim Waterline Expansion - FY 12 Carryover GB 500,000
Mid Island Standpipe - FY 12 Carryover REV WAPA 408,000
Power Operated Equipment - FY 12 Carryover REV WAPA 90,000
Computers - FY 12 Carryover REV WAPA 70,000
Cottage Water Line Expansion - FY 12 Carryover REV WAPA 504,000
Sion Hill to 5 Corners Water Expansion - FY 12 Carryover GB 800,000
Fire Hydrants and Maintenance REV WAPA 360,000
Office Furniture - FY 12 Carryover REV WAPA 20,000
Radio Communications - FY 12 Carryover REV WAPA 21,000
Strawberry/Ginger Thomas Rehab UNFUNDED 300,000
Air National Guard Waterline UNFUNDED 300,000
Painting of the K'Hill and Mountain Tank - FY 12 Carryover STC TAXES 150,000
Water System Master Plan UNFUNDED 150,000
Master Meter UNFUNDED 200,000
Transmission and Distribution Main Rehab UNFUNDED 600,000
Miscellaneous Equipment UNFUNDED 60,000
Backflow Prevention Devices UNFUNDED 60,000
Power Operated Equipment UNFUNDED 475,000
Structures and Improvements UNFUNDED 500,000
Pumping Equipment UNFUNDED 150,000
Standpipe Bldg Phase II - FY 12 Carryover REV WAPA 150,000
TOTAL CAPITAL PROJECTS - ST. CROIX $25,761,836
Virgin Islands Water and Power Authority
2011 Water System Financial Forecast
Description
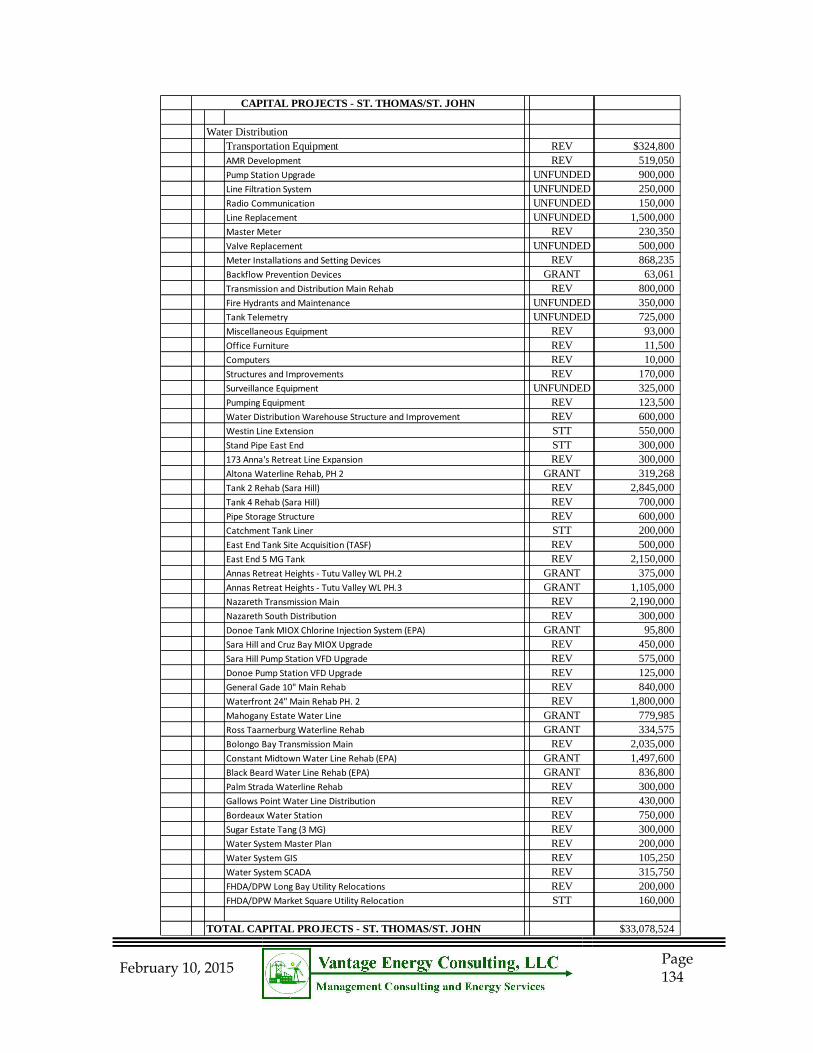
February 10, 2015
Page 134
Water Distribution
Transportation Equipment REV $324,800
AMR Development REV 519,050
Pump Station Upgrade UNFUNDED 900,000
Line Filtration System UNFUNDED 250,000
Radio Communication UNFUNDED 150,000
Line Replacement UNFUNDED 1,500,000
Master Meter REV 230,350
Valve Replacement UNFUNDED 500,000
Meter Installations and Setting Devices REV 868,235
Backflow Prevention Devices GRANT 63,061
Transmission and Distribution Main Rehab REV 800,000
Fire Hydrants and Maintenance UNFUNDED 350,000
Tank Telemetry UNFUNDED 725,000
Miscellaneous Equipment REV 93,000
Office Furniture REV 11,500
Computers REV 10,000
Structures and Improvements REV 170,000
Surveillance Equipment UNFUNDED 325,000
Pumping Equipment REV 123,500
Water Distribution Warehouse Structure and Improvement REV 600,000
Westin Line Extension STT 550,000
Stand Pipe East End STT 300,000
173 Anna's Retreat Line Expansion REV 300,000
Altona Waterline Rehab, PH 2 GRANT 319,268
Tank 2 Rehab (Sara Hill) REV 2,845,000
Tank 4 Rehab (Sara Hill) REV 700,000
Pipe Storage Structure REV 600,000
Catchment Tank Liner STT 200,000
East End Tank Site Acquisition (TASF) REV 500,000
East End 5 MG Tank REV 2,150,000
Annas Retreat Heights - Tutu Valley WL PH.2 GRANT 375,000
Annas Retreat Heights - Tutu Valley WL PH.3 GRANT 1,105,000
Nazareth Transmission Main REV 2,190,000
Nazareth South Distribution REV 300,000
Donoe Tank MIOX Chlorine Injection System (EPA) GRANT 95,800
Sara Hill and Cruz Bay MIOX Upgrade REV 450,000
Sara Hill Pump Station VFD Upgrade REV 575,000
Donoe Pump Station VFD Upgrade REV 125,000
General Gade 10" Main Rehab REV 840,000
Waterfront 24" Main Rehab PH. 2 REV 1,800,000
Mahogany Estate Water Line GRANT 779,985
Ross Taarnerburg Waterline Rehab GRANT 334,575
Bolongo Bay Transmission Main REV 2,035,000
Constant Midtown Water Line Rehab (EPA) GRANT 1,497,600
Black Beard Water Line Rehab (EPA) GRANT 836,800
Palm Strada Waterline Rehab REV 300,000
Gallows Point Water Line Distribution REV 430,000
Bordeaux Water Station REV 750,000
Sugar Estate Tang (3 MG) REV 300,000
Water System Master Plan REV 200,000
Water System GIS REV 105,250
Water System SCADA REV 315,750
FHDA/DPW Long Bay Utility Relocations REV 200,000
FHDA/DPW Market Square Utility Relocation STT 160,000
TOTAL CAPITAL PROJECTS - ST. THOMAS/ST. JOHN $33,078,524
CAPITAL PROJECTS - ST. THOMAS/ST. JOHN
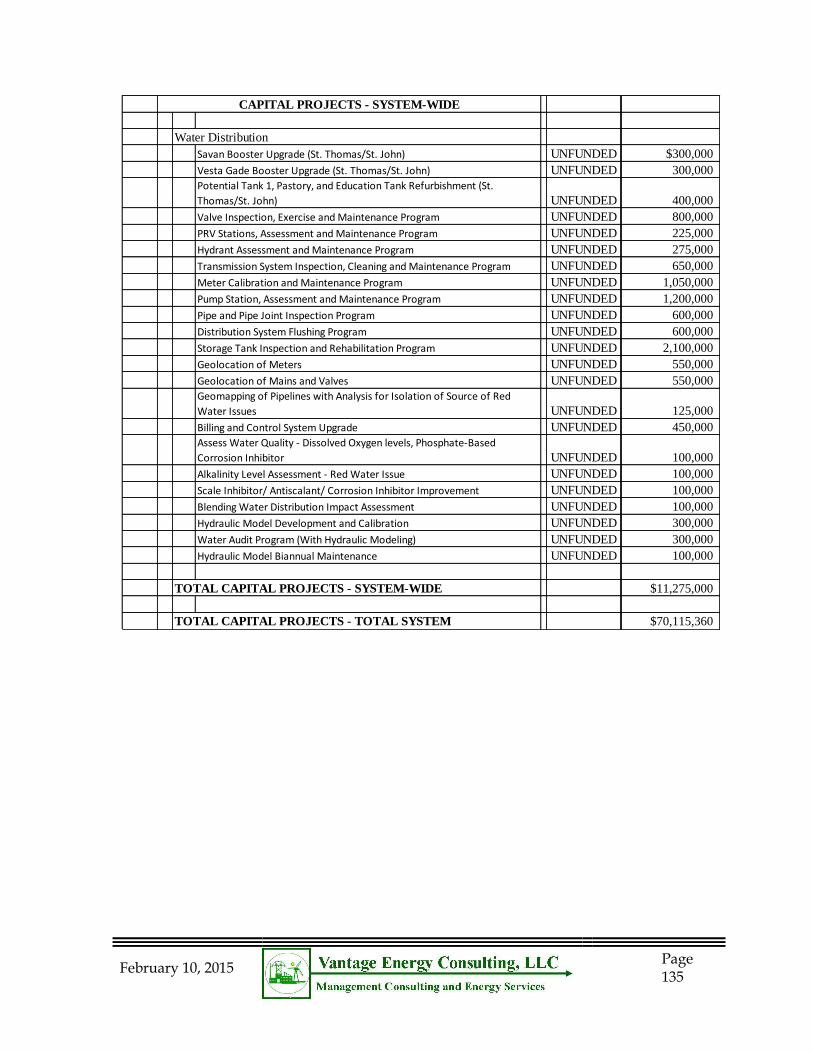
February 10, 2015
Page 135
Water Distribution
Savan Booster Upgrade (St. Thomas/St. John) UNFUNDED $300,000
Vesta Gade Booster Upgrade (St. Thomas/St. John) UNFUNDED 300,000
Potential Tank 1, Pastory, and Education Tank Refurbishment (St.
Thomas/St. John) UNFUNDED 400,000
Valve Inspection, Exercise and Maintenance Program UNFUNDED 800,000
PRV Stations, Assessment and Maintenance Program UNFUNDED 225,000
Hydrant Assessment and Maintenance Program UNFUNDED 275,000
Transmission System Inspection, Cleaning and Maintenance Program UNFUNDED 650,000
Meter Calibration and Maintenance Program UNFUNDED 1,050,000
Pump Station, Assessment and Maintenance Program UNFUNDED 1,200,000
Pipe and Pipe Joint Inspection Program UNFUNDED 600,000
Distribution System Flushing Program UNFUNDED 600,000
Storage Tank Inspection and Rehabilitation Program UNFUNDED 2,100,000
Geolocation of Meters UNFUNDED 550,000
Geolocation of Mains and Valves UNFUNDED 550,000
Geomapping of Pipelines with Analysis for Isolation of Source of Red
Water Issues UNFUNDED 125,000
Billing and Control System Upgrade UNFUNDED 450,000
Assess Water Quality - Dissolved Oxygen levels, Phosphate-Based
Corrosion Inhibitor UNFUNDED 100,000
Alkalinity Level Assessment - Red Water Issue UNFUNDED 100,000
Scale Inhibitor/ Antiscalant/ Corrosion Inhibitor Improvement UNFUNDED 100,000
Blending Water Distribution Impact Assessment UNFUNDED 100,000
Hydraulic Model Development and Calibration UNFUNDED 300,000
Water Audit Program (With Hydraulic Modeling) UNFUNDED 300,000
Hydraulic Model Biannual Maintenance UNFUNDED 100,000
TOTAL CAPITAL PROJECTS - SYSTEM-WIDE $11,275,000
TOTAL CAPITAL PROJECTS - TOTAL SYSTEM $70,115,360
CAPITAL PROJECTS - SYSTEM-WIDE
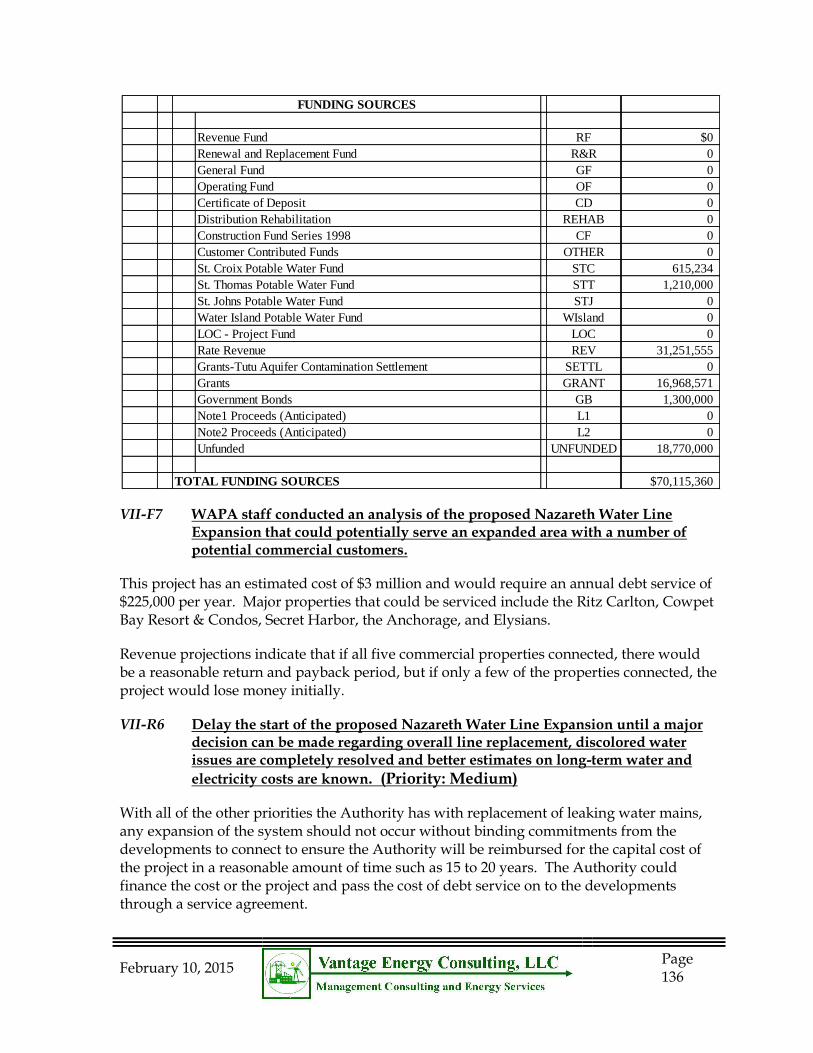
February 10, 2015
Page 136
VII-F7 WAPA staff conducted an analysis of the proposed Nazareth Water Line Expansion that could potentially serve an expanded area with a number of potential commercial customers.
This project has an estimated cost of $3 million and would require an annual debt service of $225,000 per year. Major properties that could be serviced include the Ritz Carlton, Cowpet Bay Resort & Condos, Secret Harbor, the Anchorage, and Elysians.
Revenue projections indicate that if all five commercial properties connected, there would be a reasonable return and payback period, but if only a few of the properties connected, the project would lose money initially.
VII-R6 Delay the start of the proposed Nazareth Water Line Expansion until a major decision can be made regarding overall line replacement, discolored water issues are completely resolved and better estimates on long-term water and
electricity costs are known. (Priority: Medium)
With all of the other priorities the Authority has with replacement of leaking water mains, any expansion of the system should not occur without binding commitments from the developments to connect to ensure the Authority will be reimbursed for the capital cost of the project in a reasonable amount of time such as 15 to 20 years. The Authority could finance the cost or the project and pass the cost of debt service on to the developments through a service agreement.
Revenue Fund RF $0
Renewal and Replacement Fund R&R 0
General Fund GF 0
Operating Fund OF 0
Certificate of Deposit CD 0
Distribution Rehabilitation REHAB 0
Construction Fund Series 1998 CF 0
Customer Contributed Funds OTHER 0
St. Croix Potable Water Fund STC 615,234
St. Thomas Potable Water Fund STT 1,210,000
St. Johns Potable Water Fund STJ 0
Water Island Potable Water Fund WIsland 0
LOC - Project Fund LOC 0
Rate Revenue REV 31,251,555
Grants-Tutu Aquifer Contamination Settlement SETTL 0
Grants GRANT 16,968,571
Government Bonds GB 1,300,000
Note1 Proceeds (Anticipated) L1 0
Note2 Proceeds (Anticipated) L2 0
Unfunded UNFUNDED 18,770,000
TOTAL FUNDING SOURCES $70,115,360
FUNDING SOURCES
February 10, 2015
Page 137
VII-F8 There are a number of business plan risks and uncertainties that must be considered in all long term planning.
Sales Levels
Future Credit Worthiness
Participation of Large Users
Recovery of Stand Pipe Sales
Level and Timing of Grant Funds
Payment of Accounts Receivable
Continuation of the Line Loss Surcharge
VII-F9 There are many Customers that use cisterns on a day to day basis and rely on the WAPA system only when their cistern is empty.
Although the customers are connected to the Authority’s system through a metered connection, there is usually several months when there is zero consumption on the meter because rain water has kept the cistern sufficiently filled. Although the Authority has expenses related to providing that metered connection to the customer every month, no revenues are received and those expenses are essentially passed on to other customers through the existing rate structure.
VII-R7 Take steps with the appropriate legislative body and regulators to implement a monthly Base Facility Charge for its different classes of services. (Priority: Medium)
A base facility charge would essentially be a monthly “readiness to serve charge” that would recoup costs to offset expenses that the Authority incurs to provide service to a customer regardless if they use any water. Expenses such as maintenance of the pipeline in front of the house, cost of the water production facility, customer service meter reading and billing, general administrative overhead of the Authority, etc. Yes, these expenses are also recouped within the water usage rate, but it is not equitable that a customer can enjoy the convenience, reliability, and security of a metered water connection but not contribute to the expenses of the Authority on a monthly basis regardless of water usage. A base facility charge is an equitable charge for all customers and will help provide a more stable revenue stream that would further the Authority’s goal of meeting the required debt service coverage ratio and funding needed capital improvements.
VII-R8 Distinguish between water distribution upgrades and extensions and adopt
associated funding policies. (Priority: Low)
Typically utilities differentiate between how funds are sourced for different types of projects.
February 10, 2015
Page 138
Replacement of existing water mains due to age and water loss should be budgeted and funded under the existing policies and paid for through grants and capital improvement funds. Most of the existing infrastructure on St. Croix would fit into this category.
Line extensions into new areas of development should be funded internally based on a sound economic return or a decision that the extension best serves the community needs. The proposed Nazareth Water Line Expansion on St. Thomas, which could potentially serve an expanded area with a number of potential commercial customers, would qualify here, if there are adequate commitments to make it cost effective.
New water distribution pipe extensions required to serve new developments, whether they are single family homes or commercial projects, should be funded and constructed by the developer. Funding and construction could be performed by the Authority with funds being recouped from the developer through a surcharge over a reasonable period of time at the same interest rate the Authority pays.
The cost for water main upgrades to provide a higher level of service to redeveloped properties or existing properties that previously had other sources of water would be borne by the property owner. Funding and construction could be performed by the Authority with funds being recouped from the developer through a surcharge over a reasonable period of time at the same interest rate the Authority pays.
G. OPERATING BUDGET ANALYSIS
VII-F10 The proposed operating budget faces significant risks and the existing rates as approved by the PSC are not adequate to fund all of the needs of the Water System.
Exhibit VII-9 and VII-10 below show the projected revenue in the five year plan as well as the actual results for 2014. These two exhibits illustrate just how dramatically water revenues missed the projections for 2014. Budgeted revenues were $42.2 M, but actual revenues only reached $31.2 M and net income was budgeted at $11.3 M and only reached $3.4 M. The 2015 budget seems to ignore these poor results and instead shows a projection that is similar to 2013.
The recent five year plan projected the adequacy of revenues and expenses under different scenarios. We provide these here to show the risk associated with revenue projections for the next five years. With current sales lower than anticipated in the Water Base Rate Case there is a real risk that WAPA may not recover adequate revenue over the period. Some residential customer growth is expected, but no new incentive rate customers are expected to connect to the system in the near future
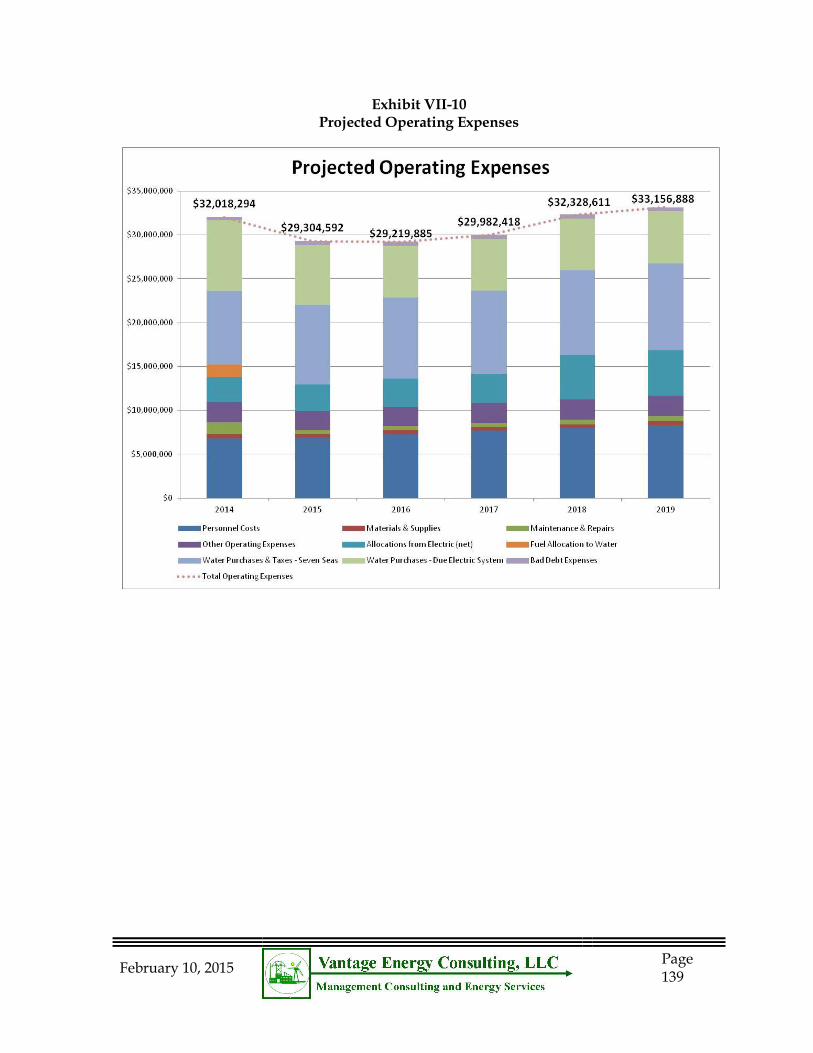
February 10, 2015
Page 139
Exhibit VII-10 Projected Operating Expenses
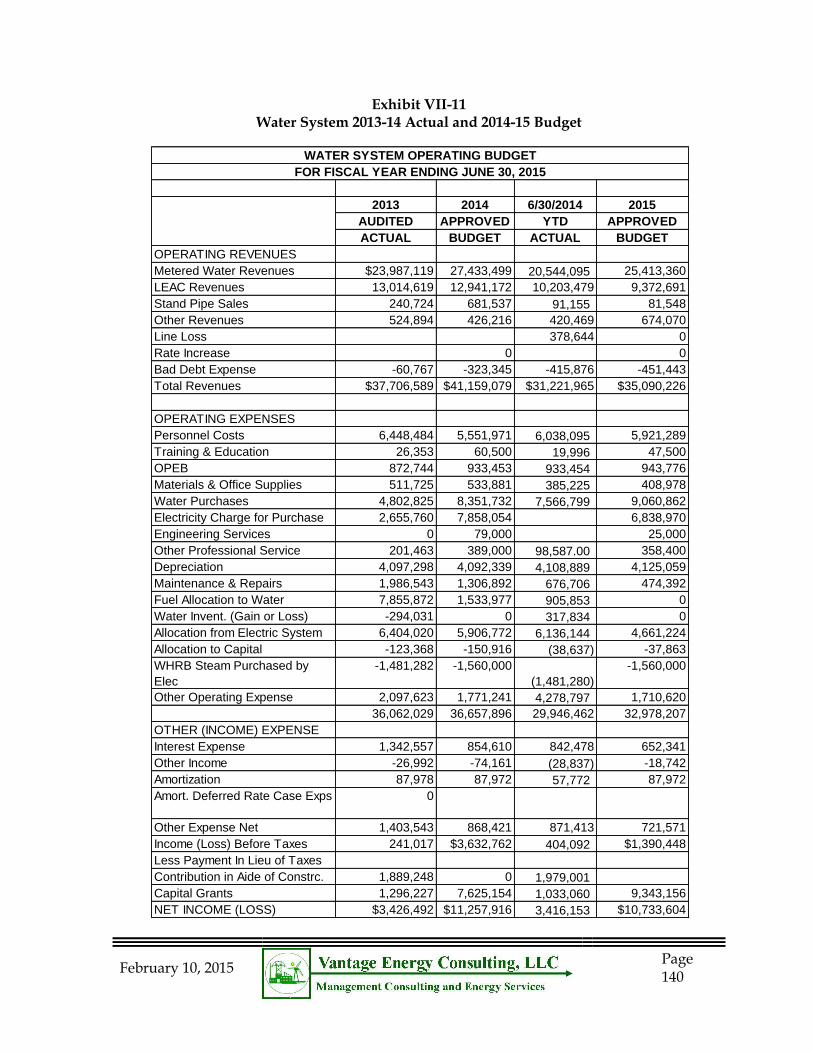
February 10, 2015
Page 140
Exhibit VII-11 Water System 2013-14 Actual and 2014-15 Budget
2013 2014 6/30/2014 2015
AUDITED APPROVED YTD APPROVED
ACTUAL BUDGET ACTUAL BUDGET
OPERATING REVENUES
Metered Water Revenues $23,987,119 27,433,499 20,544,095 25,413,360
LEAC Revenues 13,014,619 12,941,172 10,203,479 9,372,691
Stand Pipe Sales 240,724 681,537 91,155 81,548
Other Revenues 524,894 426,216 420,469 674,070
Line Loss 378,644 0
Rate Increase 0 0
Bad Debt Expense -60,767 -323,345 -415,876 -451,443
Total Revenues $37,706,589 $41,159,079 $31,221,965 $35,090,226
OPERATING EXPENSES
Personnel Costs 6,448,484 5,551,971 6,038,095 5,921,289
Training & Education 26,353 60,500 19,996 47,500
OPEB 872,744 933,453 933,454 943,776
Materials & Office Supplies 511,725 533,881 385,225 408,978
Water Purchases 4,802,825 8,351,732 7,566,799 9,060,862
Electricity Charge for Purchase 2,655,760 7,858,054 6,838,970
Engineering Services 0 79,000 25,000
Other Professional Service 201,463 389,000 98,587.00 358,400
Depreciation 4,097,298 4,092,339 4,108,889 4,125,059
Maintenance & Repairs 1,986,543 1,306,892 676,706 474,392
Fuel Allocation to Water 7,855,872 1,533,977 905,853 0
Water Invent. (Gain or Loss) -294,031 0 317,834 0
Allocation from Electric System 6,404,020 5,906,772 6,136,144 4,661,224
Allocation to Capital -123,368 -150,916 (38,637) -37,863
WHRB Steam Purchased by
Elec
-1,481,282 -1,560,000
(1,481,280)
-1,560,000
Other Operating Expense 2,097,623 1,771,241 4,278,797 1,710,620
36,062,029 36,657,896 29,946,462 32,978,207
OTHER (INCOME) EXPENSE
Interest Expense 1,342,557 854,610 842,478 652,341
Other Income -26,992 -74,161 (28,837) -18,742
Amortization 87,978 87,972 57,772 87,972
Amort. Deferred Rate Case Exps 0
Other Expense Net 1,403,543 868,421 871,413 721,571
Income (Loss) Before Taxes 241,017 $3,632,762 404,092 $1,390,448
Less Payment In Lieu of Taxes
Contribution in Aide of Constrc. 1,889,248 0 1,979,001
Capital Grants 1,296,227 7,625,154 1,033,060 9,343,156
NET INCOME (LOSS) $3,426,492 $11,257,916 3,416,153 $10,733,604
WATER SYSTEM OPERATING BUDGET
FOR FISCAL YEAR ENDING JUNE 30, 2015
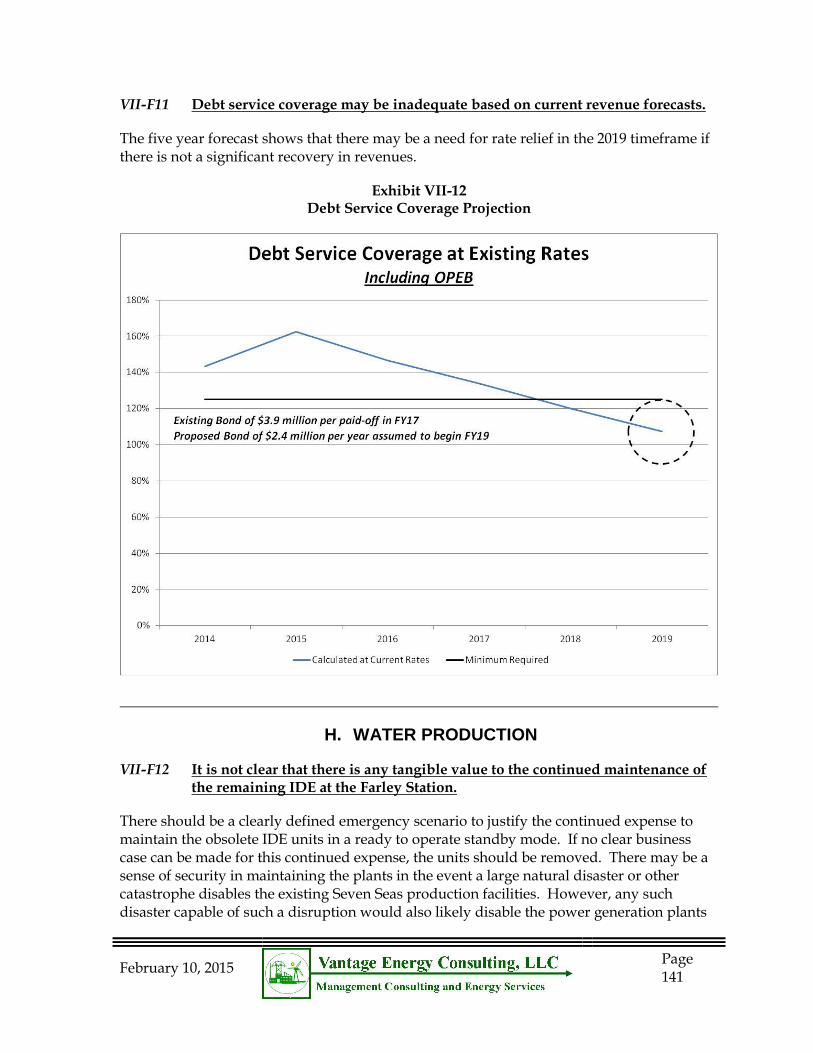
February 10, 2015
Page 141
VII-F11 Debt service coverage may be inadequate based on current revenue forecasts.
The five year forecast shows that there may be a need for rate relief in the 2019 timeframe if there is not a significant recovery in revenues.
Exhibit VII-12 Debt Service Coverage Projection
H. WATER PRODUCTION
VII-F12 It is not clear that there is any tangible value to the continued maintenance of the remaining IDE at the Farley Station.
There should be a clearly defined emergency scenario to justify the continued expense to maintain the obsolete IDE units in a ready to operate standby mode. If no clear business case can be made for this continued expense, the units should be removed. There may be a sense of security in maintaining the plants in the event a large natural disaster or other catastrophe disables the existing Seven Seas production facilities. However, any such disaster capable of such a disruption would also likely disable the power generation plants
February 10, 2015
Page 142
needed to power the IDE units assuming the IDE units were also not disabled. There may be greater value and less annual cost if WAPA puts an emergency contract in place with an entity capable of providing self-contained skid mounted RO units that could provide an emergency limited source of supply on a temporary basis until the Seven Seas plants are repaired and operational following a major disruption in service.
VII-R9 Perform an economic analysis to determine the need for the backup IDE’s. (Priority: Low)
The analysis should consider O&M implications, the value of the space presently occupied by the IDEs, the lack of a stem source, and the ability to bring in skid mounted RO systems
should a catastrophic failure occur to the existing RO equipment.
February 10, 2015
Page 143
VIII. REVENUE COLLECTION ISSUES
WAPA faces problems with revenue collection on a number of fronts. First, the late payments by various government entities and hospitals have resulted in significant receivables and led to serious cash flow constraints. Second, the elasticity associated with rising energy rates has caused revenue to fall despite increased rates. The combination of these two problems has resulted in limits on the ability for WAPA to pay its creditors on a timely basis. Further exacerbating the problem is the rate structure for certain services. This section of the report will identify the problems, assess their impact and provide recommendations as to how the parties can work to minimize these issues.
A. BACKGROUND
Based on information presented in the WAPA Monthly Financial Statement for June 2014, electric operating revenue decreased by 5% from June 30, 2013 to June 30, 2014. 30 During this period, electric kWh sales decreased 6%. For the same period operating expenses decreased by 4%. However, the decline in operating expenses was not enough to offset the revenue reduction and the result was a significant operating loss of $6.7 million for the period. For the same period, accounts receivable increased by approximately 11%. Unfortunately, this is a repeat of the recent past. Certainly, in the long run this is not a financially viable course. This evidences a systemic problem that jeopardizes WAPA’s financial future and WAPA must address this problem on all fronts – recovery of unpaid balances, identification of additional sources of revenue, legislative remedies for non-payment by government entities, reductions in losses and thefts of service and implementation of cost control measures. Going forward, WAPA needs to make every effort to collect all revenue to which it is entitled while at the same time focusing on and implementing all available cost cutting measures.
30 / Monthly Financial Statement for June 2014, page 4.
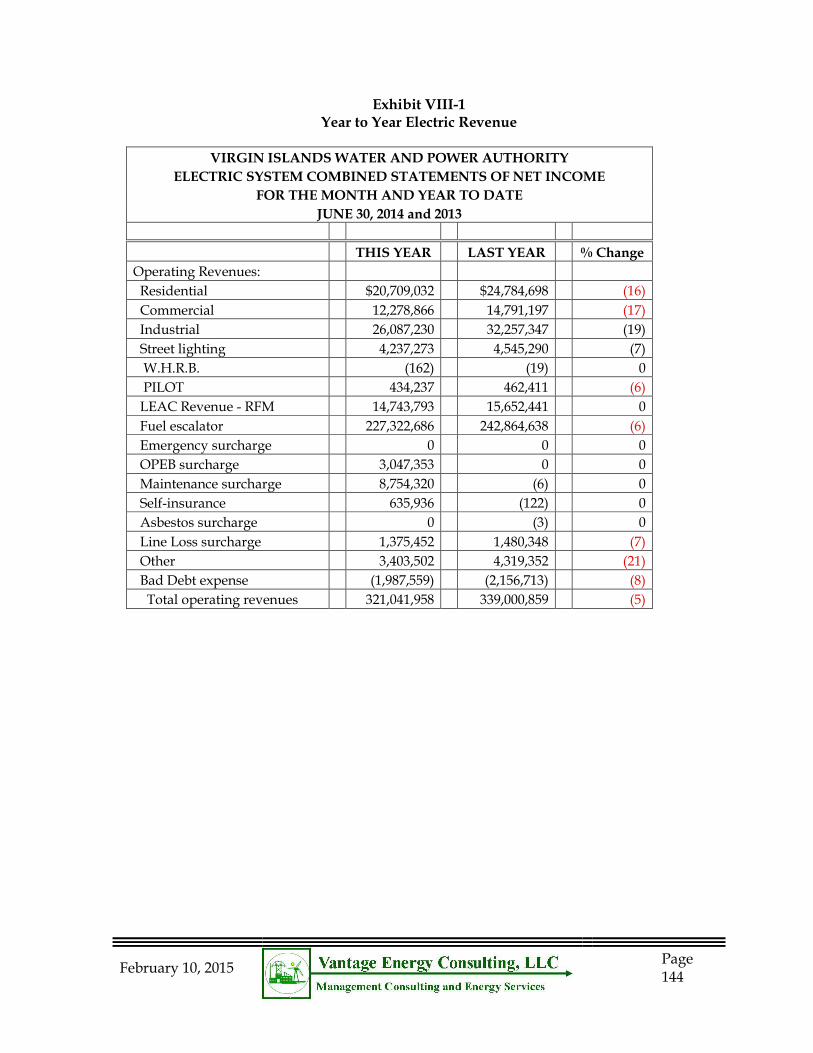
February 10, 2015
Page 144
Exhibit VIII-1 Year to Year Electric Revenue
VIRGIN ISLANDS WATER AND POWER AUTHORITY
ELECTRIC SYSTEM COMBINED STATEMENTS OF NET INCOME
FOR THE MONTH AND YEAR TO DATE
JUNE 30, 2014 and 2013
THIS YEAR LAST YEAR % Change Operating Revenues: Residential $20,709,032 $24,784,698 (16)
Commercial 12,278,866 14,791,197 (17)
Industrial 26,087,230 32,257,347 (19)
Street lighting 4,237,273 4,545,290 (7)
W.H.R.B. (162) (19) 0
PILOT 434,237 462,411 (6)
LEAC Revenue - RFM 14,743,793 15,652,441 0
Fuel escalator 227,322,686 242,864,638 (6)
Emergency surcharge 0 0 0
OPEB surcharge 3,047,353 0 0
Maintenance surcharge 8,754,320 (6) 0
Self-insurance 635,936 (122) 0
Asbestos surcharge 0 (3) 0
Line Loss surcharge 1,375,452 1,480,348 (7)
Other 3,403,502 4,319,352 (21)
Bad Debt expense (1,987,559) (2,156,713) (8)
Total operating revenues 321,041,958 339,000,859 (5)
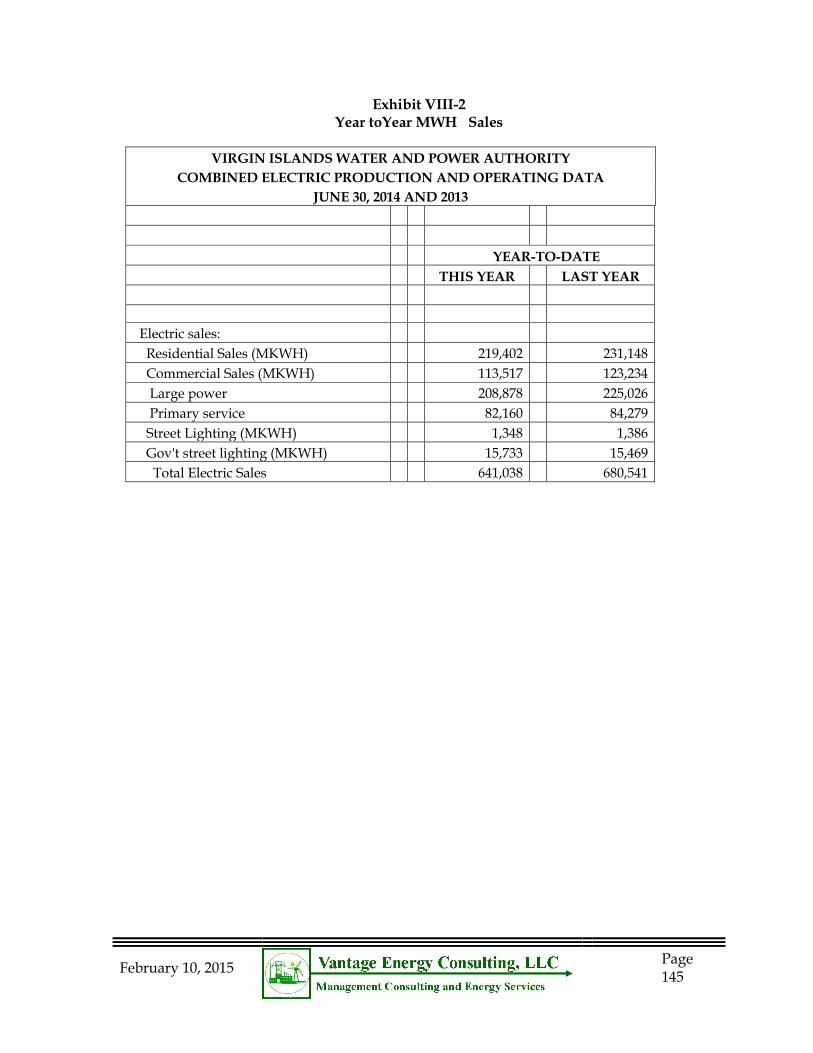
February 10, 2015
Page 145
Exhibit VIII-2 Year toYear MWH Sales
VIRGIN ISLANDS WATER AND POWER AUTHORITY
COMBINED ELECTRIC PRODUCTION AND OPERATING DATA
JUNE 30, 2014 AND 2013
YEAR-TO-DATE
THIS YEAR LAST YEAR
Electric sales:
Residential Sales (MKWH) 219,402 231,148
Commercial Sales (MKWH) 113,517 123,234
Large power 208,878 225,026
Primary service 82,160 84,279
Street Lighting (MKWH) 1,348 1,386
Gov't street lighting (MKWH) 15,733 15,469
Total Electric Sales 641,038 680,541
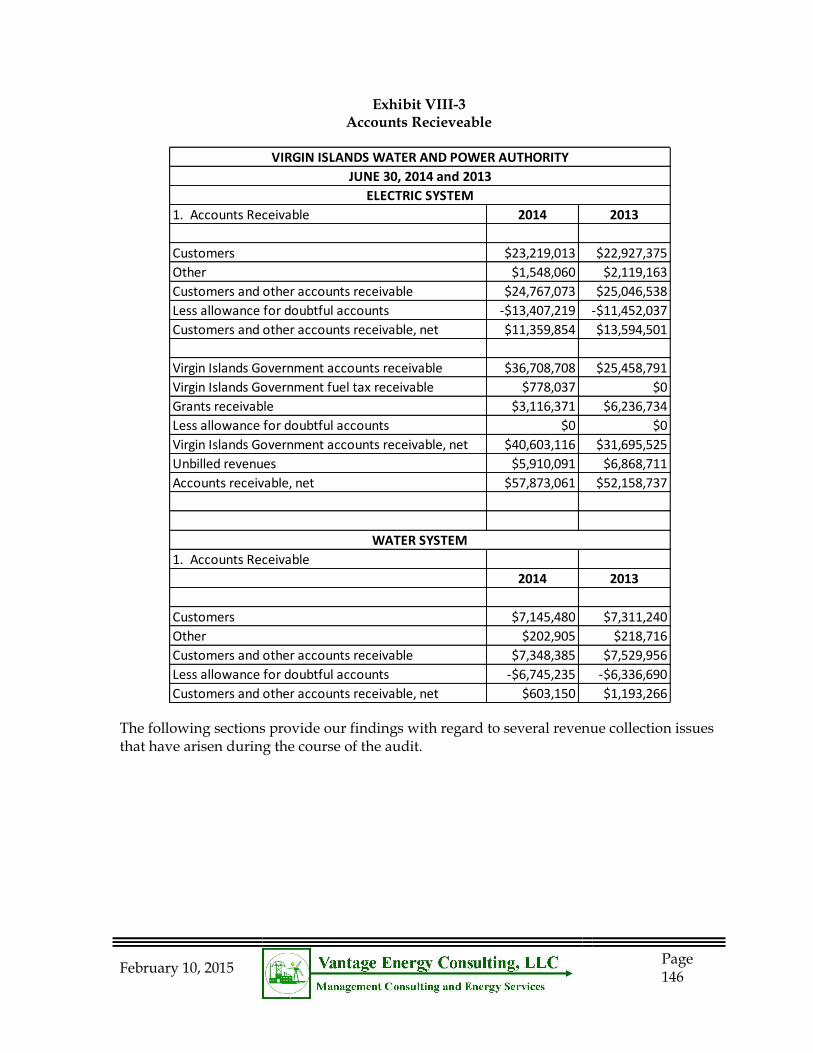
February 10, 2015
Page 146
Exhibit VIII-3 Accounts Recieveable
The following sections provide our findings with regard to several revenue collection issues that have arisen during the course of the audit.
1. Accounts Receivable 2014 2013
Customers $23,219,013 $22,927,375
Other $1,548,060 $2,119,163
Customers and other accounts receivable $24,767,073 $25,046,538
Less allowance for doubtful accounts -$13,407,219 -$11,452,037
Customers and other accounts receivable, net $11,359,854 $13,594,501
Virgin Islands Government accounts receivable $36,708,708 $25,458,791
Virgin Islands Government fuel tax receivable $778,037 $0
Grants receivable $3,116,371 $6,236,734
Less allowance for doubtful accounts $0 $0
Virgin Islands Government accounts receivable, net $40,603,116 $31,695,525
Unbilled revenues $5,910,091 $6,868,711
Accounts receivable, net $57,873,061 $52,158,737
1. Accounts Receivable
2014 2013
Customers $7,145,480 $7,311,240
Other $202,905 $218,716
Customers and other accounts receivable $7,348,385 $7,529,956
Less allowance for doubtful accounts -$6,745,235 -$6,336,690
Customers and other accounts receivable, net $603,150 $1,193,266
VIRGIN ISLANDS WATER AND POWER AUTHORITY
ELECTRIC SYSTEM
JUNE 30, 2014 and 2013
WATER SYSTEM
February 10, 2015
Page 147
B. PAYMENT ISSUES
NON-PAYMENT OF BILLS BY GOVERNMENT
VIII-F1 The government accounts receivable amount continues to grow and the lag in payment continues to expand.
According to the June 2014 Monthly Financial Statement, WAPA had an accounts receivable balance of $45.9 million at June 30, 2014. The Virgin Islands Government accounts receivable, net was $40.6 or over 70% of the total. The government accounts receivable amount continues to grow and the lag in payment continues to expand.
The remedy to this problem is not simple and it is not one that WAPA can resolve on its own. First, the legislature must allocate adequate funds for the agencies to keep current on their electric bills. Second, the government agencies must make the payments when the funds have been provided.
It is not surprising to learn that during the recent tough economic times it has been difficult for the legislature to increase taxes in order to appropriate enough funds for the payment of utility bills by the various agencies. However, it is important to note that when the government agencies delay in paying their bills, the other ratepayers suffer due to diminished services and reliability as well as increased rates. This raises a significant equity issue because the ratepayers, who are also the taxpayers, pay not only for their utility service but also for the delay in payment for the electric service of the government entities. A further complication is that this arrangement could very well be a regressive tax arrangement. This occurs if the lower income ratepayers pay a higher percentage of their income to pay their utility bill. In this case, the lower income customers are indirectly paying a higher tax rate than higher income customers.
The second part of the problem arises when the government agency is appropriated the funds to be able to pay for its utility service but chooses to spend the funds in a different manner. This appears to be the case for many of the agencies. In the case of the hospitals funding is provided through a separate tax but the hospitals still do not remain current paying their bills.
VIII-R1 Continue to inform the Legislature, Governor, and all stakeholders of the magnitude of the non-payment by the government agencies and its potential impact on the financial viability of WAPA. (Priority: High)
WAPA should take it upon itself to prepare an annual report for the legislature that lists the outstanding bills by each government agency and the length of time that the amount has been past due. The report should specify the financial impact for WAPA and also discuss the rate impact on its paying customers.
February 10, 2015
Page 148
VIII-R2 Encourage the legislature to establish a direct payment procedure for payment of utility bills by government entities.
WAPA should work with the legislature to emphasize the importance of the government agencies keeping current with the payment of their electric bills. The legislature must understand that the scarce tax dollars that are collected and allocated for the payment of utility bills are in fact not spent for the purposes for which they are collected. The legislature should be aware that one of the unintended consequences of non-payment of utility bills by the government agencies is reduced level of service for the other utility customers. Further, WAPA will be forced to increase its rates to recover the costs of government loans issued to WAPA to help it maintain its financial integrity due to non-payment by the government agencies. Based on this understanding, it should be easier for the legislature to enact a direct payment procedure. More importantly, a direct payment procedure is more equitable to WAPA, WAPA’s non-government customers and also the taxpayers of the Virgin Islands.
WATER UTILITY RATE STRUCTURE
VIII-F2 WAPA’s water rates are inadequate for recovery of its costs to provide service.
Unfortunately, the water utility component of WAPA struggles to maintain an adequate financial position and cannot keep current on the payment of its bills including payment for electric service. The additional revenue for the water entity to make current payments for the electric service it receives can only come from one of two sources – rate increase for water services or government loans. Although the government loans can provide short-term relief, it is not a long-term fix for the problem. As discussed elsewhere in this report, Vantage believes the water entity of WAPA needs to revisit its cost structure, existing infrastructure and rate structure. It appears the water system needs significant upgrades. The improvements will be costly. Currently, the rates of the water system do not cover its costs and certainly are not adequate to pay for the cost of needed upgrades.
When the improvements are made, the situation will likely worsen unless the rate levels and rate structures are significantly changed. One obvious change to the rate structure would be the inclusion of a monthly customer charge. Virtually every water utility has a fixed monthly customer charge in its rates. A cost-based customer charge would be easy to establish and it would provide some revenue stability.
VIII-R3 Seek approval, from the Legislature, for a monthly Base Facility Charge for its water rates. (Priority: Medium)
WAPA should determine the level of customer-related costs it incurs to serve its water customers. Based on this information, WAPA should develop a monthly charge per customer to recover these costs. This would be fair to customers and it would provide some measure of revenue stability for the water entity of WAPA.
February 10, 2015
Page 149
COMMERCIAL SALES LOSS
Tough economic times as well as the high electric rates of WAPA have encouraged several of WAPA’s commercial customers to significantly reduce their electric usage and in some cases to leave the electric grid.
VIII-F3 Pre-existing, existing and new commercial customers provide a potential source of increased revenue.
WAPA’s electric rates are projected to decline significantly in the near future with the conversion to LPG. This reduction may provide an opportune time to approach pre-existing customers to return to the WAPA system; to encourage existing customers to expand their energy usage; as well as to promote WAPA’s electricity to potential new customers. WAPA may need some rate flexibility to be successful in these efforts. Many utilities in the United States use economic development rates to promote the use of electricity with commercial customers. In exchange for the benefit of new jobs in the service territory, utilities are permitted to offer promotional discounts. The logic is that if the lower rate covers all of the utility’s variable cost associated with the sales to these customers and also makes some contribution to fixed cost, then all customers are better off. That is, it is better to have this customer on the system than to have the utilities facilities under-utilized and the fixed costs spread over fewer kWhs. Typically, these promotional economic development tariffs or special contracts contain other conditions. For instance, the lower rate can only be available for a limited time. The discounted rate cannot continue indefinitely. A utility cannot maintain its financial integrity for the long-term if it does not recover all of its costs. But in the short-term, some contribution to its fixed costs is better than no contribution. Usually, there are other limiting conditions associated with the provision of discounted rates and WAPA can easily research this matter by examining conditions imposed by other regulatory agencies.
VIII-R4 Establish a vigorous marketing initiative to take advantage of its reduced rates and develop increased electricity sales with pre-existing, existing and new commercial customers. (Priority: Medium)
With the prospect of WAPA’s electricity rates being significantly reduced in the near future, it should establish a marketing initiative that focuses on commercial customers who have recently left the WAPA system; those who have reduced usage but remain on the WAPA system; and those who are potential new customers. WAPA needs to assemble a team to identify all of the potential customers and develop marketing material to share with these customers. Also, WAPA should seek the necessary regulatory or legal authority to offer incentive or economic development rates and to enter special contracts. WAPA may want to research the tariffs and contracts of other utilities to enable it to develop some meaningful parameters for the tariffs and contracts.
OTHER LOSSES
Like other utilities, WAPA experiences losses and unaccounted for kWh. Some of these losses are purely operational and fully expected. However, there are potentially other
February 10, 2015
Page 150
losses. These losses can occur due to incorrect billing, theft, erroneous tariff assignment, etc. Given WAPA’s financial condition, it needs to make sure it is receiving all of the revenue that it is entitled to receive.
VIII-F4 Like other utilities, WAPA experiences a loss of revenue that it is entitled to receive.
As of June 30, 2014, WAPA had a line loss and unaccounted for kWh of 7.3% of its net generation. Although this is an improvement from the recent past few years, it is still significant. Every 1% decrease in losses is equivalent to approximately $2 million in savings or additional revenue.
VIII-R5 Initiate a program to determine if WAPA is collecting all of the revenue to which it is entitled and prepare a plan for remediation. (Priority: High)
WAPA should consider instituting a revenue assurance program. They may be surprised at the findings. Recently, Bermuda Electric Light Company (“BELCO”) completed a comprehensive review of its tariffs and losses and found considerable benefit from the initiative. More specifically Bermuda found the following:
“While there were obvious economic reasons to expect customer to slo-pay, lo-pay, and no-pay their utility bills, many of the reasons uncovered were not expected. Some customers were connected by BELCO but were not correctly setup in the billing system. Others were disconnected by BELCO and then they reconnected themselves without BELCO knowing. Some commercial customers were assigned incorrect rate classes while other commercial customers had invalid metering/wiring configurations. All tolled – these revenue assurance gaps from unbilled, under-billed and theft grew to 5.5% of gross revenue at a time when overall revenue was decreasing because of the economy.”
Many of these concerns seem applicable to the WAPA system also. Vantage believes it warrants further review. WAPA should initiate a program to audit its tariffs and the appropriate application of those tariffs. The program should also identify and account for any losses and determine the potential to convert those losses to potential revenue.
STREET LIGHTING REVENUE SHORTFALL
VIII-F5 The rates for Street Lighting do not fully recover the costs to provide this service.
As can be seen in Exhibit VII-2 Sales, the only category of kWh sales to increase from June 30, 2013 to June 30, 2014 was Government Street Lighting. Unfortunately, this growth in sales is not good news in this instance. During several interviews, it was brought to our attention that the rates for this service are inadequate to compensate WAPA for the cost to provide the service. Since street lighting is a potential safety issue, it was generally believed that some subsidy in the form of lower rates for the service is justified. However, without
February 10, 2015
Page 151
reasonable cost information, it is impossible to determine the amount of the subsidy and whether it is justifiable and equitable to WAPA’s other customers.
VIII-R6 Calculate the actual cost to provide street lighting service and, if appropriate, investigate an alternate cost-based rate structure. . (Priority: Medium)
Although the safety of the residents of the Virgin Islands as well as the safety of its tourists is an important consideration, it is impossible to determine how much WAPA and its ratepayers are subsidizing this service without a better understanding of the cost to provide the service. In order to be fair to all parties, WAPA should perform a cost study to determine what it costs to provide street lighting service. Based on the results of the study, all of the parties will have a better understanding of the magnitude of the subsidy that WAPA and its ratepayers are providing to keep the streets well lit. Based on the feedback we have received, WAPA is likely to find that the subsidy it is providing cannot be justified and that it must develop a cost-based rate for street lighting to be submitted to the PSC for approval.