Embed Size (px)
Citation preview

Management and Delivery of Community Nursing Services in Ontario: Impact on the Quality
of Care and the Quality of Worklife of Community-based Nurses
April, 2004
Diane Doran, PhD, RN
Jennie Pickard, MScN, RN Janet Harris, MScN, RN
Peter C. Coyte, PhD Andrew MacRae, PhD
Heather Laschinger, PhD, RN Gerarda Darlington, PhD Jennifer Carryer, MN, RN
Decision Maker Partners: Janet Harris, CEO, Durham Access to Care Funding Provided by: Canadian Health Services Research Foundation Ontario Ministry of Health and Long-Term Care University of Toronto

Principal Investigators: Diane Doran, RN, PhD Associate Dean, Research and International Relations Faculty of Nursing University of Toronto 50 St George Street Toronto, Ontario M5S 3H4 Telephone: (416) 978-2866 Fax: (416) 978-8222 E-mail: [email protected]
Jennie Pickard, RN, MScN Director, Quality, Contracts, Research and Organizational Development Durham Access to Care 209 Dundas St. East, 5th Floor Whitby, Ontario K1N 7H8 Telephone: (905) 430-3308, ext. 3505 Fax: (905) 430-8682 E-mail: [email protected]
This document is available on the Canadian Health Services Research Foundation web site (www.chrsf.ca). For more information on the Canadian Health Services Research Foundation, contact the foundation at: 1565 Carling Avenue, Suite 700 Ottawa, Ontario K1Z 8R1 E-mail: [email protected] Telephone: (613) 728-2238 Fax: (613) 728-3527 Ce document est disponible sur le site Web de la Fondation canadienne de la recherche sur les services de santé (www.fcrss.ca). Pour obtenir de plus amples renseignements sur la Fondation canadienne de la recherche sur les services de santé, communiquez avec la Fondation : 1565, avenue Carling, bureau 700 Ottawa (Ontario) K1Z 8R1 Courriel : [email protected] Téléphone : (613) 728-2238 Télécopieur : (613) 728-3527

Management and Delivery of Community Nursing Services in Ontario: Impact on the Quality of Care and the Quality of
Worklife of Community-based Nurses
Diane Doran, PhD, RN1 Jennie Pickard, MScN, RN2
Janet Harris, MScN, RN2 Peter C. Coyte, PhD3
Andrew MacRae, PhD4 Heather Laschinger, PhD, RN5
Gerarda Darlington, PhD6 Jennifer Carryer, MN, RN
1 Faculty of Nursing, University of Toronto 2 Durham Access to Care 3 University of Toronto 4 The Research Institute at Lakeridge Health 5 School of Nursing, University of Western Ontario 6 University of Guelph
Acknowledgements:
We gratefully acknowledge Canadian Health Services Research Foundation, the Ontario Ministry of Health and Long-Term Care and the Nursing Effectiveness Utilization and Outcomes Research Unit, Faculty of Nursing, University of Toronto, for their support of this research. The opinions, results, and conclusions are those of the authors. No endorsement by the funders is intended or should be inferred.
We would like to thank the Community Care Access Centres, nursing agencies, nurses, and clients who participated in this study. The research team recognizes the time and commitment that this study required from all of these people. We also thank them for being open and accommodating when asked to share sensitive data.
We would also like to thank the following research assistants for their contribution: Suzanne Fredericks, Jiao Jiang, Shannon Carey, Katie Fisher, Helen Mann, Tania Arko, and Antonio Valente. Special thanks to Sharon Relova, Barbara Thomson and the Statistical Consulting Service, Dept. of Statistics, University of Toronto.
A steering committee provided consultation and advice from the preliminary planning stages of the study. The same organizations have been represented on the steering committee throughout the study, although the names of representatives have changed for some organizations.
Steering Committee
Comcare Health Services Mary Jo Dunlop, Marg McAllister, Heather Arts, Greg More Ministry of Health and Long-Term Care Susan Chernin, Irene Medcof Ontario Association of Community Care Access Centres Georgina White
ParaMed Home Health Care Steve Haas Saint Elizabeth Health Care Shirlee Sharkey Victorian Order of Nurses Sue VanDeVelde-Coke, Diane McLeod

Table of Contents
Key Implications for Decision Makers ........................................................ i Executive Summary .................................................................................... ii Study Overview ...........................................................................................1 Study Background ............................................................................1 Background Literature.....................................................................2 Study Objectives...............................................................................9 Phase Two Design......................................................................................10 Sample Recruitment .......................................................................10 Study Variables ..............................................................................12 Participants.................................................................................................15 Nurse Sample .................................................................................15 Client Sample .................................................................................16 Contract Characteristics................................................................17 Study Results – Phase Two........................................................................18 Approach to Data Analysis, Phase Two ........................................18 Objective 1 .....................................................................................19 Consistency of Care Provider ........................................................20 Client Perception of the Quality of Nursing Care .........................21 Nurses’ Perception of the Quality of Care ....................................22 Contract Management ...................................................................24 Objective 2 .....................................................................................24 Client Satisfaction Linear Modeling ..............................................27 Objective 3 .....................................................................................28 Objective 4 .....................................................................................29 Perceived Job Security...................................................................31 Discussion..................................................................................................32 Study Limitations ...........................................................................32 Discussion ......................................................................................34 Objective 1 .....................................................................................36 Objective 2 .....................................................................................37 Objective 3 .....................................................................................38 Objective 4 .....................................................................................39 Conclusion .................................................................................................40 References..................................................................................................42 APPENDIX A............................................................................................45
i
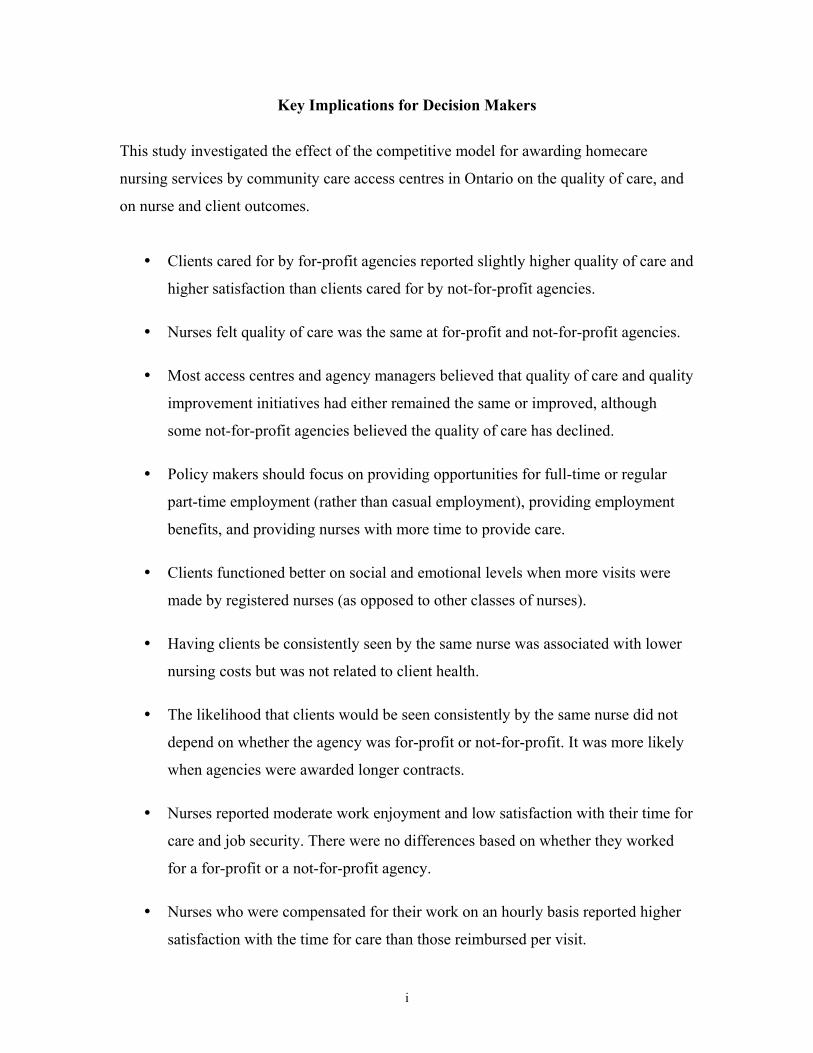
Key Implications for Decision Makers
This study investigated the effect of the competitive model for awarding homecare
nursing services by community care access centres in Ontario on the quality of care, and
on nurse and client outcomes.
Clients cared for by for-profit agencies reported slightly higher quality of care and
higher satisfaction than clients cared for by not-for-profit agencies.
Nurses felt quality of care was the same at for-profit and not-for-profit agencies.
Most access centres and agency managers believed that quality of care and quality
improvement initiatives had either remained the same or improved, although
some not-for-profit agencies believed the quality of care has declined.
Policy makers should focus on providing opportunities for full-time or regular
part-time employment (rather than casual employment), providing employment
benefits, and providing nurses with more time to provide care.
Clients functioned better on social and emotional levels when more visits were
made by registered nurses (as opposed to other classes of nurses).
Having clients be consistently seen by the same nurse was associated with lower
nursing costs but was not related to client health.
The likelihood that clients would be seen consistently by the same nurse did not
depend on whether the agency was for-profit or not-for-profit. It was more likely
when agencies were awarded longer contracts.
Nurses reported moderate work enjoyment and low satisfaction with their time for
care and job security. There were no differences based on whether they worked
for a for-profit or a not-for-profit agency.
Nurses who were compensated for their work on an hourly basis reported higher
satisfaction with the time for care than those reimbursed per visit.

ii
Executive Summary
Background
In 1995, the Ontario Ministry of Health and Long-Term Care created 43 community care
access centres, which were charged with the responsibility of awarding service contracts
to provider agencies using a competitive “request for proposals” process. Both for-profit
and not-for-profit agencies submit proposals to the centres in response to requests for
proposals, and in turn are awarded contracts for pre-determined periods of time. The
Community Nursing Services Study described this model and examined its impact on
nurse and client outcomes.
The study was conducted in two phases. The report of the first phase was released in
August 2002. It described how the competitive bidding process was being put into
operation, including the volumes and costs of nursing visits for for-profit and not-for-
profit agencies during the first five years of competitive bidding. The report can be read
at www.nursing.utoronto.ca/faculty/bios/CNSS_Phase_1_Reportb.pdf.
Objectives
The objectives of the second phase of the study were to examine the relationships
between variables in the structure of the contracts and:
$ quality of care;
$ client outcomes;
$ cost of care; and
$ nurse outcomes.

iii
This report describes the second phase of the study.
Findings
There were few differences in quality of care based on the contract length, contract
volume, or whether the agency was for-profit or not-for-profit. Clients cared for by for-
profit agencies reported higher quality of care and higher satisfaction than clients cared
for by not-for-profit agencies. There were significant differences in nurse quality
outcomes among provider agencies. The more consistently the client was seen by the
same nurse, the lower the nursing costs were. Consistency did not affect client health
outcomes. Clients who were healthier when they were admitted to homecare were still
healthier six weeks later or at discharge. More visits made by a registered nurse were
related to better emotional and social functional outcomes. Older nurses and nurses who
worked part-time enjoyed their work more than younger nurses and those who worked on
a casual basis. Nurses who were compensated on an hourly basis reported higher
satisfaction with time for care than nurses who were compensated on a per visit basis.
Nurse turnover was not related to contract variables or ownership type.
Design
A longitudinal design was used to collect data on client outcomes twice: at admission to
homecare or recruitment into the study; and at discharge or after six weeks, whichever
came first. Nurses, agencies, and access centres were surveyed using written
questionnaires and data abstraction from corporate databases.

iv
Setting/Sample
The setting consisted of 11 community care access centres and 11 nursing agencies. The
sample included 740 clients and 700 nurses.
Variables
Structural variables included information on client demographics, diagnosis, health
status, anticipated duration of service, nurses’ experience, employment characteristics,
agency ownership structure (that is, for-profit or not-for-profit), contract length, and
contract volume. Process variables included clients’ and nurses’ perceptions of the
quality of nursing care, consistency of care provider, and percentage of visits by a
registered nurse or a registered practical nurse. Outcome variables included costs of
nursing care, client satisfaction with care, client health outcomes, nurse work enjoyment,
satisfaction with time for care, perception of job security, and annual nursing turnover.
Methods
Clients completed a structured questionnaire on admission to the study and again after six
weeks (or sooner if discharged). Nurses, access centres, and agencies completed written
questionnaires once. Analysis was conducted using hierarchical linear modeling.
Implications
Whether a nursing agency is for-profit or not-for-profit was not strongly related to the
quality of services it delivers. Variations in quality existed among both types of
ownership structures. This suggests it is important to develop a better understanding of
the management and care practices that are most influential in promoting quality
performance and better outcomes for clients in the home healthcare setting.

1
Study Overview
Nationally and internationally, homecare is an increasingly important component of
healthcare services. Various models for managing and delivering homecare services have
evolved, but there is little evaluative research to assist healthcare managers and policy
makers identify the best models for quality, cost-effective care.
This study describes the competitive model (request for proposals) used in Ontario and
examines the effect of this model on the quality of care and quality of worklife of
community-based nurses. Specifically, the study’s objectives focused on identifying 1)
the extent of for-profit and not-for-profit involvement in the delivery of homecare nursing
services; 2) the methods used to award and monitor contracts; and 3) the relationship
between the methods and the quality of client care, client satisfaction, nurse satisfaction,
job security, and nurse turnover.
The examination of the competitive model for awarding homecare services in Ontario
was timely in that the model was still in the early stages of development; evaluation has
provided useful information to refine the model. Furthermore, knowledge of the strengths
and weaknesses of the model can inform healthcare policy in other parts of Canada. The
investigators believe that this research will be of compelling interest to managers and
decision makers not just in Ontario but across the country, as governments grapple with
the challenges of privatization and human and fiscal resource restrictions.
Study Background
In Canada, the provinces and territories are responsible for providing homecare services.
Publicly funded programs exist in every region, although service delivery varies (Health
Canada, 1999). Homecare in Ontario falls under the jurisdiction of the Ministry of Health
and Long-Term Care. In 1997, the ministry established 43 community care access centres
across the province to provide a single point of access to homecare and long-term
placement co-ordination services. By 2002, two of the sites had merged, leaving a total of
42 sites. The centres are statutory non-profit corporations under the Community Care
Access Corporations Act, 2002, and are accountable to the ministry through a

2
memorandum of understanding. The centres purchase services from providers using a
competitive process known as a request for proposals. The request for proposals sets out
the centre’s requirements in areas such as client services, financial management, and
organization (Carefoote, 1998). The model embraces the expectation that competition
will promote innovation and care standards while achieving cost-effectiveness.
Examination of this model is timely, in that it was in the early stages of development and
evaluation when the data were collected.
It was important to evaluate the impact of the competitive process on the quality and cost
of homecare services for several reasons. First, because competition may work in
disparate ways, one consequence may be lower prices, thereby forcing lower wages and
benefits on staff, leading to decreased morale and increased staff turnover, which in turn
can negatively affect the quality of care (Shapiro, 1997). On the other hand, because the
centres are able to establish standards for client services, there is potential for the
competitive process to lead to enhanced quality in the management and delivery of
homecare services. Third, competition may lead to increased efficiencies, innovation, and
higher standards of healthcare delivery (Starr, 1999).
The study findings will provide useful information to healthcare managers and policy
makers for refining the model, and will inform their understanding of the strengths and
weaknesses of the model and the effect of competition on healthcare.
Background Literature
Privatization is “the active and conscious transfer of responsibility from the public to the
private realm, involving three main activities; regulation, financing, and production”
(Lundqvist, 1988). Starr (1989) identified four types of government policies that can shift
services from public to private: 1) ending public programs and disengaging from specific
kinds of responsibilities. Governments may choose to restrict publicly produced services
in volume, availability, or quality, which also may lead consumers toward privately
produced and purchased healthcare; 2) privatization may take the explicit form of
transfers of public assets to private ownership, through sale or lease of public land,

3
infrastructure, and enterprises; 3) instead of directly producing some service, the
government may finance private services, for example, through contracting out; and 4)
privatization may result from the deregulation of entry into activities previously treated as
public monopolies.
Ontario has a mixture of these elements. Homecare services that meet eligibility criteria
are publicly funded. Clients may purchase additional homecare services through private
insurance or direct pay, when perceived or actual service needs exceed those that are
funded by the public system. Historically, there has been variability among the
community care access centres in how contracts are awarded and monitored, although the
provincial health ministry recently instituted a new request for proposals template
designed to standardize the procurement of client services by centres. The template was
developed in consultation with consumer representatives, service providers, and the
centres. Both for-profit and not-for-profit agencies are eligible to compete for contracts.
There is very little empirical literature examining the issue of privatizing homecare
services. One American study found that non-profit home nursing agencies served more
welfare, self-pay, and indigent clients, and made more visits per client than for-profit
agencies (Shuster & Cloonan, 1991). Nurses from for-profit agencies also spent less time
in direct client care (27 percent) than nurses from non-profit agencies (30 percent). In a
review of the literature on competitive bidding, McGuire and Riordan (1993) concluded
that government contracting for services can only work when the government has good
access to information about the service it is purchasing and when performance
expectations and standards are clearly spelled out in the performance contract. McCombs
and Christianson (1987) described the experience of the National Long-Term Care
Channeling Demonstration project in the United States. Of the 10 projects established,
five conducted competitive bidding processes to choose providers of community-based
long-term care. Two projects chose only one winning bidder, while the other three
projects chose multiple winners. The projects with one winner produced lower bid prices,
presumably because lower prices were offset by higher volumes. However, there were
increased monitoring and administering costs associated with a single winner. When

4
there were multiple winners in each service category there were fewer problems in
administering and enforcing contracts. When substandard performance existed, case
managers simply transferred clients to another service provider (McCombs &
Christianson, 1987). The Massachusetts Department of Public Health employed a form of
competitive bidding for mental health services (Schlesinger et al., 1986). Schlesinger et
al. (1986) concluded that the contracting process added administrative complexity and
that the initial cost savings appeared to be relatively small. To the extent that they
existed, they primarily reflected lower wages paid by for-profit, as opposed to public,
agencies. However, along with lower wages came higher employee turnover and reduced
continuity of care. Christianson (1984) and Hillman and Christianson (1984) described
the impact of competitive bidding for indigent medical care in Arizona. Lower bid prices
were submitted in areas where larger numbers of competitors were expected. Providers
faced great uncertainty because the information used to construct per capita bid prices
was unreliable. Shapiro (1997) offered an analysis of the impact of competitive bidding
for home personal care services in Manitoba. Although contracting out led to lower
service costs, it did so at the expense of lower employee wages, higher staff turnover, and
lower job security. In addition, Shapiro reported high administrative costs associated with
managing the service contract.
Managed competition is a topic of interest in healthcare as systems around the world seek
ways to contain escalating costs. Much of the international research on managed
competition has focused on the acute care sector and on physician services. In response to
the mandatory contracting for homecare professional and personal support services in
Ontario, an increasing amount of research focusing on the community sector has
developed. The recent literature has offered policy analyses of the implications of
managed competition, and has evaluated the impact of the competitive model for
awarding service contracts on providers and on costs. Findings from this literature are
summarized in the following paragraphs.
A few studies have investigated the effect of managed competition on caregivers and
provider agencies. Abelson et al. (2004, in press) studied the experiences of clients,

5
provider agencies, and care managers in home healthcare in one community. They noted
that the implementation of the competitive contracting model has focused attention on
improved accountability relationships between purchasers and providers, and has begun
to improve accountability for meeting contractual obligations. However, they also noted
the emerging benefits might be outweighed by “the transaction costs incurred by
purchaser and provider agencies as well as the quality of care and continuity concerns
raised by individual clients and providers who must establish and build new relationships
following the awarding of new contracts and agency transfers.” Denton, Zeytinoglu, and
Davies (2003) studied occupational illnesses among nurses, personal support workers,
and therapists working in clients’ homes. The study sample also included management
representatives and office workers. High levels of stress, burnout, and physical health
problems were documented, many of which were deemed to be preventable. The study
concluded that restructuring and organizational change were significant factors in
decreasing job satisfaction, increasing absenteeism rates, increasing fear of job loss, and
propensity to leave.
In another line of enquiry, a study by Brega, Jordan and Schlenker (2003) examined the
variation in homecare utilization at 44 agencies in eight American states. The sample
included Medicare clients aged 65 or older with congestive heart failure or diabetes
mellitus. Factors such as functional status, complexity, and agency and market
characteristics influenced care practices. Patients with greater functional disability
received more frequent visits; patients whose initial assessments were conducted by more
experienced care providers had longer lengths of stay; proprietary agencies had
significantly higher visit intensity, shorter lengths of stay, and more alternative services;
and agencies in high-volume states provided more frequent visits and appeared to provide
care in a less parsimonious manner than low-volume states. Whether or not an agency
was over or under the Medicare per-visit and per-beneficiary cost limits was predictive of
length of stay. Also, agencies that used standardized care plans had significantly longer
episode lengths than did agencies without such plans. Such care plans may ensure that
appropriate care standards are met, regardless of utilization policies.

6
Ontario has experienced many changes with respect to access centres and homecare
services. In a policy analysis of the relevant literature, Deber (2002) described several
issues that arose with the creation of the centres in 1996 and the use of requests for
proposals. Deber submitted that some of the complaints regarding the delivery model and
disparity in compensation levels could occur regardless of ownership; however,
criticisms have been specifically directed towards for-profit private delivery of care. Such
complaints included the challenges related to obtaining data when for-profit providers
can control disclosure. Schlaht (2001) acknowledged that several aspects were needed to
develop a level playing field for managed competition among agencies. These included
establishing clear expectations for performance criteria, making judgments about
proposals based on appropriate criteria, and achieving consistency within and among the
centres, contributing to the perception of fairness during the request for proposals
process. The recent introduction of a standardized request for proposals for all centres in
Ontario is consistent with this recommendation.
At a macro level, Jiwani (2003) completed a case study about the complexities of
accountability in healthcare and how accountability was used to shape homecare
practices in Ontario. The study described how market logic led to decentralizing
homecare organizations while centralizing power through standardization, leading to
widespread changes in practices and cultures among provider agencies.
The cost of managed competition and care has been explored by several studies. Browne
(2000) acknowledged that although market competition could lower costs, improve
efficiency, and enhance the quality and the quantity of service in the short term, it does
not have positive long-term effects. He contends quality and efficiency have been
redefined and made more measurable but trust has been undermined. He argues that
competitive bidding has the goal of making workers, agencies, and centres more
accountable to the provincial government, but ultimately continuity of care could be
weakened if staff turnover results from contracts that could change every few years.
Williams et al (1999) noted concerns in the long-term care sector with capped budgets
and increasing demands on centres, coupled with managed competition, which could

7
result in a decline in service quality and consumer choice. Cloutier-Fisher (2003) later
documented concern that the restructuring of community services and the substantial
reinvestment in residential long-term care facilities would result in greater institutional
care than homecare for some elderly people.
In a publication by the Canadian Centre for Policy Alternatives-B.C. Office (2000), it
was noted that research into the costs of privatization is needed. The Hamilton-based
Community Care Research Centre, accessible at www.communitycareresearch.org, has
committed to collecting and cataloguing research on managed competition in Ontario’s
homecare sector. The research centre is a partnership of community care agencies and
McMaster university researchers from health, social, and management sciences. It is
funded by the Canadian Institutes of Health Research.
Consistency of Care Provider: Consistency of care provider is explored by several
studies. Harju and Woodward (2003) reported findings from a study of requests for
proposals, provider agency interviews, and agency benchmarks for continuity of care in
nursing and homemaking, including consistency of provider as one element. They
documented indicators of consistency at one access centre, including frequency of client
visit, presence of a primary nurse, existence and size of the team, existence and size of a
back-up team, expected compliance with benchmarks, and time interval over which
compliance is measured. The authors identified the need for multiple benchmarks to meet
the needs of different client groups; for example, clients requiring long-term service, or
short-term but high-frequency visits, have different needs for consistency of care
provider. The need for standardization about the way consistency is defined and reported
by agencies has been articulated, an area that is complex because care is managed by the
access centres and delivered by contracted agencies. Woodward, Abelson, Tedford, and
Hutchison (2004) conducted an in-depth qualitative study of continuity in homecare from
the perspectives of clients, agencies, case managers, and physicians. They described the
multiple factors that can influence the number of different nurses who provide care for an
individual client, reporting that communication and consistency of personnel were key
vehicles to help ensure continuity. Reid, Haggerty, and McKendry (2002) conducted a

8
systematic survey of continuity of care, prepared a discussion paper, and facilitated a
two-day workshop about the concept. They defined “relational continuity” as “an
ongoing therapeutic relationship between a client and health care provider(s).”
Informational and management continuity were also studied, along with the range of
measurement approaches and tools designed to manage continuity. They advocated that
multiple measures are needed to capture all aspects of continuity, and that more emphasis
is needed on the concept of continuity from the client’s perspective and across
organizational and sectoral boundaries.
In summary, debate about the comparative performance of for-profit and non-profit home
healthcare services is prevalent in the healthcare literature (Rosenau & Linder, 2001).
Much of this debate has yet to be informed with the findings of well-designed evaluation
studies. Managed competition, and in particular, the competitive model for awarding
homecare services in Ontario, has spawned its own debate in the literature. In response,
researchers are addressing the gap in our scientific knowledge about the effect of
managed competition. Key findings from the recent literature suggest that homecare
restructuring has resulted in decreased job satisfaction of home healthcare workers,
increased absenteeism, and fear of job loss (Denton et al., 2003); undermined trust
(Browne, 2000); and perhaps compromised the long-term continuity of care because of
staff turnover (Browne, 2000). Most of the studies have focused on care provider and
agency perspectives. Research on the relative performance of for-profit and non-profit
home healthcare services is a research priority urgently needed (Rosenau & Linder,
2001), as is greater knowledge of the effect of the Ontario model for awarding homecare
services on the quality of care, outcomes, and costs for clients. This study was aimed at
addressing this gap in the literature.
9
Study Objectives
The study was conducted in two phases. The objectives of phase one were to:
$ assess the extent of for-profit and not-for-profit involvement in the delivery of
homecare nursing services;
$ describe the method for contracting professional nursing services within the 43
Ontario access centres;
$ describe the method for monitoring service agreements; and
$ refine the variables and sampling strategy for phase two.
The objectives of the second phase of the study were to examine the relationships
between contract structural variables and:
$ quality of care (process variables);
$ client outcomes;
$ cost of care; and
$ nurse outcomes.
The report of phase one was released in August 2002. It described how the competitive
bidding process was being operationalized, including the volumes and costs of nursing
visits for for-profit and not-for-profit agencies during the first five years of competitive
bidding. The report can be accessed at
www.nursing.utoronto.ca/faculty/bios/CNSS_Phase_1_Reportb.pdf, or by contacting the
principal investigator.
This report describes phase two of the study. The design and methodology for phase two
are described in the following section, followed by a presentation of the descriptive
results and findings for each study objective.
10
Phase Two Design
Phase two involved a correlational and repeated measures design. The 42 access centres
that participated in phase one were eligible to participate in phase two.
Sample Recruitment
One access centre was randomly selected from each of the six regions in Ontario. The
executive director of the centre was contacted by mail and invited to participate in the
study by signing and returning a consent form in a self-addressed stamped envelope. If
the executive director declined to participate, another centre was randomly selected from
the same region until each region was represented. When it was learned that the actual
number of eligible nurses and the number of new client referrals were much lower than
originally anticipated, a second centre was added in five of the six regions, again by
random sampling, for a total of 11 sites participating in phase two.
Following enrolment of the access centres, the chief executive officers of the affiliated
provider agencies were contacted and invited to participate by signing and returning a
consent form. The provider agencies were invited to attend a meeting to learn about the
study and the nature of their involvement if they chose to participate and to answer any
questions they might have. One agency, with a single contract, declined to participate,
resulting in a total of 11 agencies with 34 contracts represented in phase two.
Individual respondents for phase two included registered nurses, registered practical
nurses, and clients. Nurses were eligible to participate if they had worked for a minimum
of six months with a provider agency that consented to participate in the study. Full-time,
part-time, and casual nurses were eligible to participate. Clients were eligible to
participate if they read English, had been referred to the active caseload of a contracted
nursing agency, and consented to participate in the study. A sample size of 700
nurses/clients was sought, based on an estimated small effect size (small (0.03) change in
R2), a power of 95 percent, and a significance level of .003 (adjusting for multiple tests of

11
significance). The high power and thus the large overall sample size was required in
order to allow for an appropriate “effective” sample size resulting from the cluster
sampling used in data collection.
Nurse Recruitment: Nursing provider agencies were asked to distribute questionnaires to
nurses by preparing two mailing labels for each eligible nurse. An agency representative
advised the research co-ordinator of the number of eligible nurses, and the co-ordinator
provided packages that contained the invitation to participate, a questionnaire, and a self-
addressed stamped envelope to return the questionnaire to the university research team.
Agencies were asked to send a package by mail (postage paid) to every nurse who had
been employed with their agency for six months or longer. In order to protect nurse
confidentiality, nurses were not identified by name. Return of a completed questionnaire
indicated consent to participate in the study. After approximately two weeks, the agencies
were asked to distribute a one-page flyer to the same nurses, thanking those who had
already returned their questionnaires, and reminding others that a response would be
valued by the research team.
Client Recruitment: Clients were recruited through the assistance of the access centre’s
staff. A telephone script was provided for staff to ask new clients if they would consent to
have their name and contact information released to the research team. Centres submitted
the names of consenting clients to the study co-ordinator, who phoned clients to confirm
eligibility and then mailed a letter of explanation, two copies of the consent form, and
questionnaire. Clients were asked to return a signed copy of the consent form to the
researchers at the University of Toronto address. They were asked to return the
completed questionnaire in a separate postage-paid envelope. Clients were also given the
option of completing the questionnaire by telephone if this was more convenient, and a
toll-free telephone number was provided. A second mailing was sent after approximately
three weeks to clients who had not responded to the first mailing. The referral process
continued until the required sample had been enrolled.

12
Study Variables
Table 1 summarizes the study variables. The table is organized in three columns, with the
client, nurse, agency, and contract structural variables identified in the left hand column,
the care process variables in the centre column, and the client, nurse, and cost outcome
variables in the right hand column.
Table 1: Study Variables
Input (structural variables) Process Variables Outcome Variables
Client characteristics Age Gender Marital status Live alone (yes/no) Change in health status (in past week) Anticipated duration of service Cancer diagnosis (yes/no) Diagnosis category Telephone screener, general activities of daily living (ADL) Telephone screener, instrumental activities of daily living (IADL)
Client-perceived quality of nursing care Nurse-perceived quality of nursing care Consistency of care provider Percentage of visits by a registered nurse
Client Outcomes Client satisfaction with nursing care SF-36 subscales: General health Physical function Role physical Role emotional Social function Bodily pain Vitality Mental health
Nurse characteristics Age Experience with community nursing (years) Experience with agency (years) Employment status (full-time, part-time, casual) Hours worked per week
Nurse Outcomes Work enjoyment Satisfaction with time for care Perception of job security
Nurse retention Turnover rate
Contract Characteristics Agency structure (for-profit or not-for-profit) Contract length Potential length of contract if renewed Volume of service
Cost of nursing care
Contract Structural Variables included the method for contracting and monitoring
services, type of nursing services contracted, length of service contracted, the ownership
type or structure (for-profit or not-for-profit), and the volume of nursing service awarded
for each contract. The data on the ownership type for each provider agency that secured a

13
nursing service agreement and the volume of service were collated from the data
collected in phase one of the study. If a new contract was subsequently issued, the data
were updated.
Information on the structures, policies, and resources to support community nurses was
collected through a structured questionnaire that executive directors (or designates) of
access centres and CEOs (or designates) of the nursing provider agencies were asked to
complete.
Quality of Care Variables. For the sample of study clients, data were collected on the
number of registered nurse, registered practical nurse, and advanced practice/specialty
nurse visits over the client’s length of stay in the study, the continuity of care (hereafter
referred to as consistency of nursing care provider), and the quality of technical and
interpersonal care. The home health agency records were used to extract data on the
number of visits provided over the length of stay in the study. Continuity of care was
operationally defined as the proportion of visits made by the principal nurse assigned to
the client’s care.
Client Outcome Variables focused on how clients and their health conditions were
affected by the provision of home health nursing care. Two variables were included:
health status and client satisfaction with nursing care. Health status data were collected at
the time of the client’s admission to the study and then again at discharge or after six
weeks (for long-term clients) using the SF-36. The SF-36 has demonstrated reliability
and sensitivity to nursing variables in a community setting (Irvine et al., 2000). The
Client Satisfaction Scale developed by Reeder and Chen (1990) was used to collect
clients’ perceptions of the quality of the technical and interpersonal aspects of care. The
scale is a 35-item tool, assessing technical quality, communication, personal relationships
between clients and providers, and general satisfaction. Reliability of the scale has been
reported at .93 using Cronbach alpha.

14
Risk Adjustment. Risk adjustment (that is, the potential for good outcomes) was
addressed with two approaches: 1) controlling for functional healthcare needs; and 2)
controlling for age, medical diagnosis, and baseline scores on SF-36 subscales. To
account for the clients’ baseline functional healthcare needs, the research team had
planned to use the Resident Assessment Instrument-Home Care (Morris et al., 1997),
which was being implemented at Ontario’s access centres. This assessment instrument is
a comprehensive standardized instrument for evaluating needs and strengths of homecare
clients. It is designed to reference client complexity and provision of service issues for
continuing care clients. Since its implementation was not province-wide at the time of the
study and the data would not be available for the majority of study participants, it was
decided instead to use the MI-Choice Screener. This research-based tool was originally
designed as a telephone screening tool to determine if the more in-depth assessment with
the resident assessment instrument was warranted. It was designed to identify people best
served by information and referral services only, or a range of intensity of care options.
Part A is a general high-level section, with items such as difficulty with housework,
stamina/physical activity, bathing, skin problems, and cognitive skills. This variable is
referred to as “screener general” in the presentation of results. Part B of the screener
assesses specific instrumental activities of daily living, such as preparing meals, ordinary
housework, managing medications, and shopping. This variable is referred to as “screener
IADL” in this report. During the current study, the screener was completed by research
staff during a telephone interview with study participants at the time of study enrolment.
Cost Variables. The cost variables included 1) the centres’ direct costs associated with
nursing service provision; and 2) the costs that clients assumed (either directly or through
an insurance payer) for homecare services that were not provided under the publicly-
funded program. Data about costs incurred by the centres were abstracted from their
databases. Costs incurred by clients were self-reported by through use of the Ambulatory
and Home Care Record developed by Coyte and Guerriere (1998). Due to the low
response rate (less than 25 percent) for client-incurred costs, these data have not been
included in the analysis.

15
Nurse Outcomes. Data were collected on nurses’ professional job satisfaction,
perception of job security, and retention. Professional job satisfaction refers to nurses’
perceptions of their job based on professional fulfillment and was assessed with the
Nursing Job Satisfaction Scale (Atwood, Hinshaw, & Gerber, 1987). Its three subscales
reflect the nurses’ perception of quality of care, enjoyment, and time to do one’s job. The
construct validity of the scale is supported, and its reliability and validity are
documented, Cronbach’s alpha 0.88. Perception of job security was measured by a single
item measured on a Likert scale (1-5). Staff turnover was measured by the number of
nurses who left the organization as a proportion of the total number of staff employed in
January of each year from 1997 to 2002. These data were provided by nursing agencies
from administrative records.
Participants
Phase two of the study reflects nursing care that was managed by 11 community care
access centres and provided by 11 different agencies. The characteristics of the
participating nurses, clients, and the associated contracts are presented in this section of
the report.
Nurse Sample
Of the 1,430 questionnaires distributed through the nursing agencies, 700 nurses returned
a completed questionnaire for a response rate of 49 percent. There is anecdotal evidence
that some questionnaires were undeliverable by the post office, and that some nurses
were not actively working at the time of the study; thus the effective response rate is
higher. Because participation was anonymous and recruitment was at “arm’s length” by
the agencies, the only follow-up was a “thank you/reminder” letter that was mailed to
eligible nurses two weeks after the initial questionnaire.
The demographic and employment characteristics of the nurses who responded to the
questionnaire are summarized in the appendix, Table 22. The “average” nurse respondent
was a 45-year-old female, working 29.1 hours/week, and employed in the community for

16
8.2 years. The average length of employment with the current agency was six years, but
the high standard deviation indicated wide variation among respondents.
Table 2: Nurse Employment Status, self-reported (n=697)
Study Data Province of Ontario* (RN, all sectors)
full-time 212 (30.4%) 54.0% part-time 266 (38.3%) 31.7% casual/relief not specified
219 (31.4%) 9.4% 4.9%
* College of Nurses of Ontario, Membership Statistics 2002 Table 3: Nurse Employment Conditions
mileage reimbursed by employer (n=695) 539 (77.0%) yes travel time reimbursed by employer (n=684) 291 (53%) yes benefits available (n=692) 381 (54.4%) no average hours per week with agency (n=687) mean 29.1 (sd 12.1) work for more than one employer (n=695) 208 (29.9%) yes
Client Sample
Data from 750 clients are included in the analysis. A total of 1,395 eligible clients were
referred to the study by the centres. Table 23 in Appendix A documents the sample
achievement. Table 4 describes the demographic data for clients who completed the
demographic questions on the client questionnaire.
Table 4: Client Demographics Characteristic (# of respondents) Study Participants Comparability with all CCAC cases in
Ontario, 2002a gender (n=744) 455 (61.2%) female
289 (38.8%) male evenly matched
age (n=740) mean 63.7 years (sd 15.5; min 19, max 87)
study population was approximately 5.7 years younger than the provincial mean
live with (n=738) 213 (28.9%) live alone 506 (68.5%) live with spouse or family member 19 (2.5%) live with other (e.g. friend, paid help, etc.)
more of the study participants lived alone, more lived with a spouse or family member, and fewer had other arrangements.
education (n=718) 403 (56.1%) 91 (12.6%) 149 (20.8%) 75 (10.5%)
completed high school or less on the job or formal technical training some college or university one or more university degrees
population subgroup (n=724)
651 (89.9%) 73 (10.1%)
Caucasian Other

17
Characteristic (# of respondents) Study Participants Comparability with all CCAC cases in
Ontario, 2002a marital status (n=737) 58 (7.9%)
447 (60.7%) 68 (9.2%) 164 (22.3%)
single or engaged married or cohabitating divorced or separated widowed
residence (n=738) 676 (91.6%) 44 (5.9%) 18 (2.5%)
live in own residence (owned or rented) live in family member’s home other
new or ongoing client (n=750)
631 (84.2%) 119 (15.8%)
newly admitted for nursing services long-term client, received care for >3 months
a Source: Ontario Ministry of Health and Long-Term Care, CCAC Branch. Table 5: Anticipated Duration of Nursing Care at Time of Study Referral
Anticipated duration of care # of study participants (%) 2 weeks or less 111 (14.8%) 3 weeks 80 (10.7%) 4 weeks 79 (10.5%) 5 weeks 28 (3.7%) 6 weeks or more 413 (55.1%) not specified 39 (5.2%) TOTAL 750 (100%)
The most commonly represented diagnoses categorized by body system were:
$ 21.4 percent (157) skin, subcutaneous tissue, and breast;
$ 13.3 percent (98) cardiac or vascular;
$ 12.2 percent (90) digestive system; and
$ 10.6 percent (78) musculoskeletal.
Carcinoma was recorded as the primary diagnosis for 153 clients (20.8 percent),
represented proportionally among for-profit and not-for-profit agencies.
A detailed description of diagnoses is in Appendix A, Figure 1. It is unknown if these are
representative of all adult clients who receive nursing care through the access centres.
Contract Characteristics
Eleven different nursing agencies, which had a total of 34 service contracts with the
participating access centres, are represented in phase two of the study. The study
excluded “overflow” and single-client non-request for proposals contracts that are
commonly used at some sites for challenging-to-serve clients and during peak demand

18
periods. Eighteen (52.9 percent) of the contracts were held by for-profit agencies. Ten of
the 11 centres had awarded concurrent contracts to both for-profit and not-for-profit
agencies. Contract characteristics are presented in Table 6.
Nine access centres included palliative care within comprehensive nursing contracts,
often highlighting specialty standards within the request for proposals. Two centres
issued separate contracts for palliative nursing care, coincidentally to agencies that also
held contracts for other types of nursing care. Since the nurse outcomes could not be
differentiated (the same nurses provided care under both the palliative and general
contracts) and the client sample for each palliative contract was too small (less than eight
cases per contract) to be statistically valid, the palliative contracts are not identified
separately in the study results.
Table 6: Contract Characteristics
Characteristic Phase 2: 11 CCACs Comparability with CCACs in Ontario*
# of contacts per CCAC, excludes paediatrics and single-client contracts
mean 3.1 contracts (min 2, max 5)
a
contract volume, visits + shift hours (n=31) mean 56,352 sd 27,760 a
length of contract (months) mean 34.6, sd 7.4 mean 32.5, sd 11.2
potential length of contract if renewed (months) mean 52.2, sd 14.6 mean 49.04, sd 19.51 n = 34 contracts a It is not feasible to compare the volume and number of contracts per CCAC because Phase 1 included all contracts, including single-client contracts and “overflow” contracts that are used at some CCACs to manage peak demand periods. Phase 2 did not include these low-volume contracts.
Twenty-three of the 34 contracts in phase two included the potential for either one or two
extensions, ranging from 12 months (n=4) to 60 months (n=2). Most (15 of 23) potential
extensions were for 24 months each.
Study Results – Phase Two
Approach to Data Analysis, Phase Two
To examine the relationships among nurses and clients at the individual, contract, and
provider agency levels, an advanced statistical methodology that takes into account these

19
different levels of hierarchy is warranted. If this hierarchy is ignored, then study results
may lead to incorrect inferences.
Hierarchical linear modeling techniques were used to examine the relationships between
process variables and structural variables. Subsequent models investigated the
relationship between nurse/client outcomes and process variables, while controlling for
structural variables. To help select variables for the models, the stepwise regression
approach to model building was conducted for client data. Variables were included in the
model if p<0.15. Other variables of particular interest were also included in the model,
whether or not they were selected from the stepwise procedure. In the models involving
nurse outcomes, hours worked per week and work status were highly correlated.
Therefore the hierarchical linear models were tested with the work status variables,
excluding hours worked. Unless otherwise indicated, higher scores correspond to better
nurse and client outcomes.
Objective 1: Examine the relationship between contract structural variables and quality of care variables
The quality of care was assessed with four variables: consistency of care provider, which
was defined as the proportion of visits made by the principal nurse assigned to the
client’s care; the perceived quality of care from the client’s perspective; and perceived
quality of care from the nurse’s perspective. Because of the recent literature suggesting
better outcomes with a higher skill mix (Aiken et al., 2002; 2003; McGillis Hall et al.,
2003; Needleman et al., 2002; Tourangeau et al., 2002), percentage of visits made by a
registered nurse was also included as a variable. The descriptive results for the quality of
care variables are summarized in Table 7, followed by a more detailed description of
each variable. For study participants, a mean of 72.3 percent of visits were made by
registered nurses (sd 38.68).

20
Table 7: Process Variables
Variable Cronbach Alpha (n) Mean (sd) 95% Confidence
Interval Continuity (consistency) of care n/a (660) 0.67 (0.24) 0.65 – 0.68
Client perception of quality of care 0.97 (740) 4.38 (0.77) 4.32 – 4.43
Nurse perception of quality of care 0.81 (700) 3.84 (0.65) 3.80 – 3.89
Percent of nursing visits by RN n/a (660) 72.30% (38.68) 69.34 – 75.25
Consistency of care provider
Provider agencies were asked to provide information on the consistency of nursing visits.
The nurse who visited the client most frequently was defined as the “principal” nurse.
Table 7 suggests that, on average, about 67 percent of the nursing visits were provided by
the principal nurse. However, the most frequent value was 100 percent, indicating that
these clients had all their visits from the principal nurse. Approximately 22 percent of the
sample had 100 percent of their visits made by the principal nurse; 34 percent of the
sample had 80 percent or more of their visits made by the principal nurse. The percentage
of visits made by the principal nurse decreased as the total number of visits increased,
suggesting that there is lower continuity for longer-stay clients. Continuity of care
provider can be expected to be lower if a client requires more than one visit per day, if
daily visits including weekends are required, if a client is admitted on a Friday or
Saturday, and if a client’s level of care changes, with a resultant switch from a registered
nurse to a registered practical nurse, or vice versa. Clients in the study received a median
of 10 visits (25th and 75th percentiles = five and 26) during the study, to a maximum of
six weeks.
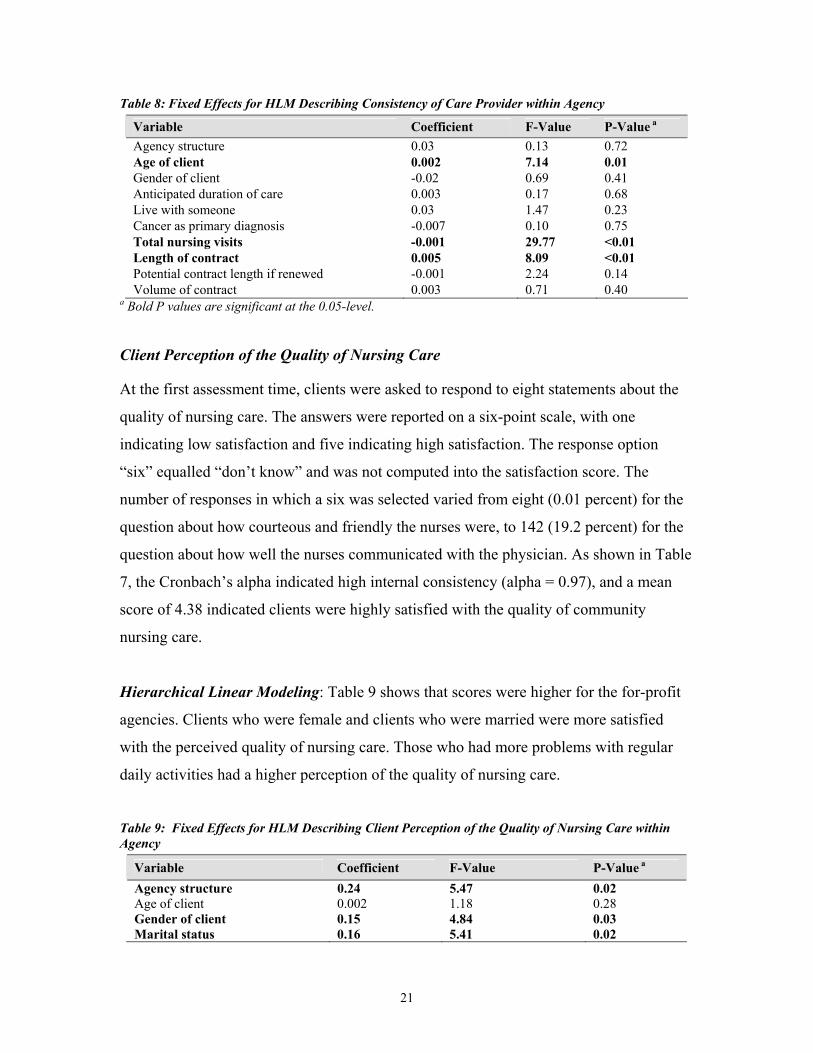
Hierarchical Linear Modeling: Table 8 shows the results from the hierarchical linear
model. Age of client and length of contract were positively related with consistency of
care provided. As the total number of nursing visits increased, consistency of care
decreased.
21
Table 8: Fixed Effects for HLM Describing Consistency of Care Provider within Agency
Variable Coefficient F-Value P-Value a Agency structure 0.03 0.13 0.72 Age of client 0.002 7.14 0.01 Gender of client -0.02 0.69 0.41 Anticipated duration of care 0.003 0.17 0.68 Live with someone 0.03 1.47 0.23 Cancer as primary diagnosis -0.007 0.10 0.75 Total nursing visits -0.001 29.77 <0.01 Length of contract 0.005 8.09 <0.01 Potential contract length if renewed -0.001 2.24 0.14 Volume of contract 0.003 0.71 0.40
a Bold P values are significant at the 0.05-level.
Client Perception of the Quality of Nursing Care
At the first assessment time, clients were asked to respond to eight statements about the
quality of nursing care. The answers were reported on a six-point scale, with one
indicating low satisfaction and five indicating high satisfaction. The response option
“six” equalled “don’t know” and was not computed into the satisfaction score. The
number of responses in which a six was selected varied from eight (0.01 percent) for the
question about how courteous and friendly the nurses were, to 142 (19.2 percent) for the
question about how well the nurses communicated with the physician. As shown in Table
7, the Cronbach’s alpha indicated high internal consistency (alpha = 0.97), and a mean
score of 4.38 indicated clients were highly satisfied with the quality of community
nursing care.
Hierarchical Linear Modeling: Table 9 shows that scores were higher for the for-profit
agencies. Clients who were female and clients who were married were more satisfied
with the perceived quality of nursing care. Those who had more problems with regular
daily activities had a higher perception of the quality of nursing care.
Table 9: Fixed Effects for HLM Describing Client Perception of the Quality of Nursing Care within Agency
Variable Coefficient F-Value P-Value a Agency structure 0.24 5.47 0.02 Age of client 0.002 1.18 0.28 Gender of client 0.15 4.84 0.03 Marital status 0.16 5.41 0.02
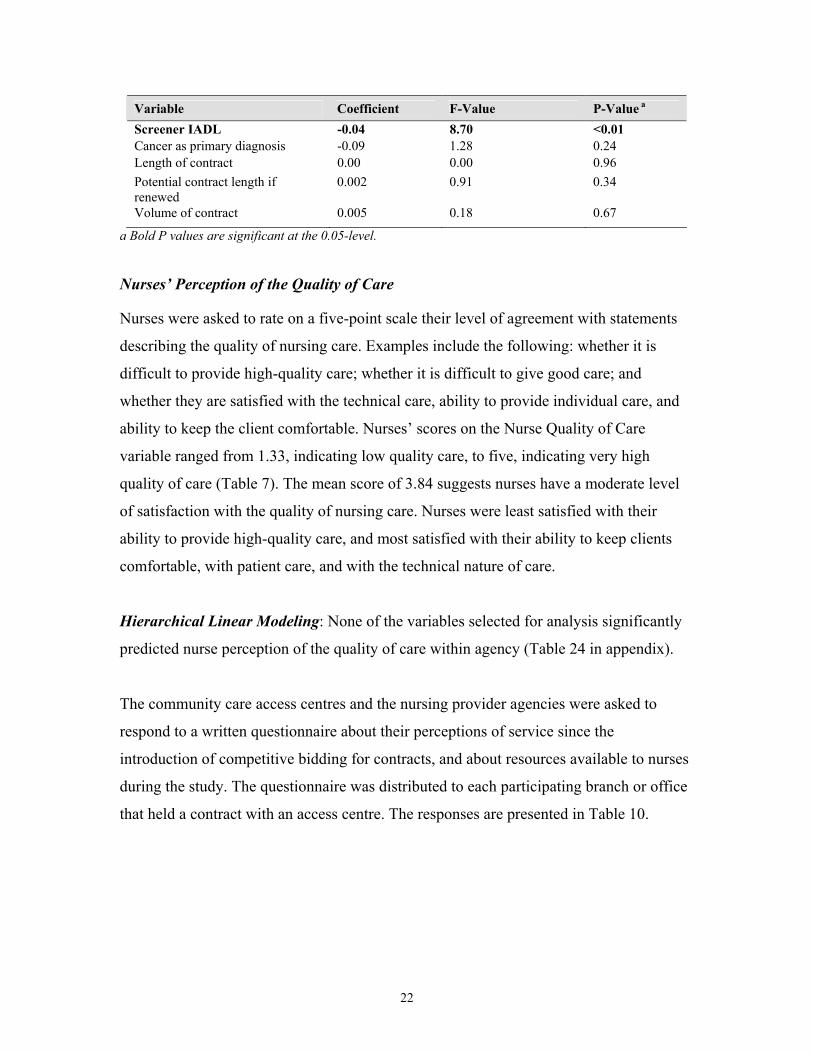
22
Variable Coefficient F-Value P-Value a Screener IADL -0.04 8.70 <0.01 Cancer as primary diagnosis -0.09 1.28 0.24 Length of contract 0.00 0.00 0.96 Potential contract length if renewed
0.002 0.91 0.34
Volume of contract 0.005 0.18 0.67
a Bold P values are significant at the 0.05-level.
Nurses’ Perception of the Quality of Care
Nurses were asked to rate on a five-point scale their level of agreement with statements
describing the quality of nursing care. Examples include the following: whether it is
difficult to provide high-quality care; whether it is difficult to give good care; and
whether they are satisfied with the technical care, ability to provide individual care, and
ability to keep the client comfortable. Nurses’ scores on the Nurse Quality of Care
variable ranged from 1.33, indicating low quality care, to five, indicating very high
quality of care (Table 7). The mean score of 3.84 suggests nurses have a moderate level
of satisfaction with the quality of nursing care. Nurses were least satisfied with their
ability to provide high-quality care, and most satisfied with their ability to keep clients
comfortable, with patient care, and with the technical nature of care.
Hierarchical Linear Modeling: None of the variables selected for analysis significantly
predicted nurse perception of the quality of care within agency (Table 24 in appendix).
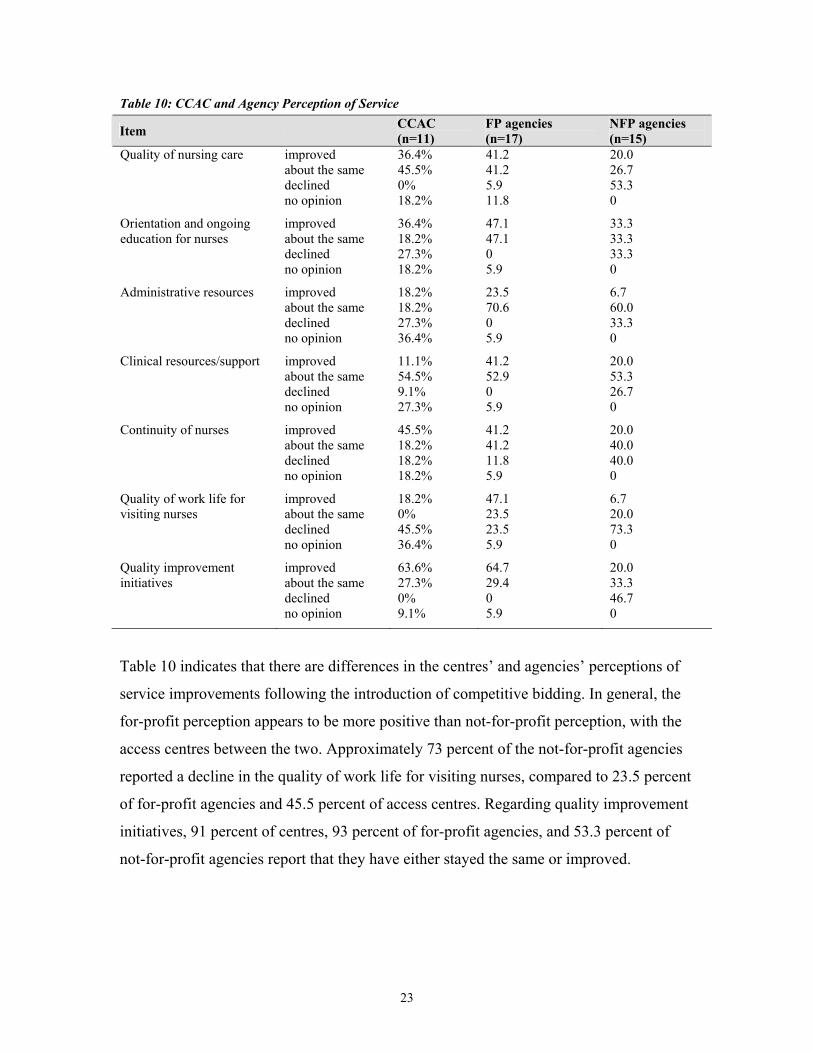
The community care access centres and the nursing provider agencies were asked to
respond to a written questionnaire about their perceptions of service since the
introduction of competitive bidding for contracts, and about resources available to nurses
during the study. The questionnaire was distributed to each participating branch or office
that held a contract with an access centre. The responses are presented in Table 10.
23
Table 10: CCAC and Agency Perception of Service
Item CCAC (n=11)
FP agencies (n=17)
NFP agencies (n=15)
Quality of nursing care improved about the same declined no opinion
36.4% 45.5% 0% 18.2%
41.2 41.2 5.9 11.8
20.0 26.7 53.3 0
Orientation and ongoing education for nurses
improved about the same declined no opinion
36.4% 18.2% 27.3% 18.2%
47.1 47.1 0 5.9
33.3 33.3 33.3 0
Administrative resources improved about the same declined no opinion
18.2% 18.2% 27.3% 36.4%
23.5 70.6 0 5.9
6.7 60.0 33.3 0
Clinical resources/support improved about the same declined no opinion
11.1% 54.5% 9.1% 27.3%
41.2 52.9 0 5.9
20.0 53.3 26.7 0
Continuity of nurses improved about the same declined no opinion
45.5% 18.2% 18.2% 18.2%
41.2 41.2 11.8 5.9
20.0 40.0 40.0 0
Quality of work life for visiting nurses
improved about the same declined no opinion
18.2% 0% 45.5% 36.4%
47.1 23.5 23.5 5.9
6.7 20.0 73.3 0
Quality improvement initiatives
improved about the same declined no opinion
63.6% 27.3% 0% 9.1%
64.7 29.4 0 5.9
20.0 33.3 46.7 0
Table 10 indicates that there are differences in the centres’ and agencies’ perceptions of
service improvements following the introduction of competitive bidding. In general, the
for-profit perception appears to be more positive than not-for-profit perception, with the
access centres between the two. Approximately 73 percent of the not-for-profit agencies
reported a decline in the quality of work life for visiting nurses, compared to 23.5 percent
of for-profit agencies and 45.5 percent of access centres. Regarding quality improvement
initiatives, 91 percent of centres, 93 percent of for-profit agencies, and 53.3 percent of
not-for-profit agencies report that they have either stayed the same or improved.

24
Contract Management
The questionnaire for the access centres included questions about contract management,
specifically how often various request for proposals requirements are monitored. There
was wide variation in contract management practices among the 11 sites, from those that
routinely monitored only a limited number of indicators to one centre that had a fixed
schedule for monitoring every standard in the request for proposals. The centres’
responses are presented in Table 11.
Table 11: Contract Management by CCACs
As n
eces
sary
Dai
ly o
r w
eekl
y
Mon
thly
Eve
ry 2
-6
mon
ths
Eve
ry 7
-12
mon
ths
Les
s tha
n ye
arly
Not
mon
itore
d
No
answ
er
Availability of nursing staff 18.2% 54.5%*
9.1% 9.1% 0 0 9.1% 0
Qualifications of agency nurses
18.2% 0 0 0 36.4% 18.2% 27.3% 0
Orientation and ongoing education for agency nurses
9.1% 0 9.1% 18.2% 27.3% 9.1% 27.3% 0
Supervisory resources/support for agency nurses
36.4% 0 0 0 9.1% 18.2% 27.3% 9.1%
Consistency of visiting nurse
18.2% 9.1% 0 36.4% 27.3% 9.1% 0 0
Reporting and communication between agency and centre
27.3% 36.4% 27.3% 9.1% 0 0 0 0
Financial viability of agency
18.2% 0 0 0 45.5% 18.2% 18.2% 0
Incident reports, complaints, compliments
18.2% 36.4% 18.2% 27.3% 0 0 0 0
Client satisfaction with nursing care
0 0 18.2% 45.5% 27.3% 9.1% 0 0
* bold indicates most frequent response
Objective 2: Examine the relationship between contract structural variables and client outcome variables
The client outcomes “client satisfaction with nursing care” and the SF-36 subscales are
described in Table 12. In the subscale names, “T1” refers to the client’s baseline score on

25
admission to the study, and “T2” refers to the follow-up score after approximately six
weeks, or on discharge from nursing care, whichever occurred first.
Table 12: Client Outcome Variables
Outcome Variable Cronbach Alpha Mean (sd) 95% Confidence Interval Client satisfaction with nursing care
0.96 4.16 (0.54) 4.12 – 4.21
SF-36 Sub Scales: General Health T1 0.79 46.69 (23.32) 45.02 – 48.36 General Health T2 0.85 47.07 (25.86) 45.52 – 48.54 Physical Function T1 0.93 33.63 (29.15) 31.54 – 35.72 Physical Function T2 0.95 37.32 (32.10) 35.33 – 41.03 Physical Role T1 0.96 34.53 (31.21) 32.30 – 36.77 Physical Role T2 0.96 36.41 (31.18) 33.50 – 39.20 Emotional Role T1 0.96 57.37 (34.89) 54.81 – 59.86 Emotional Role T2 0.95 59.12 (35.56) 55.65 – 62.12 Social Function T1 0.61 49.33 (26.07) 47.46 – 51.20 Social Function T2 0.78 51.99 (30.83) 49.27 – 54.71 Bodily Pain T1 0.80 50.18 (25.33) 47.99 – 51.66 Bodily Pain T2 0.90 50.69 (26.62) 48.16 – 53.09 Vitality T1 0.80 36.48 (22.71) 34.83 – 38.13 Vitality T2 0.87 39.74 (24.81) 37.40 – 41.83 Mental Health T1 0.83 62.90 (21.49) 61.32 – 64.45 Mental Health T2 0.87 67.91 (21.62) 65.77 – 69.68
General Health. In the hierarchical linear model, clients who had higher scores for the
SF-36 general health subscale at admission to the study, or those who scored higher on
the screener general function, had higher scores for the SF-36 general health subscale six
weeks later or at discharge (Table 13).
Table 13: Coefficients and Type 3 Tests for Fixed Effects for General Health Status within Agency Variable Coefficient F-Value P-Value a Agency structure 0.40 0.16 0.69 Age of client -1.25 1.57 0.21 Gender of client 1.92 3.69 0.06 Cancer as primary diagnosis -0.59 0.34 0.56 General health T1 22.27 495.94 <0.01 Screener general 2.54 6.45 0.01 Diagnosis category 0.41 0.94 0.53 Length of contract 0.33 0.17 0.68 Potential contract length if renewed -0.04 0.11 0.74 Contract volume 0.40 0.16 0.69 a Bold P values are significant at the 0.05-level. Main effects that appear significant, but are not involved in interactions, are not in bold font.

26
Physical Function. As shown in Table 25 (appendix), age of client, screener IADL, and
anticipated duration of care were negatively associated with physical function after six
weeks, while physical function at admission was positively associated with physical
function six weeks later. Clients who lived with someone were more likely to have higher
scores of physical function at time two than those who lived alone (P <0.01). The
interaction between cancer as primary diagnosis and physical function at time one was
significant (P = 0.01). This conditional relationship suggests that for clients who do not
have cancer, baseline physical function is highly positively related to follow-up
functional status; whereas for clients with a cancer diagnosis, their baseline physical
function is not as highly related to their follow-up physical function.
Physical Role. Females had higher scores on physical role at time two compared to males
(Table 26, appendix). Physical role at time one, anticipated duration of care, and screener
IADL were also predictors of physical role at time two. Shorter anticipated duration of
care and higher physical role function at time one were associated with better physical
role function at time two.
Emotional Role. Table 27 in the appendix shows the variables selected for the fitted
model. Emotional role was rated higher for females than for males (P = 0.01). Other
predictors were emotional role at time one, percentage of visits by a registered nurse, and
screener IADL. Clients who had a higher proportion of their visits made by a registered
nurse had higher emotional role functioning at time two than those who had fewer visits
made by a registered nurse.
Social Function. Social function at time one, screener general, and percentage of visits
by a registered nurse were positively associated with social function at time two (Table
28, appendix). Clients who had more visits from a registered nurse had higher social
functioning at time two than clients who had fewer visits made by a registered nurse.
Overall, diagnosis category was a predictor of social function at time two. Health status at
and social function were negatively related (P = 0.02).
27
Bodily Pain. As scores for bodily pain at time one increased, scores for bodily pain at
time two also increased (Table 29, appendix). Diagnosis category was also a determinant
of bodily pain at time two. Having a higher volume of contract was associated with an
increase in bodily pain at time two. Finally, younger clients with lower scores of IADL
experienced less bodily pain at time two than older clients with higher scores of IADL (P
< 0.01).
Vitality. Vitality at time one was positively associated with vitality at time two (Table 30,
appendix). Clients with shorter anticipated duration of care and higher IADL functioning
had higher scores of vitality at time two (P < 0.01).
Mental Health. For-profit agencies experienced higher scores of mental health compared
to not-for-profit agencies (Table 31, appendix). Mental health at time one was also a
predictor (P < 0.01).
Client Satisfaction with Technical and Interpersonal Aspects of Nursing Care
The follow-up questionnaire was completed approximately four weeks after the client
was admitted to the study. If the research team was notified that the client was expected
to receive care for less than four weeks, the discharge questionnaire was completed as
close to the time of discharge as possible. On the follow-up questionnaire, clients were
asked to respond to a 35-item questionnaire that assessed their satisfaction with the
quality of technical and interpersonal nursing care. Lower scores indicate lower
satisfaction with nursing care. The Cronbach’s alpha for the total scale was excellent at
0.96 (Table 10). The mean score of 4.16 also indicates that clients were highly satisfied
with the technical and interpersonal aspects of nursing care.
Hierarchical Linear Modeling. Table 32 in the appendix suggests that client satisfaction
with nursing care was higher for for-profit agencies compared to not-for-profit agencies.
The interaction between age and gender was also significant (P = 0.01). Younger females
were more satisfied than younger males, but older females were less satisfied than older
males.

28
Objective 3: Examine the relationship between contract structural variables and cost variables
Access centres were asked to provide data regarding the amounts they paid for nursing
care on behalf of study participants during the study period (Table 14). Median costs are
presented in order to minimize the impact of extreme outliers.
Table 14: Direct Costs Incurred by CCACs
median cost (range)
median # of nursing visits (range)
mean # of nursing visits (sd)*
Nursing Care (n=723) $419.85 ($7,545.18)
10.50 (181 unit)
19.53 (23.85)
*most frequently reported number of nursing visits = 4
Total Nursing Costs. The hierarchical linear model for total nursing costs is shown in
Table 15. One outlier was identified, who was someone who received an unusually high
number of visits and shifts, and was removed from the analysis of costs. Higher
consistency of nurse provider and cancer diagnosis were associated with lower total
nursing costs.
Table 15: Coefficients and Type 3 Tests of Fixed Effects for HLM Describing Nursing Costs within Agency
Variable Coefficient F-Value P-Value a Agency structure 116.57 0.70 0.40 Age of client -1.61 0.32 0.57 Gender of client -69.68 0.70 0.40 Screener general -21.87 0.94 0.33 Cancer as primary diagnosis a -258.21 5.41 0.02 Diagnosis category MC 0.96 0.45 Consistency of care provided -1089.14 36.65 <0.01 Length of contract 4.5715 0.10 0.75 Potential contract length if renewed -1.7946 0.09 0.76 Volume of contract 39.7327 2.11 0.15 a Bold P values are significant at the 0.05-level. MC Variable has multiple categories and therefore has multiple coefficients.

29
Objective 4: Examine the relationship between contract structural variables and nurse outcome variables
Nurse Outcomes
Nurses’ job satisfaction was measured by two variables: work enjoyment and satisfaction
with time for care. Scores could range from one to five, with higher scores indicating
higher satisfaction. Table 16 indicates that nurses were on average not satisfied with the
time for care, and were moderately satisfied with work enjoyment.
Table 16: Nurse Outcomes Related to Job Satisfaction
Nurse Outcomes Cronbach Alpha Mean (sd) 95% Confidence
Interval Work enjoyment 0.87 3.84 (0.54) 3.80 – 3.88 Satisfaction with time for care 0.89 2.83 (0.82) 2.78 – 2.90
n=700
Work Enjoyment. The hierarchical linear models indicated there were significant
differences in nurses’ work enjoyment among agencies. Average work enjoyment did not
differ significantly based on working for a for-profit versus a not-for-profit agency (Table
17). Older nurses enjoyed their work more.
Table 17: Fixed Effects for HLM describing Nurse Work Enjoyment within Agency
Variable Coefficient F-Value P-Value a Agency structure 0.13 0.66 0.42 Age of nurse 0.006 5.35 0.02 Length of employment with agency -0.005 1.01 0.32 Employment basis MC 2.06 0.13 Length of contract 0.002 0.26 0.61 Potential contract length if renewed -0.001 0.37 0.54 Contract volume -0.01 2.42 0.12
a Bold P values are significant at the 0.05 level. MC Variable has multiple categories and therefore has multiple coefficients.
Satisfaction With Time for Care. The longer nurses were with the same agency longer
the less satisfied they were with the time for care (Table 18). Nurses who were
compensated on an hourly basis were more satisfied with their time for care than nurses

30
who were compensated on a visit basis. Higher contract volumes meant nurses were less
satisfied with time for care.
Table 18 Fixed Effects for HLM Describing Nurse Satisfaction with Time for Care within Agency
Variable Coefficient F-Value P-Value a Agency structure 0.26 0.77 0.38 Age of nurse -0.001 0.14 0.71 Length of time employed with agency -0.01 3.79 0.05 Length of contract -0.007 1.39 0.24 Potential contract length if renewed 0.002 0.44 0.51 Volume of contract -0.03 4.56 0.03 Pay determined 0.20 5.36 0.02
a Bold P values are significant at the 0.05-level. Main effects that appear significant, but are not involved in interactions, are not in bold font.
Nurse Retention. In the hierarchical linear model, the nurse and contract variables did
not significantly explain the variation in the nurse retention outcome. The agency
structure and contract length were not significant predictors of nurse retention (agency
structure P = 0.10 and contract length P = 0.32) (Table 33 in the appendix).
Nurse Turnover. Nurse turnover was measured at the agency level. The average rates of
nurse turnover for six years, 1997 to 2002, are presented in Table 19. The data indicate
that turnover ranged from a high of 73 percent in 1999 to a low of 24 percent in 2001.
Turnover can be expected to increase during years in which an agency gains or loses a
contract during a request for proposals process, or if service volumes change
significantly.
Table 19: Agency Nurse Turnover
1997 Mean (n) (sd)
1998 Mean (n) (sd)
1999 Mean (n) (sd)
2000 Mean (n) (sd)
2001 Mean (n) (sd)
2002 Mean (n) (sd)
Turnover 25% (n=14) (sd=26)
33% (n=21) (sd=28)
73% (n=23) (sd=106)
33% (n=23) (sd=25)
24% (n=27) (sd=18)
25% (n=19) (sd=21)
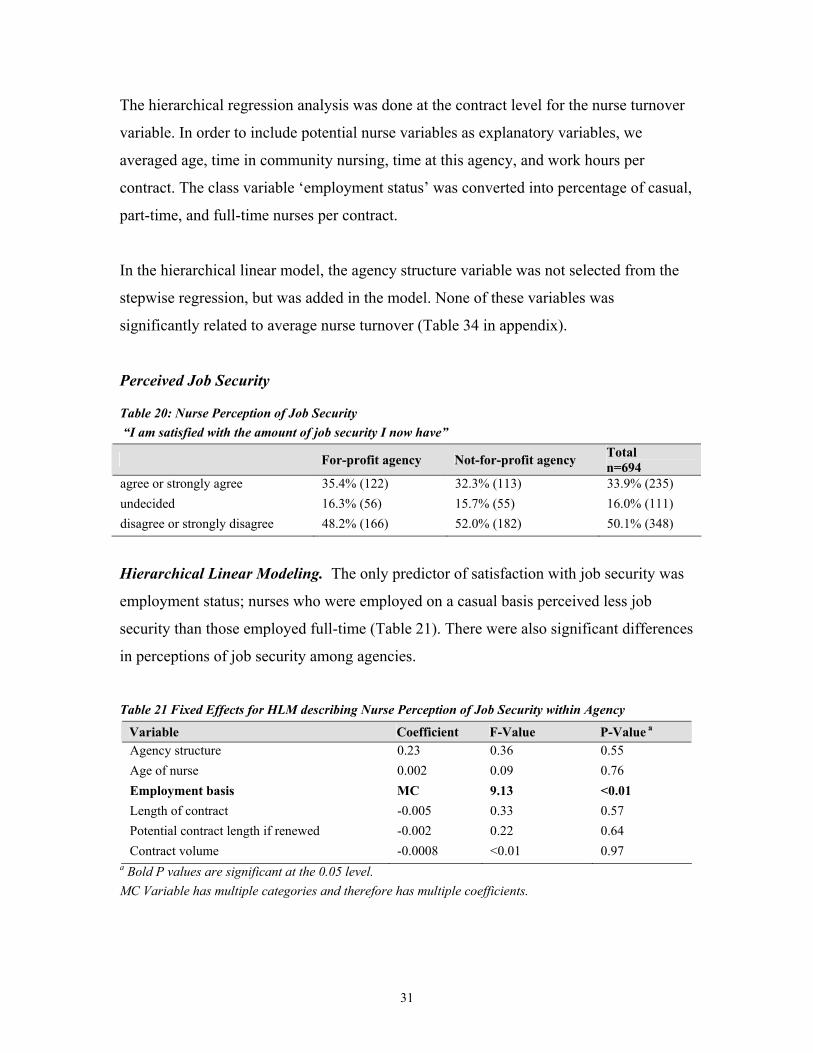
31
The hierarchical regression analysis was done at the contract level for the nurse turnover
variable. In order to include potential nurse variables as explanatory variables, we
averaged age, time in community nursing, time at this agency, and work hours per
contract. The class variable ‘employment status’ was converted into percentage of casual,
part-time, and full-time nurses per contract.
In the hierarchical linear model, the agency structure variable was not selected from the
stepwise regression, but was added in the model. None of these variables was
significantly related to average nurse turnover (Table 34 in appendix).
Perceived Job Security
Table 20: Nurse Perception of Job Security “I am satisfied with the amount of job security I now have”
For-profit agency Not-for-profit agency Total n=694
agree or strongly agree 35.4% (122) 32.3% (113) 33.9% (235) undecided 16.3% (56) 15.7% (55) 16.0% (111) disagree or strongly disagree 48.2% (166) 52.0% (182) 50.1% (348)
Hierarchical Linear Modeling. The only predictor of satisfaction with job security was
employment status; nurses who were employed on a casual basis perceived less job
security than those employed full-time (Table 21). There were also significant differences
in perceptions of job security among agencies.
Table 21 Fixed Effects for HLM describing Nurse Perception of Job Security within Agency
Variable Coefficient F-Value P-Value a Agency structure 0.23 0.36 0.55 Age of nurse 0.002 0.09 0.76 Employment basis MC 9.13 <0.01 Length of contract -0.005 0.33 0.57 Potential contract length if renewed -0.002 0.22 0.64 Contract volume -0.0008 <0.01 0.97
a Bold P values are significant at the 0.05 level. MC Variable has multiple categories and therefore has multiple coefficients.
32
Discussion
Study Limitations
The research protocol originally planned to use the Resident Assessment Instrument-
Home Care tool to document clients’ health status on admission to the study. A uniform
client classification system at all access centres will be essential for future multi-site
studies. The medical diagnosis at the time of admission for care may or may not reflect
the care needs of a client, and so it is important that centres continue to move toward the
full implementation of a standardized assessment tool for all clients in the province.
Transition. Much of the concern about the impact of competitive bidding relates to the
impact of the transition period when a contract period ends and different agencies acquire
new or increased volumes. The current study did not focus on the transition period. Study
participants were all involved in active contracts at the time of data collection; nurses
who had left the sector or the profession as a result of their employer losing a contract or
experiencing reduced service volumes were not included in the study unless they had
transferred their employment to an agency participating in our study. At the corporate
level, all of the multi-site provider agencies in the study had both won and lost contracts
in various communities.
Generalizability. The study acquired a sample of convenience. Therefore the findings are
not generalizable to all types of homecare clients. As this was a research study, informed
consent was required of all clients. This resulted in the most acutely ill clients, and those
with severe cognitive impairment, being excluded from the sample. It is unknown what
impact this had on the results. Certainly it affects the generalizability of the findings. In
addition, the study was conducted in English, with selected components of the client
questionnaire being available in French. Clients whose first language is not English are
under-represented in the client sample. Clients who received care for less than five days
are also under-represented, due to the lack of feasibility of recruiting very short-term
clients into the study.
33
Level of Analysis. Analyses were conducted with hierarchical linear modeling, in order to
account for the fact that clients and nurses were nested within agencies. Agencies were in
turn, nested in contracts. Contracts were nested within access centres; however, agencies
were not nested in centres, because the same agency could have a service contract with
more than one centre. In order to represent the multiple levels of data, we needed to
choose whether to model the results at three levels or two levels.
$ Three levels would have nurses/clients nested within contracts, which in turn are
nested in centres.
$ Two levels would have nurses/clients nested within agencies.
We chose the two-level model for several reasons. First, at no time was significant
variation in our outcome variables observed among access centres, suggesting that
modeling variation at the centre level was not important for our data. Second, we had
other variables in the model that represented the contract characteristics, such as volume
of service and contract length. Third, and probably most important, the predictor
variables that explain variation in the outcome variables were for the most part the same
for the two-level model as those for the three-level model. From a theoretical perspective,
it is usually desirable to represent the findings by the simplest model. By choosing
agency level there is an assumption that, for agencies that have multiple branches, the
management practices (for example, fee structures or nurses’ salaries and benefits) and
care practices (such as access to education and practice guidelines) are similar across
branches and that there are non-significant differences in outcomes among branches. We
found this was essentially a valid assumption for all of the client outcomes, and for all of
the nurse outcomes, with the exception of one agency. This might have been because
there were too few nurses and clients within all branches to adequately test for local
variation in outcomes. We can imagine situations where our assumption might not be
valid. Local work environments, branch culture, and branch leadership could have an
important influence on outcomes such as nurses’ job satisfaction, perceived job security,
and perceptions of quality of care.
34
Specialty Contracts. It would have been helpful to learn if nurse or client outcomes were
influenced by the presence of specialty contracts; for example, in areas such as palliative
care. Unfortunately, the sub-sample of clients who received care under the terms of
specialty contracts was inadequate to compare with clients who had received care
under comprehensive nursing contracts. The new request for proposals template includes
'streams' which address specialty requirements within a single comprehensive nursing
contract.
Discussion
General
There are several dominant themes in the literature about the effect of managed
competition on the quality of home healthcare services and outcomes for nurses. The
discussion reflects concern that home healthcare restructuring has resulted in increased
stress and burnout and decreased physical health and job satisfaction for homecare
workers (Denton et al., 2003). It has led to increased absenteeism and fear of job loss
(Denton et al., 2003); undermined trust (Browne, 2000); and perhaps compromised
continuity of care (Browne, 2000).
Nurses who participated in this study reported moderate work enjoyment. Nurses were
least satisfied with their pay schedule, conditions of the job, balance between work and
leisure, job security, and time for care. They were moderately satisfied with their freedom
to make decisions, and highly satisfied with their client care and ability to keep clients
comfortable. Fifty percent of the nurses indicated they were not satisfied with their job
security. Approximately a third worked full-time, a third part-time, and a third
casual/relief. Seventy-seven percent of the nurses had their mileage reimbursed by their
employer, but only 53 percent were reimbursed for travel time, and only 46 percent
indicated that they had employment benefits. The majority of nurses reported that they
were paid on an hourly basis; 47 percent were reimbursed on a visit basis.
In general, these findings suggest that homecare nurses are moderately satisfied with their
work but are experiencing time pressures and lack of job security. Flynn and Deatrick

35
(2004) recently published a paper on American homecare nurses’ descriptions of
important agency attributes. These nurses identified the following important attributes:
preceptor-based orientation; real-time phone support; interdisciplinary co-ordination;
scheduled time off; realistic workload; adequate staffing; supportive administrative
practices; competent supervisors; and a patient-centred vision. The conditions of work
that were identified in our study, such as time for care and job security, do not appear on
the Flynn and Deatrick (2004) list, although time for care is implied under Flynn and
Deatrick’s discussion of workload.
Homecare clients were highly satisfied with their nursing care. Our observation of high
client satisfaction is consistent with studies of patient satisfaction in other care settings.
This study was not designed to evaluate how nurse and client perceptions have changed
since the introduction of managed competition because we did not have pre-1997 data.
Community care access centres and agencies were asked to indicate whether they
believed the quality of care, administrative resources, clinical resources, continuity of
provider, and quality of work life had improved, remained the same, or declined since the
introduction of managed competition. In general we found for-profit provider agencies
were most positive about the impact of managed competition, not-for-profit agencies
were least positive, and the centres were neutral or positive about most indicators. The
greatest differences in perception were for the continuity of provider and administrative
resources. Competitive bidding was observed to result in benefits, such as increases in
quality improvement initiatives. It is possible that managed competition creates
incentives for organizations to maintain or improve their services and programs in order
to maintain competitive advantage.
Following the completion of data collection for this study, the Ministry of Health and
Long-Term Care introduced a revised policy to standardize the procurement of client
services by access centres. All future contracts will be issued for up to five years,
including any renewals. Longer request for proposals cycles should result in less
administrative burden for provider agencies and access centres. There are formalized
policies about monitoring contract volumes and performance standards. Access centres

36
define service ranges that providers can bid on with different prices. Contracts also
contain a mandatory mechanism for managing the risks of fluctuations in service levels
due to unpredictable funding levels. These measures should result in an increase in
contract stability which, in turn, should result in greater job security for homecare nurses
and enable provider agencies to develop infrastructure to support their nurses.
Objective 1: Examine the relationship between contract structural variables and quality of care variables
We had three measures of the quality of home healthcare: nurses’ perception of the
quality of care; client perception; and consistency of nurse caregiver. None of the
contract characteristic variables or nurse variables influenced nurses’ perceptions of the
quality of care. Furthermore, there was no significant variation in nurses’ perceptions
between agencies or between for-profit and not-for-profit status. On the other hand, we
observed clients cared for by for-profit agencies reported higher quality of care than
clients cared for by not-for-profit agencies. There were no significant differences in client
perceptions among agencies. The client’s gender and age also influenced this perception.
The observation that clients with for-profit agencies viewed the quality of nursing care
more favourably than clients with not-for-profit providers is contrary to the highly
publicized criticisms that have surfaced in the debates about managed competition. The
results of our phase one report (2002) demonstrated a significant shift in for-profit and
not-for-profit service volumes following the introduction of managed competition. The
turnover data in this second phase of the study showed a large disruption in staffing for
all provider agencies in 1999. That year marks the time when protected volumes were
terminated. It is possible that the clients’ perceptions could have been adversely affected
if they were cared for by an agency that was experiencing significant organizational
changes due to shifts in service volumes.
Consistency of care provider is one measure of continuity (Reid et al., 2002; Woodward
et al., 2004). This study’s measure of consistency of care provider is consistent with Reid
et al.’s concept of relational continuity. One-hundred-percent continuity is not an

37
achievable target for all clients, and probably not even a desirable target. It is not
achievable because it is not physically possible to provide continuous nurse staffing for
long-term clients or for clients with intensive visits, such as multiple daily or shift visits.
It is not desirable, because a change in staffing provides the opportunity for the infusion
of new perspectives, cross-checking, and exposes the nurse to different clients, resulting
in the enrichment of nursing knowledge and skills. The questions that this study
attempted to address are, ‘does the consistency of care relate to client outcomes?’ and
‘are there differences in consistency by contract characteristics?’ We discuss the second
question under the discussion of objective two, and address the first here.
On average, clients received 67 percent of their visits from the same nurse. Differences in
consistency were observed among provider agencies, with some agencies providing
significantly higher consistency than others. These differences were not related to
ownership type. Not surprisingly, it was harder to maintain consistency for longer-term
clients. Older clients received higher consistency than younger clients. The longer the
contract was the greater the consistency, which might reflect the fact that when agencies
are awarded longer contracts they are able to build their staffing to levels that provide
them with the flexibility and staff resources to optimize nurse assignments.
Objective 2: Examine the relationship between contract structural variables and client outcome variables
We investigated two types of client outcomes: client satisfaction with nursing care and
client health outcomes. As discussed above, clients were highly satisfied with their
nursing care, and clients from for-profit agencies were more satisfied than clients from
not-for-profit agencies. It is possible that clients’ perceptions may have been adversely
affected if they were cared for by agencies that were experiencing changes due to shifts
in service volume.
There were eight measures of client health outcomes: general health status; physical
functioning; physical role; emotional role; social function; bodily pain; vitality; and
mental health. We observed a significant improvement in four of these outcomes from
38
time one to time two: clients’ physical function; social function; vitality; and mental
health. In the hierarchical linear modelling analyses we controlled for the clients’ time
one scores on the outcome variable, as well as medical diagnosis, presence of cancer
diagnosis, client age, gender, anticipated duration of care as a measure of chronicity, and
baseline ADL function and IADL function. Time two outcomes were found to be related
to many of the client variables, most importantly the clients’ baseline health status, ADL
or IADL functioning, and sometimes age and gender. For all but one of the outcomes,
there was no difference in outcome status for clients cared for by for-profit and not-for-
profit agencies. A difference was observed for mental health outcome, demonstrating
better mental health outcomes for clients cared for by for-profit agencies than not-for-
profit agencies. This one difference could have occurred by chance but may also reflect a
qualitative difference in the experience of clients.
Consistency of care provider was not a significant predictor of client health outcomes.
However, the percentage of visits made by a registered nurse was positively associated
with clients’ emotional and social functions. It approached significance for physical
function (p=.10). These findings are consistent with the results of a previous study of
homecare nursing (O’Brien-Pallas et al, 2002) and with what has been reported about
nursing skill mix in the acute care sector (Aiken et al., 2003; McGillis Hall et al., 2003;
Needleman et al., 2002; Tourangeau et al., 2002). The findings underscore the need for
further research and policy recommendations concerning appropriate nursing skill mix in
homecare. This is an underdeveloped area of research, without clear guidelines about the
appropriate skill mix for various client populations in order to optimize outcomes.
Objective 3: Examine the relationship between contract structural variables and cost variables
Data on two cost variables were collected in this study; costs for homecare nursing, and
direct costs borne by clients. Because of missing observations for the costs borne by
clients, we restricted ourselves to analysing the data for nursing costs. For each client in
the study, data were collected from the access centres on the amount paid for nursing
visits. There were no significant differences in nursing costs for clients cared for by for-

39
profit agencies compared to those cared for by not-for-profit agencies. There were no
significant differences in nursing costs observed between provider agencies. The
consistency of nurse provider was associated with lower nursing costs, suggesting that
consistency in care provider might result in better co-ordinated planning and care, which
in turn leads to more efficient care. We also found nursing costs lower for the cancer
patients, a finding that we cannot readily explain. It is possible that a wide range of
clients with varying stages of cancer are represented, some clients requiring only short-
term visits for a treatment such as chemotherapy. Technological advances may also
enable fewer nursing visits for medication management.
Objective 4: Examine the relationship between contract structural variables and nurse outcomes
We collected data on the following nurse outcomes: nurses’ work enjoyment; nurses’
satisfaction with time for care; nurses’ perceived job security; retention; and turnover.
We observed significant differences in nurse outcomes between provider agencies.
Specifically, nurses working with some agencies expressed higher work enjoyment,
higher satisfaction with time for care, and higher job security than nurses working with
other agencies. These differences were not related to whether the nurse worked for a for-
profit or not-for-profit agency. Older nurses reported more work enjoyment than younger
nurses. Nurses who had worked with the agency longer were less satisfied with the time
for care. This finding could reflect the fact that nurses who had worked with an agency
for a long time might have experienced different time pressures and expectations in the
past, prior to the introduction of technology that has resulted in major changes in the
acuity of clients now being cared for in the community. There has also been an increased
need for care to be provided around the clock, seven days a week. Also of note is that
nurses who were compensated on a per visit basis were less satisfied with their time for
care than nurses who were compensated on an hourly basis, suggesting the need to
examine and perhaps revise the models for compensation for homecare nurses.
Casual nurses perceived less job security than full-time nurses. Retention and turnover
data were collected at the agency level. None of the contract characteristic variables
40
explained variation in turnover and retention. There were no significant differences in
turnover and retention rates among agencies or between for-profit and not-for-profit
agencies. This might be because the sample at the agency level was under-powered to
detect significant differences in turnover rates. We observed large variation in turnover
rates among agencies for each year data were available, resulting in large standard
deviations.
Conclusion
This study investigated the effect of the competitive model for awarding homecare
nursing service contracts in Ontario on the quality of care, nurse, and client outcomes.
Nurses reported moderate work enjoyment and less satisfaction with their time for care
and job security. No differences in nurses’ work enjoyment, satisfaction with time for
care, or job security were observed between agency ownership types.
Clients of for-profit agencies reported higher quality of care and higher satisfaction with
nursing care than clients of not-for-profit agencies. It is possible that the clients’
perceptions could have been adversely affected if they were cared for by an agency that
was experiencing significant changes due to shifts in service volume at the time of data
collection. What is important about our study findings is that the assumption that care
suffers under a for-profit ownership model is not borne out. Clients cared for by for-profit
agencies viewed their care very favourably.
Consistency of care provider varied by agency but not ownership type, and was enhanced
when agencies were awarded longer contracts. Longer contracts might afford agencies
the opportunity to build their staffing resources to optimize nurse assignments.
Consistency of care provider was associated with lower nursing costs, but was not related
to client outcomes. Client outcomes were primarily related to the client’s baseline health
status and age. However, clients achieved higher emotional and social functioning
outcomes when they received a higher proportion of visits from a registered nurse.

41
There are several policy implications. The study findings suggest that care does not suffer
and nurses’ quality of worklife does not suffer under for-profit delivery of homecare
nursing. Nurses from both types of agencies expressed moderate levels of work
enjoyment and low levels of satisfaction with time for care and job security. Therefore,
there need to be changes in homecare nursing to enhance nurses’ job satisfaction and job
security. For instance, employing fewer casual nurses, providing benefits, and ensuring
adequate time to provide care are three directions the findings from this study point to.
Because differences were observed at the agency level, we need further investigation of
the best practices within agencies that result in more satisfied staff. It is also possible that
the concern about having adequate time to provide care may not be sector-specific, but
could be common to nursing in areas such as acute care.
Consistency of care provider was related to costs of care but not client outcomes.
Agencies with longer contracts appeared to offer higher consistency of nurse provider,
possibly because of the infrastructure support and staff resources the longer contracts
afforded them. The Ontario government and access centres have moved toward issuing
contracts for up to five years. This policy direction should enhance provider agencies’
ability to ensure greater stability in their staff resources.
The observation that the percentage of visits made by a registered nurse was positively
related to better emotional and social functioning suggests that additional research is
needed to guide decision-making about when and which types of clients benefits from a
higher proportion of registered nurse visits. This is an under-researched area of home
healthcare.
In conclusion, we found that the quality of care was highly regarded by clients of for-
profit and not-for-profit agencies. There were differences in nurses’ job satisfaction
among agencies, but this difference was not related to ownership model. It is important to
develop a better understanding of the management and care practices that are most
influential in promoting quality performance and optimum outcomes for clients in the
home healthcare setting.

42
References
$ Abelson, J., Gold, S.T., Woodward, C., O’Connor, D., Hutchison, B. (2004, in press). Managing under managed community care: The experiences of clients, providers, and managers in Ontario’s competitive home care sector. Health Policy.
$ Aiken, L. H., Clarke, S.P., Sloane, D.M., Sochalski, J., & Silber, J.H. (2002).
Hospital nurse staffing and patient mortality, nurse burnout, and job dissatisfaction. JAMA, 288, 1987-1993.
$ Aiken, L.H., Clarke, S.P., Cheung, R.B., Sloane, D.M., & Silber, J.H. (2003).
Educational levels of hospital nurses and surgical patient mortality. JAMA, 290, 1617-1623.
$ Atwood, J. R., Hinshaw, A.S. &Gerber, R.M. (1987). Nursing Job Satisfaction
Scale. College of Nursing, University of Arizona. Obtained from author. $ Brega, A.G., Jordan, A.K., & Schlenker, R.E. (2003). Practice variations in home
health care. Home Health Care Services Quarterly, 23(3), 41-64. $ Browne, P.L. (2000). Unsafe Practices; Restructuring and Privatization in
Ontario Health Care. Ottawa, Canada: Canadian Centre for Policy Alternatives. $ Canadian Centre for Policy Alternatives BC (2000). Without Foundation: How
Medicare is undermined by gaps and privatization in Community and Continuing Care. Vancouver, Canada: author.
$ Carefoote, R.L. (1998). Health care issues: Home care quality management,
Where are we now? Where do we go from here? Canadian Journal of Nursing Administration, May-June, 78-91.
$ Christianson, J.B. (1984). Provider participation in competitive bidding for
indigent patients in Arizona. Inquiry, 21(2), 161-177. $ Cloutier-Fisher, D. & Joseph, A.E. (2000). Long-term care restructuring in rural
Ontario: retrieving community service user and provider narratives. Social Science & Medicine, 50, 1037-1045.
$ College of Nurses of Ontario (2002). Membership Statistics. Toronto, Canada:
author. http://www.cno.org/docs/general/42069_stats2002.pdf $ Coyte, P.C. & Guerriere, D. (1998). Ambulatory and Home Care Record: Home
Care Evaluation and Research Centre. Toronto, Canada: author.
43
$ Deber, R.B. (2002). Delivering Health Care Services: Public, Not-For-Profit, or Private? Discussion Paper No. 17, Commission on the Future of Health Care in Canada. http://www.hc-sc.gc.ca/english/pdf/romanow/pdfs/17_Deber_E.pdf
$ Denton, M., Zeytinoglu & Davies, S. (2003). Organizational Change and the
Health and Well-being of Home Care Workers. Final Report. Submitted to Workplace Safety and Insurance Board.
$ Flynn, L. & Deatrick, J.A. (2004). Home care nurses; descriptions of important
agency attributes. Image, Journal of Nursing Scholarship, 35, 385-390. $ Harju, M. & Woodward, C.A. (2003). Indicators of consistency of home care
providers under managed competition: A case report from Ontario. Healthcare Management Forum, Spring 2003, 54-59. accessed at <http://www.cchse.org/Forum/Spring2003/Harju%20final.pdf.> April 20 2004
$ Health Canada (1999). Provincial and territorial home care programs: A
synthesis for Canada. Ottawa: Health Canada. $ Hillman, D.G., & Christianson, J.B. (1984). Competitive bidding as a cost-
containment strategy for indigent medical care: The implementation experience in Arizona. Journal of Health Politics, Policy, & Law, 9(3), 427-451.
$ Irvine Doran, D.M., O’Brien-Pallas, L.L., Murray, M., Cockerill, R., Sidani, S.,
Laurie-Shaw, B., & Gerlach, J. (2000). The reliability and validity of two health status measures for assessing outcomes of home care nursing. Research in Nursing & Health. 23, 43-54.
$ Jiwani, I. (2003) Transformation of Health Organizations and Rhetoric of
Accountability in Community-based Health Care Practices in Ontario. Thesis. York University.
$ Lundqvist, L.J. (1988). Privatization: Towards a concept of comparative analysis.
Journal of Public Opinion, 8(1), 1-19. $ McCombs, J.S., & Christianson, J.B. (1987). Applying competitive bidding to
health care. Journal of Health Politics, Policy, & Law, 12(4), 703-722. $ McGillis Hall, L., Doran, D., Baker, G.R., Pink, G., Sidani, S., O’Brien Pallas, L.,
& Donner, G. (2003). Nurse Staffing Models as Predictors of Patient Outcomes. Medical Care, 41, 1096-1109.
$ McGuire, G., & Riordan, M.H. (1993). Contracting for community-based public
mental health services. Advances in Health Economics and Health Services Research, 14, 55-69.

44
$ Morris, J.N., Fries, B.E., Steel, K., Ikegami, N., Bernabei, R., Carpenter, G.I., Gilgem, R., Hirdes, J.P., & Topinkova, E. (1997). Comprehensive clinical assessment in community setting: applicability of the MDSHC. Journal of the American Geriatrics Society, 45(8), 101724.
$ Needleman, J., Buerhaus, P., Mattke, S., Stewart, M., & Zelevinsky, K. (2002).
Nurse-staffing levels and the quality of care in hospitals. The New England Journal of Medicine, 30, 1715-1722.
$ Reeder, P.J., & Chen, S.C. (1990). A client satisfaction survey in home health
care. Journal of Nursing Quality Assurance, 5(1), 16-24. $ Reid, R., Haggerty, J., & McKendry, R. (2002). Defusing the Confusion:
Concepts and Measure of Continuity of Health Care. Vancouver, Canada: University of British Columbia Centre for Health Services and Policy Research.
$ Rosenau, P.V., & Linder, S.H. (2001). The comparative performance of for-profit
and non-profit home health care services in the US. Home Health Care Services Quarterly, 20(2), 47-59.
$ Schlaht, L.H. (2001). Non-Profit and For-Profit Agencies in a Managed
Competition Environment: Are They Competing on a Level Playing Field? Thesis, University of Guelph. National Library of Canada.
$ Schlesinger, M., Dorwart, R.A., Pulice, R.T. (1986). Competitive bidding and
states’ purchase of services: the case of mental health care in Massachusetts. Journal of Policy Analysis & Management. 5: 245-263.
$ Shapiro, E. (1997). The cost of Privatisation: A case study of home care in
Manitoba. Winnipeg, Canada: Canadian Centre for Policy Alternatives. $ Shuster, G.F., & Cloonan, P.A. (1991). Home health nursing care: A comparison
of non-profit and for-profit agencies. Home Health Care Services Quarterly, 12(1), 23-36.
$ Tourangeau, A.E., Giovannetti, P., Tu, J.V., & Wood, M. (2002). Nursing-related
determinants of 30-day mortality for hospitalized patients. Canadian Journal of Nursing Research, 33, 71-88.
$ Williams, A.P., Barnsley, J., Leggatt, S., Deber, R. & Baranek, P. (1999). Long-
term care goes to market: Managed competition and Ontario’s reform of community-based services. Canadian Journal of Aging, 18, 125-153.
$ Woodward, C.A., Abelson, J., Tedford, S., & Hutchison, B. (2004). What is
important to continuity in home care? Perspectives of key stakeholders. Social Science & Medicine, 58. 177-192.

45
APPENDIX A
Nurse Sample
Table 22: Demographic and Employment Characteristics of Nurses
Characteristic Mean SD Age (n=680) 45.1 9.64 Years of nursing experience (n=688) 18.6 10.84 Years of community nursing experience (n=692) 8.2 6.22 Years at current agency (n=693) 6.0 5.32 Hours worked per week (n=687) 29.1 12.1 Gender (n=694) female 97.8% Marital status (n=687) 49 (7.1%) single or engaged
532 (77.4%) married or cohabiting 93 (13.5%) divorced or separated 13 (1.9%) widowed
Highest Education (n=679) RN or RPN 591 (87%) Bachelors or Master’s in Nursing 55 (8.1%) Bachelors or Master non-nursing 33 (4.8%)
Current job description (n=699) RN 479 (68.5%) RPN 211 (30.2%) Advanced practice 9 (1.3%)
Employer (n=700) 348 (49.7%) For-profit 352 (50.3%) Not-for-profit
Client Sample
Table 23: Client Sample Achievement original sample target 700 # invited by CCAC staff 1908 # referred to study (most common reasons for non-referral: too ill, not interested)
1504
# not eligible when screened by research staff (duplicate referrals, discharged from nursing when referral received, unable to provide informed consent)
149
# unable to contact 54 # invited but declined (too ill, not interested, family reluctant) 220 # consented, completed telephone screen, did not complete questionnaires (too much work, too ill, admitted to hospital, died)
331
# of clients who completed baseline questionnaire 750 # of clients who completed follow-up questionnaire 498

46
Figure 1 represents the diagnoses of the study participants, as reported by the CCACs,
based on the physician referral at the time of admission to the CCAC. Figure 1 Diagnoses of Study Participants
0
5
10
15
20
25
Skin, s
ubcu
taneo
us, o
r brea
st
Cardiac
or va
scula
r
Digesti
ve
Muscu
loske
letal
or co
nnec
tive t
issue
Respir
atory
Kidney
, urin
ary tra
ct
Endoc
rine,
nutrit
ional,
meta
bolic
Nervou
s Sys
tem
Infec
tion,
multisy
stemic
or un
spec
ified s
ite
Female
repro
ducti
ve sy
stem
Signific
ant tr
auma
Lymph
oma,
leuke
mia or
neop
lasm un
spec
ified s
ite
Mental
dise
ase o
r diso
rder
Hepato
biliar
y, pa
ncrea
sOthe
r
Diagnosis
% o
f stu
dy p
artic
ipan
ts
Relationships Among Variables
Table 24 Fixed Effects for HLM Describing Nurse Perception of the Quality of Care within Agency
Variable Coefficient F-Value P-Value a Agency structure 0.25 1.39 0.24 Age of client -0.0008 0.10 0.76 Length of time employed with agency 0.007 1.49 0.22 Casual employee -0.03 0.24 0.63 Part-time employee 0.01 0.05 0.82 Length of contract -0.003 0.49 0.48 Potential length of contract if renewed 0.002 1.26 0.26 Volume of contract -0.01 2.01 0.16 *Bold P values are significant at the 0.05-level.

47
Table 25 Coefficients and Type 3 Tests of Fixed Effects for Physical Function within Agency within Agency
Variable Coefficient F-Value P-Value a Agency structure -0.64 0.05 0.82 Age of client -0.39 17.75 <0.01 Gender of client -0.56 0.05 0.82 Cancer as primary diagnosis -9.06 2.79 0.10 Physical function T1 0.54 113.31 <0.01 Screener IADL -1.58 8.30 <0.01 Diagnosis category MC 2.15 0.10 Percentage of visit by an RN 0.06 2.80 0.10 Anticipated duration of care -2.94 11.42 <0.01 Live with someone b 8.34 8.40 <0.01 Length of contract -0.12 0.35 0.56 Potential contract length if renewed 0.09 1.73 0.19 Volume of contract -0.06 0.02 0.89 Cancer as primary diagnosis*Physical function c 0.29 7.70 0.01 a Bold P values are significant at the 0.05-level. Main effects that appear significant, but are not involved in interactions, are not in bold font. b Clients living with someone had higher scores of physical function compared to clients living alone c Clients with cancer and higher scores of physical function at time 1 had higher scores of physical function at time 2; clients with no cancer and lower scores of physical function at time 1 had lower scores of physical function at time 2. MC Variable has multiple categories and therefore has multiple coefficients
Table 26 Fixed Effects for HLM Describing Physical Role within Agency
Variable Coefficient F-Value P-Value a Agency structure -2.05 0.33 0.57 Age of client 0.14 1.49 0.22 Gender of client b 10.13 9.89 <0.01 Cancer as primary diagnosis -7.40 2.95 0.09 Physical role T1 0.34 48.30 <0.01 Screener IADL -2.62 14.05 <0.01 Diagnosis category MC 1.36 0.16 Percentage of visit by an RN 0.06 1.73 0.19 Anticipated duration of care -2.17 3.79 0.05 Length of contract 0.30 1.26 0.26 Potential contract length if renewed -0.07 0.58 0.45 Volume of contract -0.13 0.05 0.82 a Bold P values are significant at the 0.05 level. b Females had higher scores of physical role at time 2 compared to males MC Variable has multiple categories and therefore has multiple coefficients

48
Table 27: Coefficients and Type 3 Tests of Fixed Effects for Emotional Role within Agency Variable Coefficient F-Value P-Value a Agency structure -1.88 0.25 0.62 Age of client 0.08 0.44 0.51 Gender of client b 9.18 6.59 0.01 Cancer as primary diagnosis -1.97 0.15 0.69 Emotional role T1 0.24 23.84 <0.01 Screener IADL -2.06 7.61 <0.01 Diagnosis category MC 1.47 0.10 Percentage of visit by an RN 0.16 9.80 <0.01 a Bold P values are significant at the 0.05-level. b Females had higher scores of emotional role at time 2 compared to males. MC Variable has multiple categories and therefore has multiple coefficients.
Table 28: Coefficients and Type 3 Tests of Fixed Effects for Social Function within Agency
Variable Coefficient F-Value P-Value a Agency structure 1.33 0.17 0.68 Age of client 0.12 1.28 0.26 Gender of client 2.51 0.77 0.38 Cancer as primary diagnosis -7.01 3.36 0.07 Social function T1 0.64 144.01 <0.01 Screener general 1.63 4.18 0.04 Percentage of visit by an RN 0.12 7.23 0.01 Diagnosis category MC 1.85 0.02 Health status -7.76 5.48 0.02 Length of contract 0.35 1.71 0.19 Potential contract length if renewed -0.08 0.63 0.43 Volume of contract 0.79 2.03 0.16 a Bold P values are significant at the 0.05-level. MC Variable has multiple categories and therefore has multiple coefficients.

49
Table 29 Coefficients and Type 3 Tests of Fixed for HLM Describing Bodily Pain within Agency
Variable Coefficient F-Value P-Value a Agency structure 1.21 0.21 0.65 Age of client -0.20 3.90 0.05 Gender of client 0.02 0.00 0.99 Cancer as primary diagnosis 1.97 0.37 0.54 Bodily pain T1 0.62 182.56 <0.01 Screener IADL -8.29 13.34 <0.01 Diagnosis category MC 2.38 <0.01 Volume of contract 1.05 6.49 0.01 Percentage of visit by an RN 0.04 1.57 0.21 Age of client*Screener IADL 0.10 9.23 <0.01 a Bold P values are significant at the 0.05-level. Main effects that appear significant, but are not involved
in interactions, are not in bold font. b Younger clients with lower scores of IADL experienced less bodily pain at time 2 than older clients with
higher scores of IADL.
MC Variable has multiple categories and therefore has multiple coefficients.
Table 30 Coefficients and Type 3 Tests of Fixed for HLM Describing Vitality Within Agency
Variable Coefficient F-Value P-Value a Agency structure 3.64 2.10 0.15 Age of client -0.09 1.16 0.28 Gender of client 0.18 0.01 0.94 Cancer as primary diagnosis 0.65 0.05 0.83 Vitality T1 0.64 190.03 <0.01 Screener IADL -0.96 3.92 0.05 Diagnosis category MC 0.98 0.48 Percentage of visit by an RN -0.02 0.33 0.57 Anticipated duration of care -2.47 10.04 <0.01 Length of contract <-0.01 0.00 0.99 Potential contract length if renewed -0.05 0.68 0.41 Volume of contract 0.31 0.60 0.44 a Bold P values are significant at the 0.05-level.
MC Variable has multiple categories and therefore has multiple coefficients.

50
Table 31 Coefficients and Type 3 Tests of Fixed Effects Describing Mental Health within Agency
Variable Coefficient F-Value P-Value a Agency structure 4.46 5.57 0.02 Age of client 0.03 0.21 0.65 Gender of client 1.15 0.42 0.51 Mental health T1 0.59 226.54 <0.01 Percentage of visit by an RN 0.01 0.04 0.84 Diagnosis category MC 1.07 0.39 a Bold P values are significant at the 0.05-level.
MC Variable has multiple categories and therefore has multiple coefficients.
Table 32: Fixed Effects for HLM Describing Client Satisfaction with Nursing Care within Agency
Variable Coefficient F-Value P-Value a Agency structure 0.17 7.46 0.01 Age of client 0.008 5.92 0.02 Gender of client 0.65 6.01 0.01 Screener IADL -0.02 2.70 0.10 Cancer as primary diagnosis 0.053 0.57 0.45 Percentage of visit by an RN 0.00009 0.01 0.92 Length of contract -0.002 0.14 0.71 Potential contract length if renewed -0.0009 0.28 0.60 Volume of contract 0.0003 <0.01 0.98 Age of client*Gender of client b -0.009 5.38 0.02 a Bold P values are significant at the 0.05-level. Main effects that appear significant, but are not involved in
interactions, are not in bold font. b Younger males experienced higher satisfaction than older males; whereas older females experienced lower satisfactions than older females. Table 33 Fixed Effects for Nurse Retention
Variable Coefficient F-Value P-Value a Agency structure 0.08 3.17 0.10 Contract length -0.005 1.06 0.32 a No P values are significant at the 0.05-level.
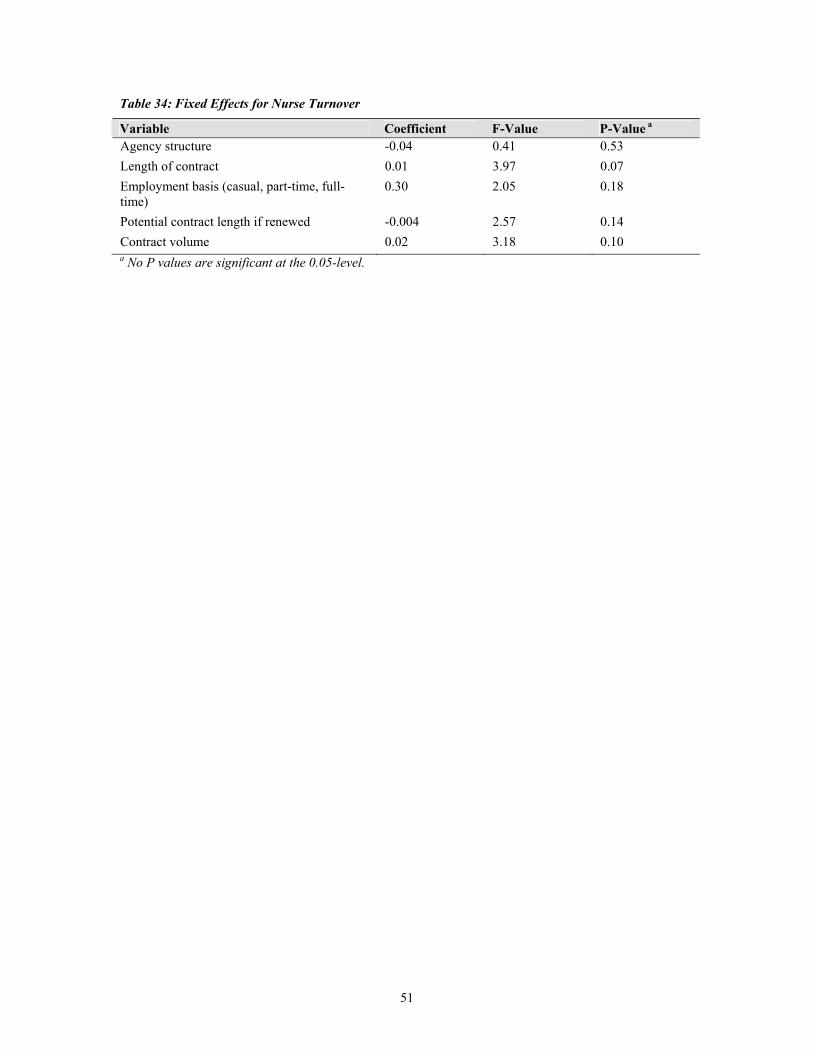
51
Table 34: Fixed Effects for Nurse Turnover Variable Coefficient F-Value P-Value a Agency structure -0.04 0.41 0.53 Length of contract 0.01 3.97 0.07 Employment basis (casual, part-time, full-time)
0.30 2.05 0.18
Potential contract length if renewed -0.004 2.57 0.14 Contract volume 0.02 3.18 0.10 a No P values are significant at the 0.05-level.


![[Arnold Goldman] the Monster Makers Mask Makers](https://img.pdfslide.us/doc/110x75/5695d4df1a28ab9b02a31e8f/arnold-goldman-the-monster-makers-mask-makers.jpg)