Embed Size (px)
Citation preview
1
�P A R T I
Operations Strategy
We begin our discussion of the role of operations in the organization by examining how global competition drives organizations to defi ne a strategy for survival and then execute on that strategy through effi cient and effective operations. Chapter 1 describes the global competitive scene, what customers value, the evolution of strat-egy and supporting functional strategies, some strategic frameworks used in opera-tions, and the organization’s production system that executes that operations strategy. The chapter ends with a description of how the remaining chapters in the text all derive from the operations strategy.
c01.indd 1c01.indd 1 7/20/09 5:37:35 PM7/20/09 5:37:35 PM

c01.indd 2c01.indd 2 7/20/09 5:37:36 PM7/20/09 5:37:36 PM

3
�Operations Strategy and Global
Competitiveness
1. Operations Strategy and GlobalCompetitiveness
Operations
SystemsPerspective
TransformationProcesses
Innovativeness
Functionality
Quality
Customization
Example:Hewlett-Packard
Quality’s benefits and costs
Qualitydimensions
Evolutionof quality:
Japan vs. America
Responsiveness
Global Trends
Strategy
StrategicFrameworks
CoreCapabilities
Flexibility
MassCustomization
Inputs
Outputs
Control
OperationsActivities
Customervalue
Strategy andcompetitiveness
From strategyto structure
The Life-CycleFramework
PerformanceFrontiers
Focus
The SandCone
Framework
C H A P T E R 1
c01.indd 3c01.indd 3 7/20/09 5:37:36 PM7/20/09 5:37:36 PM
4
I N T R O D U C T I O N
• It is not well known that the Kmart and Wal-Mart chains both date back to 1962. By
1987 Kmart was clearly dominating the discount chain race, with almost twice as
many stores and sales of $25.63 billion to Wal-Mart’s $15.96 billion. However, for the
retail year that ended in January 1991, Wal-Mart had overtaken Kmart, with sales of
$32.6 billion to Kmart’s sales of $29.7 billion. Interestingly, although Wal-Mart had
taken the lead in sales in 1991, it still had fewer stores—1721 to Kmart’s 2330. By the
2000 retail year, Wal-Mart had clearly established itself as the dominant discount
chain, with sales of $188.1 billion to Kmart’s $36.4 billion. Perhaps equally telling is
the shift in market share experienced by these two companies. For the period from
1987 to 1995, Kmart’s market share declined from 34.5 percent to 22.7 percent, while
Wal-Mart’s increased from 20.1 percent to 41.6 percent.
What accounts for this reversal in fortunes? Kmart’s response to the competition
from Wal-Mart was to build on its marketing and merchandising strengths and invest
heavily in national television campaigns using high-profi le spokespeople such as
Jaclyn Smith (a former Charlie’s Angel) and Martha Stewart. Wal-Mart took an
entirely different approach and invested heavily in operations in an effort to lower
costs. For example, Wal-Mart developed a companywide computer system to link
cash registers to headquarters, thereby greatly facilitating inventory control at the
stores. Also, Wal-Mart developed a sophisticated distribution system. The integration
of the computer system and the distribution system meant that customers would
rarely encounter out-of-stock items. Further, the use of scanners at the checkout sta-
tions eliminated the need for price checks. By Kmart’s own admission, its employees
were seriously lacking the skills needed to plan and control inventory effectively
(Duff and Ortega 1995).
Fast forward to 2004 and Kmart was still having problems with getting merchan-
dise on its shelves (Turner 2003, Duff and Ortega 1995, Merrick and Zimmerman
2004). Thus, Kmart adopted a new strategy to compete with Wal-Mart—merging with
Sears, Roebuck & Co. in March 2005 to gain potential synergies through cross-selling
and other retail sales techniques. The combined entity, known as Sears Holdings
Corporation, tried new store formats and concepts but nothing seemed to work.
Sears then tried a new approach, acquiring other retailers such as Land’s End, but
this strategy also didn’t seem to turn things around. In March 2007, the Washington
Post reported (http://en.wikipedia.org/wiki/Sears_Holdings_Corporation) that Sears
was being run as a hedge fund, making a substantial portion of its profi ts on non-
retail fi nancial investments. By year-end 2007, Wal-Mart rang up sales of $379 billion
(an 8.6% increase over 2006) while Sears sales were $51 billion (a 4.4% decrease),
with earnings at Wal-Mart of $12.7 billion, up 12.6 percent, and $0.8 billion at Sears,
down 44.6 percent! In terms of total stores, Wal-Mart had 7262 (up 7.1%) while Sears
stayed at 3800 (0%). According to SAP’s July 2008 Top 100 Retailers special report:
“Sears hasn’t turned the corner yet but not for lack of trying different things; the
4
c01.indd 4c01.indd 4 7/20/09 5:37:37 PM7/20/09 5:37:37 PM
5I n t r o d u c t i o n
national economy hasn’t helped, but many of the company’s maneuvers have yet to
pay off” (SAP 2008).
• In the early 2000s, GM’s Chairman and CEO, Richard Wagoner Jr., relied on the strat-
egy of using rebates to help generate cash and reverse GM’s long, downward
decline in market share from about 45 percent in 1980 to about 30 percent. In the
highly competitive auto industry, maintaining market share is critical. For example,
analysts estimate the impact of each percentage point of market share at GM is $1
billion in profi ts. Unfortunately for GM, as its market share continues to erode, it is
becoming increasingly clear that the rebate strategy it pursued over the last several
years is not working. A recent indication of this was that in the fi rst two months of
2005, GM’s market share declined by over two percentage points to just under 25
percent. Based on this decline, GM projected a loss for the fi rst quarter of 2005 of
over $800 million.
A closer examination of GM’s situation suggests more fundamental problems. In
particular, some analysts have suggested that GM’s reliance on rebates is simply a
refl ection of weaknesses in its product offerings. For example, in 2005 GM had eight
brands compared with Toyota’s two. Aside from the issue of whether a company
with less than 25 percent of the market needed so many brands, one result of having
so many brands was a proliferation of similar vehicles across the brands: six similar
front-wheel-drive midsize family sedans and four similar minivans. Furthermore, the
problem with offering so many models created another problem for GM, namely,
that it was unable to redesign its cars as frequently as its competitors. For example, it
took GM 9 years to replace its Chevrolet Cavalier with the Cobalt. Honda, on the
other hand, completely redesigns its Civic every fi ve years (Welch 2005).
While GM’s market share continued to drop to about 20 percent, the entire auto-
motive industry got hit with a powerful one-two punch in 2008, throwing the weak-
ened American automobile producers into chaos. First in early 2008 were extreme
gasoline prices which killed the truck and SUV market and then the sudden credit
crisis and recession killed the rest of the automobile market. The high cost of debt,
unionized labor, and unfunded liabilities (pensions and healthcare) forced GM and
Chrysler to go begging to the government for bailouts. By late 2008, they were burn-
ing through billions of dollars of cash every month. One industry analyst calculated
that GM’s obligations in March of 2009 amounted to $62 billion, 35 times its market
capitalization (Denning 2009, p. C10)! At this time, it appears that Chrysler may be
too far gone to save, and GM will need to go through at least some form of bank-
ruptcy to emerge as a viable company. Although Ford has not asked for government
monies, it is also in diffi cult straits. The future looks tumultuous for the automakers.
• Having rung up combined profi ts of $8 billion in 2004, manufacturers of fl at-panel
TVs appeared to be especially optimistic about the profi t potential for the TV market
in the years ahead. Indeed, a battle of epic proportions was brewing in the consumer
electronics industry. On one side was a group of Asian manufacturers that spent
$35 billion adding fl at-panel capacity in 2004 and 2005. Among the Asian players
were a joint venture between LG Electronics and Royal Philips Electronics that
invested $5.1 billion to build the world’s largest liquid-crystal display factory, a
c01.indd 5c01.indd 5 7/20/09 5:37:37 PM7/20/09 5:37:37 PM
6 C h a p t e r 1 : O p e r a t i o n s S t r a t e g y a n d G l o b a l C o m p e t i t i v e n e s s
$2 billion joint venture between Sony and Samsung to produce LCDs, and Matsushita
Electronics’ new $1.3 billion plant for producing chips for thin TVs. On the other side,
North America’s Dell was attempting to leverage its streamlined supply chain and
direct-sales model and thereby shift the basis of competition from features to price.
For example, in the fall of 2004 Dell introduced a high-defi nition 42-inch plasma TV
for under $3,000 while the similar offerings of its Asian competitors were still priced
above $4,000. As a result, Dell was able to capture 10 percent of the market in a span
of only a couple of months. So, would the Asian strategy based on product innova-
tion and appealing designs win out over Dell’s strategy that seeks to commoditize the
market and thereby shift the basis of competition to price. (Einhorn 2005)
Fast forward to 2007 and the fl at-panel sets have now overtaken the CRT sets,
with LCD sets taking a commanding lead of 58 percent of the market by the fourth
quarter of 2008, CRTs with a 34 percent share, and Plasma with an 8 percent share.
In addition, the market has jumped from an $11 billion industry in 1998 to
$102 billion in 2007, just ten years! And the winners are: Samsung and Sony, each
with about a 13 percent share of the market. Vizio is a close runner-up with 11
percent, and then Sharp with 8 percent. However, the future does not look quite as
rosy as it did in 2004. Most of the consumers who wanted a fl at-panel set now have
one, multiple low-end producers have entered the market and kept prices low, and
now the recession has resulted in a 3 percent drop in sales as of January 2009
(http://news.cnet.com/8301-10784_3-9891583-7.html).
These brief examples highlight the diversity and importance of operations while providing a glimpse of two themes that are central to operations: customer satisfac-tion and competitiveness. They also illustrate a more subtle point—that improve-ments made in operations can simultaneously increase customer satisfaction and lower costs. The Wal-Mart example demonstrates how a company obtained a sub-stantial competitive advantage by improving basic operational activities such as con-trolling its supply chain. And the automobile industry example shows how losing an operations focus can drive a fi rm into bankruptcy. And also, we see that the fi eld of operations is as applicable to service organizations such as Wal-Mart and Sears’ retail services as it is to manufacturing.
Today, in our international marketplace, consumers purchase their products from the provider that offers them the most “value” for their money. To illustrate, you may be doing your course assignments on a Japanese notebook computer, driving in a German automobile, or watching a sitcom on a television made in Taiwan while cooking your food in a Korean microwave. However, most of your services— banking, insurance, personal care—are probably domestic, although some of these may also be owned by, or outsourced to, foreign corporations. There is a reason why most services are produced by domestic fi rms while products may be produced in part, or wholly, by foreign fi rms, and it concerns an area of business known as operations.
A great many societal changes that are occurring today intimately involve activities associated with operations. For example, there is great pressure among competing nations to increase their exports. And businesses are intent on building effi cient and effective supply chains, improving their processes through “six-sigma,” and successfully applying the precepts of “lean management” and other operations-based programs.
c01.indd 6c01.indd 6 7/20/09 5:37:37 PM7/20/09 5:37:37 PM

7O p e r a t i o n s
Another characteristic of our modern society is the explosion of new technology, an important aspect of operations. Technologies such as cell phones, e-mail, note-book computers, personal digital assistants, and the Web, to name a few, are pro-foundly affecting business and are fundamentally changing the nature of work. For example, many banks are shifting their focus from building new branch locations to using the Web as a way to establish and develop new customer relationships. Banks rely on technology to carry out more routine activities as well, such as transferring funds instantly across cities, states, and oceans. Our industries also rely increasingly on technology: robots carry and weld parts together, and workerless, dark “factories of the future” turn out a continuing stream of products. And soft operations technolo-gies, such as “supply chain management” and “lean production” (Feld 2000; Womack and Jones 2003) have transformed world markets and the global economy.
This exciting, competitive world of operations is at the heart of every organization and, more than anything else, determines whether the organization survives in the international marketplace or disappears into bankruptcy or a takeover. It is this world that we will be covering in the following chapters.
O P E R A T I O N S
Why do we argue that operations be considered the heart of every organization? Fundamentally, organizations exist to create value, and operations involves tasks that create value. Michael Hammer (2004) maintains that operational innovation can provide organizations with long-term strategic advantages over their competitors. Regardless of whether the organization is for-profi t or not-for-profi t, primarily serv-ice or manufacturer, public or private, it exists to create value. Thus, even nonprofi t organizations like the Red Cross strive to create value for the recipients of their serv-ices in excess of their costs. Moreover, this has always been true, from the earliest days of bartering to the modern-day corporations.
Consider McDonald’s as an example. This fi rm uses a number of inputs, including ingredients, labor, equipment, and facilities; transforms them in a way that adds value to them (e.g., by frying); and obtains an output, such as a chicken sandwich, that can be sold at a profi t. This conversion process, termed a production system, is illustrated in Figure 1.1. The elements of the fi gure represent what is known as a system1: a purposeful collection of people, objects, and procedures for oper-ating within an environment.
Note the word purposeful; systems are not merely arbitrary groupings but goal-directed or purposeful collections. Managing and running a production system effi -ciently and effectively is at the heart of the operations activities that will be discussed in this text. Since we will be using this term throughout the text, let us formally defi ne it. Operations is concerned with transforming inputs into useful outputs according to the agreed-upon strategy and thereby adding value to some entity; this constitutes the primary activity of virtually every organization.
1Note the word system is being used here in a broad sense and should not be confused with more narrow usages such as information systems, planning and control systems, or performance evaluation systems.
c01.indd 7c01.indd 7 7/20/09 5:37:37 PM7/20/09 5:37:37 PM

8 C h a p t e r 1 : O p e r a t i o n s S t r a t e g y a n d G l o b a l C o m p e t i t i v e n e s s
Not only is operations central to organizations, it is also central to people’s per-sonal and professional activities, regardless of their position. People, too, must operate productively, adding value to inputs and producing quality outputs, whether those outputs are information, reports, services, products, or even personal accomplish-ments. Thus, operations should be of major interest to every reader, not just profes-sionally but also personally.
Systems PerspectiveAs Figure 1.1 illustrates, a production system is defi ned in terms of the environment, a strategy, a set of inputs, the transformation process, the outputs, and some mecha-nism for controlling the overall system. The strategy includes such elements as what customers value, the vision and mission of the organization, an appropriate frame-work to execute this vision, and the core capabilities of the organization. We discuss the strategy in detail a bit later. The environment includes those things that are out-side the actual production system but that infl uence it in some way. Because of its infl uence, we need to consider the environment, even though it is beyond the con-trol of decision makers within the system.
ENVIRONMENT
TRANSFORMATIONPROCESSES
• Facilitating goods• Services
• Alteration• Transportation• Storage• Inspection
INPUTS
CONTROL
• Capital• Materials• Equipment• Facilities• Suppliers• Labor• Knowledge• Time
• Measure• Compare• Plan improvements• Implement improvements
OUTPUT
ActionActionAction Data DataData
• Customers• Government
• Competitors• Technology
• Suppliers• Economy
STRATEGY
• Customer value• Vision/Mission• Strategic frameworks• Core capabilities
Figure 1.1 The production system.
c01.indd 8c01.indd 8 7/20/09 5:37:38 PM7/20/09 5:37:38 PM

9O p e r a t i o n s
For example, a large portion of the inputs to a production system are acquired from the environment. Also, government regulations related to pollution control and workplace safety affect the transformation system. Think about how changes in cus-tomers’ needs, a competitor’s new product, or a new advance in technology can infl uence the level of satisfaction with a production system’s current outputs. As these examples show, the environment exerts a great deal of infl uence on the pro-duction system.
Because the world around us is constantly changing, it is necessary to monitor the production system and take action when the system is not meeting its strategic goals. Of course, it may be that the current strategy is no longer appropriate, indicating a need to revise the strategy. On the other hand, it may be found that the strategy is fi ne but that the inputs or transformation processes, or both, should be modifi ed in some way. In either case, it is important to continuously collect data from the environment, the transformation processes, and the outputs, compare that data to the strategic plan, and if substantial deviations exist, design and implement improvements to the system, or perhaps the strategy, so that results agree with the strategic goals.
Thinking in terms of systems provides decision makers with numerous advantages. To begin, the systems perspective focuses on how the individual components that make up a system interact. Thus, the systems perspective provides decision makers with a broad and complete picture of an entire situation. Furthermore, the systems perspective emphasizes the relationships between the various system components. Without considering these relationships, decision makers are prone to a problem called suboptimization. Suboptimization occurs when one part of the system is improved to the detriment of other parts of the system, and perhaps the organization as a whole. For example, if a retailer decides to broaden its product line in an effort to increase sales, this could actually end up hurting the retailer as a whole if it does not have suffi cient shelf space or service personnel available to accommodate the broader product line. Thus, decisions need to be evaluated in terms of their effect on the entire system, not simply in terms of how they will affect one component of the system.
In the remainder of this section we elaborate on inputs, the transformation proc-esses, and outputs. In later sections and chapters we will further discuss both strat-egy and elements of the control system in more detail.
InputsThe set of inputs used in a production system is more complex than might be sup-posed and typically involves many other areas such as marketing, fi nance, engineer-ing, and human resource management. Obvious inputs include facilities, labor, capital, equipment, raw materials, and supplies. Supplies are distinguished from raw materials by the fact that they are not usually a part of the fi nal output. Oil, paper clips, pens, tape, and other such items are commonly classifi ed as supplies because they only aid in producing the output.
Another very important but perhaps less obvious input is knowledge of how to transform the inputs into outputs. The employees of the organization hold this knowledge. Finally, having suffi cient time to accomplish the operations is always critical. Indeed, the operations function quite frequently fails in its task because it cannot complete the transformation activities within the required time limit.
c01.indd 9c01.indd 9 7/20/09 5:37:38 PM7/20/09 5:37:38 PM

10 C h a p t e r 1 : O p e r a t i o n s S t r a t e g y a n d G l o b a l C o m p e t i t i v e n e s s
Transformation ProcessesThe transformation processes are the part of the system that adds value to the inputs. Value can be added to an entity in a number of ways. Four major ways are described here.
1. Alter: Something can be changed structurally. That would be a physical change, and this approach is basic to our manufacturing industries where goods are cut, stamped, formed, assembled, and so on. We then go out and buy the shirt, or computer, or whatever the good is. But it need not be a separate object or entity; for example, what is altered may be us. We might get our hair cut, or we might have our appendix removed.
Other, more subtle, alterations may also have value. Sensual alterations, such as heat when we are cold, or music, or beauty may be highly valued on cer-tain occasions. Beyond this, even psychological alterations can have value, such as the feeling of worth from obtaining a college degree or the feeling of friendship from a long-distance phone call.
2. Transport: An entity, again including ourselves, may have more value if it is located somewhere other than where it currently is. We may appreciate hav-ing things brought to us, such as fl owers, or removed from us, such as garbage.
3. Store: The value of an entity may be enhanced for us if it is kept in a pro-tected environment for some period of time. Some examples are stock cer-tifi cates kept in a safe-deposit box, our pet boarded at a kennel while we go on vacation, or ourselves staying in a hotel.
4. Inspect: Last, an entity may be more valued because we better understand its properties. This may apply to something we own, plan to use, or are consid-ering purchasing, or, again, even to ourselves. Medical exams, elevator certi-fi cations, and jewelry appraisals fall into this category.
Thus, we see that value may be added to an entity in a number of different ways. The entity may be changed directly, in space, in time, or even just in our mind. Additionally, value may be added using a combination of these methods. To illus-trate, an appliance store may create value by both storing merchandise and trans-porting (delivering) it. There are other, less frequent, ways of adding value as well, such as by “guaranteeing” something. These many varieties of transformations, and how they are managed, constitute some of the major issues to be discussed in this text.
OutputsTwo types of outputs commonly result from a production process: services and products. Generally, products are physical goods, such as a personal computer, and services are abstract or nonphysical. More specifi cally, we can consider the characteristics in Table 1.1 to help us distinguish between the two.
However, this classifi cation may be more confusing than helpful. For example, consider a pizza delivery chain. Does this organization produce a product or provide
c01.indd 10c01.indd 10 7/20/09 5:37:39 PM7/20/09 5:37:39 PM

11O p e r a t i o n s
a service? If you answered “a service,” suppose that instead of delivering its pizzas to the actual consumer, it made the pizzas in a factory and sold them in the frozen-food section of grocery stores. Clearly the actual process of making pizzas for immediate consumption or to be frozen involves basically the same tasks, although one may be done on a larger scale and use more automated equipment. The point is, however, that both organizations produce a pizza, and defi ning one organization as a service and the other as a manufacturer seems to be a little arbitrary. In addition, both prod-ucts and services can be produced as commodities or individually customized.
We avoid this ambiguity by adopting the point of view that any physical entity accompanying a transformation that adds value is a facilitating good (e.g., the pizza). In many cases, of course, there may be no facilitating good; we refer to these cases as pure services.
The advantage of this interpretation is that every transformation that adds value is simply a service, either with or without facilitating goods! If you buy a piece of lum-ber, you have not purchased a product. Rather, you have purchased a bundle of services, many of them embodied in a facilitating good: a tree-cutting service, a saw mill service, a transportation service, a storage service, and perhaps even an adver-tising service that told you where lumber was on sale. We refer to these services as a bundle of “benefi ts,” of which some are tangible (the sawed length of lumber, the type of tree) and others are intangible (courteous salesclerks, a convenient location, payment by charge card). Some services may, of course, even be negative, such as an audit of your tax return. In summary, services are bundles of benefi ts, some of which may be tangible and others intangible, and they may be accompa-nied by a facilitating good or goods.
Firms often run into major diffi culties when they ignore this aspect of their opera-tions. They may think of, and even market themselves as, a “lumberyard” and not as providing a bundle of services. They may recognize that they have to include certain tangible services (such as cutting lumber to the length desired by the customer) but ignore the intangible services (charge sales, having a suffi cient number of clerks). Another reason for not making a distinction between manufacturing and services is that when a company thinks of itself as a manufacturer, it tends to focus on meas-ures of internal performance such as effi ciency and utilization. But when companies consider themselves as providing services they tend to focus externally and ask questions such as “How can we serve our customers better?” This is not to imply that improving internal performance measures is not desirable. Rather, it suggests
T ABLE 1 .1 • Charac ter i s t i c s o f Produc t s and Serv ices
Products Services
Tangible Intangible
Minimal contact with customer Extensive contact with customer
Minimal participation by customer in the delivery
Extensive participation by customer in the delivery
Delayed consumption Immediate consumption
Equipment-intense production Labor-intense production
Quality easily measured Quality diffi cult to measure
c01.indd 11c01.indd 11 7/20/09 5:37:39 PM7/20/09 5:37:39 PM

12 C h a p t e r 1 : O p e r a t i o n s S t r a t e g y a n d G l o b a l C o m p e t i t i v e n e s s
that improved customer service should be the primary impetus for all improvement efforts. It is generally not advisable to seek internal improvements if these improvements do not ultimately lead to corresponding improvements in customer service and cus-tomer satisfaction.
In this text we will adopt the point of view that all value-adding transformations (i.e., operations) are services, and there may or may not be a set of accompanying facilitating goods. Figure 1.2 illustrates how the tangible product (or facilitating good) portion and the intangible service portion for a variety of outputs contribute to the total value provided by each output. The outputs shown range from virtually pure services to what would be known as products. For example, the Plush restau-rant appears to be about 75 percent service and 25 percent product. Although we work with “products” as extensively as with services throughout the chapters in this
100 50 0
% Services
Magazine purchase
Flour purchase
% Products
50 100
Plush restaurant
Theatrical performance
Travels
Auto repair
Hand-made suit
Video rental
Medical examination
Figure 1.2 The range from services to products.
c01.indd 12c01.indd 12 7/20/09 5:37:39 PM7/20/09 5:37:39 PM

13O p e r a t i o n s
book, bear in mind that in these cases we are working with only a portion of the total service, the facilitating good. In general, we will use the nonspecifi c term out-puts to mean either products or services.
One particular type of output that is substantially different from products and many other types of services is that of knowledge or information. These outputs often have the characteristic that the more they are used, the more valuable they become. For example, in a network the more entities that belong to the network, the more useful it may be. If you are on Facebook® or use email, the more other people that are also there, the more valuable it is to you. And when you share this output, you don’t lose anything, you gain. Some other characteristics of information or knowledge that differ from normal goods and services are listed below.
• giving or selling the information/knowledge to someone doesn’t mean you can’t give or sell it to someone else;
• the information/knowledge doesn’t wear out;
• the information/knowledge isn’t subject to the law of diminishing returns;
• the information/knowledge can be replicated at minimal cost and trouble; and
• the more the knowledge is used, the more valuable it becomes.
ControlSuppose that in our production system we make a mistake. We must be able to observe this through, for example, accounting records (measurement data), com-pare it to standard to see how serious the error is, and then, if needed, plan and implement (usually via a project) some improvements. If the changes are not signifi -cantly affecting the outputs, then no control actions are needed. But if they are, management must intercede and apply corrective control to alter the inputs or the transformation processes and, thereby, the outputs. The control activities illustrated in Figure 1.1 are used extensively in systems, including management systems, and will be encountered throughout this text.
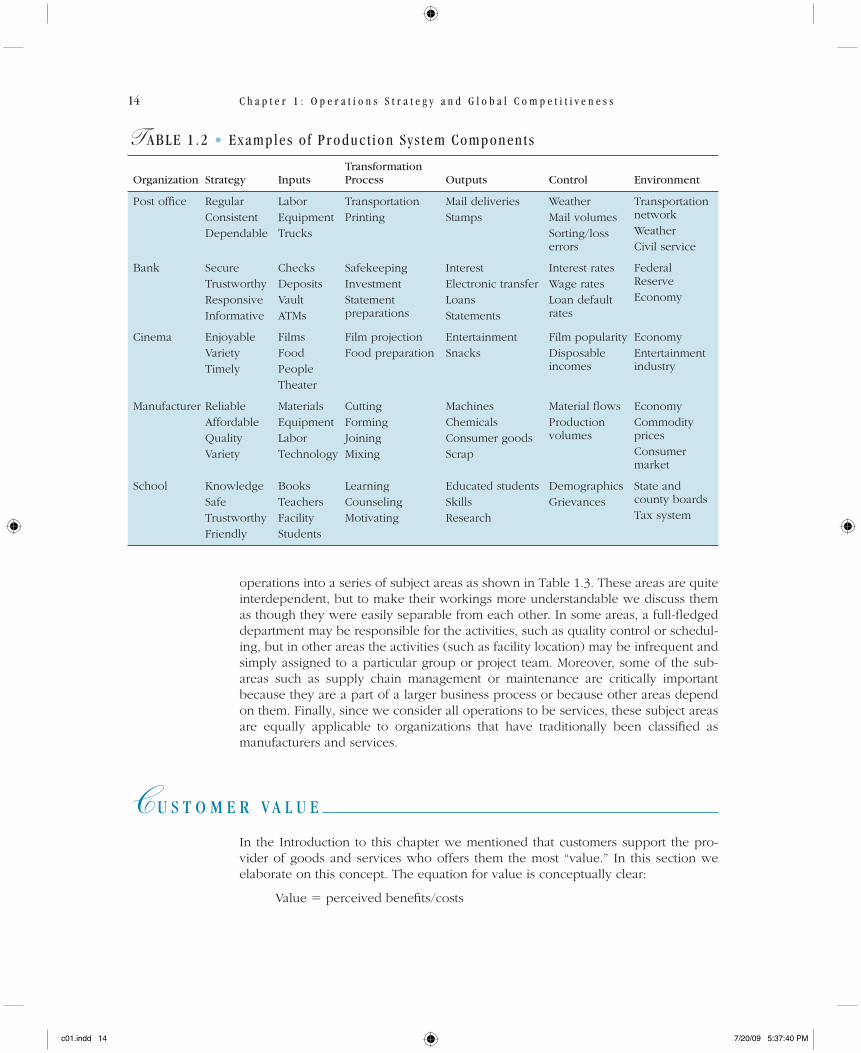
Table 1.2 lists a few examples of some components of the production system for a variety of common organizations.
Operations ActivitiesOperations include not only those activities associated specifi cally with the produc-tion system but also a variety of other activities. For example, purchasing or procure-ment activities are concerned with obtaining many of the inputs needed in the production system. Similarly, shipping and distribution are sometimes considered marketing activities and sometimes considered operations activities. Because of the important interdependencies of these activities, many organizations are attempting to manage these activities as one process commonly referred to as supply chain management.
As organizations begin to adopt new organizational structures based on business processes and abandon the traditional functional organization, it is becoming less important to classify activities as operations or nonoperations (e.g., sales, marketing, purchasing). However, to understand the tasks more easily, we divide the fi eld of
c01.indd 13c01.indd 13 7/20/09 5:37:40 PM7/20/09 5:37:40 PM
14 C h a p t e r 1 : O p e r a t i o n s S t r a t e g y a n d G l o b a l C o m p e t i t i v e n e s s
T ABLE 1 .2 • Examples o f Produc t ion Sys tem Componen t s
Organization Strategy InputsTransformation Process Outputs Control Environment
Post offi ce RegularConsistentDependable
LaborEquipmentTrucks
TransportationPrinting
Mail deliveriesStamps
WeatherMail volumesSorting/loss errors
Transportation networkWeatherCivil service
Bank SecureTrustworthyResponsiveInformative
ChecksDepositsVaultATMs
SafekeepingInvestmentStatement preparations
InterestElectronic transferLoansStatements
Interest ratesWage ratesLoan default rates
Federal ReserveEconomy
Cinema EnjoyableVarietyTimely
FilmsFoodPeopleTheater
Film projectionFood preparation
EntertainmentSnacks
Film popularityDisposable incomes
EconomyEntertainment industry
Manufacturer ReliableAffordableQualityVariety
MaterialsEquipmentLaborTechnology
CuttingFormingJoiningMixing
MachinesChemicalsConsumer goodsScrap
Material fl owsProduction volumes
EconomyCommodity pricesConsumer market
School KnowledgeSafeTrustworthyFriendly
BooksTeachersFacilityStudents
LearningCounselingMotivating
Educated studentsSkillsResearch
DemographicsGrievances
State and county boardsTax system
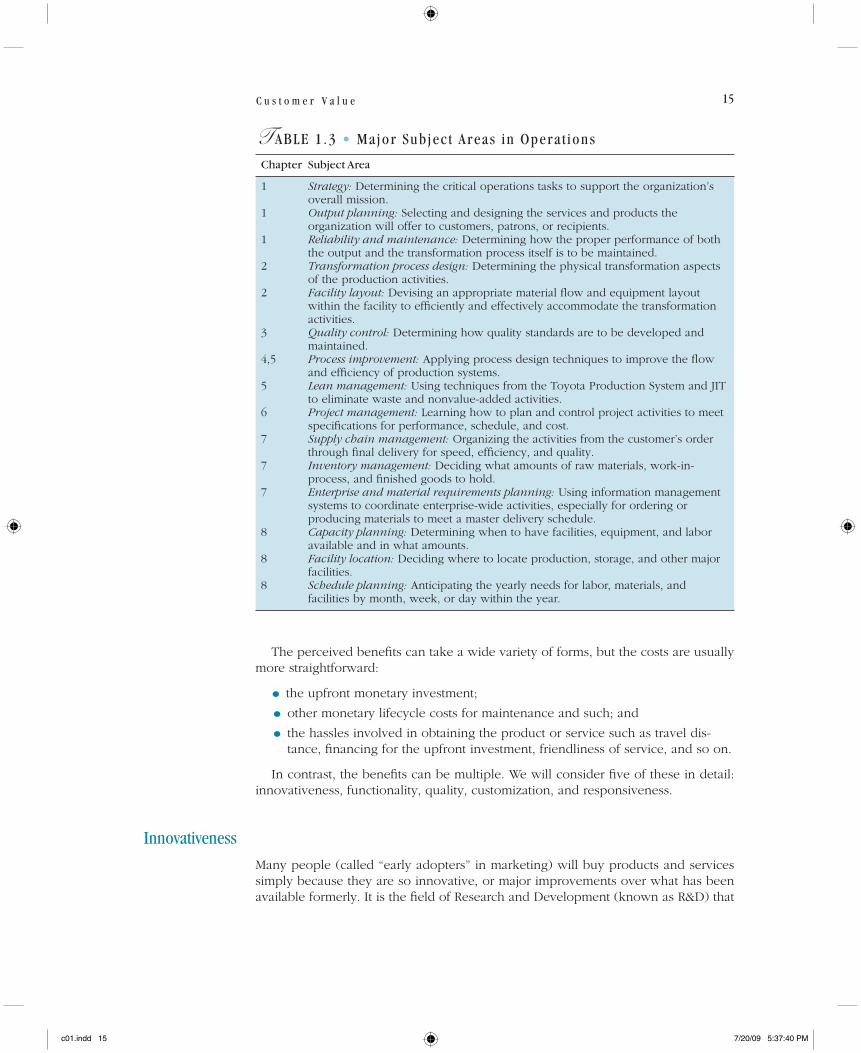
operations into a series of subject areas as shown in Table 1.3. These areas are quite interdependent, but to make their workings more understandable we discuss them as though they were easily separable from each other. In some areas, a full-fl edged department may be responsible for the activities, such as quality control or schedul-ing, but in other areas the activities (such as facility location) may be infrequent and simply assigned to a particular group or project team. Moreover, some of the sub-areas such as supply chain management or maintenance are critically important because they are a part of a larger business process or because other areas depend on them. Finally, since we consider all operations to be services, these subject areas are equally applicable to organizations that have traditionally been classifi ed as manufacturers and services.
C U S T O M E R V A L U E
In the Introduction to this chapter we mentioned that customers support the pro-vider of goods and services who offers them the most “value.” In this section we elaborate on this concept. The equation for value is conceptually clear:
Value � perceived benefi ts/costs
c01.indd 14c01.indd 14 7/20/09 5:37:40 PM7/20/09 5:37:40 PM
15C u s t o m e r V a l u e
The perceived benefi ts can take a wide variety of forms, but the costs are usually more straightforward:
• the upfront monetary investment;
• other monetary lifecycle costs for maintenance and such; and
• the hassles involved in obtaining the product or service such as travel dis-tance, fi nancing for the upfront investment, friendliness of service, and so on.
In contrast, the benefi ts can be multiple. We will consider fi ve of these in detail: innovativeness, functionality, quality, customization, and responsiveness.
InnovativenessMany people (called “early adopters” in marketing) will buy products and services simply because they are so innovative, or major improvements over what has been available formerly. It is the fi eld of Research and Development (known as R&D) that
T ABLE 1 .3 • Ma jor Sub jec t Areas in Opera t ions
Chapter Subject Area
1 Strategy: Determining the critical operations tasks to support the organization’s overall mission.
1 Output planning: Selecting and designing the services and products the organization will offer to customers, patrons, or recipients.
1 Reliability and maintenance: Determining how the proper performance of both the output and the transformation process itself is to be maintained.
2 Transformation process design: Determining the physical transformation aspects of the production activities.
2 Facility layout: Devising an appropriate material fl ow and equipment layout within the facility to effi ciently and effectively accommodate the transformation activities.
3 Quality control: Determining how quality standards are to be developed and maintained.
4,5 Process improvement: Applying process design techniques to improve the fl ow and effi ciency of production systems.
5 Lean management: Using techniques from the Toyota Production System and JIT to eliminate waste and nonvalue-added activities.
6 Project management: Learning how to plan and control project activities to meet specifi cations for performance, schedule, and cost.
7 Supply chain management: Organizing the activities from the customer’s order through fi nal delivery for speed, effi ciency, and quality.
7 Inventory management: Deciding what amounts of raw materials, work-in-process, and fi nished goods to hold.
7 Enterprise and material requirements planning: Using information management systems to coordinate enterprise-wide activities, especially for ordering or producing materials to meet a master delivery schedule.
8 Capacity planning: Determining when to have facilities, equipment, and labor available and in what amounts.
8 Facility location: Deciding where to locate production, storage, and other major facilities.
8 Schedule planning: Anticipating the yearly needs for labor, materials, and facilities by month, week, or day within the year.
c01.indd 15c01.indd 15 7/20/09 5:37:40 PM7/20/09 5:37:40 PM

16 C h a p t e r 1 : O p e r a t i o n s S t r a t e g y a n d G l o b a l C o m p e t i t i v e n e s s
is primarily responsible for developing innovative new product and service ideas. R&D activities focus on creating and developing (but not producing) the organi-zation’s outputs. On occasion, R&D also creates new production methods by which outputs, either new or old, may be produced.
Research itself is typically divided into two types: pure and applied. Pure research is simply working with basic technology to develop new knowledge. Applied research is attempting to develop new knowledge along particular lines. For example, pure research might focus on developing a material that conducts electricity with zero resistance, whereas applied research could focus on further developing this material to be used in products for customers. Development is the attempt to utilize the fi nd-ings of research and expand the possible applications, often consisting of modifi ca-tions or extensions to existing outputs to meet customers’ interests. Figure 1.3 illustrates the range of applicability of development as the output becomes more clearly defi ned. In the early years of a new output, development is oriented toward removing “bugs,” increasing performance, improving quality, and so on. In the middle years, options and variants of the output are developed. In the later years, development is oriented toward extensions of the output that will prolong its life.
Unfortunately, the returns from R&D are frequently meager, whereas the costs are great. Figure 1.4 illustrates the mortality curve (fallout rate) associated with the concurrent design, evaluation, and selection for a hypothetical group of 50 potential chemical products, assuming that the 50 candidate products are available for consid-eration in year 3. (The fi rst three years, on the average, are required for the neces-sary research preceding each candidate product.) Initial evaluation and screening reduce the 50 to about 22, and economic analysis further reduces the number to about 9. Development reduces this number even more, to about 5, and design and testing reduce it to perhaps 3. By the time construction (for production), market development, and a year’s commercialization are completed, there is only one
Time
Discovery
Eff
ort
Development
Maturity
Variants
Saturations
Extensions
Decline
Death
Options
Ideaincubation
Idearefinement
Ideaexamination
andevaluation
Improvingperformance
Outputselection
Full marketing
Acceptancetesting,
modification
Pure Research Applied
Growth
Figure 1.3 The development effort.
c01.indd 16c01.indd 16 7/20/09 5:37:40 PM7/20/09 5:37:40 PM

17C u s t o m e r V a l u e
successful product left. (Sometimes there are none!) One study found that, beyond this, only 64 percent of the new products brought to market were successful, or about two out of three.
Two alternatives to research frequently used by organizations are imitation of a proven new idea (i.e., employing a second-to-market strategy) or outright purchase of someone else’s invention. The outright purchase strategy is becoming extremely popular in those industries where bringing a new product to market can cost huge sums, such as pharmaceuticals and high technology. It is also employed in those industries where technology advances so rapidly that there isn’t enough time to employ a second-to-market strategy. Although imitation does not put the organiza-tion fi rst in the market with the new product or service, it does give an opportunity to study any possible defects in the original product or service and rapidly develop a better design, frequently at a better price. The second approach—purchasing an invention or the inventing company itself—eliminates the risks inherent in research, but it still requires the company to develop and market the product or service before knowing whether it will be successful. Either route spares the organization the risk and tremendous cost of conducting the actual research leading up to a new inven-tion or improvement.
In addition to product research (as it is generally known), there is also process research, which involves the generation of new knowledge concerning how to pro-duce outputs. Currently, the production of many familiar products out of plastic (toys, pipe, furniture, etc.) is an outstanding example of successful process research. Motorola, to take another example, extensively uses project teams that conduct process development at the same time as product development.
21 3
10
20
30
40
4 5Year
Nu
mb
er o
f ca
nd
idat
es
6 7 8 9
Research Screening
Construction
Economic analysis
Product development
Process development
Design and testing
Market development
Commercialization
Figure 1.4 Mortality curve of chemical product ideas from research to commercialization.Source: Adapted from This is Dupont 30. Wilmington, DE by permission of DuPont de Nemours and Co.
c01.indd 17c01.indd 17 7/20/09 5:37:41 PM7/20/09 5:37:41 PM
18 C h a p t e r 1 : O p e r a t i o n s S t r a t e g y a n d G l o b a l C o m p e t i t i v e n e s s
FunctionalityMany people confuse functionality with quality (discussed next). But functionality involves the activities the product or service is intended to perform, thereby provid-ing the benefi ts to the customer. A contemporary example is the ubiquitous “cell phone.” These days it is probably rare to fi nd a cell phone which is only a phone; many phones include a camera and a way to send its picture to another person, or provide access to the internet, as well as a myriad of other functions.
However, many products, especially electronics, but also some services, may be advertised to provide purchasers with a new, unique function and they may do so, but it may not work well, or for long. The former involves performance and the latter has to do with reliability. Clearly, these are different attributes of the output, and one can be well addressed while other attributes disappoint. Our discussion of quality, next, elaborates a bit more on the distinction between these attributes.
QualityQuality is a relative term, meaning different things to different people at different times. Moreover, quality is not an absolute but, rather, is based on customers’ per-ceptions. Customers’ impressions can be infl uenced by a number of factors, includ-ing brand loyalty and an organization’s reputation.
Quality dimensions
Richard J. Schonberger has compiled a list of multiple quality dimensions that cus-tomers often associate with products and services:
1. Conformance to specifi cations. Conformance to specifi cations is the extent to which the actual product matches the design specifi cations, such as a pizza delivery shop that consistently meets its advertised delivery time of 30 minutes.
2. Performance. Customers frequently equate the quality of products and services with their performance. (Note, however, that this dimension may in some cases actually refer to functionality.) Examples of performance include how quickly a sports car accelerates or the battery life of a cell phone.
3. Features. Features are the options that a product or service offers, such as side impact airbags in automobiles and leather seats. (Again, however, this dimension may also be confused with functionality.)
4. Quick response. Quick response is associated with the amount of time required to react to customers’ demands. However, we consider this to be a separate benefi t, discussed further below.
5. Reliability. Reliability is the probability that a product or service will per-form as intended on any given trial or for some period of time, such as the probability that a car will start on any given morning.
6. Durability. Durability refers to how tough a product is, such as a notebook computer that still functions after being dropped, or a knife that can cut through steel and not need sharpening.
c01.indd 18c01.indd 18 7/20/09 5:37:41 PM7/20/09 5:37:41 PM
19C u s t o m e r V a l u e
7. Serviceability. Serviceability refers to the ease with which maintenance or a repair can be performed.
8. Aesthetics. Aesthetics are factors that appeal to human senses, such as the taste of a steak or the sound of a sports car’s engine.
9. Humanity. Humanity has to do with how the customer is treated, such as a private university that maintains small classes so students are not treated like numbers by its professors.
It is worth noting that not all the dimensions of quality are relevant to all products and services. Thus, organizations need to identify the dimensions of quality that are relevant to the products and services they offer. Market research about customers’ needs is the pri-mary input for determining which dimensions are important. Of course, measuring the quality of a service can often be more diffi cult than measuring the quality of a product or facilitating good. However, the dimensions of quality described above apply to both.
Quality’s benefi ts and costs
Many benefi ts are associated with providing products and services that have high qual-ity. Obviously, customers are more pleased with a high-quality product or service. They are more apt to encourage their friends to patronize the fi rm, as well as giving the fi rm their own repeat business. Top quality also establishes a reputation for the fi rm that is very diffi cult to obtain in any other manner, and it allows the fi rm to charge a premium price. And typically, high-quality products and services are not only the most profi table but also garner the largest market shares. High quality also tends to protect the fi rm from competitors, who may have to offer competing outputs at an especially low price (and low margins). It also enhances the attractiveness of follow-up products or services so that their chances of success are much improved. And, of course, high quality mini-mizes risks to safety and health and reduces liability for the fi rm.
Traditionally, it was thought that making products and services of excellent quality would translate into higher costs. Of course this view neglects the negative consequences of gaining a reputation for producing shoddy outputs. Also, the Japanese have demon-strated that it is often possible to improve quality and lower costs at the same time. One explanation for this phenomenon is that it is simply cheaper to do a job right the fi rst time than to try to fi x it or rework it later. And if quality is built into the production sys-tem, it improves workers’ morale, reduces scrap and waste, smoothes work fl ows, improves control, and reduces a wide variety of other costs. As a result, Philip Crosby, a well-known quality consultant, maintains that “quality is free,” as in the title of his book, Quality Is Free (1979), which sold approximately 1 million copies. Crosby estimates that fi rms can lose up to 25 percent of the amount of their sales because of poor quality.
Two primary sets of costs are involved in quality: control costs and failure costs. The aggregate of these costs runs between 15 and 35 percent of sales for many U.S. fi rms. Traditionally, these costs are broken down into four categories: prevention costs (including planning, training, product design, maintenance); appraisal costs (measuring, testing, test equipment, inspectors, reports); internal costs of defects (extra labor and materials to repair, scrap, rework interruptions, expediting); and external costs of defects (ill-will, complaints, quick response to correct, warranties, insurance, recalls, lawsuits). The fi rst two costs are incurred in attempting to control quality, and the last two are the costs of failing to control quality. Costs of defects (or nonconformance) can run from 50 to 90 percent of the total cost of quality.
c01.indd 19c01.indd 19 7/20/09 5:37:42 PM7/20/09 5:37:42 PM

20 C h a p t e r 1 : O p e r a t i o n s S t r a t e g y a n d G l o b a l C o m p e t i t i v e n e s s
Evolution of quality: Japan vs. America
Although you might think that “made in Japan” signifi es a product of superior qual-ity, it may surprise you to learn that many of the techniques and philosophies Japanese companies employ today were actually developed in the United States, often around the end of World War II. Unfortunately, the sentiment among U.S. manu facturers at the end of World War II was that they already produced the highest-quality products in the world at the lowest cost. Thus, they were not particularly interested in or concerned with improving quality.
Japan was an entirely different story. Its products had a reputation for poor quality, and after it lost the war its economy was a shambles. As a result, Japanese manufac-turers were eager for help related to quality improvement. In 1950 the Japanese gov-ernment invited W. Edwards Deming (then a professor at New York University) to give a series of lectures on quality control to help Japanese engineers reindustrialize the country. But Deming insisted that the heads of the companies attend the talks too. As a result, the top Japanese managers were also invited, and they all showed up.
According to Deming (1986), the major cause of poor quality is variation. Thus, a key tenet of Deming’s approach is to reduce variability in the process. (This topic is discussed further in Chapter 4: Process Improvement—Reducing Variation through Six Sigma.) Deming stressed that improving quality was the responsibility of top management. However, he also believed that all employees should be trained in the use of problem-solving tools and especially statistical techniques. Deming believed that improvements in quality created a chain reaction where improved quality leads to lower costs, which then translate into higher productivity. In contrast to Deming, Crosby focused more on management, organizational processes, and changing cor-porate culture than on the use of statistical techniques.
Deming promised the Japanese that if they followed his advice, they would be able to compete with the West within just a few years. They did! Now the most pres-tigious industrial quality award given in Japan each year is named the Deming Prize. But the Japanese did not stop there. They tied the concept of quality control directly into their production system—and now they have even tied it into their entire econ-omy through inspections to guarantee the quality of exports. The natural inclinations of Japanese culture and traditions were exploited in this quality crusade. After nearly two decades of a national emphasis on quality, Japan’s reputation for producing shoddy goods was totally reversed. And, when high quality is combined with com-petitive pricing—another strength of the Japanese system—the result is extremely strong competition for existing producers.
DILBERT: ©Scott Adams/Dist. by United Feature Syndicate, Inc.
c01.indd 20c01.indd 20 7/20/09 5:37:42 PM7/20/09 5:37:42 PM

21C u s t o m e r V a l u e
A more recent concept (similar to zero defects) that the Japanese and some American fi rms have embraced is called total quality management (TQM) or total quality control (TQC). The basic idea of TQM is that it is extremely expensive to “inspect” quality into a company’s outputs and much more effi cient and effective to produce them right in the fi rst place. As a result, responsibility for quality has been taken away from the quality control department and placed where it belongs—with the workers who produce the parts or provide the service in the fi rst place. This is called quality at the source. It is the heart of statistical quality control (SQC), some-times called statistical process control (SPC), which we discuss further in Chapter 3.
CustomizationCustomization refers to offering a product or service exactly suited to a customer’s desires or needs. However, there is a range of accommodation to the customer’s needs, as illustrated in Figure 1.5. At the left, there is the completely standard, world-class (excellence suitable for all markets) product or service. Moving to the right is the standard with options, continuing on to variants and alternative models, and ending at the right with made-to-order customization. In general, the more customization the better, if it can be provided quickly, with acceptable quality and cost.
Standardworld-class
Increasingcustomization
Increasingstandardization
Standardwith options
Variants Alternatemodels
Customization
Figure 1.5 Continuum of customization.
Flexibility
However, to offer customization demands fl exibility on the part of the fi rm. Professor David Upton (1994, p. 73), formerly of the Harvard Business School, defi nes fl exibil-ity as “the ability to change or react with little penalty in time, effort, cost, or per-formance.” There are more than a dozen different types of fl exibility that we will not pursue here—design, volume, routing through the production system, product mix, and many others. But having the right types of fl exibility can offer the following major competitive advantages:
• Faster matches to customers’ needs because changeover time from one prod-uct or service to another is quicker.
• Closer matches to customers’ needs.
c01.indd 21c01.indd 21 7/20/09 5:37:43 PM7/20/09 5:37:43 PM
22 C h a p t e r 1 : O p e r a t i o n s S t r a t e g y a n d G l o b a l C o m p e t i t i v e n e s s
• Ability to supply the needed items in the volumes required for the markets as they develop.
• Faster design-to-market time to meet new customer needs.
• Lower cost of changing production to meet needs.
• Ability to offer a full line of products or services without the attendant cost of stocking large inventories.
• Ability to meet market demands even if delays develop in the production or distribution process.
Mass Customization
Until recently, it was widely believed that producing low-cost standard products (at the far left in Figure 1.5) required one type of transformation process and producing higher-cost customized products (far right) required another type of process. However, in addition to vast improvements in operating effi ciency, an unexpected byproduct of the continuous improvement programs of the 1980s was substantial improvement in fl exibility. Indeed, prior to this, effi ciency and fl exibility were thought to be tradeoffs. Increasing effi ciency meant that fl exibility had to be sacrifi ced, and vice versa.
Thus, with the emphasis on continuous improvement came the realization that increasing operating effi ciency could also enhance fl exibility. For example, many manufacturers initiated efforts to reduce the amount of time required to set up (or change over) equipment from the production of one product to another. Obviously, all time spent setting up equipment is wasteful, since the equipment is not being used during this time to produce outputs that ultimately create revenues for the organiza-tion. Consequently, improving the amount of time a resource is used productively directly translates into improved effi ciency. Interestingly, these same reductions in equipment setup times also resulted in improved fl exibility. Specifi cally, with shorter equipment setup times, manufacturers could produce economically in smaller-size batches, making it easier to switch from the production of one product to another.
In response to the discovery that effi ciency and fl exibility can be improved simul-taneously and may not have to be traded off, the strategy of mass customization emerged (see Pine 1993 and Gilmore and Pine 1997). Organizations pursuing mass customization seek to produce low-cost, high-quality outputs in high variety. Of course, not all products and services lend themselves to being customized. This is particularly true of commodities such as sugar, gas, electricity, and fl our. On the other hand, mass customization is often quite applicable to products characterized by short life cycles, rapidly advancing technology, or changing customer require-ments. However, recent research suggests that successfully employing mass custom-ization requires an organization to fi rst develop a transformation process that can consistently deliver high-quality outputs at a low cost. With this foundation in place, the organization can then seek ways to increase the variety of its offerings while at the same time ensuring that quality and cost are not compromised.
In an article published in Harvard Business Review, Gilmore and Pine (1997) identifi ed four mass customization strategies:
1. Collaborative customizers. These organizations establish a dialogue to help customers articulate their needs and then develop customized outputs to meet these needs. For example, one Japanese eyewear retailer developed
c01.indd 22c01.indd 22 7/20/09 5:37:44 PM7/20/09 5:37:44 PM

23C u s t o m e r V a l u e
a computerized system to help customers select eyewear. The system com-bines a digital image of the customer’s face and then various styles of eye-ware are displayed on the digital image. Once the customer is satisfi ed, the customized glasses are produced at the retail store within an hour.
2. Adaptive customizers. These organizations offer a standard product that customers can modify themselves, such as fast-food hamburgers (ketchup, etc.) and closet organizers. Each closet-organizer package is the same, but includes instructions and tools to cut the shelving and clothes rods so that the unit can fi t a wide variety of closet sizes.
3. Cosmetic customizers. These organizations produce a standard product but present it differently to different customers. For example, Planters pack-ages its peanuts and mixed nuts in a variety of containers on the basis of spe-cifi c needs of its retailing customers such as Wal-Mart, 7-Eleven, and Safeway.
4. Transparent customizers. These organizations provide custom products without the customers knowing that a product has been customized for them. For example, Amazon.com provides book recommendations based on information about past purchases.
Example: Hewlett-PackardFaced with increasing pressure from its customers for quicker order fulfi llment and for more highly customized products, Hewlett-Packard (HP) wondered whether it was really possible to deliver mass-customized products rapidly, while at the same time continuing to reduce costs (Feitzinger and Lee 1997). HP’s approach to mass customization can be summarized as effectively delaying tasks that customize a product as long as possible in the product supply process. It is based on the follow-ing three principles:
• Products should be designed around a number of independent modules that can be easily combined in a variety of ways.
• Manufacturing tasks should also be designed and performed as independent modules that can be relocated or rearranged to support new production requirements.
• The product supply process must perform two functions. First, it must cost-effectively supply the basic product to the locations that complete the cus-tomization activities. Second, it must have the requisite fl exibility to process individual customers’ orders.
HP has discovered that modular design provides three primary benefi ts. First, components that differentiate the product can be added during the later stages of production. This method of mass customization is generally called postponement, and is one form of the assemble-to-order production process, discussed in more detail in Chapter 3. For example, the company designed its printers so that country-specifi c power supplies are combined with the printers at local distribution centers and actually plugged in by the customer when the printer is set up. Second, produc-tion time can be signifi cantly reduced by simultaneously producing the required modules. Third, producing in modules facilitates the identifi cation of production and quality problems.
c01.indd 23c01.indd 23 7/20/09 5:37:44 PM7/20/09 5:37:44 PM

24 C h a p t e r 1 : O p e r a t i o n s S t r a t e g y a n d G l o b a l C o m p e t i t i v e n e s s
ResponsivenessThe competitive advantages of faster, dependable response to new markets or to the individual customer’s needs have occasionally been noted in the business media (Vessey 1991, Eisenhardt and Brown 1998, and Stalk 1988). For example, in a study of the U.S. and Japanese robotics industry, the National Science Foundation found that the Japanese tend to be about 25 percent faster than Americans, and to spend 10 percent less, in developing and marketing new robots. The major difference is that the Americans spend more time and money on marketing, whereas the Japanese spend fi ve times more than the Americans on developing more effi cient production methods.
Table 1.4 identifi es a number of prerequisites for and advantages of fast, depend-able response. These include higher quality, faster revenue generation, and lower costs through elimination of overhead, reduction of inventories, greater effi ciency, and fewer errors and scrap. One of the most important but least recognized advan-tages for managers is that by responding faster, they can allow a customer to delay an order until the exact need is known. Thus, the customer does not have to change the order—a perennial headache for most operations managers.
T ABLE 1 .4 • Prerequ i s i t e s for and Advan tages o f Rap id Response
1 Sharper focus on the customer. Faster response for both standard and custom-designed items places the customer at the center of attention.
2 Better management. Attention shifts to management’s real job, improving the fi rm’s infrastructure and systems.
3 Effi cient processing. Effi cient processing reduces inventories, eliminates non-value-added processing steps, smoothes fl ows, and eliminates bottlenecks.
4 Higher quality. Since there is no time for rework, the production system must be suffi ciently improved to make parts accurately, reliably, consistently, and correctly.
5 Elimination of overhead. More effi cient, faster fl ows through fewer steps eliminate the overhead needed to support the remaining steps, processes, and systems.
6 Improved focus. A customer-based focus is provided for strategy, investment, and general attention (instead of an internal focus on surrogate measures such as utilization).
7 Reduced changes. With less time to delivery, there is less time for changes in product mix, engineering changes, and especially changes to the order by the customer who just wanted to get in the queue in the fi rst place.
8 Faster revenue generation. With faster deliveries, orders can be billed faster, thereby improving cash fl ows and reducing the need for working capital.
9 Better communication. More direct communication lines result in fewer mistakes, oversights, and lost orders.
10 Improved morale. The reduced processing steps and overhead allow workers to see the results of their efforts, giving a feeling of working for a smaller fi rm, with its greater visibility and responsibility.
Faster response to a customer also can, up to a point, reduce the unit costs of the product or service, sometimes signifi cantly. On the basis of empirical studies reported by Meredith et al. (1994) and illustrated in Figure 1.6, it seems that there is about a 2:1 (i.e., 0.50) relationship between response time and unit cost. That is, starting from typical values, an 80 percent reduction in response time results in a corresponding
c01.indd 24c01.indd 24 7/20/09 5:37:44 PM7/20/09 5:37:44 PM

25S t r a t e g y a n d C o m p e t i t i v e n e s s
40 percent reduction in unit cost. The actual empirical data indicated a range between about 0.60 and 0.20, so for an 80 percent reduction in response time there could be a cost reduction from a high of .60 � 80 percent � 48 percent to a low of 16 percent.
This is an overwhelming benefi t because if corresponding price reductions are made, it improves the value delivered to the customer through both higher respon-siveness and lower price. The result for the producer is a much higher market share. If the producer chooses not to reduce the price, then the result is both higher mar-gins and higher sales, for signifi cantly increased profi tability.
S T R A T E G Y A N D C O M P E T I T I V E N E S S ____________________
Competitiveness can be defi ned in a number of ways. We may think of it as the long-term viability of a fi rm or organization; or we may defi ne it in a short-term con-text such as the current success of a fi rm in the marketplace as measured by its mar-ket share or its profi tability. We can also talk about the competitiveness of a nation, in the sense of its aggregate competitive success in all markets. The U.S. President’s Council on Industrial Competitiveness gave this defi nition in 1985:
Competitiveness for a nation is the degree to which it can, under free and fair market conditions, produce goods and services that meet the test of international markets while simultaneously maintaining and expanding the real incomes of its citizens.
Global TrendsThe United States provides a graphic example of global trade trends. The trend in merchandise trade for the United States is startling. Although some might think that
20 40 60
Percentage change in response time
Per
cen
tage
ch
ange
in
co
st
80 100
20
40
60
80
100
ApproximationLower rangeUpper range
Figure 1.6 Cost reductions with decreases in response time.
c01.indd 25c01.indd 25 7/20/09 5:37:44 PM7/20/09 5:37:44 PM

26 C h a p t e r 1 : O p e r a t i o n s S t r a t e g y a n d G l o b a l C o m p e t i t i v e n e s s
foreign competition has been taking markets away from U.S. producers only in the past decade, U.S. merchandise imports have grown considerably for over 30 years. Although exports have increased over this period as well, they have not increased as fast as imports; the result is an exploding trade defi cit with foreign countries. Partly as a result of this defi cit, the United States is now the biggest debtor nation in the world, with a cumulative defi cit of about 5 trillion dollars, nearly half of the U.S. annual gross domestic product (GDP), and an annual defi cit running about 6 percent of GDP. However, these values hold only for the period up to mid-2008, when the global fi nancial/credit/recession crisis started. It now appears that all these fi gures will become much worse, and not for just the U.S. but globally.
Another important issue relating to the fi nancial crisis involves the exchange rate between currencies. Let’s consider in more detail what it means when a country’s currency declines in value relative to foreign currencies. A weaker currency means that citizens in that country will have to pay more for products imported from for-eign countries. Meanwhile, the prices for products produced in that country and exported to foreign countries will decline, making them more desirable. Thus, a decline in the value of a country’s currency is a double-edged sword. Such a decline makes imported goods more expensive for citizens to purchase but at the same time makes exports less expensive for foreign consumers, increasing the demand for domestic products.
As an example, let’s consider the American dollar. In the fi nancial crisis of 2008, the dollar grew stronger as Americans sold foreign assets and foreigners rushed to hold assets in the dollar, the world’s strongest currency, as well as a “reserve” (commo-dities are priced in dollars) currency. However, given the massive amount of dollars the U.S. government borrowed and created to overcome the fi nancial crisis, there is widespread concern that the dollar may weaken or even collapse in the future.
According to economic theory, a stronger dollar should make American products less desirable (or competitive) in foreign markets, and imports more desirable in American markets. However, some market actions that governments and businesses often take to keep from losing customers can alter this perfect economic relation-ship. For instance, in the 1990s, when the price of Japanese products in the United States started increasing in terms of dollars, Japanese fi rms initiated huge cost- cutting drives to reduce the cost (and thereby the dollar price) of their products, to keep from losing American customers, which was largely successful. Similarly, China con-trols the exchange rate of its currency, the renminbi, to stay at about 7 to the dollar (though they have been letting it strengthen recently) so it always sells its goods at a competitive price.
In the last decade, particularly with the economic rise of China and India, global markets, manufacturers, and service producers have evolved in a dramatic fashion. With the changes occurring in the World Trade Organization (WTO), international competition has grown very complex in the last two decades. Previously, fi rms were domestic, exporters, or international. A domestic fi rm produced and sold in the same country. An exporter sold goods, often someone else’s, abroad. An international fi rm sold domestically produced as well as foreign-produced goods both domestically and in foreign countries. However, domestic sales were usually produced domestically, and foreign sales were made either in the home country or in a plant in the foreign country, typically altered to suit national regulations, needs, and tastes.
Now, however, there are global fi rms, joint ventures, partial ownerships, foreign subsidiaries, and other types of international producers. For example, Canon is a
c01.indd 26c01.indd 26 7/20/09 5:37:45 PM7/20/09 5:37:45 PM

27S t r a t e g y a n d C o m p e t i t i v e n e s s
global producer that sells a standard “world-class” camera with options and add-ons available through the local dealer. And automobile producers frequently own stock in foreign automobile companies. Mazak, a fast-growing machine tool company, is the U.S. subsidiary of Yamazaki Machinery Company of Japan. Part of the reason for cross-ownerships and cross-endeavors is the spiraling cost of bringing out new products. New drugs and memory chips run in the hundreds of millions to billions of dollars to bring to market. By using joint ventures and other such approaches to share costs (and thereby lower risks), fi rms can remain competitive.
Whether to build offshore, assemble offshore, use foreign parts, employ a joint venture, and so on is a complex decision for any fi rm and depends on a multitude of factors. For example, the Japanese have many of their automobile manufactur-ing plants in foreign countries. The reasons are many and include: to circumvent foreign governmental regulation of importers, to avoid the high yen cost of Japanese- produced products, to avoid import fees and quotas, and to placate foreign consumers. Of course, other considerations are involved in producing in foreign countries: culture (e.g., if women are part of the labor force), political sta-bility, laws, taxes, regulations, and image.
Other complex arrangements of suppliers can result in hidden international com-petition. For example, many products that bear an American nameplate have been totally produced and assembled in a foreign country and are simply imported under a U.S. manufacturer’s or retailer’s nameplate, such as Nike shoes. Even more confus-ing, many products contain a signifi cant proportion of foreign parts, or may be com-posed entirely of foreign parts and only assembled in the United States (e.g., toasters, mixers, hand tools). This recent strategic approach of fi nding the best mix of pro-ducers and assemblers to deliver a product or service to a customer has come to be known as “supply chain management,” a topic we discuss in detail in Chapter 7.
StrategyThe organization’s business strategy is a set of objectives, plans, and policies for the organization to compete successfully in its markets. In effect, the business strategy specifi es what an organization’s competitive advantage will be and how this advan-tage will be achieved and sustained. As we will see, a key aspect of the business strategy is defi ning the organization’s core competencies and focus. The actual stra-tegic plan that details the business strategy is typically formulated at the executive committee level (CEO, president, vice presidents). It is usually long range, in the neighborhood of three to fi ve years.
In fact, however, the decisions that are made over time are the long-range strat-egy. In too many fi rms, these decisions show no pattern at all, refl ecting the truth that they have no active business strategy, even if they have gone through a process of strategic planning. In other cases these decisions bear little or no relationship to the organization’s stated or offi cial business strategy. The point is that an organization’s actions often tell more about its true business strategy than its public statements.
The general process of formulating a business strategy is illustrated in Figure 1.7. Relevant inputs to the strategic planning process include the organization’s vision/mission statement, a variety of factors external to the organization, and a range of factors internal to the organization. One school of thought—the Resource Based View—considers the set of resources (an internal factor in Figure 1.7) available to
c01.indd 27c01.indd 27 7/20/09 5:37:45 PM7/20/09 5:37:45 PM

28 C h a p t e r 1 : O p e r a t i o n s S t r a t e g y a n d G l o b a l C o m p e t i t i v e n e s s
the organization as the primary driver of the business strategy. For further discussion of this topic and its impact on the development of corporate strategy, consult Barney and Clark (2007) or Collis and Montgomery (2005).
After collectively considering these inputs, strategic planning is often initiated by developing a vision statement, a mission statement, or both. Vision statements are used to express the organization’s values and aspirations. Mission statements express the organization’s purpose or reason for existence. In some cases, organiza-tions may choose to combine the vision and mission statements into a single state-ment. Regardless of whether separate statements or combined statements are developed, the intent is to communicate the organization’s values, aspirations, and purpose so that employees can make decisions that are consistent with and support these objectives.
Effective vision and mission statements tend to be written using language that inspires employees to high levels of performance. Further, to foster employees’ com-mitment, it is advisable to include a wide variety of employees in the development of the vision or mission statement, rather than enforcing top management’s view by edict. Once the vision and mission statements are developed for the organization as a whole, divisions, departments, process teams, project teams, work groups, and so on can develop individual vision-mission statements that support the organization’s overall statement. For example, after a university develops its overall vision-mission statement, each college could develop its own unique statements specifying the role that it will play in supporting the overall mission of the university. Likewise, once each school develops its own vision-mission statement, the departments within the school can develop unique statements. Having each organizational unit develop its own unique statements promotes wider participation in the process, helps employees think in terms of how their work supports the overall mission, and results
BusinessStrategy
External Forces
EnvironmentalCompetitorsTechnologyCustomers
Internal Forces
ResourcesCore competencies/capabilities
CultureWeaknesses
Vision/MissionStatement
Business UnitStrategies
Business Model
Figure 1.7 Strategy formulation.
c01.indd 28c01.indd 28 7/20/09 5:37:45 PM7/20/09 5:37:45 PM

29S t r a t e g y a n d C o m p e t i t i v e n e s s
THE CENTRAL INTELLIGENCE AGENCYVision
One Agency. One Community. An Agency unmatched in its core capabilities, functioning as one team, fully integratedinto the Intelligence Community.
Mission
We are the nation’s first line of defense. We accomplish what others cannot accomplish and go where others cannotgo. We carry out our mission by:
• Collecting information that reveals the plans, intentions, and capabilities of our adversaries and providesthe basis for decision and action.
• Producing timely analysis that provided insight, warning, and opportunity to the President and decisionmakers charged with protecting and advancing America’s interests.
• Conducting covert action at the direction of the President to preempt threats or achieve U.S. policy objectives.
Figure 1.8 An example of a vision and mission statement.
in statements that are more meaningful to a select group of employees. An example of an actual vision and mission statement are given in Figure 1.8.
In addition to the vision/mission statement, other important inputs in the formu-lation of the business strategy are categorized as forces external and forces internal to the organization in Figure 1.7. Although both sets of forces are considered to some extent in formulating the vision/mission statement (as shown by the dotted lines in the fi gure), they are considered at a more detailed level and more directly when developing the business strategy. Important external forces include the envi-ronment (e.g., the economy, government regulations, climate), competitors (e.g., new product introductions, industry consolidation, new entrants from outside the industry), the technology available, and customer requirements. Relevant internal forces include organizational resources, the organization’s core competencies/capabilities, its culture, and its weaknesses. As shown, there is a bidirectional rela-tionship between the organization’s business strategy and both the internal and external forces. For example, an action by a key competitor may impact the organi-zation’s strategy just as its business strategy may force a reaction by a key competitor.
Overall, as seen in Figure 1.7, strategy is primarily concerned with making sets of choices that result in a “business model” which provides the tools to help further develop and communicate the strategy. In particular, the business model can help an organization verify that the elements of the strategy are consistent with one another, that they are logical, and that they are mutually reinforcing. Business models typically including expanded verbal discussions of key elements of the strategy as well as quantitative projections for important operational, marketing, and fi nancial aspects of the business.
c01.indd 29c01.indd 29 7/20/09 5:37:46 PM7/20/09 5:37:46 PM

30 C h a p t e r 1 : O p e r a t i o n s S t r a t e g y a n d G l o b a l C o m p e t i t i v e n e s s
To help further understand the distinction between strategy and a business model, consider the construction of a custom home. Initially, the architect consults with the future homeowners to understand how they envision the home and their life within it. The architect then creates a design to fulfi ll this vision. This corresponds to strat-egy. Next, the architect prepares a detailed fl oor plan and elevation based on the choices made during the design process. These correspond to the business model. Just as a business model can be used to help analyze and communicate strategic choices, the fl oor plan can be used to help understand, analyze, and communicate the design choices that were made.
Once the business strategy has been developed and the resulting business model analyzed, the fi nal step in strategy formulation is the development of business unit strategies. At this stage, each business unit develops its own strategy to guide its activities so that they are consistent and support the organization’s overall business strategy. Although formulating the business strategy is displayed as rather straight-forward in Figure 1.7, in reality it is very iterative.
Strategic FrameworksWe now move to a discussion of the Business Unit Strategies box in Figure 1.7. Clearly, there will be a Marketing Strategy, a Financial Strategy, an R&D Strategy, and so on. Here, of course, we are interested in the Operations Strategy. As it hap-pens, there are a number of fairly well defi ned such strategies. One that is common to many of the functional areas is related to the life cycle of the organization’s prod-ucts or services.
The Life Cycle
A number of functional strategies are tied to the stages in the standard life cycle of products and services, shown in Figure 1.9. Studies of the introduction of new prod-ucts indicate that the life cycle (or stretched-S growth curve, as it is also known)
Introduction
Dem
and
Growth Maturity
Time
Figure 1.9 The life-cycle curve.
c01.indd 30c01.indd 30 7/20/09 5:37:46 PM7/20/09 5:37:46 PM
31S t r a t e g y a n d C o m p e t i t i v e n e s s
provides a good pattern for the growth of demand for a new output. The curve can be divided into three major segments: (1) introduction and early adoption, (2) acceptance and growth of the market, and (3) maturity with market saturation. After market saturation, demand may remain high or decline; or the output may be improved and possibly start on a new growth curve.
The length of product and service life cycles has been shrinking signifi cantly in the last decade or so. In the past, a life cycle might have been fi ve years, but it is now six months. This places a tremendous burden on the fi rm to constantly monitor its strategy and quickly change a strategy that becomes inappropriate to the market.
The life cycle begins with an innovation—a new output or process for the market, as discussed earlier. The innovation may be a patented product or process, a new combination of existing elements that has created a unique product or pro-cess, or some service that was previously unavailable. Initial versions of the product or service may change relatively frequently; production volumes are small, since the output has not caught on yet; and margins are high. As volume increases, the design of the output stabilizes and more competitors enter the market, frequently with more capital-intensive equipment. In the mature phase, the now high-volume output is a virtual commodity, and the fi rm that can produce an acceptable version at the lowest cost usually controls the market.
Clearly, a fi rm’s business strategy should match the life-cycle stages of its prod-ucts and services. If a fi rm such as Hewlett-Packard is good at innovation, it may choose to focus only on the introduction and acceptance phases of the product’s life cycle and then sell or license production to others as the product moves beyond the introduction stage. If its strength is in high-volume, low-cost production, the company should stick with proven products that are in the maturity stage. Most common, per-haps, are fi rms that attempt to stick with products throughout their life cycle, chang-ing their strategy with each stage.
One approach to categorizing an organization’s business strategy is based on its timing of introductions of new outputs. Two researchers, Maidique and Patch (1979), suggest the following four product development strategies:
1. First-to-market. Organizations that use this strategy attempt to have their products available before the competition. To achieve this, strong applied research is needed. If a company is fi rst to market, it has to decide if it wants to price its products high and thus skim the market to achieve large short-term profi ts or set a lower initial price to obtain a higher market share and perhaps larger long-term profi ts.
2. Second-to-market. Organizations that use this strategy try to quickly imitate successful outputs offered by fi rst-to-market organizations. This strategy requires less emphasis on applied research and more emphasis on fast development. Often, fi rms that use the second-to-market strategy attempt to learn from the mistakes of the fi rst-to-market fi rm and offer improved or enhanced versions of the original products.
3. Cost minimization or late-to-market. Organizations that use this strategy wait until a product becomes fairly standardized and is demanded in large volumes. They then attempt to compete on the basis of costs as opposed to
c01.indd 31c01.indd 31 7/20/09 5:37:47 PM7/20/09 5:37:47 PM

32 C h a p t e r 1 : O p e r a t i o n s S t r a t e g y a n d G l o b a l C o m p e t i t i v e n e s s
features of the product. These organizations focus most of their research and development on improving the production system, as opposed to focusing on product development.
4. Market segmentation. This strategy focuses on serving niche markets with specifi c needs. Applied engineering skills and fl exible manufacturing systems are often needed for the market-segmentation strategy.
Be aware that a number of implicit tradeoffs are involved in developing a strategy. Let us use the fi rst-to-market strategy to demonstrate. A fi rst-to-market strategy requires large investments in product development in an effort to stay ahead of the competition. Typically, organizations that pursue this strategy expect to achieve relatively higher profi t margins, larger market shares, or both as a result of initially having the market to themselves. The strategy is somewhat risky because a competitor may end up beat-ing them to the market. Also, even if a company succeeds in getting to the market fi rst, it may end up simply creating an opportunity for the competition to learn from its mistakes and overtake it in the market. To illustrate, although Sony introduced its Betamax format for VCRs in 1975, JVC’s VHS format—introduced the following year—is the standard that ultimately gained widespread market acceptance.
Such tradeoffs are basic to the concept of selecting a business strategy. Although specifi c tasks must be done well to execute the selected strategy, not everything needs to be particularly outstanding—only a few things. And of course, strategies based on anything else—acquisitions, mergers, tax loss carry-forwards, even streams of high-technology products—will not be successful if the customer is ignored in the process.
Performance Frontiers
As we know from the earlier Customer Value section, there is a wide range of bene-fi ts and costs that organizations can compete on and various groups of customers value. If, say, n of these factors are important for an organization to consider, we might then conceive of a graph or space with n dimensions on it showing the organi-zation’s measures on each of the n factors as well as their competitor’s measures. The curve connecting all these measures would then be called the organization’s performance frontier (Clark 1996). For simplicity, let us use just two factors, say cost and variety, as shown in Figure 1.10 with the performance frontier curve labeled 1.
Output variety
Un
it c
ost
CB
A
1
Figure 1.10 Example performance frontier.
c01.indd 32c01.indd 32 7/20/09 5:37:47 PM7/20/09 5:37:47 PM
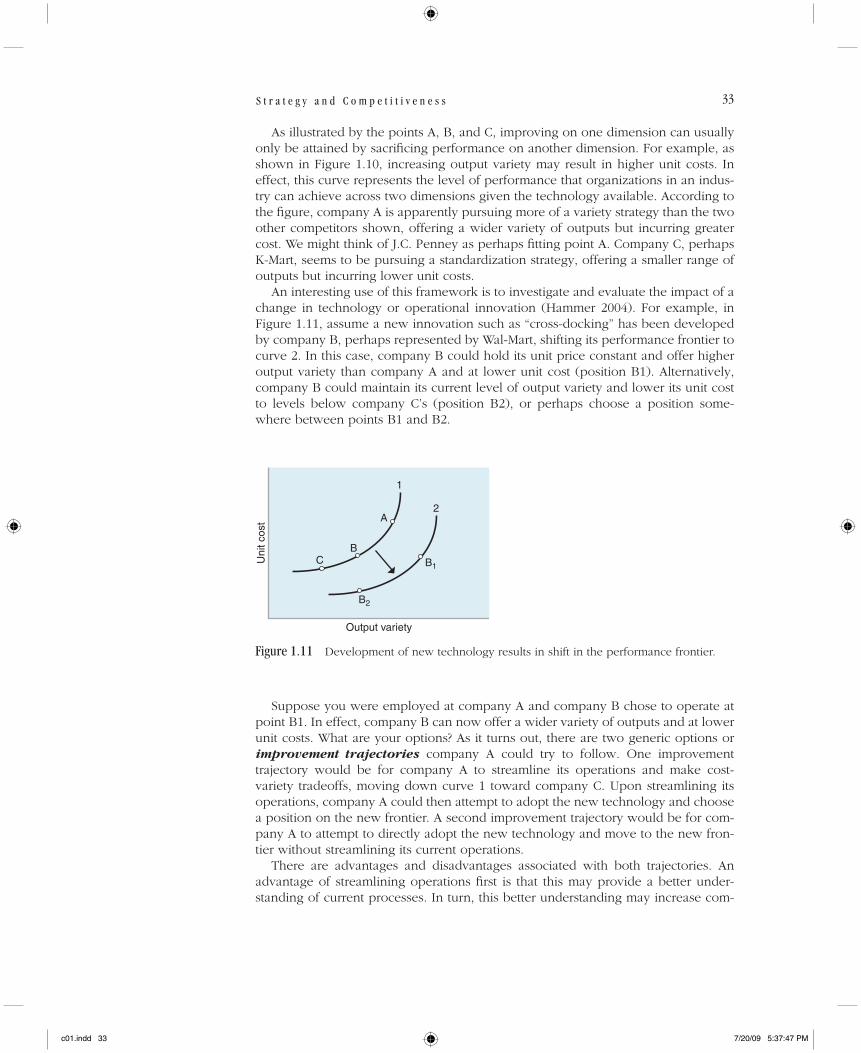
33S t r a t e g y a n d C o m p e t i t i v e n e s s
As illustrated by the points A, B, and C, improving on one dimension can usually only be attained by sacrifi cing performance on another dimension. For example, as shown in Figure 1.10, increasing output variety may result in higher unit costs. In effect, this curve represents the level of performance that organizations in an indus-try can achieve across two dimensions given the technology available. According to the fi gure, company A is apparently pursuing more of a variety strategy than the two other competitors shown, offering a wider variety of outputs but incurring greater cost. We might think of J.C. Penney as perhaps fi tting point A. Company C, perhaps K-Mart, seems to be pursuing a standardization strategy, offering a smaller range of outputs but incurring lower unit costs.
An interesting use of this framework is to investigate and evaluate the impact of a change in technology or operational innovation (Hammer 2004). For example, in Figure 1.11, assume a new innovation such as “cross-docking” has been developed by company B, perhaps represented by Wal-Mart, shifting its performance frontier to curve 2. In this case, company B could hold its unit price constant and offer higher output variety than company A and at lower unit cost (position B1). Alternatively, company B could maintain its current level of output variety and lower its unit cost to levels below company C’s (position B2), or perhaps choose a position some-where between points B1 and B2.
Output variety
Uni
t cos
t
CB
B2
B1
A2
1
Figure 1.11 Development of new technology results in shift in the performance frontier.
Suppose you were employed at company A and company B chose to operate at point B1. In effect, company B can now offer a wider variety of outputs and at lower unit costs. What are your options? As it turns out, there are two generic options or improvement trajectories company A could try to follow. One improvement trajectory would be for company A to streamline its operations and make cost- variety tradeoffs, moving down curve 1 toward company C. Upon streamlining its operations, company A could then attempt to adopt the new technology and choose a position on the new frontier. A second improvement trajectory would be for com-pany A to attempt to directly adopt the new technology and move to the new fron-tier without streamlining its current operations.
There are advantages and disadvantages associated with both trajectories. An advantage of streamlining operations fi rst is that this may provide a better under-standing of current processes. In turn, this better understanding may increase com-
c01.indd 33c01.indd 33 7/20/09 5:37:47 PM7/20/09 5:37:47 PM

34 C h a p t e r 1 : O p e r a t i o n s S t r a t e g y a n d G l o b a l C o m p e t i t i v e n e s s
pany A’s options in choosing a location on the new frontier and may even better position it to adopt the new technology. One drawback of streamlining its current operations fi rst is that the knowledge gained may be irrelevant when the new tech-nology is eventually adopted, and delaying the adoption of the new technology may mean reduced market share and profi ts. Another important factor is the amount of time required to execute the improvement trajectory and get to the new position on the new performance frontier. However, although it might appear that streamlin-ing the current operation fi rst before adopting the new technology should take more time than immediately adopting the technology, when ease of implementation is considered, the former approach may in fact be more expedient.
On a more practical note, KMart some years ago tried to challenge Wal-Mart on low prices but was unsuccessful. Then Sears and KMart merged instead; but at this time, that didn’t seem to work well either and now both seem to be in trouble.
One fi nal point. In Figure 1.11 it was assumed that the result of the new technol-ogy/innovation was simply a shift in the performance frontier. It is also important to be aware of the possibility that a new technology can change the shape as well as the location of the performance frontier. Such a change in shape can have important implications regarding choosing a location on the new frontier as well as the nature of the tradeoff facing the industry. In either case, the way to beat your competition is through developing or using new technology to move to a new frontier.
Focus
In the past, fi rms primarily competed on one factor, such as low cost, or innovation, because that was what they were good at. Obviously, they could not ignore the other factors of competition, which they had to do acceptably on, but their heavy attention to their one strength was based on a strategic framework called focus (Skinner 1974).
McKinsey & Company, a top management consulting fi rm, studied 27 outstanding successful fi rms to fi nd their common attributes. Two of the major attributes reported in Business Week are directly related to focus:
1. Stressing one key business value. At Hewlett-Packard, the key value is developing new products; at Dana Corporation, it is improving productivity.
2. Sticking to what they know best. All the outstanding fi rms defi ne their core capabilities (or strengths) and then build on them. They resist the temp-tation to move into new areas or diversify.
When an organization chooses to stress one or two key areas of strength, it is referred to as a focused organization. For example, IBM is known for its customer service, General Electric for its technology, and Procter & Gamble for its consumer marketing. In general, most but not all areas of focus relate to operations. Some fi rms, such as those in the insurance industry, focus on fi nancial strength and others focus on marketing strengths. For example, Harley-Davidson considers its strength to be in building relationships with its dealers and motorcycle owners. And many health care organizations are achieving signifi cant operational effi ciencies by focus-ing on a narrow range of ailments. For example, by treating only long-term acute cases, Intensiva HealthCare has been able to reduce its costs to 50 percent of those
c01.indd 34c01.indd 34 7/20/09 5:37:48 PM7/20/09 5:37:48 PM

35S t r a t e g y a n d C o m p e t i t i v e n e s s
of a traditional intensive-care ward. Clearly, adapting a focus strategy means know-ing not only what customers to concentrate on but also knowing what customers you do not want.
Table 1.5 identifi es several areas of focus that organizations commonly choose when forming their competitive strategy; all are various forms of differentiation. Recent competitive behavior among fi rms seems to be dividing most of the factors in Table 1.5 into two sets that Terry Hill (2000), an operations strategist and researcher in England, calls order qualifi ers and order winners. An order qualifi er is a charac-teristic of the product or service that is required if the product is even to be consid-ered or in the running. In other words, it is a prerequisite for entering the market. An order winner is a characteristic that will win the bid or the purchase. These qualifi -ers and winners vary with the market, of course, but some general commonalties exist across markets. For example, response time, performance, customization, inno-vation, and price seem to be frequent order winners, and the other factors (e.g., quality, reliability, and fl exibility) tend to be order qualifi ers. Working with market-ing and sales to properly identify which factors are which is clearly of major strategic importance.
T ABLE 1 .5 • Common Areas o f Organ i za t iona l Focus
• Innovation: Bringing a range of new products and services to market quickly
• Customization: Being able to quickly redesign and produce a product or service to meet customers’ unique needs
• Flexibility of products and services: Switching between different models or variants quickly to satisfy a customer or market
• Flexibility of volume: Changing quickly and economically from low-volume production to high volumes and vice versa
• Performance: Offering products and services with unique, valuable features
• Quality: Having better craftsmanship or consistency
• Reliability of the product or service: Always working acceptably, enabling customers to count on the performance
• Reliability of delivery: Always fulfi lling promises with a product or service that is never late
• Response: Offering very short lead times to obtain products and services
• After-sale service: Making available extensive, continuing help
• Price: Having the lowest price
In addition to the advantages of being focused, there are also some dangers. A narrowly focused fi rm can easily become uncompetitive in the market if the custom-ers’ requirements change. In addition to being focused, a fi rm must also be fl exible enough to alter its focus when the need changes and to spot the change in time. Frequently, a focus in one area can be used to an advantage in another way, if there is enough time to adapt—for example, to move into a new product line or alter the application of the focus. Moreover, as products go through their life cycle, the task of operations often changes, as shown in Figure 1.12, from being fl exible enough to accept changes in design, to meeting the growing demand in the market-
c01.indd 35c01.indd 35 7/20/09 5:37:48 PM7/20/09 5:37:48 PM
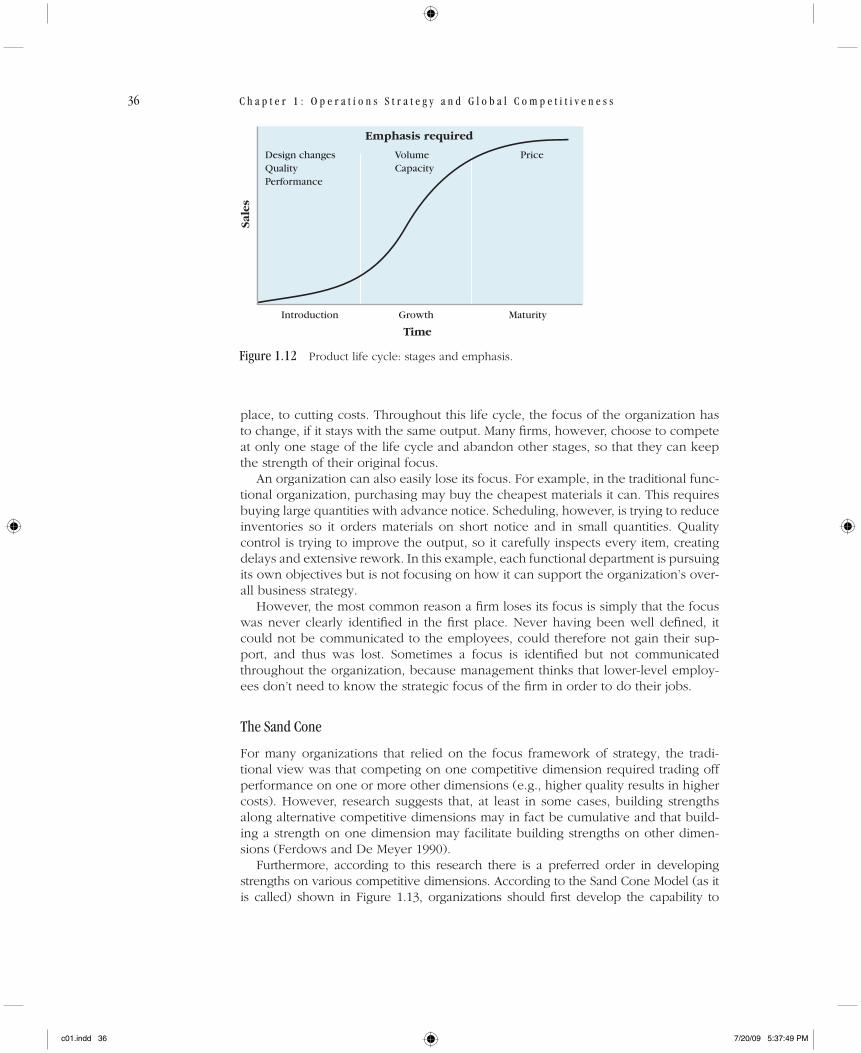
36 C h a p t e r 1 : O p e r a t i o n s S t r a t e g y a n d G l o b a l C o m p e t i t i v e n e s s
place, to cutting costs. Throughout this life cycle, the focus of the organization has to change, if it stays with the same output. Many fi rms, however, choose to compete at only one stage of the life cycle and abandon other stages, so that they can keep the strength of their original focus.
An organization can also easily lose its focus. For example, in the traditional func-tional organization, purchasing may buy the cheapest materials it can. This requires buying large quantities with advance notice. Scheduling, however, is trying to reduce inventories so it orders materials on short notice and in small quantities. Quality control is trying to improve the output, so it carefully inspects every item, creating delays and extensive rework. In this example, each functional department is pursuing its own objectives but is not focusing on how it can support the organization’s over-all business strategy.
However, the most common reason a fi rm loses its focus is simply that the focus was never clearly identifi ed in the fi rst place. Never having been well defi ned, it could not be communicated to the employees, could therefore not gain their sup-port, and thus was lost. Sometimes a focus is identifi ed but not communicated throughout the organization, because management thinks that lower-level employ-ees don’t need to know the strategic focus of the fi rm in order to do their jobs.
The Sand Cone
For many organizations that relied on the focus framework of strategy, the tradi-tional view was that competing on one competitive dimension required trading off performance on one or more other dimensions (e.g., higher quality results in higher costs). However, research suggests that, at least in some cases, building strengths along alternative competitive dimensions may in fact be cumulative and that build-ing a strength on one dimension may facilitate building strengths on other dimen-sions (Ferdows and De Meyer 1990).
Furthermore, according to this research there is a preferred order in developing strengths on various competitive dimensions. According to the Sand Cone Model (as it is called) shown in Figure 1.13, organizations should fi rst develop the capability to
Introduction
Sale
s
Growth
Time
Maturity
Design changesQualityPerformance
VolumeCapacity
Emphasis required
Price
Figure 1.12 Product life cycle: stages and emphasis.
c01.indd 36c01.indd 36 7/20/09 5:37:49 PM7/20/09 5:37:49 PM
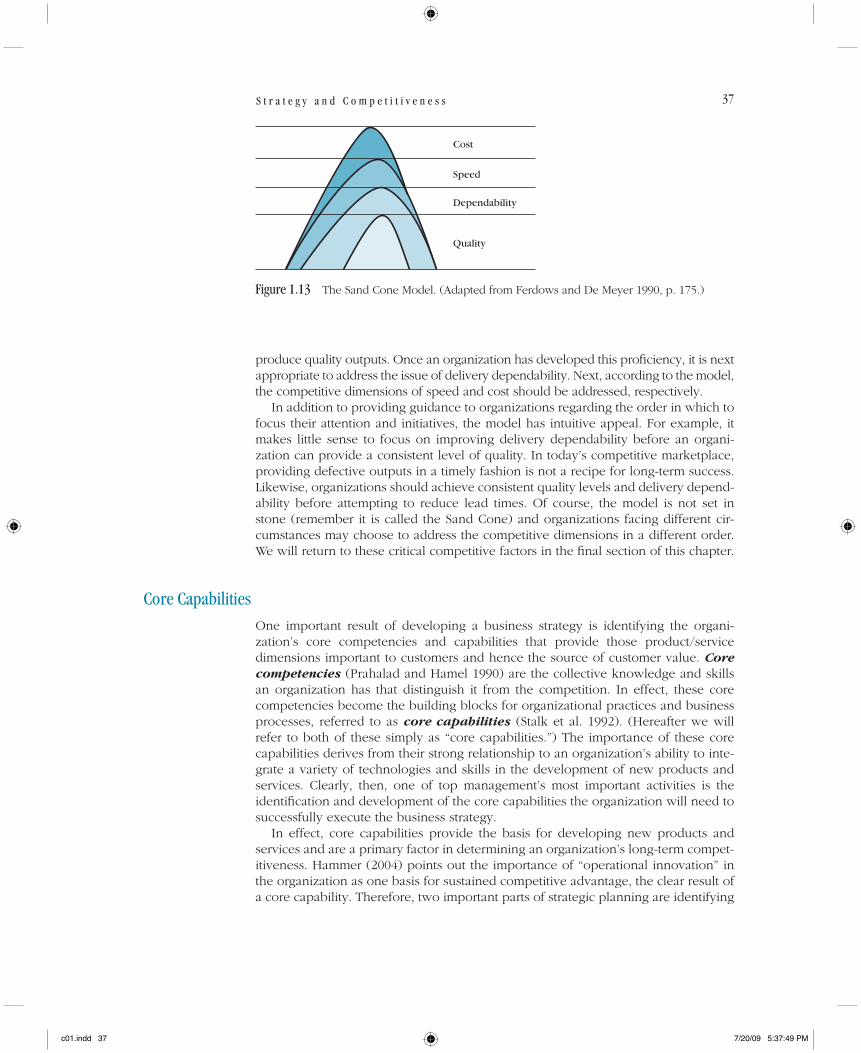
37S t r a t e g y a n d C o m p e t i t i v e n e s s
produce quality outputs. Once an organization has developed this profi ciency, it is next appropriate to address the issue of delivery dependability. Next, according to the model, the competitive dimensions of speed and cost should be addressed, respectively.
In addition to providing guidance to organizations regarding the order in which to focus their attention and initiatives, the model has intuitive appeal. For example, it makes little sense to focus on improving delivery dependability before an organi-zation can provide a consistent level of quality. In today’s competitive marketplace, providing defective outputs in a timely fashion is not a recipe for long-term success. Likewise, organizations should achieve consistent quality levels and delivery depend-ability before attempting to reduce lead times. Of course, the model is not set in stone (remember it is called the Sand Cone) and organizations facing different cir-cumstances may choose to address the competitive dimensions in a different order. We will return to these critical competitive factors in the fi nal section of this chapter.
Core CapabilitiesOne important result of developing a business strategy is identifying the organi-zation’s core competencies and capabilities that provide those product/service dimensions important to customers and hence the source of customer value. Core competencies (Prahalad and Hamel 1990) are the collective knowledge and skills an organization has that distinguish it from the competition. In effect, these core competencies become the building blocks for organizational practices and business processes, referred to as core capabilities (Stalk et al. 1992). (Hereafter we will refer to both of these simply as “core capabilities.”) The importance of these core capabilities derives from their strong relationship to an organization’s ability to inte-grate a variety of technologies and skills in the development of new products and services. Clearly, then, one of top management’s most important activities is the identifi cation and development of the core capabilities the organization will need to successfully execute the business strategy.
In effect, core capabilities provide the basis for developing new products and services and are a primary factor in determining an organization’s long-term compet-itiveness. Hammer (2004) points out the importance of “operational innovation” in the organization as one basis for sustained competitive advantage, the clear result of a core capability. Therefore, two important parts of strategic planning are identifying
Figure 1.13 The Sand Cone Model. (Adapted from Ferdows and De Meyer 1990, p. 175.)
Cost
Speed
Dependability
Quality
c01.indd 37c01.indd 37 7/20/09 5:37:49 PM7/20/09 5:37:49 PM

38 C h a p t e r 1 : O p e r a t i o n s S t r a t e g y a n d G l o b a l C o m p e t i t i v e n e s s
and predicting the core capabilities that will be critical to sustaining and enhancing the organization’s competitive position. On this basis, an organization can also assess its suppliers’ and competitors’ capabilities. If the organization fi nds that it is not the leader, it must determine the cost and risks of catching up with the best versus the cost and risks of losing that core capability.
Hayes and Pisano (1994) stress the importance of a fi rm not looking for “the” solu-tion to a current competitive problem but rather the “paths” to building one or two core capabilities to provide the source of customer value for the indefi nite future. Moreover, the fi rm should not think in terms of “tradeoffs” between core capabilities (e.g., moving from fl exibility as a strength to low cost), but rather “building” one capability on top of others, and which set will provide the most customer value.
Often, it is more useful to think of an organization in terms of its portfolio of core capabilities, rather than its portfolio of businesses or products. For instance, Sony is known for its expertise in miniaturization; 3M for its knowledge of substrates, coat-ings, and adhesives; Black and Decker for small electrical motors and industrial design; Boeing for its ability to integrate large-scale complex systems; and Honda for engines and power trains. Had Sony initially viewed itself as primarily a manufac-turer of Walkmans, rather than as a company with expertise in miniaturization, it might have overlooked several profi table opportunities, such as entering the cam-corder business. As another example, Boeing has successfully leveraged its core capability related to integrating large-scale systems in its production of commercial jetliners, space stations, fi ghter-bombers, and missiles.
As these examples illustrate, core capabilities are often used to gain access to a wide variety of markets. Cannon used its core capabilities in optics, imaging, and electronic controls to enter the markets for copiers, laser printers, cameras, and image scanners. In a similar fashion, Honda’s core capabilities in engines and power trains comprise the basis for its entry into other businesses: automobiles, motorcy-cles, lawn mowers, and generators.
In addition to providing access to a variety of markets, a core capability should be strongly related to the benefi ts provided by the product or service that customers value. In Sony’s case, its expertise in miniaturization translates directly into impor-tant product features such as portability and aesthetic designs. Alternatively, sup-pose Sony developed a core competence in writing understandable user manuals. Since people who purchase a Walkman or camcorder rarely base their purchase decision on the quality of the user manual (when was the last time you read a user manual?), this core capability would provide little if any competitive advantage.
Another characteristic of core capabilities is that they should be diffi cult to imi-tate. Clearly, no sustainable competitive advantage is provided by a core capability that is easily imitated. For example, Sony’s expertise in miniaturization would mean little if other electronics manufacturers could match it simply by purchasing and tak-ing apart Sony’s products (this is called reverse engineering). Bartmess and Cerny (1996) identify three elements of a core capability that hinders imitation:
• It is complex and requires organizational learning over a long period of time
• It is based on multiple functional areas, both internal and external to the organization
• It is a result of how the functions interact rather than the skills/knowledge within the functions themselves.
c01.indd 38c01.indd 38 7/20/09 5:37:49 PM7/20/09 5:37:49 PM

39S t r a t e g y a n d C o m p e t i t i v e n e s s
The topic of core capabilities is also strongly related to the recent surge in out-sourcing and offshoring. Outsourcing—an approach increasingly common—involves subcontracting out certain activities or services. For example, a manufacturer might outsource the production of certain components, the management and main-tenance of its computer resources, employee recruitment, or the processing of its payroll.
When we consider the concept of core capability, it is important to recognize that not all parts, services, or activities are equal. Rather, these activities and parts can be thought of as falling on a continuum ranging from strategically important to unim-portant. Parts and activities are considered strategically important when:
• They are strongly related to what customers perceive to be the key character-istics of the product or service.
• They require highly specialized knowledge and skill, a core capability.
• They require highly specialized physical assets, and few other suppliers pos-sess these assets.
• The organization has a technological lead or is likely to obtain one.
Activities that are not strategic or core are candidates for outsourcing. These parts or activities are not strongly linked to key product characteristics, do not require highly specialized knowledge, do not need special physical assets, and the organization does not have the technological lead in this area. Thus, if it is benefi cial to outsource these parts or activities—perhaps because of lower cost or higher quality—no loss in competitiveness should result. On the other hand, when a fi rm’s strategic parts and activ-ities have been outsourced, particularly to a foreign supplier, called offshoring, the fi rm has become hollow (Jonas 1986). As we have stated, the wise fi rm will outsource only nonstrategic, simple, relatively standard parts and processes such as screws or types of processes that are not worth the time for the fi rm to produce itself; the complex, proprietary parts and processes that give their products an edge in the marketplace are produced internally. If the fi rm outsources these parts and processes as well, it soon fi nds that the engineering design talent follows the production of the part out-side the fi rm, too, and its core capabilities have been lost. Then, the fi rm has been hollowed out, becoming merely a distributor of its supplier’s products.
Given the huge potential effects of outsourcing, both positive and negative, a fi rm should consider such a move very carefully. They need to think about the long-term and short-term effects. And they also need to consider the impact of this decision on their core capabilities, and everything else they do within the company. Such a major decision as outsourcing will affect other decisions as well, such as sourcing materials, hiring/releasing labor and management, marketing, fi nance, and a wide range of other areas.
So what is the problem? If a supplier can deliver the parts at lower cost and better quality when they are needed, why not use them? The problem is that the supplier gains the expertise (and core capabilities) to produce the critical parts you need, and as Hayes and Pisano (1994), among others, note: organizations quickly forget how they produced those critical parts. After a while, when the supplier has improved on the process and you have forgotten how to make the parts, it is likely to start com-peting with you, producing the products you have been selling and dropping you as a customer. This is even more dangerous if, as already noted, the product and
c01.indd 39c01.indd 39 7/20/09 5:37:50 PM7/20/09 5:37:50 PM
40 C h a p t e r 1 : O p e r a t i o n s S t r a t e g y a n d G l o b a l C o m p e t i t i v e n e s s
transformation system has also been hollowed out, following the production activi-ties to the supplier. This happened extensively in the television industry, where the Japanese learned fi rst how to produce, and then how to engineer black-and-white and, later, color television sets. They then started tentatively introducing their own brands, to see if U.S. customers would buy them. Their products were inexpensive, of high quality, and caught on quickly in the free-enterprise American markets. The Japanese now virtually control this industry, as illustrated in one of our opening examples.
Outsourcing is a growing trend among U.S. manufacturers. The Big Three U.S. automakers are well-known examples of manufacturers that extensively outsourced for years. As other examples, Deere & Co. puts its name on midrange utility tractors produced by a Japanese company, and Agco Corp. outsources the production of almost all of the transmissions and engines used in its farm equipment. Of course, not all manufacturers are jumping on the outsourcing bandwagon. New Balance Athletic Shoes, for example, invested $25 million in its manufacturing facilities as part of an overall strategy to do more assembly in-house.
Kodak’s Business Imaging Systems Division (BIS) is one fi rm that looked into off-shoring and decided against it (Bartmess and Cerny 1996). Initially they took the “traditional” perspective and discovered that overseas wage rates were 75 percent cheaper than domestic rates. [Note: Recent research reveals that wages in China are now commonly 96 percent cheaper than domestic U.S. wages!] The traditional per-spective is one dominated by considering only current conditions with no thought about the future, a short-term response to a competitive threat, a heavy emphasis on cost (primarily labor), and a singular focus on one function, typically operations, to the exclusion of other functions such as engineering, marketing, and design.
But then BIS considered a capabilities perspective and discovered that:
• Offshore productivity was also low, negating the benefi t of low wage rates.
• Large overhead costs were primarily fi xed and would not shrink with over-seas labor.
• Engineering would also have to accompany manufacturing overseas, but off-shore engineering wages were almost equal to domestic wages. Moreover, BIS did not want to lose their domestic engineering competence.
• Over time, foreign wages would be increasing: “. . . once trained and experi-enced, labor does not stay cheap very long.”
• Cost advantages almost equal to the benefi t of low offshore wages were available through product redesigns.
BIS hence decided not to move their operation overseas, though they did decide to start an offshore plant for a low-end product for the foreign market, mainly to edu-cate themselves in the advantages and disadvantages of offshore production as well as to learn ways to improve their internal low-cost manufacturing capabilities. (For another view on offshoring, see Markides and Berg 1988.)
Regarding the purpose for outsourcing, it is also important to be aware of another danger of outsourcing activities or parts primarily on the basis of “cost.” To illustrate, assume a manufacturer produces four product lines each with an annual volume of 100,000 units. Further assume that the company’s overhead is £1.2 million (British pounds). Allocating this overhead evenly across the four product lines would result
c01.indd 40c01.indd 40 7/20/09 5:37:50 PM7/20/09 5:37:50 PM
41F r o m S t r a t e g y t o S t r u c t u r e
in each unit being allocated £3 in overhead charges. Now suppose that in the inter-est of lowering its cost and increasing its competitiveness, the manufacturer investi-gates outsourcing products that can be produced at lower unit costs by external suppliers. In fact, suppose that a supplier is found for one of its product lines. What is the impact of outsourcing this product line? Clearly on one hand, the company obtains the product at a lower unit cost. But what is the impact on the remaining product lines and the organization’s overhead?
More than likely, outsourcing one product line will not have a dramatic impact on total overhead; however, the amount of overhead each unit must now absorb increases from £3/unit to £4/unit. In effect, each unit now appears to be more expensive to produce internally. Thus, outsourcing other product lines now appears to be warranted and likely will be investigated. As you can see, this logic results in a vicious cycle commonly referred to as the creeping breakeven phenomenon. As outputs are outsourced, the remaining outputs appear to be more expensive to pro-duce in-house. This creates an incentive to outsource even more outputs. The logi-cal conclusion of this process is that the organization ends up producing no outputs and going bankrupt.
F R O M S T R A T E G Y T O S T R U C T U R E ______________________
Now that the subject of operations strategy has been described, we are ready to tackle the operations concepts that refl ect this strategy in the remainder of the book. In general, there are two main sets of concepts that need to be discussed. One set is the major functions of operations that impact strategy, and the other is the three inte-grated thrusts we see occurring in organizations today: supply chain management, six sigma for improving processes, and lean for improving processes.
The book is divided into three parts: I: Operations Strategy, II: Operations Processes, and III: Supply Chain Management. We have just fi nished the fi rst part, consisting solely of Chapter 1: Operations Strategy and Global Competitiveness. The others are discussed below.
Part II: OPERATIONS PROCESSES
Chapter 2: Process Planning and Design—this chapter describes the various ways of organizing the transformation processes and each of their advantages and disadvantages. Such processes represent one of the major functions of operations.
Chapter 3: Controlling Processes—in this chapter, we describe the control element of the production system, with special attention to quality control as our primary example.
Chapter 4: Process Improvement: Reducing Variation Through Six Sigma—we devote two chapters to the major thrusts in industry today to improve their processes. This chapter focuses on the use of the six sigma approach to follow up on the control element in Chapter 3, where the production
c01.indd 41c01.indd 41 7/20/09 5:37:50 PM7/20/09 5:37:50 PM
42 C h a p t e r 1 : O p e r a t i o n s S t r a t e g y a n d G l o b a l C o m p e t i t i v e n e s s
processes have been found to need improvement in terms of reducing their variation.
Chapter 5: Process Improvement: Eliminating Waste Through Lean—here we investigate techniques to further improve the production processes by eliminating waste in processes, thereby saving cost, effort, and time.
Chapter 6: Managing Process Improvement Projects—having decided on our production processes, or ways to improve them, we now need to execute on our plan. This is done through the procedures of project management. We illustrate the procedures with a process improvement example, but project management can be applied to many other activities that organizations undertake, and especially activities involving change.
Part III: SUPPLY CHAIN MANAGEMENT
Chapter 7: Managing the Supply Chain—in this chapter we cover a range of topics that involve the supply chain such as inventory, material requirements planning and enterprise requirements planning, logistics, purchasing, and many others.
Chapter 8: Capacity, Scheduling, and Location—this chapter completes the description of the major functions of operations.
E X P A N D Y O U R U N D E R S T A N D I N G
1. Why is it so hard to increase productivity in the service sector?
2. Identify other major differences between services and products in addition to those listed in Table 1.1.
3. Many foreign fi rms have been successful in the fol-lowing areas: steel, autos, cameras, radios, and televisions. Are services more protected from for-eign competition? How?
4. It is commonly said that Japanese fi rms employ 10 times as many engineers per operations worker as U.S. fi rms and 10 times fewer accountants. What effect would you expect this to have on their com-petitiveness? Why?
5. How might the concept of a “facilitating good” alter the way we perceive a product? A service?
6. Is it wise for a fi rm to stick to what it knows best, or should it expand its market by moving into adjoin-ing products or services? How can it avoid losing its focus?
7. What do you think the result will be of the continu-ing escalation of the U.S. trade defi cit? Will a grad-ual devaluation of the dollar solve the “problem?” If it does, what do you think will be the resulting effect on the United States?
8. Can you think of any other areas of possible focus for a fi rm besides those identifi ed in Table 1.5?
9. What core capabilities do you think China pos-sesses? India? Japan? The United States ?
10. According to K. Blanchard and N. V. Peale (The Power of Ethical Management, New York: Morrow, 1988), the following three ethical tests may be use-ful: (1) Is it legal or within company policy? (2) Is it balanced and fair in the short and long term? (3) Would you be proud if the public or your family knew about it? Apply these tests to the following situations:
a. A foreign fi rm subsidizes its sales in another country.
b. A foreign fi rm dumps its products (sells them for less than cost) in another country.
c. A country imports products that, had they been made domestically, would have violated do-mestic laws (e.g., laws against pollution).
11. In responding faster to customers’ needs, where might the cost savings come from? What benefi ts would result?
c01.indd 42c01.indd 42 7/20/09 5:37:51 PM7/20/09 5:37:51 PM

43A p p l y y o u r U n d e r s t a n d i n g
12. Can you think of companies that have moved the performance frontier of their industries?
13. Why do Americans invest more in marketing new products while the Japanese invest more in engi-neering? What advantages accrue to each investment?
14. Using new technologies, it is not uncommon for fi rms to cut their response times by a factor of ten. What effect would you expect this to have on their unit costs?
15. With the increasing trend of offshoring in the United States, although companies may get richer, what will happen to their workers? What will the future hold?
16. What are the order winners and order qualifi ers for Wal-Mart? Toyota? BMW? Sony?
17. Given the recent trends in products and services, does the focus strategy or sand cone strategy seem most applicable these days?
18. Why don’t we see more mass customization in products and services?
A P P LY Y O U R U N D E R S T A N D I N GInc iden t 1 : Taracare , Inc .
Taracare, Inc. operates a single factory in Ensenada, Mexico, where it fabricates and assem-bles a wide range of outdoor furniture for the USA market, including chairs, tables, and matching accessories. Taracare’s primary production activities include extruding the alumi-num furniture parts, bending and shaping the extruded parts, fi nishing and painting the parts, and then assembling the parts into completed furniture. Upholstery, glass tabletops, and all hardware are purchased from outside suppliers.
Jorge Gonzalez purchased Taracare in 2001. Before that, Jorge had distinguished himself as a top sales rep of outdoor furniture for the western region of one of the leading national manufacturers. However, after spending 10 years on the road, Jorge wanted to settle down and spend more time with his family back in Mexico. After searching for a couple of months, he came across what he believed to be an ideal opportunity. Not only was it in an industry that he had a great deal of knowledge about, but he would be his own boss. Unfortunately, the asking price was well beyond Jorge’s means. However, after a month of negotiation, Jorge convinced Jesus Garza, Taracare’s founder, to maintain a 25 percent stake in the business. Although Jesus had originally intended to sell out completely, he was impressed with Jorge’s knowledge of the business, his extensive contacts, and his enthusiasm. He therefore agreed to sell Jorge 75 percent of Taracare and retain 25 percent as an investment.
Jorge’s ambition for Taracare was to expand it from a small regional manufacturer to one that sold to major national retailers. To accomplish this objective, Jorge’s fi rst initiative was to triple Taracare’s sales force in 2002. As sales began to increase, Jorge increased the support staff by hiring an accountant, a comptroller, two new designers, and a purchasing agent.
By mid-2005, Taracare’s line was carried by several national retailers on a trial basis. How-ever, Taracare was having diffi culty both in meeting the deliveries its sales reps were promis-ing and in satisfying the national retailers’ standards for quality. To respond to this problem, Jorge hired Alfredo Diaz as the new manufacturing manager. Before accepting Jorge’s offer, Alfredo was the plant manager of a factory that manufactured replacement windows sold by large regional and national retailers.
After several months on the job—and after making little progress toward improving on-time delivery and quality—Alfredo scheduled a meeting with Jorge to discuss his major con-cerns. Alfredo began:
I requested this meeting with you, Jorge, because I am not satisfi ed with the progress we are making toward improving our delivery performance and quality. The bottom line is that I feel I’m getting very little cooperation from the other department heads. For example, last month purchasing switched to a new supplier for paint; and although it is true that the new paint costs
c01.indd 43c01.indd 43 7/20/09 5:37:51 PM7/20/09 5:37:51 PM

44 C h a p t e r 1 : O p e r a t i o n s S t r a t e g y a n d G l o b a l C o m p e t i t i v e n e s s
less per gallon, we have to apply a thicker coat to give the furniture the same protection. I haven’t actually run the numbers, but I know it is actually costing us more, in both materials and labor.
Another problem is that we typically run a special promotion to coincide with launching new product lines. I understand that the sales guys want to get the product into the stores as quickly as possible, but they are making promises about delivery that we can’t meet. It takes time to work out the bugs and get things running smoothly. Then there is the problem with the designers. They are constantly adding features to the product that make it almost impossible for us to produce. At the very least, they make it much more expensive for us to produce. For example, on the new “Destiny” line, they designed table legs that required a new die at a cost of 250,000 pesos. Why couldn’t they have left the legs alone so that we could have used one of our existing dies? On top of this, we have the accounting department telling us that our equipment utilization is too low. Then, when we increase our equipment utilization and make more products, the fi nance guys tell us we have too much capital tied up in inventory. To be honest, I really don’t feel that I’m getting very much support.
Rising from his chair, Jorge commented:
You have raised some important issues, Alfredo. Unfortunately, I have to run to another meeting right now. Why don’t you send me a memo outlining these issues and your recommendations? Then perhaps I will call a meeting and we can discuss these issues with the other department heads. At least our production problems are really no worse than that of our competitors, and we don’t expect you to solve all of our problems overnight. Keep up the good work and send me that memo at your earliest convenience.
Questions
1. Does Alfredo’s previous experience running a plant that made replacement windows qualify him to run a plant that makes outdoor furniture?
2. What recommendations would you make if you were Alfredo?3. Given Jorge’s background and apparent priorities, how is he likely to respond
to Alfredo’s recommendations? On the basis of this likely response, is it possible to rephrase Alfredo’s recommendations so they are more appealing to Jorge?
Inc iden t 2 : I zmir Na t iona l Un i vers i t y
Izmir National University (INU) was chartered in 2000 to facilitate Turkey’s expected eventual entry into the economy of Europe, via the EU. To foster growth and development in the European economy, engineering, science, and business were deemed to be the institution’s primary areas of intellectual endeavor. The university grew rapidly during its fi rst three years. By 2005, the enrollment reached just over 9300 students. However, with this rapid growth came a number of problems. For example, because the faculty had to be hired so quickly, there was little real organization, and curriculum seemed to be decided on the basis of which adviser a student happened to consult. The administrative offi ces were often reshuffl ed, with vague responsibilities and short tenures.
The faculty of the new Business School was typical of the confusion that gripped the entire university. The 26 faculty members were mostly recent graduates of doctoral programs at major European and Turkish universities. There were 21 Assistant Docents and Lecturers, 3 Docents, and 2 full Professors, spread fairly evenly over the four Departments, each over-seen by a Kürsü professor (department head). In addition, funds were available to hire 3 addi-tional faculty members, either assistant or regular Docents. The background of the newly recruited Dekan (administrative head, dean) of the Business School included fi ve years of teaching at a primarily Muslim university in Turkey and two years of departmental administra-tion at a large southern European university.
c01.indd 44c01.indd 44 7/20/09 5:37:51 PM7/20/09 5:37:51 PM

45A p p l y y o u r U n d e r s t a n d i n g
Upon arriving at the Business School, the Dekan asked the faculty to e-mail their concerns to her so that she could begin to get a handle on the major issues confronting the school. Her offi ce assistant selected the following comments as representative of the sentiments expressed.
“Our student-teacher ratio is much higher than what it was at my former university. We need to fi ll those open slots as quickly as possible and ask the university to fund at least two more faculty positions.”“If we don’t get the quality of enrollments up in the MBA program, the Graduate School will never approve our application for a doctoral program. We need the doctoral program to attract the best faculty, and we need the doctoral students to help cover our courses.”“Given that research is our primary mission, we need to fund more graduate research assistants.”“The travel budget isn’t suffi cient to allow me to attend the meetings I’m interested in. How can we improve and maintain our visibility if we get funding for only one meeting per year?”“We need better staff support. Faculty members are required to submit their exams for copying fi ve days before they are needed. However, doing this makes it diffi cult to test the students on the material covered in class right before the exam, since it’s diffi cult to know ahead of time exactly how much material we will cover.”“I think far too much emphasis is placed on research. We are here to teach.”“Being limited in our consulting is far too restrictive. In Europe we were allowed one day a week. How are we supposed to stay current without consulting?”“We need a voice mail system. I never get my important messages.”
Questions
1. What do the comments by the faculty tell you about INU’s strategy?2. What would you recommend the Dekan do regarding the Business School’s
strategic planning process? What role would you recommend the Dekan play in this process?
3. Productivity is defi ned as the ratio of output (including both goods and services) to the input used to produce it. How could the productivity of the Business School be measured? What would the effect be on productivity if the faculty all received a 10 percent raise but continued to teach the same number of classes and students?
B I B L I O G R A P H Y
•
•
•
•
•
••
•
Barney, J. B. and D. N. Clark. Resource-Based Theory: Creating and Sustaining Competitive Advantage, Oxford, UK: Oxford University Press, 2007.
Bartlett, C. A. and S. Ghoshal. “Going Global: Lessons from Late Movers.” Harvard Business Review (March–April 2000): 132–142.
Bartmess, A. and K. Cerny. “Building Competitive Advantage through a Global Network of Capabilities.” Chapter 7 in R. A. Hayes, G. P. Pisano, and D. M. Upton: Strategic Operations: Competing through Capabilities. New York: The Free Press, 1996.
Bernstein, A. “Backlash: Behind the Anxiety of Globalization.” Business Week, April 24, 2000: 38–44.
Bowen, D. E., R. E. Chase, and T. G. Cummings & Asso-ciates. Service Management Effectiveness. San Francisco: Jossey-Bass, 1990.
Bower, J. L., and C. M. Christensen. “Disruptive Technologies: Catching the Wave.” Harvard Business Review (January–February 1995): 43–53.
Clark, K. “Competing Through Manufacturing and the New Manufacturing Paradigm: Is Manufacturing Strategy
c01.indd 45c01.indd 45 7/20/09 5:37:51 PM7/20/09 5:37:51 PM
46 C h a p t e r 1 : O p e r a t i o n s S t r a t e g y a n d G l o b a l C o m p e t i t i v e n e s s
Passé?” Production and Operations Management, 5 (1996): 42–58.
Collis, D. J., and C. A. Montgomery. Corporate Strategy: A Resource Based Approach, 2nd ed.. NY: McGraw-Hill/Irwin, 2005.
Crosby, P. B. Quality is Free: The Art of Making Quality Certain. New York: McGraw-Hill, 1979.
Deming, W. E. Out of Crisis. Cambridge, MA: MIT Press, 1986.
Denning, L. “The End of the Road is Nigh.” The Wall Street Journal, 31 March 2009.
Duff, C., and B. Ortega. “How Wal-Mart Outdid a Once-Touted KMart in Discount-Store Race.” Wall Street Journal (March 24, 1995): A1, A4.
Einhorn, B. “Your Next TV.” Business Week (April 4, 2005): 33–36.
Eisenhardt, K., and S. Brown. “Time-Pacing: Competing in Markets that Won’t Stand Still.” Harvard Business Review (March–April 1998): 59–69.
Evans, P., and T. S. Wurster. Blown to Bits. Boston: HBS Press, 2000.
Feitzinger, E., and H. L. Lee. “Mass Customization at Hewlett-Packard: The Power of Postponement.” Harvard Business Review (January–February 1997): 116–121.
Feld, W. M. Lean Manufacturing: Tools, Techniques, and How to Use Them. Boca Raton, FL: CRC Press, 2000.
Ferdows, K., ed. Managing International Manu-facturing. New York: North-Holland, 1989.
Ferdows, K., and A. DeMeyer. “Lasting Improvements in Manufacturing Performance: In Search of a New Theory.” Journal of Operations Management, 9 (1990): 168–184.
Fitzsimmons, J. A., and M. J. Fitzsimmons. Service Management for Competitive Advantage, 5th ed.. New York: McGraw-Hill, 2006.
Gilmore, J. H., and B. J. Pine II. “The Four Faces of Mass Customization.” Harvard Business Review (January–February 1997): 91–101.
Goldstein, S. M., R. Johnson, J. Duffy, and J. Rao. “The Service Concept: The Missing Link in Service Design Research?” Journal of Operations Management, Vol. 20 (2002): 121-134.
Goetsch, D. L., and S. B. Davis. Quality Management: Introduction to Total Quality Management for Pro-duction, Processing, and Services, 3rd ed. Upper Saddle River, NJ: Prentice Hall, 2000.
Hammer, M. “Deep Change: How Operational Innovation Can Transform Your Company.” Harvard Business Review, April 2004: 85–93.
Hammer, M. and S. Stanton. “How Process Enterprises Really Work.” Harvard Business Review, November–December 1999: 108–120.
Handfi eld, R. B., and E. L. Nichols, Jr. Introduction to Supply Chain Management. Upper Saddle River, NJ: Prentice-Hall, 1999.
Hayes, R. H., and G. P. Pisano. “Beyond World-Class: The New Manufacturing Strategy.” Harvard Business Review (January–February 1994): 77–86.
Hayes, R. H., G. P. Pisano, D. M. Upton, and S. C. Wheelwright. Operations, Strategy, and Technology: Pursuing the Competitive Edge. New York: John Wiley, 2004.
Hill, T. Manufacturing Strategy: Text and Cases, 3rd ed., Homewood, IL: Irwin, 2000.
Jonas, N. “The Hollow Corporation.” Business Week (March 3, 1986): 57–85.
Kaplan, R. S., and D. P. Norton. The Strategy Focused Organization. Boston: Harvard Business School Press, 2001.
Kaplan, R. S., and D. P. Norton. “Having Trouble with Your Strategy? Then Map It.” Harvard Business Review (September–October 2000), pp. 167–176.
Maidique, M. A., and P. Patch. Corporate Strategy and Technological Policy. Harvard Business School Case 9-679-033, Boston, 1979.
Markides, C. C. and N. Berg. “Manufacturing Offshore is Bad Business.” Harvard Business Review (September–October 1988): 113–120.
Meredith, J. R., D. M. McCutcheon, and J. Hartley. “Enhancing Competitiveness Through the New Market Value Equation.” International Journal of Operations and Production Management, 14 (November 11, 1994): 7–21.
Merrick, A. and Zimmerman, A., “Can Sears and Kmart Take On a Goliath Named Wal-Mart?” Wall Street Journal (November 19, 2004): B1, B2.
Pande, P. S., R. P. Neuman, and R. R. Cavanagh. The Six Sigma Way. New York: McGraw-Hill, 2000.
Pine, B. J., II. Mass Customization: The New Frontier in Business Competition. Boston: Harvard Business School Press, 1993.
Porter, M. “What is Strategy?” Harvard Business Review (November–December 1996): 61–78.
Porter, M. E. Competitive Advantage. New York: Free Press, 1985.
Prahalad, C. K., and G. Hamel. “The Core Competence of the Corporation.” Harvard Business Review (May– June 1990): 79–91.
c01.indd 46c01.indd 46 7/20/09 5:37:52 PM7/20/09 5:37:52 PM

47B i b l i o g r a p h y
SAP. Top 100 Retailers. SAP Special Report, July 2008. www.stores.org/pdf/08TOP100.pdf
Skinner, W. “The Focused Factory.” Harvard Business Review (May–June 1974): 113–122.
Shafer, S. M., H. J. Smith, and J. C. Linder, “The Power of Business Models.” Business Horizons, 48 (May–June 2005): 199–207.
Slack, N., and M. Lewis. Operations Strategy. New York: Financial Times Prentice-Hall, 2001.
Stalk, G. “Time—The Next Source of Competitive Advantage.” Harvard Business Review (July–August 1988): 41–51.
Stalk, G., P. Evans, and L. E. Shulman. “Competing on Capabilities: The New Rules of Corporate
Strategy.” Harvard Business Review (March–April 1992): 57–69.
Turner, M. L. Kmart’s Ten Deadly Sins: How Incompetence Tainted an American Icon. Hoboken, NJ: Wiley, 2003.
Upton, D. M. “The Management of Manufacturing Flexibility.” California Management Review (Winter 1994): 72–89.
Vessey, J. T. “The New Competitors: They Think in Terms of ‘Speed-to-Market.’” Academy of Management Review, 5 (April 1991): 23–33.
Welch, D., “Running Out of Gas.” Business Week (March 28, 2005): 29–31.
Womack, J. P., and D. T. Jones. Lean Thinking: Banish Waste and Create Wealth in you corporation, rev. ed.. New York: Free Press, 2003.
c01.indd 47c01.indd 47 7/20/09 5:37:52 PM7/20/09 5:37:52 PM

c01.indd 48c01.indd 48 7/20/09 5:37:52 PM7/20/09 5:37:52 PM


![Index [media.wiley.com]media.wiley.com/product_data/excerpt/31/04704813/0470481331-2.pdfIndex • A • A% major chord diagram, 608 major scale pattern #5, 458 pentatonic pattern/fret](https://img.pdfslide.us/doc/110x75/5e01ce318c84236e13228300/index-mediawileycommediawileycomproductdataexcerpt31047048130470481331-2pdfindex.jpg)
![INDEX [media.wiley.com]media.wiley.com/product_data/excerpt/44/07821441/0782144144-2.pdf · INDEX Note to the Reader: Throughout this index boldfaced page numbers indicate primary](https://img.pdfslide.us/doc/110x75/5e0b68ca8cda860aca1f2a03/index-mediawileycommediawileycomproductdataexcerpt44078214410782144144-2pdf.jpg)