Embed Size (px)
Citation preview
89
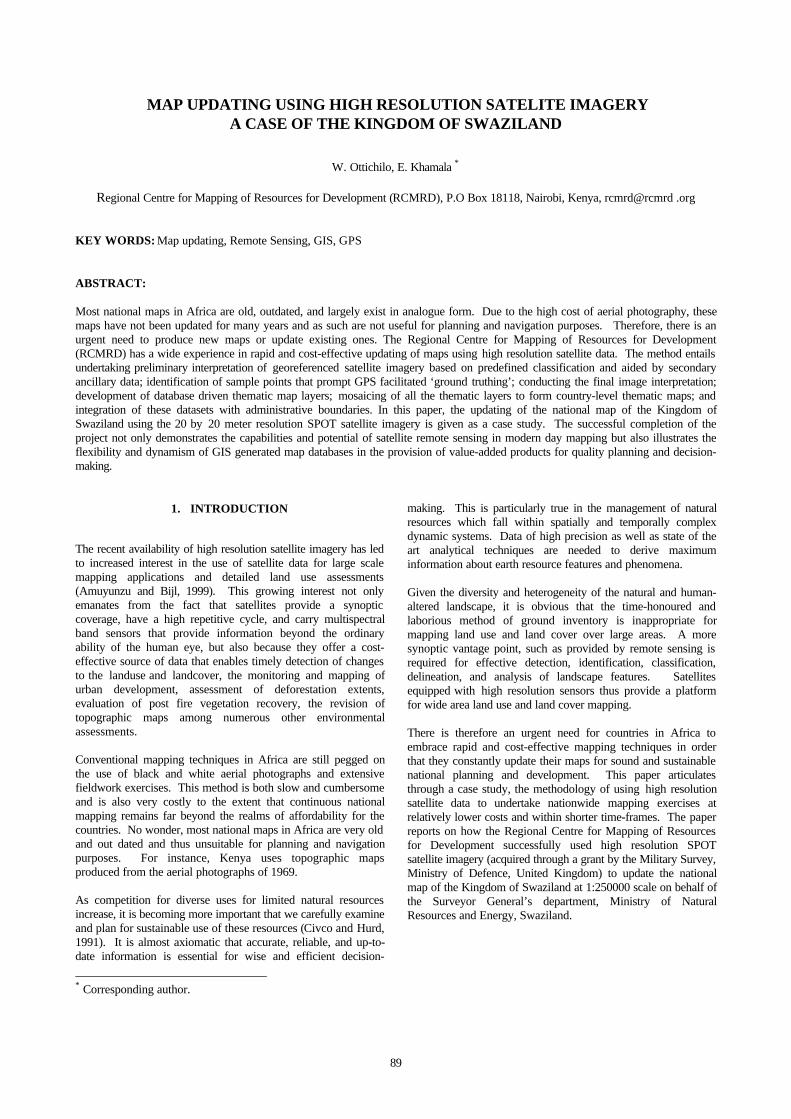
MAP UPDATING USING HIGH RESOLUTION SATELITE IMAGERYA CASE OF THE KINGDOM OF SWAZILAND
W. Ottichilo, E. Khamala *
Regional Centre for Mapping of Resources for Development (RCMRD), P.O Box 18118, Nairobi, Kenya, rcmrd@rcmrd .org
KEY WORDS: Map updating, Remote Sensing, GIS, GPS
ABSTRACT:
Most national maps in Africa are old, outdated, and largely exist in analogue form. Due to the high cost of aerial photography, thesemaps have not been updated for many years and as such are not useful for planning and navigation purposes. Therefore, there is anurgent need to produce new maps or update existing ones. The Regional Centre for Mapping of Resources for Development(RCMRD) has a wide experience in rapid and cost-effective updating of maps using high resolution satellite data. The method entailsundertaking preliminary interpretation of georeferenced satellite imagery based on predefined classification and aided by secondaryancillary data; identification of sample points that prompt GPS facilitated ‘ground truthing’; conducting the final image interpretation;development of database driven thematic map layers; mosaicing of all the thematic layers to form country-level thematic maps; andintegration of these datasets with administrative boundaries. In this paper, the updating of the national map of the Kingdom ofSwaziland using the 20 by 20 meter resolution SPOT satellite imagery is given as a case study. The successful completion of theproject not only demonstrates the capabilities and potential of satellite remote sensing in modern day mapping but also illustrates theflexibility and dynamism of GIS generated map databases in the provision of value-added products for quality planning and decision-making.
* Corresponding author.
1. INTRODUCTION
The recent availability of high resolution satellite imagery has ledto increased interest in the use of satellite data for large scalemapping applications and detailed land use assessments(Amuyunzu and Bijl, 1999). This growing interest not onlyemanates from the fact that satellites provide a synopticcoverage, have a high repetitive cycle, and carry multispectralband sensors that provide information beyond the ordinaryability of the human eye, but also because they offer a cost-effective source of data that enables timely detection of changesto the landuse and landcover, the monitoring and mapping ofurban development, assessment of deforestation extents,evaluation of post fire vegetation recovery, the revision oftopographic maps among numerous other environmentalassessments.
Conventional mapping techniques in Africa are still pegged onthe use of black and white aerial photographs and extensivefieldwork exercises. This method is both slow and cumbersomeand is also very costly to the extent that continuous nationalmapping remains far beyond the realms of affordability for thecountries. No wonder, most national maps in Africa are very oldand out dated and thus unsuitable for planning and navigationpurposes. For instance, Kenya uses topographic mapsproduced from the aerial photographs of 1969.
As competition for diverse uses for limited natural resourcesincrease, it is becoming more important that we carefully examineand plan for sustainable use of these resources (Civco and Hurd,1991). It is almost axiomatic that accurate, reliable, and up-to-date information is essential for wise and efficient decision-
making. This is particularly true in the management of naturalresources which fall within spatially and temporally complexdynamic systems. Data of high precision as well as state of theart analytical techniques are needed to derive maximuminformation about earth resource features and phenomena.
Given the diversity and heterogeneity of the natural and human-altered landscape, it is obvious that the time-honoured andlaborious method of ground inventory is inappropriate formapping land use and land cover over large areas. A moresynoptic vantage point, such as provided by remote sensing isrequired for effective detection, identification, classification,delineation, and analysis of landscape features. Satellitesequipped with high resolution sensors thus provide a platformfor wide area land use and land cover mapping.
There is therefore an urgent need for countries in Africa toembrace rapid and cost-effective mapping techniques in orderthat they constantly update their maps for sound and sustainablenational planning and development. This paper articulatesthrough a case study, the methodology of using high resolutionsatellite data to undertake nationwide mapping exercises atrelatively lower costs and within shorter time-frames. The paperreports on how the Regional Centre for Mapping of Resourcesfor Development successfully used high resolution SPOTsatellite imagery (acquired through a grant by the Military Survey,Ministry of Defence, United Kingdom) to update the nationalmap of the Kingdom of Swaziland at 1:250000 scale on behalf ofthe Surveyor General’s department, Ministry of NaturalResources and Energy, Swaziland.
The International Archives of the Photogrammetry, Remote Sensing and Spatial Information Sciences, Vol. XXXIV, Part 6/W6
90
2. AREA OF STUDY
The Kingdom of Swaziland is one of the smallest countries onthe African mainland. Located between longitudes 30o and 32o
East and Latitudes 25o and 28o South, the country occupiesabout 6700 square miles.
Land locked between its neighbours - South Africa andMozambique, the Kingdom of Swaziland is divided into fourregional administrative units namely; Hhohho, Lubomba, Manziniand Shiselweni.
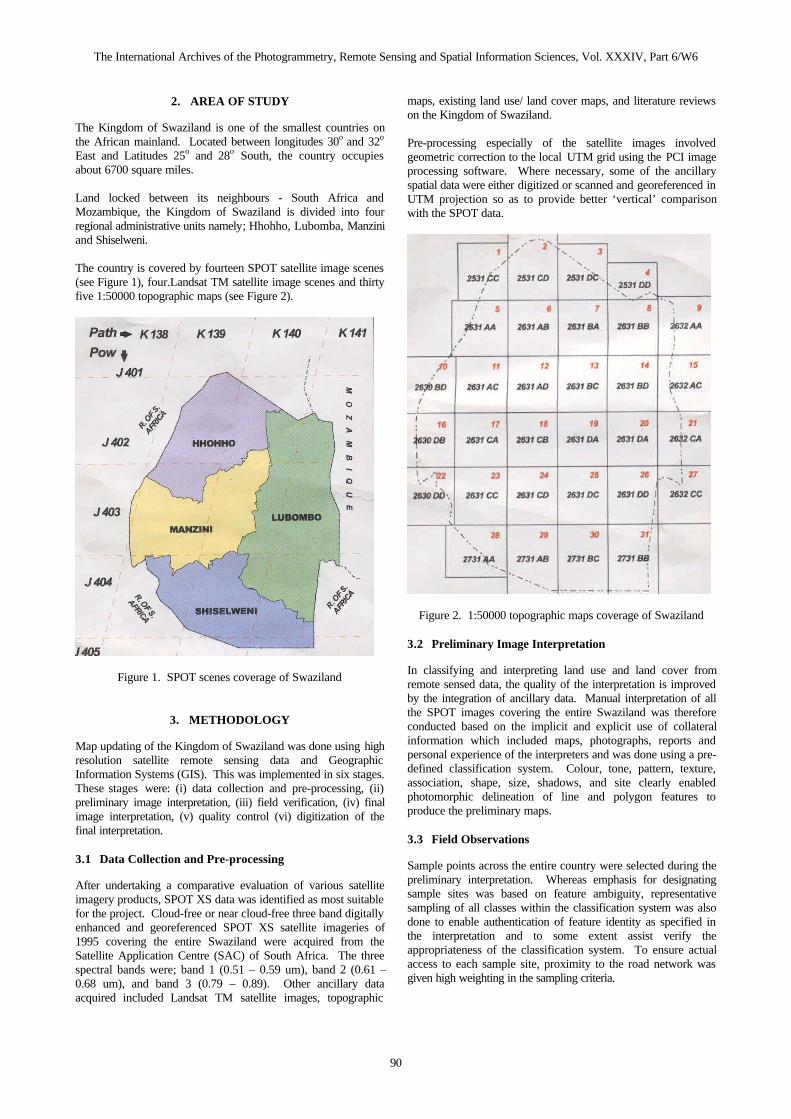
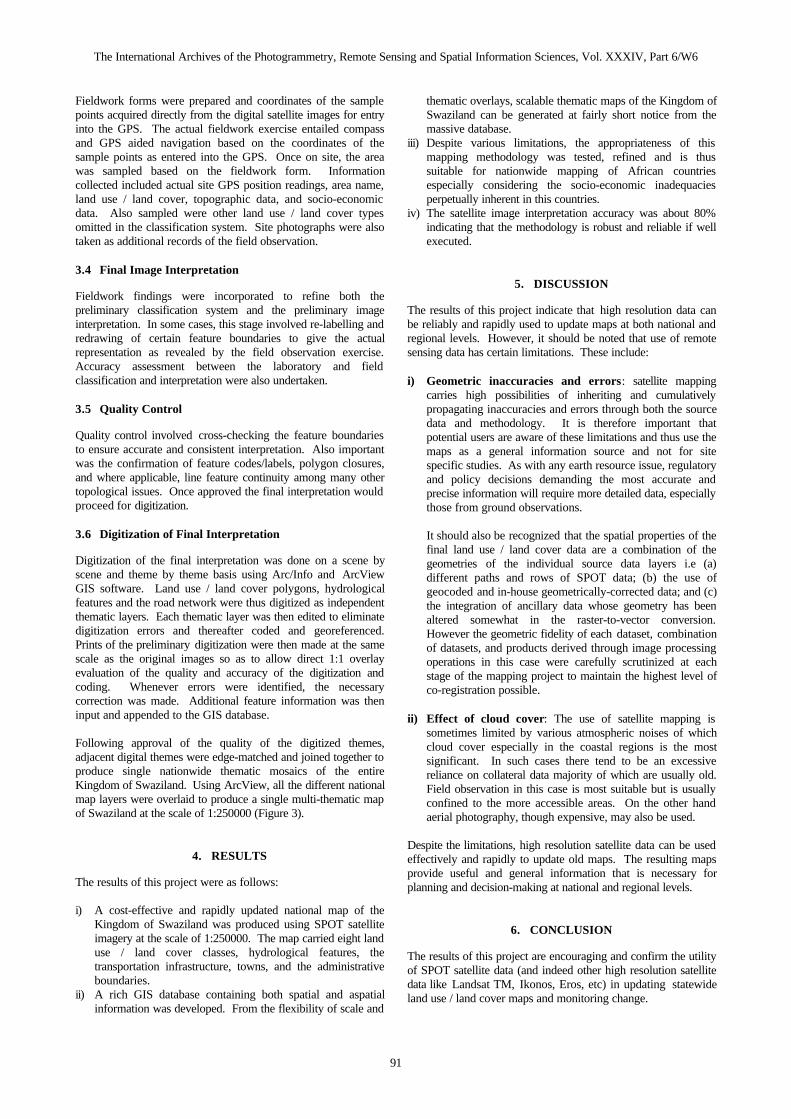
The country is covered by fourteen SPOT satellite image scenes(see Figure 1), four.Landsat TM satellite image scenes and thirtyfive 1:50000 topographic maps (see Figure 2).
Figure 1. SPOT scenes coverage of Swaziland
3. METHODOLOGY
Map updating of the Kingdom of Swaziland was done using highresolution satellite remote sensing data and GeographicInformation Systems (GIS). This was implemented in six stages.These stages were: (i) data collection and pre-processing, (ii)preliminary image interpretation, (iii) field verification, (iv) finalimage interpretation, (v) quality control (vi) digitization of thefinal interpretation.
3.1 Data Collection and Pre-processing
After undertaking a comparative evaluation of various satelliteimagery products, SPOT XS data was identified as most suitablefor the project. Cloud-free or near cloud-free three band digitallyenhanced and georeferenced SPOT XS satellite imageries of1995 covering the entire Swaziland were acquired from theSatellite Application Centre (SAC) of South Africa. The threespectral bands were; band 1 (0.51 – 0.59 um), band 2 (0.61 –0.68 um), and band 3 (0.79 – 0.89). Other ancillary dataacquired included Landsat TM satellite images, topographic
maps, existing land use/ land cover maps, and literature reviewson the Kingdom of Swaziland.
Pre-processing especially of the satellite images involvedgeometric correction to the local UTM grid using the PCI imageprocessing software. Where necessary, some of the ancillaryspatial data were either digitized or scanned and georeferenced inUTM projection so as to provide better ‘vertical’ comparisonwith the SPOT data.
Figure 2. 1:50000 topographic maps coverage of Swaziland
3.2 Preliminary Image Interpretation
In classifying and interpreting land use and land cover fromremote sensed data, the quality of the interpretation is improvedby the integration of ancillary data. Manual interpretation of allthe SPOT images covering the entire Swaziland was thereforeconducted based on the implicit and explicit use of collateralinformation which included maps, photographs, reports andpersonal experience of the interpreters and was done using a pre-defined classification system. Colour, tone, pattern, texture,association, shape, size, shadows, and site clearly enabledphotomorphic delineation of line and polygon features toproduce the preliminary maps.
3.3 Field Observations
Sample points across the entire country were selected during thepreliminary interpretation. Whereas emphasis for designatingsample sites was based on feature ambiguity, representativesampling of all classes within the classification system was alsodone to enable authentication of feature identity as specified inthe interpretation and to some extent assist verify theappropriateness of the classification system. To ensure actualaccess to each sample site, proximity to the road network wasgiven high weighting in the sampling criteria.
The International Archives of the Photogrammetry, Remote Sensing and Spatial Information Sciences, Vol. XXXIV, Part 6/W6
91
Fieldwork forms were prepared and coordinates of the samplepoints acquired directly from the digital satellite images for entryinto the GPS. The actual fieldwork exercise entailed compassand GPS aided navigation based on the coordinates of thesample points as entered into the GPS. Once on site, the areawas sampled based on the fieldwork form. Informationcollected included actual site GPS position readings, area name,land use / land cover, topographic data, and socio-economicdata. Also sampled were other land use / land cover typesomitted in the classification system. Site photographs were alsotaken as additional records of the field observation.
3.4 Final Image Interpretation
Fieldwork findings were incorporated to refine both thepreliminary classification system and the preliminary imageinterpretation. In some cases, this stage involved re-labelling andredrawing of certain feature boundaries to give the actualrepresentation as revealed by the field observation exercise.Accuracy assessment between the laboratory and fieldclassification and interpretation were also undertaken.
3.5 Quality Control
Quality control involved cross-checking the feature boundariesto ensure accurate and consistent interpretation. Also importantwas the confirmation of feature codes/labels, polygon closures,and where applicable, line feature continuity among many othertopological issues. Once approved the final interpretation wouldproceed for digitization.
3.6 Digitization of Final Interpretation
Digitization of the final interpretation was done on a scene byscene and theme by theme basis using Arc/Info and ArcViewGIS software. Land use / land cover polygons, hydrologicalfeatures and the road network were thus digitized as independentthematic layers. Each thematic layer was then edited to eliminatedigitization errors and thereafter coded and georeferenced.Prints of the preliminary digitization were then made at the samescale as the original images so as to allow direct 1:1 overlayevaluation of the quality and accuracy of the digitization andcoding. Whenever errors were identified, the necessarycorrection was made. Additional feature information was theninput and appended to the GIS database.
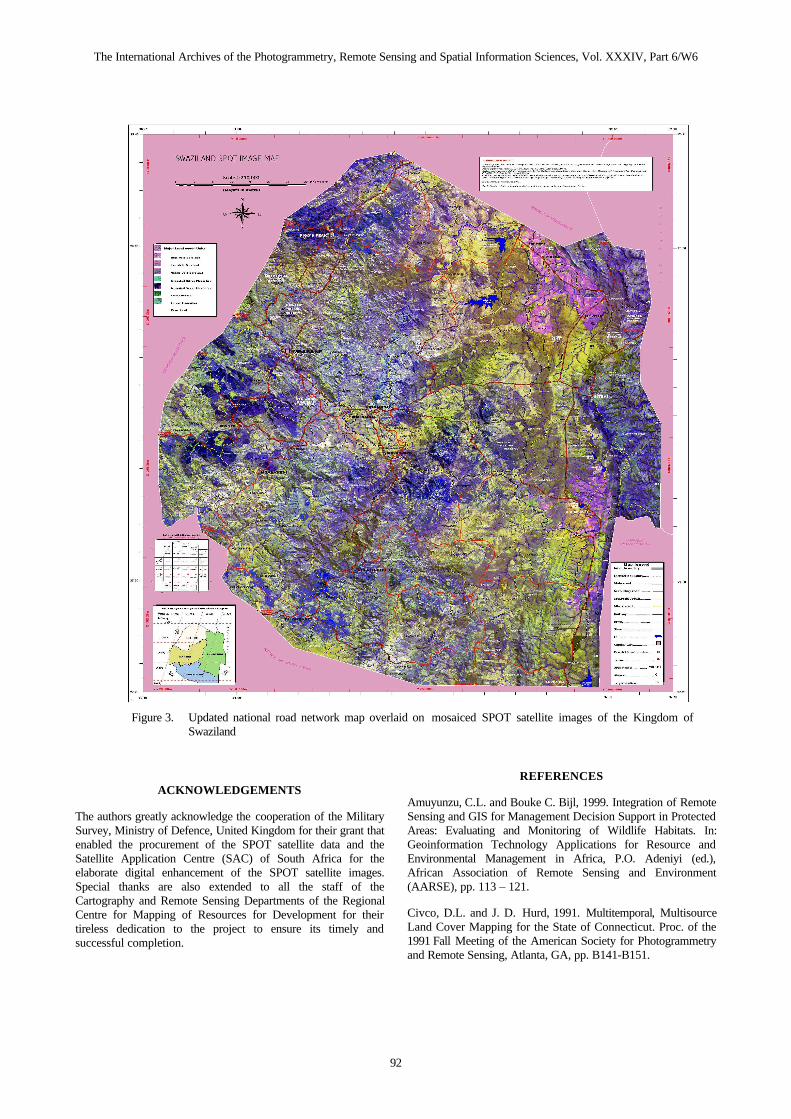
Following approval of the quality of the digitized themes,adjacent digital themes were edge-matched and joined together toproduce single nationwide thematic mosaics of the entireKingdom of Swaziland. Using ArcView, all the different nationalmap layers were overlaid to produce a single multi-thematic mapof Swaziland at the scale of 1:250000 (Figure 3).
4. RESULTS
The results of this project were as follows:
i) A cost-effective and rapidly updated national map of theKingdom of Swaziland was produced using SPOT satelliteimagery at the scale of 1:250000. The map carried eight landuse / land cover classes, hydrological features, thetransportation infrastructure, towns, and the administrativeboundaries.
ii) A rich GIS database containing both spatial and aspatialinformation was developed. From the flexibility of scale and
thematic overlays, scalable thematic maps of the Kingdom ofSwaziland can be generated at fairly short notice from themassive database.
iii) Despite various limitations, the appropriateness of thismapping methodology was tested, refined and is thussuitable for nationwide mapping of African countriesespecially considering the socio-economic inadequaciesperpetually inherent in this countries.
iv) The satellite image interpretation accuracy was about 80%indicating that the methodology is robust and reliable if wellexecuted.
5. DISCUSSION
The results of this project indicate that high resolution data canbe reliably and rapidly used to update maps at both national andregional levels. However, it should be noted that use of remotesensing data has certain limitations. These include:
i) Geometric inaccuracies and errors: satellite mappingcarries high possibilities of inheriting and cumulativelypropagating inaccuracies and errors through both the sourcedata and methodology. It is therefore important thatpotential users are aware of these limitations and thus use themaps as a general information source and not for sitespecific studies. As with any earth resource issue, regulatoryand policy decisions demanding the most accurate andprecise information will require more detailed data, especiallythose from ground observations.
It should also be recognized that the spatial properties of thefinal land use / land cover data are a combination of thegeometries of the individual source data layers i.e (a)different paths and rows of SPOT data; (b) the use ofgeocoded and in-house geometrically-corrected data; and (c)the integration of ancillary data whose geometry has beenaltered somewhat in the raster-to-vector conversion.However the geometric fidelity of each dataset, combinationof datasets, and products derived through image processingoperations in this case were carefully scrutinized at eachstage of the mapping project to maintain the highest level ofco-registration possible.
ii) Effect of cloud cover: The use of satellite mapping issometimes limited by various atmospheric noises of whichcloud cover especially in the coastal regions is the mostsignificant. In such cases there tend to be an excessivereliance on collateral data majority of which are usually old.Field observation in this case is most suitable but is usuallyconfined to the more accessible areas. On the other handaerial photography, though expensive, may also be used.
Despite the limitations, high resolution satellite data can be usedeffectively and rapidly to update old maps. The resulting mapsprovide useful and general information that is necessary forplanning and decision-making at national and regional levels.
6. CONCLUSION
The results of this project are encouraging and confirm the utilityof SPOT satellite data (and indeed other high resolution satellitedata like Landsat TM, Ikonos, Eros, etc) in updating statewideland use / land cover maps and monitoring change.
The International Archives of the Photogrammetry, Remote Sensing and Spatial Information Sciences, Vol. XXXIV, Part 6/W6
92
ACKNOWLEDGEMENTS
The authors greatly acknowledge the cooperation of the MilitarySurvey, Ministry of Defence, United Kingdom for their grant thatenabled the procurement of the SPOT satellite data and theSatellite Application Centre (SAC) of South Africa for theelaborate digital enhancement of the SPOT satellite images.Special thanks are also extended to all the staff of theCartography and Remote Sensing Departments of the RegionalCentre for Mapping of Resources for Development for theirtireless dedication to the project to ensure its timely andsuccessful completion.
REFERENCES
Amuyunzu, C.L. and Bouke C. Bijl, 1999. Integration of RemoteSensing and GIS for Management Decision Support in ProtectedAreas: Evaluating and Monitoring of Wildlife Habitats. In:Geoinformation Technology Applications for Resource andEnvironmental Management in Africa, P.O. Adeniyi (ed.),African Association of Remote Sensing and Environment(AARSE), pp. 113 – 121.
Civco, D.L. and J. D. Hurd, 1991. Multitemporal, MultisourceLand Cover Mapping for the State of Connecticut. Proc. of the1991 Fall Meeting of the American Society for Photogrammetryand Remote Sensing, Atlanta, GA, pp. B141-B151.
Figure 3. Updated national road network map overlaid on mosaiced SPOT satellite images of the Kingdom ofSwaziland