Embed Size (px)
Citation preview
ECOTECExhaustive analysis of employment trends in all sectors related to sea or using sea resources
Main report
An exhaustive analysis ofemployment trends in all sectorsrelated to sea or using sea resourcesFinal report for the European Commission, DGFisheries and Maritime Affairs
C3135 / September 2006
ECOTEC Research & ConsultingDr. Tina Weber and Anne-Mari Nevala
Priestley House12-26 Albert StreetBirminghamB4 7UDUnited Kingdom
T +44 (0)121 616 3600F +44 (0)121 616 3699
www.ecotec.com
CONTENTS PAGE
1.0 INTRODUCTION ............................. ................................ ........................ 11.1 Study sectors................................ .............................................................2
2.0 EUROPEAN OVERVIEW – CURRENT LEVEL OF EMPLOYMENT....... 4
3.0 SHIPBUILDING............................. ................................ ........................ 123.1 Economic impact................................ .....................................................123.2 Employment trends ................................................................ .................173.3 Factors affecting employment................................ ................................243.4 Employment forecast ................................................................ ..............263.5 Skill needs and labour availability .........................................................28
4.0 MARINE EQUIPMENT ............................. ................................ ............. 314.1 Economic impact................................ .....................................................314.2 Availability of employment data................................ .............................334.3 Employment trends ................................................................ .................344.4 Employment forecast ................................................................ ..............364.5 Skills and training................................................................ ....................37
5.0 SEAPORTS AND RELATED SERVICES ............................. ................ 395.1 Economic impact................................ .....................................................395.2 Availability of employment data................................ .............................395.3 Employment trends ................................................................ .................405.4 Employment forecast ................................................................ ..............445.5 Skill needs and labour availability .........................................................46
6.0 RECREATIONAL BOATING............................. ................................ .... 486.1 Economic impact................................ .....................................................486.2 Availability of employment data................................ .............................506.3 Employment trends ................................................................ .................526.4 Employment forecast ................................................................ ..............556.5 Skills and Training................................ ...................................................57
7.0 SHIPPING ............................. ................................ ................................ 587.1 Economic impact................................ .....................................................58
7.2 Availability of employment data................................ .............................597.3 Employment trends ................................................................ .................597.4 Factors affecting employment................................ ................................677.5 Employment forecast ................................................................ ..............71
8.0 OFFSHORE OIL AND GAS EXTRACTION ............................. ............. 758.1 Economic impact................................ .....................................................758.2 Availability of employment data................................ .............................768.3 Employment trends ................................................................ .................768.4 Employment projections................................................................ .........78
9.0 MARITIME SERVICES............................. ................................ ............. 799.1 Economic impact................................ .....................................................799.2 Data availability ................................................................ .......................809.3 Employment trends ................................................................ .................809.4 Employment forecast ................................................................ ..............82
10.0 MARITIME WORKS ............................. ................................ ................. 8410.1 Economic impact................................ .....................................................8410.2 Availability of employment data................................ .............................8510.3 Employment trends ................................................................ .................8510.4 Factors affecting employment................................ ................................8710.5 Employment forecast ................................................................ ..............88
11.0 OFFSHORE AND COASTAL WIND ENERGY ............................. ........ 9011.1 Economic impact................................ .....................................................9111.2 Employment trends ................................................................ .................9211.3 Employment projections................................................................ .........9611.4 Skills and training................................................................ ....................97
12.0 MARINE AGGREGATES ............................. ................................ ......... 98
13.0 COASTAL TOURISM............................. ................................ ............... 9913.1 Economic impact................................ .....................................................9913.2 Data availability and reliability ................................ .............................10013.3 Employment trends ................................................................ ...............10213.4 Factors affecting employment................................ ..............................10513.5 Employment projections................................................................ .......106
13.6 Cruise tourism ................................ .......................................................108
14.0 NAVY ............................. ................................ ................................ ..... 110
15.0 FISHERIES ............................. ................................ ............................ 11215.1 Current levels of employment ................................ ..............................11215.2 Employment trends and factors affecting employment .....................114
16.0 SECTORAL POLICY RECOMMENDATIONS............................. ........ 11616.1 Shipbuilding................................................................ ...........................11616.2 Marine equipment................................................................ ..................11916.3 Seaports and related services................................ ..............................12116.4 Recreational boating ................................................................ .............12916.5 Shipping ................................ ................................................................ .13116.6 Offshore oil and gas extraction............................................................ 14516.7 Maritime works ................................ ...................................................... 14516.8 Offshore and coastal wind energy .......................................................14616.9 Coastal tourism ................................................................ .....................150
17.0 FUTURE GROWTH POTENTIAL AND RELEVANT POLICY ACTION153
18.0 CONCLUSIONS ............................. ................................ ..................... 159
ECOTECExhaustive analysis of employment trends in all sectors related to sea or using sea resources
1
1.0 Introduction
Within the context of the growing number of economic and recreational sea relatedactivities, the sea has increasingly become the subject of political debate and a need hasbeen identified for a more holistic view on maritime affairs. Indeed, the new Europeanmaritime policy aims to develop an integrated approach to maritime activities that benefitsEuropeans, notably by creating economic growth and more and better jobs for EU citizensin a sustainable way I.
The development of maritime policy requires a number of key issues to be addressed,including an understanding of the employment impact and trends of activities related to thesea or using sea resources. For example, in the past the economic and employmentimpact of activities related to the sea have been underestimated because of the rathernarrow definition of the maritime cluster (including mainly activities related to shipping,ports and shipbuilding). The maritime cluster concept has not traditionally comprisedactivities such as coastal tourism, cruise tourism, offshore and coastal wind energy – all ofwhich are strong growth sectors in Europe. Furthermore, an effective implementation ofEuropean policies in the maritime field requires an assessment of the policies aimed atboosting sea related employment.
This study was commissioned to provide a better and more holistic picture aboutemployment and employment trends in the maritime sectors at European and nationallevels. The study also aims to identify potentials for growth and increased employment inthese sectors, and the type of policy action necessary to realise that potential. To be morespecific, the following have been the key objectives for the research II:
Analysis of current employment trendsAn overview is to be provided of existing data and analysis that provide indications of theemployment trends in economic sectors related to the sea or using sea resources withinthe European Union. Trends should include as far as possible current levels ofemployment and percentage changes over the past decade for the European Union as awhole and for each Member State. The overview should also point to existing frictions onthe labour market.
The overview should also include, to the extent possible, a forecast for the coming tenyears, based on identified sectoral projections and trend analysis as well as interviews ofeconomic actors. The study should point to areas of activity with important information
I European Commission, DG Fisheries and Maritime Affairs.II As outlined in the Terms of Reference FISH/2005/31
ECOTECExhaustive analysis of employment trends in all sectors related to sea or using sea resources
2
gaps that need to be filled to allow well-founded policy decisions. It should indicate thoseareas of activity where further data collection and analysis would be necessary or wheremethods for data collection in these areas would need to be refined.
Identification of potentials for growthThe study should provide an assessment of the strengths and weaknesses of the activitiesrelated to the sea or that use sea resources in the European Union, compared to othermajor OECD countries. Based on this, the study should point to opportunities and threatsfor the economic activities covered, hereby focusing on their effects on employment.
Possible policy actionsRecommendations should be formulated as to the areas where public intervention canplay a substantial role in facilitating the exploitation of opportunities or in taking action tocounter threats which can have a positive effect on sustainable job creation. For each ofthese areas, the study should recommend types of policy action that could be envisaged.Hereby examples of good policy practice should be used to illustrate possible actions. Adistinction is to be made for policy actions at EU, national and regional level.
This study links with the drafting and discussion of the 2006 Green Paper on MaritimePolicy I.
1.1 Study sectors
The scope of this research has been to assemble and analyse existing data from previousstudies rather than to gather primary dataII. A previous study on a number of maritimesectors conducted by Policy Research Corporation produced a classification of themaritime sector, which this study aimed to followIII.
At the same time, this study also aimed at analysing employment created by other searelated sectors, such as coastal tourism, the navy, renewable energy and offshore oil andgas extraction.
The study did not examine employment related to fisheries or seafood processing as aseparate studyIV requested by the European Commission was already underway. A
I COM (2006) 275 final “Towards a future maritime policy for the European Union: A European vision for the oceans andseas”II Although in some sectors where data was missing altogether, primary data was gathered through interviews with keystakeholders, which cannot however be always regarded as comparable or representative, but aims to give an indicationof sector size and broad trends.III This study excludes inland navigation.IV This study uses findings from a study by LEI BV and Framian BV (2006) Employment in the fisheries sector: currentsituation (FISH/2004/4) – this is one of the several European level studies looking at fisheries related employment.
ECOTECExhaustive analysis of employment trends in all sectors related to sea or using sea resources
3
summary of these study findings has been included in this overall report, with a view toprovide a comprehensive insight into the employment situation in the maritime sectors inEurope.
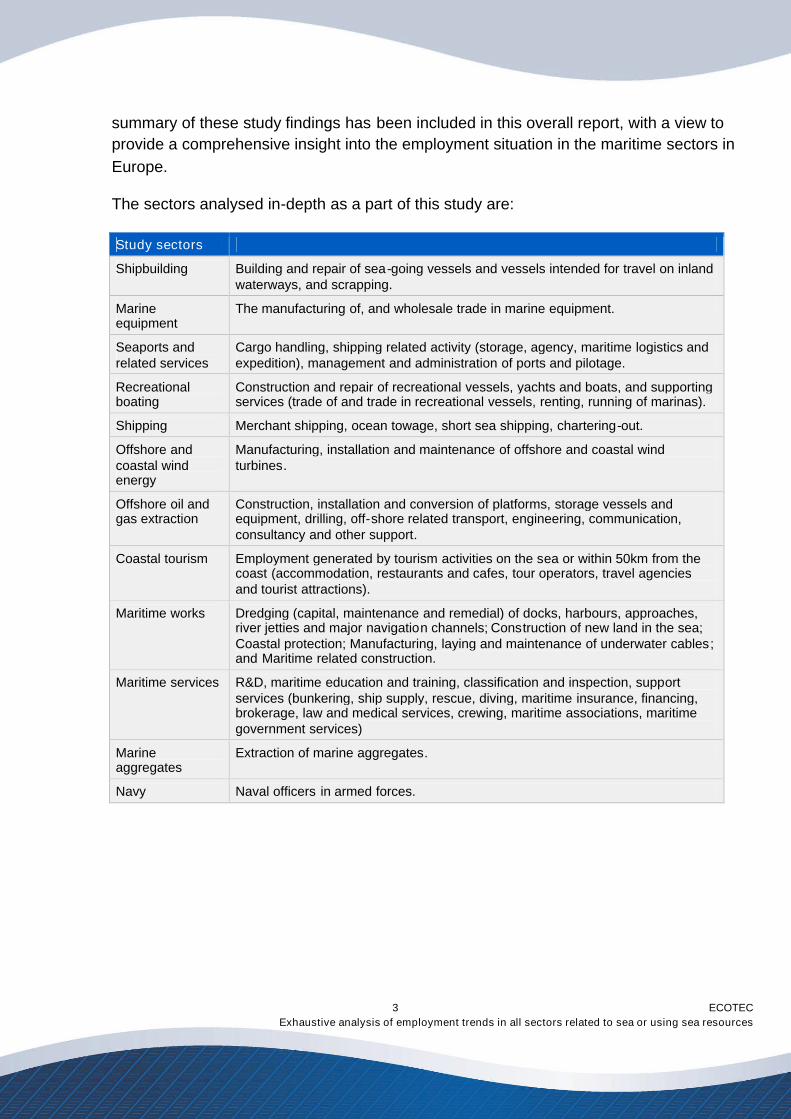
The sectors analysed in-depth as a part of this study are:
Study sectors
Shipbuilding Building and repair of sea-going vessels and vessels intended for travel on inlandwaterways, and scrapping.
Marineequipment
The manufacturing of, and wholesale trade in marine equipment.
Seaports andrelated services
Cargo handling, shipping related activity (storage, agency, maritime logistics andexpedition), management and administration of ports and pilotage.
Recreationalboating
Construction and repair of recreational vessels, yachts and boats, and supportingservices (trade of and trade in recreational vessels, renting, running of marinas).
Shipping Merchant shipping, ocean towage, short sea shipping, chartering-out.
Offshore andcoastal windenergy
Manufacturing, installation and maintenance of offshore and coastal windturbines.
Offshore oil andgas extraction
Construction, installation and conversion of platforms, storage vessels andequipment, drilling, off-shore related transport, engineering, communication,consultancy and other support.
Coastal tourism Employment generated by tourism activities on the sea or within 50km from thecoast (accommodation, restaurants and cafes, tour operators, travel agenciesand tourist attractions).
Maritime works Dredging (capital, maintenance and remedial) of docks, harbours, approaches,river jetties and major navigation channels; Construction of new land in the sea;Coastal protection; Manufacturing, laying and maintenance of underwater cables;and Maritime related construction.
Maritime services R&D, maritime education and training, classification and inspection, supportservices (bunkering, ship supply, rescue, diving, maritime insurance, financing,brokerage, law and medical services, crewing, maritime associations, maritimegovernment services)
Marineaggregates
Extraction of marine aggregates.
Navy Naval officers in armed forces.
ECOTECExhaustive analysis of employment trends in all sectors related to sea or using sea resources
4
2.0 European overview – current level of employment
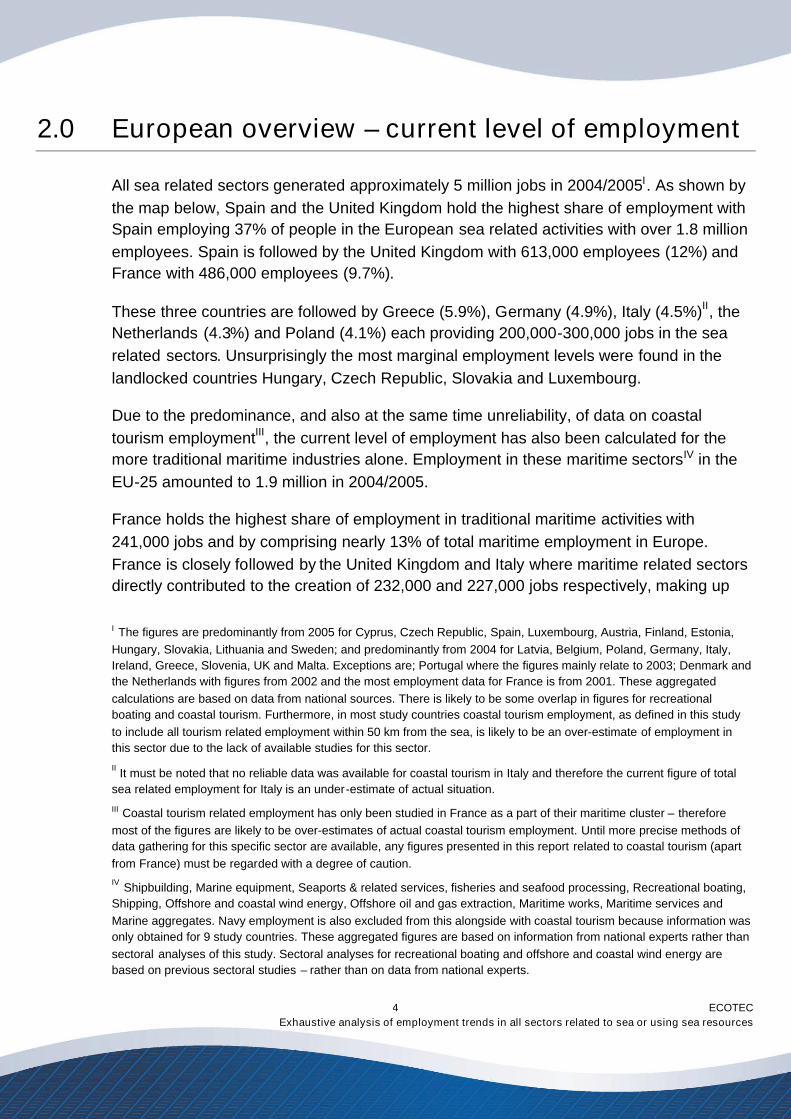
All sea related sectors generated approximately 5 million jobs in 2004/2005I. As shown bythe map below, Spain and the United Kingdom hold the highest share of employment withSpain employing 37% of people in the European sea related activities with over 1.8 millionemployees. Spain is followed by the United Kingdom with 613,000 employees (12%) andFrance with 486,000 employees (9.7%).
These three countries are followed by Greece (5.9%), Germany (4.9%), Italy (4.5%)II, theNetherlands (4.3%) and Poland (4.1%) each providing 200,000-300,000 jobs in the searelated sectors. Unsurprisingly the most marginal employment levels were found in thelandlocked countries Hungary, Czech Republic, Slovakia and Luxembourg.
Due to the predominance, and also at the same time unreliability, of data on coastaltourism employmentIII, the current level of employment has also been calculated for themore traditional maritime industries alone. Employment in these maritime sectorsIV in theEU-25 amounted to 1.9 million in 2004/2005.
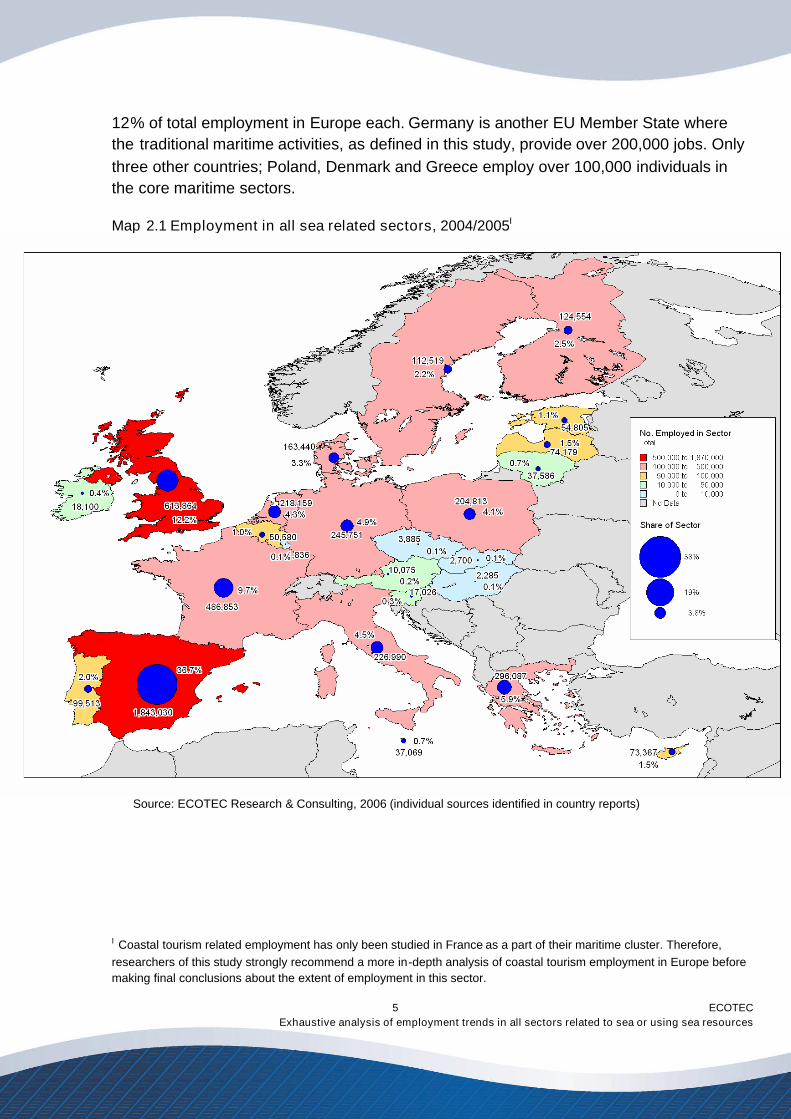
France holds the highest share of employment in traditional maritime activities with241,000 jobs and by comprising nearly 13% of total maritime employment in Europe.France is closely followed by the United Kingdom and Italy where maritime related sectorsdirectly contributed to the creation of 232,000 and 227,000 jobs respectively, making up
I The figures are predominantly from 2005 for Cyprus, Czech Republic, Spain, Luxembourg, Austria, Finland, Estonia,Hungary, Slovakia, Lithuania and Sweden; and predominantly from 2004 for Latvia, Belgium, Poland, Germany, Italy,Ireland, Greece, Slovenia, UK and Malta. Exceptions are; Portugal where the figures mainly relate to 2003; Denmark andthe Netherlands with figures from 2002 and the most employment data for France is from 2001. These aggregatedcalculations are based on data from national sources. There is likely to be some overlap in figures for recreationalboating and coastal tourism. Furthermore, in most study countries coastal tourism employment, as defined in this studyto include all tourism related employment within 50 km from the sea, is likely to be an over-estimate of employment inthis sector due to the lack of available studies for this sector.
II It must be noted that no reliable data was available for coastal tourism in Italy and therefore the current figure of totalsea related employment for Italy is an under-estimate of actual situation.
III Coastal tourism related employment has only been studied in France as a part of their maritime cluster – thereforemost of the figures are likely to be over-estimates of actual coastal tourism employment. Until more precise methods ofdata gathering for this specific sector are available, any figures presented in this report related to coastal tourism (apartfrom France) must be regarded with a degree of caution.IV Shipbuilding, Marine equipment, Seaports & related services, fisheries and seafood processing, Recreational boating,Shipping, Offshore and coastal wind energy, Offshore oil and gas extraction, Maritime works, Maritime services andMarine aggregates. Navy employment is also excluded from this alongside with coastal tourism because information wasonly obtained for 9 study countries. These aggregated figures are based on information from national experts rather thansectoral analyses of this study. Sectoral analyses for recreational boating and offshore and coastal wind energy arebased on previous sectoral studies – rather than on data from national experts.
ECOTECExhaustive analysis of employment trends in all sectors related to sea or using sea resources
5
12% of total employment in Europe each. Germany is another EU Member State wherethe traditional maritime activities, as defined in this study, provide over 200,000 jobs. Onlythree other countries; Poland, Denmark and Greece employ over 100,000 individuals inthe core maritime sectors.
Map 2.1 Employment in all sea related sectors, 2004/2005I
Source: ECOTEC Research & Consulting, 2006 (individual sources identified in country reports)
I Coastal tourism related employment has only been studied in France as a part of their maritime cluster. Therefore,researchers of this study strongly recommend a more in-depth analysis of coastal tourism employment in Europe beforemaking final conclusions about the extent of employment in this sector.
ECOTECExhaustive analysis of employment trends in all sectors related to sea or using sea resources
6
Map 2.2 Employment in traditional maritime sectors - EU-25, 2004/2005XII
Source: ECOTEC Research & Consulting, 2006 (individual sources identified in country reports)
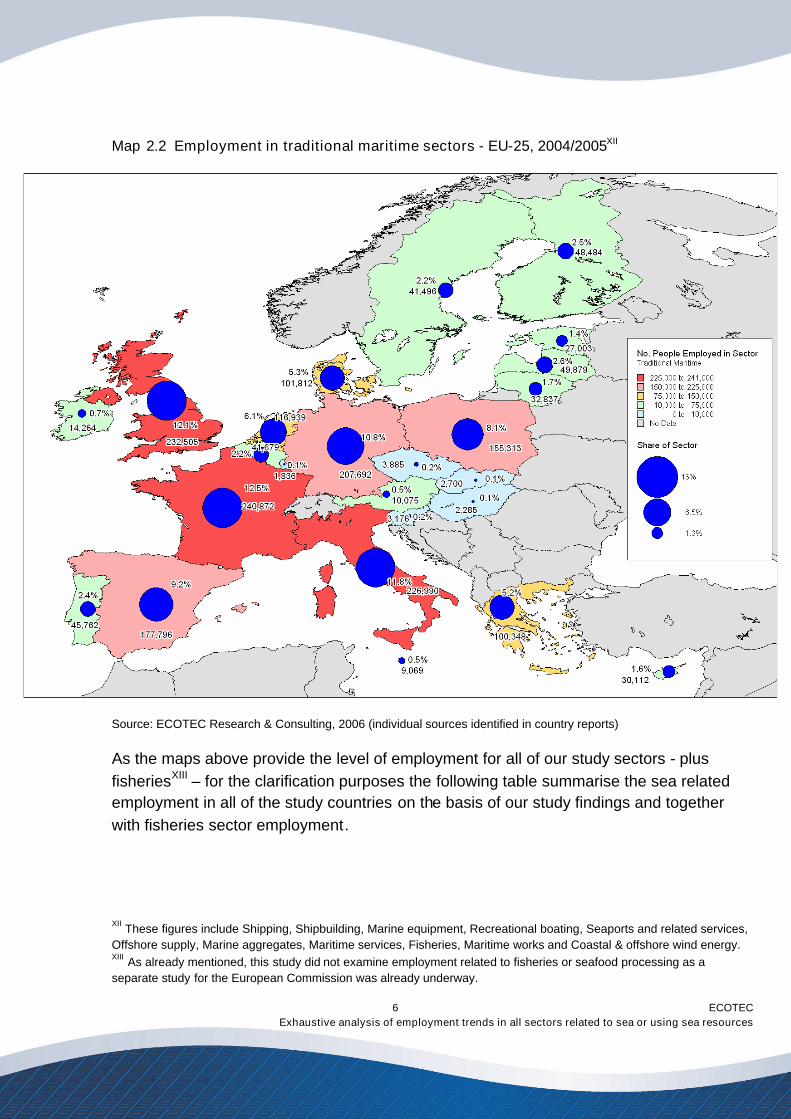
As the maps above provide the level of employment for all of our study sectors - plusfisheriesXIII – for the clarification purposes the following table summarise the sea relatedemployment in all of the study countries on the basis of our study findings and togetherwith fisheries sector employment.
XII These figures include Shipping, Shipbuilding, Marine equipment, Recreational boating, Seaports and related services,Offshore supply, Marine aggregates, Maritime services, Fisheries, Maritime works and Coastal & offshore wind energy.XIII As already mentioned, this study did not examine employment related to fisheries or seafood processing as aseparate study for the European Commission was already underway.
ECOTECExhaustive analysis of employment trends in all sectors related to sea or using sea resources
7
Our studyfindings (excludes
fisheries)
Our study findingswithout coastal
tourism and navy(excludes fisheries) FisheriesXIV
Total maritimeemployment (all study
sectors + fisheries)
Traditional maritimeemployment (includesfisheries but excludescoastal tourism and
navy)
AT 9,341 9,341 734 10,075 10,075
BE 48,837 39,936 1,743 50,580 41,679
CY 72,192 28,937 1,175 73,367 30,112
CZ 1,618 1,618 2,267 3,885 3,885
DK 149,380 87,752 14,060 163,440 101,812
EE 48,105 20,303 6,700 54,805 27,003
FI 121,814 45,744 2,740 124,554 48,484
FR 422,141 176,160 64,712 486,853 240,872
DE 229,342 191,283 16,409 24,5751 207,692
GR 258,386 62,647 37,701 296,087 100,348
HU 605 605 1,680 2,285 2,285
IE 7,516 3,680 10,584 18,100 14,264
IT 179,033 179,033 47,957 22,6990 226,990
LV 63,599 39,299 10,580 74,179 49,879
LT 31,021 26,272 6,565 37,586 32,837
LU 1,836 1,836 - 1,836 1,836
MT 35,628 7,628 1,441 37,069 9,069
NL 209,110 107,890 9,049 218,159 116,939
PL 184,890 135,390 19,923 204,813 155,313
PT 66,284 12,533 33,229 99,513 45,762
SK 1,520 1,520 1,180 2,700 2,700
SI 16,403 2,553 623 17,026 3,176
ES 1,755,720 90,486 87,310 1,843,030 177,796
SE 108,564 37,541 3,955 112,519 41,496
UK 580,330 198,971 33,534 613,864 232,505Source: ECOTEC Research & Consulting, 2006 (Please see individual country chapters for data sources)
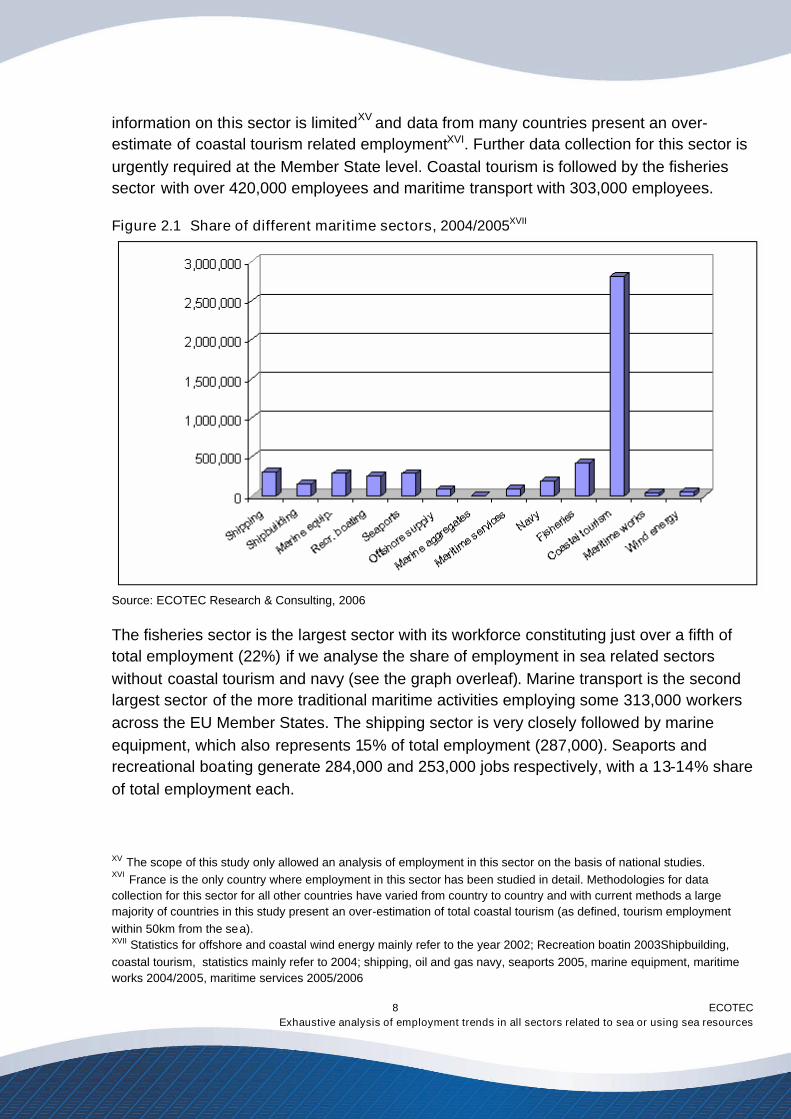
When analysing the share of different maritime sectors from total maritime relatedemployment, it is clear from the graph 2.1 below that coastal tourism is by far the largestsea related sector in the European Union. However, no final conclusions can be drawn onthe exact level of employment in the coastal tourism sector as the availability of accurate
XIV Fisheries related employment is taken from a study 'Employment in the fisheries sector: current situation' by LEI BVand Framian BV (2006).
ECOTECExhaustive analysis of employment trends in all sectors related to sea or using sea resources
8
information on this sector is limitedXV and data from many countries present an over-estimate of coastal tourism related employmentXVI. Further data collection for this sector isurgently required at the Member State level. Coastal tourism is followed by the fisheriessector with over 420,000 employees and maritime transport with 303,000 employees.
Figure 2.1 Share of different maritime sectors, 2004/2005XVII
Source: ECOTEC Research & Consulting, 2006
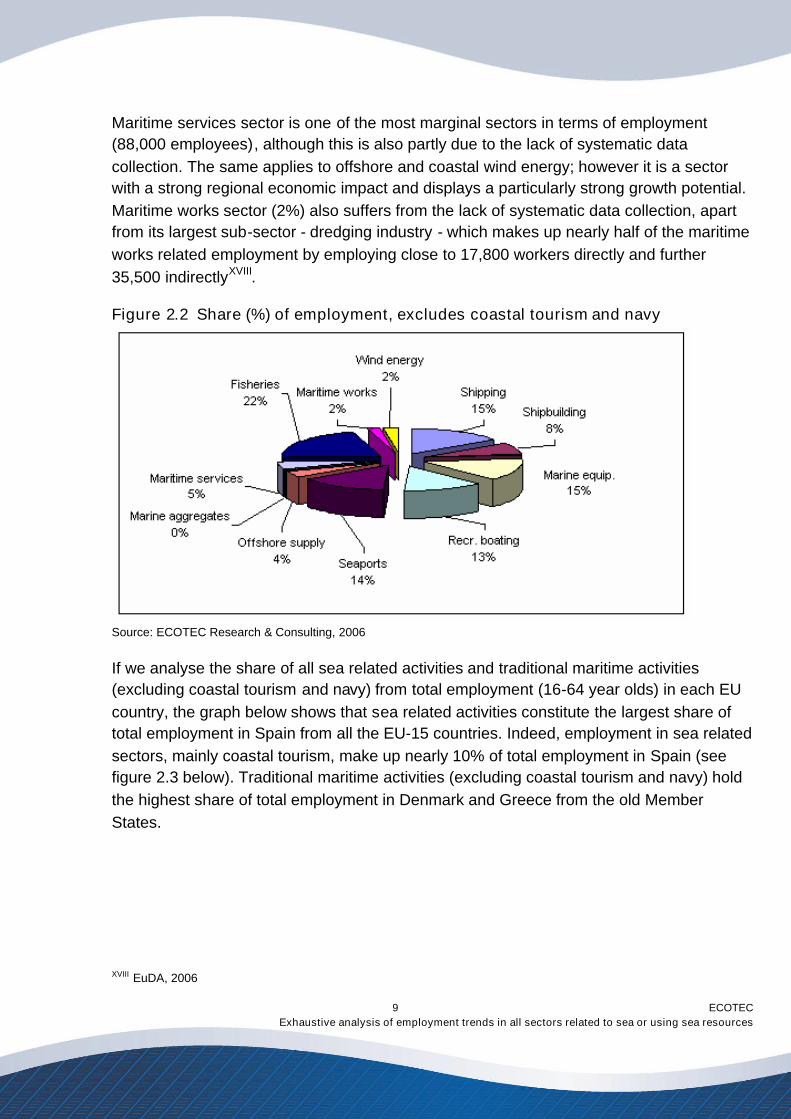
The fisheries sector is the largest sector with its workforce constituting just over a fifth oftotal employment (22%) if we analyse the share of employment in sea related sectorswithout coastal tourism and navy (see the graph overleaf). Marine transport is the secondlargest sector of the more traditional maritime activities employing some 313,000 workersacross the EU Member States. The shipping sector is very closely followed by marineequipment, which also represents 15% of total employment (287,000). Seaports andrecreational boating generate 284,000 and 253,000 jobs respectively, with a 13-14% shareof total employment each.
XV The scope of this study only allowed an analysis of employment in this sector on the basis of national studies.XVI France is the only country where employment in this sector has been studied in detail. Methodologies for datacollection for this sector for all other countries have varied from country to country and with current methods a largemajority of countries in this study present an over-estimation of total coastal tourism (as defined, tourism employmentwithin 50km from the sea).XVII Statistics for offshore and coastal wind energy mainly refer to the year 2002; Recreation boatin 2003Shipbuilding,coastal tourism, statistics mainly refer to 2004; shipping, oil and gas navy, seaports 2005, marine equipment, maritimeworks 2004/2005, maritime services 2005/2006
ECOTECExhaustive analysis of employment trends in all sectors related to sea or using sea resources
9
Maritime services sector is one of the most marginal sectors in terms of employment(88,000 employees), although this is also partly due to the lack of systematic datacollection. The same applies to offshore and coastal wind energy; however it is a sectorwith a strong regional economic impact and displays a particularly strong growth potential.Maritime works sector (2%) also suffers from the lack of systematic data collection, apartfrom its largest sub-sector - dredging industry - which makes up nearly half of the maritimeworks related employment by employing close to 17,800 workers directly and further35,500 indirectlyXVIII.
Figure 2.2 Share (%) of employment, excludes coastal tourism and navy
Source: ECOTEC Research & Consulting, 2006
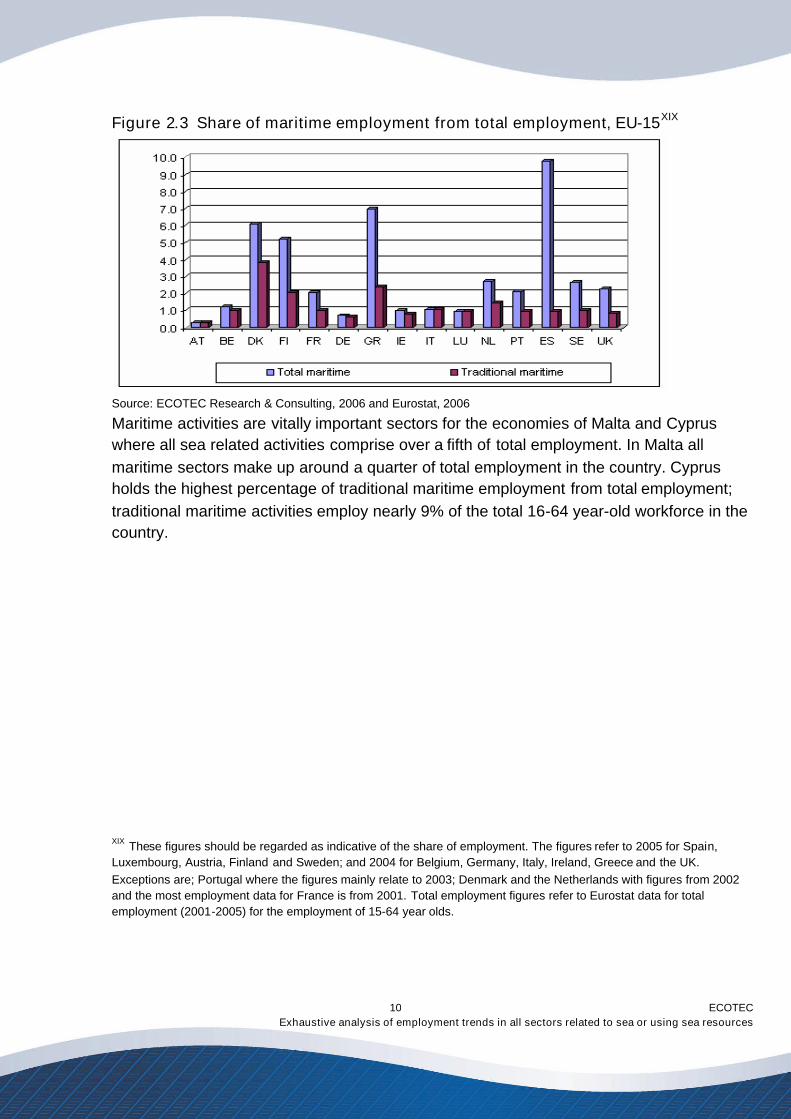
If we analyse the share of all sea related activities and traditional maritime activities(excluding coastal tourism and navy) from total employment (16-64 year olds) in each EUcountry, the graph below shows that sea related activities constitute the largest share oftotal employment in Spain from all the EU-15 countries. Indeed, employment in sea relatedsectors, mainly coastal tourism, make up nearly 10% of total employment in Spain (seefigure 2.3 below). Traditional maritime activities (excluding coastal tourism and navy) holdthe highest share of total employment in Denmark and Greece from the old MemberStates.
XVIII EuDA, 2006
ECOTECExhaustive analysis of employment trends in all sectors related to sea or using sea resources
10
Figure 2.3 Share of maritime employment from total employment, EU-15XIX
Source: ECOTEC Research & Consulting, 2006 and Eurostat, 2006
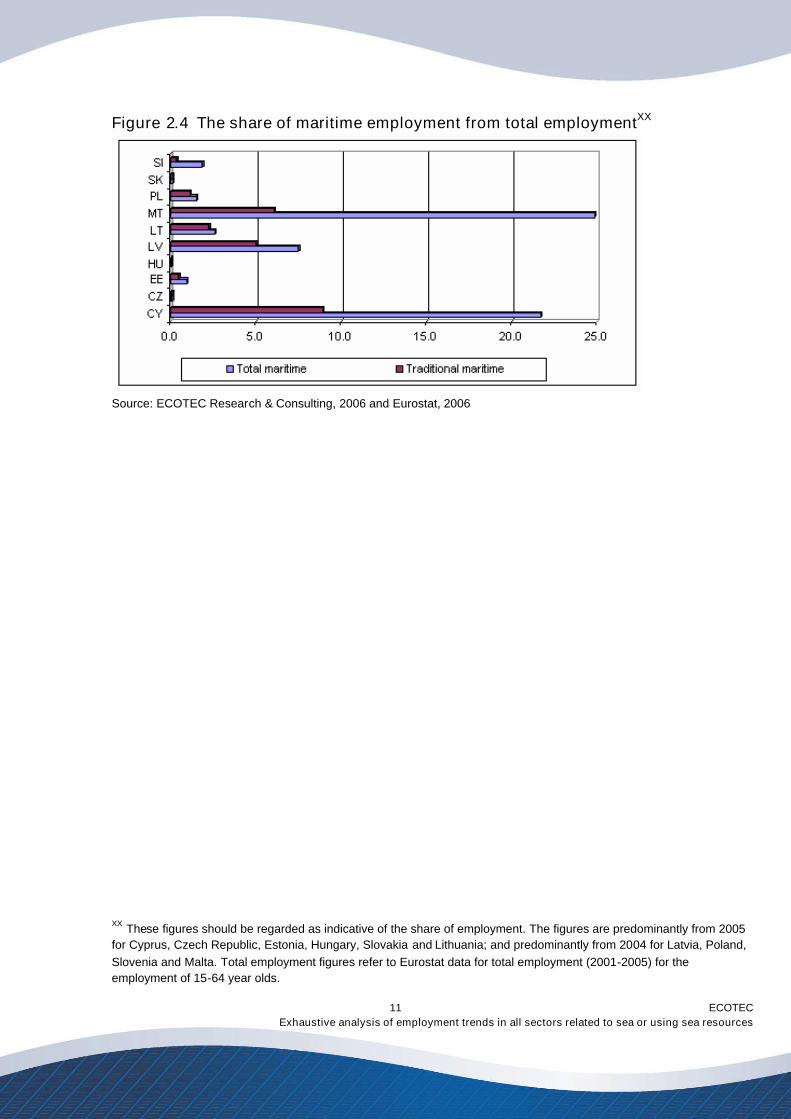
Maritime activities are vitally important sectors for the economies of Malta and Cypruswhere all sea related activities comprise over a fifth of total employment. In Malta allmaritime sectors make up around a quarter of total employment in the country. Cyprusholds the highest percentage of traditional maritime employment from total employment;traditional maritime activities employ nearly 9% of the total 16-64 year-old workforce in thecountry.
XIX These figures should be regarded as indicative of the share of employment. The figures refer to 2005 for Spain,Luxembourg, Austria, Finland and Sweden; and 2004 for Belgium, Germany, Italy, Ireland, Greece and the UK.Exceptions are; Portugal where the figures mainly relate to 2003; Denmark and the Netherlands with figures from 2002and the most employment data for France is from 2001. Total employment figures refer to Eurostat data for totalemployment (2001-2005) for the employment of 15-64 year olds.
ECOTECExhaustive analysis of employment trends in all sectors related to sea or using sea resources
11
Figure 2.4 The share of maritime employment from total employmentXX
Source: ECOTEC Research & Consulting, 2006 and Eurostat, 2006
XX These figures should be regarded as indicative of the share of employment. The figures are predominantly from 2005for Cyprus, Czech Republic, Estonia, Hungary, Slovakia and Lithuania; and predominantly from 2004 for Latvia, Poland,Slovenia and Malta. Total employment figures refer to Eurostat data for total employment (2001-2005) for theemployment of 15-64 year olds.
ECOTECExhaustive analysis of employment trends in all sectors related to sea or using sea resources
12
3.0 Shipbuilding
The European shipbuilding industry has gone through a period of significant transformationover the last 25 years. This has been induced by research and technologicaladvancement, increases in global competition, and political and economic changes inmany of the countries of the enlarged European Union. In global terms, taking togethercivil and naval shipbuilding, repair and conversion as well as its suppliers, the shipbuildingsector constitutes the third largest growth market in the global maritime cluster between2005 and 2010, according to a 2005 study by Douglas WestwoodI. Its performance is onlysurpassed by projected increases in shipping and coastal tourism.
These positive projections however have to be seen in the European context and against abackground of a significant decline in shipbuilding employment, which reduced Europe-wide employment in the sector from 461,988 in 1975 to 116,696 in 2004II and significantuncertainty and overcapacity in the world markets. The latter is particularly due to thestrong entry into the market of competitors from Asia, with China and Korea in particularmore than doubling their capacity over the last 10 years.
Historically, the shipbuilding sector has enjoyed a strong political position due to highlevels of employment and the strategic importance of the sector related to its strategic rolein maintaining many countries defence capacityIII. Also, the shipyards provide employmentfor various subcontractors and module makers. It also acts as an important economicmultiplier with spin-offs into other ancillary sectors.
This chapter sets out economic trends in the sector, pointing out the strengths,weaknesses, opportunities and threats facing the European shipbuilding industry. It will goon to illustrate employment trends and future employment projections, paying particularattentions to the changes in employment profiles and skills requirements.
3.1 Economic impact
According to the Community of European Shipyards Associations (CESA), the Europeanshipbuilding industry today produces an annual turnover of €10 billion turnover for newbuilds, naval shipbuilding and ship repair IV. Other sources estimate the value of the sector
I Douglas Westwood for University of Kiel; World Marine Markets, 2005II The figures are based on employment in CESA member yards.III Marine equipment. New insights into a lucrative market sector, Drewry Shipping Consultants, August 2002.IV LeaderSHIP 2015 Factsheet: however, it must be noted that CESA data rarely includes military shipyards.
ECOTECExhaustive analysis of employment trends in all sectors related to sea or using sea resources
13
sector at €13 billion in 2004I. Approximately 300 shipyards constitute the core of theindustry and more than 9,000 companies represent its large network of suppliers. Thelargest European shipbuilding nation in terms of output is Germany (fourth position in theworld with 3.4% of the global market share), followed by Poland (fifth position in the worldwith 2.3% of the global market share in 2004II). Other countries where the sector issignificant in European and global terms are Italy and the Netherlands; they made up €2billion and 2% of the global market share in 2004III.
Over the last 10 years there has been a constant increase in global shipbuilding capacityIV.At present, European shipyards account for 20% of this capacity, which despite presentlyrelatively healthy order books, is rarely used to its full potential. At the end of 2003,European shipyards were able to fill only 60% of their total capacity but in 2006 EU yardshave been utilised nearly to their full capacityV.
Many of the Asian yards operate at full capacity. This trend demonstrates the increasingcompetition with the Asian countriesVI. Starting in the early 1990s, South Korea began theprocess of expanding its shipbuilding capacity with the aim of becoming a world leader inthis sector. With the benefit of significant state investment, South Korea’s shipbuildingcapacity has tripled in that period. Industry analysts maintain that this, together with theexpansion of the shipbuilding sector in China, have significantly contributed to globalovercapacity and a destructive “price war” in the international shipbuilding marketVII. Morerecently the devaluation of the Korean currency has given Korean yards additionalcompetitive advantageVIII. Question marks have repeatedly been raised by the WTOregarding distortions in competition caused by what are considered to be direct andindirect subsidies provided by the national government to South Korean shipyards.However, so far, such actions have been unsuccessful.
The question of global competition rules and the provision of financial assistance to theindustry, as well as the award of large naval contracts are highly significant for this sector.Despite being faced with global competition and external factors affecting the industry,such as fuel prices or currency exchange rates, it is argued that this has not translated intoglobally applicable trade rules on subsidies and anti-dumping measuresIX. In its report and
I Marine industries global market analysis, p.109II CESA Annual Report 2004-2005, data for Poland, p.60-61III VNSI Annual Report 2004IV Global shipbuilding requirement and capacity, CESA FactsheetV DG Tren, 2006VI Maritime economy. Statistic review, Maritime Institute Gdansk, Gdansk 2004, p.143VII CESA, LeaderSHIP reportVIII European Parliament Factsheets, Factsheet No 4.7.3. Shipbuilding, 13.09.2004IX LeaderSHIP 2015, Defining the future of the European shipbuilding and ship repair industry, European Commission,2003
ECOTECExhaustive analysis of employment trends in all sectors related to sea or using sea resources
14
recommendations, the high level group on the future of the shipbuilding sector argued thatthis lack of effective regulatory environment at has impeded the development andfunctioning of the industry and poses particular threat to the European industry. Subsidiesavailable in certain countries, but not in others are seen to distort prices in the sector andtherefore force the shipyards to compete with each other at low costs. Since Europeanshipyards are not well placed to compete on price, they increasingly suffer reductions incapacity, output and, consequently, employmentI.
CESA has analysed future requirements in worldwide shipbuilding capacity. Theorganisation expects global capacity to grow to 31.2 million CGT by 2010. Seen againstthe background of the OECD’s assessment of an annual requirement of 22.8 million CGTin new build vessels, it can be assumed that for the foreseeable future, shipbuildingcapacity will outstrip demand by approximately 30% leading to a further wave of globalcompetition, which could have a detrimental impact on European shipyardsII. This resultsin a paradoxical situation in which there is a high demand for ships but the prices aredecreasing. This consequently can lead to enormous financial difficulties for EuropeanshipyardsIII.
Following a particularly lean period, in 2003 and 2004 some large shipyards were forced toclose with substantial job losses. In addition, some countries were forced to redefine theirinvolvement in shipbuilding in general (such as Sweden)IV. Experiences from Latviaillustrate the process of restructuring, where most of the shipyards were focused on navalconstruction and repair under COMECON. After the fall of the Soviet Union, the customerbase has expanded and now includes Scandinavian countries. Also, the focus of theshipyard construction has shifted towards merchant vessels.
Industry representatives argue that without significant state intervention from national orEuropean policy makers, it is unlikely that the situation of decline will change in the yearsto come. As a result, a high level expert group consisting of Commission, national andindustry representatives, was established in the early 2000s to assess the situation and tomake policy recommendations.
The key strengths of the European shipbuilding industry compared with its Asiancounterparts lie in its strong tradition, highly skilled workforce and labour productivity, aswell as the high level of investment in R&D and resulting high specialisation of production.
I CESA Annual Report, 2004-2005, p.15II See for example: Maritime Economy. Statistic review, 2004, Maritime Institute, Gdansk 2004III The Future of the Maritime Industry in Europe. The sea is the Future, EMF Executive Committee, 7-8th June 2005,Luxembourg, p.3IV Ibidem, p.3
ECOTECExhaustive analysis of employment trends in all sectors related to sea or using sea resources
15
The following table below sets out the key strengths, weaknesses, opportunities andthreats facing the European shipbuilding industry – and some of these are also discussedbelow in more detail.
Figure 3.1 SWOT analysis
Strengths Weaknesses Opportunities Threats
High RDI content Lack of globallyapplicable trade rules
Increased seabornetrade and increaseddemand for ships
Unfair competition fromAsian countries
High specialisation ofproduction
Ageing workforce anddifficulties withreplacement
Increased demand forspecialised vessels
Unattractive image ofthe industry
High labour productivity Increasing skill andlabour shortages
Innovations due toinvestment in R&D
Infringements ofintellectual propertyrights
Skilled workforce Incomplete filling of theshipyards' capacity
Expansion of short seashipping
Low prices of ships dueto global overcapacity
Strong shipbuildingtradition
Inability to compete onprice
Source: ECOTEC, 2006
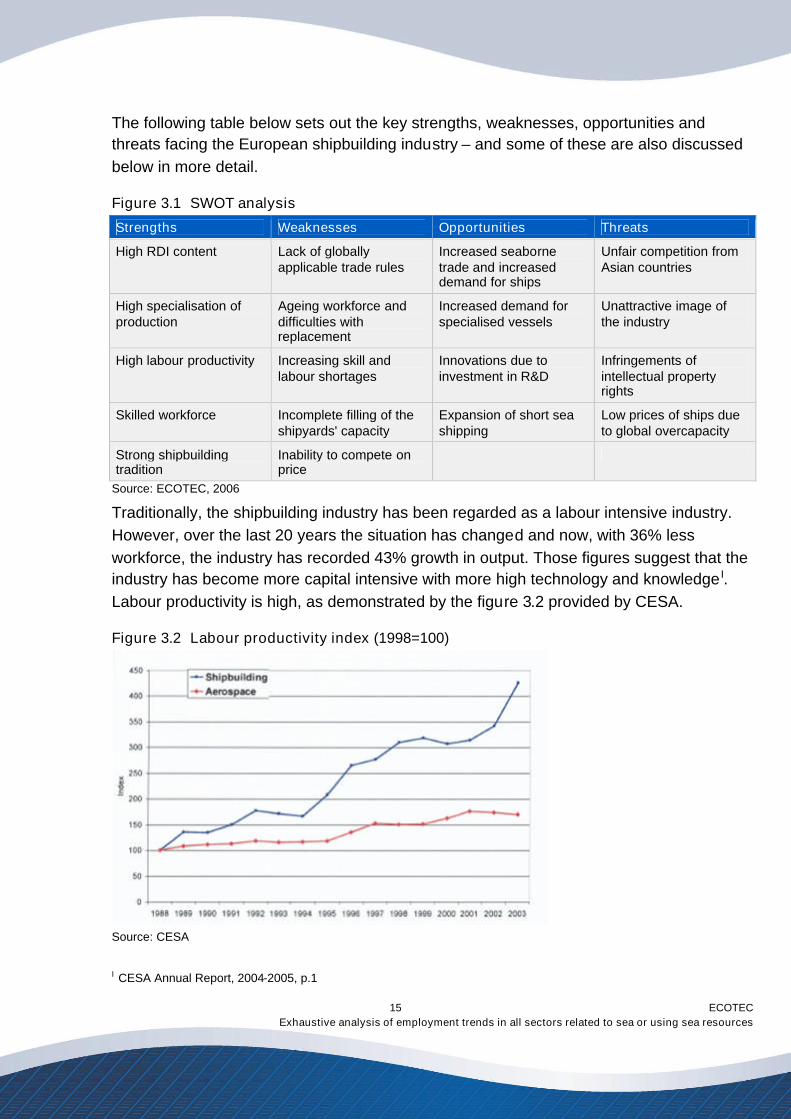
Traditionally, the shipbuilding industry has been regarded as a labour intensive industry.However, over the last 20 years the situation has changed and now, with 36% lessworkforce, the industry has recorded 43% growth in output. Those figures suggest that theindustry has become more capital intensive with more high technology and knowledge I.Labour productivity is high, as demonstrated by the figure 3.2 provided by CESA.
Figure 3.2 Labour productivity index (1998=100)
Source: CESA
I CESA Annual Report, 2004-2005, p.1
ECOTECExhaustive analysis of employment trends in all sectors related to sea or using sea resources
16
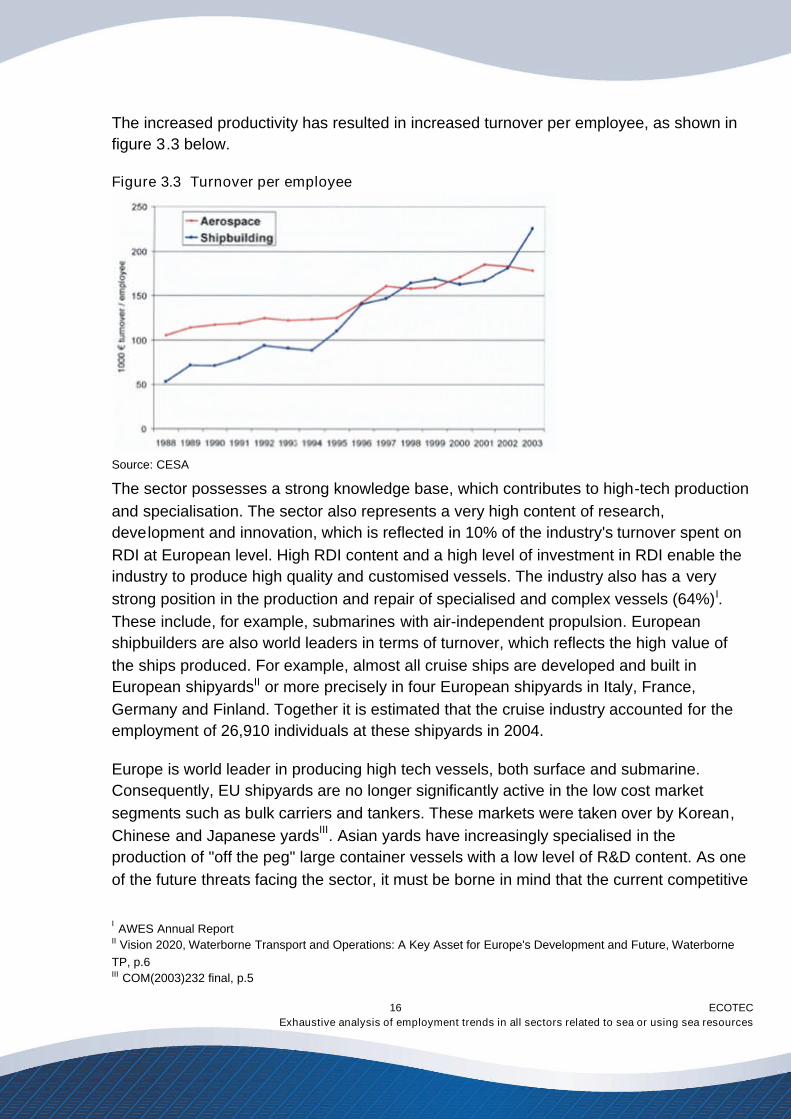
The increased productivity has resulted in increased turnover per employee, as shown infigure 3.3 below.
Figure 3.3 Turnover per employee
Source: CESA
The sector possesses a strong knowledge base, which contributes to high-tech productionand specialisation. The sector also represents a very high content of research,development and innovation, which is reflected in 10% of the industry's turnover spent onRDI at European level. High RDI content and a high level of investment in RDI enable theindustry to produce high quality and customised vessels. The industry also has a verystrong position in the production and repair of specialised and complex vessels (64%)I.These include, for example, submarines with air-independent propulsion. Europeanshipbuilders are also world leaders in terms of turnover, which reflects the high value ofthe ships produced. For example, almost all cruise ships are developed and built inEuropean shipyardsII or more precisely in four European shipyards in Italy, France,Germany and Finland. Together it is estimated that the cruise industry accounted for theemployment of 26,910 individuals at these shipyards in 2004.
Europe is world leader in producing high tech vessels, both surface and submarine.Consequently, EU shipyards are no longer significantly active in the low cost marketsegments such as bulk carriers and tankers. These markets were taken over by Korean,Chinese and Japanese yardsIII. Asian yards have increasingly specialised in theproduction of "off the peg" large container vessels with a low level of R&D content. As oneof the future threats facing the sector, it must be borne in mind that the current competitive
I AWES Annual ReportII Vision 2020, Waterborne Transport and Operations: A Key Asset for Europe's Development and Future, WaterborneTP, p.6III COM(2003)232 final, p.5
ECOTECExhaustive analysis of employment trends in all sectors related to sea or using sea resources
17
advantage in producing high value added ships may change as the Asian competitors arealso likely to develop this area of expertise.
3.2 Employment trends
The analysis of employment trends for the shipbuilding sector is somewhat complicated bythe availability of different data sources which are sometimes inconsistent with oneanother. Gathering a full picture of employment is further complicated by the fact that thesector is characterised by increasingly high levels of outsourcing, thus leading to higherlevels of employment in the marine equipment sector; the sector has moved towardsgreater specialisation requiring skills that are not necessarily held in-house.
As a result, there are concerns over what really constitutes indirect employment in theshipbuilding sector and what is considered as employment in the marine equipment sector.In many EU Member States indirect employment in the shipbuilding sector is todayregarded as employment in the marine equipment sector and only a fraction of countrieshave conducted detailed studies on indirect effects of the shipbuilding sector. Thus thefocus of this report lies in assessing and analysing the current levels of direct employmentand trends from the past decade.
According to the national studies (and complemented by CESA data) direct employment inthe shipbuilding sector in Europe stood at 153,000 persons in 2004I (see table 4.2). TheCESA member yards alone contributed to the creation of just under 85,000 jobs in thesame year. The difference is partly explained by the fact that CESA members do notinclude military yards, and also by the fact that they do not currently represent shipyardsfrom all the EU Member States (e.g. the Baltic States). Total figures also slightly differ fromthe findings of a study carried out by Tholen and Ludwig (2005) on European shipyardemployment which concluded that European shipyards generated 127,489 jobs in 2004.This difference can largely be explained by the methodological differences in data fromnational stakeholders and the approach of the Tholen and Ludwig study.
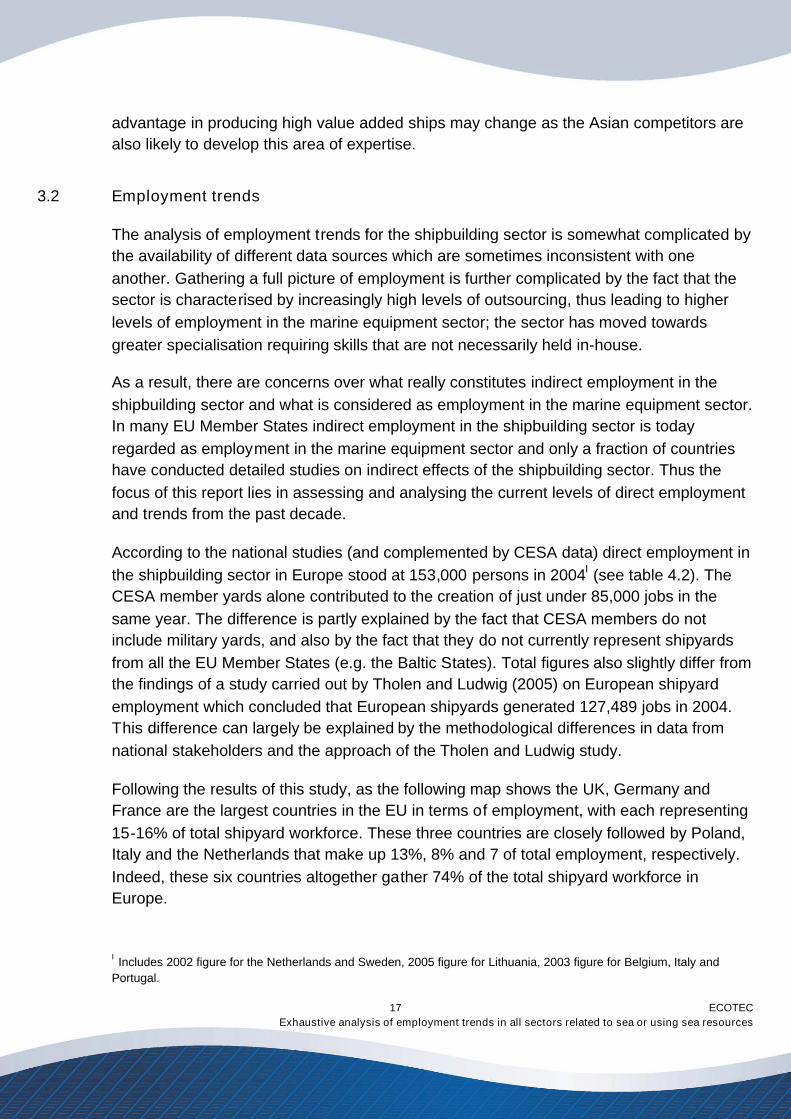
Following the results of this study, as the following map shows the UK, Germany andFrance are the largest countries in the EU in terms of employment, with each representing15-16% of total shipyard workforce. These three countries are closely followed by Poland,Italy and the Netherlands that make up 13%, 8% and 7 of total employment, respectively.Indeed, these six countries altogether gather 74% of the total shipyard workforce inEurope.
I Includes 2002 figure for the Netherlands and Sweden, 2005 figure for Lithuania, 2003 figure for Belgium, Italy andPortugal.
ECOTECExhaustive analysis of employment trends in all sectors related to sea or using sea resources
18
Map 3.1 Employments in the shipbuilding industry in EU-25, 2004I
Source: ECOTEC Research & Consulting, 2006 (individual sources identified in country reports)
The UK and France are home to 19% of the total workforce in the old-15 Member States,followed by Germany (18%), Italy (11%) and the Netherlands (9%). Countries like Spain,Portugal, Denmark and Finland each have a 4-5% market share of total employment in theEU-15.
I Figures for Austria and Czech Republic are based on a small LFS sample and therefore should be regarded asindicative of employment in this sector. Furthermore, the figures for these countries also include employment related tomanufacturing of recreational and river navigation vessels. Please note that figures for Spain vary from source to source;Gernaval has reported employment to stand at 5,419 whilst University Bremen study on shipbuilding industryemployment declares this figure to be 10,850 in 2005. This difference is likely to be caused by the restructuring of IZARgroup.
ECOTECExhaustive analysis of employment trends in all sectors related to sea or using sea resources
19
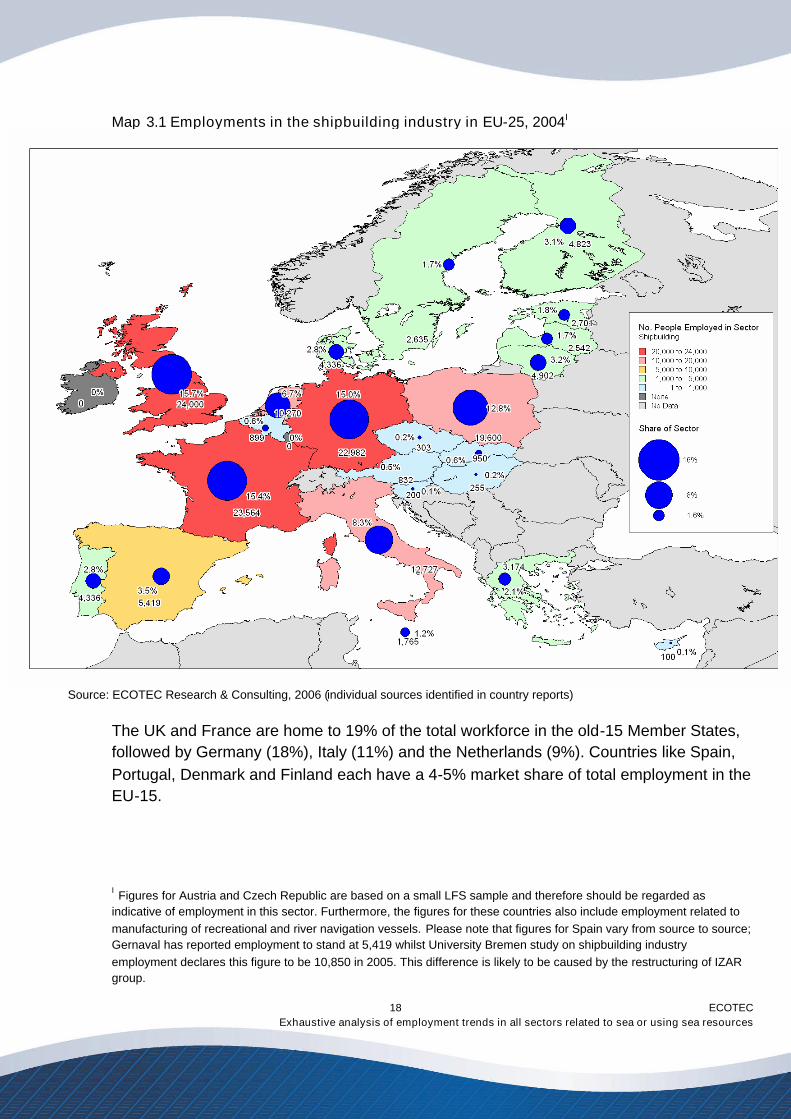
Figure 3.4 Share (%) of employment in the EU-15, 2004
Source: ECOTEC Research & Consulting, 2006
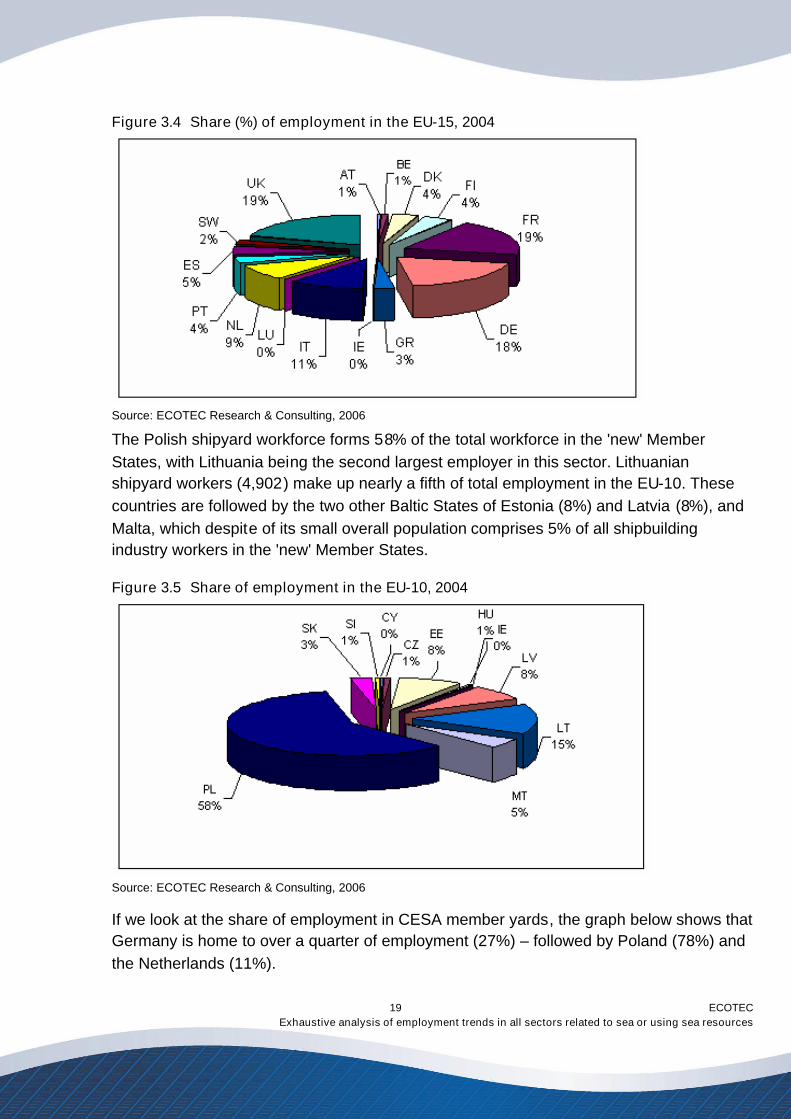
The Polish shipyard workforce forms 58% of the total workforce in the 'new' MemberStates, with Lithuania being the second largest employer in this sector. Lithuanianshipyard workers (4,902) make up nearly a fifth of total employment in the EU-10. Thesecountries are followed by the two other Baltic States of Estonia (8%) and Latvia (8%), andMalta, which despite of its small overall population comprises 5% of all shipbuildingindustry workers in the 'new' Member States.
Figure 3.5 Share of employment in the EU-10, 2004
Source: ECOTEC Research & Consulting, 2006
If we look at the share of employment in CESA member yards, the graph below shows thatGermany is home to over a quarter of employment (27%) – followed by Poland (78%) andthe Netherlands (11%).
ECOTECExhaustive analysis of employment trends in all sectors related to sea or using sea resources
20
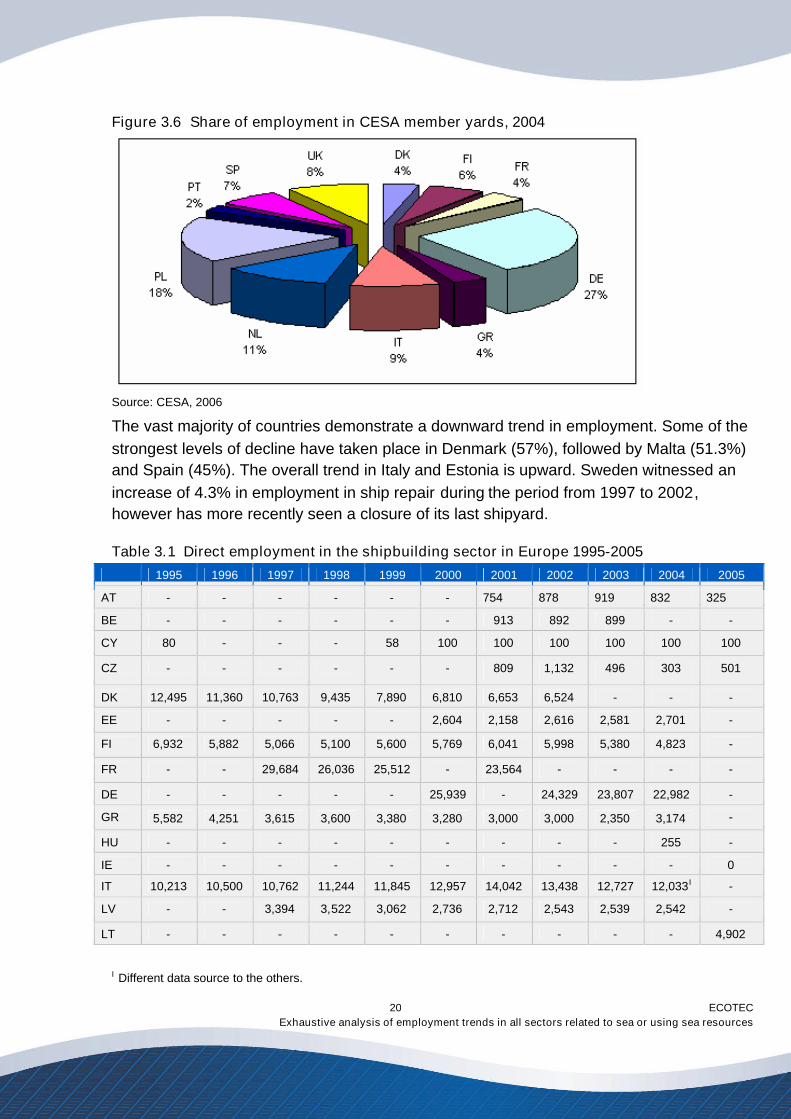
Figure 3.6 Share of employment in CESA member yards, 2004
Source: CESA, 2006
The vast majority of countries demonstrate a downward trend in employment. Some of thestrongest levels of decline have taken place in Denmark (57%), followed by Malta (51.3%)and Spain (45%). The overall trend in Italy and Estonia is upward. Sweden witnessed anincrease of 4.3% in employment in ship repair during the period from 1997 to 2002,however has more recently seen a closure of its last shipyard.
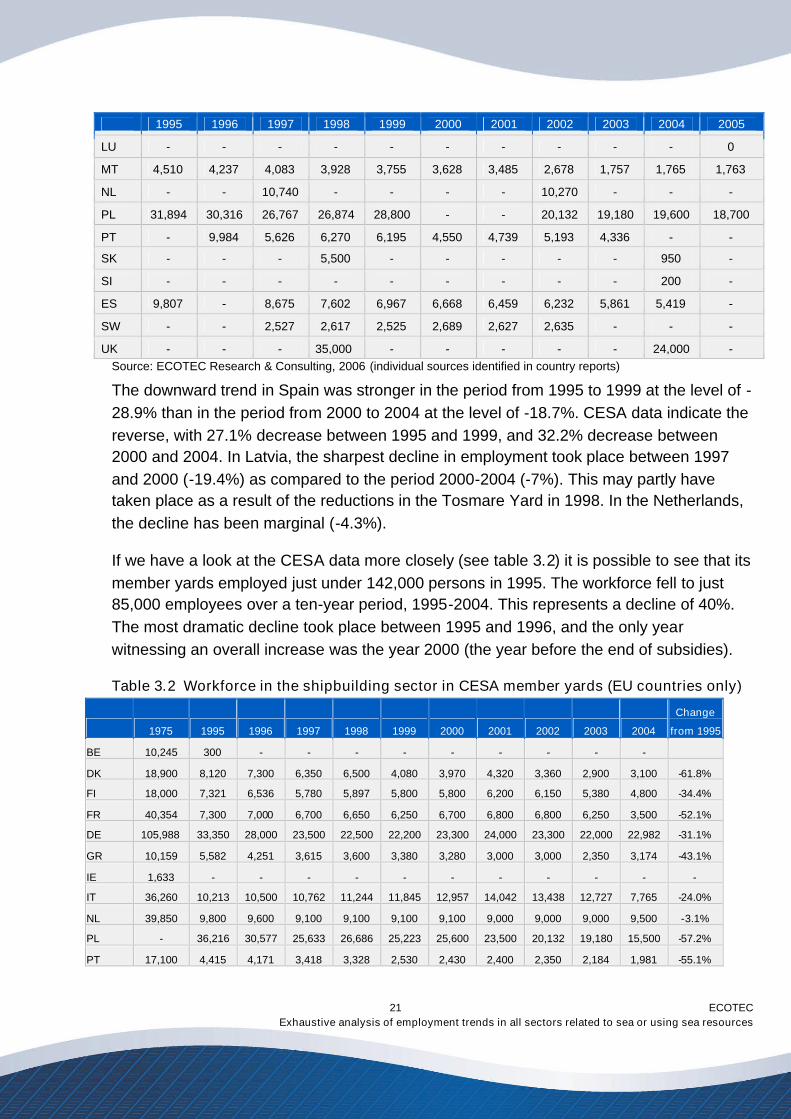
Table 3.1 Direct employment in the shipbuilding sector in Europe 1995-2005
1995 1996 1997 1998 1999 2000 2001 2002 2003 2004 2005
AT - - - - - - 754 878 919 832 325
BE - - - - - - 913 892 899 - -
CY 80 - - - 58 100 100 100 100 100 100
CZ - - - - - - 809 1,132 496 303 501
DK 12,495 11,360 10,763 9,435 7,890 6,810 6,653 6,524 - - -
EE - - - - - 2,604 2,158 2,616 2,581 2,701 -
FI 6,932 5,882 5,066 5,100 5,600 5,769 6,041 5,998 5,380 4,823 -
FR - - 29,684 26,036 25,512 - 23,564 - - - -
DE - - - - - 25,939 - 24,329 23,807 22,982 -
GR 5,582 4,251 3,615 3,600 3,380 3,280 3,000 3,000 2,350 3,174 -
HU - - - - - - - - - 255 -
IE - - - - - - - - - - 0
IT 10,213 10,500 10,762 11,244 11,845 12,957 14,042 13,438 12,727 12,033I -
LV - - 3,394 3,522 3,062 2,736 2,712 2,543 2,539 2,542 -
LT - - - - - - - - - - 4,902
I Different data source to the others.
ECOTECExhaustive analysis of employment trends in all sectors related to sea or using sea resources
21
1995 1996 1997 1998 1999 2000 2001 2002 2003 2004 2005
LU - - - - - - - - - - 0
MT 4,510 4,237 4,083 3,928 3,755 3,628 3,485 2,678 1,757 1,765 1,763
NL - - 10,740 - - - - 10,270 - - -
PL 31,894 30,316 26,767 26,874 28,800 - - 20,132 19,180 19,600 18,700
PT - 9,984 5,626 6,270 6,195 4,550 4,739 5,193 4,336 - -
SK - - - 5,500 - - - - - 950 -
SI - - - - - - - - - 200 -
ES 9,807 - 8,675 7,602 6,967 6,668 6,459 6,232 5,861 5,419 -
SW - - 2,527 2,617 2,525 2,689 2,627 2,635 - - -
UK - - - 35,000 - - - - - 24,000 -Source: ECOTEC Research & Consulting, 2006 (individual sources identified in country reports)
The downward trend in Spain was stronger in the period from 1995 to 1999 at the level of -28.9% than in the period from 2000 to 2004 at the level of -18.7%. CESA data indicate thereverse, with 27.1% decrease between 1995 and 1999, and 32.2% decrease between2000 and 2004. In Latvia, the sharpest decline in employment took place between 1997and 2000 (-19.4%) as compared to the period 2000-2004 (-7%). This may partly havetaken place as a result of the reductions in the Tosmare Yard in 1998. In the Netherlands,the decline has been marginal (-4.3%).
If we have a look at the CESA data more closely (see table 3.2) it is possible to see that itsmember yards employed just under 142,000 persons in 1995. The workforce fell to just85,000 employees over a ten-year period, 1995-2004. This represents a decline of 40%.The most dramatic decline took place between 1995 and 1996, and the only yearwitnessing an overall increase was the year 2000 (the year before the end of subsidies).
Table 3.2 Workforce in the shipbuilding sector in CESA member yards (EU countries only)
1975 1995 1996 1997 1998 1999 2000 2001 2002 2003 2004
Change
from 1995
BE 10,245 300 - - - - - - - - -
DK 18,900 8,120 7,300 6,350 6,500 4,080 3,970 4,320 3,360 2,900 3,100 -61.8%
FI 18,000 7,321 6,536 5,780 5,897 5,800 5,800 6,200 6,150 5,380 4,800 -34.4%
FR 40,354 7,300 7,000 6,700 6,650 6,250 6,700 6,800 6,800 6,250 3,500 -52.1%
DE 105,988 33,350 28,000 23,500 22,500 22,200 23,300 24,000 23,300 22,000 22,982 -31.1%
GR 10,159 5,582 4,251 3,615 3,600 3,380 3,280 3,000 3,000 2,350 3,174 -43.1%
IE 1,633 - - - - - - - - - - -
IT 36,260 10,213 10,500 10,762 11,244 11,845 12,957 14,042 13,438 12,727 7,765 -24.0%
NL 39,850 9,800 9,600 9,100 9,100 9,100 9,100 9,000 9,000 9,000 9,500 -3.1%
PL - 36,216 30,577 25,633 26,686 25,223 25,600 23,500 20,132 19,180 15,500 -57.2%
PT 17,100 4,415 4,171 3,418 3,328 2,530 2,430 2,400 2,350 2,184 1,981 -55.1%
ECOTECExhaustive analysis of employment trends in all sectors related to sea or using sea resources
22
1975 1995 1996 1997 1998 1999 2000 2001 2002 2003 2004
Change
from 1995
SP 47,000 11,692 11,051 10,765 9,150 8,519 8,209 7,983 7,876 7,343 5,562 -52.4%
SW 31,500 1,152 1,277 883 - - - - - 0 0 -
UK 55,999 6,500 8,500 8,500 8,500 8,750 8,000 7,000 7,000 7,000 7,000 +7.7%
Total 432,988 141,961 128,763 115,006 113,155 107,677 109,346 108,245 102,406 96,314 84,864 -40.2%Source: CESA Annual Report 2004-2005
The highest declines were experienced by the CESA yards in Denmark (67%), Greece(43%), Poland (57%) and Portugal (55%). The smallest decrease was recorded by theNetherlands at 3%.
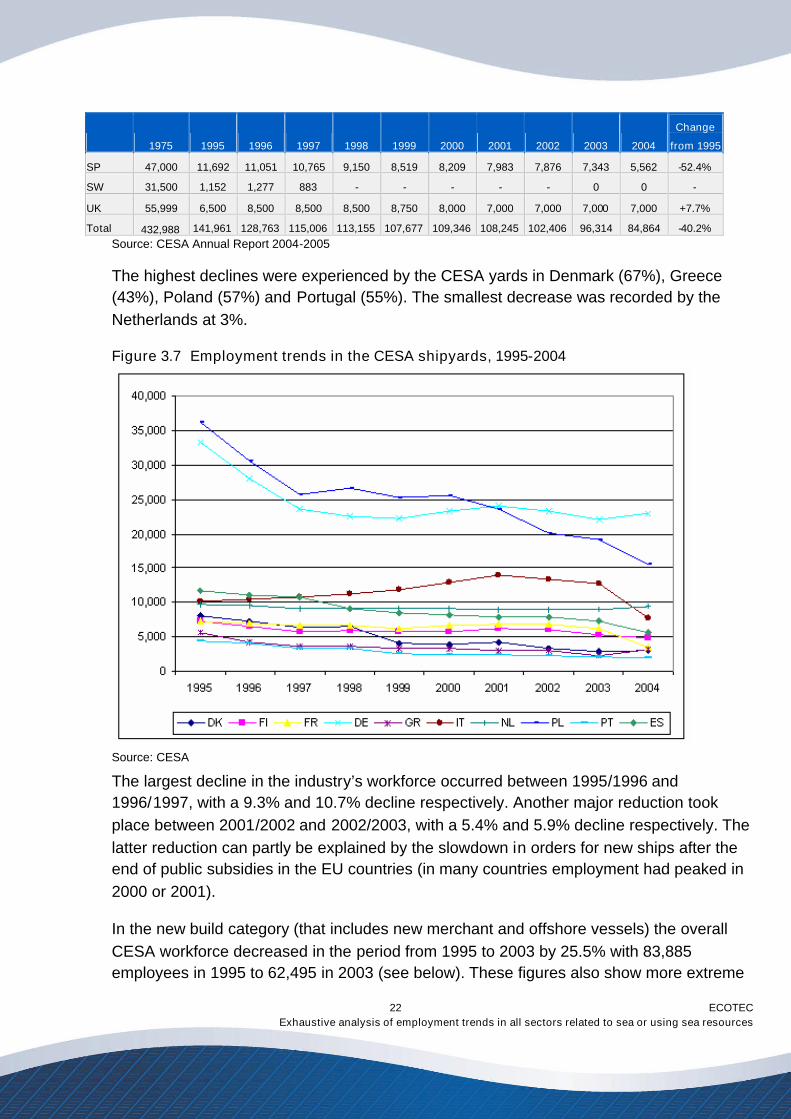
Figure 3.7 Employment trends in the CESA shipyards, 1995-2004
Source: CESA
The largest decline in the industry’s workforce occurred between 1995/1996 and1996/1997, with a 9.3% and 10.7% decline respectively. Another major reduction tookplace between 2001/2002 and 2002/2003, with a 5.4% and 5.9% decline respectively. Thelatter reduction can partly be explained by the slowdown in orders for new ships after theend of public subsidies in the EU countries (in many countries employment had peaked in2000 or 2001).
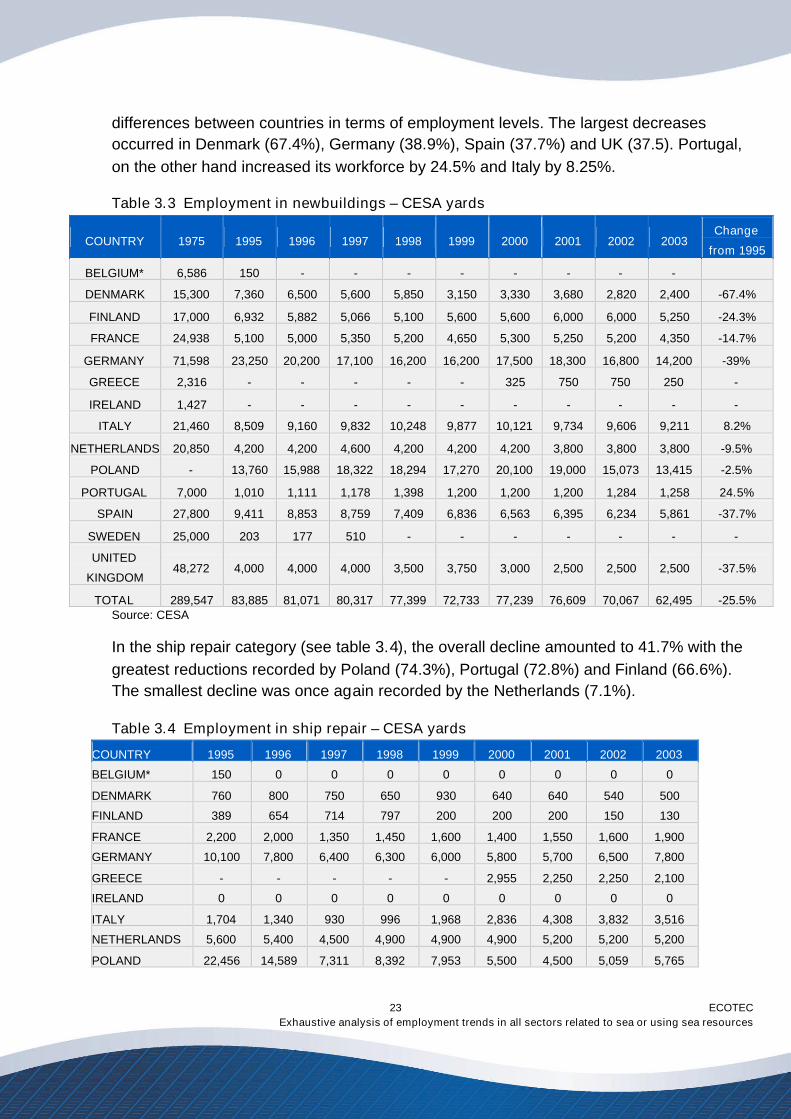
In the new build category (that includes new merchant and offshore vessels) the overallCESA workforce decreased in the period from 1995 to 2003 by 25.5% with 83,885employees in 1995 to 62,495 in 2003 (see below). These figures also show more extreme
ECOTECExhaustive analysis of employment trends in all sectors related to sea or using sea resources
23
differences between countries in terms of employment levels. The largest decreasesoccurred in Denmark (67.4%), Germany (38.9%), Spain (37.7%) and UK (37.5). Portugal,on the other hand increased its workforce by 24.5% and Italy by 8.25%.
Table 3.3 Employment in newbuildings – CESA yards
COUNTRY 1975 1995 1996 1997 1998 1999 2000 2001 2002 2003Change
from 1995
BELGIUM* 6,586 150 - - - - - - - -
DENMARK 15,300 7,360 6,500 5,600 5,850 3,150 3,330 3,680 2,820 2,400 -67.4%
FINLAND 17,000 6,932 5,882 5,066 5,100 5,600 5,600 6,000 6,000 5,250 -24.3%
FRANCE 24,938 5,100 5,000 5,350 5,200 4,650 5,300 5,250 5,200 4,350 -14.7%
GERMANY 71,598 23,250 20,200 17,100 16,200 16,200 17,500 18,300 16,800 14,200 -39%
GREECE 2,316 - - - - - 325 750 750 250 -
IRELAND 1,427 - - - - - - - - - -
ITALY 21,460 8,509 9,160 9,832 10,248 9,877 10,121 9,734 9,606 9,211 8.2%
NETHERLANDS 20,850 4,200 4,200 4,600 4,200 4,200 4,200 3,800 3,800 3,800 -9.5%
POLAND - 13,760 15,988 18,322 18,294 17,270 20,100 19,000 15,073 13,415 -2.5%
PORTUGAL 7,000 1,010 1,111 1,178 1,398 1,200 1,200 1,200 1,284 1,258 24.5%
SPAIN 27,800 9,411 8,853 8,759 7,409 6,836 6,563 6,395 6,234 5,861 -37.7%
SWEDEN 25,000 203 177 510 - - - - - - -
UNITED
KINGDOM48,272 4,000 4,000 4,000 3,500 3,750 3,000 2,500 2,500 2,500 -37.5%
TOTAL 289,547 83,885 81,071 80,317 77,399 72,733 77,239 76,609 70,067 62,495 -25.5%Source: CESA
In the ship repair category (see table 3.4), the overall decline amounted to 41.7% with thegreatest reductions recorded by Poland (74.3%), Portugal (72.8%) and Finland (66.6%).The smallest decline was once again recorded by the Netherlands (7.1%).
Table 3.4 Employment in ship repair – CESA yards
COUNTRY 1995 1996 1997 1998 1999 2000 2001 2002 2003
BELGIUM* 150 0 0 0 0 0 0 0 0
DENMARK 760 800 750 650 930 640 640 540 500
FINLAND 389 654 714 797 200 200 200 150 130
FRANCE 2,200 2,000 1,350 1,450 1,600 1,400 1,550 1,600 1,900
GERMANY 10,100 7,800 6,400 6,300 6,000 5,800 5,700 6,500 7,800
GREECE - - - - - 2,955 2,250 2,250 2,100
IRELAND 0 0 0 0 0 0 0 0 0
ITALY 1,704 1,340 930 996 1,968 2,836 4,308 3,832 3,516
NETHERLANDS 5,600 5,400 4,500 4,900 4,900 4,900 5,200 5,200 5,200
POLAND 22,456 14,589 7,311 8,392 7,953 5,500 4,500 5,059 5,765
ECOTECExhaustive analysis of employment trends in all sectors related to sea or using sea resources
24
COUNTRY 1995 1996 1997 1998 1999 2000 2001 2002 2003
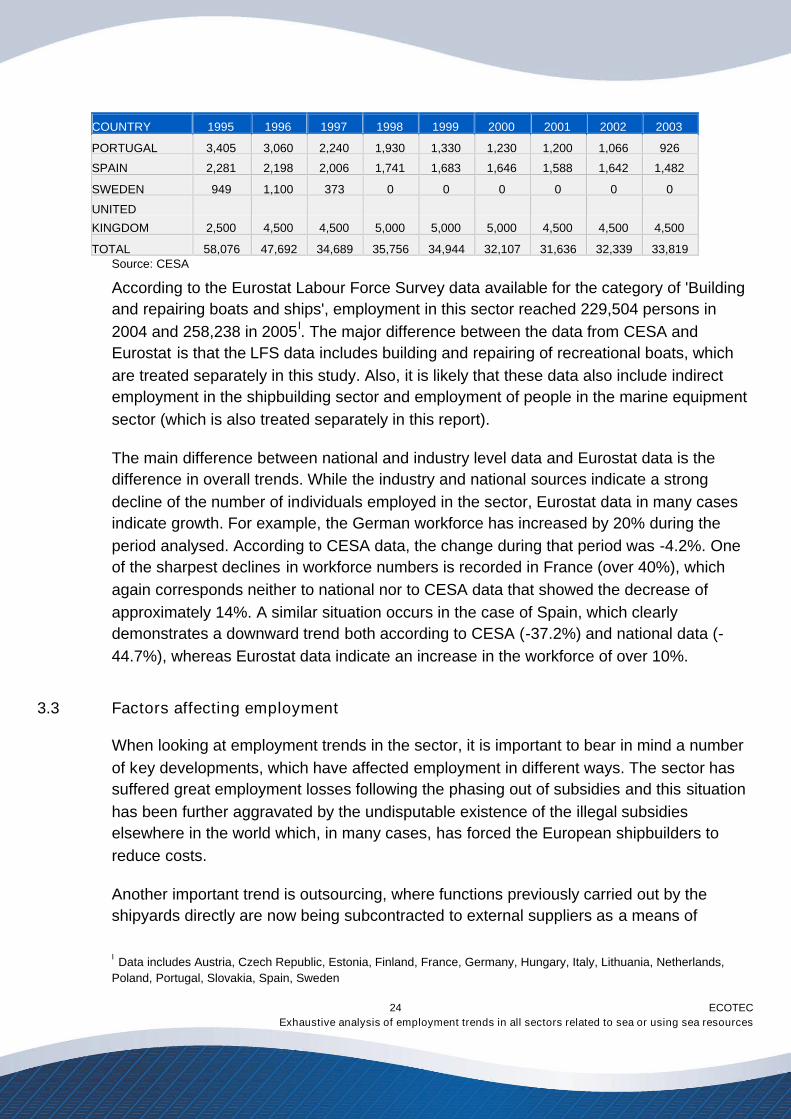
PORTUGAL 3,405 3,060 2,240 1,930 1,330 1,230 1,200 1,066 926
SPAIN 2,281 2,198 2,006 1,741 1,683 1,646 1,588 1,642 1,482
SWEDEN 949 1,100 373 0 0 0 0 0 0
UNITED
KINGDOM 2,500 4,500 4,500 5,000 5,000 5,000 4,500 4,500 4,500
TOTAL 58,076 47,692 34,689 35,756 34,944 32,107 31,636 32,339 33,819Source: CESA
According to the Eurostat Labour Force Survey data available for the category of 'Buildingand repairing boats and ships', employment in this sector reached 229,504 persons in2004 and 258,238 in 2005I. The major difference between the data from CESA andEurostat is that the LFS data includes building and repairing of recreational boats, whichare treated separately in this study. Also, it is likely that these data also include indirectemployment in the shipbuilding sector and employment of people in the marine equipmentsector (which is also treated separately in this report).
The main difference between national and industry level data and Eurostat data is thedifference in overall trends. While the industry and national sources indicate a strongdecline of the number of individuals employed in the sector, Eurostat data in many casesindicate growth. For example, the German workforce has increased by 20% during theperiod analysed. According to CESA data, the change during that period was -4.2%. Oneof the sharpest declines in workforce numbers is recorded in France (over 40%), whichagain corresponds neither to national nor to CESA data that showed the decrease ofapproximately 14%. A similar situation occurs in the case of Spain, which clearlydemonstrates a downward trend both according to CESA (-37.2%) and national data (-44.7%), whereas Eurostat data indicate an increase in the workforce of over 10%.
3.3 Factors affecting employment
When looking at employment trends in the sector, it is important to bear in mind a numberof key developments, which have affected employment in different ways. The sector hassuffered great employment losses following the phasing out of subsidies and this situationhas been further aggravated by the undisputable existence of the illegal subsidieselsewhere in the world which, in many cases, has forced the European shipbuilders toreduce costs.
Another important trend is outsourcing, where functions previously carried out by theshipyards directly are now being subcontracted to external suppliers as a means of
I Data includes Austria, Czech Republic, Estonia, Finland, France, Germany, Hungary, Italy, Lithuania, Netherlands,Poland, Portugal, Slovakia, Spain, Sweden
ECOTECExhaustive analysis of employment trends in all sectors related to sea or using sea resources
25
rationalising operations. This resulted is the reduction of direct employment in theshipyards over the recent yearsI. This trend is also impacting on skill needs and demandfor future labour as partnering and liaison with other companies in the maritime supplychain highlights the necessity for communication and project management skills, as wellas the loss of traditional skills to the sector.
The European shipbuilding sector has also been modernised and restructured. However,in the new Member States in Central and Eastern Europe, this trend has been even morepronounced than in the old EU. Restructuring did not only involve privatisation but alsochanges in production methods, such as increased input of RDI, use of subcontractors,etc. Restructuring processes also involved a different focus for the whole shipbuildingindustry. In case of Poland, the restructuring of the sector, including modernisation andprivatisation, has resulted in the increasing productivity of the sector and, consequently,reduction in staff numbers. At present, the productivity of Polish shipbuilding workers is stilllower that that of their EU counterparts. However, it is believed that further reductions ofstaff numbers may at least partly be compensated by the increase of orders in shipyards.
Before 1991, most of the shipyard production in the Baltic States and Poland was drivenby the demand from the former USSR under COMECON. The demand not only includedorders for ships but also cheaper supply of raw materials and different legal and financialguarantees for the sector to function. The example of Latvia can illustrate this process,where most of the shipyards were focused on naval construction and repair. After the fallof the Soviet Union, the customer base has expanded and the focus has shifted towardsmerchant vessels. In Spain, the restructuring of IZAR resulted in reductions in employmentof approximately 4,000 workers.
Another important trend that has exerted enormous influence on the sector’s workforce isageing. This has been reported to be an issue of particular concern for example in theNetherlands, the UK and Finland. Many highly skilled engineers in particular will retire inthe near future and at the same time it is difficult to replace them with younger workers.Since the industry is sensitive to economic fluctuation and is contract-related, these cycleshave an impact on employment. This insecurity translates into a greater tendency toaccept early retirement, as well as contributing to the poor image of the sector amongpotential new recruits.II
As most of the European workforce is ageing, the industry faces a challenge not only toretain the existing workforce but also to attract a new one. However, the industry lacks an
I Ibidem, p.4II Haltia P., Himberg H., Touminen T., Learning by shipbuilding: practices, and obstacles for younger and olderemployees?, University of Turku, Finland, p.1
ECOTECExhaustive analysis of employment trends in all sectors related to sea or using sea resources
26
appealing image, which is reflected i.e. by the decreasing number of young graduates inthe fields relevant to the shipbuilding. Finally, the shift of focus of production from morelabour-intensive into technology-intensive and more project-oriented production hasimpacted employment. Shipbuilding has always been a cyclical industry, and with therecent speeding up of delivery and product cycles, labour force planning and indeedemployment forecasting has become even more difficult and might well be subject tostronger variations over time.
The perception of the sector has therefore suffered as a result of a variety of factorsincluding outdated perceptions of heavy manual work, the image of an industry in declineas a result of past layoffs and strong ongoing cyclical influences. In order to boostrecruitment, work not only needs to be done to “update” the image of the sector as aninnovative one with high technology content, but innovative solutions also have to be foundto emphasise and ensure security of employment rather than job security and flexible workorganisation (a so-called flexicurity strategy). Some work in this area has already beenaccomplished by social partners, indicating that an exchange of good practice at theEuropean level would be beneficial to share experiences.
3.4 Employment forecast
As earlier mentioned, by taking together civil and naval shipbuilding, repair and conversionas well as its suppliers, this sector constitutes the third largest growth market in the globalmaritime cluster between 2005 and 2010, according to a 2005 study by DouglasWestwood I. However, for the reasons outlined about, this trend was largely not reflected indirect employment figures in the sector. Positive forecasts also have to be seen againstthe background of significant overcapacity in the sector in world markets.
Bringing the issue of trade distortions in shipbuilding through Korean subsidies to the WTOhas given a mixed result. In the Community's case against Korea, the Panel found that theKorean Export/Import Bank had indeed, in numerous individual cases, provided prohibitedexport-contingent subsidies to Korean shipyards. The Panel gave however the KoreanGovernment the benefit of the doubt, despite a wealth of circumstantial evidence.Therefore it has been argued that the available WTO instruments are not well suited forthis industry. It is therefore likely that the market for very large standard vessels(particularly container ships and oil tankers) will continue to shift to Asia, with Europeanshipyards forced to compete in R&D and therefore investment intensive areas and thebuilding of specialised vessels. At the end of 2004, there were outstanding orders on thebooks for 2,410 vessels. Just over a third of new orders for new ships were placed with
I Douglas Westwood for University of Kiel; World Marine Markets, 2005
ECOTECExhaustive analysis of employment trends in all sectors related to sea or using sea resources
27
shipyards in South Korea. Japan provided the largest demand for new vessels (20%),followed by Germany (12%) and Denmark (8%).
The year 2004 was a boom year for international shipping, which was reflected in asignificant number of new orders. This was buoyed by overall economic growth, mainlydriven by developments in the USA and China. On the other hand CESA's analysis offuture requirements in worldwide shipbuilding capacity together with the OECD’sassessment of an annual demand for new built vessels, lead to the assumption that for theforeseeable future, shipbuilding capacity will outstrip demand by approximately 30%,leading to a further wave of global competition, potentially resulting in a paradoxicalsituation in which there is a high demand for ships but the prices are decreasing. Thiscould have a detrimental impact on employment in European shipyardsI.
The opportunities provided by the growth in maritime transport and seaborne trade areindicated by most of the European countries. Another opportunity for development in thesector might be the increasing willingness to transfer some of the road freight to short-seashipping, which could result in the increase in orders for smaller vesselsII.
Following the downturn of during the early years of this decade, which demonstrated – onthe one hand – the cyclical nature of the industry (as a result of the ageing of vessels), butwas also to some extent due to expiry of existing state subsidy regimes in the EuropeanUnion which led a significant number of orders to be placed in 1999/2000, shipyards havebeen able to double the size of their order books in 2004. This trend continued in 2005 andensures healthy production over the next three years III. European trends in this respectreflect a global increase in demand for new vessels, particularly as a result of theincreased use of ocean and short sea shipping for the movement of cargo.
To conclude, the employment forecast should be considered to be a positive one over thecoming years (up to 2008) as order books are strong and orders often take several yearsto complete. The specialised, high quality vessels built in Europe are strongly linked tostrong economic cycles and public investment, therefore global market cycles do play animportant role. The forecasts are also positive for repair yards, which had benefited fromthe high freight rates in 2004 and 2005.
I See for example: Maritime Economy. Statistic review, 2004, Maritime Institute, Gdansk 2004II Marine industries. Global market analysis, Douglas-Westwood Ltd for Marine Institute, Ireland, in: Marine ForesightSeries, No 1, March 2005, p.110III CESA Annual Report, 2004-2005, p.5
ECOTECExhaustive analysis of employment trends in all sectors related to sea or using sea resources
28
3.5 Skill needs and labour availability
In relation to training and skills, reference must be made to a number of key trendsaffecting the sector; namely skill shortages; attractiveness of the sector; changes in skillsprofiles and related to this the availability and quality of training provision specific to thesector.
A study carried out by Tholen and Ludwig (2006) indicates that many shipyards in Europeare experiencing skills gaps as well as labour shortages. However, although approximately55% of the EU-15 yards are affected by these difficulties, only 35% perceive them to be aproblemI. The greatest difficulties are found in merchant shipbuilding, where which 43% ofthe employers reported difficulties in recruiting blue collar workers. Restructuring in thesector and technological advances have led to an ongoing training demand in newtechnologies and innovations for engineers as well as there is an increasing demand for ITskills, for example in relation computer assisted design and technology. The trend towardssubcontracting and the focus on specialised, one-off designs has increased requirementsfor contract management, legal, logistics and marketing experts. Sectoral experts havealso highlighted shortages in communication and project management skills, which areincreasingly in demand following the increase in outsourcing and necessity to liase withother companies in the supply chain. Furthermore, due to the trend in the sector towardsgreater specialisation, there is a need to train more specialised staff in order to wincontracts for specialised vessels.
As already mentioned, the industry is also facing a labour shortage that is influenced by anageing workforce and the reputation of the industry. The latter suffered greatly during 2003and 2004 when large scale redundancies were made. Furthermore, young people do notsee the sector as an attractive one although wages are often higher than the nationalaverage. In the UK, the remedy for the skill and labour shortages is believed to be theincreasing uptake of apprenticeships, as there will be an increasing amount of work relatedto new contracts II.
Employers and employee representatives have also played an important role in efforts toraise the profile and increase understanding of employment profiles and opportunities intoday’s shipyards - in the context of European Social Dialogue Committee on Shipbuilding.CESA and the European Metalworkers' Federation (EMF) run the European ShipyardsWeek in 20006 and produced material which underlined the innovation and high
I University of Bremen study, 2006 p.30II Managing cyclical changes in the European shipbuilding and ship repairing industries: Evidence from the UnitedKingdom, Draft research by Labour Research Department
ECOTECExhaustive analysis of employment trends in all sectors related to sea or using sea resources
29
technology content of work in the sector, which no longer fits the image of the past ofheavy manual labour.
Differences exist from country to country regarding the levels of qualifications and skill setsfor which employers find it most difficult to recruit. For example: In Germany, 42% of the yard owners report difficulties in recruiting white collar workers
while just over 21% report difficulties in recruiting blue collar workersI. Companies in the UK report that the most likely labour shortages in the next five years
will be for metal workers, pipe workers and electrical engineersII. In order to fill thevacancies the companies are increasing salaries, retraining workers andsubcontracting.
In Estonia, workforce shortages are considered to be the most serious challengeexperienced by the sector. At present, greatest unfulfilled demand exists for welders.The sector is in competition with other sectors of the economy (such as construction) forsuch skilled staff.
In the Netherlands, the shipbuilding sector accounts for 2% of vacancies as comparedto the total labour force, which is close to the country's average. However, 58% of thesevacancies are hard to fill. Most openings regard positions in manufacturing. Especiallymetalworkers (30% of all vacancies) and pipe workers (15%) are needed. According tothe employers many candidates do not have enough work experience or areinsufficiently specialised/educated.
In general, recruitment difficulties are more significant for highly skilled workers than forworkers with lower level qualifications. This is partly due to the changed nature of thesector, but also results from the fact that in many countries shipyards are located in areasotherwise facing labour market difficulties due to high unemployment, thus increasing thepool of labour of lower skilled staff.
Skill shortages as well as labour shortages raise doubts as to the capacity of the Europeanshipbuilding industry to effectively compete and to take advantage of the increaseddemand for new ships. This can be illustrated by the example of Poland, whose forwardorder books are filled; however, it is unsure whether there will be sufficient amount ofproperly skilled workers. In the UK, the amount of new work related to the new contracts islikely to pose problems regarding the recruitment and retaining of skilled workforce. Thelack of capable and skilled staff has also been blamed for the loss of some contract workin the UKIII.
I Bremen study, Tholen. LudwigII Marine Labour Market Observatory, EMTAIII Marine Labour Market Observatory, EMTA
ECOTECExhaustive analysis of employment trends in all sectors related to sea or using sea resources
30
The skill shortages become even more serious when specific training programmes and notor no longer available. In Sweden, for some of the occupations needed in the sector, suchas shipbuilders and welders, there are currently no appropriate educational programmesand thus shipyards in Sweden have been forced to hire staff from other countries such asDenmark and Poland. Previously when Swedish shipbuilding was still a world leadingproducer of ships, each of the shipyards had their own apprenticeship programmes inwhich they could make sure that the apprentices developed the skills required.
Skill shortages in the sector are also attributed by many to the cyclical and contract drivennature of the work, which is seen to provide insufficient job securityI. The contract drivennature of work is especially felt by the repair industry, which heavily relies on short-termcontracts, subcontractors and temporary labour. However, due to the decreasing andageing workforce, there is a great risk that the skill will not be readily available. Moreover,as highlighted by many, outsourcing and subcontracting, which used to be the method ofeasing the lay-off and redundancy schemes, has in many cases led to the loss of manyskills due to the small size of the enterprises-subcontractors and their short-termexistenceII.
Due to the skill and workforce shortages some companies have been forced to rely onworkers from other countries. This is the case of Sweden or Denmark, which recruit highlyqualified workers from elsewhere in the EU or EEA, such as Norway, Poland and Portugal.While workforce migration is not in itself a negative phenomenon, in some countries theoutflow of qualified workforce may negatively influence the development of the domesticsector. Labour migration to other EU countries has indeed become an enormous problemfor Latvia whose yards are now struggling to find auxiliary workers, such as welders rackinstallation workers, pipers and operators. In Finland, the profile of the workforce hastraditionally been fairly homogeneous with a great majority of workers coming fromFinland. Recent years have, however, witnessed a trend of growing number of workersfrom Estonia, Lithuania and Russia.
I Haltia P., Himberg H., Touminen T., Learning by shipbuilding: practices, and obstacles for younger and olderemployees?, University of Turku, Finland, p.1II Granger N., Maintenance and Development of the Skills Base for Shipyards, in: in: Qualification and Training Forum,European Shipbuilding Social Dialogue Committee, 21 October 2005, Trieste, p.26
ECOTECExhaustive analysis of employment trends in all sectors related to sea or using sea resources
31
4.0 Marine equipment
The marine equipment industry consists of companies that produce equipment andmaterials for shipbuilding, oil & gas installations, ports and other core maritime sectors.Most often this means items purchased for the shipbuilding process, such as propulsionsystems and other machinery, IT solutions, electronic control systems and bridge systems.Indeed, the sector supports the whole marine value chain and stakeholders. Thedifficulties relating to the definition of the marine equipment sector are caused by thenature of the activities of the companies in the sector – as companies in the sectorproduce increasingly specialised and often new products and they are usually active inseveral different fields, e.g. aviation, furniture or car manufacturing.
The definition which is used by the European Marine Equipment Council (EMEC)describes marine equipment market as all products and services supplied for the building,conversion and maintenance of ships (seagoing and inland). This includes technicalservices in the field of engineering, installation and commissioning, and ship maintenance(including repair).
4.1 Economic impact
Some 30 years ago most of the shipbuilding work was carried out by the shipyards. Withthe growing trend of specialisation, the work has increasingly been subcontracted toexternal suppliers. At present, an average shipyard subcontracts 50-70% of their work,which means that most of the added value comes from the subcontractors.
The marine equipment market was estimated at €73 billion in 2004, whilst shipbuildingaccounted for €21.3bnI. Europe is a major provider of marine equipment and its marketwas valued at €26bn in 2004, with €12bn related to the export market. The export share isnearly 46%.
In 2000 Europe was estimated to satisfy 37% of the world demand for marine equipment,while having 16% of the world shipbuilding market share. European equipment industriesare world leaders in propulsion, cargo handling, communication, automation andenvironmental systemsII. Significantly, the vast majority of marine equipment and servicesused for cruise ships is sourced from EuropeIII. The leading country in the European
I Ibidem, p.111II EMECIII For example, at the family controlled Meyer Werft in Germany a recently completed ship's prefabricated cabins weremade in Germany, the wall panels in Norway, carpets in Denmark, galleys in Finland, and other products were
ECOTECExhaustive analysis of employment trends in all sectors related to sea or using sea resources
32
marine equipment sector is Germany with 15% of the world market share. Other importantplayers in the sector are the UK, Austria, Netherlands, France and Italy.
Since the marine equipment is heavily dependent on the shipbuilding sector, this sectortends to be small in countries with limited shipbuilding activity, such as Belgium or Ireland.However exceptions to the rule also exist. As an example, the sector employs estimated7,000 individuals in Austria. Employment trends also tend to follow the ones of shipbuildingindustry, for example in the case of Denmark where the sector has witnessed a downturnafter the crisis in shipbuilding the sector – even if this decline has been more moderatethan in the shipbuilding sector. Furthermore, the countries which are the biggest players inthe marine equipment sector increasingly focus their attention on exports.
Some countries, such as Italy and France, have extensive local manufacturing capability.In France, for example, between one-third and a half of equipment is supplied by FrenchmanufacturersI. Another important player in the marine equipment sector in the EEA isNorway, which in 1997 accounted for 14% of the world market share.
The most important strengths of the European marine equipment market are stronginnovation which results in specialised solutions for special problems. The European shipsystems and equipment are highly sought after on the world market. The weaknesses ofthe European marine equipment sector are that it is expensive and at present both euroand sterling are overvalued, which in turn damage the European exporters in this field.Moreover, the companies do not sufficiently cooperate with universities and the latter arenot sufficiently market-oriented. This results in problems in turning innovation into aproduct.
The opportunities for the sector include growing global demand for new ships, in particularspecialised vessels and cruise ships. The growth sectors are gas shipping and LNGcarriers, together with gas treatment technology. Another strong market segments seem tobe the environmental technology, security-related solutions, such as better monitoring andonboard security. Key threats for the sector include: cyclical nature of the shipbuilding industry, which has an impact on the marine
equipment sector; increased competition from Asia, which is often unfair due to subsidies; andunfavourable dollar/euro exchange rate.
manufactured in France and Italy. The turnkey outfitting in public areas was completed by a variety of Germancompanies. See: The ECC Annual Review Book (2006) The ECCI The ECC Annual Review Book (2006) The ECC
ECOTECExhaustive analysis of employment trends in all sectors related to sea or using sea resources
33
4.2 Availability of employment data
The previous section has already dealt with some of the issues relating to problems incalculating employment in the maritime equipment sector. The sector is not recognised asits own sector by national or European statistics and difficulties arise from that fact thatmost companies are active also in other manufacturing sectors, hence only a part of theiremployment is directly linked to the wider maritime sector. In addition, company level datais often difficult to obtain due to the employment data being commercially sensitive. And insome countries, such as Italy, the marine equipment production is practically integrated inthe shipyards which make it difficult to draw an exact line between the two sectors.
It is worth mentioning that no studies have been done at European level to look atemployment in this sector in detail. Furthermore, only a few studies have been carried outat national level (DK, NL and FI). This is partly because this definition of the sector itself isseen as fairly new, and traditionally, although this perception is changing, the sector hasseen as an indirect employment effect of the shipbuilding industry. The sector is receivinga growing recognition of an industry of its own as it is becoming increasingly important ineconomic and employment terms. For example, in Spain employment in the maritimeequipment sector is approximately seven-fold compared to jobs in shipyards.
Employment data for this study has been obtained from a variety of sources. The Spanishstakeholders viewed that largely speaking the difference between employment dataprovided by the representative organisation for the shipbuilding industry and totalemployment in the 'building and repairing ships and vessels' sector (LFS) can beconsidered as employment in the maritime equipment sector. Many countries rely onoverall estimates on employment in this industry (e.g. Poland) and in many countries thenational experts were not even able to provide estimates (e.g. Lithuania).
In Denmark the Danish maritime cluster study could not specify exactly which proportion ofthe activities of companies that manufacture marine engines and compressors are linkedto the maritime sector, rather than other sectors. Furthermore, it could not guarantee thatall specialist suppliers would be covered in the study. For instance, the suppliers of radioand communication equipment were not included in the study. The Dutch and Finnishmaritime cluster studies solved this problem by carrying out a large-scale survey amongcontractors and sub-contractors for the shipyards. The Finnish study found that theturnover of and employment in these companies was substantially higher than that ofshipyards, but only just under a third of the turnover and a quarter of total employment wasgenerated by the maritime sector.
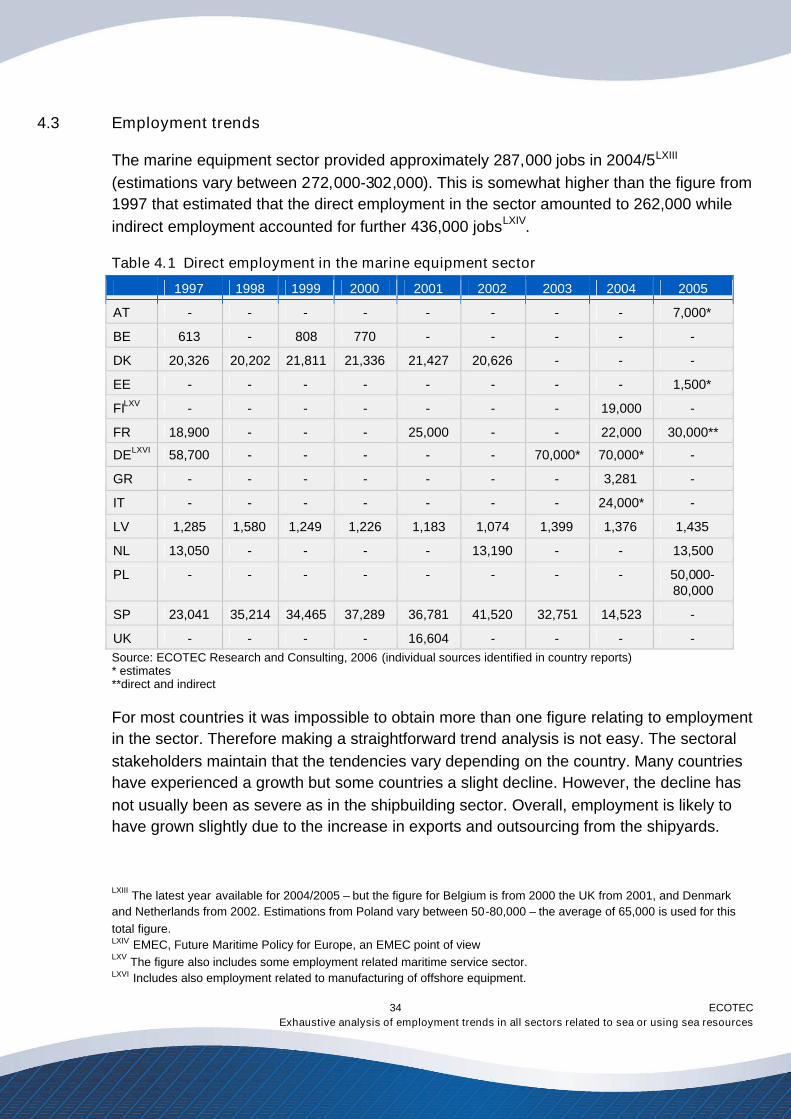
ECOTECExhaustive analysis of employment trends in all sectors related to sea or using sea resources
34
4.3 Employment trends
The marine equipment sector provided approximately 287,000 jobs in 2004/5LXIII
(estimations vary between 272,000-302,000). This is somewhat higher than the figure from1997 that estimated that the direct employment in the sector amounted to 262,000 whileindirect employment accounted for further 436,000 jobsLXIV.
Table 4.1 Direct employment in the marine equipment sector
1997 1998 1999 2000 2001 2002 2003 2004 2005
AT - - - - - - - - 7,000*
BE 613 - 808 770 - - - - -
DK 20,326 20,202 21,811 21,336 21,427 20,626 - - -
EE - - - - - - - - 1,500*
FILXV - - - - - - - 19,000 -
FR 18,900 - - - 25,000 - - 22,000 30,000**
DELXVI 58,700 - - - - - 70,000* 70,000* -
GR - - - - - - - 3,281 -
IT - - - - - - - 24,000* -
LV 1,285 1,580 1,249 1,226 1,183 1,074 1,399 1,376 1,435
NL 13,050 - - - - 13,190 - - 13,500
PL - - - - - - - - 50,000-80,000
SP 23,041 35,214 34,465 37,289 36,781 41,520 32,751 14,523 -
UK - - - - 16,604 - - - -Source: ECOTEC Research and Consulting, 2006 (individual sources identified in country reports)* estimates**direct and indirect
For most countries it was impossible to obtain more than one figure relating to employmentin the sector. Therefore making a straightforward trend analysis is not easy. The sectoralstakeholders maintain that the tendencies vary depending on the country. Many countrieshave experienced a growth but some countries a slight decline. However, the decline hasnot usually been as severe as in the shipbuilding sector. Overall, employment is likely tohave grown slightly due to the increase in exports and outsourcing from the shipyards.
LXIII The latest year available for 2004/2005 – but the figure for Belgium is from 2000 the UK from 2001, and Denmarkand Netherlands from 2002. Estimations from Poland vary between 50-80,000 – the average of 65,000 is used for thistotal figure.LXIV EMEC, Future Maritime Policy for Europe, an EMEC point of viewLXV The figure also includes some employment related maritime service sector.LXVI Includes also employment related to manufacturing of offshore equipment.
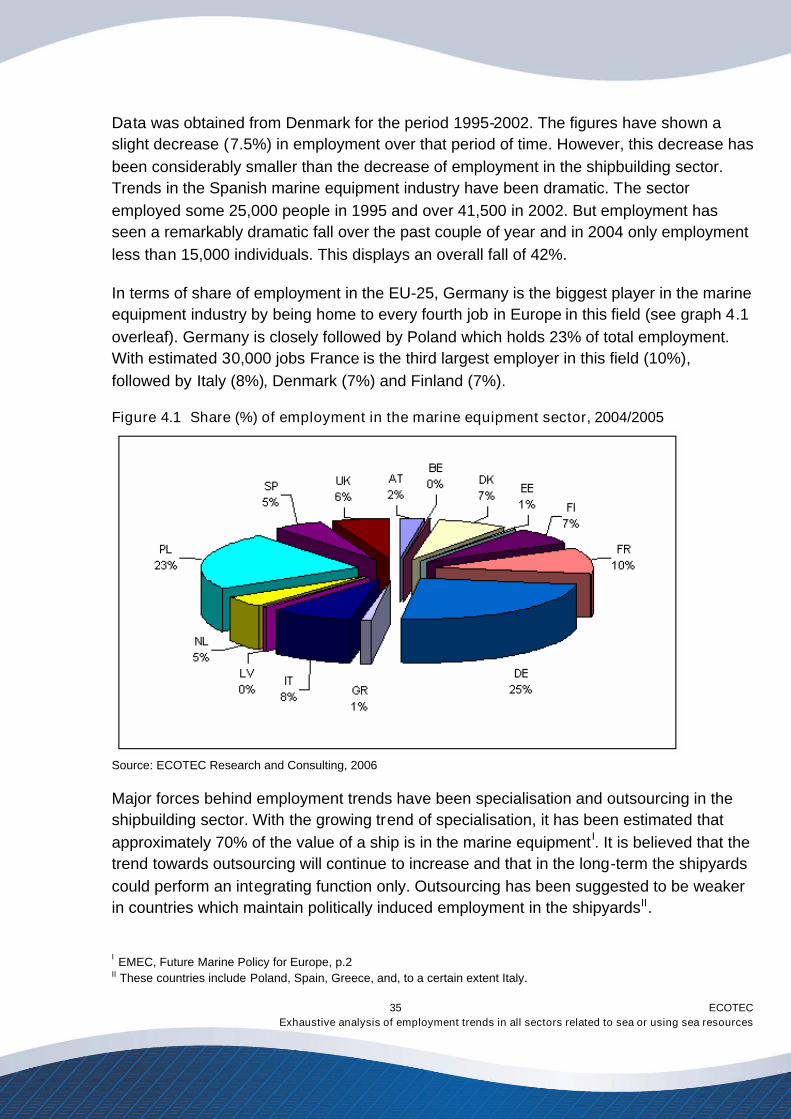
ECOTECExhaustive analysis of employment trends in all sectors related to sea or using sea resources
35
Data was obtained from Denmark for the period 1995-2002. The figures have shown aslight decrease (7.5%) in employment over that period of time. However, this decrease hasbeen considerably smaller than the decrease of employment in the shipbuilding sector.Trends in the Spanish marine equipment industry have been dramatic. The sectoremployed some 25,000 people in 1995 and over 41,500 in 2002. But employment hasseen a remarkably dramatic fall over the past couple of year and in 2004 only employmentless than 15,000 individuals. This displays an overall fall of 42%.
In terms of share of employment in the EU-25, Germany is the biggest player in the marineequipment industry by being home to every fourth job in Europe in this field (see graph 4.1overleaf). Germany is closely followed by Poland which holds 23% of total employment.With estimated 30,000 jobs France is the third largest employer in this field (10%),followed by Italy (8%), Denmark (7%) and Finland (7%).
Figure 4.1 Share (%) of employment in the marine equipment sector, 2004/2005
Source: ECOTEC Research and Consulting, 2006
Major forces behind employment trends have been specialisation and outsourcing in theshipbuilding sector. With the growing trend of specialisation, it has been estimated thatapproximately 70% of the value of a ship is in the marine equipment I. It is believed that thetrend towards outsourcing will continue to increase and that in the long-term the shipyardscould perform an integrating function only. Outsourcing has been suggested to be weakerin countries which maintain politically induced employment in the shipyardsII.
I EMEC, Future Marine Policy for Europe, p.2II These countries include Poland, Spain, Greece, and, to a certain extent Italy.
ECOTECExhaustive analysis of employment trends in all sectors related to sea or using sea resources
36
It is important to notice that the European marine equipment sector is increasingly export-oriented and it does not rely solely on the internal demand. As mentioned earlier, thestrongest marine equipment industries in Europe rely also on exports rather than oninternal demand only from the domestic shipyards. For example the Netherlands hasincreasingly focused production on exports - following a slowdown in the shipbuildingsector, which again had an impact on the domestic marine equipment sector. The Germanand Danish marine equipment sectors are also increasingly export-oriented, with a largepart of German industry producing for the Asian market.
At present, the marine equipment sector is composed of many SMEs. There are, however,larger players and in some sub-sectors mergers have been observed (such as dieselengines and propulsion systems). However it has been claimed that these mergers havenot resulted in job cuts, at least not at a significant scale.
4.4 Employment forecast
According to EMEC the short and medium term future of the sector seems positive. EMEChas forecast the following: Growth of 2.5% in production; 1.5% growth in added value; and 1% growth in employmentI.
However, after reaching €70bn in 2009, the marine equipment market is likely to startdecreasing at an annual rate of 0.5% II.
The key factor for sustainable growth for the sector in Europe is innovation and investmentin R&D, mainly due to the increasing demand for specialised vessels and specialisedsolutions for the marine sector as a whole. One of the promising segments seems to relateto environmental systems. For example, at present, the International MaritimeOrganisation (IMO) is looking at the issue of ballast water and its disposal. Anotherimportant market segment that is likely to develop in the future is gas shipping and LNGcarriers, as well as gas treatment technologies. Another market segment that is likely togrow is the cruise ships segment, with such solutions as ventilation, air-conditioning,onboard entertainment or computer navigation. However, cruise shipping is becomingmore and more disconnected from shipping and become increasingly related to the
I EMEC, Future Marine Policy for Europe, p.2II Douglas-Westwood, p.112
ECOTECExhaustive analysis of employment trends in all sectors related to sea or using sea resources
37
tourism and entertainment industry. Therefore, the demand in that segment will continue tobe affected by factors outside the maritime cluster.
Due to increased competition, some countries are likely to be forced to focus theiractivities on specific market niches, such as super yachts. Another trend which can beobserved is relocation of production to other non-EU and non-European countries. Thisallows companies to increase their turnover and production but not necessarilyemployment if the production does not take place in Europe. That is the case of dieselengine companiesI.
Overall, it is expected that the employment levels will be maintained or will slightlyincrease. This is due to the fact that the internal demand will stabilise and external demandwill growII. However, some say that this orientation might be slightly short-term as theemerging markets, such as China, are likely to develop their expertise as well. This isconfirmed by the assessment by Douglas-Westwood, which have estimated that the valueof industry will start declining in 2009.
Turning to look at individual countries more closely, the Estonian stakeholders haveconfirmed that the workforce is likely to increase slightly, especially in companies thatproduce specific equipment for recreational vessels. In Germany, it is expected thatincoming orders will further increase which is likely to have positive impact on theworkforce. Moreover, German suppliers have increased their presence in Asia in order toservice this market at the same time maintaining their position in Germany. In Finland, thedemand for highly skilled workers is increasing and is likely to grow further. At present,some posts are being filled by foreign workers.
One of the factors that has the potential to exert a negative influence on employment isprice. It is believed that the price pressures on the shipbuilding industry will increase,which will in turn affect the marine equipment sector. Innovation and investment in R&Dare the factors most likely to help trigger positive employment effects in the sector.
4.5 Skills and training
Marine equipment sector is a complex sector with a wide array of specialisations.Therefore, the exact assessment of existing and necessary training and skills is verydifficult. Moreover, this high dominance of SMEs makes it difficult to apply uniform sectoraltraining provisions. In some countries, such as the UK, it has been specifically recognisedthat there is insufficient insight into workforce development issues in this sector.
I Vision 2020, Waterborne transport and operations, A key asset for Europe’s development and future, p.8II An interview with the representative from EMEC, 2006
ECOTECExhaustive analysis of employment trends in all sectors related to sea or using sea resources
38
Since the marine equipment sector is closely related to the shipbuilding sector, suchtrends as specialisation and increasing high tech input of the production also apply to theskill developments in the marine equipment sector. Some skill shortages among certainspecialist categories of staff have been reported. In Germany, the sector already facesshortage of experts in design and service. For example, each year approximately 30 navalarchitects leave university, whereas the demand is for at least 70 per year. In Finland,there is insufficient number of applicants to the colleges in the field of marine engineering.

ECOTECExhaustive analysis of employment trends in all sectors related to sea or using sea resources
39
5.0 Seaports and related services
The sector of seaports and related services provides employment in cargo handling,shipping related activity (storage, agency, maritime logistics and expedition), managementand administration of ports and maritime pilotage.
According to the European Sea Ports Organisation (ESPO) there were 976 ports in theEU-25 in 2002, of which 279 were significant ports handling more than 1 million tonnes oftraffic. Rotterdam, Antwerp and Marseilles remain the largest ports in Europe in terms oftonnage. On average European ports handle 3.5 billion tonnes of cargo per year and 350million passengers – the equivalent of 70% of the entire European population. Europe’sshare of the market amounted to €10.5 billion or 42 percent in 2004I.
5.1 Economic impact
It has been estimated by the ESPO that the seaport sector accounts for about €20 billionof added value in Europe. However, the integration of shipping, sea ports and roadtransportation services necessarily means the total value of the sea port sector greatlyexceeds this figure. The economic contribution of the sea port sector is demonstrated bySpain and Malta where the sector accounts for around 1% of the GDP.
Although a port liberalisation programme started in Europe many years ago, the greatmajority of ports are in public ownership and as a result some suffer from low productivity.Nevertheless, the European Transport Workers Federation claims that costs for containerhandling in Europe is on average half of that in the US and less than half of the cost inAsia.
5.2 Availability of employment data
Availability of employment data for the seaport sector is limited and available statistics arehighly fragmented. This is mainly caused by the differences in definitions for seaportrelated employment and due to the lack of systematic data collection for the sector. Theport sector is not separately defined in the standard industrial classification systems (SIC)of businesses, which means that standard economic statistics collected by the nationalstatistics offices can not be related directly to the ports sector.
I Marine Industries Global Market Analysis (2006) Douglas-Westwood
ECOTECExhaustive analysis of employment trends in all sectors related to sea or using sea resources
40
Different definitions by different Member States also make the assessment of the real levelof employment difficult. The complexity of data collection for the sector can bedemonstrated by the case of the port of Rotterdam, which had some 5,741 personsemployed in activities associated with cargo handling in 2003, but total direct port-relatedemployment stood at 44,384. In addition, 14,391 individuals were employed in port‘industries’ such as oil refining, shipbuilding & repair, etc, which brings the total up to58,739. In addition to the nearly 59,000 ‘direct port-related employment’, it is claimed thatthe port of Rotterdam generates indirect employment for 250,000 people I. Similarly inDenmark, a recent report showed that Esbjerg Port, which directly employs 64 people,contributes to nearly 7,000 employment years in the regionII.
In some countries, it proved impossible to find any reliable employment data for this sector(e.g. Greece).
5.3 Employment trends
In 1997, seaports and related services provided approximately 350,000 jobs. This studyconcluded that the seaports of the EU, together with related services, employed 284,000individuals in 2005III. However, it must be recognised that the figure for direct employmentis likely to be a slight under-estimation of actual employment in the EU-25 due to the factemployment data is currently missing for Greece, which brings the total figure down. Onthe other hand the figures for Denmark also include maritime service employment.
I Marine Industries Global Market Analysis (2006) Douglas-WestwoodII Afledt effekter af aktiviteter pa Esbjerg Havn (2005) Hahn-Pedersen and SondergaardIII The latest figure for Spain is from 2000; France and Netherlands from 2002; Belgium, Portugal and Poland from 2003;Ireland, Italy and Latvia from 2004.
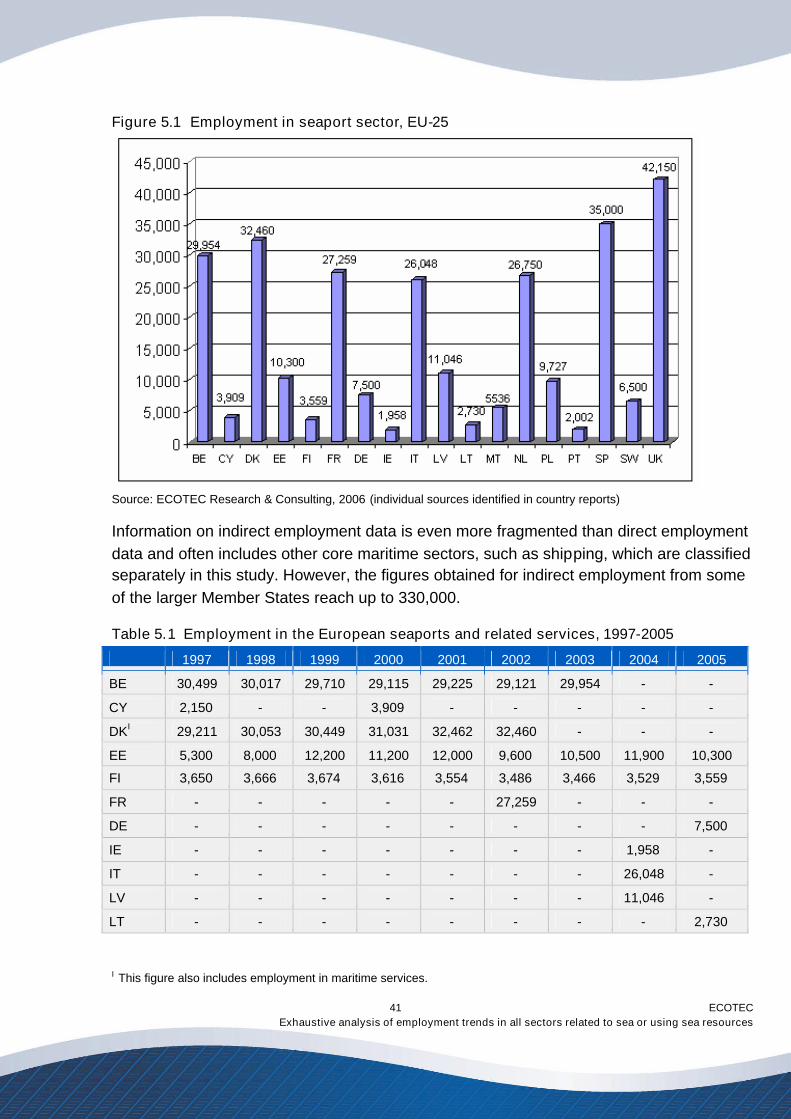
ECOTECExhaustive analysis of employment trends in all sectors related to sea or using sea resources
41
Figure 5.1 Employment in seaport sector, EU-25
Source: ECOTEC Research & Consulting, 2006 (individual sources identified in country reports)
Information on indirect employment data is even more fragmented than direct employmentdata and often includes other core maritime sectors, such as shipping, which are classifiedseparately in this study. However, the figures obtained for indirect employment from someof the larger Member States reach up to 330,000.
Table 5.1 Employment in the European seaports and related services, 1997-2005
1997 1998 1999 2000 2001 2002 2003 2004 2005
BE 30,499 30,017 29,710 29,115 29,225 29,121 29,954 - -
CY 2,150 - - 3,909 - - - - -
DKI 29,211 30,053 30,449 31,031 32,462 32,460 - - -
EE 5,300 8,000 12,200 11,200 12,000 9,600 10,500 11,900 10,300
FI 3,650 3,666 3,674 3,616 3,554 3,486 3,466 3,529 3,559
FR - - - - - 27,259 - - -
DE - - - - - - - - 7,500
IE - - - - - - - 1,958 -
IT - - - - - - - 26,048 -
LV - - - - - - - 11,046 -
LT - - - - - - - - 2,730
I This figure also includes employment in maritime services.
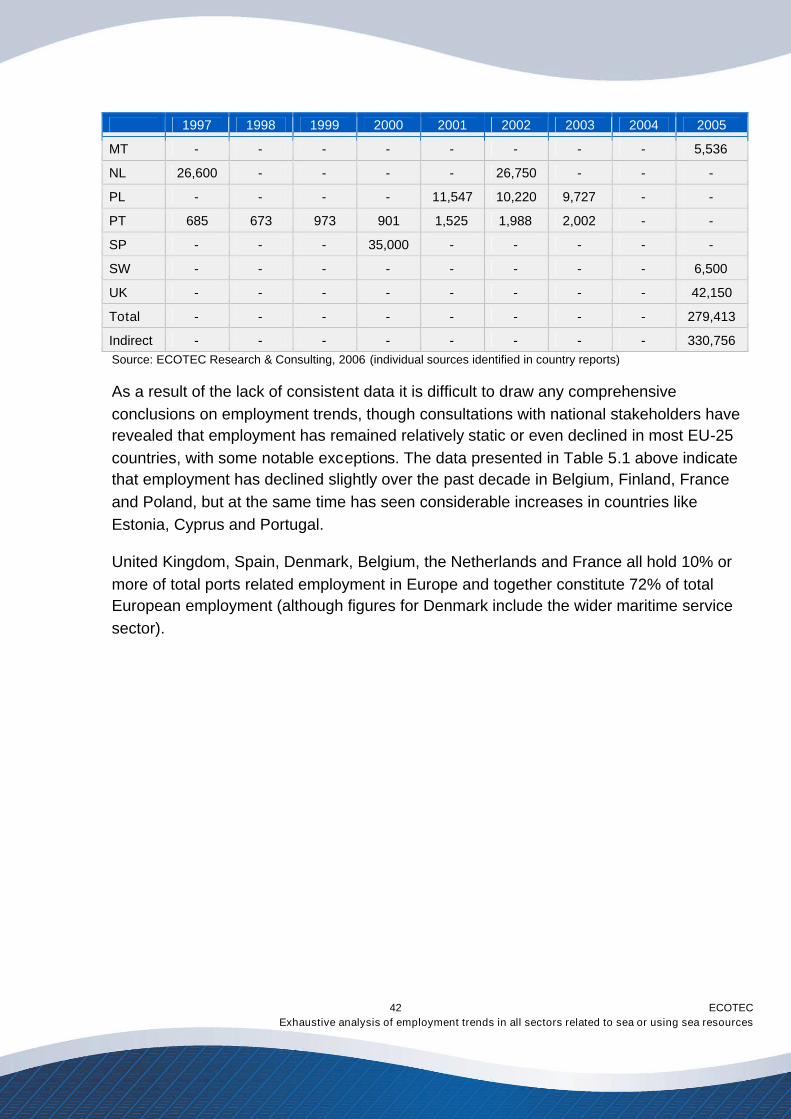
ECOTECExhaustive analysis of employment trends in all sectors related to sea or using sea resources
42
1997 1998 1999 2000 2001 2002 2003 2004 2005
MT - - - - - - - - 5,536
NL 26,600 - - - - 26,750 - - -
PL - - - - 11,547 10,220 9,727 - -
PT 685 673 973 901 1,525 1,988 2,002 - -
SP - - - 35,000 - - - - -
SW - - - - - - - - 6,500
UK - - - - - - - - 42,150
Total - - - - - - - - 279,413
Indirect - - - - - - - - 330,756Source: ECOTEC Research & Consulting, 2006 (individual sources identified in country reports)
As a result of the lack of consistent data it is difficult to draw any comprehensiveconclusions on employment trends, though consultations with national stakeholders haverevealed that employment has remained relatively static or even declined in most EU-25countries, with some notable exceptions. The data presented in Table 5.1 above indicatethat employment has declined slightly over the past decade in Belgium, Finland, Franceand Poland, but at the same time has seen considerable increases in countries likeEstonia, Cyprus and Portugal.
United Kingdom, Spain, Denmark, Belgium, the Netherlands and France all hold 10% ormore of total ports related employment in Europe and together constitute 72% of totalEuropean employment (although figures for Denmark include the wider maritime servicesector).
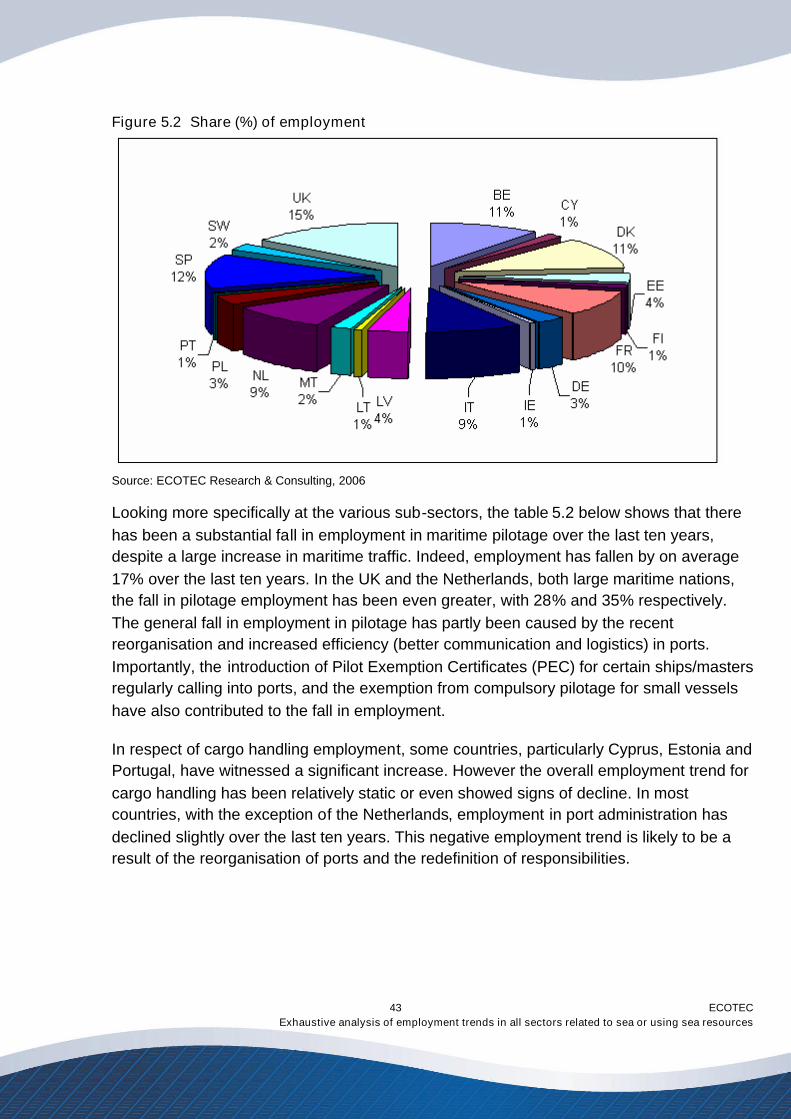
ECOTECExhaustive analysis of employment trends in all sectors related to sea or using sea resources
43
Figure 5.2 Share (%) of employment
Source: ECOTEC Research & Consulting, 2006
Looking more specifically at the various sub-sectors, the table 5.2 below shows that therehas been a substantial fall in employment in maritime pilotage over the last ten years,despite a large increase in maritime traffic. Indeed, employment has fallen by on average17% over the last ten years. In the UK and the Netherlands, both large maritime nations,the fall in pilotage employment has been even greater, with 28% and 35% respectively.The general fall in employment in pilotage has partly been caused by the recentreorganisation and increased efficiency (better communication and logistics) in ports.Importantly, the introduction of Pilot Exemption Certificates (PEC) for certain ships/mastersregularly calling into ports, and the exemption from compulsory pilotage for small vesselshave also contributed to the fall in employment.
In respect of cargo handling employment, some countries, particularly Cyprus, Estonia andPortugal, have witnessed a significant increase. However the overall employment trend forcargo handling has been relatively static or even showed signs of decline. In mostcountries, with the exception of the Netherlands, employment in port administration hasdeclined slightly over the last ten years. This negative employment trend is likely to be aresult of the reorganisation of ports and the redefinition of responsibilities.
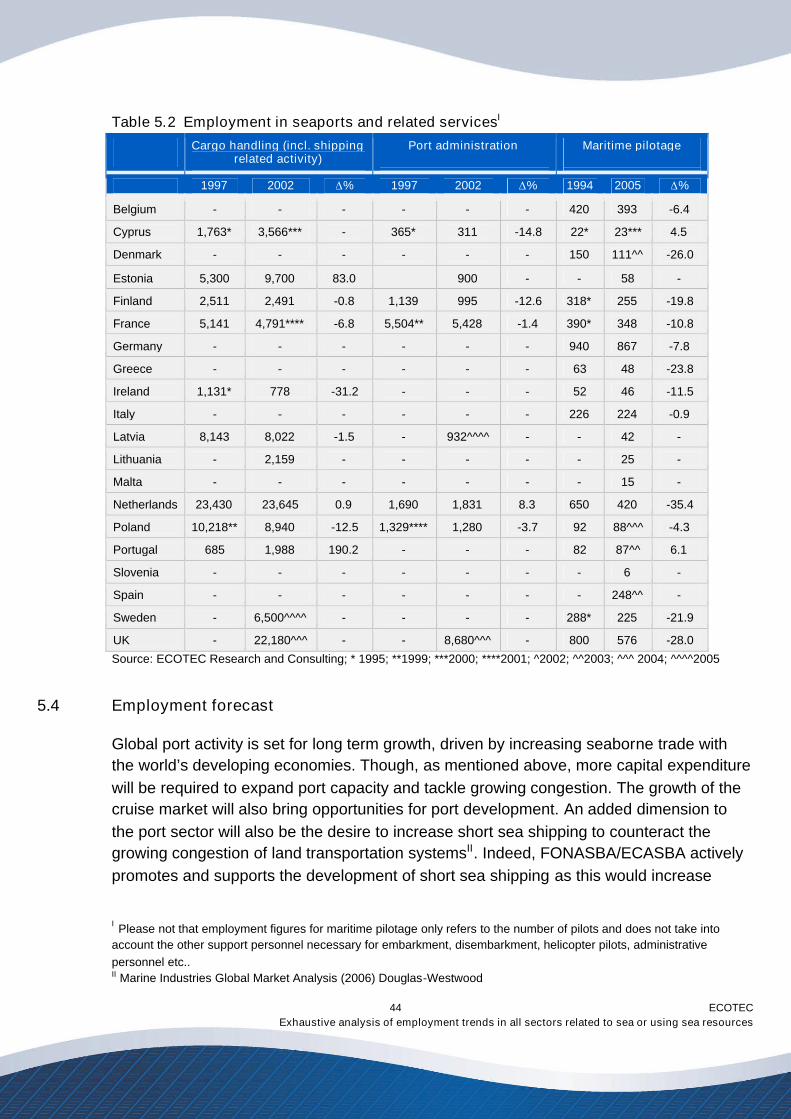
ECOTECExhaustive analysis of employment trends in all sectors related to sea or using sea resources
44
Table 5.2 Employment in seaports and related servicesI
Cargo handling (incl. shippingrelated activity)
Port administration Maritime pilotage
1997 2002 ∆% 1997 2002 ∆% 1994 2005 ∆%
Belgium - - - - - - 420 393 -6.4
Cyprus 1,763* 3,566*** - 365* 311 -14.8 22* 23*** 4.5
Denmark - - - - - - 150 111^^ -26.0
Estonia 5,300 9,700 83.0 900 - - 58 -
Finland 2,511 2,491 -0.8 1,139 995 -12.6 318* 255 -19.8
France 5,141 4,791**** -6.8 5,504** 5,428 -1.4 390* 348 -10.8
Germany - - - - - - 940 867 -7.8
Greece - - - - - - 63 48 -23.8
Ireland 1,131* 778 -31.2 - - - 52 46 -11.5
Italy - - - - - - 226 224 -0.9
Latvia 8,143 8,022 -1.5 - 932^^^^ - - 42 -
Lithuania - 2,159 - - - - - 25 -
Malta - - - - - - - 15 -
Netherlands 23,430 23,645 0.9 1,690 1,831 8.3 650 420 -35.4
Poland 10,218** 8,940 -12.5 1,329**** 1,280 -3.7 92 88^^^ -4.3
Portugal 685 1,988 190.2 - - - 82 87^^ 6.1
Slovenia - - - - - - - 6 -
Spain - - - - - - - 248^^ -
Sweden - 6,500^^^^ - - - - 288* 225 -21.9
UK - 22,180^^^ - - 8,680^^^ - 800 576 -28.0
Source: ECOTEC Research and Consulting; * 1995; **1999; ***2000; ****2001; ^2002; ^^2003; ^^^ 2004; ^^^^2005
5.4 Employment forecast
Global port activity is set for long term growth, driven by increasing seaborne trade withthe world’s developing economies. Though, as mentioned above, more capital expenditurewill be required to expand port capacity and tackle growing congestion. The growth of thecruise market will also bring opportunities for port development. An added dimension tothe port sector will also be the desire to increase short sea shipping to counteract thegrowing congestion of land transportation systemsII. Indeed, FONASBA/ECASBA activelypromotes and supports the development of short sea shipping as this would increase
I Please not that employment figures for maritime pilotage only refers to the number of pilots and does not take intoaccount the other support personnel necessary for embarkment, disembarkment, helicopter pilots, administrativepersonnel etc..II Marine Industries Global Market Analysis (2006) Douglas-Westwood
ECOTECExhaustive analysis of employment trends in all sectors related to sea or using sea resources
45
employment in ship brokerage and agency in smaller ports that currently do not benefit asmuch as the larger ports. Moreover, it would help to regenerate peripheral economies andgenerate employment in areas of high unemployment.
Despite this positive outlook it is projected that there will only be relatively small changesin sea port employment over the next few years. There are many reasons for this. Firstly,the increasing privatisation of ports is likely to lead to operational efficiency savings.Secondly, investment in new technology (more modern ships and handling technology) byboth seaport and shipping companies will reduce labour intensity. Finally, the increasingtrend towards greater concentration of activity around a number of logistics centres is likelyto lead to significant efficiency gains through economies of scale. As an example, almost70% of the total goods transport in Danish ports was concentrated in the ten largest trafficports in 2001. Within the next few years, this concentration of traffic is likely to increase to80-85 percentI. The same tendency is seen all over Europe and as a result many ports willhave to decide whether they want to compete with other ports or whether they should giveway for housing development or focus on tourism.
The recent rejection by the European Parliament of Port Package II, which would haveintroduced sweeping changes and liberalisation in the operation of ports, for exampleauthorising ship crews to unload ships themselves and ship owners to run freightterminals, is believed to have been important for the future of the port sector. Indeed,according to the trade unions, the proposal would have meant the loss of thousands ofjobs and the deterioration of social standards. For some port operators and employers’organisations, the proposed measures did not go far enough towards creating greatercompetition for the provision of different ports services. Some critics say that the PortsPackage II would have achieved the contrary of what it set out to do, namely to secure thefuture of Europe's portsII.
In respect of maritime pilotage, it is not expected that there will be a further fall inemployment. Indeed, EMPA has become increasingly concerned about the recent declinein the number of pilots and warns that a critical point has been reached for pilot services.EMPA also suggests that workloads cannot be increased further, nor can costs be furtherreduced without jeopardising the overall quality of the pilot services. Policy makerstherefore need to put more focus on the consolidation of existing pilot services and thefuture demand for pilots due to the increase of maritime trafficIII.
I The leading harbours of the future (2002) Jensen (www.covi.dk)II EurActiv (19th January 2006) Parliament rejects port services directive;http://www.euractiv.com/en/socialeurope/parliament-rejects-port-services-directive/article-151713III EMPA (2006) http://www.empa-pilots.org/pdf/EMPA%20Maritime%20Policy.pdf
ECOTECExhaustive analysis of employment trends in all sectors related to sea or using sea resources
46
5.5 Skill needs and labour availability
The skill demands on people working in sea ports as cargo handlers are generallyspeaking relatively low. However the skill requirements may vary widely between sea portcompanies depending on what kind of cargo handling they are involved in. Moreover, thedemand for specialised skills are continuously increasing and more and more companiesare demanding that their employees are well educated, have ICT experience and haveappropriate language skills.
The sector has historically recruited people at a young age and provided training on thejob. However, as the public profile of the seaport sector is declining and new opportunitiesare becoming scarce - as reflected by the lack of employment growth – it has becomeincreasingly difficult to recruit new labour. Most of the new recruits, particularly in cargohandling, ship brokerage and ship agency, generally have a relative that works within thesector.
Sea port administrations and related services sector (pilotage, towage, harbour master,ship survey, traffic services, international organisations) offer good employmentopportunities for employees from other maritime sectors, particularly former sea farers. Atthe same time, workforce mobility from the sea ports sector to other maritime sectors isconsidered to be relatively low in most EU countries. To some extent this explains therelatively low staff turnover that characterises the sector in most countries.
In respect of maritime pilotage, reports have shown that many European countries arefacing growing difficulties in finding qualified applicants for pilot services. This is largelyconnected to fact that there are decreasing numbers of experienced officers and masters,which affects the maritime pilotage sector as the minimum qualification for becoming apilot in Europe is mostly experience as a master or chief officer. A further problem withrecruitment is that the pool of potential applicants is not as international as the supply ofseafarers. Although all citizens of the European Union can apply, requirements regardinglanguage and place of residence reduce professional mobility and restrict the number ofpotential applicants. A number of intensive recruitment campaigns have managed toreduce the labour shortage to some extent, but it remains difficult to replace pilots whotake retirement or to account for the increased trafficI.
Finally, the increasingly important role of European seaports as strategic logistics centresis increasing demand for highly skilled experts in transport and logistics. Indeed, thevertical integration strategies of the market players have blurred the traditional division oftasks within the logistics chain. This development in Europe is enhanced by the
I EMPA (2006)

ECOTECExhaustive analysis of employment trends in all sectors related to sea or using sea resources
47
increasingly interlinked land-based and maritime transport corridors, which are beingfurther developed for example with the EU support (e.g. TEN-T).
ECOTECExhaustive analysis of employment trends in all sectors related to sea or using sea resources
48
6.0 Recreational boating
The recreational boating sector comprises of boat builders; marine engine manufacturers;high technology electronics companies; equipment manufacturers; builders and operatorsof supporting infrastructure; and trade and service providers.
European residents I own 6 million boats, not including canoes, kayaks, sailboards andother small boats (those under 2.5m or lightweight inflatables). An estimated 32 millionEuropean residents participated in recreational boating activities on an annual basis. Boatownership per head is particularly high in the Scandinavian countries, almost ten timesthat of other countries. Similarly, the boat parks in these countries are around a third of thetotal, which is significant given that the residents of these countries only account foraround 4% of the total population in Europe. In Europe the main type of boats used aresailing boats, whilst in North America motor boats and power boats are more common.
Although the European market is relatively small compared to the North American market,growth over the last 12 years has been steady in most parts of the EU and there iscurrently no sign that the public's appetite for boating will diminishII. A slowdown has beenexperienced in Germany – mainly as a result of the general economic and labour marketdifficulties, and the Netherlands, reflecting the low confidence of its neighbourIII.
The industry is highly competitive and strongly underpinned by modern and advancedproduction engineering. Currently, the EU is the global leader in super yachts, productionsailing yachts and custom and semi-custom power yachtsIV. Indeed, Italy remains theleading producer of yachts in the world, followed by the US, the Netherlands and the UK.Germany (6), Denmark (9) and France (10) also make into the top ten of yacht buildingnations.
6.1 Economic impact
In the European Overview 2004V it was estimated that the recreational boating industrycomprised some 37,200 businesses generating in the region of €23.4 billion in revenue in
I Including Norway, Switzerland, Croatia, Romania, Bulgaria and Turkey.II Towards a Future Maritime Policy for the Union: A European Vision for the Oceans and the Sea from a RecreationalMarine Industry Perspective (2005) European Union Recreational Marine Industry Group (EURMIG)III Boating Industry Statistics 2004 (2005) ICOMIAIV Towards a Future Maritime Policy for the Union: A European Vision for the Oceans and the Sea from a RecreationalMarine Industry Perspective (2005) European Union Recreational Marine Industry Group (EURMIG)V European Overview 2004: Marine leisure industry at your fingertips (2004) British Marine Federation (Note that allvalues include six non-member countries, Norway, Croatia, Bulgaria, Switzerland, Romania and Turkey)
ECOTECExhaustive analysis of employment trends in all sectors related to sea or using sea resources
49
2003. Overall, the "big four" – Germany, France, Italy and the UK – accounted for two-thirds of retail spending and 63 percent of industry revenues. Retail spending in theScandinavian countries was estimated to be over 14 percent of the total. AlthoughGermany has experienced a slight decline in its recreational boating market, it still madethe largest contribution to spending - in line with its share of the population. In value terms,Italy is the largest marine leisure market, particularly in boat building, heavily influenced bythe super yacht and large yachts sector. France produces the greatest number of boats,accounting for 38 percent of the total in volume terms. Overall, 49,900 units weremanufactured in France in 2003, this includes the production of 8,900 sailboats. The UK isthe largest European producer of inboard/stern drive motor boats over 12m, with itsinternationally recognised brand. Production of exclusive, high value yachts over 24m(super yachts) in the Netherlands, Italy in Germany makes a very significant contribution tothe European recreational boating industry.
The most successful European businesses, whatever their size, have invested significantefforts in developing the export market. In fact, there is a strong correlation between failedbusinesses and those who attempted to serve only their domestic marketI. The value ofexports and imports in the EU-25 countries is outlined in the table 7.1 below.
Table 6.1 Value of imports and exports (€1,000), 2004
Imports Exports Balance of trade
Austria 34,505 27,625 - 6,880
Belgium 50,595 34,267 - 16,328
Cyprus 3,783 2,520 - 1,263
Czech Republic 1,096 344 - 752
Denmark 30,262 73,839 43,577
Estonia 5,807 6,667 860
Finland 28,245 63,520 35,275
France 395,700 550,000 154,300
Germany 97,404 744,853 647,449
Greece 53,859 3,738 - 50,121
Hungary 823 668 - 155
Ireland 5,526 1,992 - 3,534
Italy 304,000 983,000 679,000
Latvia 1,081 288 - 793
Lithuania 1,364 517 - 847
Luxembourg 585 - - 585
I Towards a Future Maritime Policy for the Union: A European Vision for the Oceans and the Sea from a RecreationalMarine Industry Perspective (2005) European Union Recreational Marine Industry Group (EURMIG)
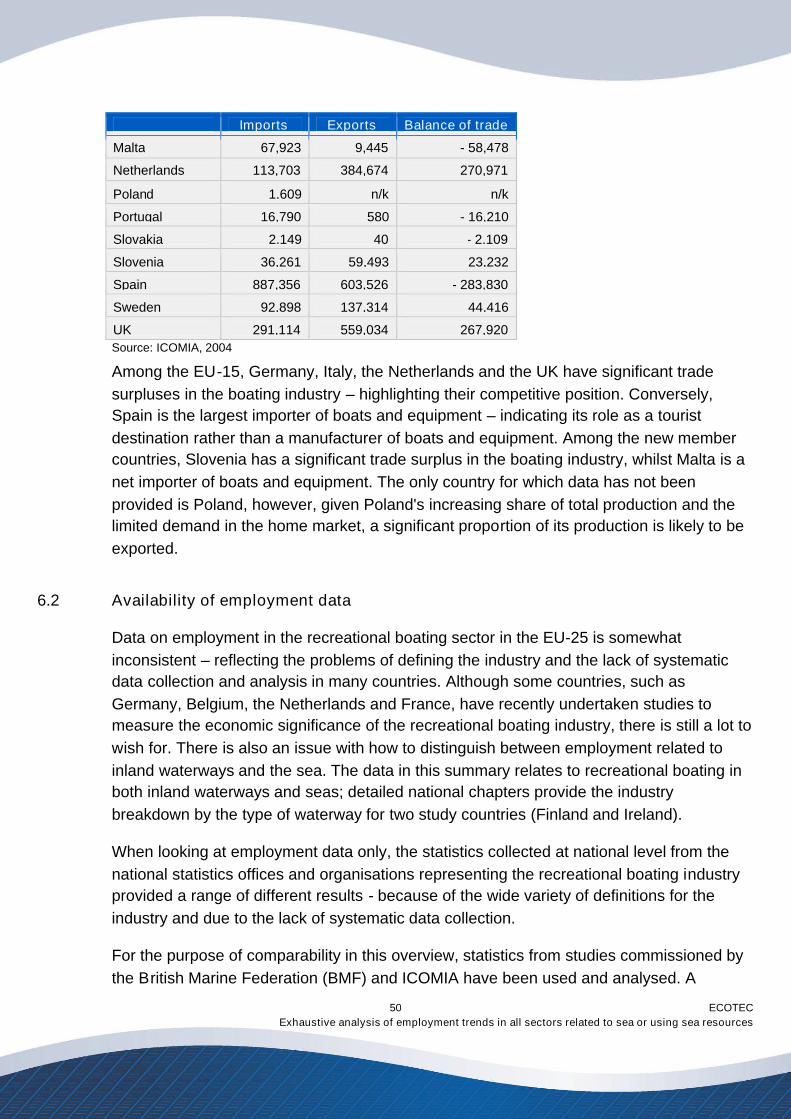
ECOTECExhaustive analysis of employment trends in all sectors related to sea or using sea resources
50
Imports Exports Balance of trade
Malta 67,923 9,445 - 58,478
Netherlands 113,703 384,674 270,971
Poland 1,609 n/k n/k
Portugal 16,790 580 - 16,210
Slovakia 2,149 40 - 2,109
Slovenia 36,261 59,493 23,232
Spain 887,356 603,526 - 283,830
Sweden 92,898 137,314 44,416
UK 291,114 559,034 267,920Source: ICOMIA, 2004
Among the EU-15, Germany, Italy, the Netherlands and the UK have significant tradesurpluses in the boating industry – highlighting their competitive position. Conversely,Spain is the largest importer of boats and equipment – indicating its role as a touristdestination rather than a manufacturer of boats and equipment. Among the new membercountries, Slovenia has a significant trade surplus in the boating industry, whilst Malta is anet importer of boats and equipment. The only country for which data has not beenprovided is Poland, however, given Poland's increasing share of total production and thelimited demand in the home market, a significant proportion of its production is likely to beexported.
6.2 Availability of employment data
Data on employment in the recreational boating sector in the EU-25 is somewhatinconsistent – reflecting the problems of defining the industry and the lack of systematicdata collection and analysis in many countries. Although some countries, such asGermany, Belgium, the Netherlands and France, have recently undertaken studies tomeasure the economic significance of the recreational boating industry, there is still a lot towish for. There is also an issue with how to distinguish between employment related toinland waterways and the sea. The data in this summary relates to recreational boating inboth inland waterways and seas; detailed national chapters provide the industrybreakdown by the type of waterway for two study countries (Finland and Ireland).
When looking at employment data only, the statistics collected at national level from thenational statistics offices and organisations representing the recreational boating industryprovided a range of different results - because of the wide variety of definitions for theindustry and due to the lack of systematic data collection.
For the purpose of comparability in this overview, statistics from studies commissioned bythe British Marine Federation (BMF) and ICOMIA have been used and analysed. A
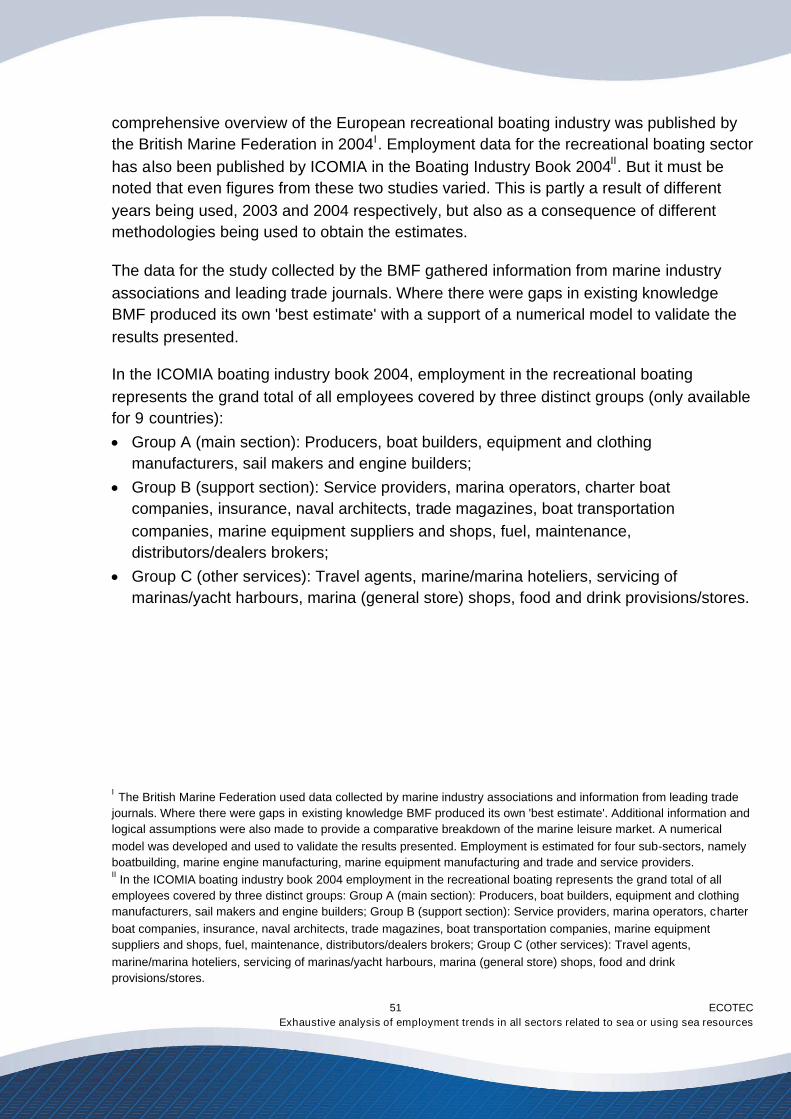
ECOTECExhaustive analysis of employment trends in all sectors related to sea or using sea resources
51
comprehensive overview of the European recreational boating industry was published bythe British Marine Federation in 2004I. Employment data for the recreational boating sectorhas also been published by ICOMIA in the Boating Industry Book 2004II. But it must benoted that even figures from these two studies varied. This is partly a result of differentyears being used, 2003 and 2004 respectively, but also as a consequence of differentmethodologies being used to obtain the estimates.
The data for the study collected by the BMF gathered information from marine industryassociations and leading trade journals. Where there were gaps in existing knowledgeBMF produced its own 'best estimate' with a support of a numerical model to validate theresults presented.
In the ICOMIA boating industry book 2004, employment in the recreational boatingrepresents the grand total of all employees covered by three distinct groups (only availablefor 9 countries): Group A (main section): Producers, boat builders, equipment and clothing
manufacturers, sail makers and engine builders; Group B (support section): Service providers, marina operators, charter boat
companies, insurance, naval architects, trade magazines, boat transportationcompanies, marine equipment suppliers and shops, fuel, maintenance,distributors/dealers brokers;
Group C (other services): Travel agents, marine/marina hoteliers, servicing ofmarinas/yacht harbours, marina (general store) shops, food and drink provisions/stores.
I The British Marine Federation used data collected by marine industry associations and information from leading tradejournals. Where there were gaps in existing knowledge BMF produced its own 'best estimate'. Additional information andlogical assumptions were also made to provide a comparative breakdown of the marine leisure market. A numericalmodel was developed and used to validate the results presented. Employment is estimated for four sub-sectors, namelyboatbuilding, marine engine manufacturing, marine equipment manufacturing and trade and service providers.II In the ICOMIA boating industry book 2004 employment in the recreational boating represents the grand total of allemployees covered by three distinct groups: Group A (main section): Producers, boat builders, equipment and clothingmanufacturers, sail makers and engine builders; Group B (support section): Service providers, marina operators, charterboat companies, insurance, naval architects, trade magazines, boat transportation companies, marine equipmentsuppliers and shops, fuel, maintenance, distributors/dealers brokers; Group C (other services): Travel agents,marine/marina hoteliers, servicing of marinas/yacht harbours, marina (general store) shops, food and drinkprovisions/stores.
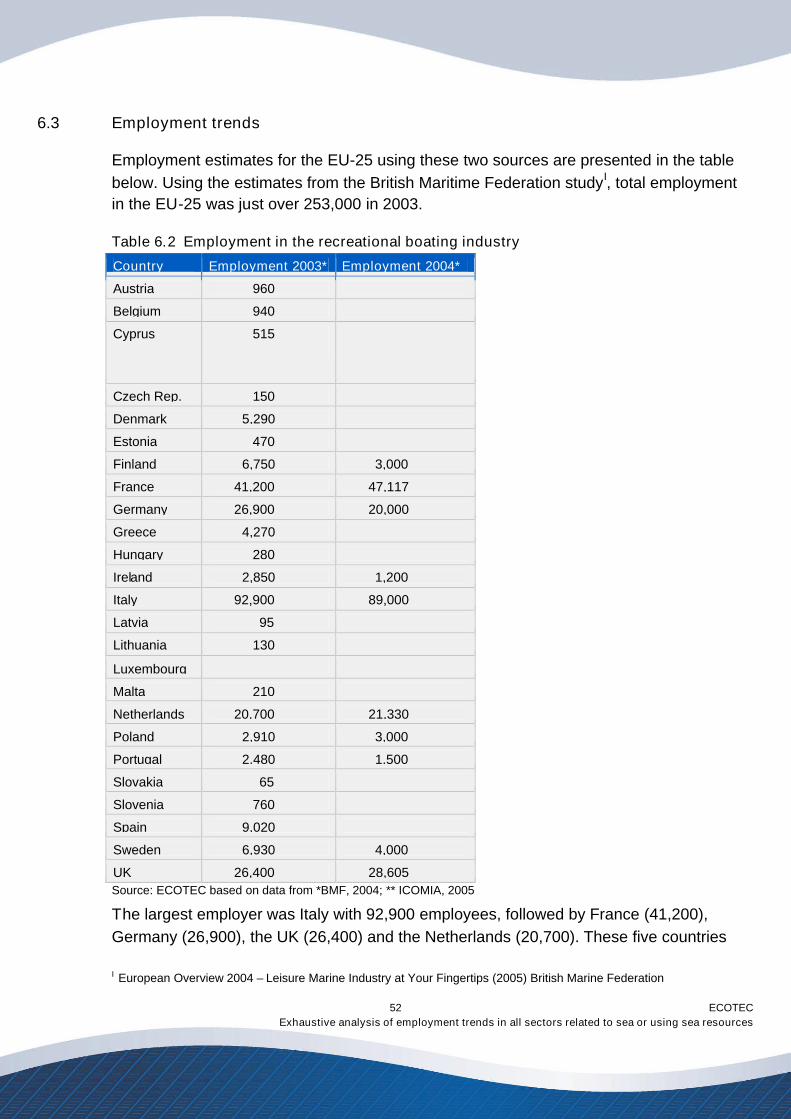
ECOTECExhaustive analysis of employment trends in all sectors related to sea or using sea resources
52
6.3 Employment trends
Employment estimates for the EU-25 using these two sources are presented in the tablebelow. Using the estimates from the British Maritime Federation studyI, total employmentin the EU-25 was just over 253,000 in 2003.
Table 6.2 Employment in the recreational boating industry
Country Employment 2003* Employment 2004*
Austria 960
Belgium 940
Cyprus 515
Czech Rep. 150
Denmark 5,290
Estonia 470
Finland 6,750 3,000
France 41,200 47,117
Germany 26,900 20,000
Greece 4,270
Hungary 280
Ireland 2,850 1,200
Italy 92,900 89,000
Latvia 95
Lithuania 130
Luxembourg
Malta 210
Netherlands 20,700 21,330
Poland 2,910 3,000
Portugal 2,480 1,500
Slovakia 65
Slovenia 760
Spain 9,020
Sweden 6,930 4,000
UK 26,400 28,605Source: ECOTEC based on data from *BMF, 2004; ** ICOMIA, 2005
The largest employer was Italy with 92,900 employees, followed by France (41,200),Germany (26,900), the UK (26,400) and the Netherlands (20,700). These five countries
I European Overview 2004 – Leisure Marine Industry at Your Fingertips (2005) British Marine Federation
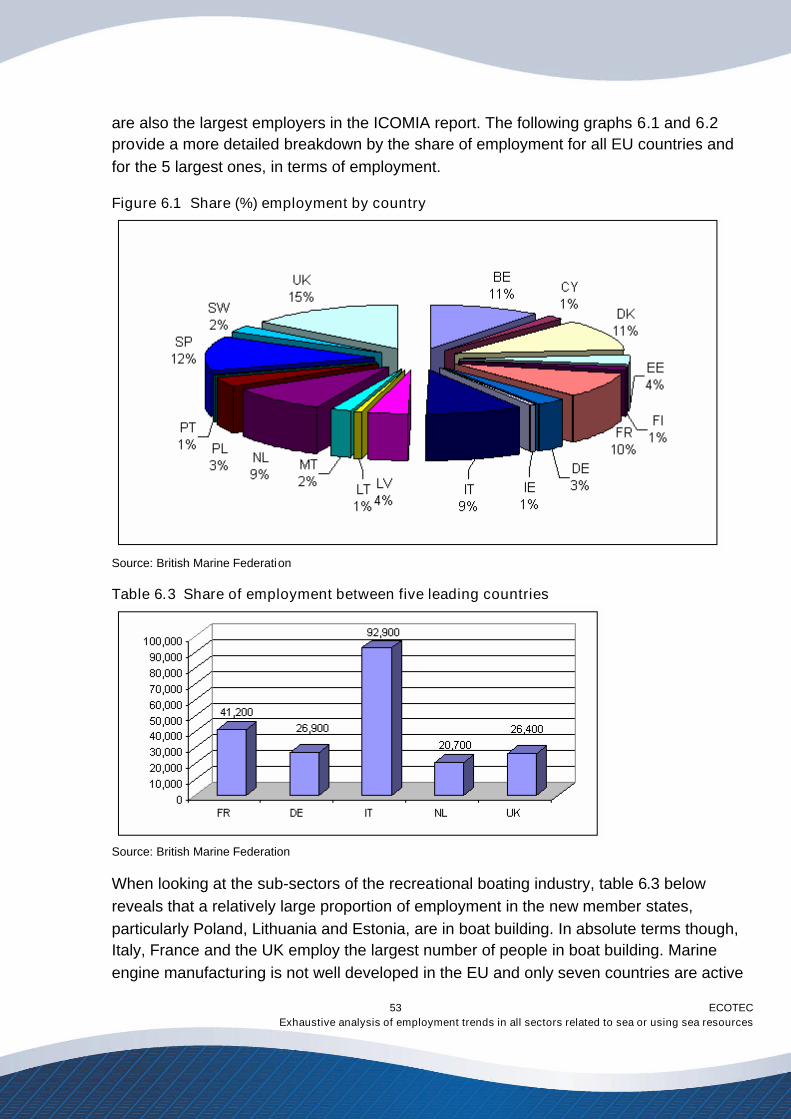
ECOTECExhaustive analysis of employment trends in all sectors related to sea or using sea resources
53
are also the largest employers in the ICOMIA report. The following graphs 6.1 and 6.2provide a more detailed breakdown by the share of employment for all EU countries andfor the 5 largest ones, in terms of employment.
Figure 6.1 Share (%) employment by country
Source: British Marine Federation
Table 6.3 Share of employment between five leading countries
Source: British Marine Federation
When looking at the sub-sectors of the recreational boating industry, table 6.3 belowreveals that a relatively large proportion of employment in the new member states,particularly Poland, Lithuania and Estonia, are in boat building. In absolute terms though,Italy, France and the UK employ the largest number of people in boat building. Marineengine manufacturing is not well developed in the EU and only seven countries are active
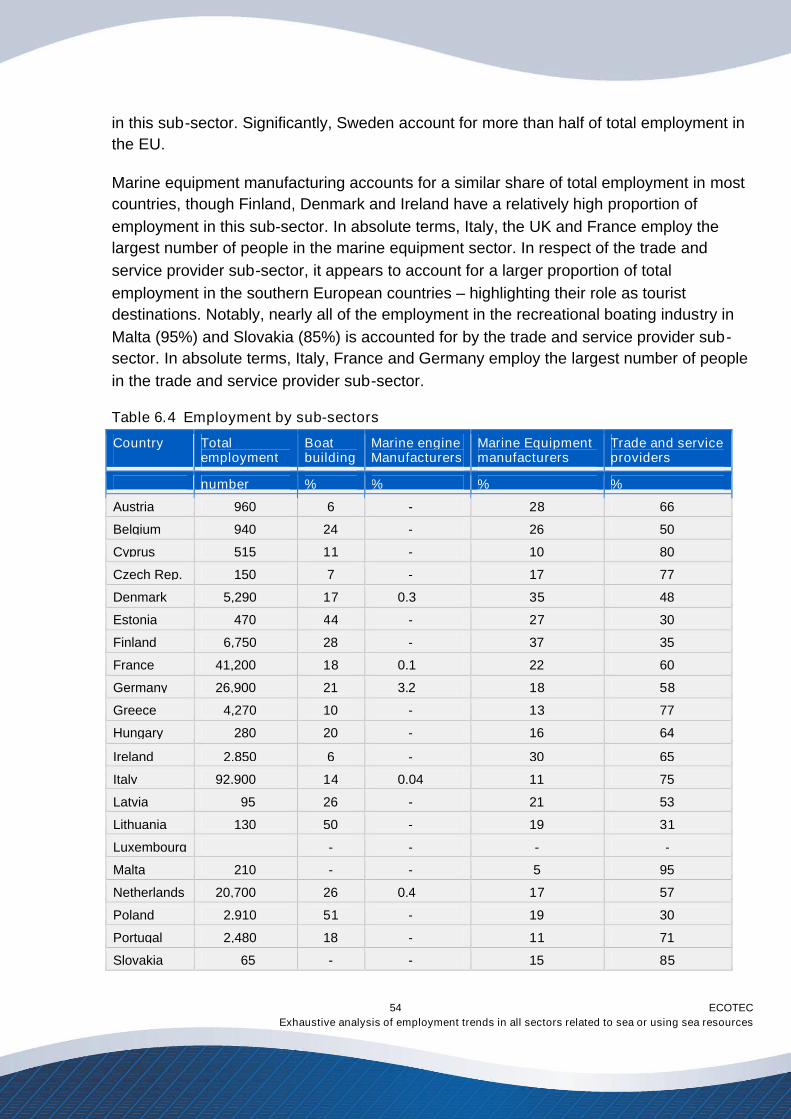
ECOTECExhaustive analysis of employment trends in all sectors related to sea or using sea resources
54
in this sub-sector. Significantly, Sweden account for more than half of total employment inthe EU.
Marine equipment manufacturing accounts for a similar share of total employment in mostcountries, though Finland, Denmark and Ireland have a relatively high proportion ofemployment in this sub-sector. In absolute terms, Italy, the UK and France employ thelargest number of people in the marine equipment sector. In respect of the trade andservice provider sub-sector, it appears to account for a larger proportion of totalemployment in the southern European countries – highlighting their role as touristdestinations. Notably, nearly all of the employment in the recreational boating industry inMalta (95%) and Slovakia (85%) is accounted for by the trade and service provider sub-sector. In absolute terms, Italy, France and Germany employ the largest number of peoplein the trade and service provider sub-sector.
Table 6.4 Employment by sub-sectors
Country Totalemployment
Boatbuilding
Marine engineManufacturers
Marine Equipmentmanufacturers
Trade and serviceproviders
number % % % %
Austria 960 6 - 28 66
Belgium 940 24 - 26 50
Cyprus 515 11 - 10 80
Czech Rep. 150 7 - 17 77
Denmark 5,290 17 0.3 35 48
Estonia 470 44 - 27 30
Finland 6,750 28 - 37 35
France 41,200 18 0.1 22 60
Germany 26,900 21 3.2 18 58
Greece 4,270 10 - 13 77
Hungary 280 20 - 16 64
Ireland 2,850 6 - 30 65
Italy 92,900 14 0.04 11 75
Latvia 95 26 - 21 53
Lithuania 130 50 - 19 31
Luxembourg - - - -
Malta 210 - - 5 95
Netherlands 20,700 26 0.4 17 57
Poland 2,910 51 - 19 30
Portugal 2,480 18 - 11 71
Slovakia 65 - - 15 85
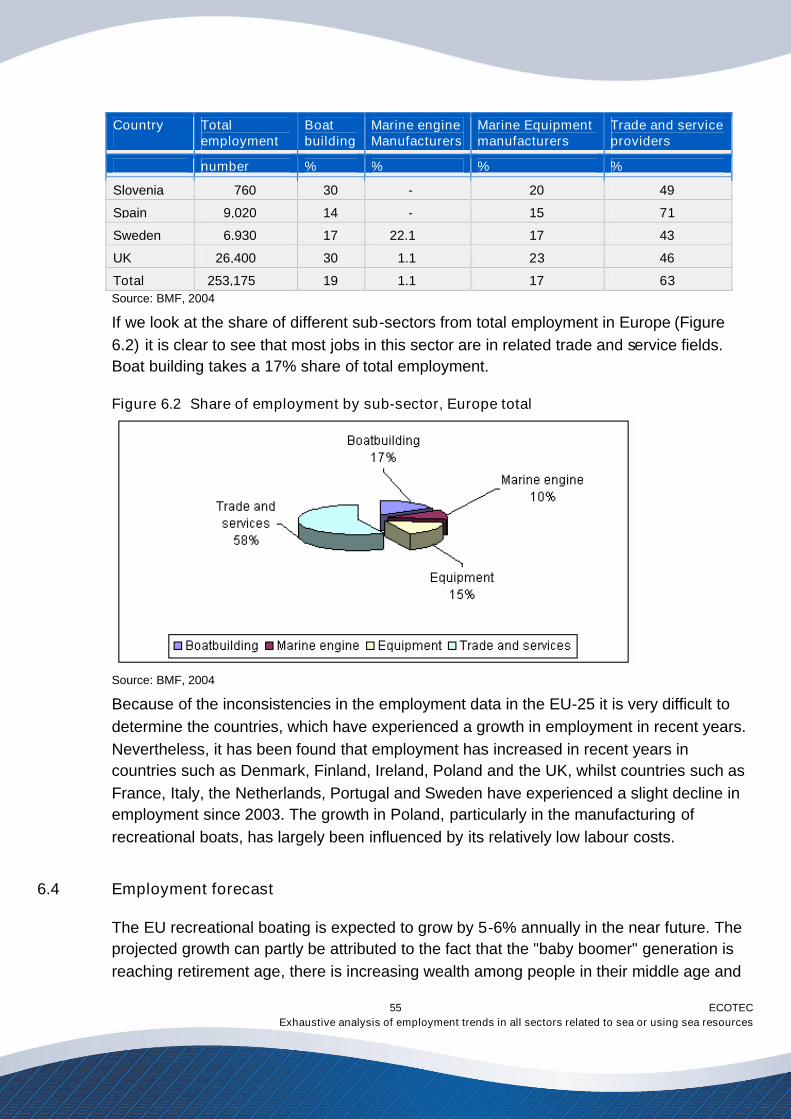
ECOTECExhaustive analysis of employment trends in all sectors related to sea or using sea resources
55
Country Totalemployment
Boatbuilding
Marine engineManufacturers
Marine Equipmentmanufacturers
Trade and serviceproviders
number % % % %
Slovenia 760 30 - 20 49
Spain 9,020 14 - 15 71
Sweden 6,930 17 22.1 17 43
UK 26,400 30 1.1 23 46
Total 253,175 19 1.1 17 63Source: BMF, 2004
If we look at the share of different sub-sectors from total employment in Europe (Figure6.2) it is clear to see that most jobs in this sector are in related trade and service fields.Boat building takes a 17% share of total employment.
Figure 6.2 Share of employment by sub-sector, Europe total
Source: BMF, 2004
Because of the inconsistencies in the employment data in the EU-25 it is very difficult todetermine the countries, which have experienced a growth in employment in recent years.Nevertheless, it has been found that employment has increased in recent years incountries such as Denmark, Finland, Ireland, Poland and the UK, whilst countries such asFrance, Italy, the Netherlands, Portugal and Sweden have experienced a slight decline inemployment since 2003. The growth in Poland, particularly in the manufacturing ofrecreational boats, has largely been influenced by its relatively low labour costs.
6.4 Employment forecast
The EU recreational boating is expected to grow by 5-6% annually in the near future. Theprojected growth can partly be attributed to the fact that the "baby boomer" generation isreaching retirement age, there is increasing wealth among people in their middle age and
ECOTECExhaustive analysis of employment trends in all sectors related to sea or using sea resources
56
more importantly there is huge potential in the emerging economies. Given that theindustry is relatively labour intensive, this growth in production is likely to have a positiveeffect on employment. In respect of the individual member countries, Poland has the mostpositive economic outlook and can expect to employ a greater number of people,particularly in boat building. Other countries that are expected to grow include Denmark,Finland, Germany and Ireland. Portugal on the other hand has a slightly weaker economicoutlook. Presumably, Portugal will remain an important tourism destination, but may losesome of its manufacturing activities to the emerging economies in Eastern Europe.
Despite this positive outlook, EURMIGI has identified a number of underlying weaknessesand challenges that need to be addressed by the industry in order to reach full economicand employment potential in the future:With SMEs making up 98 percent of all businesses in the industry, there is a lack of
corporate structure and experience in growing a business.The industry is particularly vulnerable to the economic cycle as a result of its
dependence on consumer’s discretionary expenditure. Importantly, SMEs are less ableto survive the bad times.
The main threat to the European recreational boating industry is that manufacturing maybe lost or outsourced to China, or other emerging economies in the Far East, wherelabour costs are significantly lower. Nevertheless, given that the sector needs skilledlabour, this threat is likely to be less limited.
The recreational boating industry is sensitive to sudden increases in costs and the fullimplications of the huge increase in the oil price, which has affected not only fuel costsbut industry raw materials too, are yet to be seen. Labour costs are also currentlyrelatively high in the EU, at least in the EU-15.
Outside the market leaders, businesses lack resources for research and development,which will be critical if they are to survive against increasing competition from emergingeconomies.
The multitude of regulations places a disproportionate burden on SMEs. Indeed, keepingup to date with their existence is challenging enough, let alone coping with the demandsof their implementation.
It is important to recall that recreational boating is not a mass production industry, evenin the engine sector. Companies operating in this field have to prepare customisedsolutions, often without being able to recover development costs through higher profitmargins as a result of price competition in the sector.
The industry has faced and continues to face significant pressures from environmentallegislation, despite industry representatives’ claims that environmental protection is a
I European Union Recreational Marine Industry Group (EURMIG)
ECOTECExhaustive analysis of employment trends in all sectors related to sea or using sea resources
57
core value of the industry. The requirement to reduce engine exhaust emissions hasbeen accepted and is being implemented.
The Habitats and Birds Directives have all but closed the development of yacht harboursin large areas along the EU’s coastlines. This has had a negative influence on thedevelopment of the industry with new boat purchases tending to be replacements forexisting boats rather than new entrants, as finding an available boat mooring becomesever more difficult. The demand for boat moorings is particularly high in Sweden and theUK.
The recreational boating industry faces commercial challenges from emergingeconomies in the equipment sector and this will soon spread to some of the massproduced smaller boats. Similar cost pressures are being faced from large UScorporations which are buying up smaller companies in certain sectors. With suchpressures significant consolidation can be expected in Europe in some segments overthe next 10-15 years.
Finally, in many member states there are challenges in recruiting, training and retaininga quality workforce.
6.5 Skills and Training
Overall, the European recreational boating sector faces challenges in recruiting, trainingand retaining skilled workers. This is partly a result of the highly specialised skills (e.g.working with materials such glass fibre etc) that are needed in the industry. Importantly,the recreational boasting industry is also different to other manufacturing industries, suchcar manufacturing, in that it is relatively labour intensive and that it is not producing for amass market. Generally, there is a shortage of engineering and technical staff, but inBelgium it has also been highlighted that there is a need for staff with specificadministrative and management knowledge. Administrative expertise is particularlyimportant given the substantial and complicated administrative requirements (regulations)in the sector. In Finland it has also been shown that there is a shortage of electricians,laminators and carpenters.
Although staff turnover is relatively low in northern Europe, there are some problems withretaining staff in the recreational boating industry, particularly in southern Europe. Givenrecent growth and increasing opportunities in the Eastern European countries, retainingstaff may become difficult in these countries as skilled labour may be tempted away fromthe countries or the sectorI.
I ICOMIA (2006)
ECOTECExhaustive analysis of employment trends in all sectors related to sea or using sea resources
58
7.0 Shipping
The European shipping industry plays a key role in global trade with the EEA registeredfleet representing 25% of the world tonnage and more than 40% of the global fleet iscontrolled by EEA based ownersI.
The growth in European shipping has been substantial over the past years. The EEAregistered fleet increased to about 26 % of the world fleet between 2003 and 2004. Thisrepresents an increase of more than 50 % compared to the previous year. Clearly thefleets of the new EU countries contributed to this but even without these fleets there wasgrowth of almost 5%.
7.1 Economic impact
The European shipping and maritime transport market has been estimated to be worth€151 billion in 2004II, with 90% of external trade and 40% of internal trade in EuropeanUnion being made by sea (in terms of value)III. The significance of the industry is alsodemonstrated by the fact that European shipping sector does not only play an importantrole in maritime transportation to and from Europe but also in the global trade by being animportant player in maritime transport between continents outside of Europe. In fact asubstantial share of the turnover of the EU's shipping is earned outside the EU.
In global terms the strength of the European maritime transport industry lies in the greatEuropean shipping heritage, high standards and quality and relatively efficiency of portcontrols in Europe. Many of the maritime administrations are also leading ones in theworld. The main threat for the industry is the difficulty in remaining competitive. This refers,for example, to labour costs and consequently, the representatives of the shipowners havestated that imposing rules for European shipowners that are not applicable to competitorscan put European shipping companies at a disadvantage. The European CommunityShipowners' Associations promote adoption of global guidelines for the shipping industry.The tools and policies that have been adopted at European and national levels to increasecompetitiveness of the European fleet and to improve the labour market situation of EUseafarers are discussed in more detail in the policy section of this report.
I ECSA, 2005II Douglas-Westwood Ltd (2005) Global marine industries – global market analysis. Marine Institute.III European Commission, DG TREN.
ECOTECExhaustive analysis of employment trends in all sectors related to sea or using sea resources
59
7.2 Availability of employment data
It is widely recognised that the presentation of an accurate picture of the seafaringworkforce is rendered difficult by the specific characteristics of the industry, such as theflag and registration status, a lack of clarity over ship ownership and a lack of systematicdata collection at European level. The national statistical offices collect data for the sectorof ‘sea and coastal water transport’ but these figures only cover a small proportion of totalemployment in the shipping sector as many European ships are registered in countriesoutside of Europe and are not always in a position of having to clarify the level ofemployment in Europe. Furthermore, many European vessels sail from continent tocontinent outside of Europe and crews can often be employed on short term contracts. Allthese factors complicate the projection of employment in this sector.
The following table gathers employment data for the shipping sector, collected fromnational cluster studies, national shipowners organisations, shipping registries, nationalministries and sectoral trade unions. It must be noted here that these employment figures,almost without exceptionsI, include all employees regardless of their country of origin, andemployment in fleets registered under both EU and other countries. Consequently, theemployment figures are an over-estimation of employment generated for EU nationals orvessels registered under EU flags. Statistics also vary in a sense that in some countriesthe shipping sector workforce includes seafarers only, and in others seafarers as well asstaff in support services and shipping companies on shore.
7.3 Employment trends
The maritime transport sector provided a total of 303,000 jobs for EU and non-EUnationals in 2004/2005II under EU, EEA and third country flags. This largely speakingreflects employment of seafarers working on-board (active seafarers) and those working inshipping companies ashore.
I Exceptions are the landlocked countries Luxembourg, Hungary, Austria, Slovakia and Czech Republic, and Malta,Portugal and Luxembourg.II Includes 2004 figure for Belgium, Finland, Germany, Greece, Hungary, Ireland, Malta, and 2003 figure for the UK and2002 figure for Sweden and Denmark.
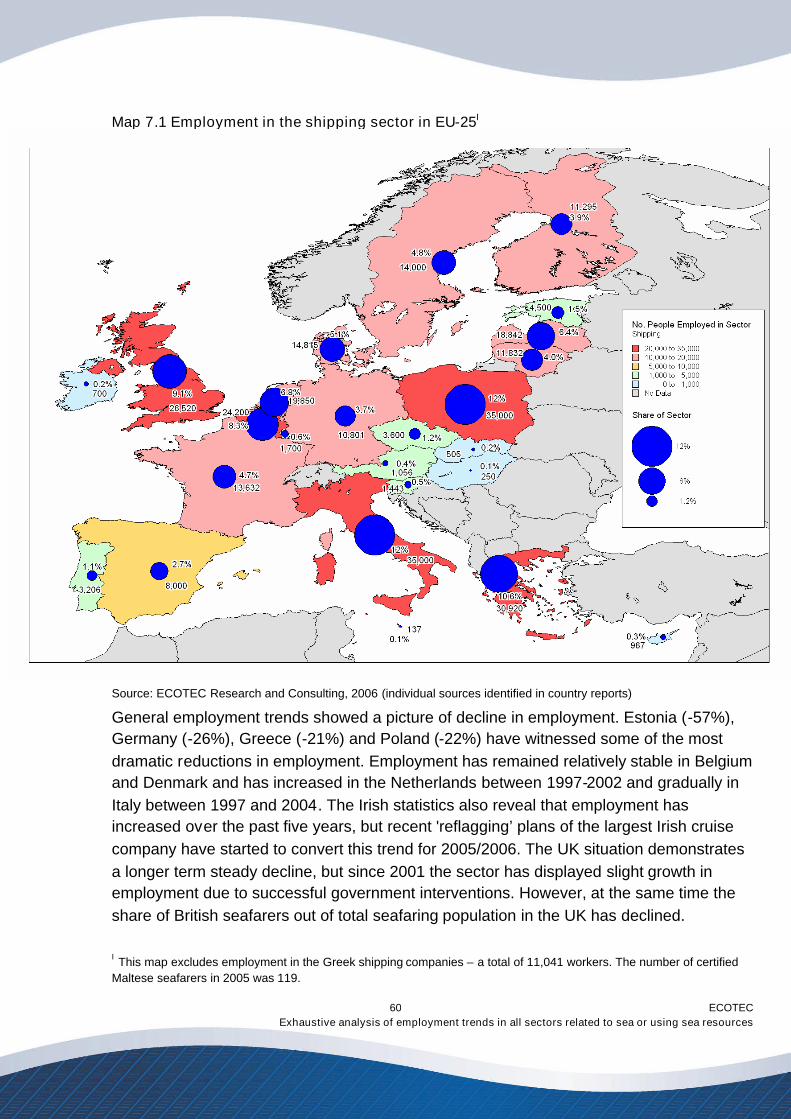
ECOTECExhaustive analysis of employment trends in all sectors related to sea or using sea resources
60
Map 7.1 Employment in the shipping sector in EU-25I
Source: ECOTEC Research and Consulting, 2006 (individual sources identified in country reports)
General employment trends showed a picture of decline in employment. Estonia (-57%),Germany (-26%), Greece (-21%) and Poland (-22%) have witnessed some of the mostdramatic reductions in employment. Employment has remained relatively stable in Belgiumand Denmark and has increased in the Netherlands between 1997-2002 and gradually inItaly between 1997 and 2004. The Irish statistics also reveal that employment hasincreased over the past five years, but recent 'reflagging’ plans of the largest Irish cruisecompany have started to convert this trend for 2005/2006. The UK situation demonstratesa longer term steady decline, but since 2001 the sector has displayed slight growth inemployment due to successful government interventions. However, at the same time theshare of British seafarers out of total seafaring population in the UK has declined.
I This map excludes employment in the Greek shipping companies – a total of 11,041 workers. The number of certifiedMaltese seafarers in 2005 was 119.
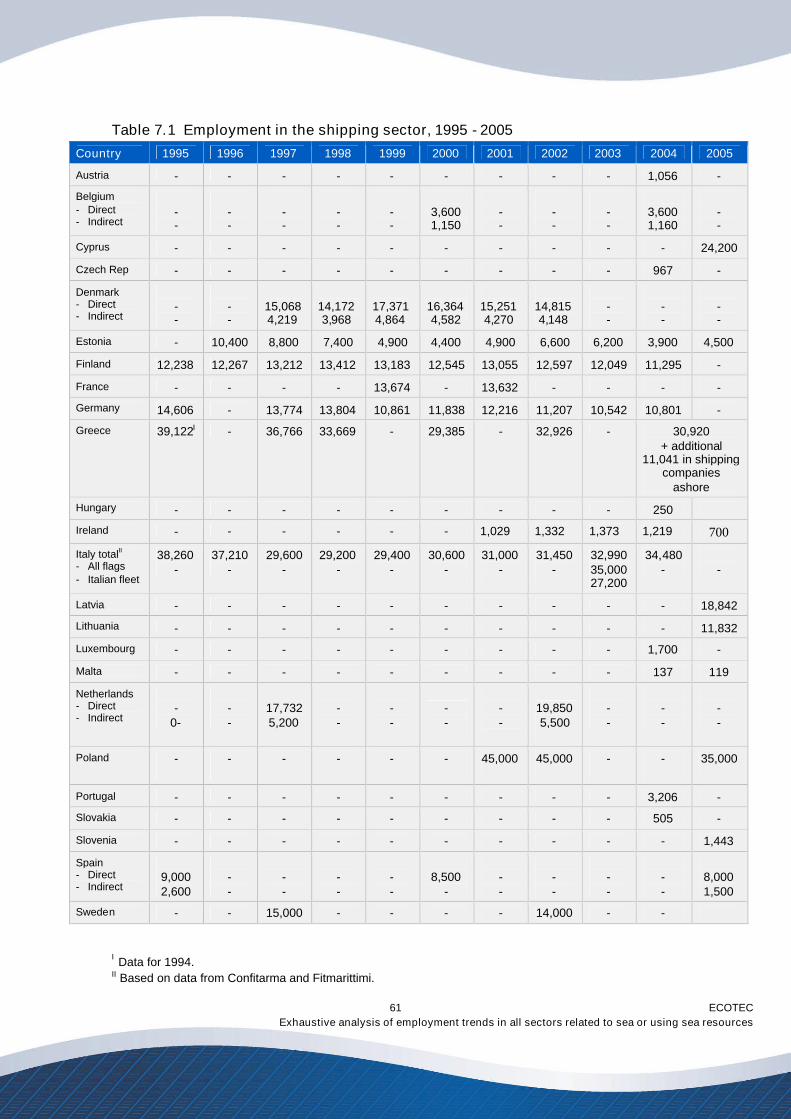
ECOTECExhaustive analysis of employment trends in all sectors related to sea or using sea resources
61
Table 7.1 Employment in the shipping sector, 1995 - 2005
Country 1995 1996 1997 1998 1999 2000 2001 2002 2003 2004 2005
Austria - - - - - - - - - 1,056 -
Belgium- Direct- Indirect
--
--
--
--
--
3,6001,150
--
--
--
3,6001,160
--
Cyprus - - - - - - - - - - 24,200
Czech Rep - - - - - - - - - 967 -
Denmark- Direct- Indirect
--
--
15,0684,219
14,1723,968
17,3714,864
16,3644,582
15,2514,270
14,8154,148
--
--
--
Estonia - 10,400 8,800 7,400 4,900 4,400 4,900 6,600 6,200 3,900 4,500
Finland 12,238 12,267 13,212 13,412 13,183 12,545 13,055 12,597 12,049 11,295 -
France - - - - 13,674 - 13,632 - - - -
Germany 14,606 - 13,774 13,804 10,861 11,838 12,216 11,207 10,542 10,801 -
Greece 39,122I - 36,766 33,669 - 29,385 - 32,926 - 30,920+ additional
11,041 in shippingcompanies
ashore
Hungary - - - - - - - - - 250
Ireland - - - - - - 1,029 1,332 1,373 1,219 700
Italy totalII
- All flags- Italian fleet
38,260-
37,210-
29,600-
29,200-
29,400-
30,600-
31,000-
31,450-
32,99035,00027,200
34,480- -
Latvia - - - - - - - - - - 18,842
Lithuania - - - - - - - - - - 11,832
Luxembourg - - - - - - - - - 1,700 -
Malta - - - - - - - - - 137 119
Netherlands- Direct- Indirect
-0-
--
17,7325,200
--
--
--
--
19,8505,500
--
--
--
Poland - - - - - - 45,000 45,000 - - 35,000
Portugal - - - - - - - - - 3,206 -
Slovakia - - - - - - - - - 505 -
Slovenia - - - - - - - - - - 1,443
Spain- Direct- Indirect
9,0002,600
--
--
--
--
8,500-
--
--
--
--
8,0001,500
Sweden - - 15,000 - - - - 14,000 - -
I Data for 1994.II Based on data from Confitarma and Fitmarittimi.
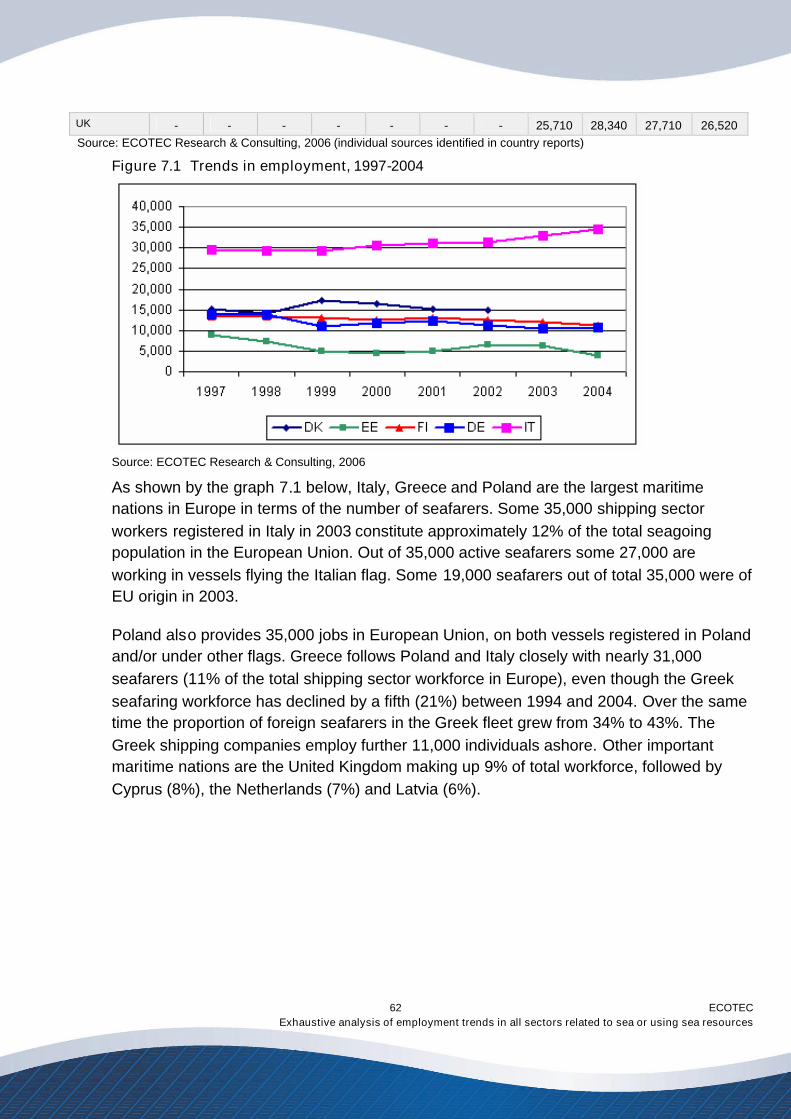
ECOTECExhaustive analysis of employment trends in all sectors related to sea or using sea resources
62
UK - - - - - - - 25,710 28,340 27,710 26,520Source: ECOTEC Research & Consulting, 2006 (individual sources identified in country reports)
Figure 7.1 Trends in employment, 1997-2004
Source: ECOTEC Research & Consulting, 2006
As shown by the graph 7.1 below, Italy, Greece and Poland are the largest maritimenations in Europe in terms of the number of seafarers. Some 35,000 shipping sectorworkers registered in Italy in 2003 constitute approximately 12% of the total seagoingpopulation in the European Union. Out of 35,000 active seafarers some 27,000 areworking in vessels flying the Italian flag. Some 19,000 seafarers out of total 35,000 were ofEU origin in 2003.
Poland also provides 35,000 jobs in European Union, on both vessels registered in Polandand/or under other flags. Greece follows Poland and Italy closely with nearly 31,000seafarers (11% of the total shipping sector workforce in Europe), even though the Greekseafaring workforce has declined by a fifth (21%) between 1994 and 2004. Over the sametime the proportion of foreign seafarers in the Greek fleet grew from 34% to 43%. TheGreek shipping companies employ further 11,000 individuals ashore. Other importantmaritime nations are the United Kingdom making up 9% of total workforce, followed byCyprus (8%), the Netherlands (7%) and Latvia (6%).
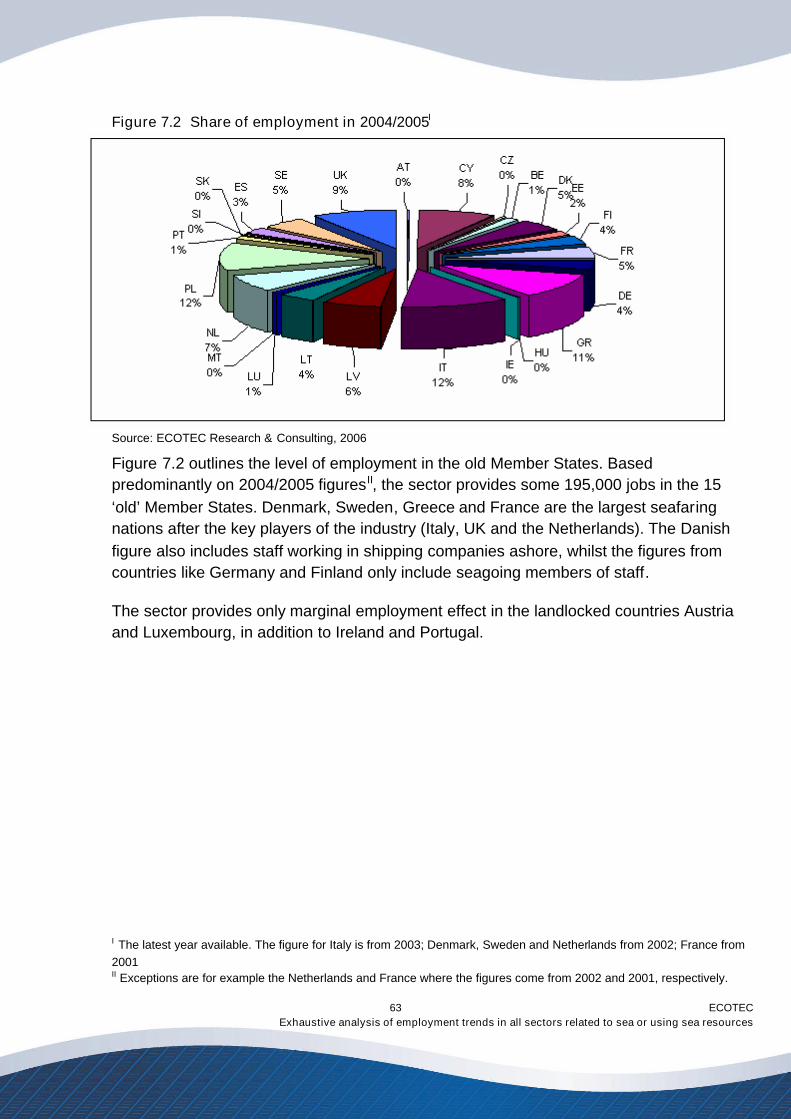
ECOTECExhaustive analysis of employment trends in all sectors related to sea or using sea resources
63
Figure 7.2 Share of employment in 2004/2005I
Source: ECOTEC Research & Consulting, 2006
Figure 7.2 outlines the level of employment in the old Member States. Basedpredominantly on 2004/2005 figuresII, the sector provides some 195,000 jobs in the 15‘old’ Member States. Denmark, Sweden, Greece and France are the largest seafaringnations after the key players of the industry (Italy, UK and the Netherlands). The Danishfigure also includes staff working in shipping companies ashore, whilst the figures fromcountries like Germany and Finland only include seagoing members of staff.
The sector provides only marginal employment effect in the landlocked countries Austriaand Luxembourg, in addition to Ireland and Portugal.
I The latest year available. The figure for Italy is from 2003; Denmark, Sweden and Netherlands from 2002; France from2001II Exceptions are for example the Netherlands and France where the figures come from 2002 and 2001, respectively.
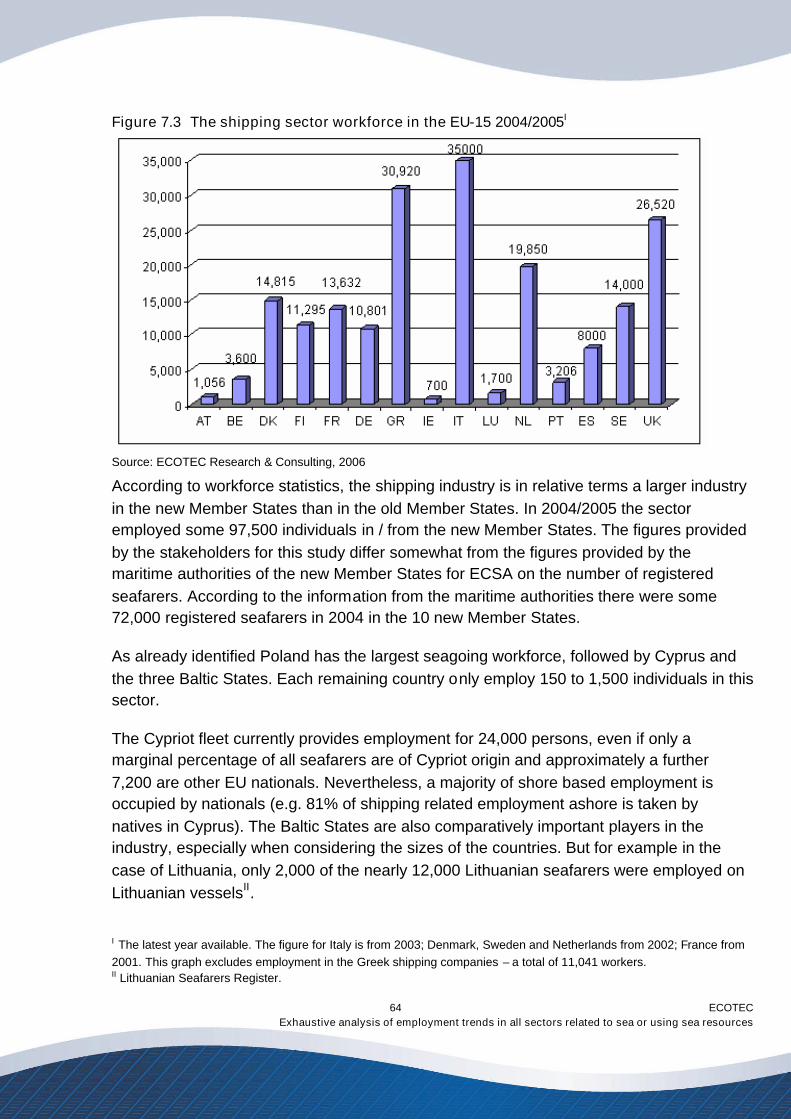
ECOTECExhaustive analysis of employment trends in all sectors related to sea or using sea resources
64
Figure 7.3 The shipping sector workforce in the EU-15 2004/2005I
Source: ECOTEC Research & Consulting, 2006
According to workforce statistics, the shipping industry is in relative terms a larger industryin the new Member States than in the old Member States. In 2004/2005 the sectoremployed some 97,500 individuals in / from the new Member States. The figures providedby the stakeholders for this study differ somewhat from the figures provided by themaritime authorities of the new Member States for ECSA on the number of registeredseafarers. According to the information from the maritime authorities there were some72,000 registered seafarers in 2004 in the 10 new Member States.
As already identified Poland has the largest seagoing workforce, followed by Cyprus andthe three Baltic States. Each remaining country only employ 150 to 1,500 individuals in thissector.
The Cypriot fleet currently provides employment for 24,000 persons, even if only amarginal percentage of all seafarers are of Cypriot origin and approximately a further7,200 are other EU nationals. Nevertheless, a majority of shore based employment isoccupied by nationals (e.g. 81% of shipping related employment ashore is taken bynatives in Cyprus). The Baltic States are also comparatively important players in theindustry, especially when considering the sizes of the countries. But for example in thecase of Lithuania, only 2,000 of the nearly 12,000 Lithuanian seafarers were employed onLithuanian vesselsII.
I The latest year available. The figure for Italy is from 2003; Denmark, Sweden and Netherlands from 2002; France from2001. This graph excludes employment in the Greek shipping companies – a total of 11,041 workers.II Lithuanian Seafarers Register.
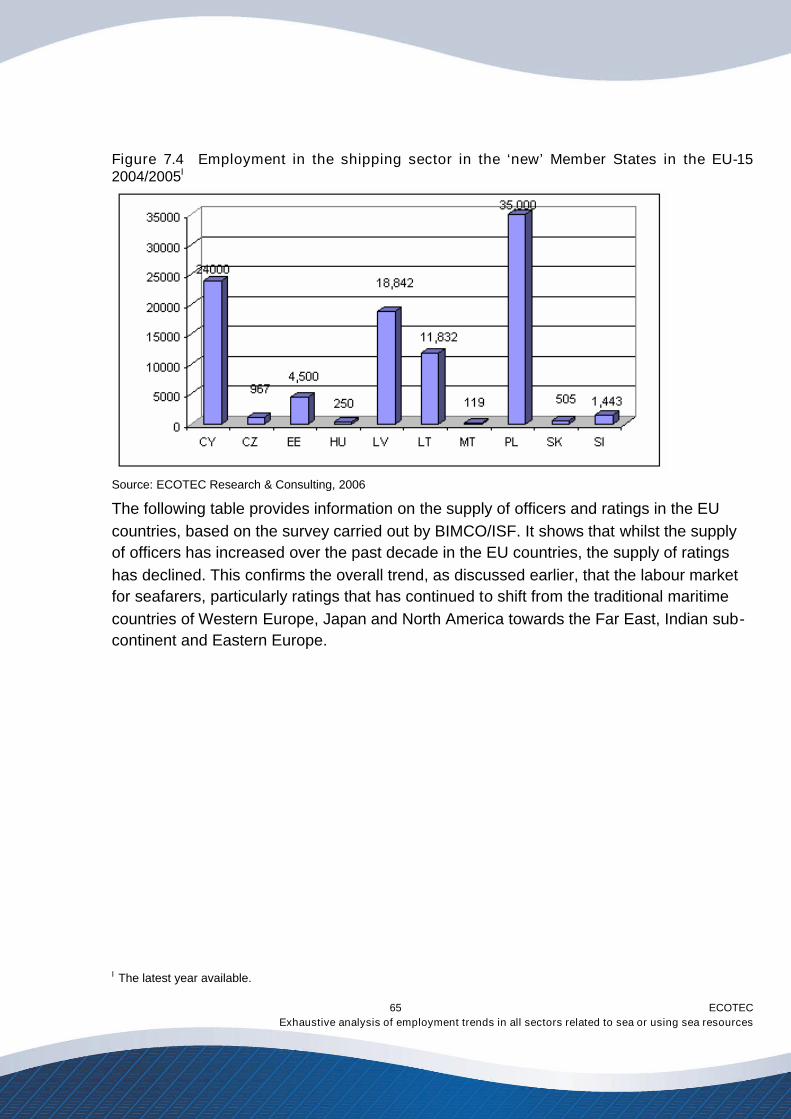
ECOTECExhaustive analysis of employment trends in all sectors related to sea or using sea resources
65
Figure 7.4 Employment in the shipping sector in the ‘new’ Member States in the EU-152004/2005I
Source: ECOTEC Research & Consulting, 2006
The following table provides information on the supply of officers and ratings in the EUcountries, based on the survey carried out by BIMCO/ISF. It shows that whilst the supplyof officers has increased over the past decade in the EU countries, the supply of ratingshas declined. This confirms the overall trend, as discussed earlier, that the labour marketfor seafarers, particularly ratings that has continued to shift from the traditional maritimecountries of Western Europe, Japan and North America towards the Far East, Indian sub-continent and Eastern Europe.
I The latest year available.
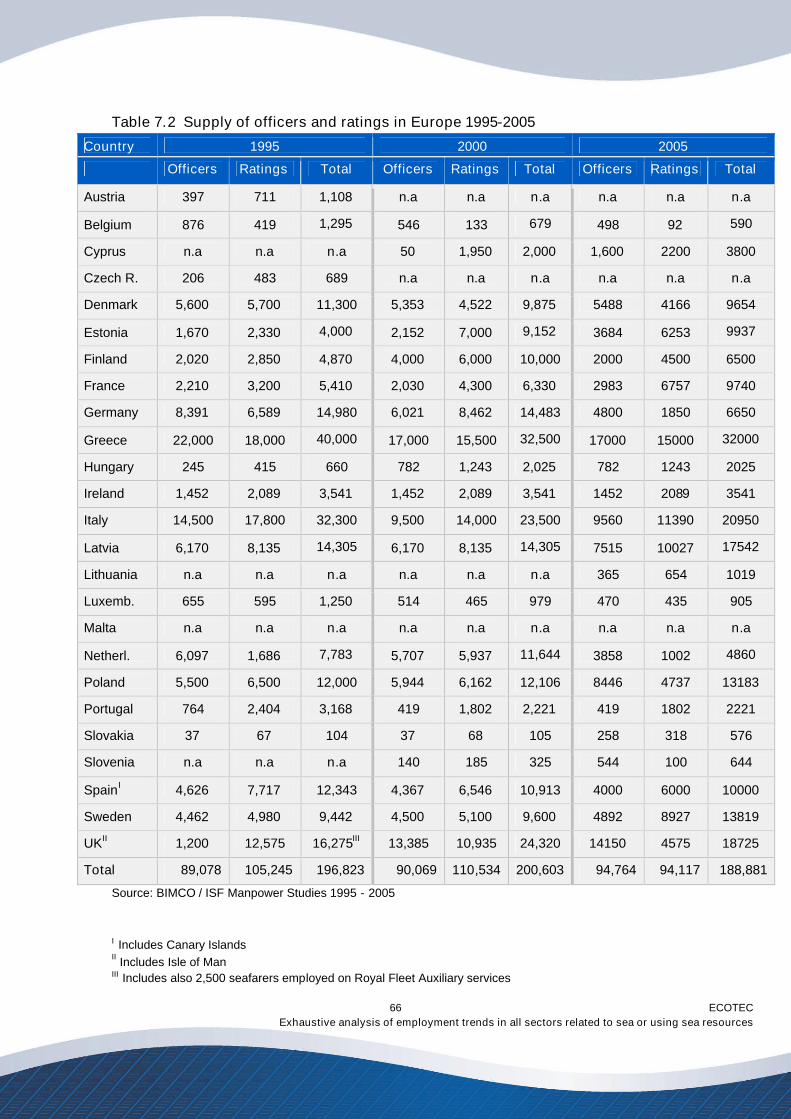
ECOTECExhaustive analysis of employment trends in all sectors related to sea or using sea resources
66
Table 7.2 Supply of officers and ratings in Europe 1995-2005
Country 1995 2000 2005
Officers Ratings Total Officers Ratings Total Officers Ratings Total
Austria 397 711 1,108 n.a n.a n.a n.a n.a n.a
Belgium 876 419 1,295 546 133 679 498 92 590
Cyprus n.a n.a n.a 50 1,950 2,000 1,600 2200 3800
Czech R. 206 483 689 n.a n.a n.a n.a n.a n.a
Denmark 5,600 5,700 11,300 5,353 4,522 9,875 5488 4166 9654
Estonia 1,670 2,330 4,000 2,152 7,000 9,152 3684 6253 9937
Finland 2,020 2,850 4,870 4,000 6,000 10,000 2000 4500 6500
France 2,210 3,200 5,410 2,030 4,300 6,330 2983 6757 9740
Germany 8,391 6,589 14,980 6,021 8,462 14,483 4800 1850 6650
Greece 22,000 18,000 40,000 17,000 15,500 32,500 17000 15000 32000
Hungary 245 415 660 782 1,243 2,025 782 1243 2025
Ireland 1,452 2,089 3,541 1,452 2,089 3,541 1452 2089 3541
Italy 14,500 17,800 32,300 9,500 14,000 23,500 9560 11390 20950
Latvia 6,170 8,135 14,305 6,170 8,135 14,305 7515 10027 17542
Lithuania n.a n.a n.a n.a n.a n.a 365 654 1019
Luxemb. 655 595 1,250 514 465 979 470 435 905
Malta n.a n.a n.a n.a n.a n.a n.a n.a n.a
Netherl. 6,097 1,686 7,783 5,707 5,937 11,644 3858 1002 4860
Poland 5,500 6,500 12,000 5,944 6,162 12,106 8446 4737 13183
Portugal 764 2,404 3,168 419 1,802 2,221 419 1802 2221
Slovakia 37 67 104 37 68 105 258 318 576
Slovenia n.a n.a n.a 140 185 325 544 100 644
SpainI 4,626 7,717 12,343 4,367 6,546 10,913 4000 6000 10000
Sweden 4,462 4,980 9,442 4,500 5,100 9,600 4892 8927 13819
UKII 1,200 12,575 16,275III 13,385 10,935 24,320 14150 4575 18725
Total 89,078 105,245 196,823 90,069 110,534 200,603 94,764 94,117 188,881
Source: BIMCO / ISF Manpower Studies 1995 - 2005
I Includes Canary IslandsII Includes Isle of ManIII Includes also 2,500 seafarers employed on Royal Fleet Auxiliary services
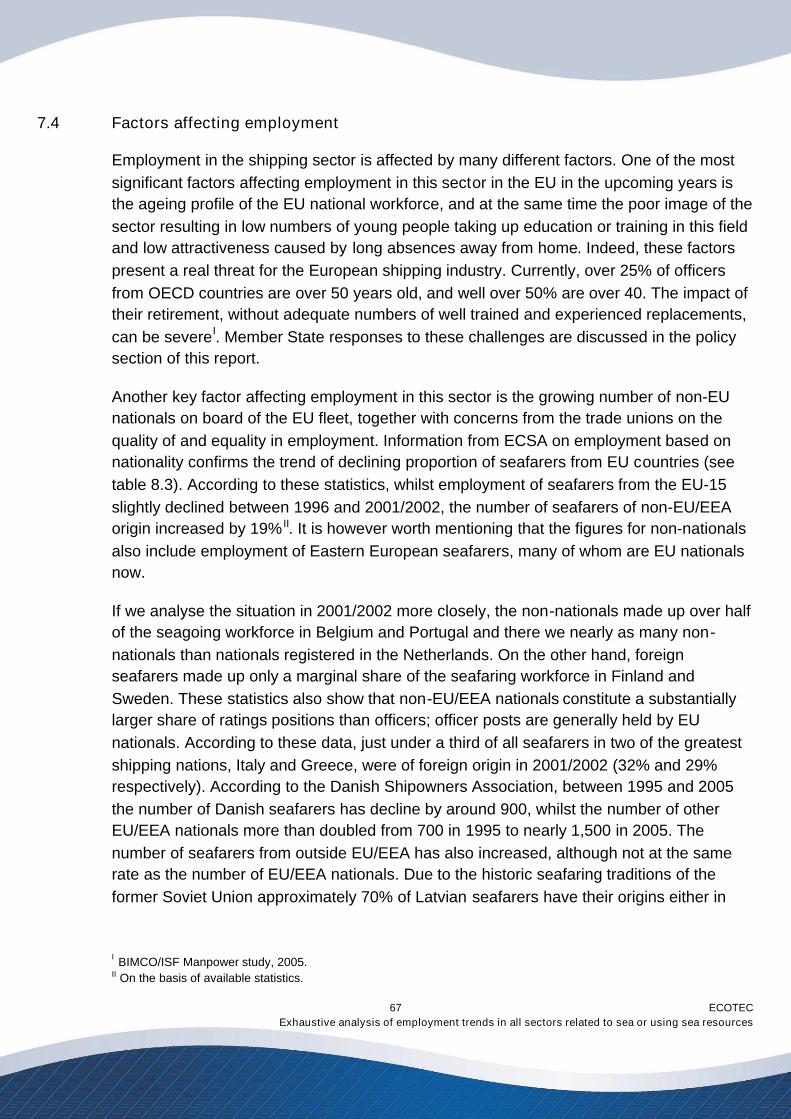
ECOTECExhaustive analysis of employment trends in all sectors related to sea or using sea resources
67
7.4 Factors affecting employment
Employment in the shipping sector is affected by many different factors. One of the mostsignificant factors affecting employment in this sector in the EU in the upcoming years isthe ageing profile of the EU national workforce, and at the same time the poor image of thesector resulting in low numbers of young people taking up education or training in this fieldand low attractiveness caused by long absences away from home. Indeed, these factorspresent a real threat for the European shipping industry. Currently, over 25% of officersfrom OECD countries are over 50 years old, and well over 50% are over 40. The impact oftheir retirement, without adequate numbers of well trained and experienced replacements,can be severeI. Member State responses to these challenges are discussed in the policysection of this report.
Another key factor affecting employment in this sector is the growing number of non-EUnationals on board of the EU fleet, together with concerns from the trade unions on thequality of and equality in employment. Information from ECSA on employment based onnationality confirms the trend of declining proportion of seafarers from EU countries (seetable 8.3). According to these statistics, whilst employment of seafarers from the EU-15slightly declined between 1996 and 2001/2002, the number of seafarers of non-EU/EEAorigin increased by 19% II. It is however worth mentioning that the figures for non-nationalsalso include employment of Eastern European seafarers, many of whom are EU nationalsnow.
If we analyse the situation in 2001/2002 more closely, the non-nationals made up over halfof the seagoing workforce in Belgium and Portugal and there we nearly as many non-nationals than nationals registered in the Netherlands. On the other hand, foreignseafarers made up only a marginal share of the seafaring workforce in Finland andSweden. These statistics also show that non-EU/EEA nationals constitute a substantiallylarger share of ratings positions than officers; officer posts are generally held by EUnationals. According to these data, just under a third of all seafarers in two of the greatestshipping nations, Italy and Greece, were of foreign origin in 2001/2002 (32% and 29%respectively). According to the Danish Shipowners Association, between 1995 and 2005the number of Danish seafarers has decline by around 900, whilst the number of otherEU/EEA nationals more than doubled from 700 in 1995 to nearly 1,500 in 2005. Thenumber of seafarers from outside EU/EEA has also increased, although not at the samerate as the number of EU/EEA nationals. Due to the historic seafaring traditions of theformer Soviet Union approximately 70% of Latvian seafarers have their origins either in
I BIMCO/ISF Manpower study, 2005.II On the basis of available statistics.
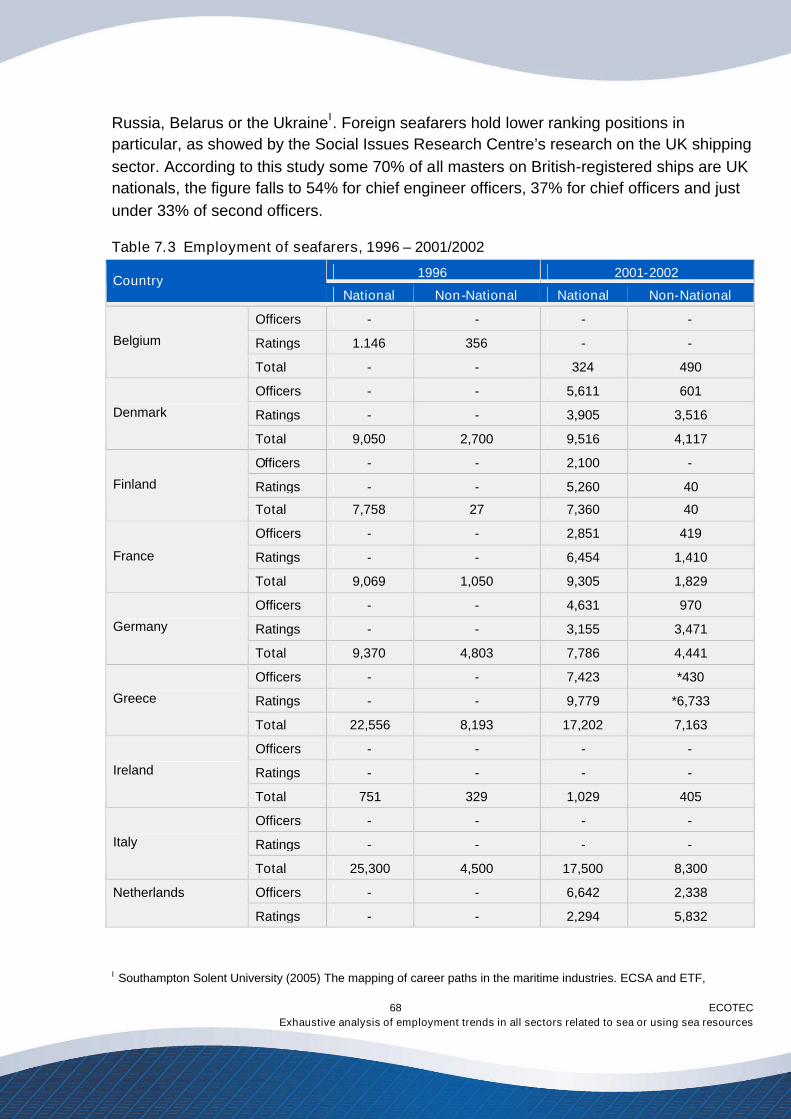
ECOTECExhaustive analysis of employment trends in all sectors related to sea or using sea resources
68
Russia, Belarus or the UkraineI. Foreign seafarers hold lower ranking positions inparticular, as showed by the Social Issues Research Centre’s research on the UK shippingsector. According to this study some 70% of all masters on British-registered ships are UKnationals, the figure falls to 54% for chief engineer officers, 37% for chief officers and justunder 33% of second officers.
Table 7.3 Employment of seafarers, 1996 – 2001/2002
1996 2001-2002CountryNational Non-National National Non-National
Officers - - - -
Ratings 1.146 356 - -Belgium
Total - - 324 490
Officers - - 5,611 601
Ratings - - 3,905 3,516Denmark
Total 9,050 2,700 9,516 4,117
Officers - - 2,100 -
Ratings - - 5,260 40Finland
Total 7,758 27 7,360 40
Officers - - 2,851 419
Ratings - - 6,454 1,410France
Total 9,069 1,050 9,305 1,829
Officers - - 4,631 970
Ratings - - 3,155 3,471Germany
Total 9,370 4,803 7,786 4,441
Officers - - 7,423 *430
Ratings - - 9,779 *6,733Greece
Total 22,556 8,193 17,202 7,163
Officers - - - -
Ratings - - - -Ireland
Total 751 329 1,029 405
Officers - - - -
Ratings - - - -Italy
Total 25,300 4,500 17,500 8,300
Officers - - 6,642 2,338Netherlands
Ratings - - 2,294 5,832
I Southampton Solent University (2005) The mapping of career paths in the maritime industries. ECSA and ETF,
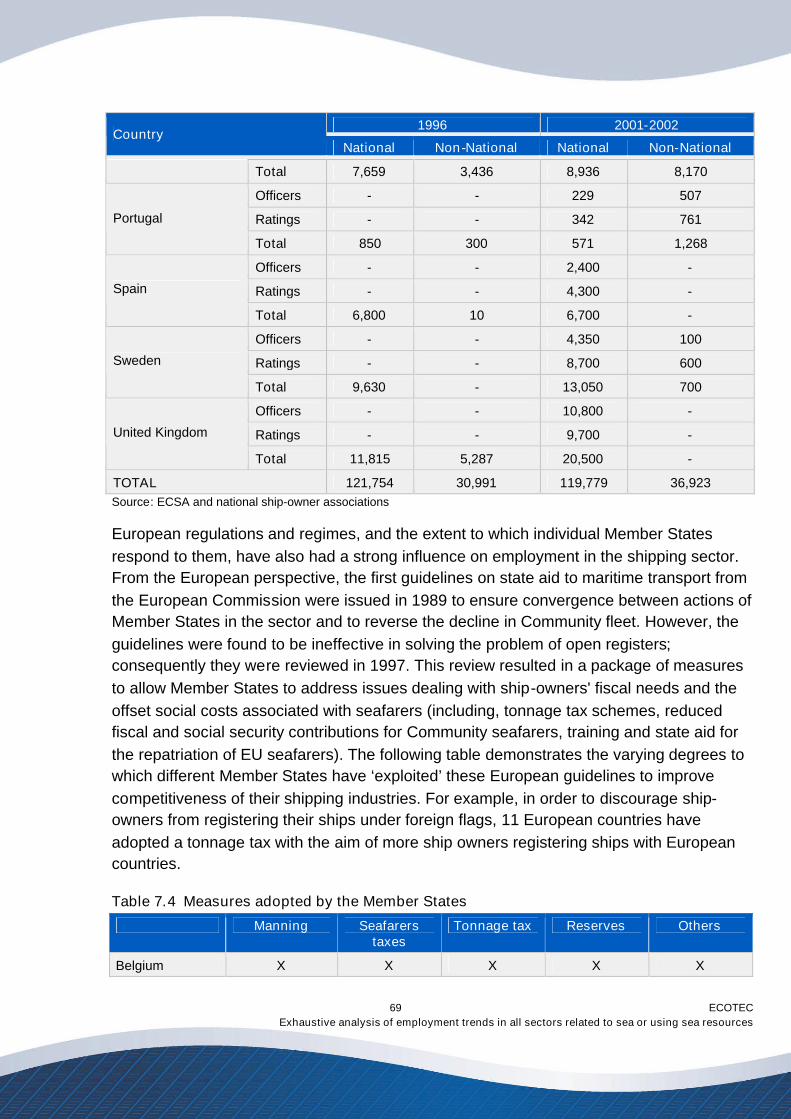
ECOTECExhaustive analysis of employment trends in all sectors related to sea or using sea resources
69
1996 2001-2002Country
National Non-National National Non-National
Total 7,659 3,436 8,936 8,170
Officers - - 229 507
Ratings - - 342 761Portugal
Total 850 300 571 1,268
Officers - - 2,400 -
Ratings - - 4,300 -Spain
Total 6,800 10 6,700 -
Officers - - 4,350 100
Ratings - - 8,700 600Sweden
Total 9,630 - 13,050 700
Officers - - 10,800 -
Ratings - - 9,700 -United Kingdom
Total 11,815 5,287 20,500 -
TOTAL 121,754 30,991 119,779 36,923Source: ECSA and national ship-owner associations
European regulations and regimes, and the extent to which individual Member Statesrespond to them, have also had a strong influence on employment in the shipping sector.From the European perspective, the first guidelines on state aid to maritime transport fromthe European Commission were issued in 1989 to ensure convergence between actions ofMember States in the sector and to reverse the decline in Community fleet. However, theguidelines were found to be ineffective in solving the problem of open registers;consequently they were reviewed in 1997. This review resulted in a package of measuresto allow Member States to address issues dealing with ship-owners' fiscal needs and theoffset social costs associated with seafarers (including, tonnage tax schemes, reducedfiscal and social security contributions for Community seafarers, training and state aid forthe repatriation of EU seafarers). The following table demonstrates the varying degrees towhich different Member States have ‘exploited’ these European guidelines to improvecompetitiveness of their shipping industries. For example, in order to discourage ship-owners from registering their ships under foreign flags, 11 European countries haveadopted a tonnage tax with the aim of more ship owners registering ships with Europeancountries.
Table 7.4 Measures adopted by the Member States
Manning Seafarerstaxes
Tonnage tax Reserves Others
Belgium X X X X X
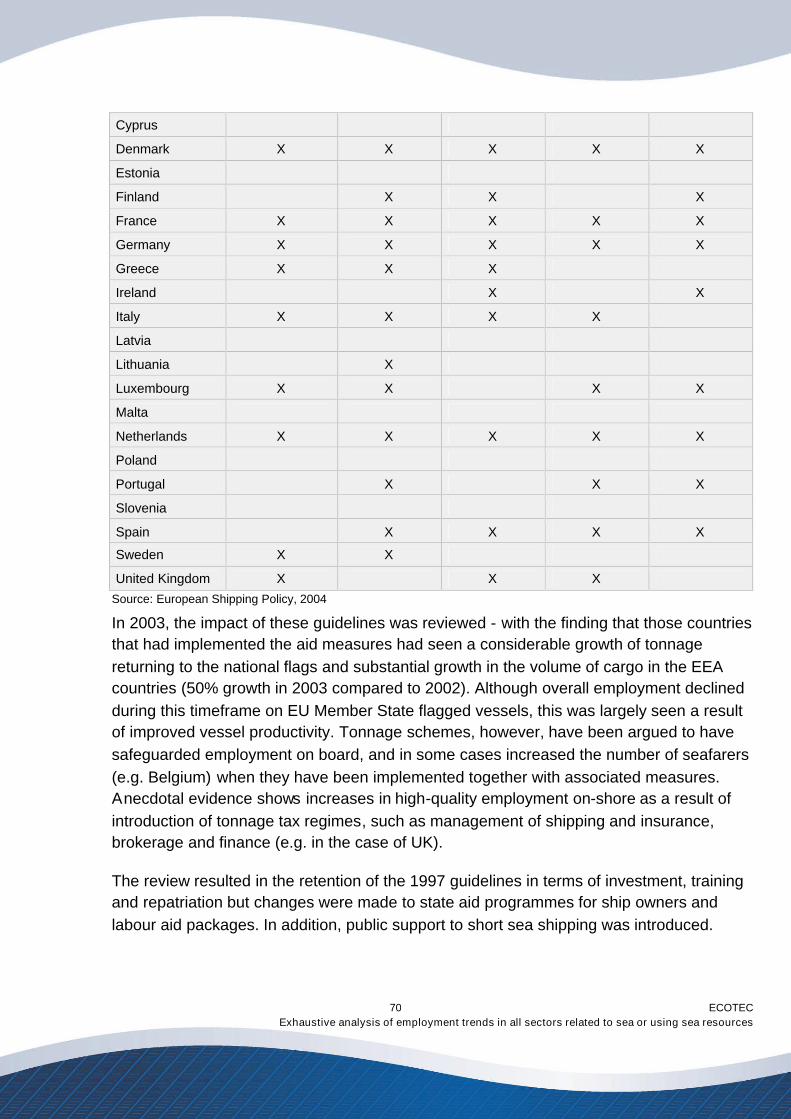
ECOTECExhaustive analysis of employment trends in all sectors related to sea or using sea resources
70
Cyprus
Denmark X X X X X
Estonia
Finland X X X
France X X X X X
Germany X X X X X
Greece X X X
Ireland X X
Italy X X X X
Latvia
Lithuania X
Luxembourg X X X X
Malta
Netherlands X X X X X
Poland
Portugal X X X
Slovenia
Spain X X X X
Sweden X X
United Kingdom X X XSource: European Shipping Policy, 2004
In 2003, the impact of these guidelines was reviewed - with the finding that those countriesthat had implemented the aid measures had seen a considerable growth of tonnagereturning to the national flags and substantial growth in the volume of cargo in the EEAcountries (50% growth in 2003 compared to 2002). Although overall employment declinedduring this timeframe on EU Member State flagged vessels, this was largely seen a resultof improved vessel productivity. Tonnage schemes, however, have been argued to havesafeguarded employment on board, and in some cases increased the number of seafarers(e.g. Belgium) when they have been implemented together with associated measures.Anecdotal evidence shows increases in high-quality employment on-shore as a result ofintroduction of tonnage tax regimes, such as management of shipping and insurance,brokerage and finance (e.g. in the case of UK).
The review resulted in the retention of the 1997 guidelines in terms of investment, trainingand repatriation but changes were made to state aid programmes for ship owners andlabour aid packages. In addition, public support to short sea shipping was introduced.
ECOTECExhaustive analysis of employment trends in all sectors related to sea or using sea resources
71
Most of the Member States are also affected by the fact that employment in the sector isno longer seen as an attractive career option by young people. The sector has receivedbad press in some countries with detrimental impact on the image of the sector (e.g.Greece) and often the sector suffers from an image of being ‘old-fashioned and hard work’with young people lacking knowledge about today’s high-tech vessels. For example, thegrowth in the short sea shipping sector demands new skills; ship manoeuvres arebecoming more complicated and need to be faster which requires in-depth knowledge ofnew computer and electronic systems. This information about the changes in the jobprofile of a seafarer as an increasingly technical and skilled profession has not reachedyoung people in many countries and many maritime schools across Europe have seensevere declines in the number of young people choosing to study maritime related studies.For example, in Latvia the number of new certificates issued for seafarers has gone downfrom over 15,000 certificates in 2002 to just 9,500 certificates in 2005. In Finland themaritime schools have witnessed a decline of 33% in the number of young people applyingfor maritime related studies. On the other hand, as a result of greater investment inmarketing, the image and reputation of the sector are improving and registrations formaritime studies are on the increase in Belgium.
Other factors affecting employment in the sector are salaries, labour migration andavailability of training. In Latvia the salary rises in the shipping sector have been fairly lowand Italy the sector has suffered from the lack of publicly-funded training. Some of the newMember States have suffered from labour migration with people moving to work in foreignvessels with substantially higher salaries. Whilst the sector used to be highly paid inPoland, nowadays the average monthly pay of a seafarer equals the average monthlysalary in Poland. In Latvia young people have started to view that shore based jobs givebetter opportunities for career development.
The shortage of officers is also of a growing concern the European shipowners who arefinding it increasingly difficult hire to senior crew members. This is fuelled by the decliningnumber of young people choosing maritime related studies, the ageing profile of officersand low retention rates. According to BIMCO/ISF 10% of trainee officers drop-out beforethey qualify. These trends also have an impact on the maritime sector as a whole becausetraditionally ex-seafarers have held important positions in port administrations and othermaritime related professions onshore.
Another concern for the industry is the career progression from sea based employment toa career ashore. The process of progressing to a career ashore is different for deckofficers who often find it more difficult to find shore based employment than engineeringofficers would seek for opportunities in well defined areas where their skills are in demand.The main reason for decreasing opportunities for deck officers is the greater integration of
ECOTECExhaustive analysis of employment trends in all sectors related to sea or using sea resources
72
the ships agencies, ports, ship brokerage and freight forwarding businesses into widerlogistics industry, which has resulted in greater detachment of that sector from seafaring.Engineer officers are widely sought after in such professions as inspectors and surveyorswith shipping, management, classification and insurance companies, as well as inoperational functions with shipping and management companies, shipyards and enginemanufacturers, etc.
The study by ECSA and ETF on career progression in maritime sectors argues that formerofficers make attractive employees in shore based professions and progress from themiddle to top middle management. However, due to the general lack of management orbusiness qualifications, very few progress further. It is difficult to assess whether the lackof qualifications is the primary cause of the lack of progression of the ex-seafarers into topmanagement. One important factor may be different scope of management responsibilitiesat sea (that focus on technical and operational functions) and current qualifications of topmanagement with predominantly financial and commercial backgrounds.
7.5 Employment forecast
The global seaborne trade has been predicted to grow steadily with an average annualgrowth of 3-4% over the next decade. As a direct consequently, despite efficiency gains,shipping sector stakeholders who were interviewed for this study have forecast a growingdemand for qualified seafarers – at least for the next decade. At the same time it is a welldocumented fact that the number of active EU seafarers is in decline. This study forexample already highlighted some dramatic declines in seafaring workforce in some of theMember States (e.g. Estonia, Greece and Germany) and the growing share of non-EUseafarers. This trend is further fuelled by the ageing profile of officers from the EU-countries and the low attractiveness of the sector among young people in Europe (asevidenced above). BIMCO/ISF have stated that the growing demand for qualifiedseafarers will only be met if the increase in levels of recruitment and training is maintainedand if wastage/turnover rates are reduced. In terms of efficiency gains and impact onemployment, it is argued that there is little scope for further manning reductions, sinceinternational requirements, such as working time regulations and the ISPS Code, togetherwith commercial demands, have increased the workload on board.
In future EU countries will continue to remain an important source of officers, althoughover the past years Eastern Europe has become increasingly significant with a largeincrease in officer numbers. In the global scale, the Far East and South East Asia, and theIndian sub-continent remain the largest sources of supply of ratings and are rapidly alsobecoming a key source of officers.
ECOTECExhaustive analysis of employment trends in all sectors related to sea or using sea resources
73
Despite projected increases in the volume of cargo traffic in Europe, the forecasts foremployment vary from country to country. The following table summarises some projectedtrends from a selection of Member States.
Employment forecasts for seafarers in the EU Member States
Even though the Estonian shipping sector has experienced severe decline over the past decade,shipping companies believe that stability has now been achieved, and employment is expected toincrease in the near future due to developments in the tourism sector and the construction of newharbours.
The Belgian stakeholders believe that without the introduction of the tonnage tax, employment andadded value in the Belgian shipping sector would have dropped drastically. Additional employmentsupporting measures also played an important role in this. Instead, since 2001 employment has beenshowing a clear positive trend. And if the policies are developed further, employment can be expected tocontinue grow in the future, but if the government does not take action to develop the current policiesfurther, the number of Belgian seafarers may begin to decline again. It has been estimated that in 2020there will be only 3,000 Belgian seafarers left if nothing is doneI.
The labour market for Polish seafarers has been found to be faced with two contradictory trends. On onehand, there is a growing demand for highly trained and experienced officers in and outside the EU, buton the other hand there is a declining number of Polish seafarers employed on the EU-flagged ships dueto fears of the ship owners of rising employment costs and claims from the trade unions. But the demandfor higher skilled, specialised seafarers is likely to increase but on the other hand the attractiveness ofthe sector is likely to diminish in the future. Whilst the sector used to be highly paid, especially during thecommunist regime, nowadays the average monthly pay of a seafarer equals the average monthly salaryin Poland.
The Italian seafarers' union has estimated that the sector has a growth employment potential of 5 - 10%annuallyII. However, as the sector is facing a labour shortage it is expected that growth in employmentwould be absorbed by foreign rather than Italian seafarers.
The future of the Irish shipping sector employment looks dark at the moment, due to the recent newsfrom Irish Ferries to reflag their vessel.
Although the number of individuals employed on board vessels under a German flag has increased inrecent years as a result of government measures, the number of German seafarers is likely to continueto decline in the future. Trade unions would like to see stronger enforcement of existing requirements ofequal treatment of seafarers. Ver.di in particular points to a new agreement on global working conditionsfor seafarers.
Some 200 ships have recently been ordered by the Danish ship owners suggesting that there is anoptimism about the sector. If a significant proportion of these new ships fly the Danish flag, it couldpotentially have a positive impact on employment in the sector.
I Policy Research Corporation (2001 and update 2004) Economic impact study Belgian shipping clusterII Fitmarittimi
ECOTECExhaustive analysis of employment trends in all sectors related to sea or using sea resources
74
The Greek stakeholders have confirmed that unless drastic action is taken to provide the Greek youngpeople with motives to attract them to the shipping sector, employment in the sector will continue todecline – particularly employment of Greek nationals.
According to the Swedish Shipowners' Association much of the future of the sector is dependent on theintroduction of a tonnage tax. Without a tonnage tax, the Swedish Shipowners' Association fears thatconditions for Swedish shipping companies will not be internationally competitive. But there were 60confirmed orders for vessels by Swedish shipping companies in December 2005 and the SwedishShipowners' Association suggests that if all of these 60 vessels would register under the national flag,there would be an estimated increase in employment of some 7,200 seafarersI. They also estimated thatonly half of the 60 vessels in order will fly the Swedish flag. Thus, reducing the possible employmentimpact to some 3,500 people.
The Finnish seafarers' union believe that Finnish vessels will start registering under the Swedish flag ifthe Swedish tonnage tax will be introduced and implemented successfully.
Finally, the number of seafarers in the EU maritime cluster is likely to increase if the twocandidate countries Romania and Bulgaria are to join the EU in 2007. The BulgarianMaritime Administration has confirmed that in 2004 Bulgaria had 21,727 registeredseafarers and the Romanian Naval authority has reported that there were 8,467 registeredseafarers in 2004 from Romania.
I As a rule of thumb, an offshore employee contributes to the employment of 5-6 people onshore. Thus, an averageonboard crew of 20 people (corresponding only to the security staff) on 60 vessels would lead to a total employmenteffect of 7,200 (20*60*6=7,200).
ECOTECExhaustive analysis of employment trends in all sectors related to sea or using sea resources
75
8.0 Offshore oil and gas extraction
Offshore oil and gas extraction as a part of the maritime cluster refers to the construction,installation and conversion of platforms, storage vessels and equipment; drilling and off-shore related transport, engineering, communication, consultancy and other support.
Some 35% of global oil production and 27% of gas production is from offshore supplyI.Compared to other marine industries offshore oil and gas extraction is the world's largestmarine industry in terms of value of output and third largest after shipping and marinetourism as a marketII. However, after nearly 40 years of production, Europe has become amature region and is now entering an irreversible long-term decline. Indeed, in the UKaverage production per field has decreased from 112,000 barrels per day in 1979 to13,000 in 2003III. There could, however, still be some significant discoveries in Europe andas the major oil companies are leaving the North Sea, there are considerable opportunitiesfor small companies. In addition, there are many prospects for new entrants to acquireexisting 'brownfields' from the existing major oil companiesIV.
Norway and the UK currently account for a considerable share of total offshore oil and gasproduction and it is expected that they will account for 86% of expenditure in the next fiveyears. Denmark, Italy and the Netherlands together largely account for the remainingshareV. Although a small producer itself, Germany is an important provider of technologyto the industry. Similarly, France has developed a major oil and gas service industrywithout its own offshore production. Indeed, over the last 20 years European equipmentand service suppliers in the oil and gas industry have built up a 30% world market sharefrom almost nothing.
8.1 Economic impact
European expenditureVI was €19 billion in 2004 and the UK alone accounted for more than40% of thisVII. Around 80% of the oil and gas production is exportedVIII. The economiccontribution of the industry is further emphasised by the UK experience where offshore oil
I Marine Industries Global Market Analysis (2005) Douglas-WestwoodII Ibid.III Marine Industries Global Market Analysis (2005) Douglas-WestwoodIV World Marine Markets (2005) Douglas-WestwoodV Ibid.VI Total capital and operational expenditure (not the value of the offshore oil and gas production which is considerablygreater)VII Marine Industries Global Market Analysis (2005) Douglas-WestwoodVIII EUROGIF (2006)
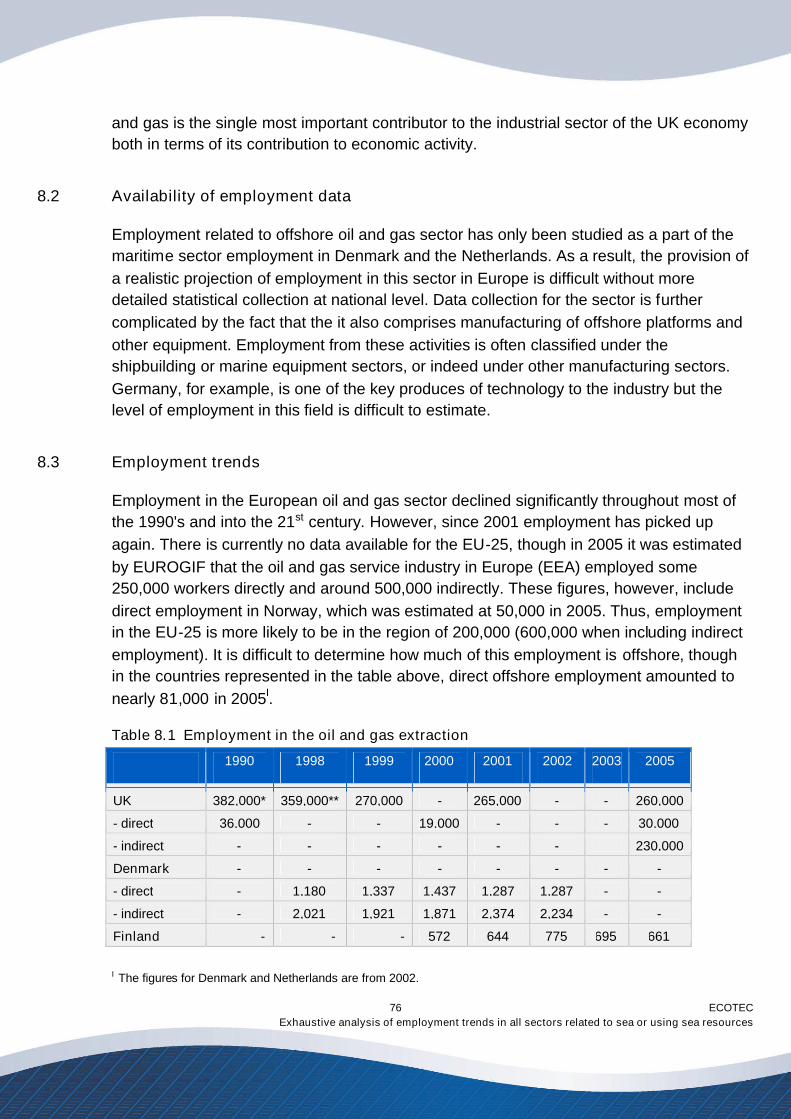
ECOTECExhaustive analysis of employment trends in all sectors related to sea or using sea resources
76
and gas is the single most important contributor to the industrial sector of the UK economyboth in terms of its contribution to economic activity.
8.2 Availability of employment data
Employment related to offshore oil and gas sector has only been studied as a part of themaritime sector employment in Denmark and the Netherlands. As a result, the provision ofa realistic projection of employment in this sector in Europe is difficult without moredetailed statistical collection at national level. Data collection for the sector is furthercomplicated by the fact that the it also comprises manufacturing of offshore platforms andother equipment. Employment from these activities is often classified under theshipbuilding or marine equipment sectors, or indeed under other manufacturing sectors.Germany, for example, is one of the key produces of technology to the industry but thelevel of employment in this field is difficult to estimate.
8.3 Employment trends
Employment in the European oil and gas sector declined significantly throughout most ofthe 1990's and into the 21st century. However, since 2001 employment has picked upagain. There is currently no data available for the EU-25, though in 2005 it was estimatedby EUROGIF that the oil and gas service industry in Europe (EEA) employed some250,000 workers directly and around 500,000 indirectly. These figures, however, includedirect employment in Norway, which was estimated at 50,000 in 2005. Thus, employmentin the EU-25 is more likely to be in the region of 200,000 (600,000 when including indirectemployment). It is difficult to determine how much of this employment is offshore, thoughin the countries represented in the table above, direct offshore employment amounted tonearly 81,000 in 2005I.
Table 8.1 Employment in the oil and gas extraction
1990 1998 1999 2000 2001 2002 2003 2005
UK 382,000* 359,000** 270,000 - 265,000 - - 260,000
- direct 36,000 - - 19,000 - - - 30,000
- indirect - - - - - - 230,000
Denmark - - - - - - - -
- direct - 1,180 1,337 1,437 1,287 1,287 - -
- indirect - 2,021 1,921 1,871 2,374 2,234 - -
Finland - - - 572 644 775 695 661
I The figures for Denmark and Netherlands are from 2002.
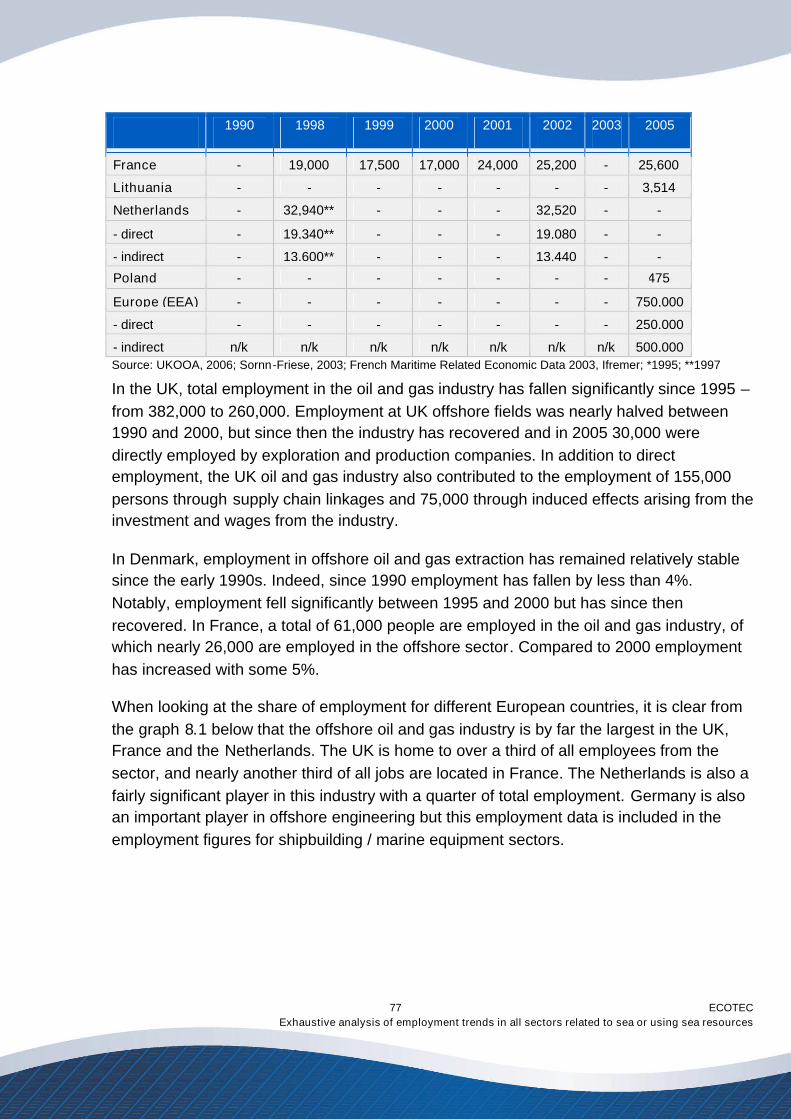
ECOTECExhaustive analysis of employment trends in all sectors related to sea or using sea resources
77
1990 1998 1999 2000 2001 2002 2003 2005
France - 19,000 17,500 17,000 24,000 25,200 - 25,600
Lithuania - - - - - - - 3,514
Netherlands - 32,940** - - - 32,520 - -
- direct - 19,340** - - - 19,080 - -
- indirect - 13,600** - - - 13,440 - -
Poland - - - - - - - 475
Europe (EEA) - - - - - - - 750,000
- direct - - - - - - - 250,000
- indirect n/k n/k n/k n/k n/k n/k n/k 500,000Source: UKOOA, 2006; Sornn-Friese, 2003; French Maritime Related Economic Data 2003, Ifremer; *1995; **1997
In the UK, total employment in the oil and gas industry has fallen significantly since 1995 –from 382,000 to 260,000. Employment at UK offshore fields was nearly halved between1990 and 2000, but since then the industry has recovered and in 2005 30,000 weredirectly employed by exploration and production companies. In addition to directemployment, the UK oil and gas industry also contributed to the employment of 155,000persons through supply chain linkages and 75,000 through induced effects arising from theinvestment and wages from the industry.
In Denmark, employment in offshore oil and gas extraction has remained relatively stablesince the early 1990s. Indeed, since 1990 employment has fallen by less than 4%.Notably, employment fell significantly between 1995 and 2000 but has since thenrecovered. In France, a total of 61,000 people are employed in the oil and gas industry, ofwhich nearly 26,000 are employed in the offshore sector. Compared to 2000 employmenthas increased with some 5%.
When looking at the share of employment for different European countries, it is clear fromthe graph 8.1 below that the offshore oil and gas industry is by far the largest in the UK,France and the Netherlands. The UK is home to over a third of all employees from thesector, and nearly another third of all jobs are located in France. The Netherlands is also afairly significant player in this industry with a quarter of total employment. Germany is alsoan important player in offshore engineering but this employment data is included in theemployment figures for shipbuilding / marine equipment sectors.
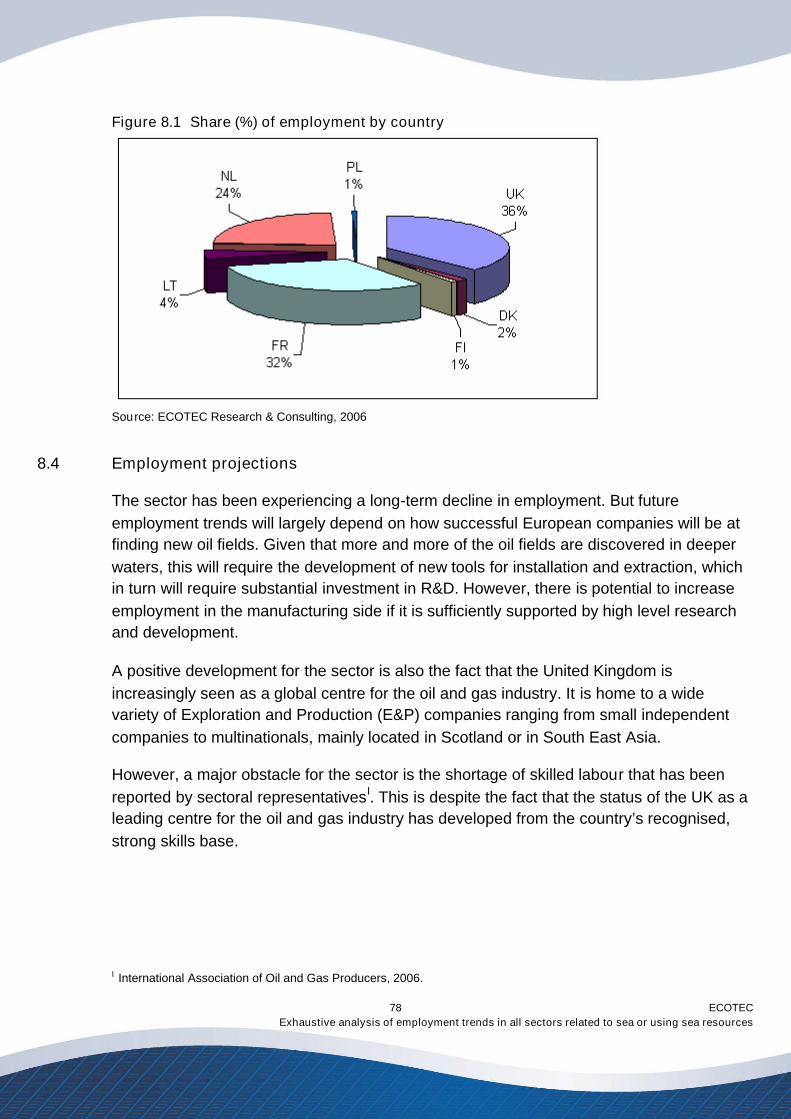
ECOTECExhaustive analysis of employment trends in all sectors related to sea or using sea resources
78
Figure 8.1 Share (%) of employment by country
Source: ECOTEC Research & Consulting, 2006
8.4 Employment projections
The sector has been experiencing a long-term decline in employment. But futureemployment trends will largely depend on how successful European companies will be atfinding new oil fields. Given that more and more of the oil fields are discovered in deeperwaters, this will require the development of new tools for installation and extraction, whichin turn will require substantial investment in R&D. However, there is potential to increaseemployment in the manufacturing side if it is sufficiently supported by high level researchand development.
A positive development for the sector is also the fact that the United Kingdom isincreasingly seen as a global centre for the oil and gas industry. It is home to a widevariety of Exploration and Production (E&P) companies ranging from small independentcompanies to multinationals, mainly located in Scotland or in South East Asia.
However, a major obstacle for the sector is the shortage of skilled labour that has beenreported by sectoral representativesI. This is despite the fact that the status of the UK as aleading centre for the oil and gas industry has developed from the country’s recognised,strong skills base.
I International Association of Oil and Gas Producers, 2006.
ECOTECExhaustive analysis of employment trends in all sectors related to sea or using sea resources
79
9.0 Maritime services
The maritime service sector is a sector currently lacking European/global recognition as amaritime sector of its own. Having said that, London is widely seen to be at the heart ofthis sector because of the strong presence of major international organisations such as theIMO, Lloyd's insurance and the Baltic Exchange. This presence leads to Europe’s topglobal position for the maritime service sector with London as the hub for the capital andexpertise for marine insurance, ship-chatering, shipping finance, ship classification, legalservices, dispute resolution and accountancy services. In addition, there are a wide rangeof other facilities, including education and training, publishing, event organisation, researchand technical and engineering consultancy located in different EU member states.
The World Marine Market study by Douglas-Westwood (2005) divides the sector into threekey clusters: maritime commerce, education & training and research & development. Inthis study the maritime service sector is defined as consisting of the following segments: Maritime related research and development: with sub sectors related to shipbuilding and
marine equipment, as well as to the oil and gas sector and academic and governmentbased R&D work.
Maritime education and training: marine-related education and training of personnelemployed in the marine sector. This sub-sector has three primary activity areas;seafarers' training, offshore workers' training and higher education.
Ship classification and inspection: employment related to the survey and inspection ofvessels to establish their compliance with regulations.
Support services for the marine cluster (bunkering, ship supply, rescue, diving) Commercial activities, such as maritime insurance, financing, brokerage, law and
consultancy. Medical services Coast guard Crewing agencies Maritime associations (e.g. shipowners' associations) Maritime government services (e.g. ministries, maritime authorities, European
Commission etc.)
9.1 Economic impact
From the economic perspective the maritime services market shows a trend of long-termgrowth. The World Marine Market study by Douglas-Westwood (2005) has valued theeconomic significance of the sector for marine commerce activities and R&D.
ECOTECExhaustive analysis of employment trends in all sectors related to sea or using sea resources
80
In 2005, the value of the marine commerce sector in Europe was €2239million (€5.7billionbeing the global value) and it is expected reach €2278million by 2010I. However, theEuropean forecast is less positive in global terms as the value of the global marine serviceindustry market is expected to be €6.502million in 2010. It has also been estimated thatLondon and Western Europe together account for 38% of the world marine commercialservice market, followed by Asia with 24%. Altogether maritime commercial services inLondon employ over 14,000 people and generate £1,092m in overseas earnings.II Themajor contributors to the UK's £1,092m net overseas earnings of maritime services in 2002were the Baltic Exchange (£322m), insurance brokers (£170m), legal services (£190m)and banks (£150m). The Lloyd's Register of Shipping and publishing also make animportant contribution to the UK economy.
The maritime related R&D sector has been estimated to have a value of €3136 million in2005 and this has been projected to reach €3522 million by 2010III.
9.2 Data availability
As indicated above, the maritime service sector is not widely recognised as its own sub-sector in the maritime cluster. Employment for this sector has only been researched inmore detail in the UK, France and the Netherlands. If one was to include data from thesecountries only, it would not be possible to provide a picture of maritime serviceemployment in Europe as a whole – even if the UK is the heart of the sector both inEuropean and global terms.
As a result, even though the aim of this study has been only to gather data from existingstudies and from maritime sector stakeholders, researchers have contacted individual keyorganisations from the maritime service sector in most of the study countries in order toobtain further information on employment in this sector. These statistics which have beencollected as a part of this exercise by no means provide a full or a complete projection oftotal employment in this sector, but they provide a basis for the assessment ofemployment in this sector. Further data collection for this sector is strongly recommended.
9.3 Employment trends
On the basis of available data, employment in the sector amounted to 88,000 in2004/2006IV. Both indirect and direct maritime service employment in the Dutch maritime
I Douglas-Westwood (2005) World Marine Markets.II Maritime Services, 2003, International Financial Services, LondonIII Ibid.IV Figures for Spain and Cyprus are from 2004; Poland from 2003; Netherlands from 2002 and France from 2001.
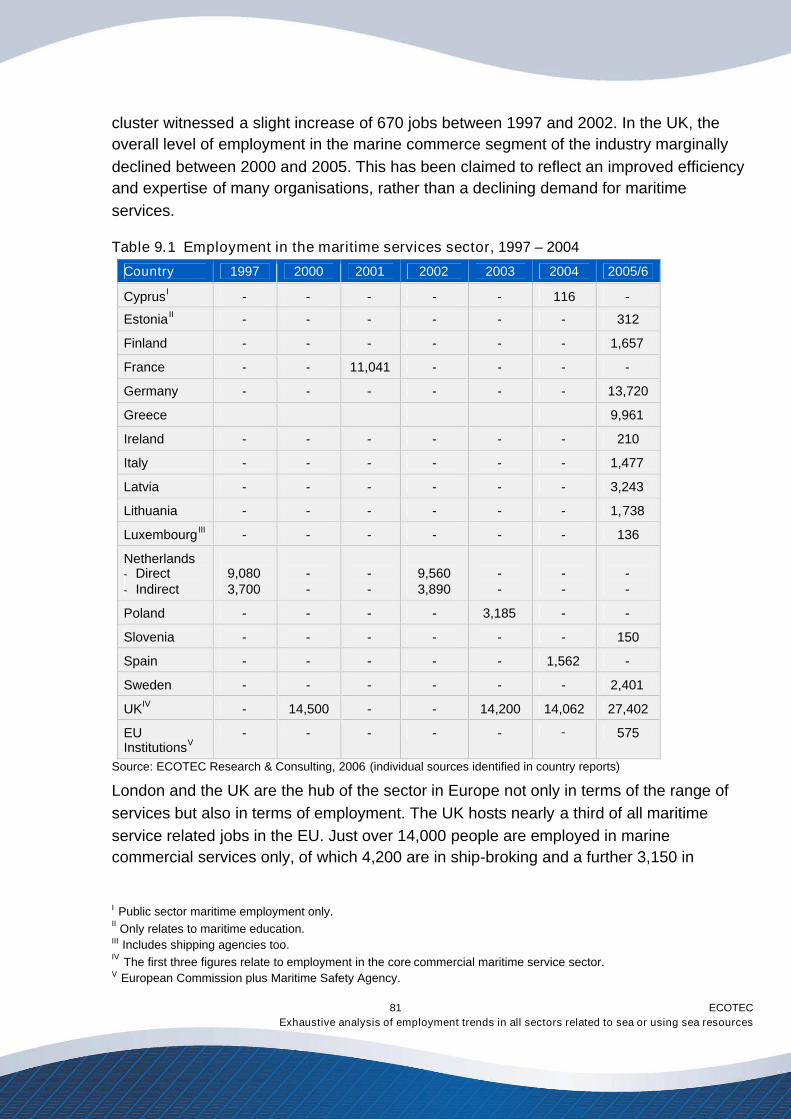
ECOTECExhaustive analysis of employment trends in all sectors related to sea or using sea resources
81
cluster witnessed a slight increase of 670 jobs between 1997 and 2002. In the UK, theoverall level of employment in the marine commerce segment of the industry marginallydeclined between 2000 and 2005. This has been claimed to reflect an improved efficiencyand expertise of many organisations, rather than a declining demand for maritimeservices.
Table 9.1 Employment in the maritime services sector, 1997 – 2004
Country 1997 2000 2001 2002 2003 2004 2005/6
CyprusI - - - - - 116 -
Estonia II - - - - - - 312
Finland - - - - - - 1,657
France - - 11,041 - - - -
Germany - - - - - - 13,720
Greece 9,961
Ireland - - - - - - 210
Italy - - - - - - 1,477
Latvia - - - - - - 3,243
Lithuania - - - - - - 1,738
Luxembourg III - - - - - - 136
Netherlands- Direct- Indirect
9,0803,700
--
--
9,5603,890
--
--
--
Poland - - - - 3,185 - -
Slovenia - - - - - - 150
Spain - - - - - 1,562 -
Sweden - - - - - - 2,401
UKIV - 14,500 - - 14,200 14,062 27,402
EUInstitutionsV
- - - - - - 575
Source: ECOTEC Research & Consulting, 2006 (individual sources identified in country reports)
London and the UK are the hub of the sector in Europe not only in terms of the range ofservices but also in terms of employment. The UK hosts nearly a third of all maritimeservice related jobs in the EU. Just over 14,000 people are employed in marinecommercial services only, of which 4,200 are in ship-broking and a further 3,150 in
I Public sector maritime employment only.II Only relates to maritime education.III Includes shipping agencies too.IV The first three figures relate to employment in the core commercial maritime service sector.V European Commission plus Maritime Safety Agency.
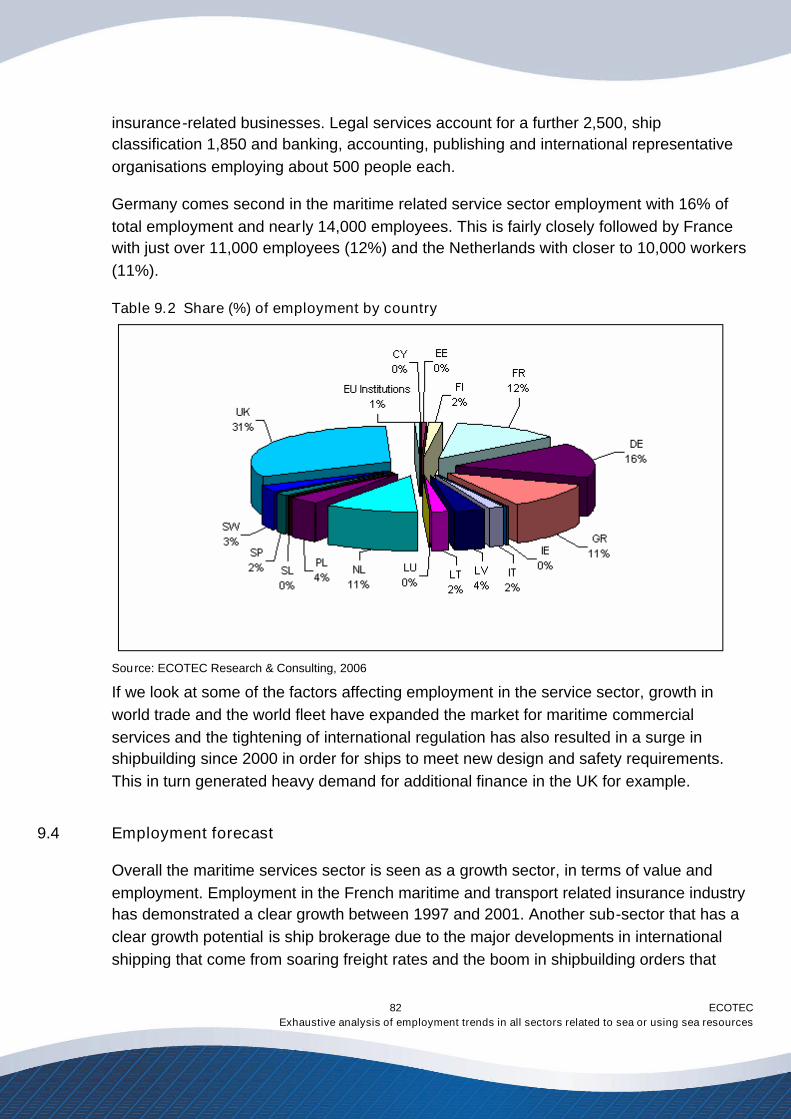
ECOTECExhaustive analysis of employment trends in all sectors related to sea or using sea resources
82
insurance-related businesses. Legal services account for a further 2,500, shipclassification 1,850 and banking, accounting, publishing and international representativeorganisations employing about 500 people each.
Germany comes second in the maritime related service sector employment with 16% oftotal employment and nearly 14,000 employees. This is fairly closely followed by Francewith just over 11,000 employees (12%) and the Netherlands with closer to 10,000 workers(11%).
Table 9.2 Share (%) of employment by country
Source: ECOTEC Research & Consulting, 2006
If we look at some of the factors affecting employment in the service sector, growth inworld trade and the world fleet have expanded the market for maritime commercialservices and the tightening of international regulation has also resulted in a surge inshipbuilding since 2000 in order for ships to meet new design and safety requirements.This in turn generated heavy demand for additional finance in the UK for example.
9.4 Employment forecast
Overall the maritime services sector is seen as a growth sector, in terms of value andemployment. Employment in the French maritime and transport related insurance industryhas demonstrated a clear growth between 1997 and 2001. Another sub-sector that has aclear growth potential is ship brokerage due to the major developments in internationalshipping that come from soaring freight rates and the boom in shipbuilding orders that
ECOTECExhaustive analysis of employment trends in all sectors related to sea or using sea resources
83
create greater demand for ship finance. The number of shipbrokers and their support staffsaw an apparent increase in the UK between 2000 and 2005.
Maritime related R&D is in particular seen as a growth segment. The European maritimesectors are facing R&D challenges, which require a strong R&D workforce base. Some ofthe challenges ahead include oil extraction from increasingly deep waters, operatingoffshore wind farms in deeper waters and greater distances from the shore, exploitation ofdeep water energy sources such as methane hydrates, technological advancements tocounter high European labour costs and exploring the potentials of marine biotechnologyI.
I Douglas-Westwood (2005) World Marine Markets.
ECOTECExhaustive analysis of employment trends in all sectors related to sea or using sea resources
84
10.0 Maritime works
The maritime works sector comprises a wide range of sea and inland waterway relatedactivities. In this study the maritime works sector is defined as follows:Dredging (capital, maintenance and remedial) of docks, harbours, approaches, river
jetties and major navigation channels.Construction of new land in the sea.Coastal protection.Manufacturing, laying and maintenance of underwater cables.Maritime related construction.
10.1 Economic impact
In global terms, the value of the maritime works sector has grown rapidly over the pastdecade with the current annual volume of sales standing at around€7 billion. The totalturnover of the member companies of the European Dredging Association (EuDA) standsat €4.2 billion.
Four of the largest Western European dredging companies account for approximately 60%of the world-wide sales generated in the so-called open markets. Dredging and other sub-sectors of the maritime works sectors are particularly important for the both economiesand particularly maritime economies of the Netherlands and Belgium.
A number of other smaller dredging companies are active all over Europe and sometimesworldwide; a lot of whom (10) are subsidiaries of the big four. The dredging sector is alsoregarded as a basic industry with important spin-off effects: 1 person onboard creates 3 to4 direct positions onshore and has many more indirect effectsI.
In the less open markets, dredging works are normally carried out by state-ownedcompanies or local private companies. But in recent years dredging work by state-ownedcompanies has somewhat declined due to the deregulation of global trade andconsequently the 'opening' of closed markets. The free market has expanded in favour ofprofessional dredging companies, in particular the above mentioned larger Dutch andBelgian players.
I EuDA.
ECOTECExhaustive analysis of employment trends in all sectors related to sea or using sea resources
85
10.2 Availability of employment data
Only three countries follow the collection of employment data for the maritime workssector; Belgium, France and the Netherlands. The data has been collected as a part oflarger maritime cluster studies and only in countries where the sector plays a relativeimportant economic role.
In addition to these cluster studies, the representative organisation for the dredgingindustry, European Dredging Association (EuDA), collects data on the level of employmentin its member companies. Data collection for other sub-segments of the sector is muchmore limited, and some of the employment data in this study refers to individual companyemployment. Data collection is also further complicated by the fact that many constructioncompanies are involved in water based construction projects (e.g. bridges) as well as landbased construction projection; making it difficult to estimate the number of employees onlyinvolved in water based development projects. The German figure is substantially largerthan for other countries as the figure is based on employment in the wider maritime workssector – which is not studies in many other countries to the same level of detailI
10.3 Employment trends
According to the European Dredging Association (EuDA) the dredging industry alonecontributed to the creation of a total of 53,289 jobs (17,763 directly and 35,526 indirectly)in 2005. One third of employees were employed as seafaring crew and the rest ashore.Employment in dredging companies has grown strongly in recent years, with employmentmore than doubling in some companies over the past 5-10 years.
By looking at data from national sources for the wider maritime works sector, the sectorprovided employment directly for nearly 40,000 individuals in 2004/2005II. Indirectemployment of the sector has only been calculated in the Netherlands and Belgium and inboth countries the indirect employment effect has been greater than the direct one. InBelgium the sector provided just under 4,000 jobs indirectly in 2004 (demonstrating agrowth trend of 9.8% in comparison to the year 2000). In the Netherlands the maritimeworks sector generated 7,620 indirect jobs in 2002 (220 jobs more than in 1997).
I German figures are from the maritime cluster study by Michael Jarowinsky (MC), Joachim Brodda (BALanceTechnology Consult Germany); Potenzialstudie für die maritime Wirtschaft in Schleswig Hostein und Deutschland, 2005II Data for Cyprus is from 2000, France from 2001, for the Netherlands from 2002, for Portugal and Poland from 2003.
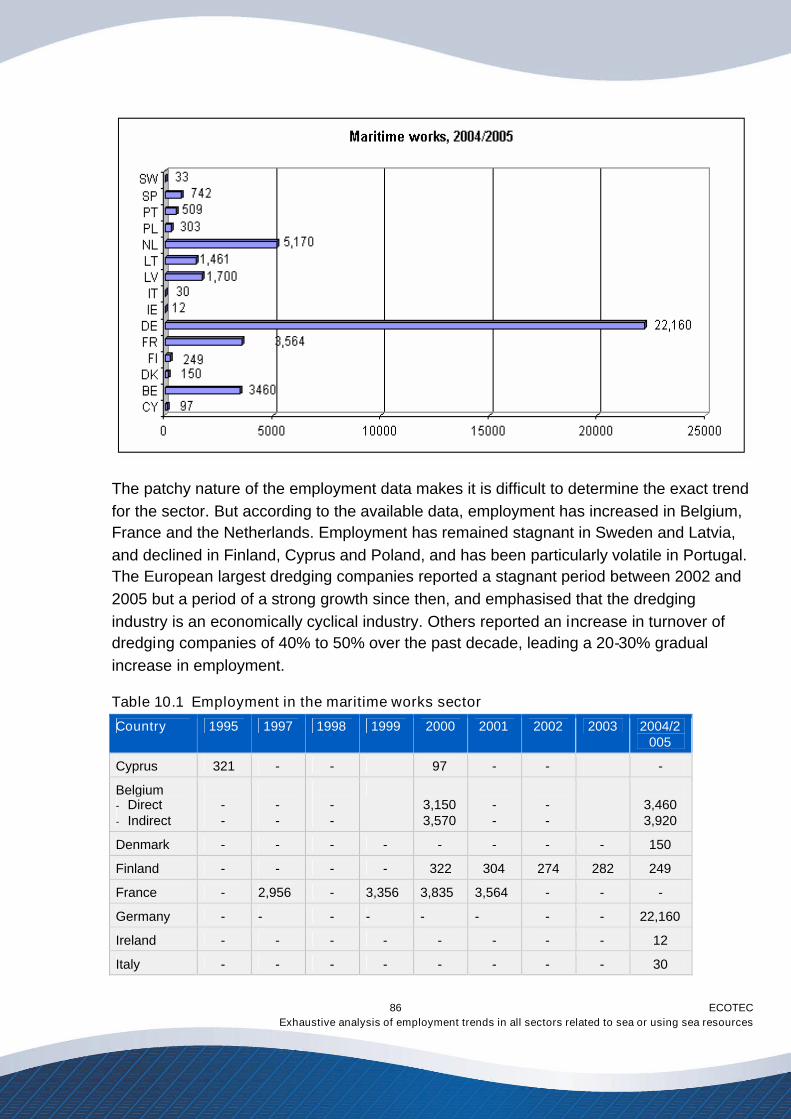
ECOTECExhaustive analysis of employment trends in all sectors related to sea or using sea resources
86
The patchy nature of the employment data makes it is difficult to determine the exact trendfor the sector. But according to the available data, employment has increased in Belgium,France and the Netherlands. Employment has remained stagnant in Sweden and Latvia,and declined in Finland, Cyprus and Poland, and has been particularly volatile in Portugal.The European largest dredging companies reported a stagnant period between 2002 and2005 but a period of a strong growth since then, and emphasised that the dredgingindustry is an economically cyclical industry. Others reported an increase in turnover ofdredging companies of 40% to 50% over the past decade, leading a 20-30% gradualincrease in employment.
Table 10.1 Employment in the maritime works sector
Country 1995 1997 1998 1999 2000 2001 2002 2003 2004/2005
Cyprus 321 - - 97 - - -
Belgium- Direct- Indirect
--
--
--
3,1503,570
--
--
3,4603,920
Denmark - - - - - - - - 150
Finland - - - - 322 304 274 282 249
France - 2,956 - 3,356 3,835 3,564 - - -
Germany - - - - - - - - 22,160
Ireland - - - - - - - - 12
Italy - - - - - - - - 30
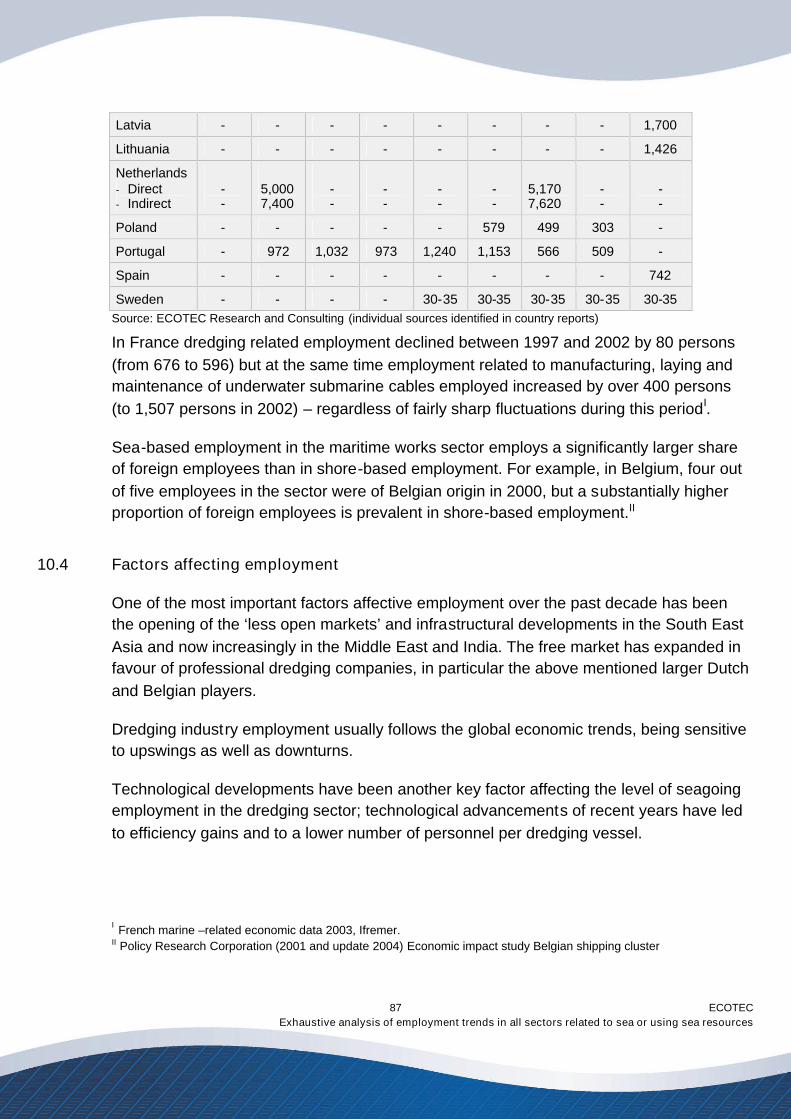
ECOTECExhaustive analysis of employment trends in all sectors related to sea or using sea resources
87
Latvia - - - - - - - - 1,700
Lithuania - - - - - - - - 1,426
Netherlands- Direct- Indirect
--
5,0007,400
--
--
--
--
5,1707,620
--
--
Poland - - - - - 579 499 303 -
Portugal - 972 1,032 973 1,240 1,153 566 509 -
Spain - - - - - - - - 742
Sweden - - - - 30-35 30-35 30-35 30-35 30-35Source: ECOTEC Research and Consulting (individual sources identified in country reports)
In France dredging related employment declined between 1997 and 2002 by 80 persons(from 676 to 596) but at the same time employment related to manufacturing, laying andmaintenance of underwater submarine cables employed increased by over 400 persons(to 1,507 persons in 2002) – regardless of fairly sharp fluctuations during this periodI.
Sea-based employment in the maritime works sector employs a significantly larger shareof foreign employees than in shore-based employment. For example, in Belgium, four outof five employees in the sector were of Belgian origin in 2000, but a substantially higherproportion of foreign employees is prevalent in shore-based employment.II
10.4 Factors affecting employment
One of the most important factors affective employment over the past decade has beenthe opening of the ‘less open markets’ and infrastructural developments in the South EastAsia and now increasingly in the Middle East and India. The free market has expanded infavour of professional dredging companies, in particular the above mentioned larger Dutchand Belgian players.
Dredging industry employment usually follows the global economic trends, being sensitiveto upswings as well as downturns.
Technological developments have been another key factor affecting the level of seagoingemployment in the dredging sector; technological advancements of recent years have ledto efficiency gains and to a lower number of personnel per dredging vessel.
I French marine –related economic data 2003, Ifremer.II Policy Research Corporation (2001 and update 2004) Economic impact study Belgian shipping cluster
ECOTECExhaustive analysis of employment trends in all sectors related to sea or using sea resources
88
Adoption of international regulative frameworks and guidelines also affect the dredgingindustry. This refers for example to the State Aid Guidelines and the level of their‘exploitation’ by the Member States; the ISM safety certifications; regulations dealing withemissions such as the new Directive on NOx; landfill and Habitats Directives; Natura 2000;ILO conventions on labour standards; EU enlargement; European funded programmessuch as ‘Eurosion’ research project on coastal erosion, ERAMAR on coastal developmentand Beachmed on restoration of coastal regions.
The availability of labour is another factor affecting employment in the dredging sector overthe past years and during next 10 years to come. According to the dredging industryrepresentative, the demand for qualified dredging sector personnel is growing. This isfuelled both by the need to replace ageing workers and the expansion of the dredgingfleet.
The supply of young educated personnel is too limited in Europe at the moment and thedredging sector can only employ skilled, educated personnel. Dredging companies arefacing a shortage of young graduates for the dredging fleet in the Western Europeancountries and are not having to, on an individual bases, develop additional dredgingeducation in Eastern European and the Far East.
10.5 Employment forecast
After a few less profitable years nationally as well internationally, the net profit of mostenterprises in maritime works increased in 2005, especially for international dredgingcompanies. For 2006, most companies expect increasing turnover and higher equipmentusage. Ecologically responsible dredging is more than ever an economic necessity due tothe increase in seaborne trade. That is one reason why the significance of dredging as aninstrument for economic growth is itself growing.
Industry representatives have forecast an overall increase in dredging activity with agrowth rate of 10% to 15% for the upcoming decade. The impact on employment is likelyto be a slightly less limited (an annual growth rate of 5% has been predicted) due to theimpact of automatisation and technological advancements. But as a whole, an increasingturn-over (worldwide), diversification, a growing number of environmental and coastalprotection projects and the need to develop coastal tourism infrastructure and transportinfrastructure generate demand for new jobs.
The following discusses some of the macro-growth factors that are likely to contribute tothe growth of the European dredging market over the next 10 years in more detail. Itdivides the sector into five sub-sectors; harbours (new built, enlargement), harbour
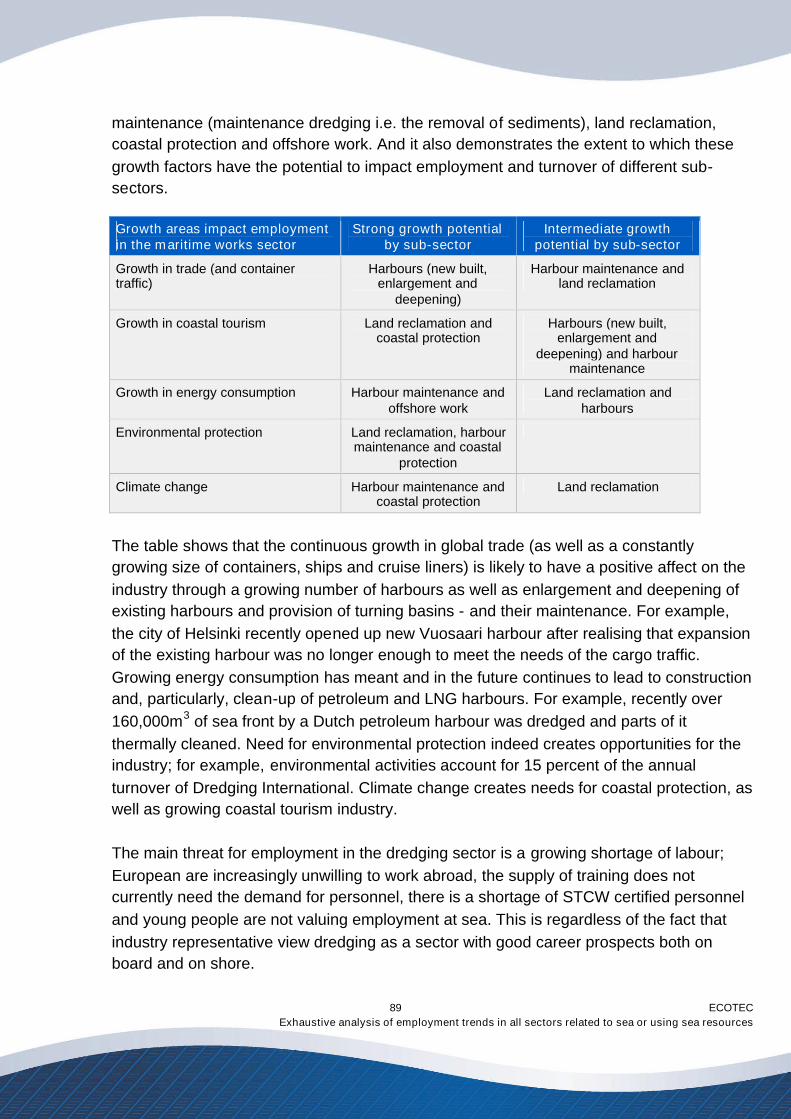
ECOTECExhaustive analysis of employment trends in all sectors related to sea or using sea resources
89
maintenance (maintenance dredging i.e. the removal of sediments), land reclamation,coastal protection and offshore work. And it also demonstrates the extent to which thesegrowth factors have the potential to impact employment and turnover of different sub-sectors.
Growth areas impact employmentin the maritime works sector
Strong growth potentialby sub-sector
Intermediate growthpotential by sub-sector
Growth in trade (and containertraffic)
Harbours (new built,enlargement and
deepening)
Harbour maintenance andland reclamation
Growth in coastal tourism Land reclamation andcoastal protection
Harbours (new built,enlargement and
deepening) and harbourmaintenance
Growth in energy consumption Harbour maintenance andoffshore work
Land reclamation andharbours
Environmental protection Land reclamation, harbourmaintenance and coastal
protection
Climate change Harbour maintenance andcoastal protection
Land reclamation
The table shows that the continuous growth in global trade (as well as a constantlygrowing size of containers, ships and cruise liners) is likely to have a positive affect on theindustry through a growing number of harbours as well as enlargement and deepening ofexisting harbours and provision of turning basins - and their maintenance. For example,the city of Helsinki recently opened up new Vuosaari harbour after realising that expansionof the existing harbour was no longer enough to meet the needs of the cargo traffic.Growing energy consumption has meant and in the future continues to lead to constructionand, particularly, clean-up of petroleum and LNG harbours. For example, recently over160,000m3 of sea front by a Dutch petroleum harbour was dredged and parts of itthermally cleaned. Need for environmental protection indeed creates opportunities for theindustry; for example, environmental activities account for 15 percent of the annualturnover of Dredging International. Climate change creates needs for coastal protection, aswell as growing coastal tourism industry.
The main threat for employment in the dredging sector is a growing shortage of labour;European are increasingly unwilling to work abroad, the supply of training does notcurrently need the demand for personnel, there is a shortage of STCW certified personneland young people are not valuing employment at sea. This is regardless of the fact thatindustry representative view dredging as a sector with good career prospects both onboard and on shore.
ECOTECExhaustive analysis of employment trends in all sectors related to sea or using sea resources
90
11.0 Offshore and coastal wind energy
This chapter analyses economic and employment trends in the offshore and coastal windenergy sector, and pays particular attention to the potential the sector has in generatingemployment in the future.
The progress of wind power around the world in recent years has been impressive andbetween 1995 and 2005 the cumulative installed capacity has increased from 4,800 MW to59,084 MW, of which more than 40,500 MW or 69 percent were installed in the EUI.Europe also dominates the market for wind turbine manufacturing and controlled 90% ofthe global market in 2002. The main reason for this is that the US market is characterisedby 'boom and bust', which means that it is booming for two years and then it goes bust fortwo years, and manufacturing companies have therefore been reluctant to set upmanufacturing in the US. As a consequence, a significant share of European wind turbinemanufacturing is exported to the US.
The most successful markets for wind power in the EU are Germany, Spain and Denmark,who account for nearly 80% of the wind power capacity installed in Europe and around90% of direct employment. In respect of the new member countries installations arebeginning to take off, especially in Poland, Estonia and Latvia. The only countries in theEU that by the end of 2005 did not have any installed wind energy capacity were Cyprus,Malta and Slovenia.
Although most of the current wind capacity is installed onshore, albeit near the coast,offshore sites are becoming the new frontier for the wind industry. In northern Europealone many thousands of megawatts of capacity are planned off the coasts of a dozencountries. The main motivation for going offshore stems from the considerably higher andmore predictable wind speeds to be found out at sea. With average speeds well above 8metres per second at a height of 60 metres, most of the marine sites being considered innorthern European waters are expected to deliver between 20% and 40% more energythan good shoreline sites. A second advantage is that placing wind farms offshore reducestheir impact on the landscape, with many of the developments now being planned virtuallyinvisible from the shoreII.
It is currently more expensive to build wind turbines out at sea. Offshore wind farmsrequire strong foundations, which must be firmly lodged in the sea bed. Many kilometres ofcabling is also required to bring the power back to shore, and both construction and
I Global Wind 2005 Report (2006) GWECII Wind Force 12: A blueprint to achieve 12% of the world's electricity from wind power by 2020 (2005) GWEC
ECOTECExhaustive analysis of employment trends in all sectors related to sea or using sea resources
91
maintenance work must be carried out in reasonable weather conditions using specialistboats and equipment. Moreover, the technology for offshore wind is currently about 15years behind that of onshore wind. Nonetheless, the cost of building offshore wind turbinesis reducing rapidly and importantly, it is reducing much faster than that for onshore windturbinesI.
By the end of 2004, a total of almost 600 MW of offshore capacity (just under 2 percent oftotal wind capacity) had been installed around the coastlines and large inland waters offive European countries – Denmark, the UK, Sweden, the Netherlands and Ireland. Thelargest of these, at Nysted in Denmark, has a capacity of 165.6 MW. In the future,however, much larger offshore projects are envisaged, with total capacities rising to above1,000 MW and with individual turbines in a size range up to 5 MW. These would benefitfrom economies of scale and a resulting reduction in unit production cost. The targets setand licenses issued by a number of European countries show the expectation forsubstantial growth in the offshore market over the next few years. Indeed, between 2006and 2010 an additional offshore capacity of some 5 GW is expected to be installed. In thelonger term, the target set by the European Wind Energy Association (EWEA) is for 70GW (or nearly 40 percent of total wind capacity) to be installed offshore by 2020II.
11.1 Economic impact
In addition to wind energy's significant environmental benefits, the industry also has aconsiderable economic impact. Currently, the wind turbine business is an €8 billionindustry in Europe and in 2012 it is forecast that the world market will be worth €130billion. In Europe it has been forecast that the wind energy market could be worth €80billion per annum by 2020.
An important strength of the European wind energy market is that it is characterised by alarger degree of stability compared to the US market. A stable market is often aprerequisite for manufacturers of wind turbines when they choose where to locate. The EUalso benefits from the fact that it is made up of 25 markets. To a considerable extent thisreduced the risks for manufacturers, as it is relatively easy to move production to anotherEU-25 country if the market for wind power decreases in one country. Moreover, thedistance between countries and markets is relatively small, which makes it possible toexport wind turbines and other equipment. Knowledge and technology is also appreciablymore developed in Europe compared to other OECD countries. Most of the technologyused in the wind energy sector has been developed in Europe. Indeed, the American firm
I EWEA (2006)II EWEA (2006)
ECOTECExhaustive analysis of employment trends in all sectors related to sea or using sea resources
92
General Electrics uses German technology and has located its research centre inGermany.
Generally the European market is very strong and the only weakness, if any, is that it hasrelatively high labour costs compared to Asian countries such as India and China.Nevertheless, the skills base in Europe is appreciably higher which to some degreecompensates for the higher labour costs.
It is probably unrealistic that wind energy will be able to compete with coal and nuclearplants etc that have been established and paid for by tax payers in the past. Nevertheless,there is an opportunity for wind energy to compete with other energy sources whenadditional capacity is needed. Clearly, the cost per kWh and energy efficiency will be keyto the future competitiveness of the sector. Wind energy and hydro energy are the onlyindigenous resources that all countries currently have access to. Thus, for countries thatdo not sit on large quantities of oil, gas and/or uranium it may help to reduce countries'dependency on energy imports.
Although technology is relatively well developed in Europe, given the limited funds that hasbeen used compared to other sources of energy, there is still an opportunity to improvetechnologies, particularly in the offshore market.
The main threat to the wind energy market is that the oil price per barrel will fallsignificantly. Although prices are currently on an all time high at $70 per barrel, SaudiArabia and other oil producing countries have many decades worth of oil left in the groundand so have an incentive to cap prices to ward off conservation and substitution. There isalso an uncertainty at the moment on what role nuclear power will play in the future.Although wind energy is currently cheaper than nuclear power, there is still a threat fromnuclear power as it can provide very large scale energy production.
11.2 Employment trends
Employment in the European wind energy sector has been increasing considerably sincethe beginning of the 1990's, as exemplified by the Danish experience where employmenthas increased from some 2,900 in 1991 to 21,000 in 2002. Growth in employment has alsobeen considerable in Germany and Spain where employment nearly doubled over theperiod 2000 to 2002.
Overall, the number of people employed in the European industry has increased by some188% since 1998, from 25,075 to 72,275 in 2002. These figures do not however includeemployment associated with exports and construction and installation of wind farms
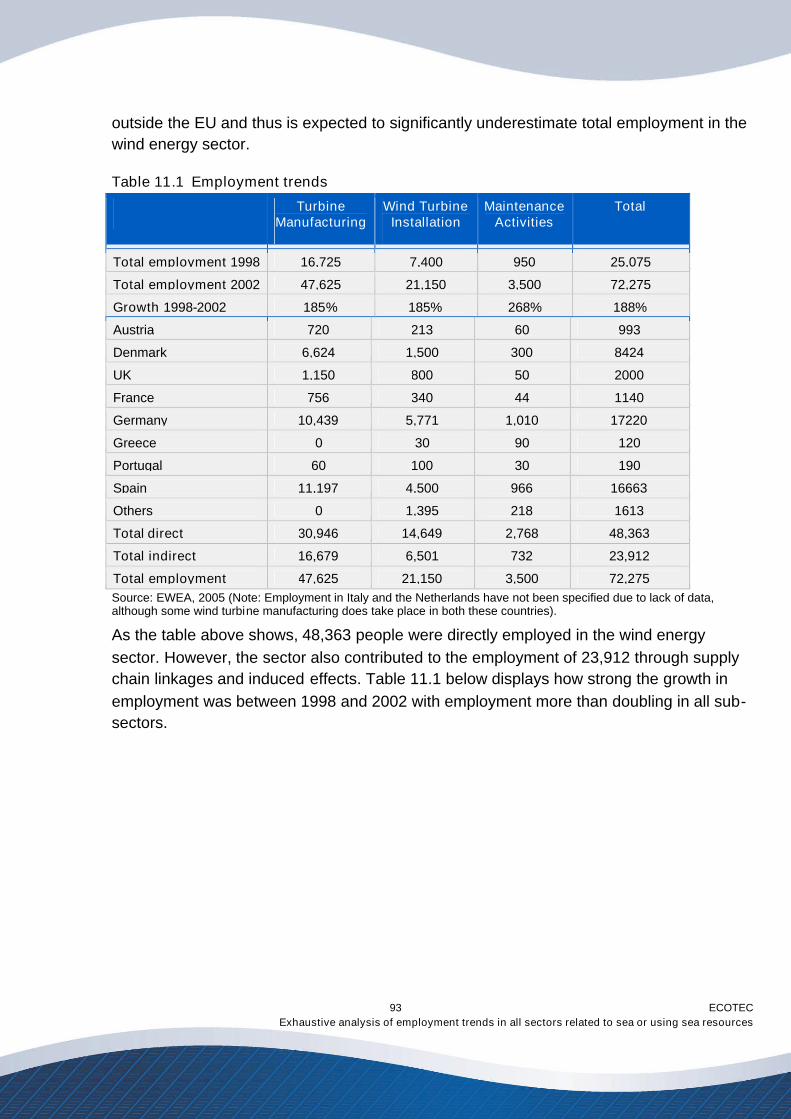
ECOTECExhaustive analysis of employment trends in all sectors related to sea or using sea resources
93
outside the EU and thus is expected to significantly underestimate total employment in thewind energy sector.
Table 11.1 Employment trends
TurbineManufacturing
Wind TurbineInstallation
MaintenanceActivities
Total
Total employment 1998 16,725 7,400 950 25,075
Total employment 2002 47,625 21,150 3,500 72,275
Growth 1998-2002 185% 185% 268% 188%
Austria 720 213 60 993
Denmark 6,624 1,500 300 8424
UK 1,150 800 50 2000
France 756 340 44 1140
Germany 10,439 5,771 1,010 17220
Greece 0 30 90 120
Portugal 60 100 30 190
Spain 11,197 4,500 966 16663
Others 0 1,395 218 1613
Total direct 30,946 14,649 2,768 48,363
Total indirect 16,679 6,501 732 23,912
Total employment 47,625 21,150 3,500 72,275Source: EWEA, 2005 (Note: Employment in Italy and the Netherlands have not been specified due to lack of data,although some wind turbine manufacturing does take place in both these countries).
As the table above shows, 48,363 people were directly employed in the wind energysector. However, the sector also contributed to the employment of 23,912 through supplychain linkages and induced effects. Table 11.1 below displays how strong the growth inemployment was between 1998 and 2002 with employment more than doubling in all sub-sectors.
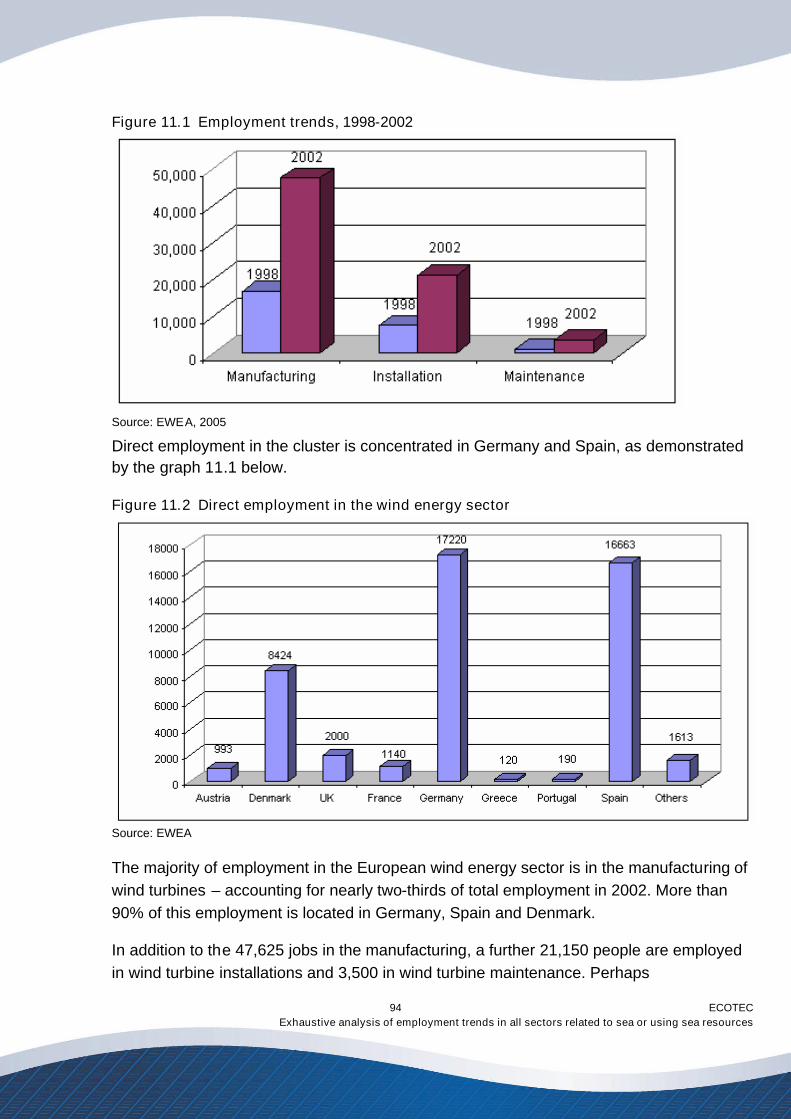
ECOTECExhaustive analysis of employment trends in all sectors related to sea or using sea resources
94
Figure 11.1 Employment trends, 1998-2002
Source: EWEA, 2005
Direct employment in the cluster is concentrated in Germany and Spain, as demonstratedby the graph 11.1 below.
Figure 11.2 Direct employment in the wind energy sector
Source: EWEA
The majority of employment in the European wind energy sector is in the manufacturing ofwind turbines – accounting for nearly two-thirds of total employment in 2002. More than90% of this employment is located in Germany, Spain and Denmark.
In addition to the 47,625 jobs in the manufacturing, a further 21,150 people are employedin wind turbine installations and 3,500 in wind turbine maintenance. Perhaps
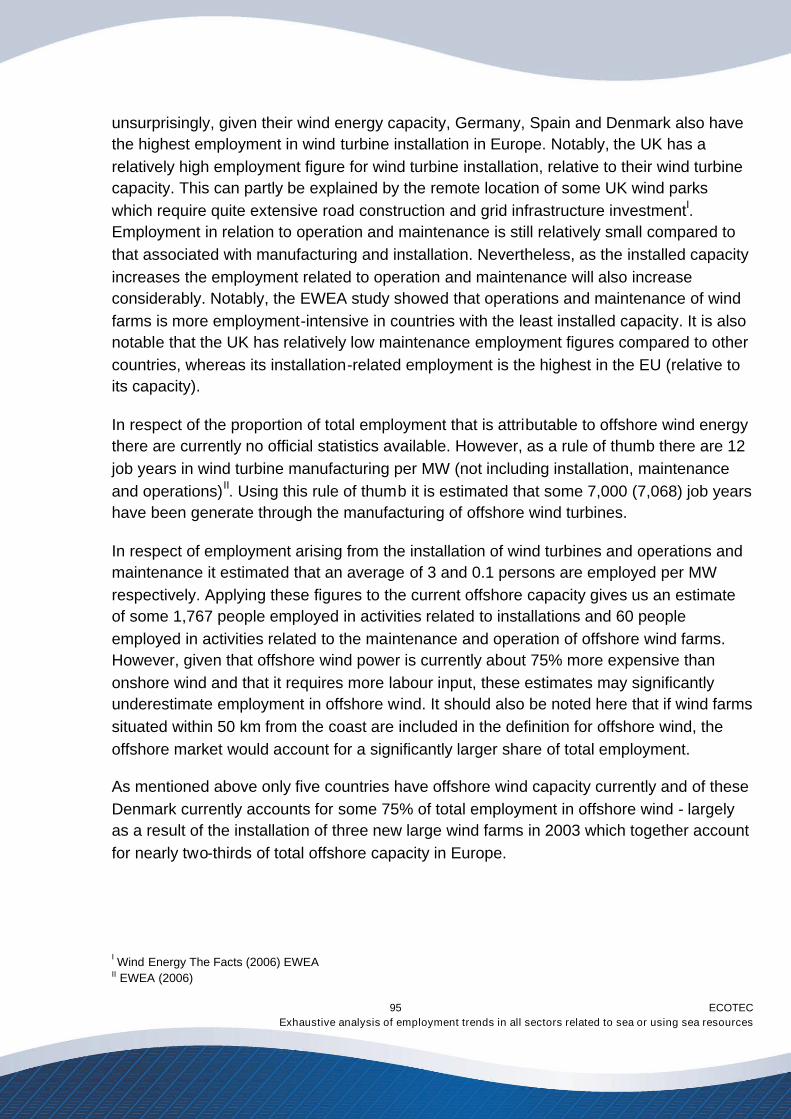
ECOTECExhaustive analysis of employment trends in all sectors related to sea or using sea resources
95
unsurprisingly, given their wind energy capacity, Germany, Spain and Denmark also havethe highest employment in wind turbine installation in Europe. Notably, the UK has arelatively high employment figure for wind turbine installation, relative to their wind turbinecapacity. This can partly be explained by the remote location of some UK wind parkswhich require quite extensive road construction and grid infrastructure investmentI.Employment in relation to operation and maintenance is still relatively small compared tothat associated with manufacturing and installation. Nevertheless, as the installed capacityincreases the employment related to operation and maintenance will also increaseconsiderably. Notably, the EWEA study showed that operations and maintenance of windfarms is more employment-intensive in countries with the least installed capacity. It is alsonotable that the UK has relatively low maintenance employment figures compared to othercountries, whereas its installation-related employment is the highest in the EU (relative toits capacity).
In respect of the proportion of total employment that is attributable to offshore wind energythere are currently no official statistics available. However, as a rule of thumb there are 12job years in wind turbine manufacturing per MW (not including installation, maintenanceand operations)II. Using this rule of thumb it is estimated that some 7,000 (7,068) job yearshave been generate through the manufacturing of offshore wind turbines.
In respect of employment arising from the installation of wind turbines and operations andmaintenance it estimated that an average of 3 and 0.1 persons are employed per MWrespectively. Applying these figures to the current offshore capacity gives us an estimateof some 1,767 people employed in activities related to installations and 60 peopleemployed in activities related to the maintenance and operation of offshore wind farms.However, given that offshore wind power is currently about 75% more expensive thanonshore wind and that it requires more labour input, these estimates may significantlyunderestimate employment in offshore wind. It should also be noted here that if wind farmssituated within 50 km from the coast are included in the definition for offshore wind, theoffshore market would account for a significantly larger share of total employment.
As mentioned above only five countries have offshore wind capacity currently and of theseDenmark currently accounts for some 75% of total employment in offshore wind - largelyas a result of the installation of three new large wind farms in 2003 which together accountfor nearly two-thirds of total offshore capacity in Europe.
I Wind Energy The Facts (2006) EWEAII EWEA (2006)
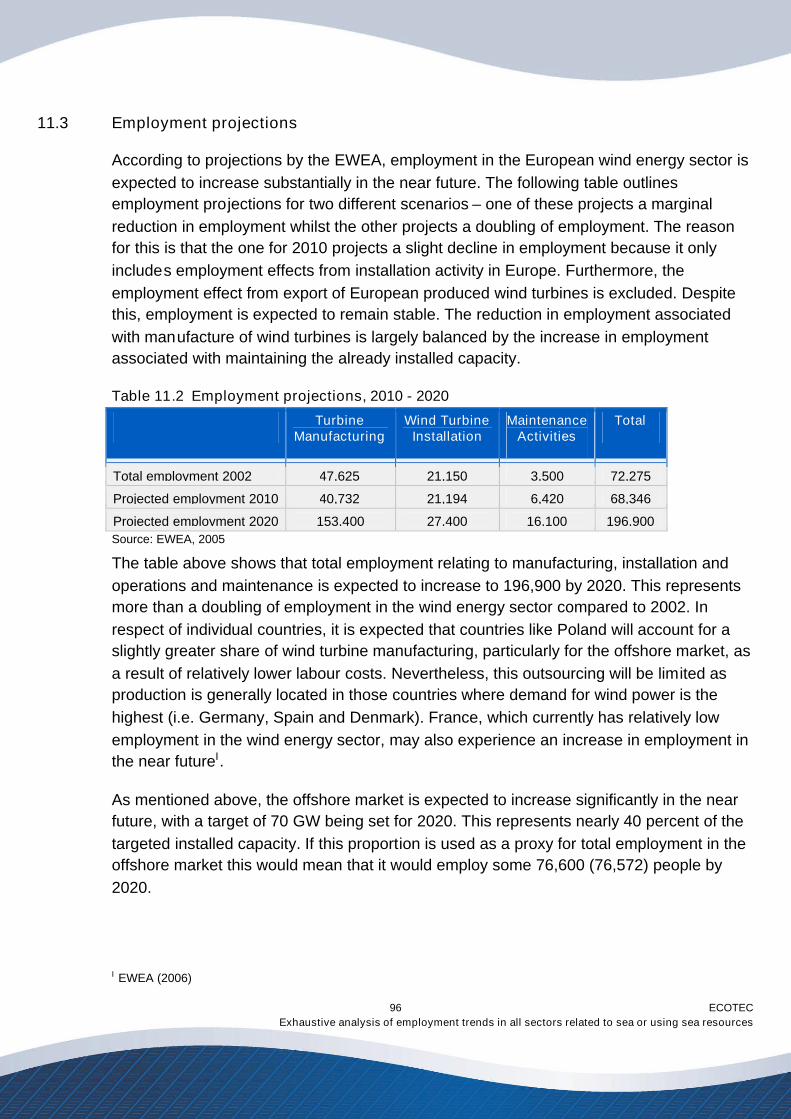
ECOTECExhaustive analysis of employment trends in all sectors related to sea or using sea resources
96
11.3 Employment projections
According to projections by the EWEA, employment in the European wind energy sector isexpected to increase substantially in the near future. The following table outlinesemployment projections for two different scenarios – one of these projects a marginalreduction in employment whilst the other projects a doubling of employment. The reasonfor this is that the one for 2010 projects a slight decline in employment because it onlyincludes employment effects from installation activity in Europe. Furthermore, theemployment effect from export of European produced wind turbines is excluded. Despitethis, employment is expected to remain stable. The reduction in employment associatedwith manufacture of wind turbines is largely balanced by the increase in employmentassociated with maintaining the already installed capacity.
Table 11.2 Employment projections, 2010 - 2020
TurbineManufacturing
Wind TurbineInstallation
MaintenanceActivities
Total
Total employment 2002 47,625 21,150 3,500 72,275
Projected employment 2010 40,732 21,194 6,420 68,346
Projected employment 2020 153,400 27,400 16,100 196,900Source: EWEA, 2005
The table above shows that total employment relating to manufacturing, installation andoperations and maintenance is expected to increase to 196,900 by 2020. This representsmore than a doubling of employment in the wind energy sector compared to 2002. Inrespect of individual countries, it is expected that countries like Poland will account for aslightly greater share of wind turbine manufacturing, particularly for the offshore market, asa result of relatively lower labour costs. Nevertheless, this outsourcing will be limited asproduction is generally located in those countries where demand for wind power is thehighest (i.e. Germany, Spain and Denmark). France, which currently has relatively lowemployment in the wind energy sector, may also experience an increase in employment inthe near futureI.
As mentioned above, the offshore market is expected to increase significantly in the nearfuture, with a target of 70 GW being set for 2020. This represents nearly 40 percent of thetargeted installed capacity. If this proportion is used as a proxy for total employment in theoffshore market this would mean that it would employ some 76,600 (76,572) people by2020.
I EWEA (2006)
ECOTECExhaustive analysis of employment trends in all sectors related to sea or using sea resources
97
In respect of individual nations, there is foreseen rapid development of offshore wind in theNetherlands, Denmark and the UK. In the UK the focus on offshore wind is largely aconsequence of the fact they are hoping to gain a technology lead in the offshore market.In Denmark and the Netherlands on the other hand the focus on offshore wind can partlybe explained by the high population density which makes it spatially difficult to find newlocations for onshore wind farms. Of the new member countries, Poland has the greatestpotential of developing its offshore market.
Experience from previous years shows that the targets for total wind capacity are likely tobe revised upwards in a few years. Indeed, the target set for 2000 in 1991 was alreadyachieved by 1997 and the target set for 2010 in 1997 was achieved already in 2005.
11.4 Skills and training
A significant share of workers in the wind energy sector has been drawn from the decliningshipbuilding sector in Europe, as exemplified by the Danish experience where many windturbine manufacturers, particularly offshore, have located their production in the oldshipyards and employed a significant number of workers that used to be employed inshipbuilding. Importantly, these shipyards, and hence wind turbine manufacturers, aregenerally located in depressed areas with high unemployment rates and has thereforeserved to regenerate these local areas (see case study example, Nakskov andRudkobing).
Retraining of workers from the shipbuilding sector is not very complicated and the same istrue for workers in the car manufacturing industry, which is another European industry thatis currently showing signs of decline. As a result, there is generally not a shortage oflabour or skills in the wind energy sector, though in some countries there is a slightshortage of electrical engineers.
Although there is currently no shortage of available labour in the production andinstallation of wind turbines, there is a need for skilled labour at the research centres.
ECOTECExhaustive analysis of employment trends in all sectors related to sea or using sea resources
98
12.0 Marine aggregates
Marine aggregate production both in France and the UK makes up a little less than 3% ofnational production of building materials. If the activity is classified as extraction,unloading, drying and calibration to delivery for processing the total turnover of the industryin France was €25 million in 2001 and 2002. The value added stood at €10 millionI.
The marine aggregates industry contributes to the creation of 2,500 jobs on British-registered vessels and on landII. Total employment for the sector in 2001 in France was300.III For siliceous materials direct employment is estimated to be 200 seamen and 100on-shore staff (admin, sales and technical duties).
I French maritime-related data 2003, IfremerII BMAPA, 2006III Ibid.
ECOTECExhaustive analysis of employment trends in all sectors related to sea or using sea resources
99
13.0 Coastal tourism
Coastal tourism has become a sector of major economic importance; indeed it is the mostsignificant maritime sector (as defined in this study) in terms of employment in almost allEU Member States with a coastline. For the purposes of this research, coastal tourismemployment is defined as employment generated directly by tourism activities within 50kmfrom the sea. Our aim was to focus on tourism industry employment which is defined asemployment related to the operation and running of accommodation establishments,restaurants and cafes, tour operators, sights and visitor, travel agencies and touristinformation facilities. However, in some countries coastal tourism employment also coversemployment generated by the wider tourism economy, e.g. employment in passengertransport companies.
The traditional coastal tourism product has focussed on the Mediterranean countries;Spain, France, Italy, Greece, Cyprus and Malta in particular. Today the coast of Croatiaand Slovenia are also growing as coastal tourism destinations. Marine related tourism andcruise tourism are also showing evidence of strong growth in many of the NorthernEuropean countries such as the Baltic States and Germany. The North Sea regions havedeveloped the sailing and spa markets in the coastal regions. This study however refers toall tourism industry employment within 50 km from the sea; therefore it also encompassesthe growth in city and short break tourism to many capital cities of Europe (e.g. Tallinn,Stockholm, Copenhagen, Helsinki, Riga).
Coastal tourism has seen growth over the past 2-3 decades mainly due to more leisuretime, increased spending power and improved communication and transportationtechnologies. In recent years, ‘second-home tourism’ to the Mediterranean countries hasincreased dramatically from the Northern Europe, the UK in particular, partly as a result ofthe rapid expansion of low cost airlines.
13.1 Economic impact
The economic or indeed employment impact of coastal tourism has not been calculated atEuropean level or at the Member State level, apart from France. The World Marine Marketreview estimates the economic impact of marine tourism (defined as marine tourismexcluding the impact of travel and accommodation) to be €74 billion in 2005. This figurewas found by calculating the economic impact of the tourism industry in Europe andcalculating a percentage for marine tourism. This approach has also been found to haveits limitations and at its best can only act as an approximation.

ECOTECExhaustive analysis of employment trends in all sectors related to sea or using sea resources
100
13.2 Data availability and reliability
The availability of studies analysing employment in coastal tourism is also extremelylimited as the definition of this study classifies coastal tourism as tourism employmentwithin 50 km from the sea or on the sea. With this classification coastal tourism does notonly relate to marine tourism activities but all tourism employment within the classifieddistance from the sea, also including cities situated by the coast. France is the onlycountry which has developed a systematic and on-going methodology for data collectionon the coastal tourism sector. Ireland is the only European country where a study wasfound that looked at employment generated from sea and water-related tourism activitiesonly, but the study only included employment created by international touristsI.
Eurostat together with OECD and the World Travel and Tourism Council have adopted acommon methodology for tourism employment in the form of a Tourism SatelliteAccounting but as a part of this study it was found that tourism stakeholders at nationallevels have not yet fully started to use this methodology. Accurate employmentcalculations for the sector are further complicated by the seasonal and temporary nature ofemployment and issues around undeclared work.
For this study we have used a variety of methodologies to assess the most accurate levelof employment related to coastal tourism in each study country – as it is only within thescope of this study to rely on existing labour market information. The methodologies thathave been adopted for this study have varied from estimates on the share of coastaltourism of total employment provided to us by national experts, usually representatives ofthe national tourist board or ministry responsible for tourism, to LFS tourism employmentII
data for NUTS II / III coastal regions. The weakness of the latter is that whilst it under-estimates coastal tourism related employment in a sense that the data usually only coversaccommodation and restaurant related employment, it however at the same time over-estimates employment in a sense that the regions tend to cover more than 50km from thesea and many restaurants are mainly used by local people.
In other cases total tourism employment figures have been used, as provided by thenational tourist boards, and their estimates on the proportion of coastal tourismemployment as a part of total tourism employment. Therefore some of the figures aresomewhat crude measures of total coastal tourism employment and should be regardedas an estimate only. It is however also worth mentioning here that WTTCIII data would
I Employment generated by seaside / resort trips, angling, coastal and inland boating, watersports and nature-relatedcoastal activities.II Usually the NACE code for hotels and restaurants only.III World Travel and Tourism Council – tourism satellite accounting.
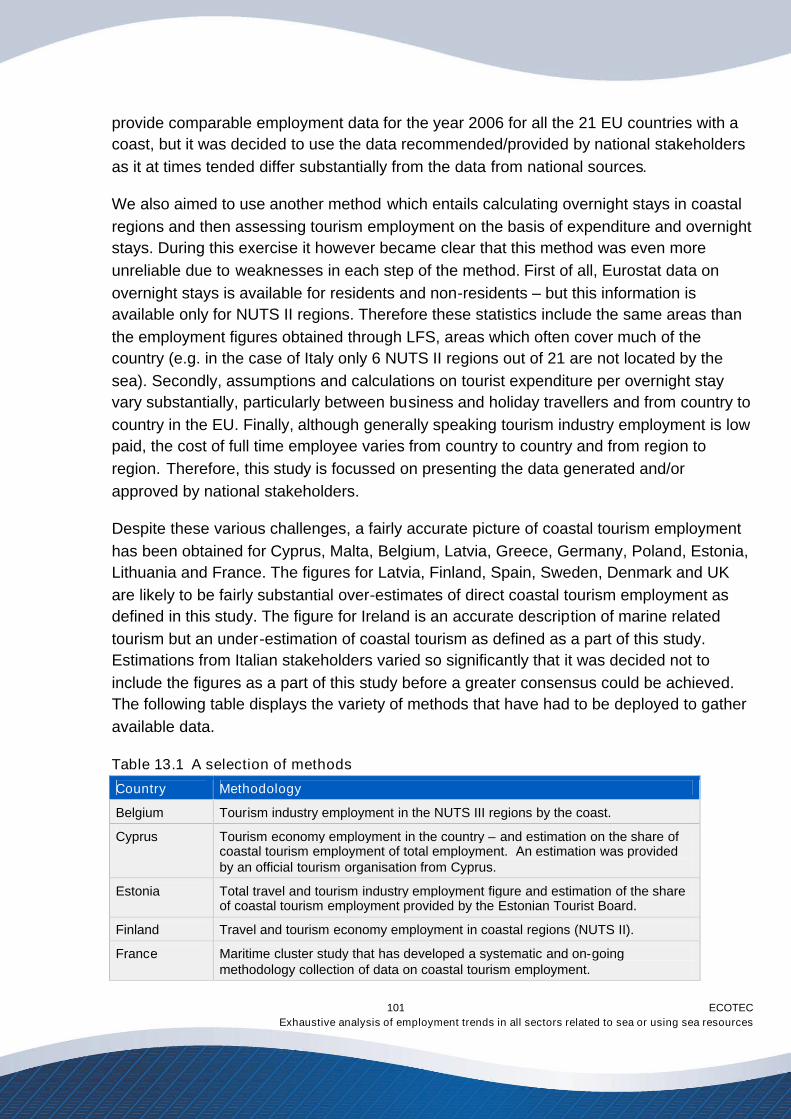
ECOTECExhaustive analysis of employment trends in all sectors related to sea or using sea resources
101
provide comparable employment data for the year 2006 for all the 21 EU countries with acoast, but it was decided to use the data recommended/provided by national stakeholdersas it at times tended differ substantially from the data from national sources.
We also aimed to use another method which entails calculating overnight stays in coastalregions and then assessing tourism employment on the basis of expenditure and overnightstays. During this exercise it however became clear that this method was even moreunreliable due to weaknesses in each step of the method. First of all, Eurostat data onovernight stays is available for residents and non-residents – but this information isavailable only for NUTS II regions. Therefore these statistics include the same areas thanthe employment figures obtained through LFS, areas which often cover much of thecountry (e.g. in the case of Italy only 6 NUTS II regions out of 21 are not located by thesea). Secondly, assumptions and calculations on tourist expenditure per overnight stayvary substantially, particularly between business and holiday travellers and from country tocountry in the EU. Finally, although generally speaking tourism industry employment is lowpaid, the cost of full time employee varies from country to country and from region toregion. Therefore, this study is focussed on presenting the data generated and/orapproved by national stakeholders.
Despite these various challenges, a fairly accurate picture of coastal tourism employmenthas been obtained for Cyprus, Malta, Belgium, Latvia, Greece, Germany, Poland, Estonia,Lithuania and France. The figures for Latvia, Finland, Spain, Sweden, Denmark and UKare likely to be fairly substantial over-estimates of direct coastal tourism employment asdefined in this study. The figure for Ireland is an accurate description of marine relatedtourism but an under-estimation of coastal tourism as defined as a part of this study.Estimations from Italian stakeholders varied so significantly that it was decided not toinclude the figures as a part of this study before a greater consensus could be achieved.The following table displays the variety of methods that have had to be deployed to gatheravailable data.
Table 13.1 A selection of methods
Country Methodology
Belgium Tourism industry employment in the NUTS III regions by the coast.
Cyprus Tourism economy employment in the country – and estimation on the share ofcoastal tourism employment of total employment. An estimation was providedby an official tourism organisation from Cyprus.
Estonia Total travel and tourism industry employment figure and estimation of the shareof coastal tourism employment provided by the Estonian Tourist Board.
Finland Travel and tourism economy employment in coastal regions (NUTS II).
France Maritime cluster study that has developed a systematic and on-goingmethodology collection of data on coastal tourism employment.
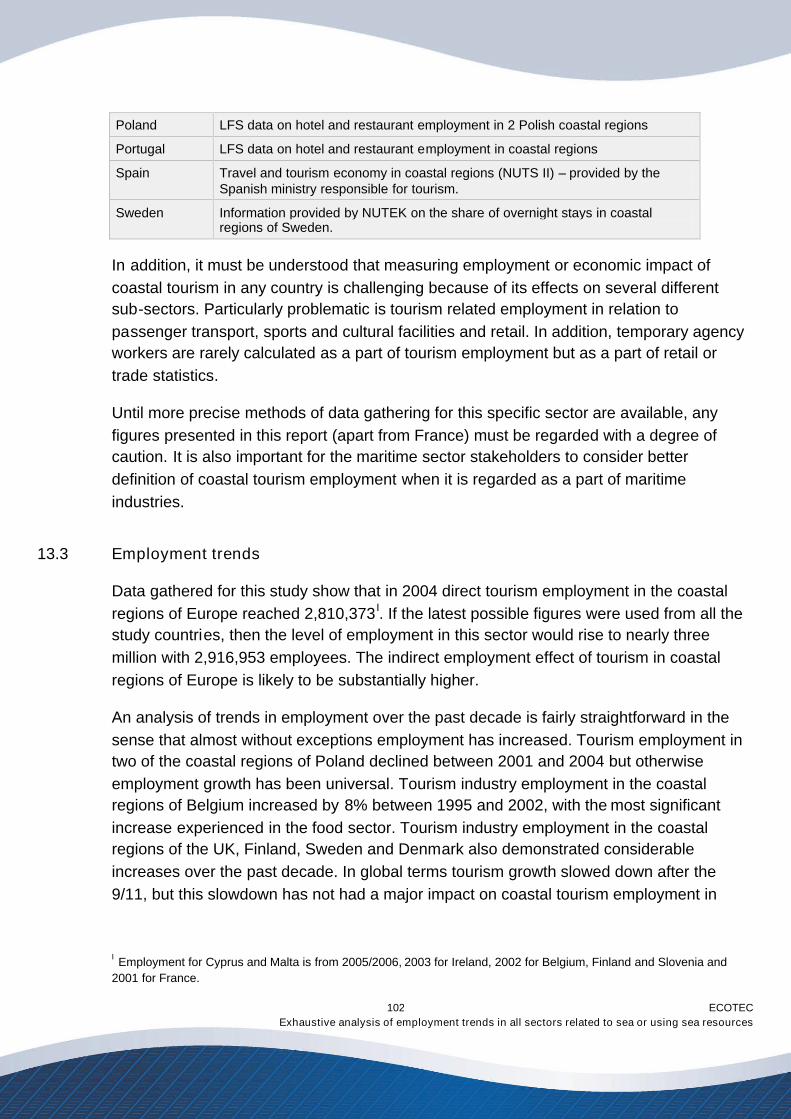
ECOTECExhaustive analysis of employment trends in all sectors related to sea or using sea resources
102
Poland LFS data on hotel and restaurant employment in 2 Polish coastal regions
Portugal LFS data on hotel and restaurant employment in coastal regions
Spain Travel and tourism economy in coastal regions (NUTS II) – provided by theSpanish ministry responsible for tourism.
Sweden Information provided by NUTEK on the share of overnight stays in coastalregions of Sweden.
In addition, it must be understood that measuring employment or economic impact ofcoastal tourism in any country is challenging because of its effects on several differentsub-sectors. Particularly problematic is tourism related employment in relation topassenger transport, sports and cultural facilities and retail. In addition, temporary agencyworkers are rarely calculated as a part of tourism employment but as a part of retail ortrade statistics.
Until more precise methods of data gathering for this specific sector are available, anyfigures presented in this report (apart from France) must be regarded with a degree ofcaution. It is also important for the maritime sector stakeholders to consider betterdefinition of coastal tourism employment when it is regarded as a part of maritimeindustries.
13.3 Employment trends
Data gathered for this study show that in 2004 direct tourism employment in the coastalregions of Europe reached 2,810,373 I. If the latest possible figures were used from all thestudy countries, then the level of employment in this sector would rise to nearly threemillion with 2,916,953 employees. The indirect employment effect of tourism in coastalregions of Europe is likely to be substantially higher.
An analysis of trends in employment over the past decade is fairly straightforward in thesense that almost without exceptions employment has increased. Tourism employment intwo of the coastal regions of Poland declined between 2001 and 2004 but otherwiseemployment growth has been universal. Tourism industry employment in the coastalregions of Belgium increased by 8% between 1995 and 2002, with the most significantincrease experienced in the food sector. Tourism industry employment in the coastalregions of the UK, Finland, Sweden and Denmark also demonstrated considerableincreases over the past decade. In global terms tourism growth slowed down after the9/11, but this slowdown has not had a major impact on coastal tourism employment in
I Employment for Cyprus and Malta is from 2005/2006, 2003 for Ireland, 2002 for Belgium, Finland and Slovenia and2001 for France.
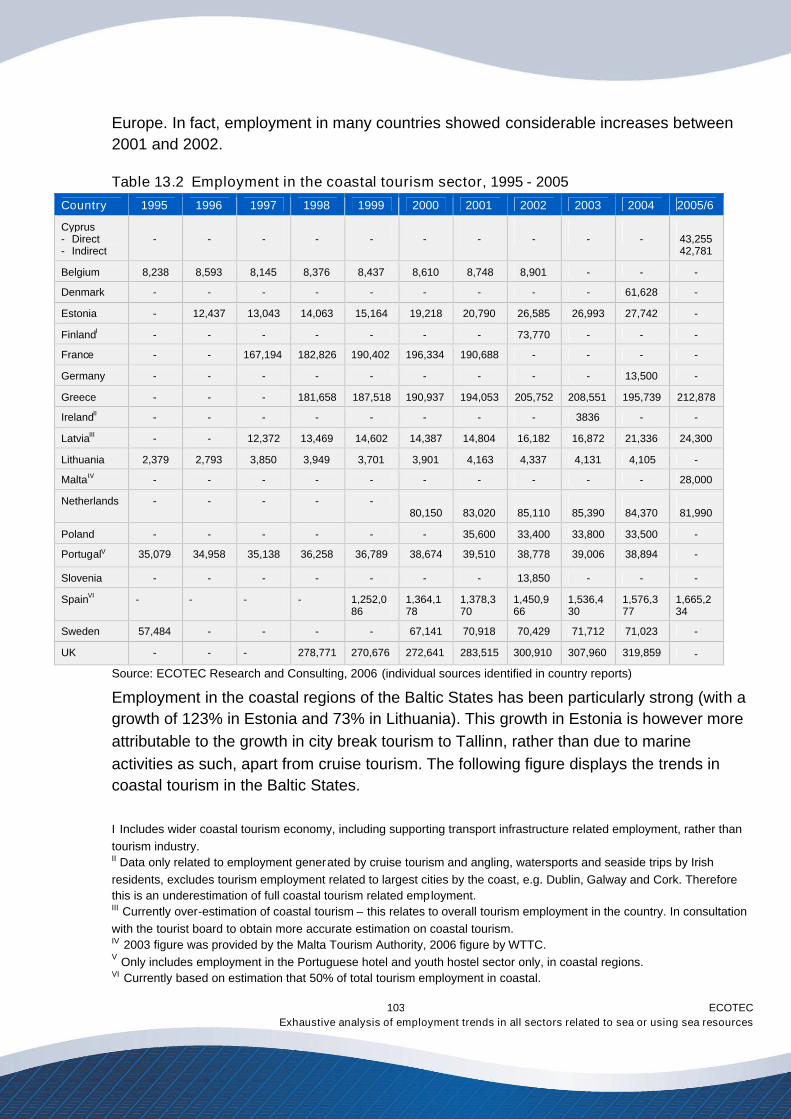
ECOTECExhaustive analysis of employment trends in all sectors related to sea or using sea resources
103
Europe. In fact, employment in many countries showed considerable increases between2001 and 2002.
Table 13.2 Employment in the coastal tourism sector, 1995 - 2005
Country 1995 1996 1997 1998 1999 2000 2001 2002 2003 2004 2005/6
Cyprus- Direct- Indirect
- - - - - - - - - - 43,25542,781
Belgium 8,238 8,593 8,145 8,376 8,437 8,610 8,748 8,901 - - -
Denmark - - - - - - - - - 61,628 -
Estonia - 12,437 13,043 14,063 15,164 19,218 20,790 26,585 26,993 27,742 -
FinlandI - - - - - - - 73,770 - - -
France - - 167,194 182,826 190,402 196,334 190,688 - - - -
Germany - - - - - - - - - 13,500 -
Greece - - - 181,658 187,518 190,937 194,053 205,752 208,551 195,739 212,878
IrelandII - - - - - - - - 3836 - -
LatviaIII - - 12,372 13,469 14,602 14,387 14,804 16,182 16,872 21,336 24,300
Lithuania 2,379 2,793 3,850 3,949 3,701 3,901 4,163 4,337 4,131 4,105 -
MaltaIV - - - - - - - - - - 28,000
Netherlands - - - - -80,150 83,020 85,110 85,390 84,370 81,990
Poland - - - - - - 35,600 33,400 33,800 33,500 -
PortugalV 35,079 34,958 35,138 36,258 36,789 38,674 39,510 38,778 39,006 38,894 -
Slovenia - - - - - - - 13,850 - - -
SpainVI - - - - 1,252,086
1,364,178
1,378,370
1,450,966
1,536,430
1,576,377
1,665,234
Sweden 57,484 - - - - 67,141 70,918 70,429 71,712 71,023 -
UK - - - 278,771 270,676 272,641 283,515 300,910 307,960 319,859 -
Source: ECOTEC Research and Consulting, 2006 (individual sources identified in country reports)
Employment in the coastal regions of the Baltic States has been particularly strong (with agrowth of 123% in Estonia and 73% in Lithuania). This growth in Estonia is however moreattributable to the growth in city break tourism to Tallinn, rather than due to marineactivities as such, apart from cruise tourism. The following figure displays the trends incoastal tourism in the Baltic States.
I Includes wider coastal tourism economy, including supporting transport infrastructure related employment, rather thantourism industry.II Data only related to employment generated by cruise tourism and angling, watersports and seaside trips by Irishresidents, excludes tourism employment related to largest cities by the coast, e.g. Dublin, Galway and Cork. Thereforethis is an underestimation of full coastal tourism related employment.III Currently over-estimation of coastal tourism – this relates to overall tourism employment in the country. In consultationwith the tourist board to obtain more accurate estimation on coastal tourism.IV 2003 figure was provided by the Malta Tourism Authority, 2006 figure by WTTC.V Only includes employment in the Portuguese hotel and youth hostel sector only, in coastal regions.VI Currently based on estimation that 50% of total tourism employment in coastal.
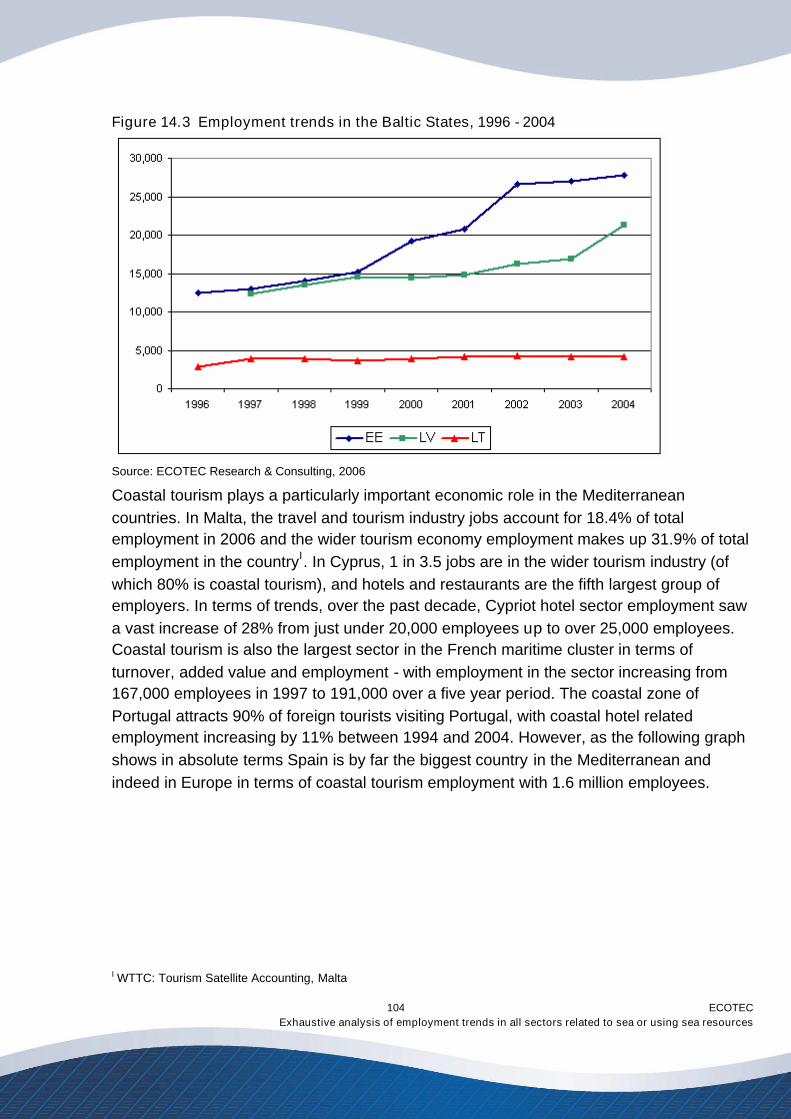
ECOTECExhaustive analysis of employment trends in all sectors related to sea or using sea resources
104
Figure 14.3 Employment trends in the Baltic States, 1996 - 2004
Source: ECOTEC Research & Consulting, 2006
Coastal tourism plays a particularly important economic role in the Mediterraneancountries. In Malta, the travel and tourism industry jobs account for 18.4% of totalemployment in 2006 and the wider tourism economy employment makes up 31.9% of totalemployment in the countryI. In Cyprus, 1 in 3.5 jobs are in the wider tourism industry (ofwhich 80% is coastal tourism), and hotels and restaurants are the fifth largest group ofemployers. In terms of trends, over the past decade, Cypriot hotel sector employment sawa vast increase of 28% from just under 20,000 employees up to over 25,000 employees.Coastal tourism is also the largest sector in the French maritime cluster in terms ofturnover, added value and employment - with employment in the sector increasing from167,000 employees in 1997 to 191,000 over a five year period. The coastal zone ofPortugal attracts 90% of foreign tourists visiting Portugal, with coastal hotel relatedemployment increasing by 11% between 1994 and 2004. However, as the following graphshows in absolute terms Spain is by far the biggest country in the Mediterranean andindeed in Europe in terms of coastal tourism employment with 1.6 million employees.
I WTTC: Tourism Satellite Accounting, Malta
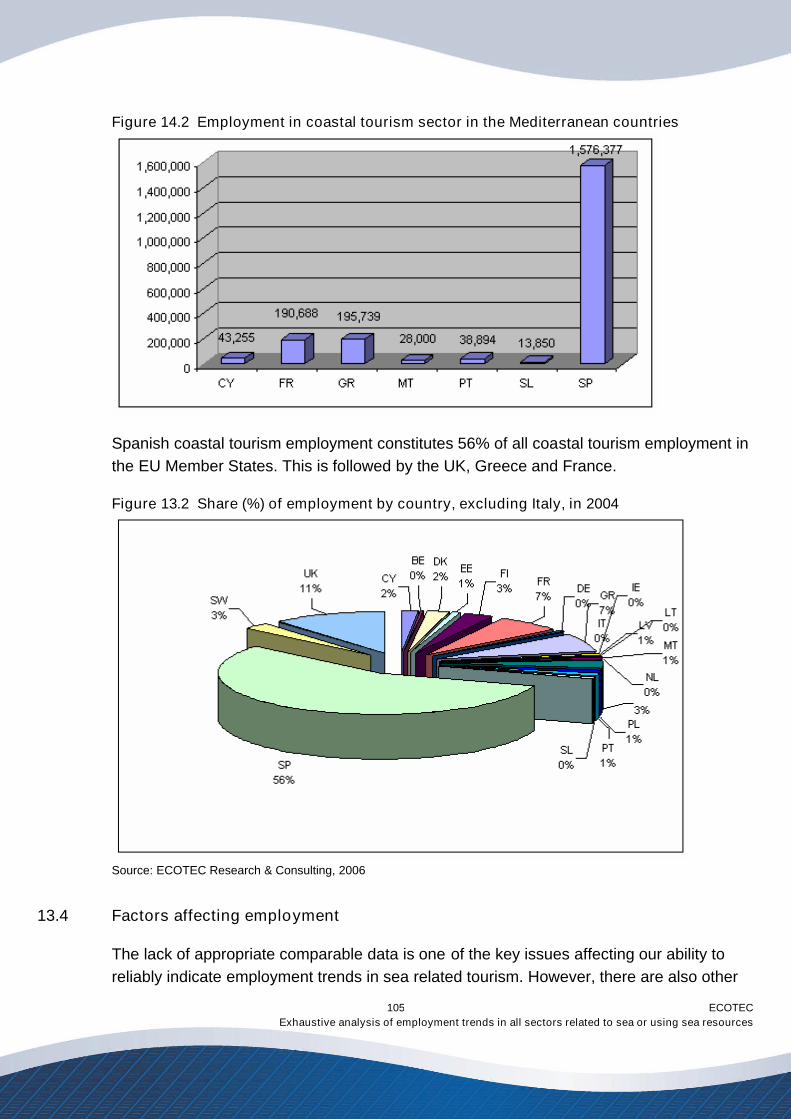
ECOTECExhaustive analysis of employment trends in all sectors related to sea or using sea resources
105
Figure 14.2 Employment in coastal tourism sector in the Mediterranean countries
Spanish coastal tourism employment constitutes 56% of all coastal tourism employment inthe EU Member States. This is followed by the UK, Greece and France.
Figure 13.2 Share (%) of employment by country, excluding Italy, in 2004
Source: ECOTEC Research & Consulting, 2006
13.4 Factors affecting employment
The lack of appropriate comparable data is one of the key issues affecting our ability toreliably indicate employment trends in sea related tourism. However, there are also other
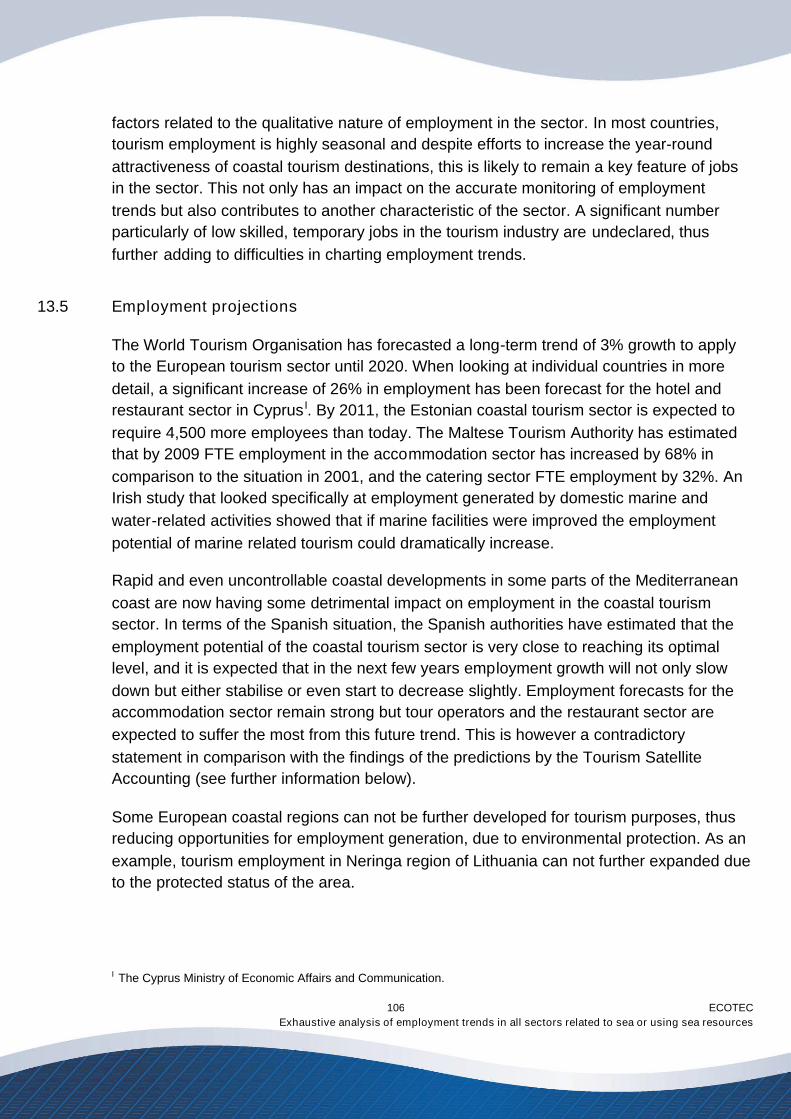
ECOTECExhaustive analysis of employment trends in all sectors related to sea or using sea resources
106
factors related to the qualitative nature of employment in the sector. In most countries,tourism employment is highly seasonal and despite efforts to increase the year-roundattractiveness of coastal tourism destinations, this is likely to remain a key feature of jobsin the sector. This not only has an impact on the accurate monitoring of employmenttrends but also contributes to another characteristic of the sector. A significant numberparticularly of low skilled, temporary jobs in the tourism industry are undeclared, thusfurther adding to difficulties in charting employment trends.
13.5 Employment projections
The World Tourism Organisation has forecasted a long-term trend of 3% growth to applyto the European tourism sector until 2020. When looking at individual countries in moredetail, a significant increase of 26% in employment has been forecast for the hotel andrestaurant sector in Cyprus I. By 2011, the Estonian coastal tourism sector is expected torequire 4,500 more employees than today. The Maltese Tourism Authority has estimatedthat by 2009 FTE employment in the accommodation sector has increased by 68% incomparison to the situation in 2001, and the catering sector FTE employment by 32%. AnIrish study that looked specifically at employment generated by domestic marine andwater-related activities showed that if marine facilities were improved the employmentpotential of marine related tourism could dramatically increase.
Rapid and even uncontrollable coastal developments in some parts of the Mediterraneancoast are now having some detrimental impact on employment in the coastal tourismsector. In terms of the Spanish situation, the Spanish authorities have estimated that theemployment potential of the coastal tourism sector is very close to reaching its optimallevel, and it is expected that in the next few years employment growth will not only slowdown but either stabilise or even start to decrease slightly. Employment forecasts for theaccommodation sector remain strong but tour operators and the restaurant sector areexpected to suffer the most from this future trend. This is however a contradictorystatement in comparison with the findings of the predictions by the Tourism SatelliteAccounting (see further information below).
Some European coastal regions can not be further developed for tourism purposes, thusreducing opportunities for employment generation, due to environmental protection. As anexample, tourism employment in Neringa region of Lithuania can not further expanded dueto the protected status of the area.
I The Cyprus Ministry of Economic Affairs and Communication.
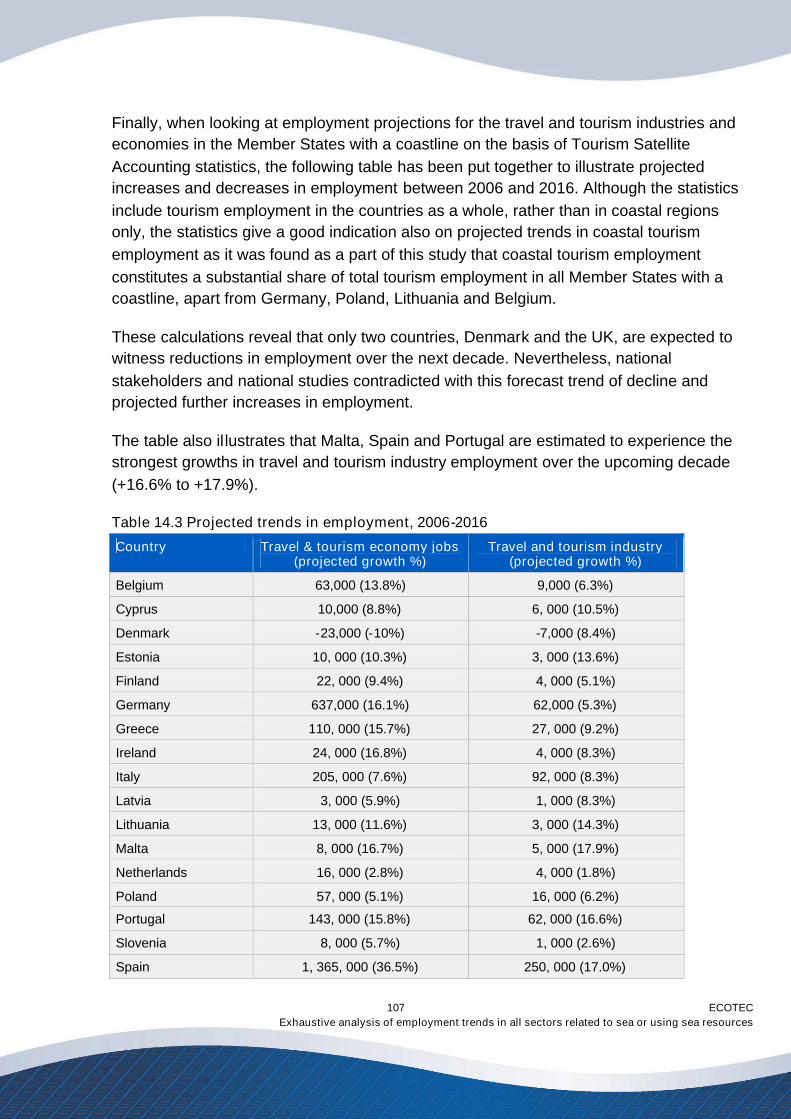
ECOTECExhaustive analysis of employment trends in all sectors related to sea or using sea resources
107
Finally, when looking at employment projections for the travel and tourism industries andeconomies in the Member States with a coastline on the basis of Tourism SatelliteAccounting statistics, the following table has been put together to illustrate projectedincreases and decreases in employment between 2006 and 2016. Although the statisticsinclude tourism employment in the countries as a whole, rather than in coastal regionsonly, the statistics give a good indication also on projected trends in coastal tourismemployment as it was found as a part of this study that coastal tourism employmentconstitutes a substantial share of total tourism employment in all Member States with acoastline, apart from Germany, Poland, Lithuania and Belgium.
These calculations reveal that only two countries, Denmark and the UK, are expected towitness reductions in employment over the next decade. Nevertheless, nationalstakeholders and national studies contradicted with this forecast trend of decline andprojected further increases in employment.
The table also illustrates that Malta, Spain and Portugal are estimated to experience thestrongest growths in travel and tourism industry employment over the upcoming decade(+16.6% to +17.9%).
Table 14.3 Projected trends in employment, 2006-2016
Country Travel & tourism economy jobs(projected growth %)
Travel and tourism industry(projected growth %)
Belgium 63,000 (13.8%) 9,000 (6.3%)
Cyprus 10,000 (8.8%) 6, 000 (10.5%)
Denmark -23,000 (-10%) -7,000 (8.4%)
Estonia 10, 000 (10.3%) 3, 000 (13.6%)
Finland 22, 000 (9.4%) 4, 000 (5.1%)
Germany 637,000 (16.1%) 62,000 (5.3%)
Greece 110, 000 (15.7%) 27, 000 (9.2%)
Ireland 24, 000 (16.8%) 4, 000 (8.3%)
Italy 205, 000 (7.6%) 92, 000 (8.3%)
Latvia 3, 000 (5.9%) 1, 000 (8.3%)
Lithuania 13, 000 (11.6%) 3, 000 (14.3%)
Malta 8, 000 (16.7%) 5, 000 (17.9%)
Netherlands 16, 000 (2.8%) 4, 000 (1.8%)
Poland 57, 000 (5.1%) 16, 000 (6.2%)
Portugal 143, 000 (15.8%) 62, 000 (16.6%)
Slovenia 8, 000 (5.7%) 1, 000 (2.6%)
Spain 1, 365, 000 (36.5%) 250, 000 (17.0%)
ECOTECExhaustive analysis of employment trends in all sectors related to sea or using sea resources
108
United Kingdom -28,000 (-1%) -61,000 (-6.2%)Source: ECOTEC calculations on the basis of WTTC data
13.6 Cruise tourism
Cruise tourism is one of the growth sectors in the maritime cluster but it is not analysed asa sector of its own due the duplication of statistics with tourism and shipping sectorstatistics. This section however looks into the employment in the cruise tourism sector inmore detail.
A CLOSER ANALYSIS ON EMPLOYMENT IN THE CRUISE TOURISM SECTOR
The cruise industry in Europe has undergone significant expansion over the last 15 years – with an annualgrowth rate of over 10% since 2001. Due to being one of the core sea related growth industries, it wasdecided to outline the economic and employment impact of the industry in more detail. However,employment data relating to the cruise tourism industry partly duplicates employment data fromshipbuilding and shipping sectors. This must be taken into consideration when reading this section.
In Western Europe, the UK remains the largest market with more than a third of all Western Europeanpassengers. Other core markets in the cruise industry, in order of significance, are Germany, Italy, Spainand France. Together these five countries account for approximately 90 percent of total cruise bookings.
Although, at present, there is no definitive research in Europe on the economic impact of the operations ofthe cruise industry it is possible to provide some estimates for the region by drawing from the ICCL/BREA'sexisting North American analysis. In this study direct spending in 2004 by the cruise lines and passengerson goods and services were calculated at €1,445 per passenger. If this is replicated in Europe the totaleconomic benefit of the operations of the cruise industry was €8.36 billion in 2004. This figure amounts to atotal of €17.1 billion if shipbuilding related to cruise tourism is also included. Direct spending on goods andservices (related to the operations of the cruise industry) is estimated at €4.10 billion. It should be notedthat these figures should be treated as guidance only as there are significant structural difference betweenthe North American and Western European market which will necessarily have an effect on the sector'simpact on the economy.
Employment trends
Using the same methods as above for the economic impact, it is estimated that the Western Europeancruise industry (excluding cruise shipbuilding) directly employed some 110,000 (110,005) in 2004.According to the data from the European Cruise Council the European shipyards building cruise shipsprovided 26,910 jobs directly and further 80,730 jobs indirectly in marine equipment and service sectors.
According to this data if indirect and direct employment related to the construction of cruise ships is alsotaken into consideration, the study of the ECC estimates that this total increases up to 217,600. Given thatthe number of passengers has increased on average 10% annually since 2001, it can be assumed thatemployment related to the operation of cruise ships has also increased in recent years.
Employment related to the building of cruise ships
As mentioned above nearly all of the world's new cruise ships are being built in European shipyards, ormore precisely in four European shipyards in Italy, France, Germany and Finland. Together it is estimatedthat the cruise industry accounted for the employment of 26,910 individuals at these shipyards in 2004. Inaddition the shipyards contributed to the employment of 80,730 people in the maritime equipment andservice sector, bringing the total to at least 107,640. If the indirect jobs created through the 9,000 sub-
ECOTECExhaustive analysis of employment trends in all sectors related to sea or using sea resources
109
contractors employed by the shipbuilding industry in the service sector are also included this figure wouldincrease significantly. Significantly, the vast majority of maritime equipment and services used for cruiseships is sourced from Europe. For example, at the family controlled Meyer Werft in Germany a recentlycompleted ship's prefabricated cabins were made in Germany, the wall panels in Norway, carpets inDenmark, galleys in Finland, and other products were manufactured in France and Italy. The turnkeyoutfitting in public areas was completed by a variety of German companies. Mathias Munchau, director ofGermany's maritime industry and marine equipment suppliers VSM, suggests that 1,000 to 2,000businesses lie behind the building of a cruise-ship in Germany.
In Italy and France, the sourcing of equipment and products outside the individual country is lesssignificant, as there is such extensive local manufacturing capability. In France, for example, between one-third and a half of equipment is supplied by French manufacturers.
Employment projections
In 2004 the total number of passengers in the Western Europe cruise market grew by 5%. However,market growth was not consistent in all countries and the market actually contracted in countries such asGreece, Sweden, the Netherlands and Spain. However, in the future, cruise ship operations are expectedto continue to expand through an increase in cruise ships and investment which will increase the capacityof the Western European market. This suggests that there are prospects for further employment andeconomic benefits to be generated from the cruise industry in the future. A demographic trend of an ageingpopulation is expected to further reinforce this trend.
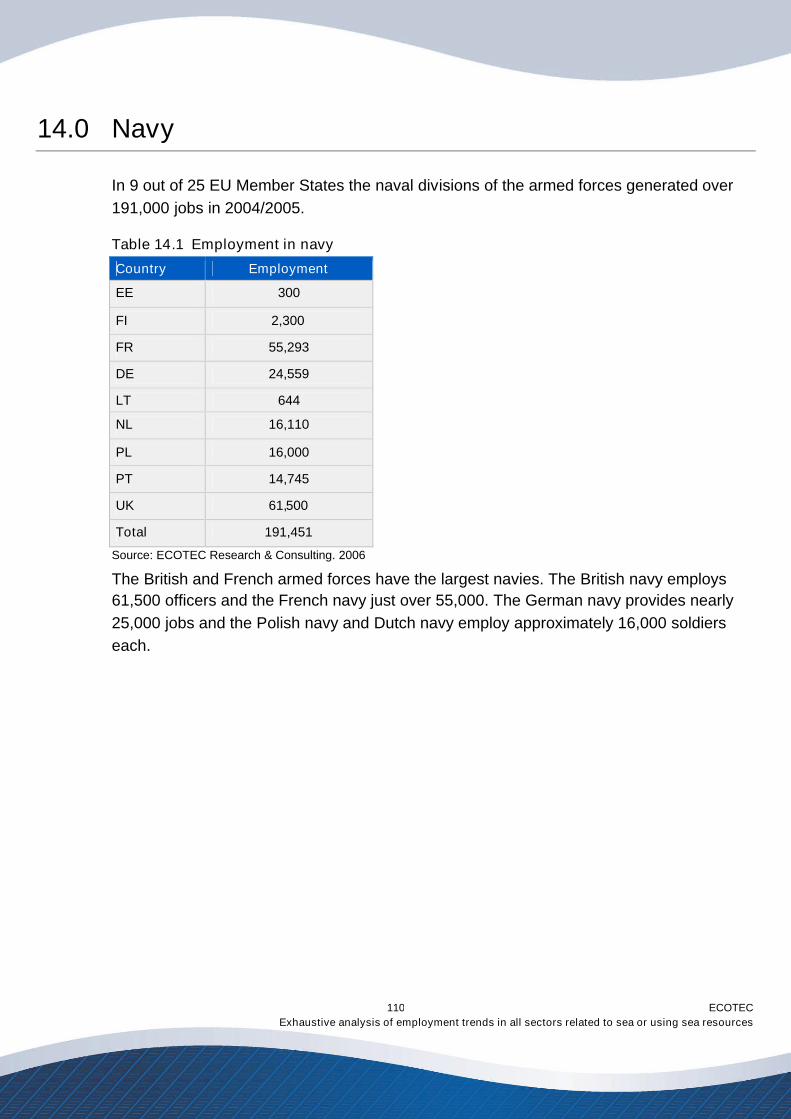
ECOTECExhaustive analysis of employment trends in all sectors related to sea or using sea resources
110
14.0 Navy
In 9 out of 25 EU Member States the naval divisions of the armed forces generated over191,000 jobs in 2004/2005.
Table 14.1 Employment in navy
Country Employment
EE 300
FI 2,300
FR 55,293
DE 24,559
LT 644
NL 16,110
PL 16,000
PT 14,745
UK 61,500
Total 191,451
Source: ECOTEC Research & Consulting. 2006
The British and French armed forces have the largest navies. The British navy employs61,500 officers and the French navy just over 55,000. The German navy provides nearly25,000 jobs and the Polish navy and Dutch navy employ approximately 16,000 soldierseach.
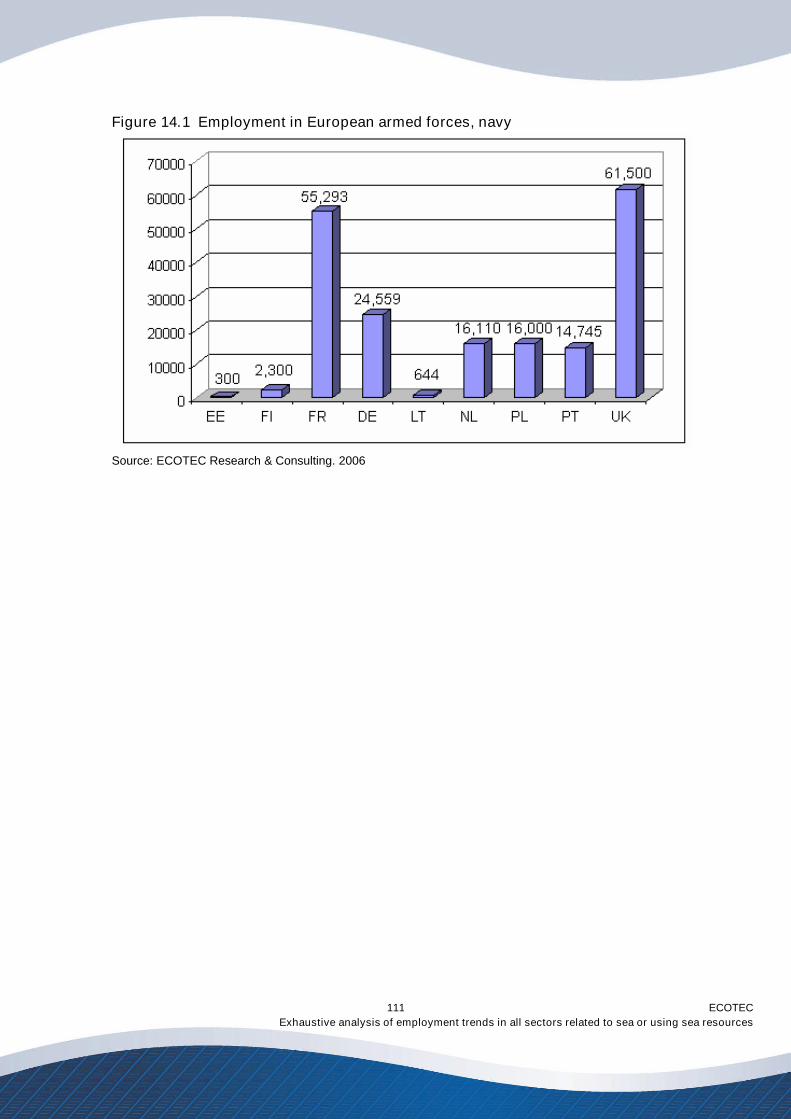
ECOTECExhaustive analysis of employment trends in all sectors related to sea or using sea resources
111
Figure 14.1 Employment in European armed forces, navy
Source: ECOTEC Research & Consulting. 2006
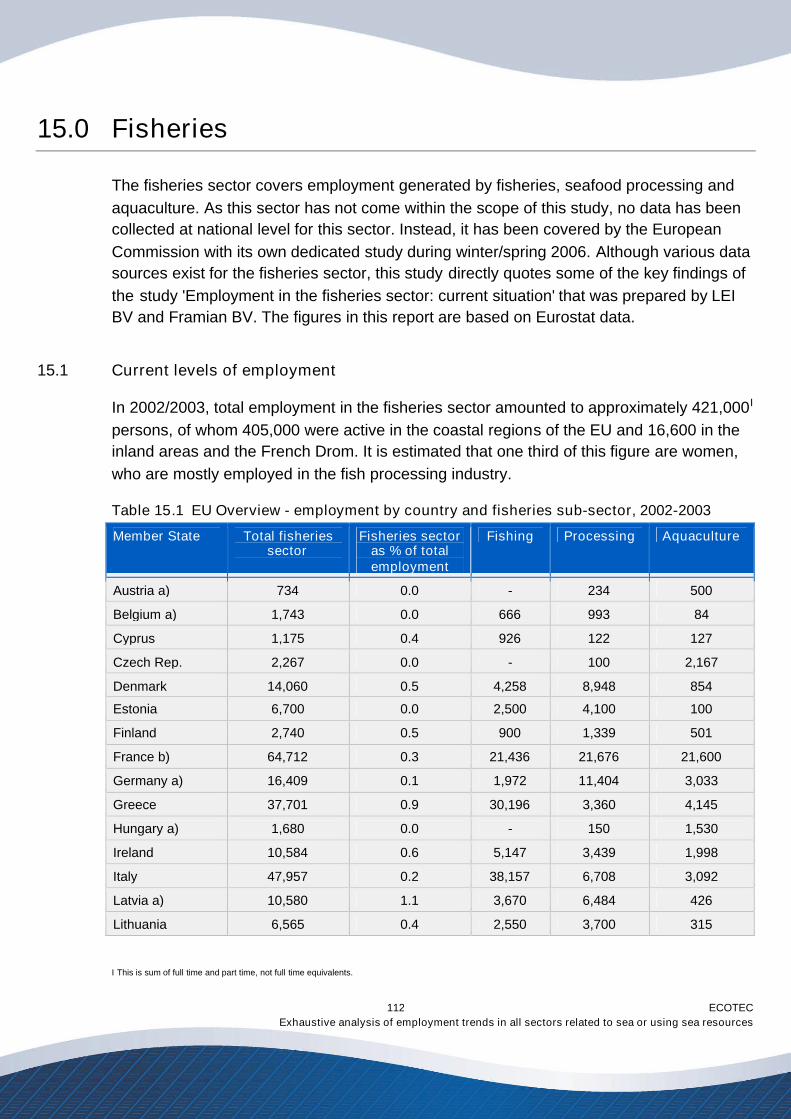
ECOTECExhaustive analysis of employment trends in all sectors related to sea or using sea resources
112
15.0 Fisheries
The fisheries sector covers employment generated by fisheries, seafood processing andaquaculture. As this sector has not come within the scope of this study, no data has beencollected at national level for this sector. Instead, it has been covered by the EuropeanCommission with its own dedicated study during winter/spring 2006. Although various datasources exist for the fisheries sector, this study directly quotes some of the key findings ofthe study 'Employment in the fisheries sector: current situation' that was prepared by LEIBV and Framian BV. The figures in this report are based on Eurostat data.
15.1 Current levels of employment
In 2002/2003, total employment in the fisheries sector amounted to approximately 421,000I
persons, of whom 405,000 were active in the coastal regions of the EU and 16,600 in theinland areas and the French Drom. It is estimated that one third of this figure are women,who are mostly employed in the fish processing industry.
Table 15.1 EU Overview - employment by country and fisheries sub-sector, 2002-2003
Member State Total fisheriessector
Fisheries sectoras % of totalemployment
Fishing Processing Aquaculture
Austria a) 734 0.0 - 234 500
Belgium a) 1,743 0.0 666 993 84
Cyprus 1,175 0.4 926 122 127
Czech Rep. 2,267 0.0 - 100 2,167
Denmark 14,060 0.5 4,258 8,948 854
Estonia 6,700 0.0 2,500 4,100 100
Finland 2,740 0.5 900 1,339 501
France b) 64,712 0.3 21,436 21,676 21,600
Germany a) 16,409 0.1 1,972 11,404 3,033
Greece 37,701 0.9 30,196 3,360 4,145
Hungary a) 1,680 0.0 - 150 1,530
Ireland 10,584 0.6 5,147 3,439 1,998
Italy 47,957 0.2 38,157 6,708 3,092
Latvia a) 10,580 1.1 3,670 6,484 426
Lithuania 6,565 0.4 2,550 3,700 315
I This is sum of full time and part time, not full time equivalents.
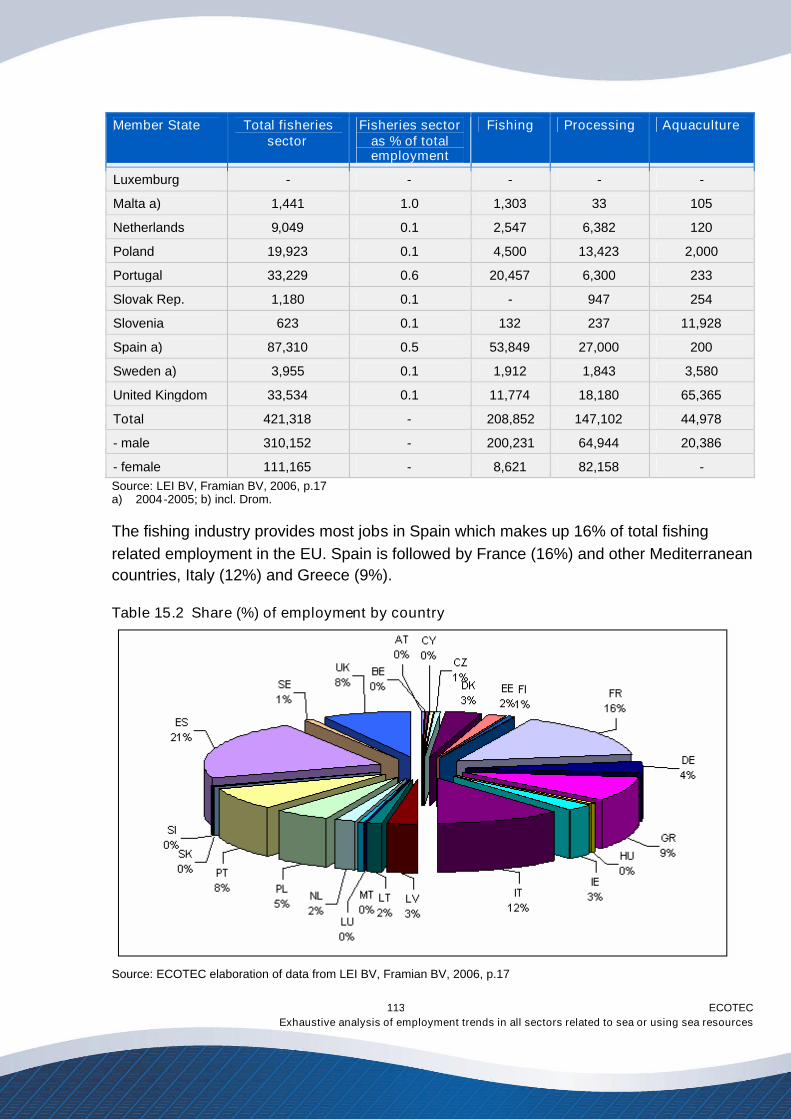
ECOTECExhaustive analysis of employment trends in all sectors related to sea or using sea resources
113
Member State Total fisheriessector
Fisheries sectoras % of totalemployment
Fishing Processing Aquaculture
Luxemburg - - - - -
Malta a) 1,441 1.0 1,303 33 105
Netherlands 9,049 0.1 2,547 6,382 120
Poland 19,923 0.1 4,500 13,423 2,000
Portugal 33,229 0.6 20,457 6,300 233
Slovak Rep. 1,180 0.1 - 947 254
Slovenia 623 0.1 132 237 11,928
Spain a) 87,310 0.5 53,849 27,000 200
Sweden a) 3,955 0.1 1,912 1,843 3,580
United Kingdom 33,534 0.1 11,774 18,180 65,365
Total 421,318 - 208,852 147,102 44,978
- male 310,152 - 200,231 64,944 20,386
- female 111,165 - 8,621 82,158 -Source: LEI BV, Framian BV, 2006, p.17a) 2004-2005; b) incl. Drom.
The fishing industry provides most jobs in Spain which makes up 16% of total fishingrelated employment in the EU. Spain is followed by France (16%) and other Mediterraneancountries, Italy (12%) and Greece (9%).
Table 15.2 Share (%) of employment by country
Source: ECOTEC elaboration of data from LEI BV, Framian BV, 2006, p.17
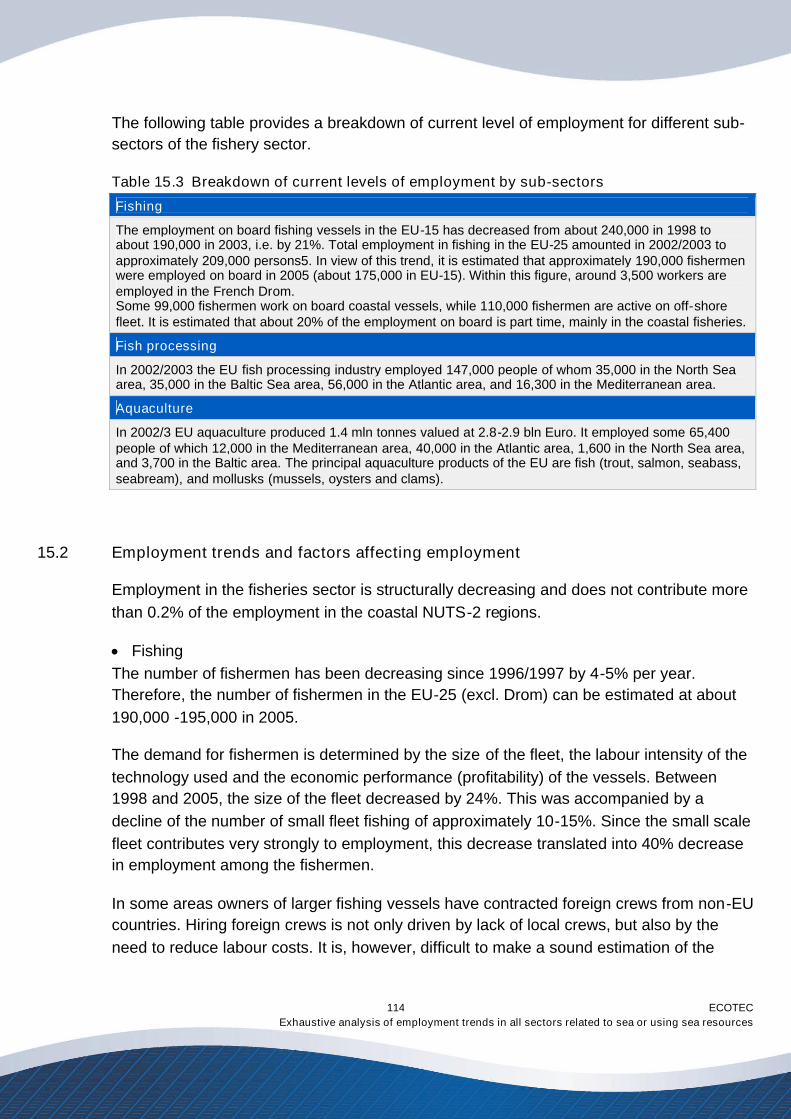
ECOTECExhaustive analysis of employment trends in all sectors related to sea or using sea resources
114
The following table provides a breakdown of current level of employment for different sub-sectors of the fishery sector.
Table 15.3 Breakdown of current levels of employment by sub-sectors
Fishing
The employment on board fishing vessels in the EU-15 has decreased from about 240,000 in 1998 toabout 190,000 in 2003, i.e. by 21%. Total employment in fishing in the EU-25 amounted in 2002/2003 toapproximately 209,000 persons5. In view of this trend, it is estimated that approximately 190,000 fishermenwere employed on board in 2005 (about 175,000 in EU-15). Within this figure, around 3,500 workers areemployed in the French Drom.Some 99,000 fishermen work on board coastal vessels, while 110,000 fishermen are active on off-shorefleet. It is estimated that about 20% of the employment on board is part time, mainly in the coastal fisheries.
Fish processing
In 2002/2003 the EU fish processing industry employed 147,000 people of whom 35,000 in the North Seaarea, 35,000 in the Baltic Sea area, 56,000 in the Atlantic area, and 16,300 in the Mediterranean area.
Aquaculture
In 2002/3 EU aquaculture produced 1.4 mln tonnes valued at 2.8-2.9 bln Euro. It employed some 65,400people of which 12,000 in the Mediterranean area, 40,000 in the Atlantic area, 1,600 in the North Sea area,and 3,700 in the Baltic area. The principal aquaculture products of the EU are fish (trout, salmon, seabass,seabream), and mollusks (mussels, oysters and clams).
15.2 Employment trends and factors affecting employment
Employment in the fisheries sector is structurally decreasing and does not contribute morethan 0.2% of the employment in the coastal NUTS-2 regions.
FishingThe number of fishermen has been decreasing since 1996/1997 by 4-5% per year.Therefore, the number of fishermen in the EU-25 (excl. Drom) can be estimated at about190,000 -195,000 in 2005.
The demand for fishermen is determined by the size of the fleet, the labour intensity of thetechnology used and the economic performance (profitability) of the vessels. Between1998 and 2005, the size of the fleet decreased by 24%. This was accompanied by adecline of the number of small fleet fishing of approximately 10-15%. Since the small scalefleet contributes very strongly to employment, this decrease translated into 40% decreasein employment among the fishermen.
In some areas owners of larger fishing vessels have contracted foreign crews from non-EUcountries. Hiring foreign crews is not only driven by lack of local crews, but also by theneed to reduce labour costs. It is, however, difficult to make a sound estimation of the
ECOTECExhaustive analysis of employment trends in all sectors related to sea or using sea resources
115
number of foreigners who have replaced EU crewmen. A very rough estimate would beapproximately 5,000 -10,000.
Fish processingThe trends in seafood processing differs depending on the region. In the regions thatdepended on local landings, employment in seafood processing dropped as a result of amove away from primary food processing. This trend is accompanied by the decreasingdistinctiveness of the seafood processing and its greater integration in the general foodprocessing industry, coupled with the development of new added value products (such asready meals). Therefore, part of the employment in the sector is expected to disappear asa result of further consolidation of the industry. Additionally, competition with thirdcountries, with low labour costs, has dramatically increased which has negative impact onprices. It is expected that a larger share of employment in fish processing will betransferred to low-wage countries.
AquacultureThe major issues of concern to the aquaculture sector are increasing competition fromimports and technological progress. The former results in particular in great pricedecreases and the necessity to increase productivity, both of which result in reductionrather than the growth of employment. This is further aggravated by the relatively negativeimage of fish farming (environmental concerns) and the difficulty in attracting youngerworkers to the sector.
ECOTECExhaustive analysis of employment trends in all sectors related to sea or using sea resources
116
16.0 Sectoral policy discussion; recommendations andexamples of good practice
This chapter discusses some of the key policy recommendations for individual sectorswithin the sea related sectorsI.
16.1 Shipbuilding
Firstly, as the study has identified, an increasingly intense global competition in theshipbuilding industry has put pressure on employment in the sector. Given the heavydependency on these global trends, it is necessary to continue the present approachtowards international trade policy and to ensure the full applicability of the WTO regime tothe shipbuilding sector. It is also necessary to renegotiate the OECD shipbuildingagreement on the regulation of subsidies and injurous pricing practices. Since Europeanshipyards are not well placed to compete on price, they increasingly suffer reductions incapacity, output and, consequently, employment if globally applicable trade rules are notimplementedII. These difficulties were outlined by industry stakeholders and EuropeanCommission and national policy representatives in the forum leading to the LeaderSHIP2015 recommendations.
Since the major competitive advantage of the European shipbuilding industry is its highRDI content, the industry and policy makers must co-operate to ensure the protection ofintellectual property rights (IPR). Technological innovation also requires integration andcoordination through the creation of technology platforms. The work presently undertakenby the Maritime Industries Forum is a good basis for such an approach.
The sector is also affected by the difficulties experienced in obtaining financial guaranteesor credits. For example, Polish shipyards experience difficulties in obtaining commercialcredits. On the other hand, the Netherlands have made a significant progress with theintroduction of a financial guarantee fund for the shipbuilding industry aimed at pre-financing, which can potentially enable the industry to benefit from increased internationaldemand for new ships. Indeed, the difficulties relating to shipbuilding financing could beeased up through an establishment of an EU-wide pre- and post-delivery financingsystems.
I General cross-cutting policy considerations are presented at the end of the report.II CESA Annual Report, 2004-2005, p.15
ECOTECExhaustive analysis of employment trends in all sectors related to sea or using sea resources
117
Improving research, development and innovation investment for the sector can alsoadvance the sustainability of employment in the shipbuilding sector. Projects initiatedunder the 6th Framework Programme are good examples of fostering vertical integration,collaboration and innovation between shipyards and suppliers. A review of the currentState aid regimes in the view of innovation aid has also been suggested. In actual factseveral European countries, such as Germany, Spain and France have alreadysuccessfully submitted applications for innovation subsidies to the European Commission.At present, the Dutch employers' organisation VNSI is urging the Dutch government tosubmit a similar application. With regards to naval shipbuilding, activities that can fostergreater collaboration between naval shipyards across the borders in Europe arerecommended, as well as a continuous exchange of expertise and information betweenmerchant and military shipbuilders.
The sector faces a range of challenges in relation to employment which need to beaddressed through innovative solutions negotiated between social partner and other keystakeholders. These challenges include the cyclical nature of employment, an ageingworkforce and increasing skill shortages not only in relation to particular skills profiles butalso in certain geographical locations affected by “brain drain” (e.g. from eastern towestern Europe). An outdated image of the sector as being one of heavy manual worktogether with the perception of an industry in decline as a result of past layoffs and thecyclical nature of employment have impacted on the number of young people training forand seeking careers in the sector. As a result, work not only needs to be done to “update”the image of the sector as an innovative one with high technology content, but innovativesolutions have to be found to emphasise and ensure security of employment rather thanjob security and flexible work organisation (a so-called flexicurity strategy). Some work inthis area has already been accomplished by social partners, indicating that an exchange ofgood practice at the European level would be beneficial to share experiences. Examples ofgood practice include the following:
“Shipyard Week”, as well as Waterborne Technology Platform organised by the sectoralsocial dialogue committee is a good example of an initiative aimed at addressing theimage of the sector. The Shipbuilding Social Dialogue Committee is also involved in aproject with the European Foundation for the Improvement of Living and WorkingConditions to look at instruments to manage cyclical changes in the industry and to build aportfolio of good practices. Challenges created by project orientation can be partlyovercome by promoting exchange of workers. A recent German initiative, calledEmployment Pool, has done exactly this. It addressed the problem by securing access toqualified workforce through an agreement between companies to exchange workers andthus adjust more easily to cyclical demand in the global market.
ECOTECExhaustive analysis of employment trends in all sectors related to sea or using sea resources
118
Due to the ageing workforce in the sector, there are initiatives aimed at retaining olderworkers who possess considerable experience and knowledge. However, in spite of thehigh tech input in the shipbuilding industry, some of the tasks still require physical strengthand thus older workers cannot perform them. In Germany, there is an initiative aimed atinternal redeployment of older workers to retain them in the companyI. In Finland, althoughthe average retirement age is 59 the Aker Finnyard HR management is trying to raise it to62 or 63 by re-engaging older workers mainly in the process of teaching the younger onesand passing on the culture of good working practices II.
This review as well as a study carried out by Tholen and Ludwig (2006) indicate that manyshipyards in Europe are experiencing skill and labour shortages. Skill shortages raisedoubts as to the capacity of the European shipbuilding industry to effectively compete andto take advantage of the increased demand for new ships. Therefore, the industry has toensure access to a skilled workforce through the identification of future skill needs.Sectoral social dialogue at European level can play an important role here. At the MemberState level the Netherlands has already adopted a more systematic approach toidentification of skill needs in the shipbuilding industry and designing appropriate trainingcourses. VTL, a centre for expertise in vocational training and labour markets, has beenworking with employers, trade unions and training institutions in the development oncompetence-oriented vocational training for 58 skill profiles in the shipbuilding sector. Thetesting phase will last from 2005 to 2007 and first courses are scheduled to begin in 2008.
The quality of training can be an issue, but in many countries the sector is already workingclosely with colleges and universities to improve linkages between the sector and theresearch community. In Germany, shipyards offer placements to pupils in their final year ofschool as well as to engineering students in the hope of attracting them to the sector.Shipyards also work closely with universities to help develop the curriculum not only inengineering but also computer-assisted design and other IT functions.
In addition to making sure that qualifications are meeting the needs of the industry, thesemust be accompanied by lifelong learning programmes in order to ensure a culture oflearning and the ongoing updating of skills. In Spain ESF funds have been used to help set
I See also: Bloem P., Human Resource Management as a way of Maintaining and Enhancing Productivity, Qualificationsand Learning Aptitude, in Times of Demographic Change, in: Qualification and Training Forum, European ShipbuildingSocial Dialogue Commit tee, 21 October 2005, Trieste, p.21II Helin A., The On-The-Job Training Experience at Aker Finnyards, Turku , in: Qualification and Training Forum,European Shipbuilding Social Dialogue Committee, 21 October 2005, Trieste, p.23
ECOTECExhaustive analysis of employment trends in all sectors related to sea or using sea resources
119
up different training schemes to ease adaptation to new technologies and to easetransferability of workers to related sectors. These courses reached 20,000 people during2004.
Furthermore, since training is usually regarded as a cost, there is a need to encouragetraining in the industry and increasingly highlight the benefits of training such as increasedproductivity and better quality I. In France, the focus on competence development andbetter career planning has been the focus of the Carrières 21+ project, which allowedworkers to better position themselves within Chantiers de l'Atlantique through managingtheir own individual skills. The project also took account the employees' contributions andpotential for advancement, as well as their opinion on their career progression. The projectwas preceded by an exercise in job and skills mapping. Since work in the shipbuildingsector is becoming increasingly project-oriented, one of the skills necessary is theshipbuilding-specific management and project-management. Currently the marineeducation and training market is estimated at 0.5% of the total market value of the marinesectorII. It is therefore necessary to increase the promotion of the sector as a hightechnology industry and ensure incentive funding for companies to make training moreattractive to them.
16.2 Marine equipment
As mentioned earlier, the marine equipment sector has historically speaking been lackinga clear definition and consequently systematic collection of data on employment. In fact,the fragmentation of the sector also makes the industry slightly less visible and its socio-economic impact is not as widely recognised in some Member States as it has traditionallybeen seen as 'indirect employment in shipbuilding'. However, this situation is changingwith the industry today having 10 national level representative organisations and aEuropean level representation. Furthermore, a definition for the sector has now beenadopted by the European representative association for the sector (European MarineEquipment Council).
This report has also dealt with difficulties in accessing economic impact and employmentdata due to the marine equipment companies being active in many different sectors (notalways entirely related to the maritime sector) and the commercial sensitivity ofemployment data. With these challenges in mind, the first step forward could be toestablish the core business areas and closely monitor employment in those sectors,leaving estimates for the areas where data is less available. Employment data has already
I EMTAII Marine Labour Market Observatory, EMTA
ECOTECExhaustive analysis of employment trends in all sectors related to sea or using sea resources
120
been systematically collected for the sector in Denmark and the Netherlands and there arelessons to be learnt from those studies and methodologies.
The shift from a congested land transportation system to a more environmentallysustainable waterborne traffic system strengthens the job generating position of theindustry. The sector should therefore concentrate investment on growth areas, forexample, equipment for shipping gas, LNG carriers, gas treatment technology andsecurity-related solutions. The importance of automation is increasing too, and the exportmarket has boosted the scale and size of some companies in the industry. Environmentalregulations can also trigger the potential for employment growth in this segment of themarine equipment industry - if the regulations are properly enforced. Given the marineequipment sector's high interdependency with the core maritime cluster, shipbuilding inparticular, again fostering inter-sectoral collaboration on research, innovation,employment, education and training is recommended. The future competitiveness of theindustry is directly dependant on innovation and highly skilled employees. For example, askills shortage of engineering operators, designers and technicians continues to act as abarrier to technology innovation in the UK. Thus education and training policies should aimto identify and then respond to the current and future needs of the sector. Moreover, aswith the shipbuilding sector, it is also necessary for the marine equipment industry topromote its image as a sector with a high degree of high technology content in order toattract young people.
This study recognised that many companies in the sector do not yet sufficiently co-operatewith universities and the latter are not sufficiently market-oriented. This results in problemsin turning innovation into a product. Such co-operation should be improved. Indeed, one ofthe targets of the WATERBORNE Vision 2020I is to strengthen the cooperation betweenthe universities and the industry and allow for a better transfer of know how andtechnology from other sectors. Some actions have already been taken at Member Stateslevel to advance this co-operation. For example, the Maritime competitiveness centres inFrance are clusters of companies, training centres, universities, ministries, local actors andpublic and private research centres involved in a partnership intended to create synergiesaround common innovative, high-technology maritime projects. It is also critical to ensurethe industry and the academic sector in Europe can retain and maximise the usage ofnational scientific assets which impact on the sector.
Companies in the sector could do more to benefit from technological developments in non-maritime fields and apply them also to the marine equipment sector. Key industries for
I Waterborne TP was launched in January 2005 and is a forum where all sectoral stakeholders are working to agree toVision 2020, to assess the key challenges to the maritime industry and waterborne transport and to formulate necessaryR&D initiatives (under Waterborne Strategic Research Agenda).
ECOTECExhaustive analysis of employment trends in all sectors related to sea or using sea resources
121
collaboration include capital intensive construction, automotive, rail and aerospace. But asalready indicated, investment generation in long term R&D continues to be difficult due tothe high number of SMEs operating in the sector. Horizontal networking betweencompanies, in addition to vertical co-operation with other industries, can assist thisprocess. A recent example of action on this front is the establishment of a R&D workinggroup by the European Marine Equipment Council.
As in the case for the shipbuilding industry, the European marine equipment industry isalso calling for a better enforcement of legislative frameworks that protect intellectualproperty rights. This is to protect European knowledge and know-how and particular that ofSMEs, which can contribute towards sustaining employment in Europe. The EuropeanMarine Equipment Council is also calling for consideration to be given to the expansion ofthe Marine Equipment Directive to include harmonisation of classification rules and allowmutual recognition of certificates and - last but not least - facilitate competition betweenclassification services.
16.3 Seaports and related services
Firstly, more accurate and reliable information on the levels of employment is needed asan essential tool for policy development for the industry and to assess the wider economicimportance of European seaports to the European economy.
The port liberalisation programmes, increases in the need for ports as wider transportlogistic centres and a growth in container traffic have been the traditional factors affectingemployment in the port sector. Global port activity is set for long-term growth. Thereforeoverall European transport policy plays an important role in determining employment levelsin European seaports, for example through investments in port capacity and tacklinggrowing land transportation congestions. Some Member States are already trying to tacklethis through considerable investments to expand port capacity and to improve maritimeaccess and hinterland infrastructure as a way of avoiding congestion. For instance, annualinvestment in ports in Sweden has increased from 200m SEK in 1993 to an average of 1billion SEK per year since 2000. Investment in Swedish ports will continue in the next fewyears, with 6 billion SEK already allocated for investments between 2005 and 2009.Similarly, Spain has announced a plan to spend €23bn on the maritime and port sectorover the next 15 years (to 2020) – the proposal particularly aims to boost short-seashippingI.
I Marine Industries Global Market Analysis (2006) Douglas-Westwood
ECOTECExhaustive analysis of employment trends in all sectors related to sea or using sea resources
122
Promotion of and subsidies for short sea shipping was forecast to have the potential tocreate employment in more peripheral economies and coastal regions of EuropeCLXXIII.Indeed, FONASBA/ECASBA actively promotes and supports the development of short seashipping as this would increase employment in ship brokerage and agency in smaller portsthat currently do not benefit as much as the larger ports. However, the trade unions haveclaimed that short sea shipping has not succeeded in creating employment for EUseafarers, or even for dock workers, to its full potential.
Local and national policy responses dealing with a growth in the cruise tourism markethave also the potential to generate employment opportunities in the sector.
A proposed Directive on market access to ports servicesCLXXIV was rejected by theEuropean Parliament in January 2006 and has subsequently been withdrawn by theEuropean Commission. The so-called Ports Package II was intended to increasecompetition in the ports sector and would have liberalised port services by permitting firmsto appoint independent contractors to load and unload ships. It also would have endedterminal operators' monopolies on cargo handling. There was widespread industryopposition to the proposal, with trade unions fearing the destruction of dock workers’employment and social dumping practices, whereas in the eyes of some employers’organisations the liberalising provisions of the proposed Directive did not go far enough toopen up the market for services.
In respect of maritime pilotage, reports have shown that many European countries arefacing growing difficulties in finding qualified applicants for pilot services. This is largelylinked to fact that there are decreasing numbers of experienced officers and masters.However, a number of intensive recruitment campaigns have been able to reduce thelabour shortage to some extent, but it remains difficult to replace pilots who take retirementor to account for the increased trafficCLXXV.
A number of countries have also expressed their concern over wider skill shortages in theseaport sector. For that reason, this section will look into two examples of the way in whichskill (and labour shortages) in the port sector have been addressed in two Europeancountries – before having a more general discussion on lessons learnt on training in theport sector.
The first case study explains how the Spanish sectoral social partners have been able toimprove the level of training and employment in the ports sector through the developmentof new competence management tool. The second case study looks into the port of
CLXXIII Marine Industries Global Market Analysis (2006) Douglas-WestwoodCLXXIV COM (2004) 654 finalCLXXV EMPA
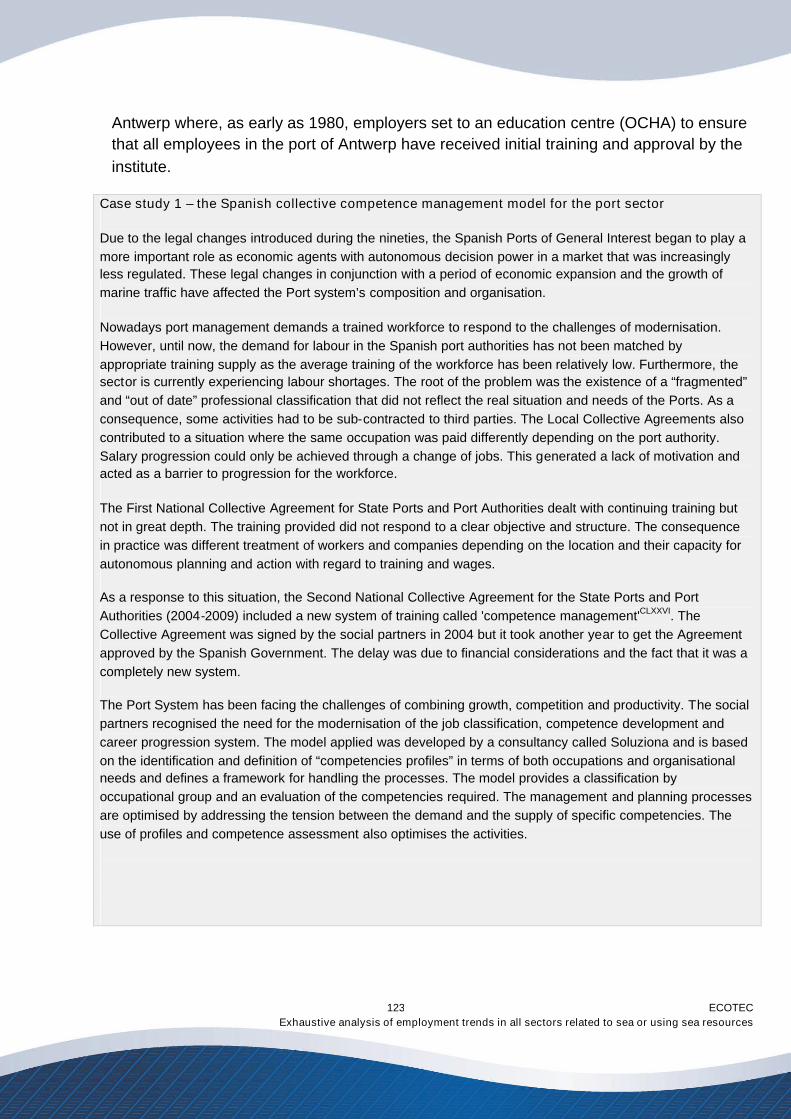
ECOTECExhaustive analysis of employment trends in all sectors related to sea or using sea resources
123
Antwerp where, as early as 1980, employers set to an education centre (OCHA) to ensurethat all employees in the port of Antwerp have received initial training and approval by theinstitute.
Case study 1 – the Spanish collective competence management model for the port sector
Due to the legal changes introduced during the nineties, the Spanish Ports of General Interest began to play amore important role as economic agents with autonomous decision power in a market that was increasinglyless regulated. These legal changes in conjunction with a period of economic expansion and the growth ofmarine traffic have affected the Port system’s composition and organisation.
Nowadays port management demands a trained workforce to respond to the challenges of modernisation.However, until now, the demand for labour in the Spanish port authorities has not been matched byappropriate training supply as the average training of the workforce has been relatively low. Furthermore, thesector is currently experiencing labour shortages. The root of the problem was the existence of a “fragmented”and “out of date” professional classification that did not reflect the real situation and needs of the Ports. As aconsequence, some activities had to be sub-contracted to third parties. The Local Collective Agreements alsocontributed to a situation where the same occupation was paid differently depending on the port authority.Salary progression could only be achieved through a change of jobs. This generated a lack of motivation andacted as a barrier to progression for the workforce.
The First National Collective Agreement for State Ports and Port Authorities dealt with continuing training butnot in great depth. The training provided did not respond to a clear objective and structure. The consequencein practice was different treatment of workers and companies depending on the location and their capacity forautonomous planning and action with regard to training and wages.
As a response to this situation, the Second National Collective Agreement for the State Ports and PortAuthorities (2004-2009) included a new system of training called 'competence management'CLXXVI. TheCollective Agreement was signed by the social partners in 2004 but it took another year to get the Agreementapproved by the Spanish Government. The delay was due to financial considerations and the fact that it was acompletely new system.
The Port System has been facing the challenges of combining growth, competition and productivity. The socialpartners recognised the need for the modernisation of the job classification, competence development andcareer progression system. The model applied was developed by a consultancy called Soluziona and is basedon the identification and definition of “competencies profiles” in terms of both occupations and organisationalneeds and defines a framework for handling the processes. The model provides a classification byoccupational group and an evaluation of the competencies required. The management and planning processesare optimised by addressing the tension between the demand and the supply of specific competencies. Theuse of profiles and competence assessment also optimises the activities.
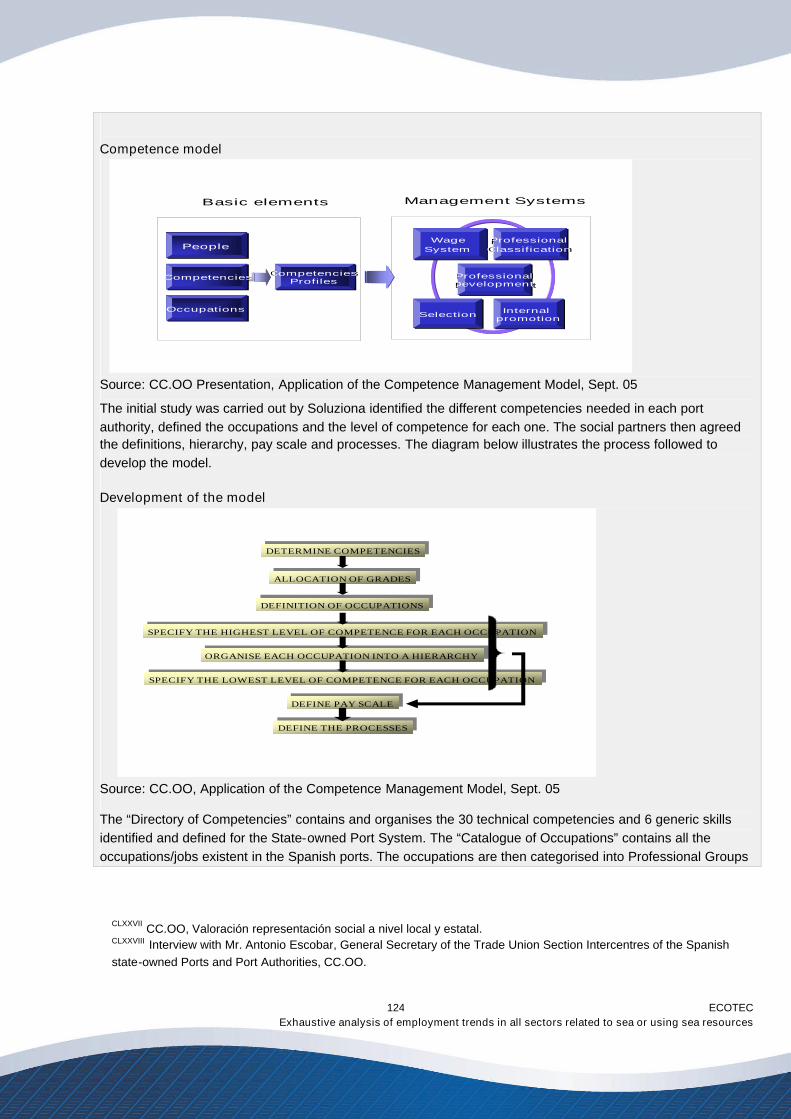
ECOTECExhaustive analysis of employment trends in all sectors related to sea or using sea resources
124
Competence model
Management SystemsBasic elements
CompetenciesCompetencies
OccupationsOccupations
PeoplePeople
CompetenciesProfiles
CompetenciesProfiles
ProfessionalDevelopmentProfessionalDevelopment
WageSystemWage
SystemProfessionalClassificationProfessionalClassification
InternalpromotionInternal
promotionSelectionSelection
Source: CC.OO Presentation, Application of the Competence Management Model, Sept. 05
The initial study was carried out by Soluziona identified the different competencies needed in each portauthority, defined the occupations and the level of competence for each one. The social partners then agreedthe definitions, hierarchy, pay scale and processes. The diagram below illustrates the process followed todevelop the model.
Development of the model
DETERMINE COMPETENCIESDETERMINE COMPETENCIES
ALLOCATION OF GRADESALLOCATION OF GRADES
DEFINITION OF OCCUPATIONSDEFINITION OF OCCUPATIONS
SPECIFY THE HIGHEST LEVEL OF COMPETENCE FOR EACH OCCUPATIONSPECIFY THE HIGHEST LEVEL OF COMPETENCE FOR EACH OCCUPATION
ORGANISE EACH OCCUPATION INTO A HIERARCHYORGANISE EACH OCCUPATION INTO A HIERARCHY
SPECIFY THE LOWEST LEVEL OF COMPETENCE FOR EACH OCCUPATIONSPECIFY THE LOWEST LEVEL OF COMPETENCE FOR EACH OCCUPATION
DEFINE PAY SCALEDEFINE PAY SCALE
DEFINE THE PROCESSESDEFINE THE PROCESSES
Source: CC.OO, Application of the Competence Management Model, Sept. 05
The “Directory of Competencies” contains and organises the 30 technical competencies and 6 generic skillsidentified and defined for the State-owned Port System. The “Catalogue of Occupations” contains all theoccupations/jobs existent in the Spanish ports. The occupations are then categorised into Professional Groups
CLXXVII CC.OO, Valoración representación social a nivel local y estatal.CLXXVIII Interview with Mr. Antonio Escobar, General Secretary of the Trade Union Section Intercentres of the Spanishstate-owned Ports and Port Authorities, CC.OO.
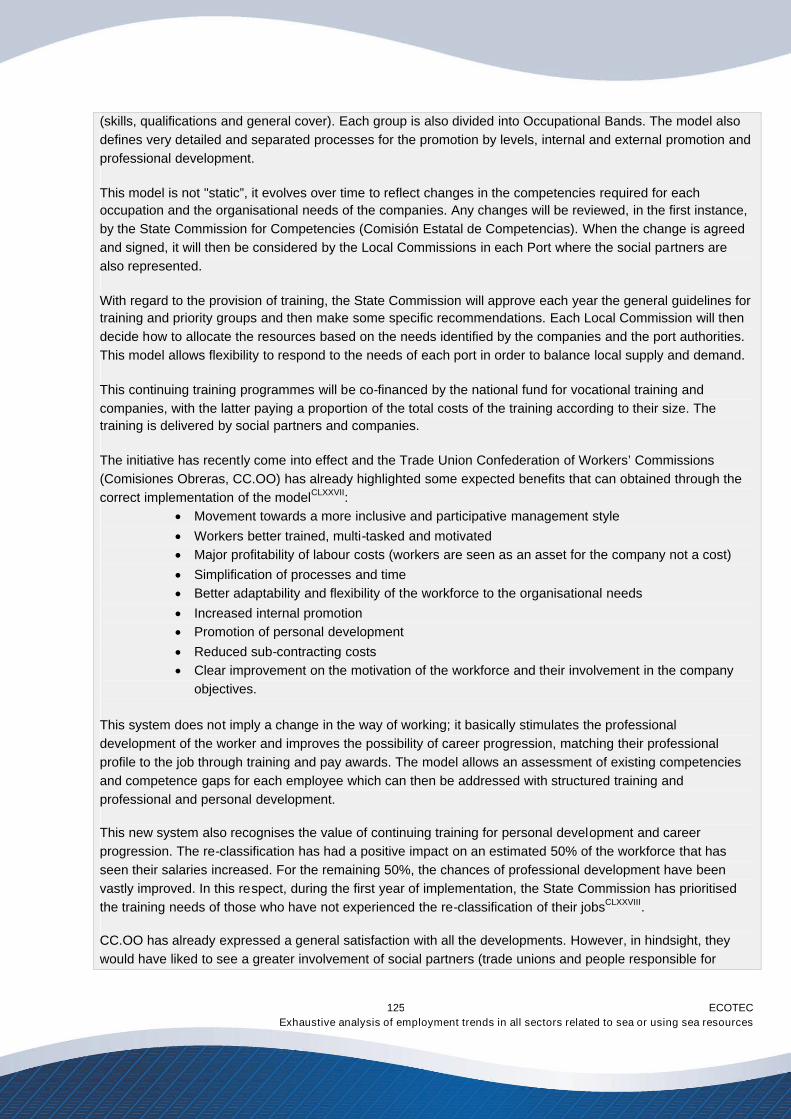
ECOTECExhaustive analysis of employment trends in all sectors related to sea or using sea resources
125
(skills, qualifications and general cover). Each group is also divided into Occupational Bands. The model alsodefines very detailed and separated processes for the promotion by levels, internal and external promotion andprofessional development.
This model is not "static”, it evolves over time to reflect changes in the competencies required for eachoccupation and the organisational needs of the companies. Any changes will be reviewed, in the first instance,by the State Commission for Competencies (Comisión Estatal de Competencias). When the change is agreedand signed, it will then be considered by the Local Commissions in each Port where the social partners arealso represented.
With regard to the provision of training, the State Commission will approve each year the general guidelines fortraining and priority groups and then make some specific recommendations. Each Local Commission will thendecide how to allocate the resources based on the needs identified by the companies and the port authorities.This model allows flexibility to respond to the needs of each port in order to balance local supply and demand.
This continuing training programmes will be co-financed by the national fund for vocational training andcompanies, with the latter paying a proportion of the total costs of the training according to their size. Thetraining is delivered by social partners and companies.
The initiative has recently come into effect and the Trade Union Confederation of Workers’ Commissions(Comisiones Obreras, CC.OO) has already highlighted some expected benefits that can obtained through thecorrect implementation of the modelCLXXVII:
Movement towards a more inclusive and participative management style Workers better trained, multi-tasked and motivated Major profitability of labour costs (workers are seen as an asset for the company not a cost) Simplification of processes and time Better adaptability and flexibility of the workforce to the organisational needs Increased internal promotion Promotion of personal development Reduced sub-contracting costs Clear improvement on the motivation of the workforce and their involvement in the company
objectives.
This system does not imply a change in the way of working; it basically stimulates the professionaldevelopment of the worker and improves the possibility of career progression, matching their professionalprofile to the job through training and pay awards. The model allows an assessment of existing competenciesand competence gaps for each employee which can then be addressed with structured training andprofessional and personal development.
This new system also recognises the value of continuing training for personal development and careerprogression. The re-classification has had a positive impact on an estimated 50% of the workforce that hasseen their salaries increased. For the remaining 50%, the chances of professional development have beenvastly improved. In this respect, during the first year of implementation, the State Commission has prioritisedthe training needs of those who have not experienced the re-classification of their jobsCLXXVIII.
CC.OO has already expressed a general satisfaction with all the developments. However, in hindsight, theywould have liked to see a greater involvement of social partners (trade unions and people responsible for
ECOTECExhaustive analysis of employment trends in all sectors related to sea or using sea resources
126
human resources) in the initial stages of the study carried out by Soluziona. This would have avoided someissues that cropped up during the negotiation such as the exclusion of trade unionists and some technicalcategories.
With this agreement, social partners and the public administration are pursuing an increased involvement oftrade unions and employers’ organisations in the development and implementation of a more effective trainingsystem for workers and companies and a clear identification of professional categories to reinforce andimproved the social dialogue in the sector. Provision of such model as a result of collective bargaining hasbeen seen as a positive outcome to help offset the problems created by the current skill and labour shortagesin the sector.
Moreover, this is the first collective agreement in the sector that addressed the exclusion from trainingpreviously faced by trade unionists. This refers to specific training for trade union representatives to fulfil theirtasks as union representatives. This obviously had an effect on their professional career and possibilities ofpromotion. It is the first time that, “employers acknowledge trade unions as part of the company and recognisetheir contribution" III. The competence management model includes and recognises the "trade unionrepresentative" as an occupation with specific competencies and training needs.
Case study 2: Addressing skill shortages in the port sector in Belgium
The four Flemish seaports are of great economic importance to the country, with a total added value of €11.5billion. The port of Antwerp is the largest port ranking third in Europe and eleventh in the world – followed bythe ports of Ghent, Zeebrugge and Oostende. The supply of skilled labour for the sector is therefore not onlyimportant for these seaport cities, but to the overall maritime cluster and indeed, the economy of the country. Inorder to ensure a sufficient supply of skilled labour, as early as 1980, employers set to an education centre(OCHA) to ensure that all employees in the port of Antwerp have received initial and ongoing training andapproval by the institute.
In this way not only the needs of employers would be addressed in the best possible way, but also the risk ofaccidents would be minimised. This case study looks more closely at the training provided by OCHA as well asthe collective agreement from 1988 that ensures extra funding for training in the seaport sector.
In 1980, the OCHA training centre was set up by - and continues to be jointly managed by the social partnersin the Belgian port of Antwerp: the employer organisation CEPA (Centre of employers of the port of Antwerp)and the labour unions active in the transport sector ACV, ABBV and ACLVBI. In the joint management board,the chairman is from the employer organisation and 6 mandates are given to the labour unions and 6mandates to the employer organisation. Other Belgian ports have other arrangements. For example, the port ofZeebrugge does not have a training centre, but has an agreement with other education institutes to provideemployees working in the port of Zeebrugge with practice-oriented training.
The initiative to set up the training centre was taken during joint discussions on how to tackle accidents at workin the port sector. Social partners decided to start by offering basic health and safety training for dock workersto reduce the risk of accidents. The OCHA Training centre started with 2 teachers, but has since thenexpanded greatly and currently employs 34 teachers and 5 administrative staff. The administrative staff are
I This section is based on a interview with the director of OCHA and the website www.cepa.be.
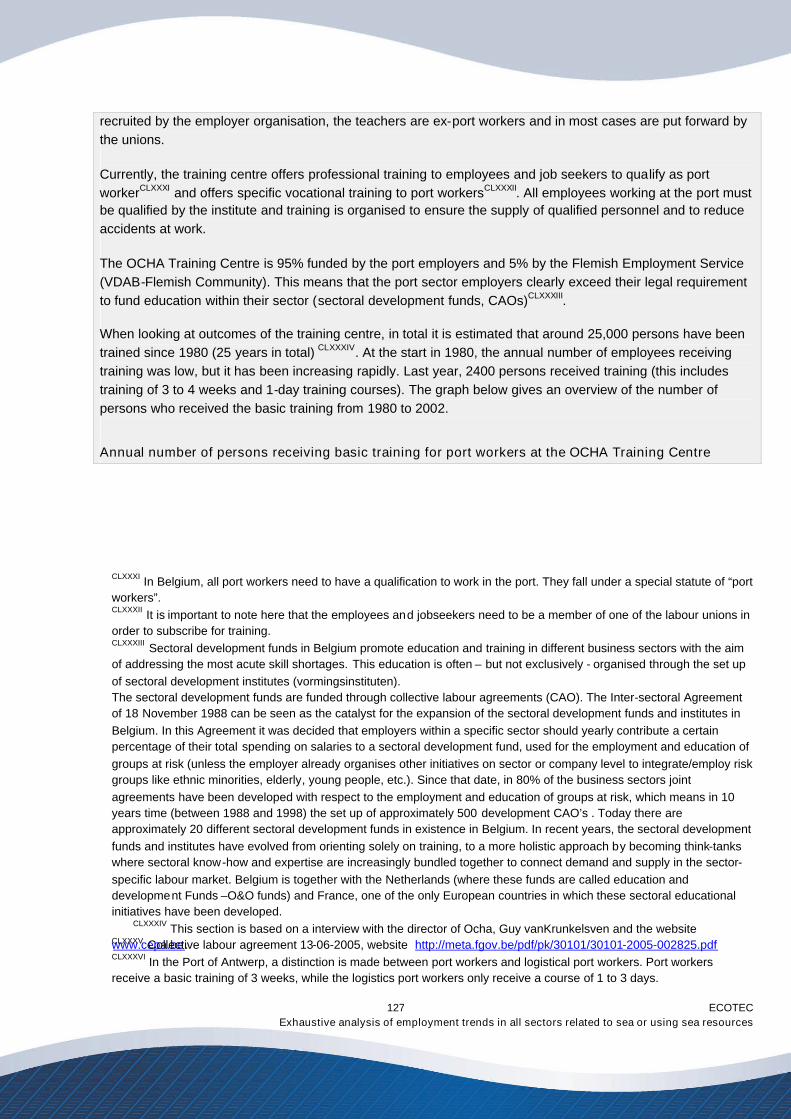
ECOTECExhaustive analysis of employment trends in all sectors related to sea or using sea resources
127
recruited by the employer organisation, the teachers are ex-port workers and in most cases are put forward bythe unions.
Currently, the training centre offers professional training to employees and job seekers to qualify as portworkerCLXXXI and offers specific vocational training to port workersCLXXXII. All employees working at the port mustbe qualified by the institute and training is organised to ensure the supply of qualified personnel and to reduceaccidents at work.
The OCHA Training Centre is 95% funded by the port employers and 5% by the Flemish Employment Service(VDAB-Flemish Community). This means that the port sector employers clearly exceed their legal requirementto fund education within their sector (sectoral development funds, CAOs)CLXXXIII.
When looking at outcomes of the training centre, in total it is estimated that around 25,000 persons have beentrained since 1980 (25 years in total) CLXXXIV. At the start in 1980, the annual number of employees receivingtraining was low, but it has been increasing rapidly. Last year, 2400 persons received training (this includestraining of 3 to 4 weeks and 1-day training courses). The graph below gives an overview of the number ofpersons who received the basic training from 1980 to 2002.
Annual number of persons receiving basic training for port workers at the OCHA Training Centre
CLXXXI In Belgium, all port workers need to have a qualification to work in the port. They fall under a special statute of “portworkers”.CLXXXII It is important to note here that the employees and jobseekers need to be a member of one of the labour unions inorder to subscribe for training.CLXXXIII Sectoral development funds in Belgium promote education and training in different business sectors with the aimof addressing the most acute skill shortages. This education is often – but not exclusively - organised through the set upof sectoral development institutes (vormingsinstituten).The sectoral development funds are funded through collective labour agreements (CAO). The Inter-sectoral Agreementof 18 November 1988 can be seen as the catalyst for the expansion of the sectoral development funds and institutes inBelgium. In this Agreement it was decided that employers within a specific sector should yearly contribute a certainpercentage of their total spending on salaries to a sectoral development fund, used for the employment and education ofgroups at risk (unless the employer already organises other initiatives on sector or company level to integrate/employ riskgroups like ethnic minorities, elderly, young people, etc.). Since that date, in 80% of the business sectors jointagreements have been developed with respect to the employment and education of groups at risk, which means in 10years time (between 1988 and 1998) the set up of approximately 500 development CAO’s . Today there areapproximately 20 different sectoral development funds in existence in Belgium. In recent years, the sectoral developmentfunds and institutes have evolved from orienting solely on training, to a more holistic approach by becoming think-tankswhere sectoral know-how and expertise are increasingly bundled together to connect demand and supply in the sector-specific labour market. Belgium is together with the Netherlands (where these funds are called education anddevelopment Funds –O&O funds) and France, one of the only European countries in which these sectoral educationalinitiatives have been developed.
CLXXXIV This section is based on a interview with the director of Ocha, Guy vanKrunkelsven and the websitewww.cepa.be.CLXXXV Collective labour agreement 13-06-2005, website http://meta.fgov.be/pdf/pk/30101/30101-2005-002825.pdfCLXXXVI In the Port of Antwerp, a distinction is made between port workers and logistical port workers. Port workersreceive a basic training of 3 weeks, while the logistics port workers only receive a course of 1 to 3 days.
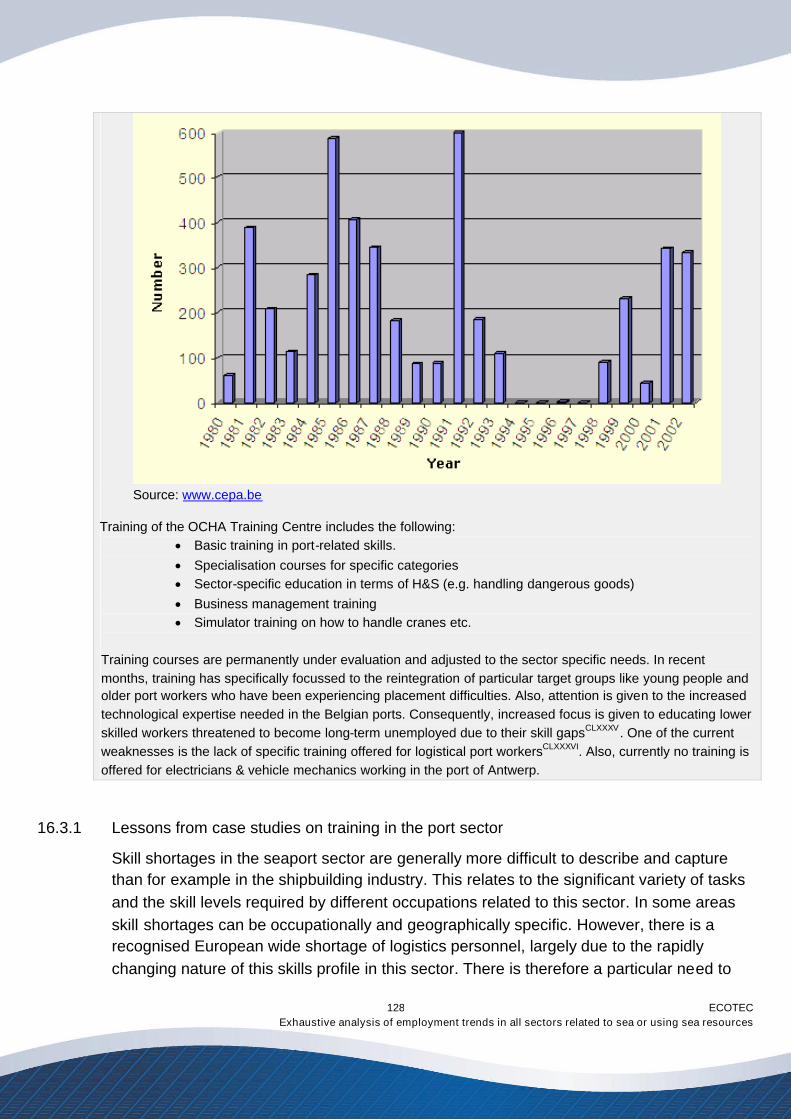
ECOTECExhaustive analysis of employment trends in all sectors related to sea or using sea resources
128
Source: www.cepa.be
Training of the OCHA Training Centre includes the following: Basic training in port-related skills. Specialisation courses for specific categories Sector-specific education in terms of H&S (e.g. handling dangerous goods) Business management training Simulator training on how to handle cranes etc.
Training courses are permanently under evaluation and adjusted to the sector specific needs. In recentmonths, training has specifically focussed to the reintegration of particular target groups like young people andolder port workers who have been experiencing placement difficulties. Also, attention is given to the increasedtechnological expertise needed in the Belgian ports. Consequently, increased focus is given to educating lowerskilled workers threatened to become long-term unemployed due to their skill gapsCLXXXV. One of the currentweaknesses is the lack of specific training offered for logistical port workersCLXXXVI. Also, currently no training isoffered for electricians & vehicle mechanics working in the port of Antwerp.
16.3.1 Lessons from case studies on training in the port sector
Skill shortages in the seaport sector are generally more difficult to describe and capturethan for example in the shipbuilding industry. This relates to the significant variety of tasksand the skill levels required by different occupations related to this sector. In some areasskill shortages can be occupationally and geographically specific. However, there is arecognised European wide shortage of logistics personnel, largely due to the rapidlychanging nature of this skills profile in this sector. There is therefore a particular need to

ECOTECExhaustive analysis of employment trends in all sectors related to sea or using sea resources
129
link business with workforce planning and ensuring, as indicated in the good practiceexamples above, a strong link between social partners and training providers to ensuretraining is regularly updated to meet the needs of the industry.
The case studies also highlighted a number of lessons in terms of training in the portsector: Policies aimed at tackling skills needs amongst workers in the ports need to take into
account the importance of learning towards competence development and theintegration of learning with work. They also need to show flexibility to take into accountthe organisational and contextual needs of each individual port. It can not be forgottenthat the European seaports are very diverse.
Workers need to be well informed and aware of learning opportunities offered by thePort Authorities and information on how to access them.
Policies for promoting quality in training for the sector should be developed inconsultation with social partners and integrate incentives to make employers andemployees aware of the role of training for job performance and professionaldevelopment.
Policies should be based on new forms of recognition between the training world andthe productive world in order to balance supply and demand and meet theorganisational needs of companies and the challenges faced by ports.
There needs to be a shared business vision and the strategic priorities and plans shouldbe understood across the companies in order to face the challenges of growth,productivity and competition in the port industry.
One of the main success factors of the Belgian system is the fact that they are able touse and fully exploit the know-how present within a specific sector for development andtraining. The OCHA Training Centre hires former port workers and experienced (port)engineers to teach.
Training schemes must be easily adaptable to the changing needs of the industry.
16.4 Recreational boating
This study has clearly already found that in most of the EU member countries there arelarge gaps in the collection and analysis of employment or indeed economic impact data
ECOTECExhaustive analysis of employment trends in all sectors related to sea or using sea resources
130
for the recreational boating sector. This is partly because some countries have not realisedthe full economic potential of this sector. ICOMIA has responded to this by recentlycommissioning Michigan State University to undertake an economic benefit study.Specifically, this study will investigate how statistics in this industry are currently collectedin its member countries and try to identify a common set of definitions for the industry toaid future data collection.
Similarly, the sector is fairly rarely seen as one 'policy area' by national public authorities.The industry is often viewed as a part of the recreation or manufacturing sectors. TheFlemish authorities have become increasingly aware that water recreation is an importantcatalyst for economic growth and employment especially in the Flemish region.Consequently, the key actors in Flanders have recently collaborated in the development ofa policy plan for water recreation and tourism (aimed at the waterway regions and coast ofFlanders)CLXXXVII. This plan focuses mainly on sustainable recreation, and aims to increasethe economic importance of the recreational boating and tourism industry.
The future competitiveness of the European recreational boating industry will depend oncompanies' abilities to reduce overheads and where possible not to rely solely on thenational markets, but there is also an increasing need for governments to relax theregulative burden on companies and consumers; the multitude of regulations places adisproportionate burden on SMEs, which currently make up 98% of businesses in thisindustry. Given this high proportion of SMEs, there is also an immediate need for businesssupport in terms of innovation and R&D.
One of the main threats to the European recreational boating industry is thatmanufacturing may be lost or outsourced to China, or other emerging economies in theFar East, where labour costs are significantly lower. Similar cost pressures are being facedfrom large US corporations which are buying up smaller companies in certain sectors. As aresult it is essential for the sector to hold on to the high skill base of its employees in orderto hold on to its competitive advantage, as is also the case with many other maritimeindustries. However, both the European industry representatives and national levelinterviews found that in many member states businesses in this industry face challenges inrecruiting, training and retaining a quality, skilled workforce. Smaller businesses often alsolack a corporate structure and experience in growing and marketing a business,particularly internationally.
CLXXXVII WES, CIBE, CDR (2003) Development of a policy plan for water recreation and tourism on the waterways and coast ofFlanders, final report, resource analysis, study for the Ministry of the Flemish Community, Policy Division for Harbours,Waterways and Sea
ECOTECExhaustive analysis of employment trends in all sectors related to sea or using sea resources
131
As a response to these challenges the Irish Marine Federation recently started to run aprogramme called Flying Start that provides management training for employees in therecreational boating industry. This programme is operated with European support throughINTERREG. Currently the first phase of the training is under way with 15 students takingthe course leading to a certificate in marine leisure management. The course is focussedon equipping the participants with skills in operations management, marketing and e-business.
Likewise, as a consequence of the lack of commercial skills in the Finnish recreationalboating industry, Finnboat, the representative organisation of the Finnish recreationalboating industry, has, in collaboration with public education authorities and a privatetraining institute developed an official management programme for the boating industryworkers, which leads to a nationally recognised qualification. The course is based oncompetence-based examination system and intensive short training courses, with the aimof improving commercial management, business expansion, language, customer service,sales and marketing skills of employees and managers in the industry. The educationincludes 1-2 day blocks of training, which is tailored to the particular needs of eachparticipant on the programme. Each student is also provided with an individualdevelopment programme with tasks that can be carried out in the workplace, and thatsupports both personal and organisational development needs.
Both of the above mentioned training programmes are currently being implemented,therefore it is not possible to make judgement about their success as such. However, theyare good examples of industry representatives aiming to improve overall competitivenessof the businesses in the industry. It would be recommendable for the European levelactors to follow-up implementation of these programmes and more widely disseminateresults and successful elements of each programme to actors across Europe. The problemhowever remains in more technical skills that are often too specialised to be learnt inmainstream education programmes and heavily rely on 'on-the-job training'. The IrishMarine Federation co-operates with the British Marine Federation by 'buying' trainers fromthe UK market. Indeed, European level co-operation in this field is highly recommendableas the training requirements, apart from more general business skills, are so specialised.Many of the tasks in boatbuilding businesses are so specialised that no education ortraining provision exists even at national level.
16.5 Shipping
First and foremost, an efficient European maritime transport system is the backbone of thefunctionality and economic competitiveness of Europe. In order to ensure efficient maritimetransport system within Europe and to safeguard employment in this sector, efforts must
ECOTECExhaustive analysis of employment trends in all sectors related to sea or using sea resources
132
be focussed on removing bottlenecks from the wider transportation system in Europe andon ensuring the efficient functioning of the port system. This should be regarded as a basisfor any policy developments.
The second recommendation relates to the complexities of creating sustainableemployment in the sector. Employment trends identified in this report clearly chart adecline in overall employment and particularly in the employment of European seafarers inthe sector. This particularly applies to extra-community shipping operations. Similar to theshipbuilding sector, shipping therefore suffers from an image declining employment for EUnationals as well as image problems related to what are perceived to be poor workingconditions relating to long absences away from home and difficulties in dealing with oftendifferent working conditions applied to multi-national crew. These complex factors have ledto a decline in EU seafarers training for careers on board ships, high drop out rates fromtraining and poor retention rates. It is important to address such emerging skill shortagesnot only to ensure the competitiveness of the European shipping industry but also of thewider maritime cluster, as it is widely acknowledged that the skills of former seafarers arehighly valued for employment on-shore.
As in the shipbuilding industry, policy approaches to dealing with the shortage of EUseafarers and officers in particular must be multi-faceted in the full understanding of theabove mentioned challenges. The situation in the shipping sector differs from that in theshipbuilding industry in that it is generally a sector where demand is likely to increase infuture. On the other hand, there is a greater challenge from the recruitment of non-EU staffin this sector, an issue rendered more complex by the weak implementation andenforcement of existing rules and legislation (in global terms) relating to living and workingconditions of seafarers of different nationalities on different flag carriers. This report did notaddress in detail the difficult question of working conditions on board vessels, but theresearch made clear the complexity of the debate with shipowners arguing against theapplication of EU working conditions on board vessels flagged to EU member states or theapplication of rules that make employment of European seafarers compulsory for fleetsflying EU flags. Such regulations are considered to prove counterproductive for thepromotion of employment among European seafarers as it is easy for shipowners to flagout. Instead shipowners are supportive of the enforcement of global regulations onemployment and any initiatives to boost the attractiveness of employment on sea. Theyare also in favour of maritime cluster approach, which they have found particularlysuccessful for example in the Netherlands, and that further promotes the idea of a longterm career in the maritime cluster.
Trade unions on the other hand are concerned over the preference of shipowners toemploy seafarers from third countries with the effect of loosing important maritime skills
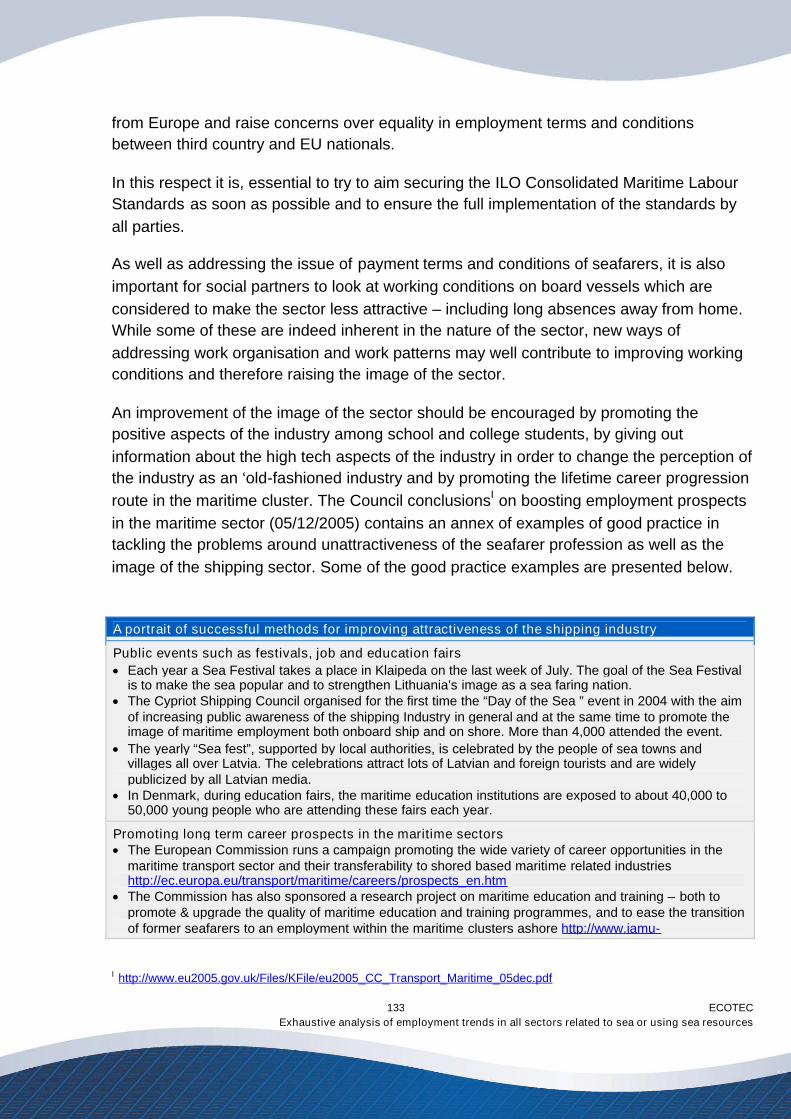
ECOTECExhaustive analysis of employment trends in all sectors related to sea or using sea resources
133
from Europe and raise concerns over equality in employment terms and conditionsbetween third country and EU nationals.
In this respect it is, essential to try to aim securing the ILO Consolidated Maritime LabourStandards as soon as possible and to ensure the full implementation of the standards byall parties.
As well as addressing the issue of payment terms and conditions of seafarers, it is alsoimportant for social partners to look at working conditions on board vessels which areconsidered to make the sector less attractive – including long absences away from home.While some of these are indeed inherent in the nature of the sector, new ways ofaddressing work organisation and work patterns may well contribute to improving workingconditions and therefore raising the image of the sector.
An improvement of the image of the sector should be encouraged by promoting thepositive aspects of the industry among school and college students, by giving outinformation about the high tech aspects of the industry in order to change the perception ofthe industry as an ‘old-fashioned industry and by promoting the lifetime career progressionroute in the maritime cluster. The Council conclusionsI on boosting employment prospectsin the maritime sector (05/12/2005) contains an annex of examples of good practice intackling the problems around unattractiveness of the seafarer profession as well as theimage of the shipping sector. Some of the good practice examples are presented below.
A portrait of successful methods for improving attractiveness of the shipping industry
Public events such as festivals, job and education fairsEach year a Sea Festival takes a place in Klaipeda on the last week of July. The goal of the Sea Festival
is to make the sea popular and to strengthen Lithuania's image as a sea faring nation.The Cypriot Shipping Council organised for the first time the “Day of the Sea ” event in 2004 with the aim
of increasing public awareness of the shipping Industry in general and at the same time to promote theimage of maritime employment both onboard ship and on shore. More than 4,000 attended the event.
The yearly “Sea fest”, supported by local authorities, is celebrated by the people of sea towns andvillages all over Latvia. The celebrations attract lots of Latvian and foreign tourists and are widelypublicized by all Latvian media.
In Denmark, during education fairs, the maritime education institutions are exposed to about 40,000 to50,000 young people who are attending these fairs each year.
Promoting long term career prospects in the maritime sectorsThe European Commission runs a campaign promoting the wide variety of career opportunities in the
maritime transport sector and their transferability to shored based maritime related industrieshttp://ec.europa.eu/transport/maritime/careers/prospects_en.htm
The Commission has also sponsored a research project on maritime education and training – both topromote & upgrade the quality of maritime education and training programmes, and to ease the transitionof former seafarers to an employment within the maritime clusters ashore http://www.iamu-
I http://www.eu2005.gov.uk/Files/KFile/eu2005_CC_Transport_Maritime_05dec.pdf
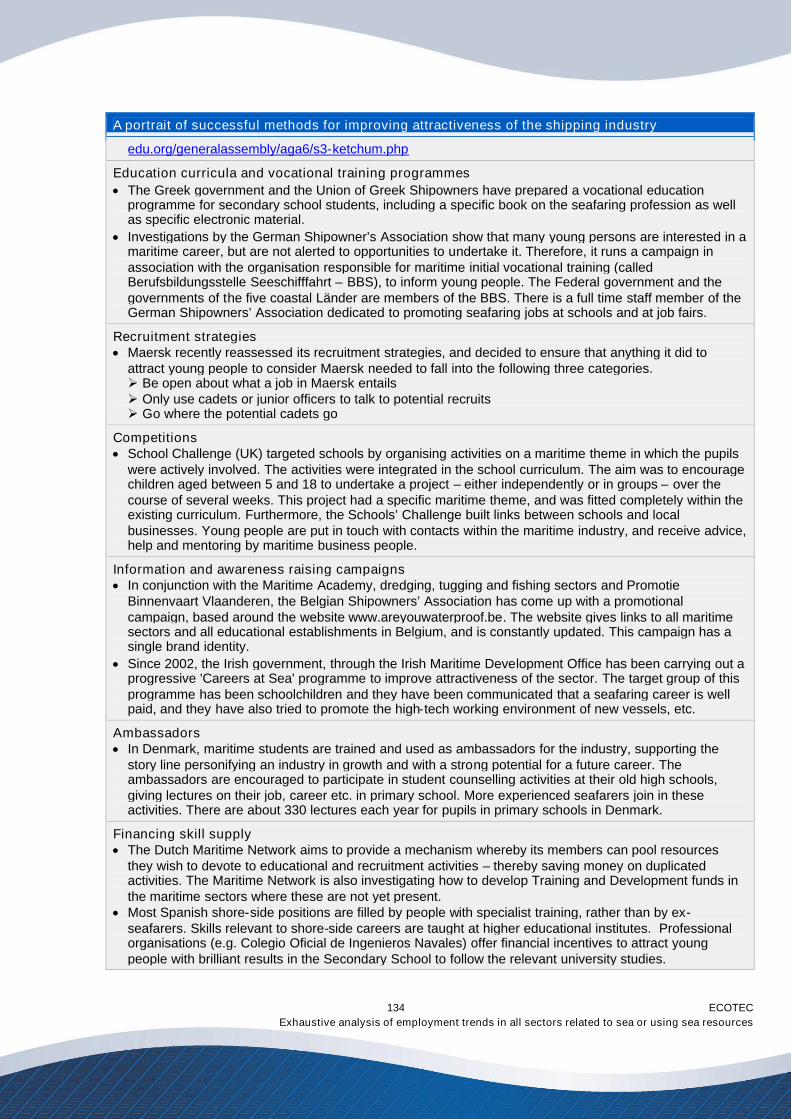
ECOTECExhaustive analysis of employment trends in all sectors related to sea or using sea resources
134
A portrait of successful methods for improving attractiveness of the shipping industry
edu.org/generalassembly/aga6/s3-ketchum.php
Education curricula and vocational training programmesThe Greek government and the Union of Greek Shipowners have prepared a vocational education
programme for secondary school students, including a specific book on the seafaring profession as wellas specific electronic material.
Investigations by the German Shipowner’s Association show that many young persons are interested in amaritime career, but are not alerted to opportunities to undertake it. Therefore, it runs a campaign inassociation with the organisation responsible for maritime initial vocational training (calledBerufsbildungsstelle Seeschifffahrt – BBS), to inform young people. The Federal government and thegovernments of the five coastal Länder are members of the BBS. There is a full time staff member of theGerman Shipowners’ Association dedicated to promoting seafaring jobs at schools and at job fairs.
Recruitment strategiesMaersk recently reassessed its recruitment strategies, and decided to ensure that anything it did to
attract young people to consider Maersk needed to fall into the following three categories.Be open about what a job in Maersk entailsOnly use cadets or junior officers to talk to potential recruitsGo where the potential cadets go
CompetitionsSchool Challenge (UK) targeted schools by organising activities on a maritime theme in which the pupils
were actively involved. The activities were integrated in the school curriculum. The aim was to encouragechildren aged between 5 and 18 to undertake a project – either independently or in groups – over thecourse of several weeks. This project had a specific maritime theme, and was fitted completely within theexisting curriculum. Furthermore, the Schools’ Challenge built links between schools and localbusinesses. Young people are put in touch with contacts within the maritime industry, and receive advice,help and mentoring by maritime business people.
Information and awareness raising campaigns In conjunction with the Maritime Academy, dredging, tugging and fishing sectors and Promotie
Binnenvaart Vlaanderen, the Belgian Shipowners’ Association has come up with a promotionalcampaign, based around the website www.areyouwaterproof.be. The website gives links to all maritimesectors and all educational establishments in Belgium, and is constantly updated. This campaign has asingle brand identity.
Since 2002, the Irish government, through the Irish Maritime Development Office has been carrying out aprogressive 'Careers at Sea' programme to improve attractiveness of the sector. The target group of thisprogramme has been schoolchildren and they have been communicated that a seafaring career is wellpaid, and they have also tried to promote the high-tech working environment of new vessels, etc.
Ambassadors In Denmark, maritime students are trained and used as ambassadors for the industry, supporting the
story line personifying an industry in growth and with a strong potential for a future career. Theambassadors are encouraged to participate in student counselling activities at their old high schools,giving lectures on their job, career etc. in primary school. More experienced seafarers join in theseactivities. There are about 330 lectures each year for pupils in primary schools in Denmark.
Financing skill supplyThe Dutch Maritime Network aims to provide a mechanism whereby its members can pool resources
they wish to devote to educational and recruitment activities – thereby saving money on duplicatedactivities. The Maritime Network is also investigating how to develop Training and Development funds inthe maritime sectors where these are not yet present.
Most Spanish shore-side positions are filled by people with specialist training, rather than by ex-seafarers. Skills relevant to shore-side careers are taught at higher educational institutes. Professionalorganisations (e.g. Colegio Oficial de Ingenieros Navales) offer financial incentives to attract youngpeople with brilliant results in the Secondary School to follow the relevant university studies.
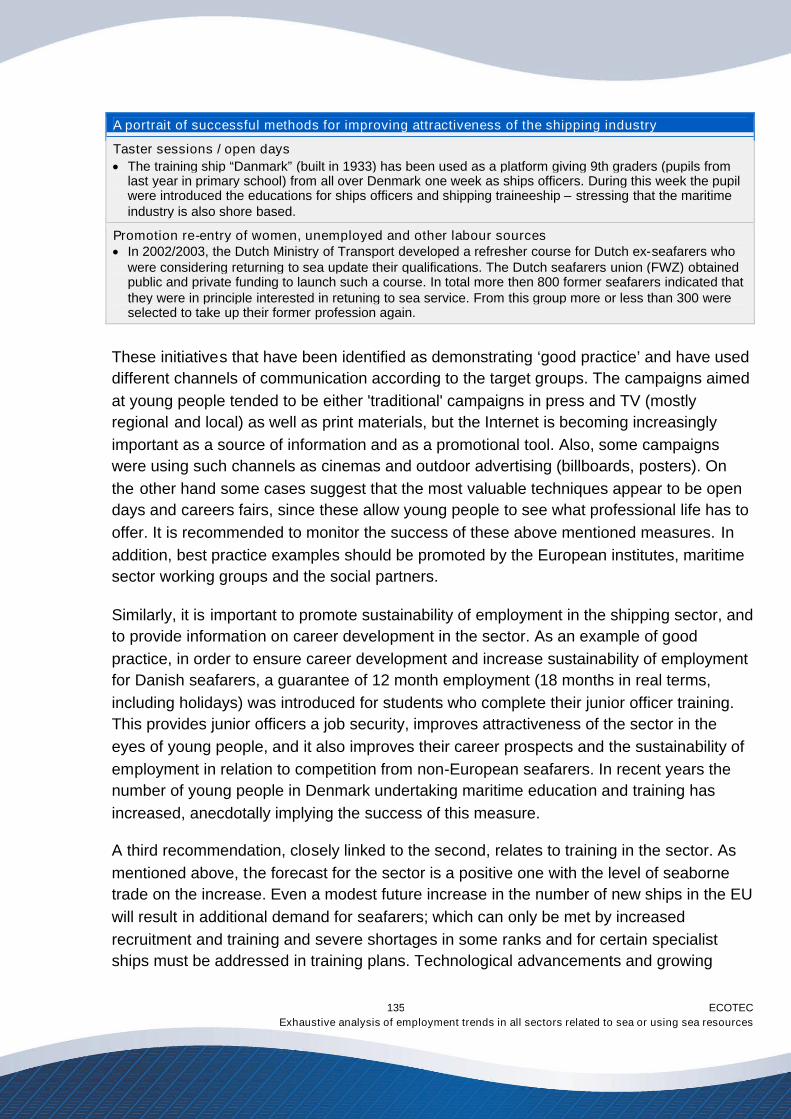
ECOTECExhaustive analysis of employment trends in all sectors related to sea or using sea resources
135
A portrait of successful methods for improving attractiveness of the shipping industry
Taster sessions / open daysThe training ship “Danmark” (built in 1933) has been used as a platform giving 9th graders (pupils from
last year in primary school) from all over Denmark one week as ships officers. During this week the pupilwere introduced the educations for ships officers and shipping traineeship – stressing that the maritimeindustry is also shore based.
Promotion re-entry of women, unemployed and other labour sources In 2002/2003, the Dutch Ministry of Transport developed a refresher course for Dutch ex-seafarers who
were considering returning to sea update their qualifications. The Dutch seafarers union (FWZ) obtainedpublic and private funding to launch such a course. In total more then 800 former seafarers indicated thatthey were in principle interested in retuning to sea service. From this group more or less than 300 wereselected to take up their former profession again.
These initiatives that have been identified as demonstrating ‘good practice’ and have useddifferent channels of communication according to the target groups. The campaigns aimedat young people tended to be either 'traditional' campaigns in press and TV (mostlyregional and local) as well as print materials, but the Internet is becoming increasinglyimportant as a source of information and as a promotional tool. Also, some campaignswere using such channels as cinemas and outdoor advertising (billboards, posters). Onthe other hand some cases suggest that the most valuable techniques appear to be opendays and careers fairs, since these allow young people to see what professional life has tooffer. It is recommended to monitor the success of these above mentioned measures. Inaddition, best practice examples should be promoted by the European institutes, maritimesector working groups and the social partners.
Similarly, it is important to promote sustainability of employment in the shipping sector, andto provide information on career development in the sector. As an example of goodpractice, in order to ensure career development and increase sustainability of employmentfor Danish seafarers, a guarantee of 12 month employment (18 months in real terms,including holidays) was introduced for students who complete their junior officer training.This provides junior officers a job security, improves attractiveness of the sector in theeyes of young people, and it also improves their career prospects and the sustainability ofemployment in relation to competition from non-European seafarers. In recent years thenumber of young people in Denmark undertaking maritime education and training hasincreased, anecdotally implying the success of this measure.
A third recommendation, closely linked to the second, relates to training in the sector. Asmentioned above, the forecast for the sector is a positive one with the level of seabornetrade on the increase. Even a modest future increase in the number of new ships in the EUwill result in additional demand for seafarers; which can only be met by increasedrecruitment and training and severe shortages in some ranks and for certain specialistships must be addressed in training plans. Technological advancements and growing
ECOTECExhaustive analysis of employment trends in all sectors related to sea or using sea resources
136
safety and efficiency concerns also had an impact on training requirements in the sector,which again is essential in ensuring high labour productivity and the high skill levels ofEuropean seafarers. Although there are sufficient land-based training facilities, on-boardtraining places could be increased, for example by exploiting the provisions in the state aidguidelines. Indeed, the increased availability of the supplementary training would increasethe employability of the European seafarers. Increased collaboration between theshipowners associations, social partners and public bodies provides better opportunities tomatch the emerging skills needs with appropriate training supply. Italy has experiences aproblem in recruiting young people – due to a lack of publicly funded training for STCWtraining for seafarers. Co-operation once again is recommended to ensure affordabletraining supply as training in this sector is not only important from the point of view ofemployment, but also in terms of marine safety. International regulations, such as revisedSTCW Convention on training and the ISM Code have had an impact on the trainingprovision in the industry through the establishment of minimum standards for educationand training. However it must be highlighted that further qualifications to the STWC furtherenhance possibilities for a life time career, both at sea and on shore-side of the maritimecluster. The following table demonstrates three successful measures to improve training inthe sector.
Successful methods for improving training in the sector
The UK stakeholders have developed a number of training initiatives aimed at the shipping sector, includingthe Officer Cadet Scholarship. The Scholarship aims to encourage young men and women to fulfil theirambition for a career at sea and to take advantage of the excellent maritime education available. On agross basis it costs approximately £35,000 to train a cadet over a three and a half year course. Half of thisis covered by SmarT - a government training grant. This covers everything from the cadet's uniformallowance to salary and college fees. In March 2000 the Scholarship gained the annual InternationalIndustry's "Salute to Youth Training" award. This was awarded to the best Maritime Youth trainingorganisation from no less than 47 entries from 18 countriesI.
Besides the officer training in the UK, the Merchant Navy Training Board (MNTB) produced the MerchantNavy Foundation Degree (MNFD) framework in October 2005. The degree is a vocational qualificationdeveloped to provide a basis for further life-long study, including progression to an Honours level degreeand the highest level of professional certificates of competency. The qualification combines collegeeducation with sea-going training and experience and incorporates aspects of the ‘value-added’ qualitiesthat the industry is asking for with regard to management and leadership capability. The programme aims toattract larger numbers of high quality entrants to the Merchant Navy by satisfying the current expectation inschool leavers and their parents that further education leads to a degree. Alternative training programmeswill continue to be available for those sections of the industry where degree-level programmes are notappropriate. The scheme is partly funded by the monies received as Payments in Lieu of Training (PILOT)from companies choosing not to train cadets in their ships under the tonnage tax regimeII.
Belgium demonstrates an example of good practice in training and education provision and in the way in
I www.maritimelondon.co.ukII Further information on http://www.mntb.org.uk/news/Documents/FD_SectFrame_MN.pdf
ECOTECExhaustive analysis of employment trends in all sectors related to sea or using sea resources
137
Successful methods for improving training in the sector
which it has managed to turn the trend of decline in employment around and to increase the number ofseafarers of Belgian origin. Indeed, as a result of an intensive campaign to enhance the image of maritimestudies and professions in the shipping sector, the number of students in Belgium shows an upward trend.For example, in comparison with the academic year 2003-2004, the number of students in the deck divisionincreased by 8.6% in 2004-2005. However, the number of students in the mechanical division droppedslightly with 5%. As a result the Royal Belgian Ship Owners Association, together with the HigherNavigation School, wishes to develop a high-profile campaign to solve this problem and promote take-up ofstudies in the mechanical field.
Dual-purpose training officer training that was introduced in 1996 has been widely regarded as success inDenmark. This qualifies a ship’s officer to work both as a navigator and as a ‘machine master’. The aim ofthe training was, and still is, to give Danish officers a competitive advantage over foreign ship’s officers inbeing able to master two occupations.
To counteract problems relating to the lack of publicly financed training in the shipping sector, a new Italianshipping academy - Accademia del mare (Sea academy) - was established in Genova in 2005. At theacademy the cadets can study for 2 years, combining a year of service at sea and a mandatory STCWtraining course.
Last but not least Member States should fully explore and use the potential of the StateAid Guidelines, and not only in fiscal terms but also from the perspective social securityand income taxation. ECSA also calls for a stable global regulative framework as frequentchanges in regulations make it difficult to plan and optimise maritime transport; accordingto ECSA global rules for the shipping industry would ensure that European shipping canoperate outside Europe on a level playing field. This is particularly important as aconsiderable share of the EU's shipping industry turnover comes from activities outsideEurope. The global character of the industry has also been increasingly recognised byinternational bodies like the EU institutions and the OECD. As a result, most of the recentEU regulations on safety, environment and social matters are based on IMO and ILOConventions.
The rest of the section focuses on a more detailed analysis of tonnage tax regimes with adiscussion on their impact on sustaining employment. It also briefly reviews discussions onthe introduction of a tonnage tax in Sweden. The chapter will conclude by discussing theconcept of ‘policy package’ approach in sustaining employment in the shipping sector.
ECOTECExhaustive analysis of employment trends in all sectors related to sea or using sea resources
138
Tonnage tax - overview
Tonnage tax has been operating in Europe in different forms since the mid-1990s. Greece was the firstcountry to introduce a tonnage tax in the mid 1990s, followed by the Netherlands and Norway, Germany in1999, the UK in 2000, and Denmark, Spain, Ireland, Belgium, Italy, Finland and France in 2002.
Nearly universally across Europe the introduction of tonnage tax has led to an increase in the number ofvessels registered under European flags and a decline in the average age of the Community flagged fleet.However, the extent to which it has managed to address the decline in the number of EU seafarers variessignificantly from Member State to Member State. As a part of the national stakeholder consultationprocess for this study it was found that the tonnage tax schemes from Belgium, the Netherlands, Denmarkand the UK were regarded as particularly successful from the point of view of employment creation.However, it must be noted that usually it is tonnage tax regime together with other measures that havemade the most significant contribution for employment.
Experience from the UK
To rectify the problem around the decline of the UK-owned fleet, the British Government set up a ShippingWorking Group in 1997 which, in 1998, recommended the introduction of a tonnage tax. A White paper'British Shipping: Charting a New course' was published in1998, which outlined the future of Transport inthe UK and in 1999 the Chancellor of the Exchequer commissioned an independent enquiry into the casefor a tonnage tax regime for shipping. The Finance Act 2000 contained the main points of the legislation,which were supplemented by the Tonnage Tax Regulations 2000, a Statement of Practice and TonnageTax (Training Requirements) Regulations 2000, and the most recent Finance Act 2005.
The main objectives of the tonnage tax were to reverse the decline in the UK shipping industry byincreasing direct ownership of shipping by companies within the UK, and by increasing the UK's merchantmarine workforce (Leggate and McConville, 2005). Addressing employment of seafarers in maritimeindustries ashore was also a key objective.
The UK Tonnage Tax largely follows the Dutch model, but also has some distinct elements. To qualify forinclusion in the regime, a ship must be seagoing and over 100 gross tons used for: the carriage by sea ofpassengers, or cargo; towage, salvage or other marine assistance carried out at sea; or transport by sea inconnection with other services of a kind necessarily provided at sea (Moore Stephens). There is a 75% limiton chartered tonnage, i.e. not more than 75% of the net tonnage of the qualifying ships operated can bechartered in other than on 'bareboat charter terms', this does not apply to chartered members of the sameUK group. The election is in force for 10 years unless the company or group ceases to qualify, the 75%limit on chartered tonnage is exceeded, or if a company is found guilty of tax avoidance.
An important feature of the UK tonnage tax is its associated minimum training requirement, which has beenhailed as an important and unique feature of the UK tax. The training element requires that companiesmust recruit and train one UK cadet per year for every 15 officer posts entered on the Safe ManningCertificates/Safe Manning Documents for all vessels in the regime. Companies must also continue to trainrecruits from previous two years, so that once a company has been in tonnage tax for three years it will betraining three UK cadets for every fifteen officer posts. The trainees must be UK or EEA nationals andresident in the UK. However, a company can also choose make a payment in lieu of training (PILOT),instead of training. In terms of ratings (crew members) companies must also review annually the feasibility
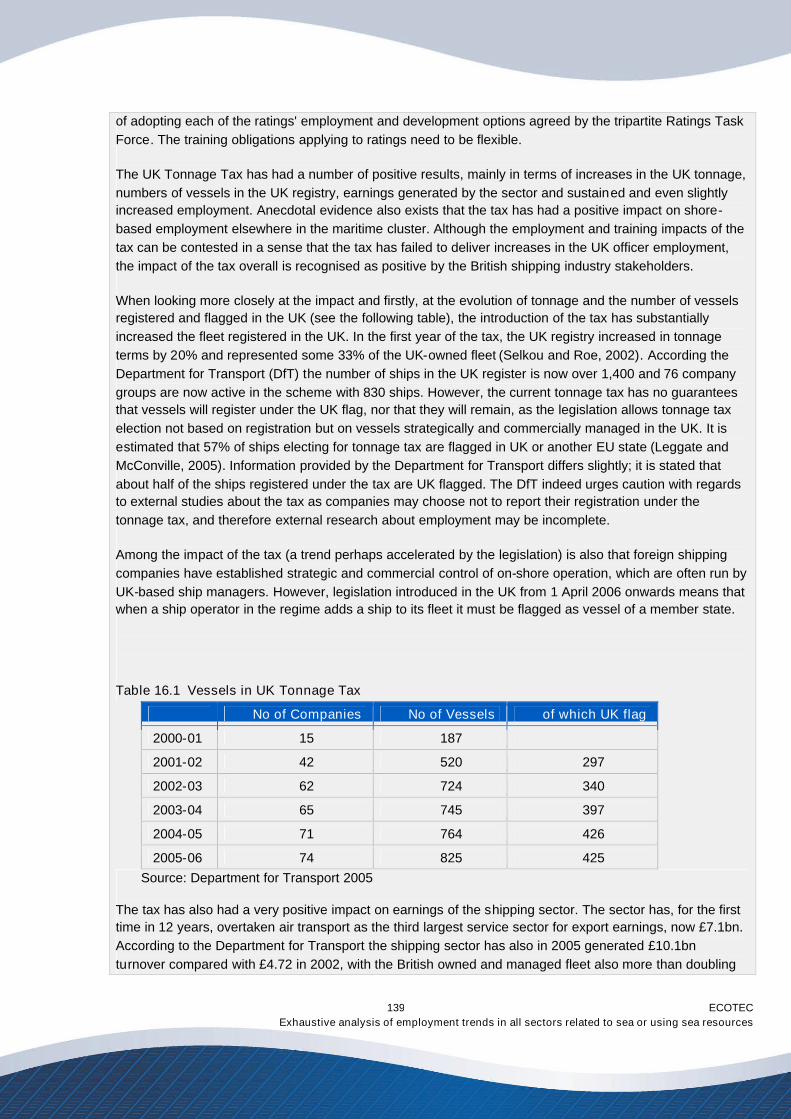
ECOTECExhaustive analysis of employment trends in all sectors related to sea or using sea resources
139
of adopting each of the ratings' employment and development options agreed by the tripartite Ratings TaskForce. The training obligations applying to ratings need to be flexible.
The UK Tonnage Tax has had a number of positive results, mainly in terms of increases in the UK tonnage,numbers of vessels in the UK registry, earnings generated by the sector and sustained and even slightlyincreased employment. Anecdotal evidence also exists that the tax has had a positive impact on shore-based employment elsewhere in the maritime cluster. Although the employment and training impacts of thetax can be contested in a sense that the tax has failed to deliver increases in the UK officer employment,the impact of the tax overall is recognised as positive by the British shipping industry stakeholders.
When looking more closely at the impact and firstly, at the evolution of tonnage and the number of vesselsregistered and flagged in the UK (see the following table), the introduction of the tax has substantiallyincreased the fleet registered in the UK. In the first year of the tax, the UK registry increased in tonnageterms by 20% and represented some 33% of the UK-owned fleet (Selkou and Roe, 2002). According theDepartment for Transport (DfT) the number of ships in the UK register is now over 1,400 and 76 companygroups are now active in the scheme with 830 ships. However, the current tonnage tax has no guaranteesthat vessels will register under the UK flag, nor that they will remain, as the legislation allows tonnage taxelection not based on registration but on vessels strategically and commercially managed in the UK. It isestimated that 57% of ships electing for tonnage tax are flagged in UK or another EU state (Leggate andMcConville, 2005). Information provided by the Department for Transport differs slightly; it is stated thatabout half of the ships registered under the tax are UK flagged. The DfT indeed urges caution with regardsto external studies about the tax as companies may choose not to report their registration under thetonnage tax, and therefore external research about employment may be incomplete.
Among the impact of the tax (a trend perhaps accelerated by the legislation) is also that foreign shippingcompanies have established strategic and commercial control of on-shore operation, which are often run byUK-based ship managers. However, legislation introduced in the UK from 1 April 2006 onwards means thatwhen a ship operator in the regime adds a ship to its fleet it must be flagged as vessel of a member state.
Table 16.1 Vessels in UK Tonnage Tax
No of Companies No of Vessels of which UK flag
2000-01 15 187
2001-02 42 520 297
2002-03 62 724 340
2003-04 65 745 397
2004-05 71 764 426
2005-06 74 825 425Source: Department for Transport 2005
The tax has also had a very positive impact on earnings of the shipping sector. The sector has, for the firsttime in 12 years, overtaken air transport as the third largest service sector for export earnings, now £7.1bn.According to the Department for Transport the shipping sector has also in 2005 generated £10.1bnturnover compared with £4.72 in 2002, with the British owned and managed fleet also more than doubling
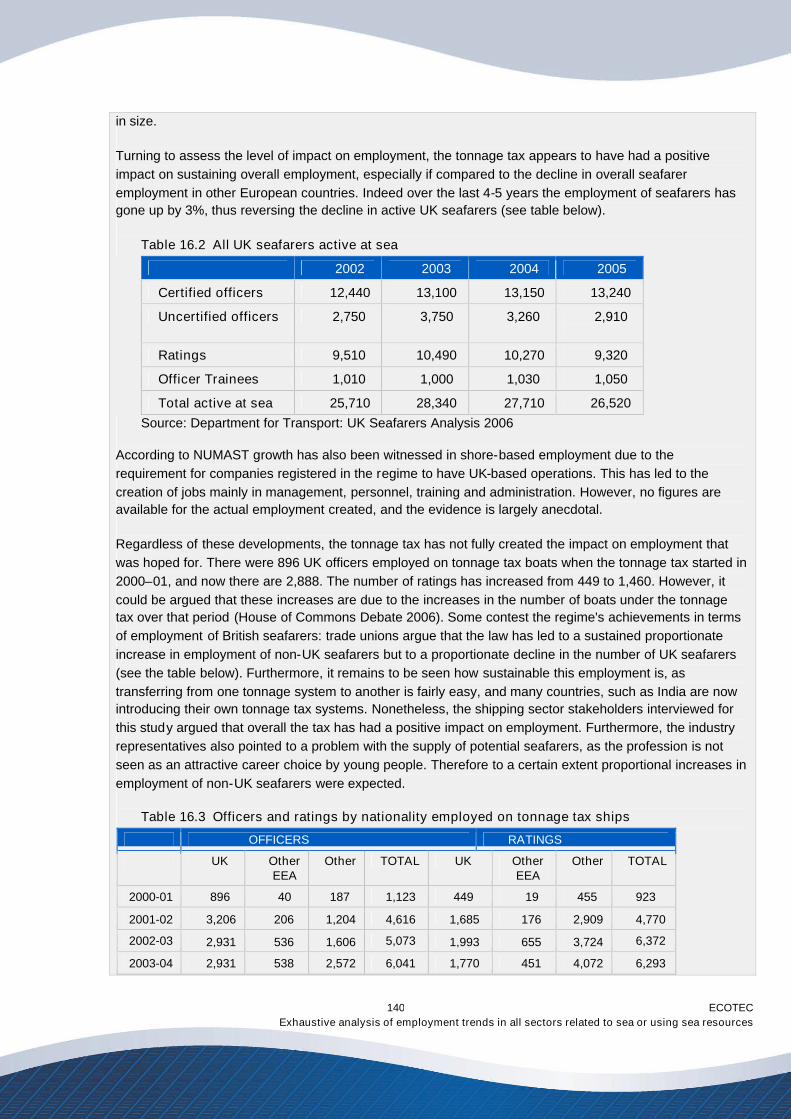
ECOTECExhaustive analysis of employment trends in all sectors related to sea or using sea resources
140
in size.
Turning to assess the level of impact on employment, the tonnage tax appears to have had a positiveimpact on sustaining overall employment, especially if compared to the decline in overall seafareremployment in other European countries. Indeed over the last 4-5 years the employment of seafarers hasgone up by 3%, thus reversing the decline in active UK seafarers (see table below).
Table 16.2 All UK seafarers active at sea
2002 2003 2004 2005
Certified officers 12,440 13,100 13,150 13,240
Uncertified officers 2,750 3,750 3,260 2,910
Ratings 9,510 10,490 10,270 9,320
Officer Trainees 1,010 1,000 1,030 1,050
Total active at sea 25,710 28,340 27,710 26,520Source: Department for Transport: UK Seafarers Analysis 2006
According to NUMAST growth has also been witnessed in shore-based employment due to therequirement for companies registered in the regime to have UK-based operations. This has led to thecreation of jobs mainly in management, personnel, training and administration. However, no figures areavailable for the actual employment created, and the evidence is largely anecdotal.
Regardless of these developments, the tonnage tax has not fully created the impact on employment thatwas hoped for. There were 896 UK officers employed on tonnage tax boats when the tonnage tax started in2000–01, and now there are 2,888. The number of ratings has increased from 449 to 1,460. However, itcould be argued that these increases are due to the increases in the number of boats under the tonnagetax over that period (House of Commons Debate 2006). Some contest the regime's achievements in termsof employment of British seafarers: trade unions argue that the law has led to a sustained proportionateincrease in employment of non-UK seafarers but to a proportionate decline in the number of UK seafarers(see the table below). Furthermore, it remains to be seen how sustainable this employment is, astransferring from one tonnage system to another is fairly easy, and many countries, such as India are nowintroducing their own tonnage tax systems. Nonetheless, the shipping sector stakeholders interviewed forthis study argued that overall the tax has had a positive impact on employment. Furthermore, the industryrepresentatives also pointed to a problem with the supply of potential seafarers, as the profession is notseen as an attractive career choice by young people. Therefore to a certain extent proportional increases inemployment of non-UK seafarers were expected.
Table 16.3 Officers and ratings by nationality employed on tonnage tax ships
OFFICERS RATINGS
UK OtherEEA
Other TOTAL UK OtherEEA
Other TOTAL
2000-01 896 40 187 1,123 449 19 455 923
2001-02 3,206 206 1,204 4,616 1,685 176 2,909 4,770
2002-03 2,931 536 1,606 5,073 1,993 655 3,724 6,372
2003-04 2,931 538 2,572 6,041 1,770 451 4,072 6,293
ECOTECExhaustive analysis of employment trends in all sectors related to sea or using sea resources
141
2004-05 2,933 770 2,751 6,454 1,667 652 4,504 6,823
2005-06 2,888 962 3,232 7,082 1,460 636 5,357 7,453
Source: Department for Transport 2005
The associated training requirement of the tonnage tax is described as a good practice by the stakeholderssuch as NUMAST, the trade union for seafarers. However, it is also argued that the tax has not quitedelivered the ‘unique feature’ of increased training I. Although the numbers of cadets have somewhatincreased, they have not quite reached the levels wished by the trade unions. The number of cadets hasimproved in terms of percentage growth; but the number still falls short of the sufficient numbers tomaintain stability of officer numbers – around 1,000 per annum (Leggate and McConville, 2005). Thecumulative training commitment for 2005/06 for shipping companies is 1,371 trainees in their first, secondor third year of training. The average number of new starters in training prior to the launch of tonnage taxwas under 500, the number of new starters since the launch of tonnage tax has been over 500 and in someyears has been over 600, which clearly falls short of the cumulative training commitment (DfT). A surveyconducted by McKinnon for NUMAST and British Shipowner's Association found that two thirds ofrespondents (66%) had officer cadets in training. A majority of the companies had British officer cadets intraining, some also having both British and non-British officer cadets. However, out of the 1,298 officercadets, 763 (59%) were British (Chamber of Shipping and NUMAST, 2006).
The reason for not reaching the training target is that the opt-out for training has been popular, allowingcompanies to make a payment in lieu of training into a training fund, PILOT fund (Leggate and McConville,2005). Unions argue that unplanned payments to the PILOT fund are also argued to be high, withunplanned payments increasing from 16% to 23% in 2005. Some of the reasons offered for the increasedpayments into the PILOT fund are the inability of the shipping industry to cope with the increased numbersof junior officers. The reaction of shipping companies to reduce the level of training may thus be a reactionto the scarcity of junior officer posts at UK rates of pay for cadets at end of their training (House ofCommons Transport Committee). There may be other causes of unplanned Payments In Lieu of Training,the main one is argued to be temporary additions to the fleet which temporarily increase a company'straining commitment for a limited period (NUMAST).
However, the trade union NUMAST disputes the employers' claim that they cannot take on more cadetsthan there are jobs. They argued that the main barriers employers face to recruiting UK nationals are costsand the availability of cheaper labour. The tendency to employ foreign junior officers is reflected by findingsof a survey carried out for NUMAST and the Chamber for Shipping. A third (32%) of the respondentssurveyed expected a significant change in the nature of their company’s need for junior officers over thenext three years and also expected to recruit junior officers from different countries. Less than half (45%) ofthe recently qualified cadets that the companies expected to recruit in 2005-2007 were expected to beBritish.
Some stakeholders have also seen the culture of poaching as a barrier to training and employing juniorofficers. It is argued that the minority of the companies who do adhere to the tonnage tax trainingrequirement are often undermined by other companies poaching cadets after they have been trained up.This can be a hard hit for companies who on average spend £10,000/year on training cadets for threeyears (NUMAST).
This case study has demonstrated a number of ways in which the tonnage tax has positively influencedemployment in the sector. However, it has also shown some challenges that the sector is facing,particularly in relation to the implementation of the training initiative and recruitment of foreign seafarers. As
ECOTECExhaustive analysis of employment trends in all sectors related to sea or using sea resources
142
a response to these challenges, a link between eligibility for the tonnage tax and the actual employmentand training of UK seafaring ratings has been proposed by trade unions in order to improve the impact onUK employment. According to the DfT and Inland Revenue, both the RMT and NUMAST, supported by theTGWU and the TUC, have submitted papers calling for a mandatory employment link in tonnage tax forcadets (NUMAST) and a training and employment link for ratings (RMT). The mandatory employment linkwould require employers to make a commitment to providing further employment for the cadets they havetaken on as trainees. The ship-owners are firmly opposed to this, arguing that it would drive them awayfrom the UK flag.
The proposals are currently being considered by a sub-group of the Shipping Task Force and the decisionis due before the summer recess. NUMAST anticipates that it is unlikely that the mandatory employmentelements of the proposal will be agreed. However, what may happen instead is that the value of aid tocompanies for training will be increased. This proposal is also supported by the Chamber of Shipping.
Experience from Sweden
The Swedish shipping industry has campaigned for a system of tonnage tax for Swedish shipping lines forthe last 10 years. However, when the proposals for it emerged in Europe in the nineties, the Governmenthad concerns about subsidising a particular sector, largely due to its experience with subsidising the textilesector. But the first development of its kind for the shipping sector was an introduction of shipping aid in2001 to give the industry similar competitive terms to its closest rivals. The initial bill provided aid only foronboard employee payroll costs on freight vessels, but was later widened to include the ferry sector andextended to cover income tax and all payroll charges for seafarers working on Swedish-registered vessels.Before the introduction of shipping aid, there was a trend towards a significant reduction in the Swedish-controlled tonnage. However, since its implementation this trend has been reversed, and more companiesare registering their ships under the Swedish flag. By 2002, 25 vessels had been registered under theSwedish flag. The increase in Swedish-controlled tonnage not only implies an increase in the number ofseafarers, but also has an effect on employment in administration, servicing and other land-based services.
Since the introduction of shipping aid, an agreement has also been reached on temporary employment aid(TEA). Under the TEA agreement, a certain proportion of employees on board freight vessels ininternational traffic may be foreign citizens covered by special collective agreements. Shipowners arguethat the agreement has contributed to reducing staffing costs to a competitive level. According to theSwedish Maritime Administration at the end of 2004, a total of 746 TEA employees were working onSwedish vessels.
During the year 2004, a tonnage tax regime was under discussion in several different forums and sincethen, notably a half a year ago, the mood changed. Those in favour of the tax built up a majority inparliament and widespread support for the tax exists with even the Green Party, who previously opposedthe tax. The Minister of Finance decided to appoint a commission of inquiry to investigate and present aproposal for Swedish tonnage-based tax system for shipping on 25 November 2004 and in December thatyear a chair was appointed to lead the investigation. The Commission presented its report to the Ministry ofFinance in February 2006.
The rationale for the tonnage tax is mainly about its contribution to the competitiveness of Sweden'sshipping sector's competitiveness. Employment creation is another key objective of the Swedish proposal,both in terms of onboard and onshore jobs. The shipping employers' argument has been based oncompetitive neutrality vis-à-vis competing countries and the lower numbers of that vessel orders by
ECOTECExhaustive analysis of employment trends in all sectors related to sea or using sea resources
143
Swedish companies for many decades (Swedish Maritime Administration). Other Member States' tonnagetax regimes have also made it more difficult for Sweden to continue without one. Registering under theSwedish flag is also seen to have other positive consequences, namely in terms of better environmentaland safety standards.
A committee of twelve representatives from the Ministry of Finance, University of Gothenburg, the SwedishTax Agency and Business Organisations, such as the Swedish Ship-owners' Association, led theinvestigation into the tax. The committee was chaired by Goran Ekstrom, Director General for the SwedishGovernment Employers. During the development of the proposal, the committee also met withrepresentatives from Finance departments of the Danish, Finnish and Norwegian Governments. Theproposal has now been submitted to the Ministry of Finance, and is under consultation until late June 2006.The Ministry of Finance will then prepare the Bill for the government. A decision is likely to be taken in thefirst half of next year. The committee explored tonnage tax systems and their impacts in other memberstates, and has sought to replicate good elements of regimes from other countries. The Swedish tonnagetax largely follows the model of the UK, Danish or Dutch tax systems. The Finnish, English and Danishcases have been particularly investigated in detail.
The Swedish proposal mirrors many elements of the UK, Dutch and Danish tonnage tax regimes. The mainelements of the Swedish proposal are: a company has to have a net tonnage of at least 100; the strategicand economic management of the company must be in Sweden; the net tonnage of rented/leased shipsmay not exceed 75% of the companies average net tonnage over the tax year; qualified activity is thetransport of goods or passengers to sea with companies' own or leased vessel letting of ships withoutcrews; and the period of adherence to the tax must be 10 years. There is no requirement for a Swedishship to register under the Swedish flag, for tow boats a flag requirement is proposed in accordance with theEuropean Commission guidelines.
In terms of learning from other countries with reference to employment, the UK experience of an increasein onshore jobs elsewhere in the maritime cluster following the introduction of a tonnage tax regime hasbeen mentioned as encouraging for the Swedish context. The tonnage tax is anticipated to have effects onthe whole Swedish maritime cluster and on-shore employment.
The Swedish proposal differs from the UK scheme as it lacks a training requirement. This was consideredby employers to be unnecessary as there is already considered to be sufficient training provided in thesystem.
Another key element in the Swedish proposal, that differs from tonnage tax regimes in other MemberStates is that cabotage is under international competition, and therefore applicable for tonnage tax. Shipsengaging in transport between two Swedish ports can register with the tonnage tax regime, which is incontrast to for example, to neighbouring Finland, where cabotage between two Finnish ports may not electthe tax. The justification for this element is that domestic transport competes more and more in theinternational market (through foreign companies operating on the domestic transport market), and shouldtherefore be considered under international competition.
The consultation of other organisations during the investigation has been comprehensive, and the work ofthe committee has been described as consensual. According to the Committee Chair, ship-owners andtrade unions are fully satisfied with the proposal. The main concerns of the Ministry of Finance is ship-owners may not be paying tax on funds after 10 years, as well as the issue of retro-activeness of the taxfrom year 2005, i.e. ship-owners being able to register ships bought in the year 2005 into the tax regime.
ECOTECExhaustive analysis of employment trends in all sectors related to sea or using sea resources
144
Growth both in onboard and onshore employment is an anticipated impact of the tax. The impact on landbased employment is also underlined: calculations outline that for every employee onboard, employment iscreated for between 5-6 employees on land (Swedish Tonnage Tax Proposal). One of the impacts of thetax in Sweden may also be increasing numbers of Finnish ship-owners registering in Sweden. Theexperience of the Finnish tonnage tax system has not been positive, with only one company registering.The Committee has already received phone-calls from Finnish ship-owners registering their interest in theSwedish scheme. This has caused concern among the Finnish seafarers union about the future ofemployment in the Finnish shipping industry.
Many Member States have taken a ‘policy package' approach to the challengesexperienced by the sector in relation to employment in order to ensure sustainable policyframework that would address the issue of employment in the longer term future. Forexample, earlier on this decade the Belgian government was blamed for not following anintegrated vision, and only implementing temporary measures. As a response to thiscriticism the Belgium government started to develop the following package of measures:
the introduction of a tonnage tax; exemption of tax on surplus value of ship sales; exemption from company tax and social tax; facilitation of educational possibilities for the growing numbers of students interested in
sea navigation; trying to establish synergies with other countries (particularly the Netherlands) in the
field of education; bringing ship mortgaging down to the cost level of other countries (the Netherlands);
and modernising maritime law.
A new Belgian sea navigation policy was introduced in 2004 with the impact that thenumber of Belgian ships registering under the Belgian flag increasing since 2004. A newdynamic in education has meant that the take-up of maritime education has increased by50% since 2001. Direct employment in the Belgian shipping cluster (including maritimeworks) has increased since 1998 by 1% (2.8% for Belgians). This increase is not large, butin light of the expected drop which would have happened under the old regime, it is a goodresult. It is also worth mentioning that the number of Belgian seafarers recruited hasgrown, mainly thanks to the other measures (such as employment subsidies) working sowell with the tonnage tax regime.
The Irish government has also taken a comprehensive approach to sustain and createemployment in the shipping sector, including:
ECOTECExhaustive analysis of employment trends in all sectors related to sea or using sea resources
145
Introduction of tonnage tax Establishment of the National Maritime College of Ireland (NMCI) The PRSI Refund Scheme Training of junior officers according to the STCW95 standards - Irish Seafarer Training
Grants Scheme ISEACampaign to promote "Careers at Sea"
16.6 Offshore oil and gas extraction
Europe is home to a third of all manufacturing of equipment related to offshore oil and gasextraction. This together with the fact that existing oil fields will have to improve their yieldand in the future new fields will be much smaller than before and at the same time indeeper waters, and often in harsher climates –creates a market for new infrastructure butalso poses financial challenges. In addition, all fields will have to meet more stringentenvironmental and ecological requirements.
Consequently, policies from European and national levels can play a role in supportingresearch and development in this sector. Organisations representing the industry arealready working in this field with support from the European Framework Programmes forresearch. Eurogif, for example, has set up a Technology Master Plan with the aim ofidentifying a set of R&D priorities that will enable the European Service & Supply Industryin co-operation with the operators, universities and research institutes to develop thetechnology needed to find and produce fossil energy with a minimum discharge andemissions, whilst also develop ways to use fossil fuels more intelligently throughdecarbonisation and CO2 management. The Plan is based on the priorities developed inthe thematic networks organised by Eurogif in the 5th Framework Programme (FP5).
It is also essential for the industry to aim at addressing the shortage of young peoplechoosing the oil and gas industry as a career option. The shortage of skilled individualshas currently been reported to be 'acute'.
16.7 Maritime works
There is an urgent demand by the dredging industry to address the growing demand forlabour with policy interventions. This is caused by the unattractiveness of the sectoramong young people, an ageing workforce, expansion of the dredging fleet and a shortageof education and training. This problem has expanded to the stage where individualdredging companies are organising their own training in the Far East and Eastern Europein order to address the shortage of skilled labour. Some industry representatives have alsodeveloped their own programmes in Western Europe with the aim of addressing the poor
ECOTECExhaustive analysis of employment trends in all sectors related to sea or using sea resources
146
image of the sector. For example, in the Netherlands there is a network of educationinstitutions that have committed themselves to promoting dredging technology as a part oftheir education curriculum. The Association of Dutch Dredging Companies (VBKO) is thesponsor and partner in this network with the main goal of this network to promote thedredging education and the industry as such.
Further data collection and research is also recommended, particularly in relation toemployment, education provision in the sector, the age profile of the workforce andexpectations of future fleet. Such information should be easily available to companies inthe maritime works sector.
The dredging industry stakeholders also support the development of the industry as itsown sector within the maritime cluster, due to its growing economic and employmentimpact. The industry is also calling for simpler European regulations and rule making toenhance transparency and to avoid different interpretations of the regulations by theMember States. This is particular relevant for the dredging industry in terms of theapplication of the Landfill directive. The dredging industry also calls for the endorsement ofinternational (IMO and ILO) regulations rather than European wide regulations in order toavoid conflicting demands from the European Commission and international organisations.In particular they call for the endorsement of the International Safety Management Code inorder to avoid unfair competition from dredging vessels from outside Europe that do notmeet these regulations. They would like policy action to also to encourage ratification,implementation and enforcement of the International Labour Convention. Finally, the StateAid guidelines should also be implemented to ensure the competitiveness of the Europeanseafarers in dredging fleet.
16.8 Offshore and coastal wind energy
As the main part of the report recognised, the wind energy market is particularly strong inEurope, with knowledge and related technology more developed than anywhere else in theworld. There is still however room to improve technologies, particularly in the offshore windenergy market that currently remains as the most expensive and labour extensive segmentof the wind energy market.
As a result of increasing globalisation and the ongoing turn towards a knowledge-driveneconomy it has become more difficult for peripheral European regions to promote regionalgrowth and job creation. This is largely because knowledge based production and servicesrequire knowledge developing institutions and a highly skilled workforce - prerequisitesperipheral areas often lack. Moreover, some European countries have seen a change in
ECOTECExhaustive analysis of employment trends in all sectors related to sea or using sea resources
147
regional policy favouring larger cities and regions that are already endowed with therequirements necessary to compete in a global and knowledge-driven economy.
The wind energy sector has the potential to induce both new job creation and/orcounteract declines in traditional maritime sector employment, particularly in peripheralregions of Europe. This can be demonstrated by a story of a small city in the Danishperiphery, Nakskov that in the last few years has reached a turning point in terms of jobcreation and regional economic growth. As it will be possible to see below this has largelybeen achieved through a new endogenous development strategy to boost economic andemployment growth through investments in green energy industry and innovativedevelopment initiatives financed largely by local resources.
Nakskov – from shipbuilding to job creation in offshore and coastal wind energy sector
Nakskov is a town of about 15,000 inhabitants situated on the island Lolland in the southeast peripheralpart of Denmark. The city is relatively isolated from commercial and industrial centres - Copenhagen ismore than 2 hours away. Hence, Nakskov does not have the same potential in turning into a long-distancesuburb like for example Nykoping-Falster, also situated in the same region, but about 50 km closer toCopenhagen.
Over the last couple of decades, Nakskov has had one of the worst images in Denmark, with highunemployment, social problems and population decline. The problems in Nakskov started in the 1970swhen the oil crisis of 1973 and 1975 led to a global recession in the shipyard industry, leading tosubstantial job losses. The situation worsened in the late 1980s when the Copenhagen-based owner of theshipyard in Nakskov decided to close it down in 1986. The shipyard used to be the pillar of the regionaleconomy by being the city's largest employer employing some 2,300 people at its peak. This recession anddecline in the shipbuilding industry also had a detrimental effect on a number of other large manufacturingcompanies in the region, leading to even greater job losses.
As a result of these events unemployment rose to 35% among skilled workers and 40% among unskilledworkers in 1988. Unemployment continued to rise and population continued to decline throughout the1990s.
Several grant and financial support programmes/initiatives financed by the EU, and co-financed by theDanish government and local funds, were initiated to rectify the situation in Nakskov. Unfortunately, as aresult of poor adaptation to local conditions and the short term nature of support, these initiatives largelyfailed to produce sustainable results.
Change of the development path – endogenous development strategy
In 1998, after more than a decade of suffering from high unemployment and population decline, as well asseveral failed local initiatives, the new mayor of the Socialist People's Party, who had come into office in1997 ending 84 years of Social Democratic rule, decided that creative measures were needed in order tochange course. More specifically, the new mayor decided that the town should 'invest themselves out ofproblems'. Thus, the city council decided upon a proactive, endogenous development strategy.
The new mayor realised Nakskov’s limitations in developing a knowledge driven economy and thereforedecided to stick with its traditional industry base with a focus on innovation and niche-markets. Theambition was to build an industrial base where energy, environment, recycling, and heavy industry allshould influence the nature of future industrial development of the region. The political decision to focus on‘green industry’ was based on the fact that this industry had the second largest growth potential after the IT
ECOTECExhaustive analysis of employment trends in all sectors related to sea or using sea resources
148
industry. Importantly, the new development strategy was unanimously decided by all political parties in thecity council, with the exception of the Social Democratic Party.
In connection with the decision to focus future development on Nakskov's traditional industrial base, it wasalso decided by the city council that the Port of Nakskov should remain as an industrial port. Subsequently,the port and adjacent areas (later to become the Nakskov Industry and Environment Park) were identifiedas the focal points for development.
Putting the new strategy into action
Key players in moving this strategy from paper to action was a new chief executive and a developmentmanager with a large network of private business leaders in Denmark and abroad. This 'dynamic duo' andthe new mayor introduced a new more flexible management style and also set up a development sectionclosely connected to the mayor's office. At the same time, a team of external advisors was connected to thedevelopment section to support the start-up process and later advising in technical questions.
In 1999, the 10-year master plan for Nakskov Industry and Environment Park was made, providing a newoverall structure for the port of Nakskov and adjacent areas. Already during the preparation of the masterplan, Danish windmill producer Vestas, who needed a new site to produce wings for windmills, showedinterest. This interest had partly been stimulated by investigative work by a group from the municipality ofNakskov, who actively searched for enterprises in the need of adequate port capacity and which fitted intothe concept of 'green industry'. Vestas, however, had some concerns about locating their production to alandfill site and the development group from Nakskov, therefore, decided to spend an extra 5 million DKK(€670,000) on top of the EU support (18 million DKK/€2.4 million) for preparing the production site forVestas and the rest of the Industry and Environment Park. Specifically, the council offered to removecontaminated soil as well as old concrete. That extra offer and quick decision by the municipality convincedVestas to establish its factory in Nakskov. The construction of the Vestas factory started in June 1999 andstretched over an area of 20,000m2.
Whilst the site was prepared for Vestas, the local labour market council and the vocational training schoolestablished a temporary training school in Nakskov, in order to ensure that Vestas had access to localworkers that were sufficiently trained to work in the plant. About 700 persons received training and whenVestas started production in December 1999 some hundred people were employed.
After the establishment of the Vestas factory, two more new establishments were realised – both related tothe production of windmills – Poul Ree, a tower manufacturer, and Skagen Sanblasting, a sandblasting andpainting company. This created synergy, 'clustering' effects and made a significant further contribution jobcreation in the 'green industry' in the region.
As part of the master plan, the municipality also decided to buy the entire former shipyard area in January2000, in order to build a maritime logistics centre and hence create a better setting for industrialcompanies. To afford this, the municipality had to take a loan of 100 million DKK. Later Nakskov and theneighbouring three municipalities also bought the farm property next to the harbour area and the areaexpanded heavily. In total, Nakskov invested some 130 million DKK into the port and adjacent areas.Although the old shipyard area and the adjacent areas are currently owned by the municipality, the aim issell buildings and sites to private companies. Ideally, only the deposit areas connected to the maritimelogistic centre should be owned by the municipality in the future.
Wider outcomes
Since 1999 several companies, including Vestas, Skagen Sandblasting, Trifolium Seeds, RewAir andRemming & Co, have been attracted to Nakskov from other parts of Denmark and from abroad – not onlyto form ' a green energy industry cluster' but also create employment in other related sectors. Importantly,the development group has been very quick to respond to any interest and actively searched for companiesthat may benefit from locating in or near the Port of Nakskov, just as they did with Vestas.
ECOTECExhaustive analysis of employment trends in all sectors related to sea or using sea resources
149
Synergy effects strengthened with many local companies intensifying their commercial relations. In additionto Vestas and their subcontractors, synergy effects have also been created through the cooperation of thelocal power plant that uses waste products from a sugar producing plant, Danisco. Moreover, sections ofthe recycling site have been used by the Danish Technical University and private engineering companies toexperiment for new methods to clean contaminated harbour soil. Thus, new 'green industry' knowledgeflows have been inserted into the town.
Currently, representatives from the municipality's technical department are travelling throughout EasternEurope hoping to sell the new acquired technical expertise through an initiative called Baltic Sea Solutions.Baltic Sea Solutions was launched by Nakskov in cooperation with the inter-municipal network in Lolland-Falster and is a cross-border network throughout the Baltic Sea Region with the goal of boostingsustainable growth and transnational cooperation between public administration systems. Importantly, itdeals with globalisation and outsourcing as opportunities to be grasped, rather than as a problem. As partof this project, the Operational Knowledge Centre (OKC) has been created by the Lolland-Falster region toattract new businesses to the Baltic Sea area and encourage the establishment of similar centresthroughout the region. Baltic Sea Solutions not only builds institutional capacity in the Baltic States; it isparamount for Nakskov’s development opportunities as it strengthens Nakskov’s position not only amongneighbouring municipalities, but also throughout the Baltic Sea region. It also works internally as a platformfor Nakskov’s own programmes and brings an added dimension of credibility to the programmes and ideasthat are ‘exported’ further.
The attraction of new companies to Nakskov has been a big boost not only for the city but also the seaport.The new companies that have located to the city (e.g. Vestas and Danisco) now export a significant shareof their production via the Port of Nakskov. The increasing activity in and near the port is illustrated by thefact that the tonnage handled by the port increased from 370,000 tonnes to 550,000 tonnes between 2000and 2003.
Impact on employment
In terms of employment, it is estimated that some 1,400 to 1,500 jobs have been created since 1999. Thisis significant given the fact that the population of Nakskov is only 15,000. A majority of the jobs have beencreated at the Vestas factory for wind energy turbines. Employment in the company has gone up fromsome hundred workers in 1999 to nearly 600 in 2006. Importantly, the Vestas factory uses a significantnumber of sub-contractors in the local area which has further contributed to the employment growth in theregion. It is however difficult to establish whether all of these jobs have been created through thedevelopment strategy or if they would have been created anyway. After all Denmark as a whole hasexperienced an economic growth in recent years.
In relation to transferability of employment from the old shipyard to wind energy industry, some 10% ofworkers that lost their jobs in the shipbuilding industry have now found employment in the green energycluster, most of them at Vestas. This is a fairly significant number as the shipyard has been closed for 20years, thus many former employees have retired and/or left the area.
Access to skilled workers has always been a problem in Nakskov and this problem has further exaggeratedin recent years. The lack of skilled labour is largely rooted in the fact that Nakskov lacks higher educationinstitutions, thus a majority of the younger people are forced to leave the region and in many cases they donot end up returning to Nakskov. The extent of the problem is illustrated by a recent study that showed thatNakskov may lack more than 3,500 skilled workers in ten years time. However, in relation to a majority ofthe new jobs created, they have predominantly been developed at the lower end of the skill scale,manufacturing jobs. But considerable amount of private money has also gone into further training andeducation of the workers, and the municipality has been working to get tailored training courses to meet thedemand of local companies. As an example, the wind turbine manufacturer Vestas has recently set up a 2-year training course to provide a qualification to work in the turbine manufacturing.
Lessons learnt
ECOTECExhaustive analysis of employment trends in all sectors related to sea or using sea resources
150
The key to the positive development in Nakskov in recent years has been the fact that they havesucceeded in involving and mobilising all local actors, and fostering collaboration for common good.Moreover, in the face of an increasingly competitive environment, the local decision makers realised theimportance of being proactive and making quick decisions (more importantly, having the capacity to makethese decisions). Another key to success, as identified by the Director of the Municipality, has been thegeneral belief by the local community that the situation could change.
The development of the green energy cluster has also required chances / investment risk by investing morethan 100 million DKK in the area and on the one hand this has put Nakskov under increasing financialpressure. Indeed, local taxes have been raised and is today one of the highest in Denmark, though this ispartly due to the social problems that prevail in Nakskov. Moreover, more loans had to be taken in order torepay the loan. Although Nakskov benefited from being in an Objective 2 area and hence received some€2.4 million in assistance, most of the investment has came from local sources. Thus, Nakskov relied onboth endogenous and exogenous resources rather than on exogenous resources only, which shouldimprove the transferability of the approach to other regions cities in Denmark and Europe. And theinvestments have created an interesting environment for businesses to locate in Nakskov. Importantly, thedecision to invest this large sum of money has been taken according to a long-term strategy (10 years) thatwas outlined beforehand and the commune should benefit financially as well as in development/territorialregeneration terms as it sells the revitalised area off to businesses.
All the parties have also agreed that well functioning public/private partnership has been and continues tobe at the core of the success. In addition, as mentioned above the coalition of most political parties hasplayed an important role in the positive development of Nakskov and it is believed that a similardevelopment would not have been achieved without this consensus. Thus, if a similar strategy were to beimplemented in another peripheral city/region a political consensus would have to be reached.
Finally, this study has been able to present a fairly comprehensive picture of the Europeanwind energy market, it is still the case that there are some significant gaps in datacollection and analysis in many countries across the EU. Specifically, there are significantdifferences in the way individual countries collect employment data and define theindustry. The EWEA is concerned about the fact that there are so many differentmethodologies in collecting data and would like to see a single methodology being used. Inthe publication 'Wind Energy - The Facts' the EWEA used national input-output tablestogether with EUROSTAT data.
16.9 Coastal tourism
This is the first European level study to explicitly include the coastal tourism sector in aEuropean wide study of employment in the maritime cluster. This has its justification in thedesire to assess the employment creation potential in all sectors related to the sea in orderto assist in drawing up a holistic maritime policy. It is also important as it allows theconsideration of the transferability of skills and capabilities between sea related sectors.However, the inclusion of this sector is not without its difficulties which include: lack of accurate comparable data; potential “data distortion” effect of the inclusion of this sector;
ECOTECExhaustive analysis of employment trends in all sectors related to sea or using sea resources
151
potential for “double counting” of employment, particularly with sectors such asrecreational boating;
differences in skill sets related to the tourism and the “traditional sectors” of the maritimecluster;
concerns over the quality and seasonality of employment in the coastal tourism sector;and potential policy impact of the inclusion of this sector in the cluster.
The general assessment of employment in the maritime sectors clearly indicates thesignificance of the share of tourism employment within the overall figures. On the whole,this share and the overall level of employment in coastal tourism have increased over theyears (although a trend of continuous growth can by no means be established for allcoastal regions, particularly in the context of the apparent increasing desire of Europeancitizens to explore more far away destinations). This generally positive profile thereforeappears to provide opportunities for employment and redeployment from sectors currentlyexperiencing decline. While this may be the case it must be noted that the skills setsrequired and to some extent the quality and sustainability (particularly over whole year) oftourism employment must be taken into consideration. There was some concern amongstakeholders that the inclusion of the tourism sector in this study could distort the picture ofemployment trends in the maritime cluster (which in many sectors are downward) andtherefore reduce incentives for policy makers to address European competitiveness issuesin more traditional sectors offering more highly skilled, high quality employment.
National and even regional employment data at Member State level currently does notenable us to develop an accurate picture of employment in this sector. Available data fortourism employment up to 50km from the coast are largely little more than estimates withthe added difficulty of potential “double counting” with other sectors in the cluster such asrecreational boating or cruise tourism. Until more precise methods of data gathering forthis specific sector are available, any figures presented must be regarded with a seriousdegree of caution. The first recommendation must therefore relate to the generation ofmore reliable data sources to estimate the impact and development of this sector, which initself includes a wide range of activities from the traditional hotel and catering provision,over cultural and other leisure activities to more specialised providers to the tourismindustry.
While some attempts have been made to look at the transferability of skills betweendifferent maritime sectors, the reality and potential impact of the transfer of workforce from“traditional” maritime employment to growth sectors such as coastal tourism has not beenexplored in detail. This should go hand in hand with an assessment of the quality andsustainability of employment in the sector. The case study presented below provides oneattempt at reducing the impact of seasonal effects experienced in the coastal tourism

ECOTECExhaustive analysis of employment trends in all sectors related to sea or using sea resources
152
sector. The exchange of policies and good practices between coastal regions ishighlighted as an important element in the development of successful integrated strategiesfor the maritime sector.
The CULTOURMED project is an example of public intervention by the Palma de Mallorca Council tosustain employment and reduce the effects of seasonality on tourism employment on the island. The aim ofthe project, funded by the INTERREG IIIB MEDOCC programme, was to promote cultural tourism as analternative to the dominating 'sun and sea holidays' in order to avoid the regions being solely advertised asa summer destination. The regions that signed up to the programme were Palma de Mallorca, Sardinia,Sicily, Campania and Crete.
The project offered an alternative in the medium and long term by promoting sustainable growth of "mature"tourist destinations, improving the competitiveness of the regions within the holiday market as well as theprogressive abandonment of the phenomenon of the seasonal economy. Cultural tourism has a positiveimpact in terms of regeneration of cultural heritage since it leads to the restoration of key sites. Culturaltourism depends less on the climate/season, and can therefore open up opportunities to reduce significantseasonal peak and troughs with their detrimental impact on the sustainability of tourism employment. Theproject has also sought to improve the co-ordination and quality of the activities offered by the differenttourist destinations, involving all the players of the tourism industry on the islands.
Impact
No evaluation of the project has so far been carried out as this is expected to require a longer termanalysis, and the project has not been completed yet. However, the project has been expected to increasethe tourist expenditure on the island by 15%, create 500 new jobs and better collaboration with regionalactors in the tourism industry.
Lessons
The project experienced the normal difficulties of any transnational project regarding different ways ofworking and the application of different rules and regulations in the participating countries. However thesynergy between the cities and the common problematic helped overcome the initial challenges. Theproject has shown the value of establishing international exchanges between "mature" tourist destinations.It has allowed the exchange of knowledge and expertise but also contributed to a better understanding oftheir different realities.
ECOTECExhaustive analysis of employment trends in all sectors related to sea or using sea resources
153
17.0 Future growth potential and relevant policy action
The traditional view of employment in the maritime industries is that of a sector in decline.This is partly due to the well documented falls in employment in the European shipbuildingand shipping industries. This study however has found that a number of maritime sectorsand their sub-sectors demonstrate a fairly significant growth potential, both in economicand employment terms. Furthermore, whist the shipbuilding industry has witnessed aperiod of decline, the level of outsourcing has increased and hence increased employmentin related sectors, marine equipment in particular.
17.1 Growth sectors
This study has identified five particularly strong growth sectors; offshore and coastal windenergy, cruise tourism, coastal tourism, recreational boating and maritime works. TheEuropean Wind Energy Association has estimated that the total employment relating tomanufacturing, installation and operation and maintenance of wind turbines is expected toincrease from 72,275 in 2002 to 196,900 by 2020. This represents more than a doubling ofemployment in the wind energy sector compared to 2002. This is partly explained by theprojections of increases in offshore capacity (from current 2% of total capacity to 40% by2020).
The recreational boating sector is expected to grow by 5-6% annually in the short andmedium term future. The projected growth can partly be attributed to the fact that the "babyboomer" generation is reaching retirement age, there is increasing wealth among people intheir middle age and more importantly there is huge potential in the emerging economies.
In 2004 the total number of passengers in the Western Europe cruise market grew by 5%in comparison to 2003. In the future, cruise ship operations are expected to continue toexpand through an increase in cruise ships and investment into the capacity of theWestern European market. The demographic trend of an ageing population is expected tofurther reinforce this trend.
Coastal tourism is still seen as a growth sector even though some regions are expected toreach their optimum level of development in the upcoming years. The WTO has forecast along-term trend of 3% growth to apply to the European tourism sector until 2020 and thecalculations of the WTTC expected increases of up to 17.9% in employment by 2016 II.
The industry representatives of the dredging industry have forecast an overall increase indredging activity - with a growth rate of 10% to 15% for the upcoming decade. The impacton employment is likely to be a slightly less limited (a growth rate of 5% has been
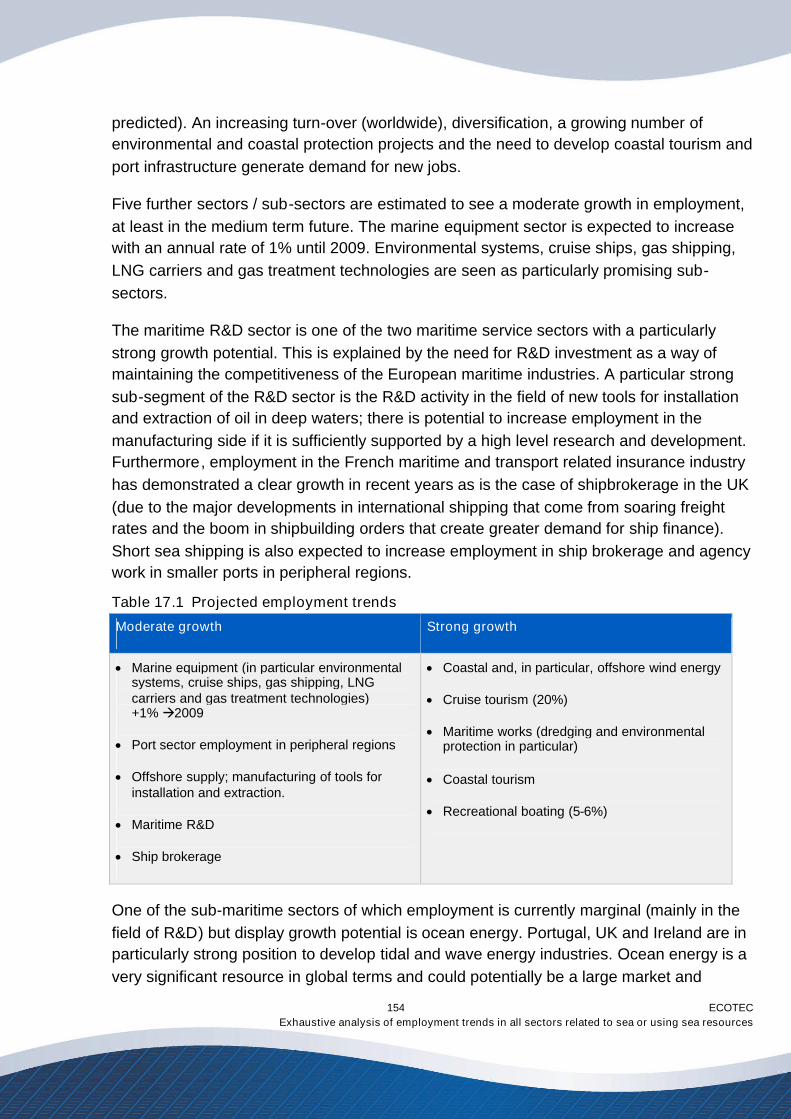
ECOTECExhaustive analysis of employment trends in all sectors related to sea or using sea resources
154
predicted). An increasing turn-over (worldwide), diversification, a growing number ofenvironmental and coastal protection projects and the need to develop coastal tourism andport infrastructure generate demand for new jobs.
Five further sectors / sub-sectors are estimated to see a moderate growth in employment,at least in the medium term future. The marine equipment sector is expected to increasewith an annual rate of 1% until 2009. Environmental systems, cruise ships, gas shipping,LNG carriers and gas treatment technologies are seen as particularly promising sub-sectors.
The maritime R&D sector is one of the two maritime service sectors with a particularlystrong growth potential. This is explained by the need for R&D investment as a way ofmaintaining the competitiveness of the European maritime industries. A particular strongsub-segment of the R&D sector is the R&D activity in the field of new tools for installationand extraction of oil in deep waters; there is potential to increase employment in themanufacturing side if it is sufficiently supported by a high level research and development.Furthermore, employment in the French maritime and transport related insurance industryhas demonstrated a clear growth in recent years as is the case of shipbrokerage in the UK(due to the major developments in international shipping that come from soaring freightrates and the boom in shipbuilding orders that create greater demand for ship finance).Short sea shipping is also expected to increase employment in ship brokerage and agencywork in smaller ports in peripheral regions.
Table 17.1 Projected employment trends
Moderate growth Strong growth
Marine equipment (in particular environmentalsystems, cruise ships, gas shipping, LNGcarriers and gas treatment technologies)+1%2009
Port sector employment in peripheral regions
Offshore supply; manufacturing of tools forinstallation and extraction.
Maritime R&D
Ship brokerage
Coastal and, in particular, offshore wind energy
Cruise tourism (20%)
Maritime works (dredging and environmentalprotection in particular)
Coastal tourism
Recreational boating (5-6%)
One of the sub-maritime sectors of which employment is currently marginal (mainly in thefield of R&D) but display growth potential is ocean energy. Portugal, UK and Ireland are inparticularly strong position to develop tidal and wave energy industries. Ocean energy is avery significant resource in global terms and could potentially be a large market and
ECOTECExhaustive analysis of employment trends in all sectors related to sea or using sea resources
155
employment generating sector in some European countries. The Irish stakeholders havefor example identified that ocean energy sectors could have a desirable regional effect inthe sense that these energy sources could induce employment development in the moreperipheral regions of the country. They have also identified that the technology to buildfunctional wave converters is developing rapidly but the opportunity for Europe to gain alead remains - as no one proven formula for this sector has been found yet. Ireland is,academically, well represented at the cutting edge of wave and tidal technology due to thetechnical competence of several universities and their participation in projects with otherinternational participants. Furthermore, because of the direction of prevailing winds andthe size of the Atlantic Ocean, North Western Europe, including Ireland, has one of thelargest wave energy resources in the world.
Countries with a strong background in the development of technology for coastal andoffshore wind energy could also potentially be in a strong position to develop this sectoras, for example, the installation skills broadly similar to those needed in the offshore windenergy industry.
17.2 Policy action
The diversity of the factors affecting the many sea related sectors means that policyactions utilise their economic and employment growth potential need to be manifold andinterlinked in order to be successful. Policy recommendations regarding specific sectorsare included in the sectoral chapters of this report and will not be reiterated here. The mainaim of this section is to focus on policy recommendations which are largely valid forseveral or all the sectors covered by this study. They relate to maritime, transport, energy,R&D, employment and competition policy.
Transport policyTransport policy has a critical role to play in the future of sea related transport andassociated sectors. It is widely recognised by policy makers and stakeholders that theglobalisation of manufacturing and trade, as well as increasing congestion on Europeanroad networks and the desire to reduce emissions from road transport are all combining torequire improvements in the ports infrastructure and its transport interlinkages. Existingbottlenecks in ports and inland shipping routes, as well as the inadequate connection ofmany ports with other transport links must be addressed in order to exploit the economicpotential of the shipping and ports sector and its associated industries.
Energy policyThe development of energy technologies linked to the sea depends to a significant extent,on EU energy policy. EU legislation aimed at liberalising gas and electricity markets, as
ECOTECExhaustive analysis of employment trends in all sectors related to sea or using sea resources
156
well as other relevant legislation including that on the promotion of renewables and thelimitation of CO2 emissions has an impact on investments and the utilisation of differentforms of electricity generation and gas exploitation. In particular, it is seen to have boostedthe development and utilisation – and therefore associated employment in - renewabletechnology including wind energy. Although wind turbines can be located anywhere, muchof the capacity is located in coastal areas and offshore. It is the latter technology whichhas seen a particular growth in recent years. The future of coastal and off-shore energyproduction is also strongly links to investment and co-operation in the field of research anddevelopment.
R&D policyThe review of the Lisbon strategy emphasised the need to invest more in research anddevelopment, as well as encouraging European and international co-operation in this field.This applies to private and as well as public sector investment. Despite the difficultiesassociated with competitor status among many private companies in Europe on thetechnology intensive sea related sectors (shipbuilding, maritime equipment, maritime R&Damong others) co-operation in the area of research and development has increased inrecent years, not least because of the increasing globalisation of ownership structures inthis sector. The role of the EU is to boost such public and private sector co-operation andthe interlinkages between academic and private sector research through its systems ofR&D grants. The 7th EU Framework programme for Research and TechnologicalDevelopment (FP7) declares that special attention will be paid to priority scientific areaswhich cut across themes, including marine related sciences. However, FP7 is only a smallpart of investment in R&D in this area and it is therefore important for national efforts tobecome more co-ordinated to avoid duplication and create synergies. Examples ofeffective co-operation already exist, for example in WATERBORNE. Experience from suchprogrammes should be exploited to work towards establishing a European marineresearch network for the regular exchange and co-operation on relevant R&D projects.
In relation to investment in R&D the importance of legislating for – and the observance ofEuropean intellectual property rights is highly significant if Europe’s competitive position onthe global market is to be bolstered and expanded.
Regional policyRegional policy and the emphasis on territorial cohesion play an important role in theexploitation of the growth potential of sea related sectors. Experience shows that manyEuropean coastal areas have traditionally been heavily reliant on one or the other searelated sector (e.g. either mostly tourism or mostly shipbuilding and ports), while possiblelinks between the different sectors have not historically been exploited. This means that adownturn in one sector can have a significant and overwhelming effect on a particular
ECOTECExhaustive analysis of employment trends in all sectors related to sea or using sea resources
157
locality (as demonstrated in the case study of Nakskov in the full report). Europeanstructural funds combined with national, regional and local measures have an importantrole to play in seeking to revive and diversity areas affected by the decline in certainmaritime industries.
Employment policyAcross all economic sectors and countries there is an increasing recognition that securityin employment is less and less related to job security, but that instead more emphasisneeds to be placed on employment security. The approach to “flexicurity” being developedby the European Commission recognises the need to link appropriate employmentprotection with measures to encourage employability and adaptability through anemphasis on core and transferable skills and lifelong learningIII. The social partners as wellas national policy makers are called upon in devising employment regulation, training,active labour market policy and social protection services which encourage this form ofemployability and adaptability, as well as ensuring that working conditions are sufficientlyattractive and flexible to meet both the needs of employers and employees. Although thisis clearly a difficult balancing act which must take into account national and sectoralspecificities and requirements, it is clear that in many of the sea related sectors, a betteraccommodation in this area is yet to be achieved to ensure adequate recruitment andretention while being adaptable to the challenges facing the sectors. A significant amountof good practice is already available in this area which needs to be evaluated anddisseminated more systematically.
In order to encourage recruitment and retention in sectors which have suffered from poorimage, it is important to promote a career for life approach in the maritime cluster,emphasising skill links between sectors and transferable skills. Training curricula thereforehave to be revised. The role of the social partners in this area as crucial as they shouldinform the content of training on the basis of the latest requirements of the sector. Someefforts have already been made to map skill requirements and career paths – particularlyfor former seafarers, but this should be expanded to cover all sectors. Links between suchactivities and the proposals for a European Qualifications Framework should beestablished to ensure not only sectoral but also geographical mobility.
At the same time, poor image must also be addressed through the provision of adequateliving and working conditions, particularly for seafarers. Ratification of the ConsolidatedMaritime Labour Convention, adopted by the ILO in February 2006 is crucial in thisrespect. The Commission intends to present a Communication on minimum maritimelabour standards addressing the implementation of the ILO consolidated Convention withinthe framework of community law. The social partners in the sector have an important roleto play in this process.
ECOTECExhaustive analysis of employment trends in all sectors related to sea or using sea resources
158
Competition policy as well as the application of international rulesEuropean Union as well as international (e.g. WTO) competition policies are, at leastnominally, based on the desire to create a level playing field for intra-EU and internationaltrade. This principle also underlies more recent policy approaches in relation to theavailability and application of state aid regimes. While these approaches have led to aphasing out of state aids for sectors such as shipbuilding, these is significant criticism overthe perceived lack of application of such rules by a number of global competitors, which isseen to act to the disadvantage of European companies. For examples, concerns aboutstate subsidies to Korean shipyards have been brought to the attention of the WTO but sofar remain unresolved. Even more complex are the difficulties posed by the application ofdifferent rules to different flag carriers and individuals from different nationalities employedin the shipping industry. Efforts by the European Commission to seek to address this issue(at least in relation to a sub-section of the sector) incorporated in the 1998 ManningDirectiveIV failed to find approval in Council and the Directive was eventually withdrawn in2004. The social partners were equally unable to reach agreement on a measure aimed atsetting minimum standards for personnel working on board intra-EU ferries, withemployers fearing retaliatory protectionist measures and a further flagging out of theEuropean fleet. At the same time International Labour Standards applying to work onboard ship are insufficient and not universally implemented.
The lack of comprehensive regulation and force behind the implementation of internationalagreements in relation to competition and labour standards is having an undeniable impacton the economic viability of a number of European sea related sectors and affectemployment opportunities for European seafarers contributing to the poor image of anumber of sectors and associated recruitment difficulties (see also above) and skillshortages in the wider sea related sectors relying on the availability of these skills.
Maritime policyWhile it might rightly be considered that a consideration of maritime policy should comefirst in an assessment of policy actions necessary to boost the growth potential of the searelated sectors, this is deliberately placed last here, as it will be argued that it is a holisticmaritime policy which is best placed to assemble all the different policy strands outlinedabove and to combine them in a policy mix suitable to benefit employment in the relevantsectors.
This is indeed the approach taken by the European Commission in its recent Green Paperon Maritime Policy. The role of the EU in this area should be to set policy holisticintegrated policy guidelines which can be monitored on a regulation and can lead to thecollection and active exchange of good practice or existing integrated or indeed particularlyrelevant or transferable sectoral approaches.
ECOTECExhaustive analysis of employment trends in all sectors related to sea or using sea resources
159
18.0 Conclusions
This study has demonstrated that maritime and sea related sectors are crucial to theeconomic prosperity of the European Union and provide employment for a total of 5 millionindividuals. Employment in traditional maritime sectorsV in the EU-25 amounts to 1.9million. The exploitation of the growth potential of these sectors is therefore critical to thesuccess of the Lisbon strategy. A holistic policy approach, strategically combiningmaritime, employment, regional R&D, energy, environment and transport policies isrequired to fully exploit this economic and employment creation potential in a sustainableway. This section outlines some of the key conclusions:
Data availability
This study has shown that the EU countries are currently lacking a systematic and on-going methodology for data collection, and the definitions of different maritime sectors inthe EU are not uniform. Indeed, the definitions vary from source to source, from country tocountry, even from region to region and often the definitions are not available. These leadinto differences in the way in which different countries define direct employment and it alsoresults in difficulties in comparing and collating data for a European level analysis.
The situation is made worse by the overall lack of comparable data as the statisticsgathered by the national statistical offices are only available for the fisheries sector, withdata largely lacking for other maritime sectors. Industry data, from sector representativeorganisations, is therefore often regarded as the most reliable information. However, thisapproach relies on voluntary contributions from these organisations. Also some tradeorganisations are much more systematic in gathering information on the number of jobsthan others. Furthermore, some consider this data to be commercially sensitive and do notwish to disclose workforce data. In order to improve our knowledge and monitoring ofemployment developments in the sectors, the availability of comparable employment datamust be improved in discussions between Eurostat and the national statistical offices.
With reference to statistics, this study also found that the range of definitions for indirectemployment of different sea related sectors is even greater than for direct employment.Furthermore, indirect employment of an individual maritime sector often encompassesmost other sea related sectors. Consequently an assessment of indirect employment inthe maritime cluster was not seen to be appropriate due to the potential of ‘doublecounting’.
ECOTECExhaustive analysis of employment trends in all sectors related to sea or using sea resources
160
Promotion of maritime cluster approach
The maritime cluster approach, which is particularly advanced in the Netherlands andpromoted further through the Maritime Industries Forum, should be taken further both atEuropean and Member State levels as it has the potential to give more political impetus toimportant questions concerning the maritime industries, and such approach also has thepotential to help in maintaining maritime networks. Networks between different industriesin the maritime sector can be a vital asset for the whole cluster by helping to facilitate co-operation for the sake of the wider cluster in Europe. Co-operation can take place, forexample, on joint research projects, marketing and procurement activities and trainingcourses or establishments.
The cluster approach can also give the sea related cluster a better defined concept andscale and therefore the promotion of this concept also has the potential of improvingemployment data collection in this cluster. Such activity also fosters collaboration andnetworking between companies in the core maritime sectors and helps them to recognisetheir shared maritime interests.
Endorsement of global regulations
The maritime sectors, maybe more than any others, clearly operate in an internationalenvironment facing global competitive forces. It is therefore particularly important to fosteran international level playing field in areas such as competition policy and employmentconditions. There is a need to ensure that existing legal and policy frameworks arerespected and enforced to avoid unfair competition from low wage countries. This involvesthe development, ratification, implementation and policing of WTO, ILO and other rules forexample in relation to state aids and working conditions of seafarers.
Human resources
The availability of skilled human resources is at the very core of economic growth andemployment in the maritime cluster – more and more of the maritime activities havebecome "knowledge dependant". Therefore, access to high quality maritime education andtraining should be high on national and local agendas. European level co-operation is alsoadvisable, particularly in niche sectors. There is also a need to encourage industry andmaritime cluster organisations to develop functioning partnerships with training andeducation institutes in order to create maritime education system that is reflective andadaptable to new emerging skill needs.
Indeed, as already mentioned, the maritime and sea related sectors can only besustainable with a constant supply of EU workers training and skilled in the related
ECOTECExhaustive analysis of employment trends in all sectors related to sea or using sea resources
161
occupational profiles, and in particular seafarers. It is widely acknowledged thatrecruitment and retention in shipping as well as in shipbuilding is detrimentally affected bythe image of the sectors as being in decline and suffering from poor working conditions. Aswell as initiating campaigns to improve the image of these sectors it is therefore crucial toaddress regulatory issues, working conditions, work organisation, and training.
For example, it must be explored whether the exclusion of the maritime sector fromEuropean labour and social legislation is still appropriate. This is a complex area, mademore difficult for example by the differential application of rules regarding workingconditions to different categories of workers. And the question whether to apply flag state,home or residence conditions to the employment of seafarers needs to be addressed inthe context of sustaining a competitive European shipping fleet. The ratification of the 2006ILO Consolidated Maritime Convention and the planned Commission communication onthe employment conditions of seafarers should contribute to the resolution of these issues.
In addition, a new approach should be promoted to training in the maritime sector which onone hand ensures the close involvement of social partners to ensure that curricula are upto date with the requirements of modern workplaces but also to create routes to a"maritime career path" ensuring internal as well as external mobility for workers in thesector: for example it is widely recognised that the expertise and experience of seafarers isvital for many shore based maritime sectors. The social partners have an important role toplay in this debate and existing efforts should be built upon and good practice exchanged.
With reference to cyclical industries like shipbuilding, employment pool schemes canfunction as a solution to the problems caused by fluctuations in employment. There is alsoa need to give consideration to establishing training frameworks in the maritime sectors,which emphasise transferable skills as well as sector specific skills. This work could beginby conducting a study to cover commonalities in skill requirements and potentialoverlap/transferability. A good example of this approach is the study on “Mapping careerpaths in the maritime industries” commissioned by ECSA and ETF sought to make acontribution to providing career maps, with particular reference to seafarers.
Learning from the best
There is a need to “learn from the best” by studying the business practices of Europeancompanies successfully competing on the world market (particularly SMEs). This cancontribute to the development of sector specific business tools. Our study has shown thatcompanies successful in developing a market beyond their national borders are more likelybe sustainable in the long term. The exchange of business know-how, as well as R&D andinnovation development and networking can make a significant contribution to thesustainability of EU level employment.
ECOTECExhaustive analysis of employment trends in all sectors related to sea or using sea resources
162
Exploitation of existing financing opportunities
Member States are also encouraged to make best possible use of financing opportunitiesoffered by the European Commission regimes and funding programmes. This refers, forexample, to the use of State Aid Guidelines on employment, education and training in theshipping sector and to the opportunities offered by Leonardo da Vinci programme oneducation and training.
Importance of traditional maritime industries
There is a need to recognise the importance of the coastal tourism sector and itsrelevance in relation to revenue generation and labour market potential, but at the sametime must not loose sight of the challenges and requirements facing the "traditional"maritime sectors as there is a national and European interest in retaining a strongpresence in these areas to underpin standards and ensure investment in innovation andenvironmentally friendly technologies.
Partnership for policy
For the management of change in maritime industries and wider policy planning for themaritime industries the involvement of the social partners and other key stakeholders indecision making is crucial. This serves to exploit the information and experience of eachorganisation, as well as enabling the creation of maximum buy-in to suggested policysolutions.
Role of EU
Policy actions must be taken at the appropriate level and should involve all keystakeholders in consultation as well as their implementation. The role of the EU could befourfold: to act where desired outcomes cannot be achieved by member states acting
independently (i.e. in terms of regulation or policy co-ordination) to encourage the involvement of all stakeholders to provide strategic funding to support key priorities to set strategic guidelines for holistic maritime policy and to monitor their
implementation, as well as encouraging the exchange of good practice.
Furthermore, on the whole, awareness should be raised of the importance of sea relatedsectors in terms of employment and the possibility of a career in the relevant sectors. TheEU also has an important role to play in providing and encouraging greater investment inmarine R&D in order to ensure Europe remains competitive in high value added and
ECOTECExhaustive analysis of employment trends in all sectors related to sea or using sea resources
163
innovative maritime sectors. The 7th Framework Research Programme provides fundingopportunities in this area, but greater efforts must also be made to co-ordinate nationalresearch efforts to avoid duplication and encourage synergies. The setting up of aEuropean network of marine research should therefore be considered. Greaterinvestments in R&D must go hand in hand with efforts to protect European intellectualproperty rights. It is also essential to ensure longer-term commitment on financing ofresearch and development institutions in the maritime cluster in order to ensure constant,high quality developments.
An integrated transport policy is required to realise the potential for expansion in long andshort sea shipping. This relates to investments in port capacity as well as interlinkageswith the inland waterway, road and rail network. Investment in this area will act as acatalyst for growth in the shipbuilding, marine equipment and other sectors.
The possibility of regional policy and existing European regional funding must be fullyutilised to ensure the diversification of coastal areas, making them less dependent on asingle maritime sector. The exchange of good practice in local employment creation inthese areas should be more actively encouraged.
Finally, energy policy, environmental policy and R&D policy must be interlinked to ensurethat the growth potential of renewable energy linked to the sea and coastal areas can befully exploited.


![MatthiasHamann FabianHundertmark FachbereichMathematik ...epub.sub.uni-hamburg.de/epub/volltexte/2010/5532/pdf/1004.5273v1.pdf · and Kr¨on [8] and used before in [16, 17, 18]. A](https://img.pdfslide.us/doc/110x75/5e09abbd0c063625687e7504/matthiashamann-fabianhundertmark-fachbereichmathematik-epubsubuni-and-kron.jpg)