Embed Size (px)
Citation preview

Basic Departmental Data
2004

Basic Departmental Data
2 0 0 4


Basic Departmental Data
- 2 0 0 4 -
First Nations and Northern Statistics Section Corporate Information Management Directorate
Information Management Branch
Department of Indian Affairs and Northern Development
December 2005

Published under the authority of the Minister of Indian Affairs and Northern Development Ottawa, 2004 www.ainc-inac.gc.ca 1-800-567-9604 TTY only 1-866-553-0554 QS-3625-040-EE-A1 Catalogue No. R12-7/2003E ISBN 0-662-39941-2 © Minister of Public Works and Government Services Canada Cette publication peut aussi être obtenue en français sous le titre: Données ministérielles de base 2004

TABLE OF CONTENTS ACKNOWLEDGEMENTS .............................................................................................................. i NOTE TO USERS.......................................................................................................................... i INTRODUCTION........................................................................................................................... ii SECTION 1 – DEMOGRAPHICS
1.1 Registered Indian Population ................................................................................2 1.2 Population Projections...........................................................................................4 1.3 Bill C-31 Population ...............................................................................................6 1.4 On and Off-Reserve Registered Indian Population ...............................................8 1.5 Registered Indian Population by Region .............................................................10 1.6 On-Reserve Population by Region ......................................................................12 1.7 Off-Reserve Population by Region ......................................................................14 1.8 On-Reserve Population by Geographic Zones....................................................16 1.9 On-Reserve Population by Geographic Zones and by Region............................18 1.10 Population Distribution by Age and Gender ........................................................20
SECTION 2 – HEALTH
2.1 Life Expectancy ...................................................................................................24 2.2 Potential Years of Life Lost .................................................................................26 2.3 Tuberculosis ........................................................................................................28 2.4 Infant Mortality Rates...........................................................................................30 2.5 Fire Deaths and Injuries ......................................................................................32
SECTION 3 – EDUCATION
3.1 Enrolment for Elementary/Secondary Schools....................................................36 3.2 Enrolment in Provincial and First Nation Managed Schools by Grade..............................................................................................................38 3.3 Enrolment in Provincial and First Nation Managed Schools by Grade by Year ................................................................................................40 3.4 Enrolment in Provincial and First Nation Managed Schools................................42 3.5 On-Reserve Registered Indian Enrolment Rate ..................................................44 3.6 High School Graduates .......................................................................................46 3.7 First Nation Managed Schools ............................................................................48 3.8 Classrooms in First Nation Managed Schools.....................................................50 3.9 Post-Secondary Enrolment..................................................................................52 3.10 Post-Secondary Education Attainment................................................................54 3.11 Post-Secondary Education Graduates ................................................................56
SECTION 4 – SOCIAL CONDITIONS
4.1 Children in Care...................................................................................................60 4.2 Adults in Institutional Care...................................................................................62 4.3 Income Assistance Recipients and Beneficiaries ................................................64 4.4 Income Assistance Program................................................................................66

TABLE OF CONTENTS (continued) SECTION 5 – HOUSING
5.1 On-Reserve Dwellings.........................................................................................70 5.2 On-Reserve Dwellings/Infrastructure...................................................................72 5.3 On-Reserve Dwellings/Infrastructure/Water and Sewage ...................................74
SECTION 6 – SELF-GOVERNMENT
6.1 Self-Government Negotiations ............................................................................78 6.2 Devolution............................................................................................................80
SECTION 7 – THE NORTH
7.1 Population in the North ........................................................................................84 7.2 Population Projections in the North .....................................................................86 7.3 Infant Mortality in the North .................................................................................88 7.4 Aboriginal Identity Population in the North ..........................................................90 7.5 Employment in the North .....................................................................................92 7.6 Employment Income in the North ........................................................................94
SECTION 8 – ADDITIONAL TOPICS
8.1 Lands .................................................................................................................98 8.2 Environment ......................................................................................................100 8.3 Treaties..............................................................................................................101 8.4 Comprehensive Claims .....................................................................................118 8.5 Specific Claims ..................................................................................................120 8.6 Community Economic Development Organizations (CEDOs)...........................121
GLOSSARY................................................................................................................... 124

Basic Departmental Data 2004 CIMD, IMB December 2005 QS-3625-040-EE-A1 i
ACKNOWLEDGEMENTS The principal author of this version of Basic Departmental Data is Christiane Gour. This publication was prepared under the direction of Pierre Gauvin, Manager, First Nations and Northern Statistics Section, Corporate Information Management Directorate. Technical and editorial support was provided by colleagues in the Corporate Information Management Directorate and by organizations both inside and outside the Department of Indian Affairs and Northern Development.
NOTE TO USERS Most of the data found in this publication are based on departmental administrative databases. Population counts are taken from the Indian Register and reflect a reporting date of December 31 of any given year. Finally, the user is cautioned that data may be different from previously reported editions, as a result of edit reviews of historical data. Also, numbers may differ slightly from previous releases due to the availability of more current program data or departmental revisions. "Revised" will be indicated at the top of all pages where tables contain revisions to an historical series. Data in the chapter entitled The North pertain to the total population (Aboriginal and non-Aboriginal) unless otherwise indicated. Statistics for this report are derived primarily from departmental administrative data sources.

ii Basic Departmental Data 2004 CIMD, IMB December 2005 QS-3625-040-EE-A1
INTRODUCTION Basic Departmental Data (BDD) provides a comprehensive portrait of the demographic, social and economic conditions of all Registered Indians and Northerners. Essentially descriptive, BDD has tried to maintain continuity with past events while providing an accurate portrait of the changing circumstances of First Nations and Northerners. Subjects covered in BDD include population, health, education, social conditions, and housing. For each subject area, information is presented in textual, graphic and tabular formats. Each page contains highlights pertaining to the tabular and graphical information, and notes and sources are indicated at the bottom of each table. The Glossary includes definitions of basic terms used throughout the publication. It is important to note in this publication, the word "Indian" means a Registered Indian. A person with status within the meaning of the Indian Act, whose name appears on the Indian Register as maintained by INAC, is a Registered Indian. In June 1985, amendments to the Indian Act were passed by Parliament. These changes, known as the Bill C-31 amendments, restore Indian status and membership rights to individuals and their children who had been enfranchised because of certain clauses contained in the Indian Act. In 2003, Registered Indians were affiliated with one of the 614 First Nations located across Canada.

SECTION 1
DEMOGRAPHICS

Section 1 – Demographics
2 Basic Departmental Data 2004 CIMD, IMB December 2005 QS-3625-040-EE-A1
1.1 Registered Indian Population
Figure1.1 Percentage Change in Registered Indian Population, Canada, 1981 to 2003
Highlights Fluctuation of the Registered Indian population has been considerable, largely due to the 1985 amendment to the Indian Act although it has been relatively stable in the last four years The 1985 amendment, (Bill C-31), is reflected in the graph, with the percentage change nearly quadrupling in size.
0
1
2
3
4
5
6
7
8
9
1981 1983 1985 1987 1989 1991 1993 1995 1997 1999 2001 2003
Year
Annu
al in
crea
se (%
)

Section 1 – Demographics
Basic Departmental Data 2004 CIMD, IMB December 2005 QS-3625-040-EE-A1
3
Table 1.1 Percentage Change in Registered Indian Population by Gender, Canada, 1979 to 2003
Source: 1979-2003 Indian Register, INAC
Year Population % Change Population % Change Population % Change1979 156,336 - 153,252 - 309,588 - 1980 159,740 2.2 156,997 2.4 316,737 2.31981 162,968 2.0 160,814 2.4 323,782 2.21982 166,865 2.4 165,313 2.8 332,178 2.61983 171,510 2.8 170,458 3.1 341,968 2.91984 174,801 1.9 174,008 2.1 348,809 2.01985 179,959 3.0 180,282 3.6 360,241 3.31986 191,640 6.5 196,189 8.8 387,829 7.71987 204,226 6.6 211,672 7.9 415,898 7.21988 217,053 6.3 226,831 7.2 443,884 6.71989 227,942 5.0 238,395 5.1 466,337 5.11990 239,764 5.2 250,414 5.0 490,178 5.11991 250,371 4.4 261,420 4.4 511,791 4.41992 260,944 4.2 272,517 4.2 533,461 4.21993 270,790 3.8 282,526 3.7 553,316 3.71994 280,742 3.7 292,915 3.7 573,657 3.71995 290,175 3.4 302,875 3.4 593,050 3.41996 299,040 3.1 311,834 3.0 610,874 3.01997 307,211 2.7 320,224 2.7 627,435 2.71998 314,577 2.4 327,837 2.4 642,414 2.41999 323,140 2.7 336,750 2.7 659,890 2.72000 330,883 2.4 344,616 2.3 675,499 2.42001 338,208 2.2 351,893 2.1 690,101 2.22002 345,409 2.1 359,442 2.1 704,851 2.12003 352,631 2.1 366,865 2.1 719,496 2.1
Male Female Total

Section 1 – Demographics
4 Basic Departmental Data 2004 CIMD, IMB December 2005 QS-3625-040-EE-A1
1.2 Population Projections
Figure 1.2: On and Off-Reserve Registered Indian Population by Residence, Canada 2001, 2006, 2011, 2016, and 2021
Highlights The total Registered Indian population could increase by 34%, from approximately 703,800 in 2001 to slightly less than 940,000 in 2021. Over the same period, the on-reserve population could grow quite substantially if the migration assumption (net inflow to reserves) proves correct over time. The proportion of Registered Indians living on reserve could increase from an estimated 60% in 2001 to 75% in 2021. Conversely, the off-reserve proportion and corresponding five-year annual growth rates could decline during the period.
0
10
20
30
40
50
60
70
80
90
100
2001 2006 2011 2016 2021
Year
On Reserve Off Reserve
Section 1 – Demographics
Basic Departmental Data 2004 CIMD, IMB December 2005 QS-3625-040-EE-A1
5
Table 1.2: On and Off-reserve Registered Indian Population by Residence, Canada 2001, 2006, 2011, 2016, and 2021
Notes: 1. Numbers rounded to nearest 100. Average annual growth rate (AAGR) and percentage distributions calculated on unrounded data. 2. Projections based on the December 31, 2000 Indian Register population adjusted for the late and under reporting. Source: Population Projections of Registered Indians, 2001-2021, INAC, 2004.
Year No. % AAGR (%) No. % AAGR (%) No. AAGR (%)
2001 419,800 59.6 - 284,000 40.4 - 703,800 -
2006 485,400 63.1 2.9 284,000 36.9 0 769,400 1.8
2011 556,100 66.9 2.8 275,400 33.1 -0.6 831,500 1.6
2016 629,200 70.8 2.5 259,200 29.2 -1.2 888,400 1.3
2021 703,200 74.8 2.2 236,500 25.2 -1.8 939,700 1.1
On Reserve Total Registered IndiansOff Reserve

Section 1 – Demographics
6 Basic Departmental Data 2004 CIMD, IMB December 2005 QS-3625-040-EE-A1
1.3 Bill C-31 Population
Figure 1.3 Percentage Change in Registered Indian and Bill C-31 Population, Canada, 1991 to 2003
Highlights As of December 31, 2003 a total of 113,354 Registered Indians were registered based upon Bill C-31 amendments to the Indian Act. Bill C-31 registrants made up 16% of the Indian Register in 2003. Year over year growth of the Bill C-31 population has fallen from 48% in 1988 to 0.1% in 2003.
0
2
4
6
8
10
12
1991 1993 1995 1997 1999 2001 2003
Y ear
Annu
al g
row
th (%
)
T o ta l R eg is te red Ind ians B ill C -31

Section 1 – Demographics
Basic Departmental Data 2004 CIMD, IMB December 2005 QS-3625-040-EE-A1
7
Table 1.3 Percentage Change in Registered Indian and Bill C-31 Population, Canada, 1985 to 2003
Note: The slow growth rate of the Bill C-31 population between 1997 and 1998 is partly due to a backlog of files which were cleaned-up in 1999. Sources: 1985-2003 Indian Register, INAC. 1985-2003 Membership and Entitlement, INAC.
Year No. % Change No. % Change No. % Change
1985 360,241 - - - 358,636 -
1986 387,829 7.7 16,252 - 369,972 3.2
1987 415,898 7.2 37,056 128.0 378,842 2.4
1988 443,884 6.7 54,774 47.8 389,110 2.7
1989 466,337 5.1 66,904 22.1 399,433 2.7
1990 490,178 5.1 73,990 10.6 416,188 4.2
1991 511,791 4.4 79,639 7.6 432,152 3.8
1992 533,461 4.2 85,947 7.9 447,514 3.6
1993 553,316 3.7 91,439 6.4 461,877 3.2
1994 573,657 3.7 96,148 5.1 477,509 3.4
1995 593,050 3.4 100,958 5.0 492,092 3.1
1996 610,874 3.0 104,869 3.9 506,005 2.8
1997 627,435 2.7 107,577 2.6 519,858 2.7
1998 642,414 2.4 108,924 1.3 533,490 2.6
1999 659,890 2.7 109,913 0.9 549,977 3.1
2000 675,499 2.4 111,476 1.4 564,023 2.6
2001 690,101 2.2 112,306 0.7 577,795 2.4
2002 704,851 2.1 113,254 0.8 591,597 2.42003 719,496 2.1 113,354 0.1 606,142 2.5
Total Registered Indians Bill C-31 Non-Bill C-31

Section 1 – Demographics
8 Basic Departmental Data 2004 CIMD, IMB December 2005 QS-3625-040-EE-A1
1.4 On and Off-reserve Registered Indian Population
Figure 1.4 On and Off-Reserve Registered Indian Population, 1983, 1988, 1993, 1998, and 2003
Highlight Since 1993, the on-reserve and off-reserve distribution of the Registered Indian population has fluctuated only slightly.
0
10
20
30
40
50
60
70
80
90
100
1983 1988 1993 1998 2003
Year
Prop
ortio
n of
tota
l pop
ulat
ion
(%)
On Reserve Off Reserve

Section 1 – Demographics
Basic Departmental Data 2004 CIMD, IMB December 2005 QS-3625-040-EE-A1
9
Table 1.4 On and Off-Reserve Registered Indian Population by Gender, 1983, 1988, 1993, 1998, and 2003
Source: 1983-2003 Indian Register, INAC.
No. % No. % No. %1983 Total 243,556 71.2 98,412 28.8 341,968 100.0
Male 125,003 36.6 46,507 13.6 171,510 50.2Female 118,553 34.7 51,905 15.2 170,458 49.8
1988 Total 273,766 61.7 170,118 38.3 443,884 100.0Male 140,248 31.6 76,805 17.3 217,053 48.9
Female 133,518 30.1 93,313 21.0 226,831 51.11993 Total 326,444 59.0 226,872 41.0 553,316 100.0
Male 166,825 30.2 103,965 18.8 270,790 48.9Female 159,619 28.8 122,907 22.2 282,526 51.1
1998 Total 375,727 58.5 266,687 41.5 642,414 100.0Male 191,573 29.8 123,004 19.1 314,577 49.0
Female 184,154 28.7 143,683 22.4 327,837 51.02003 Total 409,671 56.9 309,825 43.1 719,496 100.0
Male 208,635 29.0 143,996 20.0 352,631 49.0Female 201,036 27.9 165,829 23.0 366,865 51.0
Year TotalOn Reserve Off Reserve

Section 1 – Demographics
10 Basic Departmental Data 2004 CIMD, IMB December 2005 QS-3625-040-EE-A1
1.5 Registered Indian Population by Region
Figure 1.5 Registered Indian Population by Region, 1983 to 2003
Highlights The total Registered Indian population has more than doubled in nearly all regions over the last 20 years. In 2003, roughly 23% of the Registered Indian population was in Ontario.
0
20
40
60
80
100
120
140
160
Atlantic Quebec Ontario Manitoba Sask. Alberta B.C. Yukon N.W.T.
Region
Pop
ulat
ion
(in T
hous
ands
)
1983 1988 1993 1998 2003

Section 1 – Demographics
Basic Departmental Data 2004 CIMD, IMB December 2005 QS-3625-040-EE-A1
11
Table 1.5 Registered Indian Population by Region, 1983 to 2003
Source: 1983-2003 Indian Register, INAC.
Year Atlantic Quebec Ontario Manitoba Sask. Alberta B.C. Yukon N.W.T. Canada
1983 No. 12,816 33,911 73,349 51,376 53,445 42,248 60,811 3,536 8,476 339,968
% 3.8 10.0 21.6 15.1 15.7 12.4 17.9 1.0 2.5 100.0
1988 No. 17,711 44,111 101,612 64,315 68,246 55,290 77,153 5,510 9,936 443,884
% 4.0 9.9 22.9 14.5 15.4 12.5 17.4 1.2 2.2 100.0
1993 No. 21,524 54,273 125,743 84,020 85,413 68,639 94,006 6,807 12,891 553,316
% 3.9 9.8 22.7 15.2 15.4 12.4 17.0 1.2 2.3 100.0
1994 No. 22,380 55,848 130,149 88,161 88,857 71,297 96,808 6,948 13,209 573,657
% 3.9 9.7 22.7 15.4 15.5 12.4 16.9 1.2 2.3 100.0
1995 No. 23,225 57,223 134,160 91,565 92,325 74,123 99,720 7,088 13,621 593,050
% 3.9 9.6 22.6 15.4 15.6 12.5 16.8 1.2 2.3 100.0
1996 No. 23,959 58,640 138,518 95,113 94,953 76,419 102,075 7,199 13,998 610,874
% 3.9 9.6 22.7 15.6 15.5 12.5 16.7 1.2 2.3 100.0
1997 No. 24,610 59,881 142,408 98,197 97,776 78,495 104,411 7,330 14,327 627,435
% 3.9 9.5 22.7 15.7 15.6 12.5 16.6 1.2 2.3 100.0
1998 No. 25,186 61,026 146,113 100,527 100,719 80,390 106,370 7,433 14,650 642,414
% 3.9 9.5 22.7 15.6 15.7 12.5 16.6 1.2 2.3 100.0
1999 No. 25,835 62,291 150,236 104,099 103,414 82,699 108,723 7,531 15,062 659,890
% 3.9 9.4 22.8 15.8 15.7 12.5 16.5 1.1 2.3 100.0
2000 No. 26,397 63,315 153,946 107,146 106,111 85,373 110,529 7,633 15,049 675,499
% 3.9 9.4 22.8 15.9 15.7 12.6 16.4 1.1 2.2 100.0
2001 No. 26,991 64,404 157,062 109,788 108,801 87,703 112,305 7,751 15,296 690,101
% 3.9 9.3 22.8 15.9 15.8 12.7 16.3 1.1 2.2 100.0
2002 No. 28,819 65,496 159,107 112,430 111,635 89,812 114,120 7,846 15,586 704,851
% 4.1 9.3 22.6 16.0 15.8 12.7 16.2 1.1 2.2 100.0
2003 No. 29,709 66,504 161,718 115,339 114,248 92,060 116,136 7,927 15,855 719,496% 4.1 9.2 22.5 16.0 15.9 12.8 16.1 1.1 2.2 100.0

Section 1 – Demographics
12 Basic Departmental Data 2004 CIMD, IMB December 2005 QS-3625-040-EE-A1
1.6 On-Reserve Population by Region
Figure 1.6 On-Reserve Registered Indian Population by Region, 1983, 1988, 1993, 1998, and 2003
Highlights By region, the number of Registered Indians living on a reserve in 2003 ranged from a low of 3,932 in the Yukon to a high of 80,539 in Ontario. The largest on-reserve regional gains in absolute terms, between 1993 and 2003, were in Alberta and Manitoba respectively.
0
10
20
30
40
50
60
70
80
90
Atlantic Quebec Ontario Manitoba Sask. Alberta B.C. Yukon N.W.T.
Region
Pop
ulat
ion
(in th
ousa
nds)
1983 1988 1993 1998 2003

Section 1 – Demographics
Basic Departmental Data 2004 CIMD, IMB December 2005 QS-3625-040-EE-A1
13
Table 1.6 On-Reserve Registered Indian Population by Region, 1983 to 2003
Notes 1. On-reserve population includes Crown lands and settlements. 2. All percentages are based on regional totals shown in Table 1.5. Source: 1983-2003 Indian Register, INAC.
Year Atlantic Quebec Ontario Manitoba Sask. Alberta B.C. Yukon N.W.T. Canada
1983 No. 9,602 28,948 51,035 37,523 34,914 32,081 38,927 2,664 7,862 243,556
% 74.9 85.4 69.6 73.0 65.3 75.9 64.0 75.3 92.8 71.6
1988 No. 11,989 32,765 57,058 43,864 36,775 36,863 42,785 3,042 8,625 273,766
% 67.7 74.3 56.2 68.2 53.9 66.7 55.5 55.2 86.8 61.7
1993 No. 14,476 38,303 64,787 55,617 45,052 44,981 50,090 3,374 9,764 326,444
% 67.3 70.6 51.5 66.2 52.7 65.5 53.3 49.6 75.7 59.0
1994 No. 14,917 39,398 66,221 58,366 46,598 46,737 50,825 3,676 9,905 336,643
% 66.7 70.5 50.9 66.2 52.4 65.6 52.5 52.9 75.0 58.7
1995 No. 15,328 40,582 67,825 60,856 48,053 49,458 52,072 3,712 10,033 347,919
% 66.0 70.9 50.6 66.5 52.0 66.7 52.2 52.4 73.7 58.7
1996 No. 15,732 41,487 70,434 60,694 49,176 50,818 52,046 3,742 10,240 354,369
% 65.7 70.7 50.8 63.8 51.8 66.5 51.0 52.0 73.2 58.0
1997 No. 16,096 41,703 72,583 64,039 50,447 52,115 54,593 3,775 10,455 365,806
% 65.4 69.6 51.0 65.2 51.6 66.4 52.3 51.5 73.0 58.3
1998 No. 16,467 42,935 74,790 66,081 51,829 53,377 55,808 3,799 10,641 375,727
% 65.4 70.4 51.2 65.7 51.5 66.4 52.5 51.1 72.6 58.5
1999 No. 16,746 43,874 76,296 68,736 52,879 54,788 56,713 3,838 10,908 384,778
% 64.8 70.4 50.8 66.0 51.1 66.2 52.2 51.0 72.4 58.3
2000 No. 17,075 44,274 78,346 70,094 54,093 56,545 56,801 3,872 10,893 391,993
% 64.7 69.9 0.5 65.4 51.0 66.2 51.4 50.7 72.4 58.0
2001 No. 17,412 44,857 79,670 69,689 55,340 58,046 56,895 3,908 10,871 396,688
% 64.5 69.6 50.7 63.5 50.9 66.2 50.7 50.4 71.1 57.5
2002 No. 17,690 45,714 80,216 72,081 56,564 59,046 57,251 3,911 10,864 403,337
% 61.4 69.8 50.4 64.1 50.7 65.7 50.2 49.8 69.7 57.2
2003 No. 17,932 46,457 80,539 73,427 57,773 60,287 58,358 3,932 10,966 409,671% 60.4 69.9 49.8 63.7 50.6 65.5 50.2 49.6 69.2 56.9

Section 1 – Demographics
14 Basic Departmental Data 2004 CIMD, IMB December 2005 QS-3625-040-EE-A1
1.7 Off-Reserve Population By Region
Figure 1.7 Off-Reserve Registered Indian Population by Region, 1983 to 2003
Highlights The off-reserve population increased steadily between 1983 and 2003 from 98,412 to 309,825. The number of Registered Indians who live off reserve has increased in all regions. The largest percentage off-reserve regional gain south of 60° between 1993 and 2003 was Manitoba. Conversely, the off-reserve population of Quebec exhibited the lowest rate of increase over the same period.
0
10
20
30
40
50
60
70
80
90
Atlantic Quebec Ontario Manitoba Sask. Alberta B.C. Yukon N.W.T.
Region
Popu
latio
n (in
Tho
usan
ds)
1983 1988 1993 1998 2003

Section 1 – Demographics
Basic Departmental Data 2004 CIMD, IMB December 2005 QS-3625-040-EE-A1
15
Table 1.7 Off-Reserve Registered Indian Population by Region, 1983 to 2003
Note: All percentages are based on regional totals shown in Table 1.5. Source: 1983-2003 Indian Register, INAC.
Year Atlantic Quebec Ontario Manitoba Sask. Alberta B.C. Yukon N.W.T. Canada
1983 No. 3,214 4,963 24,314 13,853 18,531 10,167 21,884 872 614 98,412
% 25.1 14.6 33.1 27.0 34.7 24.1 36.0 24.7 7.2 28.9
1988 No. 5,722 11,346 44,554 20,451 31,471 18,427 34,368 1,311 2,468 170,118
% 32.3 25.7 43.8 31.8 46.1 33.3 44.5 23.8 24.8 38.3
1993 No. 7,048 15,970 60,956 28,403 40,361 23,658 43,916 3,433 3,127 226,872
% 32.7 29.4 48.5 33.8 47.3 34.5 46.7 50.4 24.3 41.0
1994 No. 7,463 16,450 63,928 29,795 42,259 24,560 45,983 3,272 3,304 237,014
% 33.3 29.5 49.1 33.8 47.6 34.4 47.5 47.1 25.0 41.3
1995 No. 7,897 16,641 66,335 30,709 44,272 24,665 47,648 3,376 3,588 245,131
% 34.0 29.1 49.4 33.5 48.0 33.3 47.8 47.6 26.3 41.3
1996 No. 8,227 17,153 68,084 34,419 45,777 25,601 50,029 3,457 3,758 256,505
% 34.3 29.3 49.2 36.2 48.2 33.5 49.0 48.0 26.8 42.0
1997 No. 8,514 18,178 69,825 34,158 47,329 26,380 49,818 3,555 3,872 261,629
% 34.6 30.4 49.0 34.8 48.4 33.6 47.7 48.5 27.0 41.7
1998 No. 8,719 18,091 71,323 34,446 48,890 27,013 50,562 3,634 4,009 266,687
% 34.6 29.6 48.8 34.3 48.5 33.6 47.5 48.9 27.4 41.5
1999 No. 9,089 18,417 73,940 35,363 50,535 27,911 52,010 3,693 4,154 275,112
% 35.2 29.6 49.2 34.0 48.9 33.8 47.8 49.0 27.6 41.7
2000 No. 9,322 19,041 75,600 37,052 52,018 28,828 53,728 3,761 4,156 283,506
% 35.3 30.1 49.1 34.6 49.0 33.8 48.6 49.3 27.6 42.0
2001 No. 9,579 19,547 77,392 40,099 53,461 29,657 55,410 3,843 4,425 293,413
% 35.5 30.4 49.3 36.5 49.1 33.8 49.3 49.6 28.9 42.5
2002 No. 11,129 19,782 78,891 40,349 55,071 30,766 56,869 3,935 4,722 301,514
% 38.6 30.2 49.6 35.9 49.3 34.3 49.8 50.2 30.3 42.8
2003 No. 11,777 20,047 81,179 41,912 56,475 31,773 57,778 3,995 4,889 309,825% 39.6 30.1 50.2 36.3 49.4 34.5 49.8 50.4 30.8 43.1

Section 1 – Demographics
16 Basic Departmental Data 2004 CIMD, IMB December 2005 QS-3625-040-EE-A1
1.8 On-Reserve Population by Geographic Zones
Figure 1.8 On-Reserve Registered Indian Population by Geographic Zones, 1983 and 2003
Highlights The proportion of on-reserve Registered Indians living in rural areas has increased between 1983 and 2003, from 39% to 44%. In 2003, 35% of Registered Indians on reserve lived in INAC-defined urban zones while nearly 17%, lived in special access zones. Special access zones have no year-round road access to a service centre.
1983
Rural39.4%
Urban36.3%
Remote5.3%
Special Access19.0%
2003
Urban34.6%
Rural44.7%
Remote3.7%
Special Access17.0%

Section 1 – Demographics
Basic Departmental Data 2004 CIMD, IMB December 2005 QS-3625-040-EE-A1
17
Table 1.8 On-Reserve Registered Indian Population by Geographic Zones, 1983 to 2003
Notes: 1. On-reserve population includes Crown lands and settlements.
2. The Canada total excludes Cree and Naskapi bands in Quebec, as these groups are covered under terms established in the James Bay Agreement for 1983 to 2003. As well, totals exclude the national population from the general list. 3. See Glossary for definition of geographic zone. Sources: 1983-2003 Indian Register, INAC. 1983-1991 Classification and Housing Economic Categorization of Indian Bands by Zone. 1987-2003 Band Classification Manual, Band Support and Capital Management Branch, INAC.
Year No. % No. % No. % No. % No. %
1983 85,474 36.3 92,949 39.4 12,548 5.3 44,654 19.0 235,625 100
1988 99,819 36.5 107,269 39.2 15,043 5.5 51,624 18.9 273,755 100
1993 112,881 35.7 140,417 44.4 5,703 1.8 57,206 18.1 316,207 100
1994 116,862 35.8 144,944 44.4 5,798 1.8 58,484 17.9 326,088 100
1995 120,818 35.8 149,854 44.5 5,943 1.8 60,431 17.9 337,046 100
1996 123,922 36.1 151,679 44.2 6,016 1.8 61,586 17.9 343,203 100
1997 127,223 35.9 157,219 44.4 6,241 1.8 63,673 18.0 354,356 100
1998 132,408 36.4 161,683 44.4 6,359 1.7 63,509 17.4 363,959 100
1999 133,159 35.7 165,681 44.4 6,608 1.8 67,335 18.1 372,783 100
2000 135,701 34.6 174,566 44.5 14,541 3.7 67,179 17.1 391,987 100
2001 137,823 34.8 176,926 44.6 14,796 3.7 67,026 16.9 396,571 100
2002 139,663 34.6 180,062 44.6 15,022 3.7 68,585 17.0 403,332 100
2003 141,742 34.6 183,050 44.7 15,310 3.7 69,561 17.0 409,663 100
Urban Rural Remote Special Access Total

Section 1 – Demographics
18 Basic Departmental Data 2004 CIMD, IMB December 2005 QS-3625-040-EE-A1
1.9 On-Reserve Population by Geographic Zones and by Region
Figure 1.9 On-Reserve Registered Indian Population by Geographic Zones and Region, 2003
Highlights In 2003, Saskatchewan, Manitoba and Atlantic regions had the highest proportion of on-reserve Registered Indians living in rural areas. Alberta, Quebec and Ontario had the highest proportion of on-reserve Registered Indians living in urban areas.
0%
20%
40%
60%
80%
100%
Atl. QC ON MB SK AB BC YK NT
Region
Prop
ortio
n of
on-
rese
rve
popu
latio
n
Urban Rural Remote Special Access

Section 1 – Demographics
Basic Departmental Data 2004 CIMD, IMB December 2005 QS-3625-040-EE-A1
19
Table 1.9 On-Reserve Registered Indian Population by Geographic Zones and Region, 2003
Notes: 1. On-reserve population includes Crown lands and settlements. 2. Canada total excludes Cree and Naskapi bands in Quebec, as these groups are covered under terms established in the James Bay Agreement for 1983 to 2003. As well, totals exclude the national population from the general list. 3. See Glossary for definition of geographic zone. 4. All IR figures exclude General List counts, for which no Geographic Zone is assigned. General List counts accounted for 8 of the 409,671 total Registered Indians living on reserves in 2003. Sources: 1982-2003 Indian Register, INAC. 1983-1991 Classification and Housing Economic Categorization of Indian Bands by Zone. 1987-2003 Band Classification Manual, Band Support and Capital Management Branch, INAC.
Region No. % No. % No. % No. % No. %
Atlantic 7,226 40.3 10,700 59.7 6 0.0 0 0.0 17,932 100
Quebec 23,934 51.5 9,114 19.6 8,346 18.0 5,062 10.9 46,456 100
Ontario 37,546 46.6 21,275 26.4 97 0.1 21,617 26.8 80,535 100
Manitoba 6,052 8.2 45,156 61.5 0 0.0 22,219 30.3 73,427 100
Saskatchewan 6,600 11.4 47,013 81.4 969 1.7 3,191 5.5 57,773 100
Alberta 33,254 55.2 22,697 37.7 0 0.0 4,333 7.2 60,284 100
British Columbia 24,191 41.5 21,646 37.1 3,686 6.3 8,835 15.1 58,358 100
Yukon 781 19.9 1,586 40.3 1,286 32.7 279 7.1 3,932 100
Northwest Territories 2,158 19.7 3,863 35.2 920 8.4 4,025 36.7 10,966 100
Canada 141,742 34.6 183,050 44.7 15,310 3.7 69,561 17.0 409,663 100
Urban Rural Special AccessRemote Total

Section 1 – Demographics
20 Basic Departmental Data 2004 CIMD, IMB December 2005 QS-3625-040-EE-A1
1.10 Population Distribution by Age and Gender
Figure 1.10 Population Distribution by Age and Gender, Indian Register 2003 and Post-censal Estimates 2003
Highlights The Registered Indian population has a higher proportion of youth (under age 24 years) than the population of Canada as a whole. The proportion of the population over age 40 years is markedly lower among Registered Indians than across Canada.
Males
0
1
2
3
4
5
6
0 - 4
5 - 9
10 -
14
15 -
19
20 -
24
25 -
29
30 -
34
35 -
39
40 -
44
45 -
49
50 -
54
55 -
59
60 -
64
65 -
69
70 -
74
75 -
79
80 -
84
85 +
Age
Prop
ortio
n of
tota
l pop
ulat
ion
RI Males Total Cdn MalesFemales
0
1
2
3
4
5
6
0 - 4
5 - 9
10 -
14
15 -
19
20 -
24
25 -
29
30 -
34
35 -
39
40 -
44
45 -
49
50 -
54
55 -
59
60 -
64
65 -
69
70 -
74
75 -
79
80 -
84
85 +
Age
Prop
ortio
n of
tota
l pop
ulat
ion
RI Females Total Cdn Females

Section 1 – Demographics
Basic Departmental Data 2004 CIMD, IMB December 2005 QS-3625-040-EE-A1
21
Table 1.10 Population Distribution by Age and Gender, Indian Register 2003 and Post-censal Estimates 2003
Notes: 1. The Indian Register Population is as of December 31, 2003. Data have not been adjusted for late reporting of births. Therefore, the younger age groups (specifically 0-4) are under-represented, and would be larger than it appears. 2. The "Total Canadian" population includes the Registered Indian population. Figures are Updated Post-censal Estimates as of July 1, 2003. 3. The Registered Indian Population does not add up to the total of 719,496 due to 2 cases where the age is unknown.
Sources: 2003 Indian Register, INAC. Statistics Canada and Annual Demographic Statistics 2003, March 2003 Cat. 91-213-XPB.
Age No. % No. % No. % No. %
0 - 4 28,612 4.0 27,401 3.8 877,286 2.8 837,016 2.6
5 - 9 38,320 5.3 36,671 5.1 998,569 3.2 951,133 3.0
10 - 14 40,110 5.6 38,060 5.3 1,084,753 3.4 1,032,860 3.3
15 - 19 35,179 4.9 33,523 4.7 1,088,772 3.4 1,031,773 3.3
20 - 24 30,720 4.3 30,109 4.2 1,119,035 3.5 1,069,466 3.4
25 - 29 28,219 3.9 28,150 3.9 1,073,969 3.4 1,044,163 3.3
30 - 34 28,844 4.0 29,196 4.1 1,124,790 3.6 1,103,923 3.5
35 - 39 28,342 3.9 29,251 4.1 1,247,414 3.9 1,233,785 3.9
40 - 44 25,467 3.5 27,955 3.9 1,364,310 4.3 1,355,014 4.3
45 - 49 19,593 2.7 22,799 3.2 1,251,593 4.0 1,264,150 4.0
50 - 54 14,386 2.0 17,222 2.4 1,078,752 3.4 1,097,745 3.5
55 - 59 10,877 1.5 13,566 1.9 913,922 2.9 928,537 2.9
60 - 64 7,824 1.1 10,012 1.4 684,822 2.2 711,978 2.3
65 - 69 5,760 0.8 7,774 1.1 552,166 1.7 595,736 1.9
70 - 74 4,196 0.6 5,600 0.8 484,186 1.5 554,927 1.8
75 - 79 2,652 0.4 3,871 0.5 358,752 1.1 480,675 1.5
80 - 84 1,583 0.2 2,583 0.4 221,629 0.7 362,027 1.1
85 + 1,947 0.3 3,120 0.4 137,014 0.4 313,035 1.0
All Ages 352,631 49.0 366,863 51.0 15,661,734 49.5 15,967,943 50.5Total 719,494 31,629,677
Registered Indians All Canadians
Male Female Male Female


SECTION 2
HEALTH
Section 2 – Health
24 Basic Departmental Data 2004 CIMD, IMB December 2005 QS-3625-040-EE-A1
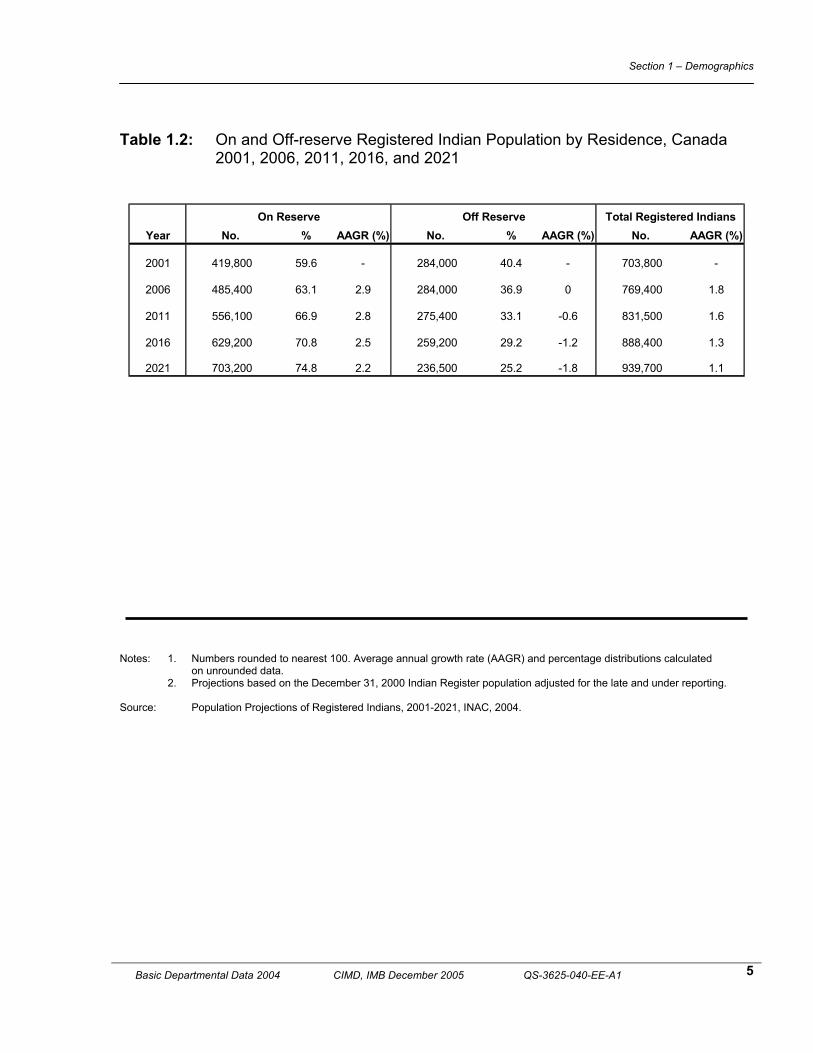
2.1 Life Expectancy Figure 2.1 Projected Life Expectancy at Birth by Gender, Registered Indian and Canadian Populations, Canada, 1980-2001
Highlights Life expectancy for Registered Indians at birth continues to approach parity with the general Canadian population. Despite the gains in life expectancy, a gap of approximately 6.6 years remains between the Registered Indian and Canadian populations in 2001. The life expectancy gap between the male and female Registered Indians in 1980 was 7.1 years in favour of females, and in 2001 the gap declines to 5.1 years.
Males
55
60
65
70
75
80
85
1980 1985 1990 1995 2000 2001
Year
Age
(yea
rs)
R.I. Males All Male Canadians
Females
55
60
65
70
75
80
85
1980 1985 1990 1995 2000 2001
YearA
ge (y
ears
)
R.I. Females All Canadian Females

Section 2 – Health
Basic Departmental Data 2004 CIMD, IMB December 2005 QS-3625-040-EE-A1 25
Table 2.1 Projected Life Expectancy at Birth by Gender, Registered Indian and Canadian Populations, Canada, 1980-2001
Note: Some numbers have been interpolated. Sources: Population Projections of Registered Indians, 2000-2021, INAC, 2003. Population Projections for Canada, Provinces and Territories, 2000-2026, Statistics Canada 2001. Medium Assumption, pages 25-26.
YearRegistered
Indians All Canadians Gap Registered Indians All Canadians Gap
1980 60.9 71.7 10.8 68.0 78.9 10.91985 63.9 73.1 9.2 71.0 79.9 8.91990 66.9 74.4 7.5 74.0 80.8 6.81995 68.0 75.1 7.1 75.7 81.1 5.42000 70.2 76.7 6.5 75.2 81.9 6.72001 70.4 77.0 6.6 75.5 82.1 6.6
Male Female

Section 2 – Health
26 Basic Departmental Data 2004 CIMD, IMB December 2005 QS-3625-040-EE-A1
2.2 Potential Years of Life Lost
Figure 2.2 Potential Years of Life (PYLL) Lost by Cause of Death First Nations 2001 and Canada, 2000
Highlights In 2001, the PYLL for injury was almost 3.5 times higher for First Nations than for Canada. First Nations report a total PYLL due to cancer lower than for all Canadians.
4,29
7
1,21
9
873
813
536
363
358
349
327
326
204
181
104
103
40
1,22
3
1,01
6
1,82
4
161
198
179
230
122 193
169
65
174
44 27 19
0
500
1 ,000
1 ,500
2 ,000
2 ,500
3 ,000
3 ,500
4 ,000
4 ,500
5 ,000
Injury
Circulatory
Cancer
Ill defin
ed
Digestive
Endocrine
Respira
tory
Perinatal
Infectious
Nervous S
ystem
Mental
Congenital
Genitourin
ary
Musculosk
eletal
Blood disease
s
C a u se o f d e a th
PYLL
per
100
,000
pop
ulat
ion
F irs t N a tions 2001 C anada 2000

Section 2 – Health
Basic Departmental Data 2004 CIMD, IMB December 2005 QS-3625-040-EE-A1 27
Table 2.2 Potential Years of Life Lost (PYLL) by Cause of Death First Nations 2001 and Canada, 2000
Notes: 1. PYLL calculations assume a life expectancy of age 75. 2. Canadian Institute of Health Information, 2003, International Classification of Diseases, Version 10. 3. PYLL per 100,000 population PYLL by ICD-9 chapter, FN (2001) and Canada (2000). Source: Health Canada, First Nations Inuit Health Branch in-house statistics; Health Canada, Data Development and Exchange System.
D is e a s e C la s s if ic a tio n F irs t N a tio n s C a n a d a
In ju ry 4 ,2 9 7 1 ,2 2 3
C irc u la to ry 1 ,2 1 9 1 ,0 1 6
C a n c e r 8 7 3 1 ,8 2 4
Ill d e f in e d 8 1 3 1 6 1
D ig e s tiv e 5 3 6 1 9 8
E n d o c r in e 3 6 3 1 7 9
R e s p ira to ry 3 5 8 2 3 0
P e r in a ta l 3 4 9 1 2 2
In fe c tio u s 3 2 7 1 9 3
N e rv o u s S ys te m 3 2 6 1 6 9
M e n ta l 2 0 4 6 5
C o n g e n ita l 1 8 1 1 7 4
G e n ito u r in a ry 1 0 4 4 4
M u s c u lo s k e le ta l 1 0 3 2 7B lo o d d is e a s e s 4 0 1 9

Section 2 – Health
28 Basic Departmental Data 2004 CIMD, IMB December 2005 QS-3625-040-EE-A1
2.3 Tuberculosis
Figure 2.3 Tuberculosis Incidence Rates, Canada and First Nations On-Reserve, 1990-2000
Highlights In 2000, the incidence of tuberculosis was six times higher in First Nations than across Canada.
0
10
20
30
40
50
60
70
80
90
1990 1991 1992 1993 1994 1995 1996 1997 1998 1999 2000
Year
Cas
es p
er 1
00,0
00 p
opul
atio
n
First Nations Canada

Section 2 – Health
Basic Departmental Data 2004 CIMD, IMB December 2005 QS-3625-040-EE-A1 29
Table 2.3 Tuberculosis Incidence Rates, Canada and First Nations On-Reserve, 1990-2000
Notes: 1. All rates standardized to 1996 Canadian population. 2. Rate calculations for First Nations and Canada do not include Quebec figures. Source: Health Canada, First Nations Inuit Health Branch in-house statistics.
Year First Nations Canada1990 82.1 7.21991 68.5 7.21992 83.2 7.41993 60.0 7.01994 60.1 7.11995 57.0 6.51996 52.8 6.31997 56.4 6.61998 44.2 5.91999 65.5 5.92000 34.0 5.5

Section 2 – Health
30 Basic Departmental Data 2004 CIMD, IMB December 2005 QS-3625-040-EE-A1
2.4 Infant Mortality Rates
Figure 2.4 Infant Mortality Rates, Canada and First Nations On-Reserve, 1979-2001
Highlights Since 1979, there has been a steady decline in infant mortality rates for First Nations on-reserve as well as for all Canadians. Between 1979 and 2001, there was a 73% decline in infant mortality rates for First Nations on-reserve compared to a decline of 47% in Canada.
Break in data from 1994 to 1998
0
5
10
15
20
25
30
1979 1981 1983 1985 1987 1989 1991 1993 1995 1997 1999 2001
Year
Dea
ths
per 1
,000
live
birt
hs
First Nations Canada

Section 2 – Health
Basic Departmental Data 2004 CIMD, IMB December 2005 QS-3625-040-EE-A1 31
Table 2.4 Infant Mortality Rates, Canada and First Nations On-Reserve, 1979-2001
Notes: 1. Rates include all births under 500 grams. 2. Deaths per 1,000 live births.
3. Data were unavailable for the First Nations population for the years 1994-1998. Current data may not be directly comparable to previous years due to different data collection methods. Source: Health Canada 1996, Trends in First Nations Mobility, 1979 to 1993, Catalogue No. 34-79/1993E; Health Canada, in- house statistics.
Year First Nations Canada1979 27.6 10.91980 23.7 10.41981 21.8 9.61982 17.1 9.11983 18.2 8.51984 18.9 8.11985 18.2 7.91986 17.5 7.91987 12.5 7.31988 12.6 7.21989 11.8 7.11990 11.2 6.81991 12.3 6.41992 12.8 6.11993 10.9 6.31994 Data not available 6.31995 Data not available 6.11996 Data not available 5.61997 Data not available 5.51998 Data not available 5.31999 6.4 5.32000 6.4 5.32001 7.2 5.2

Section 2 – Health
32 Basic Departmental Data 2004 CIMD, IMB December 2005 QS-3625-040-EE-A1
2.5 Fire Deaths and Injuries
Figure 2.5 Reported First Nation Fire Deaths and Injuries for 1990 to 2003
Highlights The number of fire deaths decreased from 20 in 1990 compared to 12 in 2003. The number of fire injuries decreased from 31 in 1990 compared to 24 in 2003.
0
10
20
30
40
50
60
1990 1991 1992 1993 1994 1995 1996 1997 1998 1999 2000 2001 2002 2003
Year
Num
ber
D eaths In juries

Section 2 – Health
Basic Departmental Data 2004 CIMD, IMB December 2005 QS-3625-040-EE-A1 33
Table 2.5 Reported First Nation Fire Deaths and Injuries for 1990 to 2003
Adults Children Total Adults Children Total1990 16 4 20 24 7 311991 14 6 20 11 4 151992 16 7 23 19 4 231993 18 19 37 11 9 201994 13 6 19 14 6 201995 13 7 20 22 5 271996 11 6 17 9 5 141997 16 9 25 38 7 451998 5 1 6 26 7 331999 15 12 27 24 11 352000 9 7 16 27 3 302001 13 1 14 20 1 212002 12 0 12 38 14 522003 11 1 12 21 3 24
Fire InjuriesFire DeathsYear
Notes: 1. These statistics are based on reports from First Nations. Source: 2003, Real Property Services for INAC, HQ, Public Works and Government Services Canada.


SECTION 3
EDUCATION

Section 3 - Education
36 Basic Departmental Data 2004 CIMD, IMB December 2005 QS-3625-040-EE-A1
3.1 Enrolment for Elementary/Secondary Schools
Figure 3.1 Students funded by INAC for Elementary/Secondary (Kindergarten,
Elementary and Secondary Schools), Canada, 1995-1996 to 2003-2004
Highlights In 2003-2004, the percentage of students enrolled in First Nation managed and federal schools was 14% higher than in 1995-1996. Of the 120,400 on-reserve students enrolled in kindergarten, elementary and secondary schools in 2003-2004, six of every 10 students were in FN managed schools while slightly less than four in 10 were in provincial/private schools.
0
10
20
30
40
50
60
70
1995-96 1996-97 1997-98 1998-99 1999-00 2000-01 2001-02 2002-03 2003-04
Year
Perc
enta
ge o
f tot
al e
nrol
men
ts
FN managed and federal schools Provincial and private schools

Section 3- Education
Basic Departmental Data 2004 CIMD, IMB December 2005 QS-3625-040-EE-A1 37
Table 3.1 Students funded by INAC for Elementary/Secondary (Kindergarten,
Elementary and Secondary Schools), Canada, 1995-1996 to 2003-2004
Revision: * Data revised. Notes: 1. Includes Registered Indians and Non-Registered (as approved by the Minister) individuals living on-reserve & Inuit
students in Kindergarten 4 to Grade 12 (Grade 13 where applicable prior to 2003-2004) inclusively from 1995-1996 to 2003-2004. On reserve population includes legally defined reserves, as well as recognized Indian settlements on Crown land. It excludes students residing and attending schools in N.W.T. and Nunavut as Elementary and Secondary Education is funded by the territorial governments and all other self-governing First Nations. Yukon reports for students residing on B.C. reserves only, but attending schools in either B.C. or Yukon.
2. Three regions have students funded by INAC for which detailed data were not reported: Atlantic, B.C. and Quebec. Detailed information on students under the James Bay and Northern Quebec Agreement between 1996-1997 and 2003-2004 are not available. These students are all attending provincial schools. The Nuu-Chah-Nulth Tribal Council in B.C. negotiated a separate agreement with INAC and therefore detailed information between 1995-1996 and 2002-2003 is not available. These students are all attending First Nation schools. In 2003-2004, the Mik’maw of the Atlantic Region did not report detailed data. These students are included in the above enrolment counts.
3. There are several reasons for the stabilization of the number of students enrolled in elementary/secondary schools over the past four years. Reasons include increased Multi-Year Agreements and Self Government agreements (data are no longer reported or updated annually on the Nominal Roll), strengthened regional compliance processes, and improved data processing procedures on the Nominal Roll System. Source: 1995-2003 Nominal Roll, Information Management Branch, INAC.
No. of students % No. of
students % No. of students % No. of
students % No. of students %
1995-96 1,794 1.6 43,787 39.4 63,000 56.7 2,534 2.3 111,115 100
1996-97 1,842 1.6 43,751 38.9 64,742 57.5 2,220 2.0 112,555 100
1997-98 1,773 1.5 43,943 37.8 68,250 58.7 2,340 2.0 116,306 100
1998-99 1,741 1.5 43,781 37.2 69,866 59.4 2,184 1.9 117,572 100
1999-00 * 1,707 1.4 43,762 36.7 71,812 60.2 2,065 1.7 119,346 100
2000-01 1,642 1.4 42,717 35.7 73,425 61.3 2,016 1.7 119,800 100
2001-02 * 1,656 1.4 43,073 36.1 72,457 60.8 2,041 1.7 119,227 100
2002-03 1,680 1.4 44,625 37.2 71,576 59.7 1,978 1.7 119,859 1002003-04 1,686 1.4 43,509 36.1 72,469 60.2 2,757 2.3 120,421 100
Federal First Nation Managed Private TotalProvincialYear

Section 3 - Education
38 Basic Departmental Data 2004 CIMD, IMB December 2005 QS-3625-040-EE-A1
3.2 Enrolment in Provincial and First Nation Managed Schools
by Grade Figure 3.2 Enrolment in Provincial and First Nation Managed Schools, by Grade,
Canada, 2003-2004
Highlight While 85% of INAC-funded K4 and K5 students attend First Nation managed schools, this number decreases to 45% by grade 12 as many First Nation managed schools offer elementary levels only. This trend has remained constant since 1994-1995.
0
1,000
2,000
3,000
4,000
5,000
6,000
7,000
K4 K5 1 2 3 4 5 6 7 8 9 10 11 12 SSGrade
Tota
l enr
olm
ent
Provincial Schools First Nation managed

Section 3- Education
Basic Departmental Data 2004 CIMD, IMB December 2005 QS-3625-040-EE-A1 39
Table 3.2 Enrolment in Provincial and First Nation Managed Schools by Region and
Grade, Canada, 2003-2004
Notes: 1. Includes Registered Indians and Non-Registered (as approved by the Minister) individuals living on-reserve & Inuit
students in Kindergarten 4 to Grade 12 in 2003-2004. On reserve population includes legally defined reserves, as well as recognized Indian settlements on Crown land. It excludes students residing and attending schools in N.W.T. and Nunavut as Elementary and Secondary Education is funded by the territorial governments and all other self-governing First Nations. Yukon reports for students residing on B.C. reserves only, but attending schools in either B.C. or Yukon.
2. In 2003-2004, two regions have students funded by INAC for which detailed data were not reported: Atlantic and Quebec. Detailed information on students under the James Bay and Northern Quebec Agreement is not available. These students are all attending provincial schools. In 2003-2004, the Mik’maw of the Atlantic Region did not report detailed data. These students are not included in the above enrolment counts.
3. Grade breakdowns vary across regions. Kindergarten - K4 & K5 in all regions, Elementary - grades 1-8, except Quebec (grades 1-6) and Secondary - grades 9-12 & Special Students (SS), except Quebec (Secondaire 1-5) and Ontario (grades 9-13 (grades 9-12 for 2003/04)).
Source: 2003-2004 Nominal Roll, Information Management Branch, INAC.
K4 K5 1 - 8 9 - 12 SS Total K4 K5 1 - 8 9 - 12 SS Total
Atlantic 299 507 8 34 848 100 1,146 720 - 1,966
Quebec 1,084 3,413 2,020 659 7,176 79 642 882 91 1,694
Ontario 1,818 8,129 3,333 - 13,280 526 2,476 4,053 - 7,055
Manitoba 2,470 10,988 3,622 - 17,080 393 1,982 2,167 - 4,542
Saskatchewan 2,318 10,035 3,433 348 16,134 142 1,838 1,415 21 3,416
Alberta 1,865 6,713 2,166 - 10,744 289 4,356 1,902 - 6,547
British Columbia 1,286 2,521 1,188 343 5,338 377 5,946 4,094 352 10,769
Yukon - - - - - 3 34 17 - 54Canada 11,140 42,306 15,770 1,384 70,600 1,909 18,420 15,250 464 36,043
RegionFirst Nation Managed
GradesProvincialGrades

Section 3 - Education
40 Basic Departmental Data 2004 CIMD, IMB December 2005 QS-3625-040-EE-A1
3.3 Enrolment in Provincial and First Nation Managed Schools,
by Grade, Canada, 1999-2000 to 2003-2004 Figure 3.3 Enrolment in Provincial and First Nation Managed Schools, by Grade,
Canada, 1999-2000 to 2003-2004
Highlight The enrolment in kindergarten, elementary and secondary education in First Nation managed schools remained fairly constant between 1999-2000 and 2003-2004.
First Nations Managed Schools
05,000
10,000 15,000 20,000 25,000 30,000 35,000 40,000 45,000 50,000
1999-2000 2000-2001 2001-2002 2002-2003 2003-2004 Years
Enr
olm
ent
K4 K5 Grade 1-8 Grade 9-12 Grade SS

Section 3- Education
Basic Departmental Data 2004 CIMD, IMB December 2005 QS-3625-040-EE-A1 41
Table 3.3 Enrolment in Provincial and First Nation Managed Schools, by Grade,
Canada, 1999-2000 to 2003-2004
Notes: 1. Includes Registered Indians and Non-Registered (as approved by the Minister) individuals living on-reserve & Inuit
students in Kindergarten 4 to Grade 12 (Grade 13 where applicable prior to 2003-2004) inclusively from 1999-2000 to 2003-2004. On reserve population includes legally defined reserves, as well as recognized Indian settlements on Crown land. It excludes students residing and attending schools in N.W.T. and Nunavut as Elementary and Secondary Education is funded by the territorial governments and all other self-governing First Nations. Yukon reports for students residing on B.C. reserves only, but attending schools in either B.C. or Yukon.
2. Three regions have students funded by INAC for which detailed data were not reported: Atlantic, B.C. and Quebec. Detailed information on students under the James Bay and Northern Quebec Agreement between 1999-2000 and 2003-2004 are not available. These students are all attending provincial schools. The Nuu-Chah-Nulth Tribal Council in B.C. negotiated a separate agreement with INAC and therefore detailed information between 1999-2000 and 2002-2003 is not available. These students are all attending First Nation schools. In 2003-2004, the Mik’maw of the Atlantic Region did not report detailed data. These students are not included in the above enrolment counts.
3. Grade breakdowns vary across regions. Kindergarten - K4 & K5 in all regions, Elementary - grades 1-8, except Quebec (grades 1-6) and Secondary - grades 9-12 & Special Students (SS), except Quebec (Secondaire 1-5) and Ontario (grades 9-13 (grades 9-12 for 2003/04)).
Source: 1999-2003 Nominal Roll, Information Management Branch, INAC.
K4 K5 1 - 8 9 - 12 SS Total K4 K5 1 - 8 9 - 12 SS Total
1999-2000 12,094 42,353 15,719 1,266 71,432 2,103 19,680 14,976 484 37,243
2000-2001 11,988 43,177 16,478 1,348 72,991 2,066 19,022 14,537 467 36,092
2001-2002 11,588 43,273 15,751 1,450 72,062 2,017 19,589 14,771 441 36,818
2002-2003 11,377 43,072 15,385 1,331 71,165 2,011 19,589 15,752 491 37,843
2003-2004 11,140 42,306 15,770 1,384 70,600 1,909 18,420 15,250 464 36,043
YearFirst Nation Managed
GradesProvincialGrades

Section 3 - Education
42 Basic Departmental Data 2004 CIMD, IMB December 2005 QS-3625-040-EE-A1
3.4 Enrolment in Provincial and First Nation Managed Schools,
Canada, 1994-1995 to 2003-2004 Figure 3.4 Enrolment in Provincial and First Nation Managed Schools, Canada,
1994-1995 to 2003-2004
Highlight More than half of the students enrolled in Secondary education attended First Nation managed schools during 1994-1995 and 2003-2004.
Enrolment in Secondary Schools
0.0 5.0
10.0 15.0 20.0 25.0 30.0 35.0 40.0 45.0 50.0
1994-95 1995-96 1996-97 1997-98 1998-99 1999-00 2000-01 2001-02 2002-03 2003-04
Years
Enr
olm
ent (
%)
Provincial Schools First Nation Managed

Section 3- Education
Basic Departmental Data 2004 CIMD, IMB December 2005 QS-3625-040-EE-A1 43
Table 3.4 Enrolment in Provincial and First Nation Managed Schools, Canada,
1994-1995 to 2003-2004
Revision: * Data revised. Notes: 1. Includes Registered Indians and Non-Registered (as approved by the Minister) individuals living on-reserve & Inuit
students in Kindergarten 4 to Grade 12 (Grade 13 where applicable prior to 2003-2004) inclusively from 1995-1996 to 2003-2004. On reserve population includes legally defined reserves, as well as recognized Indian settlements on Crown land. It excludes students residing and attending schools in N.W.T. and Nunavut as Elementary and Secondary Education is funded by the territorial governments and all other self-governing First Nations. Yukon reports for students residing on B.C. reserves only, but attending schools in either B.C. or Yukon.
2. Three regions have students funded by INAC for which detailed data were not reported: Atlantic, B.C. and Quebec. Detailed information on students under the James Bay and Northern Quebec Agreement between 1996-1997 and 2003-2004 are not available. These students are all attending provincial schools. The Nuu-Chah-Nulth Tribal Council in B.C. negotiated a separate agreement with INAC and therefore detailed information between 1995-1996 and 2002-2003 is not available. These students are all attending First Nation schools. In 2003-2004, the Mik’maw of the Atlantic Region did not report detailed data. These students are not included in the above enrolment counts.
3. Grade breakdowns vary across regions. Kindergarten - K4 & K5 in all regions, Elementary - grades 1-8, except Quebec (grades 1-6) and Secondary - grades 9-12 & Special Students (SS), except Quebec (Secondaire 1-5) and Ontario (grades 9-13 (grades 9-12 for 2003/04)).
Source: 1994-2003 Nominal Roll, Information Management Branch, INAC.
No. of Students % No. of Students % No. of Students %
1994-95 Provincial 27,265 61.8 16,853 38.2 44,118 100First Nation 46,443 79.9 11,696 20.1 58,139 100
1995-96 Provincial 26,880 61.4 16,907 38.6 43,787 100First Nation 49,415 79.0 13,112 21.0 62,527 100
1996-97 Provincial 24,550 60.5 16,055 39.5 40,605 100First Nation 51,267 79.8 12,980 20.2 64,247 100
1997-98 Provincial 22,122 58.7 15,567 41.3 37,689 100First Nation 53,128 78.4 14,612 21.6 67,740 100
1998-99 Provincial 22,260 59.5 15,156 40.5 37,416 100First Nation 53,932 77.8 15,414 22.2 69,346 100
1999-00 * Provincial 21,783 58.5 15,460 41.5 37,243 100First Nation 54,447 76.2 16,985 23.8 71,432 100
2000-01 Provincial 21,275 58.9 14,817 41.1 36,092 100First Nation 55,670 76.3 17,321 23.7 72,991 100
2001-02 Provincial 21,803 59.2 15,015 40.8 36,818 100First Nation 55,563 77.1 16,499 22.9 72,062 100
2002-03 Provincial 21,803 57.6 16,040 42.4 37,843 100First Nation 55,309 77.7 15,856 22.3 71,165 100
2003-04 Provincial 20,542 57.0 15,501 43.0 36,043 100First Nation 54,226 76.8 16,374 23.2 70,600 100
Year School TypeElementary Secondary Total

Section 3 - Education
44 Basic Departmental Data 2004 CIMD, IMB December 2005 QS-3625-040-EE-A1
3.5 On-Reserve Registered Indian Enrolment Rate
Figure 3.5 On-Reserve Registered Indian Enrolment Rate, Age 6-16 years, Canada,
1995-1996 to 2003-2004
Highlight There continues to be only a slight fluctuation in the annual enrolment rate of the on-reserve Registered Indian population.
0
10
20
30
40
50
60
70
80
90
100
1995-96 1996-97 1997-98 1998-99 1999-00 2000-01 2001-02 2002-03 2003-04
Year
Enro
lmen
t rat
e (%
)

Section 3- Education
Basic Departmental Data 2004 CIMD, IMB December 2005 QS-3625-040-EE-A1 45
Table 3.5 On-Reserve Registered Indian Enrolment Rate, Age 6-16, years, Canada, 1995-1996 to 2003-2004
Revision: * Data revised. Notes: 1. Includes Registered Indians living on-reserve, ages 6 to 16 inclusive, from 1995-1996 to 2003-2004. On reserve
population includes legally defined reserves, as well as recognized Indian settlements on Crown land. It excludes students residing and attending schools in N.W.T. and Nunavut as Elementary and Secondary Education is funded by the territorial governments and all other self-governing First Nations. Yukon reports for students residing on B.C. reserves only, but attending schools in either B.C. or Yukon.
2. Three regions have students funded by INAC for which detailed data were not reported: Atlantic, B.C. and Quebec. Detailed information on students under the James Bay and Northern Quebec Agreement between 1996-1997 and 2003-2004 are not available. These students are all attending provincial schools. The Nuu-Chah-Nulth Tribal Council in B.C. negotiated a separate agreement with INAC and therefore detailed information between 1995-1996 and 2002-2003 is not available. These students are all attending First Nation schools. In 2003-2004, the Mik’maw of the Atlantic Region did not report detailed data. These students are not included in the above enrolment counts.
3. The 6-16 age group has been used in order to be consistent with numbers reported for all Canadians. Previously, the 4-18 age group was used. 4. Enrolment rates are calculated by dividing the on-reserve enrolment by the on-reserve population and multiplying by
100. Please note that a major limitation to determining the on-reserve enrolment rate is the use of the Indian Register to identify the on-reserve population aged 6-16 years. The Indian Register is recorded by event-driven
occurrences, such as births, deaths and change in residency (individuals included in the denominator from the Indian Register may actually be living off-reserve). The population aged 6-16 years, which is used as a denominator for calculating the enrolment rate, is likely lower than that being used and is likely deflating the enrolment rate.
Sources: 1995-2003 Indian Register (as of December 31st ), INAC. 1995-2003 Nominal Roll, Information Management Branch, INAC.
YearOn-Reserve Population
6-16 years Indian Registry
On-Reserve Enrolment6-16 years
Elementary/Secondary
Enrolment Rate (%)
1995-96 80,764 70,224 86.9
1996-97 82,759 72,352 87.4
1997-98 86,280 74,617 86.5
1998-99 89,557 76,262 85.2
1999-00 92,213 78,169 * 84.8
2000-01 94,263 78,647 83.4
2001-02 95,358 79,967 * 83.9
2002-03 96,977 80,248 82.7
2003-04 97,799 78,223 80.0

Section 3 - Education
46 Basic Departmental Data 2004 CIMD, IMB December 2005 QS-3625-040-EE-A1
3.6 High School Graduates
Figure 3.6 Percentage of Students Enrolled in Grade 12 who Graduated, Canada, 1996-1997 to 2002-2003
Highlight The percentage of students enrolled in Grade 12 who graduated, fluctuated slightly between 1996-1997 and 2002-2003.
0
10
20
30
40
50
1996-97 1997-98 1998-99 1999-00 2000-01 2001-02 2002-03
Year
Rat
io o
f gra
duat
es/e
nrol
men
t (%
)

Section 3- Education
Basic Departmental Data 2004 CIMD, IMB December 2005 QS-3625-040-EE-A1 47
Table 3.6 Students Enrolled in Grade 12 who Graduated, Canada, 1996-1997 to 2002-2003
Revision: Data revised. Notes: 1. Includes Registered Indians and Non-Registered (as approved by the Minister) individuals living on-reserve & Inuit
students in Grade 12 from 1996-1997 to 2002-2003. On reserve population includes legally defined reserves, as well as recognized Indian settlements on Crown land. It excludes students residing and attending schools in N.W.T. and Nunavut as Elementary and Secondary Education is funded by the territorial governments and all other self-governing First Nations. Yukon reports for students residing on B.C. reserves only, but attending schools in either B.C. or Yukon.
2. Three regions have students funded by INAC for which detailed data were not reported: Atlantic, B.C. and Quebec. Detailed information on students under the James Bay and Northern Quebec Agreement between 1996-1997 and 2002-2003 are not available. These students are all attending provincial schools. The Nuu-Chah-Nulth Tribal Council in B.C. negotiated a separate agreement with INAC and therefore detailed information between 1996-1997 and 2002-2003 is not available. These students are all attending First Nation schools. These students are not included in the above enrolment counts.
3. Only includes students who were enrolled in a graduating year who graduated. Due to movement of students on and off reserve, graduation data are limited. These graduates only include those students who graduated while being funded by INAC. It is quite possible that students have graduated while living off-reserve and are therefore no longer on INAC's Nominal Roll. 4. The Graduation Rate is calculated by dividing the "Graduates" by the "Enrolment in Graduating Year".
Source: 1996-2002 Nominal Roll, Information Management Branch, INAC.
Year Enrolment in Graduating Year Graduates
Ratio of Graduates / Enrolment in
Graduating Year
1996-97 5,485 1,785 32.5
1997-98 5,931 1,975 33.3
1998-99 6,013 1,939 32.2
1999-00 6,460 2,072 32.1
2000-01 7,057 2,112 29.9
2001-02 6,698 1,953 29.2
2002-03 6,711 1,945 29.0

Section 3 - Education
48 Basic Departmental Data 2004 CIMD, IMB December 2005 QS-3625-040-EE-A1
3.7 First Nation Managed Schools
Figure 3.7 Number of First Nation Managed Schools, Canada, 1993-1994 to 2003-2004
Highlight First Nation communities are playing a greater role in the management of education services. Reflecting this fact, the number of First Nation managed schools increased by 33% from 372 in 1993-1994 to 496 in 2003-2004.
350
375
400
425
450
475
500
525
1993-94 1994-95 1995-96 1996-97 1997-98 1998-99 1999-00 2000-01 2001-02 2002-03 2003-04
Year
Tota
l num
ber

Section 3- Education
Basic Departmental Data 2004 CIMD, IMB December 2005 QS-3625-040-EE-A1 49
Table 3.7 Number of First Nation Managed Schools, Canada, 1993-1994 to 2003-2004
Source: 1993 -2003 Nominal Roll, Information Management Branch, INAC.
School YearFirst Nation
Managed Schools
Annual Increase (%)
1993-94 372 -
1994-95 412 10.8
1995-96 429 4.1
1996-97 446 4.0
1997-98 448 0.4
1998-99 466 4.0
1999-00 481 3.2
2000-01 492 2.3
2001-02 494 0.4
2002-03 496 0.4
2003-04 496 0.0

Section 3 - Education
50 Basic Departmental Data 2004 CIMD, IMB December 2005 QS-3625-040-EE-A1
3.8 Classrooms in First Nation Managed Schools
Figure 3.8 Number of Classrooms in First Nation Managed Schools, Canada, 1995-1996 to 2003-2004
Highlights In 2003-2004, the majority of classrooms in First Nations managed schools are at the elementary level (approximately 63%). While there has been little change in the number of classrooms for kindergarten and elementary levels between 2002-03 and 2003-04, the number of classrooms at the high school level increased by 6% over this period.
Data not available for 2001-02
0
400
800
1,200
1,600
2,000
2,400
1995-96 1996-97 1997-98 1998-99 1999-00 2000-01 2001-02 2002-03 2003-04
Year
Num
ber o
f cla
ssro
oms
Kindergarten Elementary Secondary

Section 3- Education
Basic Departmental Data 2004 CIMD, IMB December 2005 QS-3625-040-EE-A1 51
Table 3.8 Number of Classrooms in First Nation Managed Schools, Canada, 1995-1996 to 2003-2004
Note: 1. Classroom numbers are a reflection of the physical number of classrooms and do not include special-purpose rooms, i.e. gymnasiums, craft rooms, computer rooms, etc. Source: 1996-2004 Capital Asset Management System, Information Management Branch, INAC.
Year Kindergarten Elementary Secondary
1995-96 478 2,057 709
1996-97 473 2,090 666
1997-98 482 2,157 715
1998-99 471 2,125 735
1999-00 475 2,170 759
2000-01 470 2,174 775
2001-02 n/a n/a n/a
2002-03 458 2,088 7312003-04 458 2,085 774
Number of Classrooms

Section 3 - Education
52 Basic Departmental Data 2004 CIMD, IMB December 2005 QS-3625-040-EE-A1
3.9 Post-Secondary Enrolment
Figure 3.9 INAC-Funded Registered Indians and Inuit attending Post-Secondary,
Canada, 1995-1996 to 2003-2004
Highlight In 1995-1996, the INAC-funded Registered Indians and Inuit attending post-secondary increased to approximately 27,000 and remained constant through to 1998-1999, but then began to decline. In 2003-2004, post-secondary attendance increased to slightly below 25,000. Post-secondary attendance is likely to be higher as some students may be accessing funds from sources other than INAC.
18
19
20
21
22
23
24
25
26
27
28
1995-96 1996-97 1997-98 1998-99 1999-00 2000-01 2001-02 2002-03 2003-04
Year
Enro
lmen
ts (i
n th
ousa
nds)

Section 3- Education
Basic Departmental Data 2004 CIMD, IMB December 2005 QS-3625-040-EE-A1 53
Table 3.9 INAC-Funded Registered Indians and Inuit attending Post-Secondary,
Canada, 1995-1996 to 2003-2004 Notes: 1. Total number of Registered Indians and Inuit funded by INAC and enrolled in post-secondary education. Post-secondary enrolment is likely to be higher as some students may be accessing funds from different sources. 2. These data include only those students enrolled while they were being funded by their First Nation. (Or in a few
cases INAC) It is quite possible that students previously funded through INAC’s PSE program are now financing studies differently and no longer appear on the PSE file. The decreasing enrolment may be partly due to the fact that the PSE program operates on a fixed budget while tuition and other incidental costs generally increase.
3. This estimate includes reported and non-reported students. 4. Excludes N.W.T and Nunavut as they are funded by the territorial government. Source: 1995-2003 Post-Secondary Education Database, lnformation Management Branch, INAC.
School Year
Post-Secondary Enrolment 1,2,4
1995-96 27,183 1996-97 26,493 1997-98 27,172 1998-99 27,157 1999-00 26,520 2000-01 25,305 2001-02 25,146 2002-03 23,744 2003-04 24,904 3

Section 3 - Education
54 Basic Departmental Data 2004 CIMD, IMB December 2005 QS-3625-040-EE-A1
3.10 Post-Secondary Education Attainment
Figure 3.10 Post-Secondary Education Attainment Rate for the Registered Indian Population Compared to the Canadian Population, Census 1996 and 2001
Highlights Between 1996 and 2001, post-secondary education attainment rates have increased by 3 percentage points for both the Registered Indian population and the Canadian population. The gap in post-secondary education attainment between the Registered Indian population and the Canadian population has remained constant at about 15 percentage points.
0
5
10
15
20
25
30
35
40
1996 2001Year
Pos
t-sec
onda
ry a
ttain
men
t rat
e (%
)
Registered Indians Total Canadians

Section 3- Education
Basic Departmental Data 2004 CIMD, IMB December 2005 QS-3625-040-EE-A1 55
Table 3.10 Post-Secondary Education Attainment Rate for the Registered Indian Population Compared to the Canadian Population, Census 1996 and 2001
Notes: 1. The post-secondary education attainment rate is calculated by dividing the Population 15+ with a Post-Secondary Certificate/Diploma/ Degree by the Total Population 15+. 2. The Registered Indian Population is not included in the total Canadian Population. Source: 1996 and 2001 Census - INAC Core Tables (Total Population 15+ includes those still in school).
Registered Indians 1996 2001
Population ages 15 years and over 312,405 365,625
Total population with a post-secondary certificate, diploma, or degree
62,845 83,120PSE Attainment Rate (%) 20 23
Total Canadian Population (minus Total FN pop.)
Population ages 15 years and over 22,316,520 23,535,735
Total population with a post-secondary certificate, diploma, or degree
7,787,675 8,950,250PSE Attainment Rate (%) 35 38

Section 3 - Education
56 Basic Departmental Data 2004 CIMD, IMB December 2005 QS-3625-040-EE-A1
3.11 Post-Secondary Education Graduates
Figure 3.11 Registered Indian and Inuit Post-Secondary Graduates who Received INAC Funding, 1996-1997 to 2002-2003
Highlights The number of post-secondary education graduates has fluctuated slightly between 1996-1997 and 2002-2003. Of the 3,580 post-secondary graduates in 2002-2003, 60% obtained a non-university certificate or diploma while 38% received an undergraduate or graduate degree from a university.
0
500
1,000
1,500
2,000
2,500
3,000
3,500
4,000
4,500
1996-97 1997-98 1998-99 1999-00 2000-01 2001-02 2002-03
Year
Tota
l Gra
duat
es
Not Seeking a Qualification Graduate Undergraduate Non-University

Section 3- Education
Basic Departmental Data 2004 CIMD, IMB December 2005 QS-3625-040-EE-A1 57
Table 3.11 Registered Indian and Inuit Post-Secondary Graduates who Received INAC Funding, 1996-1997 to 2002-2003
Notes: 1. Non-University includes Colleges, Trades and other Institutions granting certificates or diplomas. Undergraduate includes bachelor degrees, Professional degrees etc., Graduate includes Master's degrees, PhDs etc. and Not Seeking a Qualification includes special students, auditing specializations and all others. 2. These figures do not include all First Nations as some have not reported. 3. Excludes N.W.T. and Nunavut as they are funded by the Territorial Government.
4. Graduates may be higher than those reported here. These data only include those students who graduated while being funded by their First Nation (or in a few cases, INAC). It is quite possible that students previously funded through INAC's PSE program are now financing studies differently and no longer appear on the PSE graduate file. Source: 1996-2002 Post-Secondary Education Database, Information Management Branch, INAC
Year Non-University Undergraduate Graduate Not Seeking a Qualification Total
1996-97 2,015 1,470 181 48 3,714
1997-98 2,251 1,444 208 124 4,027
1998-99 1,980 1,355 175 171 3,681
1999-00 1,945 1,267 190 116 3,518
2000-01 2,052 1,356 179 102 3,689
2001-02 2,157 1,197 192 38 3,5842002-03 2,153 1,163 194 70 3,580


SECTION 4
SOCIAL CONDITIONS
Section 4 - Social Conditions
60 Basic Departmental Data 2004 CIMD, IMB December 2005 QS-3625-040-EE-A1
4.1 Children In Care
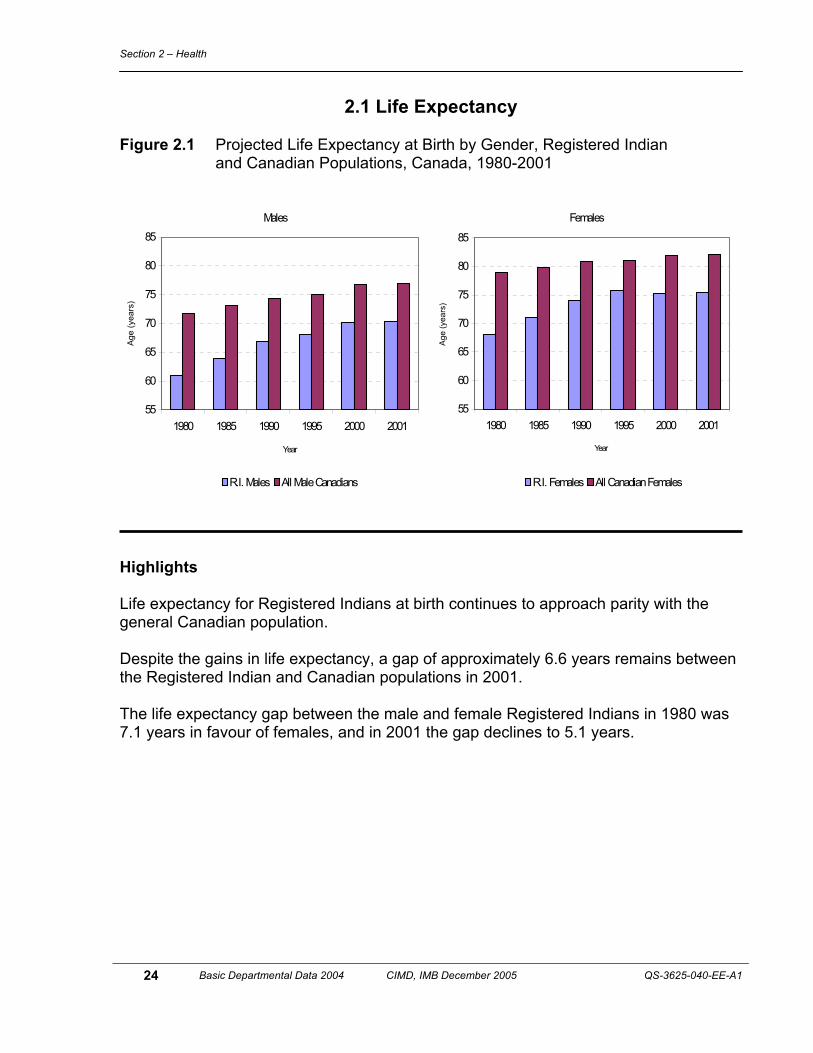
Figure 4.1 Percentage of On-Reserve Registered Indian Children in Care, Canada, 1995-1996 to 2003-2004
Highlight Of the total number of children aged 18 and under living on reserve in 2003-2004, slightly less than 6 % were in care. This percentage has remained relatively constant over the past six years.
0
1
2
3
4
5
6
7
1995-96 1996-97 1997-98 1998-99 1999-00 2000-01 2001-02 2002-03 2003-04
Year
Perc
enta
ge o
f chi
ldre
n in
car
e (%
)

Section 4- Social Conditions
Basic Departmental Data 2004 CIMD, IMB December 2005 QS-3625-040-EE-A1 61
Table 4.1 Number of On-Reserve Registered Indian Children in Care, Canada, 1995-1996 to 2003-2004
Notes: 1. See Glossary for definition of “Children in Care”. 2. The total number of children in care represents all children under the care of Operational and Development First Nations Child and Family Services Agencies, Provincial care and CSS care (Quebec and Ontario only). 3. Children in care include foster, institutional and group home care. 4. Child care cases do not include preventive and alternate approaches to child and family services. 5. Registered Indian children in care were resident on a reserve, Crown Land or settlement prior to the provision of care.
6. The total number of on-reserve children, age 0-18, is as of December 31 from the Indian Register and represents only those First Nations which were administered under a Child and Family Services Agreement.
7. The number of children in care may include estimated or incomplete data. 8. Excludes residents in the N.W.T. and Nunavut as they are funded by the territorial government. 9. Excludes Self-Government First Nations which are funded through other funding mechanisms. 10. Children in Care is a “snapshot” as of March 31. 11. Due to inaccuracies in Alberta’s Provincial Foster Care data for 2001-2002 and 2002-2003, corrections were made to the historical data on February 26, 2004.
Sources: 1995-2003 Social Development - Children in Care (Children aged 18 and under), Information Management Branch, INAC. 1995-2003 Indian Register (as of December 31), INAC. 1995-2003 Number of Children in Care based on July 15 CFS regional submissions.
Fiscal YearTotal Number of
Childrenin Care
Number of On-Reserve Children
Ages 18 and Under
Percentage of Children in Care
1995-96 5,299 135,704 3.9
1996-97 5,341 136,280 3.9
1997-98 6,220 139,564 4.5
1998-99 7,207 144,791 5.0
1999-00 7,762 148,664 5.2
2000-01 8,791 147,108 6.0
2001-02 8,075 150,646 5.4
2002-03 8,225 148,503 5.52003-04 8,846 154,632 5.7

Section 4 - Social Conditions
62 Basic Departmental Data 2004 CIMD, IMB December 2005 QS-3625-040-EE-A1
4.2 Adults In Institutional Care
Figure 4.2 Number of On-Reserve Registered Indian Adults in Institutional Care, Canada, 1994-1995 to 2003-2004
Highlight There has been little variation in the number of adults in institutional care between 1994-1995 and 2002-2003. The ratio of adults in care to the on-reserve adult population 19 years of age and over has been hovering between three and four per 1,000 population.
0
1
2
3
4
1994-95 1995-96 1996-97 1997-98 1998-99 1999-00 2000-01 2001-02 2002-03 2003-04
Year
Rat
io o
f adu
lts in
car
e (p
er 1
,000
pop
ulat
ion)
(%)

Section 4- Social Conditions
Basic Departmental Data 2004 CIMD, IMB December 2005 QS-3625-040-EE-A1 63
Table 4.2 Number of On-Reserve Registered Indian Adults in Institutional Care, Canada, 1994-1995 to 2003-2004 (Revised)
* As for April 2003, the Assisted Living Program authorities (formerly the Adults in Care Program) has been expanded to include both children and non-registered residents on-reserve. Revision: Total number of adults in care reflects March 31 actuals. Notes: 1. See Glossary for definition of “Adult in Institutional Care”.
2. The total number of on-reserve adults, aged 19 years and over, is as of December 31 from the Indian Register and represents only those First Nations that were funded under this program.
3. The ratio of Adults in Institutional Care is the number of adults in care divided by the number of on-reserve Registered Indian Adults aged 19 years.
4. The total number of adults in care represents all adults under Types I and II Institutional care. Definition types may vary from Region to Region.
5. Adult care includes institutional care and excludes in-home and foster care. 6. Registered Indian Adults in Institutional Care were resident on a reserve, Crown Land or settlement prior to the
provision of care. 7. Excludes residents in the N.W.T. and Nunavut as they are funded by the territorial government. 8. Excludes Self-Government First Nations which are funded through other funding mechanisms. Sources: 1994-2003 Social Development - Adult in Care (Adult aged 19 and over), Information Management Branch, INAC. 1994-2003 Indian Register (as of December 31), INAC. 1994-2003 Social Development data based on July 15 Regional submissions.
Fiscal Year Total Number of Adults in Care
Number ofOn-Reserve
Adults Ages 19 and Over
Ratio of Adults in Care per 1,000
population
1994-95 692 182,970 3.8
1995-96 707 189,282 3.7
1996-97 674 191,854 3.5
1997-98 694 198,287 3.5
1998-99 722 204,061 3.5
1999-00 638 209,723 3.0
2000-01 707 214,612 3.3
2001-02 676 217,150 3.1
2002-03 711 222,476 3.2
2003-04 * 729 227,372 3.2

Section 4 - Social Conditions
64 Basic Departmental Data 2004 CIMD, IMB December 2005 QS-3625-040-EE-A1
4.3 Income Assistance Recipients and Beneficiaries
Figure 4.3 Average Number of On-Reserve Income Assistance Recipients and Beneficiaries per Month, Canada, 1995-1996 to 2003-2004
Highlights Over the past seven years, there has been a slight decline in the average number of monthly income assistance beneficiaries, from approximately 156,600 in 1997-1998 to 146,600 in 2003-2004. On the other hand, the average number of monthly income assistance recipients has been rising over the same period.
0
20,000
40,000
60,000
80,000
100,000
120,000
140,000
160,000
1995-96 1996-97 1997-98 1998-99 1999-00 2000-01 2001-02 2002-03 2003-04
Year
Aver
age
num
ber p
er m
onth
Recipients Beneficiaries

Section 4- Social Conditions
Basic Departmental Data 2004 CIMD, IMB December 2005 QS-3625-040-EE-A1 65
Table 4.3 Average Number of On-Reserve Income Assistance Recipients and Beneficiaries per Month, Canada, 1995-1996 to 2003-2004
Notes: 1. See Glossary for definition of “Income Assistance”.
2. Income Assistance Recipients are defined as a combination of the number of families (heads of household) and single individuals who are eligible to receive income assistance funding. 3. Income Assistance Beneficiaries are defined as a combination of the number of persons in a family and single
individuals. 4. The number of Income Assistance recipients is a combination of two data types: actuals and “fixed-volume”
commitments. 5. The decrease in the 1995-1996 figures is due primarily to the exclusion of five (5) Yukon Self-Government First
Nations. 6. The 1997-1998 Income Assistance data were revised, as a result of the February 1999 Data Review. 7. Excludes residents in the N.W.T. and Nunavut as they are funded by the territorial government. 8. Excludes Self-Government First Nations which are funded through other funding mechanisms. Sources: 1995-2003 Income Assistance, Information Management Branch, INAC. 1995-2003 Income Assistance data based on July 15 Regional submissions.
Fiscal Year Average Number of Recipientsper Month
Average Number of Beneficiariesper Month
1995-96 69,029 151,564
1996-97 68,790 152,746
1997-98 70,927 156,629
1998-99 72,612 152,658
1999-00 73,974 151,737
2000-01 72,465 148,236
2001-02 73,975 146,194
2002-03 74,481 147,3002003-04 74,205 146,558

Section 4 - Social Conditions
66 Basic Departmental Data 2004 CIMD, IMB December 2005 QS-3625-040-EE-A1
4.4 Income Assistance Program
Figure 4.4 Percentage Change of First Nations Administering the Income Assistance Program, Canada, 1995-1996 to 2003-2004
Highlight In 2003-2004, Income Assistance was administered by 531 out of 563 eligible First Nations, with funding provided through a number of contribution arrangements.
86
87
88
89
90
91
92
93
94
95
96
1995-96 1996-97 1997-98 1998-99 1999-00 2000-01 2001-02 2002-03 2003-04
Year
Per
cent
age
of to
tal e
ligib
le F
irst N
atio
ns(%
)

Section 4- Social Conditions
Basic Departmental Data 2004 CIMD, IMB December 2005 QS-3625-040-EE-A1 67
Table 4.4 Percentage of First Nations Administering the Income Assistance Program, Canada, 1995-1996 to 2003-2004
Notes: 1. See Glossary for definition of “Income Assistance”.
2. Number of First Nations is defined as the total number of First Nations which INAC is responsible for funding Income Assistance.
3. The number of First Nations shown above does not reflect the total number of First Nations as identified in the Indian Register.
4. Number of administering First Nations is the total number of First Nations administering the Income Assistance Program, either directly or indirectly, through other First Nations, tribal councils, or under joint administration. 5. The decrease in the 1995-1996 figures is due primarily to the exclusion of five (5) Yukon Self-Government First
Nations. 6. In 1999-2000 and 2000-2001, there were eight Self-Government First Nations excluded from the count. Sources: 1995-2003 Income Assistance, Information Management Branch, INAC. 1995-2003 Income Assistance data based on July 15 Regional submissions.
Fiscal YearNumber of
First Nations
First Nations Administering the IA
Program
Percentage of Administering First
Nations
1995-96 566 531 93.8
1996-97 566 536 94.7
1997-98 565 535 94.7
1998-99 564 535 94.9
1999-00 567 538 94.9
2000-01 563 534 94.8
2001-02 564 531 94.1
2002-03 564 532 94.3
2003-04 563 531 94.3


SECTION 5
HOUSING

Section 5 - Housing
70 Basic Departmental Data 2004 CIMD, IMB December 2005 QS-3625-040-EE-A1
5.1 On-Reserve Dwellings Figure 5.1 On-Reserve New and Renovated Dwelling Units, Canada, 1993-1994 to 2003-2004
Highlights Between 1993-1994 and 2003-2004, an average of 2,580 dwelling units were constructed annually on reserve. On average, 3,543 dwelling units were renovated each year from 1993-1994 to 2003-2004. In 2003-2004, there were 251 more new dwelling units built, and 386 fewer renovations than during the previous year.
0
500
1000
1500
2000
2500
3000
3500
4000
4500
1993-94 1994-95 1995-96 1996-97 1997-98 1998-99 1999-00 2000-01 2001-02 2002-03 2003-04
Year
Tota
l num
ber o
f uni
ts
Renovated New

Section 5 - Housing
Basic Departmental Data 2004 CIMD, IMB December 2005 QS-3625-040-EE-A1 71
Table 5.1 On-Reserve New and Renovated Dwelling Units, Canada, 1993-1994 to 2003-2004
Notes: 1. See Glossary for definition of “Dwellings”.
2. Excludes dwellings in the N.W.T., Nunavut and Inuit communities of Northern Quebec, as well as dwellings of First Nations under the James Bay and Northern Quebec Agreement since 1984, Self-Government First Nations in Yukon and the Sechelt First Nation since 1986.
3. Data reported for 1997-1998 is as of August 31, 1998 and reflects adjustments made to the 1997-1998 Capital Management Database after publication of the 1997-1998 Performance Report. 4. Federal funding is provided by both INAC and CMHC. Source: 1994-2004 Capital Asset Management System, Information Management Branch, INAC.
Fiscal yearNumber of New
DwellingUnits
Number of Renovated
Dwellings Units
1993-94 4,254 4,126
1994-95 3,354 3,338
1995-96 2,427 3,310
1996-97 2,487 4,222
1997-98 2,798 2,870
1998-99 2,675 2,864
1999-00 2,313 3,243
2000-01 2,152 3,245
2001-02 1,872 3,690
2002-03 1,899 4,2242003-04 2,150 3,838

Section 5 - Housing
72 Basic Departmental Data 2004 CIMD, IMB December 2005 QS-3625-040-EE-A1
5.2 On-Reserve Dwellings/Infrastructure Figure 5.2 Percentage of Adequate On-Reserve Housing, Canada, 1993-1994 to 2003-2004
Highlight While the total number of housing units increased steadily over the past 10 years, the percentage of these units considered adequate fluctuated over the period. From a low of 46% in 1993-1994, the percentage of adequate housing units peaked in 1999-00 only to reach 53% in 2003-2004.
40
45
50
55
60
1993-94 1994-95 1995-96 1996-97 1997-98 1998-99 1999-00 2000-01 2001-02 2002-03 2003-04
Year
Prop
ortio
n of
tota
l hou
sing
uni
ts (%
)

Section 5 - Housing
Basic Departmental Data 2004 CIMD, IMB December 2005 QS-3625-040-EE-A1 73
Table 5.2 Percentage of Adequate On-Reserve Housing, Canada, 1993-1994 to 2003-2004
Notes: 1. Adequate is defined as the number of housing units that do not require any minor or major renovations or replacement. This number is determined using the following formula: Adequate Housing Units =Total Units-(Replacement+Major Renovation+Minor Renovation) 2. B.C. data excludes updates of infrastructure assets since 1987 for some First Nations participating in Alternative Funding Arrangements. Source: 1994-2004 Capital Asset Management System, Information Management Branch, INAC.
Fiscal Year Total Housing Units
Number of Adequate Units
Adequate Units (%)
1993-94 73,683 33,665 45.7
1994-95 76,385 34,875 45.7
1995-96 78,187 39,020 49.9
1996-97 80,443 41,885 52.1
1997-98 83,008 45,153 54.4
1998-99 85,647 47,140 55.0
1999-00 88,485 50,313 56.9
2000-01 89,897 50,169 55.8
2001-02 91,652 51,253 55.9
2002-03 93,474 49,683 53.22003-04 95,479 50,593 53.0

Section 5 - Housing
74 Basic Departmental Data 2004 CIMD, IMB December 2005 QS-3625-040-EE-A1
5.3 On-Reserve Dwellings/Infrastructure/Water and Sewage Figure 5.3 Percentage of On-Reserve Dwellings with Water Delivery and Sewage Disposal Systems, Canada, 1993-1994 to 2003-2004
Highlights Since 1998-1999, the proportion of on-reserve dwellings with water delivery has remained at approximately 98%. Improvement in the proportion of on-reserve dwellings with sewage disposal continued in 2003-2004 to reach 96% of all dwellings.
85
90
95
100
1993-94 1994-95 1995-96 1996-97 1997-98 1998-99 1999-00 2000-01 2001-02 2002-03 2003-04
Year
Perc
enta
ge o
f tot
al u
nits
(%)
Water Delivery Sewage Disposal
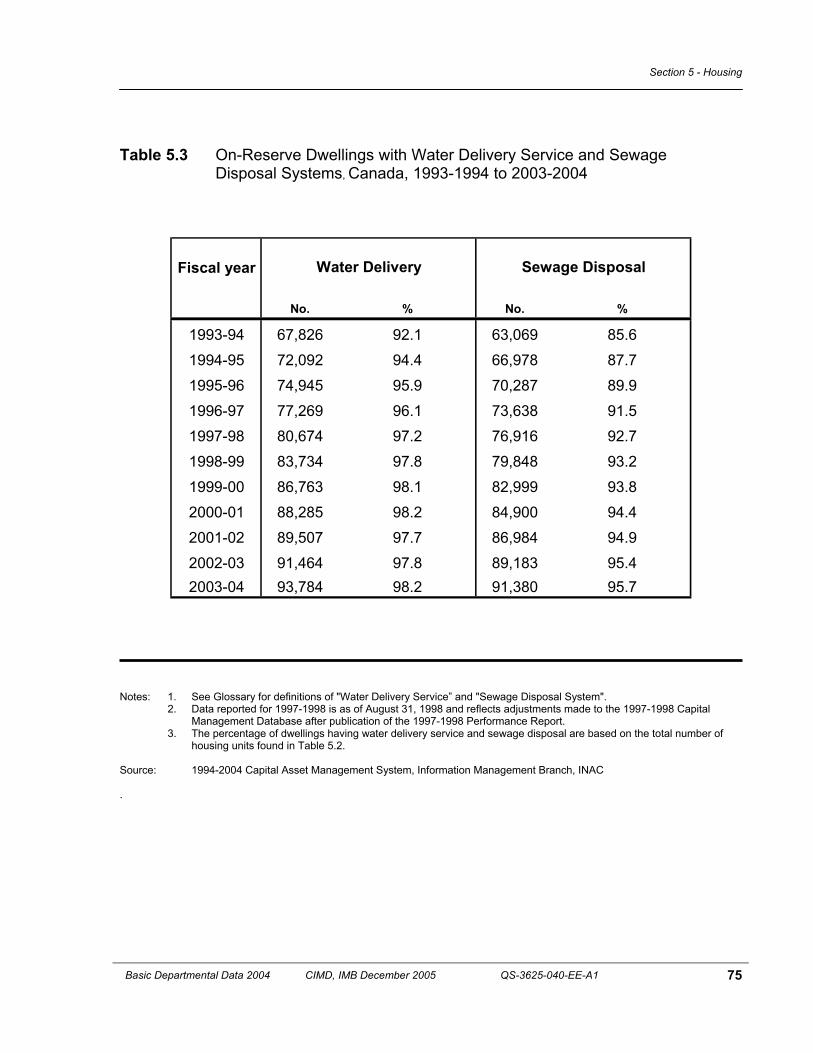
Section 5 - Housing
Basic Departmental Data 2004 CIMD, IMB December 2005 QS-3625-040-EE-A1 75
Table 5.3 On-Reserve Dwellings with Water Delivery Service and Sewage Disposal Systems, Canada, 1993-1994 to 2003-2004
Notes: 1. See Glossary for definitions of "Water Delivery Service” and "Sewage Disposal System".
2. Data reported for 1997-1998 is as of August 31, 1998 and reflects adjustments made to the 1997-1998 Capital Management Database after publication of the 1997-1998 Performance Report.
3. The percentage of dwellings having water delivery service and sewage disposal are based on the total number of housing units found in Table 5.2. Source: 1994-2004 Capital Asset Management System, Information Management Branch, INAC .
Fiscal year
No. % No. %
1993-94 67,826 92.1 63,069 85.6
1994-95 72,092 94.4 66,978 87.7
1995-96 74,945 95.9 70,287 89.9
1996-97 77,269 96.1 73,638 91.5
1997-98 80,674 97.2 76,916 92.7
1998-99 83,734 97.8 79,848 93.2
1999-00 86,763 98.1 82,999 93.8
2000-01 88,285 98.2 84,900 94.4
2001-02 89,507 97.7 86,984 94.9
2002-03 91,464 97.8 89,183 95.42003-04 93,784 98.2 91,380 95.7
Water Delivery Sewage Disposal


SECTION 6
SELF-GOVERNMENT

Section 6 –Self-Government
78 Basic Departmental Data 2004 CIMD, IMB December 2005 QS-3625-040-EE-A1
6.1 Self-Government Negotiations
Background In 1995, the Government of Canada recognized the inherent right of self-government as an existing Aboriginal right under section 35 of the Constitution Act, 1982 and announced a policy framework for the implementation and negotiation of Aboriginal self-government. The policy is based on the view that Aboriginal peoples of Canada have the right to govern themselves in relation to matters that are internal to their communities, integral to their unique cultures, identities, traditions, languages and institutions, and with respect to their special relationship to their land and their resources. The objective of the policy is the negotiation of practical and workable agreements on how self-government will be exercised. Following on the recommendations of the Royal Commission on Aboriginal Peoples in 1996 and the launch of Gathering Strength – Canada’s Aboriginal Action Plan in 1998, the approach to self-government evolved to include a focus on the more holistic challenge of setting a framework for new government-to-government relationships, including the development of internal governance capacities, skills and structures as a basis for negotiating self-government agreements. INAC is currently engaged in self-government negotiations at some 72 tables, representing 445 Aboriginal communities (includes 427 First Nations, 18 Inuit communities and some Métis locals). These tables include stand-alone self-government negotiations (i.e. a range of jurisdictions), sectoral negotiations (i.e. one jurisdiction such as education, child welfare) and self-government negotiations, which are proceeding with a large number of communities in conjunction with their comprehensive land claims negotiations.

Section 6 - Self-Government
Basic Departmental Data 2004 CIMD, IMB December 2005 QS-3625-040-EE-A1 79
Highlights of Progress Achieved in 2004 Progress achieved at stand-alone self-government tables over the last year includes the following:
The Westbank Self-Government Agreement Act received Royal Assent on May 6, 2004.The self-government agreement with Westbank is the first stand-alone self-government agreement negotiated under the Inherent Right Policy.
On September 20, 2004, negotiators initialled a Framework Agreement with the
Sahtu Dene and Métis of Tulita. This is an important achievement towards fulfilling our commitment in the Sahtu Dene and Métis Comprehensive Land Claim Agreement to negotiate self-government with the Sahtu communities.
Completed Agreements
In 1984, self-government legislation was enacted on behalf of the Cree and Naskapi First Nations of Quebec and, in 1986, on behalf of the Sechelt First Nation of British Columbia.
In September 1998, the Mi’kmaq Education Act was enacted.
Self-government legislation has also been enacted on behalf of the following Yukon
First Nations: Vuntut Gwitchin, Nacho Nyak Dun, Champagne and Aishihik, Teslin Tlingit, Little Salmon/Carmacks, Selkirk, Tr’on dëk Hwëch’in, Ta’an Kwach’an and Kluane in conjunction with their comprehensive claims. Ancillary agreements for the transfer of certain programs and services have also been reached with several of these groups.
Canada gave Royal Assent to the Nisga’a Final Agreement Act in April 2000 and the
Treaty came into effect on May 11, 2000. The Nisga’a Agreement represents the first modern-day treaty to explicitly extend section 35 (Constitution Act, 1982) protection to both land and self-government rights.
Canada also gave Royal Assent to the Westbank Self-Government Act in May 2004.
Source: 2004 Self-Government Policy Directorate, INAC.

Section 6 –Self-Government
80 Basic Departmental Data 2004 CIMD, IMB December 2005 QS-3625-040-EE-A1
6.2 Devolution
Figure 6.2 Profile of Administrators of Expenditures, INAC, 1993-1994 to 2003-2004
Highlights In 2003-2004, Registered Indians and Inuit administered 83% of INAC’s Indian and Inuit Affairs Program expenditures through band councils, tribal councils, or other First Nation organizations. The number of authorized full-time equivalents in the Indian and Inuit Affairs Program has steadily increased over the past four years from 2,187 in 2000-2001 to 2,729 in 2003-2004, representing a 25% increase.
0
10
20
30
40
50
60
70
80
90
100
1993-94 1994-95 1995-96 1996-97 1997-98 1998-99 1999-00 2000-01 2001-02 2002-03 2003-04
Year
Prop
ortio
n of
tota
l exp
endi
ture
s (%
)
INAC Administered Provincially Administered Band Administered

Section 6 - Self-Government
Basic Departmental Data 2004 CIMD, IMB December 2005 QS-3625-040-EE-A1 81
Table 6.2 Devolution of Expenditures, INAC 1993-1994 to 2003-2004
Notes: 1. Total Indian and Inuit Affairs Program (IIAP) Expenditures as reported above ($5,104,840,997) does not include the
amount of $125,986 to forgive certain debts and obligations owed to her Majesty in Right of Canada. When added, these two amounts account for the total recorded in the Public Accounts ($5,104,966,982).
Sources: Band Service Profiles, Finance Branch, DIAND 2003/2004 Estimates, Section III - Performance Accomplishments
IAAPExpenditures
Indian and Inuit Affairs Program
(Current $) % (Current $) % (Current $) % (Current $) (Auth. FTEs)
1993-94 $2,673,150,811 79.9 $360,028,800 10.8 $311,810,000 9.3 $3,344,989,611 2,567
1994-95 $2,868,833,766 81.9 $393,573,384 11.2 $240,621,423 6.9 $3,503,028,573 2,275
1995-96 $3,065,731,561 83.1 $373,997,022 10.1 $248,007,409 6.7 $3,687,735,992 2,092
1996-97 $3,179,249,715 81.8 $486,996,988 12.5 $221,460,680 5.7 $3,887,707,383 1,889
1997-98 $3,376,659,499 85.1 $340,370,427 8.6 $248,706,142 6.3 $3,965,736,068 1,755
1998-99 $3,833,125,063 86.4 $342,220,681 7.7 $260,261,082 5.9 $4,435,606,826 1,991
1999-00 $3,753,695,395 85.5 $357,252,427 8.1 $279,547,699 6.4 $4,390,495,521 1,988
2000-01 $4,062,019,805 84.6 $306,270,102 6.4 $430,390,743 9.0 $4,798,680,650 2,187
2001-02 $4,105,288,711 85.4 $351,545,820 7.3 $350,684,565 7.3 $4,807,519,096 2,263
2002-03 $4,205,134,242 84.6 $350,798,343 7.1 $416,338,733 8.4 $4,972,271,318 2,384
2003-04 $4,204,065,364 82.4 $448,729,206 8.8 $452,046,427 8.9 $5,104,840,997 2,729
Fiscal Year Band Administered Province Administered Department (INAC) Administered


SECTION 7
THE NORTH

Section 7 –The North
84 Basic Departmental Data 2004 CIMD, IMB December 2005 QS-3625-040-EE-A1
7.1 Population in the North
Figure 7.1 Population Yukon, Northwest Territories and Nunavut, 1994 to 2004
Highlight The population for Nunavut has risen sharply (21%) between 1994 and 2004 compared to the Yukon and NWT which have increased by 5% over the same period.
22,500
25,000
27,500
30,000
32,500
35,000
37,500
40,000
42,500
45,000
1994 1995 1996 1997 1998 1999 2000 2001 2002 2003 2004
Year
Tota
l Pop
ulat
ion
Yukon NWT Nunavut

Section 7 –The North
Basic Departmental Data 2004 CIMD, IMB December 2005 QS-3625-040-EE-A1 85
Table 7.1 Population, Yukon, Northwest Territories and Nunavut, by Gender 1994 to 2004
Notes: 1. Preliminary, updated and final post-censal estimates are based on the most recent census adjusted for net census under coverage and estimates of the components of demographic change since that last census. Intercensal estimates are based on post-censal estimates and data from the most recent census counts adjusted for net undercount preceding and following the year in question.
2. From July 1, 1971 to 1995, estimates are revised intercensal, final intercensal from 1996 to 2000, final post-censal for 2002, updated post-censal for 2003 and preliminary post-censal for 2004.
3. Population estimates for Northwest Territories and Nunavut are provided separately from July 1, 1991.
Source: 1994-2004 Statistics Canada, CANSIM-Table 051-0001.
Year Yukon NWT Nunavut1994 - Total 29,695 40,580 24,418
Males 15,448 21,213 12,837Females 14,247 19,367 11,581
1995 - Total 30,445 41,427 24,985Males 15,811 21,603 13,162
Females 14,634 19,824 11,8231996 - Total 31,383 41,748 25,668
Males 16,270 21,717 13,549Females 15,113 20,031 12,119
1997 - Total 31,791 41,635 25,884Males 16,418 21,630 13,632
Females 15,373 20,005 12,2521998 - Total 31,142 40,816 26,374
Males 16,020 21,178 13,858Females 15,122 19,638 12,516
1999 - Total 30,777 40,654 26,822Males 15,771 21,066 14,061
Females 15,006 19,588 12,761 2000 - Total 30,421 40,499 27,500
Males 15,527 20,959 14,382Females 14,894 19,540 13,118
2001 - Total 30,129 40,822 28,121Males 15,318 21,099 14,673
Females 14,811 19,723 13,448 2002 - Total 30,137 41,489 28,739
Males 15,272 21,439 14,952Females 14,865 20,050 13,787
2003 - Total 30,554 42,206 29,141Males 15,445 21,782 15,082
Females 15,109 20,424 14,059 2004 - Total 31,209 42,810 29,644
Males 15,705 22,113 15,279Females 15,504 20,697 14,365

Section 7 –The North
86 Basic Departmental Data 2004 CIMD, IMB December 2005 QS-3625-040-EE-A1
7.2 Population Projections in the North
Figure 7.2 Population Projections (000), Yukon, Northwest Territories, and Nunavut, 2005, 2010, 2015, 2020 and 2025
Highlight All three Territories will see their respective populations increase over the next 20 years. Nunavut could have the largest percentage increase (29%) while the NWT could have half (14%) that of Nunavut. The Yukon could experience the smallest increase (6%).
20
25
30
35
40
45
50
55
2005 2010 2015 2020 2025
Year
Popu
latio
n (0
00)
Yukon NWT Nunavut

Section 7 –The North
Basic Departmental Data 2004 CIMD, IMB December 2005 QS-3625-040-EE-A1 87
Table 7.2 Population Projections (000), Yukon, Northwest Territories, and Nunavut, 2005-2026
Notes: 1. The base population for these projections is derived from the official preliminary estimates of population for Canada, provinces and territories as of July 1, 2000. As for assumptions and scenarios, please refer to Catalogue 91-520, pages 2-58.
2. The medium-growth scenario is defined by the following assumptions: 2026 Canadian Total Fertility Rate equals 1.48 births; 2026 Canadian Life expectancy (Males) equals 80.0 years; 2026 Canadian Life expectancy (Females) equals 84.0 years; 2026 Canadian Immigration Level equals 225,000 persons.
Source: 2005-2026 Statistics Canada, CANSIM – Table 052-0001.
Total Males Females Total Males Females Total Males Females2005 30.8 15.6 15.2 43.3 22.1 21.2 30.3 15.7 14.62006 30.9 15.6 15.3 43.6 22.2 21.4 30.8 15.9 14.92007 31.0 15.6 15.4 43.9 22.3 21.6 31.2 16.1 15.12008 31.1 15.6 15.5 44.2 22.4 21.8 31.7 16.3 15.42009 31.2 15.6 15.6 44.5 22.5 22.0 32.2 16.6 15.62010 31.3 15.6 15.7 44.8 22.6 22.2 32.7 16.8 15.92011 31.4 15.6 15.8 45.2 22.8 22.4 33.1 17.0 16.12012 31.5 15.6 15.9 45.5 22.9 22.6 33.6 17.2 16.42013 31.6 15.6 16.0 45.8 23.0 22.8 34.1 17.5 16.62014 31.8 15.7 16.1 46.2 23.2 23.0 34.6 17.7 16.92015 31.9 15.7 16.2 46.5 23.3 23.2 35.0 17.9 17.12016 32.0 15.7 16.3 46.8 23.4 23.4 35.5 18.1 17.42017 32.1 15.7 16.4 47.2 23.6 23.6 35.9 18.3 17.62018 32.2 15.8 16.4 47.4 23.7 23.7 36.3 18.5 17.82019 32.3 15.8 16.5 47.7 23.8 23.9 36.7 18.7 18.02020 32.4 15.8 16.6 48.0 23.9 24.1 37.1 18.9 18.22021 32.4 15.8 16.6 48.2 24.0 24.2 37.5 19.1 18.42022 32.5 15.8 16.7 48.5 24.1 24.4 37.9 19.3 18.62023 32.5 15.8 16.7 48.8 24.2 24.6 38.2 19.4 18.82024 32.5 15.8 16.7 49.0 24.3 24.7 38.5 19.6 18.92025 32.5 15.8 16.7 49.2 24.4 24.8 38.8 19.7 19.12026 32.5 15.7 16.8 49.4 24.4 25.0 39.1 19.9 19.2
YukonYear Northwest Territories Nunavut

Section 7 –The North
88 Basic Departmental Data 2004 CIMD, IMB December 2005 QS-3625-040-EE-A1
7.3 Infant Mortality in the North
Figure 7.3 Infant Mortality Rates (per 1,000 live births) in Yukon, Northwest
Territories and Nunavut 1991 to 2001
Highlight Infant mortality rates have fluctuated over the period shown, with an overall general decrease between 1991 and 2001.
0.0
5.0
10.0
15.0
20.0
25.0
30.0
1991 1992 1993 1994 1995 1996 1997 1998 1999 2000 2001
Year
Dea
ths
per 1
,000
pop
ulat
ion
Yukon NWT Nunavut
No data for 1996

Section 7 –The North
Basic Departmental Data 2004 CIMD, IMB December 2005 QS-3625-040-EE-A1 89
Table 7.3 Infant Mortality Rates (per 1,000 live births) in Yukon, Northwest Territories and Nunavut 1979 to 2001
Note: 1. Infant mortality corresponds to the death of a child under one year of age. Source: 1979-2001 Statistics Canada, Canadian Vital Statistics, Birth and Death Database, CANSIM Table T102-0030.
Year Both sexes Males Females Both sexes Males Females Both sexes Males Females Both sexes Males Females
1979 16.0 14.9 17.2 27.3 26.4 28.1 - - - - - -
1980 18.9 15.9 22.3 22.3 29.6 15.1 - - - - - -
1981 14.9 10.9 19.1 21.5 21.4 21.6 - - - - - -
1982 21.0 23.2 18.8 16.2 18.0 14.1 - - - - - - 1983 18.5 24.5 11.8 20.8 26.8 14.2 - - - - - -
1984 13.5 18.0 8.3 17.3 16.1 18.6 - - - - - -
1985 10.8 12.2 9.2 16.7 16.3 17.1 - - - - - -
1986 24.8 26.3 23.5 18.6 21.0 16.1 - - - - - -
1987 10.5 9.0 11.7 12.5 15.8 9.2 - - - - - -
1988 5.8 6.9 4.3 10.3 10.8 9.9 - - - - - -
1989 4.2 3.9 4.4 16.2 20.2 11.6 - - - - - -
1990 7.2 6.6 8.0 12.0 13.4 10.5 - - - - - -
1991 10.6 3.4 18.1 12.2 12.2 12.3 7.7 6.8 8.5 18.0 18.6 17.3
1992 3.8 3.7 3.9 16.7 18.3 15.0 10.6 6.8 14.5 24.2 31.5 15.6
1993 7.9 11.1 4.2 9.6 6.3 13.0 6.0 4.7 7.4 13.8 8.4 19.1
1994 2.3 0.0 4.4 14.6 13.9 15.4 12.1 12.8 11.2 17.2 15.0 19.6
1995 12.8 20.5 4.4 13.0 13.3 12.7 9.2 6.6 12.0 17.6 21.7 13.5
1996 0.0 0.0 0.0 12.2 11.1 13.4 4.9 7.2 2.5 20.1 15.2 25.6
1997 8.4 8.1 8.8 10.9 9.5 12.3 6.9 5.5 8.3 14.8 13.4 16.2
1998 5.1 9.7 0.0 18.5 21.8 15.1 17.6 20.3 14.8 19.5 23.3 15.4
1999 2.6 0.0 4.9 13.6 18.6 8.6 12.1 21.2 3.0 14.9 16.3 13.6
2000 2.7 4.8 0.0 - - - 8.9 5.9 12.0 12.4 9.9 15.42001 8.7 11.4 5.9 - - - 4.9 6.6 3.2 16.9 25.0 8.6
Yukon Northwest Territories(including Nunavut) Northwest Territories Nunavut

Section 7 –The North
90 Basic Departmental Data 2004 CIMD, IMB December 2005 QS-3625-040-EE-A1
7.4 Aboriginal Identity Population in the North
Figure 7.4 Total Population, Aboriginal and Non-Aboriginal, for Yukon, Northwest
Territories, and Nunavut, 2001 Census
Highlight The Northwest Territories have almost equal proportions of Aboriginals and Non-Aboriginals. Nunavut has a predominantly Aboriginal population (85%) composed almost exclusively of Inuit, while the Yukon’s population is predominantly Non-Aboriginal (77%).
0102030405060708090
100
Yukon NWT Nunavut
Prop
ortio
n of
tota
l pop
ulat
ion
(%)
Aboriginal Non-Aboriginal
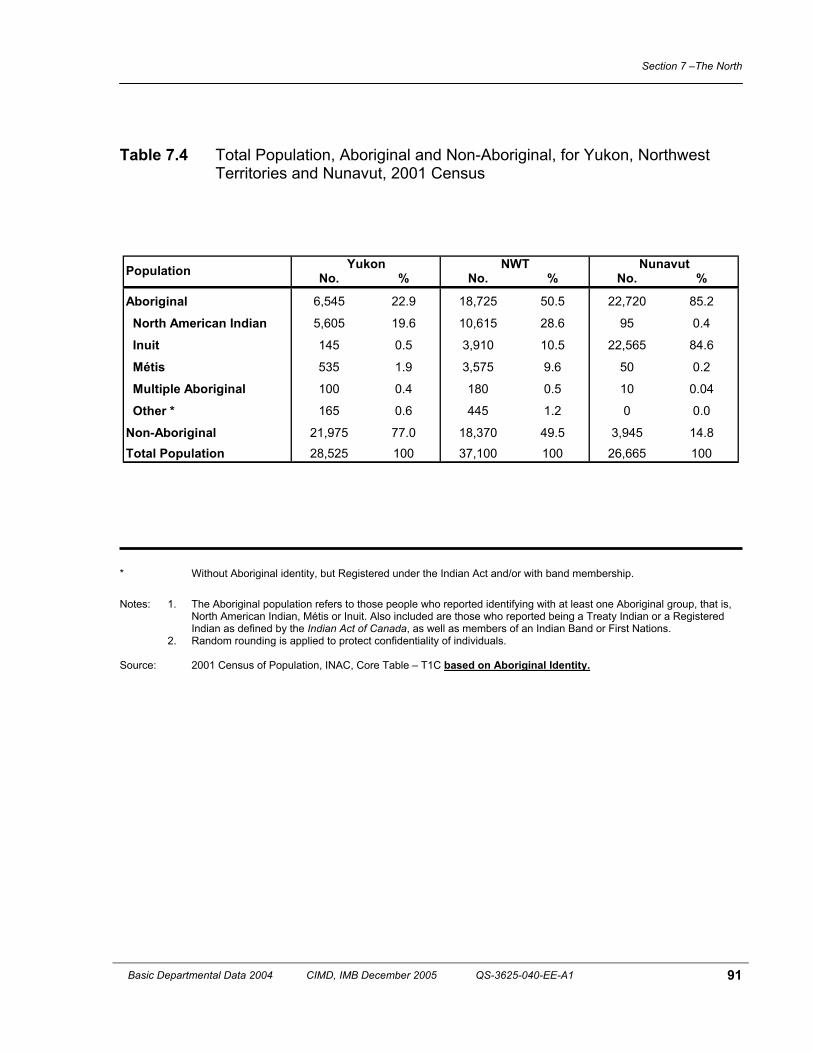
Section 7 –The North
Basic Departmental Data 2004 CIMD, IMB December 2005 QS-3625-040-EE-A1 91
Table 7.4 Total Population, Aboriginal and Non-Aboriginal, for Yukon, Northwest
Territories and Nunavut, 2001 Census
* Without Aboriginal identity, but Registered under the Indian Act and/or with band membership. Notes: 1. The Aboriginal population refers to those people who reported identifying with at least one Aboriginal group, that is, North American Indian, Métis or Inuit. Also included are those who reported being a Treaty Indian or a Registered Indian as defined by the Indian Act of Canada, as well as members of an Indian Band or First Nations.
2. Random rounding is applied to protect confidentiality of individuals. Source: 2001 Census of Population, INAC, Core Table – T1C based on Aboriginal Identity.
No. % No. % No. %
Aboriginal 6,545 22.9 18,725 50.5 22,720 85.2
North American Indian 5,605 19.6 10,615 28.6 95 0.4
Inuit 145 0.5 3,910 10.5 22,565 84.6
Métis 535 1.9 3,575 9.6 50 0.2
Multiple Aboriginal 100 0.4 180 0.5 10 0.04
Other * 165 0.6 445 1.2 0 0.0
Non-Aboriginal 21,975 77.0 18,370 49.5 3,945 14.8Total Population 28,525 100 37,100 100 26,665 100
Population Yukon NWT Nunavut

Section 7 –The North
92 Basic Departmental Data 2004 CIMD, IMB December 2005 QS-3625-040-EE-A1
7.5 Employment in the North
Figure 7.5 Employment, Aboriginal and Non-Aboriginal, for Yukon, Northwest Territories and Nunavut, 2001 Census (2000 Labour Force Activity)
Highlight The employment to population ration is very similar across all three Territories. The largest gap is seen in Nunavut where 90% of the Non-Aboriginal population and just under 50% of the Aboriginal population are employed.
0
10
20
30
40
50
60
70
80
90
100
Yukon N.W.T. Nunavut
Empl
oym
ent t
o po
pula
tion
ratio
(%)
Aboriginal Non-Aboriginal

Section 7 –The North
Basic Departmental Data 2004 CIMD, IMB December 2005 QS-3625-040-EE-A1 93
Table 7.5 Employment, Aboriginal and Non-Aboriginal for Yukon, Northwest Territories and Nunavut, 2001 Census (2000 Labour Force Activity)
Notes: 1. The Aboriginal population refers to those people who reported identifying with at least one Aboriginal group, that is, North American Indian, Métis or Inuit. Also included are those who reported being a Treaty Indian or a Registered Indian as defined by the Indian Act of Canada, as well as members of an Indian Band or First Nations.
2. Random rounding is applied to protect confidentiality of individuals. Sources: 2001 Census of Population, INAC, Core Table– T11C-P1 based on Aboriginal Identity.
Yukon N.W.T. NunavutTotal Population Total - Labour force activity 22,485 26,940 16,680
Total labour force 17,945 20,785 11,355 Employed 15,865 18,810 9,380 Unemployed 2,085 1,970 1,975 Not in the labour force 4,540 6,160 5,325Participation rate 79.8 77.2 68.1Unemployment rate 11.6 9.5 17.4Employment/population ratio 70.6 69.8 56.2
Aboriginal Population Total - Labour force activity 4,570 12,360 13,335 Total labour force 3,290 8,040 8,240 Employed 2,410 6,575 6,355 Unemployed 880 1,460 1,885 Not in the labour force 1,285 4,320 5,100Participation rate 72.0 65.0 61.8Unemployment rate 26.7 18.2 22.9Employment/population ratio 52.7 53.2 47.7
Non-Aboriginal Population Total - Labour force activity 17,915 14,580 3,340 Total labour force 14,660 12,745 3,115 Employed 13,455 12,235 3,025 Unemployed 1,205 510 90 Not in the labour force 3,255 1,835 230Participation rate 81.8 87.4 93.3Unemployment rate 8.2 4.0 2.9Employment/population ratio 75.1 83.9 90.6

Section 7 –The North
94 Basic Departmental Data 2004 CIMD, IMB December 2005 QS-3625-040-EE-A1
7.6 Employment Income in the North
Figure 7.6 Employment Income, Aboriginal and Non-Aboriginal, for Yukon, Northwest Territories and Nunavut, 2001 Census (2000 Employment Income)
Highlight The greatest difference between Aboriginal and Non-Aboriginal employment income is seen in Nunavut where the average Aboriginal income is $20,000 while the Non-Aboriginal average is almost $52,000. The least difference is in the Yukon, where the average Aboriginal income is $22,000 while the Non-Aboriginal average is almost $34,000.
10,000
15,000
20,000
25,000
30,000
35,000
40,000
45,000
50,000
55,000
Yukon NWT Nunavut
Aver
age
empl
oym
ent i
ncom
e ($
)
Aboriginal Non-Aboriginal

Section 7 –The North
Basic Departmental Data 2004 CIMD, IMB December 2005 QS-3625-040-EE-A1 95
Table 7.6 Employment Income, Aboriginal and Non-Aboriginal, Yukon, Northwest Territories and Nunavut, 2001 Census (2000 Employment Income)
Notes: 1. The Aboriginal population refers to those people who reported identifying with at least one Aboriginal group, that is, North American Indian, Métis or Inuit. Also included are those who reported being a Treaty Indian or a Registered Indian as defined by the Indian Act of Canada, as well as members of an Indian Band or First Nations.
2. Random rounding is applied to protect confidentiality of individuals. Source: 2001 Census of Population, INAC, Core Table – T19C-P1, based on Aboriginal Identity.
Yukon NWT NunavutTotal Population Total, with and without income 22,485 26,940 16,680
Without employment income 3,700 4,985 4,325With employment income 18,780 21,950 12,355 Less than $20,000 7,250 7,605 6,220 $20,000 - $39,999 5,020 5,095 2,425 $40,000 - $54,999 3,105 3,530 1,475 $55,000 - $69,999 1,970 2,635 1,025 $70,000 and over 1,430 3,085 1,215Average employment income ($) 31,526 36,645 28,215
Aboriginal Population Total, with and without income 4,570 12,360 13,340Without employment income 1,170 3,630 4,185With employment income 3,400 8,730 9,155 Less than $20,000 1,830 4,390 5,720 $20,000 - $39,999 865 2,035 1,770 $40,000 - $54,999 445 1,185 850 $55,000 - $69,999 200 655 450 $70,000 and over 60 465 360Average employment income ($) 21,992 25,332 20,011
Non-Aboriginal Population Total, with and without income 17,915 14,580 3,340Without employment income 2,535 1,360 135With employment income 15,380 13,220 3,200 Less than $20,000 5,420 3,215 500 $20,000 - $39,999 4,155 3,060 660 $40,000 - $54,999 2,660 2,345 620 $55,000 - $69,999 1,770 1,975 575 $70,000 and over 1,375 2,625 855Average employment income ($) 33,633 44,116 51,658


SECTION 8
ADDITIONAL TOPICS

Section 8 –Additional Topics
98 Basic Departmental Data 2004 CIMD, IMB December 2005 QS-3625-040-EE-A1
8.1 Lands
Figure 8.1 Land Administered by INAC 1993-1994 to 2003-2004
Highlight INAC administered land transactions for over 2,700 reserves in 2003-2004, representing over 3.1 million hectares of land.
2,200
2,300
2,400
2,500
2,600
2,700
2,800
1993-94 1994-95 1995-96 1996-97 1997-98 1998-99 1999-00 2000-01 2001-02 2002-03 2003-04
Year
Tota
l num
ber o
f res
erve
s

Section 8 –Additional Topics
Basic Departmental Data 2004 CIMD, IMB December 2005 QS-3625-040-EE-A1 99
Table 8.1 Land Administered by INAC, 1993-1994 to 2003-2004
Sources: Indian Lands Registry System, INAC. 2003 Indian Register, INAC.
Fiscal Year Number of Reserves
Amount of Land (hectares)
Number of Bands
1993-94 2,370 2,750,957.0 6051994-95 2,370 2,750,957.0 6071995-96 2,376 2,751,603.0 6081996-97 2,406 2,751,342.0 6081997-98 2,497 3,044,088.1 6081998-99 2,567 2,945,110.2 6091999-00 2,617 2,995,490.4 6102000-01 2,666 3,035,870.6 6122001-02 2,713 3,102,772.6 6122002-03 2,728 3,109,148.8 6142003-04 2,744 3,123,550.8 614

Section 8 –Additional Topics
100 Basic Departmental Data 2004 CIMD, IMB December 2005 QS-3625-040-EE-A1
8.2 Environment
Figure 8.2 National Contaminated Sites Status
Highlights INAC’s Contaminated Sites Management Policy was approved in August 2002, and encompasses the identification, assessment, remediation and/or risk management and monitoring of such sites. The New Contaminated Sites Management Program has been designed to enable INAC to implement this policy. The program will assist INAC in identifying and remediating contaminated sites to continue work identified to address legal liabilities. Of the 2,538 contaminated issues currently listed as of January 8, 2005, 1,569 have been remediated and closed. The remaining 969 issues are continuing to be addressed through INAC’s Contaminated Sites Management Plan through the Long Term Capital Plan.
235Under remediation
62Remediation
complete - Report pending
44Remediation by
Third Party
1,569Closed issue
628Under
asssessment

Section 8 –Additional Topics
Basic Departmental Data 2004 CIMD, IMB December 2005 QS-3625-040-EE-A1 101
Table 8.3A Summary - First Nations by Province and Treaty
HistoricTreaties NWT BC AB SK MB ON QC NB NS PEI Total
DouglasTreaties 10 10Murray Treaty 1 1
Peace and Friendship 4 15 13 2 34Robinson-
Huron 17 17Robinson-Superior 12 12Upper
Canada 12 12
Williams 7 7
Treaty 1 7 7
Treaty 2 9 9
Treaty 3 1 27 28
Treaty 4 27 7 34
Treaty 5 3 29 5 37
Treaty 6 16 29 2 47
Treaty 7 5 5
Treaty 8 5 8 23 3 39
Treaty 9 37 1 38
Treaty 10 5 2 7
Treaty 11 21 21
Total 26 18 44 67 57 117 6 15 13 2 365

Section 8 –Additional Topics
102 Basic Departmental Data 2004 CIMD, IMB December 2005 QS-3625-040-EE-A1
Table 8.3B First Nations by Province and Treaty
Code PRINCE EDWARD ISLAND Adhesion
PEACE AND FRIENDSHIP TREATIES
1 Abegweit 1725 to 1779
2 Lennox Island 1725 to 1779
Code NOVA SCOTIA Adhesion
PEACE AND FRIENDSHIP TREATIES
18 Acadia 1725 to 1779
20 Annapolis Valley 1725 to 1779
21 Bear River 1725 to 1779
22 Chapel Island First Nation 1725 to 1779
23 Eskasoni 1725 to 1779
30 Glooscap First Nation 1725 to 1779
26 Membertou 1725 to 1779
27 Millbrook 1725 to 1779
19 Paq’tnkek First Nation 1725 to 1779
24 Pictou Landing 1725 to 1779
25 Shubenacadie 1725 to 1779
28 Wagmatcook 1725 to 1779
29 Waycobah 1725 to 1779
Code NEW BRUNSWICK Adhesion
PEACE AND FRIENDSHIP TREATIES
4 Buctouche 1725 to 1779
5 Burnt Church 1725 to 1779
7 Eel Ground 1725 to 1779
8 Eel River Bar First Nation 1725 to 1779
3 Elsipogtog First Nation 1725 to 1779
9 Fort Folly 1725 to 1779
10 Indian Island 1725 to 1779
11 Kingsclear 1725 to 1779
6 Madawaska Maliseet First Nation 1725 to 1779
14 Metepenagiag Mi’kmaq Nation 1725 to 1779
12 Oromocto 1725 to 1779
13 Pabineau 1725 to 1779
15 Saint Mary’s 1725 to 1779
16 Tobique 1725 to 1779
17 Woodstock 1725 to 1779

Section 8 –Additional Topics
Basic Departmental Data 2004 CIMD, IMB December 2005 QS-3625-040-EE-A1 103
Table 8.3B First Nations by Province and Treaty
Code QUEBEC Adhesion
MURRAY TREATY
50 Nation Huronne Wendat 1763
PEACE AND FRIENDSHIP TREATIES
52 Gesgapegiag 1725 to 1779
53 Gespeg 1725 to 1779
51 Listuguj 1725 to 1779
54 Viger 1725 to 1779
TREATY 9
55 Conseil de la Première Nation Abitibiwinni June 7, 1906

Section 8 –Additional Topics
104 Basic Departmental Data 2004 CIMD, IMB December 2005 QS-3625-040-EE-A1
Table 8.3B First Nations by Province and Treaty
Code ONTARIO Adhesion
ROBINSON-HURON
198 Batchewana First Nation Sept. 9, 1850
218 Dokis Sept. 9, 1850
199 Garden River First Nation Sept. 9, 1850
231 Henvey Inlet First Nation Sept. 9, 1850
174 Magnetawan Sept. 9, 1850
200 Mississauga Sept. 9, 1850
220 Nipissing First Nation Sept. 9, 1850
179 Sagamok Anishnawbek Sept. 9, 1850
201 Serpent River Sept. 9, 1850
137 Shawanaga First Nation Sept. 9, 1850
178 Sheshegwaning Sept. 9, 1850
222 Temagami First Nation Sept. 9, 1850
202 Thessalon Sept. 9, 1850
232 Wahnapitae Sept. 9, 1850
136 Wasauksing First Nation Sept. 9, 1850
224 Whitefish Lake Sept. 9, 1850
230 Whitefish River Sept. 9, 1850
ROBINSON-SUPERIOR
194 Animbiigoo Zaagi'igan Anishinaabek Sept. 7, 1850
197 Biinjitiwaabik Zaaging Anishinaabek Sept. 7, 1850
187 Fort William Sept. 7, 1850
188 Gull Bay Sept. 7, 1850
184 Long Lake No. 58 First Nation Sept. 7, 1850
225 Michipicoten Sept. 7, 1850
192 Ojibways of Pic River First Nation Sept. 7, 1850
191 Pays Plat Sept. 7, 1850
195 Pic Mobert Sept. 7, 1850
193 Red Rock Sept. 7, 1850
196 Sandpoint Sept. 7, 1850
190 Whitesand Sept. 7, 1850

Section 8 –Additional Topics
Basic Departmental Data 2004 CIMD, IMB December 2005 QS-3625-040-EE-A1 105
Table 8.3B First Nations by Province and Treaty
Code ONTARIO Adhesion
UPPER CANADA TREATIES
172 Aamjiwaang (Chippewas of Sarnia) 1764 to 1863
180 Aundeck-Omni-Kaning 1764 to 1863
122 Chippewas of Nawash 1764 to 1863
171 Chippewas of Kettle and Stoney Point 1764 to 1863
166 Chippewas of the Thames 1764 to 1863
123 Chippewas of Saugeen 1764 to 1863
181 M’chigeeng First Nation 1764 to 1863
120 Mississauga of the Credit 1764 to 1863
176 Sheguiandah First Nation 1764 to 1863
121 Six Nations of the Grand River 1764
170 Walpole Island 1764 to 1863
173 Zhubaahassing First Nation 1764 to 1863
WILLIAMS TREATIES / UPPER CANADA TREATIES
160 Alderville Nov. 15, 1923
141 Beausoleil Oct. 31, 1923
138 Chippewas of Georgina Island Oct. 31, 1923
139 Chippewas of Mnjikaning (Rama) Nov. 15, 1923
161 Curve Lake Nov. 15, 1923
162 Hiawatha Nov. 15, 1923
140 Mississauga of Scugog Nov. 15, 1923

Section 8 –Additional Topics
106 Basic Departmental Data 2004 CIMD, IMB December 2005 QS-3625-040-EE-A1
Table 8.3B First Nations by Province and Treaty
Code ONTARIO Adhesion
TREATY 3
153 Anishinabe of Wauzhushk Onigum Oct. 3, 1873
125 Anishnaabeg of Naongashiing Oct. 3, 1873
124 Big Grassy Oct. 3, 1873
265 Buffalo Point First Nation Oct. 3, 1873
126 Couchiching First Nation Oct. 3, 1873
148 Eagle Lake Oct. 3, 1873
149 Grassy Narrows First Nation Oct. 3, 1873
154 Iskatewizaagegan No.39 Independent FN Oct. 3, 1873
189 Lac Des Mille Lacs Oct. 3, 1873
127 Lac La Croix Oct. 3, 1873
205 Lac Seul June 9, 1874
128 Naicatchewenin Oct. 3, 1873
158 Naotkamegwanning Oct. 3, 1873
129 Nicickousemenecaning Oct. 3, 1873
151 Northwest Angle No. 33 Oct. 3, 1873
152 Northwest Angle No. 37 Oct. 3, 1873
235 Obashkaandagaang Oct. 3, 1873
147 Ochiichagwe'babigo'ining First Nation Oct. 3, 1873
258 Ojibway Nation of Saugeen Oct. 3, 1873
131 Ojibways of Onigaming First Nation Oct. 3, 1873
130 Rainy River Oct. 3, 1873
132 Seine River First Nation Oct. 3, 1873
155 Shoal Lake No. 40 Oct. 3, 1873
133 Stanjikoming First Nation Oct. 3, 1873
150 Wabaseemoong Independent Nations Oct. 3, 1873
156 Wabauskang First Nation Oct. 3, 1873
157 Wabigoon Lake Ojibway Nation Oct. 3, 1873
TREATY 5
237 Deer Lake 1910
238 North Spirit Lake 1910
208 Pikangikum Aug. 4, 1876
236 Poplar Hill Aug. 4, 1876
211 Sandy Lake June 9, 1910

Section 8 –Additional Topics
Basic Departmental Data 2004 CIMD, IMB December 2005 QS-3625-040-EE-A1 107
Table 8.3B First Nations by Province and Treaty
Code ONTARIO Adhesion TREATY 9
142 Albany Aug. 3, 1905 242 Aroland 1905
143 Attawapiskat Aug. 3, 1905
207 Bearskin Lake July 5, 1929
228 Brunswick House July 25, 1906
216 Cat Lake July 21, 1905
221 Chapleau Cree First Nation August 1905
229 Chapleau Ojibway August 1905
182 Constance Lake Aug. 3, 1905
183 Eabametoong First Nation July 19, 1906
227 Flying Post July 16, 1906
215 Fort Severn July 28, 1930
185 Ginoogaming First Nation Aug. 9, 1906
210 Kasabonika Lake July 5, 1929
325 Keewaywin June 9, 1910
212 Kingfisher July 5, 1929
209 Kitchenuhmaykoosib Inninuwug 1929
186 Martin Falls July 25, 1905
219 Matachewan June 20, 1906
226 Mattagami July 7, 1906
326 McDowell Lake July 18, 1930
203 Mishkeegogamang July 23, 1905
223 Missanabie Cree July 30, 1906
144 Moose Cree First Nation Aug. 9, 1905
213 Muskrat Dam Lake July 5, 1929
239 Neskantaga First Nation July 19, 1906
241 Nibinamik First Nation July 19, 1906
204 North Caribou Lake July 18, 1930
214 Sachigo Lake July 5, 1929
259 Slate Falls Nation July 21, 1905
145 Taykwa Tagamou Nation Aug. 21, 1905
233 Wahgoshig June 7, 1906
206 Wapekeka July 5, 1929
234 Wawakapewin July 5, 1929
240 Webequie July 19, 1906
146 Weenusk July 28, 1930
217 Wunnumin July 5, 1929

Section 8 –Additional Topics
108 Basic Departmental Data 2004 CIMD, IMB December 2005 QS-3625-040-EE-A1
Table 8.3B First Nations by Province and Treaty
Code MANITOBA Adhesion
TREATY 1
261 Brokenhead Ojibway Nation Aug. 3, 1871
262 Fort Alexander Aug. 3, 1871
287 Long Plain Aug. 3, 1871
269 Peguis Aug. 3, 1871
273 Roseau River Aug. 3, 1871
283 Sandy Bay Aug. 3, 1871
293 Swan Lake Aug. 3, 1871
TREATY 2
316 Dauphin River Aug. 21, 1871
280 Ebb and Flow Aug. 21, 1871
286 Keeseekoowenin Aug. 21, 1871
271 Lake Manitoba Aug. 21, 1871
275 Lake St. Martin Aug. 21, 1871
274 Little Saskatchewan Aug. 21, 1871
279 O-Chi-Chak-Ko-Sipi First Nation Aug. 21, 1871
272 Pinaymootang First Nation Aug. 21, 1871
281 Skownan First Nation 1871
TREATY 3
265 Buffalo Point First Nation Oct. 3, 1873
TREATY 4
294 Gamblers Sept. 21, 1874
282 Pine Creek Sept. 24, 1875
291 Rolling River Sept. 21, 1874
314 Sapotaweyak Cree Nation Sept. 24, 1875
292 Tootinaowaziibeeng Treaty Reserve Sept. 21, 1874
285 Waywayseecappo First Nation Sept. 21, 1874
324 Wuskwi Sipihk First Nation 1874

Section 8 –Additional Topics
Basic Departmental Data 2004 CIMD, IMB December 2005 QS-3625-040-EE-A1 109
Table 8.3B First Nations by Province and Treaty
Code MANITOBA Adhesion
TREATY 5
266 Berens River Sept. 20, 1875
267 Bloodvein July 26, 1876
301 Bunibonibee Cree Nation July 29, 1909
309 Chemawawin Cree Nation 1875
276 Cross Lake First Nation Sept. 24, 1875 and July 15, 1908
264 Fisher River Aug. 24, 1908
305 Fox Lake Aug. 10, 1910
297 Garden Hill First Nations Aug. 13, 1909
296 God's Lake First Nation Aug. 6, 1909
310 Grand Rapids First Nation Sept. 27, 1875
263 Hollow Water July 26, 1876
268 Kinonjeoshtegon First Nation July 26, 1876
260 Little Black River Sept. 7, 1876
270 Little Grand Rapids Aug. 4, 1876
302 Manto Sipi Cree Nation Aug. 6, 1909
312 Mosakahiken Cree Nation Sept. 7, 1876
313 Nisichawayasihk Cree Nation July 30, 1908
278 Norway House Cree Nation Sept. 24, 1875
315 Opaskwayak Cree Nation Sept. 7, 1876
327 Pauingassi First Nation Aug. 4, 1876
277 Poplar River First Nation Sept. 20, 1875
300 Red Sucker Lake Aug. 13, 1909
298 St. Theresa Point Aug. 13, 1909
303 Sayisi Dene First Nation Aug. 1, 1910
307 Shamattawa First Nation Aug. 10, 1910
306 Tataskweyak Cree Nation June 26, 1908
323 War Lake First Nation June 26, 1908
299 Wasagamack First Nation Aug.13, 1909
304 York Factory First Nation 1910

Section 8 –Additional Topics
110 Basic Departmental Data 2004 CIMD, IMB December 2005 QS-3625-040-EE-A1
Table 8.3B First Nations by Province and Treaty
Code MANITOBA Adhesion
TREATY 6
328 Marcel Colomb First Nation Aug. 10, 1898
311 Mathias Colomb Aug. 10, 1898
TREATY 10
308 Barren Lands Aug. 19, 1907
317 Northlands 1906

Section 8 –Additional Topics
Basic Departmental Data 2004 CIMD, IMB December 2005 QS-3625-040-EE-A1 111
Table 8.3B First Nations by Province and Treaty
Code SASKATCHEWAN Adhesion
TREATY 4
378 Carry The Kettle Sept. 25, 1877
366 Cote First Nation Sept. 15, 1874
361 Cowessess Sept. 15, 1874
389 Day Star Sept. 18, 1874
390 Fishing Lake First Nation Aug. 24, 1876
391 Gordon Sept. 18, 1874
362 Kahkewistahaw Sept. 15, 1874
393 Kawacatoose Sept. 25, 1877
367 Keeseekoose Sept. 24, 1875
368 The Key First Nation Sept. 24, 1875
377 Kinistin Aug. 24, 1876
379 Little Black Bear Sept. 15, 1874
381 Muscowpetung Sept. 8, 1875
392 Muskowekwan Sept. 15, 1874
380 Nekaneet 1874
408 Ocean Man Sept. 9, 1875
363 Ochapowace Sept. 15, 1874
382 Okanese Sept. 9, 1875
383 Pasqua First Nation Sept. 15, 1874
384 Peepeekisis Sept. 15, 1874
409 Pheasant Rump Nakota Sept. 9, 1875
385 Piapot Sept. 9, 1875
364 Sakimay Sept. 15, 1874
386 Standing Buffalo 1874
387 Star Blanket Sept. 15, 1874
365 White Bear Sept. 9, 1875
376 Yellow Quill Aug. 24, 1876

Section 8 –Additional Topics
112 Basic Departmental Data 2004 CIMD, IMB December 2005 QS-3625-040-EE-A1
Table 8.3B First Nations by Province and Treaty
Code SASKATCHEWAN Adhesion
TREATY 5
350 Cumberland House Cree Nation Sept. 7, 1876
356 Red Earth 1909
357 Shoal Lake of the Cree Nation Sept. 7, 1876
TREATY 6
406 Ahtahkakoop Aug. 23, 1876
369 Beardy's and Okemasis Aug. 28, 1876
399 Big Island Lake Cree Nation June 25, 1913
404 Big River Sept. 3, 1878
395 Flying Dust First Nation Sept. 3, 1878 and Sept. 13, 1878
397 Island Lake First Nation Sept. 9, 1876
370 James Smith Aug. 23, 1876
353 Lac La Ronge Feb. 11, 1889
340 Little Pine July 2, 1879
341 Lucky Man July 2, 1879
396 Makwa Sahgaiehcan First Nation Sept. 9, 1876, 1878 and 1929
374 Mistawasis Aug. 23, 1876
354 Montreal Lake Feb. 11, 1889
342 Moosomin 1879
343 Mosquito, Grizzly Bear's Head, Lean Man Aug. 29, 1878
375 Muskeg Lake Aug. 23, 1876
371 Muskoday First Nation Aug. 23, 1876
373 One Arrow Aug. 28, 1876
344 Onion Lake Aug. 19, 1878
405 Pelican Lake Aug. 23, 1876
355 Peter Ballantyne Cree Nation Aug. 10, 1898
345 Poundmaker Aug. 23, 1876
346 Red Pheasant Aug. 23, 1876
347 Saulteaux Aug. 18, 1954 and May 15, 1956
348 Sweetgrass Sept. 9, 1876
360 Sturgeon Lake First Nation Aug. 23, 1876
349 Thunderchild First Nation 1879
402 Waterhen Lake Nov. 8, 1921
407 Witchekan Lake Nov. 21, 1950

Section 8 –Additional Topics
Basic Departmental Data 2004 CIMD, IMB December 2005 QS-3625-040-EE-A1 113
Table 8.3B First Nations by Province and Treaty
Code SASKATCHEWAN Adhesion
TREATY 8
359 Black Lake July 25, 1899 and July 27, 1899
401 Clearwater River Dene Aug. 4, 1899
351 Fond du Lac July 25, 1899 and July 27, 1899
TREATY 10
403 Birch Narrows First Nation 1906/1907
398 Buffalo River Dene Nation Aug. 28, 1906
394 Canoe Lake Cree First Nation Sept. 19, 1906
400 English River First Nation Aug. 28, 1906
352 Hatchet Lake Aug. 22, 1907
Code ALBERTA Adhesion
TREATY 6
438 Alexander Aug. 21, 1877
437 Alexis Aug. 21, 1877
460 Beaver Lake Cree Nation Sept. 9, 1876
464 Cold Lake First Nations Sept. 9, 1876
440 Enoch Cree Nation Sept. 25, 1877
443 Ermineskin Tribe 1876/1877/1878
465 Frog Lake Aug. 19, 1878
469 Heart Lake Sept. 19, 1876
466 Kehewin Cree Nation Sept. 9, 1876
439 Louis Bull Sept. 25, 1877
442 Montana Dec. 8, 1882
431 O'Chiese May 13, 1950
441 Paul Aug. 21, 1877
462 Saddle Lake Sept. 9, 1876
444 Samson 1876/1877/1878
434 Sunchild First Nation May 25, 1944

Section 8 –Additional Topics
114 Basic Departmental Data 2004 CIMD, IMB December 2005 QS-3625-040-EE-A1
Table 8.3B First Nations by Province and Treaty
Code ALBERTA Adhesion
TREATY 7
473 Bearspaw (part of Stoney Band) Sept. 22, 1877
435 Blood Sept. 22, 1877
433 Chiniki (part of Stoney Band) Sept. 22, 1877
436 Pikani Nation Sept. 22, 1877
430 Siksika Nation Sept. 22, 1877
432 Tsuu T'ina Nation Sept. 22, 1877
475 Wesley (part of Stoney Band) Sept. 22, 1877
TREATY 8
463 Athabasca Chipewyan First Nation Aug. 4, 1899
445 Beaver First Nation July 8, 1899
458 Bigstone Cree Nation Aug. 14, 1899
470 Chipewyan Prairie First Nation Aug. 10, 1900
448 Dene Tha’ June 23, 1900
450 Driftpile First Nation June 21, 1899
451 Duncan's First Nation July 1, 1899
467 Fort McKay First Nation Aug. 4, 1899
468 Fort McMurray First Nation Aug. 4, 1899
449 Horse Lake First Nation July 6, 1899
452 Kapawe'no First Nation June 21, 1899
447 Little Red River Cree Nation July 8, 1899
476 Loon River Cree June 21, 1899
453 Lubicon Lake 1899-1900
461 Mikisew Cree First Nation July 13, 1899
454 Sawridge June 21, 1899
477 Smith's Landing First Nation July 17, 1899
455 Sturgeon Lake Cree Nation June 21, 1899 and June 8, 1900
456 Sucker Creek June 21, 1899
457 Swan River First Nation June 21, 1899
446 Tallcree July 8, 1899
459 Whitefish Lake 1900
474 Woodland Cree First Nation 1899-1900

Section 8 –Additional Topics
Basic Departmental Data 2004 CIMD, IMB December 2005 QS-3625-040-EE-A1 115
Table 8.3B First Nations by Province and Treaty
Code BRITISH COLUMBIA Adhesion
DOUGLAS TREATIES
664 Esquimalt First Nation 1850
626 Kwakiutl Band Council 1851
652 Pauquachin First Nation 1852
640 Scia’new First Nation (Beecher Bay) 1850
648 Snuneymuxw First Nation 1854
656 Songhees First Nation 1850
653 Tsartlip First Nation 1852
654 Tsawout First Nation 1852
655 Tseycum First Nation 1852
657 T’Sou-ke Nation 1850
TREATY 8
547 Blueberry River First Nations May 13, 1900
548 Doig River May 13, 1900
543 Fort Nelson First Nation Aug. 15, 1910
546 Halfway River First Nation 1899-1900
618 McLeod Lake March 27, 2000
544 Prophet River Band 1899
542 Saulteau First Nations 1899-1900
545 West Moberly First Nations 1899-1900

Section 8 –Additional Topics
116 Basic Departmental Data 2004 CIMD, IMB December 2005 QS-3625-040-EE-A1
Table 8.3B First Nations by Province and Treaty
Code NORTHWEST TERRITORIES Adhesion
TREATY 8
762 Deninu K'ue First Nation 1900
761 K'atlodeeche First Nation June 21, 1899
764 Lutsel K'e Dene July 25, 1900
759 Salt River First Nation July 17, 1899
763 Yellowknives Dene First Nation July 25, 1900
TREATY 11
758 Acho Dene Koe July 17, 1922
755 Aklavik 1921-1922
771 Behdzi Ahda First Nation 1921-1922
774 Dechi Laoti' First Nation Aug. 22, 1921
760 Deh Gah Gotie Dene Council June 27, 1921
754 Deline 1921-1922
765 Dog Rib Rae Aug. 22, 1921
752 Fort Good Hope July 21, 1921
773 Gameti First Nation Aug. 22, 1921
753 Gwicha Gwich'in July 26, 1921
780 Inuvik Native 1921
770 Jean Marie River First Nation 1921-1922
768 Ka'a'gee Tu First Nation 1921-1922
757 Liidli Kue First Nation July 11, 1921
766 Nahanni Butte July 17, 1922
756 Pehdzeh Ki First Nation July 13, 1921
767 Sambaa K'e (Trout Lake) Dene July 17, 1922
751 Tetlit Gwich'in July 28, 1921
750 Tulita Dene July 15, 1921
772 West Point First Nation 1921-1922
769 Wha Ti First Nation Aug.22, 1921

Section 8 –Additional Topics
Basic Departmental Data 2004 CIMD, IMB December 2005 QS-3625-040-EE-A1 117
8.3 Treaties
Highlights The Government of Canada and the courts understand treaties between the Crown and Aboriginal peoples to be solemn agreements that set out promises, obligations and benefits for both parties. Under the Robinson Superior (1850) and Robinson-Huron (1850) Treaties, the Crown secured an area of about 84,000 square kilometers in what is today central and northern Ontario. Even earlier historic treaties include the Beaver Hunting Grounds Treaty (1701) and the Treaty of Swegatchy (1760). Note: See glossary for explanations of Peace and Friendship Treaties, Douglas Treaties, and Williams Treaties. Sources: Treaty Research Reports, Treaties and Historical Research Centre, INAC. Treaty Files/Band Histories, Claims and Historical Research Centre, INAC.

Section 8 –Additional Topics
118 Basic Departmental Data 2004 CIMD, IMB December 2005 QS-3625-040-EE-A1
8.4 Comprehensive Claims
Highlights Comprehensive land claim agreements are modern treaties which resolve issues of Aboriginal rights and title, and provide certainty regarding ownership, use and management of lands and resources. In most instances, a comprehensive land claim agreement can also include Aboriginal self-government arrangements. Sixteen final agreements have been brought into effect since the Comprehensive Land Claims Policy of the Government of Canada was introduced in 1973. The Comprehensive Claims Branch (CCB) is responsible for the negotiation of comprehensive land claims, including self-government arrangements, with Aboriginal groups in various regions of Canada. CCB currently manages 26 comprehensive land claims and related processes involving 130 Aboriginal communities with approximately 114,750 beneficiaries, in eight provinces and three territories. Seven tables are at the final agreement stage; 11 are in agreement-in-principle negotiations; and seven remain in the early stages of discussion. CCB is also responsible for negotiating one stand-alone self-government agreement in Northern Quebec. During fiscal year 2004-2005, a number of Final Agreements were negotiated and are proceeding to ratification: – In Yukon, final comprehensive land claim agreements and separate self-
government agreements were concluded with the Kluane, Carcross/Tagish and Kwanlin Dun First Nations. The Kluane agreements came into effect on February 2, 2004. The Carcross/Tagish decided to hold a second ratification vote in a referendum held on February 10-12, 2005. Kwanlin Dun First Nation members and beneficiaries ratified its agreements in a vote held November 5 and 6, 2004 and the agreements are expected to come into effect April 1, 2005.
– In the Northwest Territories (NWT), a final comprehensive claims and self-government agreement was ratified by the Tlicho in June 2003. It is the first treaty in the NWT to incorporate land claims and constitutionally protected self-government provisions. Federal enabling legislation (the Tlicho Land Claims and Self-Government Act) received Royal Assent on February 15, 2005.
– In Newfoundland and Labrador, on January 22, 2005, at a signing ceremony in Nain, Newfoundland and Labrador representatives from the Labrador Inuit Association, Government of Canada and Government of Newfoundland and Labrador signed the Labrador Inuit Land Claims Agreement. This Agreement represents the first modern treaty in Atlantic Canada. It combines land claims and self-government components. Enabling legislation is expected to be introduced in Parliament in Spring 2005.

Section 8 –Additional Topics
Basic Departmental Data 2004 CIMD, IMB December 2005 QS-3625-040-EE-A1 119
The Federal Treaty Negotiation Office (FTNO) in Vancouver is responsible for managing Canada's participation in the British Columbia treaty process and is also managing a stand-alone self-government negotiation with one First Nation. There are currently 54 accepted claims which have organized into 43 Aboriginal groups for the purposes of negotiation, involving 125 First Nation communities with approximately 77,000 treaty beneficiaries. During the 2003-2004 fiscal year, agreements-in-principle were signed with the Lheidli T'enneh, Maa-nulth, Sliammon and Tsawwassen First Nations. These tables have commenced final agreement negotiations. The Snuneymuxw First Nation table also concluded an agreement-in-principle and is expected to hold its community ratification in the winter of 2004. FTNO is also responsible for stand-alone self-government negotiations with the McLeod Lake Indian First Nation. Source: 2004-2005, Comprehensive Claims, INAC.

Section 8 –Additional Topics
120 Basic Departmental Data 2004 CIMD, IMB December 2005 QS-3625-040-EE-A1
8.5 Specific Claims
Highlights The Specific Claims Branch manages the Specific Claims and Treaty Land Entitlement policies to resolve Canada's lawful obligations through alternative disputes resolution mechanisms rather than litigation. The objective of the Specific Claims program is to address past grievances related to the administration of Indian lands and other assets, as well as the fulfilment of treaties, in a manner that strengthens partnerships, aids community healing, builds capacity and provides First Nations with needed lands and resources. Benefits of settlement to First Nations include resolution of an historic grievance, financial resources and/or land to support social and economic development and investment for future generations, strengthened governance. The process also creates or reinforces mutual trust and encourages strong partnerships among First Nations, provincial and territorial governments and the private sector. Since the inception of the program and up to March 2004, the Specific Claims Branch has settled 263 specific and treaty land entitlement claims. During the fiscal year 2003-2004, the Branch settled 14 specific claims with a total settlement value of $259 million: - In Alberta, specific claim agreements were concluded with The Siksika Nation,
Fort McKay First Nation, and Blood First Nation; - In British Columbia, specific claim agreements were concluded with The Sumas
First Nation and McLeod Lake-Leonard J. Solonas; - In Manitoba, a specific claim agreement was concluded with Mathias Colomb
First Nation; - In Ontario, specific claim agreements were concluded with Aamjiwnaang,
Chippewas of Kettle and Stony Point, and Michipicoten First Nations; - In Saskatchewan, specific claim agreements were concluded with Moosomin and
Thunderchild First Nations As of December 31, 2004, 113 specific claims were in negotiation, with a further 638 under assessment, and 39 at the Indian Specific Claims Commission (ISCC). Source: 2004-2005, Specific Claims, INAC.

Section 8 –Additional Topics
Basic Departmental Data 2004 CIMD, IMB December 2005 QS-3625-040-EE-A1 121
8.6 Community Economic Development Organizations (CEDOs)
Figure 8.6 Total Number of All Types of Community Economic Development Organizations (CEDOs), Canada, 1993-1994 to 2003-2004
Highlight Community Economic Development Organizations (CEDOs) are managed by, and accountable to, First Nations communities. They assume responsibility for the delivery of programs and services provided up to 1990 by the department. INAC regional offices work in partnership with CEDOs to establish First Nation control over local program priorities, expenditures, design, delivery and advisory services.
0
100
200
300
400
500
1993-94 1994-95 1995-96 1996-97 1997-98 1998-99 1999-00 2000-01 2001-02 2002-03 2003-04
Year
Tota
l CED
Os

Section 8 –Additional Topics
122 Basic Departmental Data 2004 CIMD, IMB December 2005 QS-3625-040-EE-A1
Table 8.6 Total Number of All Types of Community Economic Development Organizations (CEDOs), Canada, 1993-1994 to 2003-2004
Notes: 1. Data may differ from previously reported numbers due to revisions to the database. 2. Number of CEDOs that provided an “acceptable” Economic Development Report as of October 31, 2004. Source: 1993-2003 Information Management Branch, INAC.
Fiscal year Total CEDOs All Types
1993-94 3861994-95 4291995-96 4151996-97 4711997-98 4831998-99 4311999-00 4152000-01 3682001-02 4112002-03 4082003-04 376

GLOSSARY

Glossary
124 Basic Departmental Data 2004 CIMD, IMB December 2005 QS-3625-040-EE-A1
Glossary
Assisted Living (Formerly Adults in Institutional Care): INAC provides funding for care in Type I and II institutions which may be located on a reserve or operated by the province. Individuals are assessed according to provincial standards to determine the level of care required. Residents of institutions are generally elderly and disabled persons in need of supervision and assistance. Type I: "...required by a person who is ambulant and/or independently mobile, who has decreased physical and/or mental faculties, who requires primarily supervision and/or assistance with activities of daily living and provision for meeting psycho-social needs through social and recreational services. The period of time during which care is required is indeterminate and related to the individual condition"; Type II: “...required by a person with a relatively stabilized (physical or mental) chronic disease or functional disability, who, having reached the apparent limit of his recovery, is not likely to change in the near future, who has relatively little need for the diagnostic and therapeutic services of a hospital but who requires availability of personal care on a continuing 24-hour basis, with medical and professional nursing supervision and provision for meeting psycho-social needs. The period of time during which care is required is unpredictable but usually consists of a matter of months or years". (Source: Adult Long Term Institutional Care, Report of the Sub-Committee on Special Services in Hospitals, 1984). Average Annual Growth Rate: The formula used to calculate average annual growth rates was: AAGR = (X1 / X0) 1/n - 1 where: X1 = data for the most recent year in period X0 = data for the earliest year in period n = length of period (years). Bill C-31: "Passed by Parliament in June 1985, Bill C-31 contained important amendments to the Indian Act. It had three principal goals: to eliminate discrimination based on gender and marital status in the Indian Act; to restore Indian status to victims of past discrimination; and to enable Indian bands to assume control over their membership. As a result of Bill C-31, the Indian Act now essentially treats men and women equally when determining status, and prevents anyone from gaining or losing status through marriage" (Source: Lands, Revenues and Trust Review, Phase II Report INAC). Children in Care: The number of children who were placed away from parental care to protect them from neglect and/or abuse, or to prevent neglect and/or abuse. The children were placed either in foster care, group homes or institutional care. Devolution: Refers to the transfer of services and programs from INAC control to Indian bands, tribal councils and other Indian authorities. Dwellings: Defined as self-contained living accommodations (with at least one separate bedroom), and considered to be a main residence, irrespective of occupancy, level of completeness, or need for renovation or replacement.

Glossary
Basic Departmental Data 2004 CIMD, IMB December 2005 QS-3625-040-EE-A1 125
Glossary (continued)
Geographic Zones:
Urban: A zone where a First Nation is located within 50 km from the nearest service centre having year-round road access. Rural: A zone where a First Nation is located between 50 km and 350 km from the nearest service centre having year-round road access. Remote: A zone where a First Nation is located over 350 km from the nearest service centre having year-round road access. Special Access: A zone where a First Nation has no year-round road access to the nearest service centre and, as a result, experiences a higher cost of transportation. Service Centre: A community where the following services are available:
a) - supplies, material and equipment (i.e. for construction, office operations, etc.); b) - a pool of skilled or semi-skilled labour; c) - at least one financial institution, bank, trust company, credit union, etc.; d) - provincial services (such as health services, community and health services, environment services); and e) - Federal services (such as Canada Post, employment centre). Income Assistance: The Department of Indian Affairs and Northern Development (INAC) Income Assistance Program is one component of the departmental Social Development Program. INAC has engaged in on-reserve income assistance activities with the broad objective of providing individuals and families with the means to meet basic needs for food, clothing and shelter. INAC also funds special needs allowances for goods and services which are essential to the physical or social well-being of an eligible recipient but are not included as items of basic need, such as basic items of furniture and cost of a physician recommended diet. The department’s present involvement in social assistance activities is primarily to provide funding to First Nations who in turn deliver programs and services to community members. INAC must adopt the terms and conditions of provincial and territorial general assistance programs. While INAC may directly deliver the income assistance program, the program has been largely devolved. In 2000-2001, 538 First Nations administered their own program (This figure does not include First Nations functioning under self-government arrangements). Income Assistance Recipients: Are defined as the combined total of the number of families (heads of household) and single individuals who are eligible to receive income assistance funding. Income Assistance Beneficiaries: Are defined as the combined total of the number of persons in a family and single individuals. Indian Lands Registry System (ILRS): The Indian Lands Registry System (ILRS) is a web-based application consisting of a database of instruments registered in the Indian Lands Registry relating to Reserve Lands and Crown Lands. The ILRS is the authoritative source for reserve names.

Glossary
126 Basic Departmental Data 2004 CIMD, IMB December 2005 QS-3625-040-EE-A1
Glossary (continued) Indian Lands Registry System (ILRS) (continued) The First Nation Land Management Act allows First Nations to opt out of the land tenure provisions of the Indian Act, and in its place, to substitute their own land management codes to manage reserve lands and resources. This Act states that a First Nation Land Register shall be established. A First Nation Land Register System will be available early in the year 2003. Indian Register: "The Indian Register is a list of Registered Indians (as defined in the Indian Act) kept by INAC. Information on this list concerning the demographic characteristics of the Indian population is updated regularly by band officials and published for December 31 of each year". Life Expectancy: "Is an estimation of the average number of years of life remaining to each member of a group of persons. It is calculated on the basis of observed age-specific mortality rates at any particular moment in time, assuming that the risks of dying remain constant from the moment of estimation until the death of all members of the group" (Source: Wilkins, Russell, Health Status in Canada, 1926-1976, Institute for Research on Public Policy, May 1980). Reserves: As defined in the Indian Act, a tract of land, the legal title to which is vested in Her Majesty that has been set apart by Her Majesty for the use and benefit of a band. Self-Government: Pursuant to Canada’s Inherent Right Policy, the Self-Government Branch manages the negotiation of practical and workable self-government arrangements with Aboriginal groups and with relevant provinces or territories in areas affecting their jurisdiction and interests. The branch is also responsible for policy development and the coordination of activities that support negotiations, strengthen Aboriginal governance and develop new fiscal relationships with Aboriginal governments. Sewage Disposal System: Refers to the presence of one of the following types of sewage disposal systems: Piped, Community Septic Field/Tank, Individual Septic Field/Tank, Septic Truck and Other. Sewage Disposal System includes the presence of lift stations, septic systems, force mains, sewage collection mains, manholes, service connections, treatment plants, lagoons and outfall sewers and appurtenances, but excludes plumbing and fixtures. Specific Claim: The Specific Claims Branch is responsible for the assessment, negotiation and settlement, or other form of final disposition, of Indian claims against Canada, which are submitted to the government under this program. Treaties: The Peace and Friendship Treaties of 1725-79 involve 34 Mi’kmaq and Maliseet First Nations in Nova Scotia, New Brunswick, Prince Edward Island and the Gaspé region of Québec. The Peace and Friendship Treaties did not require the Mi’kmaq and Maliseet signatories to surrender any rights to land or resources. From 1850-54, Governor James Douglas entered into treaties with 14 First Nations on Vancouver Island, creating the Douglas Treaties, sometimes called the Vancouver Island Treaties.

Glossary
Basic Departmental Data 2004 CIMD, IMB December 2005 QS-3625-040-EE-A1 127
Glossary (continued)
Treaties: (continued) In 1923, the Government of Canada acquired about 5.2 million hectares of land in central and southern Ontario through two Williams Treaties. The first was made on October 31, 1923 with the Chippewa of Christian Island, Georgian Island, and Rama. The second on November 15, 1923 with the Mississauga of Rice Lake, Mud Lake, Scugog Lake, and Alderville. Water Delivery Service: Refers to the presence of one of the following types of water delivery systems: Piped, Community Well, Individual Well, Truck A, Truck B and Other. Note: Although Water Delivery includes Truck B water delivery (truck to barrel), the houses have not been plumbed to accept the services (i.e., cistern and pressurized system) and can be considered inadequate.