Embed Size (px)
Citation preview
Magnetic Resonance Studies of a Redox Probe in a Reverse SodiumBis(2-ethylhexyl)sulfosuccinate/Octane/Water Microemulsion
Daniel A. Binks, Neil Spencer, John Wilkie, and Melanie M. Britton*School of Chemistry, UniVersity of Birmingham, Edgbaston, Birmingham, B15 2TT
ReceiVed: July 19, 2010
The location and dynamics of the [Ru(bpy)3]2+ complex inside sodium bis(2-ethylhexyl)sulfosuccinate (AOT)/octane/water microemulsions were studied, over a range of droplet sizes, using magnetic resonancespectroscopy, dynamic light scattering, and molecular modeling. The T1 magnetic resonance relaxation timesof water inside the AOT reverse micelles (RMs) were measured in both the presence and the absence of the[Ru(bpy)3]2+ complex. Large size droplet RMs (ω0 > 20) were found to be sensitive to the presence of the[Ru(bpy)3]2+ complex, which was detected through a decrease in the T1 relaxation time of the water insidethe RM core, as compared to RMs containing no [Ru(bpy)3]2+. However, no difference in T1 relaxation timewas observed for water in small RMs (ω0 < 20). Two-dimensional 1H-1H NOESY spectroscopy was performedto probe the location of the [Ru(bpy)3]2+ complex in both small (ω0 ) 9.2) and large droplets (ω0 ) 34.9).Cross-peaks between protons in the AOT tail groups and bipyridyl ligands were observed, showing that the[Ru(bpy)3]2+ complex resided in the RM interface. Finally, molecular modeling simulations were performedto probe the location of the [Ru(bpy)3]2+ complex and the structure of the RM. Molecular dynamics simulationsconfirmed the location of the [Ru(bpy)3]2+ complex in the RM interface and detected differences in the surfactantlayer and the amount of water penetration into this layer with changing droplet size.
Introduction
Reverse micelles (RMs) are composed of water sequesteredby a surfactant in a continuous organic phase. These self-assembled structures form droplets of water ranging in anintramicellar diameter from approximately 1 to 20 nm, depend-ing on the molar water-to-surfactant ratio (ω0).1 The aqueouscore of RMs provides a highly adaptable environment for avariety of chemical and biochemical reactions2,3 and for thesynthesis of nanoparticles,4 as well as providing a model forunderstanding the behavior of confined water in biologicalsystems.5 For all of these applications, an understanding of thechemistry, dynamics, and structure within the interior of thedroplets is important. Using a variety of molecular probes andspectroscopic techniques, it is possible to probe intramicellarparameters such as pH,6,7 ionic strength,8 microviscosity,9,10 andmicropolarity.11
The fluorescence probe [Ru(bpy)3]2+ has been used to studythe microstructure inside RMs formed with sodium bis(2-ethylhexyl)sulfosuccinate (AOT).12-15 Luminescence decayprofiles have provided information about the micellar dropletconcentration, the surfactant aggregation number, the rate ofexchange between droplets, and the solubilized water content.12,13
There have also been investigations into the location of[Ru(bpy)3]2+ in the water pool and its application as a probemolecule of the intramicellar medium in both AOT and CTABRMs.14,15 In these studies, emission spectra were found to besensitive to the environment of the probe molecule, and bycomparing emission maxima and lifetimes between bulk andintramicellar water, it was determined that [Ru(bpy)3]2+ wasbound to the surfactant-water interface, for water-to-surfactantmole ratios of 5 < ω0 > 30. These measurements, however, relied
on the shifts of spectral peaks to explain the molecularlocation14,15 of the probe but did not measure it directly.
The location of probe molecules also has an impact on the rateconstants of any chemical processes in which they are involved.For example, quenching rate constants are sensitive to the relativelocation of probe chromophores, such as [Ru(bpy)3]2+, in RMs.15
There has also been recent interest16,17 in the ability of [Ru(bpy)3]2+
to catalyze the Belousov-Zhabotinksy reaction in an AOTmicroemulsion and act as a redox indicator in the RM. By usingthe color change produced, as the oxidative state of the rutheniumion changes, it has been possible to optically visualize patternsformed in the Ru(bpy)3-catalyzed BZ reaction in an AOT micro-emulsion. Accompanied by this color change is a change in theoxidative state of the complex, which produces a magneticsusceptibility change. This change in paramagnetism of the[Ru(bpy)3]2+ complex has been exploited by Armstrong and co-workers, who have used it18 as a magnetic resonance redox probein purely aqueous systems.
In this work, the location of the [Ru(bpy)3]2+ complex hasbeen probed directly using two-dimensional (2D) 1H-1H nuclearOverhauser effect spectroscopy (NOESY) experiments andmolecular modeling, both for the first time. The applicabilityof this complex as a magnetic resonance redox probe insideRMs has also been investigated. The effect of the [Ru(bpy)3]2+
complex on the T1 magnetic resonance relaxation time of watermolecules in the aqueous core of RMs has been measured as afunction of droplet size. The presence of the probe is found tobe sensitive to ω0, with no effect observed on the watermolecules in RMs of ω0 < 20 but increasing effects at valuesof ω0 > 20. The origins of this change were investigated usingmolecular modeling and found to be associated with a changein the position of the [Ru(bpy)3]2+ complex within the interfaceand the number of water molecules located nearby.* To whom correspondence should be addressed.
J. Phys. Chem. B 2010, 114, 12558–1256412558
10.1021/jp106709m 2010 American Chemical SocietyPublished on Web 09/10/2010
Experimental Section
Sample Preparation. For the T1 measurements, RMs wereprepared using n-octane (97%, Acros), AOT (96+%, Fluka),and high-purity water (Nanopure filtered, 18.0 MΩ cm). A stocksolution of 1.5 mol dm-3 AOT was prepared by dissolving111.14 g of AOT in 70 mL of octane. To this was added analiquot of 10 mM [Ru(bpy)3]2+, with the volume determinedby the desired ω0. Additional n-octane was then added to givea resultant microemulsion with the required droplet fraction,φd. All microemulsions were prepared to a droplet fraction (φd)of 0.45. Ruthenium-tris(2,2′-bipyridyl) dichloride, [Ru(bpy)3]Cl2
(Sigma), was used to make a stock solution of 10 mM[Ru(bpy)3]2+. All chemicals were used without further purification.
NMR Measurements. T1 relaxation experiments were per-formed on a Bruker DMX300 spectrometer, operating at aproton resonance frequency of 300 MHz, using an inversionrecovery experiment, [180x° - τ - 90x° - acq]n. StandardBruker XWINNMR 2.6 operating software was used. A variabledelay list was used containing n ) 33 time delays, logarithmi-cally spaced between τ ) 5 µs and 15 s. Four signal averageswere acquired for each τ value, with a repetition time, TR, of15 s between each scan. The spectral width was 10 kHz with16k complex data points acquired. Acquired data were processedusing Prospa software.19
For the NOESY experiments, a deuterated microemulsion wasprepared using deuterated n-octane (d-18 99%, CambridgeIsotope Laboratories Inc.), AOT, and D2O (99.9%, GossScientific). A 0.01 mol dm-3 stock solution of [Ru(bpy)3]Cl2
was prepared in D2O. This was then added to a solution of 1.5mol dm-3 AOT in deuterated n-octane, to give a microemulsionwith ω ) 9.2 and [Ru(bpy)3]2+ ) 10 mM. A sample was alsoprepared at ω0 ) 34.9 also with [Ru(bpy)3]2+ ) 10 mM.Deuterated solvents were used to maximize the signal-to-noiseratio, so that NOE cross-peaks between [Ru(bpy)3]2+ and AOTcould be observed over the noise in the acquired data.
1H-1H NOESY (proton-proton 2D nuclear Overhauserenhancement correlation spectroscopy) NMR measurementswere performed at 300 K using a Bruker DRX500 NMRspectrometer operating at 500.13 MHz for 1H and under BrukerTOPSPIN 1.3 software. The 1H chemical shifts were referencedto an external capillary of 3-(trimethylsilyl)propionic acid,sodium salt, in D2O (TSP) at 0 ppm. The instrument wasequipped with pulsed field gradients and a 5 mm inverse TBIz-gradient probesThe field gradients were used in the NOESYexperiments using a standard Bruker pulse program. TheNOESY data were acquired with a 5.3 kHz spectral windowfor proton in both F2 and F1. The NOESY mixing time, τmix,was varied from 17 ms to 1.0 s to determine the NOE build upcurve. The build up of the NOEs was determined by measuringthe volume integral of the cross-peaks using this processingfeature in Bruker’s TOPSPIN software. The data set consistedof 2K complex points in t2 by 512 complex points in t1 usingTPPI. Cosine-squared weighting functions shifted by π/2 werematched to the time domain in both t1 and t2, and the data waszero-filled to 1K in F1 before the Fourier transform. The finalresolution in F2 was 2.6 Hz/pt and 10.3 Hz/pt in F1. Theacquisition time per transient was nearly 0.2 s, and a relaxationdelay of 2.1s between transients was employed. In each dataset, eight transients were employed per t1 increment.
Dynamic Light Scattering (DLS) Measurements. DLSparticle sizing of microemulsion samples was performed usinga high performance particle sizer (Malvern Instruments modelHPP5001). The viscosity of octane was taken as 0.542 cP at 20°C, and the refractive index was taken as 1.391. Samples were
allowed to equilibrate to the temperature inside the instrument(set at 20 °C).
Molecular Mechanics and Molecular Dynamics (MD)Calculations. Molecular mechanics and MD calculations havebeen carried out using combined ff0320 and gaff21 forcefieldswithin AMBER v822 to the following protocol: Completeisolated droplets were subjected to minimization for a maximumof 500000 cycles using the default optimizer, no periodicboundary conditions were employed, and a EWALD nonbondedcut off of 12.0 Å was applied to the system. In all cases,minimization was terminated on exceeding the maximumnumber of cycles, but gradients were deemed to have fallensufficiently to allow effective dynamics simulations (rmsgradients < 2, Gmax < 102). Optimized droplets were thensubjected to either 2 ns (small, ω0 ) 8.35 droplets) or 500 ps(large, ω0 ) 29.2 droplets) equilibration dynamics (where timeswere chosen to fit with the maximum time limits imposed onjob submission queues), before being entered into the datagathering phase. All dynamics simulations were run at 300 K,without periodic boundary conditions but with an EWALDnonbonded cut off of 12.0 Å, sampling geometries, andvelocities every 10 ps (5000 steps) during the data-gatheringphase. Data-gathering MD runs were terminated on the escapeof a single water molecule from the droplet. The time taken forwater to escape from a droplet is highly variable, ranging from380 ps to 13.8 ns (ω0 ) 8.35) or 4 ps to 1.4 ns (ω0 ) 29.2), soonly those runs that completed a full equilibration run have beenconsidered for determination of the amount of water in proximityto the [Ru(bpy)3]2+ complex. Analyses have therefore beenaveraged over a number of droplets (five for ω0 ) 8.35 andfour for ω0 ) 29.2)
Droplet Construction. An initial spherical water droplet wasconstructed by solvating a single water molecule with thesolVateshell command within AMBER LEaP with a thicknessof 30 (ω0 ) 8.35) or 50 Å (ω0 ) 29.2). AOT surfactantmolecules added to the outside of the sphere oriented radiallywith headgroups close to the surface of the water droplet andtails pointing away into space. Orientations and distribution ofAOT molecules on the surface of the droplet were arrangedrandomly using our own purpose-built code.23 Followingplacement of an initial AOT molecule, subsequent AOTmolecules were placed with random θ, spherical polarcoordinates, and random rotation parallel to the surface of thesphere but constant r. Newly added molecules were acceptedif no atom lied within 1.0 Å of any atom in a previously placedAOT molecule and rejected if closer. The addition of furtherAOT molecules was terminated if the number of consecutiverejections was greater than twice the total number of successfullyplaced molecules. This process yielded droplets with ω0 valuescomparable with experimental values for droplets of similar size,but exact ω0 values were difficult to control. The process alsoresulted in significant gaps between some AOT molecules acrossthe surface of the droplet. This is a result of the AOT moleculesbeing largely elongated in a radial fashion on initial placement;however, on minimization of the droplet, these gaps close beforeany water is able to escape from the droplet. To ensure[Ru(bpy)3]2+ complexes start embedded in the surfactant layer,they were simply placed in a suitably sized gap, with theirnearest edge coming into contact with the central water sphere.Sufficient sodium ions to ensure overall charge neutrality wereadded to each sphere using the counterion option within LEaP.
Additional Parameters. Bond stretch and angle parame-ters for bonds involving ruthenium in the [Ru(bpy)3]2+ complexwere determined from vibrational frequencies of a 6-31G**/
Redox Probe in a Reverse AOT/Octane/Water Microemulsion J. Phys. Chem. B, Vol. 114, No. 39, 2010 12559
MPW1PW91 DFT Gaussian0324-26 optimization of a ruthe-nium-pyridine complex and set to the following values:
ru-na 26.8 2.077na-ru-na 25.0 90.0ru-na-ca 25.0 120.0
All torsions involving ruthenium were set to zero. Ruthe-nium nonbonded interactions were set as follows:
ru 2.0770 0.0125
Any further parameters, such as may be required for AOT,were assigned based on their similarity with existing gaff or ff03parameters.
Molecular Representations. All molecular representationswere prepared using Insight software from Accelrys.27
Results
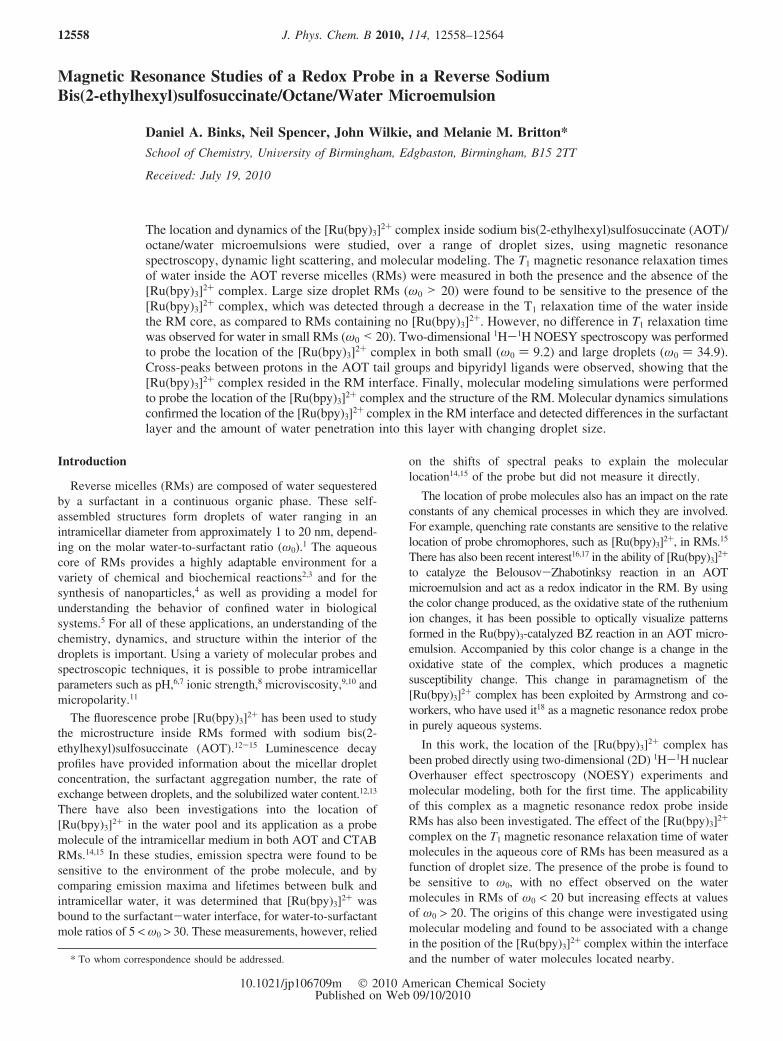
Figure 1 shows the structures and numbering scheme forprotons of the AOT molecule and [Ru(bpy)3]2+ complex. AOTand [Ru(bpy)3]2+ have been characterized previously by NMRspectroscopy,28,29 and proton chemical shifts for [Ru(bpy)3]2+
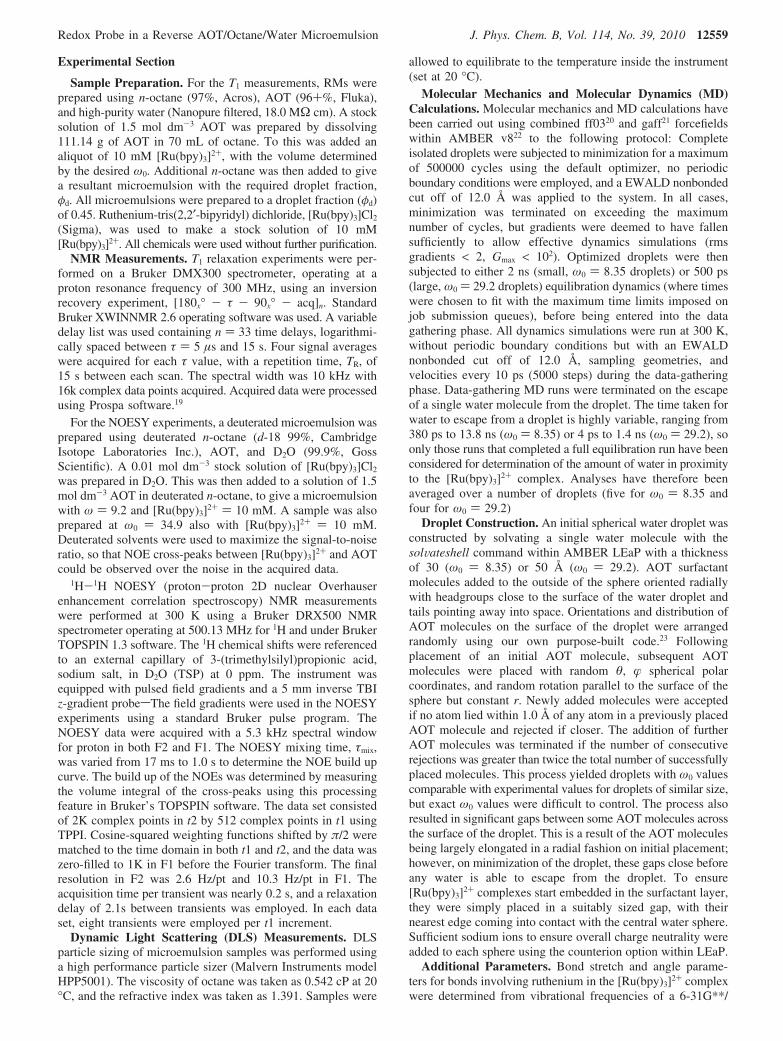
and AOT are given in Table 1. Figure 2 is a plot of the T1
relaxation time against the surfactant-to-water ratio (ω0) for arange of RMs in the presence and absence of [Ru(bpy)3]2+. Linesare included, to guide the eye, but are not fits to the data. Atlow ω0 values, and hence small droplet sizes, the T1 relaxationtime is insensitive to the presence of the Ru complex. However,as ω0, and hence RM size, increases, there begins to be adeviation between the relaxation times of water molecules inthe presence and absence of the complex. As a reduction in therelaxation time of surrounding water molecules is expected inthe presence of the [Ru(bpy)3]2+ ion, the reason for this lack ofrelaxivity at low ω0 is expected to lie in the location of thecomplex within the droplet.
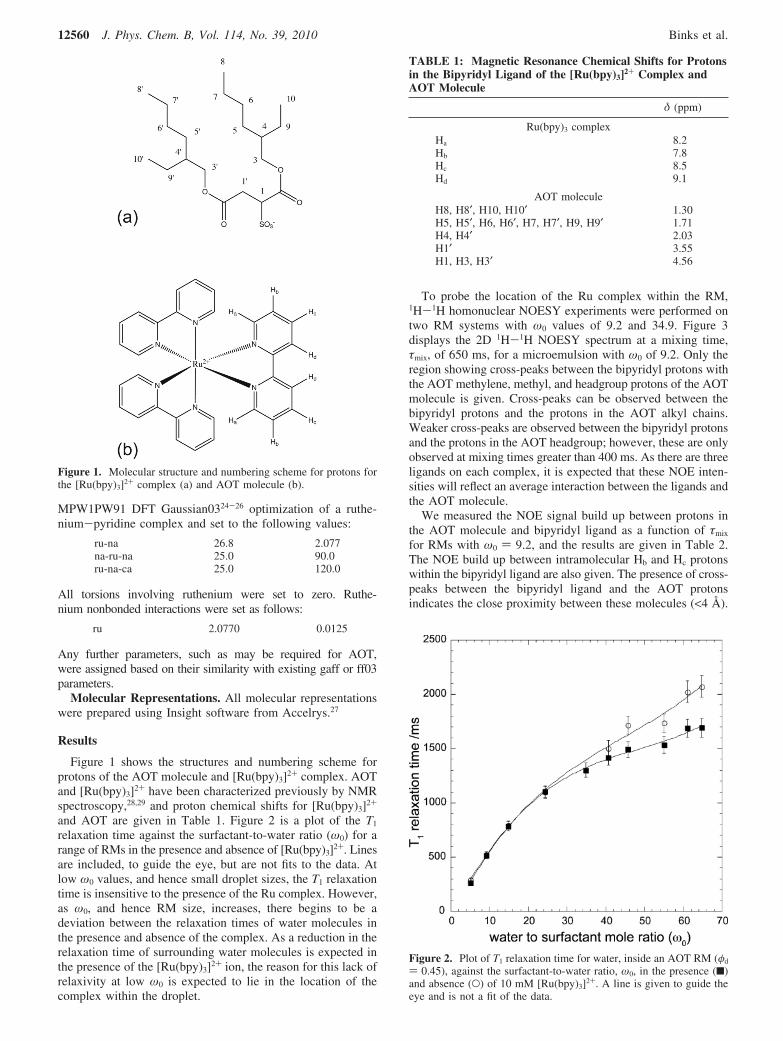
To probe the location of the Ru complex within the RM,1H-1H homonuclear NOESY experiments were performed ontwo RM systems with ω0 values of 9.2 and 34.9. Figure 3displays the 2D 1H-1H NOESY spectrum at a mixing time,τmix, of 650 ms, for a microemulsion with ω0 of 9.2. Only theregion showing cross-peaks between the bipyridyl protons withthe AOT methylene, methyl, and headgroup protons of the AOTmolecule is given. Cross-peaks can be observed between thebipyridyl protons and the protons in the AOT alkyl chains.Weaker cross-peaks are observed between the bipyridyl protonsand the protons in the AOT headgroup; however, these are onlyobserved at mixing times greater than 400 ms. As there are threeligands on each complex, it is expected that these NOE inten-sities will reflect an average interaction between the ligands andthe AOT molecule.
We measured the NOE signal build up between protons inthe AOT molecule and bipyridyl ligand as a function of τmix
for RMs with ω0 ) 9.2, and the results are given in Table 2.The NOE build up between intramolecular Hb and Hc protonswithin the bipyridyl ligand are also given. The presence of cross-peaks between the bipyridyl ligand and the AOT protonsindicates the close proximity between these molecules (<4 Å).
Figure 2. Plot of T1 relaxation time for water, inside an AOT RM (φd
) 0.45), against the surfactant-to-water ratio, ω0, in the presence (9)and absence (O) of 10 mM [Ru(bpy)3]2+. A line is given to guide theeye and is not a fit of the data.
Figure 1. Molecular structure and numbering scheme for protons forthe [Ru(bpy)3]2+ complex (a) and AOT molecule (b).
TABLE 1: Magnetic Resonance Chemical Shifts for Protonsin the Bipyridyl Ligand of the [Ru(bpy)3]2+ Complex andAOT Molecule
δ (ppm)
Ru(bpy)3 complexHa 8.2Hb 7.8Hc 8.5Hd 9.1
AOT moleculeH8, H8′, H10, H10′ 1.30H5, H5′, H6, H6′, H7, H7′, H9, H9′ 1.71H4, H4′ 2.03H1′ 3.55H1, H3, H3′ 4.56
12560 J. Phys. Chem. B, Vol. 114, No. 39, 2010 Binks et al.
The intensity is greater between the protons in the alkyl chainsthan the headgroup protons, suggesting that the complex is
embedded in the surfactant interface and surrounded by the AOTtails, rather than at the surfactant-water interface. Also, as allof the NOE cross-peaks observed are negative, it suggests thatthe residence time of the [Ru(bpy)3]2+ complex in the surfactantlayer is long30 and the rotational correlation time of the complexis dominated by the slow tumbling of the droplet. NOE signalbuild up was also measured for the same cross-peaks in amicroemulsion with ω0 ) 34.9 and is given in Table 3. Theintensities of these cross-peaks were significantly lower thanin the smaller droplet (ω0 ) 9.2).
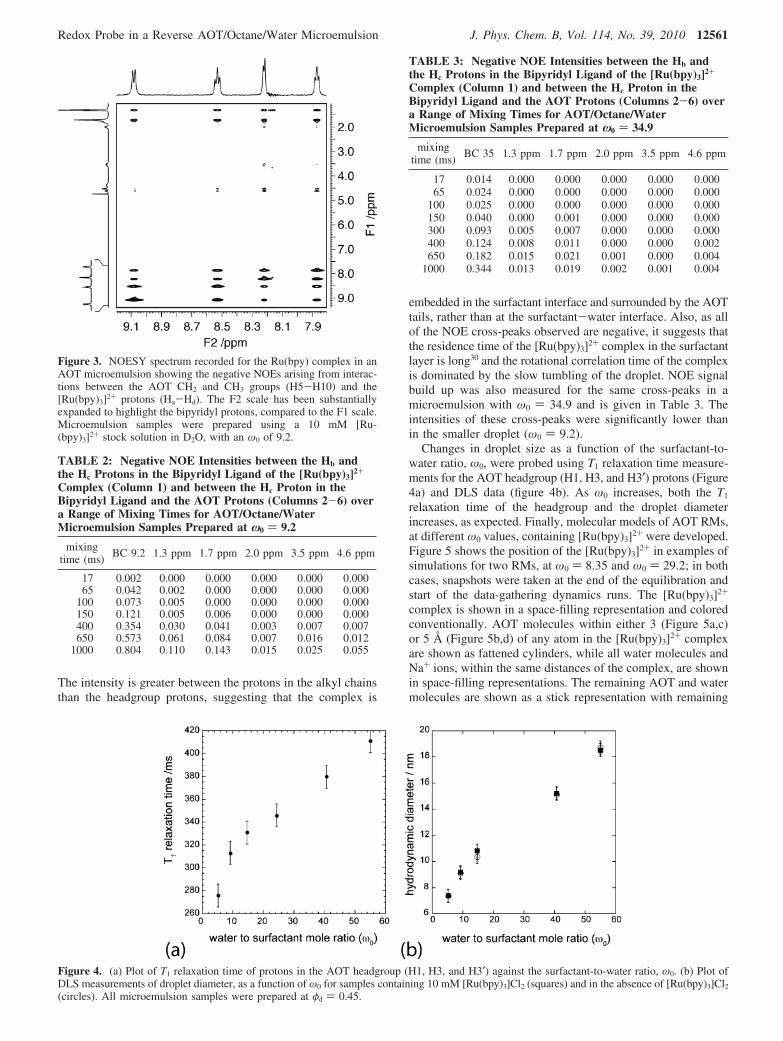
Changes in droplet size as a function of the surfactant-to-water ratio, ω0, were probed using T1 relaxation time measure-ments for the AOT headgroup (H1, H3, and H3′) protons (Figure4a) and DLS data (figure 4b). As ω0 increases, both the T1
relaxation time of the headgroup and the droplet diameterincreases, as expected. Finally, molecular models of AOT RMs,at different ω0 values, containing [Ru(bpy)3]2+ were developed.Figure 5 shows the position of the [Ru(bpy)3]2+ in examples ofsimulations for two RMs, at ω0 ) 8.35 and ω0 ) 29.2; in bothcases, snapshots were taken at the end of the equilibration andstart of the data-gathering dynamics runs. The [Ru(bpy)3]2+
complex is shown in a space-filling representation and coloredconventionally. AOT molecules within either 3 (Figure 5a,c)or 5 Å (Figure 5b,d) of any atom in the [Ru(bpy)3]2+ complexare shown as fattened cylinders, while all water molecules andNa+ ions, within the same distances of the complex, are shownin space-filling representations. The remaining AOT and watermolecules are shown as a stick representation with remaining
Figure 4. (a) Plot of T1 relaxation time of protons in the AOT headgroup (H1, H3, and H3′) against the surfactant-to-water ratio, ω0. (b) Plot ofDLS measurements of droplet diameter, as a function of ω0 for samples containing 10 mM [Ru(bpy)3]Cl2 (squares) and in the absence of [Ru(bpy)3]Cl2
(circles). All microemulsion samples were prepared at φd ) 0.45.
Figure 3. NOESY spectrum recorded for the Ru(bpy) complex in anAOT microemulsion showing the negative NOEs arising from interac-tions between the AOT CH2 and CH3 groups (H5-H10) and the[Ru(bpy)3]2+ protons (Ha-Hd). The F2 scale has been substantiallyexpanded to highlight the bipyridyl protons, compared to the F1 scale.Microemulsion samples were prepared using a 10 mM [Ru-(bpy)3]2+ stock solution in D2O, with an ω0 of 9.2.
TABLE 2: Negative NOE Intensities between the Hb andthe Hc Protons in the Bipyridyl Ligand of the [Ru(bpy)3]2+
Complex (Column 1) and between the Hc Proton in theBipyridyl Ligand and the AOT Protons (Columns 2-6) overa Range of Mixing Times for AOT/Octane/WaterMicroemulsion Samples Prepared at ω0 ) 9.2
mixingtime (ms)
BC 9.2 1.3 ppm 1.7 ppm 2.0 ppm 3.5 ppm 4.6 ppm
17 0.002 0.000 0.000 0.000 0.000 0.00065 0.042 0.002 0.000 0.000 0.000 0.000
100 0.073 0.005 0.000 0.000 0.000 0.000150 0.121 0.005 0.006 0.000 0.000 0.000400 0.354 0.030 0.041 0.003 0.007 0.007650 0.573 0.061 0.084 0.007 0.016 0.012
1000 0.804 0.110 0.143 0.015 0.025 0.055
TABLE 3: Negative NOE Intensities between the Hb andthe Hc Protons in the Bipyridyl Ligand of the [Ru(bpy)3]2+
Complex (Column 1) and between the Hc Proton in theBipyridyl Ligand and the AOT Protons (Columns 2-6) overa Range of Mixing Times for AOT/Octane/WaterMicroemulsion Samples Prepared at ω0 ) 34.9
mixingtime (ms)
BC 35 1.3 ppm 1.7 ppm 2.0 ppm 3.5 ppm 4.6 ppm
17 0.014 0.000 0.000 0.000 0.000 0.00065 0.024 0.000 0.000 0.000 0.000 0.000
100 0.025 0.000 0.000 0.000 0.000 0.000150 0.040 0.000 0.001 0.000 0.000 0.000300 0.093 0.005 0.007 0.000 0.000 0.000400 0.124 0.008 0.011 0.000 0.000 0.002650 0.182 0.015 0.021 0.001 0.000 0.004
1000 0.344 0.013 0.019 0.002 0.001 0.004
Redox Probe in a Reverse AOT/Octane/Water Microemulsion J. Phys. Chem. B, Vol. 114, No. 39, 2010 12561
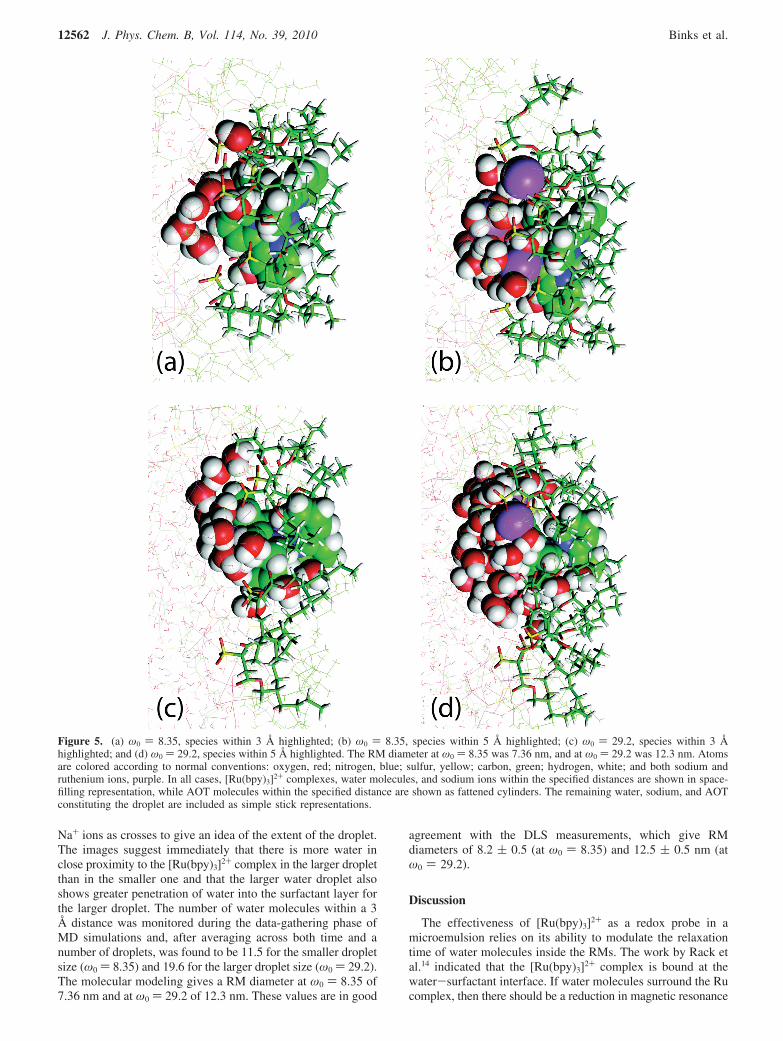
Na+ ions as crosses to give an idea of the extent of the droplet.The images suggest immediately that there is more water inclose proximity to the [Ru(bpy)3]2+ complex in the larger dropletthan in the smaller one and that the larger water droplet alsoshows greater penetration of water into the surfactant layer forthe larger droplet. The number of water molecules within a 3Å distance was monitored during the data-gathering phase ofMD simulations and, after averaging across both time and anumber of droplets, was found to be 11.5 for the smaller dropletsize (ω0 ) 8.35) and 19.6 for the larger droplet size (ω0 ) 29.2).The molecular modeling gives a RM diameter at ω0 ) 8.35 of7.36 nm and at ω0 ) 29.2 of 12.3 nm. These values are in good
agreement with the DLS measurements, which give RMdiameters of 8.2 ( 0.5 (at ω0 ) 8.35) and 12.5 ( 0.5 nm (atω0 ) 29.2).
Discussion
The effectiveness of [Ru(bpy)3]2+ as a redox probe in amicroemulsion relies on its ability to modulate the relaxationtime of water molecules inside the RMs. The work by Rack etal.14 indicated that the [Ru(bpy)3]2+ complex is bound at thewater-surfactant interface. If water molecules surround the Rucomplex, then there should be a reduction in magnetic resonance
Figure 5. (a) ω0 ) 8.35, species within 3 Å highlighted; (b) ω0 ) 8.35, species within 5 Å highlighted; (c) ω0 ) 29.2, species within 3 Åhighlighted; and (d) ω0 ) 29.2, species within 5 Å highlighted. The RM diameter at ω0 ) 8.35 was 7.36 nm, and at ω0 ) 29.2 was 12.3 nm. Atomsare colored according to normal conventions: oxygen, red; nitrogen, blue; sulfur, yellow; carbon, green; hydrogen, white; and both sodium andruthenium ions, purple. In all cases, [Ru(bpy)3]2+ complexes, water molecules, and sodium ions within the specified distances are shown in space-filling representation, while AOT molecules within the specified distance are shown as fattened cylinders. The remaining water, sodium, and AOTconstituting the droplet are included as simple stick representations.
12562 J. Phys. Chem. B, Vol. 114, No. 39, 2010 Binks et al.

relaxation times for water molecules inside the droplet. How-ever, as the presence of the [Ru(bpy)3]2+ complex is not detectedthrough relaxation measurements of water for RMs with ω0 <20, it suggests that the complex does not reside in the watercore but rather further into the interface. The presence of thecomplex in the interface is confirmed by the NOESY experi-ment, which shows negative NOE cross-peaks between thebipyridyl protons (Ha-Hd) and the AOT tailgroup protons(H5-H10 and H5′-H10′). The NOE signals are strongestbetween the AOT tails and the bipyridyl ligands, rather thanthe headgroup of the AOT molecule, which indicates that the[Ru(bpy)3]2+ complex is not positioned at the water-surfactantinterface but further in to the surfactant layer, near thehydrophobic tails. It should be noted, however, that the NOEsmeasured are an average for all three bipyridyl ligands, so it isnot possible to determine a precise position.
As the droplet size increases above ω0 ) 20, the presence ofthe [Ru(bpy)3]2+ complex becomes apparent, through a decreasein the water T1 relaxation time. There is also a decrease in therate of build up of the intensities of the cross-peaks in theNOESY experiment for the bipyridyl protons (Hb and Hc) andAOT from the smaller to the larger droplet. This suggests ashift in the location of the complex or a change in the structureof the interface. The internuclear distance between two spins isan important factor in the rate at which steady state NOEenhancement is reached. The initial rate of NOE build up isalso different to the rate of build up as the steady state isapproached, which is why it is important in kinetic NOEexperiments, such as the 2D NOESY experiment that we employhere, to use a widespread of mixing times. The precisequantification of NOE distance is a task in which great careand rigor are required.31 It is, however, well accepted that theNOE effect is very short ranging (4 Å) and that its effect dropsoff rapidly as r-6. Using the smaller droplet size as our“reference point” and given that all experiments were done underthe same conditions, the observation that when ω0 ) 34.9, thecross-peak intensities build up at a much lower rate wouldsuggest that the [Ru(bpy)3]2+ is a little bit more separated fromthe AOT molecules and that the interface can be considered tobe more open in the larger droplet.
To further probe the location of the [Ru(bpy)3]2+ complexand the structure of the interface, molecular modeling wasperformed. RMs with ω0 values of 8.35 and 29.2 wereinvestigated. In both systems, the [Ru(bpy)3]2+ complex formspart of the interface. However, there are differences in both theposition of the complex and the structure of the interfacebetween the two systems. In the smaller droplet (ω0 ) 8.35),water is less likely to penetrate the surfactant layer, as evidencedby the longer lifetimes to penetration of the smaller droplets,and the complex is largely surrounded by AOT molecules;hence, relatively few water molecules approach close (e3 Å)to the complex. Figure 5c shows two water molecules embeddedin the surfactant layer in close proximity to the [Ru(bpy)3]2+
complex. Analysis of the dynamics trajectory used for Figure5c shows that these two water molecules remain in close contact(<3.2 Å for over 70% of the total data-gathering simulation,5.1 ns). This is an extraordinary contact time for nonhydrogen-bonded water molecules. In the larger droplet, water moleculesreside in the interface, and the complex sits further toward thewater core; hence, greater numbers of water molecules are ableto come within both 3 and 5 Å distances. Furthermore, thosewater molecules that do penetrate into the surfactant layer inthe vicinity of the [Ru(bpy)3]2+ complex do not show anything
approaching the same persistence in contact times as seen withthe smaller droplet.
MD simulations highlight differences in the surfactant layerwith changing droplet size. Despite having similar surfactantdensities, larger (ω0 ) 29.2) droplets show considerably greaterwater penetration into and through the surfactant layer than isseen for smaller (ω0 ) 8.35) droplets. The median lifetimebefore water penetration through the surfactant layer is 1.7 ns(longest lifetime 13.8 ns) for the smaller droplet against 533 ps(median) and 1.4 ns (longest) lifetimes for the larger droplets.In both cases, these values come from a comparison of 12distinct droplet simulations at each size.
Conclusions
The location and dynamics of the [Ru(bpy)3]2+ complex insideAOT RMs have been studied through a combination of T1
magnetic resonance relaxation times, 2D 1H-1H NOESYspectroscopy, and molecular modeling. T1 relaxation timemeasurements for water inside RMs containing [Ru(bpy)3]2+
show a droplet size dependence. At small droplet sizes (ω0 <20), there is no reduction in the relaxation time for watermolecules, as compared to RMs not containing [Ru(bpy)3]2+,which suggest that the complex is not located in the water corebut resides inside the RM interface. However, for larger dropletsizes (ω0 > 20), there is a decrease in the T1 relaxation time forwater in RMs containing the [Ru(bpy)3]2+ complex. Thissuggested a change in the location of the complex or a changein the structure of the interface. The location of the complex inthe RM interface was confirmed with1H-1H NOESY spectros-copy, which showed cross-peaks between protons in the AOTtail groups and the bipyridyl ligand. The intensity of these peaksand their rate of build up were found to decrease for the largerdroplet, which indicated a shifting of the complex toward thesurfactant/water interface and an opening up of the interface,leading to greater separation between the bipyridyl and the AOTtail group protons. This was confirmed through molecularmodeling measurements, which showed that the location of the[Ru(bpy)3]2+ complex was deep inside the surfactant layer forsmall droplets and nearer the water/surfactant interface for largerdroplets. Simulations of both small and large droplets alsoshowed that the interface became more open as the droplet sizeincreased and that greater water penetration was possible. Thecombination of NOE experiments and molecular modeling couldthen explain why larger droplets exhibited a decrease in T1
relaxation time, of the water core, and a decrease in cross-peakintensity and build up rate between protons in the bipyridylligand and the AOT tail groups.
References and Notes
(1) De, T. K.; Maitra, A. AdV. Colloid Interface Sci. 1995, 59, 95.(2) Fendler, J. H. Acc. Chem. Res. 1976, 9, 153.(3) Pileni, M. P. J. Phys. Chem. 1993, 97, 6961.(4) Uskokovic, V.; Drofenik, M. Surf. ReV. Lett. 239, 12, 239.(5) Levinger, N. E. Science 2002, 298, 1722.(6) Falcone, R. D.; Correa, N. M.; Biasutti, M. A.; Silber, J. Langmuir
2002, 18, 2039.(7) Fujii, H.; Kawai, T.; Nishikawa, H. Bull. Chem. Soc. Jpn. 1979,
52, 2051.(8) Baruah, B.; Crans, D. C.; Levinger, N. E. Langmuir 2007, 23, 6510.(9) Hasegawa, M.; Sugimura, T.; Suzaki, Y.; Shindo, Y.; Kitahara, A.
J. Phys. Chem. 2002, 98, 2120.(10) Hirose, Y.; Yui, H.; Sawada, T. J. Phys. Chem. B 2004, 108, 9070.(11) Zhu, D. M.; Schelly, Z. A. Langmuir 1992, 8, 48.(12) Liu, D.; Ma, J.; Cheng, H.; Zhao, Z. Colloids Surf., A 1998, 139,
21.(13) Modes, S.; Lianos, P. J. Phys. Chem. 1989, 93, 5854.(14) Rack, J. J.; McCleskey, T. M.; Birnbaum, E. R. J. Phys. Chem. B
2002, 106, 632.
Redox Probe in a Reverse AOT/Octane/Water Microemulsion J. Phys. Chem. B, Vol. 114, No. 39, 2010 12563
(15) Saez, M.; Abuin, E. A.; Lissi, E. A. Langmuir 1989, 5, 942.(16) Kaminaga, A.; Vanag, V. K.; Epstein, I. R. J. Chem. Phys. 2005,
122, 174706.(17) McIlwaine, R.; Vanag, V. K.; Epstein, I. R. Phys. Chem. Chem.
Phys. 2009, 11, 1581.(18) Gao, Y.; Cross, A. R.; Armstrong, R. L. J. Phys. Chem. 1996, 100,
10159.(19) Magtritek. Prospa, version 2.1; http://www.magritek.com/prospa.html.(20) Duan, Y.; Wu, C.; Chowdhury, S.; Lee, M. C.; Xiong, G. M.;
Zhang, W.; Yang, R.; Cieplak, P.; Luo, R.; Lee, T.; Caldwell, J.; Wang,J. M.; Kollman, P. J. Comput. Chem. 2003, 24, 1999.
(21) Wang, J. M.; Wolf, R. M.; Caldwell, J. W.; Kollman, P. A.; Case,D. A. J. Comput. Chem. 2004, 25, 1157.
(22) Case, D. A.; Cheatham, T. E.; Darden, T.; Gohlke, H.; Luo, R.;Merz, K. M.; Onufriev, A.; Simmerling, C.; Wang, B.; Woods, R. J.J. Comput. Chem. 2005, 26, 1668.
(23) Program available from the author (J.W.) on request.(24) Adamo, C.; Barone, V. J. J. Chem. Phys. 1998, 108, 664.(25) Ditchfield, R.; Hehre, W. J.; Pople, J. A. J. Chem. Phys. 1971, 54,
724.(26) Frisch, M. J.; Trucks, G. W.; Schlegel, H. B.; Scuseria, G. E.; Robb,
M. A.; Cheeseman, J. R.; Montgomery, J. A., Jr.; Vreven, T.; Kudin, K. N.;Burant, J. C.; Millam, J. M.; Iyengar, S. S.; Tomasi, J.; Barone, V.;Mennucci, B.; Cossi, M.; Scalmani, G.; Rega, N.; Petersson, G. A.;
Nakatsuji, H.; Hada, M.; Ehara, M.; Toyota, K.; Fukuda, R.; Hasegawa, J.;Ishida, M.; Nakajima, T.; Honda, Y.; Kitao, O.; Nakai, H.; Klene, M.; Li,X.; Knox, J. E.; Hratchian, H. P.; Cross, J. B.; Bakken, V.; Adamo, C.;Jaramillo, J.; Gomperts, R.; Stratmann, R. E.; Yazyev, O.; Austin, A. J.;Cammi, R.; Pomelli, C.; Ochterski, J. W.; Ayala, P. Y.; Morokuma, K.;Voth, G. A.; Salvador, P.; Dannenberg, J. J.; Zakrzewski, V. G.; Dapprich,S.; Daniels, A. D.; Strain, M. C.; Farkas, O.; Malick, D. K.; Rabuck, A. D.;Raghavachari, K.; Foresman, J. B.; Ortiz, J. V.; Cui, Q.; Baboul, A. G.;Clifford, S.; Cioslowski, J.; Stefanov, B. B.; Liu, G.; Liashenko, A.; Piskorz,P.; Komaromi, I.; Martin, R. L.; Fox, D. J.; Keith, T.; Al-Laham, M. A.;Peng, C. Y.; Nanayakkara, A.; Challacombe, M.; Gill, P. M. W.; Johnson,B.; Chen, W.; Wong, M. W.; Gonzalez, C.; Pople, J. A. Gaussian 03,revision C.02; Gaussian, Inc.: Wallingford, CT, 2003.
(27) Biosym/MSI; InsightII: San Diego, CA.(28) Crans, D. C.; Rithner, C. D.; Baruah, B.; Gourley, B. L.; Levinger,
N. E. J. Am. Chem. Soc. 2006, 128, 4437.(29) Constable, E. C.; Lewis, J. Inorg. Chim. Acta 1983, 70, 251.(30) Otting, G.; Liepinsh, E. Acc. Chem. Res. 1995, 28, 171.(31) Neuhaus, D.; Williamson, M. The Nuclear OVerhauser Effect in
Structural and Conformational Analysis, 2nd ed.; Wiley-VCH: New York,2000.
JP106709M
12564 J. Phys. Chem. B, Vol. 114, No. 39, 2010 Binks et al.


![Analysis of Water in Confined Geometries and at … nonpolar, organic supporting phase. (b) Chemical structure of Aerosol OT [AOT; sodium bis(2-ethylhexyl) sulfosuccinate], the surfactant](https://img.pdfslide.us/doc/110x75/5b0320787f8b9aba168b6fed/analysis-of-water-in-conned-geometries-and-at-nonpolar-organic-supporting.jpg)


![ContinuingOurCommitment · Benzo(a)pyrene[PAHs] Carbofuran Chlordane Dalapon Di(2-ethylhexyl)adipate Di(2-ethylhexyl)phthalate Dinoseb Diquat Dioxin[2,3,7,8-TCDD] Chloramines Chlorite](https://img.pdfslide.us/doc/110x75/5e671debe9979b0ba7521704/continuingourcommitment-benzoapyrenepahs-carbofuran-chlordane-dalapon-di2-ethylhexyladipate.jpg)