Embed Size (px)
Citation preview
Department of Chemical and Biological Engineering CHALMERS UNIVERSITY OF TECHNOLOGY Gothenburg, Sweden 2014
Modification of Microemulsion Systems
used in Specialty Cleaning Formulae
Master’s thesis in the Master Degree Program, Materials Chemistry and Nanotechnology
KIM ANDERSSON
ii
Modification of microemulsion systems used
in specialty cleaning formulae
KIM ANDERSSON
Examiner:
Ass. Prof. Lars Nordstierna
Supervisors:
Ass. Prof. Lars Nordstierna
Ulf Billton
Department of Chemical and Biological Engineering
CHALMERS UNIVERSITY OF TECHNOLOGY
Göteborg, Sweden 2014
iii
Modification of microemulsion systems used in specialty cleaning formulae
KIM ANDERSSON
© KIM ANDERSSON, 2014
Department of Chemical and Biological Engineering
Chalmers University of Technology
SE-412 96 Göteborg
Sweden
Telephone + 46 (0)31-772 1000
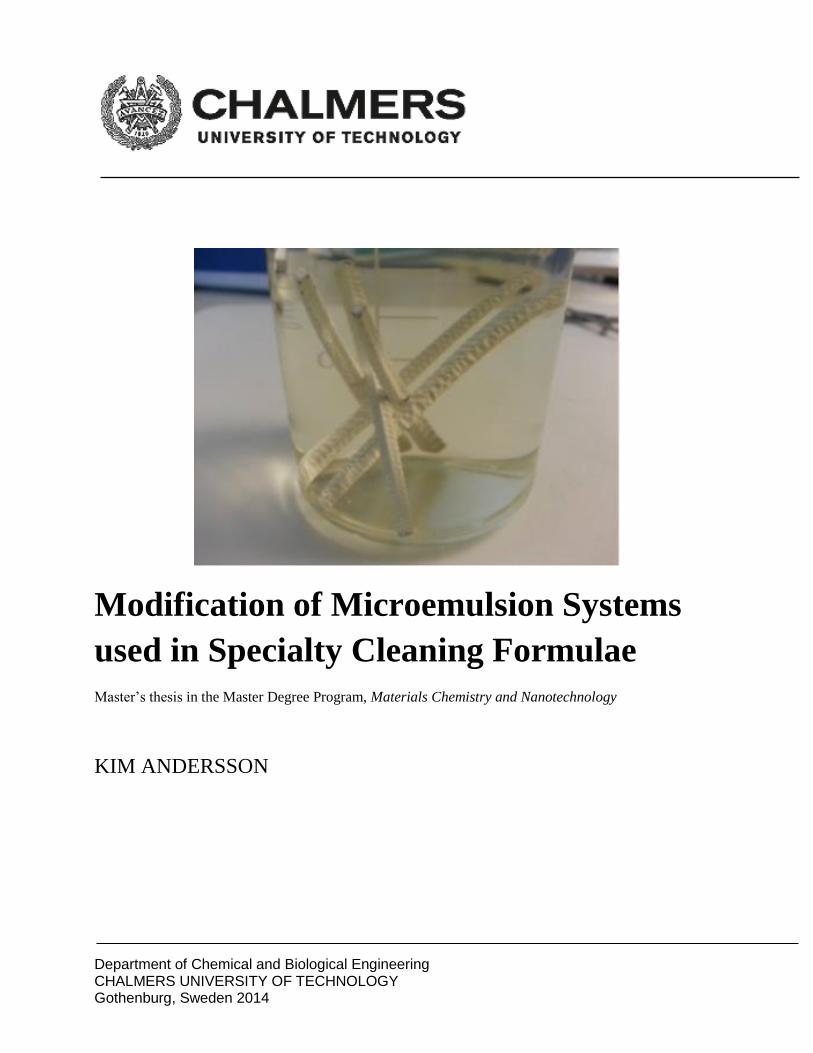
Cover:
Image of lath nails submerged in microemulsion for paint stripping.
Göteborg, Sweden 2014
iv
Abstract
Paint is a fundamental coating material and it is used everywhere in our society, from works of art to the
paint on our houses and cars. The possibility to apply and use paint on surfaces also cause situations
where it needs to be removed. Controlled removal of paint, so-called stripping, is especially important in
the industry. Traditionally the industry has used abrasion stripping, e.g. sand blasting, or chemical
stripping with solvents. However, abrasion stripping is not suitable for more sensitive substrates and
many common stripping solvents have been banned due to toxicological and environmental reasons.
These regulations have promoted development of alternative solvent-based strippers. Examples of new
stripping products are the microemulsion systems developed by the company EnviroStripp Chemicals AB
in Kungsbacka. These microemulsion systems retain good stripping properties while being composed
mostly of water making them more environmentally friendly than pure solvent systems.
In this Master project two test products from EnviroStripp Chemicals have been examined. First, the
phase behavior was examined when altering the composition of water, oil, and surfactant in the
microemulsion. Second, stripping efficiency test methods were developed and a wide area of the
microemulsion ternary phase diagram were investigated with regard to stripping efficiency. Third,
conductivity and viscosity was measured for the samples in order to find any correlation between
physical property and stripping efficiency. Fourth and finally, the addition of a diblock copolymer to the
microemulsion systems was studied to determine possible and beneficial properties of the interfacial
tension in order to decrease the surfactant concentration.
The results showed that the fastest stripping is found using a microemulsion, with low content of
surfactant, being closest to the two-phase border of the microemulsion ternary phase diagram. An
increased amount of oil promoted the stripping efficiency. No correlation between stripping efficiency
and viscosity could be found in the studied area of the phase diagram. A minimum in conductivity was
found close to the two-phase border thereby indicating a correlation to the stripping efficiency.
However, due to scattered experimental data in other parts of the phase diagram, it would be required
to perform further studies to verify a correlation between stripping efficiency and conductivity. The
addition of diblock copolymer led to formation of aggregates and phase separation in all investigated
samples. This behavior could possibly be explained by a decreased cloud point of the diblock copolymer.
Keywords: Microemulsion, paint stripper, specialty cleaning formulae, paint removal, surfactant,
cosurfactant.
v
Table of Contents
1 Introduction ........................................................................................................................................... 1
1.1 Background .................................................................................................................................... 1
1.2 Aim ................................................................................................................................................ 2
2 Theory .................................................................................................................................................... 3
2.1 Surfactants..................................................................................................................................... 3
2.2 Microemulsions ............................................................................................................................. 3
2.3 Paints ............................................................................................................................................. 6
2.3.1 Powder coating ...................................................................................................................... 6
2.3.2 Binders ................................................................................................................................... 7
2.4 Paint stripping ............................................................................................................................... 7
2.4.1 Chemical stripping ................................................................................................................. 7
2.4.2 Abrasion stripping ................................................................................................................. 9
2.4.3 Cryogenic stripping ................................................................................................................ 9
2.4.4 Thermal stripping .................................................................................................................. 9
2.4.5 Microemulsion stripping ....................................................................................................... 9
2.5 Analytical methods ...................................................................................................................... 10
2.5.1 Electrical conductivity ......................................................................................................... 10
2.5.2 Viscosimetry ........................................................................................................................ 11
2.5.2 Cone and plate viscosity meter ........................................................................................... 12
3 Experimental ....................................................................................................................................... 13
3.1 Materials ...................................................................................................................................... 13
3.2 Formulation and phase diagrams ................................................................................................ 13
3.3 Paint stripping material ............................................................................................................... 13
3.4 Paint stripping methods .............................................................................................................. 14
3.4.1 Paint stripping from nails .................................................................................................... 14
3.4.2 Paint stripping from painted tile lath .................................................................................. 14
3.5 Conductivity and viscosity ........................................................................................................... 15
3.6 Experiments including copolymer ............................................................................................... 15
vi
4 Results and discussion ......................................................................................................................... 17
4.1 Phase diagrams............................................................................................................................ 17
4.2 Paint stripping ............................................................................................................................. 18
4.3 Conductivity measurements ....................................................................................................... 23
4.4 Viscosity measurements .............................................................................................................. 26
4.5 Addition of copolymer ................................................................................................................. 27
5 Conclusions .......................................................................................................................................... 30
6 Future work ......................................................................................................................................... 31
7 Acknowledgements ............................................................................................................................. 32
8 References ........................................................................................................................................... 33
1
1 Introduction
1.1 Background Paint has been used by humans for thousands of years and in numerous applications, from the okra used
in the first cave paintings to some of today’s highly specialized industrial paints [1]. The earliest known
paints were based on simple pigments that could be easily found in nature, okra, sooth, and animal
blood include some of the earliest pigments found [1, 2]. Binders commonly used in these paints
included egg white and beeswax. A large step in the development of paint was taken during the 18th
century when the use of linseed oil as binder and the development of grinding machines for pigments
facilitated and reduced the production cost [1, 2]. The next leap in the development of paint was taken
in the middle of the 20th century. Because of World War II there was a lack of linseed oil, which led to
the development of paint using synthetic binders. Further development has granted us more kinds of
paints, using oil or water as solvent, a huge number of binders, and pigments, both natural and
synthetic. Today paints are used in many of the objects in our everyday life, the walls of our home, the
cars we drive, and the fridge in our kitchens.
From its origin being used to decorate caves, paint has grown into a large industry. In the year 2013,
sales around the world reached more than 41 million tons having a total value of over 127 billion dollars
[3].
The widespread use of paint gives rise to a large demand in methods for controlled removal, often
referred to as paint stripping or simply stripping. Especially the industry demands a large quantity of
stripping products. One example in the industry where paint stripping is important is the car industry. If a
painted detail is not up to sufficiently high standards it cannot be used. So instead of discarding the piece
paint strippers could be used to merely remove the paint making it prepared for repainting, saving both
money and resources.
Stripping of paints, powder coatings, rubbers and adhesives have traditionally been achieved through
the use of organic solvents, acidic or alkali solutions. These methods are more than often hazardous for
the people working with them and/or to the environment.
EnviroStripp Chemicals AB is a company, located in Kungsbacka Sweden, which offers products and
system solutions intended for the removal of paint and powder coatings. The company has successfully
replaced many of their organic solvent-based products with water-based alternatives. The water-based
products are mostly oil-in-water microemulsions containing water, organic solvent, surfactants, and
additives. These microemulsions have made possible a substantial decrease in the amount of organic
solvent required in the products. However, further decrease of the organic solvent is still desirable both
from an environmental and a personal exposure point of view. In addition, the relatively large quantity
of surfactant in the microemulsions is also viewed as an environmental and economical cost and an
overall decrease of the surfactant content is desired. Therefore, further studies with the ambition to
decrease the content of surfactants and organic solvents are needed.
2
1.2 Aim The purpose of this Master project is to maintain, or enhance, product efficacy while decreasing the
surfactant and/or solvent concentration. In this Master project two test products from EnviroStripp
Chemicals AB have been examined. The project aim was four-fold:
1. To develop standard test methods to study paint removal efficacy.
2. To examine a wide area of the microemulsion ternary phase diagram with regard to paint
removal efficacy.
3. To determine any correlation between the paint removal efficacy and one or several physical
properties like conductivity, turbidity and viscosity.
4. To investigate the system behavior after the introduction of a new surface-active additive with
the long-term ambition to reduce the solvent and/or surfactant concentration and to improve
the paint removal efficacy of the microemulsion.
3
2 Theory
2.1 Surfactants Surfactant is the commonly used name for amphiphilic and surface-active molecules containing one
hydrophobic and one hydrophilic part, respectively, denoted hydrophilic head and hydrophobic tail.
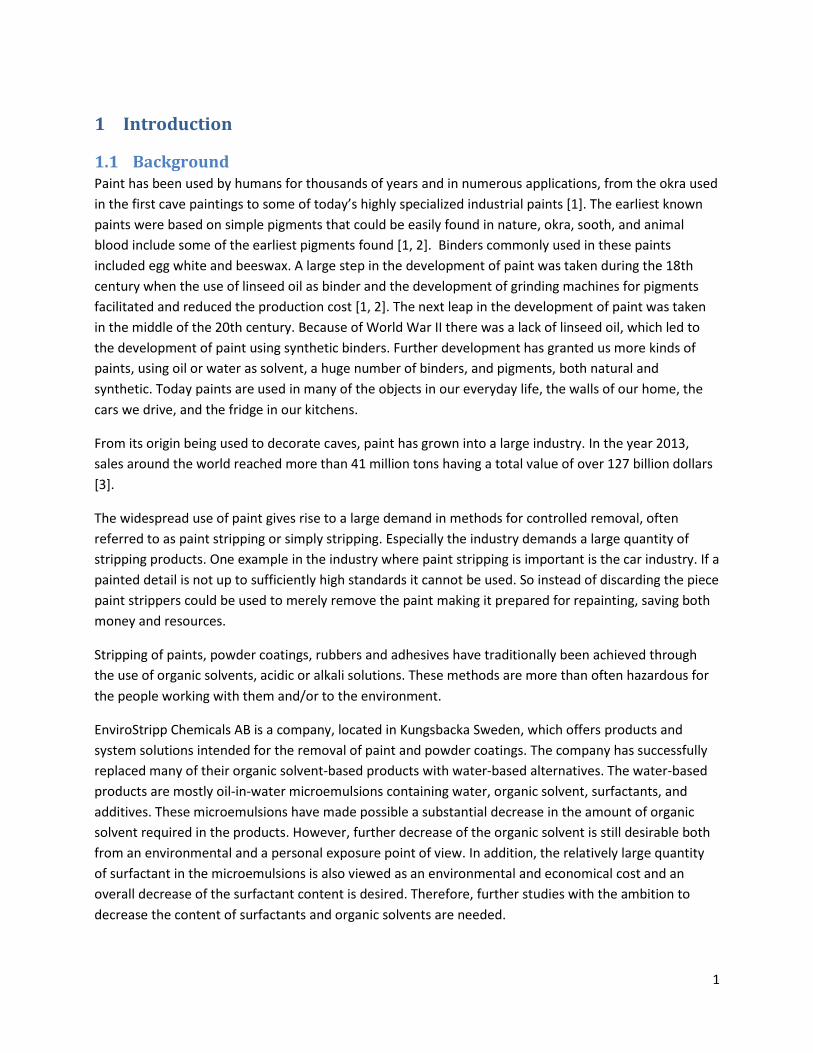
Surfactants are usually categorized in four groups depending on the property of the hydrophilic head.
These groups are: nonionic, anionic, cationic, and zwitterionic surfactants, see examples in Figure 1.
Nonionic surfactants have a polar headgroup that is uncharged, this group often consists of
polyethylenglycol. Anionic surfactants have a negatively charged headgroup, different sulfates or
carboxylates are common headgroups. Cationic surfactants have a positively charged headgroup which
can be an amine. Zwitterionic surfactants have a headgroup that is both positively and negatively
charged with the two charges located at different functional groups. Furthermore, while not commonly
recognized as surfactants, surface-active polymers also exhibit surface tension lowering properties. The
group defined as block copolymers is one example and most commonly used in small amounts mixed
with regular surfactants in order to enhance the overall lowering of interfacial tension [4].
Figure 1: From top to bottom: examples of nonionic, anionic, cationic, and zwitterionic surfactants [5].
Due to their affinity for both hydrophilic and hydrophobic environment surfactants tend to migrate to
the interface between phases and lower the interfacial tension. The interfacial tension will continue to
decrease until the interface is saturated with surfactants, at which point further addition of surfactant
will form aggregates in the solution called micelles. This critical point is called critical micelle
concentration or CMC for short [6]. At the CMC any further addition of surfactant will not further lower
the surface tension.
2.2 Microemulsions Hydrophilic and hydrophobic liquids, e.g. water and some kind of oil, usually do not mix because of the
large difference in polarity between the two phases. The interfacial tension between the two immiscible
phases is large and the system thus attends a minimal interfacial area. By the addition of surfactant the
interfacial tension can be greatly reduced. The area between the phases can thereby increase and an
emulsion can be formed. If the interfacial tension is lowered dramatically, a one-phase dynamic system
of water and oil can be formed. This system is called microemulsion, which is a thermodynamic stable
phase where the surfactant content often is at a significant concentration compared to an ordinary
emulsion with the same ratio of water and oil. In order to form a microemulsion a fourth component is
4
often needed in addition to water, oil and surfactant, a so-called cosurfactant. This cosurfactant is
usually some kind of medium chain length alcohol, which facilitates the formation of a close-packed
surfactant arrangement at the water/oil interface [5].
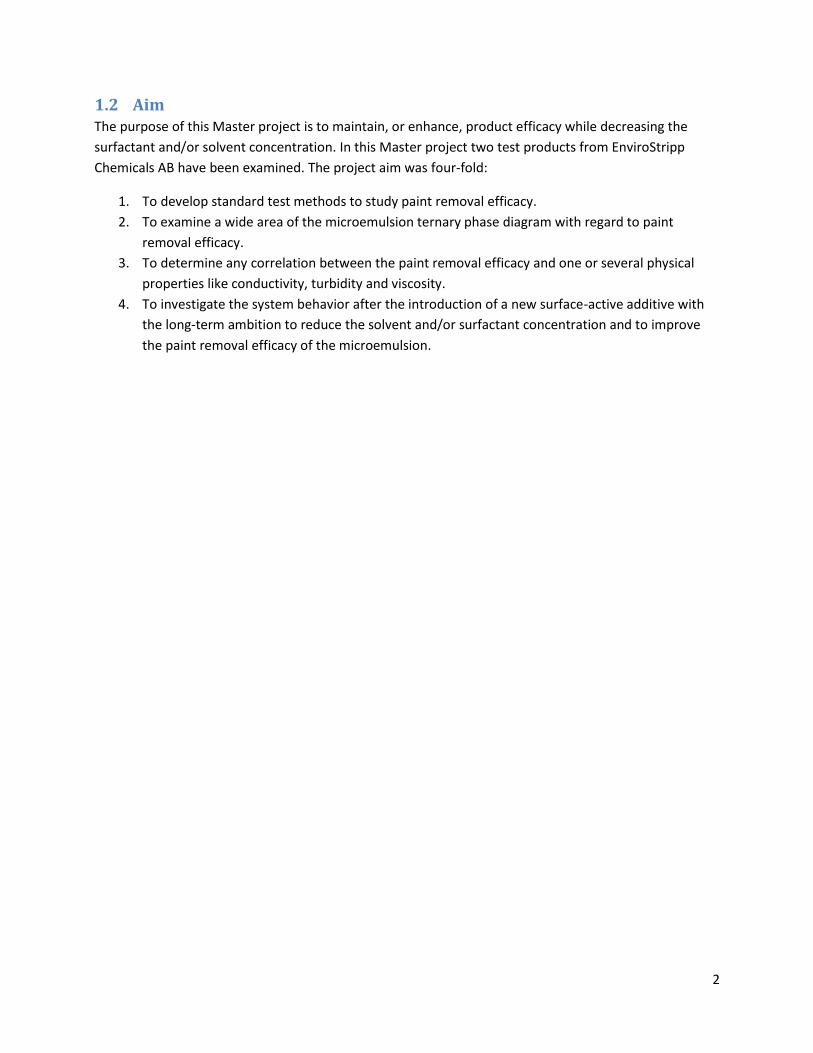
Unlike emulsions, which are not thermodynamically stable, microemulsions form without the addition of
work when the components are mixed [4, 6]. Microemulsions are generally translucent since the size of
the aggregates is in the nanometer range leading to no light of visual wavelengths being scattered.
Microemulsions are also much more dynamic systems than emulsions with oil/ water domains
constantly forming and breaking apart. Figure 2 lists the main differences between emulsions and
microemulsions and shows the large difference in curvature of the interfacial film.
Figure 2: Main differences between emulsions and microemulsions [5].
Depending on the concentration of the components in the microemulsion its micro-domain structure can
change drastically, and the concentration interval at which one-phase microemulsions are formed are
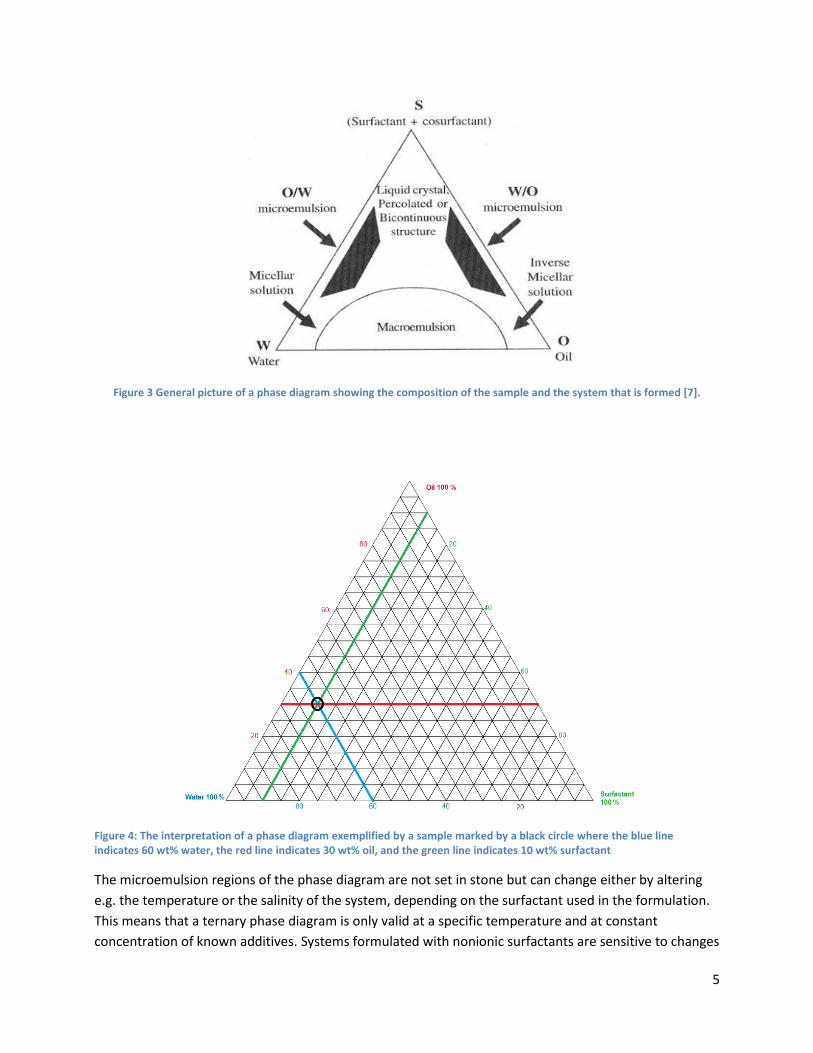
generally narrow as can be seen in Figure 3. A microemulsion can change from having domains with oil in
water, to being bicontinuous, to have water domains in oil. At low surfactant concentrations these
systems may exist, not as pure microemulsions but as microemulsions in equilibrium with one or both of
the liquid phases [5]. These systems are called Winsor systems. So-called ternary phase diagrams are
often used to show at which conditions microemulsions form and what kind that is being formed.
Ternary phase diagrams generally show the weight-percentage ratio between water, surfactant, and oil.
This makes it possible to see at what concentrations of the components a microemulsion is formed.
5
Figure 3 General picture of a phase diagram showing the composition of the sample and the system that is formed [7].
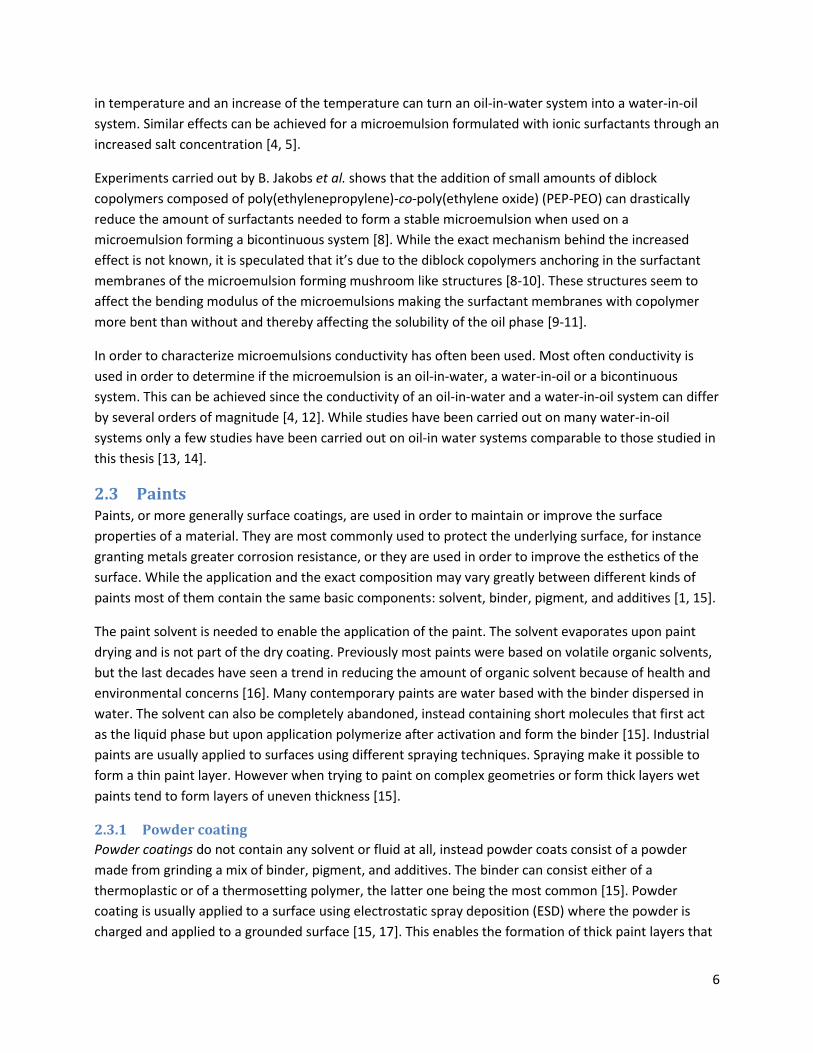
Figure 4: The interpretation of a phase diagram exemplified by a sample marked by a black circle where the blue line indicates 60 wt% water, the red line indicates 30 wt% oil, and the green line indicates 10 wt% surfactant
The microemulsion regions of the phase diagram are not set in stone but can change either by altering
e.g. the temperature or the salinity of the system, depending on the surfactant used in the formulation.
This means that a ternary phase diagram is only valid at a specific temperature and at constant
concentration of known additives. Systems formulated with nonionic surfactants are sensitive to changes
6
in temperature and an increase of the temperature can turn an oil-in-water system into a water-in-oil
system. Similar effects can be achieved for a microemulsion formulated with ionic surfactants through an
increased salt concentration [4, 5].
Experiments carried out by B. Jakobs et al. shows that the addition of small amounts of diblock
copolymers composed of poly(ethylenepropylene)-co-poly(ethylene oxide) (PEP-PEO) can drastically
reduce the amount of surfactants needed to form a stable microemulsion when used on a
microemulsion forming a bicontinuous system [8]. While the exact mechanism behind the increased
effect is not known, it is speculated that it’s due to the diblock copolymers anchoring in the surfactant
membranes of the microemulsion forming mushroom like structures [8-10]. These structures seem to
affect the bending modulus of the microemulsions making the surfactant membranes with copolymer
more bent than without and thereby affecting the solubility of the oil phase [9-11].
In order to characterize microemulsions conductivity has often been used. Most often conductivity is
used in order to determine if the microemulsion is an oil-in-water, a water-in-oil or a bicontinuous
system. This can be achieved since the conductivity of an oil-in-water and a water-in-oil system can differ
by several orders of magnitude [4, 12]. While studies have been carried out on many water-in-oil
systems only a few studies have been carried out on oil-in water systems comparable to those studied in
this thesis [13, 14].
2.3 Paints Paints, or more generally surface coatings, are used in order to maintain or improve the surface
properties of a material. They are most commonly used to protect the underlying surface, for instance
granting metals greater corrosion resistance, or they are used in order to improve the esthetics of the
surface. While the application and the exact composition may vary greatly between different kinds of
paints most of them contain the same basic components: solvent, binder, pigment, and additives [1, 15].
The paint solvent is needed to enable the application of the paint. The solvent evaporates upon paint
drying and is not part of the dry coating. Previously most paints were based on volatile organic solvents,
but the last decades have seen a trend in reducing the amount of organic solvent because of health and
environmental concerns [16]. Many contemporary paints are water based with the binder dispersed in
water. The solvent can also be completely abandoned, instead containing short molecules that first act
as the liquid phase but upon application polymerize after activation and form the binder [15]. Industrial
paints are usually applied to surfaces using different spraying techniques. Spraying make it possible to
form a thin paint layer. However when trying to paint on complex geometries or form thick layers wet
paints tend to form layers of uneven thickness [15].
2.3.1 Powder coating
Powder coatings do not contain any solvent or fluid at all, instead powder coats consist of a powder
made from grinding a mix of binder, pigment, and additives. The binder can consist either of a
thermoplastic or of a thermosetting polymer, the latter one being the most common [15]. Powder
coating is usually applied to a surface using electrostatic spray deposition (ESD) where the powder is
charged and applied to a grounded surface [15, 17]. This enables the formation of thick paint layers that
7
form evenly no matter the geometry of the object being painted. After the paint is applied the paint is
heated in order to either melt the thermoplastic or start the curing the thermoset.
2.3.2 Binders
The binder is the paint ingredient that is of outmost importance since it forms the hard protective layer.
The binder consists of either a single kind of polymer or more commonly a mixture of different polymers
to achieve the right properties in the final dry film. Depending on the paint system the binder might
either be at thermoplastic or a thermoset polymer [15]. A thermoplastic is a polymer that can be molten
and reshaped or dissolved in a solvent while a thermoset polymer is characterized by not being able to
be either dissolved or molten after curing [18]. Thermosetting polymers resistance to reshaping is due to
crosslinking between the polymer chains making the polymers form a 3D network. Since the polymers
are being linked with covalent bonds the 3D network acts as one large macromolecule, too large to be
molten or dissolved [18]. The choice of polymers to use as binder in paint is determined by the demands
on the final paint film. For instance, in order to form a strong yet flexible paint film a mixture of polymers
with different properties is often needed.
2.4 Paint stripping The wide variety of binder mixtures makes it difficult to remove the paint since one paint stripper may
be very effective on one kind of polymer while being non-effective on others. Because of the many
different surfaces being painted and the different binders being used in paints the ease of stripping from
a surface may vary greatly.
In the industry, paint is traditionally stripped by chemical stripping, abrasion stripping, thermal stripping
or cryogenic stripping. Among these methods chemical and abrasion stripping are the most common.
2.4.1 Chemical stripping
Chemical stripping includes the useof acids or bases and the use of organic solvents to stripp the paint.
Most often the painted pieces are submerged in baths of either the organic solvent or the acid/base. In
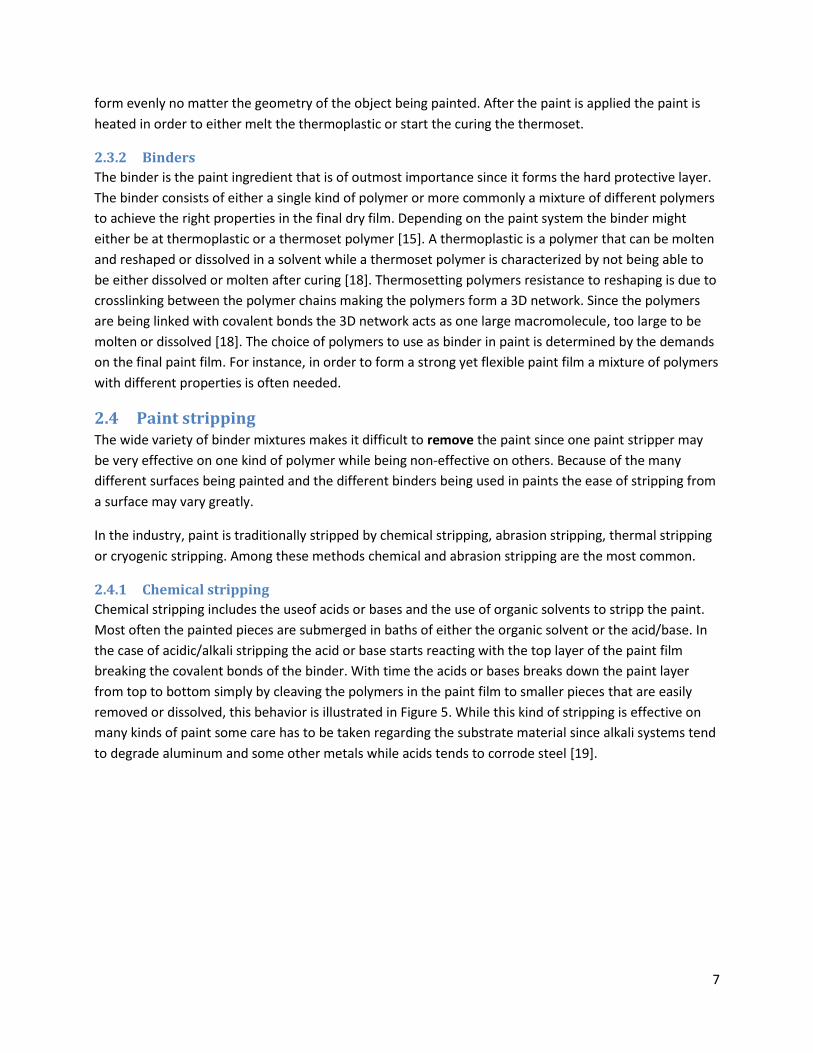
the case of acidic/alkali stripping the acid or base starts reacting with the top layer of the paint film
breaking the covalent bonds of the binder. With time the acids or bases breaks down the paint layer
from top to bottom simply by cleaving the polymers in the paint film to smaller pieces that are easily
removed or dissolved, this behavior is illustrated in Figure 5. While this kind of stripping is effective on
many kinds of paint some care has to be taken regarding the substrate material since alkali systems tend
to degrade aluminum and some other metals while acids tends to corrode steel [19].
8
Figure 5: Schematic picture showing the effect acids and bases have on paint films. The acid or base attacks the surface and break the covalent bonds of the binders. With time the paint film is dissolved from top to bottom.
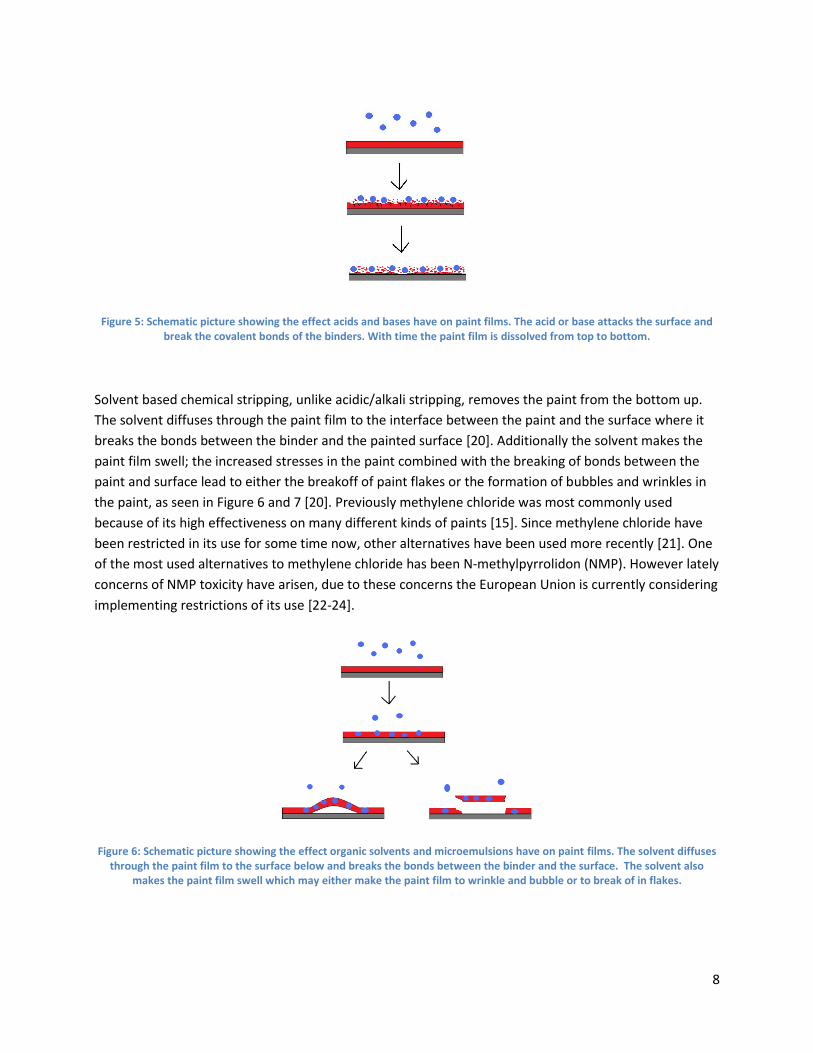
Solvent based chemical stripping, unlike acidic/alkali stripping, removes the paint from the bottom up.
The solvent diffuses through the paint film to the interface between the paint and the surface where it
breaks the bonds between the binder and the painted surface [20]. Additionally the solvent makes the
paint film swell; the increased stresses in the paint combined with the breaking of bonds between the
paint and surface lead to either the breakoff of paint flakes or the formation of bubbles and wrinkles in
the paint, as seen in Figure 6 and 7 [20]. Previously methylene chloride was most commonly used
because of its high effectiveness on many different kinds of paints [15]. Since methylene chloride have
been restricted in its use for some time now, other alternatives have been used more recently [21]. One
of the most used alternatives to methylene chloride has been N-methylpyrrolidon (NMP). However lately
concerns of NMP toxicity have arisen, due to these concerns the European Union is currently considering
implementing restrictions of its use [22-24].
Figure 6: Schematic picture showing the effect organic solvents and microemulsions have on paint films. The solvent diffuses through the paint film to the surface below and breaks the bonds between the binder and the surface. The solvent also
makes the paint film swell which may either make the paint film to wrinkle and bubble or to break of in flakes.
9
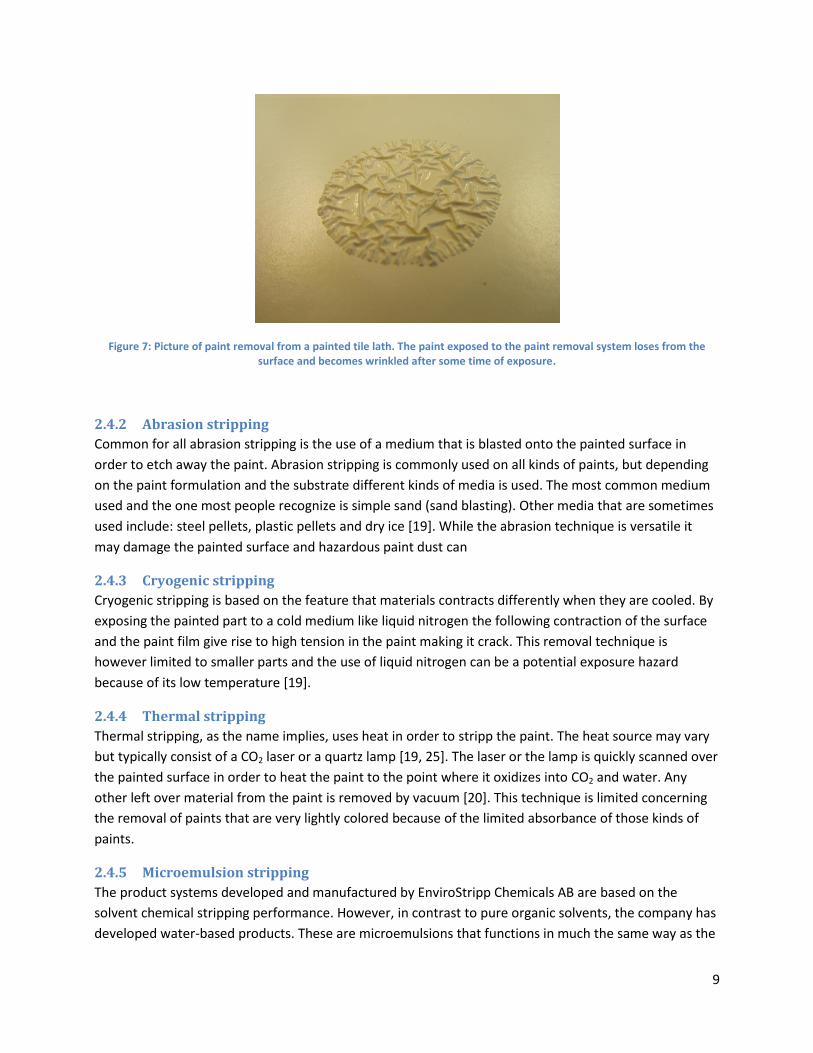
Figure 7: Picture of paint removal from a painted tile lath. The paint exposed to the paint removal system loses from the surface and becomes wrinkled after some time of exposure.
2.4.2 Abrasion stripping
Common for all abrasion stripping is the use of a medium that is blasted onto the painted surface in
order to etch away the paint. Abrasion stripping is commonly used on all kinds of paints, but depending
on the paint formulation and the substrate different kinds of media is used. The most common medium
used and the one most people recognize is simple sand (sand blasting). Other media that are sometimes
used include: steel pellets, plastic pellets and dry ice [19]. While the abrasion technique is versatile it
may damage the painted surface and hazardous paint dust can
2.4.3 Cryogenic stripping
Cryogenic stripping is based on the feature that materials contracts differently when they are cooled. By
exposing the painted part to a cold medium like liquid nitrogen the following contraction of the surface
and the paint film give rise to high tension in the paint making it crack. This removal technique is
however limited to smaller parts and the use of liquid nitrogen can be a potential exposure hazard
because of its low temperature [19].
2.4.4 Thermal stripping
Thermal stripping, as the name implies, uses heat in order to stripp the paint. The heat source may vary
but typically consist of a CO2 laser or a quartz lamp [19, 25]. The laser or the lamp is quickly scanned over
the painted surface in order to heat the paint to the point where it oxidizes into CO2 and water. Any
other left over material from the paint is removed by vacuum [20]. This technique is limited concerning
the removal of paints that are very lightly colored because of the limited absorbance of those kinds of
paints.
2.4.5 Microemulsion stripping
The product systems developed and manufactured by EnviroStripp Chemicals AB are based on the
solvent chemical stripping performance. However, in contrast to pure organic solvents, the company has
developed water-based products. These are microemulsions that functions in much the same way as the
10
organic solvents. The fundamental difference being that only about 20 wt% of the microemulsion is
composed of an organic solvent, the rest of the microemulsion being water and smaller fraction of
surfactants and additives.
2.5 Analytical methods In order to carry out this thesis work a couple of different analytical techniques have been used to
determine the properties of the microemulsions.
2.5.1 Electrical conductivity
Electric conductivity is a physical property that measures how easily electrons or other charge carriers
can be transported through a material [26].
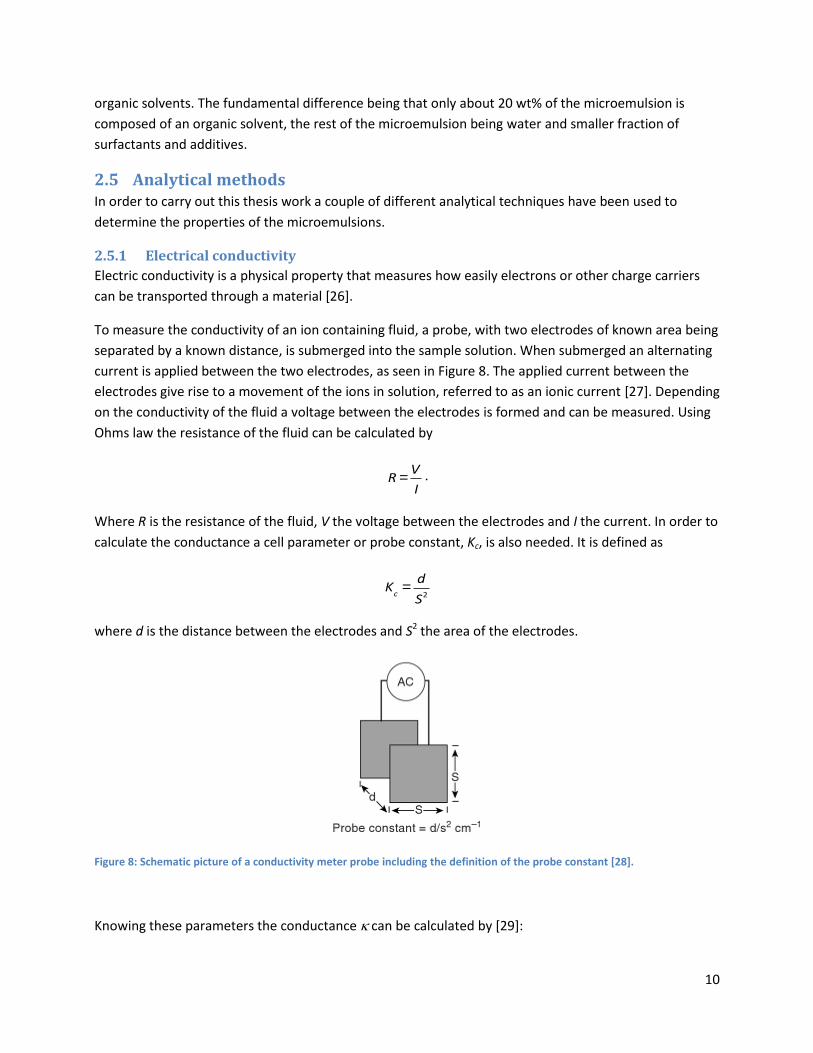
To measure the conductivity of an ion containing fluid, a probe, with two electrodes of known area being
separated by a known distance, is submerged into the sample solution. When submerged an alternating
current is applied between the two electrodes, as seen in Figure 8. The applied current between the
electrodes give rise to a movement of the ions in solution, referred to as an ionic current [27]. Depending
on the conductivity of the fluid a voltage between the electrodes is formed and can be measured. Using
Ohms law the resistance of the fluid can be calculated by
R =V
I.
Where R is the resistance of the fluid, V the voltage between the electrodes and I the current. In order to
calculate the conductance a cell parameter or probe constant, Kc, is also needed. It is defined as
Kc=d
S2
where d is the distance between the electrodes and S2 the area of the electrodes.
Figure 8: Schematic picture of a conductivity meter probe including the definition of the probe constant [28].
Knowing these parameters the conductance can be calculated by [29]:
11
k =Kc
R.
Because of greater mobility of ions at elevated temperatures, conductivity meters are often coupled
with thermometers and a program that compensates for the temperature elevation on order to give
comparable results independent of temperature [28, 29].
2.5.2 Viscosimetry
All fluids including both gases and liquids exhibit some resistance to the rate of deformation when an
external force is applied and the physical property is called viscosity. The viscosity, , of a fluid as defined
by Isaac Newton [30]:
m =t
dn dy
where denotes the shear stress upon the fluid and d/dy the rate of shear strain on the fluid.
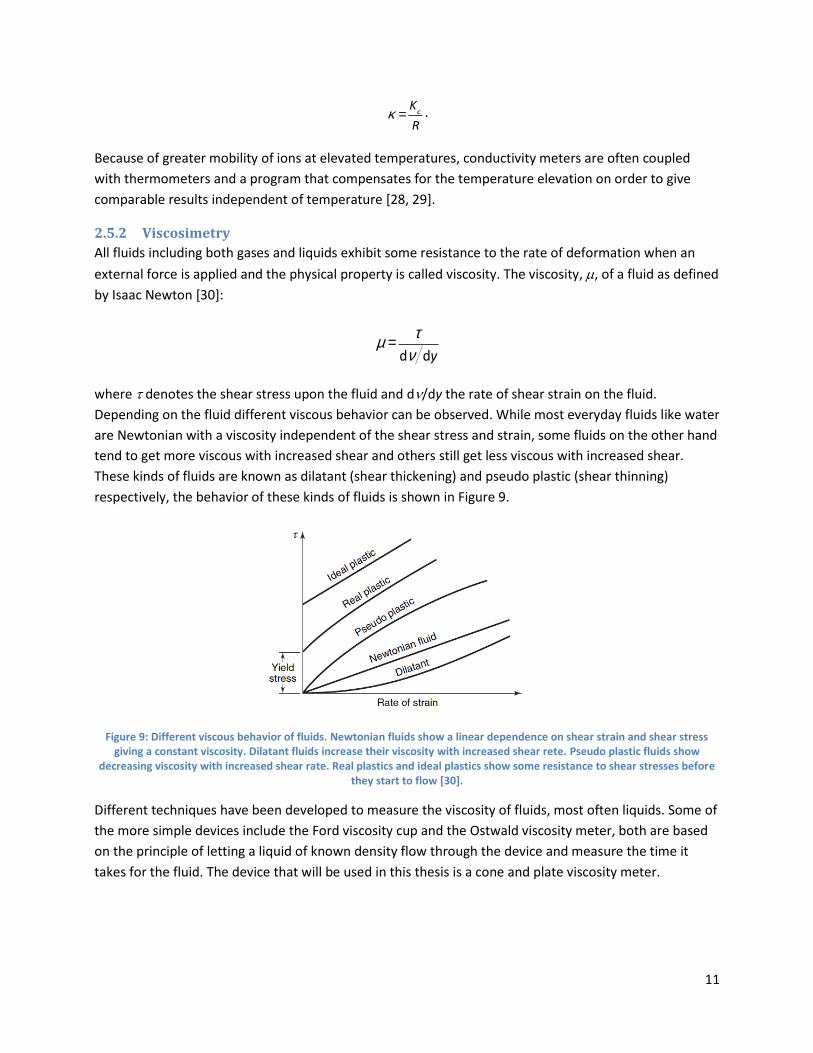
Depending on the fluid different viscous behavior can be observed. While most everyday fluids like water
are Newtonian with a viscosity independent of the shear stress and strain, some fluids on the other hand
tend to get more viscous with increased shear and others still get less viscous with increased shear.
These kinds of fluids are known as dilatant (shear thickening) and pseudo plastic (shear thinning)
respectively, the behavior of these kinds of fluids is shown in Figure 9.
Figure 9: Different viscous behavior of fluids. Newtonian fluids show a linear dependence on shear strain and shear stress giving a constant viscosity. Dilatant fluids increase their viscosity with increased shear rete. Pseudo plastic fluids show
decreasing viscosity with increased shear rate. Real plastics and ideal plastics show some resistance to shear stresses before they start to flow [30].
Different techniques have been developed to measure the viscosity of fluids, most often liquids. Some of
the more simple devices include the Ford viscosity cup and the Ostwald viscosity meter, both are based
on the principle of letting a liquid of known density flow through the device and measure the time it
takes for the fluid. The device that will be used in this thesis is a cone and plate viscosity meter.
12
2.5.2 Cone and plate viscosity meter
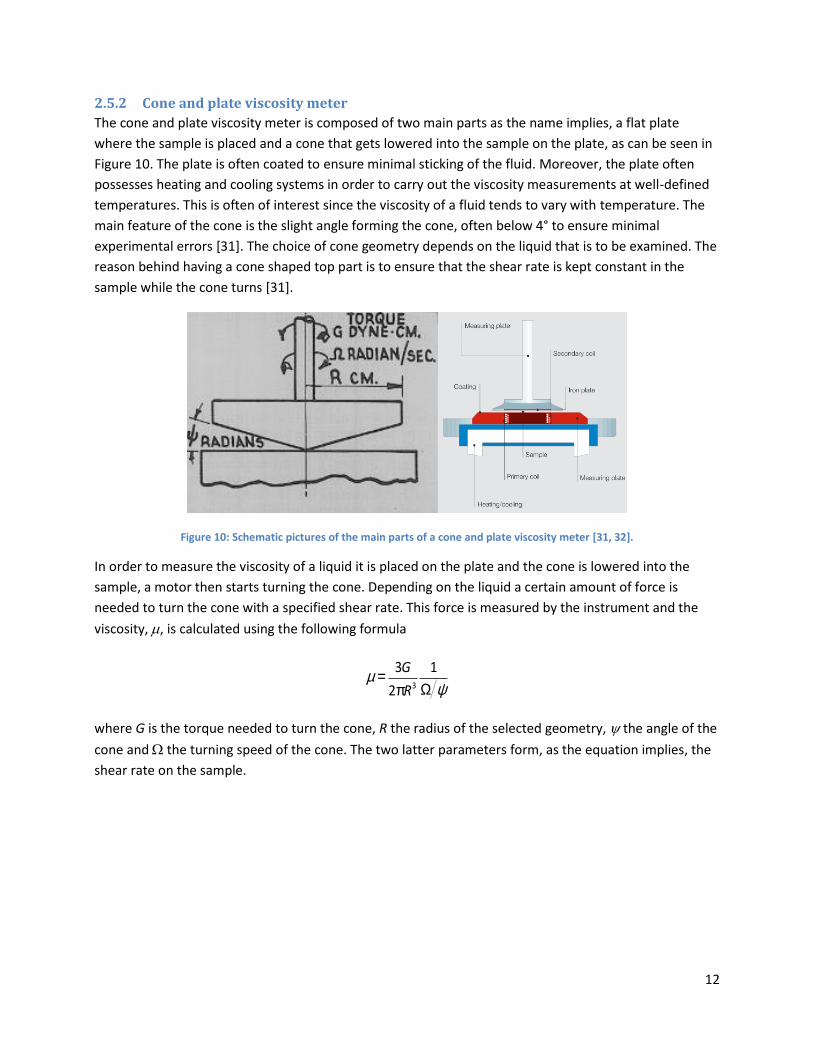
The cone and plate viscosity meter is composed of two main parts as the name implies, a flat plate
where the sample is placed and a cone that gets lowered into the sample on the plate, as can be seen in
Figure 10. The plate is often coated to ensure minimal sticking of the fluid. Moreover, the plate often
possesses heating and cooling systems in order to carry out the viscosity measurements at well-defined
temperatures. This is often of interest since the viscosity of a fluid tends to vary with temperature. The
main feature of the cone is the slight angle forming the cone, often below 4° to ensure minimal
experimental errors [31]. The choice of cone geometry depends on the liquid that is to be examined. The
reason behind having a cone shaped top part is to ensure that the shear rate is kept constant in the
sample while the cone turns [31].
Figure 10: Schematic pictures of the main parts of a cone and plate viscosity meter [31, 32].
In order to measure the viscosity of a liquid it is placed on the plate and the cone is lowered into the
sample, a motor then starts turning the cone. Depending on the liquid a certain amount of force is
needed to turn the cone with a specified shear rate. This force is measured by the instrument and the
viscosity, , is calculated using the following formula
m =3G
2pR3
1
W y
where G is the torque needed to turn the cone, R the radius of the selected geometry, the angle of the
cone and the turning speed of the cone. The two latter parameters form, as the equation implies, the
shear rate on the sample.
13
3 Experimental
3.1 Materials In this study the following materials and chemicals were used:
Water
“Oil”
Anionic surfactant 1
Anionic surfactant 2
Cosurfactant 1
Cosurfactant 2
Tile lath
Lath nails
3.2 Formulation and phase diagrams Two test products from EnviroStripp Chemicals AB were used as standard samples: an alkalic
microemulsion from here on denoted as Paint Stripper 1 or simply PS1 and an acidic microemulsion from
here on denoted as Paint Stripper 2 or simply PS2. PS1 consist of 20 wt% of a slightly hydrophilic oil-
phase, from here on simply denoted as oil, and 11 wt% surfactant mixture, from here on denoted as S1.
The surfactant mixture consists of an anionic surfactant mixture and a mixture of short cosurfactants, at
a ratio of 1.35:1.
PS 2 consist of 19 wt% of the same oil phase as PS1 and 14 wt% surfactant mixture from here on denoted
as S2. The surfactant mixture consists of an anionic surfactant mixture and a mixture of short
cosurfactants, at a ratio of 3.88:1.
Sample matrices consisting of 25 samples each were formulated with respect to each standard sample
by variation in composition of oil and surfactant mixture in steps of 3 wt%. The sample volume was set to
3 ml. First, the copolymer was dissolved in oil, then water was added and finally the surfactant mixture
was added. This order of mixing was due to the fact that in PS1 the addition of the surfactant mixture
prior to water led to the formation of a gelatinous blob between the surfactant and the oil that took
some effort to dissolve.
The PS1 samples were allowed to settle at room temperature after mixing and were then visually
inspected to detect if they formed a one-phase microemulsion system or if they formed a two- or
multiphase system. PS2 were treated similarly except for being heated to 45 °C in a water bath before
inspection. Based on these results phase diagrams could be created for the sample matrices.
3.3 Paint stripping material Standards for paint stripping had to be decided upon before any tests could be carried out to determine
the samples paint stripping properties. Metal plates, previously used by EnviroStripp as standard
samples, measuring 1020.1 cm and painted black using electro deposition, were submerged in
beakers filled with PS1 and PS2. Due to excessive time needed to achieve stripping these metal plates
14
were deemed not suitable as standards in this work. Further tests were carried out on metal plates
painted in the same manner as the metal on fridges, but due to a limited supply and them not being
uniformly covered in paint they were also disregarded. Finally lath nails from (Gunnebo fastening, art nr:
z400615) and a painted tile lath (bought at: Beijer bygg, Art.Nr: 868901611024) were tested and they
were deemed suitable as standards for submersion and droplet stripping tests respectively.
3.4 Paint stripping methods Only the samples that formed a one-phase system in the phase diagrams were subjected to paint
stripping studies. Two kinds of paint stripping tests were carried out for the samples: (i) painted lath nails
were submerged in the microemulsion samples and (ii) the microemulsion samples were applied on the
surface of a painted tile lath. The two paint stripping tests were chosen to be sufficiently different from
each other in order to ensure results that reflects the actual efficacy for the stripping systems, not only
their efficiency for one particular substrate.
3.4.1 Paint stripping from nails
For the submersion stripping test of PS1 approximately 100 ml of the samples were mixed in the same
way as described in 3.2. This amount of sample was added (just enough to completely cover the painted
nails) to 150 ml beakers and five painted nails were added in each beaker. At the addition of the nails a
timer was set and the temperature were checked so that the samples remained at room temperature,
19-21 °C. When a nail showed signs of losing of the paint it was removed from the beaker and cleaned
under running water using only finger force. If the paint removal were not deemed satisfactory during
cleaning it was put back into the beaker, otherwise the time was noted. This was repeated for all five
nails, then an average in stripping time was calculated.
The submersion paint stripping study for PS2 was carried out identically to for PS1 except that the
samples were heated to 45 °C. The elevated temperature was achieved using a heating bath consisting of
a large beaker containing silicon oil on a heating plate. A thermometer coupled to the heating plate
ensured a stable temperature at 45 °C for the silicon oil. Two beakers containing PS2 microemulsions
were lowered into the heating bath whereby the temperature at 45 °C could be established. Each beaker
was controlled with a separate thermometer to confirm that the appropriate temperature had been
achieved before the nails were added to the samples and a timer being started.
3.4.2 Paint stripping from painted tile lath
The drop test for paint stripping was carried out at room temperature for PS1 using a 3ml Pasteur
pipette. From each sample 20 droplets each were applied in two puddles onto the painted tile lath and
then covered with watch glasses to minimize any evaporation of the samples. A timer was set and the
samples closely inspected. When all the paint covered by the fluid started to get wrinkly and come lose
from the lath the time was noted, the average time for the samples was then calculated.
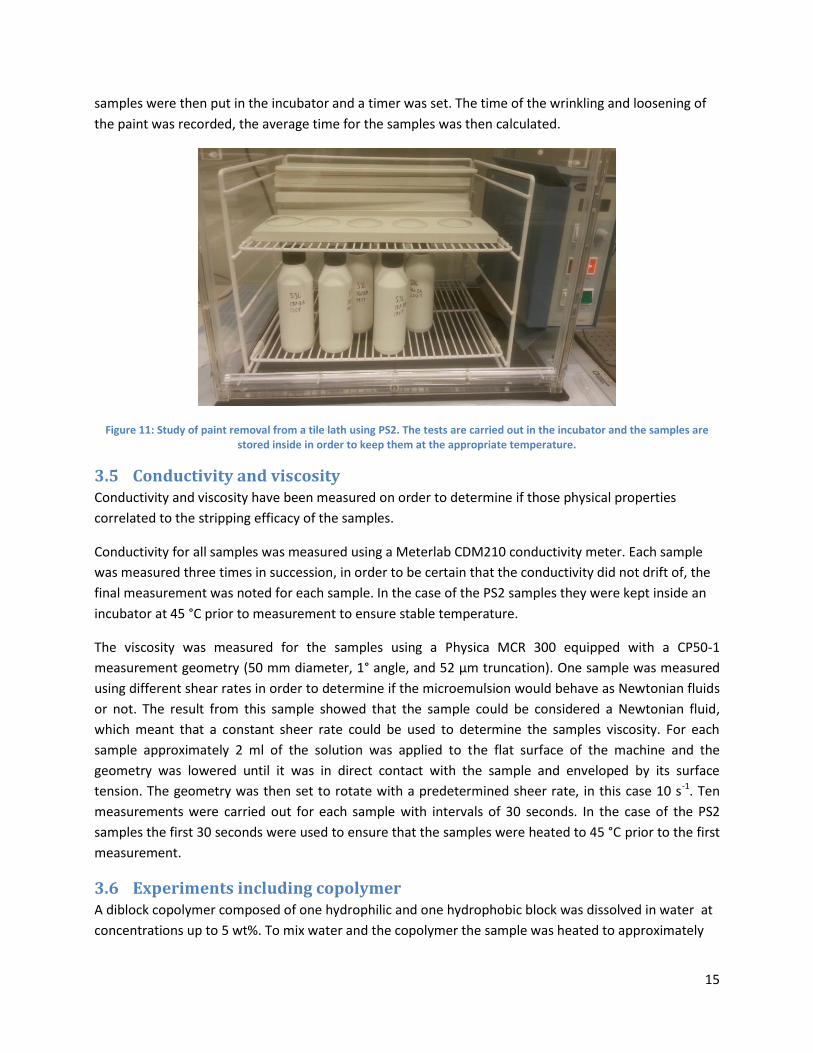
For PS2 the procedure was similar except for the need of keeping the temperature at 45 °C. All of the
samples were kept overnight in an incubator at 45 °C and the tile laths were kept in the incubator about
an hour before the test were carried out in order to ensure correct temperature. As for PS1, 20 droplets
each of the PS2 samples were applied in two puddles onto the lath and covered with watch glasses. The
15
samples were then put in the incubator and a timer was set. The time of the wrinkling and loosening of
the paint was recorded, the average time for the samples was then calculated.
Figure 11: Study of paint removal from a tile lath using PS2. The tests are carried out in the incubator and the samples are stored inside in order to keep them at the appropriate temperature.
3.5 Conductivity and viscosity Conductivity and viscosity have been measured on order to determine if those physical properties
correlated to the stripping efficacy of the samples.
Conductivity for all samples was measured using a Meterlab CDM210 conductivity meter. Each sample
was measured three times in succession, in order to be certain that the conductivity did not drift of, the
final measurement was noted for each sample. In the case of the PS2 samples they were kept inside an
incubator at 45 °C prior to measurement to ensure stable temperature.
The viscosity was measured for the samples using a Physica MCR 300 equipped with a CP50-1
measurement geometry (50 mm diameter, 1° angle, and 52 µm truncation). One sample was measured
using different shear rates in order to determine if the microemulsion would behave as Newtonian fluids
or not. The result from this sample showed that the sample could be considered a Newtonian fluid,
which meant that a constant sheer rate could be used to determine the samples viscosity. For each
sample approximately 2 ml of the solution was applied to the flat surface of the machine and the
geometry was lowered until it was in direct contact with the sample and enveloped by its surface
tension. The geometry was then set to rotate with a predetermined sheer rate, in this case 10 s-1. Ten
measurements were carried out for each sample with intervals of 30 seconds. In the case of the PS2
samples the first 30 seconds were used to ensure that the samples were heated to 45 °C prior to the first
measurement.
3.6 Experiments including copolymer A diblock copolymer composed of one hydrophilic and one hydrophobic block was dissolved in water at
concentrations up to 5 wt%. To mix water and the copolymer the sample was heated to approximately
16
85 °C on a heating plate while being magnetically stirred. The sample was removed and cooled to room
temperature when all copolymer had been dissolved.
The water solution containing the copolymer was then used in the formulation of new systems based on
PS2 and PS1. The copolymer aqueous solution was mainly tested with those samples that had been
shown to form two phase systems since the addition of copolymer was intended to reduce the amount
of surfactant mix needed to form a one phase system. The initial tests were rough with little focus on
exact composition and were meant to form a feeling for the behavior of the systems containing
copolymer. Following these initial tests further more precise tests were carried out.
Five samples of PS1- and five samples of PS2-based systems were prepared to be tested with the
addition of 0.5 wt% copolymer. The PS1 samples selected contained 20 wt% oil and 5, 8, 11, 14, 17 wt%
S1 solution, respectively. The PS2 samples selected contained 19 wt% oil and 8, 11, 14, 17, 20 wt% S2
solution, respectively. These sample sets were chosen since they include a variety of samples where a
few formed one-phase systems and the others formed two-phase systems. The addition of a copolymer
would therefore showcase how the addition of copolymer impact on both the one and the two-phase
systems.
The samples were prepared in the same manner as the samples used for the phase diagrams as
described in 3.2 The only deviation from previous sample preparation was the substitution of 300 µL
water with a 5 wt% copolymer aqueous solution that was prepared in the same manner as the previously
. The addition of the copolymer solution made the final samples contain 0.5 wt% copolymer in addition
to their oil and surfactant content.
17
4 Results and discussion
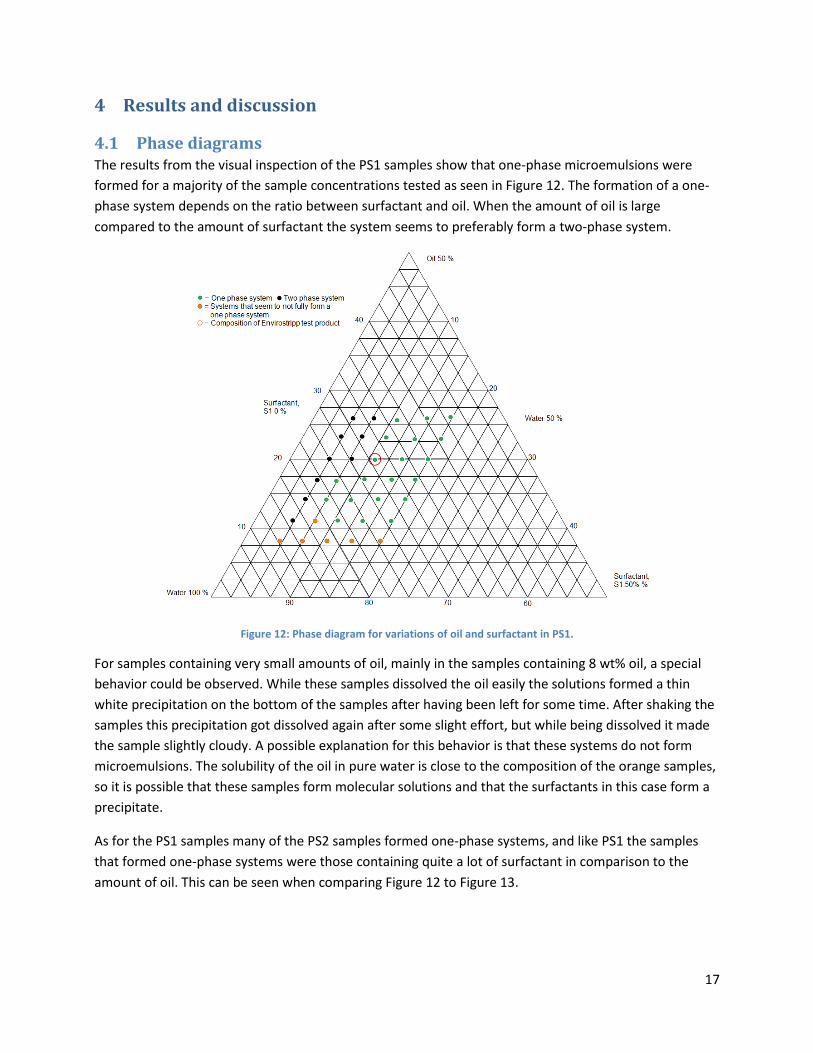
4.1 Phase diagrams The results from the visual inspection of the PS1 samples show that one-phase microemulsions were
formed for a majority of the sample concentrations tested as seen in Figure 12. The formation of a one-
phase system depends on the ratio between surfactant and oil. When the amount of oil is large
compared to the amount of surfactant the system seems to preferably form a two-phase system.
Figure 12: Phase diagram for variations of oil and surfactant in PS1.
For samples containing very small amounts of oil, mainly in the samples containing 8 wt% oil, a special
behavior could be observed. While these samples dissolved the oil easily the solutions formed a thin
white precipitation on the bottom of the samples after having been left for some time. After shaking the
samples this precipitation got dissolved again after some slight effort, but while being dissolved it made
the sample slightly cloudy. A possible explanation for this behavior is that these systems do not form
microemulsions. The solubility of the oil in pure water is close to the composition of the orange samples,
so it is possible that these samples form molecular solutions and that the surfactants in this case form a
precipitate.
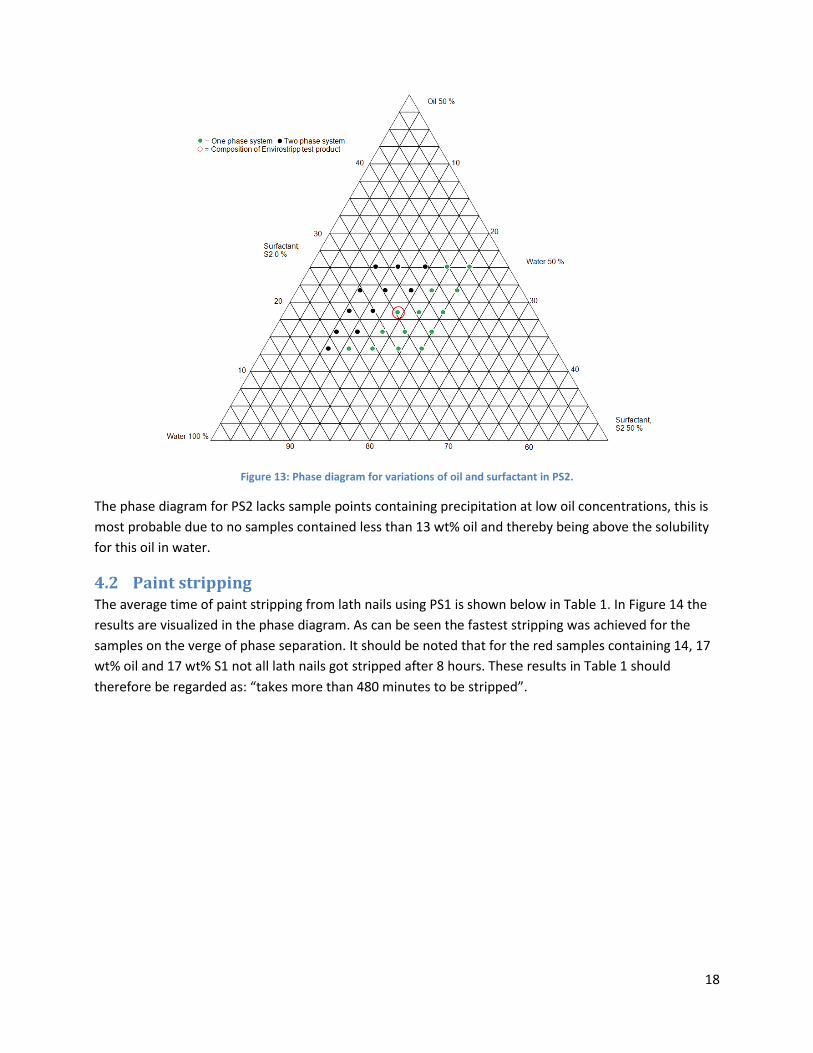
As for the PS1 samples many of the PS2 samples formed one-phase systems, and like PS1 the samples
that formed one-phase systems were those containing quite a lot of surfactant in comparison to the
amount of oil. This can be seen when comparing Figure 12 to Figure 13.
18
Figure 13: Phase diagram for variations of oil and surfactant in PS2.
The phase diagram for PS2 lacks sample points containing precipitation at low oil concentrations, this is
most probable due to no samples contained less than 13 wt% oil and thereby being above the solubility
for this oil in water.
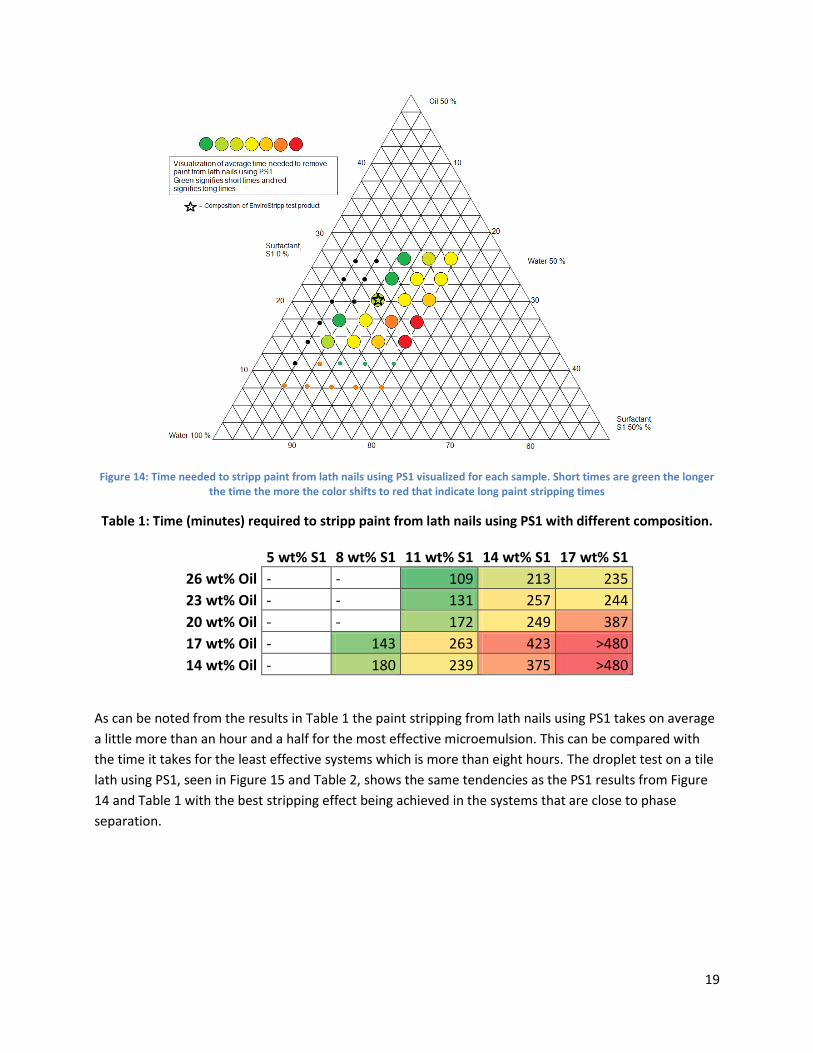
4.2 Paint stripping The average time of paint stripping from lath nails using PS1 is shown below in Table 1. In Figure 14 the
results are visualized in the phase diagram. As can be seen the fastest stripping was achieved for the
samples on the verge of phase separation. It should be noted that for the red samples containing 14, 17
wt% oil and 17 wt% S1 not all lath nails got stripped after 8 hours. These results in Table 1 should
therefore be regarded as: “takes more than 480 minutes to be stripped”.
19
Figure 14: Time needed to stripp paint from lath nails using PS1 visualized for each sample. Short times are green the longer the time the more the color shifts to red that indicate long paint stripping times
Table 1: Time (minutes) required to stripp paint from lath nails using PS1 with different composition.
5 wt% S1 8 wt% S1 11 wt% S1 14 wt% S1 17 wt% S1
26 wt% Oil - - 109 213 235
23 wt% Oil - - 131 257 244
20 wt% Oil - - 172 249 387
17 wt% Oil - 143 263 423 >480
14 wt% Oil - 180 239 375 >480
As can be noted from the results in Table 1 the paint stripping from lath nails using PS1 takes on average
a little more than an hour and a half for the most effective microemulsion. This can be compared with
the time it takes for the least effective systems which is more than eight hours. The droplet test on a tile
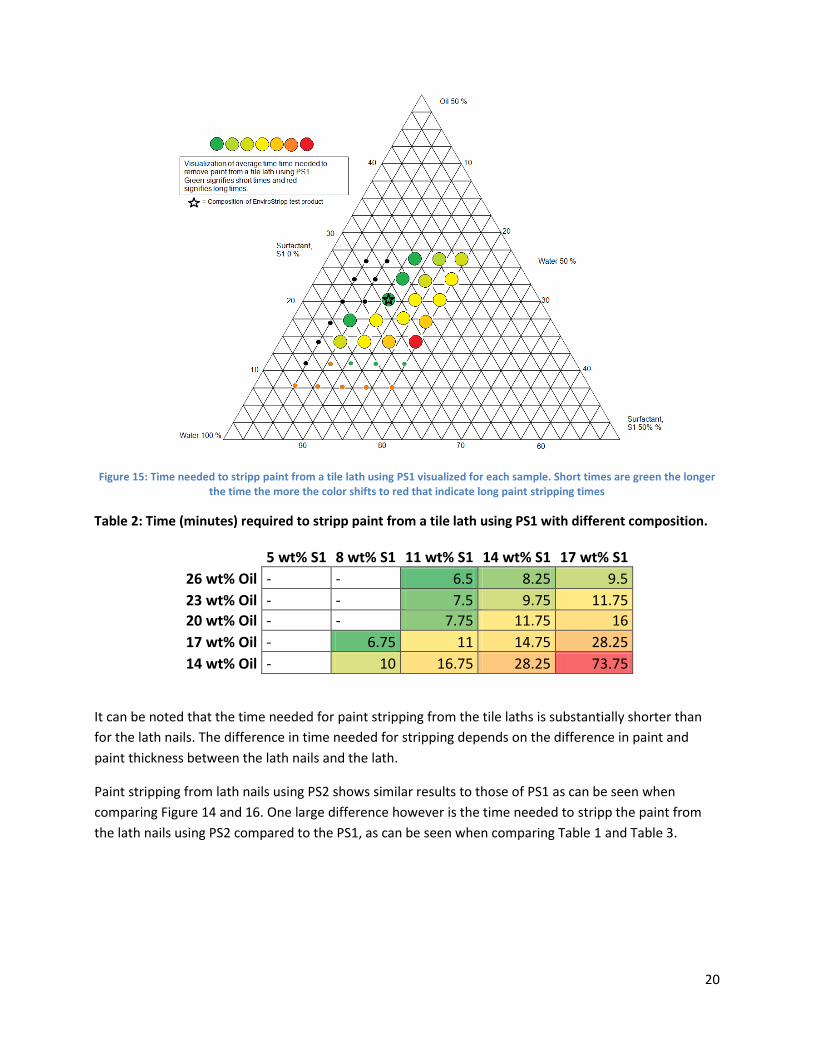
lath using PS1, seen in Figure 15 and Table 2, shows the same tendencies as the PS1 results from Figure
14 and Table 1 with the best stripping effect being achieved in the systems that are close to phase
separation.
20
Figure 15: Time needed to stripp paint from a tile lath using PS1 visualized for each sample. Short times are green the longer the time the more the color shifts to red that indicate long paint stripping times
Table 2: Time (minutes) required to stripp paint from a tile lath using PS1 with different composition.
5 wt% S1 8 wt% S1 11 wt% S1 14 wt% S1 17 wt% S1
26 wt% Oil - - 6.5 8.25 9.5
23 wt% Oil - - 7.5 9.75 11.75
20 wt% Oil - - 7.75 11.75 16
17 wt% Oil - 6.75 11 14.75 28.25
14 wt% Oil - 10 16.75 28.25 73.75
It can be noted that the time needed for paint stripping from the tile laths is substantially shorter than
for the lath nails. The difference in time needed for stripping depends on the difference in paint and
paint thickness between the lath nails and the lath.
Paint stripping from lath nails using PS2 shows similar results to those of PS1 as can be seen when
comparing Figure 14 and 16. One large difference however is the time needed to stripp the paint from
the lath nails using PS2 compared to the PS1, as can be seen when comparing Table 1 and Table 3.
21
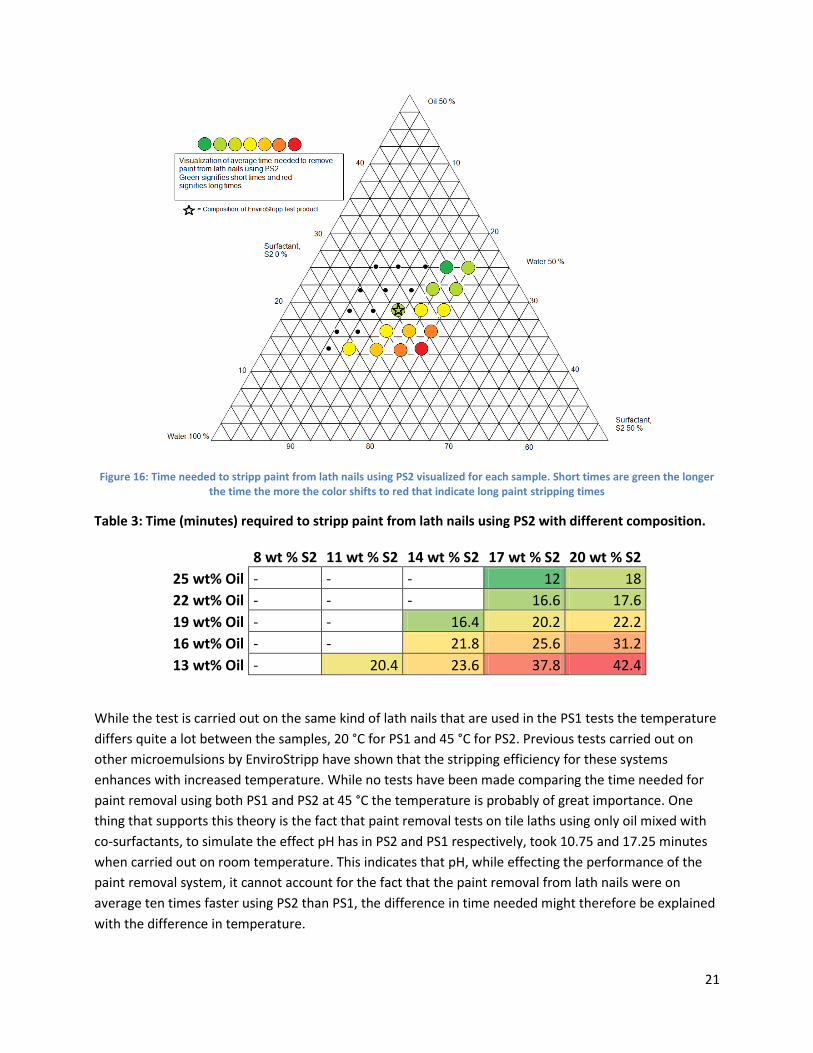
Figure 16: Time needed to stripp paint from lath nails using PS2 visualized for each sample. Short times are green the longer the time the more the color shifts to red that indicate long paint stripping times
Table 3: Time (minutes) required to stripp paint from lath nails using PS2 with different composition.
8 wt % S2 11 wt % S2 14 wt % S2 17 wt % S2 20 wt % S2
25 wt% Oil - - - 12 18
22 wt% Oil - - - 16.6 17.6
19 wt% Oil - - 16.4 20.2 22.2
16 wt% Oil - - 21.8 25.6 31.2
13 wt% Oil - 20.4 23.6 37.8 42.4
While the test is carried out on the same kind of lath nails that are used in the PS1 tests the temperature
differs quite a lot between the samples, 20 °C for PS1 and 45 °C for PS2. Previous tests carried out on
other microemulsions by EnviroStripp have shown that the stripping efficiency for these systems
enhances with increased temperature. While no tests have been made comparing the time needed for
paint removal using both PS1 and PS2 at 45 °C the temperature is probably of great importance. One
thing that supports this theory is the fact that paint removal tests on tile laths using only oil mixed with
co-surfactants, to simulate the effect pH has in PS2 and PS1 respectively, took 10.75 and 17.25 minutes
when carried out on room temperature. This indicates that pH, while effecting the performance of the
paint removal system, it cannot account for the fact that the paint removal from lath nails were on
average ten times faster using PS2 than PS1, the difference in time needed might therefore be explained
with the difference in temperature.
22
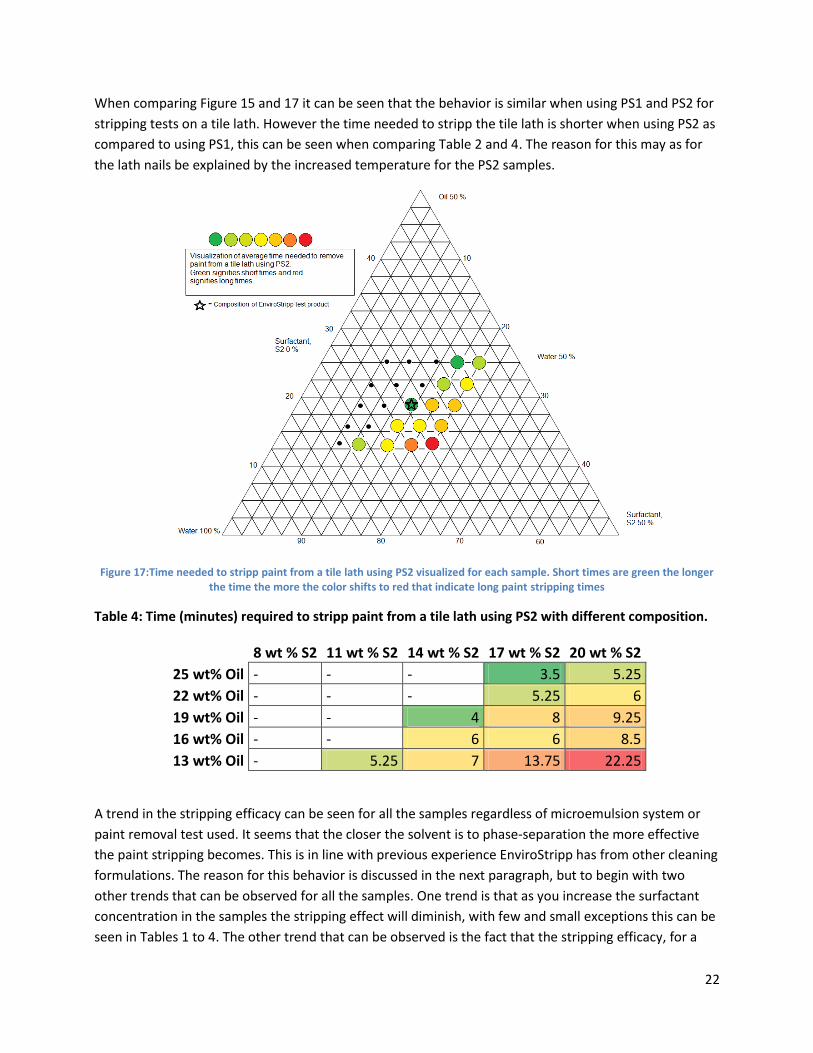
When comparing Figure 15 and 17 it can be seen that the behavior is similar when using PS1 and PS2 for
stripping tests on a tile lath. However the time needed to stripp the tile lath is shorter when using PS2 as
compared to using PS1, this can be seen when comparing Table 2 and 4. The reason for this may as for
the lath nails be explained by the increased temperature for the PS2 samples.
Figure 17:Time needed to stripp paint from a tile lath using PS2 visualized for each sample. Short times are green the longer the time the more the color shifts to red that indicate long paint stripping times
Table 4: Time (minutes) required to stripp paint from a tile lath using PS2 with different composition.
8 wt % S2 11 wt % S2 14 wt % S2 17 wt % S2 20 wt % S2
25 wt% Oil - - - 3.5 5.25
22 wt% Oil - - - 5.25 6
19 wt% Oil - - 4 8 9.25
16 wt% Oil - - 6 6 8.5
13 wt% Oil - 5.25 7 13.75 22.25
A trend in the stripping efficacy can be seen for all the samples regardless of microemulsion system or
paint removal test used. It seems that the closer the solvent is to phase-separation the more effective
the paint stripping becomes. This is in line with previous experience EnviroStripp has from other cleaning
formulations. The reason for this behavior is discussed in the next paragraph, but to begin with two
other trends that can be observed for all the samples. One trend is that as you increase the surfactant
concentration in the samples the stripping effect will diminish, with few and small exceptions this can be
seen in Tables 1 to 4. The other trend that can be observed is the fact that the stripping efficacy, for a
23
specific surfactant concentration, increases with an increased concentration of oil. While it could be
presumed that the increase of oil in the samples will simply increase the stripping effect with a maximum
efficiency when having pure oil, this is refuted by tests using pure oil. The time needed to stripp paint
from both lath nails and the painted lath proved greater for the use of pure oil. This proves that the
microemulsion enhances the paint stripping effect of the systems compared to pure oil. This would
probably mean that as the concentration of oil is increased in the system while still being close to a two-
phase system a minimum in time needed for paint stripping would be achieved. However this is not
studied any further in this thesis since the increase of organic solvent in the systems is in stark contrast
to the interest of this thesis work on decreasing the amount needed. The observation should however be
noted.
As found for both PS1 and PS2 – and for both types of stripping test methods – the rate of stripping is
faster when the concentration of surfactant is lowered, e.g. close to the phase-separation border in the
ternary phase diagram. The molecular reason for this behavior has not been investigated in this Master
project and would require further detailed studies of the micro-structure of the oil domains in the
microemulsion. In the so-called roll-up mechanism in a cleaning process using a microemulsion several
features are included: e.g. the adsorption of surfactants at the substrate interface, the swelling behavior
of the oil in the binder, and the stabilizing behavior of the oil by surfactants [5]. One plausible
explanation to the results in the work could be that the increase of surfactant enhances the stabilization
of oil domains in the microemulsion thereby preventing it from transport into, and swelling, the binder.
4.3 Conductivity measurements The conductivity for both the PS1 and PS2 samples are presented below in Tables 5 and 6 and in Figure
18 and 19. As mentioned in the theory part the conductivity of a microemulsion can change quite
drastically when shifting between an oil-in-water and a water in-oil-system. However no such change
was observed for these systems indicating that we have no change from oil-in-water systems to water-
in-oil systems over the range of the phase-diagram.
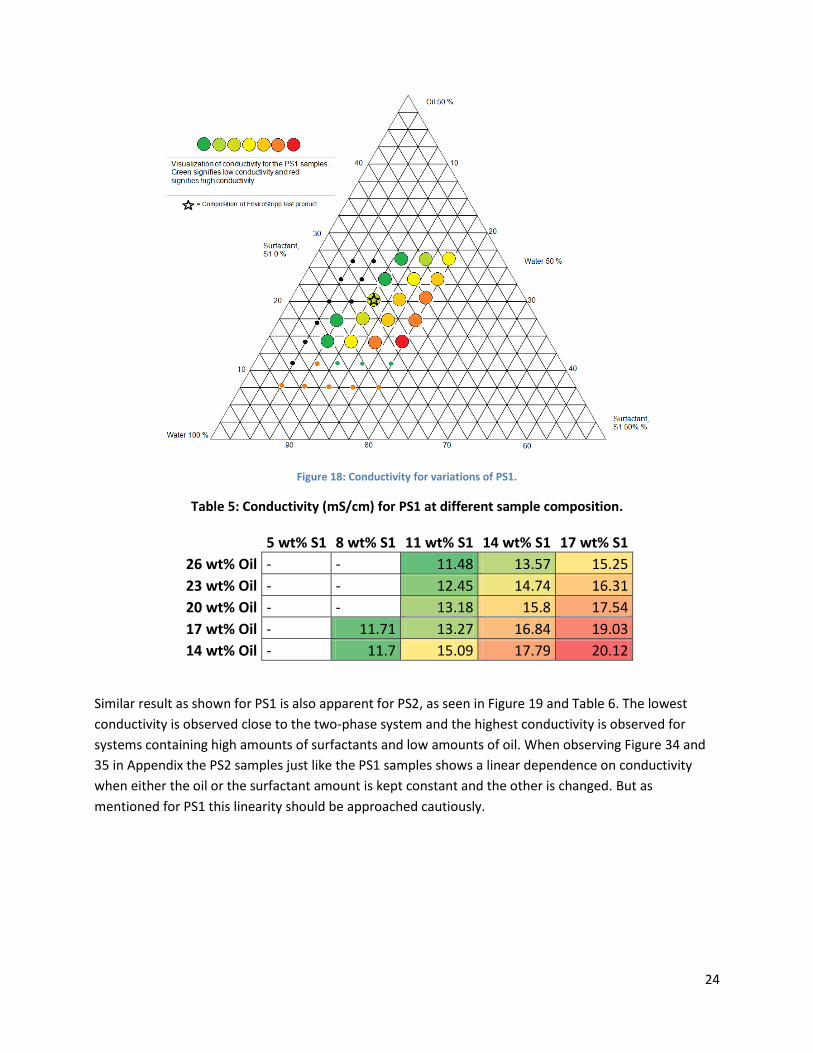
Figure 18 and Table 5 shows that the conductivity is at its lowest close to the phase separation of the
system for PS1. It also shows that highest conductivity is obtained at high surfactant and low oil
composition. When observing Figures 32 and 33 in Appendix, it can be seen that when either the oil or
surfactant composition is kept constant while varying the other linear trends seam to appear. It must
however be stressed that the linear behavior should be accepted with some caution since the amount of
samples in some of the series are limited. With this in mind it does look like the conductivity decreases
linearly with decreasing amount of oil and that the conductivity increases linearly with added S1.
24
Figure 18: Conductivity for variations of PS1.
Table 5: Conductivity (mS/cm) for PS1 at different sample composition.
5 wt% S1 8 wt% S1 11 wt% S1 14 wt% S1 17 wt% S1
26 wt% Oil - - 11.48 13.57 15.25
23 wt% Oil - - 12.45 14.74 16.31
20 wt% Oil - - 13.18 15.8 17.54
17 wt% Oil - 11.71 13.27 16.84 19.03
14 wt% Oil - 11.7 15.09 17.79 20.12
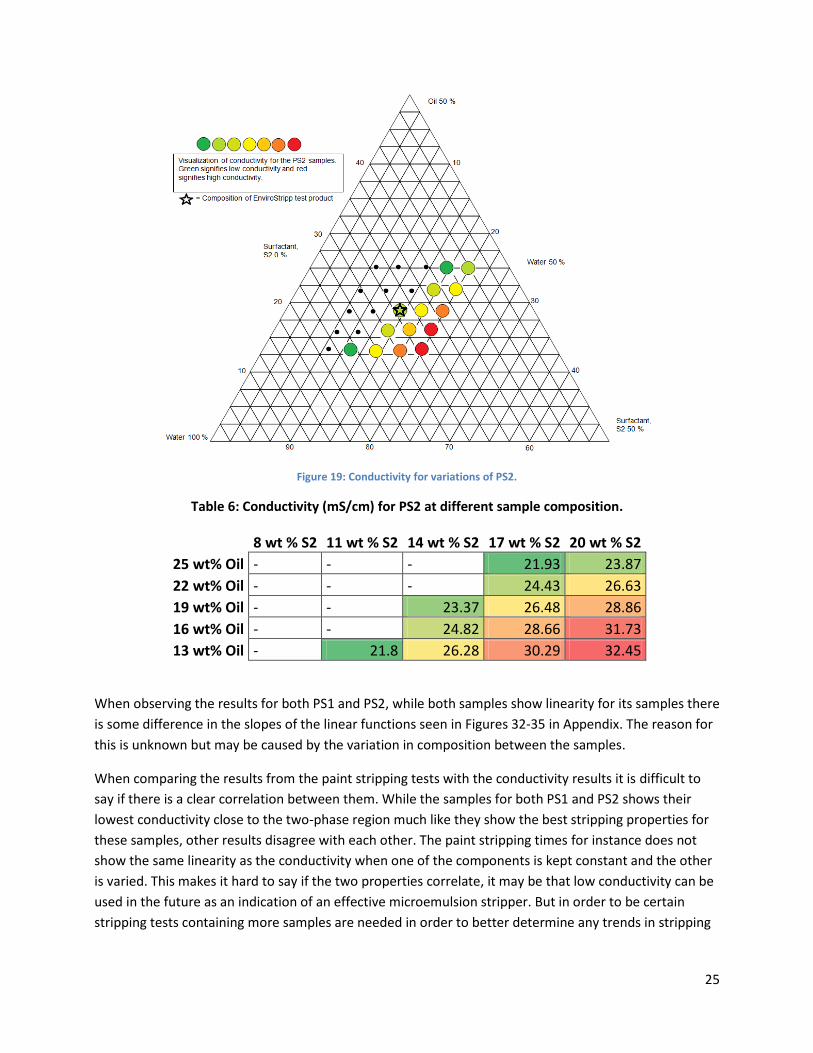
Similar result as shown for PS1 is also apparent for PS2, as seen in Figure 19 and Table 6. The lowest
conductivity is observed close to the two-phase system and the highest conductivity is observed for
systems containing high amounts of surfactants and low amounts of oil. When observing Figure 34 and
35 in Appendix the PS2 samples just like the PS1 samples shows a linear dependence on conductivity
when either the oil or the surfactant amount is kept constant and the other is changed. But as
mentioned for PS1 this linearity should be approached cautiously.
25
Figure 19: Conductivity for variations of PS2.
Table 6: Conductivity (mS/cm) for PS2 at different sample composition.
8 wt % S2 11 wt % S2 14 wt % S2 17 wt % S2 20 wt % S2
25 wt% Oil - - - 21.93 23.87
22 wt% Oil - - - 24.43 26.63
19 wt% Oil - - 23.37 26.48 28.86
16 wt% Oil - - 24.82 28.66 31.73
13 wt% Oil - 21.8 26.28 30.29 32.45
When observing the results for both PS1 and PS2, while both samples show linearity for its samples there
is some difference in the slopes of the linear functions seen in Figures 32-35 in Appendix. The reason for
this is unknown but may be caused by the variation in composition between the samples.
When comparing the results from the paint stripping tests with the conductivity results it is difficult to
say if there is a clear correlation between them. While the samples for both PS1 and PS2 shows their
lowest conductivity close to the two-phase region much like they show the best stripping properties for
these samples, other results disagree with each other. The paint stripping times for instance does not
show the same linearity as the conductivity when one of the components is kept constant and the other
is varied. This makes it hard to say if the two properties correlate, it may be that low conductivity can be
used in the future as an indication of an effective microemulsion stripper. But in order to be certain
stripping tests containing more samples are needed in order to better determine any trends in stripping
26
effect and many more microemulsions have to be studied to be sure that the conductivity is always at its
lowest close to the two-phase region.
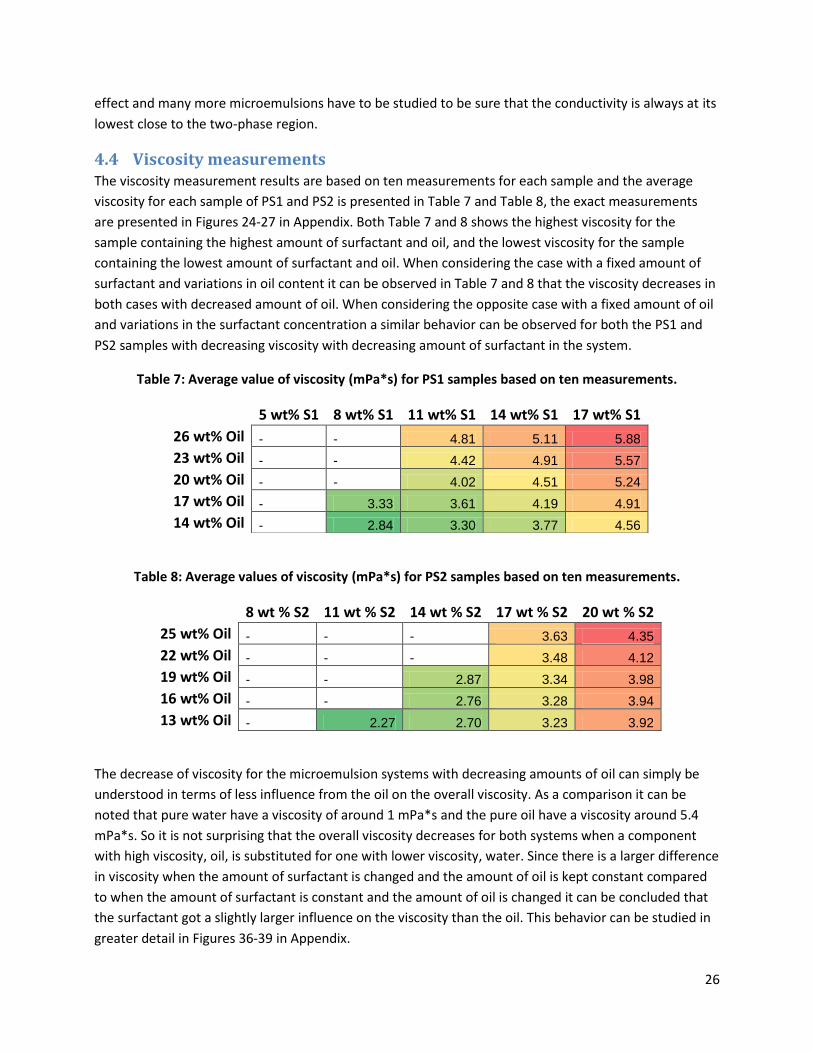
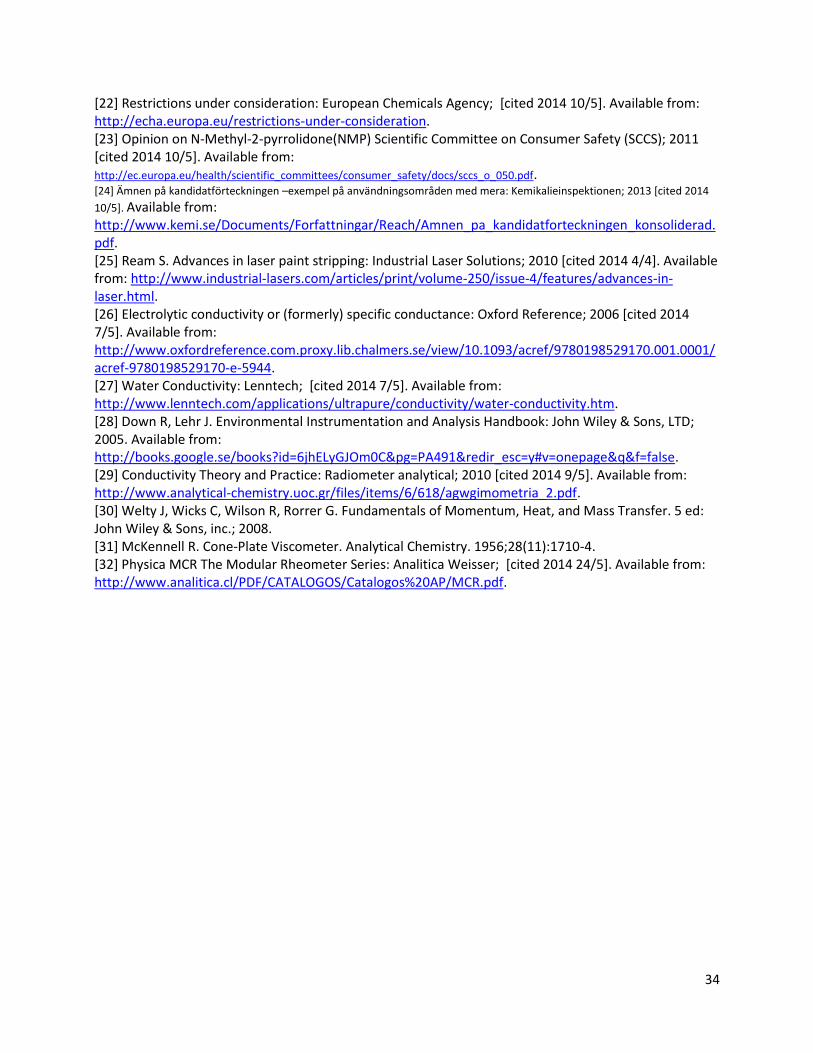
4.4 Viscosity measurements The viscosity measurement results are based on ten measurements for each sample and the average
viscosity for each sample of PS1 and PS2 is presented in Table 7 and Table 8, the exact measurements
are presented in Figures 24-27 in Appendix. Both Table 7 and 8 shows the highest viscosity for the
sample containing the highest amount of surfactant and oil, and the lowest viscosity for the sample
containing the lowest amount of surfactant and oil. When considering the case with a fixed amount of
surfactant and variations in oil content it can be observed in Table 7 and 8 that the viscosity decreases in
both cases with decreased amount of oil. When considering the opposite case with a fixed amount of oil
and variations in the surfactant concentration a similar behavior can be observed for both the PS1 and
PS2 samples with decreasing viscosity with decreasing amount of surfactant in the system.
Table 7: Average value of viscosity (mPa*s) for PS1 samples based on ten measurements.
Table 8: Average values of viscosity (mPa*s) for PS2 samples based on ten measurements.
8 wt % S2 11 wt % S2 14 wt % S2 17 wt % S2 20 wt % S2
25 wt% Oil - - - 3.63 4.35
22 wt% Oil - - - 3.48 4.12
19 wt% Oil - - 2.87 3.34 3.98
16 wt% Oil - - 2.76 3.28 3.94
13 wt% Oil - 2.27 2.70 3.23 3.92
The decrease of viscosity for the microemulsion systems with decreasing amounts of oil can simply be
understood in terms of less influence from the oil on the overall viscosity. As a comparison it can be
noted that pure water have a viscosity of around 1 mPa*s and the pure oil have a viscosity around 5.4
mPa*s. So it is not surprising that the overall viscosity decreases for both systems when a component
with high viscosity, oil, is substituted for one with lower viscosity, water. Since there is a larger difference
in viscosity when the amount of surfactant is changed and the amount of oil is kept constant compared
to when the amount of surfactant is constant and the amount of oil is changed it can be concluded that
the surfactant got a slightly larger influence on the viscosity than the oil. This behavior can be studied in
greater detail in Figures 36-39 in Appendix.
5 wt% S1 8 wt% S1 11 wt% S1 14 wt% S1 17 wt% S1
26 wt% Oil - - 4.81 5.11 5.88
23 wt% Oil - - 4.42 4.91 5.57
20 wt% Oil - - 4.02 4.51 5.24
17 wt% Oil - 3.33 3.61 4.19 4.91
14 wt% Oil - 2.84 3.30 3.77 4.56
27
When comparing the viscosity of the samples to the stripping efficiency no correlation seems apparent.
For the paint stripping results in Tables 1-4 it can be seen that the difference between samples when
increasing either the oil phase or the surfactant is not as linear as for the viscosity of the same samples.
Based on this and the previous discussion of the viscosity results it can be concluded that the viscosity
does not correlate with the paint stripping effect, it only seems to correlate with the amount of
surfactant and oil added to the system.
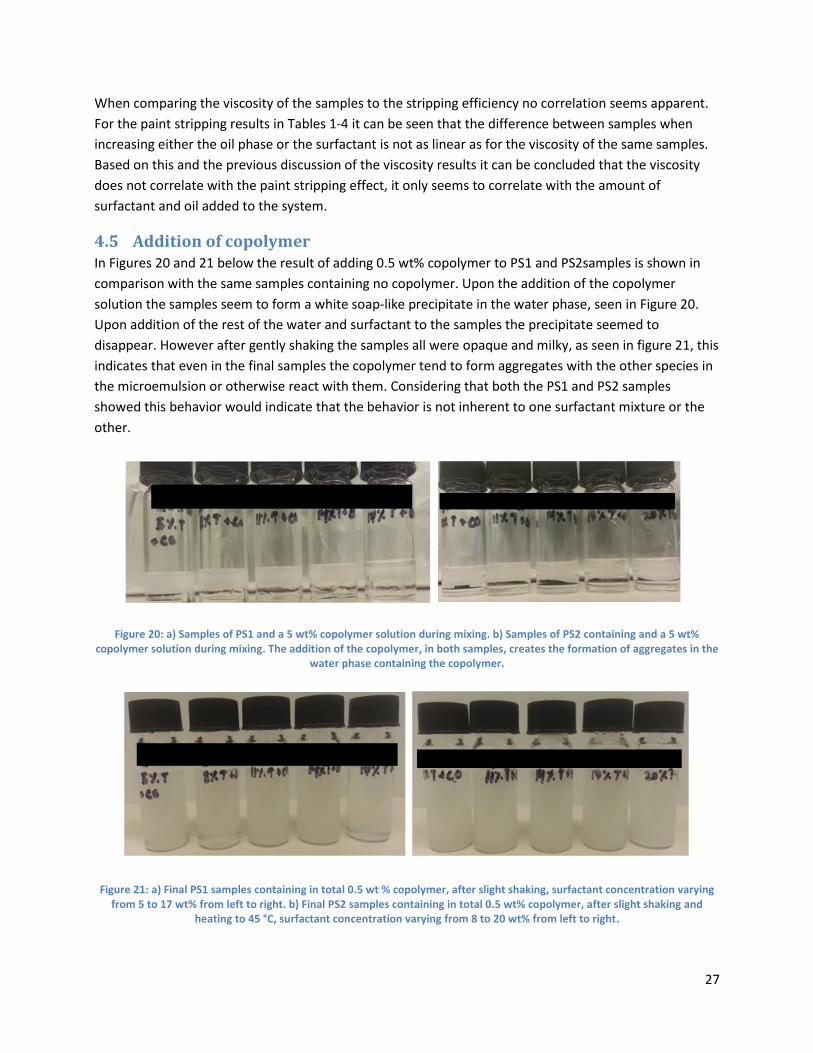
4.5 Addition of copolymer In Figures 20 and 21 below the result of adding 0.5 wt% copolymer to PS1 and PS2samples is shown in
comparison with the same samples containing no copolymer. Upon the addition of the copolymer
solution the samples seem to form a white soap-like precipitate in the water phase, seen in Figure 20.
Upon addition of the rest of the water and surfactant to the samples the precipitate seemed to
disappear. However after gently shaking the samples all were opaque and milky, as seen in figure 21, this
indicates that even in the final samples the copolymer tend to form aggregates with the other species in
the microemulsion or otherwise react with them. Considering that both the PS1 and PS2 samples
showed this behavior would indicate that the behavior is not inherent to one surfactant mixture or the
other.
Figure 20: a) Samples of PS1 and a 5 wt% copolymer solution during mixing. b) Samples of PS2 containing and a 5 wt% copolymer solution during mixing. The addition of the copolymer, in both samples, creates the formation of aggregates in the
water phase containing the copolymer.
Figure 21: a) Final PS1 samples containing in total 0.5 wt % copolymer, after slight shaking, surfactant concentration varying from 5 to 17 wt% from left to right. b) Final PS2 samples containing in total 0.5 wt% copolymer, after slight shaking and
heating to 45 °C, surfactant concentration varying from 8 to 20 wt% from left to right.
28
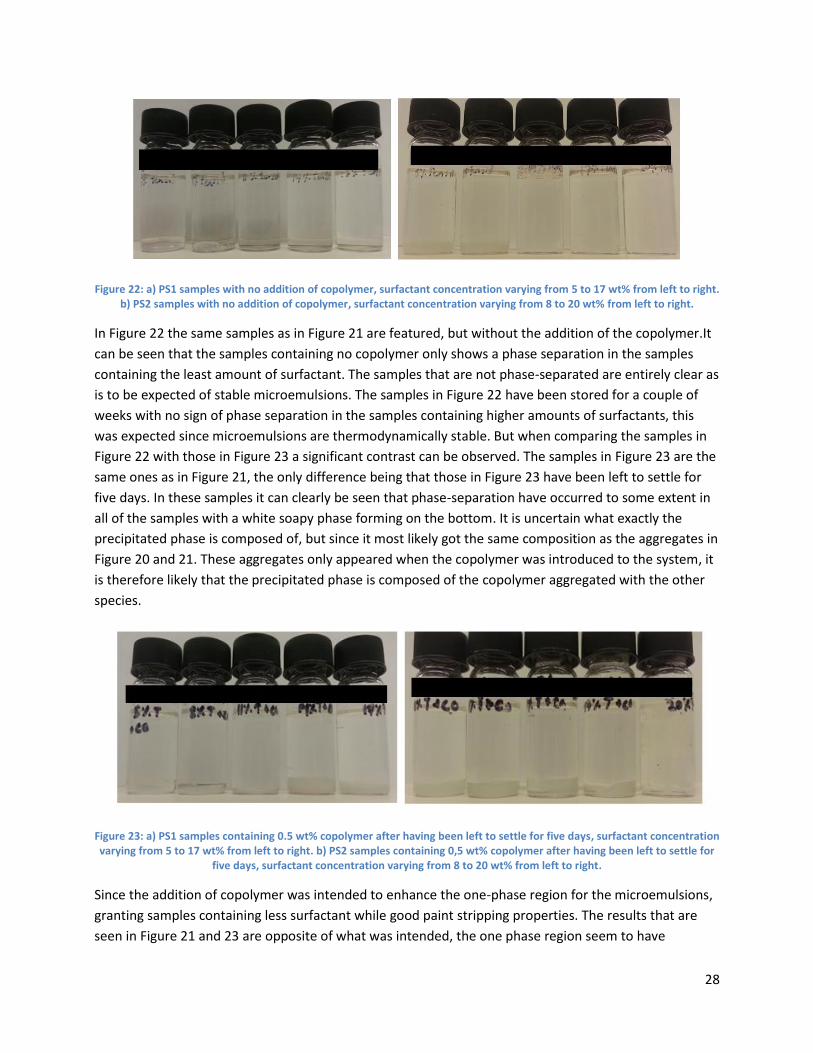
Figure 22: a) PS1 samples with no addition of copolymer, surfactant concentration varying from 5 to 17 wt% from left to right. b) PS2 samples with no addition of copolymer, surfactant concentration varying from 8 to 20 wt% from left to right.
In Figure 22 the same samples as in Figure 21 are featured, but without the addition of the copolymer.It
can be seen that the samples containing no copolymer only shows a phase separation in the samples
containing the least amount of surfactant. The samples that are not phase-separated are entirely clear as
is to be expected of stable microemulsions. The samples in Figure 22 have been stored for a couple of
weeks with no sign of phase separation in the samples containing higher amounts of surfactants, this
was expected since microemulsions are thermodynamically stable. But when comparing the samples in
Figure 22 with those in Figure 23 a significant contrast can be observed. The samples in Figure 23 are the
same ones as in Figure 21, the only difference being that those in Figure 23 have been left to settle for
five days. In these samples it can clearly be seen that phase-separation have occurred to some extent in
all of the samples with a white soapy phase forming on the bottom. It is uncertain what exactly the
precipitated phase is composed of, but since it most likely got the same composition as the aggregates in
Figure 20 and 21. These aggregates only appeared when the copolymer was introduced to the system, it
is therefore likely that the precipitated phase is composed of the copolymer aggregated with the other
species.
Figure 23: a) PS1 samples containing 0.5 wt% copolymer after having been left to settle for five days, surfactant concentration varying from 5 to 17 wt% from left to right. b) PS2 samples containing 0,5 wt% copolymer after having been left to settle for
five days, surfactant concentration varying from 8 to 20 wt% from left to right.
Since the addition of copolymer was intended to enhance the one-phase region for the microemulsions,
granting samples containing less surfactant while good paint stripping properties. The results that are
seen in Figure 21 and 23 are opposite of what was intended, the one phase region seem to have
29
diminished with added copolymer. Another observation was that after shaking the samples the white
precipitate seemed to dissolve to a certain extent and the samples once again looked like those in Figure
21. The look of the samples after shaking was cloudy and white but a tendency of an ordered system was
hinted at, this is however very hard to be certain about.
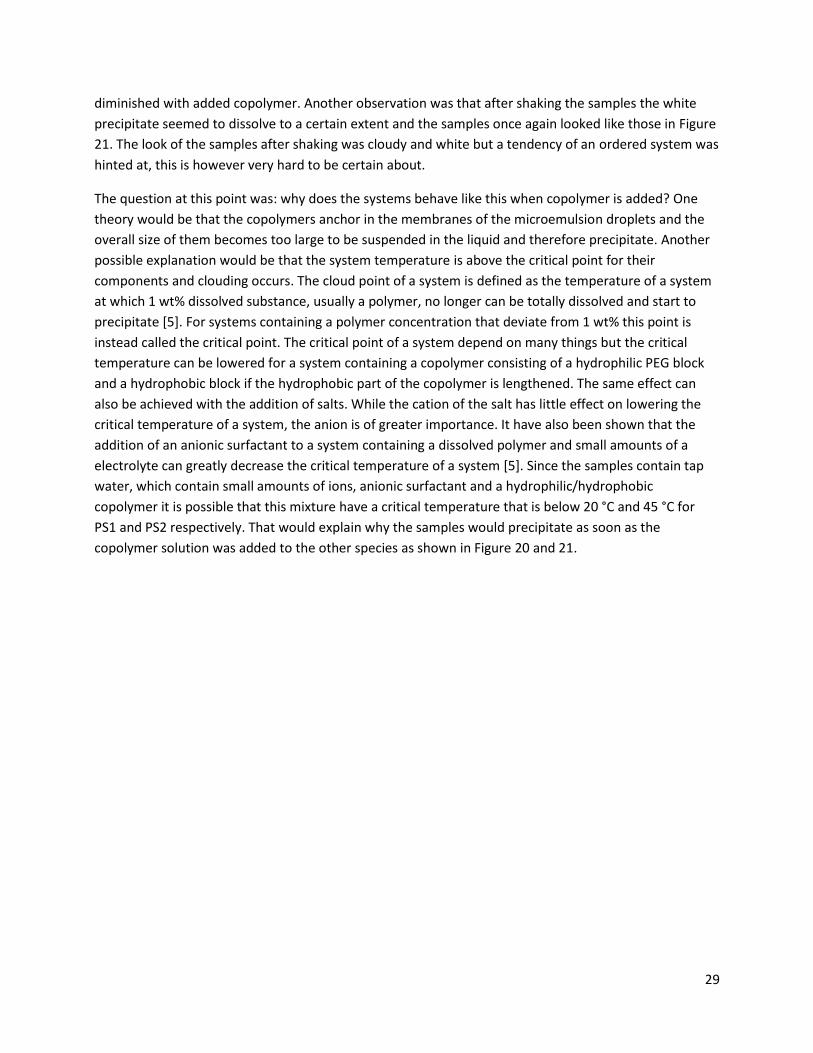
The question at this point was: why does the systems behave like this when copolymer is added? One
theory would be that the copolymers anchor in the membranes of the microemulsion droplets and the
overall size of them becomes too large to be suspended in the liquid and therefore precipitate. Another
possible explanation would be that the system temperature is above the critical point for their
components and clouding occurs. The cloud point of a system is defined as the temperature of a system
at which 1 wt% dissolved substance, usually a polymer, no longer can be totally dissolved and start to
precipitate [5]. For systems containing a polymer concentration that deviate from 1 wt% this point is
instead called the critical point. The critical point of a system depend on many things but the critical
temperature can be lowered for a system containing a copolymer consisting of a hydrophilic PEG block
and a hydrophobic block if the hydrophobic part of the copolymer is lengthened. The same effect can
also be achieved with the addition of salts. While the cation of the salt has little effect on lowering the
critical temperature of a system, the anion is of greater importance. It have also been shown that the
addition of an anionic surfactant to a system containing a dissolved polymer and small amounts of a
electrolyte can greatly decrease the critical temperature of a system [5]. Since the samples contain tap
water, which contain small amounts of ions, anionic surfactant and a hydrophilic/hydrophobic
copolymer it is possible that this mixture have a critical temperature that is below 20 °C and 45 °C for
PS1 and PS2 respectively. That would explain why the samples would precipitate as soon as the
copolymer solution was added to the other species as shown in Figure 20 and 21.
30
5 Conclusions Microemulsions could be formed for the PS1 system and the PS2 system, respectively, with significant
variety in their composition. The fastest stripping effect for both PS1 and PS2 could be observed for the
samples closest to the two-phase region in the phase diagram. The stripping efficiency for both systems
increased with increasing amount of oil, and decreased with increasing amount of surfactant. The
stripping effect was also greater for microemulsions than for pure oil which indicates that with further
addition of oil in the systems a maximum stripping effect is expected before lowering again with even
further addition of oil. Furthermore, the results show that the surfactant has a major role in the stripping
besides the oil.
The viscosity of the samples seems to depend only on the composition of the samples and no correlation
between viscosity and stripping effect could be established. The conductivity of the samples shows the
lowest values for both systems for the samples close to the two-phase region. While this match the
highest stripping effect of the samples the trends in stripping and conductivity are different when
changing the composition of the systems. Because of this it is hard to say if there exists a correlation
between stripping effect and conductivity. Further studies would be needed to determine one way or
the other.
With the addition of small amounts of copolymer to PS1 and PS2 a precipitation occurs in the samples
and a white soap like phase forms at the bottom of the samples after some time. It is speculated that
this behavior is caused by one of two phenomena:
The added copolymer attaches to the microemulsion droplets, because of the size of the
polymers the droplets become too large to be have colloidal stability and therefore precipitate.
The components in the samples act to lower the cloud temperature of the added copolymer
making it less soluble than in a pure water system making it precipitate.
While both effects are plausible further investigations are needed in order to determine which one if any
of them is responsible for the observed phenomena.
31
6 Future work In order to determine if there exists a correlation between conductivity and the stripping effect tests on
more systems are need to be carried out. Reformulated microemulsions containing ionic and nonionic
surfactants, respectively, would need to be examined in order to determine if the conductivity is
behaving in a similar way independently of the contents of ions. These results would then have to be
compared with paint stripping results made with a larger sample matrix.
In order to get more accurate trends more than five samples would be needed to be tested in the paint
stripping tests, to determine as exact values for the mean time of paint stripping as possible. This would
both lead to a greater understanding of the systems and the possibility of an exact correlation between
stripping effect and composition of a system.
Further investigation of the use of copolymers as additives would be of great interest. Tests with
copolymers with different chain length and other hydrophilic/ hydrophobic groups should be tested to
determine if the precipitation was due to the composition of the copolymer.
Studies of the addition of copolymers to microemulsions based on nonionic surfactants instead of ionic
ones would also be of great interest as the clouding of the sample may be caused by the presence of
salts and ionic surfactants.

32
7 Acknowledgements First of all I would like to thank my supervisor/ examiner Assistant Professor Lars Nordstierna and my
supervisor Ulf Billton for their help and input on this thesis work and for giving me new and interesting
perspectives on the work.
I would also like to thank Mattias Ardalen for all his help with the laboratory work and for answering all
of the many questions I had about the microemulsion systems. A special thanks also goes to Dr. Romain
Bordes for his invaluable help with interpreting and discussing the results. I would also like to thank Dr
Anna Ström for her help with the viscosity measurements.
All the people at EnviroStripp Chemicals AB for a great time and an enjoyable working environment.
Lastly I would like to thank my friends and family for always being there for me and supporting me.
33
8 References [1] Paint: Encyclopædia Britannica Online; [cited 2014 15/3]. Available from: http://www.britannica.com/EBchecked/topic/438505/paint. [2] History of Paint: Shearer Painting; 2011 [cited 2014 30/5]. Available from: http://www.shearerpainting.com/blog/resources/history-of-paint/. [3] World's Top ten Paints Companies 2013 Annual Report: World Paint & Coatings Industry Association (WPCIA); 2014 [cited 2014 10/4]. Available from: http://www.wpcia.org/news/World%27s%20Top%20ten%20Paints%20Companies%202013%20Annual%20Report.html. [4] Handbook of Applied Surface and Colloid Chemistry. Holmberg K, editor: John Wiley & Sons, LTD; 2002. [5] Holmberg K, Jönsson B, Kronberg B, Lindman B. Surfactants and Polymers in Aqueous Solutions. 2 ed: John Wiley & Sons, LTD; 2003. [6] Holmberg K. Yt- och kolloidkemi 2007. [7] Patel M. Microemulsions : As Novel Drug Delivery Vehicle: [cited 2014 18/2]. Available from: http://www.pharmainfo.net/reviews/microemulsions-novel-drug-delivery-vehicle. [8] Jakobs B, Sottmann T, Strey R, Allgaier J, Richter D. Amphiphilic Block Copolymers as Efficiency Boosters for Microemulsions. Langmuir. 1999;15(20):6707-11. [9] Mihailescu M, Monkenbusch M, Endo H, Allgaier J, Gompper G, Stellbrink J, et al. Dynamics of bicontinuous microemulsion phases with and without amphiphilic block-copolymers. The Journal of Chemical Physics. 2001;115(20):9563-77. [10] Masui T, Imai M, Nakaya K, Taniguchi T. Effects of grafted polymer chains on lamellar membranes. The Journal of Chemical Physics. 2006;124(7):-. [11] Holderer O, Frielinghaus H, Byelov D, Monkenbusch M, Allgaier J, Richter D. Dynamic properties of microemulsions modified with homopolymers and diblock copolymers: The determination of bending moduli and renormalization effects. The Journal of Chemical Physics. 2005;122(9):-. [12] Eicke HF, Borkovec M, Das-Gupta B. Conductivity of water-in-oil microemulsions: a quantitative charge fluctuation model. The Journal of Physical Chemistry. 1989;93(1):314-7. [13] Mackay RA, Dixit NS, Hermansky C, Kertes AS. Conductivity and diffusion measurements in micellar and o/w microemulsion systems. A comparative study. Colloids and Surfaces. 1986;21(0):27-39. [14] Mukhopadhyay L, Bhattacharya PK, Moulik SP. Additive effects on the percolation of water/AOT/decane microemulsion with reference to the mechanism of conduction. Colloids and Surfaces. 1990;50(0):295-308. [15] Industriell lackering, metall NIFAB, Nordiska Ingenjörsbyrån för Färg AB. [16] Europaparlamentets och rådets direktiv 2004/42/EG: Europeiska unionens officiella tidning; 2004 [cited 2014 10/5].
Available from: http://eur-lex.europa.eu/legal-content/SV/TXT/PDF/?uri=CELEX:32004L0042&from=EN. [17] What is Powder Coating: Powder Coating Institute (PCI); [cited 2014 10/4]. Available from: http://www.powdercoating.org/11/Our-Industry/What-is-Powder-Coating. [18] Strong AB. Plastics Materials and Processing. 3 ed: Pearson Prentice Hall; 2006. [19] Paint Removal Options: Illinois Department of Natural Resources; 1998 [cited 2014 5/4]. Available from: http://wmrc.illinois.edu/info/library_docs/TN/98-046.pdf. [20] Guide to Cleaner Technologies Organic Coating Removal: United States Enviromental Protection Agency; 1994 [cited 2014 4/4]. Available from: http://nepis.epa.gov/Adobe/PDF/30004N7Y.pdf. [21] Decisions adopted jointly by the european parliament and the council: Decision no 455/2009/ec of the european parliament and of the council of 6 May 2009: Official Journal of the European Union; [cited 2014 10/5]. Available from: http://eur-lex.europa.eu/LexUriServ/LexUriServ.do?uri=OJ:L:2009:137:0003:0006:EN:PDF.
34
[22] Restrictions under consideration: European Chemicals Agency; [cited 2014 10/5]. Available from: http://echa.europa.eu/restrictions-under-consideration. [23] Opinion on N-Methyl-2-pyrrolidone(NMP) Scientific Committee on Consumer Safety (SCCS); 2011 [cited 2014 10/5]. Available from: http://ec.europa.eu/health/scientific_committees/consumer_safety/docs/sccs_o_050.pdf. [24] Ämnen på kandidatförteckningen –exempel på användningsområden med mera: Kemikalieinspektionen; 2013 [cited 2014
10/5]. Available from: http://www.kemi.se/Documents/Forfattningar/Reach/Amnen_pa_kandidatforteckningen_konsoliderad.pdf. [25] Ream S. Advances in laser paint stripping: Industrial Laser Solutions; 2010 [cited 2014 4/4]. Available from: http://www.industrial-lasers.com/articles/print/volume-250/issue-4/features/advances-in-laser.html. [26] Electrolytic conductivity or (formerly) specific conductance: Oxford Reference; 2006 [cited 2014 7/5]. Available from: http://www.oxfordreference.com.proxy.lib.chalmers.se/view/10.1093/acref/9780198529170.001.0001/acref-9780198529170-e-5944. [27] Water Conductivity: Lenntech; [cited 2014 7/5]. Available from: http://www.lenntech.com/applications/ultrapure/conductivity/water-conductivity.htm. [28] Down R, Lehr J. Environmental Instrumentation and Analysis Handbook: John Wiley & Sons, LTD; 2005. Available from: http://books.google.se/books?id=6jhELyGJOm0C&pg=PA491&redir_esc=y#v=onepage&q&f=false. [29] Conductivity Theory and Practice: Radiometer analytical; 2010 [cited 2014 9/5]. Available from: http://www.analytical-chemistry.uoc.gr/files/items/6/618/agwgimometria_2.pdf. [30] Welty J, Wicks C, Wilson R, Rorrer G. Fundamentals of Momentum, Heat, and Mass Transfer. 5 ed: John Wiley & Sons, inc.; 2008. [31] McKennell R. Cone-Plate Viscometer. Analytical Chemistry. 1956;28(11):1710-4. [32] Physica MCR The Modular Rheometer Series: Analitica Weisser; [cited 2014 24/5]. Available from: http://www.analitica.cl/PDF/CATALOGOS/Catalogos%20AP/MCR.pdf.
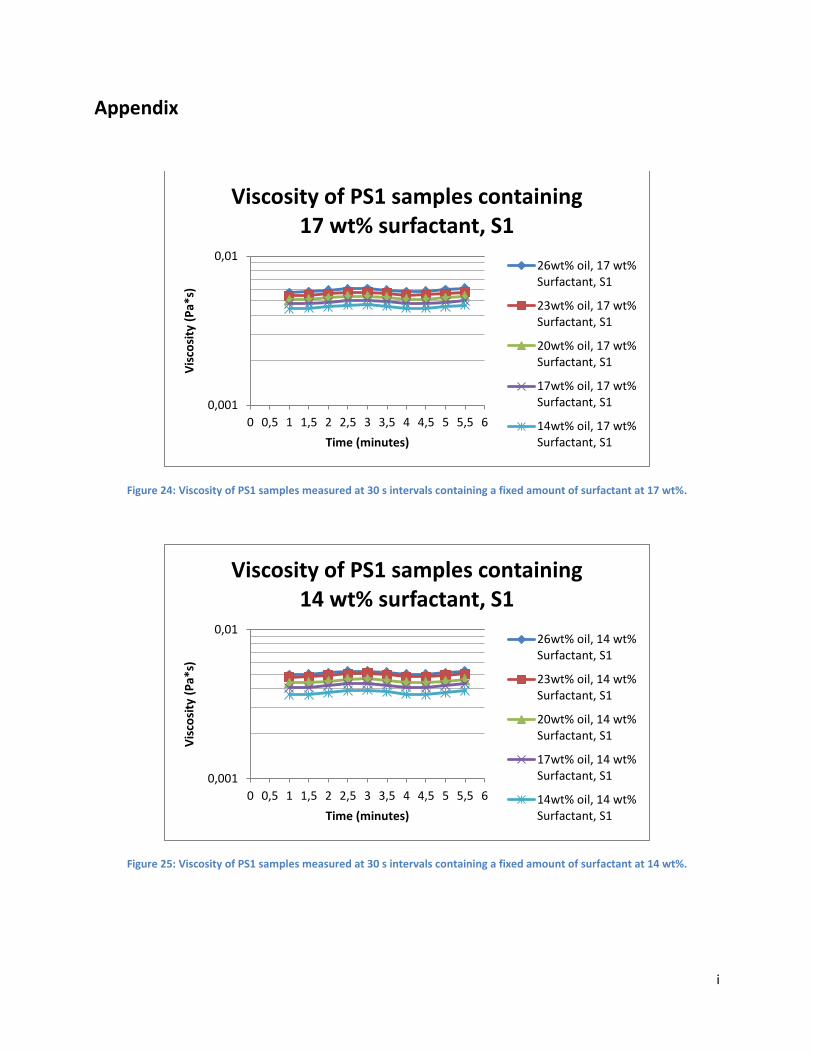
i
Appendix
Figure 24: Viscosity of PS1 samples measured at 30 s intervals containing a fixed amount of surfactant at 17 wt%.
Figure 25: Viscosity of PS1 samples measured at 30 s intervals containing a fixed amount of surfactant at 14 wt%.
0,001
0,01
0 0,5 1 1,5 2 2,5 3 3,5 4 4,5 5 5,5 6
Vis
cosi
ty (
Pa*
s)
Time (minutes)
Viscosity of PS1 samples containing 17 wt% surfactant, S1
26wt% oil, 17 wt%Surfactant, S1
23wt% oil, 17 wt%Surfactant, S1
20wt% oil, 17 wt%Surfactant, S1
17wt% oil, 17 wt%Surfactant, S1
14wt% oil, 17 wt%Surfactant, S1
0,001
0,01
0 0,5 1 1,5 2 2,5 3 3,5 4 4,5 5 5,5 6
Vis
cosi
ty (
Pa*
s)
Time (minutes)
Viscosity of PS1 samples containing 14 wt% surfactant, S1
26wt% oil, 14 wt%Surfactant, S1
23wt% oil, 14 wt%Surfactant, S1
20wt% oil, 14 wt%Surfactant, S1
17wt% oil, 14 wt%Surfactant, S1
14wt% oil, 14 wt%Surfactant, S1
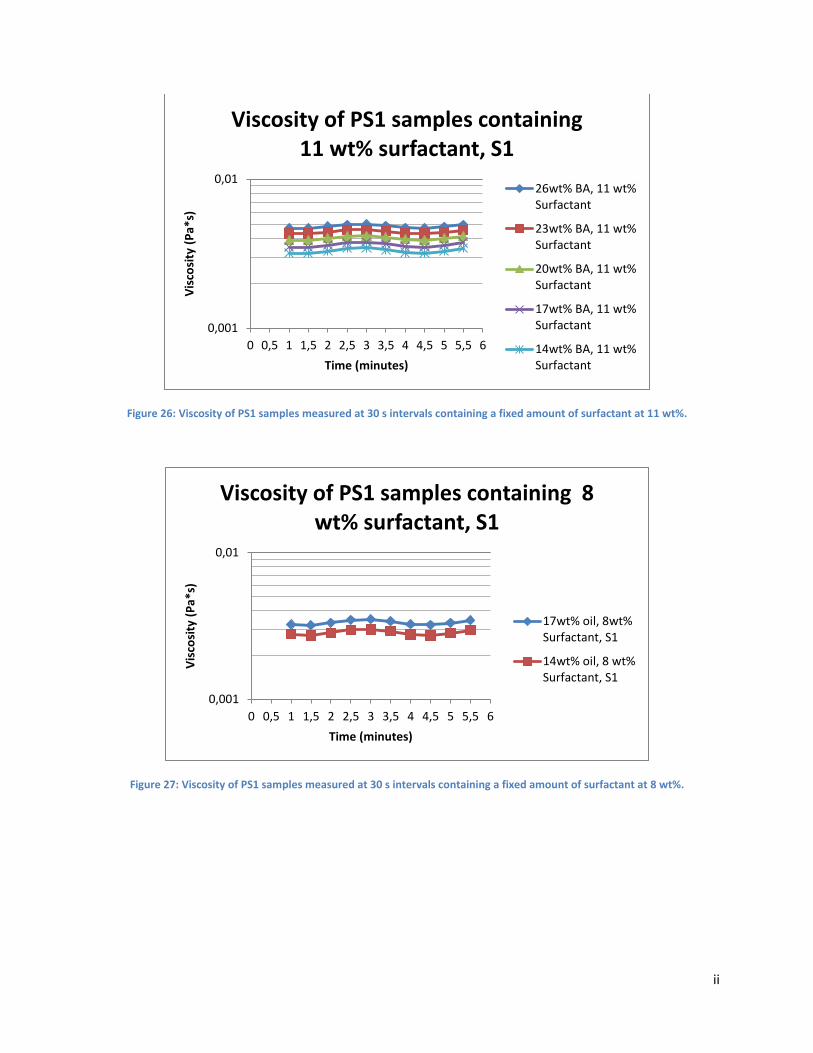
ii
Figure 26: Viscosity of PS1 samples measured at 30 s intervals containing a fixed amount of surfactant at 11 wt%.
Figure 27: Viscosity of PS1 samples measured at 30 s intervals containing a fixed amount of surfactant at 8 wt%.
0,001
0,01
0 0,5 1 1,5 2 2,5 3 3,5 4 4,5 5 5,5 6
Vis
cosi
ty (
Pa*
s)
Time (minutes)
Viscosity of PS1 samples containing 11 wt% surfactant, S1
26wt% BA, 11 wt%Surfactant
23wt% BA, 11 wt%Surfactant
20wt% BA, 11 wt%Surfactant
17wt% BA, 11 wt%Surfactant
14wt% BA, 11 wt%Surfactant
0,001
0,01
0 0,5 1 1,5 2 2,5 3 3,5 4 4,5 5 5,5 6
Vis
cosi
ty (
Pa*
s)
Time (minutes)
Viscosity of PS1 samples containing 8 wt% surfactant, S1
17wt% oil, 8wt%Surfactant, S1
14wt% oil, 8 wt%Surfactant, S1
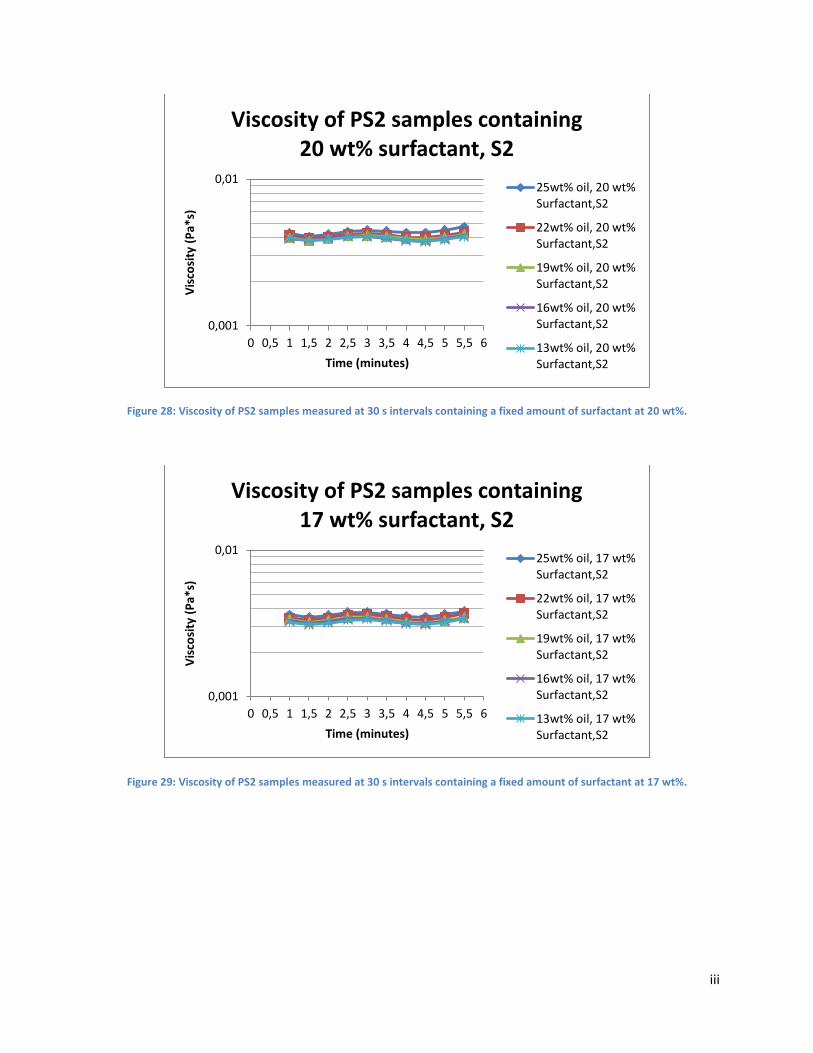
iii
Figure 28: Viscosity of PS2 samples measured at 30 s intervals containing a fixed amount of surfactant at 20 wt%.
Figure 29: Viscosity of PS2 samples measured at 30 s intervals containing a fixed amount of surfactant at 17 wt%.
0,001
0,01
0 0,5 1 1,5 2 2,5 3 3,5 4 4,5 5 5,5 6
Vis
cosi
ty (
Pa*
s)
Time (minutes)
Viscosity of PS2 samples containing 20 wt% surfactant, S2
25wt% oil, 20 wt%Surfactant,S2
22wt% oil, 20 wt%Surfactant,S2
19wt% oil, 20 wt%Surfactant,S2
16wt% oil, 20 wt%Surfactant,S2
13wt% oil, 20 wt%Surfactant,S2
0,001
0,01
0 0,5 1 1,5 2 2,5 3 3,5 4 4,5 5 5,5 6
Vis
cosi
ty (
Pa*
s)
Time (minutes)
Viscosity of PS2 samples containing 17 wt% surfactant, S2
25wt% oil, 17 wt%Surfactant,S2
22wt% oil, 17 wt%Surfactant,S2
19wt% oil, 17 wt%Surfactant,S2
16wt% oil, 17 wt%Surfactant,S2
13wt% oil, 17 wt%Surfactant,S2
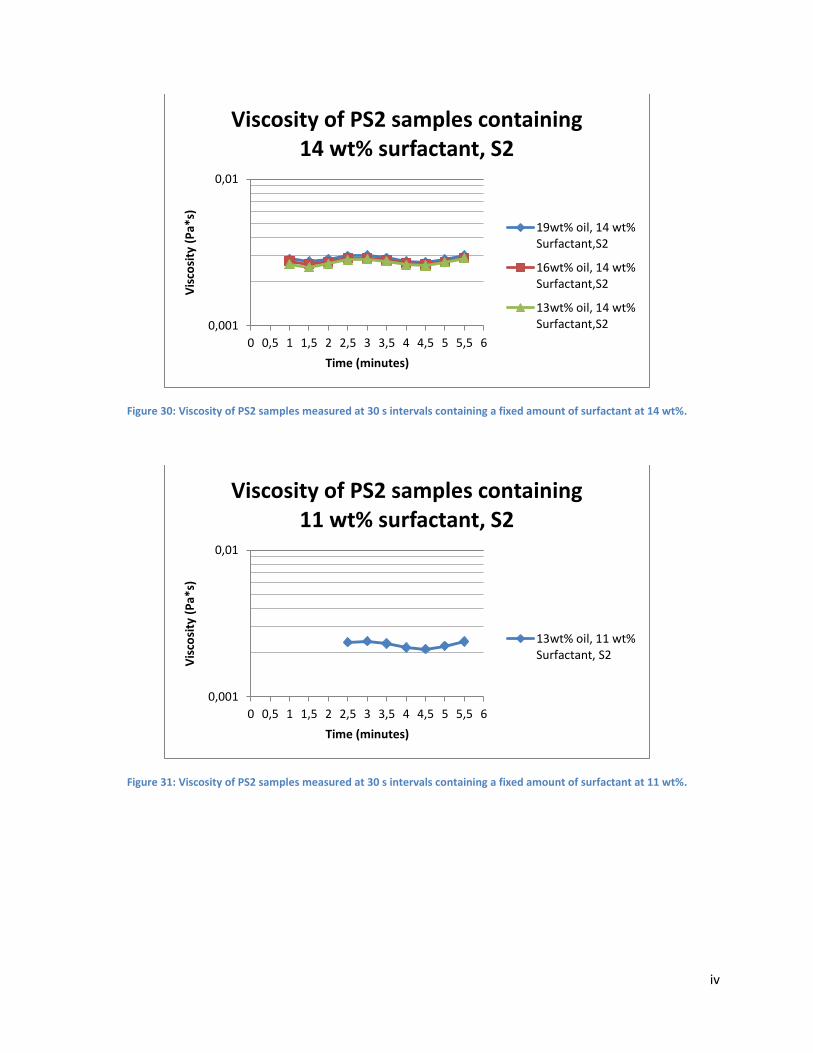
iv
Figure 30: Viscosity of PS2 samples measured at 30 s intervals containing a fixed amount of surfactant at 14 wt%.
Figure 31: Viscosity of PS2 samples measured at 30 s intervals containing a fixed amount of surfactant at 11 wt%.
0,001
0,01
0 0,5 1 1,5 2 2,5 3 3,5 4 4,5 5 5,5 6
Vis
cosi
ty (
Pa*
s)
Time (minutes)
Viscosity of PS2 samples containing 14 wt% surfactant, S2
19wt% oil, 14 wt%Surfactant,S2
16wt% oil, 14 wt%Surfactant,S2
13wt% oil, 14 wt%Surfactant,S2
0,001
0,01
0 0,5 1 1,5 2 2,5 3 3,5 4 4,5 5 5,5 6
Vis
cosi
ty (
Pa*
s)
Time (minutes)
Viscosity of PS2 samples containing 11 wt% surfactant, S2
13wt% oil, 11 wt%Surfactant, S2
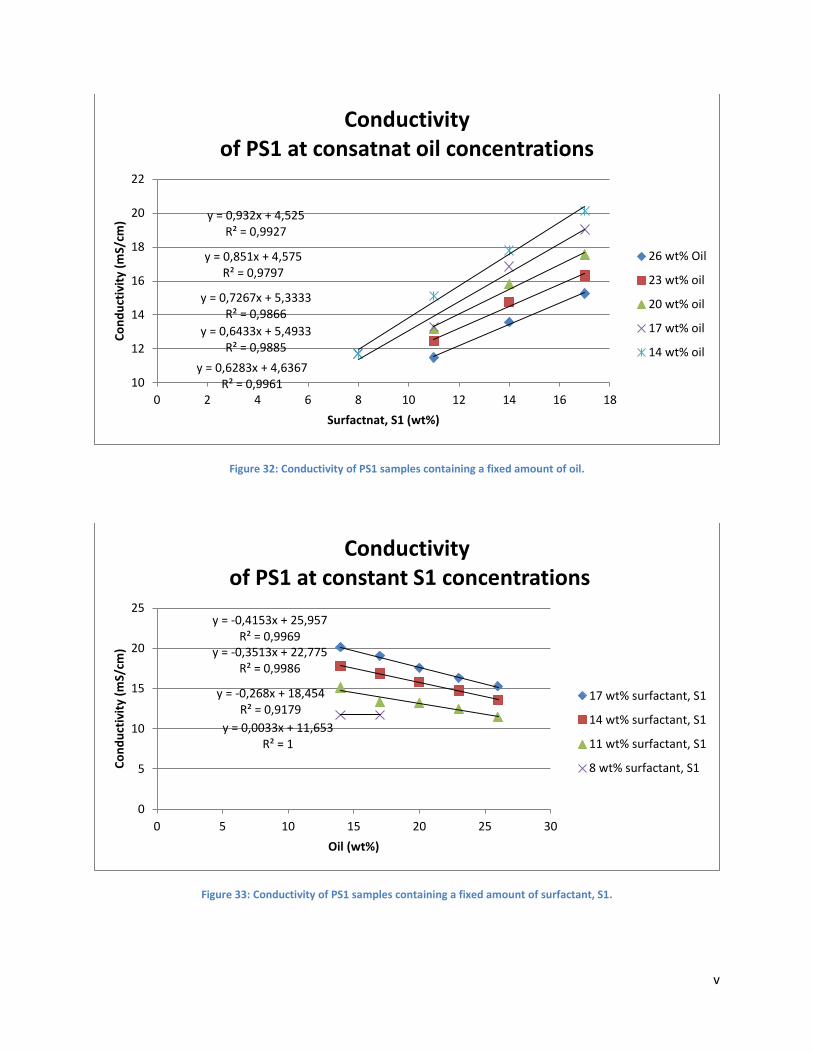
v
Figure 32: Conductivity of PS1 samples containing a fixed amount of oil.
Figure 33: Conductivity of PS1 samples containing a fixed amount of surfactant, S1.
y = 0,6283x + 4,6367 R² = 0,9961
y = 0,6433x + 5,4933 R² = 0,9885
y = 0,7267x + 5,3333 R² = 0,9866
y = 0,851x + 4,575 R² = 0,9797
y = 0,932x + 4,525 R² = 0,9927
10
12
14
16
18
20
22
0 2 4 6 8 10 12 14 16 18
Co
nd
uct
ivit
y (m
S/cm
)
Surfactnat, S1 (wt%)
Conductivity of PS1 at consatnat oil concentrations
26 wt% Oil
23 wt% oil
20 wt% oil
17 wt% oil
14 wt% oil
y = -0,4153x + 25,957 R² = 0,9969
y = -0,3513x + 22,775 R² = 0,9986
y = -0,268x + 18,454 R² = 0,9179
y = 0,0033x + 11,653 R² = 1
0
5
10
15
20
25
0 5 10 15 20 25 30
Co
nd
uct
ivit
y (m
S/cm
)
Oil (wt%)
Conductivity of PS1 at constant S1 concentrations
17 wt% surfactant, S1
14 wt% surfactant, S1
11 wt% surfactant, S1
8 wt% surfactant, S1
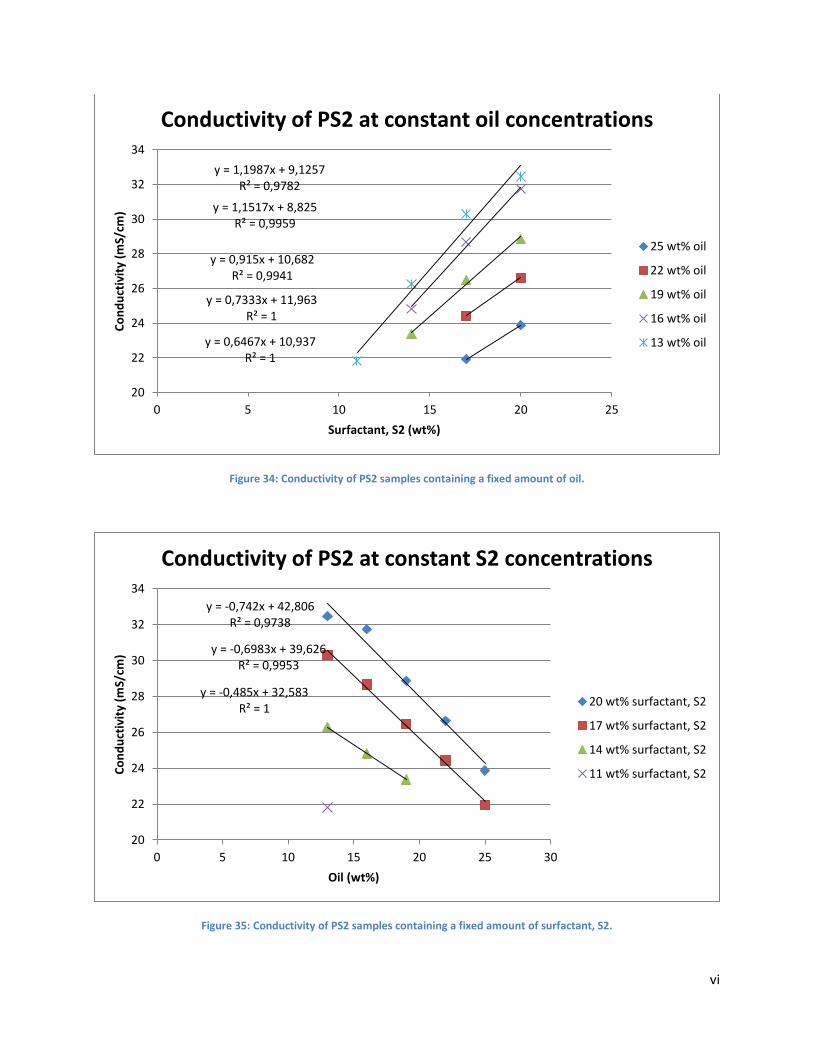
vi
Figure 34: Conductivity of PS2 samples containing a fixed amount of oil.
Figure 35: Conductivity of PS2 samples containing a fixed amount of surfactant, S2.
y = 0,6467x + 10,937 R² = 1
y = 0,7333x + 11,963 R² = 1
y = 0,915x + 10,682 R² = 0,9941
y = 1,1517x + 8,825 R² = 0,9959
y = 1,1987x + 9,1257 R² = 0,9782
20
22
24
26
28
30
32
34
0 5 10 15 20 25
Co
nd
uct
ivit
y (m
S/cm
)
Surfactant, S2 (wt%)
Conductivity of PS2 at constant oil concentrations
25 wt% oil
22 wt% oil
19 wt% oil
16 wt% oil
13 wt% oil
y = -0,742x + 42,806 R² = 0,9738
y = -0,6983x + 39,626 R² = 0,9953
y = -0,485x + 32,583 R² = 1
20
22
24
26
28
30
32
34
0 5 10 15 20 25 30
Co
nd
uct
ivit
y (m
S/cm
)
Oil (wt%)
Conductivity of PS2 at constant S2 concentrations
20 wt% surfactant, S2
17 wt% surfactant, S2
14 wt% surfactant, S2
11 wt% surfactant, S2
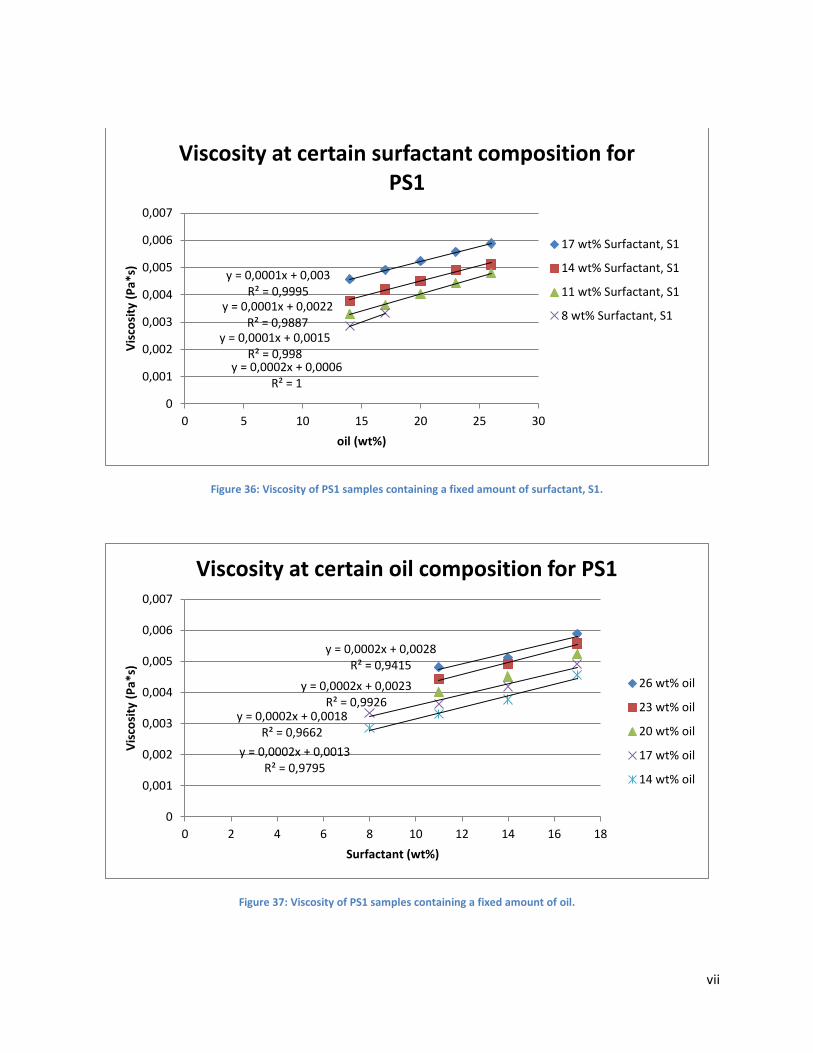
vii
Figure 36: Viscosity of PS1 samples containing a fixed amount of surfactant, S1.
Figure 37: Viscosity of PS1 samples containing a fixed amount of oil.
y = 0,0001x + 0,003 R² = 0,9995
y = 0,0001x + 0,0022 R² = 0,9887
y = 0,0001x + 0,0015 R² = 0,998
y = 0,0002x + 0,0006 R² = 1
0
0,001
0,002
0,003
0,004
0,005
0,006
0,007
0 5 10 15 20 25 30
Vis
cosi
ty (
Pa*
s)
oil (wt%)
Viscosity at certain surfactant composition for PS1
17 wt% Surfactant, S1
14 wt% Surfactant, S1
11 wt% Surfactant, S1
8 wt% Surfactant, S1
y = 0,0002x + 0,0028 R² = 0,9415
y = 0,0002x + 0,0023 R² = 0,9926
y = 0,0002x + 0,0018 R² = 0,9662
y = 0,0002x + 0,0013 R² = 0,9795
0
0,001
0,002
0,003
0,004
0,005
0,006
0,007
0 2 4 6 8 10 12 14 16 18
Vis
cosi
ty (
Pa*
s)
Surfactant (wt%)
Viscosity at certain oil composition for PS1
26 wt% oil
23 wt% oil
20 wt% oil
17 wt% oil
14 wt% oil
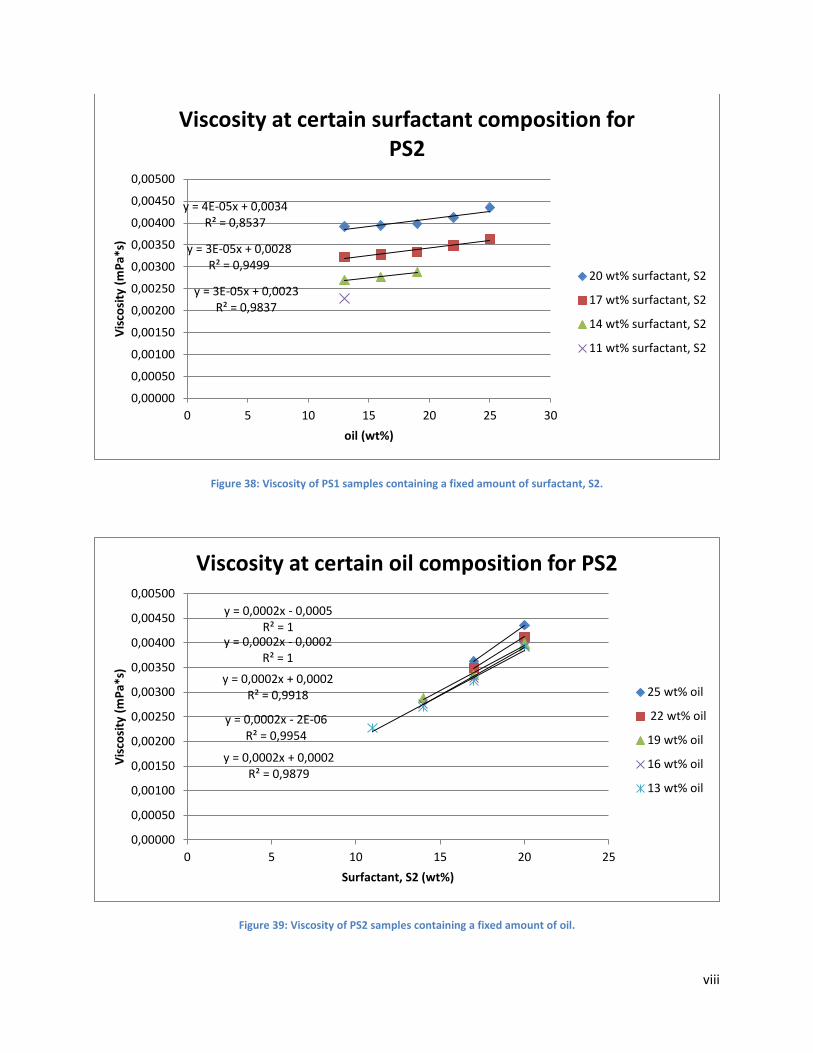
viii
Figure 38: Viscosity of PS1 samples containing a fixed amount of surfactant, S2.
Figure 39: Viscosity of PS2 samples containing a fixed amount of oil.
y = 4E-05x + 0,0034 R² = 0,8537
y = 3E-05x + 0,0028 R² = 0,9499
y = 3E-05x + 0,0023 R² = 0,9837
0,00000
0,00050
0,00100
0,00150
0,00200
0,00250
0,00300
0,00350
0,00400
0,00450
0,00500
0 5 10 15 20 25 30
Vis
cosi
ty (
mP
a*s)
oil (wt%)
Viscosity at certain surfactant composition for PS2
20 wt% surfactant, S2
17 wt% surfactant, S2
14 wt% surfactant, S2
11 wt% surfactant, S2
y = 0,0002x - 0,0005 R² = 1
y = 0,0002x - 0,0002 R² = 1
y = 0,0002x + 0,0002 R² = 0,9918
y = 0,0002x - 2E-06 R² = 0,9954
y = 0,0002x + 0,0002 R² = 0,9879
0,00000
0,00050
0,00100
0,00150
0,00200
0,00250
0,00300
0,00350
0,00400
0,00450
0,00500
0 5 10 15 20 25
Vis
cosi
ty (
mP
a*s)
Surfactant, S2 (wt%)
Viscosity at certain oil composition for PS2
25 wt% oil
22 wt% oil
19 wt% oil
16 wt% oil
13 wt% oil