Embed Size (px)
Citation preview

JOURNAL OF GEOPHYSICAL RESEARCH VOL. 73, No. 6, MARCH 15, 1968
Magnetic Anomalies in the Pacific and Sea Floor Spreading
¾i•. C. PITMAN, III, E. M. HERRON, AND J. R. HEIRTZLER 2
Lamont Geological Observatory, Columbia University Palisades, New York 10964
The symmetric linear magnetic pattern found over the crest of the Pacific-Antarctic and Juan de Fuca ridges can now be traced across the flanks and into the basins in the North and the South Pacific Ocean. The bilateral symmetry is best shown in the South Pacific, where the western half of the pattern can be traced to the edge of the New Zealand plateau. The eastern half extends to at least 90øW at 62øS. Although sections of the pattern south of the ridge axis have not yet been mapped because of the difficulties of data collection in antarctic waters, sufficient marine data are available to compile a magnetic map of these linear anomalies in the South Pacific from 35 ø to 65øS and from 90øW to 175øE. In the North Pacific, the eastern half of the symmetric pattern is generally masked by the North American continent. The complete axial pattern can be observed only in the area north of the Mendocino fracture zone. The western half of the pattern is, however, identical to that observed in the South Pacific to the west of the ridge axis. The North Pacific pattern extends from 51 ø to 250N and from the edge of the continental rise as far west as 165øW at 51øN. Previous work has shown that the axial magnetic anomaly pattern correlates with the known history of reversals of the earth's magnetic field. It is now possible to correlate between contemporaneous regions in the North and South Pacific anc• to assign relative ages to over one-half the Pacific basin.
INTRODUCTION
Dietz [1961, 1962] and Hess [1962, 1965] have postulated that the ocean basins have formed by ocean floor spreading. The crest of the mid-oceanic ridge is regarded as an area of convective upwelling where new material is constantly being injected.
Vine and Matthews [1963] suggested a method for testing this hypothesis. They hy- pothesized that as the ocean floor is forced apart at the ridge axis, the new basaltic ma- terial that wells up into the void acquires a thermoremanent magnetization in the direction of the ambient magnetic field while cooling through the Curie point. As the earth's field reverses polarity, alternate stripes of positively and negatively magnetized material are pro- duced. This in turn leads to alternate bands of
positive and negative magnetic anomalies, and, if the rate of spreading is constant on both sides of the ridge axis, this pattern should be symmetrical about the axis.
x Lamont Geological Observatory Contribution 1152.
enow at Hudson Laboratories of Columbia
University, Dobbs Ferry, New York 10522.
Paleomagnetic studies of subaerial lavas have shown that reversals of the earth's magnetic field do occur. By using radiometric dating in conjunction with the paleomagnetic data, the history of the earth's magnetic polarity for the past 3.35 m.y. has been outlined [Cox 1965; Doell and Dalrymple, 1966].
Pitman and Heirtzler [1966] presented the magnetic anomaly pattern of the axial zone of the Pacific-Antarctic ridge. This pattern, symmetric about the ridge crest, was syn- thesized using crustal blocks of alternately normal and reverse polarity. When the pattern was correlated with the known magnetic reversal history, a spreading rate of 4.5 cm/yr was ob- tained. The magnetic pattern extended beyond the known 3.35-m.y. age, predicting the exist- ence of older reversals. Confirmation of these
older polarity events up, to 5.0 m.y.B.P. has been obtained through the study of magnetic reversals observed in deep-sea cores by Hays and Opdyke [1967].
This paper is the first in a series of four that will show that the same sequence of mag- netic anomalies symmetric about, and parallel to, the ridge crest is present in much of the Pacific, Atlantic, and Indian oceans. The recog-
2069

2070 PITMAN, HERRON, AND I-IEIRTZLER
nized pattern extends from the crest, across the successfully applied the same model to the flanks, and into the basins and in some cases Reykjanes ridge. abuts against the continental shelves. The spreading rate obtained for each ocean differs, but the same type of motion occurs in all three oceans. If ocean floor spreading is also a mechanism for continental drift, analysis of the magnetic pattern permits reconstruction of the positions and relative motions of the con- tinents.
In the last paper of the series, we will attempt to present a time scale for geomagnetic field reversals and will discuss some of the conse-
DATA
Data from over 50,000 miles of traverses of the Pacific-Antarctic ridge and the flanking basin areas have been used in this study. The South Pacific data were obtained by the U.S.N.S. Eltanin during cruises 17-23 (1965- 1966), the R.V. Verna during cruise 16 (1960), Scripps Institute of Oceanography during the Monsoon cruise (1960), and the U.S.N.S. Staten Island during operation Deep Freeze
quences of this time scale from the viewpoints (1960-1961). The North Pacific data were ob- of continental drift, ocean floor spreading, and palcomagnetism.
PREVIOUS WORK IN TI-IE PACIFIC
Menard [1900, 1964] described the section of the mid-oceanic ridge extending from south of New Zealand to the Gulf of California and from north of the Mendocino fracture zone to
the Explorer ridge as a large triangular bulge in the Pacific Ocean floor 2 to 3 km high and 2000 to 4000 km wide. Except on the Gorda ridge, there is no axial rift valley similar to that found on the mid-Atlantic ridge.
Mason [1958], Mason and Ra# [1961], Ra# and Mason [1961], and Ra# [1966] published results of magnetic. surveys off the west coast
rained by R.V. Conrad during cruise 10 and R.V. Verna during cruise 21 and from the published data of Ra# [1966] and Vine [1966].
A proton precession magnetometer was used in all cases. No attempt was made to correct for diurnal variations because of the larger amplitude and shorter wavelength of the crustal anomalies. The regional field was removed using a spherical harmonic expansion of the potential field and the coefficients of Daniels and Cain [Cain et al., 1964]. Also, each profile was adjusted to a new zero equal to the average value of the residual field.
CORRELATION OF MAGNETIC ANOMALIES
To correlate the South Pacific magnetic pat- of North America showing long north-south tern with the magnetic pattern found in the lineations of magnetic anomalies. These linea- North Pacific, a composite profile, considered tions were found to be offse• at the fracture to be typical, was constructed for the North zones that trend east-west through the region Pacific from the published data of Vacquier [Mason, 1958; Menard a•d Vacquier, 1958; et al. [1961], Ra• [1966], and Vine [1966]. Vacquieretal., 1961]. Vine andMathews [1963] The crest of the East Pacific rise continues and Vine [1966] suggested that this pattern of north of the Mendocino, fracture zone as the linearions might have been cause'd by sea floor Gorda ridge and the Juan de Fuca ridge. There- spreading. Linear anomalies have been found fore, to obtain the most complete continuous in the antarctic area of the Pacific Ocean by profile from the ridge axis as far down the Christo#el and Ross [1965]. flanks and into basins as possible, data from
Vine and Wilson [1965] and Vine [1966] immediately north of the Mendocino fracture related the symmetrical magnetic pattern ob- zone were used. Because the anomaly pattern served over the Juan de Fuca ridge south of becomes intensely distorted in the vicinity of Vancouver to the known magnetic polarity his- the axis of the Gorda ridge [Menard, 1960, p. tory and obtained a spreading rate of 2.9 cm/ 46, Figures 3 and 4], however, a profile from yr. Pitman and Heirtzler [1966] studied the the Juan de Fuca ridge [Vine, 1966] was sub- symmetrical linear pattern observed over the stituted for the axial part (anomaly 5 on the Pacific-Antarctic ridge between 40 ø and 55øS west to 5 on the east; see Figure 3, the topmost and obtained a spreading rate of 4.5 cm/yr. profile labeled N. PAC.). Using a spreading rate of 1.0 cm/yr, they also Bathymetric data were available for all tracks

MAGNETIC ANOMALIES IN TI-IE PACIFIC 2071
northeast of the SI-8 traverse. (See Figures 1 and 2.)
Navigation, with the exception of that on Conrad 10, Verna 21, and Eltanin cruises 20, 21, and 23, was solely by celestial and dead reckoning methods. On these more recent cruises more accurate satellite navigation was also used. On all cruises, the absolute position error was usually less than 5 nautical miles, but the maximum absolute position error could have been 60 nautical miles after long overcast con- ditions in high latitudes. The relative error in location of the magnetic and topographic pro- files is negligible, since both profiles were ob- tained simultaneously.
Since many of the traverses of the ridge and basin were made at angles other than 90 ø to the trend of the ridge axis, all profiles except those indicated have been projected along an azimuth normal to the axis of the ridge; i.e., the dis- tance shown on the profiles is the perpendicular distance to the axis.
Figure 3 shows all the projected magnetic anomaly profiles from the tracks that are marked in Figure I with the heavy line. The solid line down the center of Figure 3 with the number I at the top marks the ridge axis and the axial anomaly. In all cases where bathy- metric data were available, the axial anomaly (anomaly 1) coincides with the topographic axis of the ridge (see Figure 2, for example). At the top of Figure 3 the composite profile from the North Pacific is plotted with west to the left on the left side of the figure and reversed on the right side of the figure with west to the right.
The six dotted lines in Figure I designated by the numerals I through ¾I show the location of fracture zones determined from offsets in
the magnetic pattern [see also Menard, 1960, and Sykes, 1963]. The profiles in Figure 3 have been grouped with respect to these frac- ture zones, which are indicated by horizontal dotted lines again numbered I through ¾I.
Figure 2 (bottom) shows unprojected bathy- metric and magnetic profiles typical of fracture zone crossings in the South Pacific. Figure 1 shows the location of these profiles. The mag- netic anomalies (in Figure 2 (bottom)) are seen to be repeated across the fractures. In such cases, where a part of the anomaly pattern has been repeated, the magnetic profiles have been interrupted and realigned (for example in
Figure 3, V-16C and V-16B to the southeast of the ridge axis and EL-23B and EL-23D to the northwest. of the ridge axis).
Some of the key anomalies have been num- bered for reference purposes. In Figure 3 the dashed lines show the correlation of these
anomalies. Profiles from Figure 3 will be pre- sented later at a larger scale to demonstrate the detailed linearity and symmetry of the pattern. The general pattern of symmetry and linearity among the South Pacific profiles and the corresponding relationship with the North Pacific profile can be seen in Figure 3, how- ever. Starting at the axis of the ridge and going outward toward the ends of the profiles, the amplitudes and wavelengths of the ano- malies display a generally symmetrical varia- tion. From anomaly 1 through anomaly 5 the amplitudes decrease gradually. Beyond anomaly 5 on both sides of the ridge axis is a region of low-amplitude shorter-wavelength anomalies. Still farther from the axis the amplitudes in- crease abruptly and the wavelengths increase gradually out to the ends of the profiles.
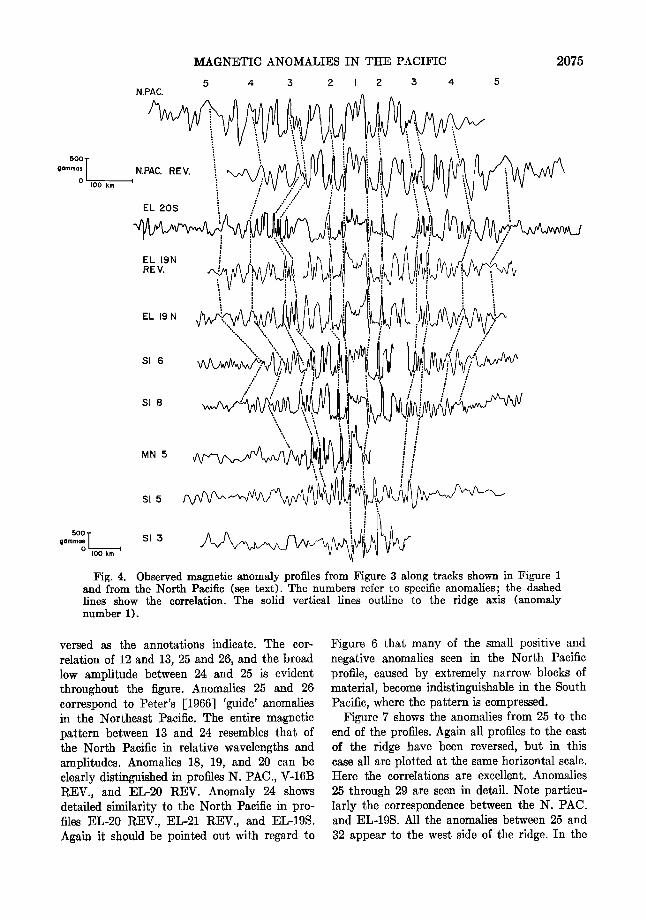
Figure 4 shows the axial zone from anomaly 5 on the west to anomaly 15 on the east. At the top is a profile from the Juan de Fuca ridge at approximately 48øN. The North Pacific pattern is disturbed on the east where the flank of the
ridge meets the North American continent. For this reason and for the purpose of demon- starting the symmetry, the profile has also been plotted in reverse (east to the left) (N. PAC. REV.). The remaining profiles are from the axial zone of the Pacific-Antarctic ridge. The linearity and bilateral symmetry of the axial anomaly pattern for the region from 40 ø to 55øS and from 100 ø to 125øW has been discussed by Pitman and Heirtzler [1966]. Two profiles from this area are shown here: EL-20S and EL-19N.
The EL-19N profile has also been plotted re- versed (east to the left).
The anomaly numbered 1 is apparent in all the profiles' it retains its rectangular shape in all profiles except in MN-5. Between anomalies 1 and 2 on both sides of the axis is a small
positive anomaly. The group of four positive anomalies bracketed by number 3 and the un- numbered dashed line is particularly notice- able; it is seen in its entirety on both sides of EL-20S, on the west side of N. PAC. EL-19N, SI-8, MN-5, and SI-5 and on the east side of

2072 PITMAN, I:IERRON, AND I-IEIRTZLER
..- ..-
.-
..
ß
...- ...'
o Q
c• 0
,..Q o
ø,.•

MAGNETIC ANOMALIES IN THE PACIFIC 2073
w
VI6A VI6B E
I
2
3
4
5
w
EL Z3D EL 23B
I000 t 31 30 2• 29 28 27 26 ?-5 gammas •j. o
IOOOKM
V 16B V 16C
25 26 27' 26 27 28 29 :30 3l
• 4
I
0 I00 200 300 400 500KM
Fig. 2. (Top) A typical bathymetric and cores pending magnetic anomaly profile from the Pacific-Antarctic ridge. Bathymetric and magnetic data have been plotted as a function of distance along the ship's track. Vertical exaggeration of bathymetry is 50:1. (Bottom) Typical bathymetric and magnetic anomaly profiles from crossings of fracture zones asso- ciated with the Pacific-Antarctic ridge. Bathymetric and magnetic data have been plotted as a function of distance along the ship's track. Numbers along the magnetic anomaly pro.file identify sections of track shown in Figure 1. Vertical exaggeration of bathymetry 100: 1.
SI-6. This same group appears as three positive anomalies on the east side of N. PAC. EL-19N, SI-8, and SI-5 and on the west side of SI-6. Note also that the entire group between 3 and 5 appears symmetrically in the N. PAC. EL- 20S, El-19N, SI-6, and SI-8. The unusually high degree of symmetry shown in the EL-19N pro- •e has been discussed in detail by Pitman and Heirtzler [1966].
Figure 5 shows the correlation of the anom- alies from 5 through 13. At the top of the figure is the appropriate. section from the North Pacific. Below are profiles from both the east and the west side of the Pacific-Antarctic ridge. The profiles from the east side have been plotted in reverse, to demonstrate simultaneously the lineartry and bilateral symmetry within the pattern. The distance scale of each of the South Pacific profiles has been linearly expanded or contracted to show the best alignment.
The similarity between small narrow anom- alies (less than 10 km in width) is of even greater significance than the evident correlation of broad anomalies numbered 5, 12, and 13. The entire set of anomalies between 5 and 6 in the
North Pacific, EL-20S REV and SI-6, correlate well.
Correlation of the anomalies between 6 and
8 is made difficult by data gaps; however, the
set in EL-20S REV. from 8 to the data gap on the right shows a resemblance to the North Pacific profile. The EL-19N profile in this region contains low-amplitude and short-wavelength anomalies in common with the North Pacific
profile. The SI-6 and EL-19S profile have few anomalies in this region. This may be due to the narrowness of the bodies causing the anom- alies. Heirtzler et al. [1962] and Vine [1966] have demonstrated that the amplitude of an anomaly decreases markedly when the width of the source body is less than 6 kin. The anom- alies between 8 and 12 correlate well in relative
wavelengths and amplitudes. It should be noted that anomalies 9, 10, and l l in the N. PAC. profile have small negative dips at the top. As the width of the bodies causing these anom- alies decreases, these cusps disappear; the SI-5 profile is an example, being shorter than the corresponding North Pacific section by a factor of 2.5. The profiles SI-5 and V-16A REV. show a reasonably good correlation with the North Pacific in the region between 8 and 12. Anom- aly 7 and the small positive spike between 7 and 8 can be seen in SI-6 and EL-19S.
In Figure 6 anomalies 12 through 26 are given. Again the horizontal scale has been linearly adjusted for best alignment, and pro- files from east of the ridge axis have been re-

2074 PITMAN, HERRON, AND tIEIRTZLER
oo[ gammas
0 I00 km
MAGNETIC ANOMALIES IN THE PACIFIC 2075
5 4 5 2 I 2 3 4 5 N.PAC.
ß
.. , i
i i '"', i i / /
EL 19 N i
MN5 ! •
gammas/ SI 5 0'100 krn I
Fig. 4. Obse•ed magnetic anomaly profiles f•o• •J•ure 3 •]o• •c•s show• J• •J•ure i •d fro• •he •ort• •cJ•c (see •e•). •he •umbers •efer •o specJ•c •o•]Jes; •e d•shed
versed as the annotations indicate. The cor-
relation of 12 and 13, 25 and 26, and the broad low amplitude between 24 and 25 is evident throughout the figure. Anomalies 25 and 26 correspond to Peter's [1966] 'guide' anomalies in the Northeast Pacific. The entire magnetic pattern between 13 and 24 resembles that of the North Pacific in relative wavelengths and amplitudes. Anomalies 18, 19, and 20 can be clearly distinguished in profiles N. PAC., V-16B REV., and EL-20 REV. Anomaly 24 shows detailed similarity to the North Pacific in pro- files EL-20 REV., EL-21 REV., and EL-19S. Again it should be pointed out with regard to
Figure 6 that many of the small positive and negative anomalies seen in the North Pacific profile, caused by extremely narrow blocks of material, become indistinguishable in the South Pacific, where the pattern is compressed.
Figure 7 shows the anomalies from 25 to the end of the profiles. Again all profiles to the east of the ridge have been reversed, but in this case all are plotted at the same horizontal scale. Here the correlations are excellent. Anomalies
25 through 29 are seen in detail. Note particu- larly the correspondence between the N. PAC. and EL-19S. All the anomalies between 25 and
32 appear to the west side of the ridge. In the

2076
IOOO
N. PAC. gommas 0
EL20S REV.
ELI9 N
ELI9 S
sI 6
VI6 B REV.
VI6A REV.
sI 5
PITMAN, HERRON, AND tIEIRTZLER
I$ 12 II I0 9 8 7' 6 5
ioo K--•'-• • • • I I I I
• I
•oo• , ' '/ /
'•oo • , , • , I
• I FlO0 KM
•100 KM •
'1OO KM • •. 5. Obse•ed •om•]• •o•]es (•mom•]•es 5 •ou[• I3) from
s•ow• •D •u•e 1 •ad •om •e •or[• •c[•c (see •e•[). •o•]es •om wes• o• [•e ridge
•eve•sed (wes• o• [he ri•). •e •umbe•s •efe• [o s•ec•c •om•]•es; •he d•s•ed ]•es show [he co•re]•t•o• of some of •hese •om•]•es.
sI 6 REV.
I00 KM
26 25 24 23 22 21 20 19 18 17 16 15 14 13 12
N. PAC. I000_
gammasJ 0 100 KS
VI6BREV. •ioo KM •
EL 20 N REV. ' 100 KM •
EL 21 REV. :ioo KM •"
EL 23B }loo KM
ELI9S • I00 KM
$I 6 'lOO KM
Fig. 6. Observed anomaly profiles (anomalies 12 through 26) from Figure 3 along tracks shown in Figure I and from the North Pacific (see text). Profiles from west of the ridge axis have been plotted with west to the left. Profiles from east of the ridge axis have been plotted with west to the right. The numbers refer to specific anomalies; the dashed lines show the correlation of some of these anomalies.

MAGNETIC ANOMALIES IN THE PACIFIC 2077
l gammas
0 50 k•m
32 3l 30 29 28 27 26 25
EL 19 S ' ;
/
¾ 16 Sl 8
v 16 c
V 16B REV. \ EL 21 R ; :
EL 23 C REV. Fig. 7. Observed anomaly profiles (anomalies 25 through 26) from Figure 3 along tracks
shown in Figure I and from the North Pacific (see text). Profiles from west of the ridge axis have been plotted with west to the left. Profiles from east of the ridge have been plotted with west to the right. The numbers refer to specific anomalies; the dashed lines show the correlation of some oœ these anomalies.
profiles from the east side of the ridge, 25 through 29 are clearly recognized. The corre- lation of anomalies 30 through 32 is not so obvious.
As mentioned previously, the distance scales for some of the profiles in Figure 5 and 6 were adjusted linearly to clarify the correlations. It is evident from an examination of Figures 3 through 7 that the spatial distribution of the individual anomalies with respect to the ridge axis is not the same for the North and South
Pacific. In other words, the ratio of the dis- tance between adjacent pairs of anomalies of the South Pacific is seen to vary according to the pair chosen.
This nonlineartry might imply a time-varying relative spreading rate. To explore this pos- sibility a graph has been constructed (Figure 8) in which the perpendicular distance from the ridge axis of individual North Pacific anom- alies has been plotted as a function of the cor- responding perpendicular distance for South Pacific anomalies. To the right, along the y axis,
are the correspo.nding anomaly numbers. The data are seen to fall into three distinct gro.ups. Group A .contains all the correlated anomalies between fracture zones II and III to the south-
east of the ridge axis; Group B contains those between fracture zones III and IV to the north-
west of the ridge axis; and Group. C contains those between fracture zones V and VI to the
northwest of the ridge axis (Figure 1). The anomalies of EL-19N north of fracture zone I
an'd to the southeast of the ridge axis have also been plotted because they will be used in a model study to be discussed later.
The I)ietz and Hess hypothesis of ocean floor spreading dictates that the youngest part of the ocean floor is to be found at the ridge a.xis and that the ocean floor becomes progressively older away from the ridge axis. Thus, distance along the x or y axis may also be thought of as proportional to time before present. Heirtzler etal. [1968] discuss an absolute time scale.
It can be seen that the points in Figure 8 do not lie on a straight line, that each group

31-
?-9- x •'7 x • • $0
28 - ox [] • 0 29 27-
24- • • • • * 24
•0 - •C • A • 17 - • a•. e 16
15- •. ? •
x •.• • 14
13 • x .• • 12- • x , • • // II - • x *• • /0 I0- • x .• •
9 8
• EL- 19S } • o Sl-6 B ß V-16A
6 • Sl-8
ß EL-20 5 • V-16B e EL-21
4 ß EL-23 C
EL-19N • MN-5 3 x __ x S•-5 C e o o S1-3 2 • EL-19 N
I o i i I i ! i i i i i E
o I 2 3 4 5 6 7 8 9 IO ii 12 13 14 15 16 IT 18 19 20 21 HUNDREDS OF KM
• X S. PACIFIC •g. 8. • •d • •xes •n hundreds of •]ome•ers. •]ong [he • •s [o [he r•gh• are
tndt•tdu•l anomaly numbers, e•ch pos•[•oned •ccor•ng [o •he perpendicular d•stance of •he p•r[•cu]•r anom•y from the r•dge •s for [he •or•h •c•fic. The perpendicular d•s[•nce of tnd•du•] Sou•h •c•fic •nom•]•es from •he r•dge •x•s •s me•ured •]ong •he • •x•s. The in [he lower right-hand co•er shows the tr•c•s from which •nomaHes were t•ken.
ANOMALIES
I I
22 23

MAGNETIC ANOMALIES IN TIlE PACIFIC 2079
(A, B, and C) falls along a separate curve, the general shape of which is shown by the smooth curve drawn through the EL-19S points. It can thus be surmised that the ratio of North
Pacific to South Pacific spreading rates has varied with time. The similarity in shape of the curves representing three different regions each bounded by a different set of fracture zones and a different section of ridge axis suggests that the variation in relative spreading rate for each of these regions in the South Pacific has followed the same pattern in time.
MoD•L ANALYSIS
Assuming the validity of the Vine and Matthews hypothesis and using reasonable crustal parameters, we can use model analysis to generate a theoretical anomaly pattern that matches the observed pattern. All models as- sume chemical homogeneity, absence of local intrusions of oppositely magnetized material that would cause inhomogeneities in the direc- tion of magnetization, uniform thickness of blocks, vertical interfaces between blocks, and absence of lateral variation of intensity of reinanent magnetization.
Hess [1965] has proposed that serpentinite with a 1- to 2-km veneer of basalt forms the
main oceanic crustal layer. The ratio between remanent and induced magnetization (Koenigs- berger ratio or Q factor) exceeds 10 in basalts, whereas for serpentines this ratio is usuaJly less than 1 [Cox et al., 1964; Ade-Hall, 1964; Vogt and Ostenso, 1966; Opdyke and Hekanian, 1967]. The remanen• magnetization for basalts is greater than 5 X 10 -• emu/cc, but for serpen- tines it is often less than 10-' emu/cc. Thus, many authors, including Cox and Doell [1962], Vine and Wilson [1965], and Heirtzler and Le- Pichon [1965], and Vine [1966], have assume. d that the source of the magnetic anomalies lies in the 1- to 2-km-thick basalt layer.
This crustal model was applied by Pitman and Heirtzler [1966] to part of the axis of the Pacific-Antarctic ridge. The axial part of the anomaly pattern was correlated with the known history of magnetic field reversals since the Gilbert reversed epoch [Cox et al., 1963a, b; Doell and Dalrymple, 1966], using a crustal structure composed of blocks of alternating normal and reverse polarity. A constant spread- ing rate of 4.5 cm/yr was obtained. Beyond the
Gilbert reversed, the crustal structure was ob- tained by placing blocks of alternating mag- netic polarity beneath the remaining anom- alies to the end of the profile. The depth to the upper surface of the blocks was set by average bathymetry, and the thickness was assumed to be 2 km. To substantiate further the validity of this set of model blocks, Pitman and Heirtz- ler [1966] applied it in its entirety to the Reyk- janes ridge but compressed the horizontal scale to give a spreading rate of 1 cm/yr.
With the detailed correlation of the entire
anomaly pattern between the South Pacific and the North Pacific, it is now possible to extend the set of model blocks from the axial zone to
anomaly 32. As discussed in detail previously, Figure 8
illustrates that the relative spreading rate be- tween the North and South Pacific has varied
with time. The region with the largest spread- ing rate will yield the greatest detail on mag- netic reversal history. Using EL-19N for the anomalies 5 on the east to 5 on the west and
N. PAC. for the remaining anomalies, we have selected a composite observed profile. Accord- ingly, a crustal model has been derived for the North Pacific by placing block of alternating normal and reverse polarity beneath the ob- served anomalies, as described previously.
To construct a model for the South Pacific, the complete North Pacific model has been ad- justed in accordance with the curve for EL- 19S shown in Figure 8. Inclination and declina- tion were computed assuming an axial dipole field. The remanent magnetization was assumed to be 5 X 10-' emu/cc.
Figure 9A shows the model blocks for the North Pacific; immediately above is the com- puted anomaly profile and above that the North Pacific composite profile. The correlation of the model pattern with the observations is good, except for some details to the bast of the axis, where the measured anomaly profile appears to be compressed at the edge of the North Amer- ican continent.
The amplitudes of the computed anomalies decrease from the axis out to the ends of the
profile, owing to the increased depth to the up- per surface of the blocks farther from the axis. It is possible that the intensity of the remanent magnetization associated with the observed anomalies may also decrease with time, owing

2080 PITMAN, I-IERRON, AND I-IEIRTZLEtt
• • o - o•

MAGNETIC ANOMALIES IN THE PACIFIC 2081
to viscous reinanent decay and chemical alter- ation [Irving, 1964].
Most of the computed anomalies have steeper slopes than the corresponding observed anom- alies. Some of the more narrow computed anom- alies (particularly between anomalies 5 and 6) have much greater amplitudes than their ob- served counterparts. The work of Loncarevic ei al. [1966] a•d Matthews and Bath [1967] suggests that the interface between model blocks is not in reMity a simple discontinuity in the 'di- rection of magnetic polarity but probably a zone of mixed polarities. The presence of such a zone would tend to reduce the gradient of the anomalies. For the very narrow blocks this zone might also decrease the effective reinanent magnetization. However, the fact that many of the narrow, anomalies, such as those shown in Figure 5, are correlatable implies that this transition zone is quite sm•ll (less than 5 km in width).
Another phenomenon found from model studies is the unusual amplitude of the central anomaly. In nearly all cases studied to date, it has been necessary to double the magnetization of the central block in order to reproduce the central anomaly [Vine and Wilson, 1965; Pit- man and Heirtzler, 1966; Vine, 1966]. It has been suggested that this necessity might arise because of the distribution of injection fissures across the axis of the ridge [Loncarevic et al., 1966]. According to this hypothesis, all the blocks except the central one are contaminated with reversely magnetized dykes. The central block has not yet experienced a reversal of the earth's field and therefore cannot be con-
taminated with material of opposite polarity. As discussed previously, however, the width of this zone of fissures appears to be quite small and thus ineffective as a contaminating agent except for very narrow blocks. It is also pos- sible to account for the central anomaly by doubling or tripling the thickness of the central block; however, this introduces severe mechan- ical difiqculties as the central block splits and moves toward the flanks.
In Figure 9B are shown the model blocks adjusted for the South Pacific with the resulting computed profile; the observed profiles EL-19S and SI-6 are presented. Blank areas in the EL-19S and SI-6 profiles are data gaps.
The correlation is good between the two
measured profiles and the computed profile. The correspondence between SI-6 from anomaly 5 on the west (at about 300 km from the axis) to 5 on the east and the computed profile in the same zone is excellent. The fit from anomaly 8 (at 700 kin) to 32 (at 1800 km) appears best for the EL-19S profile. As discussed previously, in connection with the North Pacific, the anom- alies of the South Pacific computed profile de- crease in amplitude away from the ridge axis. Again the gradients are greater than in the measured profiles, and the narrower anomalies have much higher amplitudes. The most signi- ficant result of this model analysis is that a model made for one region (the North Pacific) is applicable to a distant region (such as the South Pacific.
Figure 10 shows the location of some key anomalies that have been correlated in the North and South Pacific. Correlations are
tentative where the lines are dashed. The
dotted lines give the approximate location of fracture zones. The location of fracture zones
in the North Pacific is from Menard [1967]. The magnetic data for the northeast Pacific are largely from Ra# and Mason [19'61], Mason and Ra# [1961], a.nd Ra# [19'61]. Tracks of the R. V, Co•rad .and R. V. Verna were also used.
OTI-IER GEOPI-IYSICAL DATA
The distribution of sediments, earthquakes, and heat flow in the ocean basins further sup- port the hypothesis of a spreading ocean floor.
The spreading floor concept of Hess and Dietz predicts a thickening of sediments away from the ridge, with no sediments at the axis. Also, the age at the bottom of the sedimentary column should increase with increasing distance from the ridge axis.
Ewing and Ewing [1967] have shown that, in general, no sediment can be detected by seismic reflection techniques at the axis and that the thickness of the sediments increases
away from the ridge axis. On many parts of the ridge near the axis, bottom photographs show rock outcrop. Burckle et al. [1966] have shown that., in the Pacific, the ages of the oldest sedi- ment cores obtained increase with increasing distance from the ridge axis. They have not found sediments at the ridge axis older than Pleistocene, and the bottom of cores taken in the axial zone often contain fresh basaltic glass

2082 PITMAN, I-IERRON, AND I•EIRTZLER
120' 150' 18 0' 150' 120' 9 0' 60'
60 ø
50 ø
.
50'
60'
70'
120 ø 150 ø 1800 150 ø 120 ø 90 ø
60'
50 ø
.
50 ø
60'
70 ø
60'
Fig. 10. Anomaly map for the Pacific Ocean; the 2000-fro contour is shown. The heavy solid lines show the location of some of the key anomalies. The lines are dashed where the magnetic anomaly correlations were uncertain. The dotted lines represent known and proposed fracture zones. Data of the North Pacific are from Menard [ 1967].
broken on impact of the core barrel. Ewing and Ewing [1967] found a large discontinuity in the rate of increase of sediment thickness over
many regions of the mid-oceanic ridge system and suggest that this discontinuity reflects an interruption in the spreading process, although geographic and temporal changes in sedimenta- tion rates could also be inferred.
A difficult problem concerning the sediment distribution in the Pacific and its relationship to
the spreading floor hypothesis is the problem of disposing of the sediments in trenches or continental margins.
Both Dietz and Hess have inferred that the
spreading crustal material is being carried down into the trenches. It might be expected that the sedimentary cover would be scraped off and be highly contorted an'd compressed. One might expect to find highly distorted sediments at the bottom of the trenches. Seismic refiec-

MAGNETIC ANOMALIES IN THE PACIFIC 2083
tion and refraction profiles have been made on a few Pacific trenches [Ross and Shot, 1965; Ewing ei al., 1965; Ludwig ei al., 1966]. To date no large bodies of distorted sediments have been found to be associated with the trenches.
On the contrary, the sediment cover in general conformably follows the basement down into the trench, at the bottom of which are often found thin lenses of undistorted fiat-lying sediments. Hayes [1966] has found that to the south of 40øS, the Peru-Chile trench is sediment filled. A reflection profile [Ewing ei al., 1968b] taken from the Peru-Chile trench southwest of
Tierra del Fuego shows that the trench is filled with stratified sediments. These sediments are
fiat-lying at the ocean bottom and dip increas- ingly toward land with depth of burial. They do not appear to be distorted, and the entire wedge of sediments ends abruptly at a near vertical reflector on the landward side. Reflec-
tion profiler records show the same type of structure at the continental margin just west of Victoria, British Columbia, indicating a buried trench in the region east of the Juan de Fuca ridge [Ewing et al., 1968a]. Crustal material spreading east from the Juan de Fuca and Gorda ridges would suggest that coastal North America in this region should be bordered by a trench. It is interesting to note that the sedi- ment-filled trench areas discussed have little
earthquake activity (L. R. Sykes personal com- munication), although they are both adjacent to sections of ridges that are presumed to be spreading today. The problem of the trenches remains enigmatic with regard to ocean floor spreading.
Indirect evidence on the spreading phenom- enon has recently come from the more exact loca.tion of earthquake epicenters associated with the mid-oceanic ridge system and from fault plane solutions of the stronger of these earthquakes. Sykes [19'67] has shown that the earthquakes associated with the mid-oceanic ridge system are most often located along frac- ture zones between the. offset axes of the ridge. Wilson [1965a, b] interpreted these fracture zones as transform faults. I-Ie suggested that the ridge axis formed in an offse• manner and that, .because of spreading, the part of the fault between the offset axes would be seis-
mically active but the parts beyond would be seismically inactive.
Fault plane solutions for earthquakes located along the mid-oceanic ridge system [Skyes, 1967] show that, for all epicenters located on fracture zones, the direction of motion along a near-vertical fault plane agrees with that predicted by the transform fault hypothesis. Various authors [see e.g. Sykes, 1966] have shown that the hypocenters of earthquakes associated with island arc-oceanic trench struc-
tures lie along a plane that dips from the ocean side toward the island arc. Stauder and Bollinger [1966] have suggested that motion along a low- angle thrust fault was the most likely cause of the March 1964 Alaskan earthquake. This solu- tion is in agreement with the spreading hypoth- esis of Hess [1961] and Dietz [1962].
Olivet and Isacks [1967] have found that, in the region of the Tonga-Fiji trench, the propagation characteristics of the sloping seis- mic zone are typical of the uppermost part of the mantle. These observations are consistent
with the concept that the oceanic crust. is being forced down at the oceanic trenches along shal- low thrust faults.
Iteat flow values are frequently anomalously high in the vicinity of the ridge. The data of Lee and Uyeda [1965] show high heat flow over the axial zone of the Gorda ridge and in the Gulf of California and near the coast south
of the Murray fracture zone. Langseih ei al. [1966] show a broad zone of high heat flow centered over the ridge axis in the region 20øS to 15øN and 80 ø to 135øW. Attempts to account for the width of the zone of high average heat flow near the axis with a very simple model of convective flow have been unsuccessful (see, for example, Langseih et al. [1966], but the high heat flow zone associated with the ridge crest strongly suggests that convection is the cause.
SUM MARY
Data have been presented to show that, in the antarctic regions of the Pacific Ocean, a linear magnetic pattern, symmetric about the crest of the mid-oceanic ridge, can be traced from the edge of the New Zealand continental shelf at 175øE to 90øW. This same pattern is also found in the North Pacific although much of the eastern half of the pattern dis- appears at the continental shelf.
Using a two-dimensional structure composed

2084 PITMAN, ]KERRON, AND I-IEIRTZLER
of crustal blocks of alternating normal and reverse polarity, we can synthesize the observed magnetic pattern. The same sequence of blocks produces anomalies that correlate with both the North and the South Pacific anomalies. In
the axial zone the sequence of blocks exhibits the same pattern as shown by the radio- metrically determined magnetic history of the earth over the last 3.•5 m.y. Dating of these axial anomalies gives a spreading rate as high as 4.5 cm/yr in the South Pacific. It is now possible to assign relative ages to over half of the Pacific Ocean. The last paper of this series discusses a probable time scale for the anom- alies.
The Pacific pattern is strong evidence in support of the theory of ocean floor spreading. The theory is supported by data from sedi- ment distribution, magnetic reversals in deep- sea cores, and seismic activity on the ridge crests and near the trenches and perhaps by heat flow.
Aclcnowledgments. T. Wustenberg, magneto- meter operator on the Eltanin during cruises 19 through 24, and Mrs. P. Sutherland, who prepared the data for computer processing, contributed especially to this study. The authors are especially grateful to Miss T. Stillman for help in the com- puter analysis and to G. O. Dickson, C. L. Drake, and N. D. Opdyke for critically reviewing the manuscript.
This study was supported by the National Sci- ence Foundation under contracts GP5536 and
GA894 and by the Office of Naval Iresearch under contract N00014-67-A-0108-0004 (T04). Many people were involved in the gathering, processing, and analysis of the data.
•EFERENCES
Ade-Hall, J. M., The magnetic properties of some submarine oceanic lavas, Geophys. J., 9, 85, 1964.
Burckle, L. H., J. I. Ewing, T. Saito, and R. Leydon, Tertiary sediments from the East Pa- cific rise, Geol. Soc. Am. Program 1966 Annual Metting, 30, 1966.
Cain, J. C., W. E. Daniels, S. J. Hendricks, and D.C. Jensen, NASA Rept. X-612-65-72, 1964.
Christoffel, D. A., and D. I. Itoss, Magnetic anomalies south of the New Zealand plateau, J. Geophys. Res., 70, 2857, 1965.
Cox, A., and R. R. Doell, Magnetic properties of the basalt in hole EM7, Mohole, Project, J. Geophys. Res., 67, 3997, 1962.
Cox, A., R. R. Doell, and G. B. Dalrymple, Geo- magnetic epochs and Pleistocene geochronology, Nature, 198, 1049, 1963a.
Cox, A., R. R. Doell, and G. B. Dairytopic, Geo-
magnetic polarity epochs, Science, 142, 382, 1963b.
Cox, A., R. R. Doell, and G. B. Dairytopic, Quaternar• paleomagnetic stratigraphy, The Quaternary o/ the United States, edited by H. E. Wright and D. G. Frey, Princeton Uni- versity Press, Princeton, N.J., 1965.
Cox, A., R. R. Doell, and G. Thompson, A study of serpentinity, NAS-NRC Publ. 1188, 49, 1964.
Dietz, It. S., Continent and ocean basin evolution by spreading of the; sea floor, Nature, 19'0, 854, 1961.
Dietz, R. S., Ocean basin evolution by sea floor spreading, J. Oceanog. Soc. Japan. 20th Anniv. Vol., 4, 1962.
Doell, R. R., and G. B. Dalrymple, Geomagnetic polarity epochs: a new polarity event and age of the Brunhes-Matuyama boundary, Science, 152, 1060, 1966.
Ewing, J., and M. Ewing, Sediment distribution on the mid-ocean ridges with respect to spreading of the sea floor, Science, 156, 1590, 1967.
Ewing, J., M. Ewing, T. Aitken, and W. J. Lud- wig, North Pacific sediment layers measured by seismic profiling, in The Crust and Upper Mantle o/ the Paci/•c Area, Monograph 12, American Geophysical Union, Washington, D. C. (in press), 1968.
Ewing, M., J. Ewing, It. ]Koutz, and R. Leydon, Sediment distribution in the Bellingshausen Sea, Proceedings o/ the Symposium on .4ntarctic Oceanography, Santiago, Chile, 1966, edited by G. Robin, I.U.G.G., S.C.A.R., in press, 1968.
Ewing, M., W. J. Ludwig, and J. I. Ewing, Oceanic structural history of the Bering Sea, J. Geophys. Res., 70, 4593, 1965.
Hayes, D. E., A geophysical investigation of the Peru-Chile trench, J. Marine Geol., •, 309, 1966.
I-Iays, ,l.D., and N. D. Opdyke, Antarctic radio- laria, magnetic reversals, and climatic change, Science, 158, 1001, 1967.
I-Ieirtzler, J. It., G. O. Dickson, E. M. ]Kerron, W. C. Pitman, III, and X. Le Pichon, Marine magnetic anomalies, geomagnetic field reversals and motions of the ocean floor and continents, J Geophys. Res., 75(6), 1968.
I-Ieirtzler, J. R., and X. Le Pichon, Crustal struc- ture of the mid-ocean ridges, 3, Magnetic anomalies over the mid-Atlantic ridge, J. Geo- phys. Res., 70, 4013, 1965.
Iteirtzler, J. R., G. Peter, M. Talwani, and E. Zerfiueh, Magnetic anomalies caused by two- dimensional structure, their computation by digital computers, and their interpretation, Tech. Rept. 6, Cu-6-62, Nonr-Geology, Columbia University Press, New York, 19'62.
Hess, I-I. I-I., I-Iistory of the ocean basins in Petro- logic Studies, pp. 599-620, Geological Society of America, New York, 1962.
Hess, I-I. I-I., Mid-oceanic ridges and tectonics of the sea floor, Submarine Geology and Geophy- sics, Colston Papers 17, pp. 327-332, Butter- worth, London, 1965.

MAGNETIC ANOMALIES IN THE PACIFIC 2085
Irving, E., Palcomagnetism and Its Application to Geological and Geophysical Problems, John Wiley & Sons, New York, 1964.
Langseth, M. G., Jr., X. Le Pichon, and M. Ewing, Crustal structure of the mid-oceanic ridges, 5, Heat flow through the Atlantic ocean floor and convection currents, J. Geophys. Res., 71, 5321, 1966.
Lee, W. I-I. I•., and S. Uyeda, Review of heat flow data, Terrestrial Heat Flow, Geophys. Mono- graph 8, pp. 87-190, American Geophysical Union, Washington, D.C., 1965.
Loncaxevic, B. D., C. S. Mason, and D. It. Mat- thews, Mid-Atlantic ridge near 45 North: the median valley, Can. J. Earth Sci., 3, 327, 1966.
Ludwig, W. J., J. I. Ewing, M. Ewing, S. Murachi, N. Den, S. Asano, tt. I-Iotta, M. Itayakawa, T. Asanuma, I•. Ichikawa, and I. Noguchi, Sedi- ments and structure of the Japan trench, J. Geophys. Res., 71, 2121, 1966.
Mason, R. G., A magnetic survey off the west coast of the United States between latitudes 30
and 36 N and longitudes 121 and 128 W, Geo- phys. J., 1, 320, 1958.
Mason, R. G., and A.D. Raft, Magnetic survey off the west coast of North America, 32 N to 42 N, Bull. Geol. Soc. Am., 72, 1259, 1961.
Matthews, D. I-I., and Jennifer Bath, Formation of magnetic anomaly pattern of mid-Atlantic ridge, Geophys. J., 13, 349, 1967.
Menard, I-I. W., and V. Vaquier, Magnetic survey of a part of the deep sea floor off the coast of California, Office o/Naval Research, Res. Rev., June 1958.
Menard, I-I. W., The East Pacific rise, Science, 132, 1737, 1960.
Menard, I-I. W., Marine Geology o/ the Pacific, McGraw-Hill, New York, 1964.
Menard, I-I. W., Extension of northeastern Pa- cific fracture zones, Science, 155, 72, 1967.
Oliver, J., and B. L. Isacks, Deep earthquake zones, anomalous structures in the upper mantle, and the lithosphere, J. Geophys. Res., 72, 4259, 1967.
Opdyke, N. I)., B. Glass, J. I). Hays, and J. Foster, A palcomagnetic study of antarctic deep sea cores, Science, 154, 349, 1966.
Opdyke, N. D., and R. I-Iekanian, The magnetic properties of some igneous rocks from the mid- Atlantic ridge, J. Geophys. Res., 72, 2257, 1967.
Peter, G., Magnetic anomalies and fracture pat- tern in the northeast Pacific Ocean, J. Geophys. Res., 71, 5365, 1966.
Pitman, W. C., III, and J. R. I-Ieirtzler, Magnetic anomalies over the Pacific-Antarctic ridge, Sci- ence, 154, 1164, 1966.
Raft, A.D., Boundaries of an area of very long magnetic anomalies in the. northwest Pacific, J. Geophys. Res., 71, 2631, 1966.
Raft, A.D., and R. G. Mason, Magnetic survey off the west coast of North America 40 N lati- tude to 50 N latitude, Bull. Geol. Soc. Am., 72, 1267, 1961.
Ross, D. A., and G. G. Shor, Jr., Reflection pro- files across the middle America trench, J. Geo- phys. Res., 70, 5551, 1965.
Stauder, Wm., and G. A. Bollinger, The focal mechanism of the. Alaska earthquake of March 28, 1964, and of its aftershock sequence, J. Geo- phys. Res:, 71, 5283, 1966.
Sykes, L. R., Seismicity of the South Pacific Ocean, J. Geophys. Res., 68, 5999, 1963.
Sykes, L. R., The seismicity and deep structure of island arcs, J. Geophys. Res., 71, 2981, 1966.
Sykes, L. R., Mechanism of earthquakes and na- ture of faulting on the mid-oceanic ridges, J. Geophys. Res., 72, 2131, 1967.
Vacquier, V., A.D. Raft, and R. E. Warren, Horizontal displacements in the floor of the northeastern Pacific Ocean, Bull. Geol. Soc. Am., 72, 1251, 1961.
Vine, F. J., Spreading of the ocean fioor;• new evidence, Science, 154, 1405, 196.6.
Vine, F. J., and D. I-I. Matthews, Magnetic anom- alies over oceanic ridges, Nature, 199, 947, 1963.
Vine, F. J., and J. T. Wilson, Magnetic anomalies over a young oceanic ridge off Vancouver Is- land, Science, 150, 485, 1965.
Vogt, P. R., and N. A. Ostenso, Magnetic survey over the mid-Atlantic ridge between 42 N and 47 N, J. Geophys. Res., 71, 4389, 1966.
Wilson, J. T., A new class of faults and their bearing on continental drift, Nature, 207, 343, 1965a.
Wilson, J. T., Transform faults, oceanic ridges, and magnetic anomalies southwest of Vancouver Island, Science, 150, 482, 1965b.
(Received October 20, 1967.)