Embed Size (px)
Citation preview
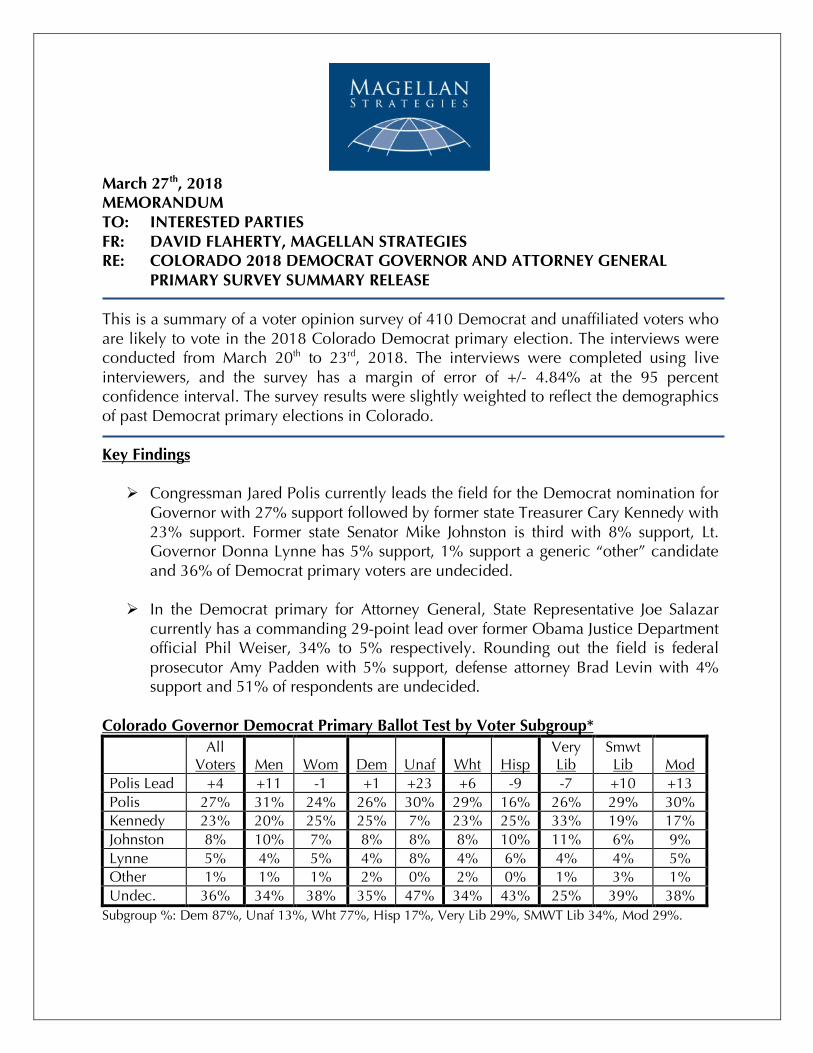
March 27th, 2018 MEMORANDUM TO: INTERESTED PARTIES FR: DAVID FLAHERTY, MAGELLAN STRATEGIES RE: COLORADO 2018 DEMOCRAT GOVERNOR AND ATTORNEY GENERAL PRIMARY SURVEY SUMMARY RELEASE This is a summary of a voter opinion survey of 410 Democrat and unaffiliated voters who are likely to vote in the 2018 Colorado Democrat primary election. The interviews were conducted from March 20th to 23rd, 2018. The interviews were completed using live interviewers, and the survey has a margin of error of +/- 4.84% at the 95 percent confidence interval. The survey results were slightly weighted to reflect the demographics of past Democrat primary elections in Colorado. Key Findings
Ø Congressman Jared Polis currently leads the field for the Democrat nomination for Governor with 27% support followed by former state Treasurer Cary Kennedy with 23% support. Former state Senator Mike Johnston is third with 8% support, Lt. Governor Donna Lynne has 5% support, 1% support a generic “other” candidate and 36% of Democrat primary voters are undecided.
Ø In the Democrat primary for Attorney General, State Representative Joe Salazar
currently has a commanding 29-point lead over former Obama Justice Department official Phil Weiser, 34% to 5% respectively. Rounding out the field is federal prosecutor Amy Padden with 5% support, defense attorney Brad Levin with 4% support and 51% of respondents are undecided.
Colorado Governor Democrat Primary Ballot Test by Voter Subgroup* All
Voters
Men
Wom
Dem
Unaf
Wht
Hisp Very Lib
Smwt Lib
Mod
Polis Lead +4 +11 -1 +1 +23 +6 -9 -7 +10 +13 Polis 27% 31% 24% 26% 30% 29% 16% 26% 29% 30% Kennedy 23% 20% 25% 25% 7% 23% 25% 33% 19% 17% Johnston 8% 10% 7% 8% 8% 8% 10% 11% 6% 9% Lynne 5% 4% 5% 4% 8% 4% 6% 4% 4% 5% Other 1% 1% 1% 2% 0% 2% 0% 1% 3% 1% Undec. 36% 34% 38% 35% 47% 34% 43% 25% 39% 38%
Subgroup %: Dem 87%, Unaf 13%, Wht 77%, Hisp 17%, Very Lib 29%, SMWT Lib 34%, Mod 29%.

Magellan Strategies Colorado 2018 Governor Democrat Primary Survey Summary Field Dates: March 20th to 23rd, 2018, 410n, MoE +/- 4.84%
Magellan Strategies | 1685 Boxelder St. Suite 300 | Louisville, CO 80027
www.MagellanStrategies.com | (303) 861-8585
2
Observations of the Colorado Governor Democrat Primary Ballot Test Since January, the conventional wisdom among political observers in Colorado was that Jared Polis was the likely front runner in the Democrat primary for Governor. The results of this survey change that story, with Cary Kennedy emerging from the pack of Polis challengers. It appears Cary Kennedy has built some momentum from her victory in the preference polls taken at the March 6th Democrat precinct caucuses, defeating Jared Polis 50% to 32.5%. Looking closer at the ballot test results by voter subgroup, we find among male voters Jared Polis leads Cary Kennedy by an 11-point margin, 31% to 20% respectively. Among female voters it is a statistical tie, with Cary Kennedy leading Jared Polis by 1 point, 25% to 24% respectively. However, female voters historically contribute about 60% to the total votes cast in a Democrat primary election in Colorado. Another observation is Jared Polis holds a 23-point lead over Cary Kennedy among unaffiliated voters, 30% to 7%. However, it is important to note that the survey interviewed only 51 unaffiliated voters and that measurement has a margin of error of +/- 13.8%. Colorado Governor Democrat Primary Candidate Image Ratings It is notable, but not surprising, that none of Democrat primary candidates for Governor have a negative image rating. However, the early period of the primary campaign is ending and the time to put money to work is just around the corner. A measurement of name recognition is perhaps more relevant. At this time, the most well-known Democrat candidate for Governor is Jared Polis, with 62% of respondents having an opinion of him and 73% having heard of him. Cary Kennedy is the second most well-known candidate, with 45% having an opinion of her and 56% having heard of her. The other two candidates in the race, Mike Johnston (60% never heard of) and Donna Lynne (71% never heard of) have a lot of work to do introducing themselves to voters. Jared Polis Image Rating by Voter Subgroup All
Voters
Men
Wom
Dem
Unaf
Wht
Hisp Very Lib
SMWT Lib
Mod
Favorable 55% 56% 54% 56% 43% 61% 33% 69% 53% 53% Unfavorable 7% 9% 6% 6% 12% 8% 3% 5% 9% 7% Hrd of, No Opinion 11% 9% 12% 11% 13% 11% 10% 8% 15% 10% Never Heard Of 27% 26% 28% 27% 32% 20% 54% 18% 23% 30%
Cary Kennedy Image Rating by Voter Subgroup All
Voters
Men
Wom
Dem
Unaf
Wht
Hisp Very Lib
SMWT Lib
Mod
Favorable 42% 38% 45% 45% 22% 46% 30% 54% 39% 41% Unfavorable 3% 4% 3% 3% 5% 3% 2% 3% 5% 1% Hrd of, No Opinion 11% 9% 12% 11% 14% 11% 10% 10% 8% 15% Never Heard Of 44% 49% 40% 41% 59% 40% 58% 33% 48% 43%
Magellan Strategies Colorado 2018 Governor Democrat Primary Survey Summary Field Dates: March 20th to 23rd, 2018, 410n, MoE +/- 4.84%
Magellan Strategies | 1685 Boxelder St. Suite 300 | Louisville, CO 80027
www.MagellanStrategies.com | (303) 861-8585
3
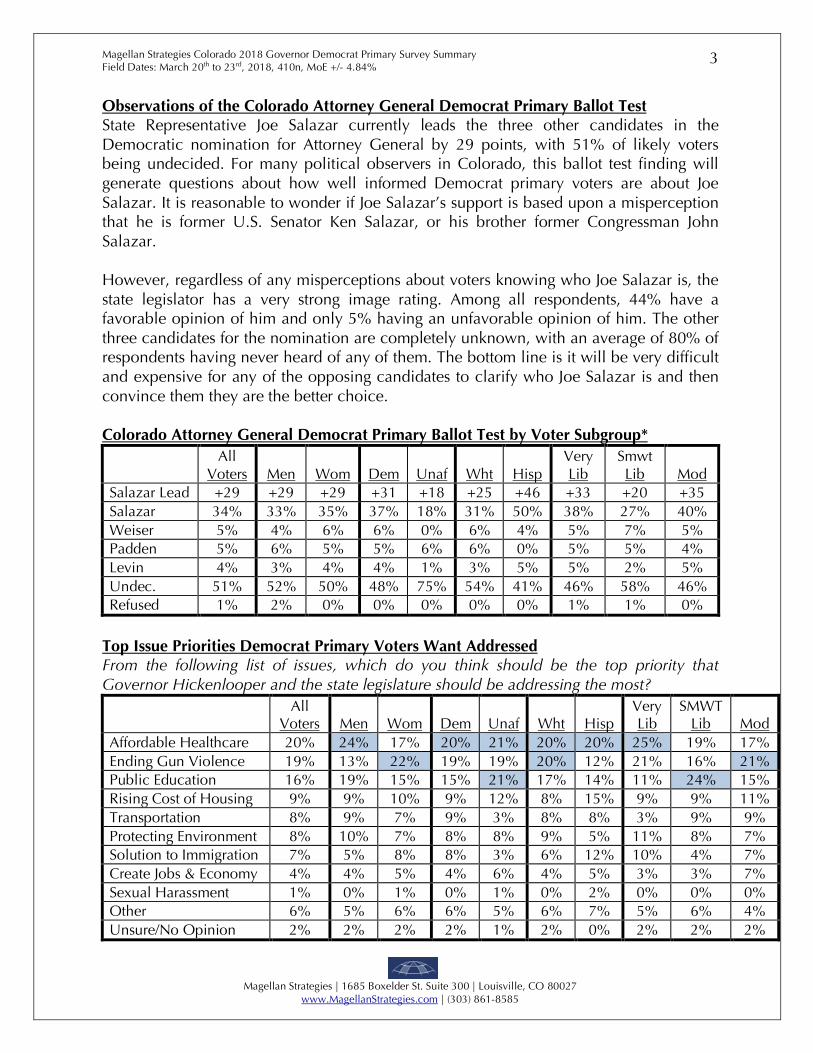
Observations of the Colorado Attorney General Democrat Primary Ballot Test State Representative Joe Salazar currently leads the three other candidates in the Democratic nomination for Attorney General by 29 points, with 51% of likely voters being undecided. For many political observers in Colorado, this ballot test finding will generate questions about how well informed Democrat primary voters are about Joe Salazar. It is reasonable to wonder if Joe Salazar’s support is based upon a misperception that he is former U.S. Senator Ken Salazar, or his brother former Congressman John Salazar. However, regardless of any misperceptions about voters knowing who Joe Salazar is, the state legislator has a very strong image rating. Among all respondents, 44% have a favorable opinion of him and only 5% having an unfavorable opinion of him. The other three candidates for the nomination are completely unknown, with an average of 80% of respondents having never heard of any of them. The bottom line is it will be very difficult and expensive for any of the opposing candidates to clarify who Joe Salazar is and then convince them they are the better choice. Colorado Attorney General Democrat Primary Ballot Test by Voter Subgroup* All
Voters
Men
Wom
Dem
Unaf
Wht
Hisp Very Lib
Smwt Lib
Mod
Salazar Lead +29 +29 +29 +31 +18 +25 +46 +33 +20 +35 Salazar 34% 33% 35% 37% 18% 31% 50% 38% 27% 40% Weiser 5% 4% 6% 6% 0% 6% 4% 5% 7% 5% Padden 5% 6% 5% 5% 6% 6% 0% 5% 5% 4% Levin 4% 3% 4% 4% 1% 3% 5% 5% 2% 5% Undec. 51% 52% 50% 48% 75% 54% 41% 46% 58% 46% Refused 1% 2% 0% 0% 0% 0% 0% 1% 1% 0%
Top Issue Priorities Democrat Primary Voters Want Addressed From the following list of issues, which do you think should be the top priority that Governor Hickenlooper and the state legislature should be addressing the most? All
Voters
Men
Wom
Dem
Unaf
Wht
Hisp Very Lib
SMWT Lib
Mod
Affordable Healthcare 20% 24% 17% 20% 21% 20% 20% 25% 19% 17% Ending Gun Violence 19% 13% 22% 19% 19% 20% 12% 21% 16% 21% Public Education 16% 19% 15% 15% 21% 17% 14% 11% 24% 15% Rising Cost of Housing 9% 9% 10% 9% 12% 8% 15% 9% 9% 11% Transportation 8% 9% 7% 9% 3% 8% 8% 3% 9% 9% Protecting Environment 8% 10% 7% 8% 8% 9% 5% 11% 8% 7% Solution to Immigration 7% 5% 8% 8% 3% 6% 12% 10% 4% 7% Create Jobs & Economy 4% 4% 5% 4% 6% 4% 5% 3% 3% 7% Sexual Harassment 1% 0% 1% 0% 1% 0% 2% 0% 0% 0% Other 6% 5% 6% 6% 5% 6% 7% 5% 6% 4% Unsure/No Opinion 2% 2% 2% 2% 1% 2% 0% 2% 2% 2%

Magellan Strategies Colorado 2018 Governor Democrat Primary Survey Summary Field Dates: March 20th to 23rd, 2018, 410n, MoE +/- 4.84%
Magellan Strategies | 1685 Boxelder St. Suite 300 | Louisville, CO 80027
www.MagellanStrategies.com | (303) 861-8585
4
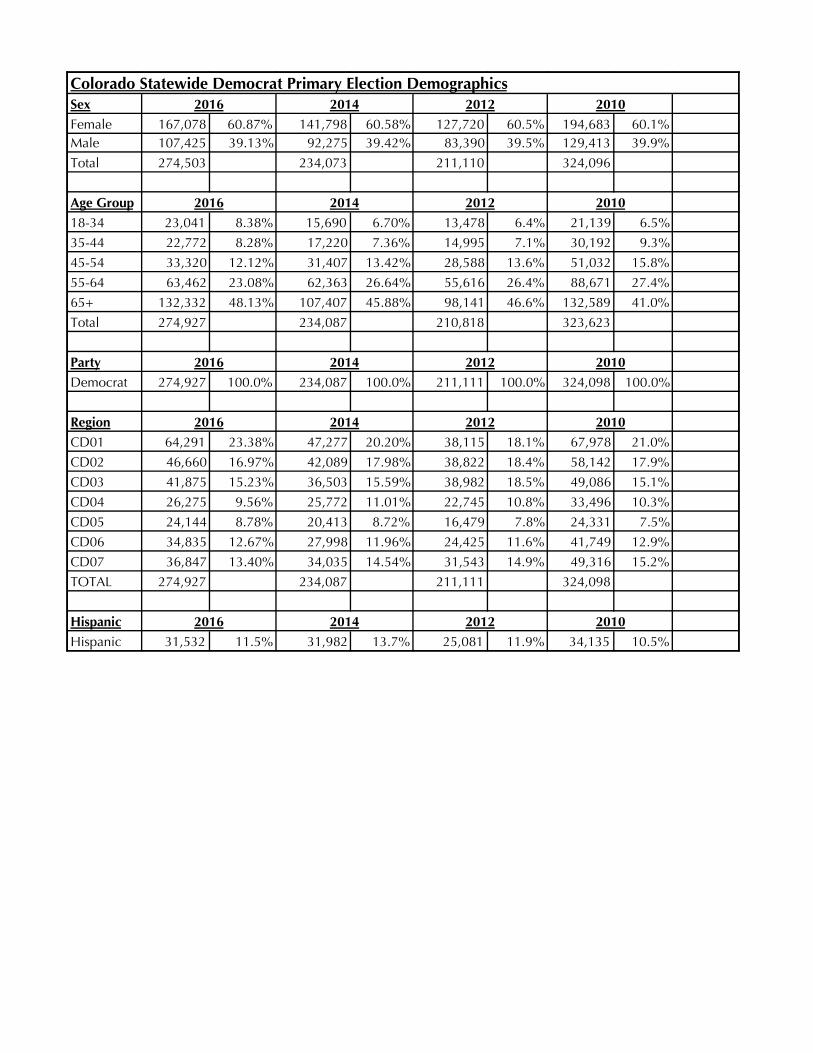
Conclusion At this early stage of the campaign Cary Kennedy has succeeded in making herself the alternative to Jared Polis and potentially the front runner in the nomination for Democrat Governor. The next test of support for her campaign and the other candidates will be at the Democratic state assembly on April 14th. However, there are millions of dollars about to be spent by several campaigns. They will be introducing themselves to primary voters and making their best arguments why they should be the nominee for Governor. For Colorado political observers, it will be very interesting to see the twists and turns of this primary through Election Day on June 26th. Our Weighting Methodology for This Survey We have made every effort to properly forecast the demographics of the Democrat primary voter turnout expected on Election Day, June 26th. To accurately project what the demographics (age, gender, party, race) on Election Day will be, we use an approach that aggregates data from our Colorado voter file. A table showing our approach is included in this document. Survey Commissioned By This survey was fielded and paid for by Magellan Strategies. We are not working with any candidates, individuals or independent expenditure committees with an interest in the 2018 Colorado Democrat primary for Governor. For any questions regarding the survey findings or methodology, please contact David Flaherty by calling our office at 303-861-8585 or email at [email protected]. Survey Sample The survey sample was randomly drawn from a Colorado voter file among households containing at least one registered Democrat or unaffiliated voter. The survey topline and crosstab results are included in this document. A survey presentation is also available on our website at www.MagellanStrategies.com. About Magellan Strategies Magellan Strategies is a national full-service voter opinion polling and survey research firm. We have provided polling services to Republican candidates, ballot issue campaigns, government relation firms, trade associations, and local governments since 2006. We also offer voter data mining, voter data analysis and campaign consulting services. Our office is in Louisville, Colorado. To learn more about our company please visit http://www.MagellanStrategies.com or call 303-861-8585. The Democrat primary demographics, survey toplines and crosstab results follow.
Sex
Female 167,078 60.87% 141,798 60.58% 127,720 60.5% 194,683 60.1%Male 107,425 39.13% 92,275 39.42% 83,390 39.5% 129,413 39.9%
Total 274,503 234,073 211,110 324,096
Age Group
18-34 23,041 8.38% 15,690 6.70% 13,478 6.4% 21,139 6.5%
35-44 22,772 8.28% 17,220 7.36% 14,995 7.1% 30,192 9.3%
45-54 33,320 12.12% 31,407 13.42% 28,588 13.6% 51,032 15.8%
55-64 63,462 23.08% 62,363 26.64% 55,616 26.4% 88,671 27.4%
65+ 132,332 48.13% 107,407 45.88% 98,141 46.6% 132,589 41.0%
Total 274,927 234,087 210,818 323,623
Party
Democrat 274,927 100.0% 234,087 100.0% 211,111 100.0% 324,098 100.0%
Region
CD01 64,291 23.38% 47,277 20.20% 38,115 18.1% 67,978 21.0%
CD02 46,660 16.97% 42,089 17.98% 38,822 18.4% 58,142 17.9%
CD03 41,875 15.23% 36,503 15.59% 38,982 18.5% 49,086 15.1%
CD04 26,275 9.56% 25,772 11.01% 22,745 10.8% 33,496 10.3%
CD05 24,144 8.78% 20,413 8.72% 16,479 7.8% 24,331 7.5%
CD06 34,835 12.67% 27,998 11.96% 24,425 11.6% 41,749 12.9%
CD07 36,847 13.40% 34,035 14.54% 31,543 14.9% 49,316 15.2%
TOTAL 274,927 234,087 211,111 324,098
Hispanic
Hispanic 31,532 11.5% 31,982 13.7% 25,081 11.9% 34,135 10.5%
2010
2016 2014 2012 2010
2016 2014 2012
2016
2016
2016
2014
2014
2014
Colorado Statewide Democrat Primary Election Demographics
2012
2012
2012
2010
2010
2010

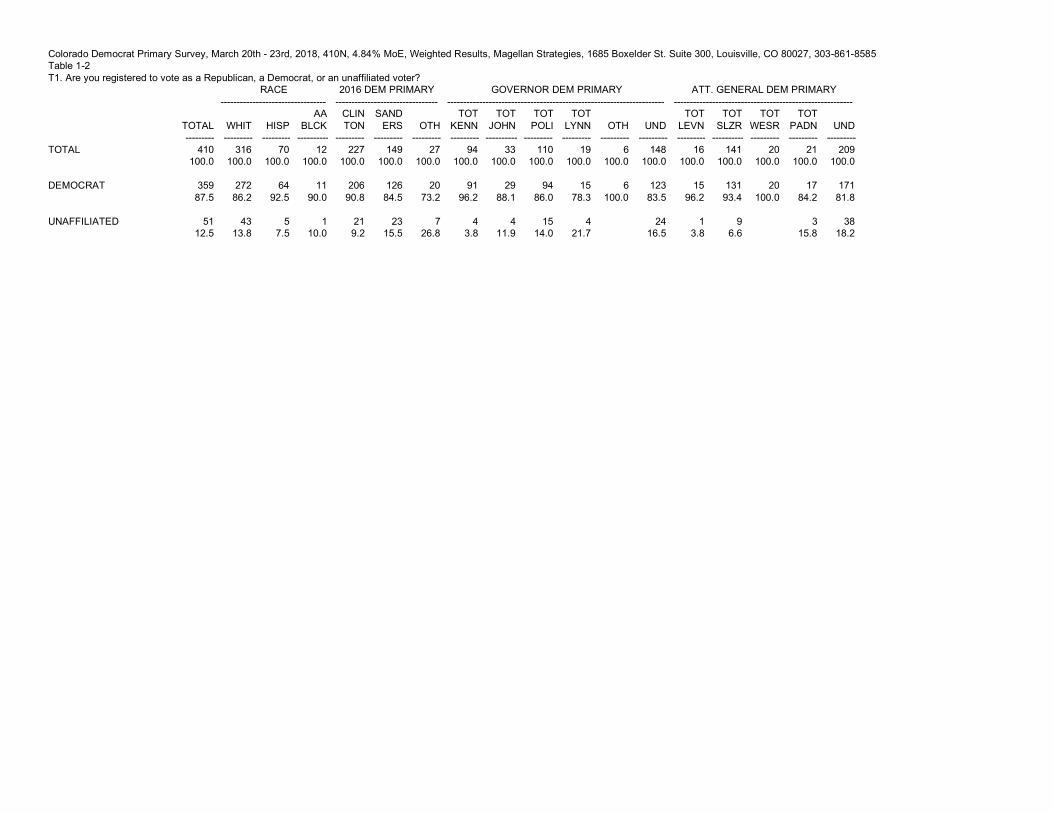
Magellan Strategies Colorado Democrat Primary Survey Topline Results Magellan Strategies are pleased to present the topline results for a 410n live survey of likely 2018 Democrat Primary voters in the state of Colorado. The interviews were conducted March 20th – 23rd, 2018. This survey has a margin of error of +/- 4.84% at the 95 percent confidence interval. This survey was weighted based upon past Democrat primary election voting demographics. T1. Are you registered to vote as a Republican, a Democrat or an unaffiliated voter? Democrat ............................................................... 87% Unaffiliated ............................................................ 13%
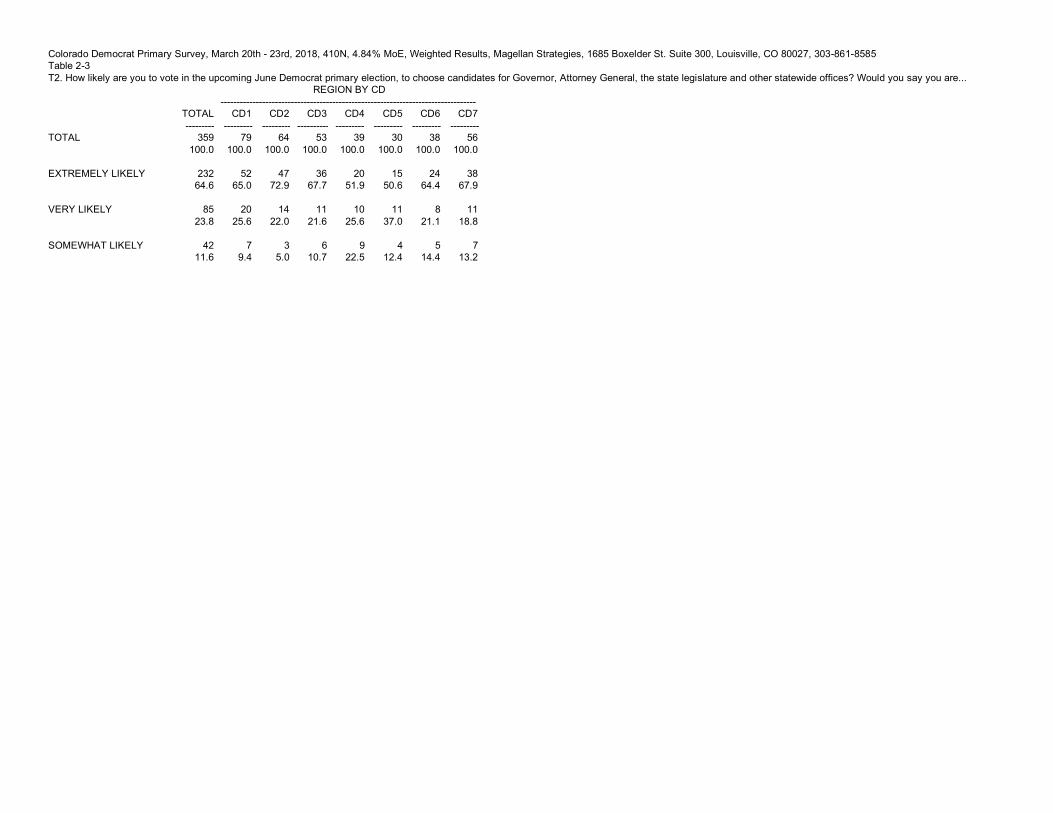
T2. How likely are you to vote in the upcoming June Democrat primary election, to choose candidates for Governor, Attorney General, the state legislature and other statewide offices? Would you say you are… Extremely Likely ..................................................... 65% Very Likely ............................................................. 24% Somewhat likely ..................................................... 11%
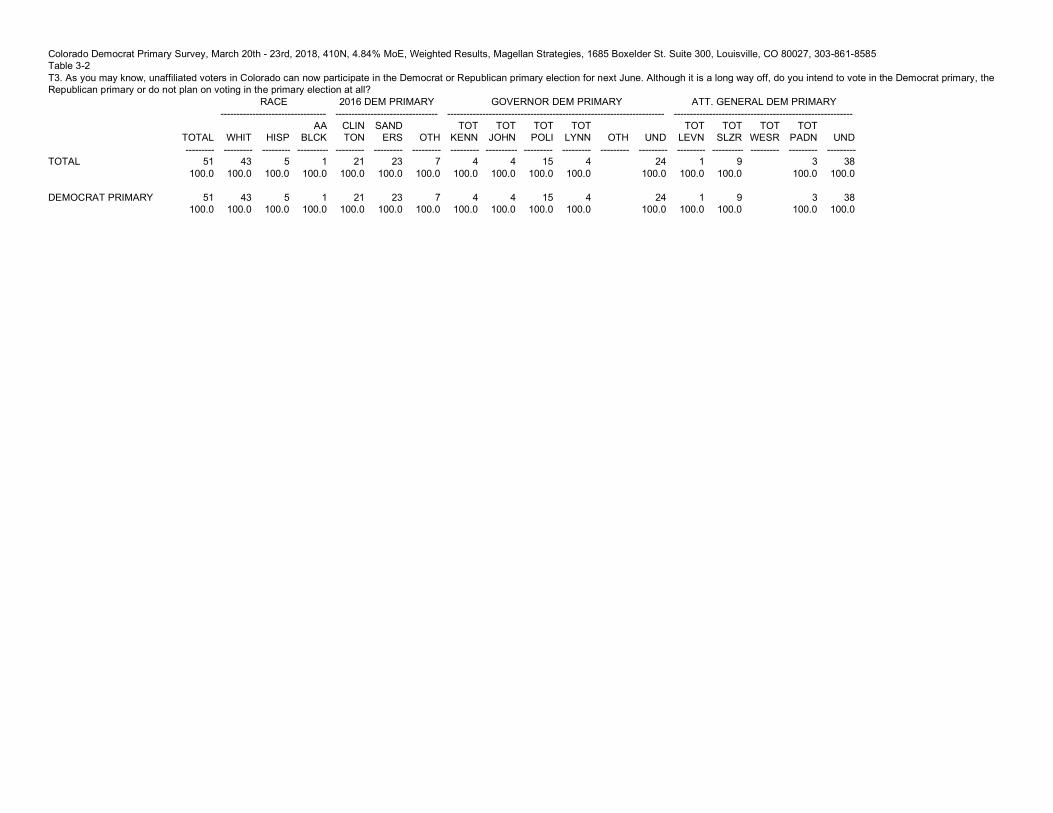
T3. As you may know, unaffiliated voters in Colorado can now participate in the Democrat or Republican primary election for next June. Although it is a long way off, do you intend to vote in the Democrat primary, the Republican primary or do not plan on voting in the primary election at all? Democrat Primary ................................................ 100%
Magellan ID#: CODEM-032018 Colorado 2018 Democrat Primary Survey Topline Results Field Dates: 3/20/18 - 3/23/18, MoE +/- 4.84%, 410n, CONFIDENTIAL
Magellan Strategies | 1685 Boxelder St. Suite 300 | Louisville, CO 80027
www.MagellanStrategies.com | (303) 861-8585
2
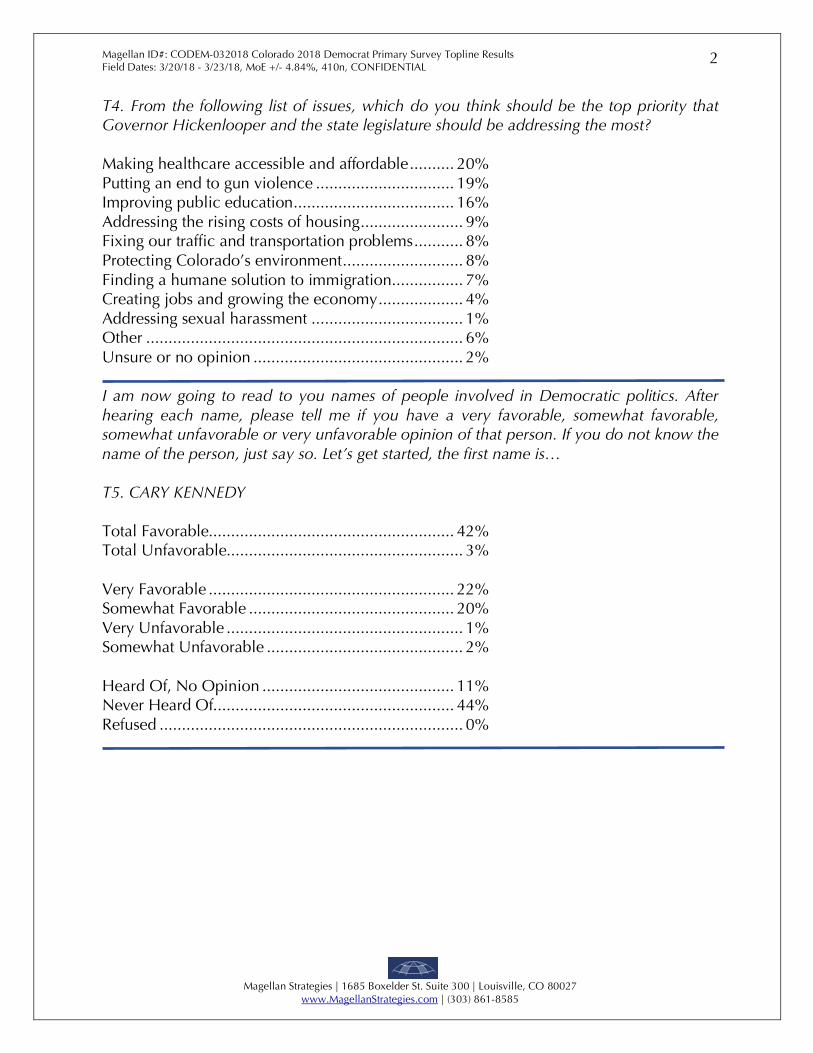
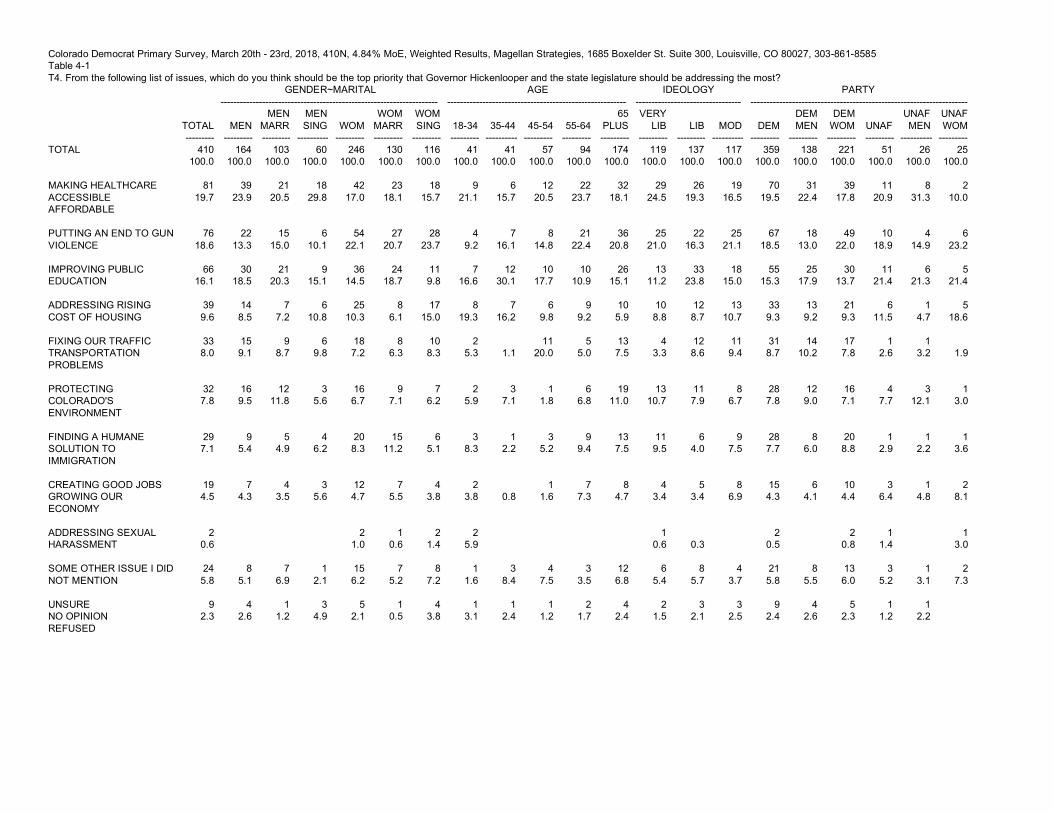
T4. From the following list of issues, which do you think should be the top priority that Governor Hickenlooper and the state legislature should be addressing the most? Making healthcare accessible and affordable .......... 20% Putting an end to gun violence ............................... 19% Improving public education .................................... 16% Addressing the rising costs of housing ....................... 9% Fixing our traffic and transportation problems ........... 8% Protecting Colorado’s environment ........................... 8% Finding a humane solution to immigration ................ 7% Creating jobs and growing the economy ................... 4% Addressing sexual harassment .................................. 1% Other ....................................................................... 6% Unsure or no opinion ............................................... 2%
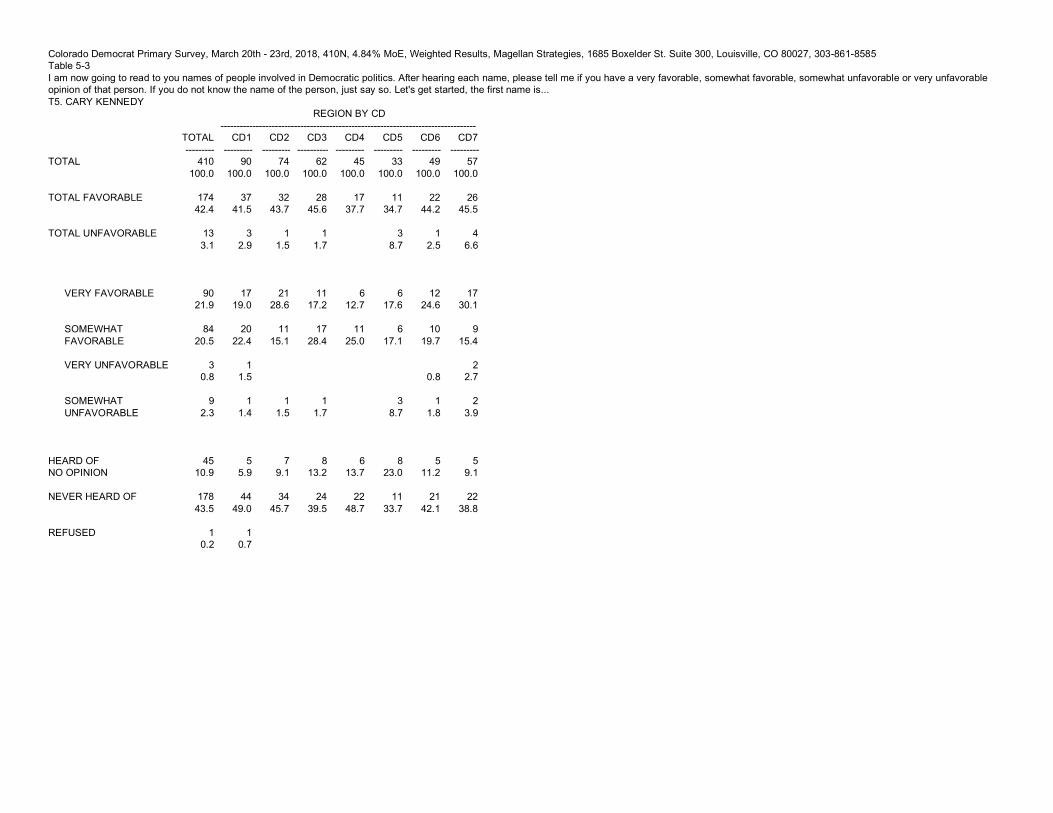
I am now going to read to you names of people involved in Democratic politics. After hearing each name, please tell me if you have a very favorable, somewhat favorable, somewhat unfavorable or very unfavorable opinion of that person. If you do not know the name of the person, just say so. Let’s get started, the first name is… T5. CARY KENNEDY Total Favorable....................................................... 42% Total Unfavorable..................................................... 3% Very Favorable ....................................................... 22% Somewhat Favorable .............................................. 20% Very Unfavorable ..................................................... 1% Somewhat Unfavorable ............................................ 2% Heard Of, No Opinion ........................................... 11% Never Heard Of...................................................... 44% Refused .................................................................... 0%
Magellan ID#: CODEM-032018 Colorado 2018 Democrat Primary Survey Topline Results Field Dates: 3/20/18 - 3/23/18, MoE +/- 4.84%, 410n, CONFIDENTIAL
Magellan Strategies | 1685 Boxelder St. Suite 300 | Louisville, CO 80027
www.MagellanStrategies.com | (303) 861-8585
3
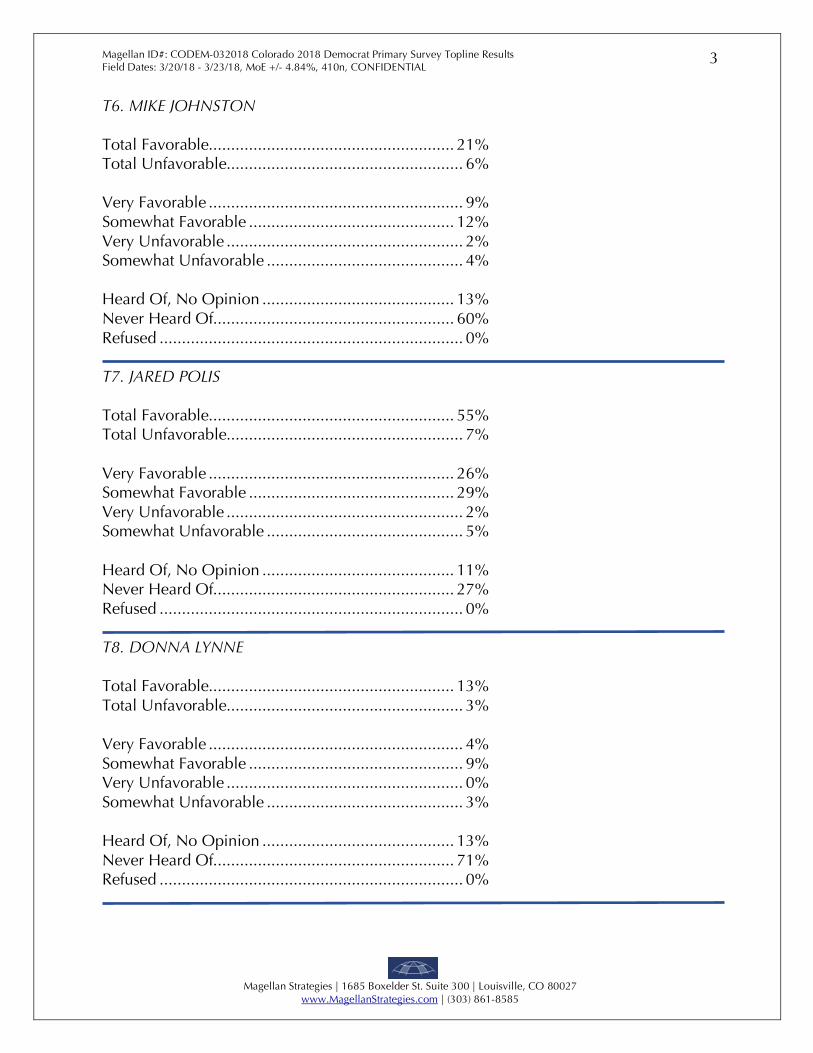
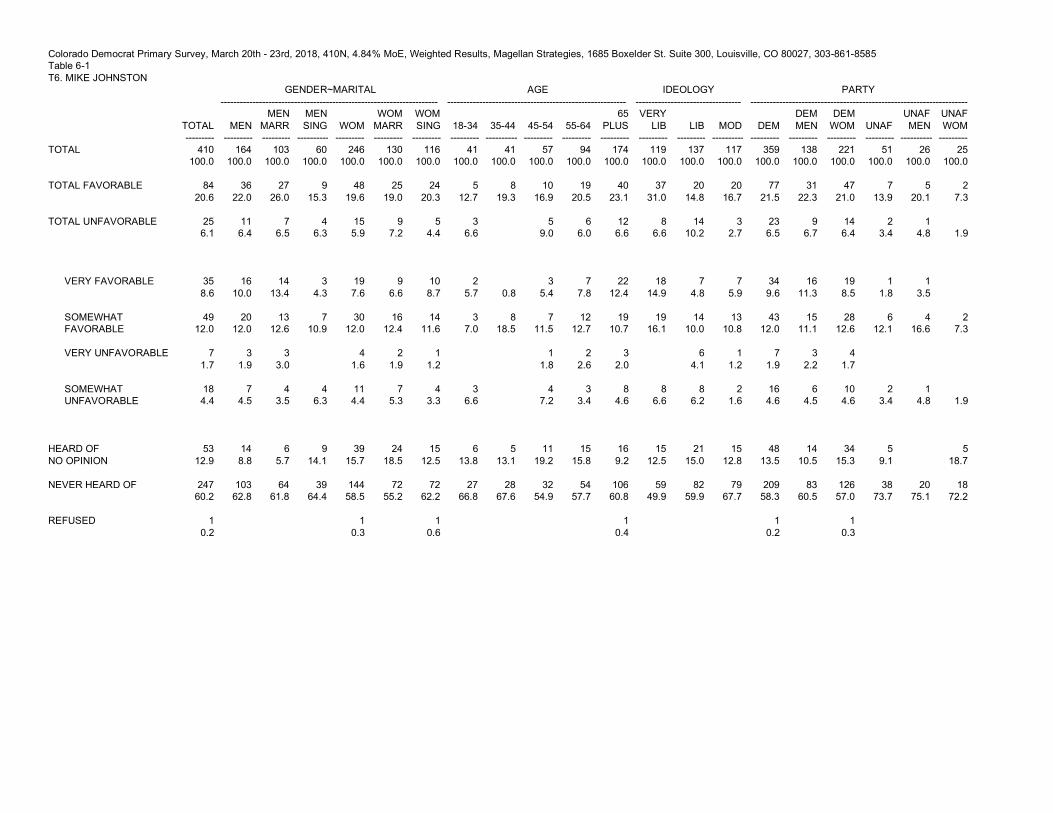
T6. MIKE JOHNSTON Total Favorable....................................................... 21% Total Unfavorable..................................................... 6% Very Favorable ......................................................... 9% Somewhat Favorable .............................................. 12% Very Unfavorable ..................................................... 2% Somewhat Unfavorable ............................................ 4% Heard Of, No Opinion ........................................... 13% Never Heard Of...................................................... 60% Refused .................................................................... 0%
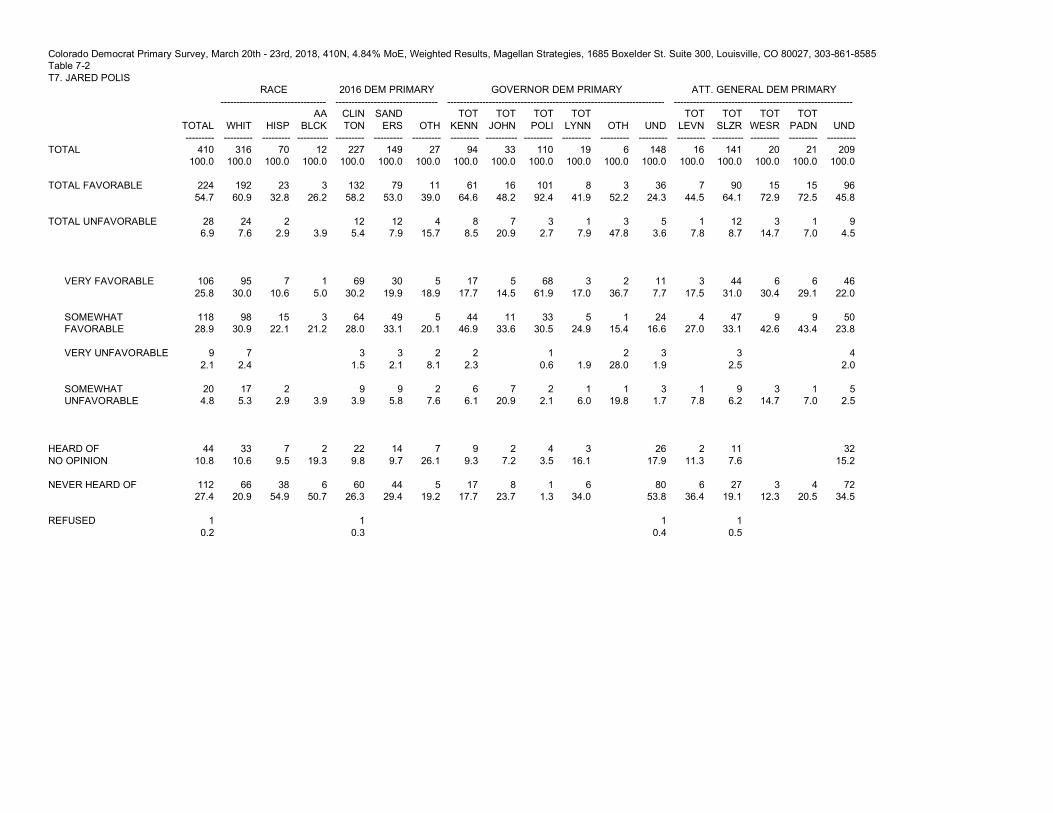
T7. JARED POLIS Total Favorable....................................................... 55% Total Unfavorable..................................................... 7% Very Favorable ....................................................... 26% Somewhat Favorable .............................................. 29% Very Unfavorable ..................................................... 2% Somewhat Unfavorable ............................................ 5% Heard Of, No Opinion ........................................... 11% Never Heard Of...................................................... 27% Refused .................................................................... 0%
T8. DONNA LYNNE Total Favorable....................................................... 13% Total Unfavorable..................................................... 3% Very Favorable ......................................................... 4% Somewhat Favorable ................................................ 9% Very Unfavorable ..................................................... 0% Somewhat Unfavorable ............................................ 3% Heard Of, No Opinion ........................................... 13% Never Heard Of...................................................... 71% Refused .................................................................... 0%
Magellan ID#: CODEM-032018 Colorado 2018 Democrat Primary Survey Topline Results Field Dates: 3/20/18 - 3/23/18, MoE +/- 4.84%, 410n, CONFIDENTIAL
Magellan Strategies | 1685 Boxelder St. Suite 300 | Louisville, CO 80027
www.MagellanStrategies.com | (303) 861-8585
4
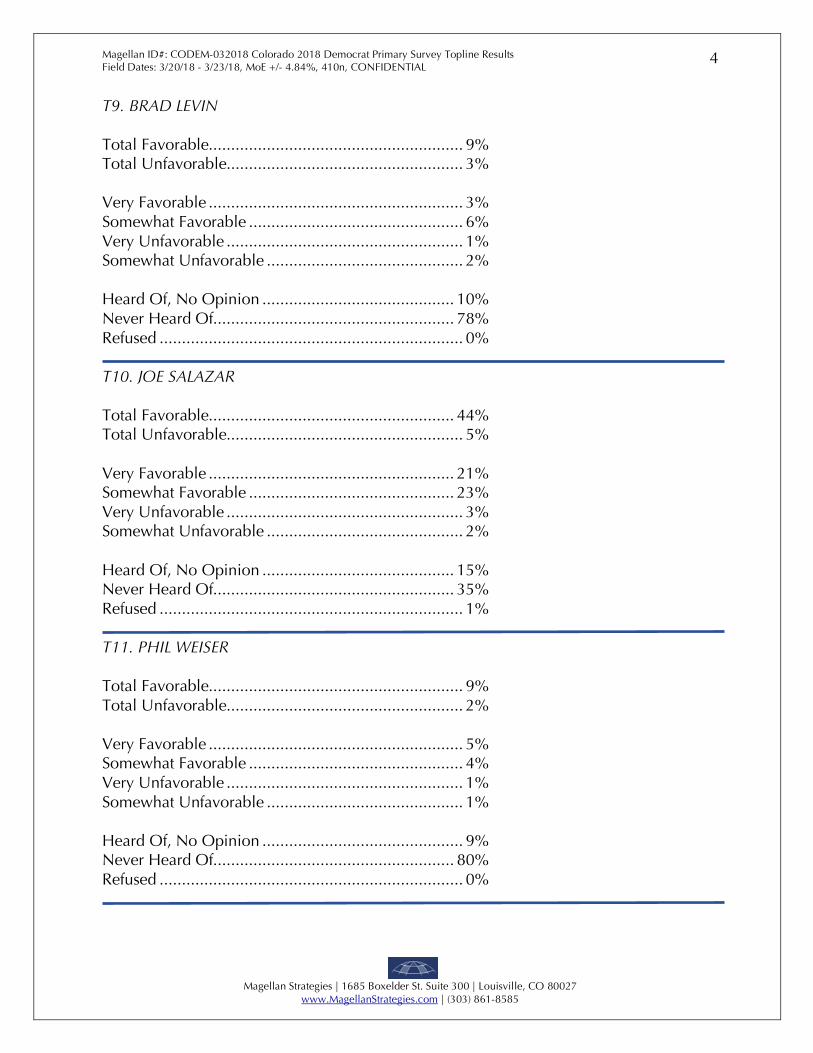
T9. BRAD LEVIN Total Favorable......................................................... 9% Total Unfavorable..................................................... 3% Very Favorable ......................................................... 3% Somewhat Favorable ................................................ 6% Very Unfavorable ..................................................... 1% Somewhat Unfavorable ............................................ 2% Heard Of, No Opinion ........................................... 10% Never Heard Of...................................................... 78% Refused .................................................................... 0%
T10. JOE SALAZAR Total Favorable....................................................... 44% Total Unfavorable..................................................... 5% Very Favorable ....................................................... 21% Somewhat Favorable .............................................. 23% Very Unfavorable ..................................................... 3% Somewhat Unfavorable ............................................ 2% Heard Of, No Opinion ........................................... 15% Never Heard Of...................................................... 35% Refused .................................................................... 1%
T11. PHIL WEISER Total Favorable......................................................... 9% Total Unfavorable..................................................... 2% Very Favorable ......................................................... 5% Somewhat Favorable ................................................ 4% Very Unfavorable ..................................................... 1% Somewhat Unfavorable ............................................ 1% Heard Of, No Opinion ............................................. 9% Never Heard Of...................................................... 80% Refused .................................................................... 0%

Magellan ID#: CODEM-032018 Colorado 2018 Democrat Primary Survey Topline Results Field Dates: 3/20/18 - 3/23/18, MoE +/- 4.84%, 410n, CONFIDENTIAL
Magellan Strategies | 1685 Boxelder St. Suite 300 | Louisville, CO 80027
www.MagellanStrategies.com | (303) 861-8585
5
T12. AMY PADDEN Total Favorable......................................................... 8% Total Unfavorable..................................................... 2% Very Favorable ......................................................... 3% Somewhat Favorable ................................................ 5% Very Unfavorable ..................................................... 1% Somewhat Unfavorable ............................................ 1% Heard Of, No Opinion ........................................... 10% Never Heard Of...................................................... 80% Refused .................................................................... 0%
T13. If the Democratic primary election for Governor were being held today, for whom would you vote if the candidates were Cary Kennedy, Mike Johnston, Jared Polis, and Donna Lynne? Total Polis .............................................................. 27% Total Kennedy ........................................................ 23% Total Johnston .......................................................... 8% Total Lynne .............................................................. 5% Definitely Polis ....................................................... 13% Probably Polis ........................................................ 14% Definitely Kennedy ................................................. 13% Probably Kennedy .................................................. 10% Definitely Johnston ................................................... 3% Probably Johnston .................................................... 5% Definitely Lynne ....................................................... 2% Probably Lynne ........................................................ 3% Other Candidate ....................................................... 1% Undecided ............................................................. 36% Refused .................................................................... 0%
Magellan ID#: CODEM-032018 Colorado 2018 Democrat Primary Survey Topline Results Field Dates: 3/20/18 - 3/23/18, MoE +/- 4.84%, 410n, CONFIDENTIAL
Magellan Strategies | 1685 Boxelder St. Suite 300 | Louisville, CO 80027
www.MagellanStrategies.com | (303) 861-8585
6
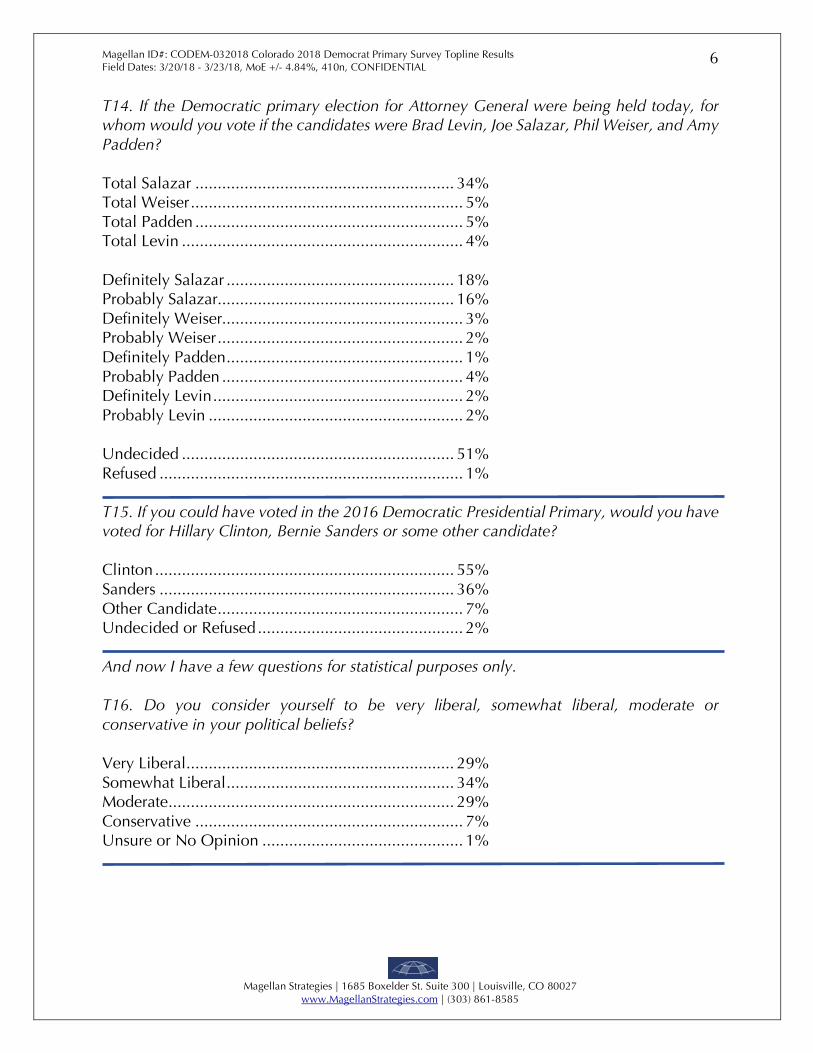
T14. If the Democratic primary election for Attorney General were being held today, for whom would you vote if the candidates were Brad Levin, Joe Salazar, Phil Weiser, and Amy Padden? Total Salazar .......................................................... 34% Total Weiser ............................................................. 5% Total Padden ............................................................ 5% Total Levin ............................................................... 4% Definitely Salazar ................................................... 18% Probably Salazar..................................................... 16% Definitely Weiser...................................................... 3% Probably Weiser ....................................................... 2% Definitely Padden ..................................................... 1% Probably Padden ...................................................... 4% Definitely Levin ........................................................ 2% Probably Levin ......................................................... 2% Undecided ............................................................. 51% Refused .................................................................... 1%
T15. If you could have voted in the 2016 Democratic Presidential Primary, would you have voted for Hillary Clinton, Bernie Sanders or some other candidate? Clinton ................................................................... 55% Sanders .................................................................. 36% Other Candidate ....................................................... 7% Undecided or Refused .............................................. 2%
And now I have a few questions for statistical purposes only. T16. Do you consider yourself to be very liberal, somewhat liberal, moderate or conservative in your political beliefs? Very Liberal ............................................................ 29% Somewhat Liberal ................................................... 34% Moderate ................................................................ 29% Conservative ............................................................ 7% Unsure or No Opinion ............................................. 1%
Magellan ID#: CODEM-032018 Colorado 2018 Democrat Primary Survey Topline Results Field Dates: 3/20/18 - 3/23/18, MoE +/- 4.84%, 410n, CONFIDENTIAL
Magellan Strategies | 1685 Boxelder St. Suite 300 | Louisville, CO 80027
www.MagellanStrategies.com | (303) 861-8585
7
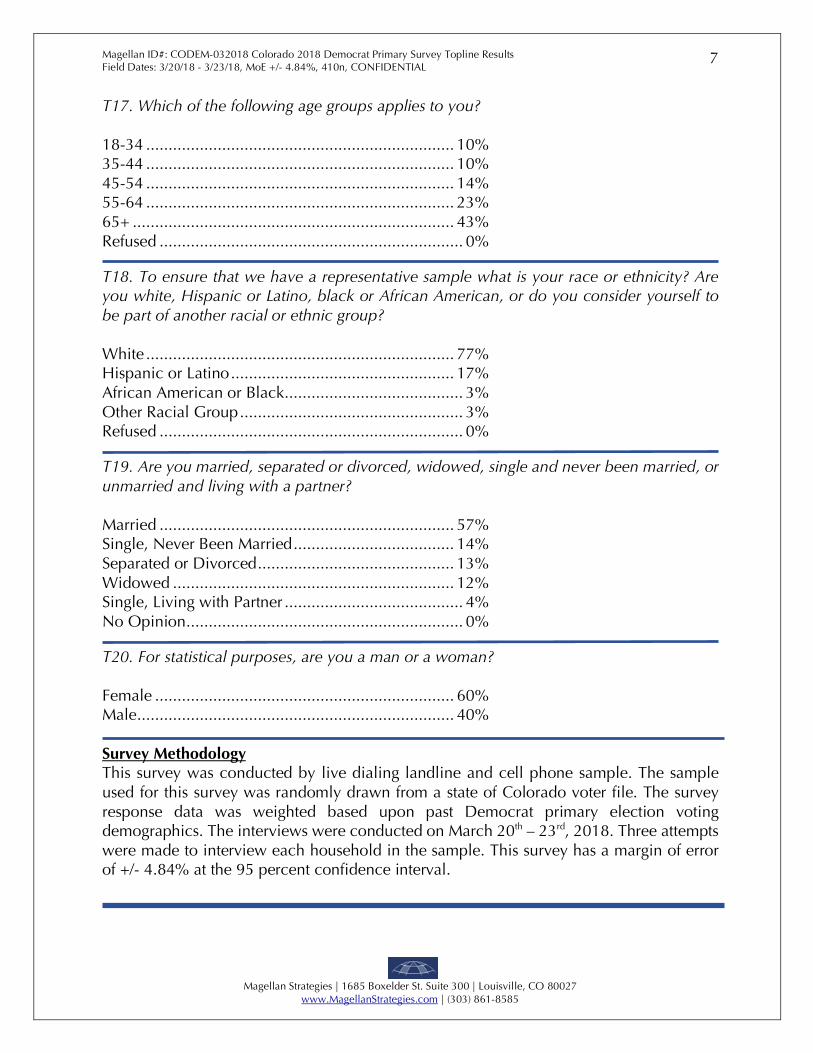
T17. Which of the following age groups applies to you? 18-34 ..................................................................... 10% 35-44 ..................................................................... 10% 45-54 ..................................................................... 14% 55-64 ..................................................................... 23% 65+ ........................................................................ 43% Refused .................................................................... 0%
T18. To ensure that we have a representative sample what is your race or ethnicity? Are you white, Hispanic or Latino, black or African American, or do you consider yourself to be part of another racial or ethnic group? White ..................................................................... 77% Hispanic or Latino .................................................. 17% African American or Black ........................................ 3% Other Racial Group .................................................. 3% Refused .................................................................... 0%
T19. Are you married, separated or divorced, widowed, single and never been married, or unmarried and living with a partner? Married .................................................................. 57% Single, Never Been Married .................................... 14% Separated or Divorced ............................................ 13% Widowed ............................................................... 12% Single, Living with Partner ........................................ 4% No Opinion .............................................................. 0%
T20. For statistical purposes, are you a man or a woman? Female ................................................................... 60% Male ....................................................................... 40%
Survey Methodology This survey was conducted by live dialing landline and cell phone sample. The sample used for this survey was randomly drawn from a state of Colorado voter file. The survey response data was weighted based upon past Democrat primary election voting demographics. The interviews were conducted on March 20th – 23rd, 2018. Three attempts were made to interview each household in the sample. This survey has a margin of error of +/- 4.84% at the 95 percent confidence interval.
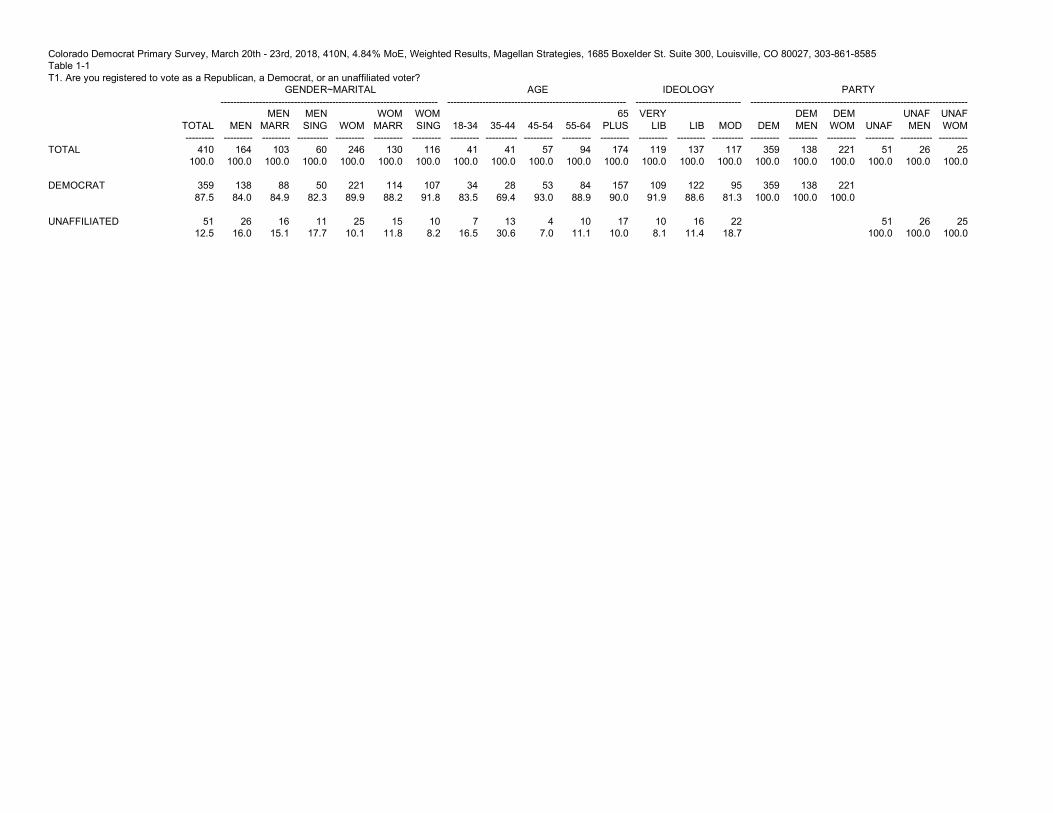
Colorado Democrat Primary Survey, March 20th - 23rd, 2018, 410N, 4.84% MoE, Weighted Results, Magellan Strategies, 1685 Boxelder St. Suite 300, Louisville, CO 80027, 303-861-8585 Table 1-1 T1. Are you registered to vote as a Republican, a Democrat, or an unaffiliated voter? GENDER~MARITAL AGE IDEOLOGY PARTY -------------------------------------------------------------------- -------------------------------------------------------- --------------------------------- --------------------------------------------------------------------
TOTAL ---------
MEN
---------
MEN MARR
---------
MEN SING
----------
WOM
---------
WOM MARR
---------
WOM SING
---------
18-34
---------
35-44
----------
45-54
---------
55-64
---------
65 PLUS
---------
VERY LIB
---------
LIB
---------
MOD
----------
DEM
---------
DEM MEN
---------
DEM WOM
---------
UNAF
---------
UNAF MEN
----------
UNAF WOM
---------
TOTAL
410 100.0
164 100.0
103 100.0
60 100.0
246 100.0
130 100.0
116 100.0
41 100.0
41 100.0
57 100.0
94 100.0
174 100.0
119 100.0
137 100.0
117 100.0
359 100.0
138 100.0
221 100.0
51 100.0
26 100.0
25 100.0
DEMOCRAT
359 87.5
138 84.0
88 84.9
50 82.3
221 89.9
114 88.2
107 91.8
34 83.5
28 69.4
53 93.0
84 88.9
157 90.0
109 91.9
122 88.6
95 81.3
359 100.0
138 100.0
221 100.0
UNAFFILIATED
51 12.5
26 16.0
16 15.1
11 17.7
25 10.1
15 11.8
10 8.2
7 16.5
13 30.6
4 7.0
10 11.1
17 10.0
10 8.1
16 11.4
22 18.7
51 100.0
26 100.0
25 100.0
Colorado Democrat Primary Survey, March 20th - 23rd, 2018, 410N, 4.84% MoE, Weighted Results, Magellan Strategies, 1685 Boxelder St. Suite 300, Louisville, CO 80027, 303-861-8585 Table 1-2 T1. Are you registered to vote as a Republican, a Democrat, or an unaffiliated voter? RACE 2016 DEM PRIMARY GOVERNOR DEM PRIMARY ATT. GENERAL DEM PRIMARY --------------------------------- -------------------------------- -------------------------------------------------------------------- --------------------------------------------------------
TOTAL ---------
WHIT
---------
HISP
---------
AA BLCK
----------
CLIN TON
---------
SAND ERS
---------
OTH
---------
TOT KENN
---------
TOT JOHN
----------
TOT POLI
---------
TOT LYNN
---------
OTH
---------
UND
---------
TOT LEVN
---------
TOT SLZR
----------
TOT WESR
---------
TOT PADN
---------
UND
---------
TOTAL
410 100.0
316 100.0
70 100.0
12 100.0
227 100.0
149 100.0
27 100.0
94 100.0
33 100.0
110 100.0
19 100.0
6 100.0
148 100.0
16 100.0
141 100.0
20 100.0
21 100.0
209 100.0
DEMOCRAT
359 87.5
272 86.2
64 92.5
11 90.0
206 90.8
126 84.5
20 73.2
91 96.2
29 88.1
94 86.0
15 78.3
6 100.0
123 83.5
15 96.2
131 93.4
20 100.0
17 84.2
171 81.8
UNAFFILIATED
51 12.5
43 13.8
5 7.5
1 10.0
21 9.2
23 15.5
7 26.8
4 3.8
4 11.9
15 14.0
4 21.7
24 16.5
1 3.8
9 6.6
3 15.8
38 18.2

Colorado Democrat Primary Survey, March 20th - 23rd, 2018, 410N, 4.84% MoE, Weighted Results, Magellan Strategies, 1685 Boxelder St. Suite 300, Louisville, CO 80027, 303-861-8585 Table 1-3 T1. Are you registered to vote as a Republican, a Democrat, or an unaffiliated voter? REGION BY CD --------------------------------------------------------------------------------
TOTAL
--------- CD1
--------- CD2
--------- CD3
---------- CD4
--------- CD5
--------- CD6
--------- CD7
---------
TOTAL
410 100.0
90 100.0
74 100.0
62 100.0
45 100.0
33 100.0
49 100.0
57 100.0
DEMOCRAT
359 87.5
79 88.1
64 87.0
53 86.2
39 86.2
30 90.2
38 76.8
56 97.2
UNAFFILIATED
51 12.5
11 11.9
10 13.0
8 13.8
6 13.8
3 9.8
11 23.2
2 2.8

Colorado Democrat Primary Survey, March 20th - 23rd, 2018, 410N, 4.84% MoE, Weighted Results, Magellan Strategies, 1685 Boxelder St. Suite 300, Louisville, CO 80027, 303-861-8585 Table 2-1 T2. How likely are you to vote in the upcoming June Democrat primary election, to choose candidates for Governor, Attorney General, the state legislature and other statewide offices? Would you say you are... GENDER~MARITAL AGE IDEOLOGY PARTY -------------------------------------------------------------------- -------------------------------------------------------- --------------------------------- --------------------------------------------------------------------
TOTAL ---------
MEN
---------
MEN MARR
---------
MEN SING
----------
WOM
---------
WOM MARR
---------
WOM SING
---------
18-34
---------
35-44
----------
45-54
---------
55-64
---------
65 PLUS
---------
VERY LIB
---------
LIB
---------
MOD
----------
DEM
---------
DEM MEN
---------
DEM WOM
---------
UNAF
---------
UNAF MEN
----------
UNAF WOM
---------
TOTAL
359 100.0
138 100.0
88 100.0
50 100.0
221 100.0
114 100.0
107 100.0
34 100.0
28 100.0
53 100.0
84 100.0
157 100.0
109 100.0
122 100.0
95 100.0
359 100.0
138 100.0
221 100.0
EXTREMELY LIKELY
232 64.6
83 60.0
57 64.8
26 51.5
149 67.5
74 64.3
76 70.8
13 39.4
15 54.3
35 65.8
54 64.3
112 71.7
75 68.4
78 64.1
65 67.9
232 64.6
83 60.0
149 67.5
VERY LIKELY
85 23.8
35 25.6
20 23.0
15 30.1
50 22.7
30 26.3
20 18.8
13 37.4
9 33.2
10 18.9
19 23.0
34 21.5
29 26.5
31 25.2
16 17.1
85 23.8
35 25.6
50 22.7
SOMEWHAT LIKELY
42 11.6
20 14.4
11 12.2
9 18.3
22 9.9
11 9.4
11 10.4
8 23.2
4 12.5
8 15.2
11 12.6
11 6.8
6 5.2
13 10.7
14 15.0
42 11.6
20 14.4
22 9.9

Colorado Democrat Primary Survey, March 20th - 23rd, 2018, 410N, 4.84% MoE, Weighted Results, Magellan Strategies, 1685 Boxelder St. Suite 300, Louisville, CO 80027, 303-861-8585 Table 2-2 T2. How likely are you to vote in the upcoming June Democrat primary election, to choose candidates for Governor, Attorney General, the state legislature and other statewide offices? Would you say you are... RACE 2016 DEM PRIMARY GOVERNOR DEM PRIMARY ATT. GENERAL DEM PRIMARY --------------------------------- -------------------------------- -------------------------------------------------------------------- --------------------------------------------------------
TOTAL ---------
WHIT
---------
HISP
---------
AA BLCK
----------
CLIN TON
---------
SAND ERS
---------
OTH
---------
TOT KENN
---------
TOT JOHN
----------
TOT POLI
---------
TOT LYNN
---------
OTH
---------
UND
---------
TOT LEVN
---------
TOT SLZR
----------
TOT WESR
---------
TOT PADN
---------
UND
---------
TOTAL
359 100.0
272 100.0
64 100.0
11 100.0
206 100.0
126 100.0
20 100.0
91 100.0
29 100.0
94 100.0
15 100.0
6 100.0
123 100.0
15 100.0
131 100.0
20 100.0
17 100.0
171 100.0
EXTREMELY LIKELY
232 64.6
182 66.9
37 57.1
6 51.0
140 67.7
76 60.1
13 64.2
64 70.9
21 73.6
68 72.0
7 45.6
4 65.7
67 54.0
9 58.7
84 64.2
17 83.2
12 67.6
107 62.3
VERY LIKELY
85 23.8
62 22.8
19 29.4
3 24.8
47 22.7
32 25.4
4 18.2
21 22.9
4 14.5
21 21.8
3 20.8
2 34.3
35 28.4
4 29.4
35 26.6
2 8.0
1 8.2
43 25.0
SOMEWHAT LIKELY
42 11.6
28 10.4
9 13.6
3 24.2
20 9.6
18 14.5
4 17.7
6 6.2
3 11.9
6 6.2
5 33.6
22 17.7
2 11.9
12 9.2
2 8.8
4 24.1
22 12.7
Colorado Democrat Primary Survey, March 20th - 23rd, 2018, 410N, 4.84% MoE, Weighted Results, Magellan Strategies, 1685 Boxelder St. Suite 300, Louisville, CO 80027, 303-861-8585 Table 2-3 T2. How likely are you to vote in the upcoming June Democrat primary election, to choose candidates for Governor, Attorney General, the state legislature and other statewide offices? Would you say you are... REGION BY CD --------------------------------------------------------------------------------
TOTAL
--------- CD1
--------- CD2
--------- CD3
---------- CD4
--------- CD5
--------- CD6
--------- CD7
---------
TOTAL
359 100.0
79 100.0
64 100.0
53 100.0
39 100.0
30 100.0
38 100.0
56 100.0
EXTREMELY LIKELY
232 64.6
52 65.0
47 72.9
36 67.7
20 51.9
15 50.6
24 64.4
38 67.9
VERY LIKELY
85 23.8
20 25.6
14 22.0
11 21.6
10 25.6
11 37.0
8 21.1
11 18.8
SOMEWHAT LIKELY
42 11.6
7 9.4
3 5.0
6 10.7
9 22.5
4 12.4
5 14.4
7 13.2

Colorado Democrat Primary Survey, March 20th - 23rd, 2018, 410N, 4.84% MoE, Weighted Results, Magellan Strategies, 1685 Boxelder St. Suite 300, Louisville, CO 80027, 303-861-8585 Table 3-1 T3. As you may know, unaffiliated voters in Colorado can now participate in the Democrat or Republican primary election for next June. Although it is a long way off, do you intend to vote in the Democrat primary, the Republican primary or do not plan on voting in the primary election at all? GENDER~MARITAL AGE IDEOLOGY PARTY -------------------------------------------------------------------- -------------------------------------------------------- --------------------------------- --------------------------------------------------------------------
TOTAL ---------
MEN
---------
MEN MARR
---------
MEN SING
----------
WOM
---------
WOM MARR
---------
WOM SING
---------
18-34
---------
35-44
----------
45-54
---------
55-64
---------
65 PLUS
---------
VERY LIB
---------
LIB
---------
MOD
----------
DEM
---------
DEM MEN
---------
DEM WOM
---------
UNAF
---------
UNAF MEN
----------
UNAF WOM
---------
TOTAL
51 100.0
26 100.0
16 100.0
11 100.0
25 100.0
15 100.0
10 100.0
7 100.0
13 100.0
4 100.0
10 100.0
17 100.0
10 100.0
16 100.0
22 100.0
51 100.0
26 100.0
25 100.0
DEMOCRAT PRIMARY
51 100.0
26 100.0
16 100.0
11 100.0
25 100.0
15 100.0
10 100.0
7 100.0
13 100.0
4 100.0
10 100.0
17 100.0
10 100.0
16 100.0
22 100.0
51 100.0
26 100.0
25 100.0
Colorado Democrat Primary Survey, March 20th - 23rd, 2018, 410N, 4.84% MoE, Weighted Results, Magellan Strategies, 1685 Boxelder St. Suite 300, Louisville, CO 80027, 303-861-8585 Table 3-2 T3. As you may know, unaffiliated voters in Colorado can now participate in the Democrat or Republican primary election for next June. Although it is a long way off, do you intend to vote in the Democrat primary, the Republican primary or do not plan on voting in the primary election at all? RACE 2016 DEM PRIMARY GOVERNOR DEM PRIMARY ATT. GENERAL DEM PRIMARY --------------------------------- -------------------------------- -------------------------------------------------------------------- --------------------------------------------------------
TOTAL ---------
WHIT
---------
HISP
---------
AA BLCK
----------
CLIN TON
---------
SAND ERS
---------
OTH
---------
TOT KENN
---------
TOT JOHN
----------
TOT POLI
---------
TOT LYNN
---------
OTH
---------
UND
---------
TOT LEVN
---------
TOT SLZR
----------
TOT WESR
---------
TOT PADN
---------
UND
---------
TOTAL
51 100.0
43 100.0
5 100.0
1 100.0
21 100.0
23 100.0
7 100.0
4 100.0
4 100.0
15 100.0
4 100.0
24 100.0
1 100.0
9 100.0
3 100.0
38 100.0
DEMOCRAT PRIMARY
51 100.0
43 100.0
5 100.0
1 100.0
21 100.0
23 100.0
7 100.0
4 100.0
4 100.0
15 100.0
4 100.0
24 100.0
1 100.0
9 100.0
3 100.0
38 100.0

Colorado Democrat Primary Survey, March 20th - 23rd, 2018, 410N, 4.84% MoE, Weighted Results, Magellan Strategies, 1685 Boxelder St. Suite 300, Louisville, CO 80027, 303-861-8585 Table 3-3 T3. As you may know, unaffiliated voters in Colorado can now participate in the Democrat or Republican primary election for next June. Although it is a long way off, do you intend to vote in the Democrat primary, the Republican primary or do not plan on voting in the primary election at all? REGION BY CD --------------------------------------------------------------------------------
TOTAL
--------- CD1
--------- CD2
--------- CD3
---------- CD4
--------- CD5
--------- CD6
--------- CD7
---------
TOTAL
51 100.0
11 100.0
10 100.0
8 100.0
6 100.0
3 100.0
11 100.0
2 100.0
DEMOCRAT PRIMARY
51 100.0
11 100.0
10 100.0
8 100.0
6 100.0
3 100.0
11 100.0
2 100.0
Colorado Democrat Primary Survey, March 20th - 23rd, 2018, 410N, 4.84% MoE, Weighted Results, Magellan Strategies, 1685 Boxelder St. Suite 300, Louisville, CO 80027, 303-861-8585 Table 4-1 T4. From the following list of issues, which do you think should be the top priority that Governor Hickenlooper and the state legislature should be addressing the most? GENDER~MARITAL AGE IDEOLOGY PARTY -------------------------------------------------------------------- -------------------------------------------------------- --------------------------------- --------------------------------------------------------------------
TOTAL ---------
MEN
---------
MEN MARR
---------
MEN SING
----------
WOM
---------
WOM MARR
---------
WOM SING
---------
18-34
---------
35-44
----------
45-54
---------
55-64
---------
65 PLUS
---------
VERY LIB
---------
LIB
---------
MOD
----------
DEM
---------
DEM MEN
---------
DEM WOM
---------
UNAF
---------
UNAF MEN
----------
UNAF WOM
---------
TOTAL
410 100.0
164 100.0
103 100.0
60 100.0
246 100.0
130 100.0
116 100.0
41 100.0
41 100.0
57 100.0
94 100.0
174 100.0
119 100.0
137 100.0
117 100.0
359 100.0
138 100.0
221 100.0
51 100.0
26 100.0
25 100.0
MAKING HEALTHCARE ACCESSIBLE AFFORDABLE
81 19.7
39 23.9
21 20.5
18 29.8
42 17.0
23 18.1
18 15.7
9 21.1
6 15.7
12 20.5
22 23.7
32 18.1
29 24.5
26 19.3
19 16.5
70 19.5
31 22.4
39 17.8
11 20.9
8 31.3
2 10.0
PUTTING AN END TO GUN VIOLENCE
76 18.6
22 13.3
15 15.0
6 10.1
54 22.1
27 20.7
28 23.7
4 9.2
7 16.1
8 14.8
21 22.4
36 20.8
25 21.0
22 16.3
25 21.1
67 18.5
18 13.0
49 22.0
10 18.9
4 14.9
6 23.2
IMPROVING PUBLIC EDUCATION
66 16.1
30 18.5
21 20.3
9 15.1
36 14.5
24 18.7
11 9.8
7 16.6
12 30.1
10 17.7
10 10.9
26 15.1
13 11.2
33 23.8
18 15.0
55 15.3
25 17.9
30 13.7
11 21.4
6 21.3
5 21.4
ADDRESSING RISING COST OF HOUSING
39 9.6
14 8.5
7 7.2
6 10.8
25 10.3
8 6.1
17 15.0
8 19.3
7 16.2
6 9.8
9 9.2
10 5.9
10 8.8
12 8.7
13 10.7
33 9.3
13 9.2
21 9.3
6 11.5
1 4.7
5 18.6
FIXING OUR TRAFFIC TRANSPORTATION PROBLEMS
33 8.0
15 9.1
9 8.7
6 9.8
18 7.2
8 6.3
10 8.3
2 5.3
1.1
11 20.0
5 5.0
13 7.5
4 3.3
12 8.6
11 9.4
31 8.7
14 10.2
17 7.8
1 2.6
1 3.2
1.9
PROTECTING COLORADO'S ENVIRONMENT
32 7.8
16 9.5
12 11.8
3 5.6
16 6.7
9 7.1
7 6.2
2 5.9
3 7.1
1 1.8
6 6.8
19 11.0
13 10.7
11 7.9
8 6.7
28 7.8
12 9.0
16 7.1
4 7.7
3 12.1
1 3.0
FINDING A HUMANE SOLUTION TO IMMIGRATION
29 7.1
9 5.4
5 4.9
4 6.2
20 8.3
15 11.2
6 5.1
3 8.3
1 2.2
3 5.2
9 9.4
13 7.5
11 9.5
6 4.0
9 7.5
28 7.7
8 6.0
20 8.8
1 2.9
1 2.2
1 3.6
CREATING GOOD JOBS GROWING OUR ECONOMY
19 4.5
7 4.3
4 3.5
3 5.6
12 4.7
7 5.5
4 3.8
2 3.8
0.8
1 1.6
7 7.3
8 4.7
4 3.4
5 3.4
8 6.9
15 4.3
6 4.1
10 4.4
3 6.4
1 4.8
2 8.1
ADDRESSING SEXUAL HARASSMENT
2 0.6
2 1.0
1 0.6
2 1.4
2 5.9
1 0.6
0.3
2 0.5
2 0.8
1 1.4
1 3.0
SOME OTHER ISSUE I DID NOT MENTION
24 5.8
8 5.1
7 6.9
1 2.1
15 6.2
7 5.2
8 7.2
1 1.6
3 8.4
4 7.5
3 3.5
12 6.8
6 5.4
8 5.7
4 3.7
21 5.8
8 5.5
13 6.0
3 5.2
1 3.1
2 7.3
UNSURE NO OPINION REFUSED
9 2.3
4 2.6
1 1.2
3 4.9
5 2.1
1 0.5
4 3.8
1 3.1
1 2.4
1 1.2
2 1.7
4 2.4
2 1.5
3 2.1
3 2.5
9 2.4
4 2.6
5 2.3
1 1.2
1 2.2

Colorado Democrat Primary Survey, March 20th - 23rd, 2018, 410N, 4.84% MoE, Weighted Results, Magellan Strategies, 1685 Boxelder St. Suite 300, Louisville, CO 80027, 303-861-8585 Table 4-2 T4. From the following list of issues, which do you think should be the top priority that Governor Hickenlooper and the state legislature should be addressing the most? RACE 2016 DEM PRIMARY GOVERNOR DEM PRIMARY ATT. GENERAL DEM PRIMARY --------------------------------- -------------------------------- -------------------------------------------------------------------- --------------------------------------------------------
TOTAL ---------
WHIT
---------
HISP
---------
AA BLCK
----------
CLIN TON
---------
SAND ERS
---------
OTH
---------
TOT KENN
---------
TOT JOHN
----------
TOT POLI
---------
TOT LYNN
---------
OTH
---------
UND
---------
TOT LEVN
---------
TOT SLZR
----------
TOT WESR
---------
TOT PADN
---------
UND
---------
TOTAL
410 100.0
316 100.0
70 100.0
12 100.0
227 100.0
149 100.0
27 100.0
94 100.0
33 100.0
110 100.0
19 100.0
6 100.0
148 100.0
16 100.0
141 100.0
20 100.0
21 100.0
209 100.0
MAKING HEALTHCARE ACCESSIBLE AFFORDABLE
81 19.7
63 19.9
14 20.3
2 19.4
48 21.1
26 17.4
4 16.5
19 20.7
7 21.9
25 23.2
3 15.7
2 37.7
24 16.1
4 24.4
34 24.4
7 36.3
2 8.2
34 16.0
PUTTING AN END TO GUN VIOLENCE
76 18.6
63 20.0
8 11.4
4 29.2
46 20.1
29 19.7
1 4.2
21 22.0
6 16.9
22 20.3
3 16.3
2 34.3
22 14.7
4 28.3
24 17.3
1 5.3
4 17.8
42 19.9
IMPROVING PUBLIC EDUCATION
66 16.1
52 16.6
10 14.2
1 7.2
39 17.0
23 15.7
3 12.1
16 16.8
6 17.2
21 18.8
4 22.5
19 12.9
2 14.9
22 15.8
6 29.4
5 26.4
29 13.9
ADDRESSING RISING COST OF HOUSING
39 9.6
25 7.8
10 15.1
3 20.4
16 6.8
22 14.6
2 6.9
7 7.6
3 9.8
10 9.0
1 5.3
18 12.2
2 12.9
14 9.7
1 6.9
2 9.2
20 9.7
FIXING OUR TRAFFIC TRANSPORTATION PROBLEMS
33 8.0
25 7.9
6 8.3
1 8.4
16 7.0
11 7.6
5 18.2
7 7.4
6 18.0
6 5.5
1.9
2 28.0
12 8.1
13 8.9
1 5.5
2 11.9
17 7.9
PROTECTING COLORADO'S ENVIRONMENT
32 7.8
27 8.6
4 5.2
15 6.4
16 10.8
9 9.9
1 3.2
7 6.0
1 5.3
14 9.5
3.1
13 9.4
2 8.8
16 7.8
FINDING A HUMANE SOLUTION TO IMMIGRATION
29 7.1
20 6.5
8 11.7
1.8
16 7.2
8 5.3
5 18.1
3 3.1
1 4.2
9 8.6
1 6.3
14 9.7
2 10.2
12 8.4
1 5.4
1 5.6
14 6.5
CREATING GOOD JOBS GROWING OUR ECONOMY
19 4.5
13 4.0
4 5.4
1 9.7
10 4.4
5 3.4
4 13.3
2 1.8
1 4.3
3 2.9
4 23.8
8 5.4
1 6.2
4 2.6
1 6.7
2 9.0
11 5.1
ADDRESSING SEXUAL HARASSMENT
2 0.6
1 0.2
1 1.9
2 0.7
1 0.5
1 1.4
1 1.0
2 1.2
SOME OTHER ISSUE I DID NOT MENTION
24 5.8
19 6.0
5 6.6
14 6.4
6 4.2
3 10.8
8 8.9
1 4.5
3 3.0
10 7.1
4 2.6
1 4.4
1 3.1
17 8.2
UNSURE NO OPINION REFUSED
9 2.3
8 2.5
3.9
6 2.8
1 0.8
0.5
2 1.8
1 2.9
6 4.3
1 0.9
8 3.8

Colorado Democrat Primary Survey, March 20th - 23rd, 2018, 410N, 4.84% MoE, Weighted Results, Magellan Strategies, 1685 Boxelder St. Suite 300, Louisville, CO 80027, 303-861-8585 Table 4-3 T4. From the following list of issues, which do you think should be the top priority that Governor Hickenlooper and the state legislature should be addressing the most? REGION BY CD --------------------------------------------------------------------------------
TOTAL
--------- CD1
--------- CD2
--------- CD3
---------- CD4
--------- CD5
--------- CD6
--------- CD7
---------
TOTAL
410 100.0
90 100.0
74 100.0
62 100.0
45 100.0
33 100.0
49 100.0
57 100.0
MAKING HEALTHCARE ACCESSIBLE AFFORDABLE
81 19.7
17 19.0
13 17.6
19 31.7
8 17.2
6 19.1
8 16.4
9 15.9
PUTTING AN END TO GUN VIOLENCE
76 18.6
18 20.4
15 19.9
7 10.9
11 23.3
4 13.1
12 23.6
10 17.4
IMPROVING PUBLIC EDUCATION
66 16.1
17 19.4
14 18.6
11 17.2
5 10.1
1.2
7 15.0
12 20.3
ADDRESSING RISING COST OF HOUSING
39 9.6
11 11.8
2 2.8
4 6.0
4 8.4
5 14.0
6 12.7
8 14.2
FIXING OUR TRAFFIC TRANSPORTATION PROBLEMS
33 8.0
9 9.7
5 7.4
3 4.2
3 7.1
4 12.5
5 9.9
4 6.4
PROTECTING COLORADO'S ENVIRONMENT
32 7.8
4 4.3
12 16.5
4 5.8
6 12.8
2 4.1
5 8.1
FINDING A HUMANE SOLUTION TO IMMIGRATION
29 7.1
6 7.1
5 6.2
8 12.2
5 10.0
2 5.4
3 5.9
2 2.7
CREATING GOOD JOBS GROWING OUR ECONOMY
19 4.5
2 2.3
2 3.0
3 4.2
1 2.0
5 15.0
3 5.2
3 6.0
ADDRESSING SEXUAL HARASSMENT
2 0.6
1 1.5
1 4.0
SOME OTHER ISSUE I DID NOT MENTION
24 5.8
3 3.6
4 5.6
4 5.7
5 15.7
2 4.8
5 9.0
UNSURE NO OPINION REFUSED
9 2.3
2 2.3
1 0.9
1 2.1
4 9.0
1 2.4

Colorado Democrat Primary Survey, March 20th - 23rd, 2018, 410N, 4.84% MoE, Weighted Results, Magellan Strategies, 1685 Boxelder St. Suite 300, Louisville, CO 80027, 303-861-8585 Table 5-1 I am now going to read to you names of people involved in Democratic politics. After hearing each name, please tell me if you have a very favorable, somewhat favorable, somewhat unfavorable or very unfavorable opinion of that person. If you do not know the name of the person, just say so. Let's get started, the first name is... T5. CARY KENNEDY GENDER~MARITAL AGE IDEOLOGY PARTY -------------------------------------------------------------------- -------------------------------------------------------- --------------------------------- --------------------------------------------------------------------
TOTAL ---------
MEN
---------
MEN MARR
---------
MEN SING
----------
WOM
---------
WOM MARR
---------
WOM SING
---------
18-34
---------
35-44
----------
45-54
---------
55-64
---------
65 PLUS
---------
VERY LIB
---------
LIB
---------
MOD
----------
DEM
---------
DEM MEN
---------
DEM WOM
---------
UNAF
---------
UNAF MEN
----------
UNAF WOM
---------
TOTAL
410 100.0
164 100.0
103 100.0
60 100.0
246 100.0
130 100.0
116 100.0
41 100.0
41 100.0
57 100.0
94 100.0
174 100.0
119 100.0
137 100.0
117 100.0
359 100.0
138 100.0
221 100.0
51 100.0
26 100.0
25 100.0
TOTAL FAVORABLE
174 42.4
63 38.3
44 42.6
19 31.2
111 45.2
63 48.6
48 41.4
9 22.4
7 16.0
33 56.9
38 40.4
86 49.4
64 53.9
53 38.5
49 41.4
163 45.3
59 43.1
103 46.7
11 22.2
3 13.0
8 31.8
TOTAL UNFAVORABLE
13 3.1
6 3.6
4 4.0
2 2.9
7 2.7
3 2.4
4 3.1
1 1.7
3 7.1
0.6
3 3.3
5 2.8
4 3.1
7 5.3
1 0.9
10 2.7
4 3.1
6 2.5
3 5.4
2 6.3
1 4.5
VERY FAVORABLE
90 21.9
35 21.6
28 27.1
7 12.2
54 22.1
31 23.6
24 20.4
4 8.8
4 9.4
16 27.4
19 19.7
47 27.1
41 34.6
31 22.5
15 13.2
87 24.1
33 24.1
53 24.2
3 6.0
2 8.3
1 3.6
SOMEWHAT FAVORABLE
84 20.5
27 16.7
16 15.5
11 18.9
57 23.1
32 25.0
24 21.0
6 13.7
3 6.6
17 29.5
19 20.7
39 22.4
23 19.4
22 15.9
33 28.2
76 21.2
26 19.0
50 22.5
8 16.1
1 4.8
7 28.2
VERY UNFAVORABLE
3 0.8
2 1.2
2 1.8
1 0.6
1 1.1
1.2
0.4
2 1.4
2 1.6
1 1.0
3 0.9
2 1.4
1 0.6
SOMEWHAT UNFAVORABLE
9 2.3
4 2.4
2 2.2
2 2.9
5 2.2
2 1.4
4 3.1
0.5
3 7.1
0.6
3 2.9
2 1.4
2 1.6
6 4.3
1 0.9
7 1.8
2 1.7
4 1.9
3 5.4
2 6.3
1 4.5
HEARD OF NO OPINION
45 10.9
14 8.7
7 7.0
7 11.8
30 12.3
16 12.0
15 12.6
3 7.1
4 8.9
4 6.6
10 10.9
24 13.7
12 10.4
11 7.8
18 15.3
38 10.5
12 8.9
25 11.4
7 13.6
2 7.9
5 19.6
NEVER HEARD OF
178 43.5
81 49.4
48 46.4
33 54.2
97 39.5
48 37.0
49 42.4
28 68.7
28 68.0
21 35.8
43 45.3
59 33.8
39 32.5
67 48.5
50 42.4
148 41.3
62 44.9
86 39.0
30 58.8
19 72.8
11 44.1
REFUSED
1 0.2
1 0.3
1 0.6
1 0.4
1 0.2
1 0.3
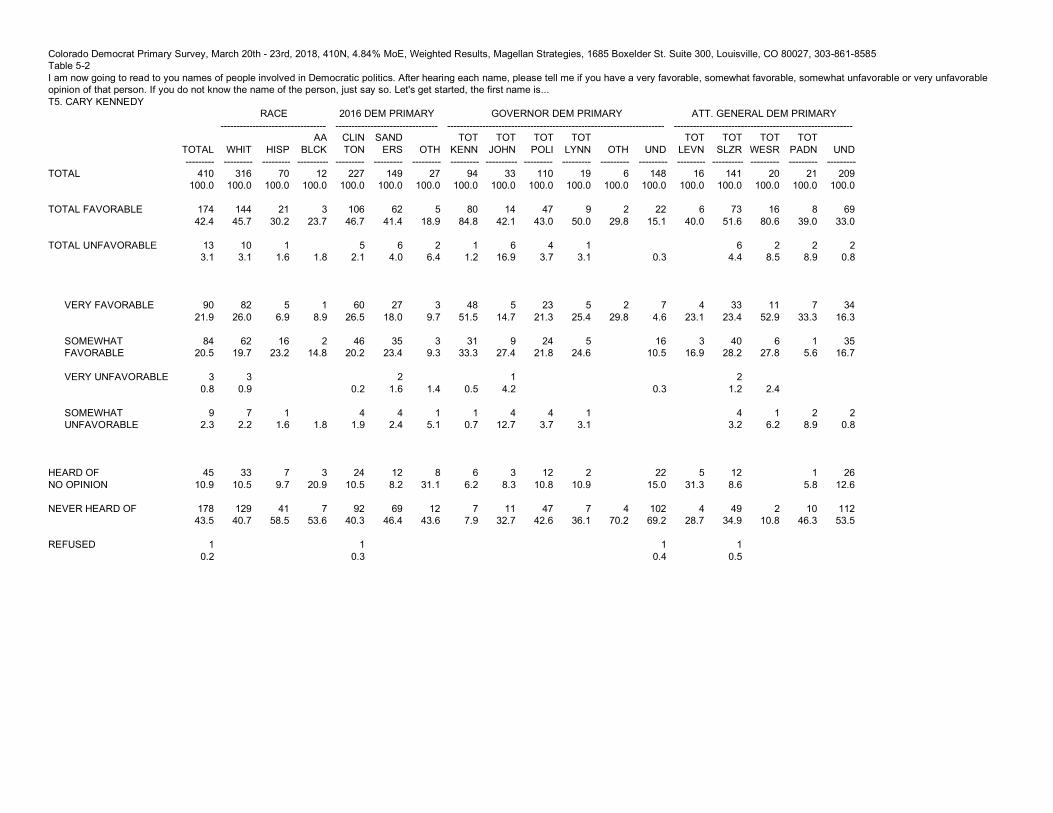
Colorado Democrat Primary Survey, March 20th - 23rd, 2018, 410N, 4.84% MoE, Weighted Results, Magellan Strategies, 1685 Boxelder St. Suite 300, Louisville, CO 80027, 303-861-8585 Table 5-2 I am now going to read to you names of people involved in Democratic politics. After hearing each name, please tell me if you have a very favorable, somewhat favorable, somewhat unfavorable or very unfavorable opinion of that person. If you do not know the name of the person, just say so. Let's get started, the first name is... T5. CARY KENNEDY RACE 2016 DEM PRIMARY GOVERNOR DEM PRIMARY ATT. GENERAL DEM PRIMARY --------------------------------- -------------------------------- -------------------------------------------------------------------- --------------------------------------------------------
TOTAL ---------
WHIT
---------
HISP
---------
AA BLCK
----------
CLIN TON
---------
SAND ERS
---------
OTH
---------
TOT KENN
---------
TOT JOHN
----------
TOT POLI
---------
TOT LYNN
---------
OTH
---------
UND
---------
TOT LEVN
---------
TOT SLZR
----------
TOT WESR
---------
TOT PADN
---------
UND
---------
TOTAL
410 100.0
316 100.0
70 100.0
12 100.0
227 100.0
149 100.0
27 100.0
94 100.0
33 100.0
110 100.0
19 100.0
6 100.0
148 100.0
16 100.0
141 100.0
20 100.0
21 100.0
209 100.0
TOTAL FAVORABLE
174 42.4
144 45.7
21 30.2
3 23.7
106 46.7
62 41.4
5 18.9
80 84.8
14 42.1
47 43.0
9 50.0
2 29.8
22 15.1
6 40.0
73 51.6
16 80.6
8 39.0
69 33.0
TOTAL UNFAVORABLE
13 3.1
10 3.1
1 1.6
1.8
5 2.1
6 4.0
2 6.4
1 1.2
6 16.9
4 3.7
1 3.1
0.3
6 4.4
2 8.5
2 8.9
2 0.8
VERY FAVORABLE
90 21.9
82 26.0
5 6.9
1 8.9
60 26.5
27 18.0
3 9.7
48 51.5
5 14.7
23 21.3
5 25.4
2 29.8
7 4.6
4 23.1
33 23.4
11 52.9
7 33.3
34 16.3
SOMEWHAT FAVORABLE
84 20.5
62 19.7
16 23.2
2 14.8
46 20.2
35 23.4
3 9.3
31 33.3
9 27.4
24 21.8
5 24.6
16 10.5
3 16.9
40 28.2
6 27.8
1 5.6
35 16.7
VERY UNFAVORABLE
3 0.8
3 0.9
0.2
2 1.6
1.4
0.5
1 4.2
0.3
2 1.2
2.4
SOMEWHAT UNFAVORABLE
9 2.3
7 2.2
1 1.6
1.8
4 1.9
4 2.4
1 5.1
1 0.7
4 12.7
4 3.7
1 3.1
4 3.2
1 6.2
2 8.9
2 0.8
HEARD OF NO OPINION
45 10.9
33 10.5
7 9.7
3 20.9
24 10.5
12 8.2
8 31.1
6 6.2
3 8.3
12 10.8
2 10.9
22 15.0
5 31.3
12 8.6
1 5.8
26 12.6
NEVER HEARD OF
178 43.5
129 40.7
41 58.5
7 53.6
92 40.3
69 46.4
12 43.6
7 7.9
11 32.7
47 42.6
7 36.1
4 70.2
102 69.2
4 28.7
49 34.9
2 10.8
10 46.3
112 53.5
REFUSED
1 0.2
1 0.3
1 0.4
1 0.5
Colorado Democrat Primary Survey, March 20th - 23rd, 2018, 410N, 4.84% MoE, Weighted Results, Magellan Strategies, 1685 Boxelder St. Suite 300, Louisville, CO 80027, 303-861-8585 Table 5-3 I am now going to read to you names of people involved in Democratic politics. After hearing each name, please tell me if you have a very favorable, somewhat favorable, somewhat unfavorable or very unfavorable opinion of that person. If you do not know the name of the person, just say so. Let's get started, the first name is... T5. CARY KENNEDY REGION BY CD --------------------------------------------------------------------------------
TOTAL
--------- CD1
--------- CD2
--------- CD3
---------- CD4
--------- CD5
--------- CD6
--------- CD7
---------
TOTAL
410 100.0
90 100.0
74 100.0
62 100.0
45 100.0
33 100.0
49 100.0
57 100.0
TOTAL FAVORABLE
174 42.4
37 41.5
32 43.7
28 45.6
17 37.7
11 34.7
22 44.2
26 45.5
TOTAL UNFAVORABLE
13 3.1
3 2.9
1 1.5
1 1.7
3 8.7
1 2.5
4 6.6
VERY FAVORABLE
90 21.9
17 19.0
21 28.6
11 17.2
6 12.7
6 17.6
12 24.6
17 30.1
SOMEWHAT FAVORABLE
84 20.5
20 22.4
11 15.1
17 28.4
11 25.0
6 17.1
10 19.7
9 15.4
VERY UNFAVORABLE
3 0.8
1 1.5
0.8
2 2.7
SOMEWHAT UNFAVORABLE
9 2.3
1 1.4
1 1.5
1 1.7
3 8.7
1 1.8
2 3.9
HEARD OF NO OPINION
45 10.9
5 5.9
7 9.1
8 13.2
6 13.7
8 23.0
5 11.2
5 9.1
NEVER HEARD OF
178 43.5
44 49.0
34 45.7
24 39.5
22 48.7
11 33.7
21 42.1
22 38.8
REFUSED
1 0.2
1 0.7
Colorado Democrat Primary Survey, March 20th - 23rd, 2018, 410N, 4.84% MoE, Weighted Results, Magellan Strategies, 1685 Boxelder St. Suite 300, Louisville, CO 80027, 303-861-8585 Table 6-1 T6. MIKE JOHNSTON GENDER~MARITAL AGE IDEOLOGY PARTY -------------------------------------------------------------------- -------------------------------------------------------- --------------------------------- --------------------------------------------------------------------
TOTAL ---------
MEN
---------
MEN MARR
---------
MEN SING
----------
WOM
---------
WOM MARR
---------
WOM SING
---------
18-34
---------
35-44
----------
45-54
---------
55-64
---------
65 PLUS
---------
VERY LIB
---------
LIB
---------
MOD
----------
DEM
---------
DEM MEN
---------
DEM WOM
---------
UNAF
---------
UNAF MEN
----------
UNAF WOM
---------
TOTAL
410 100.0
164 100.0
103 100.0
60 100.0
246 100.0
130 100.0
116 100.0
41 100.0
41 100.0
57 100.0
94 100.0
174 100.0
119 100.0
137 100.0
117 100.0
359 100.0
138 100.0
221 100.0
51 100.0
26 100.0
25 100.0
TOTAL FAVORABLE
84 20.6
36 22.0
27 26.0
9 15.3
48 19.6
25 19.0
24 20.3
5 12.7
8 19.3
10 16.9
19 20.5
40 23.1
37 31.0
20 14.8
20 16.7
77 21.5
31 22.3
47 21.0
7 13.9
5 20.1
2 7.3
TOTAL UNFAVORABLE
25 6.1
11 6.4
7 6.5
4 6.3
15 5.9
9 7.2
5 4.4
3 6.6
5 9.0
6 6.0
12 6.6
8 6.6
14 10.2
3 2.7
23 6.5
9 6.7
14 6.4
2 3.4
1 4.8
1.9
VERY FAVORABLE
35 8.6
16 10.0
14 13.4
3 4.3
19 7.6
9 6.6
10 8.7
2 5.7
0.8
3 5.4
7 7.8
22 12.4
18 14.9
7 4.8
7 5.9
34 9.6
16 11.3
19 8.5
1 1.8
1 3.5
SOMEWHAT FAVORABLE
49 12.0
20 12.0
13 12.6
7 10.9
30 12.0
16 12.4
14 11.6
3 7.0
8 18.5
7 11.5
12 12.7
19 10.7
19 16.1
14 10.0
13 10.8
43 12.0
15 11.1
28 12.6
6 12.1
4 16.6
2 7.3
VERY UNFAVORABLE
7 1.7
3 1.9
3 3.0
4 1.6
2 1.9
1 1.2
1 1.8
2 2.6
3 2.0
6 4.1
1 1.2
7 1.9
3 2.2
4 1.7
SOMEWHAT UNFAVORABLE
18 4.4
7 4.5
4 3.5
4 6.3
11 4.4
7 5.3
4 3.3
3 6.6
4 7.2
3 3.4
8 4.6
8 6.6
8 6.2
2 1.6
16 4.6
6 4.5
10 4.6
2 3.4
1 4.8
1.9
HEARD OF NO OPINION
53 12.9
14 8.8
6 5.7
9 14.1
39 15.7
24 18.5
15 12.5
6 13.8
5 13.1
11 19.2
15 15.8
16 9.2
15 12.5
21 15.0
15 12.8
48 13.5
14 10.5
34 15.3
5 9.1
5 18.7
NEVER HEARD OF
247 60.2
103 62.8
64 61.8
39 64.4
144 58.5
72 55.2
72 62.2
27 66.8
28 67.6
32 54.9
54 57.7
106 60.8
59 49.9
82 59.9
79 67.7
209 58.3
83 60.5
126 57.0
38 73.7
20 75.1
18 72.2
REFUSED
1 0.2
1 0.3
1 0.6
1 0.4
1 0.2
1 0.3

Colorado Democrat Primary Survey, March 20th - 23rd, 2018, 410N, 4.84% MoE, Weighted Results, Magellan Strategies, 1685 Boxelder St. Suite 300, Louisville, CO 80027, 303-861-8585 Table 6-2 T6. MIKE JOHNSTON RACE 2016 DEM PRIMARY GOVERNOR DEM PRIMARY ATT. GENERAL DEM PRIMARY --------------------------------- -------------------------------- -------------------------------------------------------------------- --------------------------------------------------------
TOTAL ---------
WHIT
---------
HISP
---------
AA BLCK
----------
CLIN TON
---------
SAND ERS
---------
OTH
---------
TOT KENN
---------
TOT JOHN
----------
TOT POLI
---------
TOT LYNN
---------
OTH
---------
UND
---------
TOT LEVN
---------
TOT SLZR
----------
TOT WESR
---------
TOT PADN
---------
UND
---------
TOTAL
410 100.0
316 100.0
70 100.0
12 100.0
227 100.0
149 100.0
27 100.0
94 100.0
33 100.0
110 100.0
19 100.0
6 100.0
148 100.0
16 100.0
141 100.0
20 100.0
21 100.0
209 100.0
TOTAL FAVORABLE
84 20.6
72 22.9
7 9.6
3 25.8
49 21.7
31 20.8
4 14.8
25 27.0
25 75.7
19 17.3
6 31.0
10 6.5
6 38.0
40 28.7
10 50.1
10 47.2
18 8.6
TOTAL UNFAVORABLE
25 6.1
21 6.7
4 5.1
12 5.4
12 8.1
17 18.2
3 2.6
4 2.8
7 5.2
4 20.7
1 6.6
11 5.3
VERY FAVORABLE
35 8.6
33 10.4
2 15.6
23 10.2
9 6.3
3 9.7
10 10.8
15 44.5
5 4.2
3 17.0
3 1.9
3 19.5
13 9.6
4 20.4
6 29.7
8 4.0
SOMEWHAT FAVORABLE
49 12.0
39 12.5
7 9.6
1 10.2
26 11.5
22 14.5
1 5.1
15 16.2
10 31.2
14 13.1
3 14.0
7 4.6
3 18.6
27 19.1
6 29.7
4 17.5
10 4.6
VERY UNFAVORABLE
7 1.7
6 1.8
1 2.0
6 2.6
1 0.7
6 6.3
3 17.1
1 6.6
1 0.5
SOMEWHAT UNFAVORABLE
18 4.4
16 4.9
2 3.1
6 2.8
11 7.4
11 11.9
3 2.6
4 2.8
7 5.2
1 3.6
10 4.8
HEARD OF NO OPINION
53 12.9
41 13.1
8 11.4
2 18.0
30 13.1
15 9.8
9 31.5
11 11.2
3 8.5
15 13.9
4 19.6
1 15.4
20 13.5
4 26.3
21 15.1
1 6.7
26 12.5
NEVER HEARD OF
247 60.2
181 57.3
52 74.0
7 56.2
135 59.5
91 61.2
15 53.7
41 43.6
5 15.8
73 66.2
9 49.4
5 84.6
114 76.9
6 35.7
71 50.5
5 22.5
10 46.2
154 73.6
REFUSED
1 0.2
1 0.3
1 0.4
1 0.5

Colorado Democrat Primary Survey, March 20th - 23rd, 2018, 410N, 4.84% MoE, Weighted Results, Magellan Strategies, 1685 Boxelder St. Suite 300, Louisville, CO 80027, 303-861-8585 Table 6-3 T6. MIKE JOHNSTON REGION BY CD --------------------------------------------------------------------------------
TOTAL
--------- CD1
--------- CD2
--------- CD3
---------- CD4
--------- CD5
--------- CD6
--------- CD7
---------
TOTAL
410 100.0
90 100.0
74 100.0
62 100.0
45 100.0
33 100.0
49 100.0
57 100.0
TOTAL FAVORABLE
84 20.6
27 30.0
9 11.5
19 30.5
6 13.5
4 11.6
9 19.3
11 18.5
TOTAL UNFAVORABLE
25 6.1
7 8.0
10 13.0
2 3.1
1 1.3
6 10.1
VERY FAVORABLE
35 8.6
14 15.2
7 11.3
1 3.3
2 5.4
7 13.7
5 8.0
SOMEWHAT FAVORABLE
49 12.0
13 14.8
9 11.5
12 19.3
5 10.2
2 6.3
3 5.5
6 10.5
VERY UNFAVORABLE
7 1.7
1 1.5
1 1.4
1 1.8
3 6.0
SOMEWHAT UNFAVORABLE
18 4.4
6 6.4
9 11.7
1 1.3
1 1.3
2 4.1
HEARD OF NO OPINION
53 12.9
8 8.4
7 9.2
6 10.3
9 19.2
5 16.0
8 15.5
11 18.7
NEVER HEARD OF
247 60.2
48 53.0
49 66.2
34 56.0
30 66.1
24 72.4
32 65.2
30 52.7
REFUSED
1 0.2
1 0.7

Colorado Democrat Primary Survey, March 20th - 23rd, 2018, 410N, 4.84% MoE, Weighted Results, Magellan Strategies, 1685 Boxelder St. Suite 300, Louisville, CO 80027, 303-861-8585 Table 7-1 T7. JARED POLIS GENDER~MARITAL AGE IDEOLOGY PARTY -------------------------------------------------------------------- -------------------------------------------------------- --------------------------------- --------------------------------------------------------------------
TOTAL ---------
MEN
---------
MEN MARR
---------
MEN SING
----------
WOM
---------
WOM MARR
---------
WOM SING
---------
18-34
---------
35-44
----------
45-54
---------
55-64
---------
65 PLUS
---------
VERY LIB
---------
LIB
---------
MOD
----------
DEM
---------
DEM MEN
---------
DEM WOM
---------
UNAF
---------
UNAF MEN
----------
UNAF WOM
---------
TOTAL
410 100.0
164 100.0
103 100.0
60 100.0
246 100.0
130 100.0
116 100.0
41 100.0
41 100.0
57 100.0
94 100.0
174 100.0
119 100.0
137 100.0
117 100.0
359 100.0
138 100.0
221 100.0
51 100.0
26 100.0
25 100.0
TOTAL FAVORABLE
224 54.7
92 56.3
64 62.0
28 46.6
132 53.7
79 61.0
53 45.5
16 38.8
18 45.1
25 43.1
51 54.2
112 64.3
82 68.8
72 52.5
62 53.1
202 56.3
79 57.2
123 55.8
22 43.4
14 51.8
9 34.5
TOTAL UNFAVORABLE
28 6.9
15 8.9
11 10.3
4 6.6
14 5.6
9 7.0
5 3.9
1 1.7
4 10.2
6 10.4
5 5.2
13 7.2
7 5.5
12 8.5
8 6.9
22 6.2
11 7.7
12 5.3
6 11.5
4 15.3
2 7.5
VERY FAVORABLE
106 25.8
48 29.4
34 32.5
15 24.2
58 23.5
40 30.8
18 15.2
8 19.8
8 19.7
11 18.3
25 26.2
53 30.5
42 35.3
36 26.3
26 22.0
98 27.2
42 30.5
56 25.1
8 16.2
6 23.4
2 8.6
SOMEWHAT FAVORABLE
118 28.9
44 27.0
31 29.5
13 22.4
74 30.2
39 30.1
35 30.2
8 19.0
10 25.3
14 24.8
26 28.0
59 33.8
40 33.5
36 26.2
36 31.0
105 29.1
37 26.7
68 30.7
14 27.2
7 28.4
6 25.9
VERY UNFAVORABLE
9 2.1
4 2.4
4 3.8
5 1.9
3 2.4
2 1.4
1 2.2
1 1.8
1 1.4
5 3.0
2 1.3
6 4.0
8 2.1
4 2.9
4 1.7
1 1.8
1 3.6
SOMEWHAT UNFAVORABLE
20 4.8
11 6.5
7 6.4
4 6.6
9 3.7
6 4.7
3 2.6
1 1.7
3 8.0
5 8.5
4 3.8
7 4.2
5 4.2
6 4.4
8 6.9
15 4.1
7 4.8
8 3.7
5 9.7
4 15.3
1 3.8
HEARD OF NO OPINION
44 10.8
14 8.4
7 7.2
6 10.6
31 12.4
14 10.5
17 14.6
4 10.2
4 9.6
9 15.2
16 17.4
11 6.3
9 7.8
20 14.6
11 9.5
38 10.6
12 8.8
26 11.6
6 12.6
2 6.3
5 19.3
NEVER HEARD OF
112 27.4
43 26.3
21 20.5
22 36.2
69 28.1
28 21.5
41 35.5
20 49.4
14 35.1
18 31.4
22 23.2
38 21.7
21 17.8
34 24.4
36 30.5
96 26.7
36 26.3
59 26.9
17 32.5
7 26.7
10 38.7
REFUSED
1 0.2
1 0.3
1 0.6
1 0.4
1 0.2
1 0.3
Colorado Democrat Primary Survey, March 20th - 23rd, 2018, 410N, 4.84% MoE, Weighted Results, Magellan Strategies, 1685 Boxelder St. Suite 300, Louisville, CO 80027, 303-861-8585 Table 7-2 T7. JARED POLIS RACE 2016 DEM PRIMARY GOVERNOR DEM PRIMARY ATT. GENERAL DEM PRIMARY --------------------------------- -------------------------------- -------------------------------------------------------------------- --------------------------------------------------------
TOTAL ---------
WHIT
---------
HISP
---------
AA BLCK
----------
CLIN TON
---------
SAND ERS
---------
OTH
---------
TOT KENN
---------
TOT JOHN
----------
TOT POLI
---------
TOT LYNN
---------
OTH
---------
UND
---------
TOT LEVN
---------
TOT SLZR
----------
TOT WESR
---------
TOT PADN
---------
UND
---------
TOTAL
410 100.0
316 100.0
70 100.0
12 100.0
227 100.0
149 100.0
27 100.0
94 100.0
33 100.0
110 100.0
19 100.0
6 100.0
148 100.0
16 100.0
141 100.0
20 100.0
21 100.0
209 100.0
TOTAL FAVORABLE
224 54.7
192 60.9
23 32.8
3 26.2
132 58.2
79 53.0
11 39.0
61 64.6
16 48.2
101 92.4
8 41.9
3 52.2
36 24.3
7 44.5
90 64.1
15 72.9
15 72.5
96 45.8
TOTAL UNFAVORABLE
28 6.9
24 7.6
2 2.9
3.9
12 5.4
12 7.9
4 15.7
8 8.5
7 20.9
3 2.7
1 7.9
3 47.8
5 3.6
1 7.8
12 8.7
3 14.7
1 7.0
9 4.5
VERY FAVORABLE
106 25.8
95 30.0
7 10.6
1 5.0
69 30.2
30 19.9
5 18.9
17 17.7
5 14.5
68 61.9
3 17.0
2 36.7
11 7.7
3 17.5
44 31.0
6 30.4
6 29.1
46 22.0
SOMEWHAT FAVORABLE
118 28.9
98 30.9
15 22.1
3 21.2
64 28.0
49 33.1
5 20.1
44 46.9
11 33.6
33 30.5
5 24.9
1 15.4
24 16.6
4 27.0
47 33.1
9 42.6
9 43.4
50 23.8
VERY UNFAVORABLE
9 2.1
7 2.4
3 1.5
3 2.1
2 8.1
2 2.3
1 0.6
1.9
2 28.0
3 1.9
3 2.5
4 2.0
SOMEWHAT UNFAVORABLE
20 4.8
17 5.3
2 2.9
3.9
9 3.9
9 5.8
2 7.6
6 6.1
7 20.9
2 2.1
1 6.0
1 19.8
3 1.7
1 7.8
9 6.2
3 14.7
1 7.0
5 2.5
HEARD OF NO OPINION
44 10.8
33 10.6
7 9.5
2 19.3
22 9.8
14 9.7
7 26.1
9 9.3
2 7.2
4 3.5
3 16.1
26 17.9
2 11.3
11 7.6
32 15.2
NEVER HEARD OF
112 27.4
66 20.9
38 54.9
6 50.7
60 26.3
44 29.4
5 19.2
17 17.7
8 23.7
1 1.3
6 34.0
80 53.8
6 36.4
27 19.1
3 12.3
4 20.5
72 34.5
REFUSED
1 0.2
1 0.3
1 0.4
1 0.5
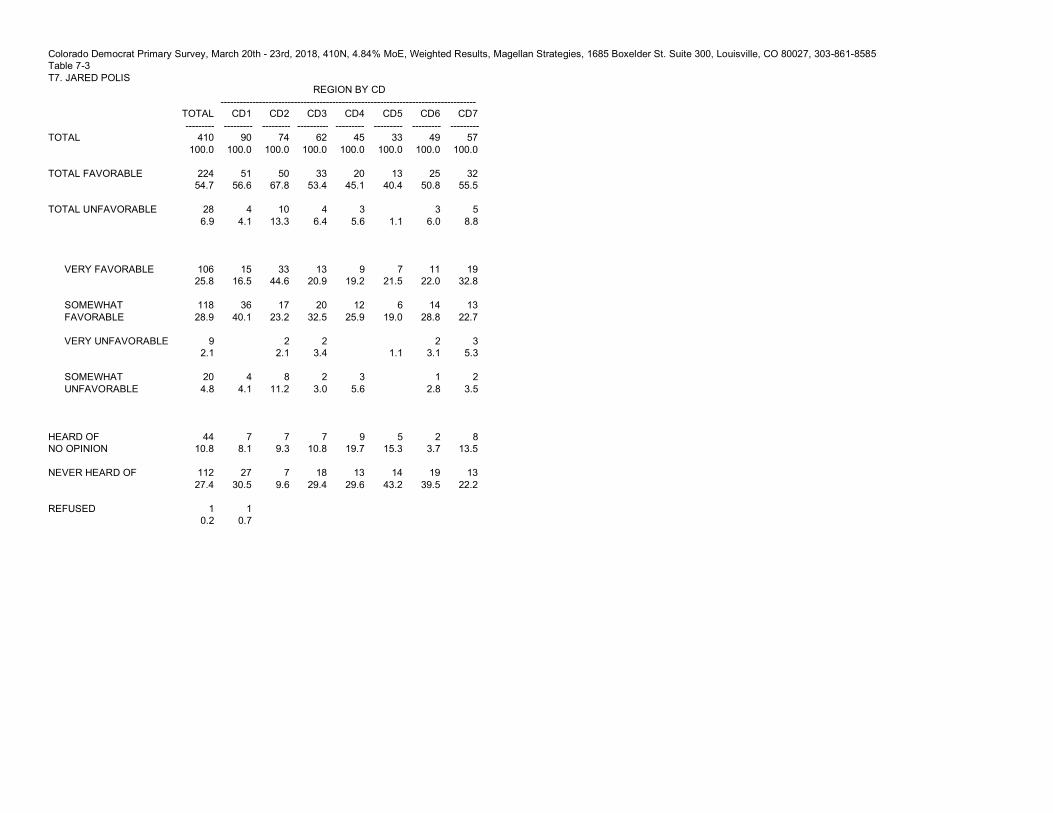
Colorado Democrat Primary Survey, March 20th - 23rd, 2018, 410N, 4.84% MoE, Weighted Results, Magellan Strategies, 1685 Boxelder St. Suite 300, Louisville, CO 80027, 303-861-8585 Table 7-3 T7. JARED POLIS REGION BY CD --------------------------------------------------------------------------------
TOTAL
--------- CD1
--------- CD2
--------- CD3
---------- CD4
--------- CD5
--------- CD6
--------- CD7
---------
TOTAL
410 100.0
90 100.0
74 100.0
62 100.0
45 100.0
33 100.0
49 100.0
57 100.0
TOTAL FAVORABLE
224 54.7
51 56.6
50 67.8
33 53.4
20 45.1
13 40.4
25 50.8
32 55.5
TOTAL UNFAVORABLE
28 6.9
4 4.1
10 13.3
4 6.4
3 5.6
1.1
3 6.0
5 8.8
VERY FAVORABLE
106 25.8
15 16.5
33 44.6
13 20.9
9 19.2
7 21.5
11 22.0
19 32.8
SOMEWHAT FAVORABLE
118 28.9
36 40.1
17 23.2
20 32.5
12 25.9
6 19.0
14 28.8
13 22.7
VERY UNFAVORABLE
9 2.1
2 2.1
2 3.4
1.1
2 3.1
3 5.3
SOMEWHAT UNFAVORABLE
20 4.8
4 4.1
8 11.2
2 3.0
3 5.6
1 2.8
2 3.5
HEARD OF NO OPINION
44 10.8
7 8.1
7 9.3
7 10.8
9 19.7
5 15.3
2 3.7
8 13.5
NEVER HEARD OF
112 27.4
27 30.5
7 9.6
18 29.4
13 29.6
14 43.2
19 39.5
13 22.2
REFUSED
1 0.2
1 0.7

Colorado Democrat Primary Survey, March 20th - 23rd, 2018, 410N, 4.84% MoE, Weighted Results, Magellan Strategies, 1685 Boxelder St. Suite 300, Louisville, CO 80027, 303-861-8585 Table 8-1 T8. DONNA LYNNE GENDER~MARITAL AGE IDEOLOGY PARTY -------------------------------------------------------------------- -------------------------------------------------------- --------------------------------- --------------------------------------------------------------------
TOTAL ---------
MEN
---------
MEN MARR
---------
MEN SING
----------
WOM
---------
WOM MARR
---------
WOM SING
---------
18-34
---------
35-44
----------
45-54
---------
55-64
---------
65 PLUS
---------
VERY LIB
---------
LIB
---------
MOD
----------
DEM
---------
DEM MEN
---------
DEM WOM
---------
UNAF
---------
UNAF MEN
----------
UNAF WOM
---------
TOTAL
410 100.0
164 100.0
103 100.0
60 100.0
246 100.0
130 100.0
116 100.0
41 100.0
41 100.0
57 100.0
94 100.0
174 100.0
119 100.0
137 100.0
117 100.0
359 100.0
138 100.0
221 100.0
51 100.0
26 100.0
25 100.0
TOTAL FAVORABLE
55 13.4
24 14.3
16 15.5
7 12.4
31 12.7
19 14.3
13 11.0
6 14.1
4 10.7
8 13.2
13 13.3
24 13.8
17 14.6
14 10.1
16 13.7
51 14.2
21 15.1
30 13.7
4 7.4
3 10.2
1 4.5
TOTAL UNFAVORABLE
14 3.4
8 5.0
5 4.7
3 5.5
6 2.3
3 2.5
2 2.1
1 3.0
2 6.0
3 5.3
1 1.2
6 3.5
4 3.5
8 6.1
0.3
12 3.2
6 4.3
6 2.6
2 4.5
2 8.7
VERY FAVORABLE
17 4.2
7 4.3
5 4.7
2 3.7
10 4.2
5 4.1
5 4.2
2 5.9
2 4.5
2 2.8
3 3.0
8 4.7
5 3.8
7 5.3
0.2
17 4.8
7 5.2
10 4.7
SOMEWHAT FAVORABLE
37 9.1
16 10.0
11 10.8
5 8.6
21 8.5
13 10.2
8 6.7
3 8.2
3 6.3
6 10.3
10 10.2
16 9.1
13 10.8
7 4.8
16 13.5
34 9.4
14 10.0
20 9.0
4 7.4
3 10.2
1 4.5
VERY UNFAVORABLE
2 0.5
1 0.6
1 1.0
1 0.5
1 0.9
1 1.2
1 0.6
2 1.6
2 0.6
1 0.8
1 0.5
SOMEWHAT UNFAVORABLE
12 2.9
7 4.4
4 3.7
3 5.5
5 1.9
2 1.6
2 2.1
1 3.0
2 6.0
3 5.3
5 2.9
4 3.5
6 4.5
0.3
9 2.6
5 3.5
5 2.1
2 4.5
2 8.7
HEARD OF NO OPINION
50 12.2
17 10.5
9 9.1
8 13.1
33 13.3
19 14.8
14 11.7
5 12.2
7 17.0
6 10.9
12 12.5
20 11.6
14 12.2
15 10.8
18 15.7
44 12.4
17 12.6
27 12.2
6 11.3
6 23.2
NEVER HEARD OF
290 70.7
114 69.7
73 70.6
41 67.9
176 71.4
89 68.4
87 74.7
28 69.1
27 66.2
41 70.7
69 73.1
123 70.8
83 69.7
100 72.5
82 70.3
250 69.8
93 67.5
158 71.3
39 76.9
21 81.1
18 72.3
REFUSED
1 0.3
1 0.4
1 1.1
1 0.3
1 0.6
1 1.7
1 0.4
1 0.5
1 0.4
1 0.5
1 0.3

Colorado Democrat Primary Survey, March 20th - 23rd, 2018, 410N, 4.84% MoE, Weighted Results, Magellan Strategies, 1685 Boxelder St. Suite 300, Louisville, CO 80027, 303-861-8585 Table 8-2 T8. DONNA LYNNE RACE 2016 DEM PRIMARY GOVERNOR DEM PRIMARY ATT. GENERAL DEM PRIMARY --------------------------------- -------------------------------- -------------------------------------------------------------------- --------------------------------------------------------
TOTAL ---------
WHIT
---------
HISP
---------
AA BLCK
----------
CLIN TON
---------
SAND ERS
---------
OTH
---------
TOT KENN
---------
TOT JOHN
----------
TOT POLI
---------
TOT LYNN
---------
OTH
---------
UND
---------
TOT LEVN
---------
TOT SLZR
----------
TOT WESR
---------
TOT PADN
---------
UND
---------
TOTAL
410 100.0
316 100.0
70 100.0
12 100.0
227 100.0
149 100.0
27 100.0
94 100.0
33 100.0
110 100.0
19 100.0
6 100.0
148 100.0
16 100.0
141 100.0
20 100.0
21 100.0
209 100.0
TOTAL FAVORABLE
55 13.4
43 13.5
9 12.8
1 6.8
32 14.1
20 13.2
3 9.7
22 23.2
7 22.7
8 7.3
11 61.7
6 4.0
5 32.4
23 16.4
7 32.7
7 31.4
13 6.4
TOTAL UNFAVORABLE
14 3.4
11 3.6
2 3.1
2.5
6 2.5
7 4.8
1 3.8
6 6.8
3 2.5
4 2.5
2.0
2 1.4
5 23.1
1 5.4
5 2.3
VERY FAVORABLE
17 4.2
13 4.1
3 4.5
2.3
12 5.5
2 1.2
3 9.7
7 7.8
2 4.7
1 0.6
6 31.8
2 1.3
1 6.2
8 5.9
1 6.7
3 14.3
4 1.8
SOMEWHAT FAVORABLE
37 9.1
30 9.4
6 8.3
1 4.5
20 8.6
18 12.0
15 15.4
6 18.0
7 6.7
6 29.9
4 2.8
4 26.2
15 10.5
5 26.0
4 17.1
10 4.6
VERY UNFAVORABLE
2 0.5
2 0.7
1 0.5
1 0.7
1 1.2
1 5.4
SOMEWHAT UNFAVORABLE
12 2.9
9 2.9
2 3.1
2.5
5 2.0
6 4.1
1 3.8
5 5.7
3 2.5
4 2.5
2.0
2 1.4
4 17.6
1 5.4
5 2.3
HEARD OF NO OPINION
50 12.2
40 12.7
6 8.3
2 15.8
25 10.9
22 14.7
3 12.6
11 12.2
6 18.4
14 12.8
4 23.4
1 15.4
13 9.1
3 21.1
23 16.3
2 8.9
22 10.5
NEVER HEARD OF
290 70.7
221 70.0
53 75.9
9 74.9
163 72.0
100 67.3
20 73.9
54 57.7
19 58.8
84 76.7
3 14.9
5 84.6
124 84.0
7 44.5
91 65.0
9 44.2
11 54.3
169 80.8
REFUSED
1 0.3
1 0.2
1 0.6
1 0.6
1 0.4
1 0.9
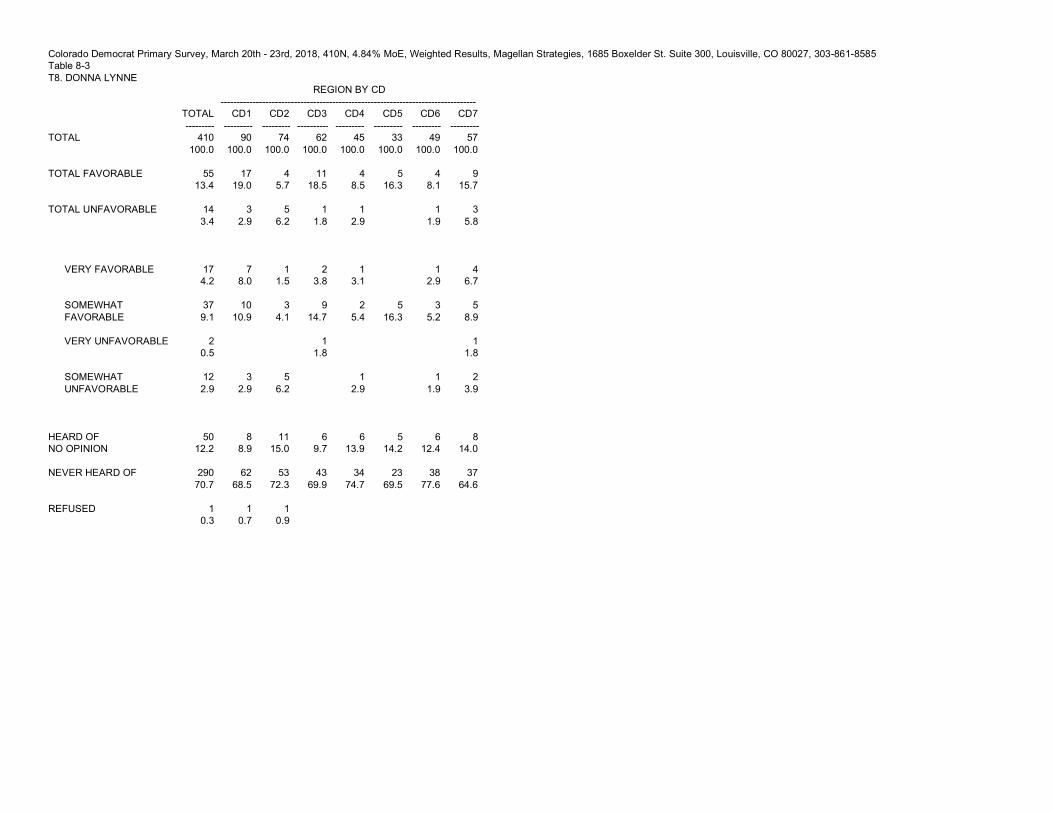
Colorado Democrat Primary Survey, March 20th - 23rd, 2018, 410N, 4.84% MoE, Weighted Results, Magellan Strategies, 1685 Boxelder St. Suite 300, Louisville, CO 80027, 303-861-8585 Table 8-3 T8. DONNA LYNNE REGION BY CD --------------------------------------------------------------------------------
TOTAL
--------- CD1
--------- CD2
--------- CD3
---------- CD4
--------- CD5
--------- CD6
--------- CD7
---------
TOTAL
410 100.0
90 100.0
74 100.0
62 100.0
45 100.0
33 100.0
49 100.0
57 100.0
TOTAL FAVORABLE
55 13.4
17 19.0
4 5.7
11 18.5
4 8.5
5 16.3
4 8.1
9 15.7
TOTAL UNFAVORABLE
14 3.4
3 2.9
5 6.2
1 1.8
1 2.9
1 1.9
3 5.8
VERY FAVORABLE
17 4.2
7 8.0
1 1.5
2 3.8
1 3.1
1 2.9
4 6.7
SOMEWHAT FAVORABLE
37 9.1
10 10.9
3 4.1
9 14.7
2 5.4
5 16.3
3 5.2
5 8.9
VERY UNFAVORABLE
2 0.5
1 1.8
1 1.8
SOMEWHAT UNFAVORABLE
12 2.9
3 2.9
5 6.2
1 2.9
1 1.9
2 3.9
HEARD OF NO OPINION
50 12.2
8 8.9
11 15.0
6 9.7
6 13.9
5 14.2
6 12.4
8 14.0
NEVER HEARD OF
290 70.7
62 68.5
53 72.3
43 69.9
34 74.7
23 69.5
38 77.6
37 64.6
REFUSED
1 0.3
1 0.7
1 0.9

Colorado Democrat Primary Survey, March 20th - 23rd, 2018, 410N, 4.84% MoE, Weighted Results, Magellan Strategies, 1685 Boxelder St. Suite 300, Louisville, CO 80027, 303-861-8585 Table 9-1 T9. BRAD LEVIN GENDER~MARITAL AGE IDEOLOGY PARTY -------------------------------------------------------------------- -------------------------------------------------------- --------------------------------- --------------------------------------------------------------------
TOTAL ---------
MEN
---------
MEN MARR
---------
MEN SING
----------
WOM
---------
WOM MARR
---------
WOM SING
---------
18-34
---------
35-44
----------
45-54
---------
55-64
---------
65 PLUS
---------
VERY LIB
---------
LIB
---------
MOD
----------
DEM
---------
DEM MEN
---------
DEM WOM
---------
UNAF
---------
UNAF MEN
----------
UNAF WOM
---------
TOTAL
410 100.0
164 100.0
103 100.0
60 100.0
246 100.0
130 100.0
116 100.0
41 100.0
41 100.0
57 100.0
94 100.0
174 100.0
119 100.0
137 100.0
117 100.0
359 100.0
138 100.0
221 100.0
51 100.0
26 100.0
25 100.0
TOTAL FAVORABLE
35 8.6
12 7.2
9 8.6
3 4.9
23 9.5
16 12.5
7 6.3
5 12.6
5 12.7
8 13.2
11 11.3
7 3.8
14 11.4
6 4.6
9 8.0
34 9.5
11 8.3
23 10.2
1 2.6
1.5
1 3.6
TOTAL UNFAVORABLE
10 2.5
3 2.1
3 3.3
7 2.7
2 1.9
4 3.6
2 5.0
3 5.6
1 1.2
4 2.1
1 1.1
7 5.4
1 1.1
10 2.8
3 2.5
7 3.0
VERY FAVORABLE
12 2.8
6 3.7
5 5.3
1 1.1
5 2.2
3 2.1
3 2.3
3 7.5
0.8
2 3.1
3 3.2
3 1.9
5 4.2
1 0.5
4 3.6
12 3.2
6 4.5
5 2.5
SOMEWHAT FAVORABLE
24 5.8
6 3.5
3 3.3
2 3.8
18 7.3
13 10.3
5 4.0
2 5.1
5 12.0
6 10.1
8 8.1
3 1.9
9 7.2
6 4.1
5 4.4
22 6.2
5 3.8
17 7.7
1 2.6
1.5
1 3.6
VERY UNFAVORABLE
2 0.5
1 0.6
1 1.0
1 0.5
1 0.9
1 1.2
1 0.6
2 1.6
2 0.6
1 0.8
1 0.5
SOMEWHAT UNFAVORABLE
8 1.9
2 1.5
2 2.3
6 2.3
1 1.1
4 3.6
2 5.0
3 5.6
3 1.6
1 1.1
5 3.9
1 1.1
8 2.2
2 1.8
6 2.5
HEARD OF NO OPINION
43 10.6
17 10.2
9 8.8
8 12.7
27 10.8
13 9.9
14 11.8
5 12.3
5 11.5
9 16.1
9 9.9
15 8.6
18 15.1
12 8.4
13 10.7
39 10.9
15 10.6
24 11.1
4 8.2
2 7.9
2 8.6
NEVER HEARD OF
320 78.0
131 80.1
82 79.3
49 81.3
189 76.7
98 75.7
90 77.7
28 68.4
31 75.8
37 65.2
73 77.6
148 85.1
86 72.4
111 81.1
94 80.1
274 76.4
107 78.1
167 75.4
46 89.2
24 90.6
22 87.8
REFUSED
1 0.3
1 0.4
1 1.1
1 0.3
1 0.6
1 1.7
1 0.4
1 0.5
1 0.4
1 0.5
1 0.3

Colorado Democrat Primary Survey, March 20th - 23rd, 2018, 410N, 4.84% MoE, Weighted Results, Magellan Strategies, 1685 Boxelder St. Suite 300, Louisville, CO 80027, 303-861-8585 Table 9-2 T9. BRAD LEVIN RACE 2016 DEM PRIMARY GOVERNOR DEM PRIMARY ATT. GENERAL DEM PRIMARY --------------------------------- -------------------------------- -------------------------------------------------------------------- --------------------------------------------------------
TOTAL ---------
WHIT
---------
HISP
---------
AA BLCK
----------
CLIN TON
---------
SAND ERS
---------
OTH
---------
TOT KENN
---------
TOT JOHN
----------
TOT POLI
---------
TOT LYNN
---------
OTH
---------
UND
---------
TOT LEVN
---------
TOT SLZR
----------
TOT WESR
---------
TOT PADN
---------
UND
---------
TOTAL
410 100.0
316 100.0
70 100.0
12 100.0
227 100.0
149 100.0
27 100.0
94 100.0
33 100.0
110 100.0
19 100.0
6 100.0
148 100.0
16 100.0
141 100.0
20 100.0
21 100.0
209 100.0
TOTAL FAVORABLE
35 8.6
21 6.6
10 14.7
2 18.7
20 8.8
13 8.5
3 9.7
16 16.6
4 11.4
8 6.9
5 24.9
4 2.5
8 50.1
16 11.0
4 17.2
4 17.1
5 2.3
TOTAL UNFAVORABLE
10 2.5
7 2.3
3 3.9
4 1.9
6 3.9
6 6.0
1 7.1
2 1.4
3 2.4
3 17.1
2 1.0
VERY FAVORABLE
12 2.8
9 3.0
1 1.3
2.5
6 2.8
3 1.8
3 9.7
5 5.6
3 2.6
3 14.1
1 0.6
6 39.3
2 1.5
1 4.3
2 8.2
1 0.3
SOMEWHAT FAVORABLE
24 5.8
11 3.5
9 13.4
2 16.2
14 6.0
10 6.7
10 11.1
4 11.4
5 4.3
2 10.8
3 1.9
2 10.8
13 9.5
3 12.9
2 8.9
4 2.0
VERY UNFAVORABLE
2 0.5
2 0.7
1 0.5
1 0.7
1 1.2
1 5.4
SOMEWHAT UNFAVORABLE
8 1.9
5 1.7
3 3.9
3 1.4
5 3.2
5 4.9
1 7.1
2 1.4
3 2.4
2 11.6
2 1.0
HEARD OF NO OPINION
43 10.6
30 9.6
10 14.6
2 14.6
24 10.6
17 11.2
3 9.4
8 8.8
7 22.0
12 11.3
1 5.5
1 15.4
14 9.2
2 10.7
21 14.9
1 3.6
1 5.8
19 9.0
NEVER HEARD OF
320 78.0
257 81.3
47 66.8
8 66.7
177 78.1
114 76.4
22 80.9
64 68.5
22 66.6
89 81.3
12 62.6
5 84.6
128 86.4
6 39.2
100 70.8
13 62.1
16 77.1
184 87.7
REFUSED
1 0.3
1 0.2
1 0.6
1 0.6
1 0.4
1 0.9

Colorado Democrat Primary Survey, March 20th - 23rd, 2018, 410N, 4.84% MoE, Weighted Results, Magellan Strategies, 1685 Boxelder St. Suite 300, Louisville, CO 80027, 303-861-8585 Table 9-3 T9. BRAD LEVIN REGION BY CD --------------------------------------------------------------------------------
TOTAL
--------- CD1
--------- CD2
--------- CD3
---------- CD4
--------- CD5
--------- CD6
--------- CD7
---------
TOTAL
410 100.0
90 100.0
74 100.0
62 100.0
45 100.0
33 100.0
49 100.0
57 100.0
TOTAL FAVORABLE
35 8.6
6 7.0
5 6.8
7 10.6
4 9.9
5 15.2
2 3.9
6 10.4
TOTAL UNFAVORABLE
10 2.5
1 1.5
3 4.3
1 1.8
1 2.9
1 4.0
2 3.2
VERY FAVORABLE
12 2.8
2 2.0
2 2.6
1 1.9
2 5.0
3 8.0
0.6
2 2.6
SOMEWHAT FAVORABLE
24 5.8
5 5.1
3 4.2
5 8.7
2 4.9
2 7.2
2 3.2
4 7.8
VERY UNFAVORABLE
2 0.5
1 1.8
1 1.8
SOMEWHAT UNFAVORABLE
8 1.9
1 1.5
3 4.3
1 2.9
1 4.0
1 1.4
HEARD OF NO OPINION
43 10.6
12 12.8
4 5.6
5 7.9
5 10.0
3 9.2
6 12.6
9 15.6
NEVER HEARD OF
320 78.0
70 77.9
61 82.4
49 79.6
35 77.2
23 71.6
41 83.5
41 70.8
REFUSED
1 0.3
1 0.7
1 0.9
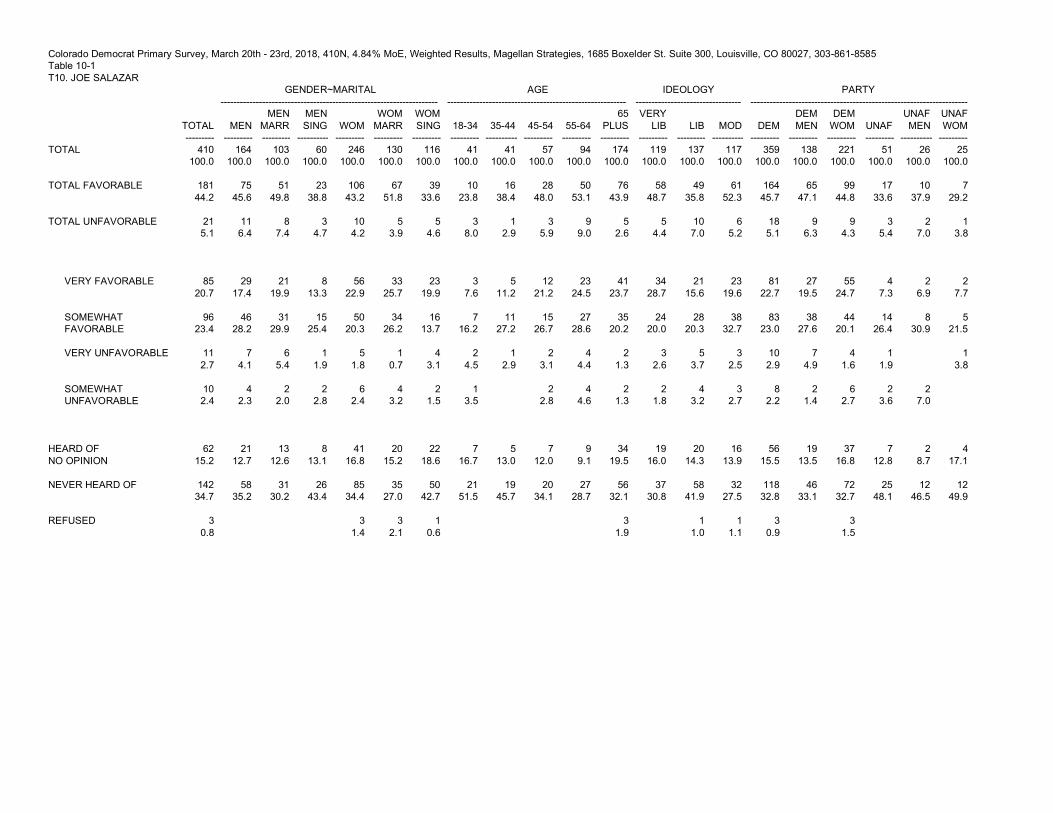
Colorado Democrat Primary Survey, March 20th - 23rd, 2018, 410N, 4.84% MoE, Weighted Results, Magellan Strategies, 1685 Boxelder St. Suite 300, Louisville, CO 80027, 303-861-8585 Table 10-1 T10. JOE SALAZAR GENDER~MARITAL AGE IDEOLOGY PARTY -------------------------------------------------------------------- -------------------------------------------------------- --------------------------------- --------------------------------------------------------------------
TOTAL ---------
MEN
---------
MEN MARR
---------
MEN SING
----------
WOM
---------
WOM MARR
---------
WOM SING
---------
18-34
---------
35-44
----------
45-54
---------
55-64
---------
65 PLUS
---------
VERY LIB
---------
LIB
---------
MOD
----------
DEM
---------
DEM MEN
---------
DEM WOM
---------
UNAF
---------
UNAF MEN
----------
UNAF WOM
---------
TOTAL
410 100.0
164 100.0
103 100.0
60 100.0
246 100.0
130 100.0
116 100.0
41 100.0
41 100.0
57 100.0
94 100.0
174 100.0
119 100.0
137 100.0
117 100.0
359 100.0
138 100.0
221 100.0
51 100.0
26 100.0
25 100.0
TOTAL FAVORABLE
181 44.2
75 45.6
51 49.8
23 38.8
106 43.2
67 51.8
39 33.6
10 23.8
16 38.4
28 48.0
50 53.1
76 43.9
58 48.7
49 35.8
61 52.3
164 45.7
65 47.1
99 44.8
17 33.6
10 37.9
7 29.2
TOTAL UNFAVORABLE
21 5.1
11 6.4
8 7.4
3 4.7
10 4.2
5 3.9
5 4.6
3 8.0
1 2.9
3 5.9
9 9.0
5 2.6
5 4.4
10 7.0
6 5.2
18 5.1
9 6.3
9 4.3
3 5.4
2 7.0
1 3.8
VERY FAVORABLE
85 20.7
29 17.4
21 19.9
8 13.3
56 22.9
33 25.7
23 19.9
3 7.6
5 11.2
12 21.2
23 24.5
41 23.7
34 28.7
21 15.6
23 19.6
81 22.7
27 19.5
55 24.7
4 7.3
2 6.9
2 7.7
SOMEWHAT FAVORABLE
96 23.4
46 28.2
31 29.9
15 25.4
50 20.3
34 26.2
16 13.7
7 16.2
11 27.2
15 26.7
27 28.6
35 20.2
24 20.0
28 20.3
38 32.7
83 23.0
38 27.6
44 20.1
14 26.4
8 30.9
5 21.5
VERY UNFAVORABLE
11 2.7
7 4.1
6 5.4
1 1.9
5 1.8
1 0.7
4 3.1
2 4.5
1 2.9
2 3.1
4 4.4
2 1.3
3 2.6
5 3.7
3 2.5
10 2.9
7 4.9
4 1.6
1 1.9
1 3.8
SOMEWHAT UNFAVORABLE
10 2.4
4 2.3
2 2.0
2 2.8
6 2.4
4 3.2
2 1.5
1 3.5
2 2.8
4 4.6
2 1.3
2 1.8
4 3.2
3 2.7
8 2.2
2 1.4
6 2.7
2 3.6
2 7.0
HEARD OF NO OPINION
62 15.2
21 12.7
13 12.6
8 13.1
41 16.8
20 15.2
22 18.6
7 16.7
5 13.0
7 12.0
9 9.1
34 19.5
19 16.0
20 14.3
16 13.9
56 15.5
19 13.5
37 16.8
7 12.8
2 8.7
4 17.1
NEVER HEARD OF
142 34.7
58 35.2
31 30.2
26 43.4
85 34.4
35 27.0
50 42.7
21 51.5
19 45.7
20 34.1
27 28.7
56 32.1
37 30.8
58 41.9
32 27.5
118 32.8
46 33.1
72 32.7
25 48.1
12 46.5
12 49.9
REFUSED
3 0.8
3 1.4
3 2.1
1 0.6
3 1.9
1 1.0
1 1.1
3 0.9
3 1.5
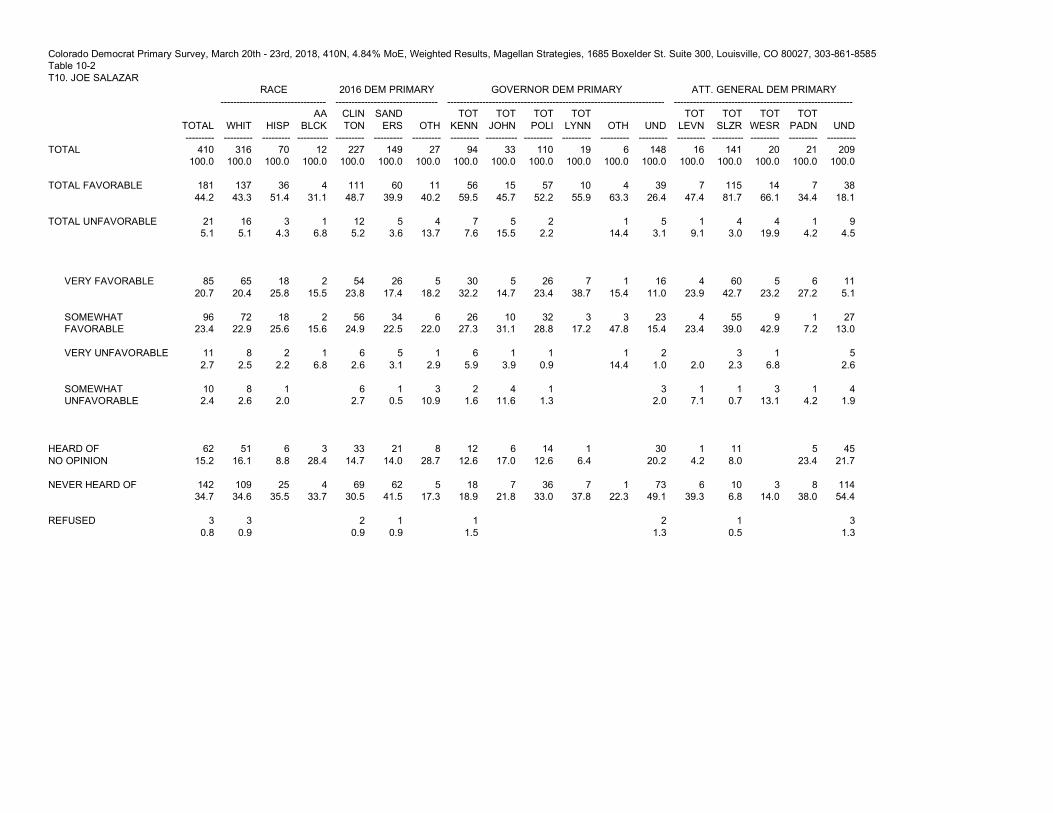
Colorado Democrat Primary Survey, March 20th - 23rd, 2018, 410N, 4.84% MoE, Weighted Results, Magellan Strategies, 1685 Boxelder St. Suite 300, Louisville, CO 80027, 303-861-8585 Table 10-2 T10. JOE SALAZAR RACE 2016 DEM PRIMARY GOVERNOR DEM PRIMARY ATT. GENERAL DEM PRIMARY --------------------------------- -------------------------------- -------------------------------------------------------------------- --------------------------------------------------------
TOTAL ---------
WHIT
---------
HISP
---------
AA BLCK
----------
CLIN TON
---------
SAND ERS
---------
OTH
---------
TOT KENN
---------
TOT JOHN
----------
TOT POLI
---------
TOT LYNN
---------
OTH
---------
UND
---------
TOT LEVN
---------
TOT SLZR
----------
TOT WESR
---------
TOT PADN
---------
UND
---------
TOTAL
410 100.0
316 100.0
70 100.0
12 100.0
227 100.0
149 100.0
27 100.0
94 100.0
33 100.0
110 100.0
19 100.0
6 100.0
148 100.0
16 100.0
141 100.0
20 100.0
21 100.0
209 100.0
TOTAL FAVORABLE
181 44.2
137 43.3
36 51.4
4 31.1
111 48.7
60 39.9
11 40.2
56 59.5
15 45.7
57 52.2
10 55.9
4 63.3
39 26.4
7 47.4
115 81.7
14 66.1
7 34.4
38 18.1
TOTAL UNFAVORABLE
21 5.1
16 5.1
3 4.3
1 6.8
12 5.2
5 3.6
4 13.7
7 7.6
5 15.5
2 2.2
1 14.4
5 3.1
1 9.1
4 3.0
4 19.9
1 4.2
9 4.5
VERY FAVORABLE
85 20.7
65 20.4
18 25.8
2 15.5
54 23.8
26 17.4
5 18.2
30 32.2
5 14.7
26 23.4
7 38.7
1 15.4
16 11.0
4 23.9
60 42.7
5 23.2
6 27.2
11 5.1
SOMEWHAT FAVORABLE
96 23.4
72 22.9
18 25.6
2 15.6
56 24.9
34 22.5
6 22.0
26 27.3
10 31.1
32 28.8
3 17.2
3 47.8
23 15.4
4 23.4
55 39.0
9 42.9
1 7.2
27 13.0
VERY UNFAVORABLE
11 2.7
8 2.5
2 2.2
1 6.8
6 2.6
5 3.1
1 2.9
6 5.9
1 3.9
1 0.9
1 14.4
2 1.0
2.0
3 2.3
1 6.8
5 2.6
SOMEWHAT UNFAVORABLE
10 2.4
8 2.6
1 2.0
6 2.7
1 0.5
3 10.9
2 1.6
4 11.6
1 1.3
3 2.0
1 7.1
1 0.7
3 13.1
1 4.2
4 1.9
HEARD OF NO OPINION
62 15.2
51 16.1
6 8.8
3 28.4
33 14.7
21 14.0
8 28.7
12 12.6
6 17.0
14 12.6
1 6.4
30 20.2
1 4.2
11 8.0
5 23.4
45 21.7
NEVER HEARD OF
142 34.7
109 34.6
25 35.5
4 33.7
69 30.5
62 41.5
5 17.3
18 18.9
7 21.8
36 33.0
7 37.8
1 22.3
73 49.1
6 39.3
10 6.8
3 14.0
8 38.0
114 54.4
REFUSED
3 0.8
3 0.9
2 0.9
1 0.9
1 1.5
2 1.3
1 0.5
3 1.3

Colorado Democrat Primary Survey, March 20th - 23rd, 2018, 410N, 4.84% MoE, Weighted Results, Magellan Strategies, 1685 Boxelder St. Suite 300, Louisville, CO 80027, 303-861-8585 Table 10-3 T10. JOE SALAZAR REGION BY CD --------------------------------------------------------------------------------
TOTAL
--------- CD1
--------- CD2
--------- CD3
---------- CD4
--------- CD5
--------- CD6
--------- CD7
---------
TOTAL
410 100.0
90 100.0
74 100.0
62 100.0
45 100.0
33 100.0
49 100.0
57 100.0
TOTAL FAVORABLE
181 44.2
34 38.0
27 36.9
35 57.6
19 42.9
14 44.0
25 50.8
25 44.1
TOTAL UNFAVORABLE
21 5.1
3 3.0
2 2.9
7 10.7
1 1.9
1.2
3 6.8
5 8.5
VERY FAVORABLE
85 20.7
22 24.0
9 12.4
12 20.1
8 17.1
8 23.6
13 26.3
13 23.5
SOMEWHAT FAVORABLE
96 23.4
13 14.1
18 24.5
23 37.5
12 25.9
7 20.4
12 24.4
12 20.6
VERY UNFAVORABLE
11 2.7
1 1.6
1 1.0
4 5.9
1 1.9
1.2
1 3.0
3 4.6
SOMEWHAT UNFAVORABLE
10 2.4
1 1.4
1 1.9
3 4.8
2 3.8
2 3.8
HEARD OF NO OPINION
62 15.2
17 19.2
16 21.0
2 3.6
8 17.6
7 20.4
6 11.5
7 12.2
NEVER HEARD OF
142 34.7
34 37.5
29 39.2
17 28.1
16 34.7
11 34.4
15 30.9
20 35.2
REFUSED
3 0.8
2 2.2
1 2.9

Colorado Democrat Primary Survey, March 20th - 23rd, 2018, 410N, 4.84% MoE, Weighted Results, Magellan Strategies, 1685 Boxelder St. Suite 300, Louisville, CO 80027, 303-861-8585 Table 11-1 T11. PHIL WEISER GENDER~MARITAL AGE IDEOLOGY PARTY -------------------------------------------------------------------- -------------------------------------------------------- --------------------------------- --------------------------------------------------------------------
TOTAL ---------
MEN
---------
MEN MARR
---------
MEN SING
----------
WOM
---------
WOM MARR
---------
WOM SING
---------
18-34
---------
35-44
----------
45-54
---------
55-64
---------
65 PLUS
---------
VERY LIB
---------
LIB
---------
MOD
----------
DEM
---------
DEM MEN
---------
DEM WOM
---------
UNAF
---------
UNAF MEN
----------
UNAF WOM
---------
TOTAL
410 100.0
164 100.0
103 100.0
60 100.0
246 100.0
130 100.0
116 100.0
41 100.0
41 100.0
57 100.0
94 100.0
174 100.0
119 100.0
137 100.0
117 100.0
359 100.0
138 100.0
221 100.0
51 100.0
26 100.0
25 100.0
TOTAL FAVORABLE
38 9.2
20 11.9
14 13.4
6 9.6
18 7.3
14 10.8
4 3.4
4 10.8
0.8
10 17.8
10 10.3
13 7.4
10 8.6
14 10.1
8 6.6
37 10.3
20 14.2
18 7.9
0.9
1.9
TOTAL UNFAVORABLE
6 1.5
2 1.2
1 1.0
1 1.5
4 1.7
3 2.2
1 1.1
1 2.3
1 2.2
1 1.7
3 1.9
2 1.9
1 0.8
3 2.4
4 1.2
2 1.4
2 1.0
2 3.6
2 7.5
VERY FAVORABLE
20 4.9
11 6.8
9 9.2
2 2.9
9 3.6
9 6.7
3 6.2
4 6.3
4 4.5
10 5.5
3 2.2
10 7.3
4 3.3
20 5.6
11 8.2
9 4.0
SOMEWHAT FAVORABLE
18 4.3
8 5.1
4 4.2
4 6.7
9 3.7
5 4.0
4 3.4
2 4.7
0.8
7 11.5
5 5.8
3 1.9
8 6.4
4 2.7
4 3.4
17 4.8
8 6.1
9 4.0
0.9
1.9
VERY UNFAVORABLE
3 0.7
1 0.6
1 1.0
2 0.8
2 1.4
1 2.2
1 1.7
1 0.6
1 0.8
1 0.8
1 0.8
1 0.3
1 0.8
2 3.6
2 7.5
SOMEWHAT UNFAVORABLE
3 0.8
1 0.6
1 1.5
2 0.9
1 0.7
1 1.1
1 2.3
2 1.3
1 1.1
2 1.6
3 0.9
1 0.7
2 1.0
HEARD OF NO OPINION
38 9.3
15 9.0
11 10.9
4 5.9
23 9.5
15 11.6
8 7.2
2 6.0
6 14.3
5 9.2
10 10.8
14 8.2
12 10.2
13 9.7
12 10.4
35 9.6
14 9.8
21 9.5
4 7.0
1 4.7
2 9.4
NEVER HEARD OF
328 79.9
128 77.9
77 74.8
50 83.0
200 81.2
98 75.5
102 87.7
33 80.9
34 82.7
41 71.3
74 78.8
143 82.1
94 79.3
109 79.4
94 80.5
282 78.7
103 74.5
180 81.2
45 88.4
25 95.3
20 81.2
REFUSED
1 0.2
1 0.3
1 0.6
1 0.4
1 0.2
1 0.3
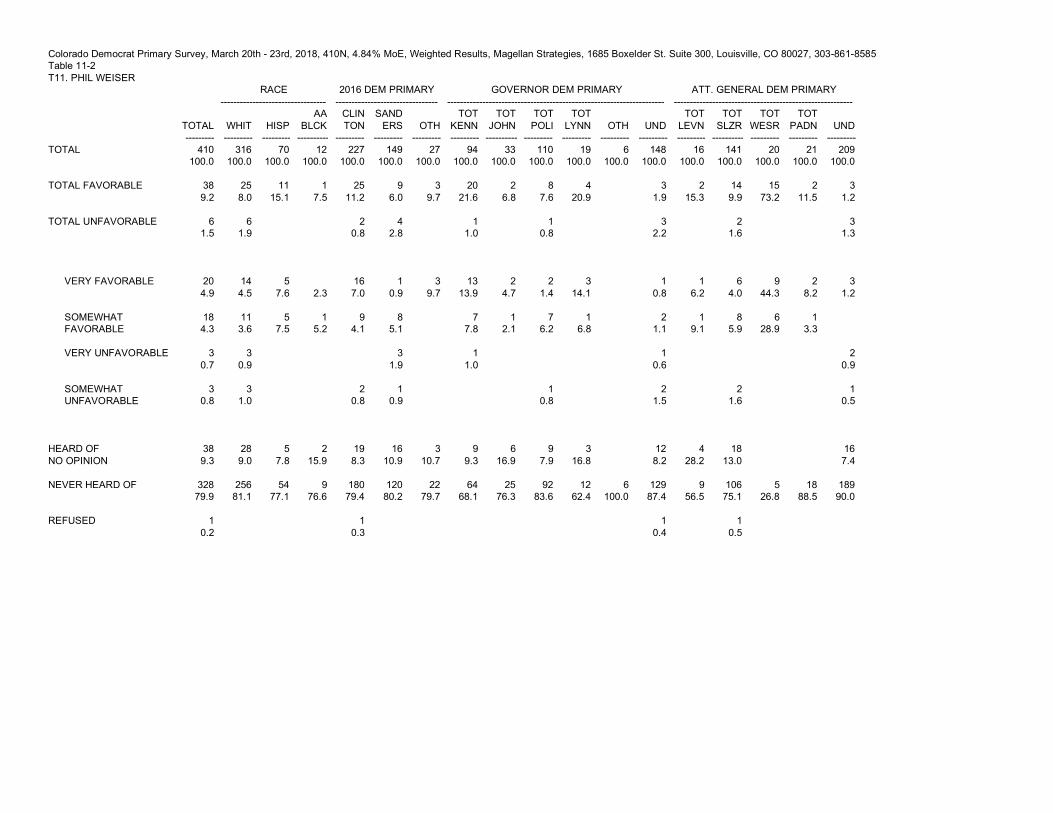
Colorado Democrat Primary Survey, March 20th - 23rd, 2018, 410N, 4.84% MoE, Weighted Results, Magellan Strategies, 1685 Boxelder St. Suite 300, Louisville, CO 80027, 303-861-8585 Table 11-2 T11. PHIL WEISER RACE 2016 DEM PRIMARY GOVERNOR DEM PRIMARY ATT. GENERAL DEM PRIMARY --------------------------------- -------------------------------- -------------------------------------------------------------------- --------------------------------------------------------
TOTAL ---------
WHIT
---------
HISP
---------
AA BLCK
----------
CLIN TON
---------
SAND ERS
---------
OTH
---------
TOT KENN
---------
TOT JOHN
----------
TOT POLI
---------
TOT LYNN
---------
OTH
---------
UND
---------
TOT LEVN
---------
TOT SLZR
----------
TOT WESR
---------
TOT PADN
---------
UND
---------
TOTAL
410 100.0
316 100.0
70 100.0
12 100.0
227 100.0
149 100.0
27 100.0
94 100.0
33 100.0
110 100.0
19 100.0
6 100.0
148 100.0
16 100.0
141 100.0
20 100.0
21 100.0
209 100.0
TOTAL FAVORABLE
38 9.2
25 8.0
11 15.1
1 7.5
25 11.2
9 6.0
3 9.7
20 21.6
2 6.8
8 7.6
4 20.9
3 1.9
2 15.3
14 9.9
15 73.2
2 11.5
3 1.2
TOTAL UNFAVORABLE
6 1.5
6 1.9
2 0.8
4 2.8
1 1.0
1 0.8
3 2.2
2 1.6
3 1.3
VERY FAVORABLE
20 4.9
14 4.5
5 7.6
2.3
16 7.0
1 0.9
3 9.7
13 13.9
2 4.7
2 1.4
3 14.1
1 0.8
1 6.2
6 4.0
9 44.3
2 8.2
3 1.2
SOMEWHAT FAVORABLE
18 4.3
11 3.6
5 7.5
1 5.2
9 4.1
8 5.1
7 7.8
1 2.1
7 6.2
1 6.8
2 1.1
1 9.1
8 5.9
6 28.9
1 3.3
VERY UNFAVORABLE
3 0.7
3 0.9
3 1.9
1 1.0
1 0.6
2 0.9
SOMEWHAT UNFAVORABLE
3 0.8
3 1.0
2 0.8
1 0.9
1 0.8
2 1.5
2 1.6
1 0.5
HEARD OF NO OPINION
38 9.3
28 9.0
5 7.8
2 15.9
19 8.3
16 10.9
3 10.7
9 9.3
6 16.9
9 7.9
3 16.8
12 8.2
4 28.2
18 13.0
16 7.4
NEVER HEARD OF
328 79.9
256 81.1
54 77.1
9 76.6
180 79.4
120 80.2
22 79.7
64 68.1
25 76.3
92 83.6
12 62.4
6 100.0
129 87.4
9 56.5
106 75.1
5 26.8
18 88.5
189 90.0
REFUSED
1 0.2
1 0.3
1 0.4
1 0.5

Colorado Democrat Primary Survey, March 20th - 23rd, 2018, 410N, 4.84% MoE, Weighted Results, Magellan Strategies, 1685 Boxelder St. Suite 300, Louisville, CO 80027, 303-861-8585 Table 11-3 T11. PHIL WEISER REGION BY CD --------------------------------------------------------------------------------
TOTAL
--------- CD1
--------- CD2
--------- CD3
---------- CD4
--------- CD5
--------- CD6
--------- CD7
---------
TOTAL
410 100.0
90 100.0
74 100.0
62 100.0
45 100.0
33 100.0
49 100.0
57 100.0
TOTAL FAVORABLE
38 9.2
11 12.4
6 8.0
5 8.3
3 6.0
1 3.9
3 5.4
9 15.1
TOTAL UNFAVORABLE
6 1.5
1 1.1
1 1.5
1 2.9
1 2.9
1 1.9
1 1.8
VERY FAVORABLE
20 4.9
6 6.7
4 5.4
2 3.7
2 4.7
1 2.8
4 7.2
SOMEWHAT FAVORABLE
18 4.3
5 5.7
2 2.6
3 4.6
1 1.3
1 3.9
1 2.6
5 8.0
VERY UNFAVORABLE
3 0.7
1 1.1
1 1.5
1 1.8
SOMEWHAT UNFAVORABLE
3 0.8
1 2.9
1 2.9
1 1.9
HEARD OF NO OPINION
38 9.3
10 10.7
6 8.4
5 8.3
2 5.3
6 17.2
3 6.7
6 10.2
NEVER HEARD OF
328 79.9
68 75.1
62 83.6
50 81.9
39 85.7
25 76.0
42 86.0
42 72.8
REFUSED
1 0.2
1 0.7
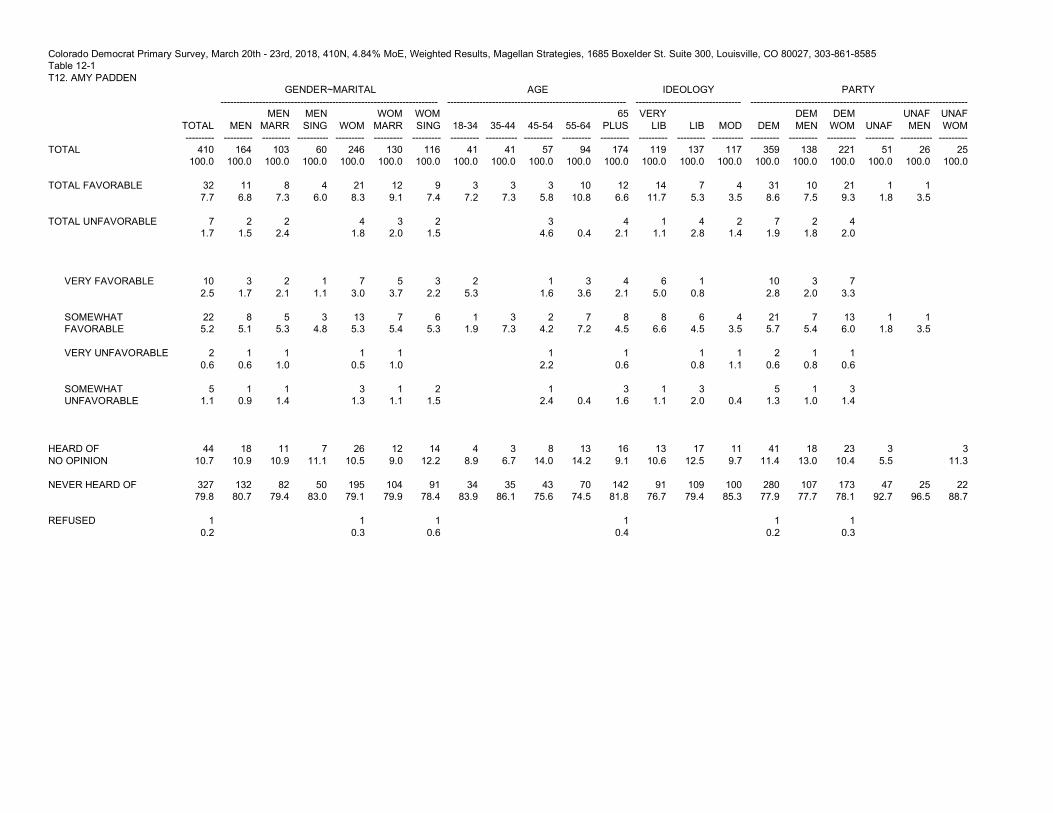
Colorado Democrat Primary Survey, March 20th - 23rd, 2018, 410N, 4.84% MoE, Weighted Results, Magellan Strategies, 1685 Boxelder St. Suite 300, Louisville, CO 80027, 303-861-8585 Table 12-1 T12. AMY PADDEN GENDER~MARITAL AGE IDEOLOGY PARTY -------------------------------------------------------------------- -------------------------------------------------------- --------------------------------- --------------------------------------------------------------------
TOTAL ---------
MEN
---------
MEN MARR
---------
MEN SING
----------
WOM
---------
WOM MARR
---------
WOM SING
---------
18-34
---------
35-44
----------
45-54
---------
55-64
---------
65 PLUS
---------
VERY LIB
---------
LIB
---------
MOD
----------
DEM
---------
DEM MEN
---------
DEM WOM
---------
UNAF
---------
UNAF MEN
----------
UNAF WOM
---------
TOTAL
410 100.0
164 100.0
103 100.0
60 100.0
246 100.0
130 100.0
116 100.0
41 100.0
41 100.0
57 100.0
94 100.0
174 100.0
119 100.0
137 100.0
117 100.0
359 100.0
138 100.0
221 100.0
51 100.0
26 100.0
25 100.0
TOTAL FAVORABLE
32 7.7
11 6.8
8 7.3
4 6.0
21 8.3
12 9.1
9 7.4
3 7.2
3 7.3
3 5.8
10 10.8
12 6.6
14 11.7
7 5.3
4 3.5
31 8.6
10 7.5
21 9.3
1 1.8
1 3.5
TOTAL UNFAVORABLE
7 1.7
2 1.5
2 2.4
4 1.8
3 2.0
2 1.5
3 4.6
0.4
4 2.1
1 1.1
4 2.8
2 1.4
7 1.9
2 1.8
4 2.0
VERY FAVORABLE
10 2.5
3 1.7
2 2.1
1 1.1
7 3.0
5 3.7
3 2.2
2 5.3
1 1.6
3 3.6
4 2.1
6 5.0
1 0.8
10 2.8
3 2.0
7 3.3
SOMEWHAT FAVORABLE
22 5.2
8 5.1
5 5.3
3 4.8
13 5.3
7 5.4
6 5.3
1 1.9
3 7.3
2 4.2
7 7.2
8 4.5
8 6.6
6 4.5
4 3.5
21 5.7
7 5.4
13 6.0
1 1.8
1 3.5
VERY UNFAVORABLE
2 0.6
1 0.6
1 1.0
1 0.5
1 1.0
1 2.2
1 0.6
1 0.8
1 1.1
2 0.6
1 0.8
1 0.6
SOMEWHAT UNFAVORABLE
5 1.1
1 0.9
1 1.4
3 1.3
1 1.1
2 1.5
1 2.4
0.4
3 1.6
1 1.1
3 2.0
0.4
5 1.3
1 1.0
3 1.4
HEARD OF NO OPINION
44 10.7
18 10.9
11 10.9
7 11.1
26 10.5
12 9.0
14 12.2
4 8.9
3 6.7
8 14.0
13 14.2
16 9.1
13 10.6
17 12.5
11 9.7
41 11.4
18 13.0
23 10.4
3 5.5
3 11.3
NEVER HEARD OF
327 79.8
132 80.7
82 79.4
50 83.0
195 79.1
104 79.9
91 78.4
34 83.9
35 86.1
43 75.6
70 74.5
142 81.8
91 76.7
109 79.4
100 85.3
280 77.9
107 77.7
173 78.1
47 92.7
25 96.5
22 88.7
REFUSED
1 0.2
1 0.3
1 0.6
1 0.4
1 0.2
1 0.3

Colorado Democrat Primary Survey, March 20th - 23rd, 2018, 410N, 4.84% MoE, Weighted Results, Magellan Strategies, 1685 Boxelder St. Suite 300, Louisville, CO 80027, 303-861-8585 Table 12-2 T12. AMY PADDEN RACE 2016 DEM PRIMARY GOVERNOR DEM PRIMARY ATT. GENERAL DEM PRIMARY --------------------------------- -------------------------------- -------------------------------------------------------------------- --------------------------------------------------------
TOTAL ---------
WHIT
---------
HISP
---------
AA BLCK
----------
CLIN TON
---------
SAND ERS
---------
OTH
---------
TOT KENN
---------
TOT JOHN
----------
TOT POLI
---------
TOT LYNN
---------
OTH
---------
UND
---------
TOT LEVN
---------
TOT SLZR
----------
TOT WESR
---------
TOT PADN
---------
UND
---------
TOTAL
410 100.0
316 100.0
70 100.0
12 100.0
227 100.0
149 100.0
27 100.0
94 100.0
33 100.0
110 100.0
19 100.0
6 100.0
148 100.0
16 100.0
141 100.0
20 100.0
21 100.0
209 100.0
TOTAL FAVORABLE
32 7.7
24 7.6
4 6.2
1 12.0
22 9.6
7 4.6
3 11.0
15 16.1
4 10.7
5 4.9
6 30.6
2 1.3
2 15.3
12 8.8
6 27.5
7 36.0
4 1.8
TOTAL UNFAVORABLE
7 1.7
4 1.2
3 3.8
3.4
3 1.3
4 2.5
3 3.0
1 1.1
2 1.2
3 2.1
1 6.7
1 0.7
VERY FAVORABLE
10 2.5
10 3.2
6 2.8
1 0.7
3 9.7
5 4.9
1 3.4
1 1.1
3 14.1
1 0.5
1 6.2
3 2.5
2 11.0
3 16.8
SOMEWHAT FAVORABLE
22 5.2
14 4.3
4 6.2
1 12.0
15 6.8
6 3.8
1.3
11 11.2
2 7.3
4 3.9
3 16.5
1 0.9
1 9.1
9 6.4
3 16.5
4 19.2
4 1.8
VERY UNFAVORABLE
2 0.6
1 0.3
1 1.8
1 0.5
1 0.7
1 1.1
1 0.9
SOMEWHAT UNFAVORABLE
5 1.1
3 0.9
1 2.0
3.4
2 0.8
3 1.8
3 3.0
2 1.2
2 1.2
1 6.7
1 0.7
HEARD OF NO OPINION
44 10.7
35 11.1
5 7.9
2 14.6
21 9.1
20 13.5
3 10.7
8 8.0
6 17.1
11 10.4
1 5.5
18 12.3
4 23.5
13 9.5
3 12.8
2 11.4
22 10.4
NEVER HEARD OF
327 79.8
253 80.2
57 82.2
9 70.0
181 79.7
118 79.4
21 78.4
69 73.0
24 72.1
92 83.5
12 63.9
6 100.0
125 84.7
10 61.2
111 79.1
11 53.0
11 52.6
183 87.2
REFUSED
1 0.2
1 0.3
1 0.4
1 0.5

Colorado Democrat Primary Survey, March 20th - 23rd, 2018, 410N, 4.84% MoE, Weighted Results, Magellan Strategies, 1685 Boxelder St. Suite 300, Louisville, CO 80027, 303-861-8585 Table 12-3 T12. AMY PADDEN REGION BY CD --------------------------------------------------------------------------------
TOTAL
--------- CD1
--------- CD2
--------- CD3
---------- CD4
--------- CD5
--------- CD6
--------- CD7
---------
TOTAL
410 100.0
90 100.0
74 100.0
62 100.0
45 100.0
33 100.0
49 100.0
57 100.0
TOTAL FAVORABLE
32 7.7
5 5.4
4 5.8
6 9.4
5 10.0
1 3.3
2 4.5
9 15.5
TOTAL UNFAVORABLE
7 1.7
1 1.5
1 1.9
1 2.0
1 2.9
0.8
1 1.8
VERY FAVORABLE
10 2.5
1 1.5
1 0.9
3 5.5
2 4.6
3 4.6
SOMEWHAT FAVORABLE
22 5.2
4 3.9
4 4.9
2 3.9
2 5.4
1 3.3
2 4.5
6 10.9
VERY UNFAVORABLE
2 0.6
1 2.0
1 1.8
SOMEWHAT UNFAVORABLE
5 1.1
1 1.5
1 1.9
1 2.9
0.8
HEARD OF NO OPINION
44 10.7
9 9.5
6 8.5
5 8.3
9 18.9
3 10.6
4 8.5
8 13.2
NEVER HEARD OF
327 79.8
75 82.8
62 83.8
49 80.3
31 68.2
28 86.1
42 86.1
40 69.5
REFUSED
1 0.2
1 0.7

Colorado Democrat Primary Survey, March 20th - 23rd, 2018, 410N, 4.84% MoE, Weighted Results, Magellan Strategies, 1685 Boxelder St. Suite 300, Louisville, CO 80027, 303-861-8585 Table 13-1 T13. If the Democratic primary election for Governor were being held today, for whom would you vote if the candidates were Cary Kennedy, Mike Johnston, Jared Polis, and Donna Lynne? GENDER~MARITAL AGE IDEOLOGY PARTY -------------------------------------------------------------------- -------------------------------------------------------- --------------------------------- --------------------------------------------------------------------
TOTAL ---------
MEN
---------
MEN MARR
---------
MEN SING
----------
WOM
---------
WOM MARR
---------
WOM SING
---------
18-34
---------
35-44
----------
45-54
---------
55-64
---------
65 PLUS
---------
VERY LIB
---------
LIB
---------
MOD
----------
DEM
---------
DEM MEN
---------
DEM WOM
---------
UNAF
---------
UNAF MEN
----------
UNAF WOM
---------
TOTAL
410 100.0
164 100.0
103 100.0
60 100.0
246 100.0
130 100.0
116 100.0
41 100.0
41 100.0
57 100.0
94 100.0
174 100.0
119 100.0
137 100.0
117 100.0
359 100.0
138 100.0
221 100.0
51 100.0
26 100.0
25 100.0
TOTAL POLIS
110 26.7
52 31.4
34 33.1
17 28.3
58 23.6
35 27.3
23 19.5
13 32.1
12 28.7
13 22.2
23 24.0
48 27.8
31 26.1
40 29.2
35 29.9
94 26.3
43 31.0
52 23.3
15 29.9
9 33.6
6 26.0
TOTAL KENNEDY
94 23.0
32 19.5
20 19.3
12 19.9
62 25.3
34 26.2
28 24.2
4 10.2
5 11.9
18 30.7
20 20.7
48 27.5
39 32.8
26 18.7
20 16.8
91 25.2
30 22.1
60 27.2
4 7.0
1 5.7
2 8.5
TOTAL JOHNSTON
33 8.0
16 10.0
11 10.2
6 9.7
16 6.6
8 6.3
8 7.0
2 5.5
3 6.7
6 9.7
5 4.8
17 9.6
13 10.8
9 6.2
10 8.8
29 8.0
14 9.9
15 6.8
4 7.6
3 10.5
1 4.5
TOTAL LYNNE
19 4.5
6 3.8
4 4.0
2 3.3
12 5.1
5 4.1
7 6.1
4 9.1
2 5.9
2 3.6
4 4.5
6 3.2
4 3.7
6 4.1
7 5.8
15 4.1
4 3.0
10 4.7
4 7.9
2 7.7
2 8.1
DEFINITELY POLIS
54 13.1
27 16.4
18 17.1
9 14.9
27 10.9
19 14.4
8 7.0
7 16.8
4 10.0
5 9.1
11 12.2
26 14.9
17 13.9
19 13.7
18 15.3
48 13.4
22 15.9
26 11.8
6 11.1
5 18.8
1 3.0
PROBABLY POLIS
56 13.6
25 15.0
17 16.0
8 13.3
31 12.7
17 12.9
14 12.4
6 15.2
8 18.7
8 13.1
11 11.8
23 12.9
14 12.1
21 15.4
17 14.6
46 12.9
21 15.0
26 11.5
10 18.8
4 14.8
6 23.1
DEFINITELY KENNEDY
52 12.7
22 13.5
12 11.6
10 16.8
30 12.2
20 15.3
10 8.7
2 5.4
2 3.9
9 15.9
12 13.0
27 15.5
24 20.1
13 9.8
11 9.7
50 13.9
22 16.1
28 12.6
2 4.1
2 8.5
PROBABLY KENNEDY
42 10.2
10 6.0
8 7.7
2 3.1
32 13.1
14 10.9
18 15.5
2 4.9
3 8.0
8 14.8
7 7.7
21 12.0
15 12.6
12 9.0
8 7.2
41 11.3
8 6.0
32 14.6
1 2.9
1 5.7
DEFINITELY JOHNSTON
14 3.4
9 5.7
6 6.2
3 4.8
5 1.8
2 1.4
3 2.3
0.7
1 1.8
1 1.8
1 0.8
10 5.9
6 4.7
5 3.4
3 2.7
13 3.6
8 6.1
5 2.0
1 1.8
1 3.5
PROBABLY JOHNSTON
19 4.6
7 4.3
4 4.0
3 4.9
12 4.8
6 4.8
5 4.7
2 4.8
2 4.9
5 8.0
4 3.9
6 3.7
7 6.1
4 2.9
7 6.1
16 4.4
5 3.8
11 4.8
3 5.8
2 7.0
1 4.5
DEFINITELY LYNNE
6 1.4
2 1.5
2 2.4
3 1.3
1 0.9
2 1.9
1 1.6
1 2.7
2 2.4
1 0.7
1 0.5
3 2.0
1 1.1
6 1.6
2 1.8
3 1.5
PROBABLY LYNNE
13 3.1
4 2.3
2 1.7
2 3.3
9 3.7
4 3.3
5 4.3
3 7.5
1 3.2
2 3.6
2 2.2
4 2.5
4 3.3
3 2.1
6 4.8
9 2.5
2 1.2
7 3.2
4 7.9
2 7.7
2 8.1
SOME OTHER CANDIDATE
6 1.4
2 1.3
2 2.0
4 1.5
4 3.1
1 2.7
1 1.4
1 0.9
3 1.6
1 0.9
4 2.7
1 0.7
6 1.6
2 1.5
4 1.6
UNDECIDED
148 36.1
54 33.1
31 29.8
23 38.8
94 38.0
47 36.1
47 40.1
17 41.7
18 44.0
19 32.3
42 45.0
52 29.7
30 25.2
53 38.3
44 37.9
123 34.4
43 31.3
80 36.3
24 47.6
11 42.6
13 52.9
REFUSED
2 0.4
2 1.0
2 1.6
1 1.4
1 0.6
1 0.5
1 0.8
2 0.5
2 1.2

Colorado Democrat Primary Survey, March 20th - 23rd, 2018, 410N, 4.84% MoE, Weighted Results, Magellan Strategies, 1685 Boxelder St. Suite 300, Louisville, CO 80027, 303-861-8585 Table 13-2 T13. If the Democratic primary election for Governor were being held today, for whom would you vote if the candidates were Cary Kennedy, Mike Johnston, Jared Polis, and Donna Lynne? RACE 2016 DEM PRIMARY GOVERNOR DEM PRIMARY ATT. GENERAL DEM PRIMARY --------------------------------- -------------------------------- -------------------------------------------------------------------- --------------------------------------------------------
TOTAL ---------
WHIT
---------
HISP
---------
AA BLCK
----------
CLIN TON
---------
SAND ERS
---------
OTH
---------
TOT KENN
---------
TOT JOHN
----------
TOT POLI
---------
TOT LYNN
---------
OTH
---------
UND
---------
TOT LEVN
---------
TOT SLZR
----------
TOT WESR
---------
TOT PADN
---------
UND
---------
TOTAL
410 100.0
316 100.0
70 100.0
12 100.0
227 100.0
149 100.0
27 100.0
94 100.0
33 100.0
110 100.0
19 100.0
6 100.0
148 100.0
16 100.0
141 100.0
20 100.0
21 100.0
209 100.0
TOTAL POLIS
110 26.7
93 29.4
11 16.4
1 10.6
63 27.8
40 26.6
5 17.2
110 100.0
1 5.8
51 36.2
2 9.3
5 24.3
51 24.2
TOTAL KENNEDY
94 23.0
73 23.0
17 24.8
2 19.0
59 25.8
34 23.0
1 4.3
94 100.0
7 45.2
39 27.6
13 62.9
2 11.2
32 15.2
TOTAL JOHNSTON
33 8.0
23 7.2
7 9.7
2 19.8
16 7.1
14 9.1
3 10.5
33 100.0
3 22.1
14 9.7
3 13.1
6 30.3
7 3.1
TOTAL LYNNE
19 4.5
12 3.9
4 5.6
1 5.5
11 5.0
4 2.9
3 11.0
19 100.0
2 12.2
9 6.4
3 16.7
4 2.0
DEFINITELY POLIS
54 13.1
45 14.4
5 7.6
1 10.6
34 15.1
16 10.8
1 4.9
54 49.0
28 20.2
2 10.9
23 11.0
PROBABLY POLIS
56 13.6
47 15.0
6 8.8
29 12.7
24 15.8
3 12.3
56 51.0
1 5.8
23 16.0
2 9.3
3 13.5
28 13.2
DEFINITELY KENNEDY
52 12.7
41 13.0
7 10.3
2 19.0
32 14.2
20 13.3
52 55.4
3 20.9
20 14.0
10 51.3
2 8.7
16 7.5
PROBABLY KENNEDY
42 10.2
31 9.9
10 14.5
26 11.6
14 9.6
1 4.3
42 44.6
4 24.2
19 13.6
2 11.6
1 2.6
16 7.7
DEFINITELY JOHNSTON
14 3.4
11 3.6
1 1.4
1 6.2
8 3.4
5 3.5
1 3.7
14 42.5
1 6.5
4 2.9
2 9.8
4 19.7
3 1.3
PROBABLY JOHNSTON
19 4.6
11 3.6
6 8.3
2 13.7
8 3.7
8 5.7
2 6.8
19 57.5
2 15.6
10 6.8
1 3.3
2 10.7
4 1.8
DEFINITELY LYNNE
6 1.4
4 1.2
1 1.8
4 1.7
1 0.4
1 4.3
6 30.8
3 2.4
1 5.6
1 0.6
PROBABLY LYNNE
13 3.1
8 2.7
3 3.8
1 5.5
7 3.3
4 2.4
2 6.6
13 69.2
2 12.2
6 4.0
2 11.1
3 1.5
SOME OTHER CANDIDATE
6 1.4
6 1.8
4 1.6
2 1.3
6 100.0
4 2.5
2 1.0
UNDECIDED
148 36.1
108 34.2
30 43.6
6 45.0
74 32.6
54 36.1
15 57.0
148 100.0
2 14.8
25 17.5
3 14.7
4 17.4
114 54.5
REFUSED
2 0.4
2 0.5
2 1.1

Colorado Democrat Primary Survey, March 20th - 23rd, 2018, 410N, 4.84% MoE, Weighted Results, Magellan Strategies, 1685 Boxelder St. Suite 300, Louisville, CO 80027, 303-861-8585 Table 13-3 T13. If the Democratic primary election for Governor were being held today, for whom would you vote if the candidates were Cary Kennedy, Mike Johnston, Jared Polis, and Donna Lynne? REGION BY CD --------------------------------------------------------------------------------
TOTAL
--------- CD1
--------- CD2
--------- CD3
---------- CD4
--------- CD5
--------- CD6
--------- CD7
---------
TOTAL
410 100.0
90 100.0
74 100.0
62 100.0
45 100.0
33 100.0
49 100.0
57 100.0
TOTAL POLIS
110 26.7
14 15.2
36 49.3
12 20.0
12 27.6
4 13.0
14 28.7
16 28.4
TOTAL KENNEDY
94 23.0
22 24.9
14 19.4
13 20.8
8 18.4
9 27.3
10 19.4
18 30.9
TOTAL JOHNSTON
33 8.0
10 11.6
10 15.9
1 2.7
3 8.2
4 7.8
5 8.0
TOTAL LYNNE
19 4.5
4 4.0
1 1.5
3 5.2
2 4.9
4 12.5
1 2.5
3 5.4
DEFINITELY POLIS
54 13.1
6 6.6
22 29.6
6 9.1
5 10.3
1.5
9 18.6
6 10.6
PROBABLY POLIS
56 13.6
8 8.7
15 19.7
7 11.0
8 17.3
4 11.5
5 10.1
10 17.7
DEFINITELY KENNEDY
52 12.7
16 17.3
4 5.2
5 8.6
3 7.2
6 17.9
5 9.8
14 23.6
PROBABLY KENNEDY
42 10.2
7 7.6
11 14.3
7 12.1
5 11.2
3 9.4
5 9.7
4 7.4
DEFINITELY JOHNSTON
14 3.4
6 6.2
4 5.9
1 2.2
2 4.5
2 3.0
PROBABLY JOHNSTON
19 4.6
5 5.5
6 10.0
1 2.7
2 6.0
2 3.4
3 4.9
DEFINITELY LYNNE
6 1.4
1 1.3
1 1.5
1 1.9
2 3.9
PROBABLY LYNNE
13 3.1
2 2.7
2 3.3
2 4.9
4 12.5
1 2.5
1 1.5
SOME OTHER CANDIDATE
6 1.4
1 1.4
3 3.7
1 1.3
1 1.8
UNDECIDED
148 36.1
38 42.2
19 26.1
23 36.7
21 46.3
13 39.0
20 39.8
15 25.5
REFUSED
2 0.4
1 0.7
1 1.8

Colorado Democrat Primary Survey, March 20th - 23rd, 2018, 410N, 4.84% MoE, Weighted Results, Magellan Strategies, 1685 Boxelder St. Suite 300, Louisville, CO 80027, 303-861-8585 Table 14-1 T14. If the Democratic primary election for Attorney General were being held today, for whom would you vote if the candidates were Brad Levin, Joe Salazar, Phil Weiser, and Amy Padden? GENDER~MARITAL AGE IDEOLOGY PARTY -------------------------------------------------------------------- -------------------------------------------------------- --------------------------------- --------------------------------------------------------------------
TOTAL ---------
MEN
---------
MEN MARR
---------
MEN SING
----------
WOM
---------
WOM MARR
---------
WOM SING
---------
18-34
---------
35-44
----------
45-54
---------
55-64
---------
65 PLUS
---------
VERY LIB
---------
LIB
---------
MOD
----------
DEM
---------
DEM MEN
---------
DEM WOM
---------
UNAF
---------
UNAF MEN
----------
UNAF WOM
---------
TOTAL
410 100.0
164 100.0
103 100.0
60 100.0
246 100.0
130 100.0
116 100.0
41 100.0
41 100.0
57 100.0
94 100.0
174 100.0
119 100.0
137 100.0
117 100.0
359 100.0
138 100.0
221 100.0
51 100.0
26 100.0
25 100.0
TOTAL SALAZAR
141 34.3
54 33.0
35 33.5
20 32.4
87 35.2
46 35.5
40 34.8
6 15.8
9 22.8
22 38.6
39 41.4
63 36.2
45 37.5
38 27.4
47 39.9
131 36.7
48 35.1
83 37.6
9 18.1
6 22.0
3 13.9
TOTAL WEISER
20 5.0
7 4.1
5 5.1
1 2.5
14 5.6
11 8.3
3 2.5
2 4.6
2 3.8
4 6.6
4 4.6
9 5.1
5 4.6
9 6.5
5 4.6
20 5.7
7 4.9
14 6.2
TOTAL PADDEN
21 5.1
9 5.7
5 4.7
4 7.4
11 4.6
5 3.7
7 5.7
3 7.1
2 6.1
2 3.0
4 4.4
9 5.0
6 5.2
7 5.0
4 3.6
17 4.9
7 5.1
10 4.7
3 6.4
2 8.9
1 3.8
TOTAL LEVIN
16 3.8
5 3.0
3 3.3
2 2.7
11 4.3
5 3.7
6 5.0
2 6.0
2 4.0
2 3.0
6 6.1
4 2.3
6 5.0
3 1.9
6 5.0
15 4.2
4 3.2
11 4.8
1 1.2
1 2.2
DEFINITELY SALAZAR
75 18.3
27 16.7
19 18.3
8 14.0
48 19.5
21 16.3
27 22.9
3 6.9
5 12.5
8 13.5
20 20.8
40 22.9
26 21.8
19 13.6
24 20.2
71 19.7
24 17.3
47 21.1
5 9.1
4 13.4
1 4.6
PROBABLY SALAZAR
66 16.0
27 16.3
16 15.2
11 18.4
39 15.7
25 19.2
14 11.9
4 8.8
4 10.3
14 25.0
19 20.6
23 13.3
19 15.7
19 13.8
23 19.7
61 17.0
25 17.8
36 16.5
5 9.0
2 8.7
2 9.3
DEFINITELY WEISER
11 2.7
3 1.9
3 3.1
8 3.2
7 5.2
1 1.0
1 1.8
1 2.0
1 2.3
3 3.2
5 3.0
3 2.3
6 4.4
2 1.9
11 3.1
3 2.3
8 3.5
PROBABLY WEISER
9 2.3
4 2.2
2 2.0
1 2.5
6 2.4
4 3.1
2 1.5
1 2.8
1 1.8
2 4.3
1 1.5
4 2.1
3 2.3
3 2.1
3 2.6
9 2.6
4 2.6
6 2.7
DEFINITELY PADDEN
5 1.2
0.3
0.7
5 1.8
2 1.5
2 2.1
2 3.8
1 0.9
3 1.4
2 1.8
3 2.1
5 1.4
0.3
5 2.0
PROBABLY PADDEN
16 3.9
9 5.4
5 4.7
4 6.7
7 2.8
3 2.2
4 3.6
3 7.1
1 2.3
2 3.0
3 3.5
6 3.6
6 5.2
5 3.3
2 1.5
13 3.5
7 4.8
6 2.7
3 6.4
2 8.9
1 3.8
DEFINITELY LEVIN
8 2.0
3 1.9
2 2.1
1 1.7
5 2.0
1 0.9
4 3.3
2 4.6
0.8
1 1.8
4 4.3
1 0.5
4 3.4
3 2.5
8 2.3
3 2.3
5 2.2
PROBABLY LEVIN
7 1.8
2 1.1
1 1.2
1 1.0
6 2.3
4 2.9
2 1.7
1 1.4
1 3.2
1 1.2
2 1.8
3 1.8
2 1.6
3 1.9
3 2.5
7 1.9
1 0.9
6 2.6
1 1.2
1 2.2
UNDECIDED UNSURE NO OPINION
209 51.1
86 52.3
54 51.8
32 53.0
124 50.3
63 48.7
60 52.0
27 65.1
26 63.4
27 46.6
41 43.5
88 50.8
55 46.1
80 58.4
55 46.9
171 47.8
68 49.6
103 46.7
38 74.4
18 66.8
21 82.3
REFUSED
3 0.7
3 1.8
2 1.6
1 2.1
1 1.4
1 2.2
1 0.6
2 1.6
1 0.8
3 0.8
3 2.1

Colorado Democrat Primary Survey, March 20th - 23rd, 2018, 410N, 4.84% MoE, Weighted Results, Magellan Strategies, 1685 Boxelder St. Suite 300, Louisville, CO 80027, 303-861-8585 Table 14-2 T14. If the Democratic primary election for Attorney General were being held today, for whom would you vote if the candidates were Brad Levin, Joe Salazar, Phil Weiser, and Amy Padden? RACE 2016 DEM PRIMARY GOVERNOR DEM PRIMARY ATT. GENERAL DEM PRIMARY --------------------------------- -------------------------------- -------------------------------------------------------------------- --------------------------------------------------------
TOTAL ---------
WHIT
---------
HISP
---------
AA BLCK
----------
CLIN TON
---------
SAND ERS
---------
OTH
---------
TOT KENN
---------
TOT JOHN
----------
TOT POLI
---------
TOT LYNN
---------
OTH
---------
UND
---------
TOT LEVN
---------
TOT SLZR
----------
TOT WESR
---------
TOT PADN
---------
UND
---------
TOTAL
410 100.0
316 100.0
70 100.0
12 100.0
227 100.0
149 100.0
27 100.0
94 100.0
33 100.0
110 100.0
19 100.0
6 100.0
148 100.0
16 100.0
141 100.0
20 100.0
21 100.0
209 100.0
TOTAL SALAZAR
141 34.3
97 30.6
35 49.9
5 41.5
89 39.0
41 27.1
11 40.6
39 41.2
14 41.9
51 46.6
9 48.4
4 63.3
25 16.7
141 100.0
TOTAL WEISER
20 5.0
17 5.5
3 4.0
17 7.4
4 2.5
13 13.7
3 8.2
2 1.7
3 2.0
20 100.0
TOTAL PADDEN
21 5.1
18 5.7
1 7.2
9 3.8
11 7.1
2 6.3
2 2.5
6 19.3
5 4.6
3 18.6
4 2.4
21 100.0
TOTAL LEVIN
16 3.8
10 3.2
3 4.6
2 12.5
7 3.3
6 4.0
2 7.8
7 7.5
3 10.6
1 0.8
2 10.2
2 1.6
16 100.0
DEFINITELY SALAZAR
75 18.3
50 15.7
20 28.4
4 34.2
54 23.7
19 12.9
2 8.3
28 30.1
6 18.8
23 20.7
7 38.0
4 63.3
8 5.1
75 53.4
PROBABLY SALAZAR
66 16.0
47 14.9
15 21.5
1 7.4
35 15.4
21 14.3
9 32.3
10 11.1
8 23.1
28 25.9
2 10.5
17 11.6
66 46.6
DEFINITELY WEISER
11 2.7
10 3.2
1 1.1
11 4.8
9 9.2
1 3.9
0.3
1 0.5
11 53.8
PROBABLY WEISER
9 2.3
7 2.3
2 2.9
6 2.6
4 2.5
4 4.5
1 4.3
2 1.5
2 1.5
9 46.2
DEFINITELY PADDEN
5 1.2
5 1.4
3.5
3 1.5
2 1.0
2 1.9
2 2.1
1 0.6
5 23.7
PROBABLY PADDEN
16 3.9
13 4.2
3.7
5 2.3
9 6.0
2 6.3
1 0.6
6 19.3
3 2.6
3 18.6
3 1.9
16 76.3
DEFINITELY LEVIN
8 2.0
5 1.6
2 2.7
2.5
4 1.9
3 1.9
1 3.7
5 5.3
1 3.1
1 0.8
1 0.8
8 52.1
PROBABLY LEVIN
7 1.8
5 1.6
1 1.9
1 10.0
3 1.4
3 2.1
1 4.1
2 2.1
2 7.5
2 10.2
1 0.8
7 47.9
UNDECIDED UNSURE NO OPINION
209 51.1
171 54.2
29 41.5
5 38.8
104 46.0
87 58.2
12 45.3
32 33.8
7 20.0
51 46.3
4 22.7
2 36.7
114 77.2
209 100.0
REFUSED
3 0.7
3 0.9
1 0.6
2 1.1
1 1.4

Colorado Democrat Primary Survey, March 20th - 23rd, 2018, 410N, 4.84% MoE, Weighted Results, Magellan Strategies, 1685 Boxelder St. Suite 300, Louisville, CO 80027, 303-861-8585 Table 14-3 T14. If the Democratic primary election for Attorney General were being held today, for whom would you vote if the candidates were Brad Levin, Joe Salazar, Phil Weiser, and Amy Padden? REGION BY CD --------------------------------------------------------------------------------
TOTAL
--------- CD1
--------- CD2
--------- CD3
---------- CD4
--------- CD5
--------- CD6
--------- CD7
---------
TOTAL
410 100.0
90 100.0
74 100.0
62 100.0
45 100.0
33 100.0
49 100.0
57 100.0
TOTAL SALAZAR
141 34.3
34 37.5
20 26.6
26 42.9
14 31.7
10 31.0
20 40.0
17 29.2
TOTAL WEISER
20 5.0
6 6.9
1 1.8
2 3.1
1 2.9
1 2.0
9 15.0
TOTAL PADDEN
21 5.1
5 5.3
2 2.4
4 7.3
4 9.4
1 3.5
2 3.6
3 4.4
TOTAL LEVIN
16 3.8
4 4.3
2 3.6
4 8.5
3 8.0
1 2.0
2 3.4
DEFINITELY SALAZAR
75 18.3
20 22.1
9 12.4
11 17.2
9 19.8
4 12.2
14 28.7
9 14.9
PROBABLY SALAZAR
66 16.0
14 15.4
10 14.1
16 25.8
5 11.9
6 18.8
6 11.3
8 14.4
DEFINITELY WEISER
11 2.7
4 4.5
1 1.8
1 1.8
5 8.0
PROBABLY WEISER
9 2.3
2 2.5
1 1.3
1 2.9
1 2.0
4 7.1
DEFINITELY PADDEN
5 1.2
2 2.0
1 1.5
1 1.8
1 2.0
PROBABLY PADDEN
16 3.9
3 3.3
1 0.9
4 7.3
4 9.4
1 3.5
1 1.9
1 2.4
DEFINITELY LEVIN
8 2.0
2 2.3
1 1.8
3 8.0
0.6
2 3.4
PROBABLY LEVIN
7 1.8
2 2.0
1 1.8
4 8.5
1 1.4
UNDECIDED UNSURE NO OPINION
209 51.1
41 45.2
51 69.2
26 43.0
21 47.5
18 53.5
26 52.3
26 46.1
REFUSED
3 0.7
1 0.7
1 3.9
1 1.8

Colorado Democrat Primary Survey, March 20th - 23rd, 2018, 410N, 4.84% MoE, Weighted Results, Magellan Strategies, 1685 Boxelder St. Suite 300, Louisville, CO 80027, 303-861-8585 Table 15-1 T15. If you could have voted in the 2016 Democratic Presidential Primary, would you have voted for Hillary Clinton, Bernie Sanders or some other candidate? GENDER~MARITAL AGE IDEOLOGY PARTY -------------------------------------------------------------------- -------------------------------------------------------- --------------------------------- --------------------------------------------------------------------
TOTAL ---------
MEN
---------
MEN MARR
---------
MEN SING
----------
WOM
---------
WOM MARR
---------
WOM SING
---------
18-34
---------
35-44
----------
45-54
---------
55-64
---------
65 PLUS
---------
VERY LIB
---------
LIB
---------
MOD
----------
DEM
---------
DEM MEN
---------
DEM WOM
---------
UNAF
---------
UNAF MEN
----------
UNAF WOM
---------
TOTAL
410 100.0
164 100.0
103 100.0
60 100.0
246 100.0
130 100.0
116 100.0
41 100.0
41 100.0
57 100.0
94 100.0
174 100.0
119 100.0
137 100.0
117 100.0
359 100.0
138 100.0
221 100.0
51 100.0
26 100.0
25 100.0
HILLARY CLINTON
227 55.4
83 50.6
58 56.1
25 41.0
144 58.6
74 57.2
70 60.1
15 36.0
15 37.3
30 52.2
57 60.2
109 62.6
52 43.8
79 57.6
80 68.0
206 57.5
71 51.8
135 61.0
21 40.8
12 44.4
9 36.9
BERNIE SANDERS
149 36.4
61 37.1
34 32.4
27 45.4
88 35.9
46 35.2
43 36.8
25 60.4
23 55.0
24 42.5
27 29.0
49 28.4
62 52.0
52 37.7
27 23.2
126 35.2
51 37.3
75 33.8
23 45.0
9 36.0
14 54.6
SOME OTHER CANDIDATE
27 6.6
16 10.0
9 8.9
7 11.8
11 4.4
9 7.2
1 1.2
1 2.3
3 7.7
3 5.4
7 7.3
13 7.5
3 2.6
6 4.4
8 6.8
20 5.5
11 8.1
9 3.9
7 14.2
5 19.6
2 8.5
UNDECIDED REFUSED
6 1.6
4 2.3
3 2.6
1 1.8
3 1.1
0.4
2 2.0
1 1.4
3 3.5
3 1.5
2 1.7
0.3
2 2.0
6 1.8
4 2.7
3 1.3

Colorado Democrat Primary Survey, March 20th - 23rd, 2018, 410N, 4.84% MoE, Weighted Results, Magellan Strategies, 1685 Boxelder St. Suite 300, Louisville, CO 80027, 303-861-8585 Table 15-2 T15. If you could have voted in the 2016 Democratic Presidential Primary, would you have voted for Hillary Clinton, Bernie Sanders or some other candidate? RACE 2016 DEM PRIMARY GOVERNOR DEM PRIMARY ATT. GENERAL DEM PRIMARY --------------------------------- -------------------------------- -------------------------------------------------------------------- --------------------------------------------------------
TOTAL ---------
WHIT
---------
HISP
---------
AA BLCK
----------
CLIN TON
---------
SAND ERS
---------
OTH
---------
TOT KENN
---------
TOT JOHN
----------
TOT POLI
---------
TOT LYNN
---------
OTH
---------
UND
---------
TOT LEVN
---------
TOT SLZR
----------
TOT WESR
---------
TOT PADN
---------
UND
---------
TOTAL
410 100.0
316 100.0
70 100.0
12 100.0
227 100.0
149 100.0
27 100.0
94 100.0
33 100.0
110 100.0
19 100.0
6 100.0
148 100.0
16 100.0
141 100.0
20 100.0
21 100.0
209 100.0
HILLARY CLINTON
227 55.4
174 55.2
39 56.6
10 79.8
227 100.0
59 62.3
16 49.4
63 57.7
11 61.1
4 65.7
74 50.1
7 48.0
89 63.0
17 82.1
9 41.0
104 49.8
BERNIE SANDERS
149 36.4
113 35.7
28 40.3
2 20.2
149 100.0
34 36.4
14 41.8
40 36.2
4 23.0
2 34.3
54 36.4
6 38.4
41 28.8
4 17.9
11 50.8
87 41.5
SOME OTHER CANDIDATE
27 6.6
23 7.3
2 3.1
27 100.0
1 1.2
3 8.7
5 4.3
3 16.0
15 10.5
2 13.6
11 7.8
2 8.2
12 5.9
UNDECIDED REFUSED
6 1.6
6 1.8
2 1.8
4 3.0
1 0.4
6 2.8

Colorado Democrat Primary Survey, March 20th - 23rd, 2018, 410N, 4.84% MoE, Weighted Results, Magellan Strategies, 1685 Boxelder St. Suite 300, Louisville, CO 80027, 303-861-8585 Table 15-3 T15. If you could have voted in the 2016 Democratic Presidential Primary, would you have voted for Hillary Clinton, Bernie Sanders or some other candidate? REGION BY CD --------------------------------------------------------------------------------
TOTAL
--------- CD1
--------- CD2
--------- CD3
---------- CD4
--------- CD5
--------- CD6
--------- CD7
---------
TOTAL
410 100.0
90 100.0
74 100.0
62 100.0
45 100.0
33 100.0
49 100.0
57 100.0
HILLARY CLINTON
227 55.4
46 51.1
45 60.6
32 51.8
20 45.1
19 56.7
34 70.0
31 54.0
BERNIE SANDERS
149 36.4
42 46.4
25 34.2
20 32.4
18 39.3
13 41.0
11 22.3
20 35.2
SOME OTHER CANDIDATE
27 6.6
2 2.5
2 3.2
10 15.9
2 5.5
1 2.3
4 7.7
6 10.0
UNDECIDED REFUSED
6 1.6
1 2.0
5 10.2
0.8

Colorado Democrat Primary Survey, March 20th - 23rd, 2018, 410N, 4.84% MoE, Weighted Results, Magellan Strategies, 1685 Boxelder St. Suite 300, Louisville, CO 80027, 303-861-8585 Table 16-1 And now I have a few questions for statistical purposes only... T16. Do you consider yourself to be very liberal, somewhat liberal, moderate or conservative in your political beliefs? GENDER~MARITAL AGE IDEOLOGY PARTY -------------------------------------------------------------------- -------------------------------------------------------- --------------------------------- --------------------------------------------------------------------
TOTAL ---------
MEN
---------
MEN MARR
---------
MEN SING
----------
WOM
---------
WOM MARR
---------
WOM SING
---------
18-34
---------
35-44
----------
45-54
---------
55-64
---------
65 PLUS
---------
VERY LIB
---------
LIB
---------
MOD
----------
DEM
---------
DEM MEN
---------
DEM WOM
---------
UNAF
---------
UNAF MEN
----------
UNAF WOM
---------
TOTAL
410 100.0
164 100.0
103 100.0
60 100.0
246 100.0
130 100.0
116 100.0
41 100.0
41 100.0
57 100.0
94 100.0
174 100.0
119 100.0
137 100.0
117 100.0
359 100.0
138 100.0
221 100.0
51 100.0
26 100.0
25 100.0
VERY LIBERAL
119 29.0
44 27.0
23 22.0
21 35.2
75 30.4
42 32.3
33 28.2
15 37.0
13 32.8
16 27.4
19 20.7
54 30.9
119 100.0
109 30.4
40 29.2
69 31.2
10 18.9
4 15.1
6 22.9
SOMEWHAT LIBERAL
137 33.5
58 35.5
40 38.7
18 30.2
79 32.2
46 35.4
33 28.5
12 30.2
14 33.8
27 46.9
35 36.8
49 28.4
137 100.0
122 33.9
50 36.0
72 32.6
16 30.4
9 32.8
7 27.9
MODERATE
117 28.6
47 28.5
36 35.2
10 17.2
70 28.6
34 25.8
37 31.8
10 23.4
10 24.6
11 18.9
32 34.5
53 30.6
117 100.0
95 26.5
34 24.5
62 27.8
22 42.9
13 49.6
9 35.8
CONSERVATIVE
31 7.5
14 8.7
4 4.1
10 16.7
17 6.8
8 6.5
8 7.1
4 9.4
3 7.3
3 4.6
4 4.8
17 9.7
28 7.7
14 9.9
14 6.4
3 6.1
1 2.5
2 9.9
DON'T KNOW REFUSED
6 1.4
1 0.4
0.7
5 2.1
5 4.4
1 1.5
1 2.2
3 3.4
1 0.4
5 1.3
1 0.4
4 1.9
1 1.7
1 3.5
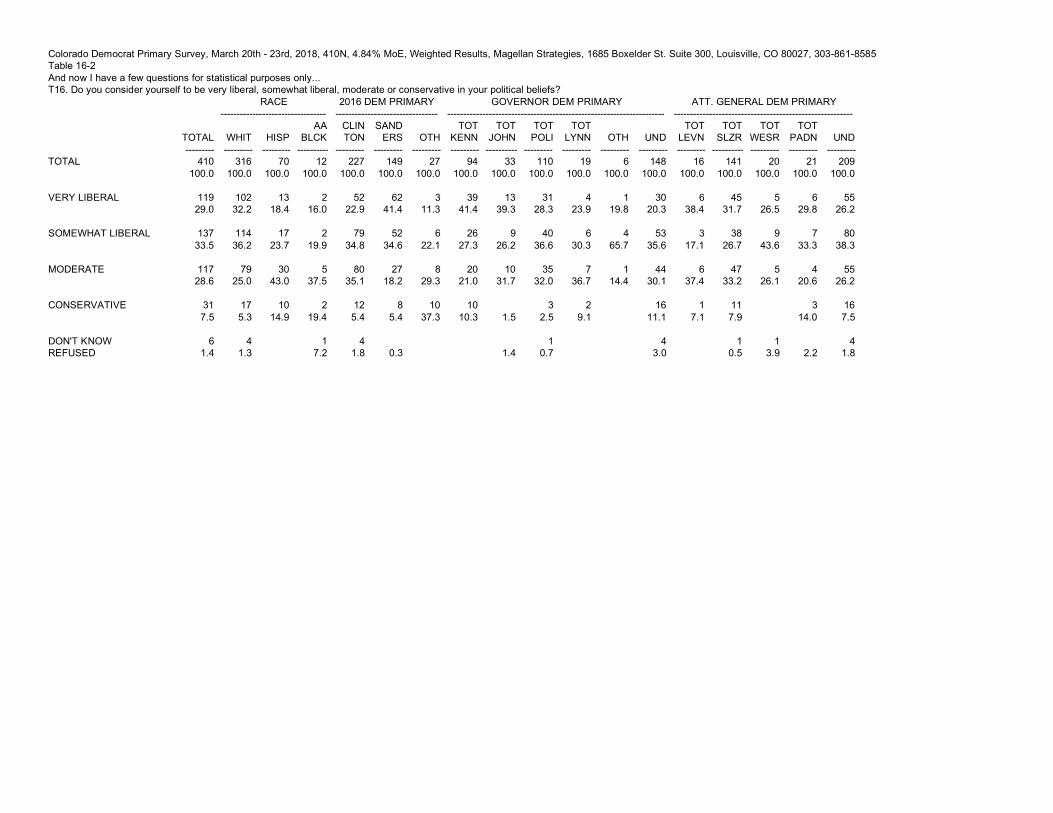
Colorado Democrat Primary Survey, March 20th - 23rd, 2018, 410N, 4.84% MoE, Weighted Results, Magellan Strategies, 1685 Boxelder St. Suite 300, Louisville, CO 80027, 303-861-8585 Table 16-2 And now I have a few questions for statistical purposes only... T16. Do you consider yourself to be very liberal, somewhat liberal, moderate or conservative in your political beliefs? RACE 2016 DEM PRIMARY GOVERNOR DEM PRIMARY ATT. GENERAL DEM PRIMARY --------------------------------- -------------------------------- -------------------------------------------------------------------- --------------------------------------------------------
TOTAL ---------
WHIT
---------
HISP
---------
AA BLCK
----------
CLIN TON
---------
SAND ERS
---------
OTH
---------
TOT KENN
---------
TOT JOHN
----------
TOT POLI
---------
TOT LYNN
---------
OTH
---------
UND
---------
TOT LEVN
---------
TOT SLZR
----------
TOT WESR
---------
TOT PADN
---------
UND
---------
TOTAL
410 100.0
316 100.0
70 100.0
12 100.0
227 100.0
149 100.0
27 100.0
94 100.0
33 100.0
110 100.0
19 100.0
6 100.0
148 100.0
16 100.0
141 100.0
20 100.0
21 100.0
209 100.0
VERY LIBERAL
119 29.0
102 32.2
13 18.4
2 16.0
52 22.9
62 41.4
3 11.3
39 41.4
13 39.3
31 28.3
4 23.9
1 19.8
30 20.3
6 38.4
45 31.7
5 26.5
6 29.8
55 26.2
SOMEWHAT LIBERAL
137 33.5
114 36.2
17 23.7
2 19.9
79 34.8
52 34.6
6 22.1
26 27.3
9 26.2
40 36.6
6 30.3
4 65.7
53 35.6
3 17.1
38 26.7
9 43.6
7 33.3
80 38.3
MODERATE
117 28.6
79 25.0
30 43.0
5 37.5
80 35.1
27 18.2
8 29.3
20 21.0
10 31.7
35 32.0
7 36.7
1 14.4
44 30.1
6 37.4
47 33.2
5 26.1
4 20.6
55 26.2
CONSERVATIVE
31 7.5
17 5.3
10 14.9
2 19.4
12 5.4
8 5.4
10 37.3
10 10.3
1.5
3 2.5
2 9.1
16 11.1
1 7.1
11 7.9
3 14.0
16 7.5
DON'T KNOW REFUSED
6 1.4
4 1.3
1 7.2
4 1.8
0.3
1.4
1 0.7
4 3.0
1 0.5
1 3.9
2.2
4 1.8
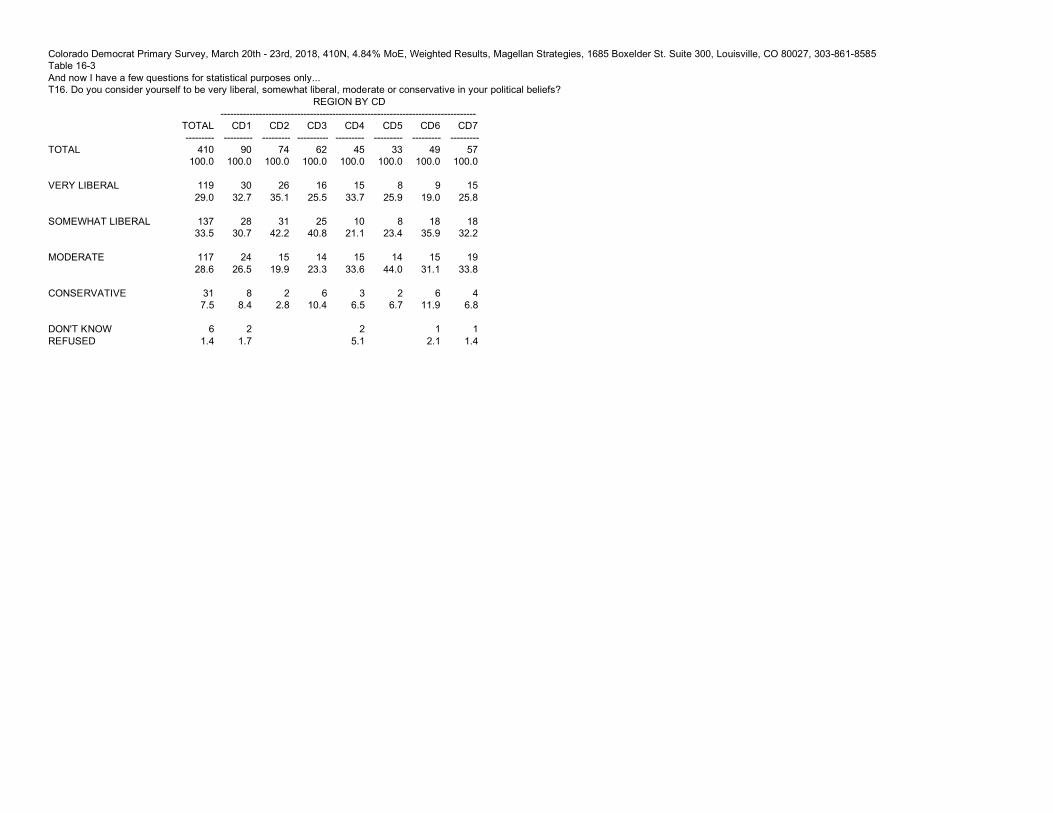
Colorado Democrat Primary Survey, March 20th - 23rd, 2018, 410N, 4.84% MoE, Weighted Results, Magellan Strategies, 1685 Boxelder St. Suite 300, Louisville, CO 80027, 303-861-8585 Table 16-3 And now I have a few questions for statistical purposes only... T16. Do you consider yourself to be very liberal, somewhat liberal, moderate or conservative in your political beliefs? REGION BY CD --------------------------------------------------------------------------------
TOTAL
--------- CD1
--------- CD2
--------- CD3
---------- CD4
--------- CD5
--------- CD6
--------- CD7
---------
TOTAL
410 100.0
90 100.0
74 100.0
62 100.0
45 100.0
33 100.0
49 100.0
57 100.0
VERY LIBERAL
119 29.0
30 32.7
26 35.1
16 25.5
15 33.7
8 25.9
9 19.0
15 25.8
SOMEWHAT LIBERAL
137 33.5
28 30.7
31 42.2
25 40.8
10 21.1
8 23.4
18 35.9
18 32.2
MODERATE
117 28.6
24 26.5
15 19.9
14 23.3
15 33.6
14 44.0
15 31.1
19 33.8
CONSERVATIVE
31 7.5
8 8.4
2 2.8
6 10.4
3 6.5
2 6.7
6 11.9
4 6.8
DON'T KNOW REFUSED
6 1.4
2 1.7
2 5.1
1 2.1
1 1.4

Colorado Democrat Primary Survey, March 20th - 23rd, 2018, 410N, 4.84% MoE, Weighted Results, Magellan Strategies, 1685 Boxelder St. Suite 300, Louisville, CO 80027, 303-861-8585 Table 17-1 T17. Which of the following age groups applies to you? GENDER~MARITAL AGE IDEOLOGY PARTY -------------------------------------------------------------------- -------------------------------------------------------- --------------------------------- --------------------------------------------------------------------
TOTAL ---------
MEN
---------
MEN MARR
---------
MEN SING
----------
WOM
---------
WOM MARR
---------
WOM SING
---------
18-34
---------
35-44
----------
45-54
---------
55-64
---------
65 PLUS
---------
VERY LIB
---------
LIB
---------
MOD
----------
DEM
---------
DEM MEN
---------
DEM WOM
---------
UNAF
---------
UNAF MEN
----------
UNAF WOM
---------
TOTAL
410 100.0
164 100.0
103 100.0
60 100.0
246 100.0
130 100.0
116 100.0
41 100.0
41 100.0
57 100.0
94 100.0
174 100.0
119 100.0
137 100.0
117 100.0
359 100.0
138 100.0
221 100.0
51 100.0
26 100.0
25 100.0
18-34
41 10.0
21 12.8
7 6.4
14 23.9
20 8.1
6 4.6
14 12.0
41 100.0
15 12.8
12 9.0
10 8.2
34 9.5
17 12.7
17 7.6
7 13.2
4 13.6
3 12.7
35-44
41 10.0
16 9.6
11 10.4
5 7.9
25 10.3
12 9.5
13 11.2
41 100.0
13 11.3
14 10.1
10 8.6
28 7.9
10 7.3
18 8.3
13 24.5
6 21.3
7 27.9
45-54
57 14.0
25 15.1
15 14.1
10 16.3
33 13.3
21 16.2
12 10.0
57 100.0
16 13.2
27 19.6
11 9.3
53 14.9
23 16.4
31 13.9
4 7.8
2 8.1
2 7.5
55-64
94 23.0
28 17.3
18 17.7
10 16.6
66 26.8
41 31.9
25 21.2
94 100.0
19 16.4
35 25.3
32 27.7
84 23.4
23 17.1
60 27.3
10 20.5
5 18.5
6 22.6
65+
174 42.5
73 44.3
52 50.6
20 34.0
102 41.3
49 37.8
53 45.2
174 100.0
54 45.3
49 36.0
53 45.6
157 43.7
63 45.5
94 42.6
17 34.0
10 38.5
7 29.3
REFUSED
2 0.5
2 0.9
1 0.7
1 1.2
1 0.2
1 0.5
1 1.1
1 0.7
2 0.6
2 1.1
1 0.2

Colorado Democrat Primary Survey, March 20th - 23rd, 2018, 410N, 4.84% MoE, Weighted Results, Magellan Strategies, 1685 Boxelder St. Suite 300, Louisville, CO 80027, 303-861-8585 Table 17-2 T17. Which of the following age groups applies to you? RACE 2016 DEM PRIMARY GOVERNOR DEM PRIMARY ATT. GENERAL DEM PRIMARY --------------------------------- -------------------------------- -------------------------------------------------------------------- --------------------------------------------------------
TOTAL ---------
WHIT
---------
HISP
---------
AA BLCK
----------
CLIN TON
---------
SAND ERS
---------
OTH
---------
TOT KENN
---------
TOT JOHN
----------
TOT POLI
---------
TOT LYNN
---------
OTH
---------
UND
---------
TOT LEVN
---------
TOT SLZR
----------
TOT WESR
---------
TOT PADN
---------
UND
---------
TOTAL
410 100.0
316 100.0
70 100.0
12 100.0
227 100.0
149 100.0
27 100.0
94 100.0
33 100.0
110 100.0
19 100.0
6 100.0
148 100.0
16 100.0
141 100.0
20 100.0
21 100.0
209 100.0
18-34
41 10.0
24 7.6
15 20.8
1 5.9
15 6.5
25 16.6
1 3.5
4 4.5
2 6.9
13 12.0
4 20.0
17 11.6
2 15.8
6 4.6
2 9.3
3 14.0
27 12.7
35-44
41 10.0
30 9.5
8 12.1
2 15.7
15 6.7
23 15.1
3 11.7
5 5.2
3 8.5
12 10.7
2 13.1
1 19.8
18 12.2
2 10.4
9 6.6
2 7.5
2 12.0
26 12.4
45-54
57 14.0
39 12.4
15 20.8
2 15.1
30 13.2
24 16.3
3 11.4
18 18.7
6 17.1
13 11.6
2 11.1
1 14.4
19 12.6
2 10.9
22 15.7
4 18.5
2 8.3
27 12.8
55-64
94 23.0
71 22.4
16 23.1
5 37.7
57 25.0
27 18.3
7 25.4
20 20.8
5 13.9
23 20.7
4 23.0
1 15.4
42 28.7
6 36.9
39 27.7
4 21.4
4 20.0
41 19.6
65+
174 42.5
151 47.8
16 23.1
3 25.6
109 48.0
49 33.2
13 48.1
48 50.9
17 51.4
48 44.3
6 29.9
3 50.3
52 35.0
4 26.1
63 44.8
9 43.3
9 42.3
88 42.2
REFUSED
2 0.5
1 0.2
1 0.6
1 0.5
1 2.2
1 0.7
1 2.9
1 0.5
1 3.5
1 0.3

Colorado Democrat Primary Survey, March 20th - 23rd, 2018, 410N, 4.84% MoE, Weighted Results, Magellan Strategies, 1685 Boxelder St. Suite 300, Louisville, CO 80027, 303-861-8585 Table 17-3 T17. Which of the following age groups applies to you? REGION BY CD --------------------------------------------------------------------------------
TOTAL
--------- CD1
--------- CD2
--------- CD3
---------- CD4
--------- CD5
--------- CD6
--------- CD7
---------
TOTAL
410 100.0
90 100.0
74 100.0
62 100.0
45 100.0
33 100.0
49 100.0
57 100.0
18-34
41 10.0
12 13.8
10 14.0
1 1.0
2 4.4
4 13.4
5 9.4
7 11.5
35-44
41 10.0
10 11.0
9 11.6
5 7.7
4 9.0
6 11.5
8 14.0
45-54
57 14.0
13 14.1
8 11.5
12 19.6
5 11.4
5 16.5
7 14.0
7 11.7
55-64
94 23.0
11 12.4
15 19.7
20 32.5
14 30.2
11 32.7
9 17.9
15 26.8
65+
174 42.5
43 48.1
32 43.1
24 39.3
20 45.0
12 35.2
22 45.6
21 35.9
REFUSED
2 0.5
1 0.6
1 2.2
1 1.6
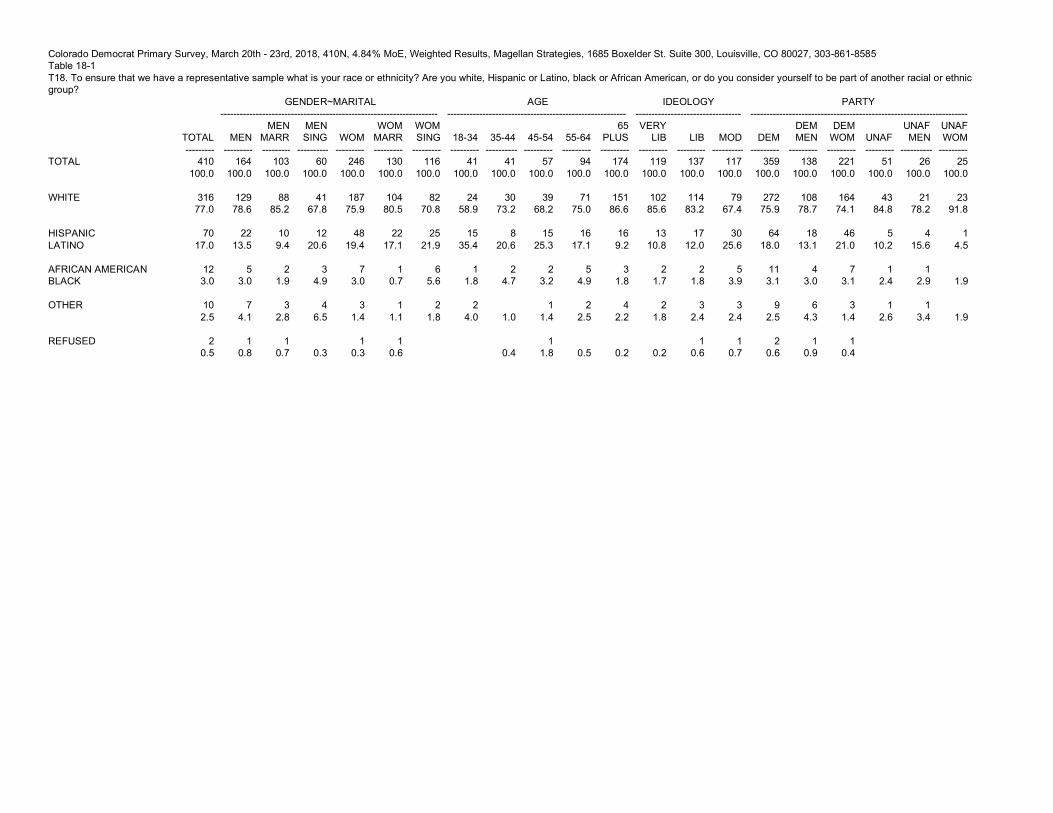
Colorado Democrat Primary Survey, March 20th - 23rd, 2018, 410N, 4.84% MoE, Weighted Results, Magellan Strategies, 1685 Boxelder St. Suite 300, Louisville, CO 80027, 303-861-8585 Table 18-1 T18. To ensure that we have a representative sample what is your race or ethnicity? Are you white, Hispanic or Latino, black or African American, or do you consider yourself to be part of another racial or ethnic group? GENDER~MARITAL AGE IDEOLOGY PARTY -------------------------------------------------------------------- -------------------------------------------------------- --------------------------------- --------------------------------------------------------------------
TOTAL ---------
MEN
---------
MEN MARR
---------
MEN SING
----------
WOM
---------
WOM MARR
---------
WOM SING
---------
18-34
---------
35-44
----------
45-54
---------
55-64
---------
65 PLUS
---------
VERY LIB
---------
LIB
---------
MOD
----------
DEM
---------
DEM MEN
---------
DEM WOM
---------
UNAF
---------
UNAF MEN
----------
UNAF WOM
---------
TOTAL
410 100.0
164 100.0
103 100.0
60 100.0
246 100.0
130 100.0
116 100.0
41 100.0
41 100.0
57 100.0
94 100.0
174 100.0
119 100.0
137 100.0
117 100.0
359 100.0
138 100.0
221 100.0
51 100.0
26 100.0
25 100.0
WHITE
316 77.0
129 78.6
88 85.2
41 67.8
187 75.9
104 80.5
82 70.8
24 58.9
30 73.2
39 68.2
71 75.0
151 86.6
102 85.6
114 83.2
79 67.4
272 75.9
108 78.7
164 74.1
43 84.8
21 78.2
23 91.8
HISPANIC LATINO
70 17.0
22 13.5
10 9.4
12 20.6
48 19.4
22 17.1
25 21.9
15 35.4
8 20.6
15 25.3
16 17.1
16 9.2
13 10.8
17 12.0
30 25.6
64 18.0
18 13.1
46 21.0
5 10.2
4 15.6
1 4.5
AFRICAN AMERICAN BLACK
12 3.0
5 3.0
2 1.9
3 4.9
7 3.0
1 0.7
6 5.6
1 1.8
2 4.7
2 3.2
5 4.9
3 1.8
2 1.7
2 1.8
5 3.9
11 3.1
4 3.0
7 3.1
1 2.4
1 2.9
1.9
OTHER
10 2.5
7 4.1
3 2.8
4 6.5
3 1.4
1 1.1
2 1.8
2 4.0
1.0
1 1.4
2 2.5
4 2.2
2 1.8
3 2.4
3 2.4
9 2.5
6 4.3
3 1.4
1 2.6
1 3.4
1.9
REFUSED
2 0.5
1 0.8
1 0.7
0.3
1 0.3
1 0.6
0.4
1 1.8
0.5
0.2
0.2
1 0.6
1 0.7
2 0.6
1 0.9
1 0.4

Colorado Democrat Primary Survey, March 20th - 23rd, 2018, 410N, 4.84% MoE, Weighted Results, Magellan Strategies, 1685 Boxelder St. Suite 300, Louisville, CO 80027, 303-861-8585 Table 18-2 T18. To ensure that we have a representative sample what is your race or ethnicity? Are you white, Hispanic or Latino, black or African American, or do you consider yourself to be part of another racial or ethnic group? RACE 2016 DEM PRIMARY GOVERNOR DEM PRIMARY ATT. GENERAL DEM PRIMARY --------------------------------- -------------------------------- -------------------------------------------------------------------- --------------------------------------------------------
TOTAL ---------
WHIT
---------
HISP
---------
AA BLCK
----------
CLIN TON
---------
SAND ERS
---------
OTH
---------
TOT KENN
---------
TOT JOHN
----------
TOT POLI
---------
TOT LYNN
---------
OTH
---------
UND
---------
TOT LEVN
---------
TOT SLZR
----------
TOT WESR
---------
TOT PADN
---------
UND
---------
TOTAL
410 100.0
316 100.0
70 100.0
12 100.0
227 100.0
149 100.0
27 100.0
94 100.0
33 100.0
110 100.0
19 100.0
6 100.0
148 100.0
16 100.0
141 100.0
20 100.0
21 100.0
209 100.0
WHITE
316 77.0
316 100.0
174 76.8
113 75.6
23 84.9
73 77.1
23 69.5
93 84.6
12 66.6
6 100.0
108 73.1
10 63.9
97 68.6
17 84.9
18 86.1
171 81.6
HISPANIC LATINO
70 17.0
70 100.0
39 17.4
28 18.8
2 8.0
17 18.4
7 20.7
11 10.4
4 20.9
30 20.5
3 20.6
35 24.7
3 13.7
29 13.8
AFRICAN AMERICAN BLACK
12 3.0
12 100.0
10 4.3
2 1.7
2 2.5
2 7.5
1 1.2
1 3.6
6 3.7
2 9.8
5 3.6
1 4.2
5 2.3
OTHER
10 2.5
3 1.2
5 3.5
1 4.6
2 2.0
1 2.2
3 2.5
1 6.9
4 2.4
1 5.6
3 2.1
2 9.7
4 2.1
REFUSED
2 0.5
1 0.3
1 0.4
1 2.5
1 1.2
1.9
0.2
1 1.0
1.5
0.2

Colorado Democrat Primary Survey, March 20th - 23rd, 2018, 410N, 4.84% MoE, Weighted Results, Magellan Strategies, 1685 Boxelder St. Suite 300, Louisville, CO 80027, 303-861-8585 Table 18-3 T18. To ensure that we have a representative sample what is your race or ethnicity? Are you white, Hispanic or Latino, black or African American, or do you consider yourself to be part of another racial or ethnic group? REGION BY CD --------------------------------------------------------------------------------
TOTAL
--------- CD1
--------- CD2
--------- CD3
---------- CD4
--------- CD5
--------- CD6
--------- CD7
---------
TOTAL
410 100.0
90 100.0
74 100.0
62 100.0
45 100.0
33 100.0
49 100.0
57 100.0
WHITE
316 77.0
61 67.7
68 91.6
47 76.7
39 86.4
21 63.0
40 81.2
40 70.1
HISPANIC LATINO
70 17.0
20 22.6
4 5.9
14 23.3
5 11.2
6 19.5
4 8.7
15 25.9
AFRICAN AMERICAN BLACK
12 3.0
6 6.7
2 7.6
4 7.6
OTHER
10 2.5
3 3.0
2 2.0
1.1
2 7.4
1 1.7
2 3.9
REFUSED
2 0.5
0.4
1 1.2
1 2.5
0.7

Colorado Democrat Primary Survey, March 20th - 23rd, 2018, 410N, 4.84% MoE, Weighted Results, Magellan Strategies, 1685 Boxelder St. Suite 300, Louisville, CO 80027, 303-861-8585 Table 19-1 T19. Are you married, separated or divorced, widowed, single and never been married, or unmarried and living with a partner? GENDER~MARITAL AGE IDEOLOGY PARTY -------------------------------------------------------------------- -------------------------------------------------------- --------------------------------- --------------------------------------------------------------------
TOTAL ---------
MEN
---------
MEN MARR
---------
MEN SING
----------
WOM
---------
WOM MARR
---------
WOM SING
---------
18-34
---------
35-44
----------
45-54
---------
55-64
---------
65 PLUS
---------
VERY LIB
---------
LIB
---------
MOD
----------
DEM
---------
DEM MEN
---------
DEM WOM
---------
UNAF
---------
UNAF MEN
----------
UNAF WOM
---------
TOTAL
410 100.0
164 100.0
103 100.0
60 100.0
246 100.0
130 100.0
116 100.0
41 100.0
41 100.0
57 100.0
94 100.0
174 100.0
119 100.0
137 100.0
117 100.0
359 100.0
138 100.0
221 100.0
51 100.0
26 100.0
25 100.0
MARRIED
233 56.9
103 63.0
103 100.0
130 52.7
130 100.0
13 30.8
23 56.3
36 62.2
60 63.3
101 58.1
65 54.3
86 62.6
70 59.7
202 56.3
88 63.7
114 51.7
31 60.5
16 59.5
15 61.5
SINGLE NEVER MARRIED
57 14.0
30 18.3
30 49.9
27 11.1
27 23.5
18 44.9
6 14.2
9 15.6
14 14.8
10 5.5
20 16.9
20 14.8
12 10.3
45 12.5
23 16.7
22 9.9
12 24.3
7 26.6
5 21.9
SEPARATED DIVORCED
52 12.6
15 9.0
15 24.6
37 15.0
37 31.8
2 4.7
5 13.1
10 16.9
11 11.6
24 13.6
14 11.6
16 11.5
14 11.8
48 13.4
14 10.0
34 15.6
4 6.8
1 3.9
2 10.0
WIDOWED
49 12.0
10 6.3
10 17.3
39 15.7
39 33.3
1 1.5
3 4.9
9 9.1
37 21.0
13 11.2
10 6.9
17 14.6
48 13.4
9 6.8
39 17.5
1 2.0
1 3.9
UNMARRIED LIVING PARTNER
18 4.4
5 3.0
5 8.2
13 5.4
13 11.4
7 18.1
7 16.0
1 1.2
3 1.8
7 5.9
6 4.1
4 3.6
15 4.2
3 2.4
12 5.2
3 6.4
2 6.1
2 6.6
NO OPINION
0.1
0.2
0.4
0.4
0.2
0.1
0.3

Colorado Democrat Primary Survey, March 20th - 23rd, 2018, 410N, 4.84% MoE, Weighted Results, Magellan Strategies, 1685 Boxelder St. Suite 300, Louisville, CO 80027, 303-861-8585 Table 19-2 T19. Are you married, separated or divorced, widowed, single and never been married, or unmarried and living with a partner? RACE 2016 DEM PRIMARY GOVERNOR DEM PRIMARY ATT. GENERAL DEM PRIMARY --------------------------------- -------------------------------- -------------------------------------------------------------------- --------------------------------------------------------
TOTAL ---------
WHIT
---------
HISP
---------
AA BLCK
----------
CLIN TON
---------
SAND ERS
---------
OTH
---------
TOT KENN
---------
TOT JOHN
----------
TOT POLI
---------
TOT LYNN
---------
OTH
---------
UND
---------
TOT LEVN
---------
TOT SLZR
----------
TOT WESR
---------
TOT PADN
---------
UND
---------
TOTAL
410 100.0
316 100.0
70 100.0
12 100.0
227 100.0
149 100.0
27 100.0
94 100.0
33 100.0
110 100.0
19 100.0
6 100.0
148 100.0
16 100.0
141 100.0
20 100.0
21 100.0
209 100.0
MARRIED
233 56.9
193 61.0
32 45.7
3 23.6
132 58.2
79 53.0
19 68.7
54 57.3
19 57.2
70 63.6
9 50.9
2 36.7
78 52.5
8 52.7
81 57.4
16 78.4
10 46.7
117 55.7
SINGLE NEVER MARRIED
57 14.0
35 11.2
17 24.7
2 19.8
33 14.5
23 15.2
1 4.6
12 12.5
5 15.1
14 12.9
2.2
26 17.7
3 17.0
14 10.3
1 7.3
5 24.1
33 15.5
SEPARATED DIVORCED
52 12.6
38 11.9
9 12.9
4 32.9
26 11.3
21 13.9
5 17.6
13 13.8
3 9.3
11 10.1
7 36.1
2 35.3
16 10.7
2 15.1
24 17.2
1 5.5
2 10.3
22 10.5
WIDOWED
49 12.0
37 11.7
6 9.2
3 23.7
32 14.1
12 8.3
2 9.1
13 14.1
4 12.8
8 7.6
1 4.1
2 28.0
21 14.2
2 11.3
19 13.8
2 8.8
1 2.6
26 12.2
UNMARRIED LIVING PARTNER
18 4.4
13 4.1
5 7.4
4 1.7
14 9.5
2 2.3
2 5.6
6 5.6
1 6.6
7 4.7
1 3.8
2 1.3
3 16.4
12 5.9
NO OPINION
0.1
0.2
0.2
0.1
0.2

Colorado Democrat Primary Survey, March 20th - 23rd, 2018, 410N, 4.84% MoE, Weighted Results, Magellan Strategies, 1685 Boxelder St. Suite 300, Louisville, CO 80027, 303-861-8585 Table 19-3 T19. Are you married, separated or divorced, widowed, single and never been married, or unmarried and living with a partner? REGION BY CD --------------------------------------------------------------------------------
TOTAL
--------- CD1
--------- CD2
--------- CD3
---------- CD4
--------- CD5
--------- CD6
--------- CD7
---------
TOTAL
410 100.0
90 100.0
74 100.0
62 100.0
45 100.0
33 100.0
49 100.0
57 100.0
MARRIED
233 56.9
34 37.8
49 67.1
36 58.7
31 69.6
16 48.5
33 66.7
33 57.9
SINGLE NEVER MARRIED
57 14.0
16 18.2
10 14.0
10 15.9
4 8.2
4 12.8
7 13.5
6 11.1
SEPARATED DIVORCED
52 12.6
16 17.6
2 3.0
11 17.8
2 3.8
7 21.6
4 8.2
10 17.1
WIDOWED
49 12.0
16 17.7
9 11.6
3 5.6
6 13.3
4 13.1
5 9.8
6 10.5
UNMARRIED LIVING PARTNER
18 4.4
8 8.7
3 4.2
1 1.9
2 4.6
1 4.0
1 1.4
2 3.4
NO OPINION
0.1
0.5
0.4

Colorado Democrat Primary Survey, March 20th - 23rd, 2018, 410N, 4.84% MoE, Weighted Results, Magellan Strategies, 1685 Boxelder St. Suite 300, Louisville, CO 80027, 303-861-8585 Table 20-1 T20. Are you male or female? GENDER~MARITAL AGE IDEOLOGY PARTY -------------------------------------------------------------------- -------------------------------------------------------- --------------------------------- --------------------------------------------------------------------
TOTAL ---------
MEN
---------
MEN MARR
---------
MEN SING
----------
WOM
---------
WOM MARR
---------
WOM SING
---------
18-34
---------
35-44
----------
45-54
---------
55-64
---------
65 PLUS
---------
VERY LIB
---------
LIB
---------
MOD
----------
DEM
---------
DEM MEN
---------
DEM WOM
---------
UNAF
---------
UNAF MEN
----------
UNAF WOM
---------
TOTAL
410 100.0
164 100.0
103 100.0
60 100.0
246 100.0
130 100.0
116 100.0
41 100.0
41 100.0
57 100.0
94 100.0
174 100.0
119 100.0
137 100.0
117 100.0
359 100.0
138 100.0
221 100.0
51 100.0
26 100.0
25 100.0
FEMALE
246 60.0
246 100.0
130 100.0
116 100.0
20 48.7
25 61.7
33 57.0
66 69.9
102 58.3
75 62.8
79 57.6
70 60.1
221 61.6
221 100.0
25 48.6
25 100.0
MALE
164 40.0
164 100.0
103 100.0
60 100.0
21 51.3
16 38.3
25 43.0
28 30.1
73 41.7
44 37.2
58 42.4
47 39.9
138 38.4
138 100.0
26 51.4
26 100.0
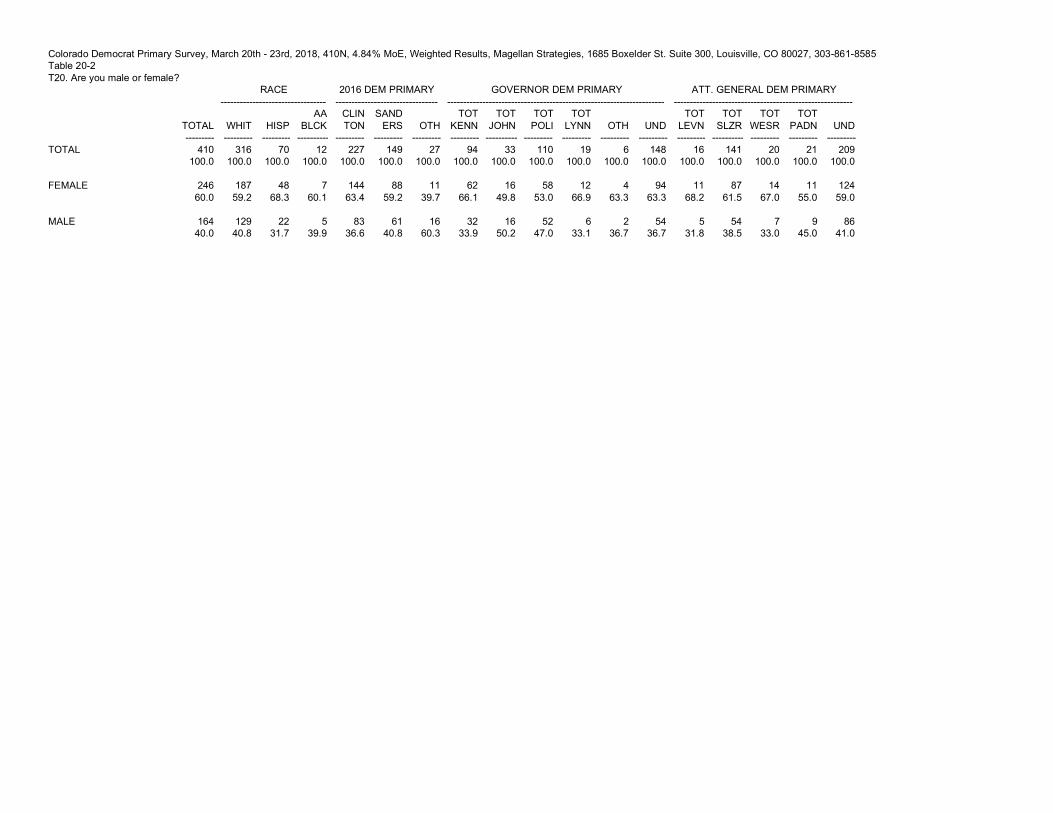
Colorado Democrat Primary Survey, March 20th - 23rd, 2018, 410N, 4.84% MoE, Weighted Results, Magellan Strategies, 1685 Boxelder St. Suite 300, Louisville, CO 80027, 303-861-8585 Table 20-2 T20. Are you male or female? RACE 2016 DEM PRIMARY GOVERNOR DEM PRIMARY ATT. GENERAL DEM PRIMARY --------------------------------- -------------------------------- -------------------------------------------------------------------- --------------------------------------------------------
TOTAL ---------
WHIT
---------
HISP
---------
AA BLCK
----------
CLIN TON
---------
SAND ERS
---------
OTH
---------
TOT KENN
---------
TOT JOHN
----------
TOT POLI
---------
TOT LYNN
---------
OTH
---------
UND
---------
TOT LEVN
---------
TOT SLZR
----------
TOT WESR
---------
TOT PADN
---------
UND
---------
TOTAL
410 100.0
316 100.0
70 100.0
12 100.0
227 100.0
149 100.0
27 100.0
94 100.0
33 100.0
110 100.0
19 100.0
6 100.0
148 100.0
16 100.0
141 100.0
20 100.0
21 100.0
209 100.0
FEMALE
246 60.0
187 59.2
48 68.3
7 60.1
144 63.4
88 59.2
11 39.7
62 66.1
16 49.8
58 53.0
12 66.9
4 63.3
94 63.3
11 68.2
87 61.5
14 67.0
11 55.0
124 59.0
MALE
164 40.0
129 40.8
22 31.7
5 39.9
83 36.6
61 40.8
16 60.3
32 33.9
16 50.2
52 47.0
6 33.1
2 36.7
54 36.7
5 31.8
54 38.5
7 33.0
9 45.0
86 41.0
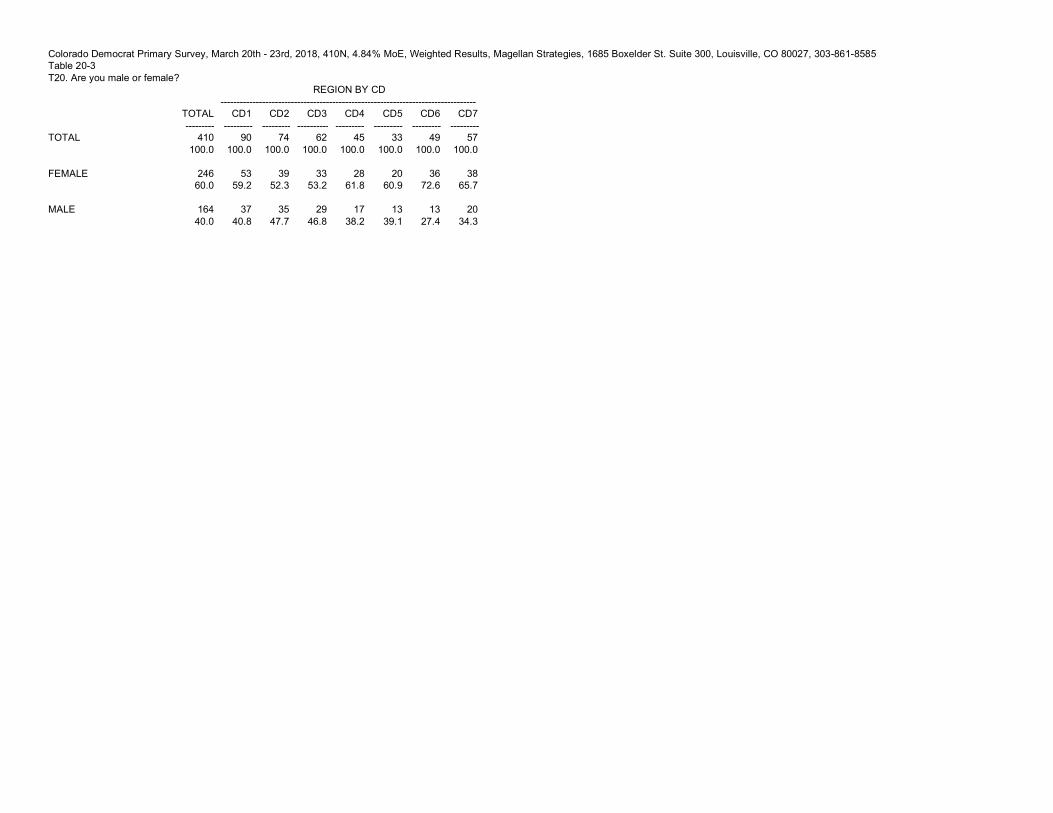
Colorado Democrat Primary Survey, March 20th - 23rd, 2018, 410N, 4.84% MoE, Weighted Results, Magellan Strategies, 1685 Boxelder St. Suite 300, Louisville, CO 80027, 303-861-8585 Table 20-3 T20. Are you male or female? REGION BY CD --------------------------------------------------------------------------------
TOTAL
--------- CD1
--------- CD2
--------- CD3
---------- CD4
--------- CD5
--------- CD6
--------- CD7
---------
TOTAL
410 100.0
90 100.0
74 100.0
62 100.0
45 100.0
33 100.0
49 100.0
57 100.0
FEMALE
246 60.0
53 59.2
39 52.3
33 53.2
28 61.8
20 60.9
36 72.6
38 65.7
MALE
164 40.0
37 40.8
35 47.7
29 46.8
17 38.2
13 39.1
13 27.4
20 34.3
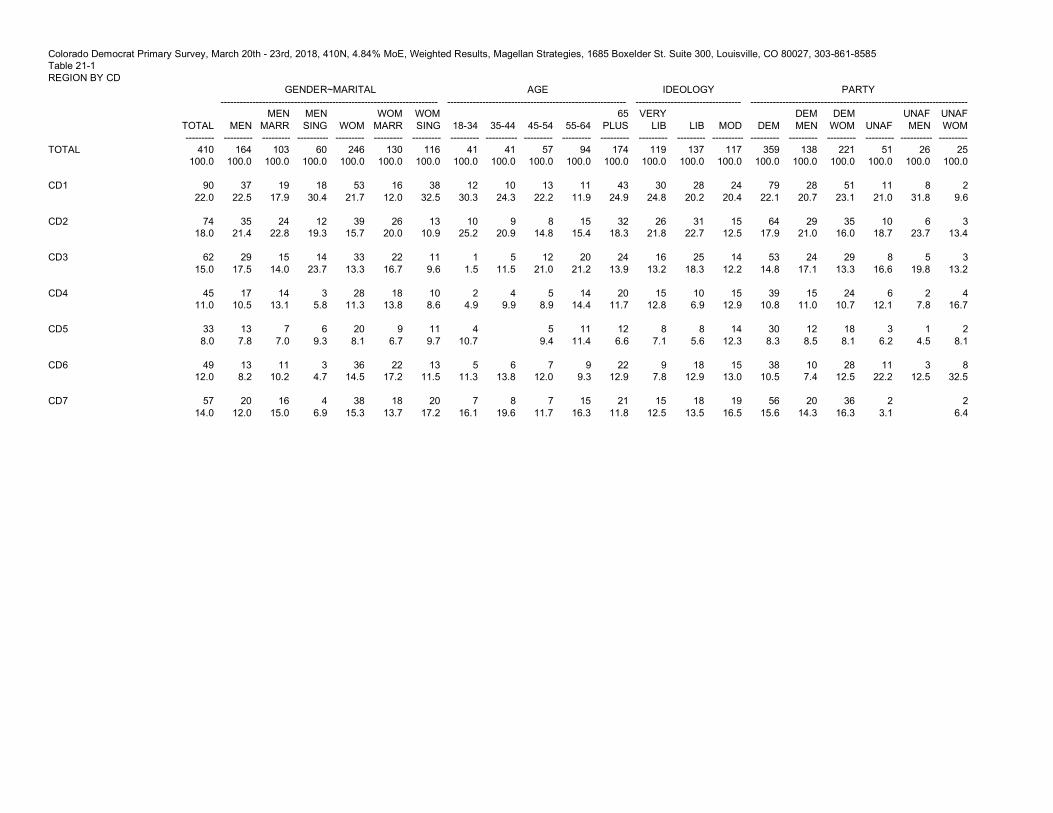
Colorado Democrat Primary Survey, March 20th - 23rd, 2018, 410N, 4.84% MoE, Weighted Results, Magellan Strategies, 1685 Boxelder St. Suite 300, Louisville, CO 80027, 303-861-8585 Table 21-1 REGION BY CD GENDER~MARITAL AGE IDEOLOGY PARTY -------------------------------------------------------------------- -------------------------------------------------------- --------------------------------- --------------------------------------------------------------------
TOTAL ---------
MEN
---------
MEN MARR
---------
MEN SING
----------
WOM
---------
WOM MARR
---------
WOM SING
---------
18-34
---------
35-44
----------
45-54
---------
55-64
---------
65 PLUS
---------
VERY LIB
---------
LIB
---------
MOD
----------
DEM
---------
DEM MEN
---------
DEM WOM
---------
UNAF
---------
UNAF MEN
----------
UNAF WOM
---------
TOTAL
410 100.0
164 100.0
103 100.0
60 100.0
246 100.0
130 100.0
116 100.0
41 100.0
41 100.0
57 100.0
94 100.0
174 100.0
119 100.0
137 100.0
117 100.0
359 100.0
138 100.0
221 100.0
51 100.0
26 100.0
25 100.0
CD1
90 22.0
37 22.5
19 17.9
18 30.4
53 21.7
16 12.0
38 32.5
12 30.3
10 24.3
13 22.2
11 11.9
43 24.9
30 24.8
28 20.2
24 20.4
79 22.1
28 20.7
51 23.1
11 21.0
8 31.8
2 9.6
CD2
74 18.0
35 21.4
24 22.8
12 19.3
39 15.7
26 20.0
13 10.9
10 25.2
9 20.9
8 14.8
15 15.4
32 18.3
26 21.8
31 22.7
15 12.5
64 17.9
29 21.0
35 16.0
10 18.7
6 23.7
3 13.4
CD3
62 15.0
29 17.5
15 14.0
14 23.7
33 13.3
22 16.7
11 9.6
1 1.5
5 11.5
12 21.0
20 21.2
24 13.9
16 13.2
25 18.3
14 12.2
53 14.8
24 17.1
29 13.3
8 16.6
5 19.8
3 13.2
CD4
45 11.0
17 10.5
14 13.1
3 5.8
28 11.3
18 13.8
10 8.6
2 4.9
4 9.9
5 8.9
14 14.4
20 11.7
15 12.8
10 6.9
15 12.9
39 10.8
15 11.0
24 10.7
6 12.1
2 7.8
4 16.7
CD5
33 8.0
13 7.8
7 7.0
6 9.3
20 8.1
9 6.7
11 9.7
4 10.7
5 9.4
11 11.4
12 6.6
8 7.1
8 5.6
14 12.3
30 8.3
12 8.5
18 8.1
3 6.2
1 4.5
2 8.1
CD6
49 12.0
13 8.2
11 10.2
3 4.7
36 14.5
22 17.2
13 11.5
5 11.3
6 13.8
7 12.0
9 9.3
22 12.9
9 7.8
18 12.9
15 13.0
38 10.5
10 7.4
28 12.5
11 22.2
3 12.5
8 32.5
CD7
57 14.0
20 12.0
16 15.0
4 6.9
38 15.3
18 13.7
20 17.2
7 16.1
8 19.6
7 11.7
15 16.3
21 11.8
15 12.5
18 13.5
19 16.5
56 15.6
20 14.3
36 16.3
2 3.1
2 6.4

Colorado Democrat Primary Survey, March 20th - 23rd, 2018, 410N, 4.84% MoE, Weighted Results, Magellan Strategies, 1685 Boxelder St. Suite 300, Louisville, CO 80027, 303-861-8585 Table 21-2 REGION BY CD RACE 2016 DEM PRIMARY GOVERNOR DEM PRIMARY ATT. GENERAL DEM PRIMARY --------------------------------- -------------------------------- -------------------------------------------------------------------- --------------------------------------------------------
TOTAL ---------
WHIT
---------
HISP
---------
AA BLCK
----------
CLIN TON
---------
SAND ERS
---------
OTH
---------
TOT KENN
---------
TOT JOHN
----------
TOT POLI
---------
TOT LYNN
---------
OTH
---------
UND
---------
TOT LEVN
---------
TOT SLZR
----------
TOT WESR
---------
TOT PADN
---------
UND
---------
TOTAL
410 100.0
316 100.0
70 100.0
12 100.0
227 100.0
149 100.0
27 100.0
94 100.0
33 100.0
110 100.0
19 100.0
6 100.0
148 100.0
16 100.0
141 100.0
20 100.0
21 100.0
209 100.0
CD1
90 22.0
61 19.3
20 29.2
6 49.2
46 20.3
42 28.0
2 8.4
22 23.9
10 32.1
14 12.5
4 19.4
1 22.3
38 25.8
4 25.1
34 24.0
6 30.6
5 23.1
41 19.5
CD2
74 18.0
68 21.4
4 6.3
45 19.7
25 16.9
2 8.8
14 15.2
36 33.2
1 6.0
3 47.8
19 13.0
20 13.9
1 6.4
2 8.7
51 24.4
CD3
62 15.0
47 14.9
14 20.6
32 14.0
20 13.3
10 36.0
13 13.6
10 30.0
12 11.3
3 17.2
1 14.4
23 15.3
2 14.3
26 18.8
2 9.4
4 21.5
26 12.6
CD4
45 11.0
39 12.3
5 7.3
20 9.0
18 11.9
2 9.1
8 8.8
1 3.7
12 11.4
2 12.0
21 14.1
4 24.7
14 10.2
1 6.5
4 20.3
21 10.2
CD5
33 8.0
21 6.5
6 9.2
2 20.2
19 8.2
13 9.0
1 2.8
9 9.5
3 8.3
4 3.9
4 22.0
13 8.7
3 16.9
10 7.2
1 5.5
18 8.4
CD6
49 12.0
40 12.7
4 6.1
4 30.5
34 15.2
11 7.4
4 13.9
10 10.2
4 11.8
14 12.9
1 6.6
1 15.4
20 13.3
1 6.5
20 14.0
1 4.9
2 8.6
26 12.3
CD7
57 14.0
40 12.8
15 21.3
31 13.7
20 13.5
6 21.1
18 18.9
5 14.0
16 14.9
3 16.7
15 9.9
2 12.7
17 11.9
9 42.2
3 12.2
26 12.6

Colorado Democrat Primary Survey, March 20th - 23rd, 2018, 410N, 4.84% MoE, Weighted Results, Magellan Strategies, 1685 Boxelder St. Suite 300, Louisville, CO 80027, 303-861-8585 Table 21-3 REGION BY CD REGION BY CD --------------------------------------------------------------------------------
TOTAL
--------- CD1
--------- CD2
--------- CD3
---------- CD4
--------- CD5
--------- CD6
--------- CD7
---------
TOTAL
410 100.0
90 100.0
74 100.0
62 100.0
45 100.0
33 100.0
49 100.0
57 100.0
CD1
90 22.0
90 100.0
CD2
74 18.0
74 100.0
CD3
62 15.0
62 100.0
CD4
45 11.0
45 100.0
CD5
33 8.0
33 100.0
CD6
49 12.0
49 100.0
CD7
57 14.0
57 100.0


![[PPT]Ferdinand Magellan - Tripod.comwadd.tripod.com/Magellan.ppt · Web viewFerdinand Magellan By Taylor and Haley Magellan was born in spring in 1470. Magellan was killed in the](https://img.pdfslide.us/doc/110x75/5afc89fd7f8b9a814d8c3915/pptferdinand-magellan-viewferdinand-magellan-by-taylor-and-haley-magellan-was.jpg)