Embed Size (px)
Citation preview
MACROECONOMIC
REVIEW
OF LATVIA
April 2021
ISSN 2592-8538
MACROECONOMIC REVIEW OF LATVIA 2
© 2021 | Ministry of Economics of the Republic of Latvia
Central Statistical Bureau of Latvia
Mainly, numerical information and data, except of particularly indicated cases, are received from Central Statistical
Bureau of the Republic of Latvia. European Union data are taken from Eurostat database. Data from the Bank of Latvia
and Financial and Capital Market Commission are used in characterizing Latvia's Balance of Payments, banking and
monetary indicators. Data from the Treasury are used in characteristics of public finances.
Reproductions and quotations are permitted on condition that the source is stated.
If you have comments, questions or suggestions, please address them to:
Ministry of Economics of the Republic of Latvia
55 Brīvības str.
Riga, LV-1519
Telephone: 371 67 013 109
E-mail: [email protected]
Web page: em.gov.lv/en
ISSN 2592-852X
3 MACROECONOMIC REVIEW OF LATVIA
ECONOMIC DEVELOPMENT TRENDS ............................................................ Error! Bookmark not defined.
WORLD ECONOMIC OUTLOOK ............................................................................................................................. 6
GROSS DOMESTIC PRODUCT AND AGGREGATE DEMAND ......................................................................... 7
GROSS DOMESTIC PRODUCT .............................................................................................................................................. 7
CONSUMPTION......................................................................................................................................................................... 8
INVESTMENT .............................................................................................................................................................................. 9
EXPORTS ..................................................................................................................................................................................... 11
IMPORTS .................................................................................................................................................................................... 14
SECTORAL DEVELOPMENT .................................................................................................................................... 15
MANUFACTURING .................................................................................................................................................................. 17
AGRICULTURE, FORESTRY, AND FISHING ...................................................................................................................... 24
OTHER MANUFACTURING .................................................................................................................................................. 24
CONSTRUCTION .................................................................................................................................................................... 25
TRADE, ACCOMMODATION, AND FOOD SERVICE ACTIVITIES ............................................................................. 26
TRANSPORTATION AND STORAGE ................................................................................................................................. 27
COMMERCIAL SERVICES ..................................................................................................................................................... 28
PUBLIC SERVICES ................................................................................................................................................................... 28
LABOUR MARKET ..................................................................................................................................................... 29
EMPLOYMENT AND UNEMPLOYMENT .......................................................................................................................... 29
WAGES AND SALARIES ........................................................................................................................................................ 32
ECONOMIC STABILITY AND COMPETITIVENESS ........................................................................................... 34
PRICES........................................................................................................................................................................................ 34
BALANCE OF PAYMENTS .................................................................................................................................................... 36
FOREIGN DIRECT INVESTMENT ........................................................................................................................................ 37
MONETARY INDICATORS ................................................................................................................................................... 38
BUDGET AND GOVERNMENT DEBT ................................................................................................................................ 39
BUDGET REVENUES AND EXPENDITURES ..................................................................................................................... 40
PRODUCTIVITY AND COMPETITIVENESS ....................................................................................................................... 41
EU ALERT MECHANISM ....................................................................................................................................................... 42
LATVIA IN INTERNATIONAL RANKINGS ........................................................................................................... 43
2021 | 1 CONTENTS
MACROECONOMIC REVIEW OF LATVIA 4
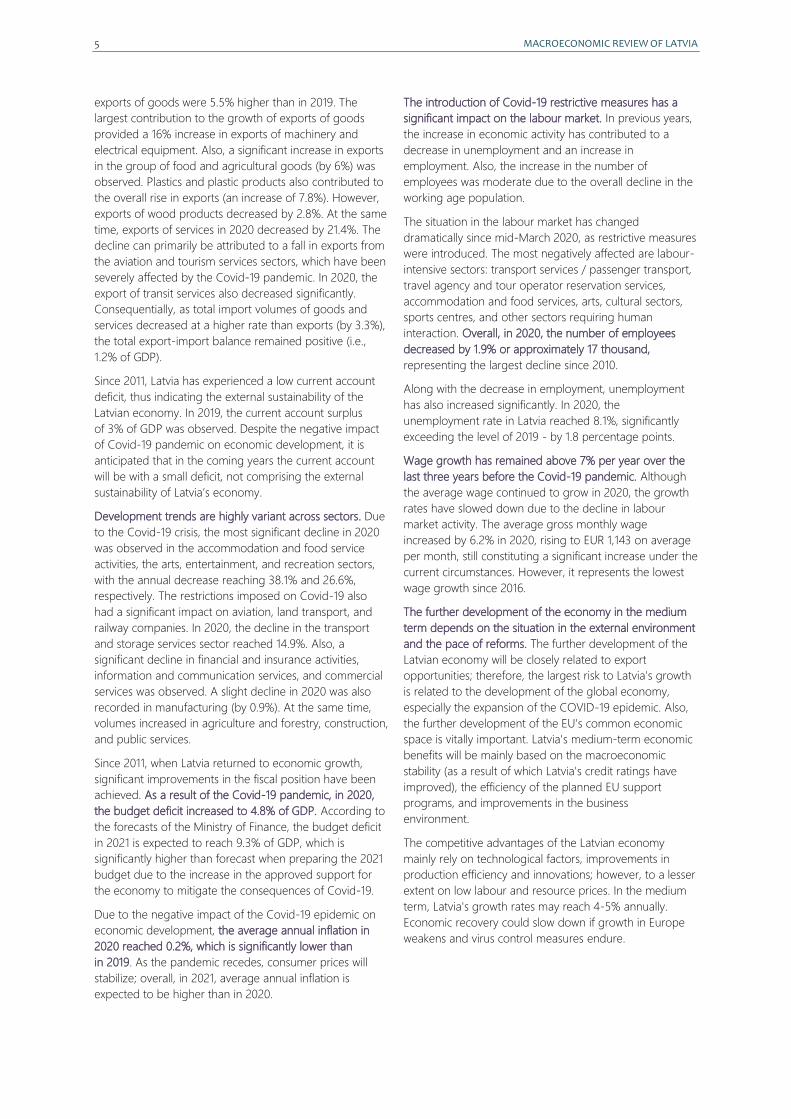
Until the outbreak of Covid-19 pandemic, Latvia's
economic growth remained stable, exceeding the EU
average. From 2011-2019, GDP on average increased by
3.3% annually. In 2019, economic growth moderated. GDP
increased by 2%. The slight economic slowdown was
driven by both internal factors (investments from EU funds
have peaked, developments in the financial sector, etc.)
and external factors (review of global trade tensions,
Brexit, slower growth in other EU countries).
The Covid-19 pandemic has a significant impact on the
global and Latvian economies. In the 2nd quarter of 2020,
GDP in Latvia decreased by 8.9% annually. However, this
appears to be a comparatively mild decline, as the EU-27
GDP contracted by 13.9% over the same period.
In Q3 and Q4 of 2020, the economic decline slightly
slowed down. Overall, in 2020, GDP decreased by
3.6%, compared to 2019. With the epidemiological
constraints remaining, the economy will decline in the first
quarter of 2021 as well. However, with the resumption of
seasonal work in the spring and the improvement of the
epidemiological situation, which will be facilitated by
vaccination, economic activity is expected to increase
gradually. The Ministry of Economics forecasts that in 2021
economic growth could exceed 3%. However, the
uncertainty remains elevated.
Key Economic Development Indicators
2015 2016 2017 2018 2019 2020 2021e
Gross domestic product, at current prices, billion euro 24.6 25.4 27.0 29.1 30.4 29.3 30.7
Changes against the previous year, as per cent
Gross domestic product 4.0 2.4 3.3 4.0 2.0 -3.6 3.2
Private consumption 2.2 3.3 3.0 2.6 2.2 -10.0 7.5
Public consumption 2.7 2.5 3.4 1.6 2.6 2.6 2.6
Gross fixed capital formation -2.0 -8.2 11.4 11.8 2.1 0.2 3.3
Exports 3.0 4.0 6.4 4.3 2.1 -2.7 4.9
Imports 1.6 3.6 8.6 6.4 3.0 -3.3 5.0
Consumer prices 0.2 0.1 2.9 2.5 2.8 0.2 1.5
as per cent
Changes in the number of employed 1.3 -0.3 0.2 1.6 0.1 -1.9 -0.3
Employment rate 60.9 61.6 62.9 64.5 65.0 64.2 64.3
Unemployment rate 9.9 9.6 8.7 7.4 6.3 8.1 7.7
as per cent of GDP
General government balance -1.4 0.2 -0.8 -0.8 -0.6 -4.8 -8.0
General government debt 37.1 40.4 39.1 37.1 37.0 43.5 50.0
Net exports -1.7 0.3 -0.6 -0.8 -0.8 1.2 1.0
e - estimation
The Covid-19 crisis has had a significant impact on
consumption. With rising employment and wages, private
consumption has grown steadily in recent years. In 2020,
the increase in unemployment and the fall in income
caused by the Covid-19 crisis have significantly reduced
household consumption. In 2020, private consumption
was 10% lower than a year ago. The government's support
measures to mitigate the negative effects of Covid-19,
which have been largely financed at the expense of
increasing the general government deficit, have
maintained positive growth in government consumption.
In the first half of 2020, it was 2.6% higher than a year ago.
The Covid-19 crisis has had a relatively more moderate
impact on investment. In previous years, the increase in
investment was largely due to the acquisition of EU funds.
In 2019, when the investments of the EU funds reached the
maximum within the current planning period, the
investment rate declined, increasing only by 2.1% (for
comparison in 2018 - by 11.8%). Despite the overall
economic decline in 2020, the gross fixed capital formation
increased by 0.2%, compared to 2019. In 2020, investment
in dwellings, buildings, and structures increased by 1.6%; in
intellectual property products - by 2.6%. However,
investment in machinery and equipment declined by 2.2%.
The Covid-19 crisis is having a negative impact on exports
of goods and services. In recent years, export growth rates
have exceeded the overall economic growth. In 2020, due
to Covid-19 restrictions in foreign markets, exports
decreased by 2.7%. At the same time, trends in exports of
goods and services were very different. In 2020, Latvia's
2021 | 1 ECONOMIC DEVELOPMENT TRENDS
5 MACROECONOMIC REVIEW OF LATVIA
exports of goods were 5.5% higher than in 2019. The
largest contribution to the growth of exports of goods
provided a 16% increase in exports of machinery and
electrical equipment. Also, a significant increase in exports
in the group of food and agricultural goods (by 6%) was
observed. Plastics and plastic products also contributed to
the overall rise in exports (an increase of 7.8%). However,
exports of wood products decreased by 2.8%. At the same
time, exports of services in 2020 decreased by 21.4%. The
decline can primarily be attributed to a fall in exports from
the aviation and tourism services sectors, which have been
severely affected by the Covid-19 pandemic. In 2020, the
export of transit services also decreased significantly.
Consequentially, as total import volumes of goods and
services decreased at a higher rate than exports (by 3.3%),
the total export-import balance remained positive (i.e.,
1.2% of GDP).
Since 2011, Latvia has experienced a low current account
deficit, thus indicating the external sustainability of the
Latvian economy. In 2019, the current account surplus
of 3% of GDP was observed. Despite the negative impact
of Covid-19 pandemic on economic development, it is
anticipated that in the coming years the current account
will be with a small deficit, not comprising the external
sustainability of Latvia’s economy.
Development trends are highly variant across sectors. Due
to the Covid-19 crisis, the most significant decline in 2020
was observed in the accommodation and food service
activities, the arts, entertainment, and recreation sectors,
with the annual decrease reaching 38.1% and 26.6%,
respectively. The restrictions imposed on Covid-19 also
had a significant impact on aviation, land transport, and
railway companies. In 2020, the decline in the transport
and storage services sector reached 14.9%. Also, a
significant decline in financial and insurance activities,
information and communication services, and commercial
services was observed. A slight decline in 2020 was also
recorded in manufacturing (by 0.9%). At the same time,
volumes increased in agriculture and forestry, construction,
and public services.
Since 2011, when Latvia returned to economic growth,
significant improvements in the fiscal position have been
achieved. As a result of the Covid-19 pandemic, in 2020,
the budget deficit increased to 4.8% of GDP. According to
the forecasts of the Ministry of Finance, the budget deficit
in 2021 is expected to reach 9.3% of GDP, which is
significantly higher than forecast when preparing the 2021
budget due to the increase in the approved support for
the economy to mitigate the consequences of Covid-19.
Due to the negative impact of the Covid-19 epidemic on
economic development, the average annual inflation in
2020 reached 0.2%, which is significantly lower than
in 2019. As the pandemic recedes, consumer prices will
stabilize; overall, in 2021, average annual inflation is
expected to be higher than in 2020.
The introduction of Covid-19 restrictive measures has a
significant impact on the labour market. In previous years,
the increase in economic activity has contributed to a
decrease in unemployment and an increase in
employment. Also, the increase in the number of
employees was moderate due to the overall decline in the
working age population.
The situation in the labour market has changed
dramatically since mid-March 2020, as restrictive measures
were introduced. The most negatively affected are labour-
intensive sectors: transport services / passenger transport,
travel agency and tour operator reservation services,
accommodation and food services, arts, cultural sectors,
sports centres, and other sectors requiring human
interaction. Overall, in 2020, the number of employees
decreased by 1.9% or approximately 17 thousand,
representing the largest decline since 2010.
Along with the decrease in employment, unemployment
has also increased significantly. In 2020, the
unemployment rate in Latvia reached 8.1%, significantly
exceeding the level of 2019 - by 1.8 percentage points.
Wage growth has remained above 7% per year over the
last three years before the Covid-19 pandemic. Although
the average wage continued to grow in 2020, the growth
rates have slowed down due to the decline in labour
market activity. The average gross monthly wage
increased by 6.2% in 2020, rising to EUR 1,143 on average
per month, still constituting a significant increase under the
current circumstances. However, it represents the lowest
wage growth since 2016.
The further development of the economy in the medium
term depends on the situation in the external environment
and the pace of reforms. The further development of the
Latvian economy will be closely related to export
opportunities; therefore, the largest risk to Latvia's growth
is related to the development of the global economy,
especially the expansion of the COVID-19 epidemic. Also,
the further development of the EU's common economic
space is vitally important. Latvia's medium-term economic
benefits will be mainly based on the macroeconomic
stability (as a result of which Latvia's credit ratings have
improved), the efficiency of the planned EU support
programs, and improvements in the business
environment.
The competitive advantages of the Latvian economy
mainly rely on technological factors, improvements in
production efficiency and innovations; however, to a lesser
extent on low labour and resource prices. In the medium
term, Latvia's growth rates may reach 4-5% annually.
Economic recovery could slow down if growth in Europe
weakens and virus control measures endure.
MACROECONOMIC REVIEW OF LATVIA 6
The outlook for global economic growth has improved
significantly, driven by the introduction of vaccines, fiscal
support, and signs that the economy is coping better with
anti-virus measures. However, uncertainty remains
elevated. New waves of the pandemic and the spread of
the most contagious strains of the virus raise concerns for
further development. Global growth is projected to reach
5.6% in 2021 (OECD Interim Economic Outlook, March
2021; hereinafter – OECD).
GDP Growth Rate as per cent
2020 2021f 2022f
World -3.4 5.6 4.0
G20 -3.2 6.2 4.1
Euro Area -6.8 3.9 3.8
USA -3.5 6.5 4.0
Russia -3.6 2.7 2.6
China 2.3 7.8 4.9
Source: OECD Interim Economic Outlook Forecasts, March 2021; f – forecast
The economic impact of the pandemic is being limited in
many countries in Asia-Pacific, reflecting effective public
health measures as well as the significant stimulus
provided by the recovery of industry and China's
economy. Fiscal support is also helping the Japanese and
Indian economies to recover.
Strong US fiscal support strengthens demand, with positive
effects on other economies, in particular Canada and
Mexico. US GDP is estimated to grow by 6.5% in 2021; in
2022, GDP growth is expected to reach 4% (OECD).
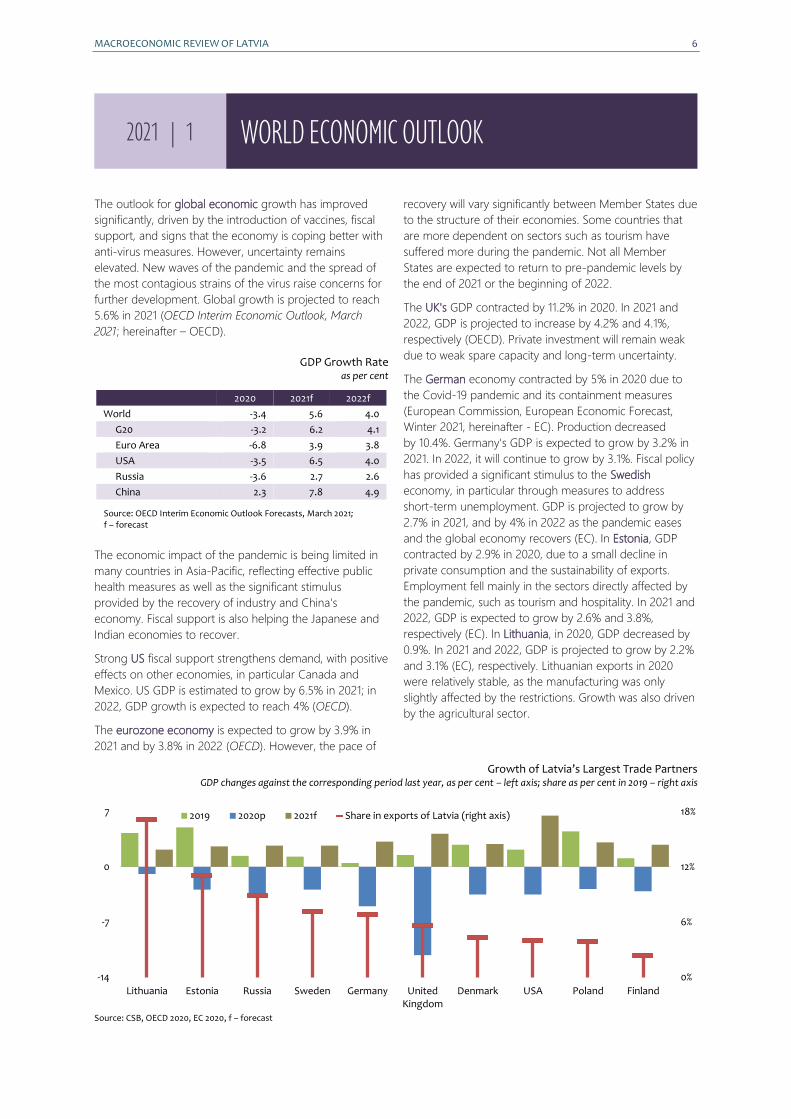
The eurozone economy is expected to grow by 3.9% in
2021 and by 3.8% in 2022 (OECD). However, the pace of
recovery will vary significantly between Member States due
to the structure of their economies. Some countries that
are more dependent on sectors such as tourism have
suffered more during the pandemic. Not all Member
States are expected to return to pre-pandemic levels by
the end of 2021 or the beginning of 2022.
The UK's GDP contracted by 11.2% in 2020. In 2021 and
2022, GDP is projected to increase by 4.2% and 4.1%,
respectively (OECD). Private investment will remain weak
due to weak spare capacity and long-term uncertainty.
The German economy contracted by 5% in 2020 due to
the Covid-19 pandemic and its containment measures
(European Commission, European Economic Forecast,
Winter 2021, hereinafter - EC). Production decreased
by 10.4%. Germany's GDP is expected to grow by 3.2% in
2021. In 2022, it will continue to grow by 3.1%. Fiscal policy
has provided a significant stimulus to the Swedish
economy, in particular through measures to address
short-term unemployment. GDP is projected to grow by
2.7% in 2021, and by 4% in 2022 as the pandemic eases
and the global economy recovers (EC). In Estonia, GDP
contracted by 2.9% in 2020, due to a small decline in
private consumption and the sustainability of exports.
Employment fell mainly in the sectors directly affected by
the pandemic, such as tourism and hospitality. In 2021 and
2022, GDP is expected to grow by 2.6% and 3.8%,
respectively (EC). In Lithuania, in 2020, GDP decreased by
0.9%. In 2021 and 2022, GDP is projected to grow by 2.2%
and 3.1% (EC), respectively. Lithuanian exports in 2020
were relatively stable, as the manufacturing was only
slightly affected by the restrictions. Growth was also driven
by the agricultural sector.
Growth of Latvia’s Largest Trade Partners GDP changes against the corresponding period last year, as per cent – left axis; share as per cent in 2019 – right axis
Source: CSB, OECD 2020, EC 2020, f – forecast
0%
6%
12%
18%
-14
-7
0
7
Lithuania Estonia Russia Sweden Germany UnitedKingdom
Denmark USA Poland Finland
2019 2020p 2021f Share in exports of Latvia (right axis)
2021 | 1 WORLD ECONOMIC OUTLOOK
7 MACROECONOMIC REVIEW OF LATVIA
GROSS DOMESTIC PRODUCT
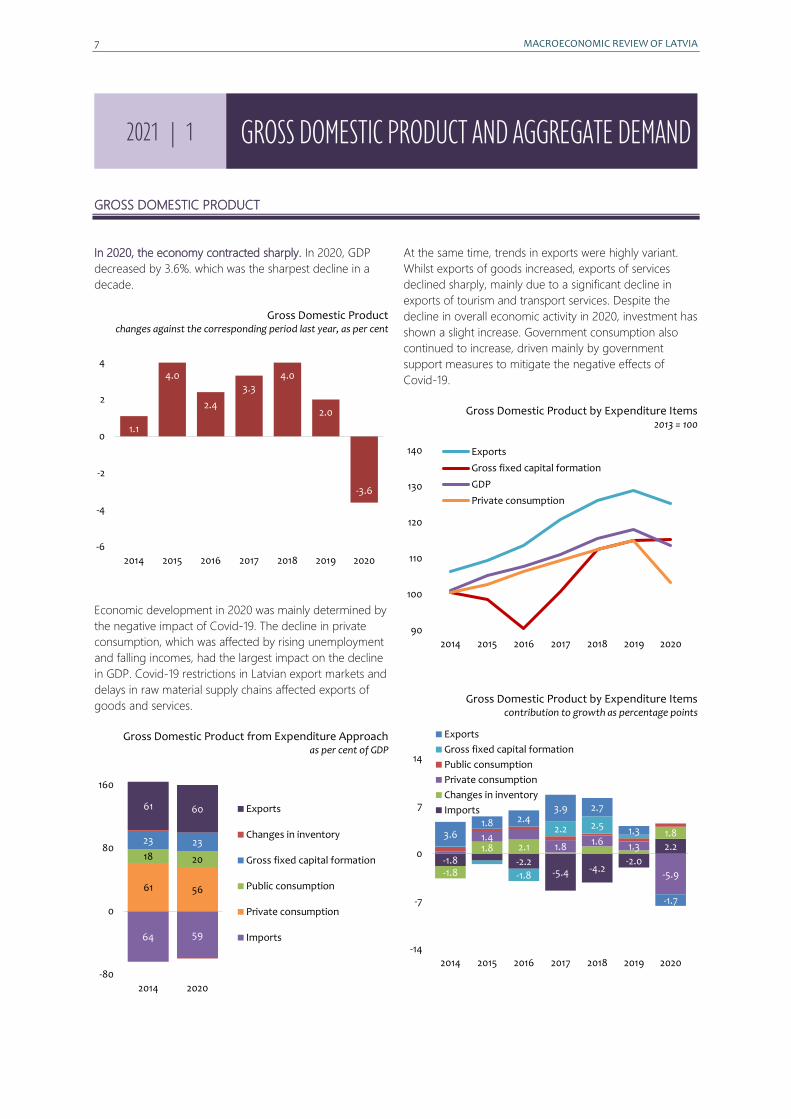
In 2020, the economy contracted sharply. In 2020, GDP
decreased by 3.6%. which was the sharpest decline in a
decade.
Gross Domestic Product changes against the corresponding period last year, as per cent
Economic development in 2020 was mainly determined by
the negative impact of Covid-19. The decline in private
consumption, which was affected by rising unemployment
and falling incomes, had the largest impact on the decline
in GDP. Covid-19 restrictions in Latvian export markets and
delays in raw material supply chains affected exports of
goods and services.
Gross Domestic Product from Expenditure Approach as per cent of GDP
At the same time, trends in exports were highly variant.
Whilst exports of goods increased, exports of services
declined sharply, mainly due to a significant decline in
exports of tourism and transport services. Despite the
decline in overall economic activity in 2020, investment has
shown a slight increase. Government consumption also
continued to increase, driven mainly by government
support measures to mitigate the negative effects of
Covid-19.
Gross Domestic Product by Expenditure Items 2013 = 100
Gross Domestic Product by Expenditure Items contribution to growth as percentage points
1.1
4.0
2.4
3.34.0
2.0
-3.6
-6
-4
-2
0
2
4
2014 2015 2016 2017 2018 2019 2020
64 59
61 56
18 20
23 23
61 60
-80
0
80
160
2014 2020
Exports
Changes in inventory
Gross fixed capital formation
Public consumption
Private consumption
Imports
90
100
110
120
130
140
2014 2015 2016 2017 2018 2019 2020
Exports
Gross fixed capital formation
GDP
Private consumption
-1.8 -2.2-5.4 -4.2
-2.0
2.2
-1.8
1.8 2.1
1.81.41.8
1.6 1.3
-5.9-1.8
2.2 2.53.6
1.8 2.43.9 2.7
1.3
-1.7
-14
-7
0
7
14
2014 2015 2016 2017 2018 2019 2020
Exports
Gross fixed capital formation
Public consumption
Private consumption
Changes in inventory
Imports
2021 | 1 GROSS DOMESTIC PRODUCT AND AGGREGATE DEMAND
MACROECONOMIC REVIEW OF LATVIA 8
CONSUMPTION
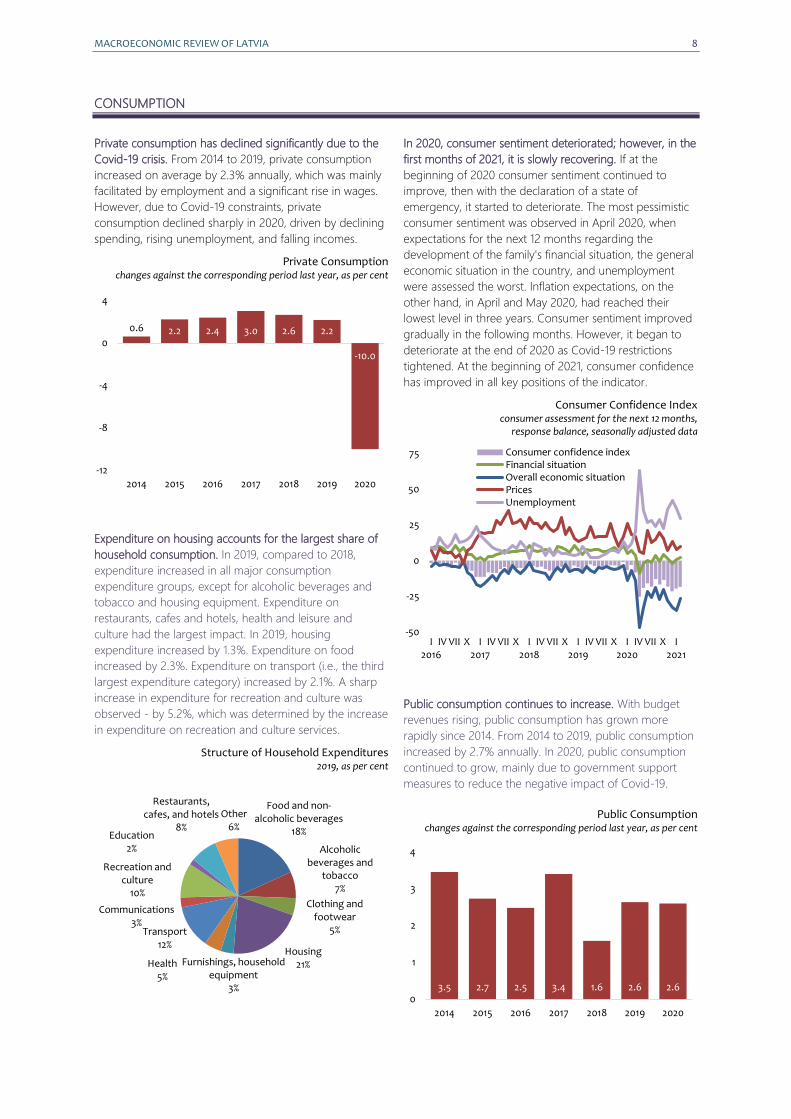
Private consumption has declined significantly due to the
Covid-19 crisis. From 2014 to 2019, private consumption
increased on average by 2.3% annually, which was mainly
facilitated by employment and a significant rise in wages.
However, due to Covid-19 constraints, private
consumption declined sharply in 2020, driven by declining
spending, rising unemployment, and falling incomes.
Private Consumption changes against the corresponding period last year, as per cent
Expenditure on housing accounts for the largest share of
household consumption. In 2019, compared to 2018,
expenditure increased in all major consumption
expenditure groups, except for alcoholic beverages and
tobacco and housing equipment. Expenditure on
restaurants, cafes and hotels, health and leisure and
culture had the largest impact. In 2019, housing
expenditure increased by 1.3%. Expenditure on food
increased by 2.3%. Expenditure on transport (i.e., the third
largest expenditure category) increased by 2.1%. A sharp
increase in expenditure for recreation and culture was
observed - by 5.2%, which was determined by the increase
in expenditure on recreation and culture services.
Structure of Household Expenditures 2019, as per cent
In 2020, consumer sentiment deteriorated; however, in the
first months of 2021, it is slowly recovering. If at the
beginning of 2020 consumer sentiment continued to
improve, then with the declaration of a state of
emergency, it started to deteriorate. The most pessimistic
consumer sentiment was observed in April 2020, when
expectations for the next 12 months regarding the
development of the family's financial situation, the general
economic situation in the country, and unemployment
were assessed the worst. Inflation expectations, on the
other hand, in April and May 2020, had reached their
lowest level in three years. Consumer sentiment improved
gradually in the following months. However, it began to
deteriorate at the end of 2020 as Covid-19 restrictions
tightened. At the beginning of 2021, consumer confidence
has improved in all key positions of the indicator.
Consumer Confidence Index consumer assessment for the next 12 months,
response balance, seasonally adjusted data
Public consumption continues to increase. With budget
revenues rising, public consumption has grown more
rapidly since 2014. From 2014 to 2019, public consumption
increased by 2.7% annually. In 2020, public consumption
continued to grow, mainly due to government support
measures to reduce the negative impact of Covid-19.
Public Consumption changes against the corresponding period last year, as per cent
0.6 2.2 2.4 3.0 2.6 2.2
-10.0
-12
-8
-4
0
4
2014 2015 2016 2017 2018 2019 2020
Food and non-alcoholic beverages
18%
Alcoholic beverages and
tobacco7%
Clothing and footwear
5%
Housing21%Furnishings, household
equipment3%
Health5%
Transport12%
Communications3%
Recreation and culture
10%
Education2%
Restaurants, cafes, and hotels
8%
Other6%
-50
-25
0
25
50
75
I2016
IV VII X I2017
IV VII X I2018
IV VII X I2019
IV VII X I2020
IV VII X I2021
Consumer confidence indexFinancial situationOverall economic situationPricesUnemployment
3.5 2.7 2.5 3.4 1.6 2.6 2.60
1
2
3
4
2014 2015 2016 2017 2018 2019 2020
9 MACROECONOMIC REVIEW OF LATVIA
INVESTMENT
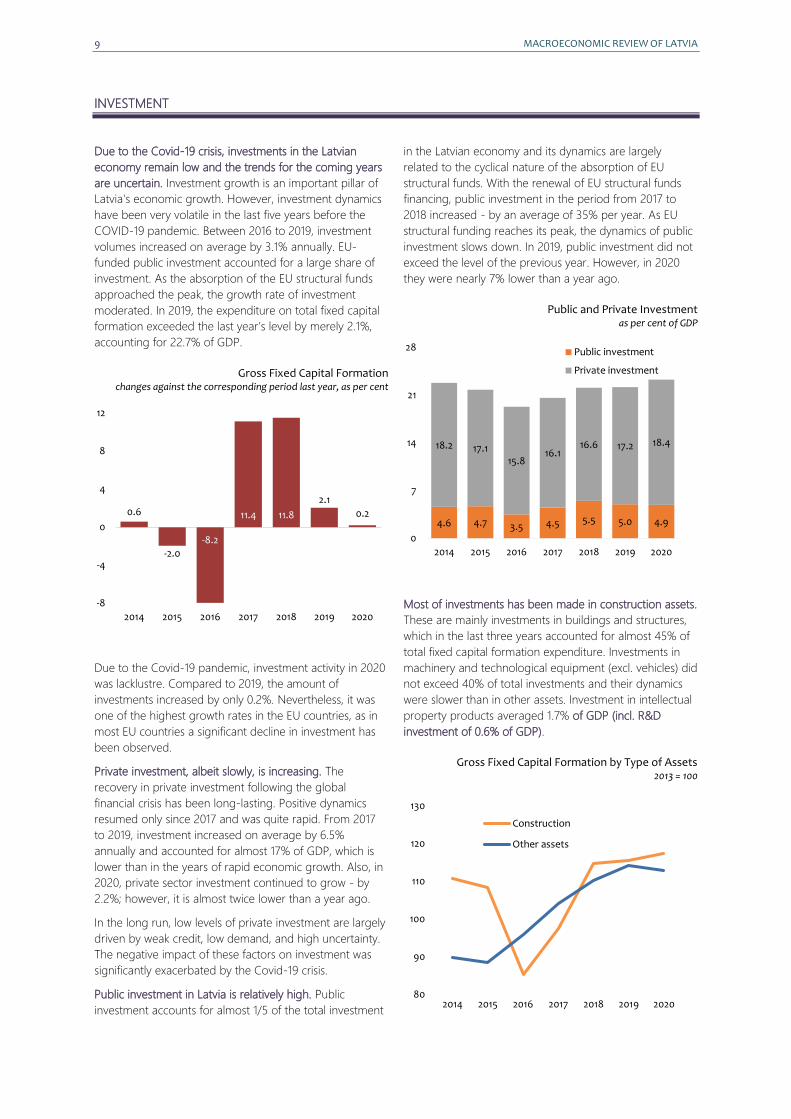
Due to the Covid-19 crisis, investments in the Latvian
economy remain low and the trends for the coming years
are uncertain. Investment growth is an important pillar of
Latvia's economic growth. However, investment dynamics
have been very volatile in the last five years before the
COVID-19 pandemic. Between 2016 to 2019, investment
volumes increased on average by 3.1% annually. EU-
funded public investment accounted for a large share of
investment. As the absorption of the EU structural funds
approached the peak, the growth rate of investment
moderated. In 2019, the expenditure on total fixed capital
formation exceeded the last year’s level by merely 2.1%,
accounting for 22.7% of GDP.
Gross Fixed Capital Formation
changes against the corresponding period last year, as per cent
Due to the Covid-19 pandemic, investment activity in 2020
was lacklustre. Compared to 2019, the amount of
investments increased by only 0.2%. Nevertheless, it was
one of the highest growth rates in the EU countries, as in
most EU countries a significant decline in investment has
been observed.
Private investment, albeit slowly, is increasing. The
recovery in private investment following the global
financial crisis has been long-lasting. Positive dynamics
resumed only since 2017 and was quite rapid. From 2017
to 2019, investment increased on average by 6.5%
annually and accounted for almost 17% of GDP, which is
lower than in the years of rapid economic growth. Also, in
2020, private sector investment continued to grow - by
2.2%; however, it is almost twice lower than a year ago.
In the long run, low levels of private investment are largely
driven by weak credit, low demand, and high uncertainty.
The negative impact of these factors on investment was
significantly exacerbated by the Covid-19 crisis.
Public investment in Latvia is relatively high. Public
investment accounts for almost 1/5 of the total investment
in the Latvian economy and its dynamics are largely
related to the cyclical nature of the absorption of EU
structural funds. With the renewal of EU structural funds
financing, public investment in the period from 2017 to
2018 increased - by an average of 35% per year. As EU
structural funding reaches its peak, the dynamics of public
investment slows down. In 2019, public investment did not
exceed the level of the previous year. However, in 2020
they were nearly 7% lower than a year ago.
Public and Private Investment as per cent of GDP
Most of investments has been made in construction assets.
These are mainly investments in buildings and structures,
which in the last three years accounted for almost 45% of
total fixed capital formation expenditure. Investments in
machinery and technological equipment (excl. vehicles) did
not exceed 40% of total investments and their dynamics
were slower than in other assets. Investment in intellectual
property products averaged 1.7% of GDP (incl. R&D
investment of 0.6% of GDP).
Gross Fixed Capital Formation by Type of Assets
2013 = 100
0.6
-2.0
-8.2
11.4 11.8
2.1
0.2
-8
-4
0
4
8
12
2014 2015 2016 2017 2018 2019 2020
4.6 4.7 3.5 4.5 5.5 5.0 4.9
18.2 17.115.8
16.116.6 17.2 18.4
0
7
14
21
28
2014 2015 2016 2017 2018 2019 2020
Public investment
Private investment
80
90
100
110
120
130
2014 2015 2016 2017 2018 2019 2020
Construction
Other assets
MACROECONOMIC REVIEW OF LATVIA 10
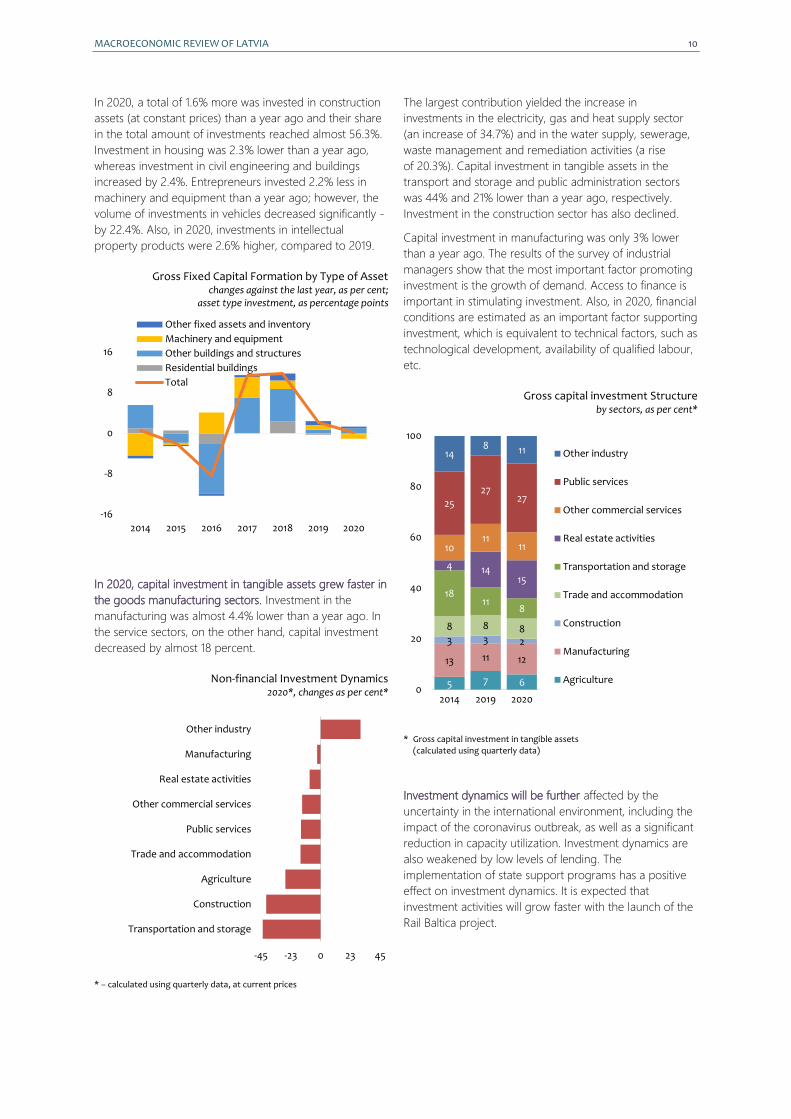
In 2020, a total of 1.6% more was invested in construction
assets (at constant prices) than a year ago and their share
in the total amount of investments reached almost 56.3%.
Investment in housing was 2.3% lower than a year ago,
whereas investment in civil engineering and buildings
increased by 2.4%. Entrepreneurs invested 2.2% less in
machinery and equipment than a year ago; however, the
volume of investments in vehicles decreased significantly -
by 22.4%. Also, in 2020, investments in intellectual
property products were 2.6% higher, compared to 2019.
Gross Fixed Capital Formation by Type of Asset
changes against the last year, as per cent; asset type investment, as percentage points
In 2020, capital investment in tangible assets grew faster in
the goods manufacturing sectors. Investment in the
manufacturing was almost 4.4% lower than a year ago. In
the service sectors, on the other hand, capital investment
decreased by almost 18 percent.
Non-financial Investment Dynamics 2020*, changes as per cent*
* – calculated using quarterly data, at current prices
The largest contribution yielded the increase in
investments in the electricity, gas and heat supply sector
(an increase of 34.7%) and in the water supply, sewerage,
waste management and remediation activities (a rise
of 20.3%). Capital investment in tangible assets in the
transport and storage and public administration sectors
was 44% and 21% lower than a year ago, respectively.
Investment in the construction sector has also declined.
Capital investment in manufacturing was only 3% lower
than a year ago. The results of the survey of industrial
managers show that the most important factor promoting
investment is the growth of demand. Access to finance is
important in stimulating investment. Also, in 2020, financial
conditions are estimated as an important factor supporting
investment, which is equivalent to technical factors, such as
technological development, availability of qualified labour,
etc.
Gross capital investment Structure by sectors, as per cent*
* Gross capital investment in tangible assets (calculated using quarterly data)
Investment dynamics will be further affected by the
uncertainty in the international environment, including the
impact of the coronavirus outbreak, as well as a significant
reduction in capacity utilization. Investment dynamics are
also weakened by low levels of lending. The
implementation of state support programs has a positive
effect on investment dynamics. It is expected that
investment activities will grow faster with the launch of the
Rail Baltica project.
-16
-8
0
8
16
2014 2015 2016 2017 2018 2019 2020
Other fixed assets and inventory
Machinery and equipment
Other buildings and structures
Residential buildings
Total
-45 -23 0 23 45
Transportation and storage
Construction
Agriculture
Trade and accommodation
Public services
Other commercial services
Real estate activities
Manufacturing
Other industry
5 7 6
13 11 12
3 3 2
8 8 8
1811
8
4 1415
1011
11
25
2727
148 11
0
20
40
60
80
100
2014 2019 2020
Other industry
Public services
Other commercial services
Real estate activities
Transportation and storage
Trade and accommodation
Construction
Manufacturing
Agriculture
11 MACROECONOMIC REVIEW OF LATVIA
EXPORTS
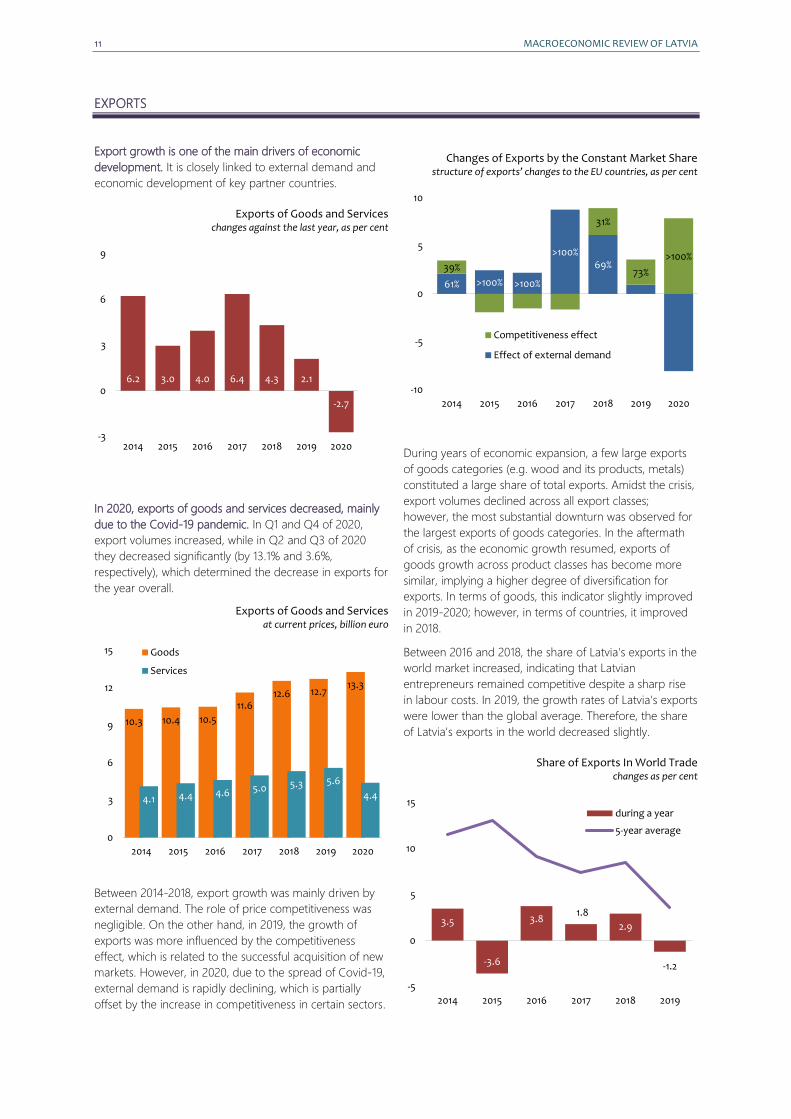
Export growth is one of the main drivers of economic
development. It is closely linked to external demand and
economic development of key partner countries.
Exports of Goods and Services changes against the last year, as per cent
In 2020, exports of goods and services decreased, mainly
due to the Covid-19 pandemic. In Q1 and Q4 of 2020,
export volumes increased, while in Q2 and Q3 of 2020
they decreased significantly (by 13.1% and 3.6%,
respectively), which determined the decrease in exports for
the year overall.
Exports of Goods and Services at current prices, billion euro
Between 2014-2018, export growth was mainly driven by
external demand. The role of price competitiveness was
negligible. On the other hand, in 2019, the growth of
exports was more influenced by the competitiveness
effect, which is related to the successful acquisition of new
markets. However, in 2020, due to the spread of Covid-19,
external demand is rapidly declining, which is partially
offset by the increase in competitiveness in certain sectors.
Changes of Exports by the Constant Market Share structure of exports’ changes to the EU countries, as per cent
During years of economic expansion, a few large exports
of goods categories (e.g. wood and its products, metals)
constituted a large share of total exports. Amidst the crisis,
export volumes declined across all export classes;
however, the most substantial downturn was observed for
the largest exports of goods categories. In the aftermath
of crisis, as the economic growth resumed, exports of
goods growth across product classes has become more
similar, implying a higher degree of diversification for
exports. In terms of goods, this indicator slightly improved
in 2019-2020; however, in terms of countries, it improved
in 2018.
Between 2016 and 2018, the share of Latvia's exports in the
world market increased, indicating that Latvian
entrepreneurs remained competitive despite a sharp rise
in labour costs. In 2019, the growth rates of Latvia's exports
were lower than the global average. Therefore, the share
of Latvia's exports in the world decreased slightly.
Share of Exports In World Trade changes as per cent
6.2 3.0 4.0 6.4 4.3 2.1
-2.7
-3
0
3
6
9
2014 2015 2016 2017 2018 2019 2020
10.3 10.4 10.5
11.612.6 12.7
13.3
4.1 4.4 4.6 5.0 5.3 5.6
4.4
0
3
6
9
12
15
2014 2015 2016 2017 2018 2019 2020
Goods
Services
61% >100% >100%
>100%69%39%
31%
73%
>100%
-10
-5
0
5
10
2014 2015 2016 2017 2018 2019 2020
Competitiveness effect
Effect of external demand
3.5
-3.6
3.81.8
2.9
-1.2
-5
0
5
10
15
2014 2015 2016 2017 2018 2019
during a year
5-year average
MACROECONOMIC REVIEW OF LATVIA 12
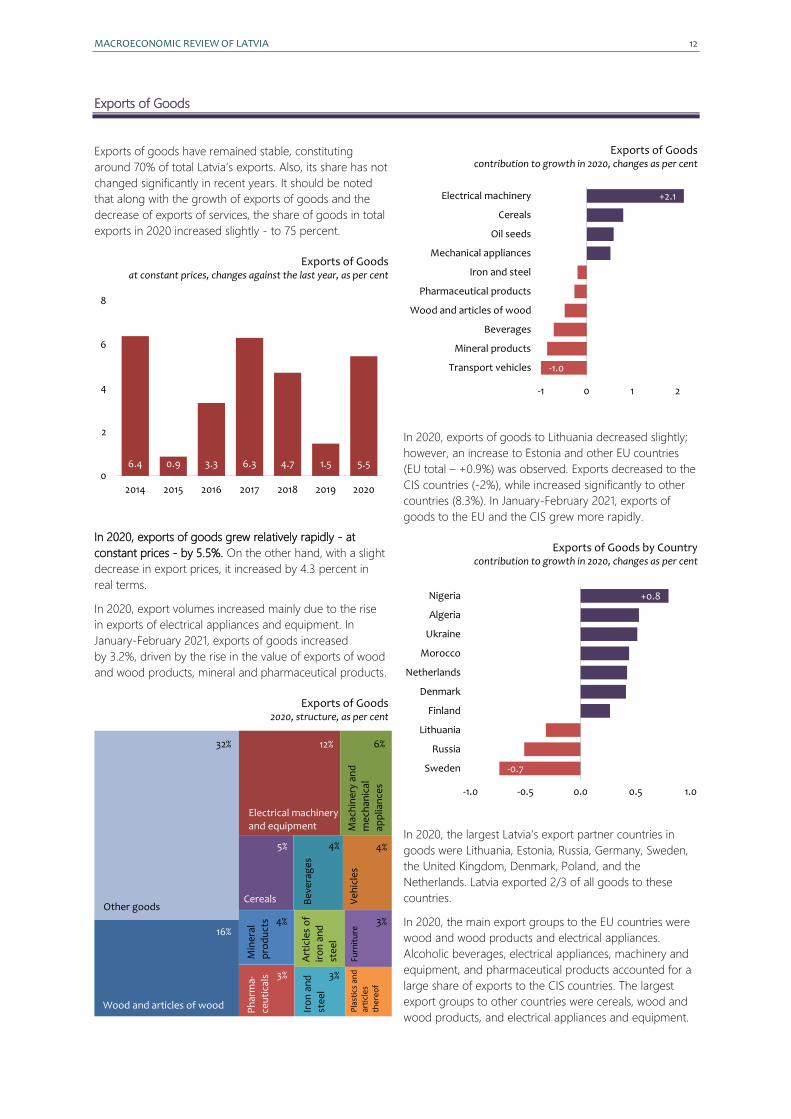
Exports of Goods
Exports of goods have remained stable, constituting
around 70% of total Latvia’s exports. Also, its share has not
changed significantly in recent years. It should be noted
that along with the growth of exports of goods and the
decrease of exports of services, the share of goods in total
exports in 2020 increased slightly - to 75 percent.
Exports of Goods at constant prices, changes against the last year, as per cent
In 2020, exports of goods grew relatively rapidly - at
constant prices - by 5.5%. On the other hand, with a slight
decrease in export prices, it increased by 4.3 percent in
real terms.
In 2020, export volumes increased mainly due to the rise
in exports of electrical appliances and equipment. In
January-February 2021, exports of goods increased
by 3.2%, driven by the rise in the value of exports of wood
and wood products, mineral and pharmaceutical products.
Exports of Goods 2020, structure, as per cent
Exports of Goods contribution to growth in 2020, changes as per cent
In 2020, exports of goods to Lithuania decreased slightly;
however, an increase to Estonia and other EU countries
(EU total – +0.9%) was observed. Exports decreased to the
CIS countries (-2%), while increased significantly to other
countries (8.3%). In January-February 2021, exports of
goods to the EU and the CIS grew more rapidly.
Exports of Goods by Country contribution to growth in 2020, changes as per cent
In 2020, the largest Latvia’s export partner countries in
goods were Lithuania, Estonia, Russia, Germany, Sweden,
the United Kingdom, Denmark, Poland, and the
Netherlands. Latvia exported 2/3 of all goods to these
countries.
In 2020, the main export groups to the EU countries were
wood and wood products and electrical appliances.
Alcoholic beverages, electrical appliances, machinery and
equipment, and pharmaceutical products accounted for a
large share of exports to the CIS countries. The largest
export groups to other countries were cereals, wood and
wood products, and electrical appliances and equipment.
6.4 0.9 3.3 6.3 4.7 1.5 5.50
2
4
6
8
2014 2015 2016 2017 2018 2019 2020
-1.0
+2.1
-1 0 1 2
Transport vehicles
Mineral products
Beverages
Wood and articles of wood
Pharmaceutical products
Iron and steel
Mechanical appliances
Oil seeds
Cereals
Electrical machinery
-0.7
+0.8
-1.0 -0.5 0.0 0.5 1.0
Sweden
Russia
Lithuania
Finland
Denmark
Netherlands
Morocco
Ukraine
Algeria
Nigeria
Other goods
16%
32% 12% 6%
3%
4%
4%
4%
Wood and articles of wood
Electrical machinery and equipment M
ach
ine
ry a
nd
me
chan
ical
app
lian
ces
Cereals Ve
hic
les
Art
icle
s o
f ir
on
an
d
ste
el
Furn
itu
re
Be
vera
ge
s Ir
on
an
d
ste
el
3%
Min
era
l
pro
du
cts
Ph
arm
a-
ceu
tica
ls
5%
3%
Pla
stic
s an
d
arti
cle
s
the
reo
f
13 MACROECONOMIC REVIEW OF LATVIA
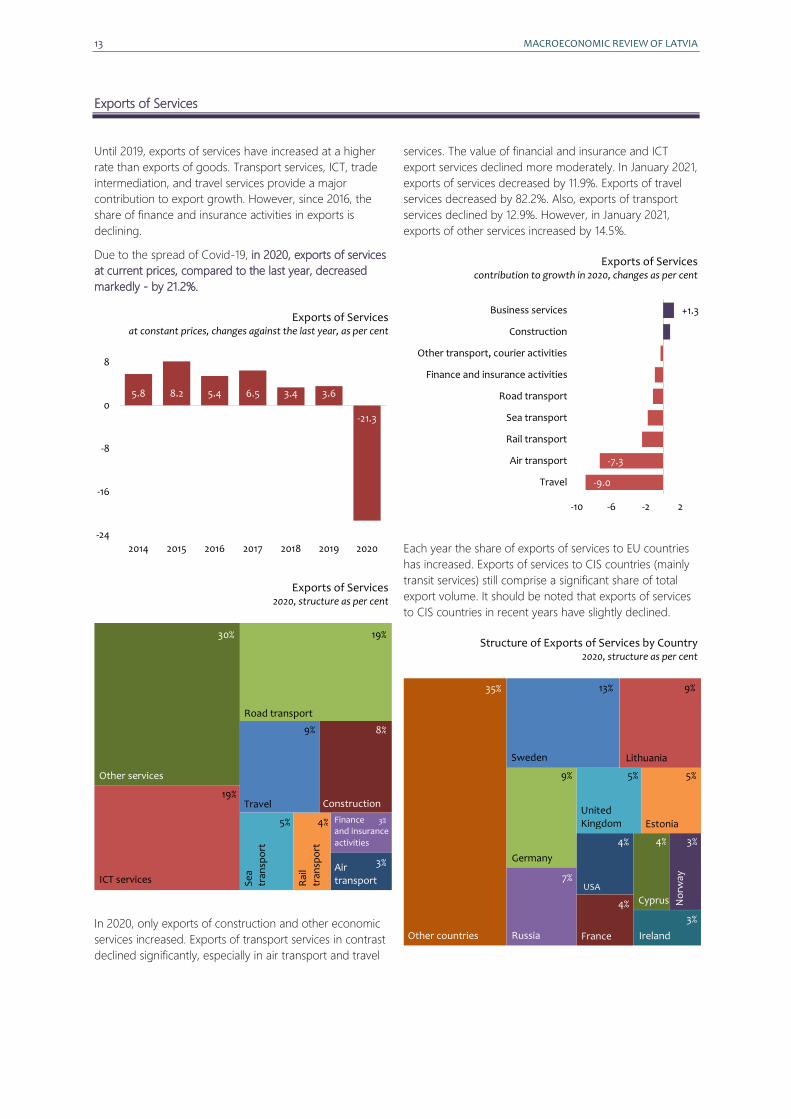
Exports of Services
Until 2019, exports of services have increased at a higher
rate than exports of goods. Transport services, ICT, trade
intermediation, and travel services provide a major
contribution to export growth. However, since 2016, the
share of finance and insurance activities in exports is
declining.
Due to the spread of Covid-19, in 2020, exports of services
at current prices, compared to the last year, decreased
markedly - by 21.2%.
Exports of Services at constant prices, changes against the last year, as per cent
Exports of Services 2020, structure as per cent
In 2020, only exports of construction and other economic
services increased. Exports of transport services in contrast
declined significantly, especially in air transport and travel
services. The value of financial and insurance and ICT
export services declined more moderately. In January 2021,
exports of services decreased by 11.9%. Exports of travel
services decreased by 82.2%. Also, exports of transport
services declined by 12.9%. However, in January 2021,
exports of other services increased by 14.5%.
Exports of Services contribution to growth in 2020, changes as per cent
Each year the share of exports of services to EU countries
has increased. Exports of services to CIS countries (mainly
transit services) still comprise a significant share of total
export volume. It should be noted that exports of services
to CIS countries in recent years have slightly declined.
Structure of Exports of Services by Country 2020, structure as per cent
5.8 8.2 5.4 6.5 3.4 3.6
-21.3
-24
-16
-8
0
8
2014 2015 2016 2017 2018 2019 2020
-9.0
-7.3
+1.3
-10 -6 -2 2
Travel
Air transport
Rail transport
Sea transport
Road transport
Finance and insurance activities
Other transport, courier activities
Construction
Business services
Sweden
35%
Road transport
30%
Other services
Travel
ICT services
Construction
Se
a
tran
spo
rt
Air transport
9%
19%
19%
8%
Other countries Russia
Germany
Estonia
Lithuania
United Kingdom
USA
France
Cyprus
13% 9%
7%
9%
4%
4%
5% 5%
3%
No
rway
4%
5%
3%
Rai
l
tran
spo
rt
4% Finance and insurance
activities
3%
3%
Ireland
MACROECONOMIC REVIEW OF LATVIA 14
IMPORTS
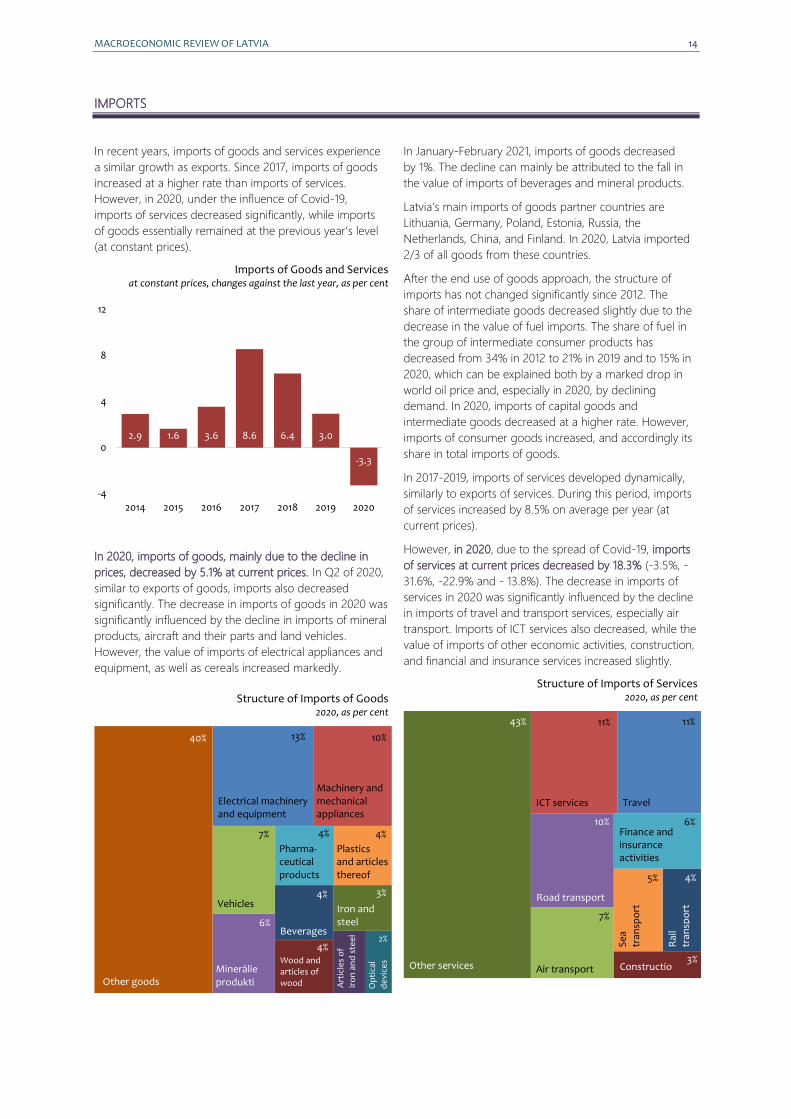
In recent years, imports of goods and services experience
a similar growth as exports. Since 2017, imports of goods
increased at a higher rate than imports of services.
However, in 2020, under the influence of Covid-19,
imports of services decreased significantly, while imports
of goods essentially remained at the previous year's level
(at constant prices).
Imports of Goods and Services at constant prices, changes against the last year, as per cent
In 2020, imports of goods, mainly due to the decline in
prices, decreased by 5.1% at current prices. In Q2 of 2020,
similar to exports of goods, imports also decreased
significantly. The decrease in imports of goods in 2020 was
significantly influenced by the decline in imports of mineral
products, aircraft and their parts and land vehicles.
However, the value of imports of electrical appliances and
equipment, as well as cereals increased markedly.
Structure of Imports of Goods 2020, as per cent
In January-February 2021, imports of goods decreased
by 1%. The decline can mainly be attributed to the fall in
the value of imports of beverages and mineral products.
Latvia’s main imports of goods partner countries are
Lithuania, Germany, Poland, Estonia, Russia, the
Netherlands, China, and Finland. In 2020, Latvia imported
2/3 of all goods from these countries.
After the end use of goods approach, the structure of
imports has not changed significantly since 2012. The
share of intermediate goods decreased slightly due to the
decrease in the value of fuel imports. The share of fuel in
the group of intermediate consumer products has
decreased from 34% in 2012 to 21% in 2019 and to 15% in
2020, which can be explained both by a marked drop in
world oil price and, especially in 2020, by declining
demand. In 2020, imports of capital goods and
intermediate goods decreased at a higher rate. However,
imports of consumer goods increased, and accordingly its
share in total imports of goods.
In 2017-2019, imports of services developed dynamically,
similarly to exports of services. During this period, imports
of services increased by 8.5% on average per year (at
current prices).
However, in 2020, due to the spread of Covid-19, imports
of services at current prices decreased by 18.3% (-3.5%, -
31.6%, -22.9% and - 13.8%). The decrease in imports of
services in 2020 was significantly influenced by the decline
in imports of travel and transport services, especially air
transport. Imports of ICT services also decreased, while the
value of imports of other economic activities, construction,
and financial and insurance services increased slightly.
Structure of Imports of Services 2020, as per cent
2.9 1.6 3.6 8.6 6.4 3.0
-3.3
-4
0
4
8
12
2014 2015 2016 2017 2018 2019 2020
Other goods
40%
Machinery and mechanical appliances
Vehicles
Minerālie produkti
Iron and steel 6%
13% 10%
4%
4%
Electrical machinery and equipment
Beverages
Plastics and articles thereof
Art
icle
s o
f
iro
n a
nd
ste
el
Op
tica
l
de
vice
s
7%
Air transport
Travel
43%
Other services
Road transport
ICT services
Se
a
tran
spo
rt
Rai
l tr
ansp
ort
Finance and insurance activities
7%
11% 11%
3%
10% 6%
Pharma-ceutical products 3%
4%
Wood and articles of wood
5%
4%
4%
2%
Construction
15 MACROECONOMIC REVIEW OF LATVIA
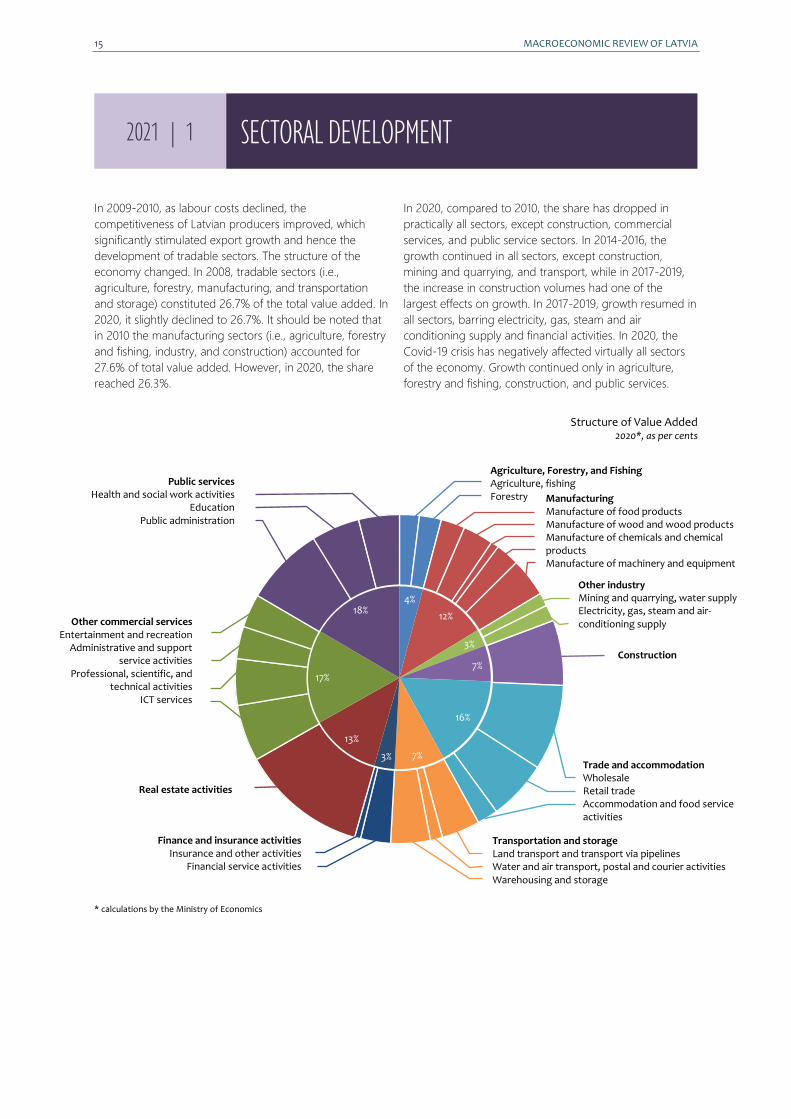
In 2009-2010, as labour costs declined, the
competitiveness of Latvian producers improved, which
significantly stimulated export growth and hence the
development of tradable sectors. The structure of the
economy changed. In 2008, tradable sectors (i.e.,
agriculture, forestry, manufacturing, and transportation
and storage) constituted 26.7% of the total value added. In
2020, it slightly declined to 26.7%. It should be noted that
in 2010 the manufacturing sectors (i.e., agriculture, forestry
and fishing, industry, and construction) accounted for
27.6% of total value added. However, in 2020, the share
reached 26.3%.
In 2020, compared to 2010, the share has dropped in
practically all sectors, except construction, commercial
services, and public service sectors. In 2014-2016, the
growth continued in all sectors, except construction,
mining and quarrying, and transport, while in 2017-2019,
the increase in construction volumes had one of the
largest effects on growth. In 2017-2019, growth resumed in
all sectors, barring electricity, gas, steam and air
conditioning supply and financial activities. In 2020, the
Covid-19 crisis has negatively affected virtually all sectors
of the economy. Growth continued only in agriculture,
forestry and fishing, construction, and public services.
Structure of Value Added 2020*, as per cents
* calculations by the Ministry of Economics
2021 | 1 SECTORAL DEVELOPMENT
4%
12%
3%
7%
16%
7%3%
13%
17%
18%Other commercial services
Entertainment and recreation Administrative and support
service activities Professional, scientific, and
technical activities ICT services
Agriculture, Forestry, and Fishing Agriculture, fishing Forestry
Manufacturing Manufacture of food products Manufacture of wood and wood products Manufacture of chemicals and chemical products Manufacture of machinery and equipment Other manufacturing
Other industry Mining and quarrying, water supply Electricity, gas, steam and air-conditioning supply
Construction
Trade and accommodation Wholesale Retail trade Accommodation and food service activities
Transportation and storage Land transport and transport via pipelines Water and air transport, postal and courier activities Warehousing and storage
Finance and insurance activities Insurance and other activities
Financial service activities
Real estate activities
Public services Health and social work activities
Education Public administration

MACROECONOMIC REVIEW OF LATVIA 16
Development of Sectors changes against the last year, as per cent
2014 2015 2016 2017 2018 2019 2020
Gross domestic product 1.1 4.0 2.4 3.3 4.0 2.0 -3.6
Agriculture, forestry, and fishing 8.0 2.7 -4.3 1.8 -3.6 12.3 1.8
Mining and quarrying -13.1 14.8 -2.8 9.1 9.1 -4.6 8.8
Manufacturing -2.9 4.4 1.7 6.7 7.6 2.1 -0.9
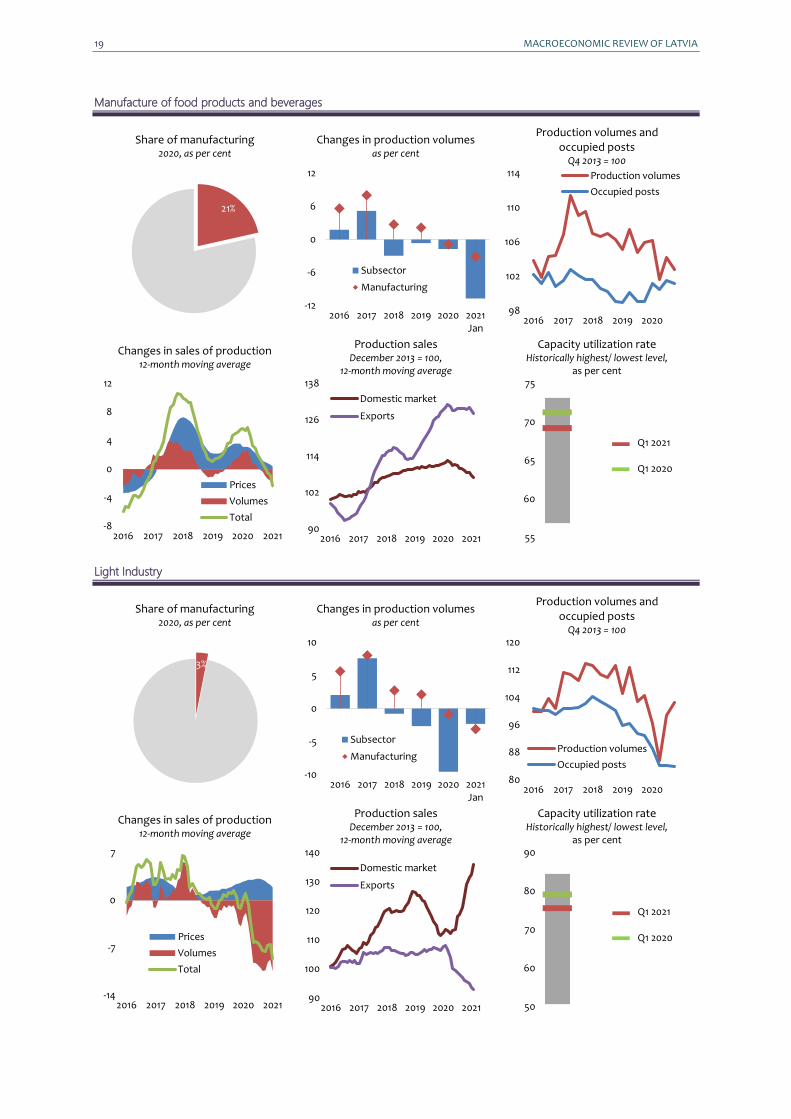
Manufacture of food products 0.1 -4.6 1.8 5.2 -2.9 -0.7 -1.7
Light industry -13.6 -13.2 2.1 7.6 -0.8 -2.6 -9.5
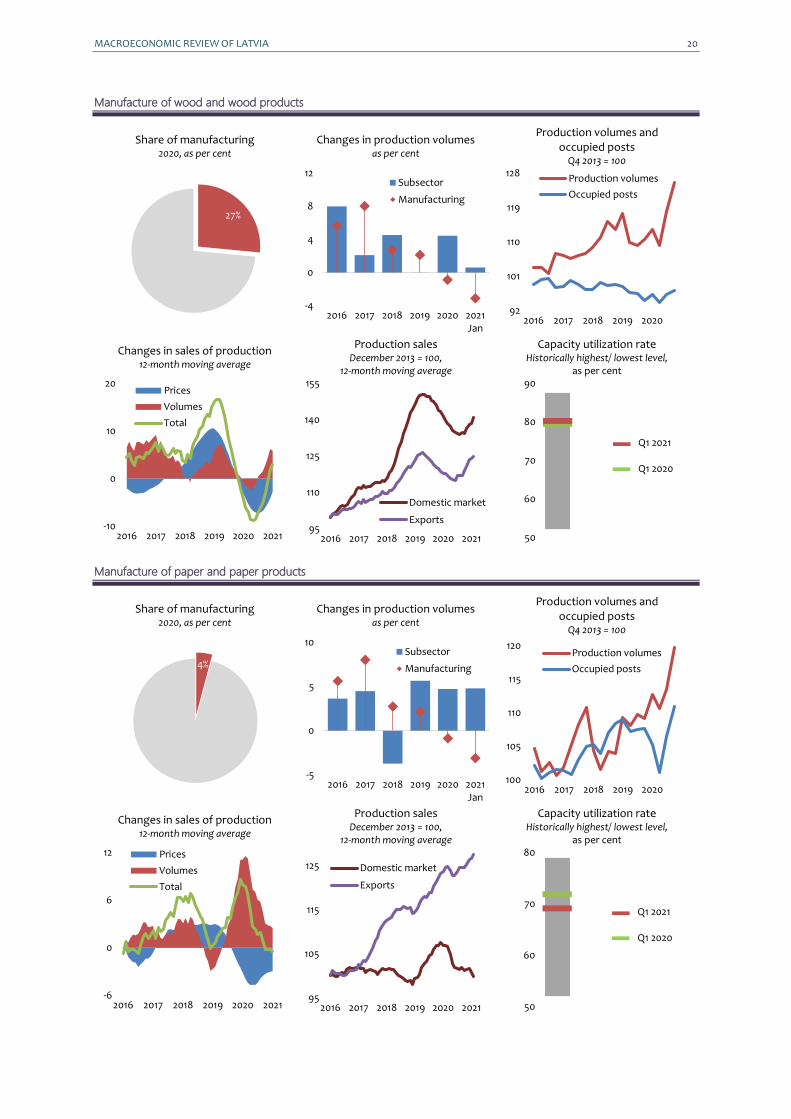
Manufacture of wood and articles of wood 6.9 7.1 8.0 2.1 4.5 0.0 4.5
Manufacture of paper and paper products -0.6 0.0 3.6 4.5 -3.7 5.7 4.7
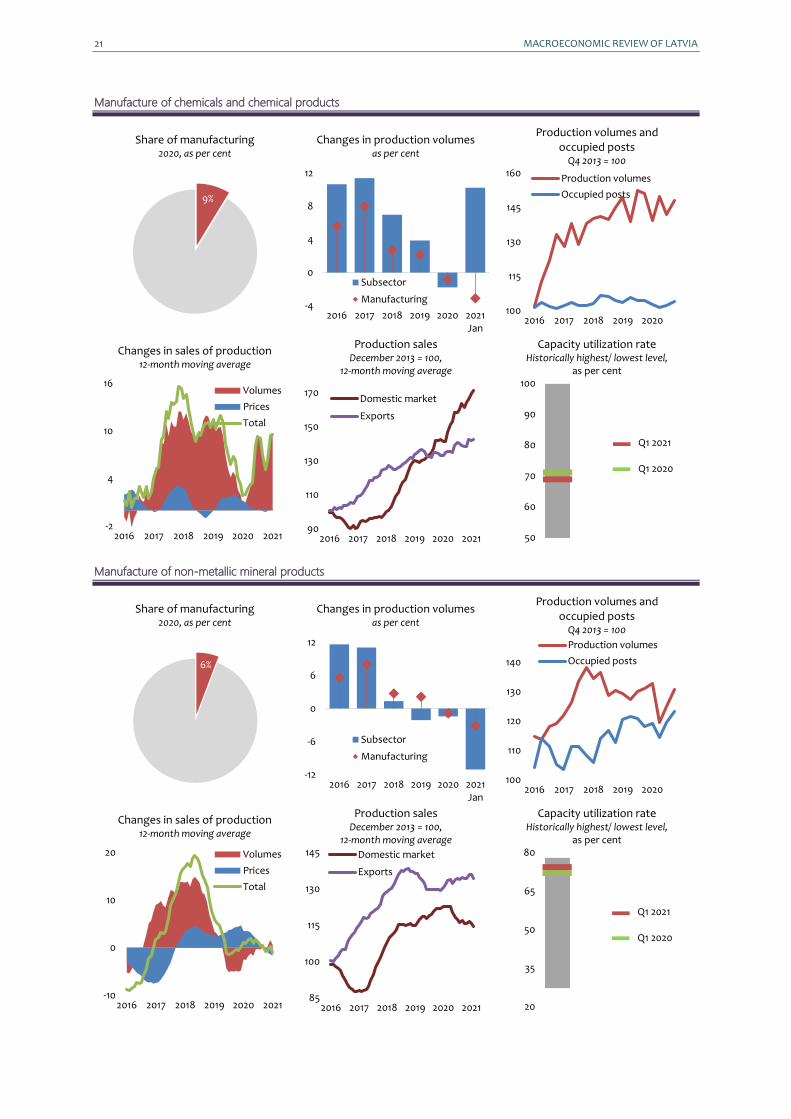
Manufacture of chemicals and chemical products -2.6 -4.1 10.7 11.4 7.0 3.9 -1.8
Manufacture of non-metallic mineral products 1.2 -9.8 11.6 11.1 1.3 -2.1 -1.4
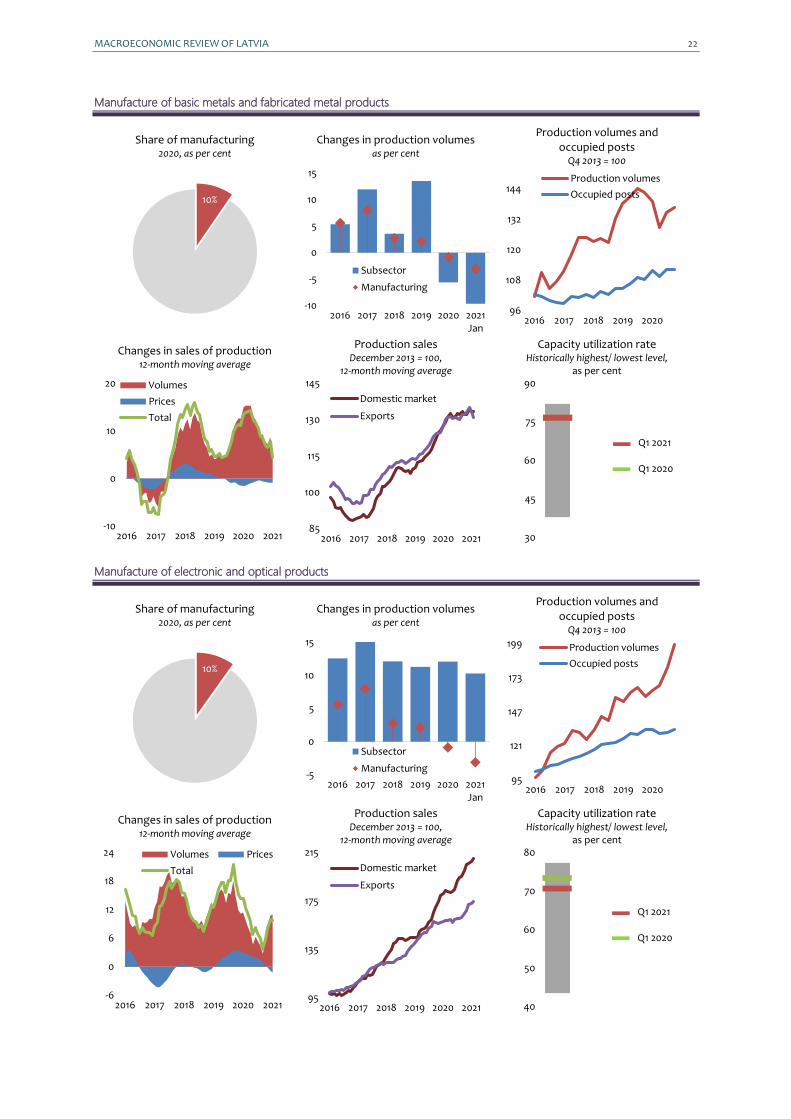
Manufacture of basic metals -10.5 34.8 5.4 12.0 3.6 13.5 -5.6
Manufacture of computer, electronic and optical products 32.3 16.7 12.6 15.8 12.1 11.3 12.1
Manufacture of machinery and equipment 2.4 7.9 8.5 21.5 7.0 -1.9 -2.7
Manufacture of motor vehicles -15.2 3.5 -2.9 22.8 7.3 -7.7 -15.3
Other manufacturing -12.0 3.5 0.8 4.3 -1.8 2.8 -14.2
Electricity, gas, steam, and air-conditioning supply -13.3 22.1 17.5 -2.1 -38.7 -4.4 -6.0
Construction -2.6 -0.4 -9.6 14.6 12.5 2.2 2.6
Construction of buildings 28.2 -8.2 -11.1 22.4 25.6 7.8 0.9
Civil engineering -6.8 0.4 -25.7 30.0 11.6 1.0 -1.5
Trade 3.7 7.0 4.5 2.5 4.0 4.2 -2.2
Retail trade 3.5 4.9 2.3 4.3 3.8 2.3 1.5
Transportation and storage -3.6 1.2 1.7 6.4 4.0 -2.7 -14.9
Freight rail transport 2.2 -2.4 -14.1 -8.4 12.5 -15.8 -42.3
Cargo handling 5.2 -6.2 -9.3 -2.0 6.9 -5.7 -28.0
Freight transport by road 2.7 0.5 1.3 7.0 12.8 -3.8 2.6
Accommodation and food service activities -2.2 8.9 4.4 9.3 7.6 8.3 -38.1
Information and communication services -2.7 2.3 5.0 8.6 9.7 1.0 -6.2
Finance and insurance activities 5.5 13.3 -0.2 -17.1 -3.1 -15.7 -5.7
Real estate activities 4.9 -2.4 1.6 -1.6 2.4 1.4 -0.4
Other service activities -1.2 1.9 3.9 4.5 2.8 6.3 -3.3
Public administration and defence; compulsory social security 2.4 2.4 1.5 3.8 2.8 2.0 1.5
Education 1.9 3.2 1.1 4.3 3.0 2.8 0.8
Health and social work activities 14.5 5.2 1.2 4.3 9.3 9.6 2.4
Arts, entertainment, and recreation -7.7 8.2 5.0 5.1 6.1 5.7 -26.6
17 MACROECONOMIC REVIEW OF LATVIA
MANUFACTURING
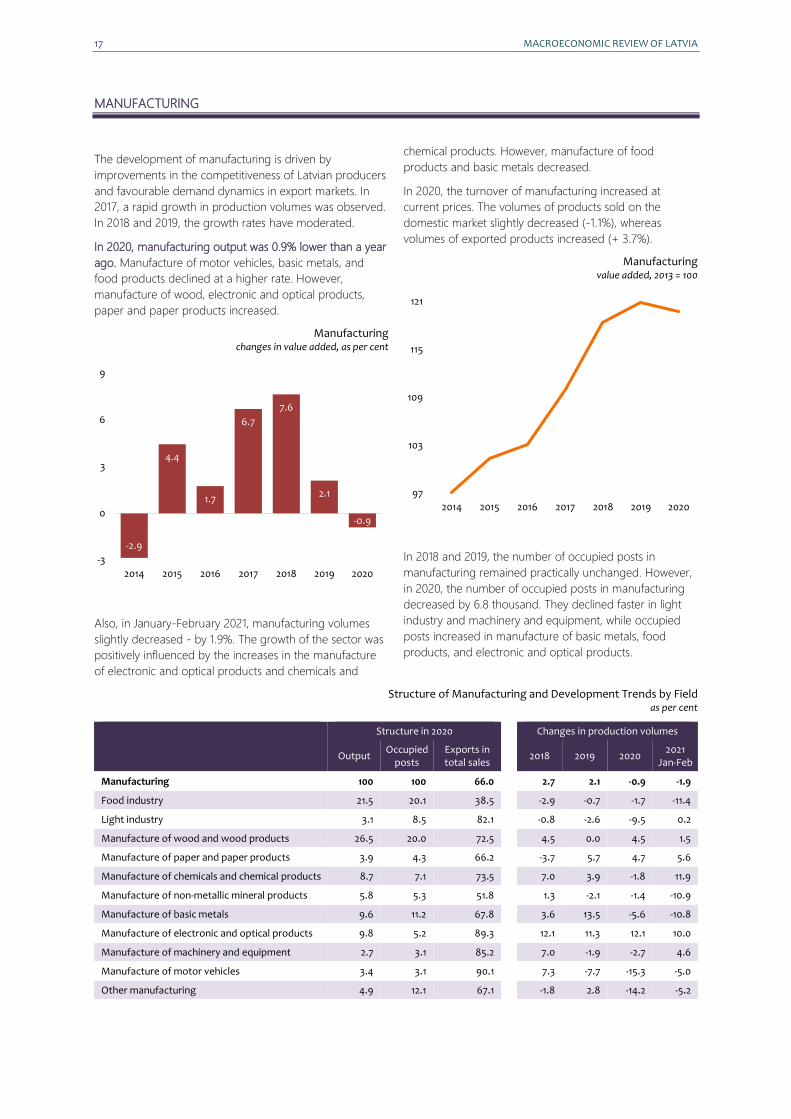
The development of manufacturing is driven by
improvements in the competitiveness of Latvian producers
and favourable demand dynamics in export markets. In
2017, a rapid growth in production volumes was observed.
In 2018 and 2019, the growth rates have moderated.
In 2020, manufacturing output was 0.9% lower than a year
ago. Manufacture of motor vehicles, basic metals, and
food products declined at a higher rate. However,
manufacture of wood, electronic and optical products,
paper and paper products increased.
Manufacturing changes in value added, as per cent
Also, in January-February 2021, manufacturing volumes
slightly decreased - by 1.9%. The growth of the sector was
positively influenced by the increases in the manufacture
of electronic and optical products and chemicals and
chemical products. However, manufacture of food
products and basic metals decreased.
In 2020, the turnover of manufacturing increased at
current prices. The volumes of products sold on the
domestic market slightly decreased (-1.1%), whereas
volumes of exported products increased (+ 3.7%).
Manufacturing value added, 2013 = 100
In 2018 and 2019, the number of occupied posts in
manufacturing remained practically unchanged. However,
in 2020, the number of occupied posts in manufacturing
decreased by 6.8 thousand. They declined faster in light
industry and machinery and equipment, while occupied
posts increased in manufacture of basic metals, food
products, and electronic and optical products.
Structure of Manufacturing and Development Trends by Field as per cent
Structure in 2020
Changes in production volumes
Output Occupied
posts Exports in total sales
2018 2019 2020 2021
Jan-Feb
Manufacturing 100 100 66.0
2.7 2.1 -0.9 -1.9
Food industry 21.5 20.1 38.5
-2.9 -0.7 -1.7 -11.4
Light industry 3.1 8.5 82.1
-0.8 -2.6 -9.5 0.2
Manufacture of wood and wood products 26.5 20.0 72.5
4.5 0.0 4.5 1.5
Manufacture of paper and paper products 3.9 4.3 66.2
-3.7 5.7 4.7 5.6
Manufacture of chemicals and chemical products 8.7 7.1 73.5
7.0 3.9 -1.8 11.9
Manufacture of non-metallic mineral products 5.8 5.3 51.8
1.3 -2.1 -1.4 -10.9
Manufacture of basic metals 9.6 11.2 67.8
3.6 13.5 -5.6 -10.8
Manufacture of electronic and optical products 9.8 5.2 89.3
12.1 11.3 12.1 10.0
Manufacture of machinery and equipment 2.7 3.1 85.2
7.0 -1.9 -2.7 4.6
Manufacture of motor vehicles 3.4 3.1 90.1
7.3 -7.7 -15.3 -5.0
Other manufacturing 4.9 12.1 67.1
-1.8 2.8 -14.2 -5.2
-2.9
4.4
1.7
6.7
7.6
2.1
-0.9
-3
0
3
6
9
2014 2015 2016 2017 2018 2019 2020
97
103
109
115
121
2014 2015 2016 2017 2018 2019 2020
MACROECONOMIC REVIEW OF LATVIA 18
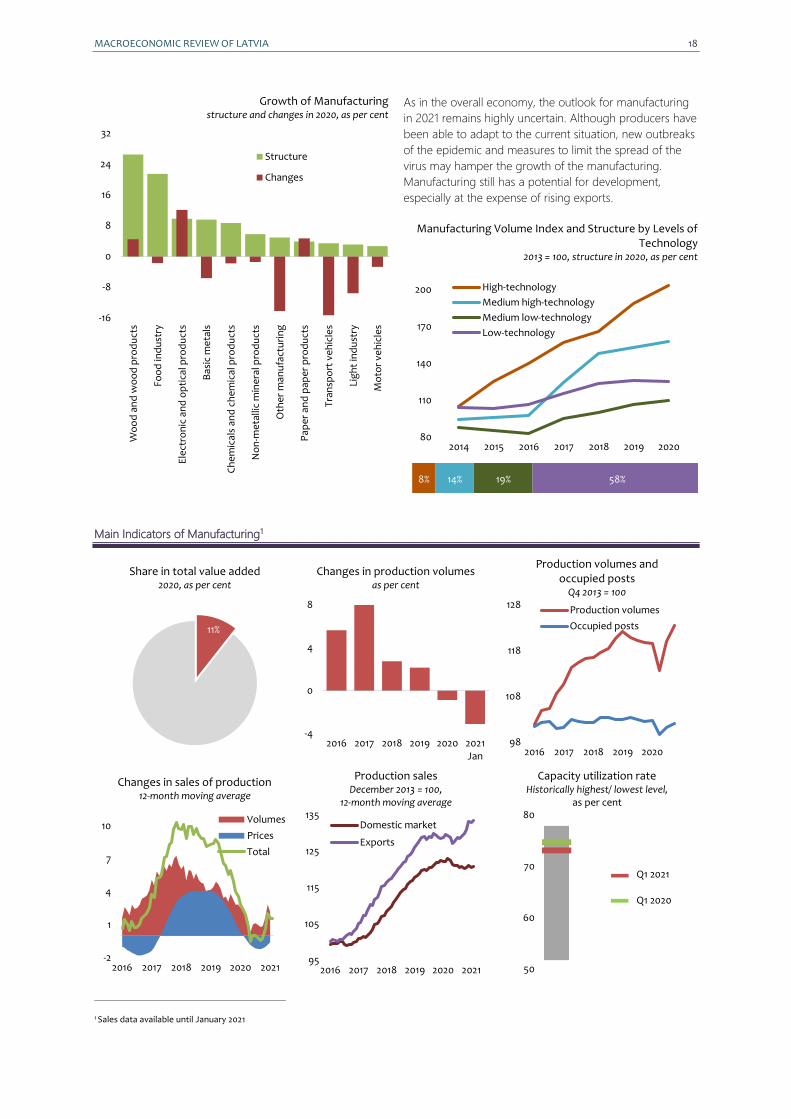
Growth of Manufacturing structure and changes in 2020, as per cent
As in the overall economy, the outlook for manufacturing
in 2021 remains highly uncertain. Although producers have
been able to adapt to the current situation, new outbreaks
of the epidemic and measures to limit the spread of the
virus may hamper the growth of the manufacturing.
Manufacturing still has a potential for development,
especially at the expense of rising exports.
Manufacturing Volume Index and Structure by Levels of Technology
2013 = 100, structure in 2020, as per cent
Main Indicators of Manufacturing1
Share in total value added 2020, as per cent
Changes in production volumes as per cent
Production volumes and occupied posts
Q4 2013 = 100
Changes in sales of production 12-month moving average
Production sales December 2013 = 100,
12-month moving average
Capacity utilization rate Historically highest/ lowest level,
as per cent
Q1 2021 Q1 2020
1 Sales data available until January 2021
-16
-8
0
8
16
24
32W
oo
d a
nd
wo
od
pro
du
cts
Foo
d in
du
stry
Ele
ctro
nic
an
d o
pti
cal p
rod
uct
s
Bas
ic m
eta
ls
Ch
em
ical
s an
d c
he
mic
al p
rod
uct
s
No
n-m
eta
llic
min
era
l pro
du
cts
Oth
er
man
ufa
ctu
rin
g
Pap
er
and
pap
er
pro
du
cts
Tra
nsp
ort
ve
hic
les
Lig
ht
ind
ust
ry
Mo
tor
veh
icle
s
Structure
Changes
80
110
140
170
200
2014 2015 2016 2017 2018 2019 2020
High-technology
Medium high-technology
Medium low-technology
Low-technology
8% 14% 19% 58%
11%
-4
0
4
8
2016 2017 2018 2019 2020 2021Jan
98
108
118
128
2016 2017 2018 2019 2020
Production volumes
Occupied posts
-2
1
4
7
10
2016 2017 2018 2019 2020 2021
Volumes
Prices
Total
95
105
115
125
135
2016 2017 2018 2019 2020 2021
Domestic market
Exports
50
60
70
80
19 MACROECONOMIC REVIEW OF LATVIA
Manufacture of food products and beverages
Share of manufacturing 2020, as per cent
Changes in production volumes as per cent
Production volumes and occupied posts
Q4 2013 = 100
Changes in sales of production 12-month moving average
Production sales December 2013 = 100,
12-month moving average
Capacity utilization rate Historically highest/ lowest level,
as per cent
Q1 2021 Q1 2020
Light Industry
Share of manufacturing 2020, as per cent
Changes in production volumes as per cent
Production volumes and occupied posts
Q4 2013 = 100
Changes in sales of production 12-month moving average
Production sales December 2013 = 100,
12-month moving average
Capacity utilization rate Historically highest/ lowest level,
as per cent
Q1 2021 Q1 2020
21%
-12
-6
0
6
12
2016 2017 2018 2019 2020 2021Jan
Subsector
Manufacturing
98
102
106
110
114
2016 2017 2018 2019 2020
Production volumes
Occupied posts
-8
-4
0
4
8
12
2016 2017 2018 2019 2020 2021
Prices
Volumes
Total90
102
114
126
138
2016 2017 2018 2019 2020 2021
Domestic market
Exports
55
60
65
70
75
3%
-10
-5
0
5
10
2016 2017 2018 2019 2020 2021Jan
Subsector
Manufacturing
80
88
96
104
112
120
2016 2017 2018 2019 2020
Production volumes
Occupied posts
-14
-7
0
7
2016 2017 2018 2019 2020 2021
Prices
Volumes
Total
90
100
110
120
130
140
2016 2017 2018 2019 2020 2021
Domestic market
Exports
50
60
70
80
90
MACROECONOMIC REVIEW OF LATVIA 20
Manufacture of wood and wood products
Share of manufacturing 2020, as per cent
Changes in production volumes as per cent
Production volumes and occupied posts
Q4 2013 = 100
Changes in sales of production 12-month moving average
Production sales December 2013 = 100,
12-month moving average
Capacity utilization rate Historically highest/ lowest level,
as per cent
Q1 2021 Q1 2020
Manufacture of paper and paper products
Share of manufacturing 2020, as per cent
Changes in production volumes as per cent
Production volumes and occupied posts
Q4 2013 = 100
Changes in sales of production 12-month moving average
Production sales December 2013 = 100,
12-month moving average
Capacity utilization rate Historically highest/ lowest level,
as per cent
Q1 2021 Q1 2020
27%
-4
0
4
8
12
2016 2017 2018 2019 2020 2021Jan
Subsector
Manufacturing
92
101
110
119
128
2016 2017 2018 2019 2020
Production volumes
Occupied posts
-10
0
10
20
2016 2017 2018 2019 2020 2021
Prices
Volumes
Total
95
110
125
140
155
2016 2017 2018 2019 2020 2021
Domestic market
Exports
50
60
70
80
90
4%
-5
0
5
10
2016 2017 2018 2019 2020 2021Jan
Subsector
Manufacturing
100
105
110
115
120
2016 2017 2018 2019 2020
Production volumes
Occupied posts
-6
0
6
12
2016 2017 2018 2019 2020 2021
Prices
Volumes
Total
95
105
115
125
2016 2017 2018 2019 2020 2021
Domestic market
Exports
50
60
70
80
21 MACROECONOMIC REVIEW OF LATVIA
Manufacture of chemicals and chemical products
Share of manufacturing 2020, as per cent
Changes in production volumes as per cent
Production volumes and occupied posts
Q4 2013 = 100
Changes in sales of production 12-month moving average
Production sales December 2013 = 100,
12-month moving average
Capacity utilization rate Historically highest/ lowest level,
as per cent
Q1 2021 Q1 2020
Manufacture of non-metallic mineral products
Share of manufacturing 2020, as per cent
Changes in production volumes as per cent
Production volumes and occupied posts
Q4 2013 = 100
Changes in sales of production 12-month moving average
Production sales December 2013 = 100,
12-month moving average
Capacity utilization rate Historically highest/ lowest level,
as per cent
Q1 2021 Q1 2020
9%
-4
0
4
8
12
2016 2017 2018 2019 2020 2021Jan
Subsector
Manufacturing100
115
130
145
160
2016 2017 2018 2019 2020
Production volumes
Occupied posts
-2
4
10
16
2016 2017 2018 2019 2020 2021
Volumes
Prices
Total
90
110
130
150
170
2016 2017 2018 2019 2020 2021
Domestic market
Exports
50
60
70
80
90
100
6%
-12
-6
0
6
12
2016 2017 2018 2019 2020 2021Jan
Subsector
Manufacturing
100
110
120
130
140
2016 2017 2018 2019 2020
Production volumes
Occupied posts
-10
0
10
20
2016 2017 2018 2019 2020 2021
Volumes
Prices
Total
85
100
115
130
145
2016 2017 2018 2019 2020 2021
Domestic market
Exports
20
35
50
65
80
MACROECONOMIC REVIEW OF LATVIA 22
Manufacture of basic metals and fabricated metal products
Share of manufacturing 2020, as per cent
Changes in production volumes as per cent
Production volumes and occupied posts
Q4 2013 = 100
Changes in sales of production 12-month moving average
Production sales December 2013 = 100,
12-month moving average
Capacity utilization rate Historically highest/ lowest level,
as per cent
Q1 2021 Q1 2020
Manufacture of electronic and optical products
Share of manufacturing 2020, as per cent
Changes in production volumes as per cent
Production volumes and occupied posts
Q4 2013 = 100
Changes in sales of production 12-month moving average
Production sales December 2013 = 100,
12-month moving average
Capacity utilization rate Historically highest/ lowest level,
as per cent
Q1 2021 Q1 2020
10%
-10
-5
0
5
10
15
2016 2017 2018 2019 2020 2021Jan
Subsector
Manufacturing
96
108
120
132
144
2016 2017 2018 2019 2020
Production volumes
Occupied posts
-10
0
10
20
2016 2017 2018 2019 2020 2021
Volumes
Prices
Total
85
100
115
130
145
2016 2017 2018 2019 2020 2021
Domestic market
Exports
30
45
60
75
90
10%
-5
0
5
10
15
2016 2017 2018 2019 2020 2021Jan
Subsector
Manufacturing95
121
147
173
199
2016 2017 2018 2019 2020
Production volumes
Occupied posts
-6
0
6
12
18
24
2016 2017 2018 2019 2020 2021
Volumes Prices
Total
95
135
175
215
2016 2017 2018 2019 2020 2021
Domestic market
Exports
40
50
60
70
80
23 MACROECONOMIC REVIEW OF LATVIA
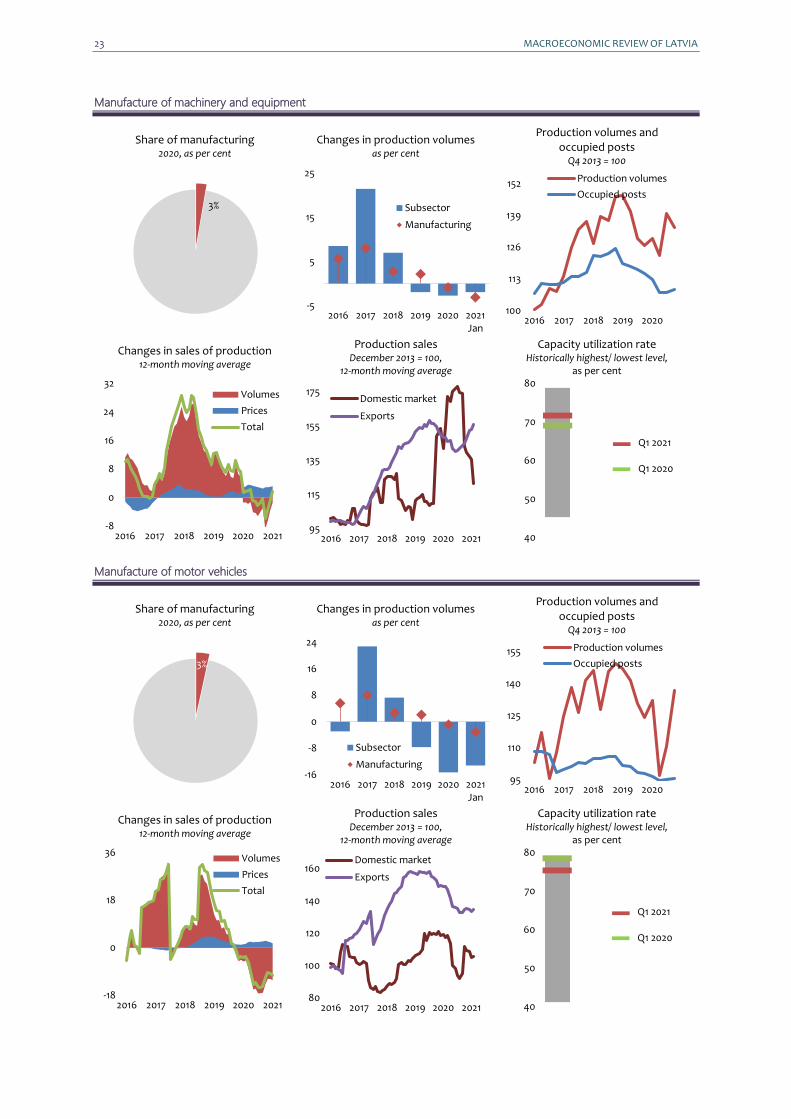
Manufacture of machinery and equipment
Share of manufacturing 2020, as per cent
Changes in production volumes as per cent
Production volumes and occupied posts
Q4 2013 = 100
Changes in sales of production 12-month moving average
Production sales December 2013 = 100,
12-month moving average
Capacity utilization rate Historically highest/ lowest level,
as per cent
Q1 2021 Q1 2020
Manufacture of motor vehicles
Share of manufacturing 2020, as per cent
Changes in production volumes as per cent
Production volumes and occupied posts
Q4 2013 = 100
Changes in sales of production 12-month moving average
Production sales December 2013 = 100,
12-month moving average
Capacity utilization rate Historically highest/ lowest level,
as per cent
Q1 2021 Q1 2020
3%
-5
5
15
25
2016 2017 2018 2019 2020 2021Jan
Subsector
Manufacturing
100
113
126
139
152
2016 2017 2018 2019 2020
Production volumes
Occupied posts
-8
0
8
16
24
32
2016 2017 2018 2019 2020 2021
Volumes
Prices
Total
95
115
135
155
175
2016 2017 2018 2019 2020 2021
Domestic market
Exports
40
50
60
70
80
3%
-16
-8
0
8
16
24
2016 2017 2018 2019 2020 2021Jan
Subsector
Manufacturing
95
110
125
140
155
2016 2017 2018 2019 2020
Production volumes
Occupied posts
-18
0
18
36
2016 2017 2018 2019 2020 2021
Volumes
Prices
Total
80
100
120
140
160
2016 2017 2018 2019 2020 2021
Domestic market
Exports
40
50
60
70
80
MACROECONOMIC REVIEW OF LATVIA 24
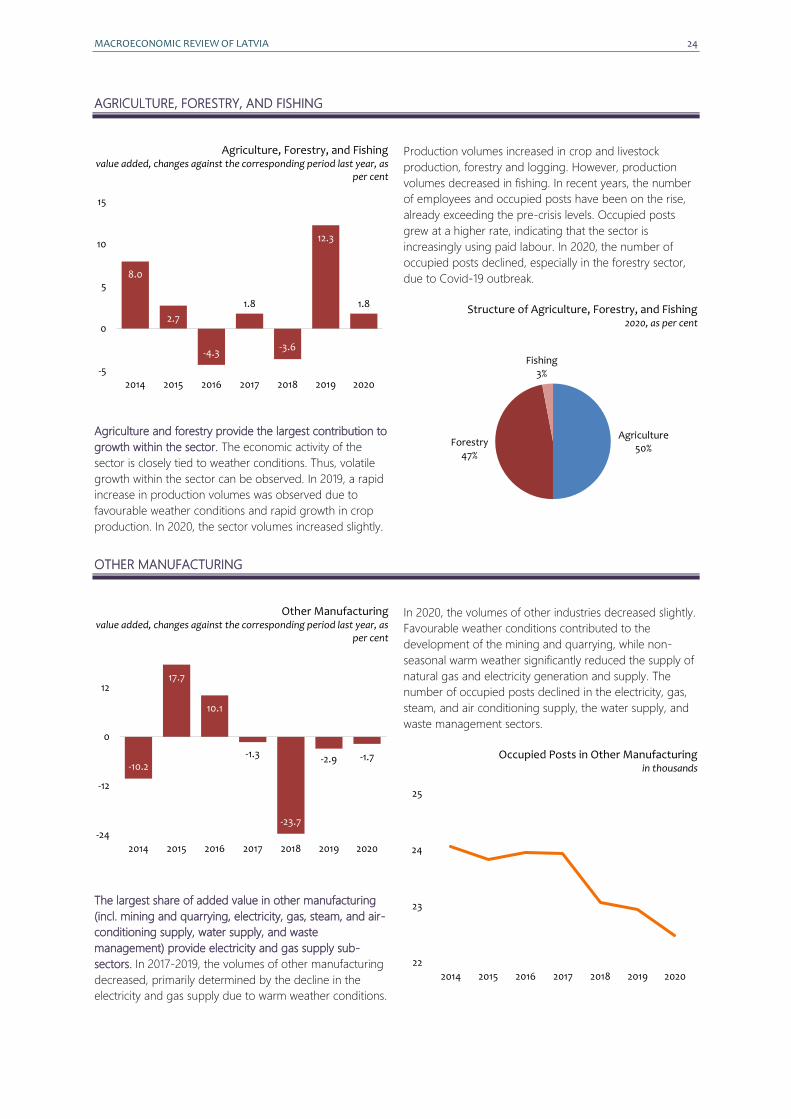
AGRICULTURE, FORESTRY, AND FISHING
Agriculture, Forestry, and Fishing value added, changes against the corresponding period last year, as
per cent
Agriculture and forestry provide the largest contribution to
growth within the sector. The economic activity of the
sector is closely tied to weather conditions. Thus, volatile
growth within the sector can be observed. In 2019, a rapid
increase in production volumes was observed due to
favourable weather conditions and rapid growth in crop
production. In 2020, the sector volumes increased slightly.
Production volumes increased in crop and livestock
production, forestry and logging. However, production
volumes decreased in fishing. In recent years, the number
of employees and occupied posts have been on the rise,
already exceeding the pre-crisis levels. Occupied posts
grew at a higher rate, indicating that the sector is
increasingly using paid labour. In 2020, the number of
occupied posts declined, especially in the forestry sector,
due to Covid-19 outbreak.
Structure of Agriculture, Forestry, and Fishing 2020, as per cent
OTHER MANUFACTURING
Other Manufacturing value added, changes against the corresponding period last year, as
per cent
The largest share of added value in other manufacturing
(incl. mining and quarrying, electricity, gas, steam, and air-
conditioning supply, water supply, and waste
management) provide electricity and gas supply sub-
sectors. In 2017-2019, the volumes of other manufacturing
decreased, primarily determined by the decline in the
electricity and gas supply due to warm weather conditions.
In 2020, the volumes of other industries decreased slightly.
Favourable weather conditions contributed to the
development of the mining and quarrying, while non-
seasonal warm weather significantly reduced the supply of
natural gas and electricity generation and supply. The
number of occupied posts declined in the electricity, gas,
steam, and air conditioning supply, the water supply, and
waste management sectors.
Occupied Posts in Other Manufacturing in thousands
8.0
2.7
-4.3
1.8
-3.6
12.3
1.8
-5
0
5
10
15
2014 2015 2016 2017 2018 2019 2020
Agriculture50%
Forestry47%
Fishing3%
-10.2
17.7
10.1
-1.3
-23.7
-2.9 -1.7
-24
-12
0
12
2014 2015 2016 2017 2018 2019 2020
22
23
24
25
2014 2015 2016 2017 2018 2019 2020
25 MACROECONOMIC REVIEW OF LATVIA
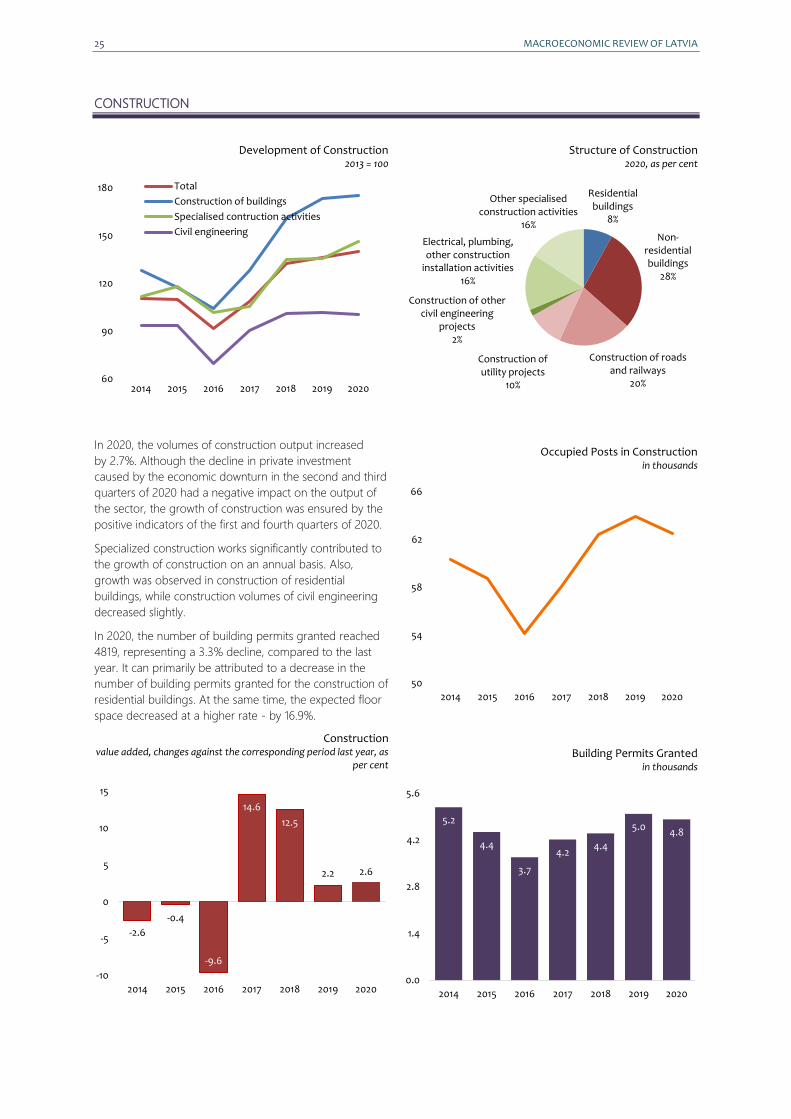
CONSTRUCTION
Development of Construction 2013 = 100
In 2020, the volumes of construction output increased
by 2.7%. Although the decline in private investment
caused by the economic downturn in the second and third
quarters of 2020 had a negative impact on the output of
the sector, the growth of construction was ensured by the
positive indicators of the first and fourth quarters of 2020.
Specialized construction works significantly contributed to
the growth of construction on an annual basis. Also,
growth was observed in construction of residential
buildings, while construction volumes of civil engineering
decreased slightly.
In 2020, the number of building permits granted reached
4819, representing a 3.3% decline, compared to the last
year. It can primarily be attributed to a decrease in the
number of building permits granted for the construction of
residential buildings. At the same time, the expected floor
space decreased at a higher rate - by 16.9%.
Construction value added, changes against the corresponding period last year, as
per cent
Structure of Construction 2020, as per cent
Occupied Posts in Construction in thousands
Building Permits Granted in thousands
60
90
120
150
180
2014 2015 2016 2017 2018 2019 2020
Total
Construction of buildings
Specialised contruction activities
Civil engineering
-2.6
-0.4
-9.6
14.6
12.5
2.2 2.6
-10
-5
0
5
10
15
2014 2015 2016 2017 2018 2019 2020
Residential buildings
8%
Non-residential buildings
28%
Construction of roads and railways
20%
Construction of utility projects
10%
Construction of other civil engineering
projects2%
Electrical, plumbing, other construction
installation activities16%
Other specialised construction activities
16%
50
54
58
62
66
2014 2015 2016 2017 2018 2019 2020
5.2
4.4
3.7
4.24.4
5.04.8
0.0
1.4
2.8
4.2
5.6
2014 2015 2016 2017 2018 2019 2020
MACROECONOMIC REVIEW OF LATVIA 26
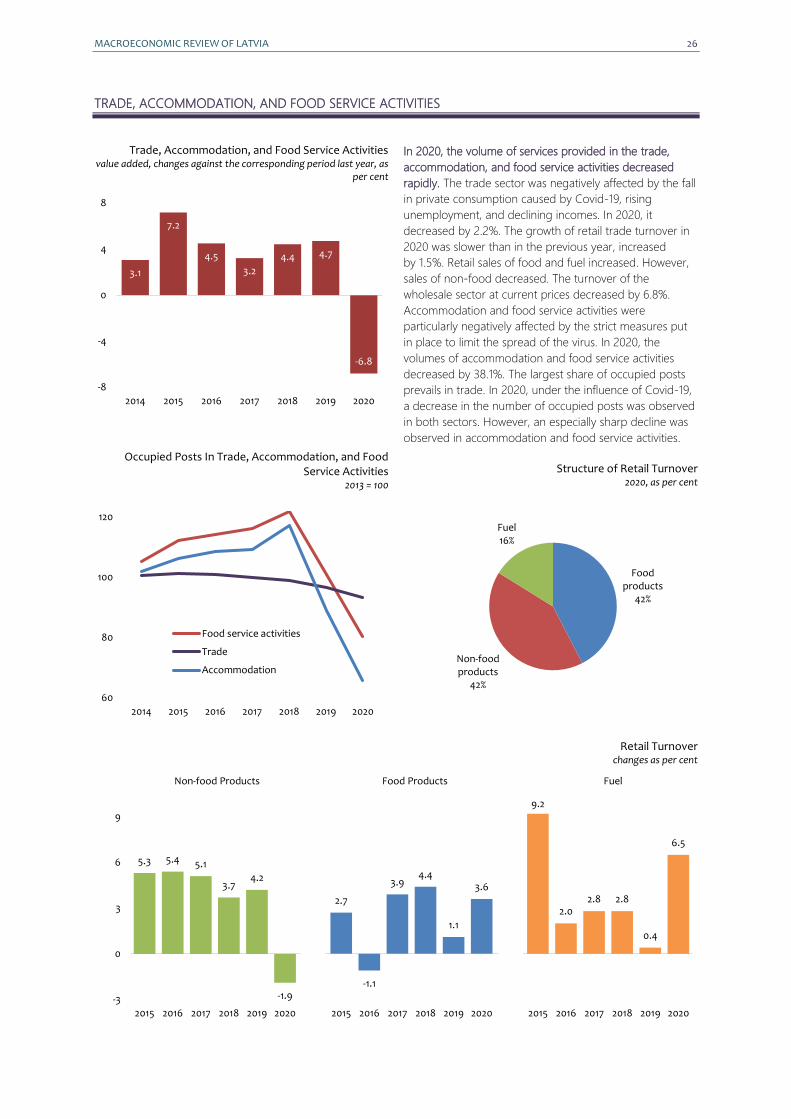
TRADE, ACCOMMODATION, AND FOOD SERVICE ACTIVITIES
Trade, Accommodation, and Food Service Activities value added, changes against the corresponding period last year, as
per cent
Occupied Posts In Trade, Accommodation, and Food Service Activities
2013 = 100
In 2020, the volume of services provided in the trade,
accommodation, and food service activities decreased
rapidly. The trade sector was negatively affected by the fall
in private consumption caused by Covid-19, rising
unemployment, and declining incomes. In 2020, it
decreased by 2.2%. The growth of retail trade turnover in
2020 was slower than in the previous year, increased
by 1.5%. Retail sales of food and fuel increased. However,
sales of non-food decreased. The turnover of the
wholesale sector at current prices decreased by 6.8%.
Accommodation and food service activities were
particularly negatively affected by the strict measures put
in place to limit the spread of the virus. In 2020, the
volumes of accommodation and food service activities
decreased by 38.1%. The largest share of occupied posts
prevails in trade. In 2020, under the influence of Covid-19,
a decrease in the number of occupied posts was observed
in both sectors. However, an especially sharp decline was
observed in accommodation and food service activities.
Structure of Retail Turnover 2020, as per cent
Retail Turnover changes as per cent
Non-food Products Food Products Fuel
3.1
7.2
4.5
3.2
4.4 4.7
-6.8
-8
-4
0
4
8
2014 2015 2016 2017 2018 2019 2020
60
80
100
120
2014 2015 2016 2017 2018 2019 2020
Food service activities
Trade
Accommodation
Food products
42%
Non-food products
42%
Fuel16%
5.3 5.4 5.1
3.74.2
-1.9
2.7
-1.1
3.94.4
1.1
3.6
9.2
2.02.8 2.8
0.4
6.5
-3
0
3
6
9
2015 2016 2017 2018 2019 2020 2015 2016 2017 2018 2019 2020 2015 2016 2017 2018 2019 2020
27 MACROECONOMIC REVIEW OF LATVIA
TRANSPORTATION AND STORAGE
Transportation and Storage value added, changes against the corresponding period last year, as
per cent
Occupied Posts In Transportation and Storage in thousands
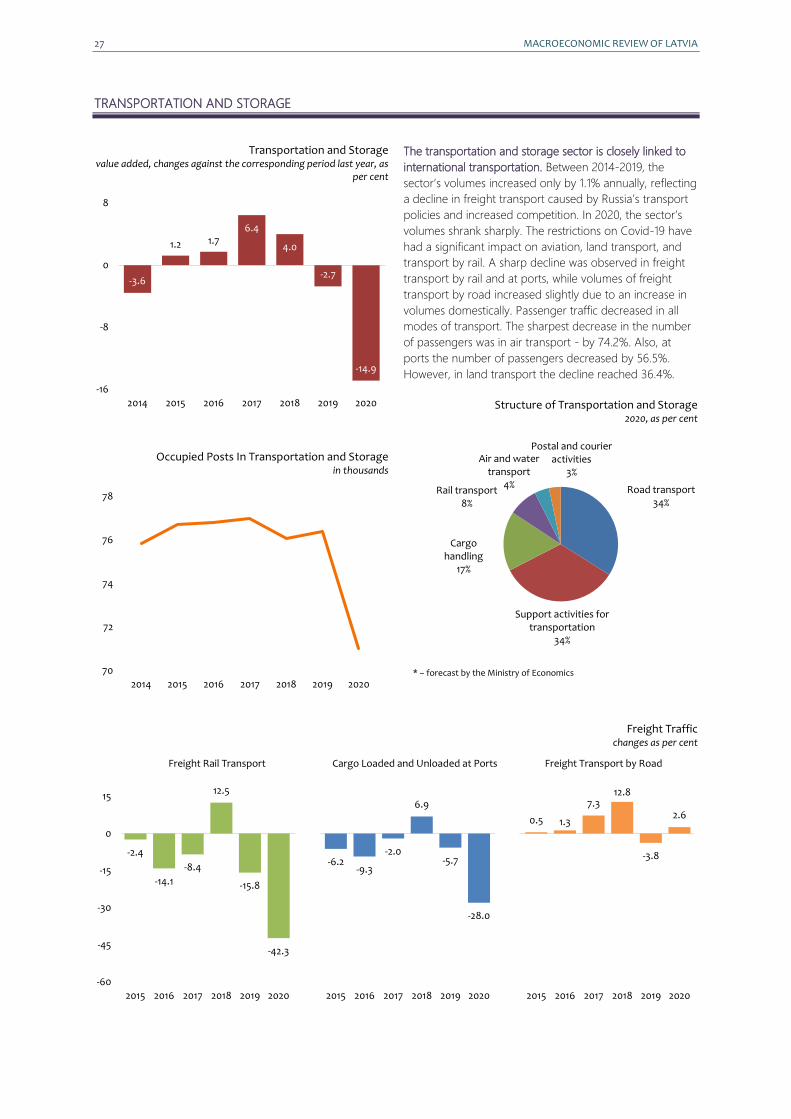
The transportation and storage sector is closely linked to
international transportation. Between 2014-2019, the
sector’s volumes increased only by 1.1% annually, reflecting
a decline in freight transport caused by Russia’s transport
policies and increased competition. In 2020, the sector’s
volumes shrank sharply. The restrictions on Covid-19 have
had a significant impact on aviation, land transport, and
transport by rail. A sharp decline was observed in freight
transport by rail and at ports, while volumes of freight
transport by road increased slightly due to an increase in
volumes domestically. Passenger traffic decreased in all
modes of transport. The sharpest decrease in the number
of passengers was in air transport - by 74.2%. Also, at
ports the number of passengers decreased by 56.5%.
However, in land transport the decline reached 36.4%.
Structure of Transportation and Storage 2020, as per cent
* – forecast by the Ministry of Economics
Freight Traffic changes as per cent
Freight Rail Transport Cargo Loaded and Unloaded at Ports Freight Transport by Road
-3.6
1.2 1.76.4
4.0
-2.7
-14.9
-16
-8
0
8
2014 2015 2016 2017 2018 2019 2020
70
72
74
76
78
2014 2015 2016 2017 2018 2019 2020
Road transport34%
Cargo handling
17%
Postal and courier activities
3%
Support activities for transportation
34%
Rail transport8%
Air and water transport
4%
-2.4
-14.1
-8.4
12.5
-15.8
-42.3
-6.2-9.3
-2.0
6.9
-5.7
-28.0
0.5 1.3
7.312.8
-3.8
2.6
-60
-45
-30
-15
0
15
2015 2016 2017 2018 2019 2020 2015 2016 2017 2018 2019 2020 2015 2016 2017 2018 2019 2020
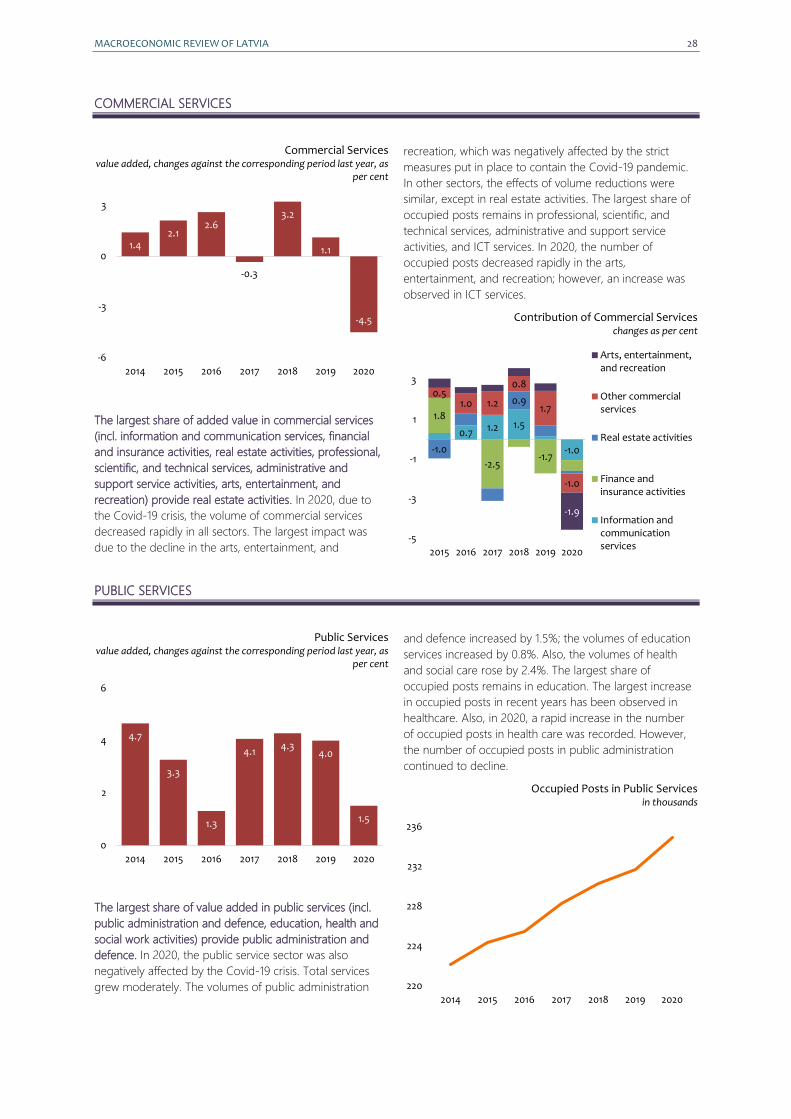
MACROECONOMIC REVIEW OF LATVIA 28
COMMERCIAL SERVICES
Commercial Services value added, changes against the corresponding period last year, as
per cent
The largest share of added value in commercial services
(incl. information and communication services, financial
and insurance activities, real estate activities, professional,
scientific, and technical services, administrative and
support service activities, arts, entertainment, and
recreation) provide real estate activities. In 2020, due to
the Covid-19 crisis, the volume of commercial services
decreased rapidly in all sectors. The largest impact was
due to the decline in the arts, entertainment, and
recreation, which was negatively affected by the strict
measures put in place to contain the Covid-19 pandemic.
In other sectors, the effects of volume reductions were
similar, except in real estate activities. The largest share of
occupied posts remains in professional, scientific, and
technical services, administrative and support service
activities, and ICT services. In 2020, the number of
occupied posts decreased rapidly in the arts,
entertainment, and recreation; however, an increase was
observed in ICT services.
Contribution of Commercial Services changes as per cent
PUBLIC SERVICES
Public Services value added, changes against the corresponding period last year, as
per cent
The largest share of value added in public services (incl.
public administration and defence, education, health and
social work activities) provide public administration and
defence. In 2020, the public service sector was also
negatively affected by the Covid-19 crisis. Total services
grew moderately. The volumes of public administration
and defence increased by 1.5%; the volumes of education
services increased by 0.8%. Also, the volumes of health
and social care rose by 2.4%. The largest share of
occupied posts remains in education. The largest increase
in occupied posts in recent years has been observed in
healthcare. Also, in 2020, a rapid increase in the number
of occupied posts in health care was recorded. However,
the number of occupied posts in public administration
continued to decline.
Occupied Posts in Public Services in thousands
1.42.1
2.6
-0.3
3.2
1.1
-4.5
-6
-3
0
3
2014 2015 2016 2017 2018 2019 2020
0.7 1.2 1.5
-1.0
1.8
-2.5-1.7
-1.0
0.90.5
1.0 1.2
0.8
1.7
-1.0
-1.9
-5
-3
-1
1
3
2015 2016 2017 2018 2019 2020
Arts, entertainment,and recreation
Other commercialservices
Real estate activities
Finance andinsurance activities
Information andcommunicationservices
4.7
3.3
1.3
4.14.3
4.0
1.5
0
2
4
6
2014 2015 2016 2017 2018 2019 2020
220
224
228
232
236
2014 2015 2016 2017 2018 2019 2020
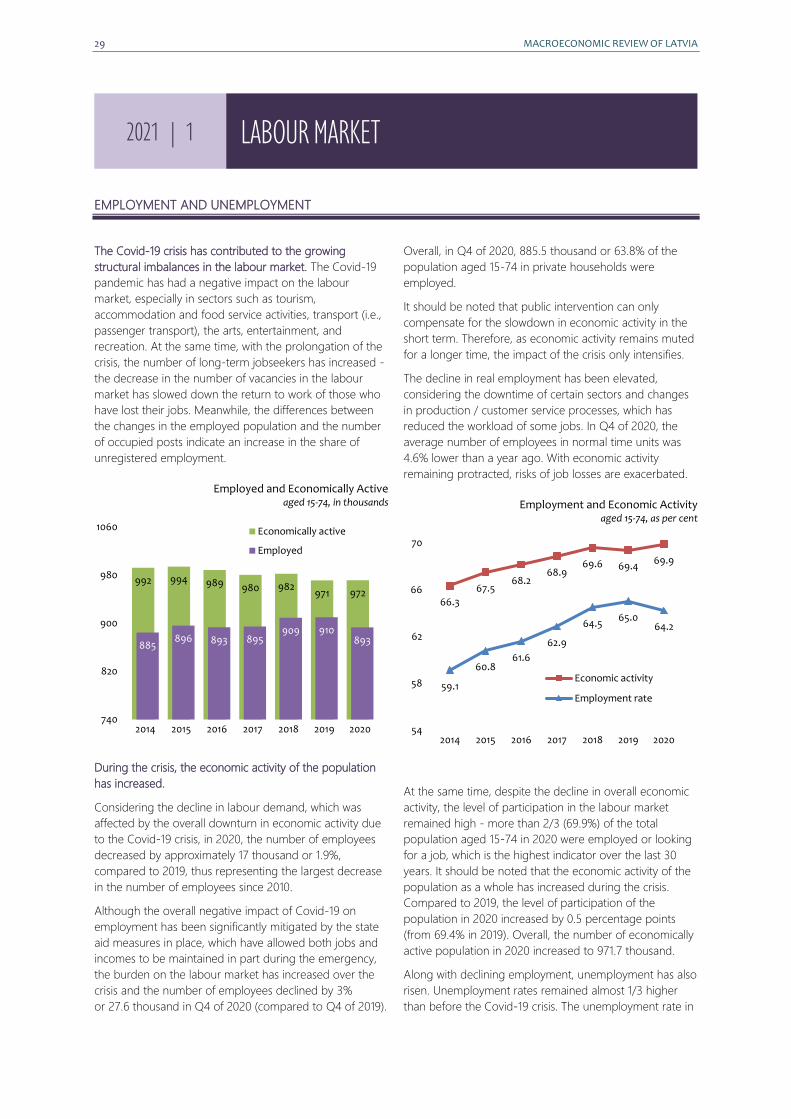
29 MACROECONOMIC REVIEW OF LATVIA
EMPLOYMENT AND UNEMPLOYMENT
The Covid-19 crisis has contributed to the growing
structural imbalances in the labour market. The Covid-19
pandemic has had a negative impact on the labour
market, especially in sectors such as tourism,
accommodation and food service activities, transport (i.e.,
passenger transport), the arts, entertainment, and
recreation. At the same time, with the prolongation of the
crisis, the number of long-term jobseekers has increased -
the decrease in the number of vacancies in the labour
market has slowed down the return to work of those who
have lost their jobs. Meanwhile, the differences between
the changes in the employed population and the number
of occupied posts indicate an increase in the share of
unregistered employment.
Employed and Economically Active aged 15-74, in thousands
During the crisis, the economic activity of the population
has increased.
Considering the decline in labour demand, which was
affected by the overall downturn in economic activity due
to the Covid-19 crisis, in 2020, the number of employees
decreased by approximately 17 thousand or 1.9%,
compared to 2019, thus representing the largest decrease
in the number of employees since 2010.
Although the overall negative impact of Covid-19 on
employment has been significantly mitigated by the state
aid measures in place, which have allowed both jobs and
incomes to be maintained in part during the emergency,
the burden on the labour market has increased over the
crisis and the number of employees declined by 3%
or 27.6 thousand in Q4 of 2020 (compared to Q4 of 2019).
Overall, in Q4 of 2020, 885.5 thousand or 63.8% of the
population aged 15-74 in private households were
employed.
It should be noted that public intervention can only
compensate for the slowdown in economic activity in the
short term. Therefore, as economic activity remains muted
for a longer time, the impact of the crisis only intensifies.
The decline in real employment has been elevated,
considering the downtime of certain sectors and changes
in production / customer service processes, which has
reduced the workload of some jobs. In Q4 of 2020, the
average number of employees in normal time units was
4.6% lower than a year ago. With economic activity
remaining protracted, risks of job losses are exacerbated.
Employment and Economic Activity aged 15-74, as per cent
At the same time, despite the decline in overall economic
activity, the level of participation in the labour market
remained high - more than 2/3 (69.9%) of the total
population aged 15-74 in 2020 were employed or looking
for a job, which is the highest indicator over the last 30
years. It should be noted that the economic activity of the
population as a whole has increased during the crisis.
Compared to 2019, the level of participation of the
population in 2020 increased by 0.5 percentage points
(from 69.4% in 2019). Overall, the number of economically
active population in 2020 increased to 971.7 thousand.
Along with declining employment, unemployment has also
risen. Unemployment rates remained almost 1/3 higher
than before the Covid-19 crisis. The unemployment rate in
992 994 989 980 982971 972
885896 893 895
909 910893
740
820
900
980
1060
2014 2015 2016 2017 2018 2019 2020
Economically active
Employed
66.3
67.568.2
68.969.6 69.4
69.9
59.1
60.861.6
62.9
64.565.0
64.2
54
58
62
66
70
2014 2015 2016 2017 2018 2019 2020
Economic activity
Employment rate
2021 | 1 LABOUR MARKET
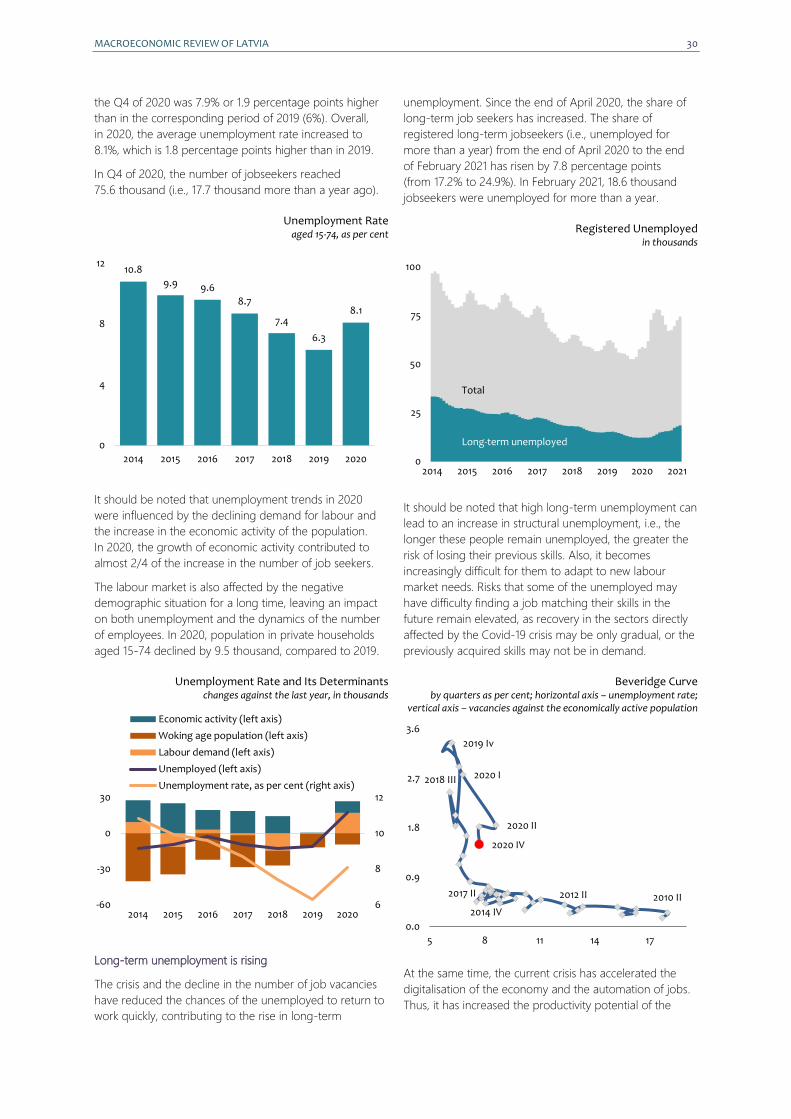
MACROECONOMIC REVIEW OF LATVIA 30
the Q4 of 2020 was 7.9% or 1.9 percentage points higher
than in the corresponding period of 2019 (6%). Overall,
in 2020, the average unemployment rate increased to
8.1%, which is 1.8 percentage points higher than in 2019.
In Q4 of 2020, the number of jobseekers reached
75.6 thousand (i.e., 17.7 thousand more than a year ago).
Unemployment Rate aged 15-74, as per cent
It should be noted that unemployment trends in 2020
were influenced by the declining demand for labour and
the increase in the economic activity of the population.
In 2020, the growth of economic activity contributed to
almost 2/4 of the increase in the number of job seekers.
The labour market is also affected by the negative
demographic situation for a long time, leaving an impact
on both unemployment and the dynamics of the number
of employees. In 2020, population in private households
aged 15-74 declined by 9.5 thousand, compared to 2019.
Unemployment Rate and Its Determinants changes against the last year, in thousands
Long-term unemployment is rising
The crisis and the decline in the number of job vacancies
have reduced the chances of the unemployed to return to
work quickly, contributing to the rise in long-term
unemployment. Since the end of April 2020, the share of
long-term job seekers has increased. The share of
registered long-term jobseekers (i.e., unemployed for
more than a year) from the end of April 2020 to the end
of February 2021 has risen by 7.8 percentage points
(from 17.2% to 24.9%). In February 2021, 18.6 thousand
jobseekers were unemployed for more than a year.
Registered Unemployed in thousands
It should be noted that high long-term unemployment can
lead to an increase in structural unemployment, i.e., the
longer these people remain unemployed, the greater the
risk of losing their previous skills. Also, it becomes
increasingly difficult for them to adapt to new labour
market needs. Risks that some of the unemployed may
have difficulty finding a job matching their skills in the
future remain elevated, as recovery in the sectors directly
affected by the Covid-19 crisis may be only gradual, or the
previously acquired skills may not be in demand.
Beveridge Curve by quarters as per cent; horizontal axis – unemployment rate;
vertical axis – vacancies against the economically active population
At the same time, the current crisis has accelerated the
digitalisation of the economy and the automation of jobs.
Thus, it has increased the productivity potential of the
10.8
9.9 9.6
8.7
7.4
6.3
8.1
0
4
8
12
2014 2015 2016 2017 2018 2019 2020
6
8
10
12
-60
-30
0
30
2014 2015 2016 2017 2018 2019 2020
Economic activity (left axis)
Woking age population (left axis)
Labour demand (left axis)
Unemployed (left axis)
Unemployment rate, as per cent (right axis)
0
25
50
75
100
2014 2015 2016 2017 2018 2019 2020 2021
Total
Long-term unemployed
2010 II2012 II
2014 IV
2017 II
2018 III
2019 Iv
2020 I
2020 II
2020 IV
0.0
0.9
1.8
2.7
3.6
5 8 11 14 17
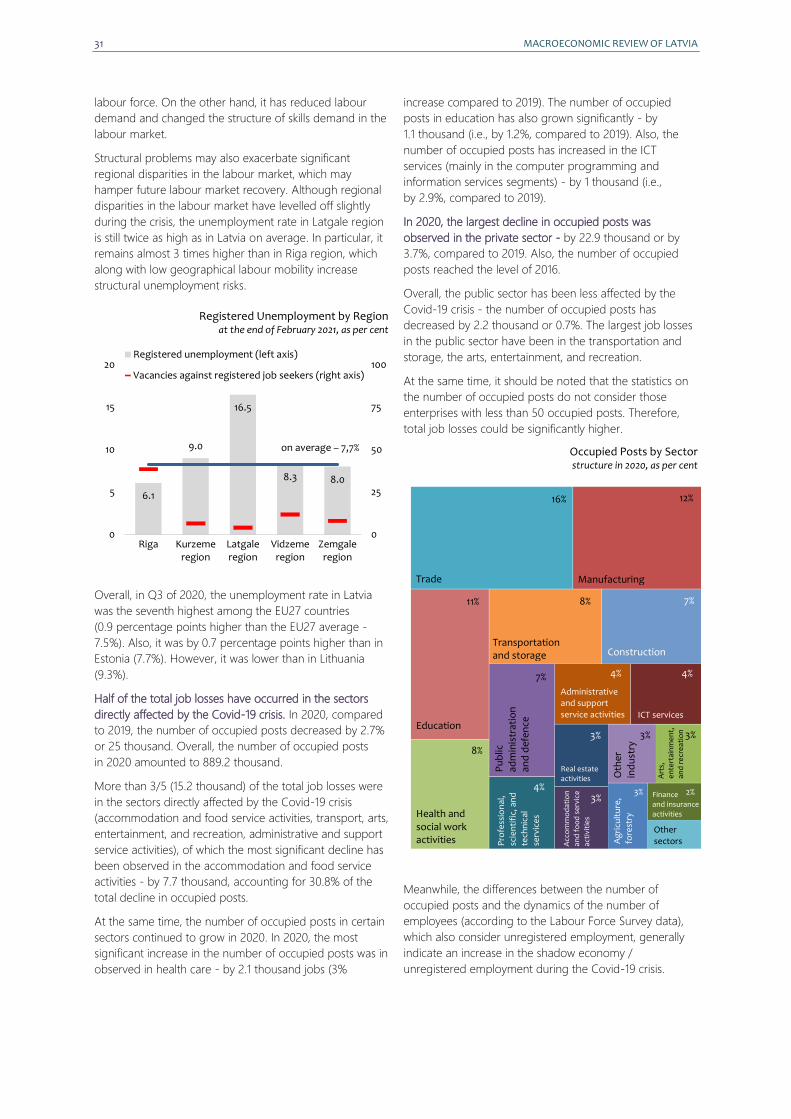
31 MACROECONOMIC REVIEW OF LATVIA
labour force. On the other hand, it has reduced labour
demand and changed the structure of skills demand in the
labour market.
Structural problems may also exacerbate significant
regional disparities in the labour market, which may
hamper future labour market recovery. Although regional
disparities in the labour market have levelled off slightly
during the crisis, the unemployment rate in Latgale region
is still twice as high as in Latvia on average. In particular, it
remains almost 3 times higher than in Riga region, which
along with low geographical labour mobility increase
structural unemployment risks.
Registered Unemployment by Region at the end of February 2021, as per cent
Overall, in Q3 of 2020, the unemployment rate in Latvia
was the seventh highest among the EU27 countries
(0.9 percentage points higher than the EU27 average -
7.5%). Also, it was by 0.7 percentage points higher than in
Estonia (7.7%). However, it was lower than in Lithuania
(9.3%).
Half of the total job losses have occurred in the sectors
directly affected by the Covid-19 crisis. In 2020, compared
to 2019, the number of occupied posts decreased by 2.7%
or 25 thousand. Overall, the number of occupied posts
in 2020 amounted to 889.2 thousand.
More than 3/5 (15.2 thousand) of the total job losses were
in the sectors directly affected by the Covid-19 crisis
(accommodation and food service activities, transport, arts,
entertainment, and recreation, administrative and support
service activities), of which the most significant decline has
been observed in the accommodation and food service
activities - by 7.7 thousand, accounting for 30.8% of the
total decline in occupied posts.
At the same time, the number of occupied posts in certain
sectors continued to grow in 2020. In 2020, the most
significant increase in the number of occupied posts was in
observed in health care - by 2.1 thousand jobs (3%
increase compared to 2019). The number of occupied
posts in education has also grown significantly - by
1.1 thousand (i.e., by 1.2%, compared to 2019). Also, the
number of occupied posts has increased in the ICT
services (mainly in the computer programming and
information services segments) - by 1 thousand (i.e.,
by 2.9%, compared to 2019).
In 2020, the largest decline in occupied posts was
observed in the private sector - by 22.9 thousand or by
3.7%, compared to 2019. Also, the number of occupied
posts reached the level of 2016.
Overall, the public sector has been less affected by the
Covid-19 crisis - the number of occupied posts has
decreased by 2.2 thousand or 0.7%. The largest job losses
in the public sector have been in the transportation and
storage, the arts, entertainment, and recreation.
At the same time, it should be noted that the statistics on
the number of occupied posts do not consider those
enterprises with less than 50 occupied posts. Therefore,
total job losses could be significantly higher.
Occupied Posts by Sector structure in 2020, as per cent
Meanwhile, the differences between the number of
occupied posts and the dynamics of the number of
employees (according to the Labour Force Survey data),
which also consider unregistered employment, generally
indicate an increase in the shadow economy /
unregistered employment during the Covid-19 crisis.
6.1
9.0
16.5
8.3 8.0
0
25
50
75
100
0
5
10
15
20
Riga Kurzemeregion
Latgaleregion
Vidzemeregion
Zemgaleregion
Registered unemployment (left axis)
Vacancies against registered job seekers (right axis)
on average – 7,7%
Trade Manufacturing
Education
Transportation and storage
Health and social work activities
Pu
blic
ad
min
istr
atio
n
and
def
en
ce
Construction
Pro
fess
ion
al,
scie
nti
fic,
an
d
tech
nic
al
serv
ice
s
ICT services
Acc
om
mo
dat
ion
and
fo
od
ser
vice
acti
viti
es
Real estate activities A
rts,
e
nte
rtai
nm
en
t,
and
re
cre
atio
n
Administrative and support service activities
Oth
er
ind
ust
ry
Ag
ricu
ltu
re,
fore
stry
Finance and insurance activities Other sectors
16% 12%
11%
8%
8%
7%
7%
4%
4% 4%
3%
3%
3% 3%
3% 2%
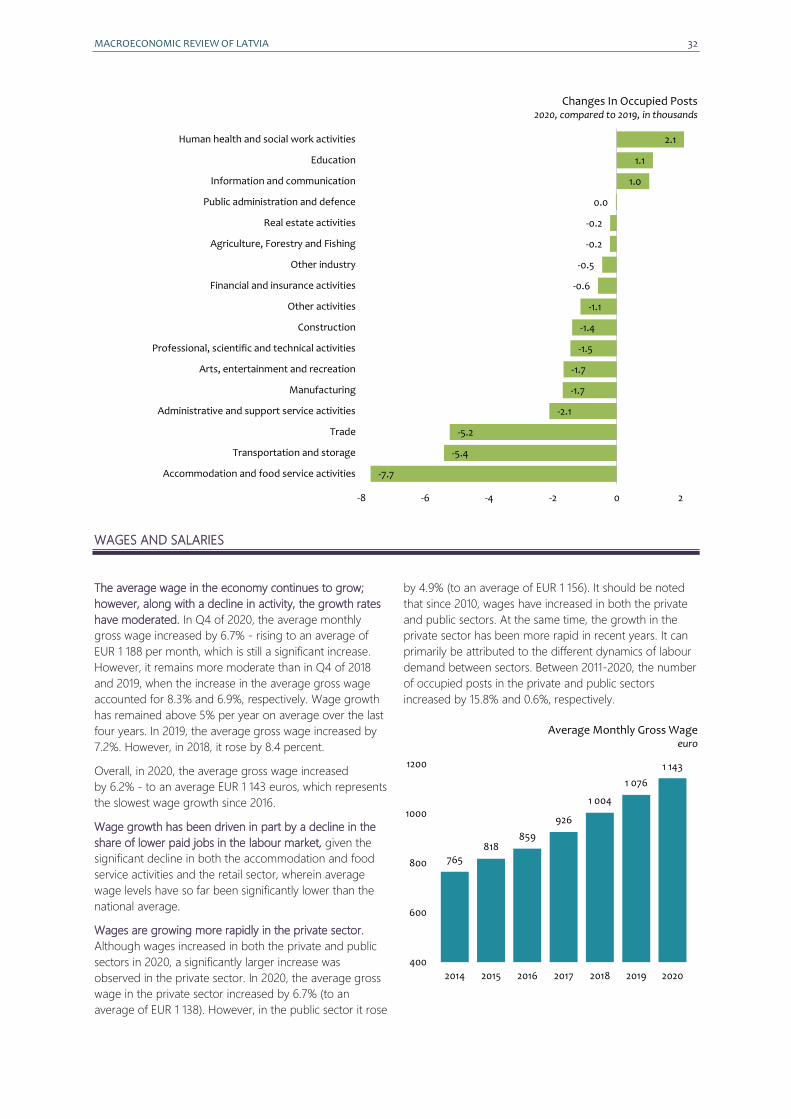
MACROECONOMIC REVIEW OF LATVIA 32
Changes In Occupied Posts 2020, compared to 2019, in thousands
WAGES AND SALARIES
The average wage in the economy continues to grow;
however, along with a decline in activity, the growth rates
have moderated. In Q4 of 2020, the average monthly
gross wage increased by 6.7% - rising to an average of
EUR 1 188 per month, which is still a significant increase.
However, it remains more moderate than in Q4 of 2018
and 2019, when the increase in the average gross wage
accounted for 8.3% and 6.9%, respectively. Wage growth
has remained above 5% per year on average over the last
four years. In 2019, the average gross wage increased by
7.2%. However, in 2018, it rose by 8.4 percent.
Overall, in 2020, the average gross wage increased
by 6.2% - to an average EUR 1 143 euros, which represents
the slowest wage growth since 2016.
Wage growth has been driven in part by a decline in the
share of lower paid jobs in the labour market, given the
significant decline in both the accommodation and food
service activities and the retail sector, wherein average
wage levels have so far been significantly lower than the
national average.
Wages are growing more rapidly in the private sector.
Although wages increased in both the private and public
sectors in 2020, a significantly larger increase was
observed in the private sector. In 2020, the average gross
wage in the private sector increased by 6.7% (to an
average of EUR 1 138). However, in the public sector it rose
by 4.9% (to an average of EUR 1 156). It should be noted
that since 2010, wages have increased in both the private
and public sectors. At the same time, the growth in the
private sector has been more rapid in recent years. It can
primarily be attributed to the different dynamics of labour
demand between sectors. Between 2011-2020, the number
of occupied posts in the private and public sectors
increased by 15.8% and 0.6%, respectively.
Average Monthly Gross Wage euro
-7.7
-5.4
-5.2
-2.1
-1.7
-1.7
-1.5
-1.4
-1.1
-0.6
-0.5
-0.2
-0.2
0.0
1.0
1.1
2.1
-8 -6 -4 -2 0 2
Accommodation and food service activities
Transportation and storage
Trade
Administrative and support service activities
Manufacturing
Arts, entertainment and recreation
Professional, scientific and technical activities
Construction
Other activities
Financial and insurance activities
Other industry
Agriculture, Forestry and Fishing
Real estate activities
Public administration and defence
Information and communication
Education
Human health and social work activities
765818
859
926
1 004
1 076
1 143
400
600
800
1000
1200
2014 2015 2016 2017 2018 2019 2020
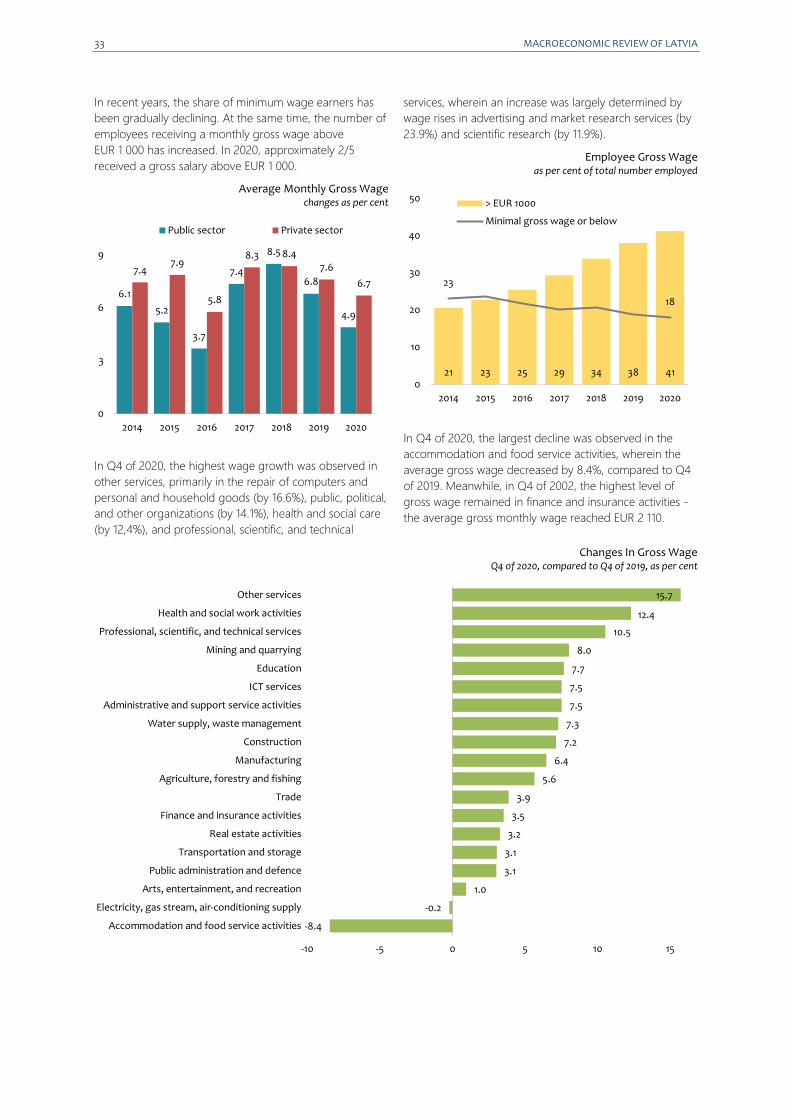
33 MACROECONOMIC REVIEW OF LATVIA
In recent years, the share of minimum wage earners has
been gradually declining. At the same time, the number of
employees receiving a monthly gross wage above
EUR 1 000 has increased. In 2020, approximately 2/5
received a gross salary above EUR 1 000.
Average Monthly Gross Wage changes as per cent
In Q4 of 2020, the highest wage growth was observed in
other services, primarily in the repair of computers and
personal and household goods (by 16.6%), public, political,
and other organizations (by 14.1%), health and social care
(by 12,4%), and professional, scientific, and technical
services, wherein an increase was largely determined by
wage rises in advertising and market research services (by
23.9%) and scientific research (by 11.9%).
Employee Gross Wage as per cent of total number employed
In Q4 of 2020, the largest decline was observed in the
accommodation and food service activities, wherein the
average gross wage decreased by 8.4%, compared to Q4
of 2019. Meanwhile, in Q4 of 2002, the highest level of
gross wage remained in finance and insurance activities -
the average gross monthly wage reached EUR 2 110.
Changes In Gross Wage Q4 of 2020, compared to Q4 of 2019, as per cent
6.1
5.2
3.7
7.4
8.5
6.8
4.9
7.47.9
5.8
8.3 8.4
7.6
6.7
0
3
6
9
2014 2015 2016 2017 2018 2019 2020
Public sector Private sector
21 23 25 29 34 38 41
23
18
0
10
20
30
40
50
2014 2015 2016 2017 2018 2019 2020
> EUR 1000
Minimal gross wage or below
-8.4
-0.2
1.0
3.1
3.1
3.2
3.5
3.9
5.6
6.4
7.2
7.3
7.5
7.5
7.7
8.0
10.5
12.4
15.7
-10 -5 0 5 10 15
Accommodation and food service activities
Electricity, gas stream, air-conditioning supply
Arts, entertainment, and recreation
Public administration and defence
Transportation and storage
Real estate activities
Finance and insurance activities
Trade
Agriculture, forestry and fishing
Manufacturing
Construction
Water supply, waste management
Administrative and support service activities
ICT services
Education
Mining and quarrying
Professional, scientific, and technical services
Health and social work activities
Other services
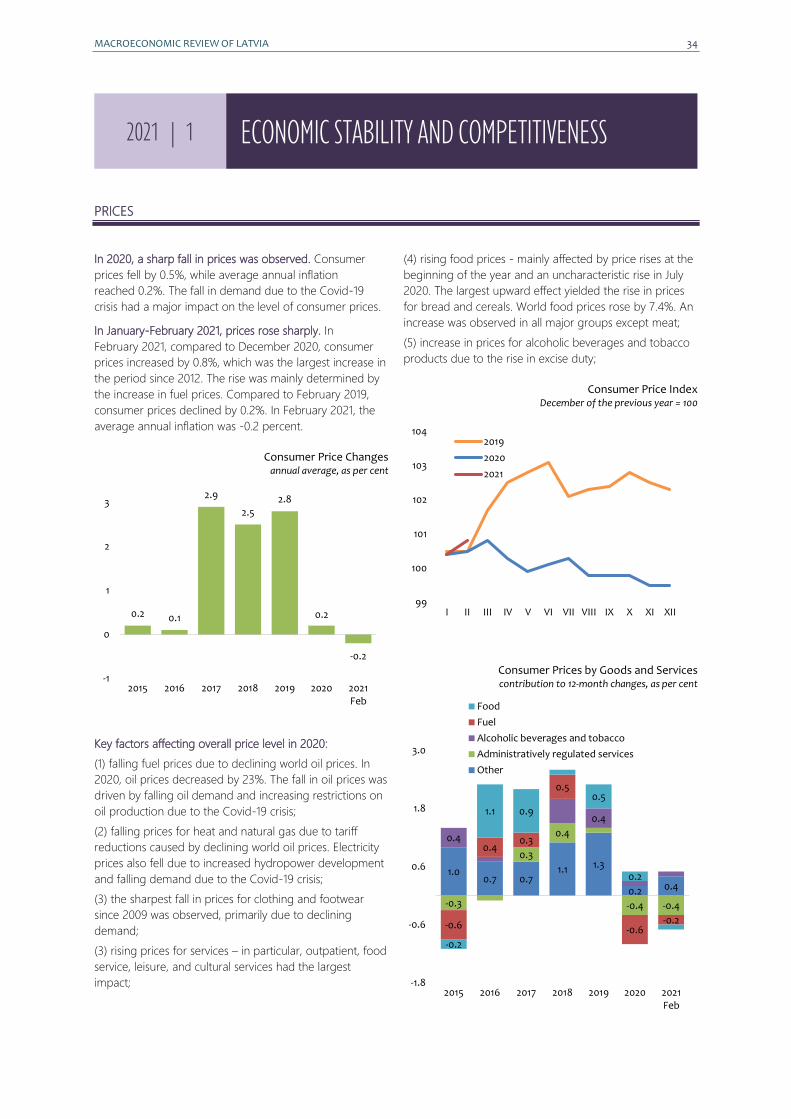
MACROECONOMIC REVIEW OF LATVIA 34
PRICES
In 2020, a sharp fall in prices was observed. Consumer
prices fell by 0.5%, while average annual inflation
reached 0.2%. The fall in demand due to the Covid-19
crisis had a major impact on the level of consumer prices.
In January-February 2021, prices rose sharply. In
February 2021, compared to December 2020, consumer
prices increased by 0.8%, which was the largest increase in
the period since 2012. The rise was mainly determined by
the increase in fuel prices. Compared to February 2019,
consumer prices declined by 0.2%. In February 2021, the
average annual inflation was -0.2 percent.
Consumer Price Changes annual average, as per cent
Key factors affecting overall price level in 2020:
(1) falling fuel prices due to declining world oil prices. In
2020, oil prices decreased by 23%. The fall in oil prices was
driven by falling oil demand and increasing restrictions on
oil production due to the Covid-19 crisis;
(2) falling prices for heat and natural gas due to tariff
reductions caused by declining world oil prices. Electricity
prices also fell due to increased hydropower development
and falling demand due to the Covid-19 crisis;
(3) the sharpest fall in prices for clothing and footwear
since 2009 was observed, primarily due to declining
demand;
(3) rising prices for services – in particular, outpatient, food
service, leisure, and cultural services had the largest
impact;
(4) rising food prices - mainly affected by price rises at the
beginning of the year and an uncharacteristic rise in July
2020. The largest upward effect yielded the rise in prices
for bread and cereals. World food prices rose by 7.4%. An
increase was observed in all major groups except meat;
(5) increase in prices for alcoholic beverages and tobacco
products due to the rise in excise duty;
Consumer Price Index December of the previous year = 100
Consumer Prices by Goods and Services contribution to 12-month changes, as per cent
0.2 0.1
2.9
2.52.8
0.2
-0.2
-1
0
1
2
3
2015 2016 2017 2018 2019 2020 2021Feb
99
100
101
102
103
104
I II III IV V VI VII VIII IX X XI XII
2019
2020
2021
1.00.7 0.7
1.1 1.3
0.2 0.4
-0.3
0.3
0.4
-0.4 -0.4
0.4
0.4
-0.6
0.40.3
0.5
-0.6-0.2
-0.2
1.1 0.9
0.5
0.2
-1.8
-0.6
0.6
1.8
3.0
2015 2016 2017 2018 2019 2020 2021Feb
Food
Fuel
Alcoholic beverages and tobacco
Administratively regulated services
Other
2021 | 1 ECONOMIC STABILITY AND COMPETITIVENESS
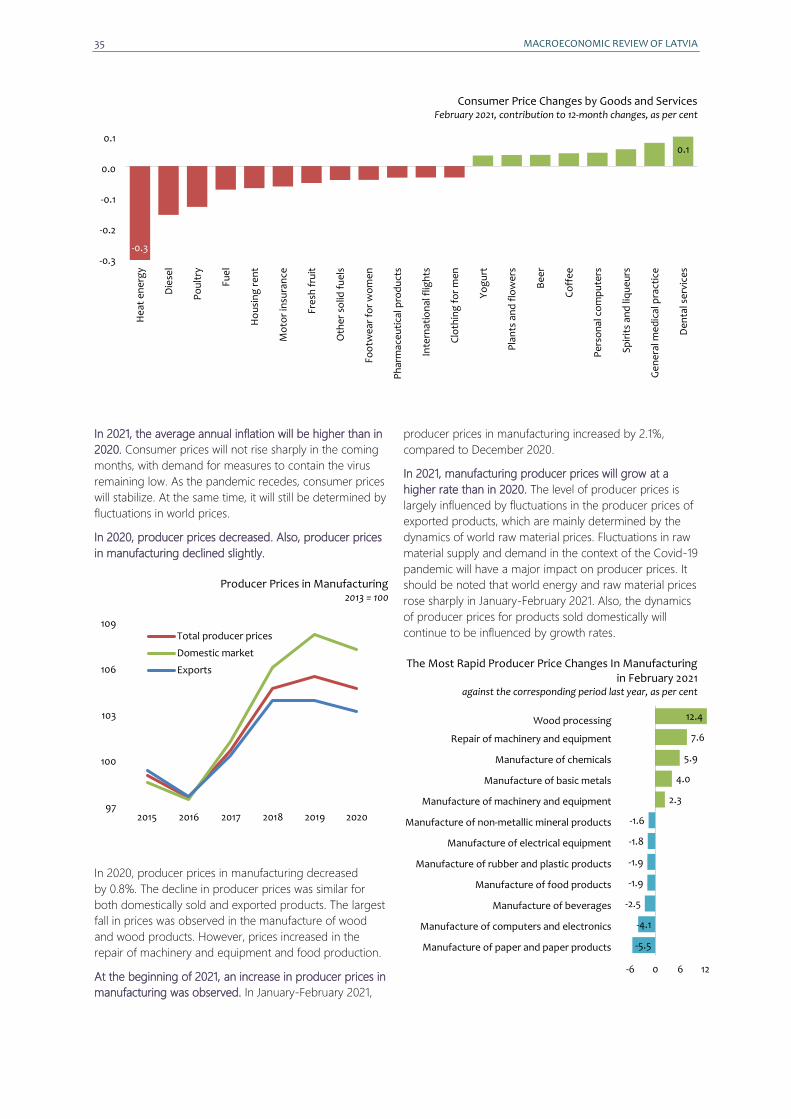
35 MACROECONOMIC REVIEW OF LATVIA
Consumer Price Changes by Goods and Services February 2021, contribution to 12-month changes, as per cent
In 2021, the average annual inflation will be higher than in
2020. Consumer prices will not rise sharply in the coming
months, with demand for measures to contain the virus
remaining low. As the pandemic recedes, consumer prices
will stabilize. At the same time, it will still be determined by
fluctuations in world prices.
In 2020, producer prices decreased. Also, producer prices
in manufacturing declined slightly.
Producer Prices in Manufacturing 2013 = 100
In 2020, producer prices in manufacturing decreased
by 0.8%. The decline in producer prices was similar for
both domestically sold and exported products. The largest
fall in prices was observed in the manufacture of wood
and wood products. However, prices increased in the
repair of machinery and equipment and food production.
At the beginning of 2021, an increase in producer prices in
manufacturing was observed. In January-February 2021,
producer prices in manufacturing increased by 2.1%,
compared to December 2020.
In 2021, manufacturing producer prices will grow at a
higher rate than in 2020. The level of producer prices is
largely influenced by fluctuations in the producer prices of
exported products, which are mainly determined by the
dynamics of world raw material prices. Fluctuations in raw
material supply and demand in the context of the Covid-19
pandemic will have a major impact on producer prices. It
should be noted that world energy and raw material prices
rose sharply in January-February 2021. Also, the dynamics
of producer prices for products sold domestically will
continue to be influenced by growth rates.
The Most Rapid Producer Price Changes In Manufacturing in February 2021
against the corresponding period last year, as per cent
Wood processing
Repair of machinery and equipment
Manufacture of chemicals
Manufacture of basic metals
Manufacture of machinery and equipment
Manufacture of non-metallic mineral products
Manufacture of electrical equipment
Manufacture of rubber and plastic products
Manufacture of food products
Manufacture of beverages
Manufacture of computers and electronics
Manufacture of paper and paper products
-0.3
0.1
-0.3
-0.2
-0.1
0.0
0.1H
eat
en
erg
y
Die
sel
Po
ult
ry
Fue
l
Ho
usi
ng
re
nt
Mo
tor
insu
ran
ce
Fre
sh f
ruit
Oth
er
solid
fu
els
Foo
twe
ar f
or
wo
me
n
Ph
arm
ace
uti
cal p
rod
uct
s
Inte
rnat
ion
al f
ligh
ts
Clo
thin
g f
or
me
n
Yo
gu
rt
Pla
nts
an
d f
low
ers
Be
er
Co
ffe
e
Pe
rso
nal
co
mp
ute
rs
Sp
irit
s an
d li
qu
eu
rs
Ge
ne
ral m
ed
ical
pra
ctic
e
De
nta
l se
rvic
es
97
100
103
106
109
2015 2016 2017 2018 2019 2020
Total producer prices
Domestic market
Exports
-5.5
-4.1
-2.5
-1.9
-1.9
-1.8
-1.6
2.3
4.0
5.9
7.6
12.4
-6 0 6 12
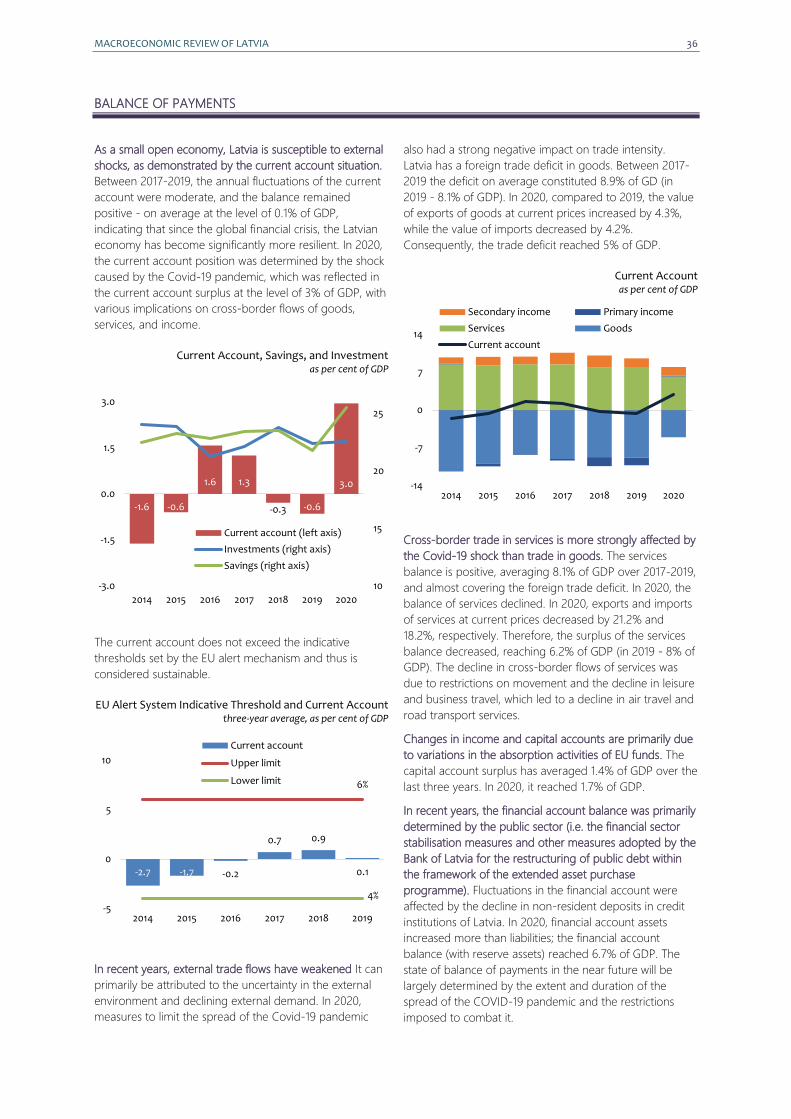
MACROECONOMIC REVIEW OF LATVIA 36
BALANCE OF PAYMENTS
As a small open economy, Latvia is susceptible to external
shocks, as demonstrated by the current account situation.
Between 2017-2019, the annual fluctuations of the current
account were moderate, and the balance remained
positive - on average at the level of 0.1% of GDP,
indicating that since the global financial crisis, the Latvian
economy has become significantly more resilient. In 2020,
the current account position was determined by the shock
caused by the Covid-19 pandemic, which was reflected in
the current account surplus at the level of 3% of GDP, with
various implications on cross-border flows of goods,
services, and income.
Current Account, Savings, and Investment as per cent of GDP
The current account does not exceed the indicative
thresholds set by the EU alert mechanism and thus is
considered sustainable.
EU Alert System Indicative Threshold and Current Account three-year average, as per cent of GDP
In recent years, external trade flows have weakened It can
primarily be attributed to the uncertainty in the external
environment and declining external demand. In 2020,
measures to limit the spread of the Covid-19 pandemic
also had a strong negative impact on trade intensity.
Latvia has a foreign trade deficit in goods. Between 2017-
2019 the deficit on average constituted 8.9% of GD (in
2019 - 8.1% of GDP). In 2020, compared to 2019, the value
of exports of goods at current prices increased by 4.3%,
while the value of imports decreased by 4.2%.
Consequently, the trade deficit reached 5% of GDP.
Current Account as per cent of GDP
Cross-border trade in services is more strongly affected by
the Covid-19 shock than trade in goods. The services
balance is positive, averaging 8.1% of GDP over 2017-2019,
and almost covering the foreign trade deficit. In 2020, the
balance of services declined. In 2020, exports and imports
of services at current prices decreased by 21.2% and
18.2%, respectively. Therefore, the surplus of the services
balance decreased, reaching 6.2% of GDP (in 2019 - 8% of
GDP). The decline in cross-border flows of services was
due to restrictions on movement and the decline in leisure
and business travel, which led to a decline in air travel and
road transport services.
Changes in income and capital accounts are primarily due
to variations in the absorption activities of EU funds. The
capital account surplus has averaged 1.4% of GDP over the
last three years. In 2020, it reached 1.7% of GDP.
In recent years, the financial account balance was primarily
determined by the public sector (i.e. the financial sector
stabilisation measures and other measures adopted by the
Bank of Latvia for the restructuring of public debt within
the framework of the extended asset purchase
programme). Fluctuations in the financial account were
affected by the decline in non-resident deposits in credit
institutions of Latvia. In 2020, financial account assets
increased more than liabilities; the financial account
balance (with reserve assets) reached 6.7% of GDP. The
state of balance of payments in the near future will be
largely determined by the extent and duration of the
spread of the COVID-19 pandemic and the restrictions
imposed to combat it.
-1.6 -0.6
1.6 1.3
-0.3 -0.6
3.0
10
15
20
25
-3.0
-1.5
0.0
1.5
3.0
2014 2015 2016 2017 2018 2019 2020
Current account (left axis)
Investments (right axis)
Savings (right axis)
-2.7 -1.7 -0.2
0.7 0.9
0.1
6%
4%-5
0
5
10
2014 2015 2016 2017 2018 2019
Current account
Upper limit
Lower limit
-14
-7
0
7
14
2014 2015 2016 2017 2018 2019 2020
Secondary income Primary income
Services Goods
Current account
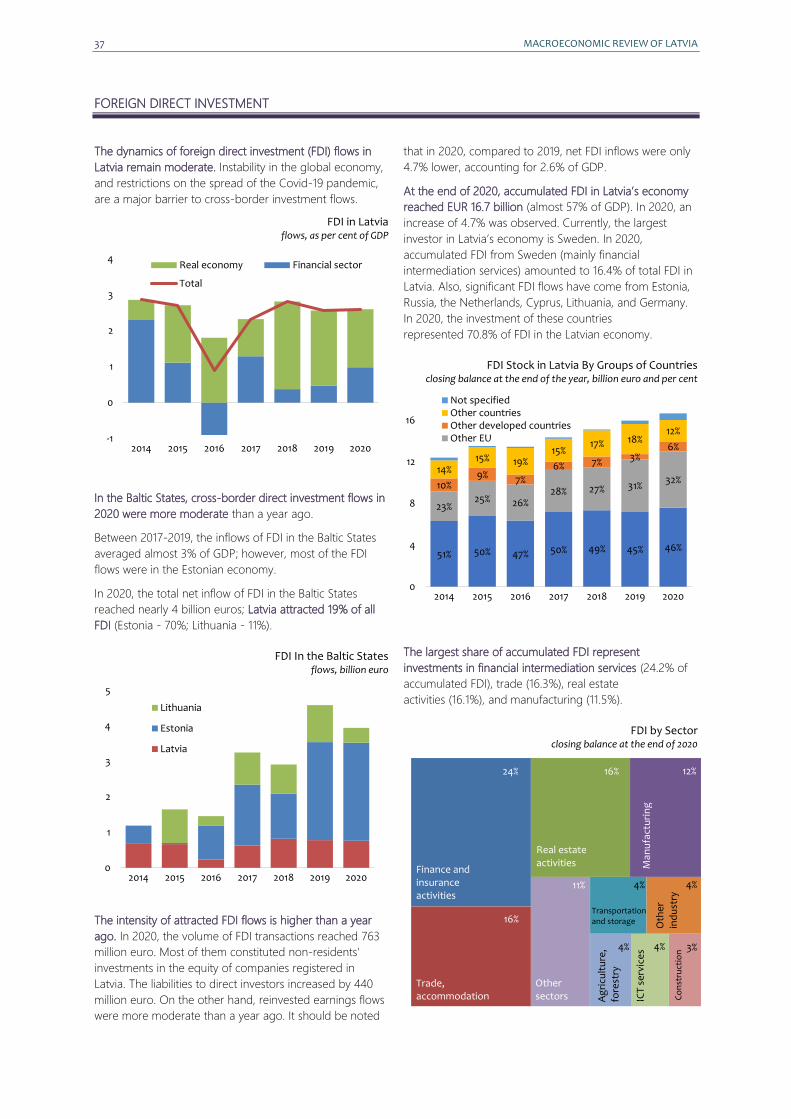
37 MACROECONOMIC REVIEW OF LATVIA
FOREIGN DIRECT INVESTMENT
The dynamics of foreign direct investment (FDI) flows in
Latvia remain moderate. Instability in the global economy,
and restrictions on the spread of the Covid-19 pandemic,
are a major barrier to cross-border investment flows.
FDI in Latvia flows, as per cent of GDP
In the Baltic States, cross-border direct investment flows in
2020 were more moderate than a year ago.
Between 2017-2019, the inflows of FDI in the Baltic States
averaged almost 3% of GDP; however, most of the FDI
flows were in the Estonian economy.
In 2020, the total net inflow of FDI in the Baltic States
reached nearly 4 billion euros; Latvia attracted 19% of all
FDI (Estonia - 70%; Lithuania - 11%).
FDI In the Baltic States flows, billion euro
The intensity of attracted FDI flows is higher than a year
ago. In 2020, the volume of FDI transactions reached 763
million euro. Most of them constituted non-residents'
investments in the equity of companies registered in
Latvia. The liabilities to direct investors increased by 440
million euro. On the other hand, reinvested earnings flows
were more moderate than a year ago. It should be noted
that in 2020, compared to 2019, net FDI inflows were only
4.7% lower, accounting for 2.6% of GDP.
At the end of 2020, accumulated FDI in Latvia’s economy
reached EUR 16.7 billion (almost 57% of GDP). In 2020, an
increase of 4.7% was observed. Currently, the largest
investor in Latvia’s economy is Sweden. In 2020,
accumulated FDI from Sweden (mainly financial
intermediation services) amounted to 16.4% of total FDI in
Latvia. Also, significant FDI flows have come from Estonia,
Russia, the Netherlands, Cyprus, Lithuania, and Germany.
In 2020, the investment of these countries
represented 70.8% of FDI in the Latvian economy.
FDI Stock in Latvia By Groups of Countries closing balance at the end of the year, billion euro and per cent
The largest share of accumulated FDI represent
investments in financial intermediation services (24.2% of
accumulated FDI), trade (16.3%), real estate
activities (16.1%), and manufacturing (11.5%).
FDI by Sector closing balance at the end of 2020
-1
0
1
2
3
4
2014 2015 2016 2017 2018 2019 2020
Real economy Financial sector
Total
0
1
2
3
4
5
2014 2015 2016 2017 2018 2019 2020
Lithuania
Estonia
Latvia
51% 50% 47% 50% 49% 45% 46%
23%25% 26%
28% 27% 31%32%
10%9% 7%
6% 7% 3%6%
14%15% 19%
15%17% 18%
12%
0
4
8
12
16
2014 2015 2016 2017 2018 2019 2020
Not specifiedOther countriesOther developed countriesOther EU
24%
4% 4%
Co
nst
ruct
ion
4%
12%
11%
16%
16%
3%
Finance and insurance activities
Other sectors
Trade, accommodation
Real estate activities
Transportation and storage
4%
Oth
er
ind
ust
ry
Ag
ricu
ltu
re,
fore
stry
IC
T se
rvic
es
M
anu
fact
uri
ng
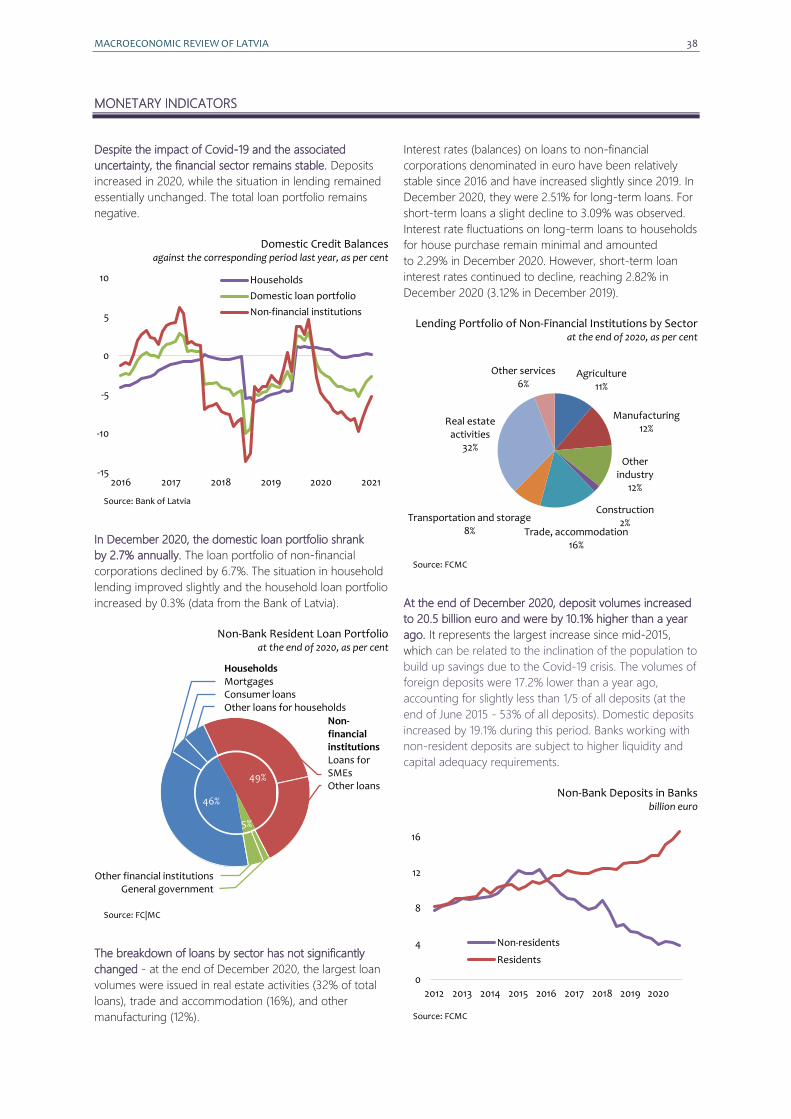
MACROECONOMIC REVIEW OF LATVIA 38
MONETARY INDICATORS
Despite the impact of Covid-19 and the associated
uncertainty, the financial sector remains stable. Deposits
increased in 2020, while the situation in lending remained
essentially unchanged. The total loan portfolio remains
negative.
Domestic Credit Balances against the corresponding period last year, as per cent
Source: Bank of Latvia
In December 2020, the domestic loan portfolio shrank
by 2.7% annually. The loan portfolio of non-financial
corporations declined by 6.7%. The situation in household
lending improved slightly and the household loan portfolio
increased by 0.3% (data from the Bank of Latvia).
Non-Bank Resident Loan Portfolio at the end of 2020, as per cent
Source: FC|MC
The breakdown of loans by sector has not significantly
changed - at the end of December 2020, the largest loan
volumes were issued in real estate activities (32% of total
loans), trade and accommodation (16%), and other
manufacturing (12%).
Interest rates (balances) on loans to non-financial
corporations denominated in euro have been relatively
stable since 2016 and have increased slightly since 2019. In
December 2020, they were 2.51% for long-term loans. For
short-term loans a slight decline to 3.09% was observed.
Interest rate fluctuations on long-term loans to households
for house purchase remain minimal and amounted
to 2.29% in December 2020. However, short-term loan
interest rates continued to decline, reaching 2.82% in
December 2020 (3.12% in December 2019).
Lending Portfolio of Non-Financial Institutions by Sector at the end of 2020, as per cent
Source: FCMC
At the end of December 2020, deposit volumes increased
to 20.5 billion euro and were by 10.1% higher than a year
ago. It represents the largest increase since mid-2015,
which can be related to the inclination of the population to
build up savings due to the Covid-19 crisis. The volumes of
foreign deposits were 17.2% lower than a year ago,
accounting for slightly less than 1/5 of all deposits (at the
end of June 2015 - 53% of all deposits). Domestic deposits
increased by 19.1% during this period. Banks working with
non-resident deposits are subject to higher liquidity and
capital adequacy requirements.
Non-Bank Deposits in Banks billion euro
Source: FCMC
-15
-10
-5
0
5
10
2016 2017 2018 2019 2020 2021
Households
Domestic loan portfolio
Non-financial institutions
Other financial institutionsGeneral government
HouseholdsMortgagesConsumer loansOther loans for households
Non-financial institutionsLoans for SMEsOther loans
Agriculture11%
Manufacturing12%
Other industry
12%
Construction2%
Trade, accommodation16%
Transportation and storage8%
Real estate activities
32%
Other services6%
0
4
8
12
16
2012 2013 2014 2015 2016 2017 2018 2019 2020
Non-residents
Residents
46%
49%
5%
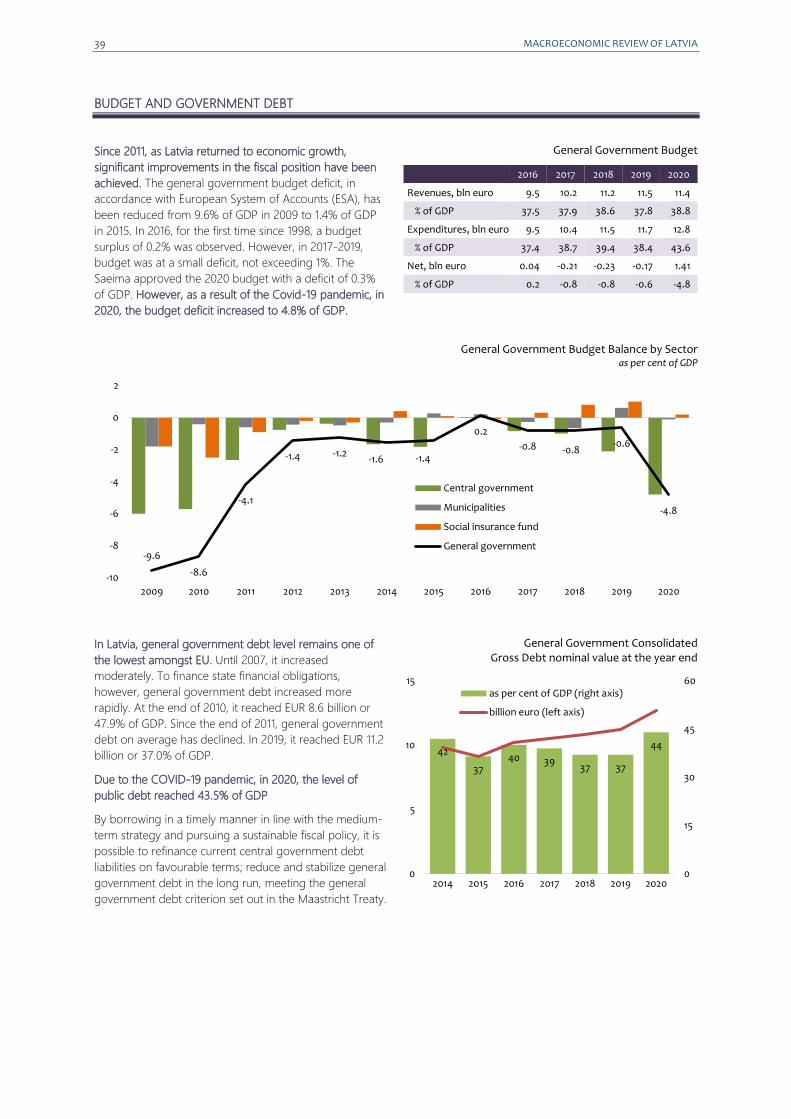
39 MACROECONOMIC REVIEW OF LATVIA
BUDGET AND GOVERNMENT DEBT
Since 2011, as Latvia returned to economic growth,
significant improvements in the fiscal position have been
achieved. The general government budget deficit, in
accordance with European System of Accounts (ESA), has
been reduced from 9.6% of GDP in 2009 to 1.4% of GDP
in 2015. In 2016, for the first time since 1998, a budget
surplus of 0.2% was observed. However, in 2017-2019,
budget was at a small deficit, not exceeding 1%. The
Saeima approved the 2020 budget with a deficit of 0.3%
of GDP. However, as a result of the Covid-19 pandemic, in
2020, the budget deficit increased to 4.8% of GDP.
General Government Budget
2016 2017 2018 2019 2020
Revenues, bln euro 9.5 10.2 11.2 11.5 11.4
% of GDP 37.5 37.9 38.6 37.8 38.8
Expenditures, bln euro 9.5 10.4 11.5 11.7 12.8
% of GDP 37.4 38.7 39.4 38.4 43.6
Net, bln euro 0.04 -0.21 -0.23 -0.17 1.41
% of GDP 0.2 -0.8 -0.8 -0.6 -4.8
General Government Budget Balance by Sector as per cent of GDP
In Latvia, general government debt level remains one of
the lowest amongst EU. Until 2007, it increased
moderately. To finance state financial obligations,
however, general government debt increased more
rapidly. At the end of 2010, it reached EUR 8.6 billion or
47.9% of GDP. Since the end of 2011, general government
debt on average has declined. In 2019, it reached EUR 11.2
billion or 37.0% of GDP.
Due to the COVID-19 pandemic, in 2020, the level of
public debt reached 43.5% of GDP
By borrowing in a timely manner in line with the medium-
term strategy and pursuing a sustainable fiscal policy, it is
possible to refinance current central government debt
liabilities on favourable terms; reduce and stabilize general
government debt in the long run, meeting the general
government debt criterion set out in the Maastricht Treaty.
General Government Consolidated Gross Debt nominal value at the year end
-9.6
-8.6
-4.1
-1.4 -1.2-1.6 -1.4
0.2
-0.8 -0.8-0.6
-4.8
-10
-8
-6
-4
-2
0
2
2009 2010 2011 2012 2013 2014 2015 2016 2017 2018 2019 2020
Central government
Municipalities
Social insurance fund
General government
42
3740 39
37 37
44
0
15
30
45
60
0
5
10
15
2014 2015 2016 2017 2018 2019 2020
as per cent of GDP (right axis)
billion euro (left axis)
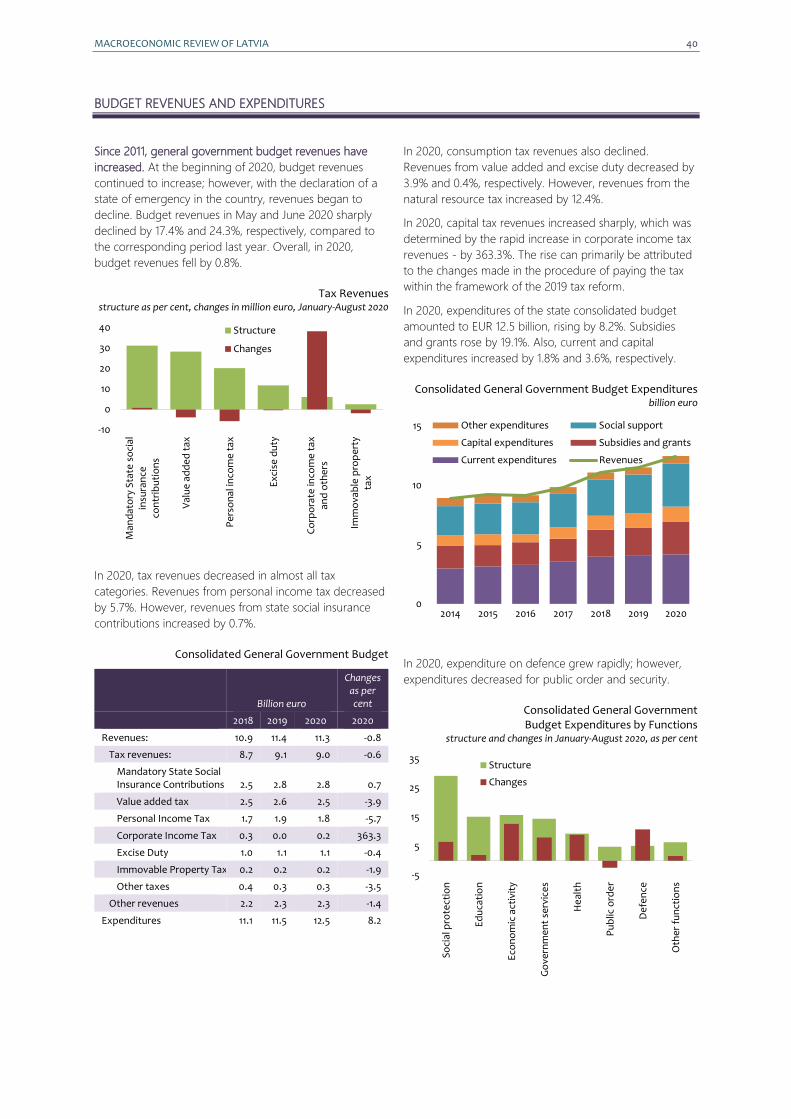
MACROECONOMIC REVIEW OF LATVIA 40
BUDGET REVENUES AND EXPENDITURES
Since 2011, general government budget revenues have
increased. At the beginning of 2020, budget revenues
continued to increase; however, with the declaration of a
state of emergency in the country, revenues began to
decline. Budget revenues in May and June 2020 sharply
declined by 17.4% and 24.3%, respectively, compared to
the corresponding period last year. Overall, in 2020,
budget revenues fell by 0.8%.
Tax Revenues structure as per cent, changes in million euro, January-August 2020
In 2020, tax revenues decreased in almost all tax
categories. Revenues from personal income tax decreased
by 5.7%. However, revenues from state social insurance
contributions increased by 0.7%.
Consolidated General Government Budget
Billion euro
Changes as per cent
2018 2019 2020 2020
Revenues: 10.9 11.4 11.3 -0.8
Tax revenues: 8.7 9.1 9.0 -0.6
Mandatory State Social Insurance Contributions 2.5 2.8 2.8 0.7
Value added tax 2.5 2.6 2.5 -3.9
Personal Income Tax 1.7 1.9 1.8 -5.7
Corporate Income Tax 0.3 0.0 0.2 363.3
Excise Duty 1.0 1.1 1.1 -0.4
Immovable Property Tax 0.2 0.2 0.2 -1.9
Other taxes 0.4 0.3 0.3 -3.5
Other revenues 2.2 2.3 2.3 -1.4
Expenditures 11.1 11.5 12.5 8.2
In 2020, consumption tax revenues also declined.
Revenues from value added and excise duty decreased by
3.9% and 0.4%, respectively. However, revenues from the
natural resource tax increased by 12.4%.
In 2020, capital tax revenues increased sharply, which was
determined by the rapid increase in corporate income tax
revenues - by 363.3%. The rise can primarily be attributed
to the changes made in the procedure of paying the tax
within the framework of the 2019 tax reform.
In 2020, expenditures of the state consolidated budget
amounted to EUR 12.5 billion, rising by 8.2%. Subsidies
and grants rose by 19.1%. Also, current and capital
expenditures increased by 1.8% and 3.6%, respectively.
Consolidated General Government Budget Expenditures billion euro
In 2020, expenditure on defence grew rapidly; however,
expenditures decreased for public order and security.
Consolidated General Government Budget Expenditures by Functions
structure and changes in January-August 2020, as per cent
-10
0
10
20
30
40
Man
dat
ory
Sta
te s
oci
alin
sura
nce
con
trib
uti
on
s
Val
ue
ad
de
d t
ax
Pe
rso
nal
inco
me
tax
Exc
ise
du
ty
Co
rpo
rate
inco
me
tax
and
oth
ers
Imm
ova
ble
pro
pe
rty
tax
Structure
Changes
0
5
10
15
2014 2015 2016 2017 2018 2019 2020
Other expenditures Social support
Capital expenditures Subsidies and grants
Current expenditures Revenues
-5
5
15
25
35
So
cial
pro
tect
ion
Ed
uca
tio
n
Eco
no
mic
act
ivit
y
Go
vern
me
nt
serv
ice
s
He
alth
Pu
blic
ord
er
De
fen
ce
Oth
er
fun
ctio
ns
Structure
Changes
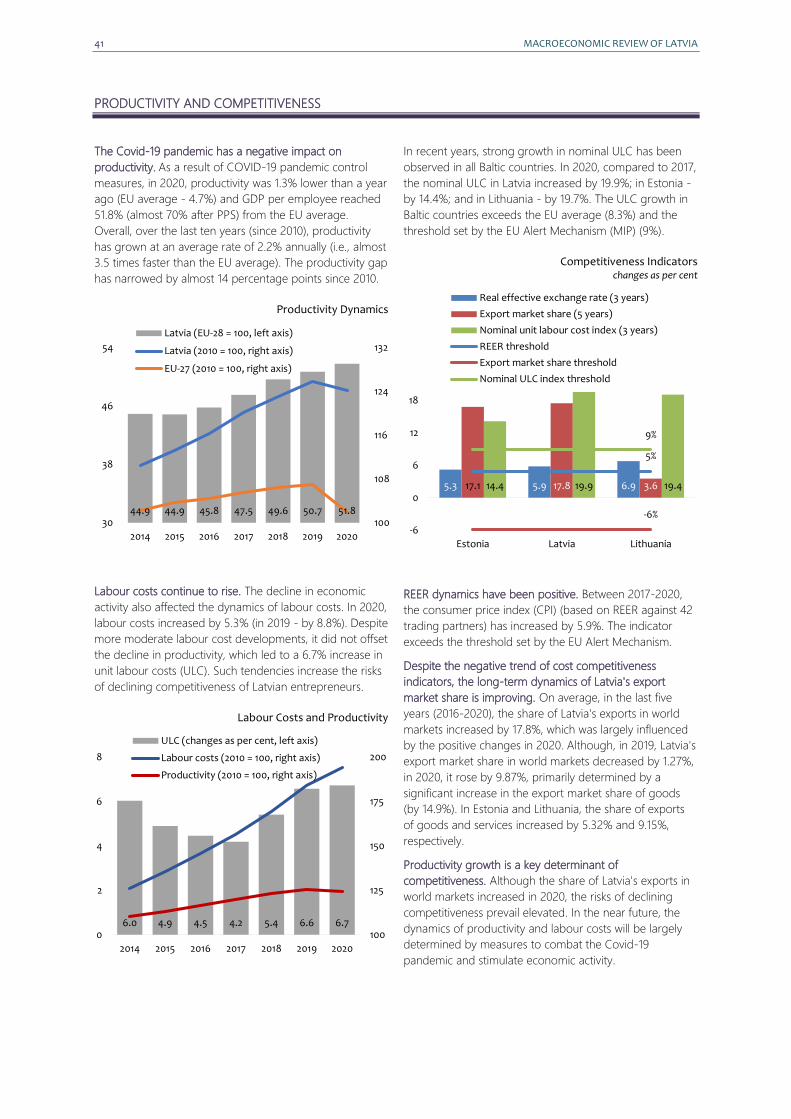
41 MACROECONOMIC REVIEW OF LATVIA
PRODUCTIVITY AND COMPETITIVENESS
The Covid-19 pandemic has a negative impact on
productivity. As a result of COVID-19 pandemic control
measures, in 2020, productivity was 1.3% lower than a year
ago (EU average - 4.7%) and GDP per employee reached
51.8% (almost 70% after PPS) from the EU average.
Overall, over the last ten years (since 2010), productivity
has grown at an average rate of 2.2% annually (i.e., almost
3.5 times faster than the EU average). The productivity gap
has narrowed by almost 14 percentage points since 2010.
Productivity Dynamics
Labour costs continue to rise. The decline in economic
activity also affected the dynamics of labour costs. In 2020,
labour costs increased by 5.3% (in 2019 - by 8.8%). Despite
more moderate labour cost developments, it did not offset
the decline in productivity, which led to a 6.7% increase in
unit labour costs (ULC). Such tendencies increase the risks
of declining competitiveness of Latvian entrepreneurs.
Labour Costs and Productivity
In recent years, strong growth in nominal ULC has been
observed in all Baltic countries. In 2020, compared to 2017,
the nominal ULC in Latvia increased by 19.9%; in Estonia -
by 14.4%; and in Lithuania - by 19.7%. The ULC growth in
Baltic countries exceeds the EU average (8.3%) and the
threshold set by the EU Alert Mechanism (MIP) (9%).
Competitiveness Indicators changes as per cent
REER dynamics have been positive. Between 2017-2020,
the consumer price index (CPI) (based on REER against 42
trading partners) has increased by 5.9%. The indicator
exceeds the threshold set by the EU Alert Mechanism.
Despite the negative trend of cost competitiveness
indicators, the long-term dynamics of Latvia's export
market share is improving. On average, in the last five
years (2016-2020), the share of Latvia's exports in world
markets increased by 17.8%, which was largely influenced
by the positive changes in 2020. Although, in 2019, Latvia's
export market share in world markets decreased by 1.27%,
in 2020, it rose by 9.87%, primarily determined by a
significant increase in the export market share of goods
(by 14.9%). In Estonia and Lithuania, the share of exports
of goods and services increased by 5.32% and 9.15%,
respectively.
Productivity growth is a key determinant of
competitiveness. Although the share of Latvia's exports in
world markets increased in 2020, the risks of declining
competitiveness prevail elevated. In the near future, the
dynamics of productivity and labour costs will be largely
determined by measures to combat the Covid-19
pandemic and stimulate economic activity.
44.9 44.9 45.8 47.5 49.6 50.7 51.8100
108
116
124
132
30
38
46
54
2014 2015 2016 2017 2018 2019 2020
Latvia (EU-28 = 100, left axis)
Latvia (2010 = 100, right axis)
EU-27 (2010 = 100, right axis)
6.0 4.9 4.5 4.2 5.4 6.6 6.7100
125
150
175
200
0
2
4
6
8
2014 2015 2016 2017 2018 2019 2020
ULC (changes as per cent, left axis)
Labour costs (2010 = 100, right axis)
Productivity (2010 = 100, right axis)
5.3 5.9 6.917.1 17.8 3.614.4 19.9 19.4
5%
-6%
9%
-6
0
6
12
18
Estonia Latvia Lithuania
Real effective exchange rate (3 years)
Export market share (5 years)
Nominal unit labour cost index (3 years)
REER threshold
Export market share threshold
Nominal ULC index threshold
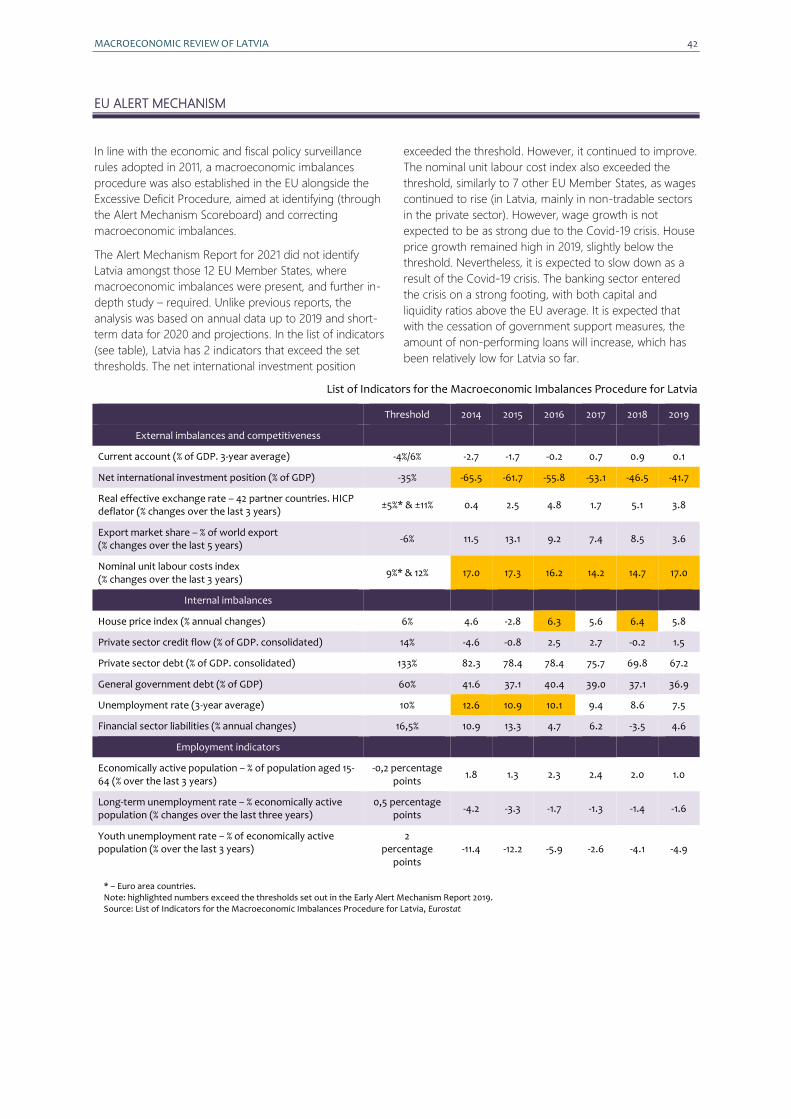
MACROECONOMIC REVIEW OF LATVIA 42
EU ALERT MECHANISM
In line with the economic and fiscal policy surveillance
rules adopted in 2011, a macroeconomic imbalances
procedure was also established in the EU alongside the
Excessive Deficit Procedure, aimed at identifying (through
the Alert Mechanism Scoreboard) and correcting
macroeconomic imbalances.
The Alert Mechanism Report for 2021 did not identify
Latvia amongst those 12 EU Member States, where
macroeconomic imbalances were present, and further in-
depth study – required. Unlike previous reports, the
analysis was based on annual data up to 2019 and short-
term data for 2020 and projections. In the list of indicators
(see table), Latvia has 2 indicators that exceed the set
thresholds. The net international investment position
exceeded the threshold. However, it continued to improve.
The nominal unit labour cost index also exceeded the
threshold, similarly to 7 other EU Member States, as wages
continued to rise (in Latvia, mainly in non-tradable sectors
in the private sector). However, wage growth is not
expected to be as strong due to the Covid-19 crisis. House
price growth remained high in 2019, slightly below the
threshold. Nevertheless, it is expected to slow down as a
result of the Covid-19 crisis. The banking sector entered
the crisis on a strong footing, with both capital and
liquidity ratios above the EU average. It is expected that
with the cessation of government support measures, the
amount of non-performing loans will increase, which has
been relatively low for Latvia so far.
List of Indicators for the Macroeconomic Imbalances Procedure for Latvia
Threshold 2014 2015 2016 2017 2018 2019
External imbalances and competitiveness
Current account (% of GDP. 3-year average) -4%/6% -2.7 -1.7 -0.2 0.7 0.9 0.1
Net international investment position (% of GDP) -35% -65.5 -61.7 -55.8 -53.1 -46.5 -41.7
Real effective exchange rate – 42 partner countries. HICP deflator (% changes over the last 3 years)
±5%* & ±11% 0.4 2.5 4.8 1.7 5.1 3.8
Export market share – % of world export (% changes over the last 5 years)
-6% 11.5 13.1 9.2 7.4 8.5 3.6
Nominal unit labour costs index (% changes over the last 3 years)
9%* & 12% 17.0 17.3 16.2 14.2 14.7 17.0
Internal imbalances
House price index (% annual changes) 6% 4.6 -2.8 6.3 5.6 6.4 5.8
Private sector credit flow (% of GDP. consolidated) 14% -4.6 -0.8 2.5 2.7 -0.2 1.5
Private sector debt (% of GDP. consolidated) 133% 82.3 78.4 78.4 75.7 69.8 67.2
General government debt (% of GDP) 60% 41.6 37.1 40.4 39.0 37.1 36.9
Unemployment rate (3-year average) 10% 12.6 10.9 10.1 9.4 8.6 7.5
Financial sector liabilities (% annual changes) 16,5% 10.9 13.3 4.7 6.2 -3.5 4.6
Employment indicators
Economically active population – % of population aged 15-64 (% over the last 3 years)
-0,2 percentage points
1.8 1.3 2.3 2.4 2.0 1.0
Long-term unemployment rate – % economically active population (% changes over the last three years)
0,5 percentage points
-4.2 -3.3 -1.7 -1.3 -1.4 -1.6
Youth unemployment rate – % of economically active population (% over the last 3 years)
2 percentage
points -11.4 -12.2 -5.9 -2.6 -4.1 -4.9
* – Euro area countries. Note: highlighted numbers exceed the thresholds set out in the Early Alert Mechanism Report 2019. Source: List of Indicators for the Macroeconomic Imbalances Procedure for Latvia, Eurostat
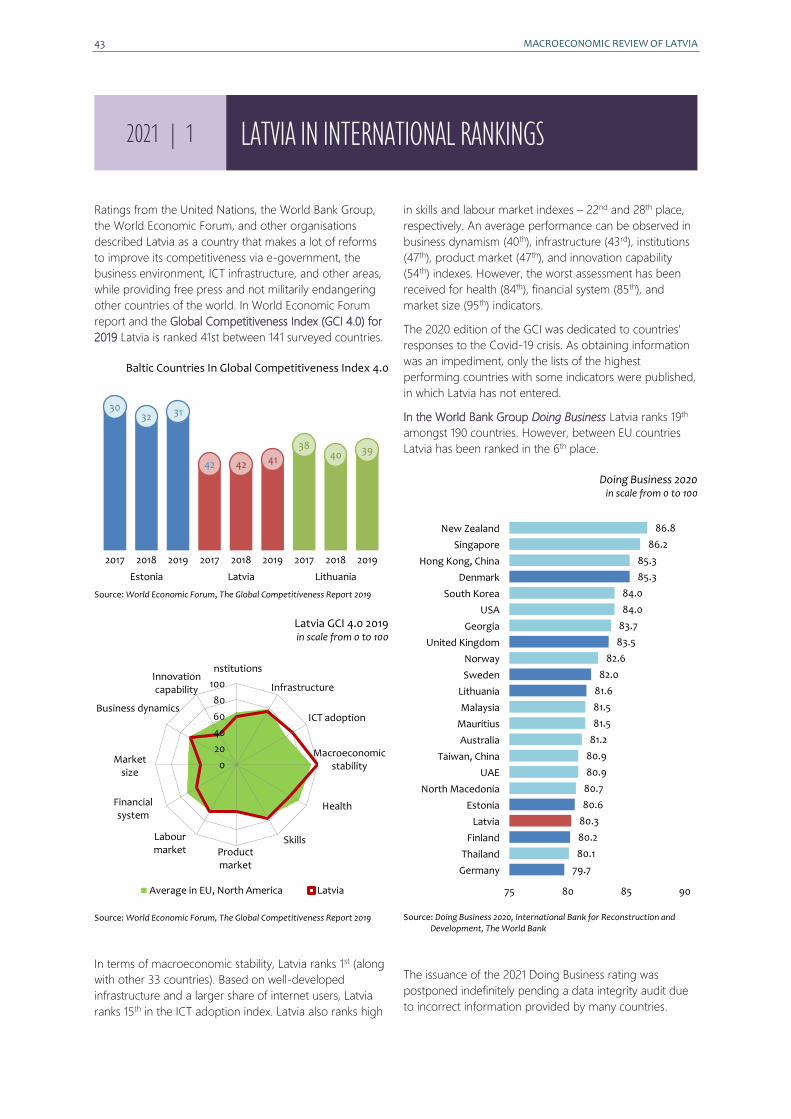
43 MACROECONOMIC REVIEW OF LATVIA
Ratings from the United Nations, the World Bank Group,
the World Economic Forum, and other organisations
described Latvia as a country that makes a lot of reforms
to improve its competitiveness via e-government, the
business environment, ICT infrastructure, and other areas,
while providing free press and not militarily endangering
other countries of the world. In World Economic Forum
report and the Global Competitiveness Index (GCI 4.0) for
2019 Latvia is ranked 41st between 141 surveyed countries.
Baltic Countries In Global Competitiveness Index 4.0
Source: World Economic Forum, The Global Competitiveness Report 2019
Latvia GCI 4.0 2019 in scale from 0 to 100
Source: World Economic Forum, The Global Competitiveness Report 2019
In terms of macroeconomic stability, Latvia ranks 1st (along
with other 33 countries). Based on well-developed
infrastructure and a larger share of internet users, Latvia
ranks 15th in the ICT adoption index. Latvia also ranks high
in skills and labour market indexes – 22nd and 28th place,
respectively. An average performance can be observed in
business dynamism (40th), infrastructure (43rd), institutions
(47th), product market (47th), and innovation capability
(54th) indexes. However, the worst assessment has been
received for health (84th), financial system (85th), and
market size (95th) indicators.
The 2020 edition of the GCI was dedicated to countries'
responses to the Covid-19 crisis. As obtaining information
was an impediment, only the lists of the highest
performing countries with some indicators were published,
in which Latvia has not entered.
In the World Bank Group Doing Business Latvia ranks 19th
amongst 190 countries. However, between EU countries
Latvia has been ranked in the 6th place.
Doing Business 2020 in scale from 0 to 100
Source: Doing Business 2020, International Bank for Reconstruction and Development, The World Bank
The issuance of the 2021 Doing Business rating was
postponed indefinitely pending a data integrity audit due
to incorrect information provided by many countries.
3032 31
42 42 41
3840 39
2017 2018 2019 2017 2018 2019 2017 2018 2019
Estonia Latvia Lithuania
0
20
40
60
80
100
Average in EU, North America Latvia
nstitutions
Infrastructure
ICT adoption
Macroeconomic stability
Health
SkillsProduct market
Labour market
Financial system
Market size
Business dynamics
Innovation capability
79.7
80.1
80.2
80.3
80.6
80.7
80.9
80.9
81.2
81.5
81.5
81.6
82.0
82.6
83.5
83.7
84.0
84.0
85.3
85.3
86.2
86.8
75 80 85 90
Germany
Thailand
Finland
Latvia
Estonia
North Macedonia
UAE
Taiwan, China
Australia
Mauritius
Malaysia
Lithuania
Sweden
Norway
United Kingdom
Georgia
USA
South Korea
Denmark
Hong Kong, China
Singapore
New Zealand
2021 | 1 LATVIA IN INTERNATIONAL RANKINGS
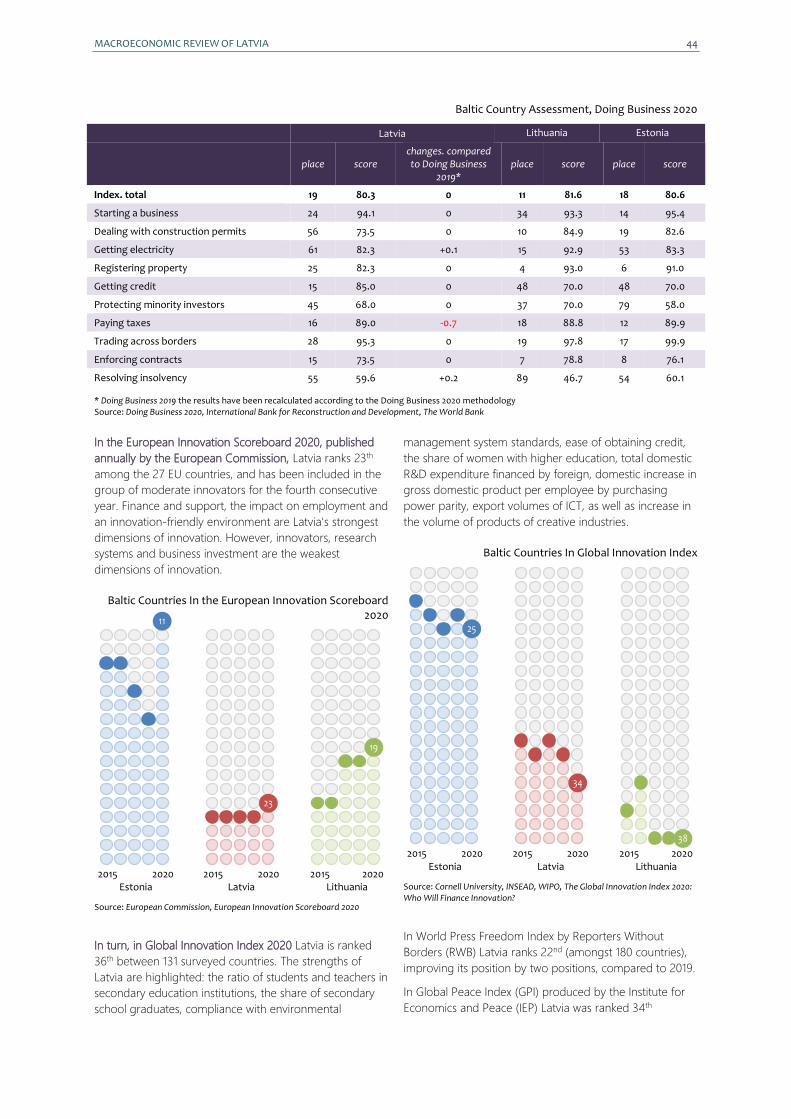
MACROECONOMIC REVIEW OF LATVIA 44
Baltic Country Assessment, Doing Business 2020
Latvia Lithuania Estonia
place score changes. compared to Doing Business
2019* place score place score
Index. total 19 80.3 0 11 81.6 18 80.6
Starting a business 24 94.1 0 34 93.3 14 95.4
Dealing with construction permits 56 73.5 0 10 84.9 19 82.6
Getting electricity 61 82.3 +0.1 15 92.9 53 83.3
Registering property 25 82.3 0 4 93.0 6 91.0
Getting credit 15 85.0 0 48 70.0 48 70.0
Protecting minority investors 45 68.0 0 37 70.0 79 58.0
Paying taxes 16 89.0 -0.7 18 88.8 12 89.9
Trading across borders 28 95.3 0 19 97.8 17 99.9
Enforcing contracts 15 73.5 0 7 78.8 8 76.1
Resolving insolvency 55 59.6 +0.2 89 46.7 54 60.1
* Doing Business 2019 the results have been recalculated according to the Doing Business 2020 methodology Source: Doing Business 2020, International Bank for Reconstruction and Development, The World Bank
In the European Innovation Scoreboard 2020, published
annually by the European Commission, Latvia ranks 23th
among the 27 EU countries, and has been included in the
group of moderate innovators for the fourth consecutive
year. Finance and support, the impact on employment and
an innovation-friendly environment are Latvia's strongest
dimensions of innovation. However, innovators, research
systems and business investment are the weakest
dimensions of innovation.
Baltic Countries In the European Innovation Scoreboard 2020
2015 2020 2015 2020 2015 2020
Estonia Latvia Lithuania
Source: European Commission, European Innovation Scoreboard 2020
In turn, in Global Innovation Index 2020 Latvia is ranked
36th between 131 surveyed countries. The strengths of
Latvia are highlighted: the ratio of students and teachers in
secondary education institutions, the share of secondary
school graduates, compliance with environmental
management system standards, ease of obtaining credit,
the share of women with higher education, total domestic
R&D expenditure financed by foreign, domestic increase in
gross domestic product per employee by purchasing
power parity, export volumes of ICT, as well as increase in
the volume of products of creative industries.
Baltic Countries In Global Innovation Index
2015 2020 2015 2020 2015 2020
Estonia Latvia Lithuania
Source: Cornell University, INSEAD, WIPO, The Global Innovation Index 2020: Who Will Finance Innovation?
In World Press Freedom Index by Reporters Without
Borders (RWB) Latvia ranks 22nd (amongst 180 countries),
improving its position by two positions, compared to 2019.
In Global Peace Index (GPI) produced by the Institute for
Economics and Peace (IEP) Latvia was ranked 34th
25
34
38
11
23
19
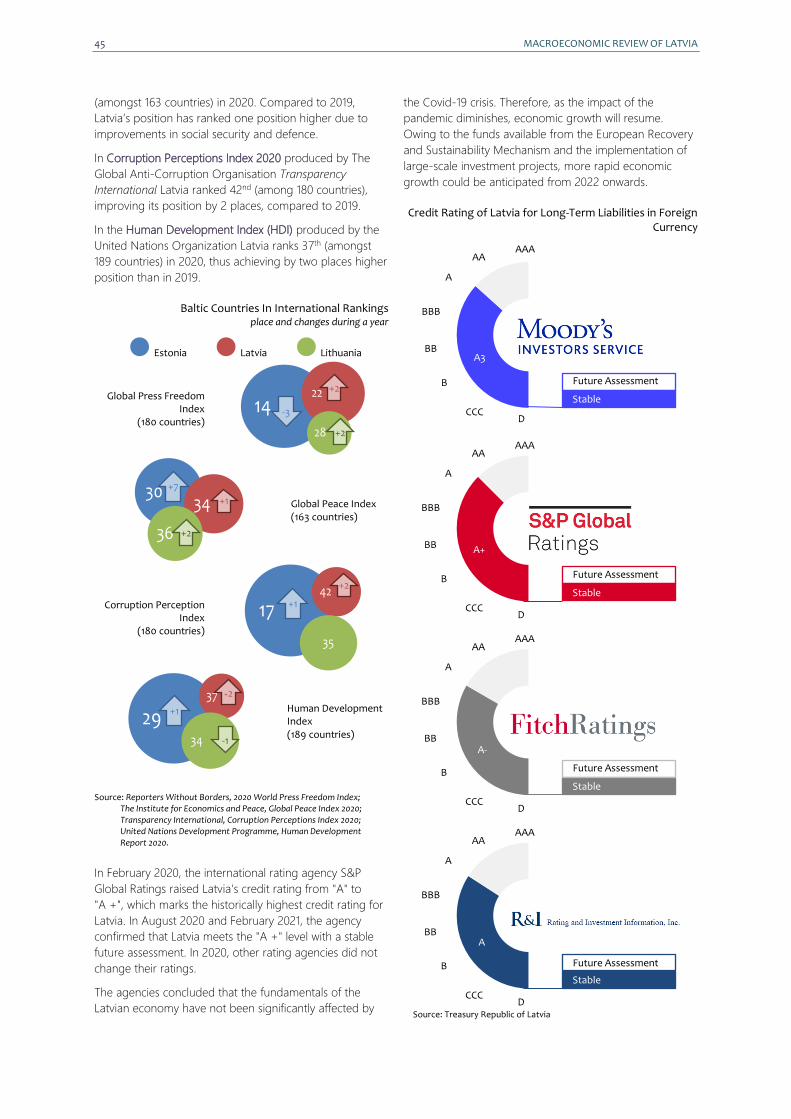
45 MACROECONOMIC REVIEW OF LATVIA
(amongst 163 countries) in 2020. Compared to 2019,
Latvia’s position has ranked one position higher due to
improvements in social security and defence.
In Corruption Perceptions Index 2020 produced by The
Global Anti-Corruption Organisation Transparency
International Latvia ranked 42nd (among 180 countries),
improving its position by 2 places, compared to 2019.
In the Human Development Index (HDI) produced by the
United Nations Organization Latvia ranks 37th (amongst
189 countries) in 2020, thus achieving by two places higher
position than in 2019.
Baltic Countries In International Rankings place and changes during a year
Estonia Latvia Lithuania
Global Press Freedom Index
(180 countries)
Global Peace Index (163 countries)
Corruption Perception Index
(180 countries)
Human Development Index (189 countries)
Source: Reporters Without Borders, 2020 World Press Freedom Index;
The Institute for Economics and Peace, Global Peace Index 2020; Transparency International, Corruption Perceptions Index 2020; United Nations Development Programme, Human Development Report 2020.
In February 2020, the international rating agency S&P
Global Ratings raised Latvia's credit rating from "A" to
"A +", which marks the historically highest credit rating for
Latvia. In August 2020 and February 2021, the agency
confirmed that Latvia meets the "A +" level with a stable
future assessment. In 2020, other rating agencies did not
change their ratings.
The agencies concluded that the fundamentals of the
Latvian economy have not been significantly affected by
the Covid-19 crisis. Therefore, as the impact of the
pandemic diminishes, economic growth will resume.
Owing to the funds available from the European Recovery
and Sustainability Mechanism and the implementation of
large-scale investment projects, more rapid economic
growth could be anticipated from 2022 onwards.
Credit Rating of Latvia for Long-Term Liabilities in Foreign Currency
Source: Treasury Republic of Latvia
A3
A+
A-
A
+2
+2
AAA
D CCC
B
BB
BBB
A
AA
Stable
Future Assessment
Stable
Future Assessment
AAA
D CCC
B
BB
BBB
A
AA
Stable
Future Assessment
AAA
D CCC
B
BB
BBB
A
AA
Stable
Future Assessment
AAA
D CCC
B
BB
BBB
A
AA
+2
-3
+2
+1
+1
-1
+2
+1
+7