Embed Size (px)
Citation preview

Volume X, Issue 2October 2011


Volume X, Issue 2 October 2011
ISSN 0219-8908 Published in October 2011 Economic Policy Group Monetary Authority of Singapore http://www.mas.gov.sg All rights reserved. No part of this publication may be reproduced, stored in a retrieval system or transmitted in any form or by any means, electronic, mechanised, photocopying, recording or otherwise, without the prior written permission of the copyright owner except in accordance with the provisions of the Copyright Act (Cap. 63). Application for the copyright owner's written permission to reproduce any part of this publication should be addressed to: Economic Policy Group Monetary Authority of Singapore 10 Shenton Way MAS Building Singapore 079117 Printed by Xpress Print Singapore

Contents Preface i Highlights ii-iii Monetary Policy Statement iv-vi 1 Macroeconomic Developments 1.1 External Developments 2 1.2 Domestic Economy 6 1.3 Macroeconomic Policy 14
Box A: Review of MAS Money Market Operations in FY2010/11 23
2 Wage-Price Dynamics 2.1 Labour Market Conditions 28 2.2 Consumer Price Developments 31
3 Outlook 3.1 External Outlook 38 3.2 Outlook for the Singapore Economy 43
Box B: Global Trade in Services and its Implications for Singapore 53 3.3 Labour Market 57 3.4 Inflation 61
Special Features
Special Feature A: An Overview of the Satellite Model of Singapore 68 Special Feature B: Capital Flow Waves 77
Statistical Appendix 82 List of Selected Publications 92
Monetary Authority of Singapore Economic Policy Group

Macroeconomic Review, October 2011
Monetary Authority of Singapore Economic Policy Group
LIST OF ABBREVIATIONS ACU Asian Currency Unit ASEAN Association of Southeast Asian Nations capex capital expenditures COE Certificate of Entitlement CPF Central Provident Fund CPI consumer price index CSP community, social & personal DLI Domestic Liquidity Indicator EIA Energy Information Administration EPG Economic Policy Group FAO Food and Agriculture Organisation of the United Nations FI Fiscal Impulse GFCF Gross fixed capital formation GST goods and services tax HDB Housing Development Board IMF International Monetary Fund IPI import price index IPO Initial Public Offering m-o-m month-on-month MENA Middle East/North Africa MEQ machinery and equipment MMS Monetary Model of Singapore NIEs newly-industrialised economies NEER nominal effective exchange rate OECD Organisation of Economic Cooperation and Development OPEC Organisation of the Petroleum Exporting Countries PMI Purchasing Managers’ Index q-o-q quarter-on-quarter REER real effective exchange rate SAAR seasonally-adjusted annualised rate SIBOR Singapore interbank offered rate SITC Standard International Trade Classification SOR swap offered rate SMS Satellite Model of Singapore WTO World Trade Organisation WTI West Texas Intermediate y-o-y year-on-year

Preface i
Preface The Macroeconomic Review is published twice a year in conjunction with the release of the MAS Monetary Policy Statement. The Review documents the Economic Policy Group’s (EPG) analysis and assessment of macroeconomic developments in the Singapore economy, and shares with market participants, analysts and the wider public, the basis for the policy decisions conveyed in the Monetary Policy Statement. It also features in-depth studies undertaken by EPG on important economic issues facing Singapore. The Review was edited by Associate Professor Peter Wilson, and continues to feature our collaborations with various academics. We are pleased to have Professor Kristin J. Forbes of MIT and Associate Professor Frank E. Warnock of the University of Virginia write about capital flow waves in Special Feature B of this issue. We are also grateful to Sanjay Kalra, the IMF Resident Representative for Vietnam and Laos, for his collaboration with EPG on Box A which examines the underlying drivers of global trade in services. The data used in the Review were drawn from the following government agencies, unless otherwise stated: BCA, CPF Board, DOS, EDB, HDB, IE Singapore, LTA, MOF, MOM, MTI, STB and URA. The Review may be accessed in PDF format on the MAS website: http://www.mas.gov.sg/publications/macro_review/index.html. The Review may also be purchased at major bookstores, online (http://asp.marketasia.com.sg/Spore/sporeindex.asp), or on an annual subscription basis (details can be found on the last page).
Monetary Authority of Singapore Economic Policy Group

ii Macroeconomic Review, October 2011
Highlights Since the last Review, global economic growth has faltered, with stresses in private and public balance sheets in the crisis-affected countries proving to be more severe, and the deleveraging process more protracted, than previously anticipated. Just as the supply shocks from the political unrest in the Middle East/North Africa (MENA) region and the Tohoku earthquake subsided, the global economy was confronted with fresh uncertainties over US fiscal sustainability and sovereign indebtedness in Europe. Against this backdrop, the Singapore economy recorded a marginal expansion of 1.3% q-o-q SAAR in Q3, with the bulk of this growth coming from pharmaceuticals. Looking ahead, the step-up in uncertainties in recent months has clearly skewed the risks towards the downside, with the outlook for Singapore very much dependent on how economic events in the US and Eurozone unfold. Chapter 1 begins with an overview of recent developments in the external environment and the domestic economy. The supply-chain disruptions from the Tohoku earthquake have largely dissipated, but the retraction in global demand alongside a rapid deterioration of global business and consumer confidence has led to further slowing of the Singapore economy. IT-related activities bore the brunt of the slowdown, partly due to Singapore’s larger exposure to component manufacturing, which generally tends to be more sensitive to changes in final demand. However, the tourism and retail sectors stayed buoyant, owing to continued income growth in the region and domestically. Chapter 2 examines recent trends in the labour market and prices. Notwithstanding the slower pace of employment growth, the labour market has remained tight, causing firms in some sectors to increase hours of work. Some firms responded to the tight labour supply by raising wages, which, coupled with weaker economy-wide labour productivity, has resulted in a further pickup in overall unit labour costs. Correspondingly, domestic price and cost pressures were relatively strong in the first half of the year amidst the high level of resource utilisation in the economy. Headline CPI inflation also rose sharply on a sequential basis, largely due to a rapid increase in accommodation costs and car COE prices. Chapter 3 turns to the prospects for both the external and domestic economies. Broadly, the outlook for the Singapore economy can be characterised by two phases, namely “stalled growth” over the next few quarters, followed by a “modest recovery” probably occurring sometime in the latter half of 2012. The first phase depicts the drag on domestic economic activity due to continued uncertainty and financial volatility in the external environment. Thereafter, if external uncertainties subside, the Singapore economy should experience a more discernible pick-up in activity. However, growth will still be modest, due to structural fragilities in the G3 economies. Accordingly, GDP growth in the Singapore economy could slow to below its potential rate of 3–5% in 2012. At the same time, the gradual narrowing of the positive output gap will have a restraining effect on domestic costs and prices next year, while weak global demand will dampen commodity prices. Also included in Chapter 3 is a box item that examines the underlying drivers of global trade in services. Singapore’s experience in services exports is benchmarked against the global surge in services trade over the last decade. The study shows that Singapore’s export share of modern services (which include financial and ICT services) is low compared to the global average. Coupled with potentially strong regional demand for services imports, there is considerable scope for expansion in these sectors. To complete this Review, we present two special feature items. In Special Feature A, we introduce the Satellite Model of Singapore (SMS), the latest addition to EPG’s suite of models. The SMS is a small quarterly macroeconomic model that provides a satellite view of the Singapore economy, making it more tractable for economic analysis. The SMS is principally used for policy simulations, and is based on core New Keynesian equations for aggregate demand, inflation and the monetary policy reaction function.
Monetary Authority of Singapore Economic Policy Group

Monetary Policy Statement iii
The SMS will complement EPG’s flagship model, the Monetary Model of Singapore (MMS), as essential tools for macroeconomic policy analysis at the MAS. This Review concludes with a Special Feature by Professors Kristin J. Forbes of MIT and Francis E. Warnock of the University of Virginia titled, “Capital Flow Waves”. This feature attempts to better understand the major ebbs and flows of international capital by using a novel approach to define four types of (gross) capital flow episodes—surges, stops, flight, and retrenchment—and differentiate between capital movements initiated by foreigners and residents. Using a probit-like model, they estimate the conditional probability of one of these episodes occurring within the quarter. Their results indicate a significant role for global factors and contagion in driving capital flow episodes, thus pointing to the importance of global institutions and cross-country cooperation in reducing capital flow volatility. In contrast, they find that many domestic factors only have a limited effect on capital flow volatility. This suggests that governments concerned about the effects of capital flow volatility should prioritise strengthening their country’s ability to withstand this volatility rather than trying to reduce it. The next issue of the Review will be released in April 2012.
Economic Policy Group Monetary Authority of Singapore
27 October 2011
Monetary Authority of Singapore Economic Policy Group

iv Macroeconomic Review, October 2011
14 October 2011
Monetary Policy Statement
INTRODUCTION 1. MAS re-centred the S$NEER policy band upwards in April this year, with no change to the slope and width of the band, amidst tight factor markets and strong pressures on domestic costs and prices. This was the third consecutive tightening move since April 2010, aimed at ensuring price stability in the medium term, while keeping growth on a sustainable path.
Chart 1
S$ Nominal Effective Exchange Rate (S$NEER)
Apr Jul Oct Jan Apr Jul Oct
96
100
104
108
112
Inde
x (1
Apr
201
0 =
100)
indicates release of Monetary Policy Statement
Appreciation
Depreciation
2010 2011
2. From April to early September 2011, the S$NEER (Chart 1) had generally appreciated and remained within the upper half of the policy band. This reflected the broad-based weakness in the US$ and investor interest in higher-growth economies. However, the S$NEER has since fallen to the lower half of the band, reflecting a pullback in investor risk appetite on concerns over the deepening debt crisis in the Eurozone and softer growth prospects for Asia. The domestic three-month interbank rate eased further after April, but has increased to 0.44% as of early October.
OUTLOOK FOR 2011 AND 2012 3. The Singapore economy has weakened over the last six months, weighed down by supply-side disruptions arising from the earthquake in Japan and, more recently, by faltering global demand. According to the Advance Estimates released by the Ministry of Trade and Industry today, Singapore’s GDP expanded marginally by 1.3% on a quarter-on-quarter seasonally adjusted annualised basis in Q3 2011, following the 6.3% contraction in the preceding quarter. The continued weakness in activity was most evident in electronics-related manufacturing, while sentiment-driven segments of the financial sector were also hit. The biomedical sector however provided support to GDP growth during the quarter.
Monetary Authority of Singapore Economic Policy Group

Monetary Policy Statement v
4. The outlook for the global economy has deteriorated sharply against the backdrop of increased uncertainty in financial markets. The Eurozone economy, faced with an ongoing sovereign debt crisis, will be constrained by fiscal austerity and tightening credit conditions. Private consumption in the US continues to be hampered by the sluggish labour market and anaemic housing prices, while firms remain cautious in their investment spending. With final demand in the advanced economies softening, growth in Asia will slow, notwithstanding some support from domestic demand. At the same time, the global IT industry continues to experience excess supply and could see further correction in output in the coming quarters. Against this backdrop, Singapore’s GDP growth in 2011 is expected to be around 5%. With the weak external environment likely to persist, the Singapore economy will expand more slowly in 2012 and growth could be below its potential rate of 3–5%. 5. The MAS measure of core inflation, which excludes private road transport and accommodation costs, stood at 2.2% in Q2 and the first two months of Q3, compared to 1.9% in Q1 2011. Core inflation better reflects underlying price pressures in the economy and is the most relevant among the range of indicators that MAS monitors for monetary policy. The core inflation over the last two quarters reflected higher global commodity prices compared to a year ago, as well as some pass-through of wage increases arising from the tight labour market. 6. Headline CPI inflation rose from 4.7% in Q2 2011 to 5.6% in July–August. This mainly reflected higher COE premiums and the imputed rental cost of owner-occupied housing, which is the largest component of accommodation costs in the CPI.1/ The core inflation has been significantly lower than headline inflation since the middle of 2010. (Chart 2)
Chart 2 Headline and Core CPI Inflation
2007 2008 2009 2010 2011 Jul-Aug
-2
0
2
4
6
8
0
-2
YO
Y %
Gro
wth
HeadlineInflation
Core Inflation
7. The ongoing slowdown in domestic economic activity will reduce tightness in the labour market and alleviate price pressures. Inflationary pressures emanating from abroad should also subside. As a result, core inflation should gradually ease from an estimated 2.3% in Q4 this year to 1.5% at the end of 2012. It is forecast to be around 1.5–2% in 2012, compared to about 2.1% in 2011. 8. The strength in rentals due to a temporary shortage of completed dwellings will, however, cause the imputed rental cost of owner-occupied housing to rise further at a fairly strong pace. Private road transport costs may also remain firm in response to the tight COE supply. As a result, headline inflation will be elevated for the rest of this year before easing, especially in the second half of 2012. For the full year, it is expected to come in at around 5% in 2011 and 2.5–3.5% in 2012.
__________________________________
1/ The CPI accommodation series also includes the costs of actual rented accommodation and minor repairs.
Monetary Authority of Singapore Economic Policy Group

vi Macroeconomic Review, October 2011
MONETARY POLICY 9. Given the stresses and fragility in the advanced economies, the prospects for growth in Singapore’s major trading partners have deteriorated. With the slowdown in demand, growth in the Singapore economy could fall below its potential rate of 3–5%. Thus, core inflation should ease next year, although headline inflation could stay elevated in the near term reflecting the higher imputed rental cost of owner-occupied housing. 10. MAS will continue with the policy of a modest and gradual appreciation of the S$NEER policy band in the period ahead. However, given the expected moderation in core inflation, the slope of the policy band will be reduced, with no change to the width of the band and the level at which it is centred.
Monetary Authority of Singapore Economic Policy Group

Chapter 1 Macroeconomic
Developments
2 Macroeconomic Review, October 2011
Monetary Authority of Singapore Economic Policy Group
1.1 External Developments
World Economic Growth Faltered
Adverse effects from supply shocks were compounded by slowing demand in the G3.
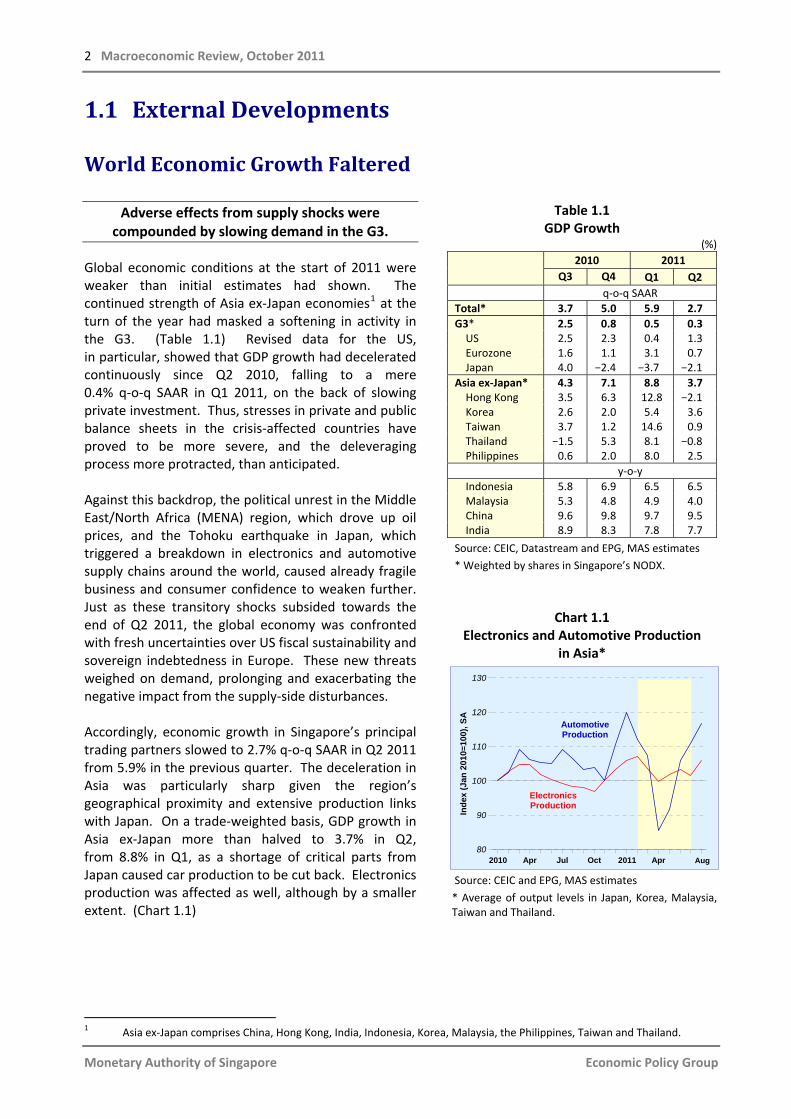
Global economic conditions at the start of 2011 were weaker than initial estimates had shown. The continued strength of Asia ex-Japan economies1 at the turn of the year had masked a softening in activity in the G3. (Table 1.1) Revised data for the US, in particular, showed that GDP growth had deceleratedcontinuously since Q2 2010, falling to a mere 0.4% q-o-q SAAR in Q1 2011, on the back of slowing private investment. Thus, stresses in private and public balance sheets in the crisis-affected countries have proved to be more severe, and the deleveraging process more protracted, than anticipated. Against this backdrop, the political unrest in the Middle East/North Africa (MENA) region, which drove up oil prices, and the Tohoku earthquake in Japan, which triggered a breakdown in electronics and automotive supply chains around the world, caused already fragile business and consumer confidence to weaken further. Just as these transitory shocks subsided towards the end of Q2 2011, the global economy was confronted with fresh uncertainties over US fiscal sustainability and sovereign indebtedness in Europe. These new threats weighed on demand, prolonging and exacerbating the negative impact from the supply-side disturbances. Accordingly, economic growth in Singapore’s principal trading partners slowed to 2.7% q-o-q SAAR in Q2 2011 from 5.9% in the previous quarter. The deceleration in Asia was particularly sharp given the region’s geographical proximity and extensive production links with Japan. On a trade-weighted basis, GDP growth in Asia ex-Japan more than halved to 3.7% in Q2, from 8.8% in Q1, as a shortage of critical parts from Japan caused car production to be cut back. Electronics production was affected as well, although by a smaller extent. (Chart 1.1)
Table 1.1 GDP Growth
(%)
2010 2011
Q3 Q4 Q1 Q2 q-o-q SAAR
Total* 3.7 5.0 5.9 2.7 G3* 2.5 0.8 0.5 0.3 US 2.5 2.3 0.4 1.3 Eurozone 1.6 1.1 3.1 0.7 Japan 4.0 −2.4 −3.7 −2.1 Asia ex-Japan* 4.3 7.1 8.8 3.7 Hong Kong 3.5 6.3 12.8 −2.1 Korea 2.6 2.0 5.4 3.6 Taiwan 3.7 1.2 14.6 0.9 Thailand −1.5 5.3 8.1 −0.8 Philippines 0.6 2.0 8.0 2.5
y-o-y Indonesia 5.8 6.9 6.5 6.5 Malaysia 5.3 4.8 4.9 4.0 China 9.6 9.8 9.7 9.5 India 8.9 8.3 7.8 7.7
Source: CEIC, Datastream and EPG, MAS estimates
* Weighted by shares in Singapore’s NODX.
Chart 1.1 Electronics and Automotive Production
in Asia*
Source: CEIC and EPG, MAS estimates
* Average of output levels in Japan, Korea, Malaysia, Taiwan and Thailand.
1 Asia ex-Japan comprises China, Hong Kong, India, Indonesia, Korea, Malaysia, the Philippines, Taiwan and Thailand.
2010 Apr Jul Oct 2011 Apr80
90
100
110
120
130
Inde
x (J
an 2
010=
100)
, SA
Automotive Production
Aug
Electronics Production

Macroeconomic Developments 3
Monetary Authority of Singapore Economic Policy Group
US consumption was undermined by a fall in durable goods spending.
In the US, real GDP growth recovered to 1.3% q-o-q SAAR in Q2 2011, after levelling off in the first quarter. (Table 1.1) However, private consumption growth slipped to just 0.7% in the same quarter from 2.1% previously, due to a sharp contraction in durable goods spending. (Chart 1.2) The economy was instead supported by broad-based improvements in investment growth—residential investment and fixed expenditures on structures rose, while equipment and software investment remained firm. In addition, the weak US dollar provided a fillip to exports but this was offset, to some degree, by the moderation in global demand. Apart from higher energy prices, consumption growth was further curtailed by an increase in precautionary savings as households reacted to renewed concerns over the labour market. Non-farm payrolls added only 290,000 workers in the second quarter, compared to 497,000 in the first, as the private sector hired fewer workers, and the public sector continued to shed jobs. Despite slower growth in real disposable incomes, the personal savings rate crept back up to 5.1% in Q2. A lacklustre housing market also weighed on sentiment. Although the overall house price index has stabilised, the dispersion of price changes across the US regions was large and uneven, with increases mostly on the East Coast while property values continued to fall in the Midwest and West Coast. (Chart 1.3)
Growth in the Eurozone and Japan fell in Q2.
The Eurozone economy has fallen to “stall speed”2 as GDP growth tumbled to 0.7% q-o-q SAAR in Q2 2011 from 3.1% in Q1. While the exceptional growth in the first quarter reflected special factors such as the bounce-back in construction activity following a harsh winter, the sharp slowdown in Q2 was due to an abrupt weakening of domestic demand. Notably, private consumption was dragged down by the lagged effects of oil price increases. (Chart 1.4) Moreover, concerns were reignited in April over the debt crisis in Greece on fears that budget slippages could lead to imminent debt restructuring—theconsequences of which could be far-reaching financial
Chart 1.2 US Private Consumption Expenditures
Source: US Bureau of Economic Analysis
Chart 1.3 US House Price Indices by Cities
Source: Case-Shiller (Standard & Poor’s)
* Composite-20 is an aggregate index of the 20 major metropolitan areas in the US listed in the chart.
Chart 1.4 Contribution to Eurozone GDP Growth
Source: Datastream
2 “Stall speed” refers to threshold values of GDP growth below which a recession in the next period is likely.
2010 Q2 Q3 Q4 2011 Q2-10
-5
0
5
10
15
20
-10-10
QO
Q S
AA
R %
Gro
wth
Durable goods Non-durable goods Services
NV-
Las
Vega
sTX
-Dal
las
OR
-Por
tland
OH
-Cle
vela
ndA
Z-Ph
oeni
xM
I-Det
roit
CA
-San
Die
goC
A-L
os A
ngel
esFL
-Tam
paC
A-S
an F
ranc
isD
C-W
ashi
ngto
nC
O-D
enve
rG
A-A
tlant
a
NC
-Cha
rlotte
MA
-Bos
ton
FL-M
iam
iIL
-Chi
cago
NY-
New
Yor
kM
N-M
inne
apol
is
WA
-Sea
ttle
-1.0
-0.5
0.0
0.5
1.0
(Apr
-Jun
201
1)A
vera
ge M
OM
% G
row
th
*Com
posi
te-2
0
2009 Q3 2010 Q3 2011 Q2-15
-10
-5
0
5
QO
Q S
AA
R G
row
th%
Poi
nt C
ontr
ibut
ion
to
Private ConsumptionGovernment ConsumptionGFCF
Net ExportsChange in StocksGDP

4 Macroeconomic Review, October 2011
Monetary Authority of Singapore Economic Policy Group
and fiscal contagion across the Eurozone. As a result, retail sales and new car registrations shrank as households, even in the core countries, braced themselves for further belt tightening. At the same time, corporates reduced the pace of investment in the second quarter. Following two quarters of decline, Japan’s real GDP fell again by 2.1% in Q2 on a q-o-q SAAR basis, dragged down by the extensive damage from the earthquake and tsunami. The attendant power shortages caused industrial production and exports to plummet by 14.8% and 18.1% respectively. (Chart 1.5) Not surprisingly, firms held back capital expenditure and consumers became more cautious. Nevertheless, post-quake reconstruction works in the form of public investment spending, which rose by 18.3%, provided some relief.
In Asia ex-Japan, the trade-oriented economies were hit by supply disruptions …
The production stoppages in Japan and anaemic demand from the advanced economies hit GDP growth in the trade-dependent NIE-33 in Q2 2011. However, as anticipated in the April issue of the Review, Taiwan and Korea benefited from the “export substitution” effect arising from overseas customers switching their orders from Japan. (Chart 1.6) These economies have a similar export structure to Japan, in that they ship more consumer and final IT products than components. In contrast, the supply-chain disruptions had a larger impact on the trade of component-producing ASEAN countries such as Thailand and Malaysia, where industrial structures are more complementary to that of Japan. Further, the effects of the common supply shock on growth were aggravated by country-specific factors. In Thailand, negative sentiments arising from uncertainty in the political process weakened consumer spending while implementation delays in infrastructure projects in Malaysia and the Philippines dampened investment.
… while the domestic-oriented economies were relatively resilient.
With the slackening in G3 final demand and a volley of policy tightening measures, China’s economic growth slowed to 9.1% y-o-y in Q3 2011, from 9.5% in Q2 and
Chart 1.5 Japan’s Industrial Production and
Real Exports
Source: CEIC
Chart 1.6 Asian Exports of Final Machinery Goods
Source: World Trade Atlas
Chart 1.7 China’s Money Supply and Loan Growth
Source: CEIC
3 NIE-3 refers to Hong Kong, Korea and Taiwan.
2008 2009 2010 201150
60
70
80
90
100
110
Inde
x (J
an 2
008=
100)
, SA
Real Exports
Aug
Industrial Production
(Mfg)
Mar Apr May Jun2011
80
90
100
110
120
Inde
x (M
ar 2
011=
100)
Malaysia
Taiwan
Korea
Thailand
China
2000 2002 2004 2006 2008 201010
15
20
25
30
35
% Y
OY
(3M
MA
)
Bank Loans
Bank Loans Avg 2000-08 =15.3%
M2
M2 Avg 2000-08 =16.5%
2011Sep

Macroeconomic Developments 5
Monetary Authority of Singapore Economic Policy Group
9.7% in Q1. Concerted moves to rein in excessive credit expansion brought money supply and loan growth back in line with historical norms. (Chart 1.7) Concurrently, industrial production growth moderated to 14.0% y-o-y in Q3 from 14.4% in Q1, amidst rising wages, raw material prices and borrowing costs. However, domestic growth engines, such as fixed investment and retail spending, proved to be resilient. Indonesia expanded at a robust pace of 6.5% in H1 2011, underpinned by strong domestic spending and net exports, which were supported by buoyant commodity prices. (Chart 1.8) Private consumption remained firm, sustained by low interest rates, strong credit growth and higher agricultural earnings. Boosted by public and commodity-based infrastructural expenditures, investment also expanded briskly.
Inflation rose despite softening economic conditions.
In the G3, higher energy prices resulted in headline inflation rising from 1.8% y-o-y in Q1 2011 to 2.5% in Q2. While core inflation increased in the US, it remained relatively subdued in the Eurozone as wage growth was restrained. In Japan, core consumer prices fell by a smaller 0.3% in Q2, following a 0.8% decline in Q1, as deflationary pressures started to dissipate due to energy price increases. (Chart 1.9) Meanwhile, price pressures continued to intensify across Asia ex-Japan, driven largely by higher food and commodity prices, and tight labour markets. Headline CPI inflation in the region rose to 6.1% y-o-y in Q3 2011, from 5.5% in Q1. Nonetheless, there are signs that the upward momentum has slowed and headline rates are starting to stabilise in some countries, particularly Indonesia and Taiwan. Even so, high inflation rates persisted in China and India. (Chart 1.10) The main factor behind the run-up in China has been food price inflation, which exceeded 10% throughout H1 2011 because of weather-related factors and a rise in hog prices. In India, WPI inflation stayed close to double digits during the same period, due partly to higher petroleum prices, increases in the minimum support prices for some agricultural commodities, and strong underlying demand pressures. To curb inflationary pressures, China and India tightened monetary policies several times over the first half of 2011 despite a weakening global outlook.
Chart 1.8 Contribution to Indonesia’s GDP Growth
Source: CEIC
Chart 1.9 G3 Core Inflation
Source: CEIC and Datastream
* Core inflation in Japan only excludes fresh food prices.
Chart 1.10 Asia ex-Japan CPI Inflation*
Source: CEIC and Datastream
* Weighted by 2010 nominal GDP.
** ASEAN-4 refers to Indonesia, Malaysia, the Philippines and Thailand.
2009 Q3 2010 Q3 2011 Q2-5
0
5
10
YOY
Gro
wth
% P
oint
Con
trib
utio
n to
Private ConsumptionGovernment ConsumptionGFCFNet Exports
Change in StocksStatistical DiscrepancyGDP
2009 Jul 2010 Jul 2011-3
-2
-1
0
1
2
3
% Y
OY
Sep
US
Eurozone
Japan*
2007 2008 2009 2010 2011-2
0
2
4
6
8
10
12
% Y
OY
NIE-3
ASEAN-4**
China
India (WPI)
Q3

6 Macroeconomic Review, October 2011
Monetary Authority of Singapore Economic Policy Group
1.2 Domestic Economy
Global Headwinds Confronted the Domestic Economy
A series of external shocks buffeted the Singapore economy, weighing on growth.
The domestic economy witnessed significant swings in performance alongside renewed turbulence in the external environment over the last six months. Following the stellar performance at the beginning of the year, GDP contracted on a q-o-q SAAR basis by 6.3% in Q2 2011, a sharp reversal from the 27% expansion in the preceding quarter. (Chart 1.11) The decline was due to a confluence of factors. In mid-March, the calamities in Japan led to supply shortages in cross-border production networks (CPNs) in the region. As a key node of the CPNs, Singapore saw supply-side disruptions in its manufacturing and trade-related activities in the early months of Q2. While production in the region resumed in the latter part of Q2, trade-related services were further hit by sluggish demand in the advanced economies. Higher oil prices, due in part to political unrest in the MENA region, also started to weigh on final demand in Singapore’s key trading partners in Q2. This was compounded by renewed concerns over the sovereign debt situation in the Eurozone. The weakness continued in Q3. Even though the supply-chain disruptions had largely dissipated, the retraction in global demand, alongside the rapid deterioration in global business and consumer confidence, led to a further slowing of domestic economic activity. According to the Advance Estimates, the Singapore economy recorded marginal growth of 1.3% q-o-q SAAR in Q3. Notably, the bulk of the growth support came from pharmaceuticals.4
Chart 1.11 Singapore’s GDP Growth
* Advance Estimates.
4 Pharmaceutical output recorded 33% q-o-q growth in Q3, as firms shifted to a higher value-added product mix during the
quarter.
2008Q3 2009 2010 2011 Q3*-20
-10
0
10
20
30
40
Per C
ent
QOQ SAAR
YOY

Macroeconomic Developments 7
Monetary Authority of Singapore Economic Policy Group
Exhibit A Economic Activity Index
Source: EPG, MAS Estimates
Exhibit A shows EPG’s monthly Economic Activity Index (EAI).5 The EAI reading indicated that output surged at the turn of this year, on a rise in electronics production, and consolidated in the rest of Q1. Following the Japan earthquake in March, the EAI saw a slight dip in April on slower activity, but rebounded subsequently in May. However, the recovery was short-lived and the index contracted over the next few months as a result of renewed weakness in the external environment.
The IT-related activities bore the brunt of the impact …
As Exhibit A shows, the downshift in domestic economic activity was most evident in the trade-related sectors. In the earlier part of Q2, industries such as electronics and chemicals were temporarily affected by the supply-side disruptions in Japan. Growth in these sectors registered sharp double-digit declines in April in the immediate aftermath of the Tohoku quake, but rebounded subsequently in May. (Chart 1.12) However, following the upward blip in May, the IT-related activities saw steep contractions in June, in line with the correction in the global IT industry. (See Chapter 3 for a more detailed discussion of recent developments and prospects for the global IT industry.)
Chart 1.12 Electronics and Petrochemicals Output
5 See the October 2010 issue of the Review for further details on the Economic Activity Index.
Indicators Global Pickup Japan Effect Global Slowdown
EAI ex-PharmaTrade-related IT Non-ITFinancial SvcsTourism
114
116
118
120
122
Inde
x (2
009=
100)
, SA
EAI ex-Pharma
Positive Growth Flat Growth Negative Growth
Global Pickup Japan Effect Global Slowdo
2011Jan Feb Mar Apr May Jun Jul
wn
Aug
Jun Sep Jan Apr Jun
80
90
100
110
120
Inde
x (J
un 2
010=
100)
, SA
Electronics IIP
Petrochemicals IIP
20112010

8 Macroeconomic Review, October 2011
Monetary Authority of Singapore Economic Policy Group
The weakness in IT-related activities was broad-based across the IT supply chain, ranging from the upstream precision engineering segment, to midstream components, such as semiconductor chips, and to downstream final products, such as PCs and handsets. (Table 1.2) This had spillover effects on the trade-related services, which fell in Q2 and declined further in July and August. In particular, non-oil re-exports contracted for the third straight month in August, as a result of the deterioration in demand for electronics exports from the US and the Eurozone.
Table 1.2 The Domestic IT Supply Chain
Source: EPG, MAS estimates
… in part due to our larger exposure to component manufacturing.
Singapore’s electronics production fell by a sharp 30% over the last two quarters. This was partly due to the domestic product mix. Singapore’s IT sector is concentrated in component manufacturing, which accounts for a hefty 70% of total electronics output, compared to an average of 44% for the region. In general, the global component manufacturing segment tends to be more sensitive to changes in final demand. During the 2009 recession, for instance, global GDP contracted by 3.4% from its pre-crisis peak over three quarters, while final IT demand suffered a larger 6.7% drop over the same period.6 (Chart 1.13) The latter, in turn, had a magnified impact on the semiconductor segment, which saw global chip sales plunge by 29% from its peak in Q3 2008. Inventoryeffects would also have been at work here. During the global recession, inventory destocking did not occur evenly throughout the supply chain. The brunt of
Chart 1.13 Global GDP and IT Demand during the 2009
Global Recession
Source: EPG, MAS estimates
* Global GDP cyclical peak.
6 Final IT demand is proxied by indicators of final IT demand in the US and China.
SectorsManufacturing
(Non-electronics)Manufacturing (Electronics) Wholesale Air Cargo
Products/ Activities
Precision Engineering
Components Final ProductsProcurement,
Testing & Warehousing
Distribution
Jan-Mar
Apr-May
Jun-Aug
Flat Growth Negative GrowthPositive Growth
P-3 P-2 P-1 Peak* P+1 P+2 P+3 P+4 P+570
80
90
100
110
Inde
x (Q
3 20
08=1
00),
SA
Final IT Demand
Global GDP
Global Chip Sales

Macroeconomic Developments 9
the impact fell on the midstream component makers, who experienced the sharpest cutback in production and inventory drawdown. Thus, the recent global semiconductor inventory overhang has led to a disproportionate impact on markets such as Singapore. By the same token, Singapore should see a stronger rebound in electronics output when the inventory adjustment runs its course and final demand picks up again.
There was also some pullback in activity in the financial services sector.
Besides trade-related activities, there were also some retractions in asset market-related activities. In particular, the financial services sector recorded a mild contraction of 0.2% q-o-q SAAR in Q2, following the 28% expansion in the preceding quarter. (Chart 1.14) Debt-related problems in Europe and the US caused jitters for investors worldwide. This also affected average daily turnover volumes in the domestic stock market, which declined by 24% q-o-q. In addition, insurance activity fell as demand across a number of product lines weakened. Sentiment-sensitive activities in the financial services sector saw a further contraction in Q3 as volatility in global financial markets escalated. Regional equity funds experienced a sharp outflow of US$7.1 billion in August after two months of inflows, as fund managers turned defensive and increased cash holdings. (Chart 1.15) Similarly, domestic equity funds, which track global developments closely, have witnessed consecutive months of outflows since May. Mirroring the 22% fall in the MSCI Asia ex-Japan Index, the local bourse saw a corresponding sell-off, with the STI plunging 14% in Q3, marking its largest decline since Lehman Brothers’ collapse in September 2008. While average daily turnover volumes spiked in August on panic selling, they fell 30% m-o-m in September. (Chart 1.16) Amidst heightened risk aversion, companies in Singapore and the region held back on their fund-raising plans. IPO issuance in Singapore to amounted only $150 million in Q3, compared to the $1.4 billion raised in Q2. In Asia, funds raised through equity markets halved to US$14 billion, fromUS$28 billion in the preceding quarter. Lacklustre fund-raising activities, in turn, translated into lower
Chart 1.14 Contribution to Financial Services GDP
Growth
Source: EPG, MAS estimates
Chart 1.15 Fund Flows and Cash Holdings
Source: EPFR Global
Chart 1.16 Stock Market Average Daily Turnover and
Straits Times Index (STI)
Source: SGX
2010 Q2 Q3 Q4 2011 Q2-20
-10
0
10
20
30
40
QO
Q S
AA
R G
row
th%
Poi
nt C
ontr
ibut
ion
to
InsuranceFinancial IntermediationBrokerage & TreasuryAsset Management
Private Banking Others
Financial Services GDP
Jan Feb Mar Apr May Jun Jul Aug2011
-8
-4
0
4
US$
Bill
ion
1.0
1.5
2.0
2.5
% o
f Ass
ets
Man
aged
Asia ex-Japan Equity Funds (LHS)Cash Holdings (RHS)
2010 May Sep 2011 May Sep0.0
0.5
1.0
1.5
2.0
2.5
Bill
ion
2640
2760
2880
3000
3120
3240
Inde
x
Volume, Units (LHS) STI (RHS)
Monetary Authority of Singapore Economic Policy Group

10 Macroeconomic Review, October 2011
Monetary Authority of Singapore Economic Policy Group
fees and commissions for domestic financial institutions, with underwriting income falling by a steep 87% q-o-q in Q3, according to data from Bloomberg. In comparison, financial intermediation remained resilient. Domestic non-bank lending continued to expand, recording its ninth sequential quarter of gains in Q2. In particular, business lending growth accelerated to its fastest on record at 12.0% q-o-q, supported by a steady pipeline of loans extended to all sectors. Loan volumes continued to expand in August, albeit at a slower pace of 6.9%. (Chart 1.17) Likewise, offshore lending activities remained firm in Q2 despite a pullback in lending to Europe, supported by demand from Asia and the Americas. However, the continued deterioration in the advanced economies in Q3 took a toll on business confidence. August data showed that loans extended to the Americas contracted by 4.0%, marking the sharpest sequential decline since September 2010. (Chart 1.18)
Domestic-oriented sectors showed signs of softening.
Aided by a firm labour market, the domestic-oriented sectors continued to post steady growth in H1 2011. Excluding motor vehicles, retail sales accelerated further from 1.9% q-o-q SA in Q1 to 2.3% in Q2 on the back of higher merchandise sales. In particular, discretionary expenditure items, such as electronic peripherals, watches and jewellery recorded stronger sales during the quarter. However, growth in non-vehicle retail sales slowed in Q3, declining by 4.6% m-o-m SA in August after rising by 0.9% in the previous two months, reflecting less buoyant consumer sentiment.
Tourist arrivals strengthened despite the global economic turbulence.
The tourism industry was the star performer over the
last six months. Overall visitor arrivals increased 4.9% q-o-q SA in Q2 after rising 5.6% in Q1. Monthly arrivals in July and August remained above 1.14 million visitors on average, even higher than the record levels achieved in Q2. (Chart 1.19) Alongside stable gains from ASEAN, tourists from North Asian markets such as Hong Kong and Taiwan surged. Consequently, hotel occupancy rose to 88% in Q2 and hovered around 86% in July and August, even as
Chart 1.17 Contribution to DBU Business Lending
Chart 1.18 ACU Non-Bank Lending by Region
Chart 1.19 Average Monthly Visitor Arrivals and Hotel
Occupancy
Source: EPG, MAS estimates
2010 Q2 Q3 Q4 2011 Q2 Aug-5
0
5
10
15
% P
oint
Con
trib
utio
n to
QO
Q G
row
th
Trade-relatedBuilding & Construction
Non-bank FIsOthers
Jan Feb Mar Apr May Jun Jul Aug2011
-8
-4
0
4
8M
OM
% G
row
th
East Asia
The Americas
Europe
Overall
2009Q3 2010 Q3 2011
0.6
0.8
1.0
1.2
Mill
ion,
SA
60
70
80
90
%, S
A
Visitor Arrivals (LHS) Occupancy Rate (RHS)
Jul-Aug

Macroeconomic Developments 11
Monetary Authority of Singapore Economic Policy Group
average room rates continued to trend upwards. With corporate demand staying firm, hoteliers continued to report gains in revenues. The resilience shown in the tourism-related industry in recent months underscores its revival in recent years. MTI has estimated that tourism value-added as a share of nominal GDP grew from 3.0% in 2008 to 3.5% in 2010.7 Aside from the decline during the 2009 Global Financial Crisis, visitor inflows have increased steadily over this period, buoyed by regional tourist arrivals. Visitor arrivals from the G3, meanwhile, remained steady, averaging about 2.2 million per annum over the same period.
Shift-share analysis points to the “external effect” as the primary driver of the surge in
Singapore’s visitor arrivals.
To better understand the trend of growing tourism demand, and benchmark Singapore’s performance against regional tourist destinations such as Hong Kong, Malaysia and Thailand, EPG adopted a variant of the shift-share methodology to decompose the growth of visitor arrivals into three factors: the external effect, the competitive effect and the market-mix effect. Singapore’s visitor arrivals grew by an average of 5.1% over the last decade and hit a record high growth of 20.2% in 2010, excluding the rebound in 2004 after the SARS epidemic. (Chart 1.20) The bulk of the growth last year can be attributed to the external effect, reflecting the attractiveness of the region as a tourist destination.8 In fact, the external effect accounted for more than two-thirds of the 20.2% growth in visitor arrivals last year, higher than its average contribution of 10.2% over the decade. Further disaggregation suggests that this was due to intra-Asian travel which, in turn, was facilitated by the proliferation of budget airlines in the region. (Chart 1.21) The competitive effect, which isolates the growth differential in visitor arrivals into Singapore relative to other economies turned positive in 2010 following a decade of weakness. (Chart 1.20) This coincided with a
Chart 1.20 Decomposition of Singapore’s Growth
in Visitor Arrivals
Source: EPG, MAS estimates
Chart 1.21 Decomposition of the External Effect
Source: EPG, MAS estimates
7 Ministry of Trade and Industry (2010), “The Contribution of Tourism to the Singapore Economy”, Economic Survey of
Singapore. 8 The external effect captures the growth of Singapore’s visitor arrivals arising from developments in the external
environment common to Singapore and regional economies including Hong Kong, Malaysia and Thailand.
2000 2002 2004 2006 2008 2010-20
-10
0
10
20
30
40
% P
oint
Con
trib
utio
n to
Gro
wth
External Effect Competitive Effect Market-Mix Effect
1997 1999 2001 2003 2005 20070
20
40
60
80
100
Per C
ent
OthersG3
Rest of AsiaIndia
ChinaASEAN
2010

12 Macroeconomic Review, October 2011
Monetary Authority of Singapore Economic Policy Group
series of supply-side expansions to enhance Singapore’stourism infrastructure vis-à-vis the rest of the region, including the opening of the Integrated Resorts in 2010. Notably, Singapore topped the region for its quality of tourism and travel infrastructure in the recent World Economic Forum’s Travel & Tourism Competitiveness Index 2011. The market-mix effect highlights Singapore’s ability to attract tourists from high growth markets. As indicated in Chart 1.20, Singapore had seen a negative market-mix effect last year, due to its reliance on visitor inflows from the ASEAN region, which grew at a slower rate compared to the other emerging markets, such as China and India. (Table 1.3 and Chart 1.22) In comparison, Hong Kong saw positive market-mix effects in 2010 as it has a higher share of mainland tourists.
Table 1.3 Share of Visitor Arrivals from Key Source Markets in 2010
(%)
Source Markets
China India ASEAN
Hong Kong 63 1 1 Malaysia 4 3 77 Singapore 10 7 41 Thailand 7 5 28
Source: EPG, MAS estimates
Chart 1.22 Growth in Tourist Inflows into the Region*
by Source Markets in 2010
Source: EPG, MAS estimates
* The region comprises Hong Kong, Malaysia, Singapore and Thailand.
5
10
15
20
25
30
% Y
OY
China India Rest of Asia
Others ASEAN G3 Total

Macroeconomic Developments 13
Monetary Authority of Singapore Economic Policy Group
The immediate outlook is clouded by significant uncertainties.
Amidst the adverse external environment in recent months, the Singapore economy has seen a sharper downshift in activity compared to the rest of the region. (Chart 1.23) This might be explained by Singapore’s stronger dependence on external trade, extensive global financial linkages, and larger exposure to the more volatile electronics and biomedical manufacturing industries. (Table 1.4) Larger swings in growth numbers are thus not entirely unexpected, especially during periods of global economic and financial stress. Nevertheless, higher volatility has not translated into lower average growth rates for Singapore relative to the rest of the region, as shown in Table 1.5. The immediate outlook is thus characterised by a high degree of uncertainty. In particular, developments in the US and the Eurozone will be critical to Singapore’s economic prospects over the next few quarters. This will be further discussed in Chapter 3.
Chart 1.23 Regional GDP Growth in Q2 2011
Source: CEIC
Table 1.4 Singapore’s Global Exposures Compared to
the Region* in 2010 (% of GDP)
Singapore Regional Average
Total Exports 180 60 Electronics Exports 80 20 Offshore Lending 380 70
Source: BIS, CEIC
* The region comprises China, Hong Kong, Indonesia, Korea, Malaysia, the Philippines, Taiwan and Thailand.
Table 1.5 Annual GDP Growth (2000s)
Average Rate
(%)
Standard Deviation (% point)
China 10.5 1.8 India 7.6 1.9 Singapore 5.7 5.0 Indonesia 5.2 0.9 Philippines 4.8 1.9 Malaysia 4.7 2.9 Thailand 4.4 3.0 Korea 4.2 2.0 Hong Kong 4.1 3.6 Taiwan 3.9 3.9
Source: CEIC
Singapore
Hong Kong
Thailan
d
Taiwan
Philippines
Korea-8
-6
-4
-2
0
2
4
0
% Q
OQ
SA
AR

14 Macroeconomic Review, October 2011
Monetary Authority of Singapore Economic Policy Group
1.3 Macroeconomic Policy
Macroeconomic policy in Singapore plays a countercyclical role, while maintaining
a medium-term orientation.
The Singapore economy emerged from recession in Q2 2009, and by Q1 2010, it had recouped all the output lost during the Global Financial Crisis. Price pressures began to build up as resource markets tightened. Given the robust recovery, the authorities began in early 2010 to withdraw the monetary and fiscal stimulus that had been put in place during the crisis. Monetary policy decisions were deliberately calibrated, with the exchange rate providing the effective macroeconomic restraint in order to ensure price stability over the medium term. In April 2010, MAS tightened monetary policy by re-centring the S$NEER policy band upwards and restoring its modest and gradual appreciation path. Monetary policy was tightened further in October via a slightly steeper appreciation of the policy band. The band was also widened slightly to accommodate volatility in international financial markets. Meanwhile, fiscal policy shifted away from the recession relief measures in the FY2009 Budget to more medium term-oriented and productivity-enhancing initiatives. The monetary and fiscal policy stance is proxied by the Domestic Liquidity Indicator (DLI) and the Fiscal Impulse (FI) measure, respectively. 9 Chart 1.24 plots these measures against the output gap. A positive output gap signals that output is above potential, leading to inflationary pressures as the economy faces bottlenecks in meeting demand. Conversely, a negative output gap indicates that the economy is producing below capacity, resulting in the easing of cost and price pressures. Points above the horizontal axis denote a positive output gap and an expansionary policy stance, and vice versa for points below the axis. Movements in the DLI or the FI in the opposite direction to the output gap indicate that macroeconomic policy is countercyclical. It is evident from the chart that the macroeconomic policy stance in Singapore tightened during periods of robust growth, such as recently.
Chart 1.24 DLI, FI and Output Gap
Source: EPG, MAS estimates
9 The DLI reflects changes in the S$NEER and three-month domestic interbank rate. For more details on the methodology
used to calculate the FI measure, see the January 2002 issue of the Review.
1990 1994 1998 2002 2006 2010-4
-2
0
2
4
6
-4
-2
0
2
4
6
% o
f GD
P
Contractionary
% o
f Pot
entia
l GD
P
-1.5
-1.0
-0.5
0.0
0.5
1.0 -4
-2
0
2
4
6
Cha
nge
over
Pre
viou
s Ye
ar Expansionary
% o
f Pot
entia
l GD
P
Contractionary
Expansionary
FI Measure (LHS) Output Gap (RHS)DLI (LHS)
Macroeconomic Developments 15
Monetary Authority of Singapore Economic Policy Group
Monetary Policy
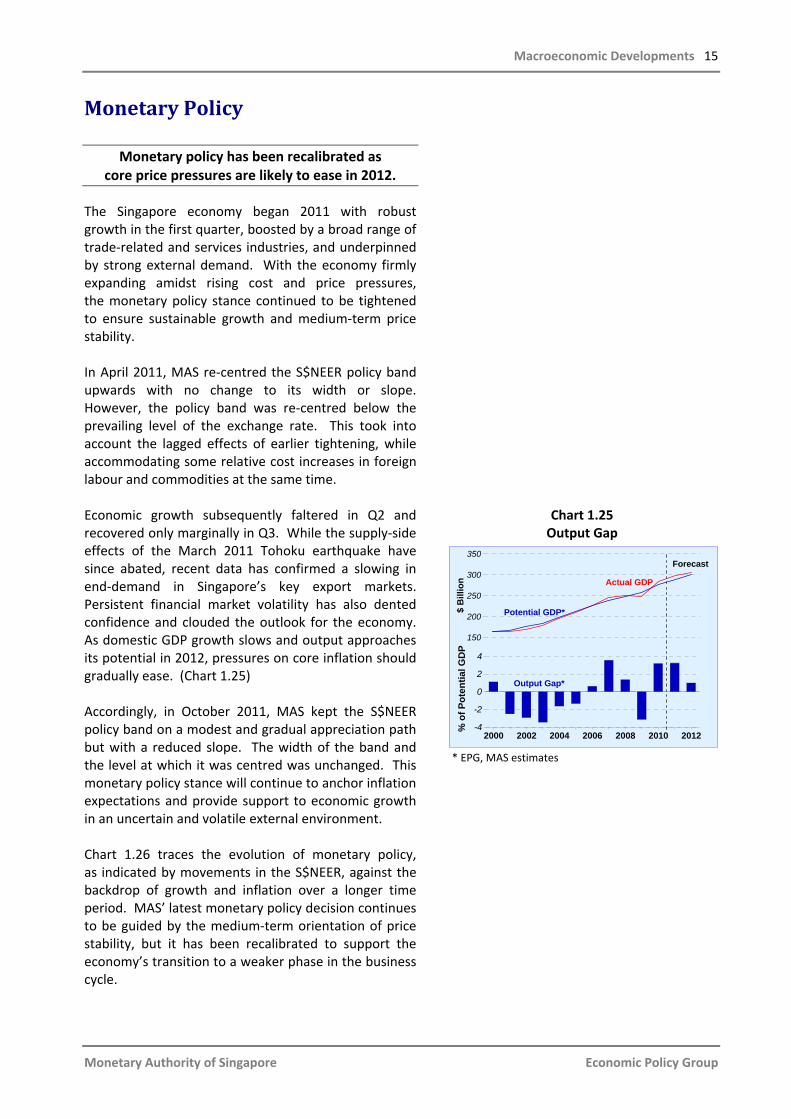
Monetary policy has been recalibrated as core price pressures are likely to ease in 2012.
The Singapore economy began 2011 with robust growth in the first quarter, boosted by a broad range of trade-related and services industries, and underpinned by strong external demand. With the economy firmly expanding amidst rising cost and price pressures, the monetary policy stance continued to be tightened to ensure sustainable growth and medium-term price stability. In April 2011, MAS re-centred the S$NEER policy band upwards with no change to its width or slope. However, the policy band was re-centred below the prevailing level of the exchange rate. This took into account the lagged effects of earlier tightening, while accommodating some relative cost increases in foreign labour and commodities at the same time. Economic growth subsequently faltered in Q2 and recovered only marginally in Q3. While the supply-side effects of the March 2011 Tohoku earthquake have since abated, recent data has confirmed a slowing in end-demand in Singapore’s key export markets. Persistent financial market volatility has also dented confidence and clouded the outlook for the economy. As domestic GDP growth slows and output approaches its potential in 2012, pressures on core inflation should gradually ease. (Chart 1.25) Accordingly, in October 2011, MAS kept the S$NEER policy band on a modest and gradual appreciation path but with a reduced slope. The width of the band and the level at which it was centred was unchanged. This monetary policy stance will continue to anchor inflation expectations and provide support to economic growth in an uncertain and volatile external environment. Chart 1.26 traces the evolution of monetary policy, as indicated by movements in the S$NEER, against the backdrop of growth and inflation over a longer time period. MAS’ latest monetary policy decision continues to be guided by the medium-term orientation of price stability, but it has been recalibrated to support the economy’s transition to a weaker phase in the business cycle.
Chart 1.25 Output Gap
* EPG, MAS estimates
* EPD, internal estimates.2000 2002 2004 2006 2008 2010 2012-4
-2
0
2
4
% o
f Pot
entia
l GD
P 150
200
250
300
350
$ B
illio
n
Potential GDP*
Output Gap*
Actual GDP
Forecast

16 Macroeconomic Review, October 2011
Monetary Authority of Singapore Economic Policy Group
Chart 1.26 Key Macroeconomic Variables and Changes in the Monetary Policy Stance
-10
-5
0
5
10
15
20
2004 2005 2006 2007 2008 2009 2010 2011
% Y
OY
Real GDP Growth
-2
0
2
4
6
8
10
% Y
OY
CPI Inflation
IncreaseSlope Slightly Re-
centreRe-
centre
Q3
Reduce Slope
90
95
100
105
110
115
120
125
Inde
x (Q
1 20
04=1
00)
S$NEER
Increase Slope Slightly & Widen
Band Slightly
Modest & Gradual Appreciation
Modest & Gradual AppreciationNeutral
Policy
Maintain
Re-centre

Macroeconomic Developments 17
Monetary Authority of Singapore Economic Policy Group
The S$NEER fluctuated in the upper half of the policy band until mid-September.
Following the April 2011 policy review, the S$NEER mostly fluctuated in the upper half of the exchange rate policy band. (Chart 1.27) Regional currencies appreciated against the US$ between April and August, as Asia, including Singapore, experienced sustained inflows of global liquidity. The S$NEER reached a peak in early September. From mid-September, however, fears of a sovereign debt default in the peripheral Eurozone countries escalated. With risk aversion on the rise, the S$NEER weakened from the upper half of the policy band to the lower half.
The S$REER has strengthened and exceeded its previous peak in the late 1990s.
The Singapore dollar real effective exchange rate (S$REER) is a measure of the S$NEER adjusted for price and cost differentials between Singapore and its trading partners. Using the CPI as the price deflator, the S$REER is estimated to have risen by 3.5% on a sequential basis in H1 2011. (Chart 1.28) This was primarily due to a strengthening of the nominal exchange rate. Nonetheless, relative CPI also contributed to the S$REER appreciation, as domestic consumer prices rose more rapidly than the foreign CPI this year. Moreover, some of the domestic price adjustments were due to the effects of permanent price shifts reflecting higher resource costs. As of Q2 2011, the S$REER was nearly 9% higher than in Q1 2010, before the MAS embarked on the monetary policy tightening cycle. It had also surpassed its historical peak in Q1 1998 by about 2.9%.
Liquidity conditions continued to tighten until August.
From April to August 2011, the DLI was positive, as overall liquidity conditions tightened alongside the modest and gradual appreciation of the S$NEER. (Chart 1.29) Changes in the DLI were almost entirely driven by the exchange rate component over this period, as the three-month domestic interbank rate was quite stable at about 0.44% but fell to 0.31% in August. (Chart 1.30) As at end-September, the interbank rate declined further to 0.25%, while the
Chart 1.27 S$NEER
Chart 1.28
S$NEER, S$REER and Relative CPI
* EPG, MAS estimates.
Chart 1.29 Domestic Liquidity Indicator
* EPG, MAS estimates.
Jan Jan Jan Jan Jan
95
100
105
110
115
120
Inde
x (5
Jan
200
7=10
0)
Appreciation
Depreciation
200920082007 2010Oct
2011
1985 1991 1997 2003 2011
60
80
100
120
140
160
80
Inde
x (Q
1 19
85=1
00)
S$REER*
S$NEER
Relative CPI*
Appreciation
Depreciation
Q2
Apr Jul Oct Jan Apr Jul
-0.4
-0.2
0.0
0.2
0.4
0.6
Cha
nge
from
Pre
viou
s Q
uart
er Tightening
Easing
Sep2010
Exchange Rate Changes
InterestRate Changes
DLI*
2011

18 Macroeconomic Review, October 2011
Monetary Authority of Singapore Economic Policy Group
S$NEER depreciated sharply. 10 As a result, overall liquidity conditions in the short term eased for the first time since the MAS embarked on the monetary policy tightening cycle in April 2010. Meanwhile, the three-month US$ SIBOR rose from 0.25% in June to 0.37% by end-September. Renewed concerns about financial market stresses in Europe and the US, as well as weaker global growth prospects, led to a shortage of US$ liquidity and higher US$ borrowing costs across international financial markets. As the domestic interbank rate has been falling, the US$-S$ interest rate differential, which has been negative since May 2009, turned positive from late August 2011 to the start of October. In the first week of October, the 3-month domestic interbank rate rose back to 0.44%, given expectations of a looser monetary policy stance in the October policy review. Since US$ interest rates have risen by less, the differential became negative once again. Movements in the 3-month S$ swap offered rate (SOR), which represents the cost of borrowing S$ via a swap out of US$, were similar. The SOR trended down and turned negative in August, reaching a low of −0.70% as expectations of a US$ depreciation against the S$ intensified. When these pressures abated in September, the SOR returned to positive territory and ended the month at 0.19%.
Credit growth picked up in line with low interest rates and sustained economic activity.
The negative SOR rate prompted banks to cease loans pegged to SOR, or introduce new clauses to set a floor for the interest rate. With overall interest rates remaining very low, and given the high levels of activity in the Singapore economy, domestic credit to the private sector continued to expand. (Chart 1.31) Business loan growth was especially robust, and by August, the stock of outstanding loans had risen 39% y-o-y. Loans to a wide range of industries rose, supporting the broad-based expansion in economic activity. Consumer credit growth also remained high at 19% y-o-y in August, as a steady pipeline of housing and other loans this year offset declines in car and share financing loans.
Chart 1.30 Interest and Swap Rates
Chart 1.31 Domestic Credit to the Private Sector
10 As a result of Singapore’s open capital account and the exchange rate-centred monetary policy framework, domestic
interest rates are endogenous, and MAS’ money market operations (MMOs) are not targeted at a specific interest rate level. Instead, MMOs are conducted to ensure there is sufficient liquidity in the banking system to meet banks’ demand for reserve and settlement balances. Box A provides a review of MAS’ MMOs in FY2010/11.
2009 Jul 2010 Jul 2011End of Month
0.00
0.25
0.50
0.75
1.00
1.25
1.50
0.00
% P
er A
nnum
3-month S$ SwapOffered Rate
3-month Domestic Interbank Rate
Sep
3-month US$ SIBOR
2006 2007 2008 2009 2010 2011-10
0
10
20
30
40
YOY
% G
row
th
Domestic Credit to Private Sector
Aug
ConsumerLoans
Business Loans
Macroeconomic Developments 19
Monetary Authority of Singapore Economic Policy Group
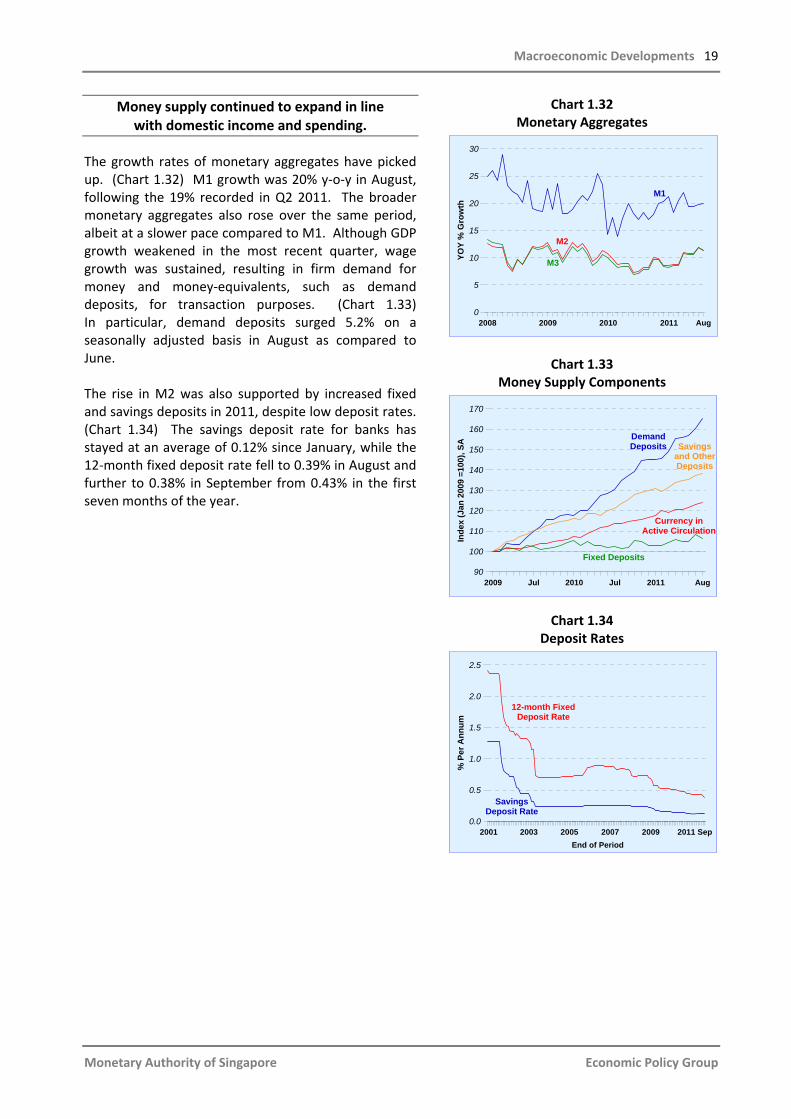
Money supply continued to expand in line with domestic income and spending.
The growth rates of monetary aggregates have picked up. (Chart 1.32) M1 growth was 20% y-o-y in August, following the 19% recorded in Q2 2011. The broader monetary aggregates also rose over the same period, albeit at a slower pace compared to M1. Although GDP growth weakened in the most recent quarter, wage growth was sustained, resulting in firm demand for money and money-equivalents, such as demand deposits, for transaction purposes. (Chart 1.33) In particular, demand deposits surged 5.2% on a seasonally adjusted basis in August as compared to June. The rise in M2 was also supported by increased fixed and savings deposits in 2011, despite low deposit rates. (Chart 1.34) The savings deposit rate for banks has stayed at an average of 0.12% since January, while the 12-month fixed deposit rate fell to 0.39% in August and further to 0.38% in September from 0.43% in the first seven months of the year.
Chart 1.32 Monetary Aggregates
Chart 1.33
Money Supply Components
Chart 1.34
Deposit Rates
2008 2009 2010 2011
0
5
10
15
20
25
30
YOY
% G
row
th
M1
M3
Aug
M2
2009 Jul 2010 Jul 2011
90
100
110
120
130
140
150
160
170
Inde
x (J
an 2
009
=100
), SA
Demand Deposits
Fixed Deposits
Aug
Savingsand OtherDeposits
Currency in Active Circulation
2001 2003 2005 2007 2009 2011 Sep End of Period
0.0
0.5
1.0
1.5
2.0
2.5
% P
er A
nnum
12-month Fixed Deposit Rate
Savings Deposit Rate

20 Macroeconomic Review, October 2011
Monetary Authority of Singapore Economic Policy Group
Fiscal Policy
Government operating revenue increased in the first half of 2011 in line with robust economic growth.
Given strong economic growth in 2010 and early this year, the government’s operating revenue increased from $22.3 billion (15.0% of GDP) in H1 2010 to $25.5 billion (15.8% of GDP) in the first half of 2011. Income tax, GST, property-related taxes, as well as fees & charges were the main contributors to this increase. (Chart 1.35) In H1 2011, the government collected $10.5 billion from income taxes, the largest component of operating revenue, $1.1 billion more than in the same period last year. The bulk of the increase was from corporate taxes, notwithstanding the 20% corporate income tax rebate for YA2011. GST, the second largest contributor, also increased by $0.7 billion from a year ago to $4.5 billion in H1 2011. Among the other revenue components, property tax and stamp duty collections rose by $0.5 billion and $0.2 billion, respectively, in H1 2011 due to the increased valuation of private housing amidst a buoyant property market. In particular, with the shift towards a progressive property tax regime from January 2011, all HDB flat owners and a large majority of private property owners would have paid lower property taxes, while only a minority staying in high-end private property paid more.11 The bulk of the increase in non-tax revenue, i.e. fees & charges, was due to receipts from Certificates of Entitlement (COEs). While new car registrations tumbled by about 36% in H1 2011 compared to a year ago, COE premiums for cars surged 79%. (Chart 1.36)
Chart 1.35 Components of Operating Revenue
Chart 1.36 COE Premiums and New Car Registrations
11 Under the progressive property tax system for owner-occupied residential properties, the first $6,000 of Annual Values
(AV) of a property is exempted from tax. The next tier is taxed at 4%, and the balance of AV in excess of $65,000 at 6%. The property tax structure of non-owner occupied residential properties and other properties remains at a flat rate of 10% of AV.
Income Taxes
GST
Fees & Charges
Assets Taxes
Stamp Duties
Betting Taxes
Motor Vehicle Taxes
0 4 8 12$ Billion
2010 H1 2011 H1
Customs & Excise Duties
2007 2008 2009 2010 20110
2
4
6
8
10
12
Thou
sand
0
12
24
36
48
60
72
0
$ Th
ousa
nd
Average COE Premiums for
Cars (RHS)
Sep
New Car Registrations
(LHS)

Macroeconomic Developments 21
Monetary Authority of Singapore Economic Policy Group
Operating and development expenditure also rose, but by less than revenue.
Overall government spending rose by $2.0 billion to $24.4 billion (15.1% of GDP) in H1 2011, largely driven by the increase in operating expenditure which accounts for about 75% of total government expenditure. These include expenses on manpower, equipment and supplies, as well as operating grants to statutory boards and aided educational institutions to support their day-to-day operations. Operating expenses were $1.7 billion higher at $18.4 billion (11.4% of GDP), with increases recorded across nearly all ministries. In particular, the Ministryof Education recorded the largest expansion on the back of increased funding to institutions of higher-learning. (Chart 1.37) The Ministry of Health also saw a rise in operating spending stemming from the new initiatives in integrated care, as well as manpower recruitment, retention, and training. Meanwhile, the government spent $6.0 billion (3.7% of GDP) on development items in H1 2011, $0.3 billion more than in the first half of 2010. The bulk of the increase was incurred by the Ministry of National Development to fund home upgrading programmes. (Chart 1.38) In contrast, development expenditure in the healthcare sector fell, given the lull in the construction of new medical facilities. After the completion of the Khoo Teck Puat Hospital last year, spending on major construction projects, such as the Jurong General Hospital, will only ramp up in 2012.
The basic balance remained negative.
Overall, the government recorded a primary surplus of $1.1 billion in H1 2011, compared to a small $55 million deficit recorded in the same period a year ago.12 The basic balance similarly improved by about $1.1 billion, to record a smaller deficit of $1.3 billion.13 (Chart 1.39) While the amount of special transfers disbursed in the first half of this year was almost twice that in H1 2010, the bulk comprised contributions to endowment and trust funds, such as the Singapore
Chart 1.37 Selected Components of Operating Expenditure
Chart 1.38 Selected Components of
Development Expenditure
Chart 1.39 Basic Balance
12 The primary surplus/deficit is defined as operating revenue (excluding net investment income/returns contribution) less
the sum of operating and development expenditure. 13 The basic balance is the primary balance plus special transfers but excluding top-ups to endowment and trust funds.
Education
Health
0 2 4 6$ Billion
8
2010 H1 2011 H1
Security & External Relations
Community Development
NationalDevelopment
Transport
Trade & Industry
Education
Health
0.0 0.5 1.0 1.5 2.0$ Billion
2010 H1 2011 H1
National Development
2000 2002 2004 2006 2008
-10
-5
0
5
10
$ B
illio
n
2011H1

22 Macroeconomic Review, October 2011
Monetary Authority of Singapore Economic Policy Group
Universities Trust Fund14, National Productivity Fund and Eldercare Fund, which have no impact on the basic balance.
The fiscal stance is expected to be mildly contractionary in 2011.
In the FY2011 Budget, the government focused on supply-side measures to generate sustainable and inclusive growth over the longer term. In line with the shift of the economy towards productivity-driven growth, it contained measures to spur the upgrading of the workforce, such as the expansion of the Continuing Education and Training Scheme and top-up to the Lifelong Learning Endowment Fund. Schemes to encourage companies to increase productivity were also enhanced, including higher levies on foreign labour, bigger payouts of Productivity and Innovation Credit, and top-ups to the National Productivity Fund. At the same time, the budget provided substantial support to the economically vulnerable (such as lower-income workers and the elderly) through various long-term programmes. It also included short-term relief measures to help households and businesses cope with rising costs. The FI measure, which provides a useful indication of the initial stimulus to aggregate demand arising from fiscal policy, is forecast to be −1.5% of GDP for CY2011. (Chart 1.40) This indicates a mildly contractionary fiscal policy stance compared to the previous year. It is also slightly more contractionary than the earlier estimate (−0.2%), largely reflecting the higher revenue outturn in H1 2011.
Chart 1.40 Fiscal Impulse Measure
Source: EPG, MAS estimates
14 The Singapore Universities Trust Fund was announced at the National Day Rally in August 2010. The government injected
$2 billion into this Fund in March 2011, and matches three-to-one for new donations to the Fund, and 1.5-to-one for existing programmes.
1990 1996 2002 2008-4
-2
0
2
4
% o
f GD
P
-4
-2
0
2
4
% o
f Pot
entia
l GD
P
Fiscal Impulse Measure (LHS)
2011F
OutputGap (RHS)

Macroeconomic Developments 23
Box A Review of MAS Money Market Operations in FY2010/111/
This box reviews the conduct of MAS’ Money Market Operations (MMOs) in FY2010/11. MAS’ MMOs are undertaken to manage liquidity within the banking system and are distinct from the implementation of exchange rate policy, as explained in the monograph on “Monetary Policy Operations in Singapore” published in April 2007. A brief description of how MMOs are conducted is first provided, followed by a review of banks’ demand for cash balances with MAS, the behaviour of autonomous money market factors in FY2010/11, and an examination of the MMOs conducted during this period. A short introduction to MAS Bills, a new MMO instrument introduced in April 2011 after FY2010/11, completes this box. MMOs in Singapore MAS’ MMOs are aimed at ensuring that there is sufficient liquidity in the banking system to meet banks’ demand for reserve and settlement balances, and are not targeted at any level of interest rate or money supply. This is consistent with the principle underlying the open economy trilemma, i.e. domestic interest rates and the money supply are endogenously determined as a result of Singapore’s open capital account and exchange rate-centred monetary policy. MMOs are conducted daily by the Monetary & Domestic Markets Management Department at MAS. The amount of liquidity in the banking system is estimated by taking into consideration the banking sector’s demand for funds and the net liquidity impact of autonomous money market factors. Money market transactions are then carried out, with market and liquidity conditions monitored throughout the day. Banks’ Demand for Cash Balances Banks hold cash balances with MAS to meet reserve requirements and for settlement purposes. Banks in Singapore are required to maintain with MAS a Minimum Cash Balance (MCB) equivalent to 3% of their liabilities base on a two-week average basis. This forms a base demand for cash balances, which MAS takes into account when conducting MMOs. The demand for reserve balances could, however, vary across periods as banks may use their reserve balances to fulfil other regulatory (e.g. liquid asset) requirements. In FY2010/11, banks’ demand for balances to meet reserve requirements grew as a result of the increase in their liabilities base. (Chart A1) The increase in liabilities base, in turn, reflected the continued rise in bank intermediation activity owing to the robust economic growth in Singapore and across Asia.
Chart A1 Average Reserve Requirements over a Two-week Maintenance Period
Mar Jul Sep Nov Jan Mar
Two-week Maintenance Period Beginning
11.5
12.0
12.5
13.0
13.5
S$ B
illio
n
2010 2011May
____________________________________________________________________
1/ This box is contributed by the Monetary & Domestic Markets Management Department at MAS.
Monetary Authority of Singapore Economic Policy Group

24 Macroeconomic Review, October 2011
MAS also takes into account banks’ demand for settlement balances when planning MMOs, apart from meeting banks’ demand for reserve balances. Since the financial crisis, there has been a tendency for banks to hold slightly more liquidity in the form of central bank reserves compared to the pre-crisis period. Patterns in Banks’ Daily Demand for Cash Balances with MAS Although banks are required to keep an average MCB ratio of 3% over the two-week maintenance period, their daily effective MCB ratios can fluctuate between 2% and 4% of their liability base, giving them more flexibility in their liquidity management. As such, there may be day-to-day variations in banks’ demand for cash balances with MAS within each maintenance period. Chart A2 illustrates the daily fluctuations in cash balances within an average maintenance period in FY2010/11. As the chart suggests, banks typically maintain higher cash balances during the start of a maintenance period so as to avoid being caught short of cash towards the end of the period. The daily cash balances required by the banking system during the last few days of a typical maintenance period are, therefore, lower in general. In addition, banks also tend to keep higher cash balances on Fridays (Days 2 and 9 in Chart A2), on the eve of public holidays, around festive seasons, and towards the end of a month or quarter, to cover their positions.
Chart A2 Daily Effective Cash Balances as % of Liabilities Base over a
Typical Two-week Maintenance Period in FY2010/11
Money Market Factors Liquidity Impact of Autonomous Money Market Factors Chart A3 shows the liquidity impact of each of the autonomous money market factors, which include (i) public sector operations, (ii) currency in circulation, and (iii) Singapore Government Securities (SGS) issuance, redemption and coupon payments, over FY2010/11. Public sector operations include the Government’s and CPF Board’s net transfers of funds between their accounts with MAS and their deposits with commercial banks. In FY2010/11, the liquidity impact of the autonomous money market factors was net contractionary, largely arising from public sector operations. Public sector operations were consistently contractionary throughout the year. SGS issuance and redemption was contractionary in Q4 2010, but mildly expansionary in the other quarters as the amount of redemptions exceeded the issuance size in those quarters. The liquidity impact of currency in circulation was negligible.
Monetary Authority of Singapore Economic Policy Group
1 2 3 4 5 6 7 8 9 10 11 12 13 14Day
2.6
2.8
3.0
3.2
3.4
MA
S as
% o
f Lia
bilit
ies
Bas
eA
ggre
gate
Ban
k B
alan
ces
with Thu Mon Wed
Mon
Fri
Wed
Fri

Macroeconomic Developments 25
Chart A3 Liquidity Impact of Autonomous Money Market Factors
2010 Q2 Q3 Q4 2011 Q1
0
Contractionary (-) : Withdrawal of liquidity from banking system
Expansionary (+) : Injection of liquidity into banking system
Public Sector OperationsCurrency in CirculationSingapore Government Securities
MAS’ MMOs took into consideration the daily impact of these autonomous money market factors and MAS’ foreign exchange (FX) intervention operations on liquidity. Over FY2010/11, banks were generally more conservative in their liquidity management, holding an effective cash balance of 3.2–3.3% of their liabilities base on average in most two-week maintenance periods. (Chart A4)
Chart A4
Average Two-week Effective Cash Balances as % of Liabilities Base
Mar Jul Sep Nov Jan Mar
Two-week Maintenance Period Beginning
3.0
3.1
3.2
3.3
3.4
3.5
MA
S as
% o
f Lia
bilit
ies
Bas
eA
ggre
gate
Ban
k B
alan
ces
with
2010 2011May
MMO Instruments
MAS relied on three instruments to inject liquidity into, and withdraw liquidity from, the banking system in FY2010/11, namely, (i) FX swaps or reverse swaps; (ii) SGS repos or reverse repos; and (iii) clean lending or borrowing. Chart A5 illustrates the distribution of MMOs across the instruments as at the end of FY2010/11. A fourth instrument to manage banking system liquidity—MAS Bills—was announced in FY2010/11 but introduced only after the end of the FY. The first issuance took place in April 2011, and the use of MAS Bills has grown steadily since. Although primarily a MMO instrument, MAS Bills can also help meet the demand by banks in Singapore for more high quality, liquid assets.
Monetary Authority of Singapore Economic Policy Group

26 Macroeconomic Review, October 2011
Monetary Authority of Singapore Economic Policy Group
Chart A5 Distribution of MMOs by Instrument
FY 2011/12 (end-Sep 2011)
FX Reverse Swaps
MAS Bills&Borrowings
69%
FX Reverse Swaps
end-FY 2010/11
Borrowings
65%
SGSReverseRepos
2%
34%
29%
SGSReverseRepos
1%

Chapter 2 Wage-Price Dynamics

28 Macroeconomic Review, October 2011
2.1 Labour Market Conditions
Employment Growth Moderated
Job creation slowed but the labour market remained tight.
Singapore’s employment growth moderated in H1 2011. While seasonally weaker demand for hospitality workers was largely responsible for the slowdown in job creation in Q1, the trade-related and sentiment-sensitive industries were the main drags on employment growth in Q2. Despite this, the labour market remained tight, with vacancy rates at recent record levels and unemployment rates below their recent historical averages. (Chart 2.1) Firms responded to the labour shortage by increasing average working hours and raising wages. The services sector saw a sharp slowdown in hiring.
Overall employment gains moderated from a seasonal high of 33,900 in Q4 2010 to 28,300 in Q1 2011 and 24,800 in Q2. (Chart 2.2) The services sector witnessed a sharp slowdown in job creation in the first half of the year, as hotels & restaurants hired only modestly after the year-end festivities. At the same time, the employment boost from the Integrated Resorts dissipated as most of their hiring needs were met in 2010. Wholesale trade and financial services were also more restrained in their headcount expansion given the greater economic uncertainty. Within the business services sector, professional services added 3,000 fewer workers in Q2 compared to the preceding quarter. In manufacturing, the electronics industry started to cut employment in Q1, with job losses accelerating in Q2 as global demand for IT products slowed. Nevertheless, hiring in a number of industries stayed firm. The transport & storage and retail trade industries increased employment on account of higher tourist inflows, while the healthcare industry
Chart 2.1 Unemployment Rates
Chart 2.2 Employment Changes by Sector
Overall Resident0
1
2
3
4
Per C
ent,
SA
2006-10 Average 2011 Q1 2011 Q2
2009 Q3 2010 Q3 2011-40
-20
0
20
40
Thou
sand
Q2
ServicesManufacturingConstruction Overall
Monetary Authority of Singapore Economic Policy Group

Wage-Price Dynamics 29
Monetary Authority of Singapore Economic Policy Group
added strongly to headcount to meet the expansion of hospital facilities. Ancillary services such as information & communications and administrative support were also relatively resilient to the economic slowdown and continued to hire. Concomitantly, even in manufacturing, there was considerable demand for workers in the machinery & equipment and transport equipment segments, which had a high volume of maintenance and repair work from commercial airlines and rig orders from previous quarters. Construction also stepped up hiring throughout H1 2011, supported by a steady stream of public sector infrastructure projects.
Overall, labour supply remained constrained …
Notwithstanding the overall slower pace of employment growth, the labour market remained tight. The headline unemployment rate stayed below its recent five-year average of 2.4% even as it inched up from 1.9% in Q1 2011 to 2.1% in Q2. (Chart 2.1) Similarly, although the resident unemployment rate rose to 3.0% in Q2 2011, it was still lower than the 3.5% average over the last five years. As a result, firms still found it difficult to hire workers and many positions remained unfilled. Reflecting this, the seasonally adjusted overall vacancy rate rose to 3.0% in H1 2011, the highest since 1997. (Chart 2.3) This was despite the resident labour force participation rate reaching a record high of 66.2% in 2010.
… causing firms in some sectors to increase hours of work.
Firms in sectors where labour constraints were more binding raised their average working hours to meet output requirements. This was most evident in hotels & restaurants, construction, retail trade, and transport & storage where overtime work is more widely adopted. These sectors were also likely to have been adversely affected by the tighter foreign worker policy, given their large proportion of low-skilled workers.1 (Chart 2.4a)
Chart 2.3 Job Vacancy Rate
Source: EPG, MAS estimates
Chart 2.4a Average Hours Worked by Sector
Source: EPG, MAS estimates
1 The phasing out of unskilled construction work permit holders began in July 2011. At the same time, a further increase in
foreign worker levies came into effect. In February 2011, MOM also announced that there would be larger increases in levies for the construction and services sectors compared to those for manufacturing. These would take effect from January 2012 with the levies increasing every six months until July 2013.
1997 1999 2001 2003 2005 2007 2009 2011
1
2
3
4
5
Per C
ent,
SA
Q2
2008 2009 2010 201198
100
102
104
106
Inde
x (Q
1 20
08=1
00),
SA
Q2
Construction
Retail Trade
Transport & Storage
Hotels & Restaurants
Real Estate

30 Macroeconomic Review, October 2011
Monetary Authority of Singapore Economic Policy Group
Conversely, there was evidence of increased slack in some of the external-oriented sectors, such as electronics manufacturing, financial services and wholesale trade. Notably, there was a marked decline in average hours worked in electronics manufacturing in Q2 as firms cut back on overtime hours. (Chart 2.4b)
Wage growth was generally stronger in sectors with higher vacancies.
In addition to increasing average hours worked, firms responded to the tight labour supply by raising wages. Resident nominal wages rose by an average of 7.3% y-o-y in H1 2011, or more than twice the average increase in the last five years. The average seasonally adjusted nominal wage is currently about 6.3% above its previous peak in Q1 2008. Nominal wage growth was strongest in sectors where labour shortages were more acute, as indicated by their vacancy rates. (Chart 2.5) The exceptions were wage gains in hotels & restaurants, and administrative & support services. The heavy reliance on foreign labour in hotels & restaurants, and the large share of low-skilled workers in administrative & support services2, likely accounted for the weaker wage growth in these sectors despite their high vacancy rates.
Unit labour costs rose sharply in Q2.
Alongside continuing employment growth, lower output led to a fall in labour productivity in Q2 2011. (Chart 2.6) Together with the strong growth in wages, this resulted in a further pickup in unit labour costs (ULCs), which rose close to its previous peak in Q1 2009.
Chart 2.4b Average Hours Worked by Sector
Source: EPG, MAS estimates
Chart 2.5 Wage Growth and Vacancy Rates by Sector
* EPG, MAS estimates.
Chart 2.6 Unit Labour Costs and Labour Productivity
* EPG, MAS estimates.
2 Security, cleaning and landscape care companies make up a large proportion of employment in administrative & support
services.
2008 2009 2010 201188
92
96
100
104
Inde
x (Q
1 20
08=1
00),
SA
Q2
ElectronicsManufacturing
Non-electronics Manufacturing
Business Services excluding Real Estate
Financial Services
WholesaleTradeCommunity, Social &
Personal Services
1 2 3 4 5
(Per Cent, SA)H1 2011 Average Vacancy Rate*
0
4
8
12
16
(% Y
OY)
H1
2011
Ave
rage
Wag
e G
row
th
Wholesale & Retail
Mfg Fin Svc
ConstructionT&S
Hotels & RestProf Svc
Admin & Support
Info & Com
Real EstateCommunity,
Social & Personal Svc
2008 2009 2010 201185
90
95
100
105
110
115
Inde
x (Q
1 20
08=1
00),
SA
Q2
Unit Labour Costs
Productivity*

Wage-Price Dynamics 31
Monetary Authority of Singapore Economic Policy Group
2.2 Consumer Price Developments
Consumer Price Inflation Was Underpinned by Domestic Factors
Domestic cost pressures were strong …
Domestic price and cost pressures were relatively strong, amidst a high level of resource utilisation. As a result, wage growth stayed strong despite moderating employment growth. Coupled with weaker labour productivity, unit labour costs rose sharply in Q2 2011.
... while external sources of inflation receded.
Singapore’s main import source countries witnessed slower sequential price increases in line with weaker economic growth. (Chart 2.7) However, inflation on a year-ago basis remained elevated in these countries, especially in the regional economies that faced cost pressures in H1 this year. Following sharp increases in Q4 2010 and Q1 2011, Singapore’s Import Price Index has edged down since April, largely due to the recent correction in global oil prices. (Chart 2.8) The 4% appreciation of the trade-weighted S$NEER3 also had a dampening effect on Singapore’s import prices. Nevertheless, import prices in Jul–Aug were on average still 4% higher than a year ago. The previous rounds of policy tightening by MAS since April 2010 have kept imported inflation in check, notwithstanding the strong price pressures emanating from the external front since late last year. Recent econometric work by EPG reaffirmed the relevance of the fairly strong exchange rate pass-through effect for the most recent period and also established the structural stability of this relationship.4
Chart 2.7 Foreign CPI Inflation*
* Weighted by 2010 nominal GDP.
** Asia refers to China, Hong Kong, Indonesia, Korea, Malaysia, Taiwan, Thailand, and the Philippines while Industrial-8 consists of Australia, France, Germany, Italy, Japan, Netherlands, UK and US.
Source: EPG, MAS estimates
Chart 2.8
Import Price Indices
3 Based on the daily average rate in Jan-Sep 2011 compared to the whole of 2010. 4 Chew, J, Ouliaris, S and Tan, S M (2009), “An Empirical Analysis of Exchange Rate Pass-Through in Singapore”, MAS Staff
Paper No. 50. EPG adapted the methodology used in this staff paper and combined the first and second stages of the pass-through approach, allowing for a direct analysis of the effects of the exchange rate on Singapore’s CPI inflation until Q2 2011. The structural stability of the relationship between inflation and its major sources was also assessed by recursive estimations.
2006 2007 2008 2009 2010 2011-1.5
-1.0
-0.5
0.0
0.5
1.0
1.5
2.0
% Q
OQ
, SA
Industrial-8**
Q3
Asia**
2007 2008 2009 2010 201180
90
100
110
120
Inde
x (J
an 2
007=
100)
Overall
Machinery & Equipment
Aug

32 Macroeconomic Review, October 2011
Monetary Authority of Singapore Economic Policy Group
CPI inflation rose sharply in Q3 2011 after easing in Q2.
Given domestic and external cost pressures, both headline CPI inflation and MAS Core Inflation remained elevated. While CPI Inflation, measured on a year-ago basis, moderated from 5.2% in Q1 2011 to 4.7% in Q2, this was entirely due to high base effects associated with car prices in Q2 last year. (Chart 2.9) With car prices recently rising rapidly again, CPI inflation picked up to 5.5% in Q3. MAS Core Inflation, which excludes accommodation and private road transport costs, was lower but also edged up from 1.9% in Q1 to 2.2% in both Q2 and Q3.
Prices also saw rapid sequential increases …
CPI rose sharply on a sequential basis, as compared to the 2006–10 average due to a rapid increase in accommodation costs and car prices. Together, these items accounted for more than two-thirds of the average 1.5% q-o-q rise in the CPI thus far in 2011. MAS Core Inflation has also been higher than in previous years, due in part to the rise in the prices of commodity-related items in the CPI. (Chart 2.10)
… due largely to higher rental values amidst a tight housing market …
Accommodation cost has been on an upward trajectory due to rising rental values of new tenancy contracts.5 (Chart 2.11) This partly reflected the low vacancy rate for private residential property despite a sizeable increase in the number of new units available. 6 HDB rentals rose even faster, suggesting that supply constraints in this segment were even more binding. Overall, accommodation costs accounted for 2.1% points or around two-fifths of CPI inflation in Q3 2011, up from 1.4% points in Q1 this year.
Chart 2.9 CPI Inflation and MAS Core Inflation and
Contributions to CPI Inflation
Chart 2.10 Sequential CPI and MAS Core Inflation
Chart 2.11 CPI Accommodation Cost Inflation
5 The average rental value of the entire stock of leased properties is used to compute the cost of rented accommodation as
well as the imputed costs of owner-occupied housing in the CPI basket. 6 In H1 2011, the net addition to the stock of private residential units was 36% higher than the average for the last five
years.
2007 2008 2009 2010 2011 Q3-2
0
2
4
6
8
to Y
OY
Gro
wth
% P
oint
Con
trib
utio
n
AccommodationPte Rd Trpt ex-PetrolFood
Oil-relatedServicesOthers
CPI InflationMAS Core Inflation
2009 Q3 2010 Q3 2011 Q3-2
-1
0
1
2%
QO
Q
2006-10 Historical Average
CPI Inflation
MAS Core Inflation
2007 2008 2009 2010 2011 Q3100
110
120
130
140
150
Inde
x (Q
1 20
07=1
00)

Wage-Price Dynamics 33
Monetary Authority of Singapore Economic Policy Group
… and sharp increases in COE premiums.
After stabilising at around $50,000 in Jan–May this year, average COE premiums for cars surged to $63,000 in July, before the 3% cut in the COE quota in August. (Chart 2.12) The supply of COEs is now at its lowest since 1999. Given that the vehicle population has risen by nearly 40% since then, the current market is arguably the tightest ever. Thus, COE premiums continued to rise, even as demand for cars weakened, as reflected in the lower number of bids. (Chart 2.13) As a result, the costs of private road transport, excluding petrol, added 1.6% points or around a third to CPI inflation in Q3 this year, compared to 1.3% points in Q2 and 2.2% points in Q1.
Lower global oil prices have had little impact on domestic oil-related prices so far.
Global oil prices, as measured by the West Texas Intermediate (WTI) benchmark, reached US$110 a barrel in April this year, the highest since August 2008, when civil strife broke out in several oil-producing countries. (Chart 2.14) Since then, oil prices have retreated to about US$85 a barrel due to rising concerns about global economic growth prospects, the release of 60 million barrels of emergency stockpiles by the International Energy Agency (IEA) and diminishing geopolitical risks in Libya. While receding global oil prices led to petrol pump operators lowering prices, the cost of other energy-related items in the CPI have barely adjusted. In particular, electricity tariffs, which respond to global oil prices with a lag of one quarter, rose by 6.6% q-o-q in Q3. On the whole, oil-related items added 0.6% point to CPI inflation in Q3 2011, slightly more than the 0.5% point in H1 2011.
Chart 2.12 COE Premiums and Car Quotas
Chart 2.13
Number of Bids Received for Car COEs
Chart 2.14
Global Oil Prices and Domestic Prices of Oil-related Items
*EPG, MAS estimates.
1999 2002 2005 2008 2011Aug0
15
30
45
60
75
90
$ Th
ousa
nd
0
2
4
6
8
10
12
Thou
sand
Average COE Premiums (LHS)Quota of Car COEs (RHS)
2000 2003 2006 20090
5
10
15
20
25
30
Thou
sand
2011Aug
2007 2008 2009 2010 2011 Q350
100
150
200
250
Inde
x (Q
1 20
07=1
00)
WTI Oil Price
Oil-related*

34 Macroeconomic Review, October 2011
Monetary Authority of Singapore Economic Policy Group
Domestic food price increases were muted as global food commodity prices corrected.
After surging by around 40% between June 2010 and February 2011, global food prices have edged down slightly in recent months as weather conditions improved and crop production increased in response to higher prices. The heightened risk aversion amongst commodity traders also dampened speculative activities and hence food commodity prices. Correspondingly, domestic food price increases were relatively muted. (Chart 2.15) On a year-ago basis, food price inflation in Singapore continued to edge up modestly, from 2.7% in Q1 to 3.0% in Q3. Only a small fraction of food items, such as mutton and certain seafood products, saw significant price increases of 10% or more this time around, compared to the commodity price surge in 2007–08.7 (Chart 2.16) There was also a considerable number of items, such as bread and some vegetables, which registered price declines from a year ago. In addition, items with substantial weight in the CPI basket, such as rice and infant milk powder, saw far more moderate price increases compared to 2007–08.
Some services firms held back on fee increases recently.
As noted in Section 2.1, wages grew strongly in H1 this year. Correspondingly, cost pressures for the services sector, which had not been able to raise productivity substantially, were the strongest in recent years. (Chart 2.17) As a result, services cost inflation picked up from 1.5% y-o-y in Q1 to 1.8% in Q2, but subsequently eased to 1.4% in Q3 as some service providers held back from passing on cost increases further, possibly due to the uncertain economic outlook. Reflecting this, sequential price increases for a number of services were more subdued in Q3 2011 compared to the same period last year. (Chart 2.18)
Chart 2.15 Food Price Indices
Chart 2.16
Distribution of Price Changes for Selected Retail Food Items
Chart 2.17
Unit Services Cost Index
Source: EPG, MAS estimates
7 This is based on the list of retail prices found in DOS’ Monthly Digest of Statistics.
2007 2008 2009 2010 2011100
120
140
160
180
Inde
x (J
an 2
007=
100)
90
100
110
120
130
Inde
x (J
an 2
007=
100)
UN FAO Food (LHS)
CPIPrepared
Food (RHS)
Sep
CPI Non-cooked Food (RHS)
<0 0-5 5-10 10-15 15-20 20-25 >25YOY % Price Change
0
10
20
30
Num
ber o
f Ite
ms
Average 2007-08 Jan-Aug 2011
2006 2007 2008 2009 2010 2011Q2100
105
110
115
120
125
Inde
x (Q
1 20
06=1
00)

Wage-Price Dynamics 35
Monetary Authority of Singapore Economic Policy Group
On the whole, despite strong labour cost pressures, services cost inflation has been relatively modest so far. There are a number of reasons for this. First, the removal of the TV and radio license fees lowered services cost inflation by 1% point y-o-y this year. Second, the earthquake and subsequent nuclear crisis that hit Japan dampened demand for overseas travel and resulted in cheaper holiday packages. Finally, competitive pressures in the telecommunications sector have constrained price increases.8
Chart 2.18 Sequential Services Cost Inflation
Q3 2010
Hobbies & Other Misc
Telecommunications
Health ex-Supplies
Personal Care
Household Services
Q3 2011
School/Tuition& Other Fees
Recreation &Entertainment
-2 -1 0 1 2% QOQ
8 The launch of the Next Generation Nationwide Broadband Network (NGNBN) in September 2010, which offers ultra-high
speed broadband access, has put a lid on traditional cable broadband providers’ ability to raise prices. Furthermore, competition within the industry has intensified as seven retail service providers now offer NGNBN services, compared to four cable broadband providers previously.


Chapter 3 Outlook

38 Macroeconomic Review, October 2011
Monetary Authority of Singapore Economic Policy Group
3.1 External Outlook
Global Growth Prospects Dim
The world economy has entered an uncertain phase.
In the six months since the last Review, the outlook for the global economy has been increasingly clouded by economic uncertainty and financial market volatility. Sovereign debt problems in the Eurozone periphery intensified over the summer, while a long-drawn political debate on the fiscal debt ceiling in the US also cast a pall over growth prospects. Investors were unnerved by these developments, precipitating a sell-off in equity markets in early August. While sentiment has improved somewhat in the US following a deficit-reduction deal and slightly more positive economic data, significant concerns remain about the situation in the Eurozone despite some progress on measures to contain the sovereign debt crisis. The close inter-linkages between the US and Europe mean that financial turbulence in one continent quickly spills over to the other and results in amplified effects on the real economy. The trade-oriented Eurozone economies are particularly vulnerable to a slowdown in the US, a key export market that accounts for approximately 11% of the region’s total exports. In addition to financial contagion and a credit crunch, a synchronised downturn in the US and the Eurozone will have serious knock-on effects on the rest of the world via the trade channel. Consequently, consensus forecasts for world economic growth have been revised sharply downwards since April 2011. The latest forecasts indicate that US and Eurozone growth projections for 2012 have been lowered by more than a percentage point, as compared to six months ago. Growth in Asia ex-Japan has also been downgraded, albeit by a smaller amount. (Table 3.1 and Chart 3.1)
Table 3.1 GDP Growth Forecasts
(%) 2010 2011F 2012F
Total* 6.3 4.5 4.4 G3* 2.7 1.2 1.5 US 3.0 1.7 1.9 Eurozone 1.8 1.6 0.6 Japan 4.0 −0.5 2.2 Asia ex-Japan 8.2 6.1 5.7 NIE-3* 7.8 4.7 4.0 Hong Kong 7.0 5.3 4.2 Korea 6.2 3.8 3.8 Taiwan 10.9 4.5 3.8 ASEAN-4* 7.0 5.0 4.9 Indonesia 6.1 6.4 6.1 Malaysia 7.2 4.5 4.3 Thailand 7.8 3.7 4.0 Philippines 7.6 4.4 4.6 China 10.4 9.1 8.5 India** 8.9 7.5 7.9
Source: Consensus Economics Inc.
* Weighted by shares in Singapore’s NODX.
** Forecasts refer to fiscal year ending March.
Chart 3.1 Consensus Forecasts for
World Economic Growth in 2012
Source: Consensus Economics Inc.
US Eurozone Asia ex-Japan0
1
2
3
4
5
6
7
% Y
OY
As of Apr 2011 As of Oct 2011
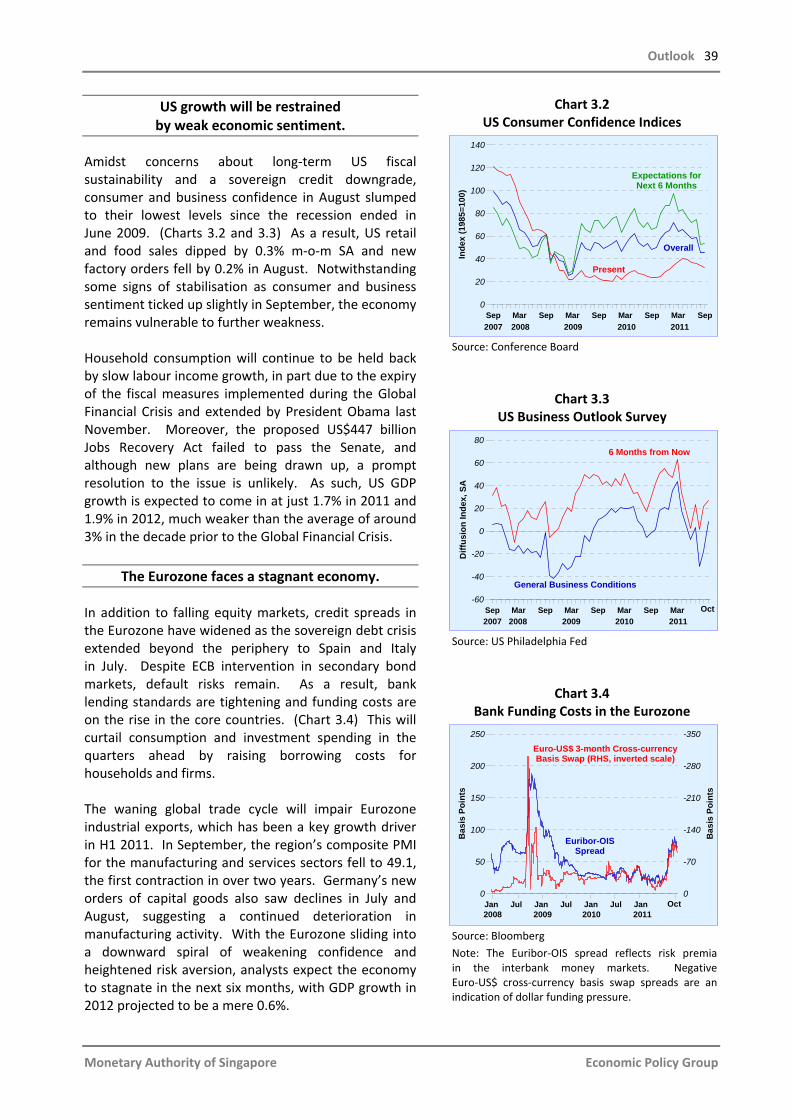
Outlook 39
Monetary Authority of Singapore Economic Policy Group
US growth will be restrained by weak economic sentiment.
Amidst concerns about long-term US fiscal sustainability and a sovereign credit downgrade, consumer and business confidence in August slumped to their lowest levels since the recession ended in June 2009. (Charts 3.2 and 3.3) As a result, US retail and food sales dipped by 0.3% m-o-m SA and new factory orders fell by 0.2% in August. Notwithstanding some signs of stabilisation as consumer and business sentiment ticked up slightly in September, the economy remains vulnerable to further weakness. Household consumption will continue to be held back by slow labour income growth, in part due to the expiry of the fiscal measures implemented during the Global Financial Crisis and extended by President Obama last November. Moreover, the proposed US$447 billion Jobs Recovery Act failed to pass the Senate, and although new plans are being drawn up, a prompt resolution to the issue is unlikely. As such, US GDP growth is expected to come in at just 1.7% in 2011 and 1.9% in 2012, much weaker than the average of around 3% in the decade prior to the Global Financial Crisis.
The Eurozone faces a stagnant economy.
In addition to falling equity markets, credit spreads in the Eurozone have widened as the sovereign debt crisis extended beyond the periphery to Spain and Italy in July. Despite ECB intervention in secondary bond markets, default risks remain. As a result, bank lending standards are tightening and funding costs are on the rise in the core countries. (Chart 3.4) This will curtail consumption and investment spending in the quarters ahead by raising borrowing costs for households and firms. The waning global trade cycle will impair Eurozone industrial exports, which has been a key growth driver in H1 2011. In September, the region’s composite PMI for the manufacturing and services sectors fell to 49.1, the first contraction in over two years. Germany’s new orders of capital goods also saw declines in July and August, suggesting a continued deterioration in manufacturing activity. With the Eurozone sliding into a downward spiral of weakening confidence and heightened risk aversion, analysts expect the economy to stagnate in the next six months, with GDP growth in
012 projected to be a mere 0.6%. 2
Chart 3.2 US Consumer Confidence Indices
Source: Conference Board
Chart 3.3 US Business Outlook Survey
Source: US Philadelphia Fed
Chart 3.4 Bank Funding Costs in the Eurozone
Source: Bloomberg
Note: The Euribor-OIS spread reflects risk premia in the interbank money markets. Negative Euro-US$ cross-currency basis swap spreads are an indication of dollar funding pressure.
Sep Mar Sep Mar Sep Mar Sep Mar Sep
0
20
40
60
80
100
120
140
Inde
x (1
985=
100)
2007 2008 2009 2010 2011
Overall
Present
Expectations for Next 6 Months
Sep Mar Sep Mar Sep Mar Sep Mar
-60
-40
-20
0
20
40
60
80
Diff
usio
n In
dex,
SA
2007 2008 2009 2010 2011
General Business Conditions
6 Months from Now
Oct
Jan Jul Jan Jul Jan Jul Jan Jul
0
50
100
150
200
250
Bas
is P
oint
s
-350
-280
-210
-140
-70
0
Bas
is P
oint
s
2008
Euribor-OIS Spread
Euro-US$ 3-month Cross-currency Basis Swap (RHS, inverted scale)
2009 2010 2011Oct

40 Macroeconomic Review, October 2011
Monetary Authority of Singapore Economic Policy Group
Growth in Japan will pick up on production normalisation and reconstruction spending.
Japan’s near-term economic growth is expected to rebound from the trough in Q1 2011, when the earthquake and tsunami hit. With the restoration of supply chains, industrial production has almost returned to its pre-quake level while exports have fully recovered. Electricity shortages might still arise during the winter season, but their impact will be mitigated by ongoing measures to raise energy efficiency. According to the September BOJ Tankan survey, business conditions will improve further in Q4 2011, but by less than in Q3. (Chart 3.5) The recovery should extend into early 2012, and may receive a further boost if the proposed third supplementary budget, totalling around ¥12 trillion, is passed by the Diet. Of this, about half or 1.3% of GDP is earmarked for reconstruction purposes. On the external front, however, the global economic slowdown, together with the strong yen, will adversely affect exports and business investment.
Asia ex-Japan will be affected by the slowdown in the US and Eurozone …
In the rest of Asia, GDP growth is set to slow on the back of slackening external demand as well as previous monetary tightening. The consensus forecast for the region has been revised down to 6.1% in 2011 and 5.7% in 2012, compared with growth of 8.2% in 2010. (Table 3.1) This prognosis is consistent with the fact that the G3 still accounts for about 60% of final demand for Asia’s goods, while only about one-fifth is destined for markets within the region.1 In fact, the contraction in G3 demand during the Global Financial Crisis had a cascading effect on Asian trade flows as a result of vertically-integrated cross-border production networks in the region.
Chart 3.5 Japan’s Tankan Diffusion Indices
Source: CEIC
Note: The diffusion index is the percentage of favourable responses minus the percentage of unfavourable responses.
1 See Kim, S, Lee, J and Park, C (2010), “The Ties that Bind Asia, Europe and United States”, ADB Economics Working Paper
Series No. 192.
2002 2004 2006 2008 2010
-60
-45
-30
-15
0
15
30
% P
oint
Large Manufacturing
2011Q4F
Large Non- manufacturing

Outlook 41
Monetary Authority of Singapore Economic Policy Group
… although the impact will vary across economies.
The impact of a further slowdown in the US and the Eurozone on individual economies in Asia will vary according to their degree of outward orientation. Economic growth in domestic-oriented China and Indonesia will be cushioned by private consumption and investment spending, which is in turn supported by increases in household income and the pipeline of infrastructure projects. The Chinese economy has also become less reliant on exports. In 2010, net exports accounted for less than one-tenth of GDP growth, compared to a fifth in the years before the Global Financial Crisis. Meanwhile, China’s imports from the region have risen fourfold in the last decade, out of which the share of consumption and capital goods imports used to satisfy domestic demand has risen steadily to 59% in 2010 from 41% in 2000. As such, China is likely to remain a mainstay of regional growth. Manufacturing in China has remained resilient, with the official PMI still in expansion mode in September. (Chart 3.6) Retail sales and fixed asset investment are also growing robustly. The export-driven economies in the region will be most vulnerable to a renewed slowdown in the US and Eurozone, although growth prospects for each country will depend on its export markets and commodity mix. Korea and Taiwan will be shielded, to some extent, by their relatively large share of exports to China. (Chart 3.7) At the same time, reconstruction demand from Japan will boost exports of steel, timber and petrochemicals from the resource-rich ASEAN countries, especially Indonesia and Malaysia. However, electronics producers, such as Malaysia and the Philippines, will be negatively affected by a downswing in electronics demand. (Chart 3.8) In Thailand, near-term growth will be curtailed by the severe floods inundating the country, although forthcoming expansionary fiscal measures and reconstruction spending will help limit downside risks to overall growth.
Chart 3.6 China’s Industrial Production and PMI
Source: CEIC
Chart 3.7 Exports of Selected Asian Economies
by Destination in 2010
Source: CEIC
Chart 3.8 Exports of Selected Asian Economies
by Commodity Type in 2010
Source: CEIC and EPG, MAS estimates
Oct Jan Apr Jul Oct Jan Apr
48
50
52
54
56
58
Inde
x
5
10
15
20
25
30
YOY
% G
row
th
PMI OverallPMI New Export Orders
Industrial Production (RHS)
2009 2010 2011Sep
Taiwan
Korea
Indonesia
Malays
ia
Philippines
Thailan
d0
10
20
30
40
50
60
0
% S
hare
USA EU-15 Japan China
0 5 10 15 20 25 30 35 40Agriculture & Fuel, % Share of Total Exports
0
10
20
30
40
50
60
70
0
Elec
tron
ics,
% S
hare
of T
otal
Exp
orts
Taiwan
Philippines
Indonesia
Malaysia
Thailand
Korea

42 Macroeconomic Review, October 2011
Monetary Authority of Singapore Economic Policy Group
A reversal of capital flows would hurt Asia.
Further volatility in international financial markets also presents a significant downside risk to global growth. Apart from the trade channel, events in the US and Europe could potentially hurt Asian economies through a sudden reversal of capital flows, such as a repatriation of funds by foreign banks, thus causing a tightening in financial conditions and trade credit. There is, however, some scope for Asian policymakers to counter the fallout on the real economy by implementing countercyclical fiscal measures. Indeed, the Philippines recently unveiled a US$1.7 billion package to stimulate growth while Malaysia announced measures to boost domestic demand in its Budget for 2012.
Headline inflation is likely to moderate in Asia although some core price pressures could persist.
As inflationary pressures moderate in tandem with the softening external environment, central banks in the region will have scope to recalibrate the monetary policy stance. Headline inflation is expected to peak this year and moderate gradually going into 2012, partly due to stabilising commodity prices. After two years of rapid expansion, however, capacity constraints in some Asian economies could keep cost pressures elevated in the near term and lead to some downward stickiness in core inflation. (Chart 3.9) Meanwhile, higher rice prices caused by policy adjustments and flooding in Thailand could pose an upside risk to food inflation. Headline inflation in the US and the Eurozone should trend down over the next few quarters, as lower oil and commodity prices feed into the production chain. With a weaker growth outlook, negative output gaps will widen again, thus dampening inflationary pressures. In Japan, price pressures are also expected to remain subdued given the continued slack in the economy.
Chart 3.9 Core Inflation in Selected Asian Countries
Source: CEIC
2009 Jul 2010 Jul 2011-2
0
2
4
6
8%
YO
Y
Sep
Indonesia
Thailand
Korea
Philippines

Outlook 43
Monetary Authority of Singapore Economic Policy Group
3.2 Outlook for the Singapore Economy
Subdued Growth amidst Persistent Global Vulnerabilities
GDP growth is expected to come in at around 5% this year.
Two years after the recovery from the Global Financial Crisis, strong global headwinds once again confront the Singapore economy. The surge in domestic economic activity in the first quarter of the year has given way to an external-led slowdown in the second and third quarters. Chart 3.10 traces the revisions to private sector growth forecasts of the Singapore economy. Following the release of the Advance Estimates in July, which showed a decline in GDP growth in Q2, the median forecast remained unchanged from the 6.0% in June as the supply-chain disruptions arising from the Tohoku earthquake were widely thought to be temporary. However, renewed jitters over the prospect of sovereign debt defaults in the Eurozone cast a shroud of uncertainty over the domestic economic outlook. Consequently, the range of forecasts widened in July. In August, following the slew of negative news from the US and Eurozone, the median growth forecast was revised downwards. In September and October, when high-frequency data confirmed the slowdown in trade-related activities, the median forecast was further downgraded. Singapore’s GDP growth is expected to come in at around 5% in 2011. While some pickup is envisioned next year, the underlying recovery momentum is likely to be modest, due to the structural fragilities in some of Singapore’s major trading partners. Against this backdrop, Singapore’s GDP growth next year could slow to below its potential rate of 3–5%.
Chart 3.10 Consensus Forecasts of Singapore’s
GDP Growth in 2011
Source: Consensus Economics Inc.
5.0
5.2
5.4
5.6
5.8
6.0
6.2
0.4 0.6 0.8 1.0
Wea
ker
Out
look
Increased Uncertainty
Median GDPGrowth Forecast (%)
Jun Jul
Aug
Sep
StandardDeviation
(%)
Oct

44 Macroeconomic Review, October 2011
Monetary Authority of Singapore Economic Policy Group
Singapore is likely to be confronted with strong cyclical headwinds in the immediate quarters.
The outlook for the Singapore economy over the next 15 months can be divided into two phases: stalled growth over the next few quarters, followed by a modest recovery, probably sometime in the latter half of 2012. The first phase depicts the drag on domestic economic activity in the near term due to continued uncertainty and financial volatility in the external environment. Given Singapore’s heavy exposure to global production, trade and financial flows, the economy will not be able to avoid the knock-on effects of the deteriorating external environment and the softening global IT cycle. The manufacturing, transport-hub, financial and tourism services sectors will be disproportionately affected. Moreover, the squeeze on corporate profits could further impact the labour market and consumer sentiment and subsequently spill over into domestic-oriented activities.
The global IT industry will remain lacklustre amidst the midstream inventory overhang
and softening end demand …
The outlook for the global IT industry is a key determinant of the performance of the Singapore economy over the next few quarters. As developments in the global IT industry are closely tied to the broader macroeconomic environment, Table 3.2 links the performance of global GDP to activity in the IT supply chain for the first three quarters of the year. As explained in Section 1.2, the midstream global semiconductor industry has started to contract, alongside the general weakness in the external environment since Q2 this year. Following broad-based contractions across the Americas, Europe and Asia Pacific, global chip sales have declined over the last five months, reversing gains in Q1. (Chart 3.11) Reflecting the inventory overhang, average selling prices for memory chips in the DRAM market have fallen sharply, coming in 20% lower in September compared to March. (Chart 3.12)
Table 3.2 The Global IT Supply Chain
* Based on available Jul–Aug data, where necessary.
** Refers to a ratio of below one.
Chart 3.11 Global Chip Sales by Region
Source: Semiconductor Industry Association
Chart 3.12 Price of 1GB DRAM Chips
Source: DRAMeXchange
QOQ % Growth2011
Q1 Q2 Q3*
Global GDP
Final IT Demand
Developed Markets
Emerging Markets
Global Chip Sales
Semi Book-to-Bill Ratio**
Flat Growth Negative GrowthPositive Growth
2009 2010 2011
-20
-10
0
10
20
30%
Poi
nt C
ontr
ibut
ion
to Q
OQ
Gro
wth
Asia Pacific Japan Europe Americas
Jul-Aug
Sep Jan May Sep
1.0
1.2
1.4
1.6
1.8
2.0
US$
Per
Chi
p
2010 2011

Outlook 45
Monetary Authority of Singapore Economic Policy Group
The weakness in the midstream segment is also evident from the build-up in semiconductor days of inventory (DOI) in Q2, which rose to a record high of 83.4, breaching the 80-day mark for the first time in 12 consecutive quarters. (Chart 3.13) In the aftermath of the Tohoku earthquake, major industry players stocked up aggressively on fears of component shortages. Slowing global demand in the latter half of the quarter, however, resulted in further inventory accumulation. This led firms to cut back on production in Q3, as they sought to unwind their excess inventories. The fall in midstream demand has spilled into the upstream capital equipment segment. Correspondingly, the North American book-to-bill ratio for semiconductor equipment has fallen steadily over the past five months, from 0.98 in April to 0.75 in September, as a result of cutbacks in capacity expansion in the semiconductor industry. (Chart 3.14) In comparison, final demand for IT has shown some signs of a slowdown, rather than an outright contraction, supported by the emerging market segment. More recently, however, end demand from key emerging markets such as China, has started to slow in both the corporate and retail segments. (Chart 3.15) This follows, in part, from the expiration of government subsidies for the trade-in and purchase of electrical appliances. Given the more subdued macroeconomic outlook, the boost from emerging markets could wane in the quarters ahead. Moreover, IT investment from the US corporate sector, which tracks profits fairly well with a lag of 1–2 quarters, could also slow amidst the broader economic weakness. Softening IT final demand could lead to a protracted adjustment in the midstream semiconductor segment, dampening production over the next few quarters. Indeed, IHS iSuppli estimates that global chip stockpiles fell by only 2.5% to 81.3 DOI in the latest quarter.2 Assuming that the reduction in inventory continues at the current rate, it would take at least three more quarters before inventory levels revert to their historical average of around 75 days. Accordingly, the expectation is that the global IT industry could consolidate further in the coming quarters before stabilising sometime in mid-2012.
Chart 3.13 Global Semiconductor Inventories
Source: IHS iSuppli
Chart 3.14 North American Book-to-Bill Ratio for
Semiconductor Equipment
Source: SEMI
Chart 3.15 US and China IT End Demand
Source: CEIC and EPG, MAS estimates
2 According to the latest IHS iSuppli Inventory Insider Report, Issue 5, 2011.
2009 Q3 2010 Q3 2011 Q360
65
70
75
80
85
Day
s of
Inve
ntor
y
2008 2009 2010 2011 Sep0.4
0.6
0.8
1.0
1.2
1.4R
atio
2008 2009 2010 2011
50
100
150
200
250
300
50
Inde
x (Q
1 20
08=1
00),
SA
Jul-Aug
US IT Corporate Sales
US IT Retail Sales
China IT Retail Sales
China IT Corporate Sales

46 Macroeconomic Review, October 2011
Monetary Authority of Singapore Economic Policy Group
… dampening activity in the domestic IT-related sectors.
The subdued profile of the global IT industry will have a significant impact on Singapore’s domestic trade-related industries. Over the last six months, the decline in electronics production has been more severe than that in exports, suggesting that firms have been drawing down inventories to meet their existing orders, which have been on a downtrend since the middle of the year. (Chart 3.16) The weakness in electronics production has had attendant spillover effects on the trade-related sectors. Air cargo volumes, for instance, have fallen for the fifth consecutive month in August, alongside continued declines in electronics re-exports. While the divergence in electronics production and exports will probably narrow over the next few quarters as the inventory destocking process runs its course, the recovery is likely to be muted amidst a generally weak macroeconomic environment.
Asset market-related activities could see a further pullback.
In the financial sector, ongoing worries over economic challenges in the industrialised economies will dominate trading themes in the immediate quarters ahead. Consequently, sentiment-driven activities could continue to perform poorly. In early October, global financial markets weakened substantially, with the S&P 500 Index losing 19% from its peak in April. The STI shed 21% over the same period, plunging to an all-year low of 2,528.71. The CBOE Volatility Index (VIX), a forward-looking indicator, has also remained at elevated levels of above 30 since August, higher than the historical average of 21. 3 This suggests that volatility in global financial markets could persist in the months ahead. (Chart 3.17) Growth in non-bank lending could also see some deceleration. On the domestic front, softer demand for credit from the trade-related segments, which have accounted for 29% of business lending gains in 2011 thus far, will weigh on non-bank loan growth. In addition, offshore lending activity will slow as firms in the region postpone their expansion plans. Tepid sentiment in the advanced economies could also cap the demand for funds.
Chart 3.16 IT-related Activities
Source: EPG, MAS estimates
Chart 3.17 Key Stock Market Indices
Source: Bloomberg
* As of 21 Oct 2011.
3 The CBOE Volatility Index measures investors’ expectations of volatility in the S&P 500 Index over the next 30-day period.
Jan Feb Mar Apr May Jun Jul Aug2011
70
80
90
100
110
Inde
x (M
ar 2
011=
100)
, SA
Electronics IIP
Electronics Re-exports
Air Cargo Handled
Electronics Exports
Jan Apr Jul Oct*2011
80
85
90
95
100
105
110
100
Inde
x (J
an 2
011=
100)
12
18
24
30
36
42
48
Inde
x
S&P 500 (LHS)
VIX (RHS)
STI (LHS)

Outlook 47
Monetary Authority of Singapore Economic Policy Group
The tourism industry could be affected if global weakness persists.
The tourism-related cluster, which has remained resilient thus far, could record more moderate growth should global weakness persist. In particular, business travel could be more adversely hit, as it is more dependent on travellers from the developed economies. Consequently, demand for tourism-related services could soften, especially in the meetings, incentive travel, and conventions & exhibitions (MICE) segment. However, this might be offset, to some degree, by gains in recreational travel. A modest recovery in the latter half of next year is expected as cyclical headwinds gradually recede ...
If external uncertainties subside in the latter half of next year, the Singapore economy will move into the modest recovery phase, with a more discernible pickup in activity. However, the timing and extent of recovery in this phase is extremely uncertain, and hinges heavily on how events in the US and Eurozone unfold. Nonetheless, the pickup will most likely be mild, as long as structural fragilities in the G3 economies linger.
… providing a boost to investor sentiment.
Sentiment-sensitive industries could be the first to see a turnaround in 2012, following a possible bottoming out in investor sentiment, which could prompt investors to reduce their elevated cash positions and channel capital back into asset markets. (Chart 3.18) Meanwhile, the life insurance segment could also see an increase in demand for investment-linked policies if there is a recovery in investors’ risk appetite. An upturn in investor sentiment would see companies reviving their plans for debt and equity issuance. Underlying demand for equity fund raising in Singapore has remained strong, with nearly US$3 billion worth of proposed IPO issuances in the last two quarters put on hold. This would also complement an increase in mergers & acquisitions (M&As) as companies seek new platforms for growth. Indeed, more than half of the M&A deal advisors surveyed expect regional deal olumes to gather pace as market volatility subsides.v
4
Chart 3.18 Share of Global Assets
Source: Reuters Asset Allocation Poll, Sep 2011
4 According to a survey by Clifford Chance/Finance Asia M&A in September 2011.
Jan Mar May Jul Sep2011
49
50
51
52
53
54
55
Per C
ent
3.5
4.0
4.5
5.0
5.5
6.0
6.5
Per C
ent
Equity (LHS)
Cash (RHS)

48 Macroeconomic Review, October 2011
Monetary Authority of Singapore Economic Policy Group
Trade-related activities will benefit from a pickup in global demand ...
Within the manufacturing and trade cluster, activity in the IT-related sectors could see an upturn as the inventory destocking process in the semiconductor segment runs its course, and final demand registers a modest increase alongside the stabilisation in the external environment. The non-electronics clusters, such as chemicals and pharmaceuticals, could also provide support to growth. In addition, the impact of recent transitory shocks, such as the fire outbreak that led to the shutdown of the Shell refinery in Pulau Bukom, is likely to have dissipated.
... as will tourism-related industries.
Regional-oriented services, such as tourism, will also be well placed to provide an additional boost to growth. (See Box B for an in-depth analysis of the underlying drivers of global trade in services). Global visitor arrivals into Southeast Asia are expected to grow apace, expanding by 6–7% in 2012–13. 5 The fast-growing source markets in Asia, such as China and Malaysia, should continue to provide support. (Chart 3.19) For instance, over the next few years, the Chinese market for international travel, already the third largest market by tourist spending, is expected to grow by 17% annually.6 Singapore’s tourism sector will be able to leverage on these developments, given the strong investment and increases in capacity that have come on-stream or are in the pipeline. Several attractions such as the Gardens by the Bay, River Safari at the Singapore Zoo, and new attractions at the Integrated Resorts such as Marine Life Park, are scheduled to open in the latter half of next year. (Table 3.3) The new International Cruise Terminal, which will expand berthing capacity substantially, should also attract more cruise passengers to Singapore.
Chart 3.19 GDP Growth and Visitor Arrivals to
Singapore by Country of Origin in 2010
Source: CEIC and EPG, MAS estimates
Table 3.3 Upcoming Tourist Attractions in Singapore
Attraction Estimated
Completion
Maritime Experiential Museum Q4 2011
Gardens by the Bay (Bay South) 2012
River Safari 2012
International Cruise Terminal 2012
Marine Life Park 2012
Equarius Water Park 2012
Sports Hub 2014
National Art Gallery 2014
5 According to the Pacific Asia Travel Association. 6 Lui, V, Kuo, Y, Fung, J, Jap, W, and Hsu, H (2011), “Taking Off: Travel and Tourism in China and Beyond”, Report by the
Boston Consulting Group; available at: http://www.bcg.com/documents/file74525.pdf
0 2 4 6 8 10 12
(YOY % Growth)GDP
0
10
20
30
40
(YO
Y %
Gro
wth
)Vi
sito
r Arr
ival
s
EU
USBrunei
Japan
India
TaiwanChinaPhilippines
Hong Kong
ThailandMalaysia
IndonesiaSouth Korea

Outlook 49
Monetary Authority of Singapore Economic Policy Group
However, for 2012 as a whole, the Singapore economy could grow below its potential rate.
The Singapore economy is expected to be grow at below potential in 2012, due in part to the near-term weakness of our key trading partners. However, the downturn is unlikely to match the severity of the Global Financial Crisis. The step-up in uncertainties in the external environment over the recent months has tilted the risks clearly towards the downside. Much depends on how events
the US and Eurozone unfold. Should there be a ull-blown crisis in the developed economies, the ingapore economy will be more adversely affected.
infS
Structural Adjustments amidst Cyclical Uncertainties
Medium-term growth will be underpinned by a shift toward higher-value, productivity-driven activities.
The following section highlights some of the necessary adjustments that will be taking place in the Singapore economy over the medium term, notwithstanding the near-term cyclical headwinds. As articulated in the 2010 Report of the Economic Strategies Committee (ESC) and reinforced by recent government budgets, the Singapore economy has to shift towards productivity-driven activities in order to raise real median incomes, create higher-value jobs, and support medium-term economic growth. In a similar vein, the April 2010 Review put forward a case for capital deepening, particularly in machinery equipment & software (MEQ).7
Cross-country comparisons suggest scope for further capital deepening in some industries.
There is clearly some scope to increase the capital-to-labour (K/L) ratio in the domestic economy. A cross-country comparison, which plots the K/L ratio against GDP per capita in 2005 for 93 countries, indicates that Singapore’s estimated K/L ratio is lower than what its level of income would predict. (Chart 3.20) Since the capital data includes residential
Chart 3.20 Capital-to-Labour Ratio and GDP per capita
in 2005 Prices
Source: EPG, MAS estimates, IMF, International Labour Organisation and the World Bank
7 Monetary Authority of Singapore (2010), “Sources of Singapore’s Economic Growth 1990–2009”, Macroeconomic Review,
Vol. IX(1), pp. 66–77.
0 10 20 30 40 50 60 70 80GDP Per Capita, PPP-adjusted (US$ Thousand)
0
100
200
300
400
K/L
Rat
io (2
005
US$
Tho
usan
d)
Hong Kong
Luxembourg
Norway
India
US
Switzerland
Denmark
KuwaitUAE
Japan
Singapore

50 Macroeconomic Review, October 2011
Monetary Authority of Singapore Economic Policy Group
property, the K/L ratio for industrial production would be even lower in a built-up city-state like Singapore. However, the extent of capital deepening could vary considerably across the economy. At the sectoral level, some sectors, such as construction and wholesale & retail trade, appear to have more scope for capital deepening, when benchmarked against the median of selected OECD economies. (Chart 3.21) In comparison, other sectors such as transport & storage already have K/L ratios higher than the sample median. This is not surprising since Singapore is a major transport and logistics hub, and has continuously upgraded its infrastructure and facilities amidst strong competition from the region. The elasticity of substitution, which measures the ease with which capital can be substituted for labour and vice versa, will also differ across sectors.8 The higher the elasticity of substitution, the easier firms can replace labour inputs with capital equipment given changes in relative prices. Sectors which employ more labour-intensive processes, such as construction and hotels & restaurants, could face difficulties when substituting capital for labour. Conversely, sectors which already employ capital-intensive technologies, such as manufacturing, may exhibit a greater ease of substitution. (Table 3.4) Exhibit 3.1 plots the scope for capital deepening against the ease of substituting capital for labour across the major sectors in the domestic economy. The wholesale & retail trade sector offers the most scope for improvement, given its relatively higher ease of substitution and relatively lower K/L ratio. It may be more difficult, however, for sectors such as construction and hotels & restaurants.
Chart 3.21 Sectoral Capital-to-Labour Ratio
Source: EUKLEMS and EPG, MAS estimates
Table 3.4 Elasticity of Substitution by Sector
Sectors Elasticity of Substitution
Manufacturing 0.99** (high) Wholesale & Retail Trade 0.95** (high) Financial 0.67* (average) Hotels & Restaurants 0.21* (low) Construction 0.05* (low) Transport & Storage 0.00 (low)
Source: EPG, MAS estimates
* Statistically significant at the 10% level.
** Statistically significant at the 5% level.
Exhibit 3.1
Matrix for Capital Deepening by Sector
8 Formally, the elasticity of substitution, σ, is equal to the percentage change in capital per worker divided by the
percentage change in relative input prices. To estimate the elasticity of substitution for the major sectors, the following framework was adopted and applied to quarterly data from Q1 1983 to Q4 2010.
α σ ε⎛ ⎞ ⎛ ⎞= + +⎜ ⎟ ⎜ ⎟⎝ ⎠ ⎝ ⎠
Output Price of Labourln
where α is a constant term and ε is a random disturbance term. For more information on the methodology, please see Berndt, E R (1991), The Practice of Econometrics: Classic and Contemporary, Addison-Wesley Publishing Company, Massachusetts, Chapter 9, pp. 449–506.
lnLabour General Price Level t
t t
0
50
100
150
200
250
300
350
(OEC
D M
edia
n=10
0)C
apita
l-to-
Labo
ur R
atio
Singapore
Mfg Constr Hotels& Rest
Wsale& Retail
T&S Fin Svcs
0
50
100
150
200
250
300
350
(OEC
D M
edia
n=10
0)K
/L R
atio
Singapore
Mfg Constr Hotels& Rest
Wsale& Retail
T&S Fin Svcs
UKUK
Japan
Spain
GermanyAustralia
Austria
Austria
Finland
Sweden
DenmarkUSA
Ease of Substitution
Scop
e fo
r Cap
ital D
eepe
ning
High
Low
Low High
Financial
Hotels & Restaurants
Construction
Transport & Storage
Wholesale & Retail
Manufacturing
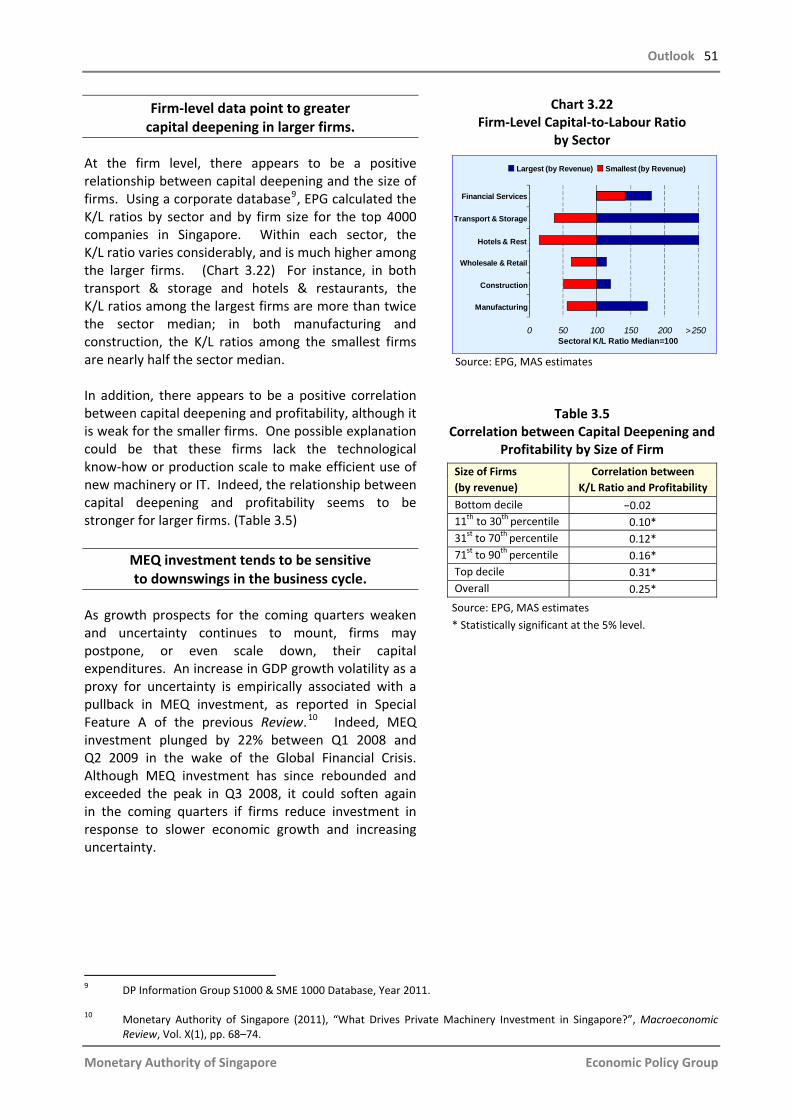
Outlook 51
Monetary Authority of Singapore Economic Policy Group
Firm-level data point to greater capital deepening in larger firms.
At the firm level, there appears to be a positive relationship between capital deepening and the size of firms. Using a corporate database9, EPG calculated the K/L ratios by sector and by firm size for the top 4000 companies in Singapore. Within each sector, the K/L ratio varies considerably, and is much higher among the larger firms. (Chart 3.22) For instance, in both transport & storage and hotels & restaurants, the K/L ratios among the largest firms are more than twice the sector median; in both manufacturing and construction, the K/L ratios among the smallest firms are nearly half the sector median. In addition, there appears to be a positive correlation between capital deepening and profitability, although it is weak for the smaller firms. One possible explanation could be that these firms lack the technological know-how or production scale to make efficient use of new machinery or IT. Indeed, the relationship between capital deepening and profitability seems to be stronger for larger firms. (Table 3.5)
MEQ investment tends to be sensitive to downswings in the business cycle.
As growth prospects for the coming quarters weaken and uncertainty continues to mount, firms may postpone, or even scale down, their capital expenditures. An increase in GDP growth volatility as a proxy for uncertainty is empirically associated with a pullback in MEQ investment, as reported in Special Feature A of the previous Review.10 Indeed, MEQ investment plunged by 22% between Q1 2008 and Q2 2009 in the wake of the Global Financial Crisis. Although MEQ investment has since rebounded and exceeded the peak in Q3 2008, it could soften again in the coming quarters if firms reduce investment in response to slower economic growth and increasing uncertainty.
Chart 3.22 Firm-Level Capital-to-Labour Ratio
by Sector
Source: EPG, MAS estimates
Table 3.5 Correlation between Capital Deepening and
Profitability by Size of Firm
Size of Firms (by revenue)
Correlation between K/L Ratio and Profitability
Bottom decile −0.02 11th to 30th percentile 0.10* 31st to 70th percentile 0.12* 71st to 90th percentile 0.16* Top decile 0.31* Overall 0.25*
Source: EPG, MAS estimates
* Statistically significant at the 5% level.
9 DP Information Group S1000 & SME 1000 Database, Year 2011. 10 Monetary Authority of Singapore (2011), “What Drives Private Machinery Investment in Singapore?”, Macroeconomic
Review, Vol. X(1), pp. 68–74.
0 50 100 150 200 250Sectoral K/L Ratio Median=100
Wholesale & Retail
>
Manufacturing
Construction
Hotels & Rest
Transport & Storage
Financial Services
Largest (by Revenue) Smallest (by Revenue)

52 Macroeconomic Review, October 2011
Capital deepening positions firms for the cyclical rebound, and for productivity-driven growth
in the medium term.
Despite the deteriorating global outlook, it is important for firms with the ability to do so to continue with capital deepening initiatives. Sustained capital spending now could augment their productive capacity and position them favourably for the cyclical rebound. In the longer run, labour market conditions could become more challenging. The resident labour force participation rate is already at a historical high, while restrictions on the hiring of foreign workers will remain tight. Capital deepening would help ease labour market cost pressures on firms and provide innovation dividends over the medium term.
Monetary Authority of Singapore Economic Policy Group

Outlook 53
Monetary Authority of Singapore Economic Policy Group
Box B
Global Trade in Services and its Implications for Singapore1/
There has been a surge in global services trade over the last decade, facilitated by improvements in technology that have transformed services from a largely non-tradable sector—due to constraints imposed by production and proximity to consumers—to one that is increasingly tradable across borders.2/
In Asia, this phenomenon was perhaps most visible in India, which witnessed a “services revolution” in the 2000s. Recent studies have also documented that total factor productivity (TFP) growth in the new service sectors—long thought to be stagnant—could be large enough to be a significant engine of growth.3/ Productivity gains in these sectors can arise from the potential for learning, networking, knowledge spillovers, economies of scale and other externalities. These sources of productivity gains have further underlined the need for investment in infrastructure and human capital for countries to take advantage of the global market in tradable services. This box examines recent trends and growth drivers for services exports, along with shifts in the trade patterns of services. It also explores the implications of the recent boom in services exports for Singapore. Rapid Growth and a Shifting Composition Services exports grew more strongly during the 2000s, compared to the previous two decades. The average annual growth in services exports accelerated to 12% in the 2000s, from 7% in the 1980s and 1990s. (Chart B1) This was a consequence of rapid advances in information and communication technology (ICT), which spurred the fragmentation of services exports and the subsequent specialisation within the services sector itself.
Chart B1 Global Exports of Goods and Services
Source: WTO *2000–08 The unbundling and technological innovation in services gave rise to a host of new tradable services activities, predominantly in the modern services sector comprising financial, business and ICT services. As a result of their more rapid growth, modern services have accounted for the lion’s share of total services exports over the last decade, at 53% in 2009. (Chart B2)
____________________________________________________________________
1/ We are grateful to Sanjay Kalra, IMF Resident Representative, Vietnam and Laos, for his valuable contributions to this box, during his visit to EPG in H1 2011.
2/ See Bhagwati (1984). 3/ See Bosworth and Collins (2008).
1980 1985 1990 1995 2000 2005 20100
200
400
600
800
1000
1200
Inde
x (1
980=
100)
, US$
Services
Goods
1980s 1990s 2000s*0
2
4
6
8
10
12
14
YOY
% G
row
th
Services Goods

54 Macroeconomic Review, October 2011
Chart B2 Breakdown of Services Exports
Chart B3 Breakdown of Modern Services Exports
Source: UN Service Trade
2000 2002 2004 2006 20080
1000
2000
3000
4000
5000
US$
Bill
ion
Traditional Modern Others Services
2009 2000 2002 2004 2006 20080
500
1000
1500
2000
2500
US$
Bill
ion
Financial Business ICT Modern
2009
Note: Other services include construction services, royalties and license fees, personal, cultural and recreational services and government services.
The growth in modern services, in turn, has been driven largely by financial services, which now constitute 62% of modern services exports. (Chart B3) The cross-border reach of financial activities has increased exponentially, boosted by financial sector liberalisation and the increasing fragmentation of job functions. For example, while Morgan Stanley had 110 personnel and one New York office in 1972, it now has 50,000 workers and offices around the globe. Business services, which include legal, accounting, consulting and marketing services, and ICT services have similarly benefited from advances in IT and the trend towards the outsourcing of support functions.
The growth in financial services trade between 2001 and 2008 was principally supported by the advanced economies and a number of high-growth Asian countries.4/ The advanced economies still have the largest market share at 72% on average, although they generally registered lower growth rates than the global average of 11%. The US dominated with a 17% share in financial services, while, in terms of growth China and India led the Asian pack. Singapore also averaged fairly high growth of 23% over the last decade, similar to Ireland.
Traditional services, comprising travel and trade-related services (including commerce and transportation), made up 31% of total services exports over the last decade. (Chart B4) The bulk of growth in this category came from travel services, which averaged 84% of traditional services exports over the decade. The boom in tourism was facilitated by rising levels of disposable income in emerging markets, and by the proliferation of budget airlines in the 2000s.
Chart B4Breakdown of Traditional Services Exports
Source: UN Service Trade
2000 2001 2002 2003 2004 2005 2006 2007 2008 20090
200
400
600
800
1000
1200
1400
US$
Bill
ion
Trade-related Travel Traditional
____________________________________________________________________
4/ Our sample of 103 countries over the period 2001–08 included 29 advanced economies based on the IMF’s classification, 10 Asian economies (China, Hong Kong, India, Indonesia, Malaysia, the Philippines, Singapore, Korea, Taiwan and Thailand), and 64 developing economies.
Monetary Authority of Singapore Economic Policy Group

Outlook 55
Monetary Authority of Singapore Economic Policy Group
While the largest source markets for tourism remain concentrated in the advanced economies, emerging markets are catching up. According to the UN World Tourism Organisation, growth in outbound tourists from Asia and the Middle East grew by 5.6% and 9.9% respectively over the period 2000–10, compared to an average of 2.1% for both Europe and the Americas. In particular, Chinese tourists have emerged as the fastest-growing spenders: expenditure by outbound Chinese visitors has multiplied four times since 2000, propelling China up to third position in the international tourism spending rankings in 2010, just behind Germany and the US. Exports of travel services have similarly been dominated by the advanced economies, followed by Asia and the popular tourism destinations of Mexico and Turkey. The US has an established foothold in travel services exports, commanding a global market share (18%) which is greater than the combined shares of runners-up Spain and France. In Asia, China (4.3%) is the star performer, with Hong Kong and the popular Singapore-Malaysia-Thailand holiday route a step behind. Singapore and Global Services Trade Over the period 2001–09, the growth of Singapore’s services exports at 15% surpassed the world average of 10%. Growth in both traditional and modern services exports was strong, at 13% and 18% respectively. Nevertheless, the share of modern services in overall services exports of 26% was low compared to the global average of 53%. Given Singapore’s advanced infrastructure and human capital, this suggests that there may be some scope to raise both the share of modern services exports and their growth rate. As far as services export destinations are concerned, the share of Asia ex-Japan rose steadily from 25% in 2000 to 28% in 2009 while that of the G3 fell by 4% points to 29% over the same period, as a result of rising incomes and rapid GDP growth in the region. (Chart B5) In particular, services exports to China and India grew rapidly at annual rates of 23% and 21%, respectively. Overall, the growth of exports to Asia ex-Japan was higher than to the G3 for both traditional and modern services, providing a resilient source of external demand during the Global Financial Crisis.
Chart B5Singapore Services Exports: By Category and Destination
Source: DOS and UN Service Trade * G3 proxied by USA and Japan. ** Asia ex-Japan proxied by China, Hong Kong, India and Korea.
Transport Trade-Travel relatedFinancial ICT BusinessOther
2000 2009
Traditional Traditional
ModernModern
33%
25%
42%
2000 2009
G3 Rest of the WorldAsia ex-Japan
28%
29%43%
21%23%
USAJapan
TaiwanMalaysia
Hong KongIndonesiaThailand
KoreaEuropean Union
IndiaChina
0 5 10 15 20 25YOY % Growth (Avg 2001-09)
Total
Traditional
Modern
Total
Traditional
Modern
Total
Traditional
Modern
8 10 12 14 16 18 20 22YOY % Growth (Avg 2001-09)
World
G3*
Asia ex-Japan**
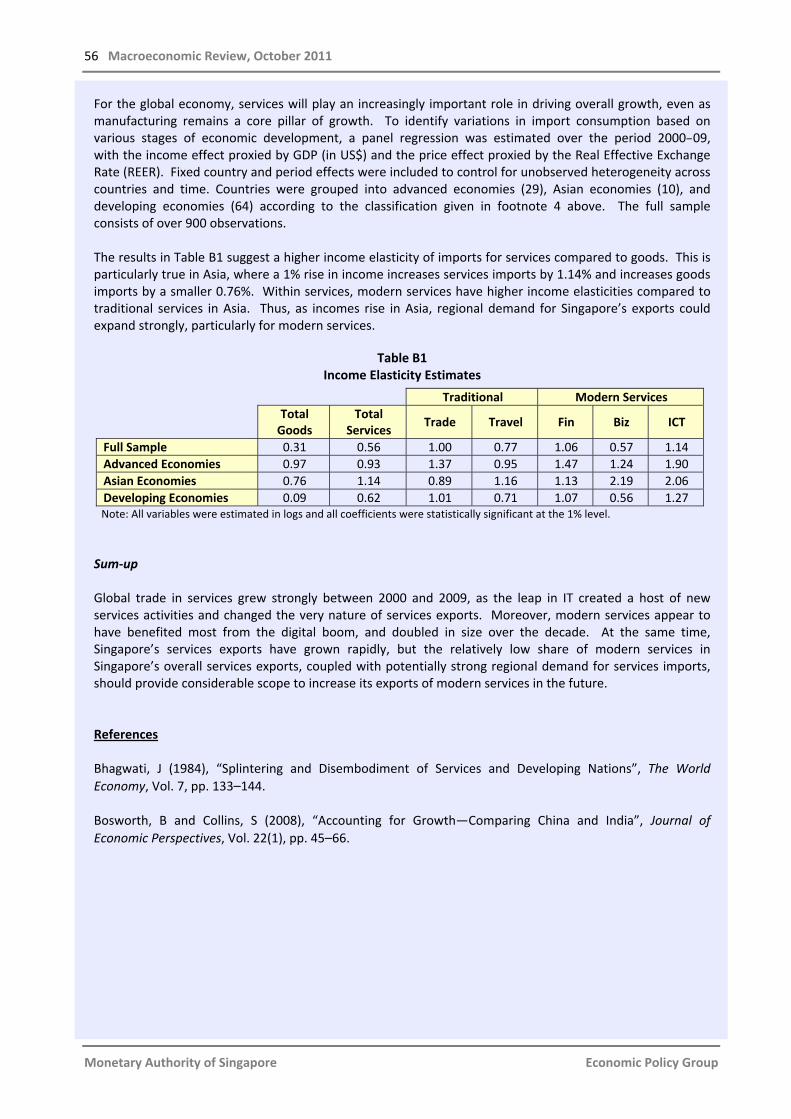
56 Macroeconomic Review, October 2011
For the global economy, services will play an increasingly important role in driving overall growth, even as manufacturing remains a core pillar of growth. To identify variations in import consumption based on various stages of economic development, a panel regression was estimated over the period 2000–09, with the income effect proxied by GDP (in US$) and the price effect proxied by the Real Effective Exchange Rate (REER). Fixed country and period effects were included to control for unobserved heterogeneity across countries and time. Countries were grouped into advanced economies (29), Asian economies (10), and developing economies (64) according to the classification given in footnote 4 above. The full sample consists of over 900 observations. The results in Table B1 suggest a higher income elasticity of imports for services compared to goods. This is particularly true in Asia, where a 1% rise in income increases services imports by 1.14% and increases goods imports by a smaller 0.76%. Within services, modern services have higher income elasticities compared to traditional services in Asia. Thus, as incomes rise in Asia, regional demand for Singapore’s exports could expand strongly, particularly for modern services.
Table B1 Income Elasticity Estimates
Traditional Modern ServicesTotal
Goods Total
Services Trade Travel Fin Biz ICT
Full Sample 0.31 0.56 1.00 0.77 1.06 0.57 1.14Advanced Economies 0.97 0.93 1.37 0.95 1.47 1.24 1.90Asian Economies 0.76 1.14 0.89 1.16 1.13 2.19 2.06Developing Economies 0.09 0.62 1.01 0.71 1.07 0.56 1.27
Note: All variables were estimated in logs and all coefficients were statistically significant at the 1% level.
Sum-up Global trade in services grew strongly between 2000 and 2009, as the leap in IT created a host of new services activities and changed the very nature of services exports. Moreover, modern services appear to have benefited most from the digital boom, and doubled in size over the decade. At the same time, Singapore’s services exports have grown rapidly, but the relatively low share of modern services in Singapore’s overall services exports, coupled with potentially strong regional demand for services imports, should provide considerable scope to increase its exports of modern services in the future. References Bhagwati, J (1984), “Splintering and Disembodiment of Services and Developing Nations”, The World Economy, Vol. 7, pp. 133–144. Bosworth, B and Collins, S (2008), “Accounting for Growth—Comparing China and India”, Journal of Economic Perspectives, Vol. 22(1), pp. 45–66.
Monetary Authority of Singapore Economic Policy Group
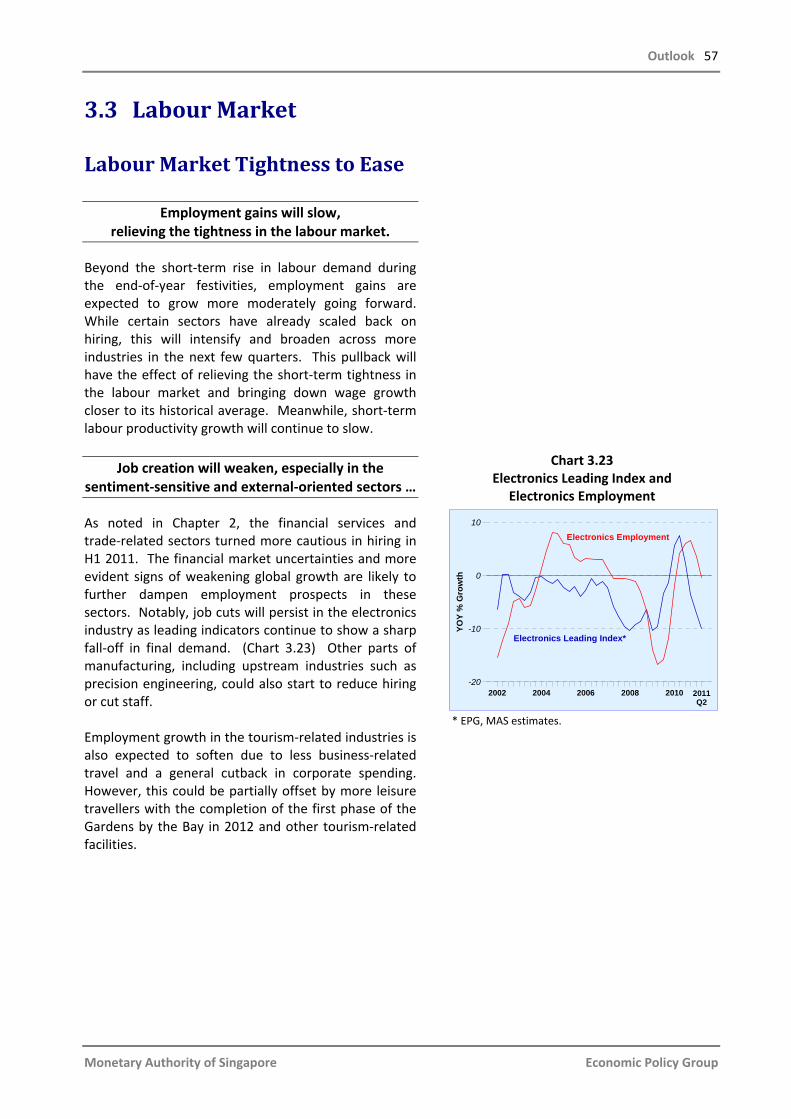
Outlook 57
Monetary Authority of Singapore Economic Policy Group
3.3 Labour Market
Labour Market Tightness to Ease
Employment gains will slow, relieving the tightness in the labour market.
Beyond the short-term rise in labour demand during the end-of-year festivities, employment gains are expected to grow more moderately going forward. While certain sectors have already scaled back on hiring, this will intensify and broaden across more industries in the next few quarters. This pullback will have the effect of relieving the short-term tightness in the labour market and bringing down wage growth closer to its historical average. Meanwhile, short-term labour productivity growth will continue to slow.
Job creation will weaken, especially in the sentiment-sensitive and external-oriented sectors …
As noted in Chapter 2, the financial services and trade-related sectors turned more cautious in hiring in H1 2011. The financial market uncertainties and more evident signs of weakening global growth are likely to further dampen employment prospects in these sectors. Notably, job cuts will persist in the electronics industry as leading indicators continue to show a sharp fall-off in final demand. (Chart 3.23) Other parts of manufacturing, including upstream industries such as precision engineering, could also start to reduce hiring or cut staff. Employment growth in the tourism-related industries is also expected to soften due to less business-related travel and a general cutback in corporate spending. However, this could be partially offset by more leisure travellers with the completion of the first phase of the Gardens by the Bay in 2012 and other tourism-related facilities.
Chart 3.23 Electronics Leading Index and
Electronics Employment
* EPG, MAS estimates.
2002 2004 2006 2008 2010
-20
-10
0
10
YOY
% G
row
th
2011Q2
Electronics Leading Index*
Electronics Employment

58 Macroeconomic Review, October 2011
Monetary Authority of Singapore Economic Policy Group
… though some non-cyclical domestic-oriented sectors will provide support.
Employment in the domestic-oriented industries, in comparison, will be more resilient. Notably, capacity expansion in education & public administration and health & social services will support job creation. Demand for workers is strong in these two industries, which together accounted for 20% of the 55,300 seasonally adjusted job vacancies in Q2 2011, substantially above their 10% share of total employment. (Chart 3.24) Construction employment growth is also expected to remain firm, underpinned by a strong pipeline of public sector and infrastructure projects.
Certain sectors could still face tight labour supply due to changes in foreign worker policy.
Labour supply will expand much slower as several changes to foreign labour policy take effect in January 2012. In particular, the intake of both skilled and unskilled foreigners will be tightened, along with the continuation of the more selective immigration policy that began in 2010. The increase in the foreign population has moderated to 70,000 a year over the last two years compared to 114,000 annually over 2006–09. (Chart 3.25) The slowdown will probably continue into 2012 due to higher foreign worker levies and stricter qualifying criteria for employment-pass holders. Thus, even as demand for workers softens, certain sectors could still face labour shortages if they are unable to substitute foreigners with local workers, or raise the productivity of existing workers.
Productivity in both manufacturing and services dipped in Q2.
Productivity fell in both manufacturing and services in Q2 2011, dragged down by weaker output growth. (Chart 3.26) This situation is likely to persist as firms tend to hoard labour to some extent during a downturn for fear of being unable to hire when economic conditions improve. The fall in average labour productivity will be compounded by a shift in employment creation towards sectors with low measured productivity, such as education and healthcare.
Chart 3.24 Job Vacancies in Education & Public
Administration and Health & Social Services
Chart 3.25 Mid-year Population Changes
Chart 3.26 Labour Productivity by Sector
Source: EPG, MAS estimates
2009 Q3 2010 Q3 20117
8
9
10
11
12
Thou
sand
Q2
2006 2007 2008 2009 2010 2011-100
0
100
200
300
Thou
sand
Singapore CitizensPermanent Residents
Non-residentsOverall
1997 1999 2001 2003 2005 2007 2009 2011
0
10
20
30
40
$ Th
ousa
nd, S
A
6
8
10
12
$ Th
ousa
nd, S
A
Q2
Construction (RHS)
Manufacturing (LHS)
Continuation of pre-recession trend
Services (LHS)

Outlook 59
Monetary Authority of Singapore Economic Policy Group
As the economy slows further, there is a risk that underlying productivity growth may be impaired beyond the cyclical downturn. As observed in Section 3.2, firms may invest less in capital amidst an environment of economic uncertainty, falling profits and tighter credit conditions. Furthermore, as some slack opens up in the labour market, they may delay the adoption of new work processes to improve labour efficiency. Employees will also have less opportunity to upgrade their skills as firms scale back training budgets and remuneration. Nonetheless, trend productivity growth has shown
signs of a pickup in manufacturing and construction.
Abstracting from the current downshift in economic activity, the government’s push for productivity-led growth appears to have yielded some early results. In particular, manufacturing productivity has been above its pre-recession trend for several quarters, suggesting some form of restructuring is taking place.11 (Chart 3.26) For instance, some advanced electronics manufacturing facilities have opened in recent years while the precision engineering segment has taken on more complex activities. The strong performance of pharmaceutical manufacturing has also contributed to the step-up in average output per worker. Meanwhile, productivity growth in construction has picked up modestly, after remaining broadly flat in the last decade, supported by government and industry initiatives to boost productivity.12 In comparison, labour productivity in services continued to remain below trend, weighed down in particular by the retail trade segment. (Chart 3.27)
Chart 3.27 Labour Productivity in the Services Sectors
Source: EPG, MAS estimates
11 The pre-recession trend is calculated by using the average quarterly growth rate from Q1 1998 to Q4 2007 implied by the
Hodrick-Prescott filtered trend of output per worker. 12 For instance, BCA set up the $250 million Construction Productivity and Capability Fund in June 2010, of which $26 million
has been committed to firms for technology adoption and workforce development. In all, about 900 companies have benefited from the scheme, of which 60% are smaller firms.
1997 1999 2001 2003 2005 2007 2009 2011
0
20
40
60
$ Th
ousa
nd, S
A
Q2
Business Services
Financial Services
Hotels & Restaurants
Wholesale & Retail Trade
Continuation of Pre-recession Trend
Other Services

60 Macroeconomic Review, October 2011
Monetary Authority of Singapore Economic Policy Group
Wage growth will slow to around its historical average rate.
In the immediate quarters, the softer labour market will help to contain wage pressures. Historically, wage gains have slowed in tandem with a moderation in employment growth. (Chart 3.28) For the year as a whole, wage growth could slow from around 5.0–6.0% in 2011 to 2.0–4.0% in 2012, which is close to its historical average. The higher CPF employer contribution rates and ceiling that came into effect in September, as well as higher foreign worker levies, mean that firms’ labour costs will inevitably edge up. Together with slowing productivity, this means that unit labour costs will rise further in the next few quarters, albeit at a slower pace.
Chart 3.28 Total Employment Growth and
Nominal Wage Growth
-3 0 3 6 9 12
(% YOY)Total Employment
-10
-5
0
5
10
15
(% Y
OY)
Nom
inal
Wag
e

Outlook 61
Monetary Authority of Singapore Economic Policy Group
3.4 Inflation
CPI Inflation will Moderate
Inflationary pressures will ease in 2012 as economic conditions weaken.
The expected slowdown in economic activity, signalled by a gradual narrowing of the positive output gap, will have a restraining effect on domestic costs and prices in 2012. The strong positive correlation between the changes in the output gap and inflation is borne out by historical data. (Chart 3.29) Indeed, the rapid switch in the output gap from positive to negative during the recent Global Financial Crisis produced a corresponding fall in inflation. This suggests that the prices of most items in the CPI basket are sensitive to the business cycle, i.e. they have procyclical characteristics. In an economic downturn, prices tend to moderate either because demand has fallen off or because cost pressures have eased. In Singapore’s case, consumer prices tend to respond quickly to changes in demand. In comparison, wage adjustments tend to lag the business cycle by two quarters on average, and the pass-through to prices, particularly in services, will also take time. With the expected slowdown in the economy, prices of cyclically-sensitive items, such as recreation services, are likely to decline. (Chart 3.30) Domestic cost pressures will abate as the tightness in the labour market gradually eases. As such, the price increase of non-cyclical items that are driven more by wage costs, such as education and healthcare services, will moderate. Meanwhile, price pressures from external sources, such as oil, are likely to subside as global growth slows. Thus, a broad range of consumer goods and services are set to witness more modest price increases or even price declines going forward. Accordingly, MAS Core Inflation on a year-ago basis should gradually ease from Q2 2012. However, accommodation costs and car prices will remain sticky in the near term, given continuing supply constraints. This will keep headline CPI inflation high for the rest of 2011 and into the early part of 2012 before falling more significantly in the second half of the year.
Chart 3.29 Output Gap, CPI Inflation and
MAS Core Inflation
Chart 3.30 Contributions to the Decline in CPI during
Previous Downturns
Source: EPG, MAS estimates
2006 2007 2008 2009 2010 2011Q2-6
-4
-2
0
2
4
6
8
% o
f Pot
entia
l GD
P
-3
-2
-1
0
1
2
3
4
% Q
OQ
Output Gap (LHS) MAS Core (RHS)CPI (RHS)
IT Downturn-2.5
-2.0
-1.5
-1.0
-0.5
0.0
0.5
% P
oint
Con
trib
utio
n
Non-cyclical ServicesFoodOthers
Pte Rd Trpt ex-PetrolCyclical Services
AccommodationOil-related
Asian Financial Crisis
Global Financial Crisis

62 Macroeconomic Review, October 2011
Monetary Authority of Singapore Economic Policy Group
The overall increase in services fees will slow.
The costs of sentiment-sensitive services, such as holiday travel and entertainment, are likely to fall, as consumers turn cautious and business cost pressures ease. The decline in the most recent Nielsen Consumer Confidence Index is indicative of consumers’ plans to cut back on discretionary spending over the next few quarters, which will in turn dampen price increases. (Chart 3.31) However, the costs of non-cyclical services, such as education and healthcare, could increase further, albeit at a more moderate rate. This is due to resilient consumer demand for these types of services and sticky wages arising from a general shortage of manpower, even during an economic slowdown.
Oil-related items will contribute negatively to inflation in 2012 …
Global oil prices, as measured by the WTI benchmark, dipped to around US$85 recently. Further, IEA, the US Energy Information Agency (EIA), and OPEC have all cut their forecasts for global oil consumption growth in 2012. OECD oil consumption is forecast to decline further in 2012 from the current level, which is itself already around 10% lower than that before the Global Financial Crisis. (Chart 3.32) The expected incremental oil demand from the emerging economies has also been shaved down. However, a repeat of the 2008–09 collapse in prices is unlikely as the oil market is still generally tight because of the loss of Libya’s output.13 Global oil prices could therefore remain close to current levels for the next few months until some of Libya’s output is restored, averaging slightly below US$90 in 2012, compared to around US$95 in 2011. (Chart 3.33) Hence, direct oil-related items will contribute negatively to inflation next year.
Chart 3.31 Nielsen Consumer Confidence Index:
Singapore
Chart 3.32 Incremental Demand for Oil
Source: EIA
Chart 3.33 WTI Oil Price
Source: Bloomberg
13 Libya’s pre-war oil output of 1.6 million barrels per day constituted around 40% of OPEC’s surplus productive capacity in
2010. International agencies’ projections of the resumption of Libya’s oil production differ significantly. OPEC expects Libya to restore two-thirds of its production within six months and return to full production within 12–18 months. Meanwhile, IEA projects Libya’s production to grow only marginally by the end of this year and by almost 75% at the end of 2012. EIA expects only half of Libya’s pre-disruption production to resume by end-2012.
2007 2008 2009 2010 2011Q270
80
90
100
110
120
Inde
x
2007 2008 2009 2010 2011 2012-3
-2
-1
0
1
2
3M
illio
n bp
d
Non-OECD OECD
Forecast
2007 2008 2009 2010 2011 201240
60
80
100
120
140
US$
Per
Bar
rel
Nymex Spot Price Futures
Q4
Forecast

Outlook 63
Monetary Authority of Singapore Economic Policy Group
… while food prices will continue to rise, albeit more moderately.
Global food prices, as measured by the FAO food price index, have also corrected somewhat as global growth slowed. During the Global Financial Crisis in 2008–09, for example, the index slumped by close to 40% in eight months. Nonetheless, a number of commodities continue to display significant price pressures. In particular, export prices of Thai white rice have surged as farmers hoarded stocks after the Thai Government promised to purchase their harvests at a 40% premium to the prevailing market price in October. (Chart 3.34) Severe monsoon floods in several Asian countries, such as Thailand and Pakistan, as well as the expected re-emergence of the La Niña weather phenomenon later this year, will also dampen grain crop yields.14 On balance, domestic food prices will continue to rise but modestly. For the whole year of 2012, food price inflation is expected to come in slightly below the outcome in 2011.
Rental increases will continue given supply constraints in the HDB segment.
Despite the economic uncertainty, accommodation cost inflation will be sticky in the near term, given strong housing demand arising from the continued inflow of foreigners and the current tight supply. HDB rents, in particular, have seen sharp increases due to supply shortages. HDB’s residency requirement implies that only HDB flats built in 2007 or earlier can potentially be added to the leasing market in the next year.15 However, net additions to the stock of HDB flats was modest over 2002–09 due to the slowdown in construction since the early 2000s. (Chart 3.35) Hence, the number of HDB flats that can be added into the rental market will remain low in the near term.
Chart 3.34 Thai Grade B 100% White Rice Price
Source: Bloomberg
Chart 3.35 Change in Stock of HDB
and Private Residential Units
14 The Australian Bureau of Meteorology and US National Weather Service have reported that a second wave of La Niña
effects is expected during the coming northern hemisphere winter. If so, current indicators suggest that it will be weaker than that in 2010–11.
15 For owners to sublet the entire flat, they typically need to satisfy the condition of a five-year Minimum Occupation Period.
Mar2009 2010 2011
60
80
100
120
140
160
Inde
x (M
ar 2
008=
100)
Jan Jan Jan Sep2008
1993 1996 1999 2002 2005 2008-10
0
10
20
30
40
50
Thou
sand
HDB Private
2010

64 Macroeconomic Review, October 2011
Monetary Authority of Singapore Economic Policy Group
In contrast, the number of private residential units to be completed in 2012 is expected to be twice the five-year historical average. These can be added to the rental market quickly and will help to ease the current tightness in the market. Overall, leasing contracts will continue to be renewed at values that are higher than those under previous contracts. As such, accommodation costs in the CPI will register increases on a year-ago basis until the end of 2012 and account for around half of CPI inflation for the whole year. COE premiums will remain elevated due to further
tightening of the vehicle population policy.
With the poorer economic outlook, the demand for new cars will be weak. Indeed, the number of COE bids submitted has fallen by another 8% in September. In particular, demand from the taxi companies, which has helped to prop up COE premiums in the past, has eased in recent months. (Chart 3.36) At the same time, Singapore’s motor vehicle policy will be tightened further in August next year.16 The current monthly supply of new COEs is already extremely low at around 0.4% of the car population, compared to the five-year historical average of 1.4%. Hence, notwithstanding the slight pickup in vehicle deregistrations in recent months, COE supply will probably remain tight, which will support premiums. (Chart 3.37) For the whole of 2012, car prices will contribute modestly to CPI inflation, after adding more than 1.5% points this year.
Chart 3.36 Proportion of New Car Registrations
by Taxi Companies
Chart 3.37 Number of COE Deregistrations
16 The permissible vehicle population growth rate will be cut from the current 1.5% per annum to 0.5% per annum in
August 2012.
2007 2008 2009 2010 20110
5
10
15
20
25
Per C
ent
% of New Car Registrations by Taxi CompaniesHistorical Average between 2005-09
Sep
2007 2008 2009 2010 20110
1
2
3
4
5
6
7
Thou
sand
Sep
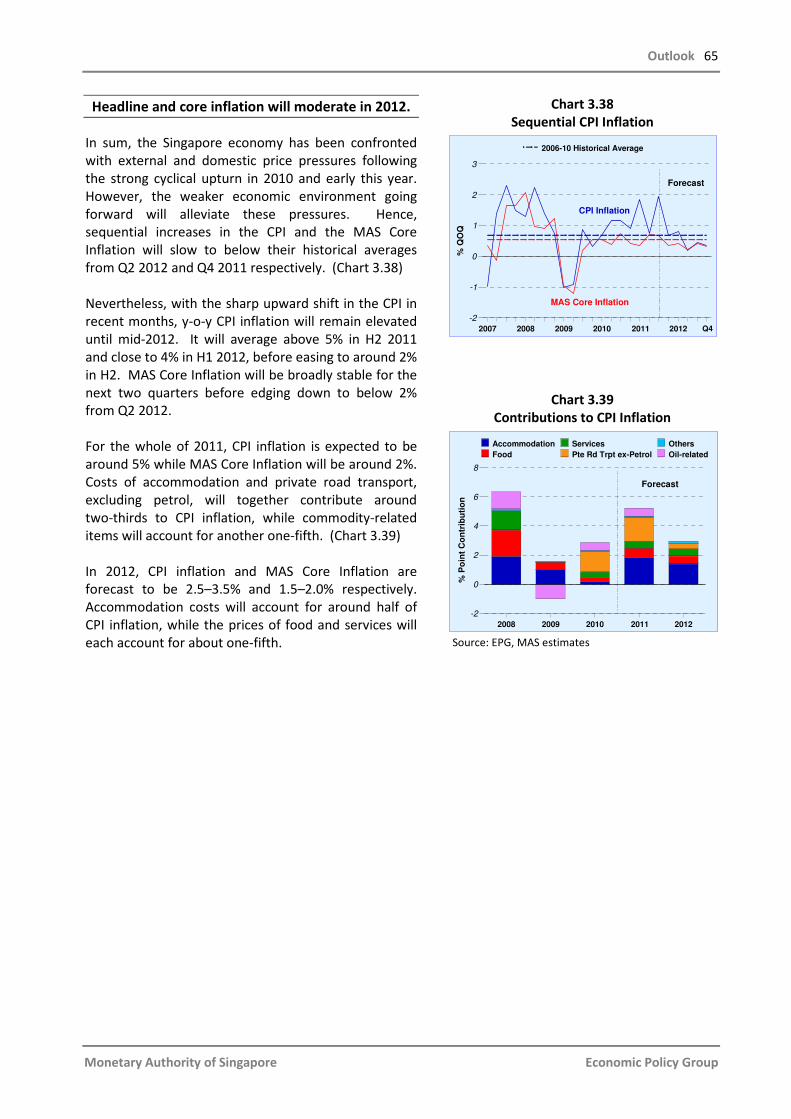
Outlook 65
Monetary Authority of Singapore Economic Policy Group
Headline and core inflation will moderate in 2012.
In sum, the Singapore economy has been confronted
with external and domestic price pressures following
the strong cyclical upturn in 2010 and early this year.
However, the weaker economic environment going
forward will alleviate these pressures. Hence,
sequential increases in the CPI and the MAS Core
Inflation will slow to below their historical averages
from Q2 2012 and Q4 2011 respectively. (Chart 3.38)
Nevertheless, with the sharp upward shift in the CPI in
recent months, y-o-y CPI inflation will remain elevated
until mid-2012. It will average above 5% in H2 2011
and close to 4% in H1 2012, before easing to around 2%
in H2. MAS Core Inflation will be broadly stable for the
next two quarters before edging down to below 2%
from Q2 2012.
For the whole of 2011, CPI inflation is expected to be
around 5% while MAS Core Inflation will be around 2%.
Costs of accommodation and private road transport,
excluding petrol, will together contribute around
two-thirds to CPI inflation, while commodity-related
items will account for another one-fifth. (Chart 3.39)
In 2012, CPI inflation and MAS Core Inflation are
forecast to be 2.5–3.5% and 1.5–2.0% respectively.
Accommodation costs will account for around half of
CPI inflation, while the prices of food and services will
each account for about one-fifth.
Chart 3.38
Sequential CPI Inflation
Chart 3.39
Contributions to CPI Inflation
Source: EPG, MAS estimates
2007 2008 2009 2010 2011 2012
-2
-1
0
1
2
3
% Q
OQ
2006-10 Historical Average
MAS Core Inflation
CPI Inflation
Q4
Forecast
2008 2009 2010 2011 2012
-2
0
2
4
6
8%
Po
int
Co
ntr
ibu
tio
n
Accommodation
Food
Services
Pte Rd Trpt ex-Petrol
Others
Oil-related
Forecast


Special Features

68 Macroeconomic Review, October 2011
Monetary Authority of Singapore Economic Policy Group
An Overview of the Satellite Model of Singapore1
Introduction
Macroeconomic models are stylised depictions of economic reality, as they attempt to replicate the main mechanisms of an entire economic system. Thus, a complex economic system can be made far more tractable in order to facilitate economic analysis. A fully elaborated model would also assemble various interpretations of the economy into a coherent whole, so that the implications of events and economic policies can be assessed in an internally consistent manner. Such features make models extremely useful for policymakers. The origins of modern macroeconomic modelling can be traced back to the 1940s, when major modelling work was undertaken, especially with the adoption of simultaneous equation systems. Thereafter, modelling methodology made continuous progress in tandem with advances in economic and econometric research. For example, one weakness of older models was in the treatment of expectations. A powerful critique by Robert Lucas (1976) showed how tenuous the use of backward-looking or adaptive expectations was, since changes in the policy regime would surely lead to a revision of expectations. Economic agents anticipate the effects of these policy changes when forming their expectations, thus making adaptive expectations incompatible with reality. Combined with advances in computing technology and econometrics, the Lucas critique led to the widespread adoption of forward-looking or rational expectations. Newer modelling approaches, such as Dynamic Stochastic General Equilibrium (DSGE) models, in fact, build on this
theoretical foundation and explicitly derive behavioural equations from microeconomic foundations. In this Special Feature, we look at how macroeconomic modelling has evolved in MAS by focusing on the latest addition to our suite of models, the Satellite Model of Singapore (SMS). This model is then compared with our flagship model, the Monetary Model of Singapore (MMS), and its properties demonstrated by analysing the effects on the Singapore economy of a hypothetical foreign demand shock. Evolution of Macroeconomic Modelling in MAS Macroeconomic models have played an integral role in MAS’ monetary policy since 1990, when the first comprehensive macroeconomic model, SINGMOD, was developed. In the following decade, the MMS, which incorporated new economic and econometric methodologies, was introduced. The MMS is a Macro-Computable General Equilibrium (Macro-CGE) model.2 It is able to analyse policy effects dynamically at both the economy and industry levels by using detailed information on all production activities from Singapore’s input-output tables. The MMS also has the advantage of being able to model both short- and long-run dynamics, as its key behavioural equations are estimated using error-correction models.
1 We are grateful to Douglas Laxton, Division Chief, Economic Modelling Division, Research Department, IMF and Werner
Schule, Deputy Division Chief, Asia and Pacific Department, IMF for their assistance in the development of the SMS. 2 CGE models are largely driven by theory and are based on the optimising behaviour of a variety of economic agents.
As they evolved to include dynamic adjustment processes, these were subsequently labelled as Macro-CGE models.
Special Feature A

Special Features 69
Monetary Authority of Singapore Economic Policy Group
In 2010, the SMS became the latest addition to MAS’ suite of models. Developed in collaboration with the IMF, the SMS is a small quarterly macroeconomic model that provides a satellite view of the Singapore economy, making it more tractable for economic analysis.
The Satellite Model of Singapore (SMS)
Overview The SMS is based on a theoretical foundation that lies midway between Dynamic Stochastic General Equilibrium (DSGE) models and reduced-form econometric models. Essentially, the SMS blends the New Keynesian concept of imperfect markets with DSGE models that incorporate rational expectations. Nominal and real rigidities are permitted by setting prices to adjust gradually to changing economic conditions. Under these assumptions, the economy may therefore fail to attain full employment in the short run. This suggests a “stabilisation” role for policy in the SMS, allowing it to be used as a suitable model for analysing monetary policy. Although the SMS is not explicitly based on microeconomic foundations, many of its features are nonetheless motivated by economic theory. Moreover, the SMS also requires the model to be calibrated by the user, so that it more closely mimics existing economic conditions. As such, the SMS adopts a pragmatic approach, whereby modellers engage in theory but not fully for its own sake. The SMS has three key behavioural equations: an aggregate demand or output gap equation; a price-setting or New Keynesian Phillips curve equation; and a monetary policy equation motivated by the Taylor rule.
The aggregate demand equation relates the level of real activity (in terms of the output gap) to previous and future real activity, the level of real activity in Singapore’s trading partners,3 the real exchange rate, and the short-term real interest rate. Within the model, the real exchange rate provides the crucial link between monetary policy and the real economy. The Phillips curve captures the relationship between current inflation and the output gap, change in the real exchange rate, and expected and lagged inflation. This equation embodies some of the key ideas from the contemporary macroeconomic synthesis regarding the role of monetary policy, which is to provide a nominal anchor for inflation and to influence inflation through its effects on output and the exchange rate. Following Parrado (2004), a modified Taylor-type monetary policy reaction function is adopted for Singapore based on changes in the Singapore dollar nominal effective exchange rate (S$NEER), rather than a short-term nominal interest rate. Changes to the S$NEER are then related to the deviation of the expected inflation rate from its target and the output gap. Finally, a modified uncovered interest rate parity (UIP) equation and a dynamic version of Okun’s Law, whereby the unemployment gap is related to the output gap, complete the main equation block of the model.
3 Global output is modelled using the Global Projection Model (GPM), which is developed and maintained by the IMF.
The latest version, GPM6, comprises six country/regional blocs that include all of Singapore’s major trading partners. The GPM6 allows for interactions between the different regions through traditional trade channels as well as a financial channel. An important feature of the SMS is that it may be seamlessly integrated with the GPM6, allowing the external outlook to be fed directly into the SMS and permitting an analysis of external shocks to be introduced in a model-consistent manner.

70 Macroeconomic Review, October 2011
Monetary Authority of Singapore Economic Policy Group
Unlike the MMS, the SMS features only a basic supply side, in which variables such as potential output, the equilibrium real interest rate, and exchange rate, are modelled as simple stochastic processes and are derived using the Kalman filter.4 A noteworthy feature of SMS is that it uses a Bayesian estimation procedure, which places particular emphasis on the economic structure of the model rather than simply on the statistical goodness of fit. Accordingly, Bayesian estimation endows the model with a variety of information from the data, prior assumptions based on other studies and the judgment of the researchers and, to some extent, the structure of the model itself. The relative weights on the different sources of information are determined by examining the model’s properties using impulse response functions (IRFs).5
Bayesian techniques are particularly well-suited to handle small data sets, enabling structural changes in the economy to be more effectively captured. This is especially useful in the context of Singapore, since long time series of macroeconomic data are hard to find. Apart from forecasting key macroeconomic variables, the SMS is also used for policy simulations, such as analysing the impact of GDP and inflation shocks on the economy. The results from the simulations are then used in conjunction with the MMS to determine the appropriate monetary policy stance.
4 The Kalman filter is a recursive algorithm that is widely used in economic models to provide estimates of latent
(unobserved) variables that are conditional on a given information set and behaviour of the model parameters. 5 IRFs show the reaction of variables to various shocks, and are useful for studying the interactions between variables in a
dynamic model.

Special Features 71
Monetary Authority of Singapore Economic Policy Group
Comparison of MMS and SMS
6 The neoclassical long-run properties in the MMS are consistent with a typical computable general equilibrium model that
focuses on equilibrium steady states. 7 For example, the Phillips curve equation in SMS is specified such that current inflation depends on expected and lagged
inflation, the output gap, and the change in the exchange rate gap. Expected inflation is specified as the quarter-ahead inflation rate.
This section highlights the similarities and differences between the MMS and SMS in terms of model structure and the modelling approach. Table 1 provides a summary of the key features of both models. The MMS is a large model comprising 255 equations. Its building blocks are the national income identities and sectoral production functions, from which equations are obtained for households, firms, government, trade, labour market, production, prices, interest rates and monetary policy. These underlying relationships are derived from economic theory and are based on the optimising behaviour of the agents involved. The MMS also integrates the supply side of the economy with the respective expenditure (or demand) components and has a detailed sectoral breakdown. In contrast, the SMS is a highly aggregated model with no sectoral or expenditure components. The SMS is much smaller with 37 equations, and its key properties are derived from the three New Keynesian core equations for aggregate demand, inflation, and the monetary policy reaction function.
Economic Properties of the Models Despite these differences, the MMS and SMS have some common fundamental properties. Both are New Keynesian in the short run, but neoclassical in the long run. 6 More specifically, the long-run equilibrium path in both models assumes that: Economic growth is steady. In the MMS, real variables in the long run grow according to the rate of Harrod-neutral technological progress plus the rate of growth in the labour force. In the SMS, the economy converges to its potential growth rate. The unemployment rate converges. Both models assume that the unemployment rate converges to a non-accelerating inflation rate of unemployment (NAIRU). Neutrality of money holds. Monetary policy does not have an effect on real variables in the long run for both models. Also, the fundamental role of monetary policy in both models is to provide a nominal anchor for inflation. The MMS and SMS also share some similar short-run dynamics. Output in the short run is demand-determined as a result of nominal and real rigidities. Also, both models incorporate expectations, with the MMS assuming rational expectations in the financial markets to exhibit forward-looking behaviour, while the SMS allows for both rational and adaptive expectations in its key relationships.7

72 Macroeconomic Review, October 2011
Table 1 Model Description
MMS SMS
Year of Model Development 1999* 2010 Frequency of Data Quarterly Quarterly Size Total Number of Equations Behavioural Equations
255 38
37 5
Key Blocks/Equations Trade Sectoral Labour Market Households Firms
• Export and import demand
functions for three sectors. • Production functions for five
sectors, with interlinkages.
• Labour demand, supply, and wage equations are estimated in a disequilibrium framework. Features an Inflation Expectations-Augmented Phillips curve.
• Ando-Modigliani Consumption Function
• CES Production Functions • Tobin’s ‘q’ Theory of Investment
• Does not feature exports or imports. The trade channel is captured by including foreign real activity in the domestic output gap equation.
• No sectoral breakdown.
• Okun’s law allows real activity to affect the unemployment rate, but does not play a fundamental role in the model. Also features an Inflation Expectations-Augmented Phillips curve.
• No households.
• No firms.
Theoretical Underpinning • New Keynesian in the short run; Neoclassical in the long run.
• New Keynesian in the short run; Neoclassical in the long run.
Econometric Approach Specification Estimation
• Error Correction Model • Ordinary Least Squares
• Equation System • Bayesian estimation
Expectation
• Rational expectations in the financial markets. Adaptive expectations in others.
• Rational and adaptive expectations in key relationships.
Special Features
• Detailed modelling by sector and expenditure components.
• Can be integrated with GPM6. • Uses Taylor rule for optimal
monetary policy.
* Note: The MMS has since undergone significant enhancements.
Monetary Authority of Singapore Economic Policy Group

Special Features 73
Monetary Authority of Singapore Economic Policy Group
Analysing the Impact of a Foreign Demand Shock in SMS
8 The ESU01 model was developed in 2001 by the Econometric Studies Unit of NUS and further refined in 2005. It can be
utilised for economic analysis, policy simulation and forecasting. Details can be found in Abeysinghe and Choy (2007).
9 For the exogenous monetary policy setting, the path of S$NEER was maintained at its baseline levels. When monetary policy is endogenous, the built-in monetary policy response function is enabled.
In the October 2007 issue of the Review, we highlighted two structural macro-econometric models, the MMS and the ESU01 model developed at the National University of Singapore. 8 The different transmission mechanisms in each model were demonstrated by simulating an adverse foreign demand shock. In this section, we simulate a similar foreign demand shock in the SMS, and examine its impact on key macroeconomic variables. In the SMS, an adverse foreign demand shock affects the aggregate demand equation directly. This results in a fall-off in aggregate demand, which then impacts inflation through the short-run Phillips curve. Figure 1 shows the transmission mechanism in SMS arising from a shock to external demand. If monetary policy is exogenous, the S$NEER will remain unchanged. The Taylor-type monetary policy reaction function, however, endows the SMS with a model-based monetary policy response to the shocks to the economy. Under this endogenous monetary policy setting, the S$NEER therefore adjusts in response to lower expected future inflation and a smaller output gap. Simulation Results A fall in foreign demand is introduced in the SMS through a change in the composite foreign gross domestic product (GDPF) index. The shock is assumed to be temporary—GDPF falls by 1% below baseline for four quarters, recovers by 0.25% in each of the subsequent four quarters, and finally reverts to the baseline by the end of the second year. Chart 1 shows our assumed path for GDPF. The impact of this shock on the key macroeconomic variables is then simulated under both exogenous and endogenous monetary policy settings.9
Under the exogenous monetary policy scenario, real domestic GDP falls by 1.2% from baseline in the first quarter with the shock having a maximum impact on real GDP after two quarters. (Chart 1) Faced with a lower level of economic activity, the unemployment rate rises and reaches a peak that is 0.3% point higher than baseline in the fourth quarter. The CPI, however, remains below baseline for an extended period due to the fall in external demand, reaching its trough at 1.2% below baseline in the fifth quarter. Overall, real GDP declines by 1.3% in the first year compared to the baseline, and then recovers. (Table 2) CPI falls by 0.7% below baseline in the first year, and remains below baseline into the second year. The unemployment rate ticks up initially, before reverting to baseline by the end of the second year. Beyond the second year, the impact on the key macroeconomic variables dissipates in the long run due to the temporary nature of the GDPF shock. However, when monetary policy is allowed to respond to the external shock (endogenous monetary policy), the impact on the macroeconomic variables is more muted. This occurs as the slope of the S$NEER adjusts according to the Taylor rule, hence stabilising output and inflation around their respective targets. The resulting looser monetary policy softens the impact of the adverse foreign demand shock, thereby capping the peak decline in GDP and CPI at 1.2% and 0.9% below the baseline respectively. (Chart 1) The peak deviation in the unemployment rate is also lower at 0.2% point above the baseline. Under the endogenous monetary policy setting, real GDP and CPI decline by 0.9% and 0.6% below baseline in the first year respectively. (Table 2)

74 Macroeconomic Review, October 2011
Monetary Authority of Singapore Economic Policy Group
Figure 1 Transmission of a Foreign Demand Shock within the SMS
Chart 1 Macroeconomic Effects of a Foreign Demand Shock in the SMS
Foreign GDP Assumption
CPI
GDP
Unemployment Rate
0 1 2 3 4 5 6 7 8 9 10Number of quarters
11 12-1.2
-1.0
-0.8
-0.6
-0.4
-0.2
0.0
0.2
% D
evia
tion
from
Bas
elin
e
0 2 4 6 8 10 12 14 16 18 20Number of quarters
-1.2
-0.9
-0.6
-0.3
0.0
0.3
-1.2
% D
evia
tion
from
Bas
elin
e
CPI
CPI - with Monetary Policy Response
0 2 4 6 8 10 12 14 16 18 20Number of quarters
-2
-1
0
1
2
% D
evia
tion
from
Bas
elin
e
GDP
GDP - with Monetary Policy Response
0 2 4 6 8 10 12 14 16 18 20Number of quarters
-0.2
-0.1
0.0
0.1
0.2
0.3
% P
oint
Dev
iatio
n fr
om B
asel
ine
Unemployment Rate
Unemployment Rate - with Monetary Policy Response
Unemployment Rate
With monetary policy response
Foreign GDP
Singapore GDP
Inflation Real Interest
Rates
S$NEER

Special Features 75
Table 2 Macroeconomic Effects of a Foreign Demand Shock in the SMS
(% deviations from baseline)
Model Impact on Year 1 Year 2
SMS GDP −1.31 0.59 CPI −0.71 −0.89 Unemployment Rate* 0.23 0.08
SMS (with monetary policy response)
GDP −0.86 0.32 CPI −0.55 −0.74 Unemployment Rate* 0.16 0.05
* % point deviation.
Sum-up The addition of SMS to MAS’ suite of macro-econometric models resonates with our continued adherence to a pluralistic approach to modelling and our belief that no one model is superior in all possible circumstances. Notably, the key advantage of the SMS is its elegance in encapsulating key macroeconomic relationships within a tight model-consistent framework. The MMS, by comparison, has the advantage of scale and detail, enabling an extensive and detailed set of policy simulations to be carried out. The SMS results in this Special Feature corroborate those obtained from a simulation conducted on the latest version of the MMS. Taken together, the two models highlight the range of possible outcomes in response to an adverse external demand shock. In both models, GDP falls by 1.2–1.3% below baseline in the first year, but recovers after 4–6 quarters. Similarly, the CPI also declines by 0.5–0.7% in the first year, reaching its trough after five quarters.
The SMS further augments MAS’ analytical toolkit and, together with the MMS, will play an important role in our monetary policy formulation.
Monetary Authority of Singapore Economic Policy Group

76 Macroeconomic Review, October 2011
Monetary Authority of Singapore Economic Policy Group
References
Abeysinghe, T and Choy, K M (2007), The Singapore Economy: An Econometric Perspective, Routledge Publishing. Berg, A, Karam, P, and Laxton, D (2006), “A Practical Model-Based Approach to Monetary Policy Analysis – Overview”, IMF Working Paper No. WP/06/80. Carabenciov, I, Ermolaev, I, Freedman, C, Juilliard, M, Kamenik, O, Korshunov, D, Laxton, D, and Laxton, J (2008), “A Small Quarterly Multi-Country Projection Model”, IMF Working Paper No. WP/08/279. Enzler, J, Murphy, C, Ng, H T, Phang, A and Robinson, E (2005), “Two Decades of Macromodelling at the MAS”, Monetary Authority of Singapore Staff Paper No. 39. Lucas, R E (1976), “Econometric Policy Evaluation: A Critique”, Carnegie-Rochester Conference Series on Public Policy, Vol. 1(1), pp. 19–46. Monetary Authority of Singapore (2007), “Impact of a Foreign Demand Shock on the Singapore Economy – Perspectives from Two Macroeconometric Models”, Macroeconomic Review, Vol. VI(2), pp. 58–71. Parrado, E (2004), “Inflation Targeting and Exchange Rate Rules in an Open Economy”, IMF Working Paper No. WP/04/21.

Special Features 77
Monetary Authority of Singapore Economic Policy Group
Capital Flow Waves by Kristin J. Forbes and Francis E. Warnock1
Introduction
Many countries experienced extreme movements or “waves” of international capital flows in the 1980s and 1990s, and capital flow volatility have increased even more in the past decade. Capital flows dried up in late 2001, surged throughout the mid-2000s, contracted sharply during the Global Financial Crisis, and then rebounded quickly in 2010. Waves in capital flows can have widespread economic consequences, such as amplifying economic cycles, increasing financial system vulnerabilities, and aggravating overall macroeconomic instability. In a new research project, summarised in this article, we attempt to better understand what causes the major ebbs and flows of international capital. 2 This project synthesises an existing academic literature on “sudden stops”, “surges” or “bonanzas”, and capital “flight”, and introduces additional dimensions to this literature that generate important new results and insights for
policy formulation. Almost all previous work on capital flow episodes relied on proxies for net capital flows, which cannot differentiate between changes in foreign and domestic behaviour. In contrast, we focus on gross capital inflows and outflows, distinguishing capital movements initiated by foreigners and domestic investors. The differentiation between gross inflows and gross outflows is important. Foreign and domestic investors can be motivated by different factors and respond differently to various policies and shocks. Policymakers might also react differently based on whether episodes of extreme capital flow movements are instigated by domestic or foreign sources. Analysis based solely on net flows, while appropriate a few decades ago, would miss the dramatic changes in gross flows that have occurred over the past decade and ignore important information contained in the flows. (Chart 1)
1 Kristin J. Forbes is Professor of Management and Global Economics at MIT Sloan School of Management, and Francis
E. Warnock is Paul M. Hammaker Associate Professor of Business Administration at the Darden Business School, University of Virginia. Professor Warnock visited EPG, MAS in November 2010 under MAS’ Eminent Visitor Programme. The views in this Special Feature are solely those of the authors and should not be attributed to MAS.
2 For more information on this project and details on the analysis and results, see Forbes and Warnock (2011).
Special Feature B
Chart 1 Net and Gross Flows for Singapore
Note: Data are two-quarter moving averages in US$ billion and in BOP terms (that is, inflows are positive and outflows are negative).
1995 1997 1999 2001 2003 2005 2007 2009-60
-45
-30
-15
0
15
30
45
US$
Bill
ion
Gross Inflows
Gross Outflows
2010Q4
Net Flows

78 Macroeconomic Review, October 2011
Monetary Authority of Singapore Economic Policy Group
Measuring Extreme Capital Flow Episodes
Our methodology builds on the traditional measures of sudden stops and capital flow bonanzas, but with three fundamental changes. First, we use data on actual flows instead of current-account-based proxies for flows. Second, we use data on gross flows from the outset to identify episodes, rather than relying on proxies for net flows.3 Finally, we analyse both large increases and large decreases of both inflows and outflows, instead of just focusing on increases or decreases, in order to improve our understanding of all types of capital flow episodes. More specifically, we use quarterly gross flows data to identify four types of episodes: • “Surges”: a sharp increase in gross capital
inflows; • “Stops”: a sharp decrease in gross capital
inflows; • “Flight”: a sharp increase in gross capital
outflows; and • “Retrenchment”: a sharp decrease in gross
capital outflows
The first two types of episodes—surges and stops—are driven by foreigners while the last two—flight and retrenchment—are driven by domestic investors. We calculate y-o-y changes in four-quarter gross capital inflows and outflows and define episodes using three criteria: (1) current y-o-y change in four-quarter gross capital inflows or outflows is more than two standard deviations above or below the historic average during at least one quarter of the episode; (2) the episode lasts for all consecutive quarters for which the y-o-y change in annual gross capital flows is more than one standard deviation above or below the historical average; and (3) the length of the episode is greater than one quarter.4
To provide a more concrete example of our methodology, consider the calculation of surge and stop episodes. Let Ct be the four-quarter moving sum of gross capital inflows (GINFLOW) and compute annual y-o-y changes in Ct:
−=
= =∑ K3
0
, 1,2, ,t t ii
C GINFLOW t N (1)
and
−Δ = − = K4 , 5,6, ,t t tC C C t N (2) Next, compute rolling means and standard deviations of ΔCt over the last five years. A “surge” episode is defined as starting in the first quarter t that ΔCt increases more than one standard deviation above its rolling mean. The episode ends once ΔCt falls below one standard deviation above its mean. In addition, in order for the entire period to qualify as a surge episode, there must be at least one quarter t when ΔCt increases at least two standard deviations above its mean. A “stop” episode, defined using a symmetric approach, is a period when ΔCt falls one standard deviation below its mean, provided they reach two standard deviations below at some point. The episode ends when ΔCt is no longer at least one standard deviation below its mean. Episodes of “flight” and “retrenchment” are defined similarly, but using gross outflows (excluding reserve accumulation) rather than gross inflows, and taking into account that in balance of payments (BOP) accounting terms, outflows by domestic residents are reported with a negative value. (In other words, when domestic investors acquire foreign securities, in BOP accounting terms, gross outflows are negative.)
3 Gross capital inflows are net purchases of domestic assets by foreign investors and gross outflows are net purchases of
foreign assets by domestic investors. 4 Summing capital flows over four quarters is analogous to the traditional literature’s focus on one year of flows and also
eliminates the impact of seasonal fluctuations. The historical average and standard deviation are calculated over the last five years (20 quarters), which means that our episodes are always defined relative to the recent past.

Special Features 79
Monetary Authority of Singapore Economic Policy Group
Chart 2 shows our identification of episodes for Singapore; inflows (and, hence, surges and stops) are in the left panel, while outflows (flight and retrenchment) are in the right panel. Quarterly BOP data for Singapore are available from 1995. As our episode definitions require six years of data, we can only identify episodes beginning in 2001. In the left panel, the solid line is the change in annual gross capital inflows as defined in equation (2). The dashed lines are the bands for mean capital inflows plus or minus one standard deviation, and the dotted lines are the comparable two-standard-deviation bands. In the right panel, the solid line is the change in annual gross capital outflows, with the corresponding one- and two-standard-deviation lines.
According to these criteria, Singapore had roughly simultaneous surge and flight episodes in late 2006 and 2007, and simultaneous stop and retrenchment episodes during the peak of the Global Financial Crisis (GFC).5 Singapore was not alone in experiencing such episodes during these periods. Chart 3 shows the evolution of the incidence of each type of episode across 58 countries from 1980–2009 and shows that an elevated number of countries had surges and flight during the bubble years that preceded the GFC, and that an unprecedented number of countries experienced stops and retrenchment during the crisis. Indeed, in the fourth quarter of 2008, 78% of our sample of 58 countries experienced a sudden stop. However, over time Singapore has had relatively fewer episodes of extreme capital flow movements than other countries, although the shorter time series of quarterly data on Singapore’s capital flows makes comparisons with other countries difficult.
Chart 2 Construction of Episodes for Singapore
Surge and Stop Episodes
Flight and Retrenchment Episodes
5 More specifically, Singapore had a surge episode from Q4 2006 to Q1 2008 and a flight episode from Q2 2006 to Q4 2007.
Singapore had stop and retrenchment episodes from Q2 2008 to Q2 2009.
1997 1999 2001 2003 2005 2007 2009-150
-100
-50
0
50
100
150
US$
Bill
ion
Change in Capital Inflows 1 SD Bands 2 SD Bands
2010Q4
1997 1999 2001 2003 2005 2007 2009-150
-100
-50
0
50
100
150
US$
Bill
ion
2010Q4
Change in Capital Outflows 1 SD Bands 2 SD Bands
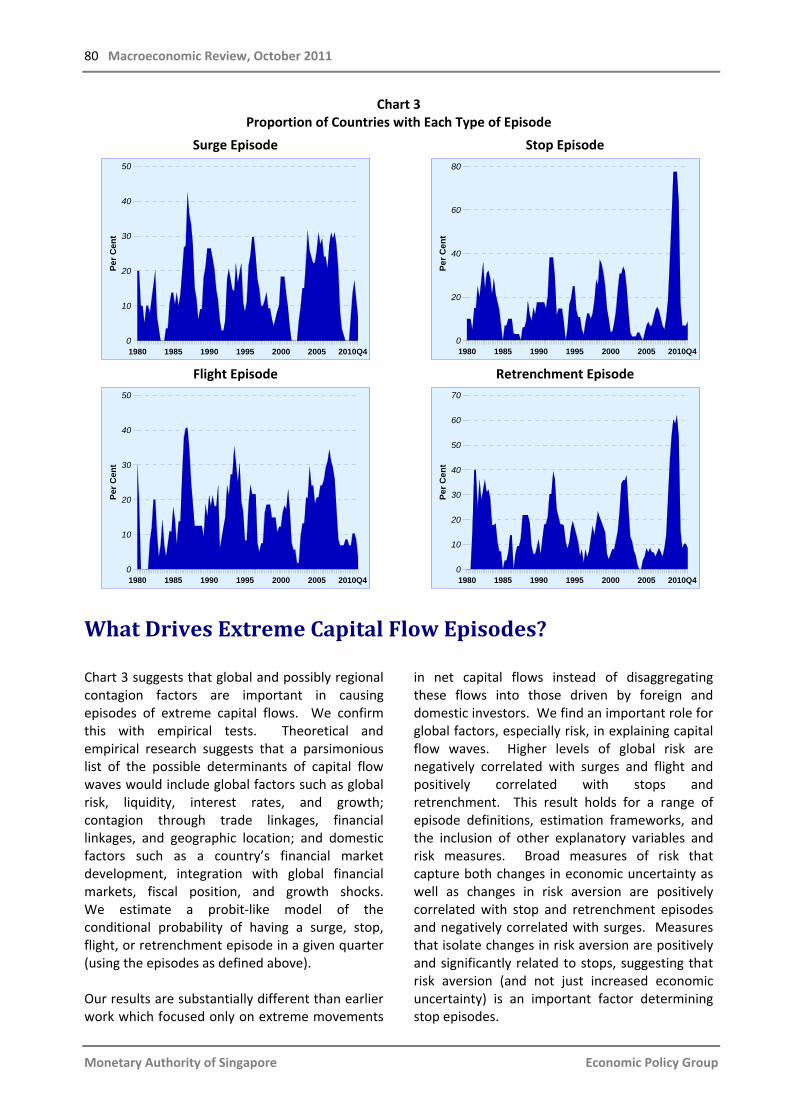
80 Macroeconomic Review, October 2011
Monetary Authority of Singapore Economic Policy Group
Chart 3 Proportion of Countries with Each Type of Episode
Surge Episode
Stop Episode
Flight Episode
Retrenchment Episode
What Drives Extreme Capital Flow Episodes?
Chart 3 suggests that global and possibly regional contagion factors are important in causing episodes of extreme capital flows. We confirm this with empirical tests. Theoretical and empirical research suggests that a parsimonious list of the possible determinants of capital flow waves would include global factors such as global risk, liquidity, interest rates, and growth; contagion through trade linkages, financial linkages, and geographic location; and domestic factors such as a country’s financial market development, integration with global financial markets, fiscal position, and growth shocks. We estimate a probit-like model of the conditional probability of having a surge, stop, flight, or retrenchment episode in a given quarter (using the episodes as defined above). Our results are substantially different than earlier work which focused only on extreme movements
in net capital flows instead of disaggregating these flows into those driven by foreign and domestic investors. We find an important role for global factors, especially risk, in explaining capital flow waves. Higher levels of global risk are negatively correlated with surges and flight and positively correlated with stops and retrenchment. This result holds for a range of episode definitions, estimation frameworks, and the inclusion of other explanatory variables and risk measures. Broad measures of risk that capture both changes in economic uncertainty as well as changes in risk aversion are positively correlated with stop and retrenchment episodes and negatively correlated with surges. Measures that isolate changes in risk aversion are positively and significantly related to stops, suggesting that risk aversion (and not just increased economic uncertainty) is an important factor determining stop episodes.
1980 1985 1990 1995 2000 2005 2010Q40
10
20
30
40
50
Per C
ent
1980 1985 1990 1995 2000 2005 2010Q40
20
40
60
80
Per C
ent
1980 1985 1990 1995 2000 2005 2010Q40
10
20
30
40
50
Per C
ent
1980 1985 1990 1995 2000 2005 2010Q40
10
20
30
40
50
60
70
Per C
ent

Special Features 81
Monetary Authority of Singapore Economic Policy Group
Other global factors help explain some types of episodes: global economic growth helps explain the two episodes driven by foreigners—higher global growth is positively correlated with surges and negatively correlated with stops—and global interest rates are positively correlated with retrenchment and stop episodes. Contagion also matters for certain episodes. In particular, contagion, especially through financial linkages, is an important factor causing investors to stop investing abroad and return money home (stop and retrenchment episodes), but less important in causing domestic or foreign investors to send money abroad. Contagion through trade flows is also important in explaining retrenchments. In contrast to the significant results for the global and contagion factors, domestic factors are usually not significant in explaining extreme capital flow episodes. When the domestic economy is growing strongly, stops are less likely and surges are more likely. No other domestic variable, however, is robustly significant. Extreme capital flow episodes appear to be driven primarily by global factors (especially risk) and through contagion rather than by domestic factors.
Just as noteworthy as the significant variables are those that are usually insignificant. In particular, there is no evidence that capital controls reduce a country’s likelihood of having a surge or stop episode, and therefore controls do not seem to reduce the extreme volatility of foreign capital flows. Given the recent interest in capital controls in many countries, we further examined this result by utilising several different measures: a broad de facto measure of financial integration (the sum of foreign assets and liabilities divided by GDP), a broad measure of capital account restrictions only available from 1995–2005, measures that focus specifically on controls on just inflows or outflows, and new indices that measure controls in the financial sector and regulations on foreign exchange. We find that no matter how we measure capital controls, they do not appear to reduce a country’s likelihood of having a surge or stop episode. Also noteworthy is that global liquidity does not affect the probability of extreme capital flow episodes.
Sum-up
Our results on the importance of global, contagion, and domestic effects in causing extreme movements in capital flows have important implications for economic policy. Capital flow volatility can have substantial economic costs, especially in emerging economies. Past work finds that surges are correlated with real estate booms, banking crises, debt defaults, inflation, and currency crises, and that sudden stops are correlated with currency depreciations, slower growth, and higher interest rates. For policymakers hoping to reduce these vulnerabilities and mitigate negative outcomes, a clear identification of episodes and an understanding of their causes is vital.
Our results suggest that many domestic factors have only a limited effect on capital flow volatility. We find no evidence that capital controls can insulate an economy against capital flow waves. As a result, governments concerned about the effects of capital flow volatility should prioritise strengthening their country’s ability to withstand this volatility rather than trying to reduce it. Finally, the results indicate a significant role for global factors and contagion in driving episodes, suggesting an important role for global institutions and cross-country cooperation in reducing capital flow volatility.
Reference
Forbes, K, and Warnock, F (2011), “Capital Flow Waves: Surges, Stops, Flight and Retrenchment”, NBER Working Paper No. 17351.

82 Macroeconomic Review, October 2011
Statistical Appendix Table 1: Real GDP Growth by Sector Table 2: Real GDP Growth by Expenditure Table 3: Labour Market (I) Table 4: Labour Market (II) Table 5: External Trade Table 6: Non-oil Domestic Exports by Selected Countries Table 7: Electronics Leading Index Table 8: Consumer Price Index Table 9: MAS Core Inflation Table 10: Balance of Payments – Current Account Table 11: Balance of Payments – Capital & Financial Accounts Table 12: Exchange Rates Table 13: Singapore Dollar Nominal Effective Exchange Rate Index Table 14: Domestic Liquidity Indicator Table 15: Monetary Table 16: Fiscal
Monetary Authority of Singapore Economic Policy Group

83
TABLE 1: REAL GDP GROWTH by Sector
Period Total
Manu-facturing
Financial Services
Business Services
Con- struction
Wholesale & Retail Trade
Hotels & Rest-aurants
Transport
&
Storage
Informa-tion &
Comms Total
Manu-facturing
Financial Services
Business Services
Con- struction
Wholesale & Retail Trade
Hotels & Rest-aurants
Transport
&
Storage
Informa-tion &
Comms
Year-on-Year % Change Seasonally-adjusted Quarter-on-Quarter Annualised % Change
2009 -0.8 -4.2 4.3 4.3 17.1 -6.0 -1.6 -9.0 1.0 2010 14.5 29.7 12.2 5.9 6.1 15.1 8.8 6.0 2.9
2010 Q1 16.4 37.2 18.9 6.1 9.7 16.9 7.2 6.6 2.2 39.9 170.5 25.6 7.9 -7.0 30.8 11.3 4.3 0.3
Q2 19.4 45.2 9.9 7.1 11.4 18.9 12.5 8.5 2.9 29.7 79.2 4.6 5.6 21.2 11.6 19.0 13.0 6.5 Q3 10.5 13.7 9.7 6.0 6.7 14.4 8.2 5.2 3.4 -16.7 -48.5 -1.4 2.1 -9.6 0.0 -3.7 -4.5 5.2 Q4 12.0 25.5 10.9 4.5 -2.0 10.8 7.5 3.8 2.9 3.9 0.7 16.9 2.8 -10.2 3.7 4.6 2.9 -0.4
2011 Q1 9.3 16.5 11.4 4.4 2.4 5.0 7.2 4.9 3.3 27.2 97.2 27.6 7.0 13.5 4.7 10.6 9.4 2.3 Q2 0.9 -5.9 10.0 2.2 1.5 0.0 6.4 4.1 2.4 -6.5 -23.7 -0.2 -2.9 13.4 -8.4 14.8 8.9 2.6
Source: Singapore Department of Statistics
TABLE 2: REAL GDP GROWTH by Expenditure Year-on-Year % Change
Period Total
Demand
Domestic Demand Exports of Goods
& Services Imports of Goods
& Services Total Consumption Gross Fixed Capital Formation
Total Private Public Total Private Public
2009 -7.8 -6.8 0.9 0.2 3.5 -2.9 -5.6 18.5 -8.1 -11.0 2010 16.2 7.2 5.7 4.2 11.0 5.1 3.5 15.0 19.2 16.6
2010 Q1 18.1 8.2 7.7 6.1 12.0 11.1 9.6 19.4 21.7 16.8
Q2 20.3 8.6 5.6 5.2 7.6 -1.7 -4.6 19.7 24.4 20.3 Q3 14.6 -1.3 3.7 1.5 11.8 5.8 4.0 17.2 19.8 16.7 Q4 12.5 14.1 5.8 4.3 11.3 5.7 5.8 5.2 12.1 12.8
2011 Q1 7.0 2.7 3.6 6.1 -2.6 -7.8 -12.4 15.8 8.4 5.8 Q2 2.3 3.8 6.4 6.6 5.4 10.0 9.4 13.1 1.8 2.9
Source: Singapore Department of Statistics
Monetary Authority of Singapore

84
TABLE 3: LABOUR MARKET (I) Year-on-Year % Change
Period Average Monthly Earnings
Labour Productivity Unit Labour Cost All
Sectors Manufacturing Construction
Wholesale & Retail Trade
Hotels & Restaurants
Transport & Storage
Information &Communications
Financial Services
BusinessServices
OverallEconomy
Manufacturing
2009 -2.6 -3.4 1.6 4.0 -7.7 -5.0 -9.3 -3.2 2.3 -0.4 0.6 -4.0 2010 5.6 10.7 31.9 2.9 12.1 3.9 4.7 -3.4 3.2 -0.9 -2.7 -15.8
2010 Q1 3.7 13.9 44.3 3.9 14.8 5.5 7.8 -1.1 12.6 1.2 -7.8 -23.2
Q2 5.8 15.3 47.4 7.0 15.8 8.0 7.7 -3.0 1.3 0.0 -6.7 -24.6 Q3 5.4 6.2 13.8 4.4 11.1 2.0 3.1 -4.5 -0.7 -2.0 2.8 -0.5 Q4 7.5 7.8 25.7 -2.8 7.2 0.5 0.6 -5.1 0.5 -2.6 1.8 -11.0
2011 Q1 8.5 5.4 17.2 1.5 1.2 0.0 1.1 -5.4 2.8 -1.7 3.5 -7.8 Q2 6.0 -2.5 -5.5 0.3 -3.8 -0.2 -0.1 -5.9 2.6 -2.7 10.3 14.9
Note: Labour productivity figures are based on SSIC 2005 classification. Source: Singapore Department of Statistics/Central Provident Fund Board
TABLE 4: LABOUR MARKET (II) Thousand
Period Changes in Employment
AllSectors
Manufacturing Construction Wholesale & Retail Trade
Hotels & Restaurants
Transport & Storage
Information & Communications
Financial Services
Business Services
Other Services Others
2009 37.6 -43.7 25.1 5.9 1.7 -3.8 2.6 3.4 12.8 32.9 0.7 2010 115.9 -1.1 2.5 14.2 12.7 6.7 7.6 15.7 27.6 26.5 3.5
2010 Q1 36.5 3.1 -0.4 1.8 -0.1 0.8 1.7 5.5 11.5 12.3 0.4
Q2 24.9 -2.3 2.0 1.8 1.8 2.0 2.6 3.2 8.5 5.4 -0.2 Q3 20.5 -0.7 0.0 2.8 2.2 1.5 2.3 4.5 6.8 1.3 0.0 Q4 33.9 -1.2 0.9 7.9 8.9 2.4 0.9 2.6 0.7 7.4 3.3
2011 Q1 28.3 0.1 1.5 3.4 0.3 1.6 2.5 2.9 6.8 9.0 0.2 Q2 24.8 0.8 3.6 3.0 0.5 2.9 2.5 2.5 6.2 2.5 0.2
Note: Changes in employment numbers are based on SSIC 2005 classification. Source: Ministry of Manpower Data by industry from Q4 2010 onwards are not strictly comparable with earlier periods, due to the nation-wide implementation of the Unique Entity Number (UEN) for enterprises.
Monetary Authority of Singapore

85
TABLE 5: EXTERNAL TRADE Year-on-Year % Change
Period Total Trade
Exports
Domestic Exports
Re- exports
Imports Exports
Domestic ExportsRe-
exports Imports
Total
Oil
Non-oilTotal Oil Non-oil
Total Electronics Non-
electronics At Current Prices At 2006 Prices
2009 -19.4 -18.0 -19.2 -34.5 -10.6 -18.0 -5.7 -16.6 -21.0 -10.3 -7.2 -1.5 -9.3 -13.3 -12.7 2010 20.7 22.4 24.3 27.9 22.8 25.6 21.2 20.5 18.8 21.2 20.1 6.5 25.6 22.3 16.2
2010 Q1 26.9 28.2 31.9 56.9 23.1 29.8 19.4 24.5 25.5 22.2 19.7 6.1 25.6 24.8 15.5
Q2 27.8 29.1 33.4 48.0 27.6 34.2 23.9 24.6 26.4 25.6 25.3 15.6 29.2 26.0 21.8 Q3 17.9 20.0 19.2 9.2 23.7 27.1 21.8 20.9 15.6 21.8 19.7 2.0 26.9 24.1 17.5 Q4 12.2 14.5 15.8 11.8 17.6 14.2 19.6 13.0 9.7 15.8 16.3 3.1 21.2 15.2 10.4
2011 Q1 11.9 13.4 19.4 35.2 12.3 -7.2 24.2 7.2 10.2 10.4 14.9 10.9 16.4 5.9 3.9 Q2 7.5 6.7 10.5 29.1 1.9 -14.4 11.6 2.6 8.4 2.4 4.0 -0.7 5.8 0.8 1.4 Q3 5.5 4.8 14.5 53.9 -1.1 -16.7 8.4 -5.6 6.2 0.3 6.4 15.6 3.4 -6.0 -1.0
Source: International Enterprise Singapore
TABLE 6: NON-OIL DOMESTIC EXPORTS by Selected Countries
Period All
Countries
ASEAN NIEs China EU Japan US
Total of which
Total Hong Kong Korea Taiwan Indonesia Malaysia Thailand
Year-on-Year % Change
2009 -10.6 -17.5 -19.7 -15.8 -19.6 4.1 4.7 -1.0 7.9 -7.7 -15.3 -20.0 -24.3 2010 22.8 19.2 22.4 19.1 21.0 39.1 36.4 35.9 47.0 31.4 30.8 25.1 24.7
2010 Q1 23.1 41.5 54.1 28.8 42.9 64.8 52.6 57.6 99.3 25.3 4.7 28.3 11.2 Q2 27.6 26.1 22.9 26.4 28.3 45.0 42.0 47.8 47.7 42.8 30.4 47.8 23.0 Q3 23.7 9.8 8.0 17.6 11.3 37.2 33.6 38.2 42.9 30.7 52.6 17.2 34.8 Q4 17.6 6.2 11.7 7.0 7.6 19.8 23.9 10.3 20.6 27.6 35.4 11.4 27.9
2011 Q1 12.3 0.0 -5.9 6.0 -1.1 -3.7 -5.2 -9.8 4.1 12.6 19.7 0.7 14.1 Q2 1.9 1.6 2.2 -1.4 3.0 -6.2 -18.8 0.6 8.5 7.1 8.5 -7.6 -2.4 Q3 -1.1 5.6 1.8 -5.5 8.7 -11.0 -10.8 -8.6 -13.2 9.9 -5.4 3.9 -22.4
% Share of All Countries
2009 100.0 23.2 6.4 8.6 4.1 17.4 8.6 4.1 4.6 10.4 14.5 6.0 10.8 2010 100.0 22.5 6.4 8.4 4.1 19.7 9.5 4.6 5.5 11.1 15.5 6.1 11.0
Source: International Enterprise Singapore
Monetary Authority of Singapore

86
TABLE 7: ELECTRONICS LEADING INDEX
Original Smoothed
Period 1999 = 100 Year-on-Year % Change Quarter-on-Quarter
% Change 1999 = 100 Year-on-Year % Change
Quarter-on-Quarter % Change
2009 62.1 -5.6 62.1 -6.22010 63.5 2.3 63.9 2.8
2010 Q1 64.2 8.3 0.0 64.1 5.6 0.1
Q2 65.1 7.0 1.3 65.0 7.6 1.4Q3 64.3 0.5 -1.1 64.5 2.2 -0.7Q4 60.4 -5.9 -6.1 61.8 -3.6 -4.3
2011 Q1 59.2 -7.8 -2.0 59.6 -7.1 -3.6Q2 58.3 -10.5 -1.6 58.5 -9.9 -1.7
Source: Monetary Authority of Singapore
TABLE 8: CONSUMER PRICE INDEX
Period All Items Food Housing Clothing
& Footwear
Trans-port
Comm-unications
Education &
Stationery
Health Care
Recrea-tion & Others
All Items
Food Housing Clothing
& Footwear
Trans-port
Comm-unications
Education &
Stationery
Health Care
Recrea-tion & Others
2009 = 100 Year-on-Year % Change
2009 100.0 100.0 100.0 99.9 100.0 99.9 100.0 100.0 100.0 0.6 2.3 1.7 0.8 -3.2 0.2 0.8 2.0 -0.3 2010 102.8 101.3 102.0 100.4 110.3 97.7 102.7 101.9 101.1 2.8 1.4 2.0 0.5 10.3 -2.2 2.7 1.9 1.2
2010 Q1 101.1 100.7 100.5 99.4 104.6 97.7 101.7 100.7 100.2 0.9 0.7 -1.7 0.0 8.2 -2.8 1.9 0.8 -0.5
Q2 102.3 101.0 100.9 99.4 110.4 96.9 102.0 101.4 100.8 3.1 1.2 2.2 0.6 12.9 -3.7 2.2 1.7 0.9 Q3 103.4 101.6 102.9 101.1 111.9 98.3 103.3 102.5 101.1 3.4 1.6 3.5 0.4 9.6 -2.0 3.2 2.4 2.0 Q4 104.4 102.0 103.8 101.6 114.2 98.0 103.9 102.9 102.3 4.0 1.9 4.2 1.0 10.6 -0.3 3.7 2.6 2.3
2011 Q1 106.3 103.4 106.6 100.2 121.0 96.5 105.2 103.8 101.1 5.2 2.7 6.1 0.8 15.6 -1.2 3.5 3.0 0.9 Q2 107.1 104.0 108.3 100.1 121.3 96.1 105.4 104.0 102.3 4.7 2.9 7.3 0.7 9.8 -0.8 3.2 2.5 1.5 Q3 109.2 104.7 112.8 100.8 125.2 96.1 106.1 104.4 102.8 5.5 3.0 9.7 -0.3 11.8 -2.2 2.6 1.9 1.7
Source: Singapore Department of Statistics
Monetary Authority of Singapore

87
TABLE 9: MAS CORE INFLATION Index (2009=100)
Period Jan Feb Mar Apr May Jun Jul Aug Sep Oct Nov Dec
1985 68.8 69.2 69.0 68.7 68.7 68.9 69.1 69.2 68.9 68.9 68.7 68.7 1986 68.8 68.7 68.7 68.4 68.2 68.1 67.9 67.9 68.2 68.2 68.0 68.0 1987 68.6 68.0 68.0 68.2 68.4 68.4 68.8 68.9 68.8 68.8 68.9 69.1 1988 69.0 69.6 69.3 69.4 69.6 69.5 69.9 69.9 70.0 69.8 69.8 70.0 1989 69.9 70.1 70.0 70.3 70.7 70.8 71.0 71.1 71.1 71.3 71.6 71.6 1990 71.8 71.9 71.6 72.1 72.2 72.2 72.2 72.2 72.1 72.7 73.4 73.9 1991 74.1 74.6 74.5 74.9 75.0 75.0 75.1 75.1 75.2 75.3 75.4 76.0 1992 75.8 75.8 75.7 76.0 76.3 76.2 76.4 76.2 76.3 76.4 76.6 76.8 1993 77.4 77.0 77.2 77.3 77.5 77.5 77.8 77.7 77.6 77.8 77.9 78.1 1994 78.4 78.9 78.6 79.1 79.4 79.8 79.9 79.9 79.9 80.1 80.2 80.2 1995 80.7 81.0 80.8 81.1 81.3 81.3 81.3 81.5 81.5 81.4 81.7 81.6 1996 81.8 82.6 82.2 82.4 82.7 82.8 82.8 83.0 83.0 83.0 83.2 83.3 1997 83.3 84.0 83.5 83.7 83.7 83.7 83.9 84.3 84.5 84.4 84.5 84.5 1998 85.0 84.9 84.4 84.4 84.1 84.0 84.1 84.2 84.2 84.1 84.4 84.2 1999 84.6 84.8 84.4 84.7 84.8 84.6 85.0 84.9 84.8 84.7 84.8 84.9 2000 85.4 85.8 85.5 85.5 85.4 85.5 86.0 86.5 86.4 86.4 86.9 87.0 2001 87.5 87.4 87.4 87.7 87.3 87.1 87.6 87.5 87.3 87.2 87.2 87.0 2002 86.9 87.2 87.0 87.1 87.3 87.3 87.4 87.4 87.4 87.4 87.7 87.7 2003 88.0 87.8 87.9 88.4 87.8 87.4 88.1 88.2 88.4 88.4 88.5 88.7 2004 89.5 89.6 89.7 89.8 89.9 89.7 89.9 89.8 90.2 90.2 90.3 90.2 2005 90.4 90.5 90.7 90.7 90.6 90.4 90.9 91.2 91.2 91.7 91.9 92.0 2006 92.5 92.3 92.3 92.3 92.1 92.0 92.5 92.6 92.6 93.0 93.2 93.5 2007 93.6 93.6 93.5 93.4 93.5 93.5 94.8 95.0 95.2 95.7 96.3 97.6 2008 98.2 98.6 98.7 99.4 99.5 99.5 100.1 100.5 100.5 101.6 101.6 101.7 2009 100.9 100.5 100.6 99.6 99.4 99.3 99.6 99.6 99.6 100.1 100.1 100.2 2010 100.3 100.9 101.0 101.2 101.1 101.0 101.6 102.0 102.0 102.1 102.3 102.3 2011 102.3 102.7 102.8 103.4 103.3 103.3 103.8 104.2 104.2
Note: MAS Core Inflation is the CPI less the costs of accommodation and private road transport. Source: Monetary Authority of Singapore
Monetary Authority of Singapore

88
TABLE 10: BALANCE OF PAYMENTS – Current Account
Current Account Balance Goods Account Services Balance Income Balance
Current Transfers (Net)
$ Million % of GDP Exports Imports Balance Total Transportation Travel Insurance Government Others
$ Million
2009 50,769 19.0 397,132 354,675 42,458 20,542 5,600 -8,145 -366 -8 23,461 -6,419 -5,811 2010 67,431 22.2 487,972 424,376 63,596 21,606 5,912 -3,558 -871 54 20,069 -11,221 -6,550
2010 Q1 15,158 20.8 112,377 100,023 12,354 5,707 1,916 -1,540 -235 -11 5,578 -1,361 -1,542 Q2 17,430 22.9 122,759 106,050 16,709 5,246 1,318 -1,035 -162 38 5,087 -2,937 -1,588 Q3 19,120 25.0 127,766 109,362 18,404 5,571 1,388 -214 -199 22 4,574 -3,188 -1,668 Q4 15,723 20.1 125,070 108,941 16,130 5,081 1,290 -769 -276 5 4,831 -3,735 -1,753
2011 Q1 17,291 21.1 126,987 110,229 16,758 5,400 1,630 -742 -360 -14 4,885 -3,029 -1,838 Q2 14,409 18.2 130,319 115,778 14,541 4,644 1,281 -1,146 -396 35 4,870 -2,975 -1,802
Source: Singapore Department of Statistics
TABLE 11: BALANCE OF PAYMENTS – Capital & Financial Accounts $ Million
Period
Capital &Financial Account Balance
Capital Account (Net)
Financial Account (Net) Net Errors &
Omissions Overall Balance
Official Foreign
Reserves (End of Period)
Total Direct
Investment Portfolio
Investment
Other Investment
Total Banks Others
2009 -39,016 -443 -38,573 -4,633 -22,546 -11,394 -8,662 -2,732 4,704 16,456 263,955 2010 -9,458 -455 -9,004 25,768 -29,816 -4,956 11,095 -16,051 -492 57,481 288,954
2010 Q1 4,494 -106 4,600 1,859 -9,893 12,634 11,537 1,097 1,393 21,045 275,749 Q2 -2,172 -118 -2,054 8,123 -4,414 -5,762 4,164 -9,926 -1,571 13,687 279,829 Q3 -13,272 -121 -13,151 7,231 -6,786 -13,596 -6,200 -7,396 423 6,272 282,159 Q4 1,491 -110 1,601 8,555 -8,722 1,768 1,594 174 -737 16,477 288,954
2011 Q1 -11,245 -128 -11,117 13,346 -9,311 -15,152 -1,454 -13,698 189 6,235 295,233 Q2 -6,604 -134 -6,471 6,587 -9,701 -3,356 255 -3,611 -2,339 5,466 297,445
Source: Singapore Department of Statistics/Monetary Authority of Singapore
Monetary Authority of Singapore

89
TABLE 12: EXCHANGE RATES
End of Period
Singapore Dollar Per
USDollar
Pound Sterling
EURO 100 Swiss
Franc 100 Japanese
Yen Malaysian
Ringgit Hong Kong
Dollar 100 New
Taiwan Dollar 100 Korean
Won Australian
Dollar
2009 1.4034 2.2541 2.0163 135.59 1.5194 0.4097 0.1810 4.3656 0.1204 1.2567 2010 1.2875 1.9887 1.7120 137.22 1.5798 0.4175 0.1655 4.4163 0.1141 1.3091
2010 Q1 1.4028 2.1143 1.8789 131.41 1.5016 0.4285 0.1807 4.4163 0.1238 1.2830
Q2 1.4013 2.1108 1.7113 129.44 1.5822 0.4302 0.1800 4.3546 0.1142 1.1928 Q3 1.3175 2.0872 1.7919 134.80 1.5760 0.4269 0.1698 4.2172 0.1155 1.2748 Q4 1.2875 1.9887 1.7120 137.22 1.5798 0.4175 0.1655 4.4163 0.1141 1.3091
2011 Q1 1.2617 2.0296 1.7828 137.43 1.5248 0.4170 0.1620 4.2808 0.1146 1.3026 Q2 1.2292 1.9802 1.7838 147.97 1.5284 0.4072 0.1579 4.2799 0.1150 1.3202 Q3 1.3003 2.0273 1.7593 144.40 1.6975 0.4076 0.1668 4.2555 0.1102 1.2668
Source: Monetary Authority of Singapore
TABLE 13: SINGAPORE DOLLAR NOMINAL EFFECTIVE EXCHANGE RATE INDEX Index (1 Apr 2010=100)
As at Week Ending S$ NEER
As at Week Ending S$ NEER
As at Week Ending S$ NEER
As at Week Ending S$ NEER
As at Week Ending S$ NEER
As at Week Ending S$ NEER
2010 Apr 1 100.00 2010 Jul 2 101.19 2010 Oct 1 102.92 2011 Jan 7 104.62 2011 Apr 1 105.42 2011 Jul 1 107.15 9 99.98 9 101.68 8 102.86 14 104.55 8 105.39 8 107.75
16 101.09 16 101.58 15 103.28 21 104.79 15 106.21 15 107.77 23 101.59 23 101.75 22 103.35 28 104.93 21 106.39 22 107.88 30 102.04 30 102.07 29 103.59 Feb 2 104.92 29 106.47 29 108.04
May 7 100.98 Aug 6 102.16 Nov 4 103.99 11 104.96 May 6 106.12 Aug 5 107.44 14 102.06 13 102.22 12 103.89 18 105.08 13 106.05 12 107.88 21 101.09 20 102.40 19 104.13 25 105.04 20 106.65 19 107.62 27 101.56 27 102.44 26 103.49 Mar 4 105.23 27 106.49 26 108.10
Jun 4 101.84 Sep 3 102.67 Dec 3 104.11 11 105.19 Jun 3 106.53 Sep 2 108.21 11 101.80 9 102.82 10 103.75 18 104.56 10 106.63 9 107.52 18 102.23 17 102.85 17 103.62 25 105.32 17 106.66 16 106.77 25 101.49 24 102.85 24 104.31 24 106.86 23 103.73
31 104.64 30 103.61 Oct 7 103.69
Source: Monetary Authority of Singapore
Monetary Authority of Singapore

90
TABLE 14: DOMESTIC LIQUIDITY INDICATOR Change from 3 Months Ago
Period Jan Feb Mar Apr May Jun Jul Aug Sep Oct Nov Dec
2008 0.037 -0.148 -0.114 0.439 0.588 0.605 0.244 -0.333 -0.322 -0.541 -0.325 -0.293 2009 -0.301 -0.239 -0.434 -0.132 0.209 0.247 0.184 -0.043 0.108 0.227 0.298 0.186 2010 0.028 -0.123 -0.064 0.168 0.385 0.351 0.171 0.215 0.340 0.465 0.468 0.305 2011 0.383 0.290 0.331 0.333 0.386 0.436 0.476 0.392 -0.205
Note: The DLI is a measure of overall monetary conditions, reflecting changes in the S$NEER and domestic 3-month interbank rate. Source: Monetary Authority of Singapore A positive (negative) number indicates a tightening (easing) monetary policy stance from the previous quarter. Please refer to the June 2001 issue of the MAS ED Quarterly Bulletin for more information.
TABLE 15: MONETARY
End of Period
Money Supply Interest Rates
Narrow Money
M1
Broad Money
M2
Broad Money
M3
Reserve Money
Narrow Money
M1
Broad Money
M2
Broad Money
M3
Reserve Money
Prime Lending
Rate
3-month Interbank
Rate
3-month SIBOR (US$)
Banks
Savings Rate
12-month Fixed
Deposit Rate $ Billion Year-on-Year % Change % Per Annum
2009 93.5 371.1 378.4 36.3 23.5 11.3 10.5 6.5 5.38 0.69 0.25 0.15 0.53 2010 112.5 403.1 410.1 40.5 20.3 8.6 8.4 11.5 5.38 0.44 0.30 0.13 0.45
2010 Q1 97.0 380.0 387.1 36.3 13.9 8.8 8.2 5.5 5.38 0.69 0.29 0.14 0.51
Q2 102.5 382.5 389.5 37.0 18.1 7.3 6.9 5.3 5.38 0.56 0.54 0.14 0.48 Q3 106.8 390.8 397.8 37.9 17.1 8.2 7.8 7.0 5.38 0.50 0.29 0.14 0.47 Q4 112.5 403.1 410.1 40.5 20.3 8.6 8.4 11.5 5.38 0.44 0.30 0.13 0.45
2011 Q1 116.9 413.3 420.4 41.9 20.6 8.7 8.6 15.4 5.38 0.44 0.31 0.12 0.43 Q2 122.3 423.5 430.8 43.6 19.4 10.7 10.6 17.7 5.38 0.44 0.25 0.12 0.43
Source: Monetary Authority of Singapore
Monetary Authority of Singapore

91
Monetary Authority of Singapore
TABLE 16: FISCAL
Period
Operating Revenue Expenditure
Primary Surplus (+)/ Deficit (−)
Less:
Special Transfers
Add: Net Investment
Income/ Returns
Contribution
Budget
Surplus (+)/ Deficit (−)
Total
Tax Revenue
Non-tax Revenue
Total
Operating
Development Total
of which
Income Tax
Asset Taxes
Stamp Duty
GST
$ Million
FY2008 41,086 37,709 19,286 2,904 1,432 6,487 3,377 38,091 28,734 9,357 2,996 7,099 4,343 239 FY2009 39,547 36,617 17,211 1,987 2,386 6,914 2,930 41,891 30,909 10,982 -2,344 5,481 7,006 -819
FY2010 (Revised) 45,462 41,223 18,473 2,991 2,840 7,900 4,238 46,393 34,132 12,261 -932 7,181 7,835 -278 FY2011 (Estimated) 48,124 43,426 19,610 3,576 2,140 8,445 4,698 47,100 35,902 11,198 1,025 8,729 7,781 76
% of Nominal GDP
FY2008 15.6 14.3 7.3 1.1 0.5 2.5 1.3 14.5 10.9 3.6 1.1 2.7 1.7 0.1 FY2009 14.2 13.2 6.2 0.7 0.9 2.5 1.1 15.1 11.1 4.0 -0.8 2.0 2.5 -0.3
FY2010 (Revised) 14.5 13.2 5.9 1.0 0.9 2.5 1.4 14.8 10.9 3.9 -0.3 2.3 2.5 -0.1 FY2011 (Estimated) 14.2 12.8 5.8 1.1 0.6 2.5 1.4 13.9 10.6 3.3 0.3 2.6 2.3 0.0
Source: Ministry of Finance

92 Macroeconomic Review, October 2011
Monetary Authority of Singapore Economic Policy Group
List of Selected Publications
Title Frequency Web Links
Inflation Monthly Monthly http://www.mas.gov.sg/eco_research/eco_dev_ana/Inflation_ Monthly.html
Monthly Statistical Bulletin Monthly
http://www.mas.gov.sg/data_room/msb/Monthly_Statistical_ Bulletin.html
Recent Economic Developments Quarterly
http://www.mas.gov.sg/eco_research/eco_dev_ana/Recent_ Economic_Developments.html
Survey of Professional Forecasters Quarterly http://www.mas.gov.sg/eco_research/surveys/Survey.html
Macroeconomic Review Semi-annual http://www.mas.gov.sg/publications/macro_review/index.html
Monetary Policy Statements Semi-annual
http://www.mas.gov.sg/eco_research/policy_issues/Monetary_ Policy_Statements.html
Financial Stability Review Annual http://www.mas.gov.sg/publications/MAS_FSR.html
Economics Explorer Occasional
http://www.mas.gov.sg/eco_research/eco_education/Economic_ Explorer_Series.html
Monographs Occasional http://www.mas.gov.sg/publications/monographs/Info_Papers_and_Monographs.html#monographs
Staff Papers Occasional http://www.mas.gov.sg/publications/staff_papers/index.html
Monographs
Title Date Web Links
Tenets of Effective Regulation Jun 2010
http://www.mas.gov.sg/publications/monographs/Tenets_of_Effective_Regulation.html
MAS’ Framework for Impact and Risk Assessment of Financial Institutions Apr 2007
http://www.mas.gov.sg/publications/monographs/Framework_for_ Impact_and_Risk_Assessment_of_Financial_Institutions.html
Monetary Policy Operations in Singapore Apr 2007
http://www.mas.gov.sg/publications/monographs/Monetary_Policy_ Operations_in_Singapore.html

List of Selected Publications 93
Title Date Web Links
MAS' Roles and Responsibilities in Relation to Securities Clearing and Settlement Systems in Singapore Aug 2004
http://www.mas.gov.sg/publications/monographs/Securities_ Clearing_Settlement_Systems.html
Objectives and Principles of Financial Supervision in Singapore Apr 2004
http://www.mas.gov.sg/publications/monographs/Financial_ Supervision.html
Singapore’s Exchange Rate Policy Feb 2001
http://www.mas.gov.sg/publications/monographs/Singapore_ Exchange_Rate_Policy.html
Staff Papers
Paper No. Date Title
51 Aug 2011 A Review of the Core Inflation Measure for Singapore
50 Jun 2009 An Empirical Analysis of Exchange Rate Pass-Through in Singapore
49 Dec 2008 Risks and Regulation of Islamic Banks: A Perspective from a Non-Islamic Jurisdiction
48 Nov 2007 Ten Years from the Financial Crisis: Managing the Challenges Posed by Capital Flows
47 Aug 2007 Perspectives on Growth: A Political-Economy Framework
46 Jun 2007 Fertility & the Real Exchange Rate
45 May 2007 A Survey of Recent Discourse on the Global Imbalances
44 Apr 2007 Checking Out: Exit from Currency Unions
43 Apr 2006 Singapore's Exchange Rate-Centred Monetary Policy Regime and its Relevance for China
42 Dec 2005 China's Rise as a Manufacturing Powerhouse: Implications for Asia
41 Dec 2005 The Welfare Analysis of a Free Trade Zone: Intermediate Goods and the Asian Tigers
40 Sep 2005 Macroeconomic Stability in Developing Countries: How Much is Enough?
39 Jul 2005 Two Decades of Macromodelling at the MAS
38 Dec 2004 Macroeconomic Determinants of Banking Financial Performance and Resilience in Singapore
Monetary Authority of Singapore Economic Policy Group

94 Macroeconomic Review, October 2011
Paper No. Date Title
37 Dec 2004 Managed Floating and Intermediate Exchange Rate Systems: The Singapore Experience
36 Dec 2004 The Long-Run Real Effective Real Exchange Rate of Singapore: A Behavioural Approach
35 Nov 2004 Review of Literature & Empirical Research: Is Board Diversity Important for Corporate Governance and Firm Value?
34 Aug 2004 FSAP Stress Testing: Singapore’s Experience
33 Aug 2004 Singapore’s Balance of Payments, 1965 to 2003: An Analysis
32 Jul 2004 Case Study on Pan-Electric Crisis
31 Jun 2004 Singapore’s Unique Monetary Policy: How Does it Work?
30 May 2004 Using Leading Indicators to Forecast the Singapore Electronics Industry
29 Mar 2004 Review of Literature & Empirical Research on Corporate Governance
28 Feb 2004 Why has there been less Financial Integration in Asia than In Europe?
27 Feb 2004 Does the WTO Make Trade More Stable?
26 Jan 2004 Education for Growth: The Premium on Education and Work Experience in Singapore
25 Jun 2003 Investigating the Relationship between Exchange Rate Volatility and Macroeconomic Volatility In Singapore
24 Sep 2002 Do We Really Know that the WTO Increases Trade?
23 Sep 2002 Assessing Singapore’s Export Competitiveness through Dynamic Shift-Share Analysis
22 Aug 2002 The Effect of Common Currencies on International Trade: Where Do We Stand?
21 Dec 2000 Kicking the Habit and Turning Over A New Leaf: Monetary Policy in East Asia after the Currency Crisis
20 May 2000 Financial Market Integration in Singapore: The Narrow and the Broad Views
19 Feb 2000 Exchange Rate Policy in East Asia after the Fall: How much have Things Changed?
18 Jan 2000 A Survey of Singapore's Monetary History
17 Nov 1999
Extracting Market Expectations of Future Interest Rates from the Yield Curve: An Application Using Singapore Interbank and Interest Rate Swap Data
16 Sep 1999 Interbank Interest Rate Determination in Singapore and its Linkages to Deposit and Prime Rates
15 Jul 1999 Money, Interest Rates And Income in the Singapore Economy
14 Jun 1999 The Petrochemical Industry in Singapore
Monetary Authority of Singapore Economic Policy Group
List of Selected Publications 95
Monetary Authority of Singapore Economic Policy Group
Paper No. Date Title
13 May 1999 How well did the Forward Market Anticipate the Asian Currency Crisis: The Case of Four ASEAN Currencies
12 May 1999 The Term Structure of Interest Rates, Inflationary Expectations and Economic Activity: Some Recent US Evidence
11 Mar 1999 Capital Account and Exchange Rate Management in a Surplus Economy: The Case of Singapore
10 Dec 1998 Measures of Core Inflation for Singapore
9 Oct 1998 Export Competition Among Asian NIEs, 1991-96: An Assessment
8 Oct 1998 The Impact of the Asian Crisis on China: An Assessment
7 Aug 1998 Singapore's Trade Linkages, 1992-96: Trends and Implications
6 May 1998 What Lies Behind Singapore's Real Exchange Rate? An Empirical Analysis of the Purchasing Power Parity Hypothesis
5 May 1998 Singapore’s Services Sector in Perspective: Trends and Outlook
4 Feb 1998 Growth in Singapore's Export Markets, 1991-96: A Shift-Share Analysis
3 Dec 1997 Whither the Renminbi?
2 Aug 1997 Quality of Employment Growth in Singapore: 1983-96
1 Jan 1997 Current Account Deficits in the ASEAN-3: Is there Cause for Concern?


MARKETASIA DISTRIBUTORS (S) PTE LTD601 Sims Drive #04-05 Pan-I Complex Singapore 387382 Tel: (65) 6744 8483 Fax: (65) 6744 3690
Email: [email protected] VISIT OUR WEBSITE @ http://www.marketasia.com.sg
Subscription Form Yes! I wish to subscribe to the Macroeconomic Review
SUBSCRIPTION RATES
Country 1 Year (Vol XI, Issue 1 and 2)
Singapore S$ 28.00
Name:
Company:
Address:
Job Title:
Postalcode:
Telephone: Fax:
E-mail:
Payment Options:Cheque/ Draft in Singapore Dollars (made payable to MarketAsia Distributors (S) Pte Ltd)
Credit Card Visa MasterCard Amex
Credit Card No:
Name (as appears on card):
Expiry Date: Signature:
I authorise the indicated amount to be charged to my credit card.
Please complete this subscription form and mail to:
Others S$ 75.00(Inclusive of GST)
(Inclusive of postage and handling)
GST REG No. M2-0077937-1