Embed Size (px)
Citation preview
M25 Junctions 27-28 Climbing Lane Study (Site 4): Post
Opening Project Evaluation
Post Opening Evaluation Report
JOB NUMBER: 4416515.1525.600 DOCUMENT REF: M25 J27-28_FINAL.doc
0 Final Report KP RS IJW PR 19/9/05
Originated Checked Reviewed Authorised Date
Revision Purpose Description
M25 CLIMBING LANE SITE 4: POST OPENING PROJECT EVALUATION
Post Opening Evaluation Report
i
Contents
Section Page
1. Introduction 1
Background 1
Scheme Objectives 3
Purpose of the Report 3
2. Data Collection 5
‘Before’ Surveys 5
‘After’ Surveys 5
3. Scheme Impact 6
Overview 6
Safety 6
Traffic Volume Changes 7
Congestion (Trafficmaster Spot Speeds) 7
4. Economic Impact of the Scheme 9
Introduction 9
Scheme Evaluation 9
Journey time Benefits/Disbenefits 10
Scheme Cost 11
5. Summary of Appraisal and Evaluation Summary Tables 13
Introduction 13
Appraisal Summary Table (AST) 13
Outturn Effects 14
6. Summary of Conclusions 15
Annex A – Analysis of Accident Data 17
Annex B – Analysis of Traffic Flow Data 20
Annex C – Original AST 23
Annex D – ATKINS EST 25
M25 CLIMBING LANE SITE 4: POST OPENING PROJECT EVALUATION
Post Opening Evaluation Report
ii
List of Tables
Table 3.1 - Accident Rate at Site Four 6
Table 3.2 – TrafficMaster Spot Speeds: Hours Where Speed<30mph: M26 26to28 Clockwise8
Table 3.3 – TrafficMaster Spot Speeds: Hours Where Speed<30mph: M26 26to28 Anti-
clockwise 8
Table 4.1 - Comparison between OPR COBA and Replica COBA Benefits 10
Table 4.2 - Conversion of Outturn Cost to Present Value Cost 11
Table 4.4 – Comparison of PAR and Post-Opening Economic Assessment 11
Table A1 - Summary of ‘Before’ Traffic Flow data from table B2 21
Table A2 - Before and After Survey Traffic Flow Comparison for Site 4 22
List of Figures
Figure 1.1 - Location of Climbing Lane Sites 1
Figure 1.2 - Detailed location of M25 Climbing Lane between Junctions 27 - 28 2
Figure 1.3 - Photograph of climbing lane site 4 2
Figure 3.1 - Location of Climbing Lane Site 4. 7
Figure 5.1 - An Example of a sign associated with the Climbing Lane 14
M25 CLIMBING LANE SITE 4: POST OPENING PROJECT EVALUATION
Post Opening Evaluation Report
1
1. Introduction
BACKGROUND
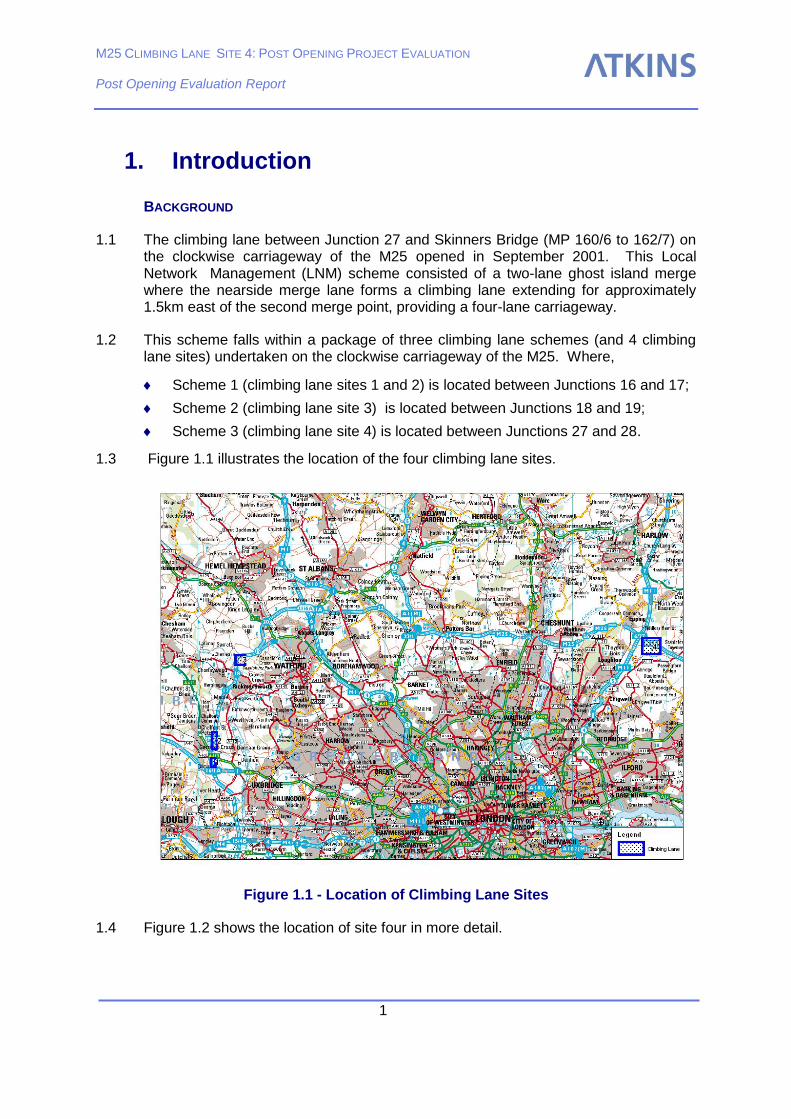
1.1 The climbing lane between Junction 27 and Skinners Bridge (MP 160/6 to 162/7) on the clockwise carriageway of the M25 opened in September 2001. This Local Network Management (LNM) scheme consisted of a two-lane ghost island merge where the nearside merge lane forms a climbing lane extending for approximately 1.5km east of the second merge point, providing a four-lane carriageway.
1.2 This scheme falls within a package of three climbing lane schemes (and 4 climbing lane sites) undertaken on the clockwise carriageway of the M25. Where,
Scheme 1 (climbing lane sites 1 and 2) is located between Junctions 16 and 17;
Scheme 2 (climbing lane site 3) is located between Junctions 18 and 19;
Scheme 3 (climbing lane site 4) is located between Junctions 27 and 28.
1.3 Figure 1.1 illustrates the location of the four climbing lane sites.
Figure 1.1 - Location of Climbing Lane Sites
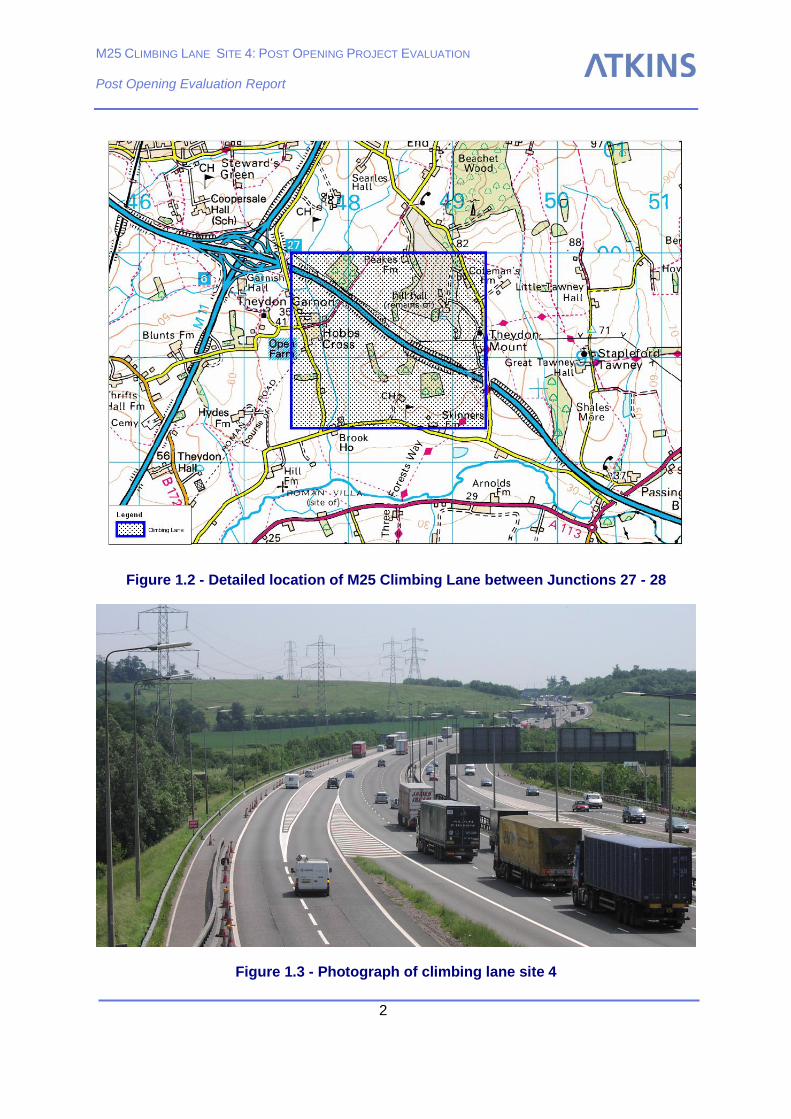
1.4 Figure 1.2 shows the location of site four in more detail.
M25 CLIMBING LANE SITE 4: POST OPENING PROJECT EVALUATION
Post Opening Evaluation Report
2
Figure 1.2 - Detailed location of M25 Climbing Lane between Junctions 27 - 28
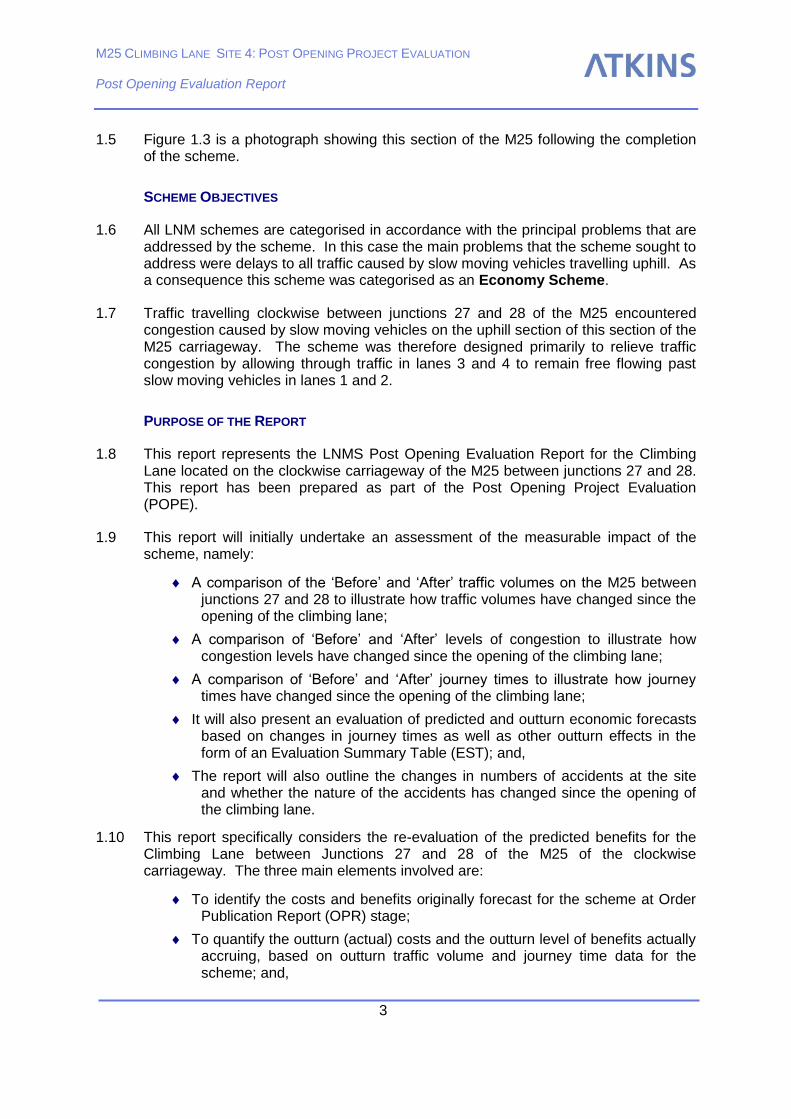
Figure 1.3 - Photograph of climbing lane site 4
M25 CLIMBING LANE SITE 4: POST OPENING PROJECT EVALUATION
Post Opening Evaluation Report
3
1.5 Figure 1.3 is a photograph showing this section of the M25 following the completion of the scheme.
SCHEME OBJECTIVES
1.6 All LNM schemes are categorised in accordance with the principal problems that are addressed by the scheme. In this case the main problems that the scheme sought to address were delays to all traffic caused by slow moving vehicles travelling uphill. As a consequence this scheme was categorised as an Economy Scheme.
1.7 Traffic travelling clockwise between junctions 27 and 28 of the M25 encountered congestion caused by slow moving vehicles on the uphill section of this section of the M25 carriageway. The scheme was therefore designed primarily to relieve traffic congestion by allowing through traffic in lanes 3 and 4 to remain free flowing past slow moving vehicles in lanes 1 and 2.
PURPOSE OF THE REPORT
1.8 This report represents the LNMS Post Opening Evaluation Report for the Climbing Lane located on the clockwise carriageway of the M25 between junctions 27 and 28. This report has been prepared as part of the Post Opening Project Evaluation (POPE).
1.9 This report will initially undertake an assessment of the measurable impact of the scheme, namely:
A comparison of the ‘Before’ and ‘After’ traffic volumes on the M25 between junctions 27 and 28 to illustrate how traffic volumes have changed since the opening of the climbing lane;
A comparison of ‘Before’ and ‘After’ levels of congestion to illustrate how congestion levels have changed since the opening of the climbing lane;
A comparison of ‘Before’ and ‘After’ journey times to illustrate how journey times have changed since the opening of the climbing lane;
It will also present an evaluation of predicted and outturn economic forecasts based on changes in journey times as well as other outturn effects in the form of an Evaluation Summary Table (EST); and,
The report will also outline the changes in numbers of accidents at the site and whether the nature of the accidents has changed since the opening of the climbing lane.
1.10 This report specifically considers the re-evaluation of the predicted benefits for the Climbing Lane between Junctions 27 and 28 of the M25 of the clockwise carriageway. The three main elements involved are:
To identify the costs and benefits originally forecast for the scheme at Order Publication Report (OPR) stage;
To quantify the outturn (actual) costs and the outturn level of benefits actually accruing, based on outturn traffic volume and journey time data for the scheme; and,
M25 CLIMBING LANE SITE 4: POST OPENING PROJECT EVALUATION
Post Opening Evaluation Report
4
To compare the results and quantify the difference in the Present Value of Benefits (PVB).
1.11 Following this introduction the report has been divided into five further sections as follows:
Section 2 outlines existing data collation and new data collection.
Section 3 presents the outturn effects of the scheme (traffic flows, journey times and accident numbers);
Section 4 presents the original economic results, calculated by the Department for Transport’s program COBA for this scheme and the level of benefits that would have been forecast if outturn traffic volumes and journey times were known at the time. The section also compares the COBA and POPE methodologies;
Section 5 presents the original Appraisal Summary Table (AST) for the M25 Site 4 climbing lane, and then re-evaluates these predictions with an Evaluation Summary Table (EST). The section also gives an early indication of changes in the number of accidents at the site; and finally
Section 6 summarises the main conclusions from the evaluations and the limitations to use.
M25 CLIMBING LANE SITE 4: POST OPENING PROJECT EVALUATION
Post Opening Evaluation Report
5
2. Data Collection
‘BEFORE’ SURVEYS
2.1 The PAR document submitted in support of the scheme was based upon the following data:
Economic Evaluation using COBA.
Traffic flow data from the Highways Agency monitoring.
Accident data from the Highways Agency.
‘AFTER’ SURVEYS
2.2 In the course of undertaking the LNM evaluation of the scheme, the following data was utilised:
Traffic flow data from the Highways Agency Monitoring South.
Accident data from Managing Agent.
COBA data from Economic Justification reports;
Automatic Traffic Counts
2.3 Automatic traffic counts were obtained for the following site locations:
2710 (Junction 27 – 28, CW);
2720 (Junction 27 – 28, AC);
2610 (Junction 27-26, AC).
Accident Data
2.4 Accident data was obtained for the years 1999 to 2003 for M25 Junctions 27 to 28. Only a proportion of accident descriptions were available so this information was excluded from the report.
M25 CLIMBING LANE SITE 4: POST OPENING PROJECT EVALUATION
Post Opening Evaluation Report
6
3. Scheme Impact
OVERVIEW
3.1 This section provides details of the outturn safety and traffic impacts of the scheme, and each of these impacts is discussed below.
SAFETY
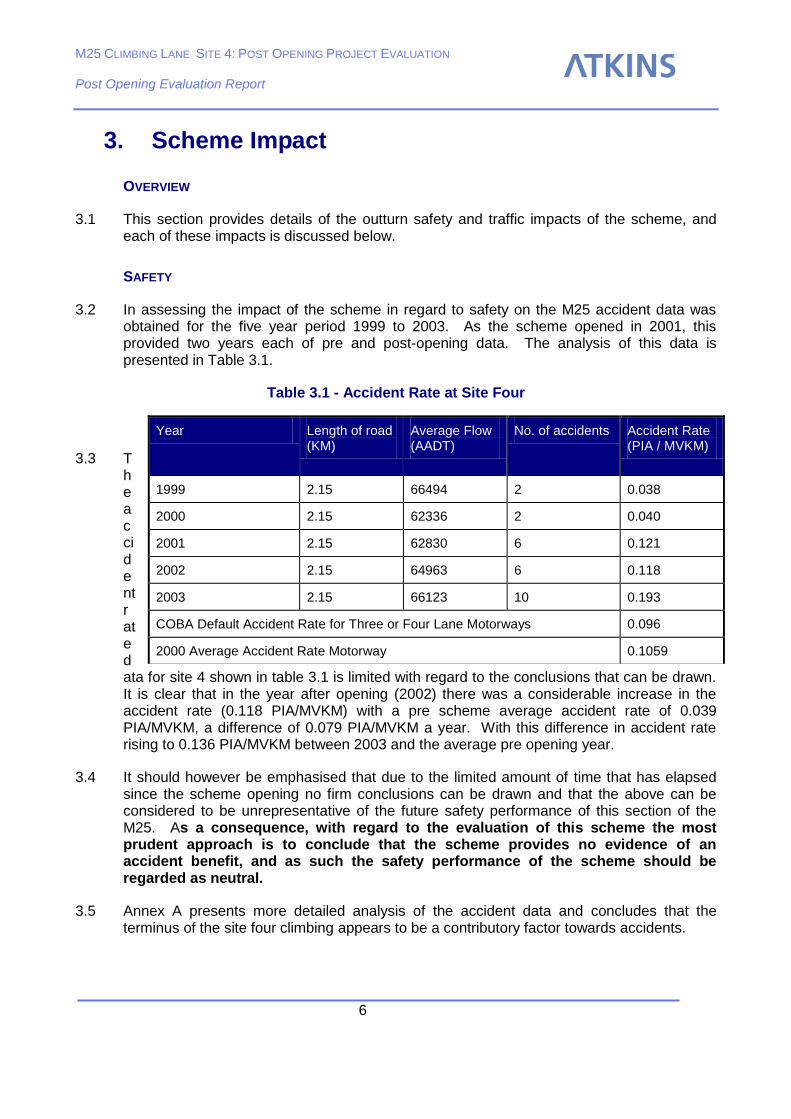
3.2 In assessing the impact of the scheme in regard to safety on the M25 accident data was obtained for the five year period 1999 to 2003. As the scheme opened in 2001, this provided two years each of pre and post-opening data. The analysis of this data is presented in Table 3.1.
Table 3.1 - Accident Rate at Site Four
3.3 The accident rate data for site 4 shown in table 3.1 is limited with regard to the conclusions that can be drawn. It is clear that in the year after opening (2002) there was a considerable increase in the accident rate (0.118 PIA/MVKM) with a pre scheme average accident rate of 0.039 PIA/MVKM, a difference of 0.079 PIA/MVKM a year. With this difference in accident rate rising to 0.136 PIA/MVKM between 2003 and the average pre opening year.
3.4 It should however be emphasised that due to the limited amount of time that has elapsed since the scheme opening no firm conclusions can be drawn and that the above can be considered to be unrepresentative of the future safety performance of this section of the M25. As a consequence, with regard to the evaluation of this scheme the most prudent approach is to conclude that the scheme provides no evidence of an accident benefit, and as such the safety performance of the scheme should be regarded as neutral.
3.5 Annex A presents more detailed analysis of the accident data and concludes that the terminus of the site four climbing appears to be a contributory factor towards accidents.
Year Length of road (KM)
Average Flow (AADT)
No. of accidents Accident Rate (PIA / MVKM)
1999 2.15 66494 2 0.038
2000 2.15 62336 2 0.040
2001 2.15 62830 6 0.121
2002 2.15 64963 6 0.118
2003 2.15 66123 10 0.193
COBA Default Accident Rate for Three or Four Lane Motorways 0.096
2000 Average Accident Rate Motorway 0.1059
M25 CLIMBING LANE SITE 4: POST OPENING PROJECT EVALUATION
Post Opening Evaluation Report
7
TRAFFIC VOLUME CHANGES
3.6 In assessing the impact of the scheme in regard to traffic flows on the M25 flow data was obtained from local TITAN Sites. The analysis of this data is presented in Annex B.
3.7 Table B2 summarises the before and after traffic flows through the relevant sections of carriageway on a weekly basis, and also provides a comparison with the same period before flows for the relevant counters. It indicates a larger increase in traffic flow in the morning peak period and the evening peak period on the clockwise carriageway, than on the anticlockwise carriageway (barring February when roadwork’s were undertaken upstream in the Bell Common Tunnel area).
3.8 The implementation of a climbing lane at site 4 has increased the traffic flowing through the clockwise carriageway between junctions 27 and 28 of the M25, and that this increase is greater than that of the corresponding traffic flows on the anticlockwise carriageway.
CONGESTION (TRAFFICMASTER SPOT SPEEDS)
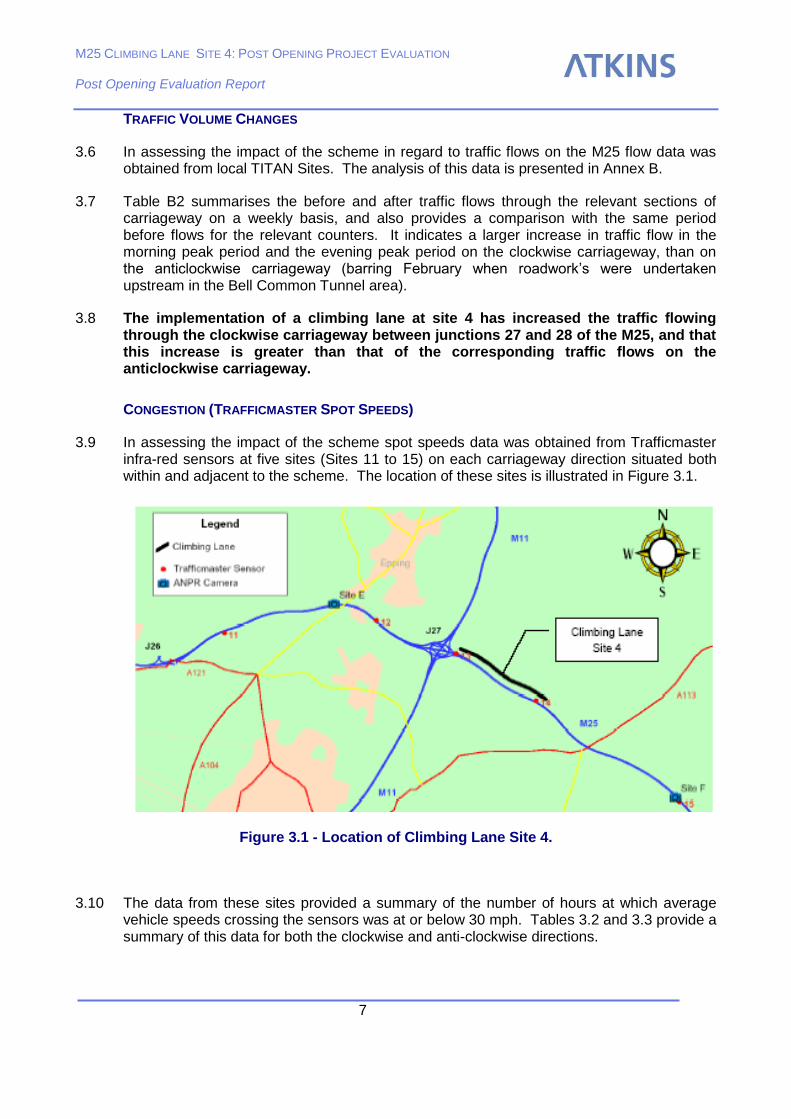
3.9 In assessing the impact of the scheme spot speeds data was obtained from Trafficmaster infra-red sensors at five sites (Sites 11 to 15) on each carriageway direction situated both within and adjacent to the scheme. The location of these sites is illustrated in Figure 3.1.
Figure 3.1 - Location of Climbing Lane Site 4.
3.10 The data from these sites provided a summary of the number of hours at which average vehicle speeds crossing the sensors was at or below 30 mph. Tables 3.2 and 3.3 provide a summary of this data for both the clockwise and anti-clockwise directions.
M25 CLIMBING LANE SITE 4: POST OPENING PROJECT EVALUATION
Post Opening Evaluation Report
8
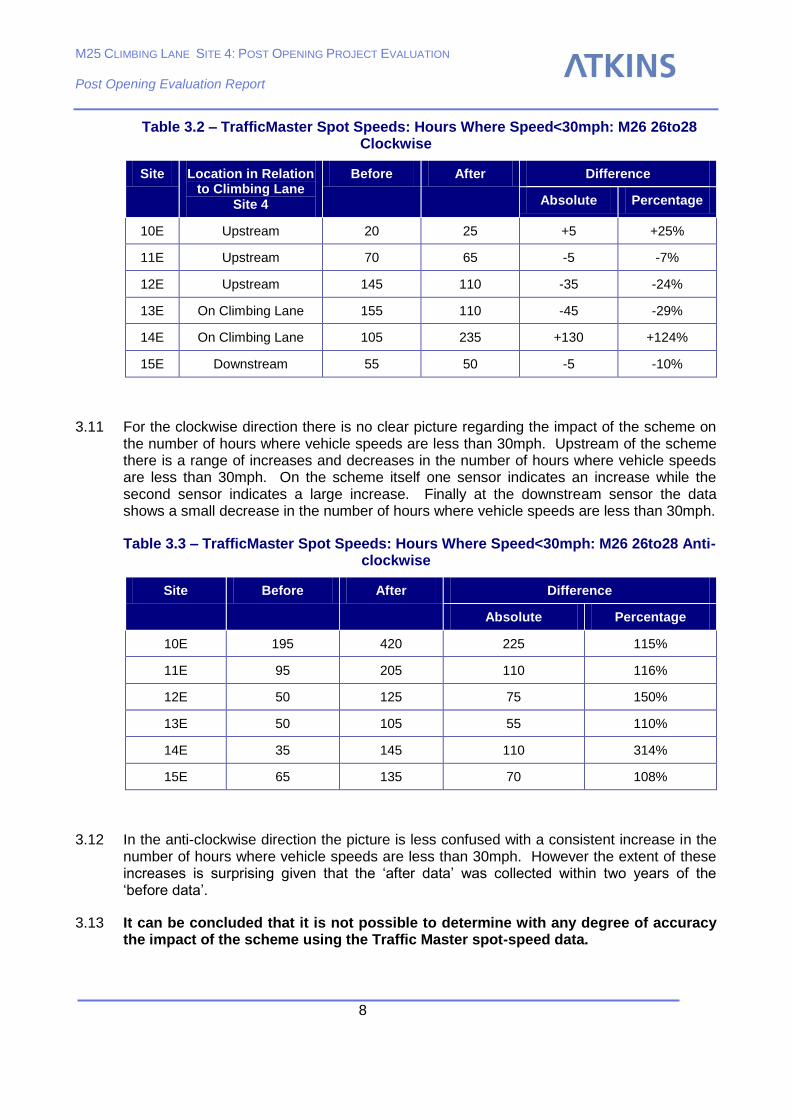
Table 3.2 – TrafficMaster Spot Speeds: Hours Where Speed<30mph: M26 26to28 Clockwise
Site Location in Relation to Climbing Lane
Site 4
Before After Difference
Absolute Percentage
10E Upstream 20 25 +5 +25%
11E Upstream 70 65 -5 -7%
12E Upstream 145 110 -35 -24%
13E On Climbing Lane 155 110 -45 -29%
14E On Climbing Lane 105 235 +130 +124%
15E Downstream 55 50 -5 -10%
3.11 For the clockwise direction there is no clear picture regarding the impact of the scheme on the number of hours where vehicle speeds are less than 30mph. Upstream of the scheme there is a range of increases and decreases in the number of hours where vehicle speeds are less than 30mph. On the scheme itself one sensor indicates an increase while the second sensor indicates a large increase. Finally at the downstream sensor the data shows a small decrease in the number of hours where vehicle speeds are less than 30mph.
Table 3.3 – TrafficMaster Spot Speeds: Hours Where Speed<30mph: M26 26to28 Anti-clockwise
Site Before After Difference
Absolute Percentage
10E 195 420 225 115%
11E 95 205 110 116%
12E 50 125 75 150%
13E 50 105 55 110%
14E 35 145 110 314%
15E 65 135 70 108%
3.12 In the anti-clockwise direction the picture is less confused with a consistent increase in the number of hours where vehicle speeds are less than 30mph. However the extent of these increases is surprising given that the ‘after data’ was collected within two years of the ‘before data’.
3.13 It can be concluded that it is not possible to determine with any degree of accuracy the impact of the scheme using the Traffic Master spot-speed data.
M25 CLIMBING LANE SITE 4: POST OPENING PROJECT EVALUATION
Post Opening Evaluation Report
9
4. Economic Impact of the Scheme
INTRODUCTION
4.1 This section assesses the level of economic benefits predicted for the scheme and compares these predictions with actual benefits accrued when considering actual traffic volume changes and actual journey time benefits. The usual approach taken is termed the Post Opening Project Evaluation (POPE) methodology. The basis of the POPE methodology is that through previous economic evaluations undertaken it has been identified that the majority of benefits are derived primarily from two areas:
Accident benefits; and
Link transit time (vehicle hours) benefit/disbenefits.
As such, link transit time, (which is represented by traffic volumes multiplied by journey times) and the number of accidents can be collected before and after scheme opening and the difference between these observed values can be compared to the difference shown in time and accidents for the same links shown in the original assessment. The premise of the POPE methodology is that the change in the observed flows, times and accidents can be directly associated to the economic benefits predicted for this scheme. However, as detailed below, the available data is not sufficiently consistent to allow a POPE economic evaluation of the scheme.
SCHEME EVALUATION
COBA Replication
4.2 As there were no COBA input files made available it was necessary to re-build the original COBA files on the basis of available information.
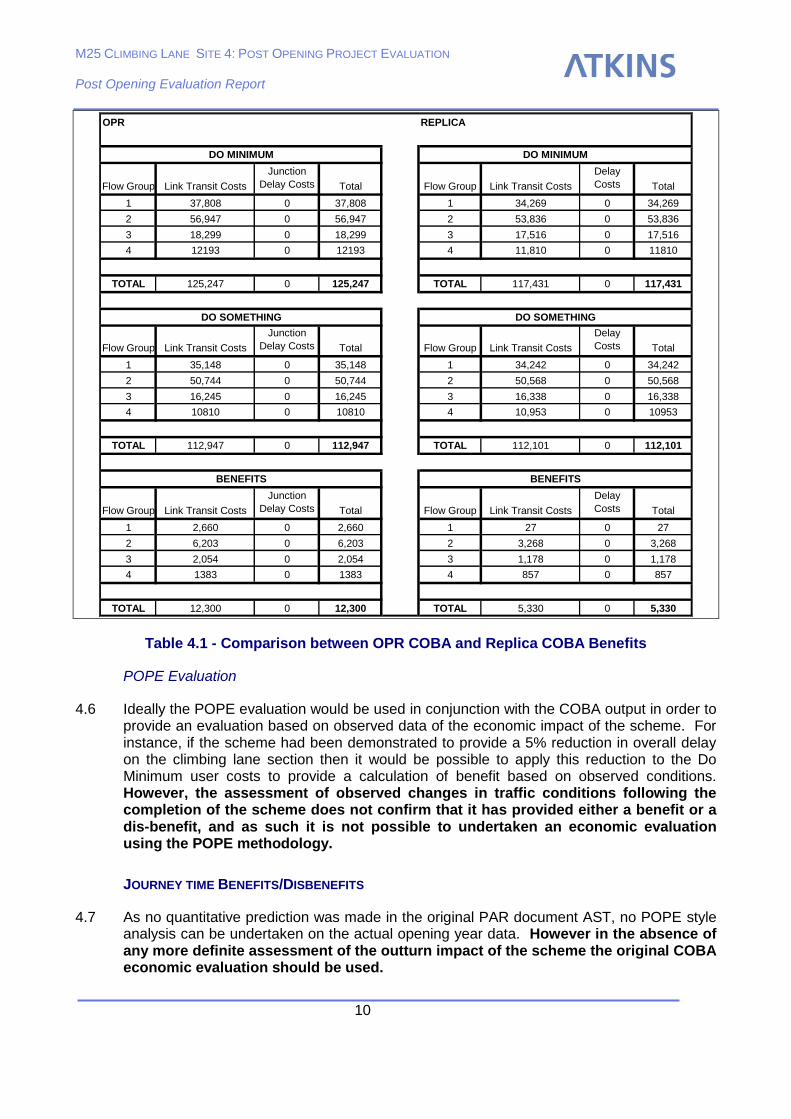
4.3 Consultant Kennedy-Donkin’s 'Economic Justification for Site 4 Proposals' report describes the input to the COBA program and the results obtained from it. Table 4.1 illustrates a comparison of the Travel Time costs output by the replica COBA and those reported in the economic justification report for the OPR COBA.
4.4 The replica results have been output in the same manner as the OPR results. That is, four separate COBA runs were conducted, one for each of the four traffic flow groups. The economic justification used this method in order to take account of the different traffic growth cut off years imposed on the flow groups by the constricted adjoining road network.
4.5 Whilst the replica of the Do-Something network appears to have been quite successful, the Do-Minimum Link Transit Costs are significantly lower than those reported in the economic justification. The sensitivity of the Do-Minimum network to various detail changes to the COBA input has been tested, but is has not been possible to narrow the gap between OPR and replica results significantly.
M25 CLIMBING LANE SITE 4: POST OPENING PROJECT EVALUATION
Post Opening Evaluation Report
10
OPR REPLICA
Flow Group Link Transit Costs
Junction
Delay Costs Total Flow Group Link Transit Costs
Junction
Delay
Costs Total
1 37,808 0 37,808 1 34,269 0 34,269
2 56,947 0 56,947 2 53,836 0 53,836
3 18,299 0 18,299 3 17,516 0 17,516
4 12193 0 12193 4 11,810 0 11810
TOTAL 125,247 0 125,247 TOTAL 117,431 0 117,431
Flow Group Link Transit Costs
Junction
Delay Costs Total Flow Group Link Transit Costs
Junction
Delay
Costs Total
1 35,148 0 35,148 1 34,242 0 34,242
2 50,744 0 50,744 2 50,568 0 50,568
3 16,245 0 16,245 3 16,338 0 16,338
4 10810 0 10810 4 10,953 0 10953
TOTAL 112,947 0 112,947 TOTAL 112,101 0 112,101
Flow Group Link Transit Costs
Junction
Delay Costs Total Flow Group Link Transit Costs
Junction
Delay
Costs Total
1 2,660 0 2,660 1 27 0 27
2 6,203 0 6,203 2 3,268 0 3,268
3 2,054 0 2,054 3 1,178 0 1,178
4 1383 0 1383 4 857 0 857
TOTAL 12,300 0 12,300 TOTAL 5,330 0 5,330
BENEFITSBENEFITS
DO MINIMUMDO MINIMUM
DO SOMETHINGDO SOMETHING
Table 4.1 - Comparison between OPR COBA and Replica COBA Benefits
POPE Evaluation
4.6 Ideally the POPE evaluation would be used in conjunction with the COBA output in order to provide an evaluation based on observed data of the economic impact of the scheme. For instance, if the scheme had been demonstrated to provide a 5% reduction in overall delay on the climbing lane section then it would be possible to apply this reduction to the Do Minimum user costs to provide a calculation of benefit based on observed conditions. However, the assessment of observed changes in traffic conditions following the completion of the scheme does not confirm that it has provided either a benefit or a dis-benefit, and as such it is not possible to undertaken an economic evaluation using the POPE methodology.
JOURNEY TIME BENEFITS/DISBENEFITS
4.7 As no quantitative prediction was made in the original PAR document AST, no POPE style analysis can be undertaken on the actual opening year data. However in the absence of any more definite assessment of the outturn impact of the scheme the original COBA economic evaluation should be used.
M25 CLIMBING LANE SITE 4: POST OPENING PROJECT EVALUATION
Post Opening Evaluation Report
11
SCHEME COST
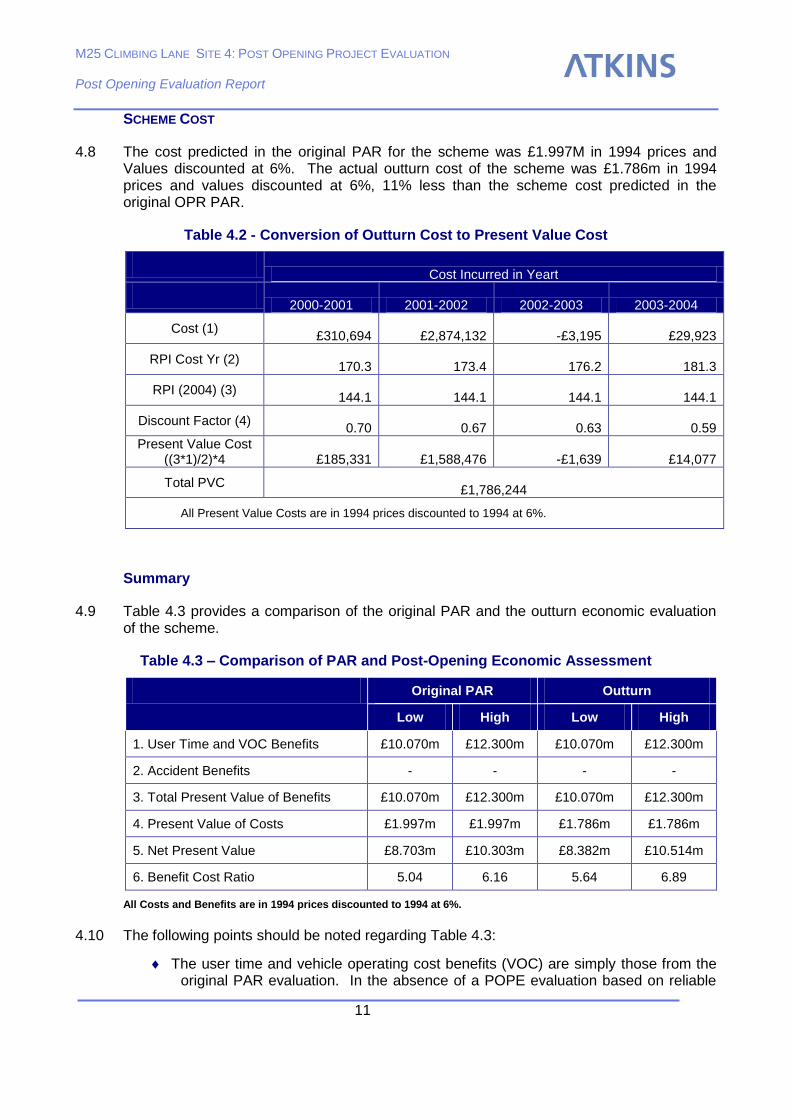
4.8 The cost predicted in the original PAR for the scheme was £1.997M in 1994 prices and Values discounted at 6%. The actual outturn cost of the scheme was £1.786m in 1994 prices and values discounted at 6%, 11% less than the scheme cost predicted in the original OPR PAR.
Table 4.2 - Conversion of Outturn Cost to Present Value Cost
Cost Incurred in Yeart
2000-2001 2001-2002 2002-2003 2003-2004
Cost (1) £310,694 £2,874,132 -£3,195 £29,923
RPI Cost Yr (2) 170.3 173.4 176.2 181.3
RPI (2004) (3) 144.1 144.1 144.1 144.1
Discount Factor (4) 0.70 0.67 0.63 0.59
Present Value Cost ((3*1)/2)*4 £185,331 £1,588,476 -£1,639 £14,077
Total PVC £1,786,244
All Present Value Costs are in 1994 prices discounted to 1994 at 6%.
Summary
4.9 Table 4.3 provides a comparison of the original PAR and the outturn economic evaluation of the scheme.
Table 4.3 – Comparison of PAR and Post-Opening Economic Assessment
Original PAR Outturn
Low High Low High
1. User Time and VOC Benefits £10.070m £12.300m £10.070m £12.300m
2. Accident Benefits - - - -
3. Total Present Value of Benefits £10.070m £12.300m £10.070m £12.300m
4. Present Value of Costs £1.997m £1.997m £1.786m £1.786m
5. Net Present Value £8.703m £10.303m £8.382m £10.514m
6. Benefit Cost Ratio 5.04 6.16 5.64 6.89
All Costs and Benefits are in 1994 prices discounted to 1994 at 6%.
4.10 The following points should be noted regarding Table 4.3:
The user time and vehicle operating cost benefits (VOC) are simply those from the original PAR evaluation. In the absence of a POPE evaluation based on reliable
M25 CLIMBING LANE SITE 4: POST OPENING PROJECT EVALUATION
Post Opening Evaluation Report
12
observed data, and also in the absence of an accurate replicated COBA, there is little alternative but to accept the original PAR economic evaluation of the scheme benefits; and,
The original PAR evaluation did not claim any scheme accident benefits. As detailed above, consideration of the observed accident record following the scheme completion indicates that the scheme may have resulted in a slight dis-benefit. Given the relatively limited scope of the available accident data, it is safest to conclude that the scheme has not demonstrated an accident benefit, and as such no accident benefits are claimed in the outturn economic evaluation.
4.11 The slight increase in the outturn scheme PVC compared to the PAR document PVC has the knock-on effect of reducing both the overall net present value (NPV) from and the benefit cost ratio. However, the scheme is still robust in terms of its overall economic evaluation.
M25 CLIMBING LANE SITE 4: POST OPENING PROJECT EVALUATION
Post Opening Evaluation Report
13
5. Summary of Appraisal and Evaluation Summary Tables
INTRODUCTION
5.1 In order to evaluate fully the effects of the opening of the climbing lane between junctions 27 and 28 of the M25, we have undertaken a review of the Appraisal Summary Table (AST) prepared for the original PAR document. The AST is the record of the predicted impacts of the scheme. Annex C presents this original AST for M25 Site 4 Climbing Lane.
5.2 This AST summarises the predicted impacts of the scheme across a range of different sub-objectives. The sub-objectives within an AST are:
Environmental impacts such as Noise, Local Air Quality, Landscape, Biodiversity, Heritage and Water;
Safety Impacts, measuring and reduction in accidents;
Economy impacts, including savings in Journey time and Vehicle Operating Costs, Scheme Cost and Reliability of journeys;
Accessibility impacts, such as change in access to public transport, severance within communities and impact on pedestrian and other modes; and
Integration, measured by how the scheme accords with local policy.
APPRAISAL SUMMARY TABLE (AST)
5.3 The main points to note from the M25 Climbing lane Site 4 AST are:
Environment
Slight reduction in pollution levels due to reduction in congestion.
Safety
A reduction in the risk of accidents due to reduced congestion.
Economy
Predicted a journey time saving through a reduction in congestion.
Substantial improvement, in terms of improved journey times due to reduction in delays.
Substantial improvement in journey time reliability due to reduced congestion.
Accessibility
No impacts predicted.
Integration
No impacts predicted
M25 CLIMBING LANE SITE 4: POST OPENING PROJECT EVALUATION
Post Opening Evaluation Report
14
Integration
No impacts predicted
OUTTURN EFFECTS
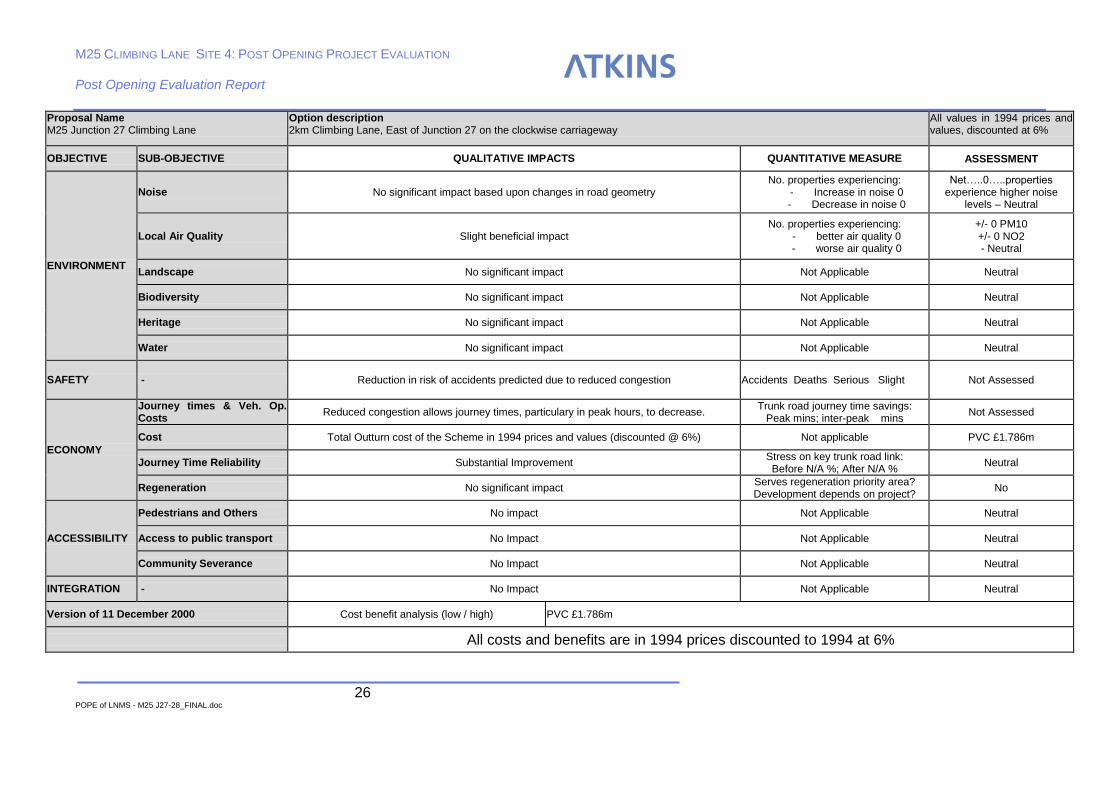
5.4 In order to assess the actual or outturn effects of the opening of the scheme, we have produced an Evaluation Summary Table (EST), which mirrors the appearance of the AST, and includes details of the actual sub-objectives that have been evaluated.
5.5 Annex D provides the EST and the main points to note on the EST are:
Environmental Impacts
Pollution Levels
5.6 The prediction of the PAR document was that a reduction in congestion would lead to a reduction in pollutants and specifically CO2 emissions. There is no conclusive post scheme evidence of a significant reduction in congestion levels; therefore this prediction cannot be validated.
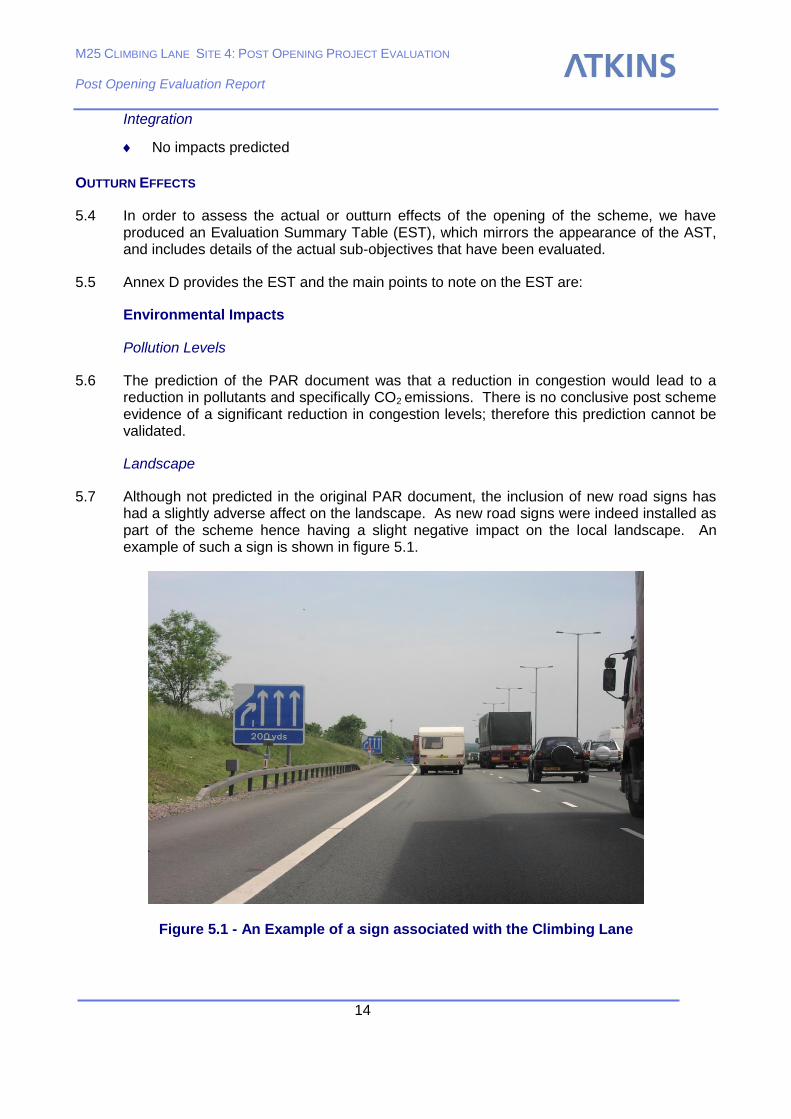
Landscape
5.7 Although not predicted in the original PAR document, the inclusion of new road signs has had a slightly adverse affect on the landscape. As new road signs were indeed installed as part of the scheme hence having a slight negative impact on the local landscape. An example of such a sign is shown in figure 5.1.
Figure 5.1 - An Example of a sign associated with the Climbing Lane
M25 CLIMBING LANE SITE 4: POST OPENING PROJECT EVALUATION
Post Opening Evaluation Report
15 POPE of LNMS - M25 J27-28_FINAL.doc
6. Summary of Conclusions
6.1 The highways Agency has a requirement to carry out re-evaluations of new trunk road schemes. The purpose of these re-evaluations is to provide a comparison of the predicted and actual impacts accruing from new schemes and to determine how far the Highways Agency achieves the objectives and benefits from its road programme.
6.2 In summary, the main points to note from the Evaluation of the M25 junction 27 - 28 Climbing Lane scheme are:
Pollution Levels
6.3 The prediction of the PAR document was that a reduction in congestion would lead to a reduction in pollutants and specifically CO2 emissions. There is no conclusive post scheme evidence of a significant reduction in congestion at site 4. Therefore this prediction cannot be validated.
Landscape
The inclusion of new road signs at the climbing lane site will have a slightly adverse affect on the landscape.
Safety
6.4 The PAR document predicted a substantial improvement in terms of reduced risk of potential accidents.
6.5 Although post opening data is limited, in 2002 (post opening year) there was a clear increase in the accident rate at climbing lane site 4 of 0.079 PIA/MVKM, leading to a post opening year accident rate of 0.118 PIA/MVKM.
6.6 It should however be re-emphasised that due to the limited amount of time that has elapsed since the schemes opening that no firm conclusions can be drawn and that the above is highly unrepresentative of future levels of benefit derived from the schemes implementation.
Traffic Volumes
6.7 The implementation of a climbing lane at site 4 has increased the traffic flowing through the clockwise carriageway between junctions 27 and 28 of the M25, and that this increase is greater than that of the corresponding traffic flows on the anticlockwise carriageway.
Congestion
6.8 The sensors between junction 27 and 28 of the anticlockwise carriageway on the M25 showed large increases in the average number of hours of congestion under 30mph post scheme opening, whereas on the clockwise carriageway far smaller increases were felt. Indicating that climbing lane site 4 has offered a degree of restraint on the growth of congestion levels on the clockwise carriageway of the M25 between junctions 27-28.
M25 CLIMBING LANE SITE 4: POST OPENING PROJECT EVALUATION
Post Opening Evaluation Report
16 POPE of LNMS - M25 J27-28_FINAL.doc
Journey Times
6.9 Savings - If the original PAR document’s assertion that a reduction in congestion leads to a reduction in journey times is held, then it can be assumed that no reduction in journey times has occurred.
6.10 Reliability - The original PAR document predicted a substantial improvement in journey time reliability. Although the cause for said improvement is not stated in the PAR document, similar schemes have claimed similar benefits based upon a reduction in congestion. If the assumption is held for this scheme, then no improvement in journey time reliability has occurred through the construction of the climbing lane located at site 4.
Scheme Costs (PVC)
6.11 The cost predicted in the original PAR for the scheme was £1.997M in 1994 prices and Values discounted at 6%. The actual outturn cost of the scheme was £1.786m in 1994 prices and values discounted at 6%, 11% less than the scheme cost predicted in the original OPR PAR.
Overall
6.12 As the economic benefits of the scheme cannot be assessed the original PAR documents predicted levels of economic benefit over 30 years cannot be validated. However the predicted decrease in the accident rate at the site appears on initial examination to be in error as an increase in the accident rate was observed in the opening year. Although safety benefits cannot be fully appreciated until more data is available.
6.13 The outturn cost of the scheme was 11% lower than forecast in the original PAR document.
6.14 The scheme should be re-evaluated in future years when more post opening data is available. This will enable more robust conclusions to be drawn. Especially regarding the levels of accident benefits achieved.
M25 CLIMBING LANE SITE 4: POST OPENING PROJECT EVALUATION
Post Opening Evaluation Report
17 POPE of LNMS - M25 J27-28_FINAL.doc
Annex A – Analysis of Accident Data
M25 CLIMBING LANE SITE 4: POST OPENING PROJECT EVALUATION
Post Opening Evaluation Report
18 POPE of LNMS - M25 J27-28_FINAL.doc
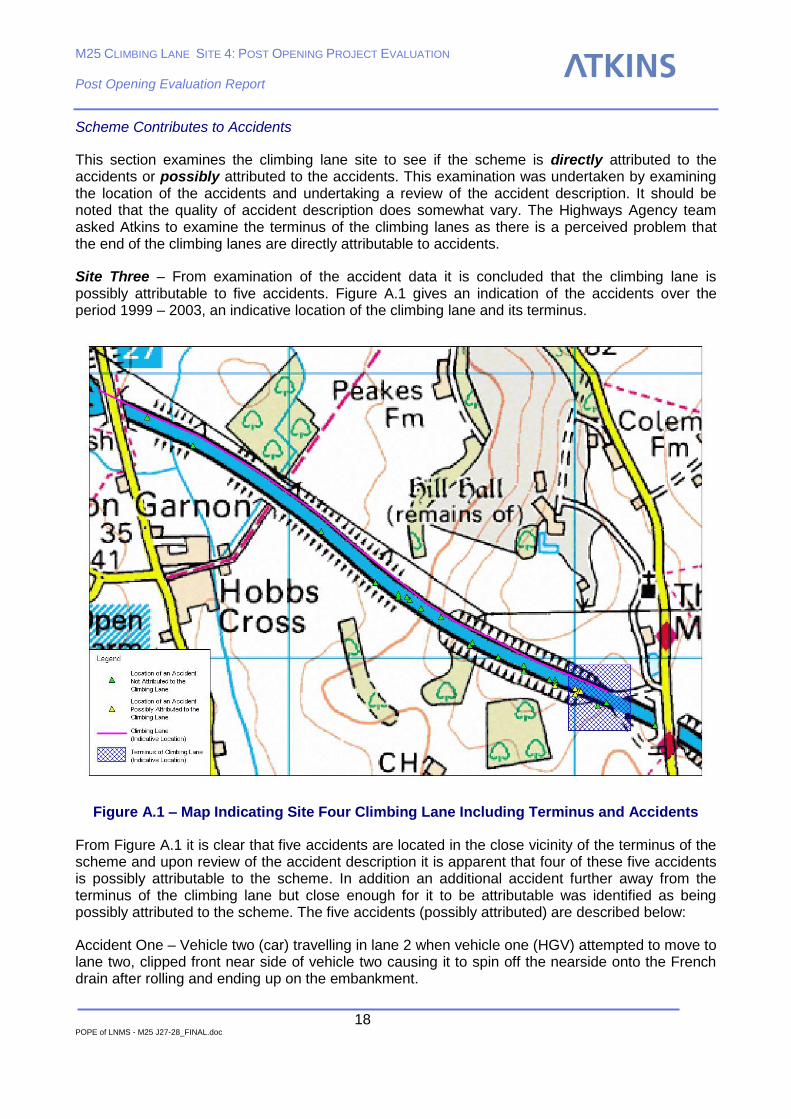
Scheme Contributes to Accidents
This section examines the climbing lane site to see if the scheme is directly attributed to the accidents or possibly attributed to the accidents. This examination was undertaken by examining the location of the accidents and undertaking a review of the accident description. It should be noted that the quality of accident description does somewhat vary. The Highways Agency team asked Atkins to examine the terminus of the climbing lanes as there is a perceived problem that the end of the climbing lanes are directly attributable to accidents.
Site Three – From examination of the accident data it is concluded that the climbing lane is possibly attributable to five accidents. Figure A.1 gives an indication of the accidents over the period 1999 – 2003, an indicative location of the climbing lane and its terminus.
Figure A.1 – Map Indicating Site Four Climbing Lane Including Terminus and Accidents
From Figure A.1 it is clear that five accidents are located in the close vicinity of the terminus of the scheme and upon review of the accident description it is apparent that four of these five accidents is possibly attributable to the scheme. In addition an additional accident further away from the terminus of the climbing lane but close enough for it to be attributable was identified as being possibly attributed to the scheme. The five accidents (possibly attributed) are described below:
Accident One – Vehicle two (car) travelling in lane 2 when vehicle one (HGV) attempted to move to lane two, clipped front near side of vehicle two causing it to spin off the nearside onto the French drain after rolling and ending up on the embankment.
M25 CLIMBING LANE SITE 4: POST OPENING PROJECT EVALUATION
Post Opening Evaluation Report
19 POPE of LNMS - M25 J27-28_FINAL.doc
Accident Two – Vehicle one (German registered lorry) moved from lane one to lane two. Vehicle two (car) was travelling in lane two but was in driver of vehicle one blindspot. Vehicle one then collided with rear of vehicle two.
Accident Three – Vehicle two was in lane two. Vehicle one pulled into lane two colliding with rear near side quarter of vehicle two. Vehicle two has spun and been struck by vehicle one;
Accident Four – Vehicle one (an Italian HGV, left hand drive) travelling in lane one. Vehicle two (car) was overtaking vehicle one in lane two. Vehicle one indicated and pulled into lane two unaware of the presence of vehicle two on his offside as it was located in the blindspot.
Accident Five – Vehicle one (HGV) in lane one, vehicle two (car) in lane two next to vehicle one. Vehicle one moved into lane two to attempt to overtake but struck vehicle two;
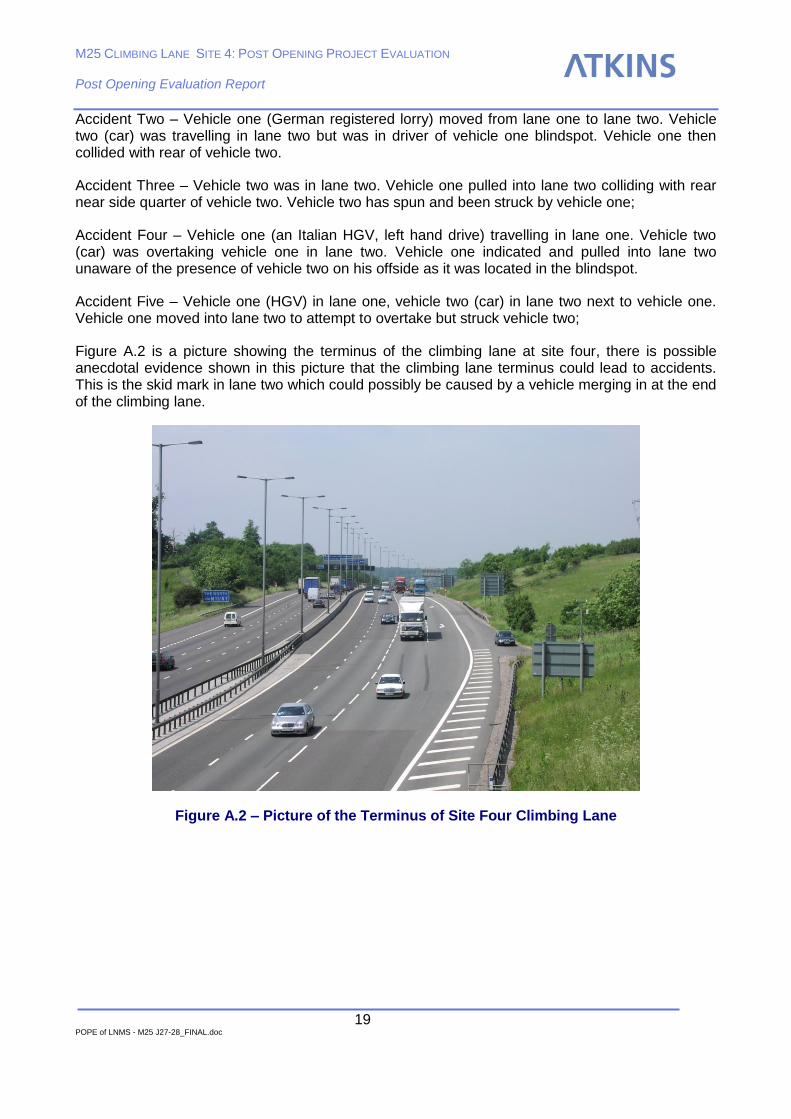
Figure A.2 is a picture showing the terminus of the climbing lane at site four, there is possible anecdotal evidence shown in this picture that the climbing lane terminus could lead to accidents. This is the skid mark in lane two which could possibly be caused by a vehicle merging in at the end of the climbing lane.
Figure A.2 – Picture of the Terminus of Site Four Climbing Lane
M25 CLIMBING LANE SITE 4: POST OPENING PROJECT EVALUATION
Post Opening Evaluation Report
20 POPE of LNMS - M25 J27-28_FINAL.doc
Annex B – Analysis of Traffic Flow Data
M25 CLIMBING LANE SITE 4: POST OPENING PROJECT EVALUATION
Post Opening Evaluation Report
21 POPE of LNMS - M25 J27-28_FINAL.doc
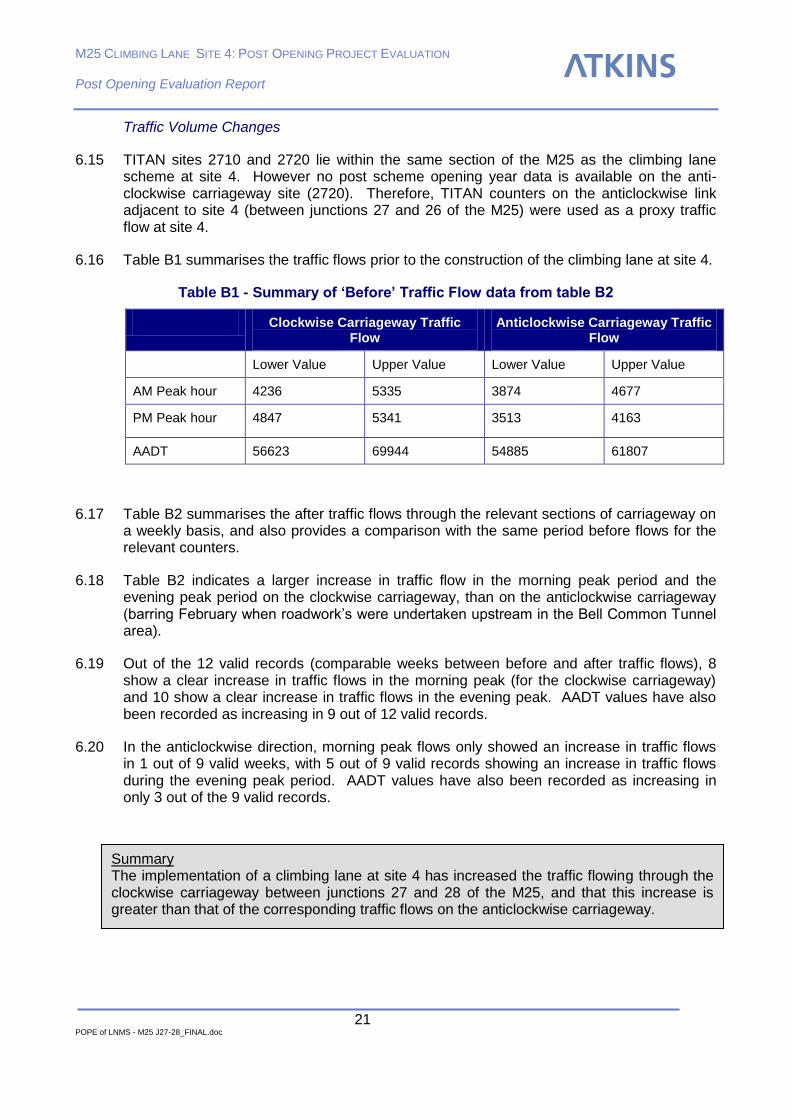
Traffic Volume Changes
6.15 TITAN sites 2710 and 2720 lie within the same section of the M25 as the climbing lane scheme at site 4. However no post scheme opening year data is available on the anti-clockwise carriageway site (2720). Therefore, TITAN counters on the anticlockwise link adjacent to site 4 (between junctions 27 and 26 of the M25) were used as a proxy traffic flow at site 4.
6.16 Table B1 summarises the traffic flows prior to the construction of the climbing lane at site 4.
Table B1 - Summary of ‘Before’ Traffic Flow data from table B2
Clockwise Carriageway Traffic Flow
Anticlockwise Carriageway Traffic Flow
Lower Value Upper Value Lower Value Upper Value
AM Peak hour 4236 5335 3874 4677
PM Peak hour 4847 5341 3513 4163
AADT 56623 69944 54885 61807
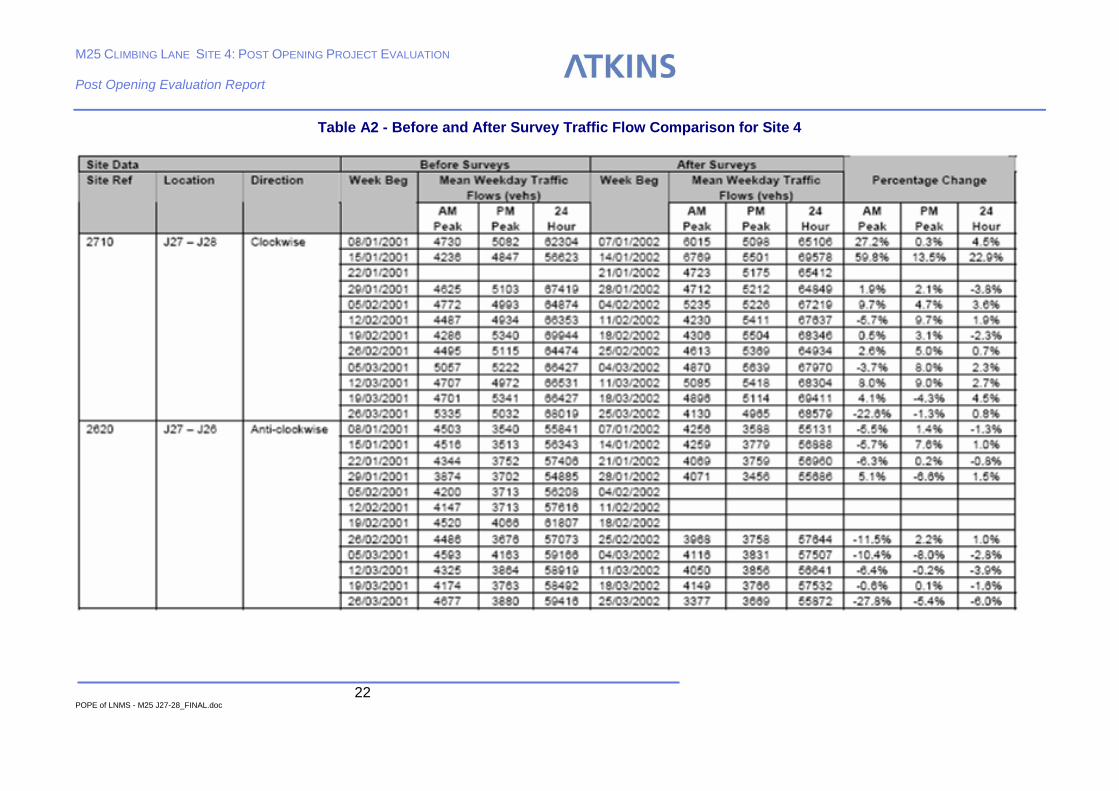
6.17 Table B2 summarises the after traffic flows through the relevant sections of carriageway on a weekly basis, and also provides a comparison with the same period before flows for the relevant counters.
6.18 Table B2 indicates a larger increase in traffic flow in the morning peak period and the evening peak period on the clockwise carriageway, than on the anticlockwise carriageway (barring February when roadwork’s were undertaken upstream in the Bell Common Tunnel area).
6.19 Out of the 12 valid records (comparable weeks between before and after traffic flows), 8 show a clear increase in traffic flows in the morning peak (for the clockwise carriageway) and 10 show a clear increase in traffic flows in the evening peak. AADT values have also been recorded as increasing in 9 out of 12 valid records.
6.20 In the anticlockwise direction, morning peak flows only showed an increase in traffic flows in 1 out of 9 valid weeks, with 5 out of 9 valid records showing an increase in traffic flows during the evening peak period. AADT values have also been recorded as increasing in only 3 out of the 9 valid records.
Summary The implementation of a climbing lane at site 4 has increased the traffic flowing through the clockwise carriageway between junctions 27 and 28 of the M25, and that this increase is greater than that of the corresponding traffic flows on the anticlockwise carriageway.
M25 CLIMBING LANE SITE 4: POST OPENING PROJECT EVALUATION
Post Opening Evaluation Report
22 POPE of LNMS - M25 J27-28_FINAL.doc
Table A2 - Before and After Survey Traffic Flow Comparison for Site 4

M25 CLIMBING LANE SITE 4: POST OPENING PROJECT EVALUATION
Post Opening Evaluation Report
23 POPE of LNMS - M25 J27-28_FINAL.doc
Annex C – Original AST

M25 CLIMBING LANE SITE 4: POST OPENING PROJECT EVALUATION
Post Opening Evaluation Report
24 POPE of LNMS - M25 J27-28_FINAL.doc
Proposal Name M25 Junction 27 Climbing Lane
Option description 2km Climbing Lane, East of Junction 27 on the clockwise carriageway
Current £2.879m Date Q4 2000
OBJECTIVE SUB-OBJECTIVE QUALITATIVE IMPACTS QUANTITATIVE MEASURE ASSESSMENT
ENVIRONMENT
Noise No significant impact based upon changes in road geometry No. properties experiencing:
- Increase in noise 0 - Decrease in noise 0
Net…..0…..properties experience higher noise
levels – Neutral
Local Air Quality Slight beneficial impact No. properties experiencing:
- better air quality 0 - worse air quality 0
+/- 0 PM10 +/- 0 NO2 - Neutral
Landscape No significant impact Not Applicable Neutral
Biodiversity No significant impact Not Applicable Neutral
Heritage No significant impact Not Applicable Neutral
Water No significant impact Not Applicable Neutral
SAFETY - Reduction in risk of accidents predicted due to reduced congestion Accidents Deaths Serious Slight PVB £0m / £0m
0% of PVC
ECONOMY
Journey times & Veh. Op. Costs
Reduced congestion allows journey times, particularly in peak hours, to decrease. Trunk road journey time savings:
Peak mins; inter-peak mins PVB £10.07m/£12.30m
589% of PVC
Cost Present value of costs is the cost of the scheme within a major maintenance contract. Not applicable PVC £1.899m
Journey Time Reliability Substantial Improvement Stress on key trunk road link: Before N/A %; After N/A %
Neutral
Regeneration No significant impact Serves regeneration priority area? Development depends on project?
No
ACCESSIBILITY
Pedestrians and Others No impact Not Applicable Neutral
Access to public transport No Impact Not Applicable Neutral
Community Severance No Impact Not Applicable Neutral
INTEGRATION - No Impact Not Applicable Neutral
Version of 11 December 2000 Cost benefit analysis (low / high) PVB £10.002m / £12.175m, PVC £1.899m, NPV £8.1m/£10.28m, BCR 5.27/6.41, FYRR.
All costs and benefits are in 1994 prices discounted to 1994 at 6%
M25 CLIMBING LANE SITE 4: POST OPENING PROJECT EVALUATION
Post Opening Evaluation Report
25 POPE of LNMS - M25 J27-28_FINAL.doc
Annex D – ATKINS EST
M25 CLIMBING LANE SITE 4: POST OPENING PROJECT EVALUATION
Post Opening Evaluation Report
26 POPE of LNMS - M25 J27-28_FINAL.doc
Proposal Name M25 Junction 27 Climbing Lane
Option description 2km Climbing Lane, East of Junction 27 on the clockwise carriageway
All values in 1994 prices and values, discounted at 6%
OBJECTIVE SUB-OBJECTIVE QUALITATIVE IMPACTS QUANTITATIVE MEASURE ASSESSMENT
ENVIRONMENT
Noise No significant impact based upon changes in road geometry No. properties experiencing:
- Increase in noise 0 - Decrease in noise 0
Net…..0…..properties experience higher noise
levels – Neutral
Local Air Quality Slight beneficial impact No. properties experiencing:
- better air quality 0 - worse air quality 0
+/- 0 PM10 +/- 0 NO2 - Neutral
Landscape No significant impact Not Applicable Neutral
Biodiversity No significant impact Not Applicable Neutral
Heritage No significant impact Not Applicable Neutral
Water No significant impact Not Applicable Neutral
SAFETY - Reduction in risk of accidents predicted due to reduced congestion Accidents Deaths Serious Slight Not Assessed
ECONOMY
Journey times & Veh. Op. Costs
Reduced congestion allows journey times, particulary in peak hours, to decrease. Trunk road journey time savings:
Peak mins; inter-peak mins Not Assessed
Cost Total Outturn cost of the Scheme in 1994 prices and values (discounted @ 6%) Not applicable PVC £1.786m
Journey Time Reliability Substantial Improvement Stress on key trunk road link: Before N/A %; After N/A %
Neutral
Regeneration No significant impact Serves regeneration priority area? Development depends on project?
No
ACCESSIBILITY
Pedestrians and Others No impact Not Applicable Neutral
Access to public transport No Impact Not Applicable Neutral
Community Severance No Impact Not Applicable Neutral
INTEGRATION - No Impact Not Applicable Neutral
Version of 11 December 2000 Cost benefit analysis (low / high) PVC £1.786m
All costs and benefits are in 1994 prices discounted to 1994 at 6%