Embed Size (px)
Citation preview

M25 Junctions 18-19 Climbing Lane Study: Post Opening
Project Evaluation
Post Opening Evaluation Report
JOB NUMBER: 4416515.1525.600 DOCUMENT REF:
M25 J18-19_FINAL.doc
0 Draft Report KP RS IJW PR 20/5/05
A Final Draft Report KP RS IJW PR 05/9/05
B Revised Final Draft Report KP RS IJW PR 03/11/05
C Final Report KP RS IJW PR 01/02/06
Originated Checked Reviewed Authorised Date
Revision Purpose Description
M25 CLIMBING LANE J18-J19 SITE THREE : POST OPENING PROJECT
EVALUATION Post Opening Evaluation Report
i POPE of LNMS - M25 J18-19_FINAL.doc
Contents
Section Page
1. Introduction 1
Background 1
Scheme Objectives 2
Purpose of the Report 2
2. Data Collection 4
‘Before’ Surveys 4
‘After’ Surveys 4
3. Scheme Impact 6
Overview 6
Safety 6
Traffic Volume Changes 6
Trafficmaster Spot Speeds 7
Journey Times 7
4. Economic Impact of the Scheme 9
Introduction 9
COBA Replication and Evaluation 9
POPE Evaluation 9
Accidents 9
Journey time Benefits/Disbenefits 10
Scheme Cost 11
Summary 11
5. Summary of Appraisal and Evaluation Summary Tables 12
Introduction 12
Appraisal Summary Table (AST) 12
Outturn Effects 13
6. Summary of Conclusions 15
Annex A – Accident Analysis 17
Annex B - TrafficMaster Data 22
M25 CLIMBING LANE J18-J19 SITE THREE : POST OPENING PROJECT
EVALUATION Post Opening Evaluation Report
ii POPE of LNMS - M25 J18-19_FINAL.doc
Annex C - Original Scheme AST 25
Annex D - Atkins EST 28
List of Tables
Table 3.1 - Average Journey times for Travelling from Junctions 18 – 19 on the M25 8
Table 4.1 - Present Value of Benefits for M25 J18-J19 Climbing Lane at Low Growth 9
Table 4.2 – Calculation of Observed Opening Year Time Savings 10
Table 4.3 – POPE Assessment of Travel Time Benefits 10
Table 4.4 – Summary of POPE Economic Evaluation: Weighted Average 11
Table 5.1 – Summary of Environmental Sub-Objectives 14
List of Figures
Figure 1.1 - Detailed location of M25 Climbing Lane between Junctions 18 - 19 1
Figure 1.2 - Photograph of climbing lane on J18-J19 of the M25 2
Figure 3.1 - AADT values for J18-J19 of the M25 7
Figure 5.1 - An Example of a sign associated with the Climbing Lanes 14
M25 CLIMBING LANE J18-J19 SITE THREE : POST OPENING PROJECT
EVALUATION Post Opening Evaluation Report
A596 M25 J18-J19 One Year 1 POPE of LNMS - M25 J18-19_FINAL.doc
1. Introduction
BACKGROUND
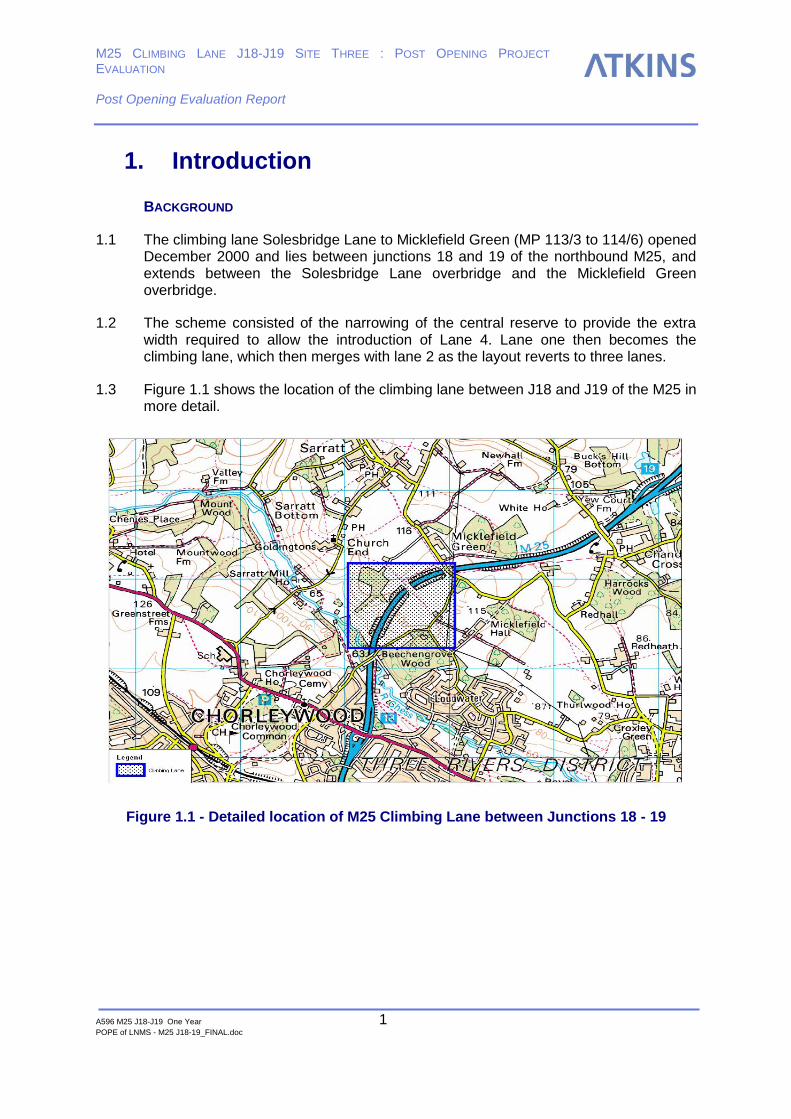
1.1 The climbing lane Solesbridge Lane to Micklefield Green (MP 113/3 to 114/6) opened December 2000 and lies between junctions 18 and 19 of the northbound M25, and extends between the Solesbridge Lane overbridge and the Micklefield Green overbridge.
1.2 The scheme consisted of the narrowing of the central reserve to provide the extra width required to allow the introduction of Lane 4. Lane one then becomes the climbing lane, which then merges with lane 2 as the layout reverts to three lanes.
1.3 Figure 1.1 shows the location of the climbing lane between J18 and J19 of the M25 in more detail.
Figure 1.1 - Detailed location of M25 Climbing Lane between Junctions 18 - 19
M25 CLIMBING LANE J18-J19 SITE THREE : POST OPENING PROJECT
EVALUATION Post Opening Evaluation Report
A596 M25 J18-J19 One Year 2 POPE of LNMS - M25 J18-19_FINAL.doc
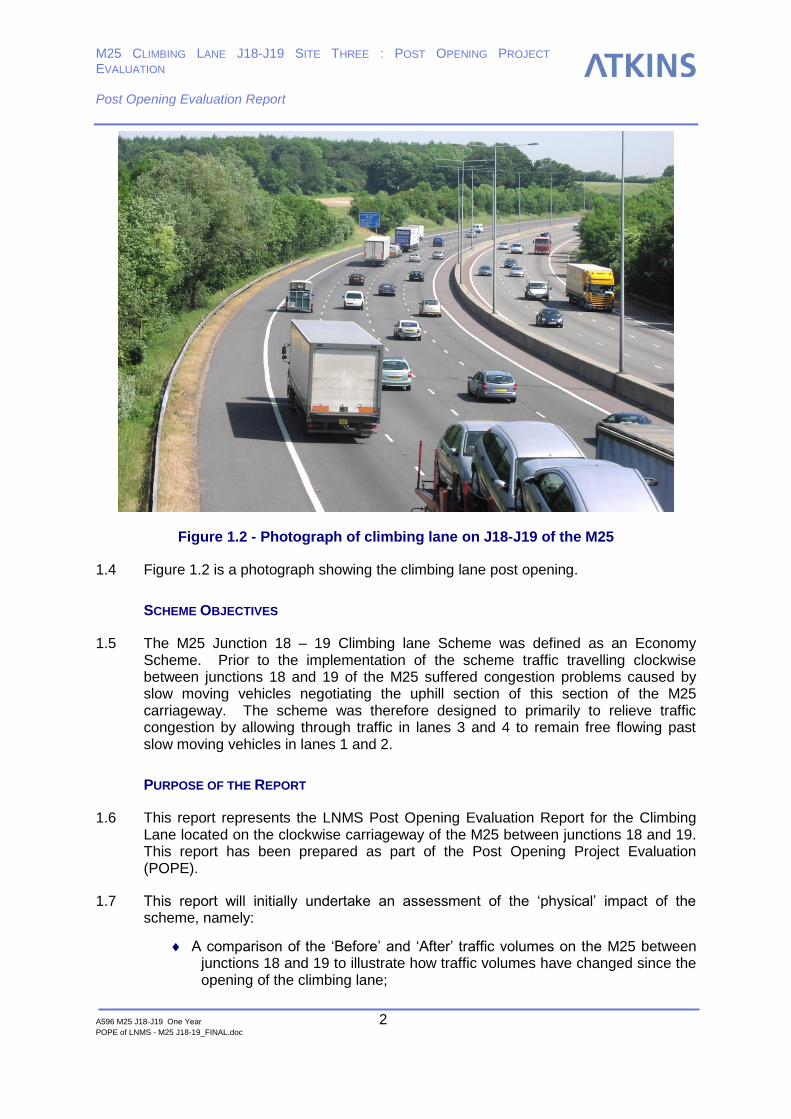
Figure 1.2 - Photograph of climbing lane on J18-J19 of the M25
1.4 Figure 1.2 is a photograph showing the climbing lane post opening.
SCHEME OBJECTIVES
1.5 The M25 Junction 18 – 19 Climbing lane Scheme was defined as an Economy Scheme. Prior to the implementation of the scheme traffic travelling clockwise between junctions 18 and 19 of the M25 suffered congestion problems caused by slow moving vehicles negotiating the uphill section of this section of the M25 carriageway. The scheme was therefore designed to primarily to relieve traffic congestion by allowing through traffic in lanes 3 and 4 to remain free flowing past slow moving vehicles in lanes 1 and 2.
PURPOSE OF THE REPORT
1.6 This report represents the LNMS Post Opening Evaluation Report for the Climbing Lane located on the clockwise carriageway of the M25 between junctions 18 and 19. This report has been prepared as part of the Post Opening Project Evaluation (POPE).
1.7 This report will initially undertake an assessment of the ‘physical’ impact of the scheme, namely:
A comparison of the ‘Before’ and ‘After’ traffic volumes on the M25 between junctions 18 and 19 to illustrate how traffic volumes have changed since the opening of the climbing lane;
M25 CLIMBING LANE J18-J19 SITE THREE : POST OPENING PROJECT
EVALUATION Post Opening Evaluation Report
A596 M25 J18-J19 One Year 3 POPE of LNMS - M25 J18-19_FINAL.doc
A comparison of ‘Before’ and ‘After’ levels of congestion to illustrate how congestion levels have changed since the opening of the climbing lane;
A comparison of ‘Before’ and ‘After’ journey times to illustrate how journey times have changed since the opening of the climbing lane;
It will also present an evaluation of predicted and outturn economic forecasts based on changes in journey times as well as other outturn effects in the form of an Evaluation Summary Table (EST); and,
The report will also outline the changes in numbers of accidents at the site.
1.8 This report specifically considers the re-evaluation of the predicted benefits for the Climbing Lane between Junctions 18 and 19 of the M25 of the clockwise carriageway. The three main elements involved are:
To identify the costs and benefits originally forecast for the scheme at Order Publication Report (OPR) stage;
To quantify the outturn (actual) costs and the outturn level of benefits actually accruing, based on outturn traffic volume and journey time data for the scheme; and,
To compare the results and quantify the difference in the Present Value of Benefits (PVB).
1.9 Following this introduction the report has been divided into five further sections as follows:
Section 2 outlines existing data collation and new data collection.
Section 3 presents the outturn effects of the scheme (traffic flows, journey times and accident numbers);
Section 4 presents the original economic results, calculated by the Department for Transport’s program COBA for this scheme and the level of benefits that would have been forecast if outturn traffic volumes and journey times were known at the time. The section also compares the COBA and POPE methodologies;
Section 5 presents the original Appraisal Summary Table (AST) for the M25 J18-J19 junction improvements, and then re-evaluates these predictions with an Evaluation Summary Table (EST). The section also gives an early indication of changes in the number of accidents at the site; and finally
Section 6 summarises the main conclusions from the evaluation.
M25 CLIMBING LANE J18-J19 SITE THREE : POST OPENING PROJECT
EVALUATION Post Opening Evaluation Report
A596 M25 J18-J19 One Year 4 POPE of LNMS - M25 J18-19_FINAL.doc
2. Data Collection
‘BEFORE’ SURVEYS
2.1 The PAR document submitted in support of the scheme was based upon the following data:
Economic Evaluation using COBA.
Traffic flow data from the Highways Agency monitoring.
Accident data from the Highways Agency.
‘AFTER’ SURVEYS
2.2 In the course of undertaking the LNM evaluation of the scheme, the following data was utilised:
Traffic flow data from the Highways Agency Monitoring South.
Accident data from Managing Agent.
COBA data from Economic Justification reports;
Journey time data from Faber Maunsell report entitled ‘M25 Climbing Lanes: Before and After Studies’.
Journey time survey data from NAOMI model for the M25 Multi Model Study (ORBIT) undertaken by Halliburton KBR.
Automatic Traffic Counts
2.3 Automatic traffic counts were obtained for the following site locations:
1810 (Junction 18– 19, CW)
1820 (Junction 18 – 19, AC)
Journey Time Surveys
2.4 A number of journey time surveys were ascertained from the NAOMI traffic model for the M25 Multi Modal Study.
2.5 The journey time surveys included the following:
Tuesday 9th May 2000 for M25 junctions 11 – 17;
Tuesday 27th November 2001 for M25 junctions 16 – 21a;
Wednesday 28th November 2001 for M25 junctions 16 – 21a;
Thursday 29th November 2001 for M25 junctions 16 – 21a;
2.6 The ‘floating car method’ was adopted by equalising the number of vehicles overtaken by those that overtake the survey car.
2.7 Journey time data from Faber Maunsell report entitled ‘M25 Climbing Lanes: Before and After Studies’ was also obtained covering the following dates:
M25 J18-J19 Before: 26th to 29th October 2000
M25 CLIMBING LANE J18-J19 SITE THREE : POST OPENING PROJECT
EVALUATION Post Opening Evaluation Report
A596 M25 J18-J19 One Year 5 POPE of LNMS - M25 J18-19_FINAL.doc
M25 J18-J19 After: 7th to 22nd November 2001
Accident Data
2.8 Accident data was obtained for the years 1999 to 2003 for M25 Junctions 15 to 20. Only a proportion of accident descriptions were available so this information was excluded from the report.
M25 CLIMBING LANE J18-J19 SITE THREE : POST OPENING PROJECT
EVALUATION Post Opening Evaluation Report
A596 M25 J18-J19 One Year 6 POPE of LNMS - M25 J18-19_FINAL.doc
3. Scheme Impact
OVERVIEW
3.1 This section provides details of the outturn safety and traffic impacts of the scheme, and each of these impacts is discussed below.
SAFETY
3.2 In assessing the impact of the scheme in regard to safety on the M25 accident data was obtained for the five year period 1999 to 2003. As the scheme opened in 2001, this provided two years each of pre and post-opening data. The analysis of this data is presented in Annex A.
3.3 Table A1 of Annex A identifies a pre-scheme accident rate of 0.127 PIA/MVKm at the site, and a post-scheme accident rate of 0.165 PIA/MVKM. This represents an increase of 0.038 PIA/MVKm (30%) in the accident rate at the site post scheme opening. Both of these values are in excess of the default accident rate for a road of this type of 0.095 PIA/MVKm.
3.4 This detailed analysis identified that the terminus of site 3 could be attributed to a number of accidents to occur post opening where HGV’s move into lane 2 into the path of oncoming vehicles. This is further qualified by the observation of skid marks in lane 2 located at the terminus. As a result we conclude that the terminus of the climbing lane appears to be a contributory factor in a number of accidents. This conclusion must be tempered by the fact that it is based on only two-years of post-opening data.
TRAFFIC VOLUME CHANGES
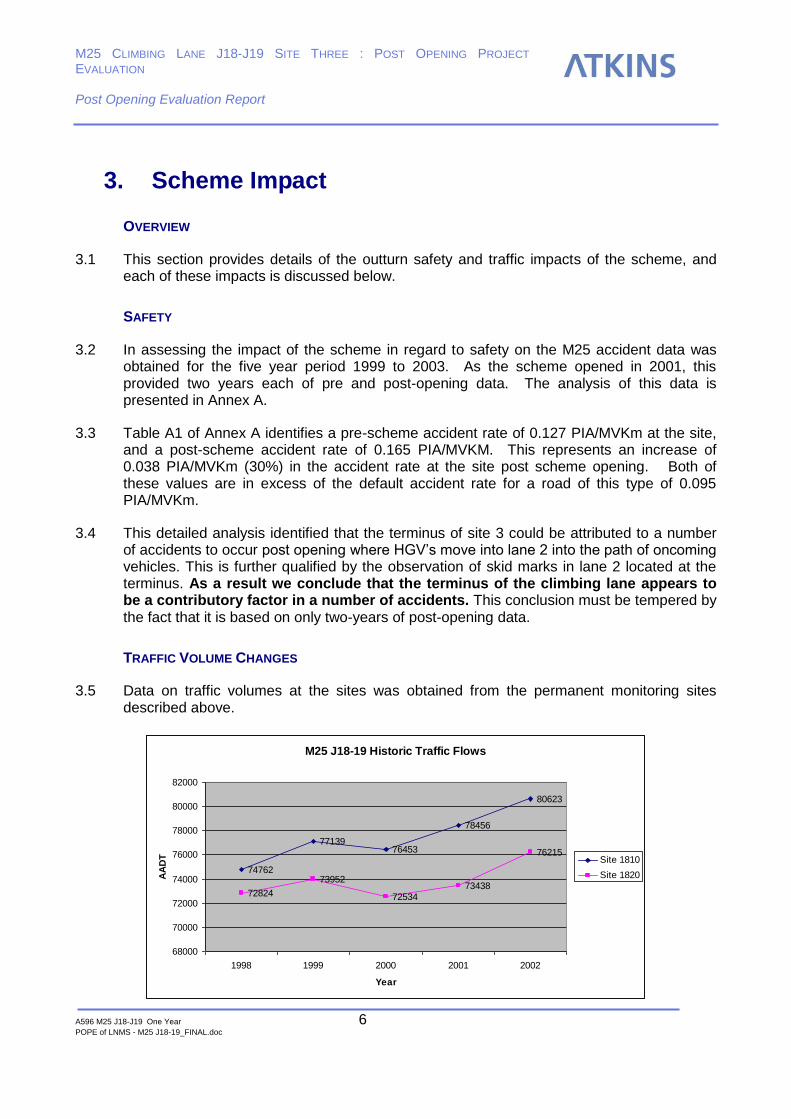
3.5 Data on traffic volumes at the sites was obtained from the permanent monitoring sites described above.
M25 J18-19 Historic Traffic Flows
74762
7713976453
78456
80623
72824
73952
7253473438
76215
68000
70000
72000
74000
76000
78000
80000
82000
1998 1999 2000 2001 2002
Year
AA
DT Site 1810
Site 1820
M25 CLIMBING LANE J18-J19 SITE THREE : POST OPENING PROJECT
EVALUATION Post Opening Evaluation Report
A596 M25 J18-J19 One Year 7 POPE of LNMS - M25 J18-19_FINAL.doc
Figure 3.1 - AADT values for J18-J19 of the M25
3.6 Figure 3.1 presents data on traffic flow for the period 1998 to 2002. Site 1810 represents the AADT values on the northbound carriageway of the M25 between junctions 18 and 19, with site 1820 representing the anticlockwise traffic flows for the same location. The changes in traffic volumes since 1998 have followed a similar trend for both directions on the link. The reduction in traffic flows in the year 2000 was likely to have been related to the works associated with construction of the climbing lane.
TRAFFICMASTER SPOT SPEEDS
3.7 Trafficmaster, who provide services related to vehicle route-choice and guidance systems, provides data on spot-speeds on motorways, including this section of the M25. Based on advice from TRL, Faber Maunsell collated TrafficMaster spot speed data below 30mph using the existing TrafficMaster infra-red sensors around the M25.
3.8 TrafficMaster data was used from two sites adjacent to the scheme. The TrafficMaster data was to determine a proxy measure for congestion (defined as hours below 30mph) by analysing the amount of time the speed at the sensor locations was below 30 mph post-opening compared to pre-opening. The data from both carriageways was processed with the anticlockwise data (section without climbing lanes) providing a control.
3.9 Further detail on the analysis of the TrafficMaster data is presented in Annex B.
3.10 Analysis of the Traffic Master data indicates that there was a slight decrease of 2.4 hours per month in the average number of hours where traffic speeds were under 30 mph at site 55 in the northbound direction, which is located at the beginning of the scheme. This can be contrasted with site 56 on the same carriageway which is located approximately two miles downstream of the scheme which had an increase in average monthly hours below 30mph of 2.9 hours per month. There were similar increases in the hours under 30mph in anti-clockwise carriageway.
3.11 Overall it can be concluded that there has been a slight improvement in vehicle seeds following the implementation of the scheme.
JOURNEY TIMES
3.12 An alternative measure of how the scheme may have had an impact on vehicle speeds on the M25 was provided by the journey time data collected on behalf of Halliburton KBR as part of the validation of the NAOMI traffic model prepared for the Orbit Multi Modal Study.
Summary The AADT values on the clockwise carriageway steadily rose by approximately 2000 vehicles (2.5%) for each year post scheme opening. This growth is consistent with pre opening growth rates. It is considered, however, that until more post opening traffic flow information is held no conclusions can be drawn on the impact of the climbing lanes on traffic flow.
M25 CLIMBING LANE J18-J19 SITE THREE : POST OPENING PROJECT
EVALUATION Post Opening Evaluation Report
A596 M25 J18-J19 One Year 8 POPE of LNMS - M25 J18-19_FINAL.doc
This work encompassed the location of the climbing lane, and included journey time surveys both before and after the scheme opening.
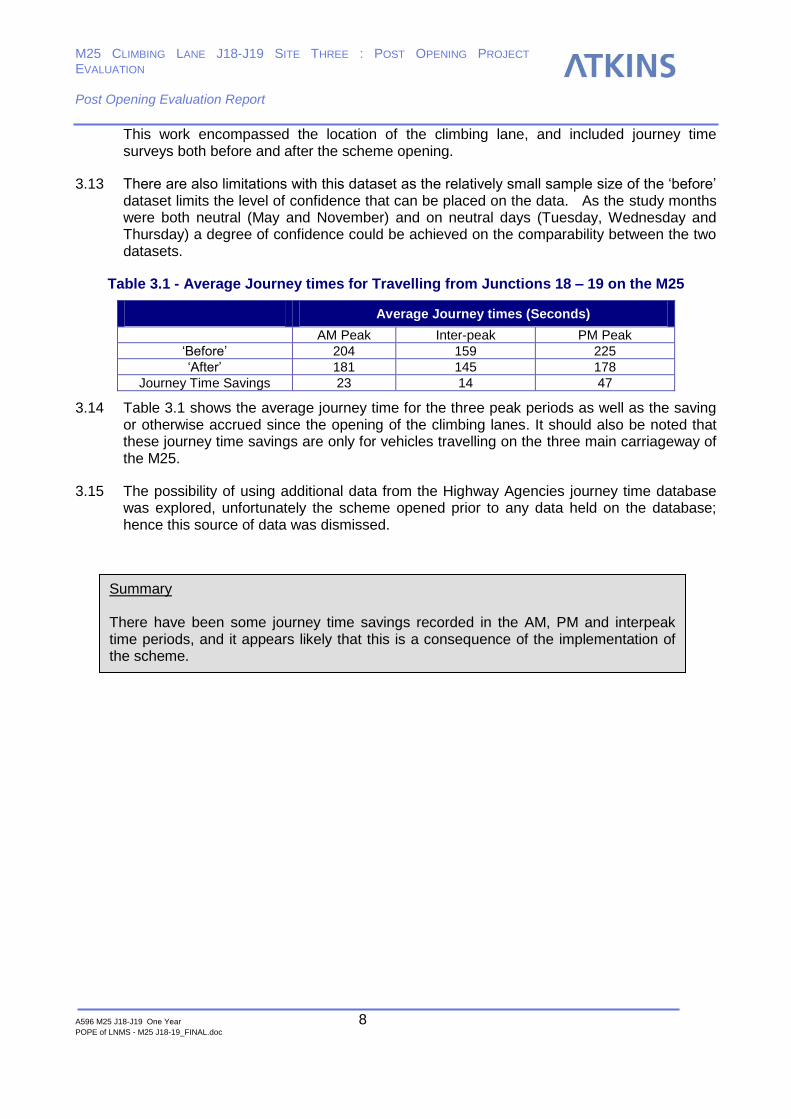
3.13 There are also limitations with this dataset as the relatively small sample size of the ‘before’ dataset limits the level of confidence that can be placed on the data. As the study months were both neutral (May and November) and on neutral days (Tuesday, Wednesday and Thursday) a degree of confidence could be achieved on the comparability between the two datasets.
Table 3.1 - Average Journey times for Travelling from Junctions 18 – 19 on the M25
Average Journey times (Seconds)
AM Peak Inter-peak PM Peak
‘Before’ 204 159 225
‘After’ 181 145 178
Journey Time Savings 23 14 47
3.14 Table 3.1 shows the average journey time for the three peak periods as well as the saving or otherwise accrued since the opening of the climbing lanes. It should also be noted that these journey time savings are only for vehicles travelling on the three main carriageway of the M25.
3.15 The possibility of using additional data from the Highway Agencies journey time database was explored, unfortunately the scheme opened prior to any data held on the database; hence this source of data was dismissed.
Summary There have been some journey time savings recorded in the AM, PM and interpeak time periods, and it appears likely that this is a consequence of the implementation of the scheme.
M25 CLIMBING LANE J18-J19 SITE THREE : POST OPENING PROJECT
EVALUATION Post Opening Evaluation Report
A596 M25 J18-J19 One Year 9 POPE of LNMS - M25 J18-19_FINAL.doc
4. Economic Impact of the Scheme
INTRODUCTION
4.1 This section assesses the level of economic benefits predicted for the scheme and compares these predictions with actual benefits accrued when considering actual traffic volume changes and actual journey time benefits. Two approaches are presented here:
A simple comparison of the level of cost and benefits from the COBA evaluation with the outturn traffic flows were input into the original COBA model. This provides a brief assessment of how well the COBA model performs; and,
The main re-evaluation, termed the Post Opening Project Evaluation (POPE) methodology. This uses observed outturn journey time and accident savings to provide an economic assessment of the performance of the scheme. This result is presented in the scheme EST and is expressed in same terms as the original evaluation (present value year of 1994, and discount rate of 6 per cent).
COBA REPLICATION AND EVALUATION
4.2 The COBA input files used in the original appraisal were not available. Furthermore the PAR document provided to Atkins could were incomplete, and did not contain either a coherent economic appraisal or any values in the AST.
4.3 In the absence of data regarding the COBA evaluation Atkins developed a COBA model based on the traffic flow data that was available. Table 4.1 presents this evaluation for low and high growth respectively.
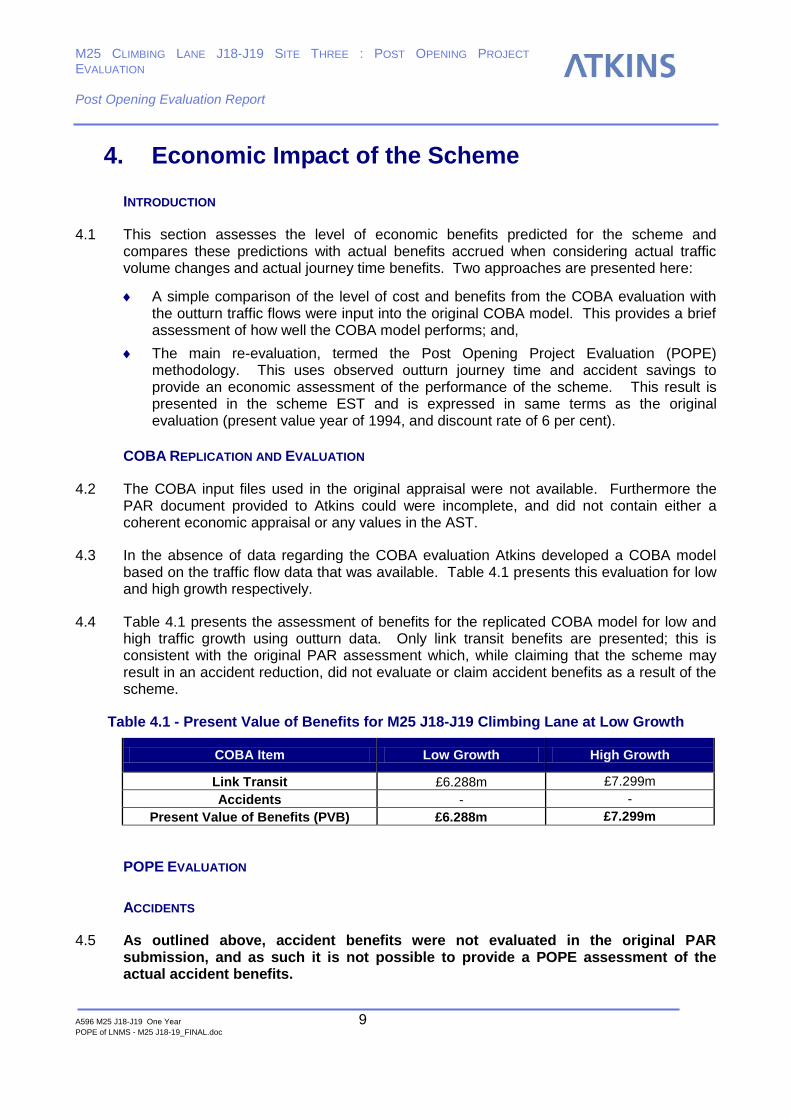
4.4 Table 4.1 presents the assessment of benefits for the replicated COBA model for low and high traffic growth using outturn data. Only link transit benefits are presented; this is consistent with the original PAR assessment which, while claiming that the scheme may result in an accident reduction, did not evaluate or claim accident benefits as a result of the scheme.
Table 4.1 - Present Value of Benefits for M25 J18-J19 Climbing Lane at Low Growth
COBA Item Low Growth High Growth
Link Transit £6.288m £7.299m
Accidents - -
Present Value of Benefits (PVB) £6.288m £7.299m
POPE EVALUATION
ACCIDENTS
4.5 As outlined above, accident benefits were not evaluated in the original PAR submission, and as such it is not possible to provide a POPE assessment of the actual accident benefits.
M25 CLIMBING LANE J18-J19 SITE THREE : POST OPENING PROJECT
EVALUATION Post Opening Evaluation Report
A596 M25 J18-J19 One Year 10 POPE of LNMS - M25 J18-19_FINAL.doc
JOURNEY TIME BENEFITS/DISBENEFITS
Outturn Benefits
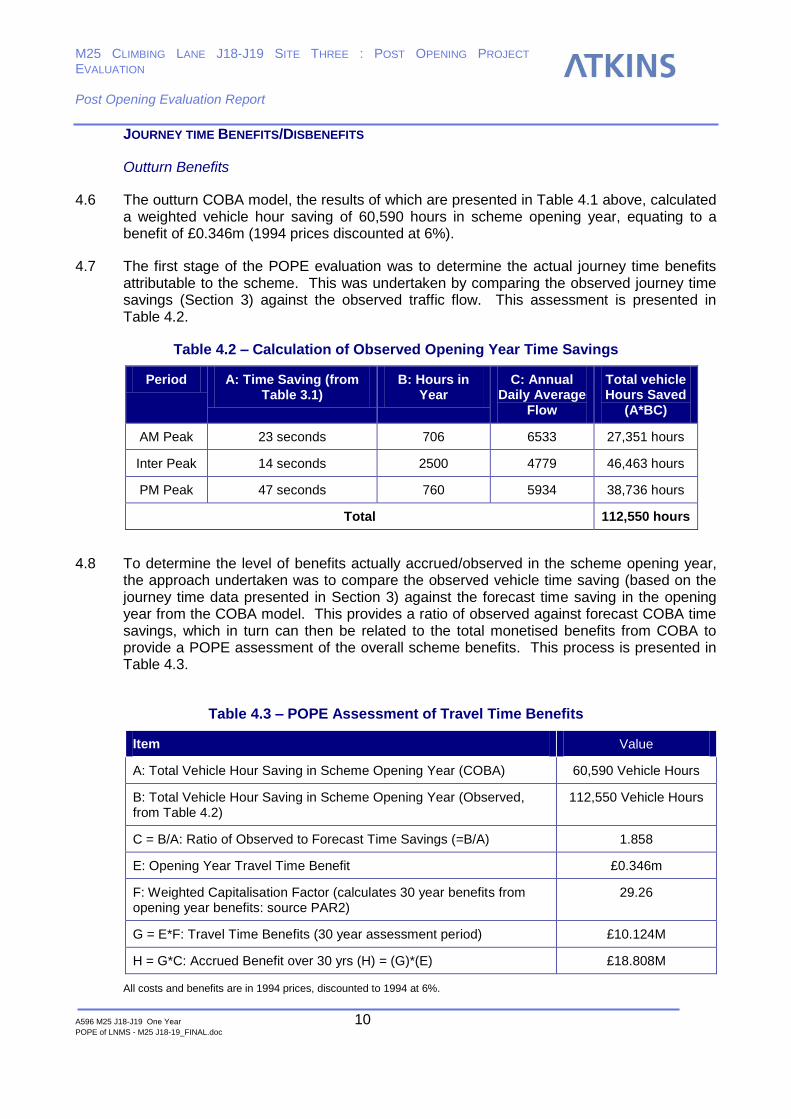
4.6 The outturn COBA model, the results of which are presented in Table 4.1 above, calculated a weighted vehicle hour saving of 60,590 hours in scheme opening year, equating to a benefit of £0.346m (1994 prices discounted at 6%).
4.7 The first stage of the POPE evaluation was to determine the actual journey time benefits attributable to the scheme. This was undertaken by comparing the observed journey time savings (Section 3) against the observed traffic flow. This assessment is presented in Table 4.2.
Table 4.2 – Calculation of Observed Opening Year Time Savings
Period A: Time Saving (from Table 3.1)
B: Hours in Year
C: Annual Daily Average
Flow
Total vehicle Hours Saved
(A*BC)
AM Peak 23 seconds 706 6533 27,351 hours
Inter Peak 14 seconds 2500 4779 46,463 hours
PM Peak 47 seconds 760 5934 38,736 hours
Total 112,550 hours
4.8 To determine the level of benefits actually accrued/observed in the scheme opening year, the approach undertaken was to compare the observed vehicle time saving (based on the journey time data presented in Section 3) against the forecast time saving in the opening year from the COBA model. This provides a ratio of observed against forecast COBA time savings, which in turn can then be related to the total monetised benefits from COBA to provide a POPE assessment of the overall scheme benefits. This process is presented in Table 4.3.
Table 4.3 – POPE Assessment of Travel Time Benefits
Item Value
A: Total Vehicle Hour Saving in Scheme Opening Year (COBA) 60,590 Vehicle Hours
B: Total Vehicle Hour Saving in Scheme Opening Year (Observed, from Table 4.2)
112,550 Vehicle Hours
C = B/A: Ratio of Observed to Forecast Time Savings (=B/A) 1.858
E: Opening Year Travel Time Benefit £0.346m
F: Weighted Capitalisation Factor (calculates 30 year benefits from opening year benefits: source PAR2)
29.26
G = E*F: Travel Time Benefits (30 year assessment period) £10.124M
H = G*C: Accrued Benefit over 30 yrs (H) = (G)*(E) £18.808M
All costs and benefits are in 1994 prices, discounted to 1994 at 6%.

M25 CLIMBING LANE J18-J19 SITE THREE : POST OPENING PROJECT
EVALUATION Post Opening Evaluation Report
A596 M25 J18-J19 One Year 11 POPE of LNMS - M25 J18-19_FINAL.doc
4.9 Table 4.3 illustrates that, given the conditions in the immediate post-opening period, the scheme is forecast to provide a journey time benefit over 30-years of £18.808m.
SCHEME COST
4.10 For this scheme the Highways Agency were not able to provide us with the outturn scheme cost. Consequently the POPE assessment of observed benefits can only be compared to the original scheme PVC of £1.134m.
SUMMARY
4.11 Table 4.4 presents a summary of the POPE economic evaluation of the scheme.
Table 4.4 – Summary of POPE Economic Evaluation: Weighted Average
In 1994 Prices and Values POPE Evaluation
A. Link Transit Benefit £18.808m
B. Accident Benefit N/A
C=A+B: Present Value of Benefits £18.808m
D: Present Value of Costs £1.134m
Benefit Cost Ratio (C/D) 16.59
All costs and benefits are in 1994 prices, discounted to 1994 at 6%.
4.12 It can be concluded that the scheme is robust and provides both good benefits and strong BCR. However, given that information regarding the outturn costs of the scheme is not available, this conclusion is based on only partial evidence. Furthermore the lack of detail in the PAR submission means that the results of the assessment of observed benefits cannot be compared against the original scheme assessment.

M25 CLIMBING LANE J18-J19 SITE THREE : POST OPENING PROJECT
EVALUATION Post Opening Evaluation Report
A596 M25 J18-J19 One Year 12 POPE of LNMS - M25 J18-19_FINAL.doc
5. Summary of Appraisal and Evaluation Summary Tables
INTRODUCTION
5.1 In order to evaluate fully the effects of the opening of the climbing lane between junctions 18 and 19 of the M25, we have undertaken a review of the Appraisal Summary Table (AST) prepared for the original PAR document. The AST is the record of the predicted impacts of the scheme. Annex C presents this original AST for M25 J18-J19 Climbing Lane.
5.2 This AST summarises the predicted impacts of the scheme across a range of different sub-objectives. The sub-objectives within an AST are:
Environmental impacts such as Noise, Local Air Quality, Landscape, Biodiversity, Heritage and Water;
Safety Impacts, measuring and reduction in accidents;
Economy impacts, including savings in Journey time and Vehicle Operating Costs, Scheme Cost and Reliability of journeys;
Accessibility impacts, such as change in access to public transport, severance within communities and impact on pedestrian and other modes; and
Integration, measured by how the scheme accords with local policy.
APPRAISAL SUMMARY TABLE (AST)
5.3 The main points to note from the M25 J18-J19 Climbing lane AST are:
Environment
Slight reduction in noise levels due to the application of a thin wearing course.
Slight reduction in pollution levels due to reduction in congestion.
Slight visual intrusion due to additional signing.
Safety
Substantial improvement in terms of reduced risk of potential accidents due to reduction in congestion.
Economy
Predicted a journey time saving of 49,000 hours saved in the first year of operation.
Substantial improvement, in terms of improved journey times due to reduction in delays.
Substantial improvement in journey time reliability due to reduced congestion.
Accessibility
No impacts predicted.
M25 CLIMBING LANE J18-J19 SITE THREE : POST OPENING PROJECT
EVALUATION Post Opening Evaluation Report
A596 M25 J18-J19 One Year 13 POPE of LNMS - M25 J18-19_FINAL.doc
OUTTURN EFFECTS
5.4 In order to assess the actual or outturn effects of the opening of the scheme, we have produced an Evaluation Summary Table (EST), which mirrors the appearance of the AST, and includes details of the actual sub-objectives that have been evaluated.
5.5 Annex D provides the EST and the main points to note on the EST are:
Environmental Impacts
5.6 An initial view has been taken of the environmental sub-objectives that are related to changes in traffic operating conditions. These are ‘Road Traffic Noise’, ‘Pollution Levels’ and ‘Landscape’.
Road Traffic Noise
5.7 The original PAR document predicted an overall reduction in traffic noise levels through the inclusion of a thin wearing course (TWC) in the schemes construction. While this benefit has not been directly assessed though new noise surveys, it is accepted that TWC confers such benefits, and therefore the sub-objective score is slight beneficial.
Pollution Levels
5.8 The prediction of the PAR document was that a reduction in congestion would lead to a reduction in pollutants and specifically CO2 emissions. Given the lack of positive information with on speeds the forecast cannot be substantiated, and as such the score should be neutral.
Landscape
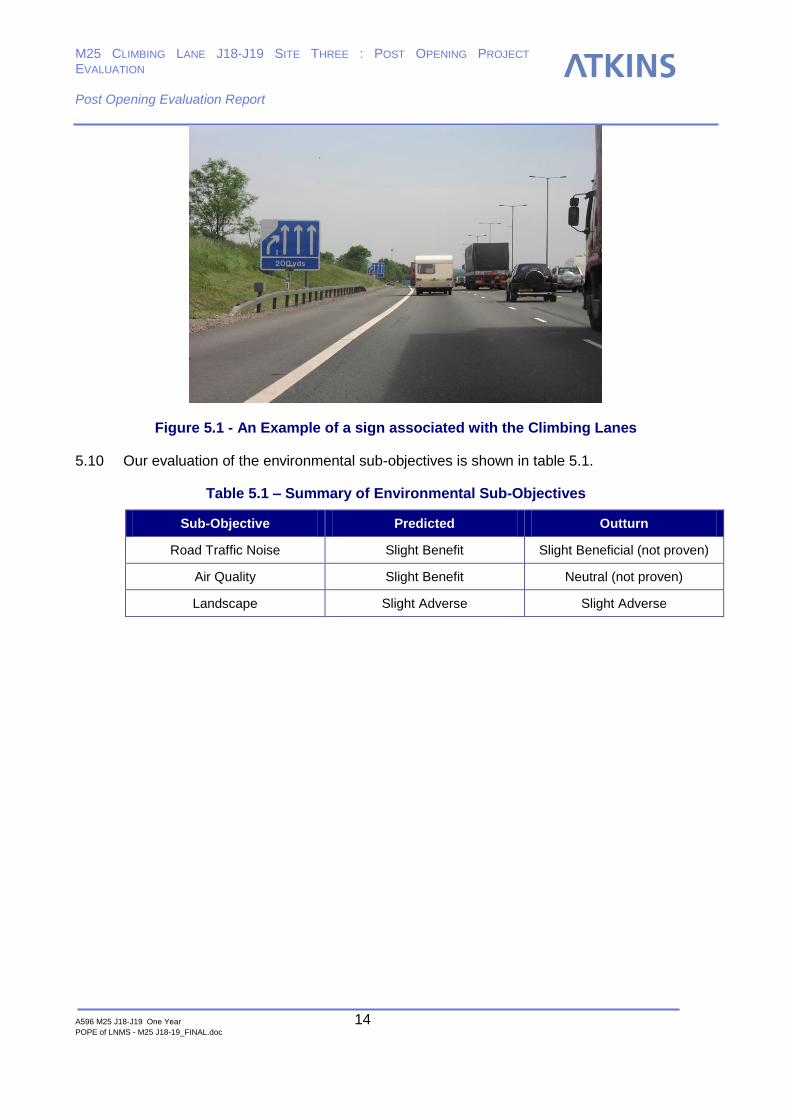
5.9 The inclusion of new road signs was predicted to have a slightly adverse affect on the landscape. New road signs were indeed installed as part of the scheme hence having a slightly negative impact on the local landscape. An example of such a sign is shown in figure 5.1.
M25 CLIMBING LANE J18-J19 SITE THREE : POST OPENING PROJECT
EVALUATION Post Opening Evaluation Report
A596 M25 J18-J19 One Year 14 POPE of LNMS - M25 J18-19_FINAL.doc
Figure 5.1 - An Example of a sign associated with the Climbing Lanes
5.10 Our evaluation of the environmental sub-objectives is shown in table 5.1.
Table 5.1 – Summary of Environmental Sub-Objectives
Sub-Objective Predicted Outturn
Road Traffic Noise Slight Benefit Slight Beneficial (not proven)
Air Quality Slight Benefit Neutral (not proven)
Landscape Slight Adverse Slight Adverse
M25 CLIMBING LANE J18-J19 SITE THREE : POST OPENING PROJECT
EVALUATION Post Opening Evaluation Report
A596 M25 J18-J19 One Year 15 POPE of LNMS - M25 J18-19_FINAL.doc
6. Summary of Conclusions
6.1 The highways Agency has a requirement to carry out re-evaluations of new trunk road schemes. The purpose of these re-evaluations is to provide a comparison of the predicted and actual impacts accruing from new schemes and to determine how far the Highways Agency achieves the objectives and benefits from its road programme.
6.2 In summary, the main points to note from the Evaluation of the M25 junction 18 - 19 Climbing Lane scheme are:
Landscape
The inclusion of new road signs was predicted to have a slightly adverse affect on the landscape. New road signs were indeed installed as part of the scheme hence having a slight negative impact on the local landscape.
Safety
6.3 The PAR document identified a substantial improvement in terms of reduced risk of potential accidents due to reduction in congestion. There has been no significant improvement in the accident rate at the scheme location and in fact accidents directly attributed to the terminus of the climbing lane have been observed.
Traffic Volumes
6.4 The AADT values on the clockwise carriageway steadily rose by approximately 2000 vehicles for each year post scheme opening. Until more post opening traffic flow information is held no conclusions can be drawn on the impact of the climbing lanes on traffic flow.
Congestion
6.5 The scheme has restrained the levels of growth of congestion on the clockwise carriageway between junctions 18 and 19 of the M25. But overall does not appear to have significantly decreased the levels of congestion felt between junctions 18 and 19 on the clockwise carriageway of the M25.
6.6 The reason for this is that the introduction of a climbing lane allows traffic in the two outside lanes to remain free flowing while the two inside lanes are used by slow moving traffic to negotiate the uphill section of road at slower speeds, this means that traffic in the two inside lanes will not have to decelerate as much post scheme opening as they did pre scheme opening, thus reducing the time traffic in these lanes spend below 30mph.
Journey Times
6.7 Journey time data indicates that there have been journey time savings recorded in the AM, PM and interpeak time periods.
M25 CLIMBING LANE J18-J19 SITE THREE : POST OPENING PROJECT
EVALUATION Post Opening Evaluation Report
A596 M25 J18-J19 One Year 16 POPE of LNMS - M25 J18-19_FINAL.doc
Scheme Costs (PVC)
6.8 The cost predicted in the original PAR for the scheme was £1.134M in 1994 prices and Values discounted at 6%. No actual out-turn costs have been established; therefore no conclusions can be drawn regarding changes in PVC.
Economic Benefits
6.9 The scheme provides both a good level of economic benefit and a strong BCR value.
Overall
6.10 Observed journey time data from the scheme suggest that it has provided journey time savings in all time periods, providing an economic benefits that outweighs the original forecast scheme PVC. However, there is no data available regarding the outturn cost of the scheme. Furthermore the observed economic assessment of the scheme cannot be compared to the original assessment of the scheme given that the original PAR document was incomplete.
M25 CLIMBING LANE J18-J19 SITE THREE : POST OPENING PROJECT
EVALUATION Post Opening Evaluation Report
A596 M25 J18-J19 One Year 17 POPE of LNMS - M25 J18-19_FINAL.doc
Annex A – Accident Analysis
M25 CLIMBING LANE J18-J19 SITE THREE : POST OPENING PROJECT
EVALUATION Post Opening Evaluation Report
A596 M25 J18-J19 One Year 18 POPE of LNMS - M25 J18-19_FINAL.doc
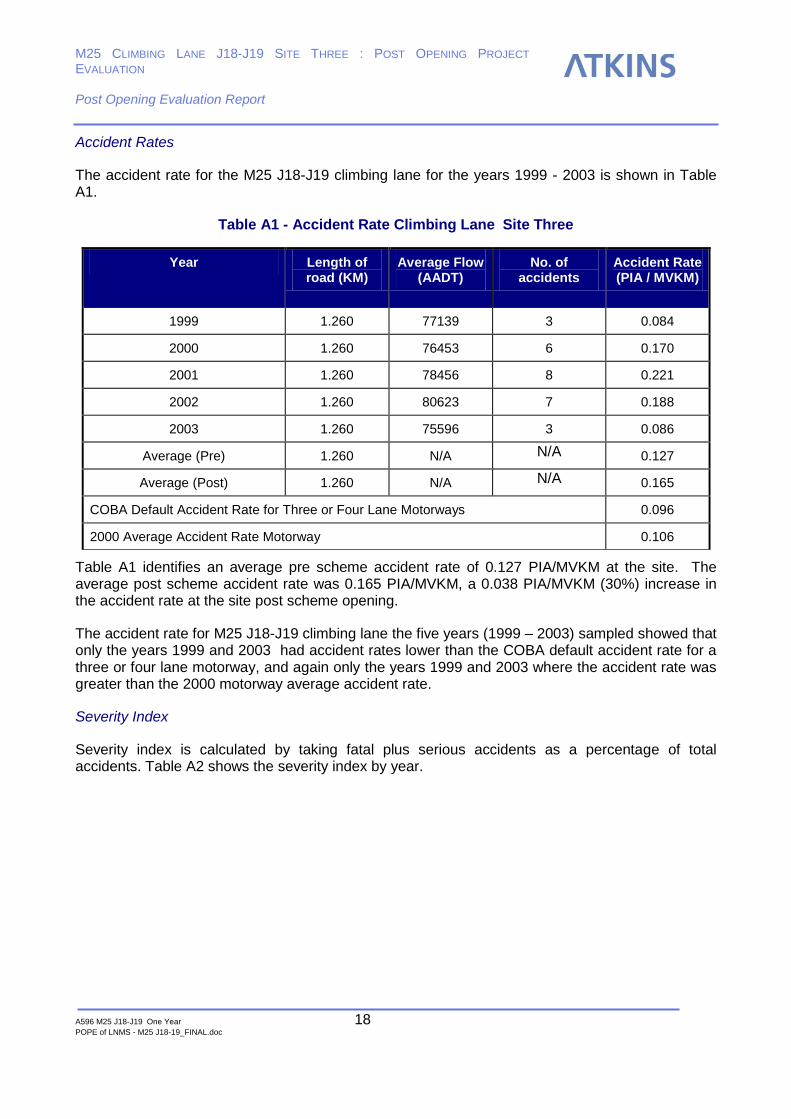
Accident Rates
The accident rate for the M25 J18-J19 climbing lane for the years 1999 - 2003 is shown in Table A1.
Table A1 - Accident Rate Climbing Lane Site Three
Table A1 identifies an average pre scheme accident rate of 0.127 PIA/MVKM at the site. The average post scheme accident rate was 0.165 PIA/MVKM, a 0.038 PIA/MVKM (30%) increase in the accident rate at the site post scheme opening.
The accident rate for M25 J18-J19 climbing lane the five years (1999 – 2003) sampled showed that only the years 1999 and 2003 had accident rates lower than the COBA default accident rate for a three or four lane motorway, and again only the years 1999 and 2003 where the accident rate was greater than the 2000 motorway average accident rate.
Severity Index
Severity index is calculated by taking fatal plus serious accidents as a percentage of total accidents. Table A2 shows the severity index by year.
Year Length of road (KM)
Average Flow (AADT)
No. of accidents
Accident Rate (PIA / MVKM)
1999 1.260 77139 3 0.084
2000 1.260 76453 6 0.170
2001 1.260 78456 8 0.221
2002 1.260 80623 7 0.188
2003 1.260 75596 3 0.086
Average (Pre) 1.260 N/A N/A 0.127
Average (Post) 1.260 N/A N/A 0.165
COBA Default Accident Rate for Three or Four Lane Motorways 0.096
2000 Average Accident Rate Motorway 0.106

M25 CLIMBING LANE J18-J19 SITE THREE : POST OPENING PROJECT
EVALUATION Post Opening Evaluation Report
A596 M25 J18-J19 One Year 19 POPE of LNMS - M25 J18-19_FINAL.doc
Table A2 - Severity Index by Year for Climbing Lane Site Three
Year Severity Index
1999 33%
2000 33%
2001 0%
2002 0%
2003 0%
PRE 27%
POST 0%
Table A2 illustrates a reduction in the severity of accidents at the site to 0%.
It should be noted however, that local data on accident severity is notoriously difficult to interpret and, for example, HA TAME would typically require 20 years of accident data to substantiate a local severity rate. Consequently a comparison of accident severity over two 19 month periods may not provide a sufficiently accurate assessment.
Scheme Contributes to Accidents
This section examines the climbing lane site to see if the scheme is directly attributed to the accidents or possibly attributed to the accidents. This examination was undertaken by examining the location of the accidents and undertaking a review of the accident description. It should be noted that the quality of accident description does somewhat vary. The Highways Agency team asked Atkins to examine the terminus of the climbing lanes as there is a perceived problem that the end of the climbing lanes are directly attributable to accidents.
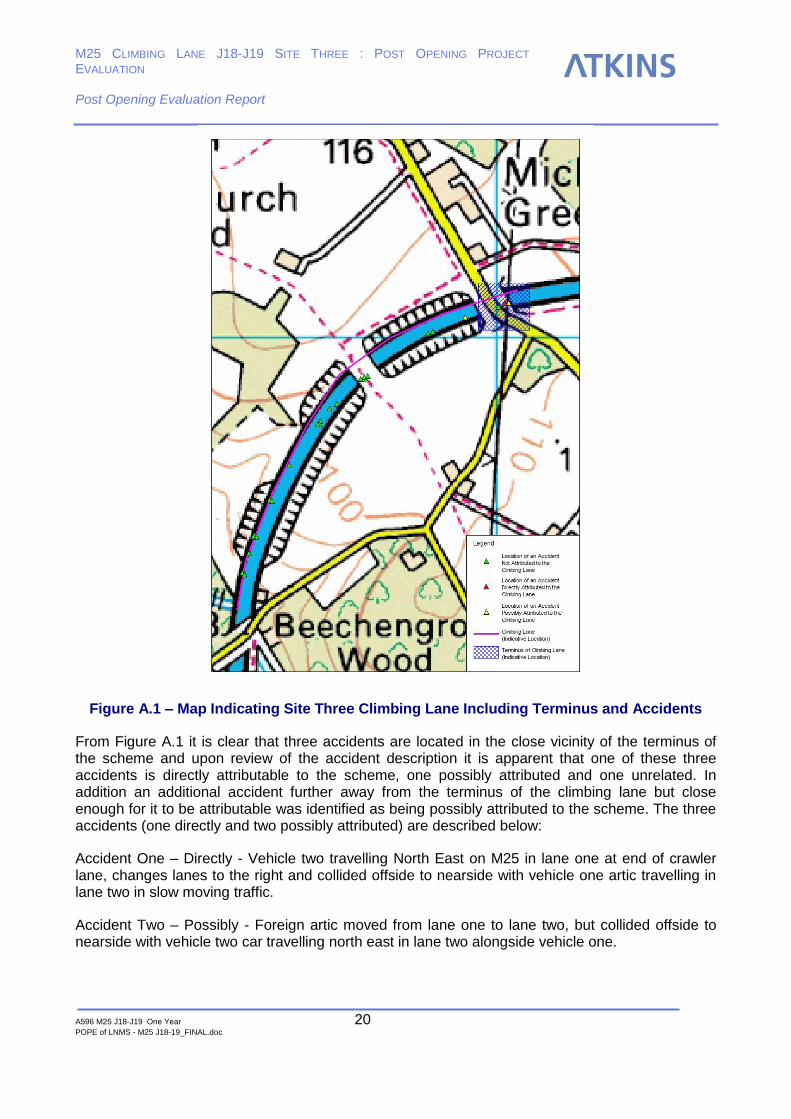
Site Three – From examination of the accident data it is concluded that the climbing lane is directly attributable to one accident and a possible cause of an additional two accidents. Figure A.1 gives an indication of the accidents over the period 1999 – 2003, an indicative location of the climbing lane and its terminus.
M25 CLIMBING LANE J18-J19 SITE THREE : POST OPENING PROJECT
EVALUATION Post Opening Evaluation Report
A596 M25 J18-J19 One Year 20 POPE of LNMS - M25 J18-19_FINAL.doc
Figure A.1 – Map Indicating Site Three Climbing Lane Including Terminus and Accidents
From Figure A.1 it is clear that three accidents are located in the close vicinity of the terminus of the scheme and upon review of the accident description it is apparent that one of these three accidents is directly attributable to the scheme, one possibly attributed and one unrelated. In addition an additional accident further away from the terminus of the climbing lane but close enough for it to be attributable was identified as being possibly attributed to the scheme. The three accidents (one directly and two possibly attributed) are described below:
Accident One – Directly - Vehicle two travelling North East on M25 in lane one at end of crawler lane, changes lanes to the right and collided offside to nearside with vehicle one artic travelling in lane two in slow moving traffic.
Accident Two – Possibly - Foreign artic moved from lane one to lane two, but collided offside to nearside with vehicle two car travelling north east in lane two alongside vehicle one.
M25 CLIMBING LANE J18-J19 SITE THREE : POST OPENING PROJECT
EVALUATION Post Opening Evaluation Report
A596 M25 J18-J19 One Year 21 POPE of LNMS - M25 J18-19_FINAL.doc
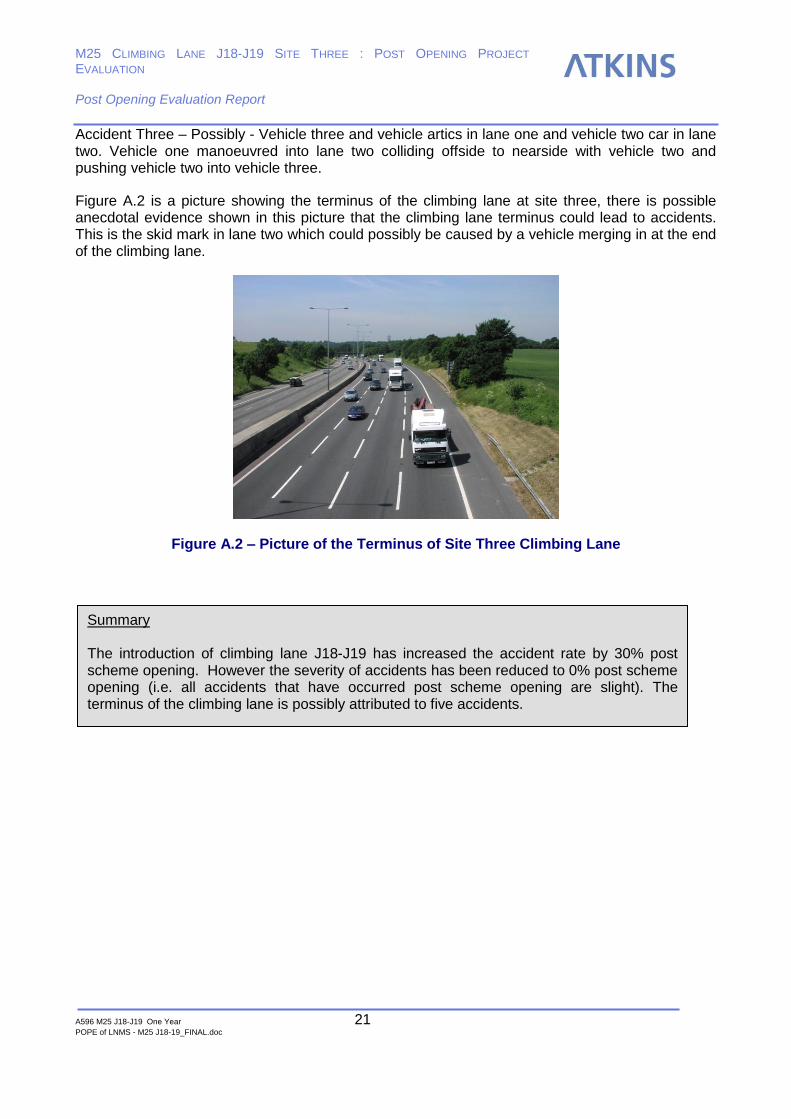
Accident Three – Possibly - Vehicle three and vehicle artics in lane one and vehicle two car in lane two. Vehicle one manoeuvred into lane two colliding offside to nearside with vehicle two and pushing vehicle two into vehicle three.
Figure A.2 is a picture showing the terminus of the climbing lane at site three, there is possible anecdotal evidence shown in this picture that the climbing lane terminus could lead to accidents. This is the skid mark in lane two which could possibly be caused by a vehicle merging in at the end of the climbing lane.
Figure A.2 – Picture of the Terminus of Site Three Climbing Lane
Summary The introduction of climbing lane J18-J19 has increased the accident rate by 30% post scheme opening. However the severity of accidents has been reduced to 0% post scheme opening (i.e. all accidents that have occurred post scheme opening are slight). The terminus of the climbing lane is possibly attributed to five accidents.

M25 CLIMBING LANE J18-J19 SITE THREE : POST OPENING PROJECT
EVALUATION Post Opening Evaluation Report
A596 M25 J18-J19 One Year 22 POPE of LNMS - M25 J18-19_FINAL.doc
Annex B - TrafficMaster Data

M25 CLIMBING LANE J18-J19 SITE THREE : POST OPENING PROJECT
EVALUATION Post Opening Evaluation Report
A596 M25 J18-J19 One Year 23 POPE of LNMS - M25 J18-19_FINAL.doc
TrafficMaster Data
Faber Maunsell collated Trafficmaster spot speed data below 30mph using the existing Trafficmaster infra-red sensors around the M25. The location of these sensors in relation to climbing is shown in Figure B1.
Figure B1 - Location of M25 J18-J19 Climbing Lane
The TrafficMaster data was analysed to calculate the amount of time the speed at the sensor locations was below 30 mph, this was calculated for each month of the 12 month for the one year pre and post opening. The data from both carriageways was processed with the anticlockwise data providing a control. The changes between comparable months were analysed for statistical significance. The difference in hours of congestion (below 30mph) for M25 junctions 18-19 between the before and after periods is shown in table B1.
Table B1 - Difference in hours of Congestion (below 30mph) for M25 Junctions 18-19
Sensor ‘Hours After’ minus ‘Hours Before’
9 Month
total Average Standard Deviation
T-Statistic Probability
55N -21.8 -2.42 2.43 1 0.35
55S 23.3 2.59 3.33 0.78 0.46
56E 26.55 2.95 1.64 1.8 0.11
56W 145.7 16.19 9.04 1.79 0.11
M25 CLIMBING LANE J18-J19 SITE THREE : POST OPENING PROJECT
EVALUATION Post Opening Evaluation Report
A596 M25 J18-J19 One Year 24 POPE of LNMS - M25 J18-19_FINAL.doc
SITE 55
Table B1 illustrates a reduction in the number of hours of congestion felt monthly by traffic travelling clockwise at site 55 of 2.42 hours. A 2.59 hour rise in the number of hours of congestion felt monthly by traffic travelling anti-clockwise at site 55 indicates that the introduction of a climbing lane on the clockwise carriageway has removed 5.01 hours of congestion a month from site 55N’s location.
SITE 56
Table B1 illustrates an increase in the number of hours of congestion felt monthly by traffic travelling clockwise at site 56 of 2.95 hours. A 16.19 hour rise in the number of hours of congestion felt monthly by traffic travelling anti-clockwise at site 56 indicates that the introduction of a climbing lane on the clockwise carriageway has restrained the growth of congestion by 13.24 hours of congestion a month at site 56E’s location.
Summary
The scheme has restrained the levels of growth of congestion on the clockwise carriageway between junctions 18 and 19 of the M25. But overall it does not appear to have significantly decreased the levels of congestion felt between junctions 18 and 19 on the clockwise carriageway of the M25.
The reason for this is that the introduction of a climbing lane allows traffic in the two outside lanes to remain free flowing while the two inside lanes are used by slow moving traffic to negotiate the uphill section of road at slower speeds. This means that traffic in the two inside lanes will not have to decelerate as much post scheme opening as they did pre scheme opening, thus reducing the time traffic in these lanes spend below 30mph.
M25 CLIMBING LANE J18-J19 SITE THREE : POST OPENING PROJECT
EVALUATION Post Opening Evaluation Report
A596 M25 J18-J19 One Year 25 POPE of LNMS - M25 J18-19_FINAL.doc
Annex C - Original Scheme AST

M25 CLIMBING LANE J18-J19 SITE THREE : POST OPENING PROJECT
EVALUATION Post Opening Evaluation Report
A596 M25 J18-J19 One Year 26 POPE of LNMS - M25 J18-19_FINAL.doc
Original Scheme AST
Proposal Name
Option description M25 Motorway Junctions 18 to 19 Climbing Lane
Current £1.288m (excl VAT) Date of Current Cost December 1999
PROBLEMS This has been identified by the Highways Agency as a site that experiences congestion and delays on sections of motorway involving significant uphill gradients in the northbound direction of traffic flow.
OTHER OPTIONS The only other option is to widen the motorway to provide a climbing lane, which is unacceptable
OBJECTIVE SUB-OBJECTIVE QUALITATIVE IMPACTS QUANTITATIVE MEASURE ASSESSMENT
ENVIRONMENT
Noise Slight reduction in noise levels due to reduction in congestion -1.0 to -0.5dB(A) Net properties experiencing
higher noise levels - Nil
Local Air Quality Slight reduction in pollution levels due to reduction in congestion PM10 -260, NO2 -78 Not assessed
Landscape Slight visual intrusion due to additional signing Not assessed Not assessed
Biodiversity Neutral Not applicable Not assessed
Heritage Neutral Not applicable Not assessed
Water No change in quality of runoff. Marginal increase in quantity of runoff. Not applicable Not assessed
SAFETY - Slight improvement, reduced risk of accidents due to reduction in congestion Not assessed Not assessed
ECONOMY
Journey times & Veh. Op. Costs
Substantial improvement in journey times due from reduction in delays caused by HGVs on uphill gradient.
49,000 vehicle hours saved in first year Not assessed
Cost Substantial adverse cost. No third party contributions £1.483 million
Journey Time Reliability Substantial improvement Not assessed Not assessed
Regeneration Not applicable Not applicable Not applicable
ACCESSIBILITY
Pedestrians and Others Neutral Not applicable Not applicable
Access to public transport Neutral Not applicable Not applicable
Community Severance Neutral Not applicable Not applicable
INTEGRATION - Not applicable Not Applicable Not Applicable
M25 CLIMBING LANE J18-J19 SITE THREE : POST OPENING PROJECT
EVALUATION Post Opening Evaluation Report
A596 M25 J18-J19 One Year 27 POPE of LNMS - M25 J18-19_FINAL.doc
Version of August 2000 Cost Benefit Analysis (low/high)
M25 CLIMBING LANE J18-J19 SITE THREE : POST OPENING PROJECT
EVALUATION Post Opening Evaluation Report
A596 M25 J18-J19 One Year 28 POPE of LNMS - M25 J18-19_FINAL.doc
Annex D - Atkins EST
M25 CLIMBING LANE J18-J19 SITE THREE : POST OPENING PROJECT
EVALUATION Post Opening Evaluation Report
A596 M25 J18-J19 One Year 29 POPE of LNMS - M25 J18-19_FINAL.doc
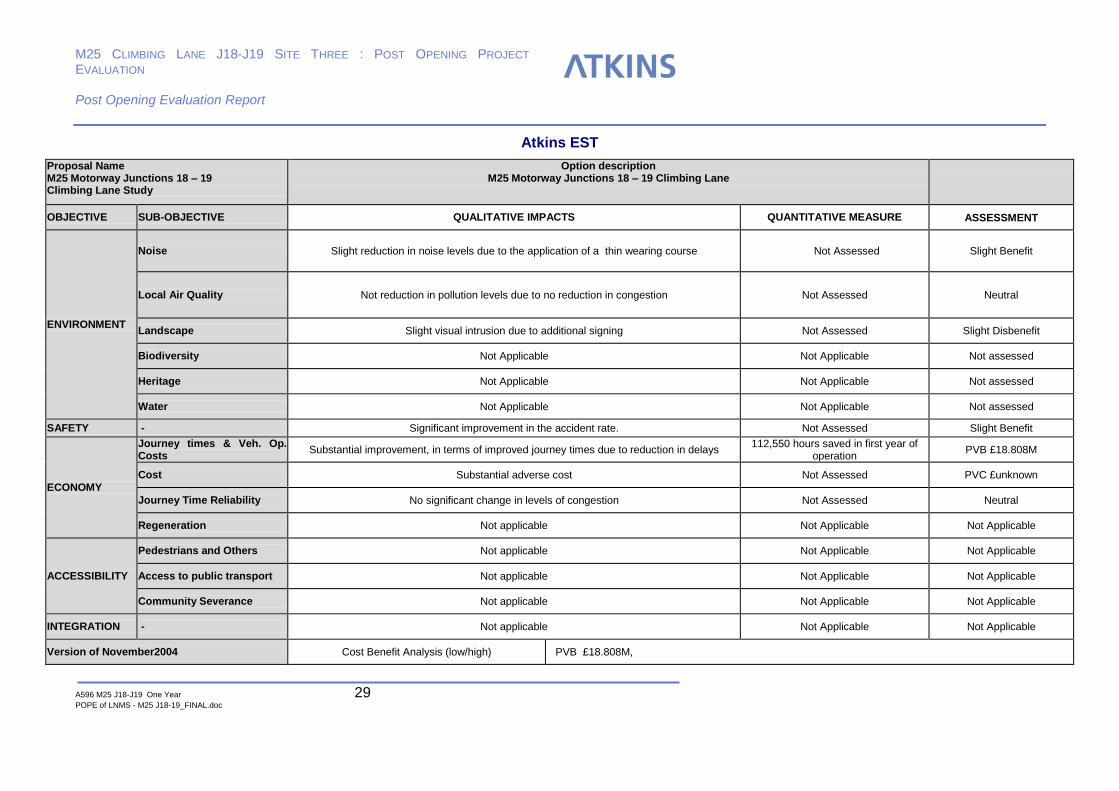
Atkins EST
Proposal Name M25 Motorway Junctions 18 – 19 Climbing Lane Study
Option description M25 Motorway Junctions 18 – 19 Climbing Lane
OBJECTIVE SUB-OBJECTIVE QUALITATIVE IMPACTS QUANTITATIVE MEASURE ASSESSMENT
ENVIRONMENT
Noise Slight reduction in noise levels due to the application of a thin wearing course Not Assessed Slight Benefit
Local Air Quality Not reduction in pollution levels due to no reduction in congestion Not Assessed Neutral
Landscape Slight visual intrusion due to additional signing Not Assessed Slight Disbenefit
Biodiversity Not Applicable Not Applicable Not assessed
Heritage Not Applicable Not Applicable Not assessed
Water Not Applicable Not Applicable Not assessed
SAFETY - Significant improvement in the accident rate. Not Assessed Slight Benefit
ECONOMY
Journey times & Veh. Op. Costs
Substantial improvement, in terms of improved journey times due to reduction in delays 112,550 hours saved in first year of
operation PVB £18.808M
Cost Substantial adverse cost Not Assessed PVC £unknown
Journey Time Reliability No significant change in levels of congestion Not Assessed Neutral
Regeneration Not applicable Not Applicable Not Applicable
ACCESSIBILITY
Pedestrians and Others Not applicable Not Applicable Not Applicable
Access to public transport Not applicable Not Applicable Not Applicable
Community Severance Not applicable Not Applicable Not Applicable
INTEGRATION - Not applicable Not Applicable Not Applicable
Version of November2004 Cost Benefit Analysis (low/high) PVB £18.808M,

M25 CLIMBING LANE J18-J19 SITE THREE : POST OPENING PROJECT
EVALUATION Post Opening Evaluation Report
A596 M25 J18-J19 One Year 30 POPE of LNMS - M25 J18-19_FINAL.doc