Embed Size (px)
Citation preview

M I K H O L D I N G J S C A N D I T S
S U B S I D I A R I E S (Incorporated in Mongolia)
Audited consolidated financial statements31 December 2019

MIK HOLDING JSC AND ITS SUBSIDIARIES
FOR THE YEAR ENDED 31 December 2019
CONTENTS
Corporate Information................................................................................................................................................. 1STATEMENT BY CHAIRMAN AND EXECUTIVES ............................................................................................... 2INDEPENDENT AUDITOR’S REPORT .................................................................................................................... 3Consolidated Statement of Profit or Loss and Other Comprehensive Income ................................................................ 8Consolidated Statement of Financial Position .............................................................................................................. 9Consolidated Statement of Changes in Equity ............................................................................................................ 10Consolidated Statement of Cash Flows ...................................................................................................................... 111. Corporate and Group information ......................................................................................................................... 132. Significant accounting policies ............................................................................................................................. 13
2.1. Basis of preparation ..................................................................................................................................... 132.2. Changes in accounting policies and disclosures ............................................................................................ 142.3. Summary of significant accounting policies ................................................................................................. 172.4. Significant accounting judgments, estimates and assumptions ...................................................................... 27
3. Interest income and segment information ............................................................................................................. 284. Interest expense ................................................................................................................................................... 285. Fee and commission expense ............................................................................................................................... 286. Credit loss expense/(reversal) on financial assets .................................................................................................. 287. Operating expenses .............................................................................................................................................. 298. Other operating expenses ..................................................................................................................................... 299. Income tax ........................................................................................................................................................... 29
9.1. Income tax expense ....................................................................................................................................... 299.2. Income tax payable ....................................................................................................................................... 309.3. Deferred tax .................................................................................................................................................. 30
10. Earnings per share ............................................................................................................................................... 3111. Cash and bank balances ....................................................................................................................................... 31
11.1. Impairment allowance for cash and bank balances ....................................................................................... 3212. Debt instruments at amortised cost ....................................................................................................................... 33
12.1. Impairment allowance for debt instruments at amortised cost ....................................................................... 3313. Mortgage pool receivables with recourse .............................................................................................................. 35
13.1. Impairment allowance for mortgage pool receivables with recourse ............................................................. 3514. Purchased mortgage pool receivables ................................................................................................................... 37
14.1. Impairment allowance for purchased mortgage pool receivables ................................................................... 3715. Financial assets at fair value through profit or loss ................................................................................................ 3916. Derivative financial instruments ........................................................................................................................... 3917. Other assets ......................................................................................................................................................... 4018. Property and equipment ....................................................................................................................................... 4119. Intangible assets .................................................................................................................................................. 4220. Other liabilities .................................................................................................................................................... 4221. Borrowed funds ................................................................................................................................................... 4222. Debt securities issued ........................................................................................................................................... 4323. Collateralised bonds ............................................................................................................................................. 4324. Ordinary shares.................................................................................................................................................... 4425. Contingent liabilities and commitments ................................................................................................................ 4526. Maturity analysis of assets and liabilities .............................................................................................................. 4627. Related party disclosures...................................................................................................................................... 4728. Risk management ................................................................................................................................................ 51
28.1. Introduction ................................................................................................................................................ 5128.2. Credit risk ................................................................................................................................................... 5128.3. Liquidity risk .............................................................................................................................................. 5528.4. Market risk.................................................................................................................................................. 5628.5. Operational risk........................................................................................................................................... 57
29. Fair value of financial instruments ....................................................................................................................... 5830. Capital management ............................................................................................................................................ 5931. Subsequent events................................................................................................................................................ 59
1
MIK HOLDING JSC AND ITS SUBSIDIARIES
Corporate Information
Registered Office : Sukhbaatar district, 1st khoroo, Peace avenue-19, 13th floor P.O.Box – 14210 – 215 Ulaanbaatar City, Mongolia
Board of Directors : Mr. Munkhbaatar M. (Chairman) Ms. Ayush D. Mr. Choijiljalbuu B. Mr. Davaajav T. Ms. Batchimeg S. Mr. Gantulga B. Mr. Khashchuluun Ch. Mr. Shijir E. Mr. Otgochuluu Ch.
Corporate Secretary : Ms. Saruul G.
Auditors : Ernst & Young Mongolia Audit LLC Certified Public Accountants


8
MIK HOLDING JSC AND ITS SUBSIDIARIES
Consolidated Statement of Profit or Loss and Other Comprehensive Income
For the year ended 31 December 2019
2019 2018Notes MNT'000 MNT'000
Interest income 3 339,227,417 237,664,203
Interest expense 4 (259,291,261) (143,679,467)
Net interest income 79,936,156 93,984,736
Fee and commission expense 5 (12,526,380) (11,882,019)
Other operating income 90,451 222,241
Total operating income 67,500,227 82,324,958
Credit loss expense on financial assets 6 (9,194,529) (737,144)
Net losses on financial assets at fair value through profit or loss 15 (300,069) –
Net gains on derivative financial instruments 16 55,516,592 –
Net operating income 113,522,221 81,587,814
Operating expenses 7 (12,695,335) (12,670,033)
Other operating expenses 8 (30,763,099) (797,470)
Profit before tax 70,063,787 68,120,311
Income tax expense 9.1 (15,829,486) (10,539,731)
Profit for the year, representing total comprehensive income 54,234,301 57,580,580
Earnings per share (MNT)Basic and diluted earnings per share 10 3,557.07 3,477.51

9
MIK HOLDING JSC AND ITS SUBSIDIARIES
Consolidated Statement of Financial Position
As at 31 December 2019
2019 2018Notes MNT'000 MNT'000
ASSETS
Cash and bank balances 11 228,337,007 86,438,794Debt instruments at amortised cost 12 256,277,326 196,008,869Mortgage pool receivables with recourse 13 705,561,246 20,317,980Purchased mortgage pool receivables 14 2,894,437,216 2,840,112,824Financial assets at fair value through profit or loss 15 4,699,931 5,000,000Derivative financial instruments 16 55,516,592 –Other assets 17 615,670 3,525,542Property and equipment 18 32,532,212 33,479,567Intangible assets 19 191,868 157,779Deferred tax asset 9.3 3,078,910 –TOTAL ASSETS 4,181,247,978 3,185,041,355
LIABILITIES
Other liabilities 20 25,409,207 11,171,232Borrowed funds 21 70,709,375 44,907,989Debt securities issued 22 839,131,215 –Collateralised bonds 23 2,949,029,174 2,898,320,103Income tax payable 9.2 1,459,805 1,195,430Deferred tax liability 9.3 32,823,469 20,995,169TOTAL LIABILITIES 3,918,562,245 2,976,589,923
EQUITY
Ordinary shares 24 20,709,320 20,709,320Share premium 24 52,225,115 52,225,115Treasury shares 24 (62,143,136) (62,143,136)Reserve 251,894,434 197,660,133TOTAL EQUITY 262,685,733 208,451,432
TOTAL LIABILITIES AND EQUITY 4,181,247,978 3,185,041,355

10
MIK HOLDING JSC AND ITS SUBSIDIARIES
Consolidated Statement of Changes in Equity
For the year ended 31 December 2019
Ordinary Share Treasury Retained Totalshares premium shares earnings* equity
Notes MNT'000 MNT'000 MNT'000 MNT'000 MNT'000
At 1 January 2018 20,709,320 52,225,115 (47,055,136) 140,079,553 165,958,852Total comprehensive income – – – 57,580,580 57,580,580Repurchase of shares 24 – – (15,088,000) – (15,088,000)At 31 December 2018 and
1 January 2019 20,709,320 52,225,115 (62,143,136) 197,660,133 208,451,432Total comprehensive income – – – 54,234,301 54,234,301At 31 December 2019 20,709,320 52,225,115 (62,143,136) 251,894,434 262,685,733
* Included in retained earnings as at 31 December 2019 are restricted retained earnings of MNT 272,718,090 thousand(31 December 2018: MNT 207,827,030 thousand) that are attributable to the Group’s SPCs. The restriction relates tothe issuance of Residential Mortgage Backed Securities (“RMBS”), whereby the retained earnings of the SPCs thathave issued RMBSs are restricted from distribution until their liquidation in accordance with their Articles of Charterand related Financial Regulatory Commission (“FRC”) regulation.
11
MIK HOLDING JSC AND ITS SUBSIDIARIES
Consolidated Statement of Cash Flows
For the year ended 31 December 2019
Notes 2019 2018MNT'000 MNT'000
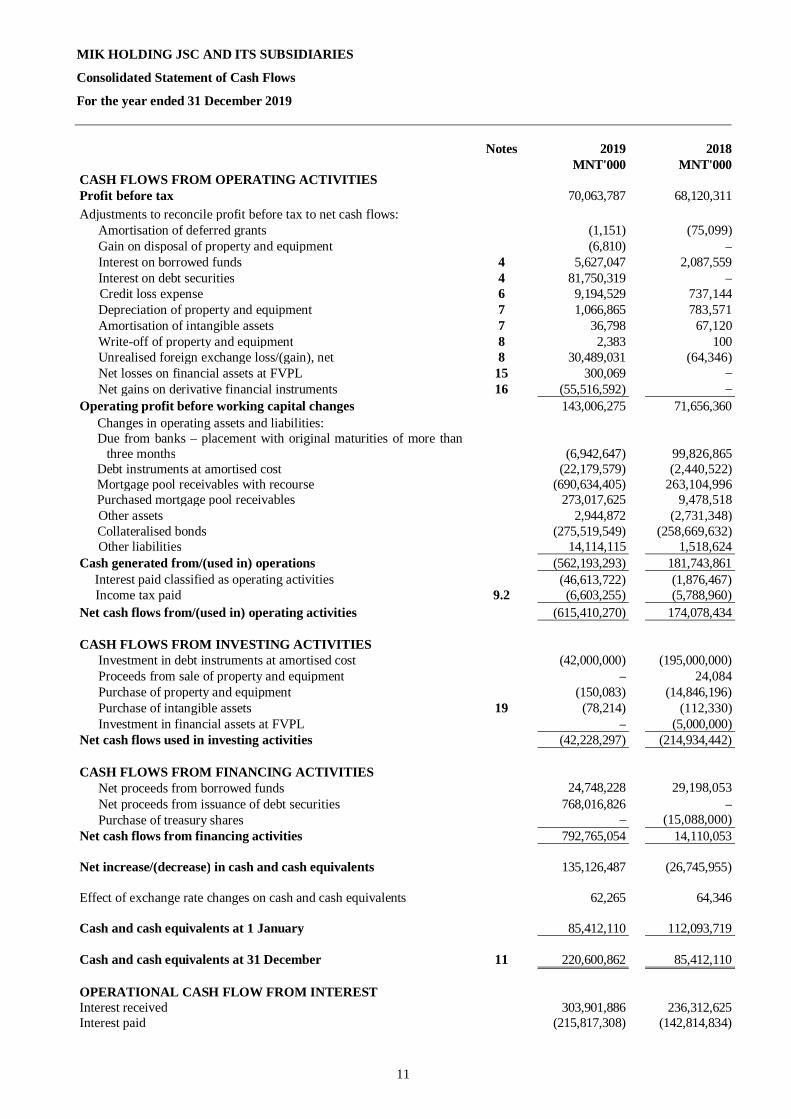
CASH FLOWS FROM OPERATING ACTIVITIESProfit before tax 70,063,787 68,120,311Adjustments to reconcile profit before tax to net cash flows:
Amortisation of deferred grants (1,151) (75,099)Gain on disposal of property and equipment (6,810) –Interest on borrowed funds 4 5,627,047 2,087,559Interest on debt securities 4 81,750,319 –Credit loss expense 6 9,194,529 737,144Depreciation of property and equipment 7 1,066,865 783,571Amortisation of intangible assets 7 36,798 67,120Write-off of property and equipment 8 2,383 100Unrealised foreign exchange loss/(gain), net 8 30,489,031 (64,346)Net losses on financial assets at FVPL 15 300,069 –Net gains on derivative financial instruments 16 (55,516,592) –
Operating profit before working capital changes 143,006,275 71,656,360Changes in operating assets and liabilities: Due from banks – placement with original maturities of more than
three months (6,942,647) 99,826,865Debt instruments at amortised cost (22,179,579) (2,440,522)Mortgage pool receivables with recourse (690,634,405) 263,104,996Purchased mortgage pool receivables 273,017,625 9,478,518Other assets 2,944,872 (2,731,348)Collateralised bonds (275,519,549) (258,669,632)Other liabilities 14,114,115 1,518,624
Cash generated from/(used in) operations (562,193,293) 181,743,861Interest paid classified as operating activities (46,613,722) (1,876,467)Income tax paid 9.2 (6,603,255) (5,788,960)
Net cash flows from/(used in) operating activities (615,410,270) 174,078,434
CASH FLOWS FROM INVESTING ACTIVITIESInvestment in debt instruments at amortised cost (42,000,000) (195,000,000)Proceeds from sale of property and equipment – 24,084Purchase of property and equipment (150,083) (14,846,196)Purchase of intangible assets 19 (78,214) (112,330)Investment in financial assets at FVPL – (5,000,000)
Net cash flows used in investing activities (42,228,297) (214,934,442)
CASH FLOWS FROM FINANCING ACTIVITIESNet proceeds from borrowed funds 24,748,228 29,198,053Net proceeds from issuance of debt securities 768,016,826 –Purchase of treasury shares – (15,088,000)
Net cash flows from financing activities 792,765,054 14,110,053
Net increase/(decrease) in cash and cash equivalents 135,126,487 (26,745,955)
Effect of exchange rate changes on cash and cash equivalents 62,265 64,346
Cash and cash equivalents at 1 January 85,412,110 112,093,719
Cash and cash equivalents at 31 December 11 220,600,862 85,412,110
OPERATIONAL CASH FLOW FROM INTERESTInterest received 303,901,886 236,312,625Interest paid (215,817,308) (142,814,834)

12
MIK HOLDING JSC AND ITS SUBSIDIARIES
Consolidated Statement of Cash Flows
For the year ended 31 December 2019 (cont’d.)
2019 2018MNT'000 MNT'000
Non-cash transactions:Purchase of property and equipment (75,000) (4,914,112)Disposal of property and equipment 110,000 –Disposal of intangible assets 7,327 –
The reconciliation of liabilities arising from financing activities is shown below:
Borrowed funds Debt securities issued2019 2018 2019 2018
MNT’000 MNT’000 MNT’000 MNT’000
As at 1 January 44,907,989 15,498,844 – –
New disbursement/additions 25,000,000 36,355,296 789,200,902 –Repayment classified as financing
activity (251,772) (7,157,243) – –Transaction costs – – (21,184,076) –Net proceeds 24,748,228 29,198,053 768,016,826 –
Interest expense for the year 5,627,047 2,087,559 81,750,319 –Interest paid (4,573,889) (1,876,467) (42,039,833) –Foreign exchange movement – – 31,403,903 –As at 31 December 70,709,375 44,907,989 839,131,215 –
MIK HOLDING JSC AND ITS SUBSIDIARIES
Notes to the Consolidated Financial Statements – 31 December 2019
13
1. Corporate and Group information
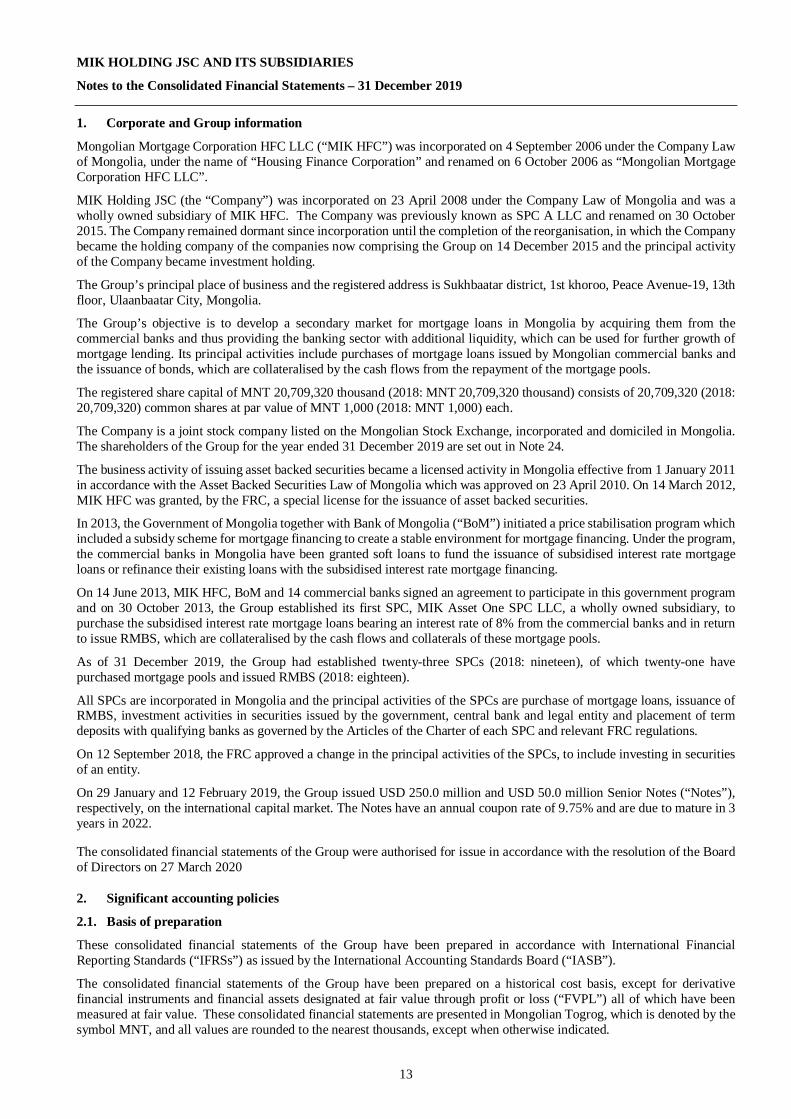
Mongolian Mortgage Corporation HFC LLC (“MIK HFC”) was incorporated on 4 September 2006 under the Company Lawof Mongolia, under the name of “Housing Finance Corporation” and renamed on 6 October 2006 as “Mongolian MortgageCorporation HFC LLC”.
MIK Holding JSC (the “Company”) was incorporated on 23 April 2008 under the Company Law of Mongolia and was awholly owned subsidiary of MIK HFC. The Company was previously known as SPC A LLC and renamed on 30 October2015. The Company remained dormant since incorporation until the completion of the reorganisation, in which the Companybecame the holding company of the companies now comprising the Group on 14 December 2015 and the principal activityof the Company became investment holding.
The Group’s principal place of business and the registered address is Sukhbaatar district, 1st khoroo, Peace Avenue-19, 13thfloor, Ulaanbaatar City, Mongolia.
The Group’s objective is to develop a secondary market for mortgage loans in Mongolia by acquiring them from thecommercial banks and thus providing the banking sector with additional liquidity, which can be used for further growth ofmortgage lending. Its principal activities include purchases of mortgage loans issued by Mongolian commercial banks andthe issuance of bonds, which are collateralised by the cash flows from the repayment of the mortgage pools.
The registered share capital of MNT 20,709,320 thousand (2018: MNT 20,709,320 thousand) consists of 20,709,320 (2018:20,709,320) common shares at par value of MNT 1,000 (2018: MNT 1,000) each.
The Company is a joint stock company listed on the Mongolian Stock Exchange, incorporated and domiciled in Mongolia.The shareholders of the Group for the year ended 31 December 2019 are set out in Note 24.
The business activity of issuing asset backed securities became a licensed activity in Mongolia effective from 1 January 2011in accordance with the Asset Backed Securities Law of Mongolia which was approved on 23 April 2010. On 14 March 2012,MIK HFC was granted, by the FRC, a special license for the issuance of asset backed securities.
In 2013, the Government of Mongolia together with Bank of Mongolia (“BoM”) initiated a price stabilisation program whichincluded a subsidy scheme for mortgage financing to create a stable environment for mortgage financing. Under the program,the commercial banks in Mongolia have been granted soft loans to fund the issuance of subsidised interest rate mortgageloans or refinance their existing loans with the subsidised interest rate mortgage financing.
On 14 June 2013, MIK HFC, BoM and 14 commercial banks signed an agreement to participate in this government programand on 30 October 2013, the Group established its first SPC, MIK Asset One SPC LLC, a wholly owned subsidiary, topurchase the subsidised interest rate mortgage loans bearing an interest rate of 8% from the commercial banks and in returnto issue RMBS, which are collateralised by the cash flows and collaterals of these mortgage pools.
As of 31 December 2019, the Group had established twenty-three SPCs (2018: nineteen), of which twenty-one havepurchased mortgage pools and issued RMBS (2018: eighteen).
All SPCs are incorporated in Mongolia and the principal activities of the SPCs are purchase of mortgage loans, issuance ofRMBS, investment activities in securities issued by the government, central bank and legal entity and placement of termdeposits with qualifying banks as governed by the Articles of the Charter of each SPC and relevant FRC regulations.
On 12 September 2018, the FRC approved a change in the principal activities of the SPCs, to include investing in securitiesof an entity.
On 29 January and 12 February 2019, the Group issued USD 250.0 million and USD 50.0 million Senior Notes (“Notes”),respectively, on the international capital market. The Notes have an annual coupon rate of 9.75% and are due to mature in 3years in 2022.
The consolidated financial statements of the Group were authorised for issue in accordance with the resolution of the Boardof Directors on 27 March 2020
2. Significant accounting policies
2.1. Basis of preparation
These consolidated financial statements of the Group have been prepared in accordance with International FinancialReporting Standards (“IFRSs”) as issued by the International Accounting Standards Board (“IASB”).
The consolidated financial statements of the Group have been prepared on a historical cost basis, except for derivativefinancial instruments and financial assets designated at fair value through profit or loss (“FVPL”) all of which have beenmeasured at fair value. These consolidated financial statements are presented in Mongolian Togrog, which is denoted by thesymbol MNT, and all values are rounded to the nearest thousands, except when otherwise indicated.

MIK HOLDING JSC AND ITS SUBSIDIARIES
Notes to the Consolidated Financial Statements – 31 December 2019
14
2. Significant accounting policies (cont’d.)
2.1. Basis of preparation (cont’d.)
Presentation of financial statements
The Group presents its statement of financial position broadly in order of liquidity. An analysis regarding recovery orsettlement within 12 months after the reporting date (current) and more than 12 months after the reporting date (non-current)is presented in Note 26.
Financial assets and financial liabilities are offset and the net amount is reported in the statement of financial position onlywhen there is a currently enforceable legal right to offset the recognised amounts and there is an intention to settle on a netbasis, or to realise the assets and settle the liability simultaneously. Income and expense is not offset in the consolidatedstatement of profit or loss and other comprehensive income (“OCI”) unless required or permitted by any accounting standardor interpretation, and as specifically disclosed in the accounting policies of the Group.
Basis of consolidation
The consolidated financial statements comprise the financial statements of the Company and its subsidiaries as at 31December 2019. A subsidiary is an entity (including structured entity), directly or indirectly, controlled by the Company.Control is achieved when the Group is exposed, or has rights, to variable returns from its involvement with the investee andhas the ability to affect those returns through its power over the investee. Specifically, the Group controls an investee if, andonly if, the Group has:
· Power over the investee (i.e., existing rights that give it the current ability to direct the relevant activities of the investee)· Exposure, or rights, to variable returns from its involvement with the investee· The ability to use its power over the investee to affect its returns
Generally, there is a presumption that a majority of voting rights results in control. To support this presumption and whenthe Group has less than a majority of the voting or similar rights of an investee, the Group considers all relevant facts andcircumstances in assessing whether it has power over an investee, including:
· The contractual arrangement(s) with the other vote holders of the investee· Rights arising from other contractual arrangements· The Group’s voting rights and potential voting rights
The Group re-assesses whether or not it controls an investee if facts and circumstances indicate that there are changes to oneor more of the three elements of control. Consolidation of a subsidiary begins when the Group obtains control over thesubsidiary and ceases when the Group loses control of the subsidiary. Assets, liabilities, income and expenses of a subsidiaryacquired or disposed of during the year are included in the consolidated financial statements from the date the Group gainscontrol until the date the Group ceases to control the subsidiary.
Profit or loss and each component of other comprehensive incomes are attributed to the equity holders of the parent of theGroup and to the non-controlling interests, even if this results in the non-controlling interests having a deficit balance. Whennecessary, adjustments are made to the financial statements of subsidiaries to bring their accounting policies into line withthe Group’s accounting policies. All intra-group assets and liabilities, equity, income, expenses and cash flows relating totransactions between members of the Group are eliminated in full on consolidation.
A change in the ownership interest of a subsidiary, without a loss of control, is accounted for as an equity transaction.
If the Group loses control over a subsidiary, it derecognises the related assets (including goodwill), liabilities, non-controllinginterest and other components of equity, while any resultant gain or loss is recognised in profit or loss. Any investmentretained is recognised at fair value.
2.2. Changes in accounting policies and disclosures
The accounting policies adopted are consistent with those of the previous financial year, except for the following standardsand amendments to IFRS that became effective as of 1 January 2019:
New and amended standards and interpretations
• IFRS 16 Leases• IFRIC Interpretation 23 Uncertainty over Income Tax Treatment• Amendments to IFRS 9 Prepayment Features in Negative Compensation• Amendments to IAS 28 Long-term Interests in Associates and Joint Ventures• Annual Improvements (2015-2017 cycle) Amendments to a number of IFRSs issued in December 2017• Amendments to IAS 19 Plan Amendment, Curtailment or Settlement
MIK HOLDING JSC AND ITS SUBSIDIARIES
Notes to the Consolidated Financial Statements – 31 December 2019
15
2. Significant accounting policies (cont’d.)
2.2. Changes in accounting policies and disclosures (cont’d.)
New and amended standards and interpretations (cont’d.)
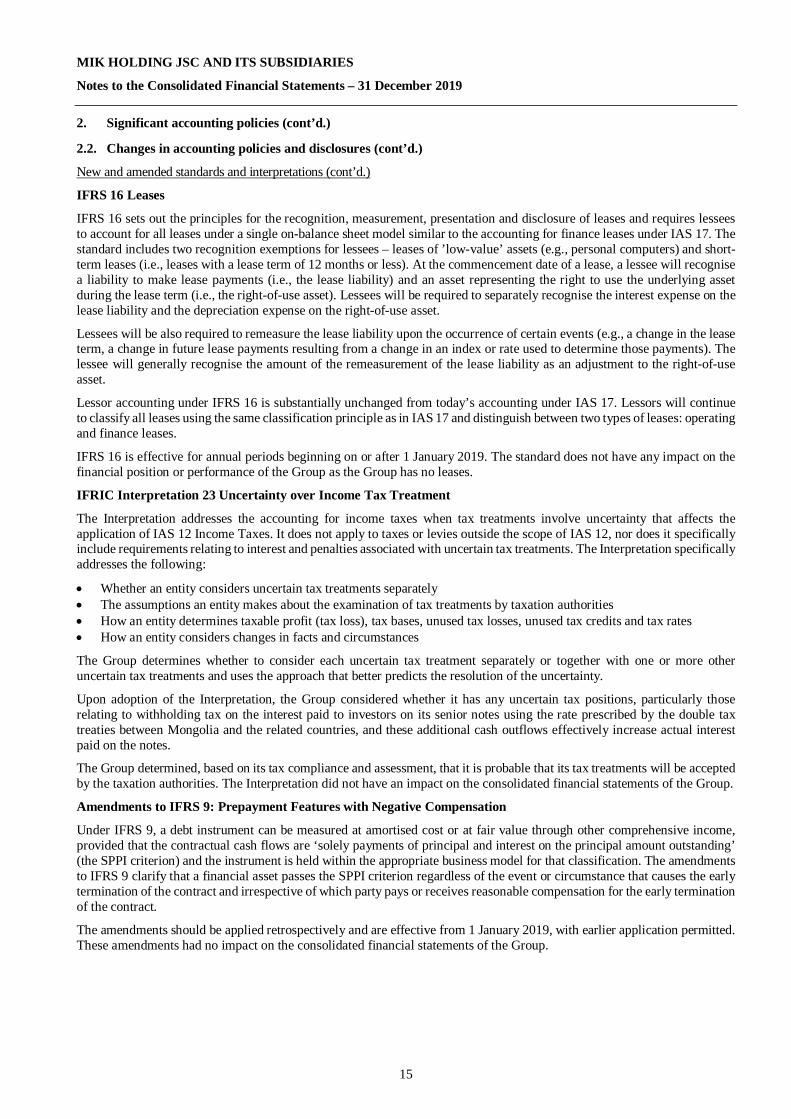
IFRS 16 Leases
IFRS 16 sets out the principles for the recognition, measurement, presentation and disclosure of leases and requires lesseesto account for all leases under a single on-balance sheet model similar to the accounting for finance leases under IAS 17. Thestandard includes two recognition exemptions for lessees – leases of ’low-value’ assets (e.g., personal computers) and short-term leases (i.e., leases with a lease term of 12 months or less). At the commencement date of a lease, a lessee will recognisea liability to make lease payments (i.e., the lease liability) and an asset representing the right to use the underlying assetduring the lease term (i.e., the right-of-use asset). Lessees will be required to separately recognise the interest expense on thelease liability and the depreciation expense on the right-of-use asset.
Lessees will be also required to remeasure the lease liability upon the occurrence of certain events (e.g., a change in the leaseterm, a change in future lease payments resulting from a change in an index or rate used to determine those payments). Thelessee will generally recognise the amount of the remeasurement of the lease liability as an adjustment to the right-of-useasset.
Lessor accounting under IFRS 16 is substantially unchanged from today’s accounting under IAS 17. Lessors will continueto classify all leases using the same classification principle as in IAS 17 and distinguish between two types of leases: operatingand finance leases.
IFRS 16 is effective for annual periods beginning on or after 1 January 2019. The standard does not have any impact on thefinancial position or performance of the Group as the Group has no leases.
IFRIC Interpretation 23 Uncertainty over Income Tax Treatment
The Interpretation addresses the accounting for income taxes when tax treatments involve uncertainty that affects theapplication of IAS 12 Income Taxes. It does not apply to taxes or levies outside the scope of IAS 12, nor does it specificallyinclude requirements relating to interest and penalties associated with uncertain tax treatments. The Interpretation specificallyaddresses the following:
· Whether an entity considers uncertain tax treatments separately· The assumptions an entity makes about the examination of tax treatments by taxation authorities· How an entity determines taxable profit (tax loss), tax bases, unused tax losses, unused tax credits and tax rates· How an entity considers changes in facts and circumstances
The Group determines whether to consider each uncertain tax treatment separately or together with one or more otheruncertain tax treatments and uses the approach that better predicts the resolution of the uncertainty.
Upon adoption of the Interpretation, the Group considered whether it has any uncertain tax positions, particularly thoserelating to withholding tax on the interest paid to investors on its senior notes using the rate prescribed by the double taxtreaties between Mongolia and the related countries, and these additional cash outflows effectively increase actual interestpaid on the notes.
The Group determined, based on its tax compliance and assessment, that it is probable that its tax treatments will be acceptedby the taxation authorities. The Interpretation did not have an impact on the consolidated financial statements of the Group.
Amendments to IFRS 9: Prepayment Features with Negative Compensation
Under IFRS 9, a debt instrument can be measured at amortised cost or at fair value through other comprehensive income,provided that the contractual cash flows are ‘solely payments of principal and interest on the principal amount outstanding’(the SPPI criterion) and the instrument is held within the appropriate business model for that classification. The amendmentsto IFRS 9 clarify that a financial asset passes the SPPI criterion regardless of the event or circumstance that causes the earlytermination of the contract and irrespective of which party pays or receives reasonable compensation for the early terminationof the contract.
The amendments should be applied retrospectively and are effective from 1 January 2019, with earlier application permitted.These amendments had no impact on the consolidated financial statements of the Group.

MIK HOLDING JSC AND ITS SUBSIDIARIES
Notes to the Consolidated Financial Statements – 31 December 2019
16
2. Significant accounting policies (cont’d.)
2.2. Changes in accounting policies and disclosures (cont’d.)
New and amended standards and interpretations (cont’d.)
Annual Improvements 2015-2017 Cycle (issued in December 2017)
These improvements include:
IAS 12 Income Taxes
The amendments clarify that the income tax consequences of dividends are linked more directly to past transactions or eventsthat generated distributable profits than to distributions to owners. Therefore, an entity recognises the income taxconsequences of dividends in profit or loss, other comprehensive income or equity according to where the entity originallyrecognised those past transactions or events.
An entity applies those amendments for annual reporting periods beginning on or after 1 January 2019, with early applicationpermitted. When an entity first applies those amendments, it applies them to the income tax consequences of dividendsrecognised on or after the beginning of the earliest comparative period. Since the Group’s current practice is in line withthese amendments, the improvement did not have any effect on its consolidated financial statements.
IAS 23 Borrowing Costs
The amendments clarify that an entity treats as part of general borrowings any borrowing originally made to develop aqualifying asset when substantially all of the activities necessary to prepare that asset for its intended use or sale are complete.An entity applies those amendments for annual reporting periods beginning on or after 1 January 2019, with early applicationpermitted. Since the Group’s current practice is in line with these amendments, the improvement did not have any effect onits consolidated financial statements.
Standards issued but not yet effective
The Standards and Interpretations that are issued, but not yet effective, up to the date of issuance of the Group’s consolidatedfinancial statements are disclosed below. The Group intends to adopt these standards, if applicable, when they becomeeffective.
• Amendments to IFRS 10 and IAS 28 Sale or Contribution of Assets between an Investor and itsAssociate or Joint Venture 3
• IFRS 17 Insurance Contracts 2
• Amendments to IAS 1 and IAS 8 Definition of Material 1
• Amendments to IFRS 9, IAS 39 and IFRS 7 Interest Rate Benchmark Reform 1
• Amendments to References to theConceptual Framework in IFRS Standards
Conceptual Framework 1
• Amendments to IFRS 3 Definition of a Business 1
1 Effective for annual periods beginning on or after 1 January 20202 Effective for annual periods beginning on or after 1 January 20213 The effective date of this amendment is indefinitely postponed by IASB, but an entity that early adopts the amendments
must apply them prospectively.

MIK HOLDING JSC AND ITS SUBSIDIARIES
Notes to the Consolidated Financial Statements – 31 December 2019
17
2. Significant accounting policies (cont’d.)
2.3. Summary of significant accounting policies
Recognition of income and expense
i) The effective interest rate method
Under IFRS 9, interest income and interest expense are recorded using the effective interest rate (“EIR”) method for allfinancial instruments measured at amortised cost, financial instruments designated at FVPL. Interest income on interestbearing financial assets measured fair value through other comprehensive income (“FVOCI”) under IFRS 9 is also recordedusing the EIR method. The EIR is the rate that exactly discounts estimated future cash payments or receipts through theexpected life of the financial instrument or, when appropriate, a shorter period, to the gross carrying amount of the financialasset or liability.
The EIR (and therefore, the amortised cost of the asset) is calculated by taking into account any discount or premium onacquisition, fees and costs that are an integral part of the EIR. The Group recognises interest income and interest expenseusing a rate of return that represents the best estimate of a constant rate of return over the expected life of the loan. Hence, itrecognises the effect of potentially different interest rates charged at various stages, and other characteristics of the productlife cycle (including prepayments, penalty interest and charges).
If expectations regarding the cash flows on the financial instruments are revised for reasons other than credit risk, theadjustment is booked as a positive or negative adjustment to the carrying amount of the instrument in the statement offinancial position with an increase or reduction in interest income and interest expense. The adjustment is subsequentlyamortised through Interest income or interest expense in the statement of profit or loss.
ii) Interest income and interest expense
The Group calculates interest income or interest expense by applying the EIR to the gross carrying amount of financialinstruments other than credit-impaired instruments.
When a financial asset becomes credit-impaired and is, therefore, regarded as ‘Stage 3’, the Group calculates interest incomeby applying the effective interest rate to the net amortised cost of the financial asset. If the financial assets cures and is nolonger credit-impaired, the group reverts to calculating interest income on a gross basis.
Interest income on all trading assets and financial assets mandatorily required to be measured at FVPL is recognised usingthe contractual interest rate in total operating income and net gains/(losses) on financial assets at fair value through profit orloss, respectively.
iii) Fee and commission expense
Fee expense represents administration and fixed fee commission paid to the commercial banks. Fee expense is recognisedwhen actual service has been provided.Components of fees that are linked to a certain performance are recognised after fulfilling the corresponding criteria.
Financial instruments – initial recognition and subsequent measurement
A financial instrument is any contract that gives rise to a financial asset of one entity and a financial liability or equityinstrument of another entity.
i) Financial assets
Initial recognition and measurement
The Group’s financial assets are classified, at initial recognition, as subsequently measured at amortised cost, FVOCI andFVPL.
The classification of financial assets at initial recognition depends on the financial asset’s contractual cash flowcharacteristics and the Group’s business model for managing them. With the exception of trade receivables that do not containa significant financing component or for which the Group has applied the practical expedient, the Group initially measures afinancial asset at its fair value plus, in the case of a financial asset not at fair value through profit or loss, transaction costs.
In order for a financial asset to be classified and measured at amortised cost or FVOCI, it needs to give rise to cash flowsthat are ‘solely payments of principal and interest (“SPPI”)’ on the principal amount outstanding. This assessment is referredto as the SPPI test and is performed at an instrument level.

MIK HOLDING JSC AND ITS SUBSIDIARIES
Notes to the Consolidated Financial Statements – 31 December 2019
18
2. Significant accounting policies (cont’d.)
2.3. Summary of significant accounting policies (cont’d.)
Financial instruments – initial recognition and subsequent measurement (cont’d.)
i) Financial assets (cont’d.)
Initial recognition and measurement (cont’d.)
The Group’s business model for managing financial assets refers to how it manages its financial assets in order to generatecash flows. The business model determines whether cash flows will result from collecting contractual cash flows, selling thefinancial assets, or both. Purchases or sales of financial assets that require delivery of assets within a time frame establishedby regulation or convention in the market place (regular way trades) are recognised on the trade date, i.e., the date that theGroup commits to purchase or sell the asset.
Business model assessment
The Group determines its business model at the level that best reflects how it manages groups of financial assets to achieveits business objective.
The Group's business model is not assessed on an instrument-by-instrument basis, but at a higher level of aggregatedportfolios and is based on observable factors such as:
· How the performance of the business model and the financial assets held within that business model are evaluated andreported to the entity's key management personnel
· The risks that affect the performance of the business model (and the financial assets held within that business model)and, in particular, the way those risks are managed
· How managers of the business are compensated (for example, whether the compensation is based on the fair value ofthe assets managed or on the contractual cash flows collected)
· The expected frequency, value and timing of sales are also important aspects of the Group’s assessment
The business model assessment is based on reasonably expected scenarios without taking 'worst case' or 'stress case’ scenariosinto account. If cash flows after initial recognition are realised in a way that is different from the Group's original expectations,the Group does not change the classification of the remaining financial assets held in that business model, but incorporatessuch information when assessing newly originated or newly purchased financial assets going forward.
The SPPI test
As a second step of its classification process the Group assesses the contractual terms of financial to identify whether theymeet the SPPI test.
‘Principal’ for the purpose of this test is defined as the fair value of the financial asset at initial recognition and may changeover the life of the financial asset (for example, if there are repayments of principal or amortisation of the premium/discount).
The most significant elements of interest within a lending arrangement are typically the consideration for the time value ofmoney and credit risk. To make the SPPI assessment, the Group applies judgment and considers relevant factors such as theperiod for which the interest rate is set.
In contrast, contractual terms that introduce a more than de minimis exposure to risks or volatility in the contractual cashflows that are unrelated to a basic lending arrangement do not give rise to contractual cash flows that are solely payments ofprincipal and interest on the amount outstanding. In such cases, the financial asset is required to be measured at FVPL.

MIK HOLDING JSC AND ITS SUBSIDIARIES
Notes to the Consolidated Financial Statements – 31 December 2019
19
2. Significant accounting policies (cont’d.)
2.3. Summary of significant accounting policies (cont’d.)
Financial instruments – initial recognition and subsequent measurement (cont’d.)
i) Financial assets (cont’d.)
Debt instruments at amortised cost
This category is the most relevant to the Group. The Group measures financial assets at amortised cost if both of the followingconditions are met:
· The financial asset is held within a business model with the objective to hold financial assets in order to collectcontractual cash flows; and
· The contractual terms of the financial asset give rise on specified dates to cash flows that are solely payments of principaland interest on the principal amount outstanding
Financial assets are assessed in their substance over their legal form.
Financial assets at amortised cost are subsequently measured using the EIR method and are subject to impairment. Gains andlosses are recognised in profit or loss when the asset is derecognised, modified or impaired.
The Group’s financial assets at amortised cost includes mortgage pool receivables with and without recourse, loan receivables,treasury assets and cash and bank balances.
Debt instruments at FVOCI
The Group measures debt instruments at FVOCI if both of the following conditions are met:
· The financial asset is held within a business model with the objective of both holding to collect contractual cash flowsand selling; and
· The contractual terms of the financial asset give rise on specified dates to cash flows that are solely payments of principaland interest on the principal amount outstanding
For debt instruments at FVOCI, interest income, foreign exchange revaluation and impairment losses or reversals arerecognised in the statement of profit or loss and computed in the same manner as for financial assets measured at amortisedcost. The remaining fair value changes are recognised in OCI. Upon derecognition, the cumulative fair value changerecognised in OCI is recycled to profit or loss.
The Group doesn’t have any debt instruments at FVOCI as of 31 December 2019.
Equity instruments at FVOCI
Upon initial recognition, the Group can elect to classify irrevocably its equity investments as equity instruments designatedat FVOCI when they meet the definition of equity under IAS 32 Financial Instruments: Presentation and are not held fortrading. The classification is determined on an instrument-by-instrument basis.
Gains and losses on these financial assets are never recycled to profit or loss. Dividends are recognised as other income inthe statement of profit or loss when the right of payment has been established, except when the Group benefits from suchproceeds as a recovery of part of the cost of the financial asset, in which case, such gains are recorded in OCI. Equityinstruments designated at FVOCI are not subject to impairment assessment.
The Group doesn’t have any equity instruments at FVOCI as of 31 December 2019.
Financial assets at FVPL
Financial assets at FVPL include financial assets held for trading, financial assets designated upon initial recognition at fairvalue through profit or loss, or financial assets mandatorily required to be measured at fair value. Financial assets areclassified as held for trading if they are acquired for the purpose of selling or repurchasing in the near term. Derivatives,including separated embedded derivatives, are also classified as held for trading unless they are designated as effectivehedging instruments. Financial assets with cash flows that are not solely payments of principal and interest are classified andmeasured at FVPL, irrespective of the business model. Notwithstanding the criteria for debt instruments to be classified atamortised cost or at FVOCI, as described above, debt instruments may be designated at FVPL on initial recognition if doingso eliminates, or significantly reduces, an accounting mismatch.

MIK HOLDING JSC AND ITS SUBSIDIARIES
Notes to the Consolidated Financial Statements – 31 December 2019
20
2. Significant accounting policies (cont’d.)
2.3. Summary of significant accounting policies (cont’d.)
Financial instruments – initial recognition and subsequent measurement (cont’d.)
i) Financial assets (cont’d.)
Financial assets at FVPL (cont’d.)
Financial assets at FVPL are carried in the statement of financial position at fair value with net changes in fair valuerecognised in the statement of profit or loss.
Included in this category is an investment in an investment fund, which the Group had irrevocably elected not to classify atFVOCI. Dividends on the investments are also recognised as other income in the statement of profit or loss when the rightof payment has been established.
Financial assets at FVPL also include a derivative relating to a cross-currency swap transaction entered into by the Groupwith a commercial bank during the year ended 31 December 2019.
A derivative is a financial instrument or other contract with all three of the following characteristics:
· Its value changes in response to the change in a specified interest rate, financial instrument price, commodity price,foreign exchange rate, index of prices or rates, credit rating or credit index, or other variable, provided that, in the caseof a non-financial variable, it is not specific to a party to the contract (i.e., the 'underlying').
· It requires no initial net investment or an initial net investment that is smaller than would be required for other types ofcontracts expected to have a similar response to changes in market factors.
· It is settled at a future date.
The derivative is recorded at fair value and carried as assets when its fair value is positive and as liabilities when its fair valueis negative.
The Group’s financial assets designated at FVPL are explained in Notes 15 and 16.
Hedge accounting
A hedging relationship qualifies for hedge accounting under IFRS 9 only if all of the following criteria are met:
1. The hedging relationship consists only of eligible hedging instruments and eligible hedged items.2. At the inception of the hedge there is formal designation and documentation both of the hedging relationship and the
entity’s risk management objective and strategy for undertaking the hedge;3. The hedging relationship meets all of the following hedge effectiveness requirements:
i. there is an economic relationship between the hedged item and the hedging instrument;ii. the effect of credit risk does not dominate the value changes that result from that economic relationship;iii. the hedge ratio of the hedging relationship is the same as that resulting from the quantity of the hedged item that
the entity actually hedges and the quantity of the hedging instrument that the entity actually uses to hedge thatquantity of hedged item. However, that designation shall not reflect an imbalance between the weightings of thehedged item and the hedging instrument that would create hedge ineffectiveness (irrespective of whetherrecognized or not) that could result in an accounting outcome that would be inconsistent with the purpose of hedgeaccounting.
Cash flow hedge
A cash flow hedge is a hedge of the exposure to variability in cash flows that is attributable to a particular risk associatedwith a recognised asset or liability (such as future payments of borrowings denominated in foreign currencies) or a highlyprobable forecast transaction and could affect profit or loss
For designated and qualifying cash flow hedges, the effective portion of the cumulative gain or loss on the hedging instrumentis initially recognised directly in OCI within equity (cash flow hedge reserve). The ineffective portion of the gain or loss onthe hedging instrument is recognised immediately in losses from financial derivatives in profit or loss. When a hedginginstrument expires, is sold, terminated, exercised, or when a hedge no longer meets the criteria for hedge accounting, anycumulative gain or loss that has been recognised in OCI at that time remains in OCI and is recognised when the hedgedforecast transaction is ultimately recognised in profit or loss. When a forecast transaction is no longer expected to occur, thecumulative gain or loss that was reported in OCI is immediately transferred to profit or loss.
The Group chose not to apply hedge accounting on the cross-currency swap. Therefore, changes in the fair value of thederivative are recognised in losses from financial derivatives in profit or loss.
MIK HOLDING JSC AND ITS SUBSIDIARIES
Notes to the Consolidated Financial Statements – 31 December 2019
21
2. Significant accounting policies (cont’d.)
2.3. Summary of significant accounting policies (cont’d.)
Financial instruments – initial recognition and subsequent measurement (cont’d.)
i) Financial assets (cont’d.)
Derecognition
A financial asset (or, where applicable a part of a financial asset or part of a group of similar financial assets) is derecognisedwhen:
· The rights to receive cash flows from the asset have expired.· The Group has transferred its rights to receive cash flows from the asset or has assumed an obligation to pay the received
cash flows in full without material delay to a third party under a 'pass–through' arrangement; and either:· the Group has transferred substantially all the risks and rewards of the asset, or· the Group has neither transferred nor retained substantially all the risks and rewards of the asset but has transferred
control of the asset.
When the Group has transferred its rights to receive cash flows from an asset or has entered into a pass-through arrangementand has neither transferred nor retained substantially all the risks and rewards of the asset nor transferred control of the asset,the asset is recognised to the extent of the Group’s continuing involvement in the asset. In that case, the Group also recognisesan associated liability. The transferred asset and the associated liability are measured on a basis that reflects the rights andobligations that the Group has retained. Continuing involvement that takes the form of a guarantee over the transferred assetis measured at the lower of the original carrying amount of the asset and the maximum amount of consideration that theGroup could be required to repay.
Impairment of financial assets
The Group records the allowance for expected credit losses for all financial assets not held at FVPL.
Overview of ECL method. The ECL allowance is based on the credit losses expected to arise over the life of the asset (thelifetime expected credit loss or LTECL), unless there has been no significant increase in credit risk since origination, in whichcase, the allowance is based on the 12 months’ expected credit loss (12mECL). The 12mECL is the portion of LTECLs thatrepresent the ECLs that result from default events on a financial instrument that are possible within the 12 months after thereporting date. Whether a financial instrument’s credit risk has increased significantly since initial recognition is determinedby considering the change in the risk of default occurring over the remaining life of the financial instrument. Based on that,the financial assets are grouped into Stage 1, Stage 2 and Stage 3, as described below:
• Stage 1: When financial assets are first recognised, an allowance is based on 12mECLs. Stage 1 financial assets alsoinclude facilities where the credit risk has improved, and the financial assets has been reclassified from Stage 2.
• Stage 2: When a financial asset has shown a significant increase in credit risk since origination, an allowance is basedon the LTECLs. Stage 2 financial assets also include facilities, where the credit risk has improved, and the financialassets has been reclassified from Stage 3.
• Stage 3: Financial assets considered credit-impaired. An allowance is based on the LTECLs.
The Calculation of ECLs. The Group calculates ECLs based on three probability-weighted scenarios to measure the expectedcash shortfalls. A cash shortfall is the difference between the cash flows that are due to an entity in accordance with thecontract and the cash flows that the entity expects to receive. The mechanics of the ECL calculations are outlined below andthe key elements are, as follows:
• PD: The Probability of Default is an estimate of the likelihood of default over a given time horizon. A default may onlyhappen at a certain time over the assessed period, if the facility has not been previously derecognised and is still in theportfolio.
• EAD: The Exposure at Default is an estimate of the exposure at a future default date, taking into account expectedchanges in the exposure after the reporting date, including repayments of principal and interest, whether scheduled bycontract or otherwise, expected drawdowns on committed facilities, and accrued interest from missed payments.
• LGD: The Loss Given Default is an estimate of the loss arising in the case where a default occurs at a given time. It isbased on the difference between the contractual cash flows due and those that the Group would expect to receive. It isusually expressed as a percentage of the EAD.
When estimating the ECLs, the Group considers three scenarios (a base case, a best case, and a worst case).
Impairment losses and releases are accounted for and disclosed separately from modification losses or gains that areaccounted for as an adjustment of the financial asset’s gross carrying value.

MIK HOLDING JSC AND ITS SUBSIDIARIES
Notes to the Consolidated Financial Statements – 31 December 2019
22
2. Significant accounting policies (cont’d.)
2.3. Summary of significant accounting policies (cont’d.)
Financial instruments – initial recognition and subsequent measurement (cont’d.)
i) Financial assets (cont’d.)
Impairment of financial assets (cont’d.)
The mechanics of the ECL method are summarised below:
Stage 1: The 12mECL is calculated as the portion of LTECLs that represent the ECLs that result from default events ona financial instrument that are possible within the 12 months after the reporting date. The Group calculates the12mECL allowance based on the expectation of a default occurring in the 12 months following the reportingdate. These expected 12-month default probabilities are applied to a forecast EAD and multiplied by the expectedLGD and discounted by an approximation to the original EIR. This calculation is made for each of the threescenarios, as explained above.
Stage 2: When a loan has shown a significant increase in credit risk since origination, the Group records an allowance forthe LTECLs. The mechanics are similar to those explained above, including the use of multiple scenarios, butPDs and LGDs are estimated over the lifetime of the instrument. The expected cash shortfalls are discounted byan approximation to the original EIR.
Stage 3: For loans considered credit-impaired, the Group recognises the lifetime expected credit losses for these loans.The method is similar to that for Stage 2 assets, with the PD set at 100%.
Forward-looking information. In its ECL models, the Group relies on a broad range of forward-looking information aseconomic inputs, such as:
• Percent change of Dollar index• Percent change of G7 GDP rate• Percent change in Consumer Price Index• Percent change in Unemployment rate
Write-offs. Uncollectible assets are written off against the related impairment loss provision after all the necessary proceduresto recover the asset have been completed and the amount of the loss has been determined. Subsequent recoveries of amountspreviously written off are credited to impairment loss account in profit or loss for the period.
ii) Financial liabilities
Initial recognition and measurement
Financial liabilities are classified, at initial recognition, as financial liabilities at fair value through profit or loss, debt issuedand other borrowed funds, payables, or as derivatives designated as hedging instruments in an effective hedge, as appropriate.
All financial liabilities are recognised initially at fair value and in the case of debt issued and other borrowed funds andpayables, net of directly attributable transaction costs.
The Group’s financial liabilities include debt issued, collateralised bonds and other borrowed funds
Subsequent measurement
Debt issued, collateralised bonds and other borrowed funds
This is the category most relevant to the Group. After recognition, debt issued, collateralised bonds and other borrowed fundsare subsequently measured at amortised cost using the EIR method. Gains and losses are recognised in profit or loss whenliabilities are derecognised as well as through the EIR amortisation process.
Amortised cost is calculated by taking into account at discount or premium on acquisition and fees or costs that are an integralpart of the EIR. The EIR amortisation is included as “interest expense” in the statement of profit or loss. This categorygenerally applies to interest-bearing debt, collateralised bonds and other borrowed funds. For more information, refer toNotes 21, 22 and 23.
Derecognition
A financial liability is derecognised when the obligation under the liability is discharged or cancelled or expires. Where anexisting financial liability is replaced by another from the same lender on substantially different terms, or the terms of anexisting liability are substantially modified, such an exchange or modification is treated as a derecognition of the originalliability and the recognition of a new liability. The difference between the carrying value of the original financial liabilityand the consideration paid is recognised in consolidated statement of profit or loss.
MIK HOLDING JSC AND ITS SUBSIDIARIES
Notes to the Consolidated Financial Statements – 31 December 2019
23
2. Significant accounting policies (cont’d.)
2.3. Summary of significant accounting policies (cont’d.)
Determination of fair value
Fair value is the price that would be received to sell an asset or paid to transfer a liability in an orderly transaction between marketparticipants at the measurement date. The fair value measurement is based on the presumption that the transaction to sell the assetor transfer the liability takes place either:
· In the principal market for the asset or liability, or· In the absence of a principal market, in the most advantageous market for the asset or liability
The principal or the most advantageous market must be accessible to by the Group.
The fair value of an asset or a liability is measured using the assumptions that market participants would use when pricing theasset or liability, assuming that market participants act in their economic best interest.
A fair value measurement of a non-financial asset takes into account a market participant's ability to generate economic benefitsby using the asset in its highest and best use or by selling it to another market participant that would use the asset in its highestand best use.
The Group uses valuation techniques that are appropriate in the circumstances and for which sufficient data are available tomeasure fair value, maximising the use of relevant observable inputs and minimising the use of unobservable inputs.
All assets and liabilities for which fair value is measured or disclosed in the consolidated financial statements are categorisedwithin the fair value hierarchy, described as follows, based on the lowest level input that is significant to the fair valuemeasurement as a whole:
Level 1 - Quoted (unadjusted) market prices in active markets for identical assets or liabilitiesLevel 2 - Valuation techniques for which the lowest level input that is significant to the fair value measurement is directly or
indirectly observableLevel 3 - Valuation techniques for which the lowest level input that is significant to the fair value measurement is unobservable
For assets and liabilities that are recognised in the consolidated financial statements on a recurring basis, the Group determineswhether transfers have occurred between Levels in the hierarchy by re-assessing categorisation (based on the lowest level inputthat is significant to the fair value measurement as a whole) at the end of each reporting period.
An analysis of fair values of financial instruments and further details as how they are measured are provided in Note 29.
Collateral repossessed
Repossessed assets are initially recognised at the lower of their fair values less costs to sell and the amortised cost of therelated outstanding loans on the date of the repossession, and the related loans and advances together with the relatedimpairment allowances are derecognised from the statement of financial position. Subsequently, repossessed assets aremeasured at the lower of cost and fair value less costs to sell and are included in ‘Other assets’.
Cash and bank balancesCash and bank balances in the statement of financial position comprise cash at banks and on hand and short-term depositswith a maturity of three months or less, which are subject to an insignificant risk of changes in value.
For the purpose of the statement of cash flows, cash and cash equivalents comprises cash on hand, non-restricted currentaccounts with banks and amounts due from banks or with an original maturity of three months or less.
Property and equipment
All items of property and equipment are initially recorded at cost. Subsequent costs are included in the asset's carryingamount or recognised as a separate asset, as appropriate, only when it is probable that future economic benefits associatedwith the item will flow to the Group and the cost of the item can be measured reliably. The carrying amount of any replacedpart is derecognised. All other repairs and maintenance are charged to profit or loss during the financial period in which theyare incurred.
Subsequent to recognition, property and equipment are stated at cost less accumulated depreciation and any accumulatedimpairment losses.

MIK HOLDING JSC AND ITS SUBSIDIARIES
Notes to the Consolidated Financial Statements – 31 December 2019
24
2. Significant accounting policies (cont’d.)
2.3. Summary of significant accounting policies (cont’d.)
Property and equipment (cont’d.)
Depreciation of other property and equipment is provided for on a straight-line basis to write off the cost of each asset to itsresidual value over the estimated useful life at the following annual rates:
Premises 40 yearsFurniture and office equipment 10 yearsComputers 3 yearsVehicles 10 years
The residual values, useful life and depreciation method are reviewed at each financial year-end to ensure that the amount,method and period of depreciation are consistent with previous estimates and the expected pattern of consumption of thefuture economic benefits embodied in the items of property and equipment.
An item of property and equipment is derecognised upon disposal or when no future economic benefits are expected fromits use or disposal. The difference between the net disposal proceeds, if any and the net carrying amount is recognised inprofit or loss.
Intangible assets
The Group's intangible assets include the value of computer software.
An intangible asset is recognised only when its cost can be measured reliably and it is probable that the expected futureeconomic benefits that are attributable to it will flow to the Group. Intangible assets acquired separately are measured oninitial recognition at cost. Following initial recognition, intangible assets are carried at cost less any accumulated amortisationand any accumulated impairment losses.
The useful lives of intangible assets are assessed to be either finite or indefinite. Intangible assets with finite lives areamortised over the useful economic life. The amortisation period and the amortisation method for an intangible asset with afinite useful life are reviewed at least at each financial year–end. Changes in the expected useful life or the expected patternof consumption of future economic benefits embodied in the asset are accounted for by changing the amortisation period ormethod, as appropriate, and treated as changes in accounting estimates.
The amortisation expense on intangible assets with finite lives is recognised in profit or loss in the expense category consistentwith the function of the intangible asset. Amortisation is calculated using the straight–line method to write down the cost ofintangible assets to their residual values over their estimated useful live of three years.
Impairment of non–financial assets
The Group assesses at each reporting date whether there is an indication that an asset may be impaired. If any indicationexists, or when annual impairment testing for an asset is required, the Group estimates the asset's recoverable amount. Anasset's recoverable amount is the higher of an asset's or cash–generating unit's (CGU) fair value less costs to sell and its valuein use. Where the carrying amount of an asset or CGU exceeds its recoverable amount, the asset is considered impaired andis written down to its recoverable amount. In assessing value in use, the estimated future cash flows are discounted to theirpresent value using a pre–tax discount rate that reflects current market assessments of the time value of money and the risksspecific to the asset. In determining fair value less costs to sell, an appropriate valuation model is used. These calculationsare corroborated by valuation multiples, quoted share prices for publicly traded subsidiaries or other available fair valueindicators.
For assets excluding goodwill, an assessment is made at each reporting date as to whether there is any indication thatpreviously recognised impairment losses may no longer exist or may have decreased. If such indication exists, the Groupestimates the asset's or CGU's recoverable amount. A previously recognised impairment loss is reversed only if there hasbeen a change in the assumptions used to determine the asset's recoverable amount since the last impairment loss wasrecognised. The reversal is limited so that the carrying amount of the asset does not exceed its recoverable amount, norexceeds the carrying amount that would have been determined, net of depreciation, had no impairment loss been recognisedfor the asset in prior years. Such reversal is recognised in the statement of profit or loss and other comprehensive income.

MIK HOLDING JSC AND ITS SUBSIDIARIES
Notes to the Consolidated Financial Statements – 31 December 2019
25
2. Significant accounting policies (cont’d.)
2.3. Summary of significant accounting policies (cont’d.)
Employee benefits(i) Short term benefitsWages, salaries and other salary related expenses are recognised as an expense in the year in which the associated servicesare rendered by employees of the Group. Short-term accumulating compensated absences, such as paid annual leave, arerecognised when services are rendered by employees that increase their entitlement to future compensated absences, andshort term non-accumulating compensated absences such as sick leave are recognised when absences occur.(ii) Defined contribution plansAs required by law, companies in Mongolia make contributions to the government pension scheme, social and health fund.Such contributions are recognised as an expense in profit or loss as incurred.ProvisionsProvisions are recognised when the Group has a present obligation (legal or constructive) as a result of a past event, and it isprobable that an outflow of resources embodying economic benefits will be required to settle the obligation and a reliableestimate can be made of the amount of the obligation. The expense relating to any provision is presented in profit or loss netof any reimbursement.Taxes(i) Current taxCurrent tax assets and liabilities for the current and prior years are measured at the amount expected to be recovered from orpaid to the taxation authorities. The tax rates and tax laws used to compute the amount are those that are enacted orsubstantively enacted by the statement of financial position date.(ii) Deferred taxDeferred tax is provided on temporary differences at the statement of financial position date between the tax bases of assetsand liabilities and their carrying amounts for financial reporting purposes. Deferred tax liabilities are recognised for alltaxable temporary differences, except for:
· Where the deferred tax liability arises from the initial recognition of goodwill or of an asset or liability in a transactionthat is not a business combination and, at the time of the transaction, affects neither the accounting profit nor taxableprofit or loss.
Deferred tax assets are recognised for all deductible temporary differences, carry forward of unused tax credits and unusedtax losses, to the extent that it is probable that taxable profit will be available against which the deductible temporarydifferences, and the carry forward of unused tax credits and unused tax losses can be utilised except:
· Where the deferred tax asset relating to the deductible temporary difference arises from the initial recognition of an assetor liability in a transaction that is not a business combination and, at the time of the transaction, affects neither theaccounting profit nor taxable profit or loss.
· In respect of deductible temporary differences associated with investments in subsidiaries, deferred tax assets arerecognised only to the extent that it is probable that the temporary differences will reverse in the foreseeable future andtaxable profit will be available against which the temporary differences can be utilised.
The carrying amount of deferred tax assets is reviewed at each statement of financial position date and reduced to the extentthat it is no longer probable that sufficient taxable profit will be available to allow all or part of the deferred tax asset to beutilised. Unrecognised deferred tax assets are reassessed at each statement of financial position date and are recognised tothe extent that it has become probable that future taxable profit will allow the deferred tax asset to be recovered.Deferred tax assets and liabilities are measured at the tax rates that are expected to apply in the year when the asset is realisedor the liability is settled, based on tax rates (and tax laws) that have been enacted or substantively enacted at the statement offinancial position date.
Deferred tax relating to items recognised outside profit or loss is recognised outside profit or loss. Deferred tax items arerecognised in correlation to the underlying transaction either in other comprehensive income or directly in equity.
Deferred tax assets and deferred tax liabilities are offset if a legally enforceable right exists to set off current tax assets againstcurrent tax liabilities and the deferred taxes relate to the same taxable entity and the same taxation authority.

MIK HOLDING JSC AND ITS SUBSIDIARIES
Notes to the Consolidated Financial Statements – 31 December 2019
26
2. Significant accounting policies (cont’d.)
2.3. Summary of significant accounting policies (cont’d.)
Equity
(i) Share capital and share premium
Ordinary shares are classified as equity. Incremental costs directly attributable to the issue of new shares are shown in equityas a deduction, net of tax, from the proceeds. When shares are sold at a premium, the excess over par value is credited to theshare premium.
(ii) Treasury shares
Own equity instruments that are reacquired (treasury shares) are recognised at cost and deducted from equity. No gain or lossis recognised in profit or loss on the purchase, sale, issue or cancellation of the Group’s own equity instruments. Anydifference between the carrying amount and the consideration, if reissued, is recognised in the share premium.
(iii) Retained earnings
Retained earnings represent accumulated profits or losses, reduced by dividend declarations. The retained earnings may alsoinclude prior period adjustments and effects of changes in accounting policies.
Retained earnings of the SPCs that have issued RMBSs are restricted from distribution until their liquidation in accordancewith their Articles of Charter and FRC regulation.
Earnings per share
Basic earnings per share is calculated by dividing the net profit for the year attributable to ordinary equity holders of theParent by the weighted average number of ordinary shares outstanding during the year.
Diluted earnings per share is calculated by dividing the net profit for the year attributable to ordinary equity holders of theParent (after adjusting for interest on the convertible preference shares and interest on the convertible bond, in each case netof tax, if any) by the weighted average number of ordinary shares outstanding during the year plus the weighted averagenumber of ordinary shares that would be issued on the conversion of all the dilutive potential ordinary shares into ordinaryshares.
Segment information
The Group is engaged in purchasing of mortgage pools and issuing RMBS securitised by those mortgage pools in Mongolia.Accordingly, the Group considers that it only has a single reportable segment from both business and geographic perspectivesand therefore only provides relevant entity-wide information.
Transactions with related parties
A related party is a person or entity that is related to the Group:
A person or a close member of that person’s family is related to a Group if that person:· has control or joint control of the Group;· has significant influence over the Group; or· is a member of the key management personnel of the Group or of a parent of the Group.
An entity is related to a Group if any of the following conditions applies:
· The entity and the Group are members of the same group (which means that each parent, subsidiary and fellow subsidiaryis related to the others).
· One entity is an associate or joint venture of the other entity (or an associate or joint venture of a member of a group ofwhich the other entity is a member).
· Both entities are joint ventures of the same third party.· One entity is a joint venture of a third entity and the other entity is an associate of the third entity.· The entity is a post-employment benefit plan for the benefit of employees of either the Group or an entity related to the
Group. If the Group is itself such a plan, the sponsoring employers are also related to the Group.· The entity is controlled or jointly controlled by a person.· A person who has control or joint control of the Group has significant influence over the entity or is a member of the key
management personnel of the entity (or of a parent of the entity).· The entity, or any member of a group of which it is a part, provides key management personnel services to the Group or
to the parent of the Group.
All material transactions and balances with the related parties are disclosed in the relevant notes to consolidated financialstatements and the detail is presented in Note 27.
MIK HOLDING JSC AND ITS SUBSIDIARIES
Notes to the Consolidated Financial Statements – 31 December 2019
27
2. Significant accounting policies (cont’d.)
2.3. Summary of significant accounting policies (cont’d.)
Foreign currency translation
The consolidated financial statements are presented in Mongolian Togrog (“MNT”), which is also the Company and thesubsidiaries’ functional currency. Monetary assets and liabilities denominated in foreign currencies are retranslated at thefunctional currency rate of exchange at the statement of financial position date. All differences arising from settlement ortranslation of monetary items are taken to the consolidated profit or loss. Non–monetary items that are measured in terms ofhistorical cost in a foreign currency are translated using the exchange rates as at the dates of the initial transactions. Non–monetaryitems measured at fair value in a foreign currency are translated using the exchange rates at the date when the fair value wasdetermined. The gain or loss arising on translation of non-monetary items measured at fair value is treated in line with therecognition of gain or loss on change in fair value of the item.
2.4. Significant accounting judgments, estimates and assumptions
In the process of applying the Group's accounting policies, management has exercised judgment and estimates in determining theamounts recognised in the consolidated financial statements. The most significant uses of judgment and estimates are as follows:
Impairment losses on financial assets
The measurement of impairment losses across all categories of financial assets requires judgment, in particular, the estimationof the amount and timing of future cash flows and collateral values when determining impairment losses and the assessmentof a significant increase in credit risk. These estimates are driven by a number of factors, changes in which can result indifferent levels of allowances.
The Group’s ECL calculations are outputs of complex models with a number of underlying assumptions regarding the choiceof variable inputs and their interdependencies. Elements of the ECL models that are considered accounting judgments andestimates include:
· The Group’s internal credit grading model, which assigns PDs to the individual grades· The Group’s criteria for assessing if there has been a significant increase in credit risk and so allowances for financial
assets should be measured on a LTECL basis and the qualitative assessment· Development of ECL models, including the various formulas and the choice of inputs· Determination of associations between macroeconomic scenarios and, economic inputs, such as consumer price index
and unemployment rate, and the effect on PDs, EADs and LGDs· Selection of forward-looking macroeconomic scenarios and their probability weightings, to derive the economic inputs
into the ECL models
The impairment loss on financial assets under IFRS 9 is recorded in the consolidated statement of profit or loss and disclosedin more detail in Notes 11.1, 12.1, 13.1 and 14.1.
Deferred tax
Deferred tax assets are recognised for all unused tax losses to the extent that it is probable that taxable profit will be availableagainst which the losses can be utilised. Significant management judgment is required to determine the amount of deferredtax assets that can be recognised, based upon the likely timing and level of future taxable profits together with future taxplanning strategies.
Significant management judgment is also required to determine the amount of withholding tax liability associated with thefuture dividend distribution of the Group’s SPCs, based upon the likely timing and level of retained earnings.
Further details are given in Note 9.3 to the consolidated financial statements.
Classification of financial assets
As disclosed in Note 15, the Group has investment in Asia Diversified Real Estate Fund One Private Investment Fund(“Fund”) classified as financial assets at FVPL in accordance with IFRS 9. The Fund is a registered fund licensed by theFRC of Mongolia established in December 2018. As of 31 December 2019, the Group owns 33% of the total investmentunits of the Fund.
Significant management judgement is required in determining the classification of financial assets and Management hasassessed that it does not have either control or significant influence on the operating and financial decisions and activities ofthe Fund, as the Fund is governed by the Mongolian Law on Investment Funds which requires the Fund to be independentand not controlled/influenced by its investors. Further details are given in Note 15.

MIK HOLDING JSC AND ITS SUBSIDIARIES
Notes to the Consolidated Financial Statements – 31 December 2019
28
2. Significant accounting policies (cont’d.)
2.4. Significant accounting judgments, estimates and assumptions (cont’d.)
Valuation of derivative financial instruments
As disclosed in Note 16, the Group entered into a cross-currency swap agreement with a commercial bank in order to hedgethe risk of variability of cash flows denominated in USD from the long-term senior notes issued on the international capitalmarket in the amounts of USD 250 million and USD 50 million on 29 January 2019 and 12 February 2019, respectively (seeNote 22).
In determining the fair value of the derivative financial instruments, management applied the discounted cash flow methodin their valuation.
The Group had recorded net gains on derivative financial instruments of MNT 55,516,592 thousand for the year ended 31December 2019.
3. Interest income and segment information
During the year ended 31 December 2019 and 2018, the Group was engaged in a single business segment, which is thepurchasing of mortgage pools and issuing RMBS securitised by those mortgage pools in Mongolia. There has been no singleexternal customer that has contributed revenue exceeding 10% or more of the Group’s revenue during the year ended 31December 2019 and 2018.
2019 2018MNT'000 MNT'000
Purchased mortgage pool receivables (without recourse) 221,478,247 210,376,263Mortgage pool receivables with recourse 46,431,798 3,016,989Bank balances 45,745,722 21,830,430Debt instruments at amortised cost (Note 12) 25,571,650 2,440,521
339,227,417 237,664,203
4. Interest expense2019 2018
MNT'000 MNT'000
Collateralised bonds 150,617,896 141,159,835Debt securities issued 81,750,319 –Cross-currency swap 20,615,238 –Borrowed funds 5,627,047 2,087,559Other payables 680,761 432,073
259,291,261 143,679,467
5. Fee and commission expense2019 2018
MNT'000 MNT'000
Loan service fee 12,515,200 11,870,907Bank service charge 11,180 11,112
12,526,380 11,882,019
6. Credit loss expense/(reversal) on financial assets2019 2018
MNT'000 MNT'000
Mortgage pool receivables with recourse (Note 13.1) 6,163,618 (31,652)Debt instruments at amortised cost (Note 12.1) 3,911,122 1,431,653Cash and cash equivalents (Note 11.1) 233,186 (944,538)Purchased mortgage pool receivables (without recourse) (Note 14.1) (1,113,397) 281,681Net credit loss expense 9,194,529 737,144

MIK HOLDING JSC AND ITS SUBSIDIARIES
Notes to the Consolidated Financial Statements – 31 December 2019
29
7. Operating expenses
2019 2018MNT’000 MNT’000
Personnel expenses* 6,277,505 4,712,442Professional service fees 1,982,776 2,760,845Advertisement expense 1,441,710 1,944,894Depreciation expense (Note 18) 1,066,865 783,571Business trip expense 684,784 1,045,231Utility expense 261,887 232,798Amortisation of intangible assets (Note 19) 36,798 67,120Other operating expenses 943,010 1,123,132
12,695,335 12,670,033* Personnel expensesSalaries, wages and bonus 5,296,956 3,960,665Contribution to social and health fund 708,589 454,611Staff training 122,519 161,577Others 149,441 135,589
6,277,505 4,712,442
8. Other operating expenses2019 2018
MNT'000 MNT'000
Unrealised foreign exchange loss/(gain), net 30,489,031 (64,346)Entertainment expense 349,665 272,733Realised foreign exchange loss/(gain), net (79,422) 4,114Write-off of property and equipment (Note 18) 2,383 100Penalty expense 52 582,858Others 1,390 2,011
30,763,099 797,470
9. Income tax
9.1. Income tax expense
The components of income tax expense for the years ended 31 December 2019 and 2018 are:2019 2018
MNT'000 MNT'000Current taxCurrent income tax 6,867,630 3,344,964Deferred taxRelating to origination of temporary differences (Note 9.3) 8,961,856 7,194,767
15,829,486 10,539,731
The Group provides for income taxes on the basis of its income for financial reporting purposes, adjusted for items whichare not assessable or deductible for income tax purposes. The income tax rate for profits of the Group are 10% (2018: 10%)for the first MNT 3 billion (2018: MNT 3 billion) of taxable income, and 25% (2018: 25%) on the excess of taxable incomeover MNT 3 billion (2018: MNT 3 billion).
MIK HOLDING JSC AND ITS SUBSIDIARIES
Notes to the Consolidated Financial Statements – 31 December 2019
30
9.1. Income tax expense (cont’d.)
A reconciliation of income tax expense applicable to profit before tax at the statutory income tax rate to income tax expenseat the effective income tax rate of the Group for the years ended 31 December are as follows:
The Group has tax losses of MNT 499,580,962 thousand (2018: MNT 368,117,749 thousand) that are available to offsetagainst future taxable profits for the next two financial years. The annual amount of tax loss deductible from taxable incomeis limited to 50% of the taxable income in a given year. The Group’s tax losses are mainly arising from the SPCs.
As per Mongolian Corporate Income Taxation Law, the principal repayment of asset backed bonds issued by a licensedcompany (in the Group’s case, the collateralised bonds issued) is deductible for tax purpose. As a result, it is uncertainwhether the SPCs will generate future taxable profits.
Deferred tax assets arising from tax losses are not recognised as the Group is uncertain whether there would be sufficienttaxable profit in the next two years available against which the tax losses carried forward can be utilised.
The effective income tax rate for the Group for the year ended 31 December 2019 is 22.59% (2018: 15.47%).
9.2. Income tax payable
2019 2018MNT'000 MNT'000
At 1 January 1,195,430 3,639,426Charge for the year 6,867,630 3,344,964Income tax paid (6,603,255) (5,788,960)At 31 December 1,459,805 1,195,430
9.3. Deferred tax
2019 2018MNT'000 MNT'000
Deferred tax liabilities, netAt 1 January 20,995,169 13,800,402Recognised in statement of comprehensive income (Note 9.1)
Future dividend distribution of the SPCs 6,489,106 6,982,301Fair value change of derivative financial instruments 5,551,660 −Unrealised foreign exchange loss, net (3,048,903) −Fair value change of financial assets at FVPL (30,007) −Interest accrued on preference shares of UBC − 212,466
8,961,856 7,194,767
Deferred tax realised (212,466) −At 31 December 29,744,559 20,995,169
2019 2018MNT'000 MNT'000
Profit before tax 70,063,787 68,120,311Tax at statutory tax rate of 25% (2018: 25%) 17,515,947 17,030,078Effect of principal repayment of collateralised bonds as tax deductible (69,317,775) (62,974,175)Effect of expenses not deductible for tax purposes 2,621,647 1,157,818Effect of income subject to lower tax rate (10,872,522) (3,640,643)Deferred tax asset not recognised for tax losses 67,274,250 50,854,017Deferred tax liability recognised (Note 9.3) 6,489,106 6,982,301Adjustment in respect of current income tax of prior years (330,051) –Others 2,448,884 1,130,335Tax expense for the year 15,829,486 10,539,731

MIK HOLDING JSC AND ITS SUBSIDIARIES
Notes to the Consolidated Financial Statements – 31 December 2019
31
9.3. Deferred tax (cont’d.)
2019 2018Deferredtax asset
Deferredtax liability
Deferredtax liability
MNT'000 MNT'000 MNT'000
Future dividend distribution of the SPCs − 27,271,809 20,782,703Fair value change of derivative financial instruments − 5,551,660 −Unrealised foreign exchange loss, net 3,048,903 − −Fair value change of financial assets at FVPL 30,007 − −Interest accrued on preference shares of UBC − − 212,466
3,078,910 32,823,469 20,995,169
10. Earnings per share
The following table shows the income and share data used in the basic and diluted earnings per share calculations:2019 2018
MNT’000 MNT’000Profit for the year and total comprehensive income for the year (net of tax)
attributable to equity holder of the Parent 54,234,301 57,580,580
Weighted-average number of ordinary shares for basic and diluted earnings per share* 15,246,891 16,558,002
Earnings per shareMNT MNT
Equity holders of the Parent for the year:Basic and diluted earnings per share 3,557.07 3,477.51
* The weighted-average number of shares take into account the weighted-average effect of movement in treasury sharesduring the year.
11. Cash and bank balances
2019 2018MNT'000 MNT'000
Cash on hand 35,488 22,317
Current accounts with banks 17,546,643 49,700,285Trust accounts with banks 24,579,241 29,080,137Collection accounts with banks 973,680 6,609,371Term deposits 185,438,479 1,030,022Gross carrying amount 228,573,531 86,442,132Allowance for impairment losses (236,524) (3,338)Net carrying amount 228,337,007 86,438,794
All bank accounts are placed in commercial banks operating in Mongolia, and most of these commercial banks areshareholders of the Group. The trust accounts with banks represent current accounts where the collections made bycommercial banks on behalf of the Group on the purchased mortgage pool receivables are accumulated and are depositedinto the current accounts on monthly basis. The collection account is used for repayment of the RMBS. The carrying amountof cash and cash equivalents approximates fair value.
The Group earns interest income at a rate of 3.5% to 14.0% (2018: 5.91% to 16.8%) per annum on term deposits.

MIK HOLDING JSC AND ITS SUBSIDIARIES
Notes to the Consolidated Financial Statements – 31 December 2019
32
11. Cash and bank balances (cont’d.)
Additional cash flow information
2019 2018MNT'000 MNT'000
Cash and bank balances 228,573,531 86,442,132
Less: Placement with banks with original maturities of more than three months (7,972,669) (1,030,022)Total cash and cash equivalents for the consolidated statement of cash flow 220,600,862 85,412,110
11.1. Impairment allowance for cash and bank balances
2018 2018MNT'000 MNT'000
At 1 January 3,338 947,876Credit loss expense/(reversal) (Note 6) 233,186 (944,538)At 31 December 236,524 3,338
Details of the Group’s stage classification and methodology for calculating ECL are explained in Note 28.2.
The table below shows the credit quality and the maximum exposure to credit risk based on the Group’s internal credit ratingsystem and year-end stage classification. The amounts presented are gross of impairment allowances. Details of the Group’sinternal grading system and policies are set out in Note 28.2:
2019 2018Stage 1 Stage 1
Internal rating grade MNT’000 MNT’000PerformingB- to B+ rated 228,340,878 86,353,675C to CCC+ rated 197,165 66,140
228,538,043 86,419,815
Allowances for impairment losses for bank balances as at 31 December 2019 and 31 December 2018 are as follows:
Expected credit loss
Exposure atdefault
MNT'000
Averageforward-
looking PD
Averageforward-looking
LGD
Averageperiod (days)
ECLs as part ofbank balances
MNT'000
At 31 December 2019Stage 1 228,538,043 0.16% 63.09% 22 236,524
At 31 December 2018Stage 1 86,419,815 0.01% 63.04% 1 3,338
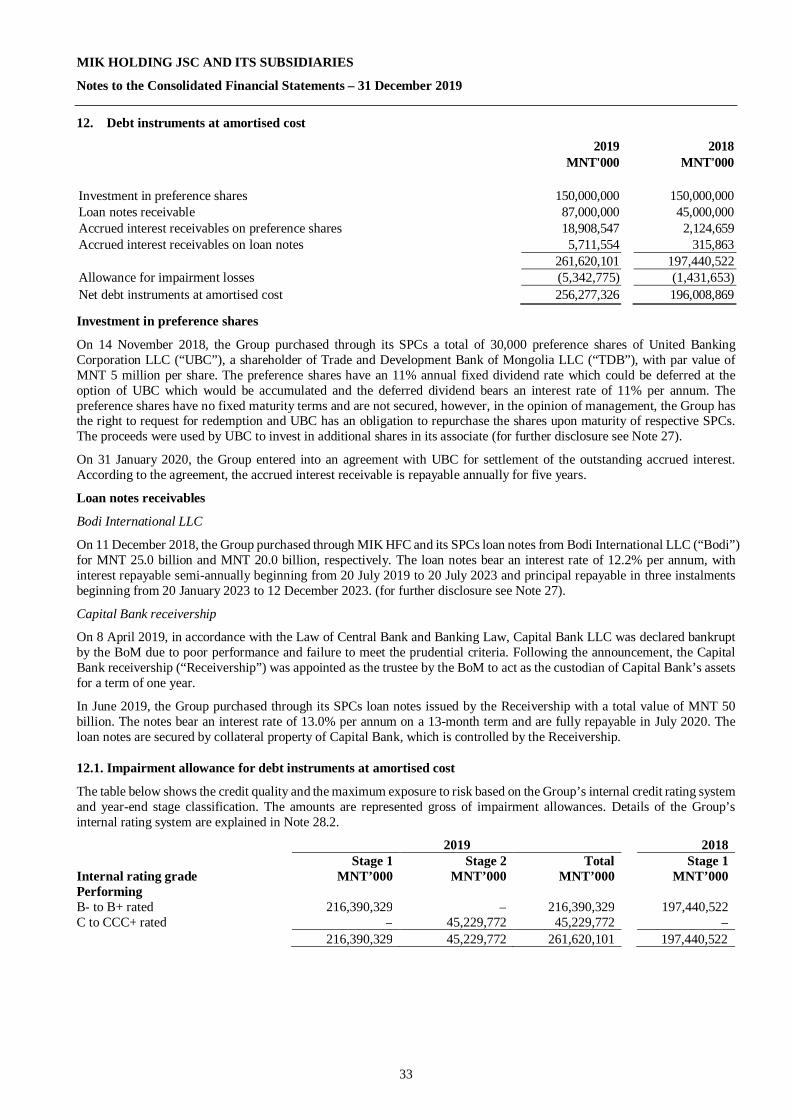
MIK HOLDING JSC AND ITS SUBSIDIARIES
Notes to the Consolidated Financial Statements – 31 December 2019
33
12. Debt instruments at amortised cost
2019 2018MNT'000 MNT'000
Investment in preference shares 150,000,000 150,000,000Loan notes receivable 87,000,000 45,000,000Accrued interest receivables on preference shares 18,908,547 2,124,659Accrued interest receivables on loan notes 5,711,554 315,863
261,620,101 197,440,522Allowance for impairment losses (5,342,775) (1,431,653)Net debt instruments at amortised cost 256,277,326 196,008,869
Investment in preference shares
On 14 November 2018, the Group purchased through its SPCs a total of 30,000 preference shares of United BankingCorporation LLC (“UBC”), a shareholder of Trade and Development Bank of Mongolia LLC (“TDB”), with par value ofMNT 5 million per share. The preference shares have an 11% annual fixed dividend rate which could be deferred at theoption of UBC which would be accumulated and the deferred dividend bears an interest rate of 11% per annum. Thepreference shares have no fixed maturity terms and are not secured, however, in the opinion of management, the Group hasthe right to request for redemption and UBC has an obligation to repurchase the shares upon maturity of respective SPCs.The proceeds were used by UBC to invest in additional shares in its associate (for further disclosure see Note 27).
On 31 January 2020, the Group entered into an agreement with UBC for settlement of the outstanding accrued interest.According to the agreement, the accrued interest receivable is repayable annually for five years.
Loan notes receivables
Bodi International LLC
On 11 December 2018, the Group purchased through MIK HFC and its SPCs loan notes from Bodi International LLC (“Bodi”)for MNT 25.0 billion and MNT 20.0 billion, respectively. The loan notes bear an interest rate of 12.2% per annum, withinterest repayable semi-annually beginning from 20 July 2019 to 20 July 2023 and principal repayable in three instalmentsbeginning from 20 January 2023 to 12 December 2023. (for further disclosure see Note 27).
Capital Bank receivership
On 8 April 2019, in accordance with the Law of Central Bank and Banking Law, Capital Bank LLC was declared bankruptby the BoM due to poor performance and failure to meet the prudential criteria. Following the announcement, the CapitalBank receivership (“Receivership”) was appointed as the trustee by the BoM to act as the custodian of Capital Bank’s assetsfor a term of one year.
In June 2019, the Group purchased through its SPCs loan notes issued by the Receivership with a total value of MNT 50billion. The notes bear an interest rate of 13.0% per annum on a 13-month term and are fully repayable in July 2020. Theloan notes are secured by collateral property of Capital Bank, which is controlled by the Receivership.
12.1. Impairment allowance for debt instruments at amortised cost
The table below shows the credit quality and the maximum exposure to risk based on the Group’s internal credit rating systemand year-end stage classification. The amounts are represented gross of impairment allowances. Details of the Group’sinternal rating system are explained in Note 28.2.
2019 2018Stage 1 Stage 2 Total Stage 1
Internal rating grade MNT’000 MNT’000 MNT’000 MNT’000PerformingB- to B+ rated 216,390,329 – 216,390,329 197,440,522C to CCC+ rated – 45,229,772 45,229,772 –
216,390,329 45,229,772 261,620,101 197,440,522
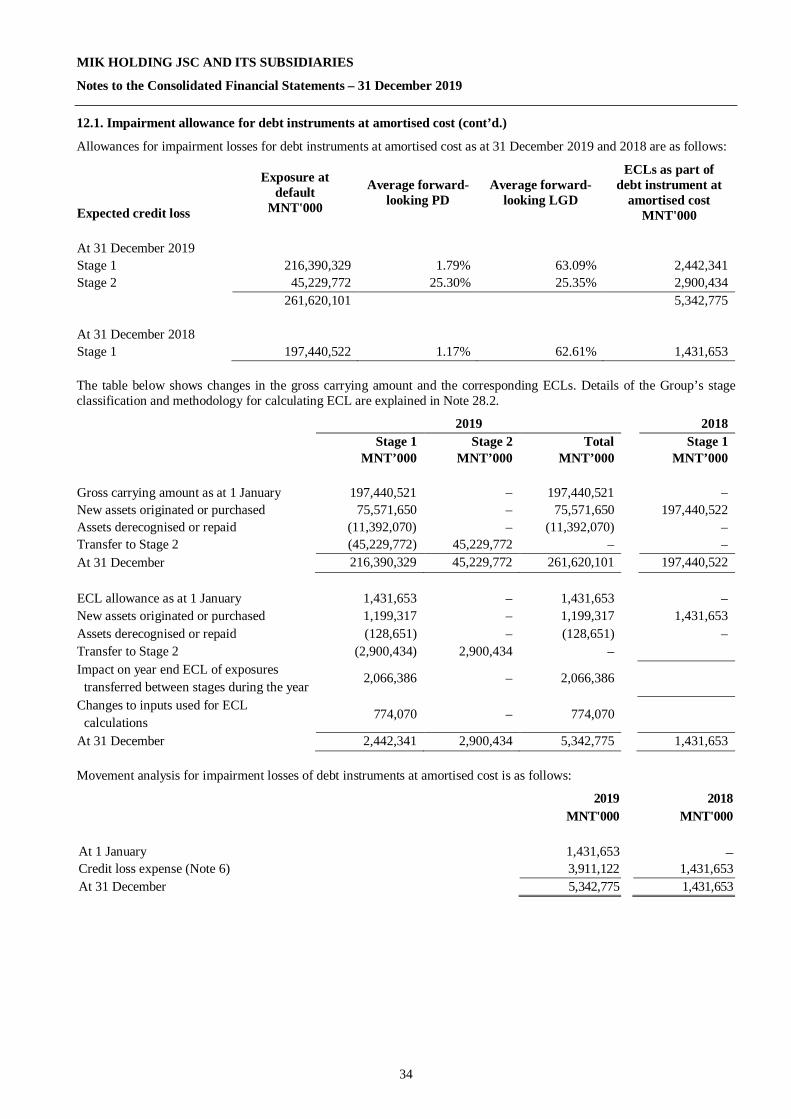
MIK HOLDING JSC AND ITS SUBSIDIARIES
Notes to the Consolidated Financial Statements – 31 December 2019
34
12.1. Impairment allowance for debt instruments at amortised cost (cont’d.)
Allowances for impairment losses for debt instruments at amortised cost as at 31 December 2019 and 2018 are as follows:
Expected credit loss
Exposure atdefault
MNT'000
Average forward-looking PD
Average forward-looking LGD
ECLs as part ofdebt instrument at
amortised costMNT'000
At 31 December 2019Stage 1 216,390,329 1.79% 63.09% 2,442,341Stage 2 45,229,772 25.30% 25.35% 2,900,434
261,620,101 5,342,775
At 31 December 2018Stage 1 197,440,522 1.17% 62.61% 1,431,653
The table below shows changes in the gross carrying amount and the corresponding ECLs. Details of the Group’s stageclassification and methodology for calculating ECL are explained in Note 28.2.
2019 2018Stage 1 Stage 2 Total Stage 1
MNT’000 MNT’000 MNT’000 MNT’000
Gross carrying amount as at 1 January 197,440,521 – 197,440,521 –New assets originated or purchased 75,571,650 – 75,571,650 197,440,522Assets derecognised or repaid (11,392,070) – (11,392,070) –Transfer to Stage 2 (45,229,772) 45,229,772 – –At 31 December 216,390,329 45,229,772 261,620,101 197,440,522
ECL allowance as at 1 January 1,431,653 – 1,431,653 –New assets originated or purchased 1,199,317 – 1,199,317 1,431,653Assets derecognised or repaid (128,651) – (128,651) –Transfer to Stage 2 (2,900,434) 2,900,434 –Impact on year end ECL of exposures
transferred between stages during the year 2,066,386 – 2,066,386
Changes to inputs used for ECLcalculations 774,070 – 774,070
At 31 December 2,442,341 2,900,434 5,342,775 1,431,653
Movement analysis for impairment losses of debt instruments at amortised cost is as follows:
2019 2018MNT'000 MNT'000
At 1 January 1,431,653 –Credit loss expense (Note 6) 3,911,122 1,431,653At 31 December 5,342,775 1,431,653

MIK HOLDING JSC AND ITS SUBSIDIARIES
Notes to the Consolidated Financial Statements – 31 December 2019
35
13. Mortgage pool receivables with recourse
The Group acquires mortgage pool receivables with recourse from commercial banks, most of whom are shareholders of theGroup. The Group has the right to request from the respective commercial bank, when any individual mortgage loan isoverdue more than 90 days, either to replace the defaulted loan with another performing mortgage loan with similar terms orto pay immediately in cash an amount equal to the carrying amount of the defaulted loan plus accumulated interest. Thus,mortgage pool receivables with recourse represent, in substance, are loans issued to commercial banks in Mongolia, whichare collateralised by related mortgage loan receivables of those commercial banks, as well as by the related residentialproperties that are used as collateral, as additional guarantee.
2019 2018MNT'000 MNT'000
Commercial mortgage pool receivables 429,235,625 –Residential mortgage pool receivables 282,518,306 20,347,047Gross mortgage pool receivables with recourse 711,753,931 20,347,047Allowance for impairment losses (6,192,685) (29,067)Net mortgage pool receivables with recourse 705,561,246 20,317,980
Following the issuance of debt securities on the international capital market in January and February 2019 (see Note 22), theGroup used the net proceeds to purchase mortgages with recourse from commercial banks amounting to MNT 700.4 billionduring the year (see Note 27).
On 17 September 2019, 108 individual mortgage loans with total outstanding balance of MNT 3.6 billion previously servicedby Capital Bank were transferred to the Group due to the bankruptcy of Capital Bank. Accordingly, the Group reclassed thebalance from mortgage pool receivables with recourse to purchased mortgage receivables without recourse (see Note 14).
The following table represents the source of funding of the acquired outstanding mortgage pool receivables with recourse:
2019 2018MNT'000 MNT'000
Senior notes 698,892,423 –Own sources 7,380,588 12,648,610The Ministry of Finance of Mongolia (“MoF”) 5,480,920 7,698,437Gross mortgage pool receivables with recourse 711,753,931 20,347,047
13.1. Impairment allowance for mortgage pool receivables with recourse
Details of calculation and policies about ECL allowances are explained in Note 28.2.
The table below shows the credit quality and the maximum exposure to risk based on the Group’s internal credit rating systemand year-end stage classification. The amounts are represented gross of impairment allowances. Details of the Group’sinternal rating system are explained in Note 28.2.
2019 2018Stage 1 Stage 1
Internal rating grade MNT’000 MNT’000PerformingB- to B+ rated 711,753,931 20,347,047
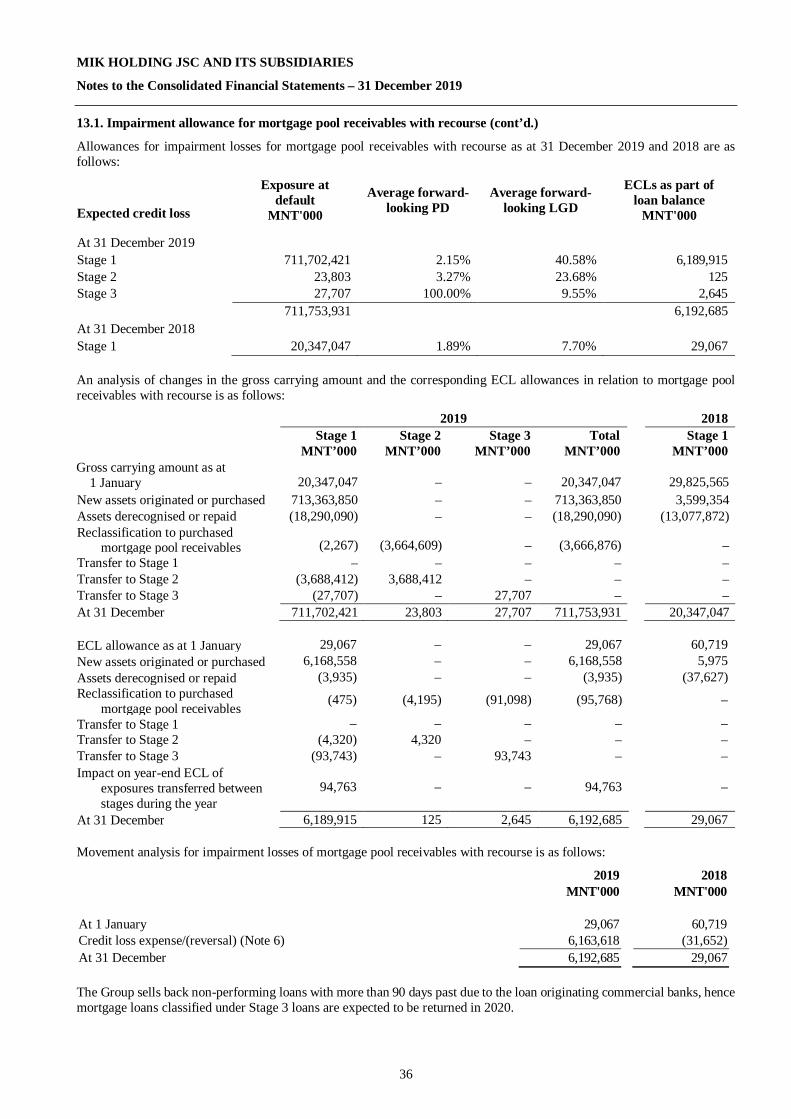
MIK HOLDING JSC AND ITS SUBSIDIARIES
Notes to the Consolidated Financial Statements – 31 December 2019
36
13.1. Impairment allowance for mortgage pool receivables with recourse (cont’d.)
Allowances for impairment losses for mortgage pool receivables with recourse as at 31 December 2019 and 2018 are asfollows:
Expected credit loss
Exposure atdefault
MNT'000
Average forward-looking PD
Average forward-looking LGD
ECLs as part ofloan balance
MNT'000
At 31 December 2019Stage 1 711,702,421 2.15% 40.58% 6,189,915Stage 2 23,803 3.27% 23.68% 125Stage 3 27,707 100.00% 9.55% 2,645
711,753,931 6,192,685At 31 December 2018Stage 1 20,347,047 1.89% 7.70% 29,067
An analysis of changes in the gross carrying amount and the corresponding ECL allowances in relation to mortgage poolreceivables with recourse is as follows:
2019 2018Stage 1 Stage 2 Stage 3 Total Stage 1
MNT’000 MNT’000 MNT’000 MNT’000 MNT’000Gross carrying amount as at
1 January 20,347,047 – – 20,347,047 29,825,565New assets originated or purchased 713,363,850 – – 713,363,850 3,599,354Assets derecognised or repaid (18,290,090) – – (18,290,090) (13,077,872)Reclassification to purchased
mortgage pool receivables (2,267) (3,664,609) – (3,666,876) –Transfer to Stage 1 – – – – –Transfer to Stage 2 (3,688,412) 3,688,412 – – –Transfer to Stage 3 (27,707) – 27,707 – –At 31 December 711,702,421 23,803 27,707 711,753,931 20,347,047
ECL allowance as at 1 January 29,067 – – 29,067 60,719New assets originated or purchased 6,168,558 – – 6,168,558 5,975Assets derecognised or repaid (3,935) – – (3,935) (37,627)Reclassification to purchased
mortgage pool receivables(475) (4,195) (91,098) (95,768) –
Transfer to Stage 1 – – – – –Transfer to Stage 2 (4,320) 4,320 – – –Transfer to Stage 3 (93,743) – 93,743 – –Impact on year-end ECL of
exposures transferred betweenstages during the year
94,763 – – 94,763 –
At 31 December 6,189,915 125 2,645 6,192,685 29,067
Movement analysis for impairment losses of mortgage pool receivables with recourse is as follows:
2019 2018MNT'000 MNT'000
At 1 January 29,067 60,719Credit loss expense/(reversal) (Note 6) 6,163,618 (31,652)At 31 December 6,192,685 29,067
The Group sells back non-performing loans with more than 90 days past due to the loan originating commercial banks, hencemortgage loans classified under Stage 3 loans are expected to be returned in 2020.

MIK HOLDING JSC AND ITS SUBSIDIARIES
Notes to the Consolidated Financial Statements – 31 December 2019
37
14. Purchased mortgage pool receivables
2019 2018MNT'000 MNT'000
Purchased mortgage pool receivables 2,886,730,905 2,834,077,603Accrued interest receivables 14,117,615 13,559,922Total gross purchased mortgage pool receivables 2,900,848,520 2,847,637,525Allowance for impairment losses (6,411,304) (7,524,701)Net purchased mortgage pool receivables 2,894,437,216 2,840,112,824
Purchased mortgage pool receivables represent mortgage loan receivables due from individual borrowers, purchased fromMongolian commercial banks, most of whom are shareholders of the Group. All significant risks and rewards related to thesemortgage loans, including the rights to the related collateral, are fully transferred to the Group at acquisition of the mortgagepools.
Included in purchased mortgage pool receivables are mortgage loans previously serviced by Capital Bank which weretransferred to the Group due the bankruptcy of Capital Bank. Accordingly, the Group reclassed the balance from mortgagepool receivables with recourse (see Note 13) to purchased mortgage pool receivables.
The Group performs a credit quality analysis of the individual mortgage loans on each mortgage pool acquired. For creditrisk policies and disclosures, please refer to Note 28.2.
14.1. Impairment allowance for purchased mortgage pool receivables
The table below shows the credit quality and the maximum exposure to risk based on the Group’s internal credit rating systemand year-end stage classification. The amounts are represented gross of impairment allowances. Details of the Group’sinternal rating system are explained in Note 28.2.
31 December 2019Stage 1 Stage 2 Stage 3 Total
Internal rating grade MNT’000 MNT’000 MNT’000 MNT’000PerformingHigh grade 409,538,694 – – 409,538,694Standard grade 2,268,956,552 – – 2,268,956,552Sub-standard grade – 91,853,016 – 91,853,016Past due but not impaired – 97,272,453 – 97,272,453
2,678,495,246 189,125,469 – 2,867,620,715Non-performingCredit-impaired – – 33,227,805 33,227,805Total 2,678,495,246 189,125,469 33,227,805 2,900,848,520
31 December 2018
Internal rating gradePerformingHigh grade 403,378,872 – – 403,378,872Standard grade 2,270,556,832 – – 2,270,556,832Sub-standard grade – 95,022,947 – 95,022,947Past due but not impaired – 45,981,423 – 45,981,423
2,673,935,704 141,004,370 – 2,814,940,074Non-performingCredit-impaired – – 32,697,451 32,697,451Total 2,673,935,704 141,004,370 32,697,451 2,847,637,525

MIK HOLDING JSC AND ITS SUBSIDIARIES
Notes to the Consolidated Financial Statements – 31 December 2019
38
14.1. Impairment allowance for purchased mortgage pool receivables (cont’d.)
Allowances for impairment losses for purchased mortgage pool receivables as at 31 December 2019 and 2018 at each stageare as follows:
Expected credit loss Exposure at defaultMNT'000
Average forward-looking PD
Forward-looking LGD
ECLs as part ofloan balance
MNT'000 31 December 2019 Stage 1 2,678,495,246 0.46% 6.98% 850,863 Stage 2 189,125,469 24.58% 6.98% 3,242,409 Stage 3 33,227,805 100.00% 6.98% 2,318,032
2,900,848,520 6,411,304 31 December 2018 Stage 1 2,673,935,704 0.49% 7.70% 1,459,144 Stage 2 141,004,370 30.51% 7.70% 3,547,630 Stage 3 32,697,451 100.00% 7.70% 2,517,927
2,847,637,525 7,524,701
An analysis of changes in the gross carrying amount and the corresponding ECL allowances in relation to purchased mortgagepool receivables is as follows:
Stage 1 Stage 2 Stage 3 2019MNT’000 MNT’000 MNT’000 Total
Gross carrying amount as at 1 January 2,673,935,704 141,004,370 32,697,451 2,847,637,525New assets originated or purchased 324,984,227 – – 324,984,227Reclassification from mortgage pool receivables
with recourse 2,267 3,664,609 – 3,666,876Assets derecognised or repaid (259,664,276) (11,869,283) (3,906,549) (275,440,108)Transfer to stage 1 42,369,967 (35,949,968) (6,419,999) –Transfer to stage 2 (92,917,976) 97,485,686 (4,567,710) –Transfer to stage 3 (10,214,667) (5,209,945) 15,424,612 –At 31 December 2,678,495,246 189,125,469 33,227,805 2,900,848,520
ECL allowance as at 1 January 1,459,144 3,547,630 2,517,927 7,524,701New assets originated or purchased 347,614 – – 347,614Reclassification from mortgage pool receivables
with recourse 475 4,195 91,098 95,768Assets derecognised or repaid (37,672) (93,641) (176,602) (307,915)Transfer to stage 1 1,431,856 (873,622) (558,234) –Transfer to stage 2 (19,614) 415,315 (395,701) –Transfer to stage 3 (17,523) (99,691) 117,214 –Impact on year end ECL of exposures transferred
between stages during the year (1,673,454) 1,297,246 867,736 491,528Changes to inputs used for ECL calculations (639,963) (955,023) (145,406) (1,740,392)At 31 December 850,863 3,242,409 2,318,032 6,411,304
Movement analysis for impairment losses of purchased mortgage pool receivables is as follows:
2019 2018MNT'000 MNT'000
At 1 January 7,524,701 7,243,020Credit loss expense/(reversal) (Note 6) (1,113,397) 281,681At 31 December 6,411,304 7,524,701

MIK HOLDING JSC AND ITS SUBSIDIARIES
Notes to the Consolidated Financial Statements – 31 December 2019
39
15. Financial assets at fair value through profit or loss
2019 2018MNT'000 MNT'000
Fair value as at 1 January 5,000,000 –Acquisitions – 5,000,000Net loss from change in fair value through profit or loss (300,069) –Fair value as at 31 December 4,699,931 5,000,000
On 25 December 2018, the Group purchased 500,000 investment units of Asia Diversified Real Estate Fund One PrivateInvestment Fund LLC (the “Fund”) at 10,000 per unit at a total amount of MNT 5.0 billion. The Fund is a registered fundlicensed by the FRC and has issued 1,500,000 investment units and is due for liquidation upon maturity in 10 years since itsestablishment in 2018. As of 31 December 2019, 500,000 units are held by the Group, 4,002 units are held by other parties,while the remaining 995,998 units have not been purchased by any other investor (for further disclosure, see Note 27).
Management has assessed that it does not have either control or significant influence on the operating and financial decisionsand activities of the Fund, as the Fund is governed by the Investment Fund Law of Mongolia which requires the Fund to beindependent and not controlled/influenced by its investors. The Fund is classified as a financial investment at FVPL inaccordance with IFRS 9 requirements (see Note 2.2). In making this judgment, management has also considered thefollowings:
· The Fund is managed by a managing company which is independent of the Group, and the Group has no right or abilityto nominate or replace the managing company;
· By contract and the relevant law, the Group or other investors are prohibited from influencing the decision, includinginvesting decisions and operation of the managing company.
As at 31 December 2019 and 2018, the Fund’s underlying investment comprised of principally an investment portfolio ofthe Group’s shares.
The Fund has a material bank loan that is securitized by its investment portfolio which is due in 2020, significant assumptionhas been applied by management in the valuation of the Fund that the bank loan will be extended.
16. Derivative financial instruments
On 28 March 2019, the Group entered into a cross-currency swap agreement with nominal amount of USD 295.4 million orMNT 777,151 million with commercial bank for foreign currency risk management purposes. The swap agreement isdesigned to manage the risk of variability of cash flows denominated in USD from its Senior Notes issued on the internationalmarket in January and February 2019 (see Notes 22 and 27). The USD/MNT swap has a maturity of three years, with interestpayable semi-annually beginning 30 September 2019 to 30 March 2022 on a net basis.
The table below shows the fair value of derivative financial instruments recorded as assets together with their notionalamounts. The notional amount, recorded gross, is the amount of a derivative’s underlying asset, reference rate or index andis the basis upon which changes in the value of derivatives are measured. The notional amounts indicate the volume oftransactions outstanding at the year end and are indicative of neither the market risk nor the credit risk.
For the fair value disclosure of derivative financial instruments, please refer to Note 29.
31 December 2019 Notional Fair valueamount of assets
MNT’000 MNT’000DerivativesCross currency swaps 777,151,290 55,516,592
2019MNT'000
Fair value as at 28 March 2019 –Net gains on derivative financial instruments 55,516,592Fair value as at 31 December 2019 55,516,592
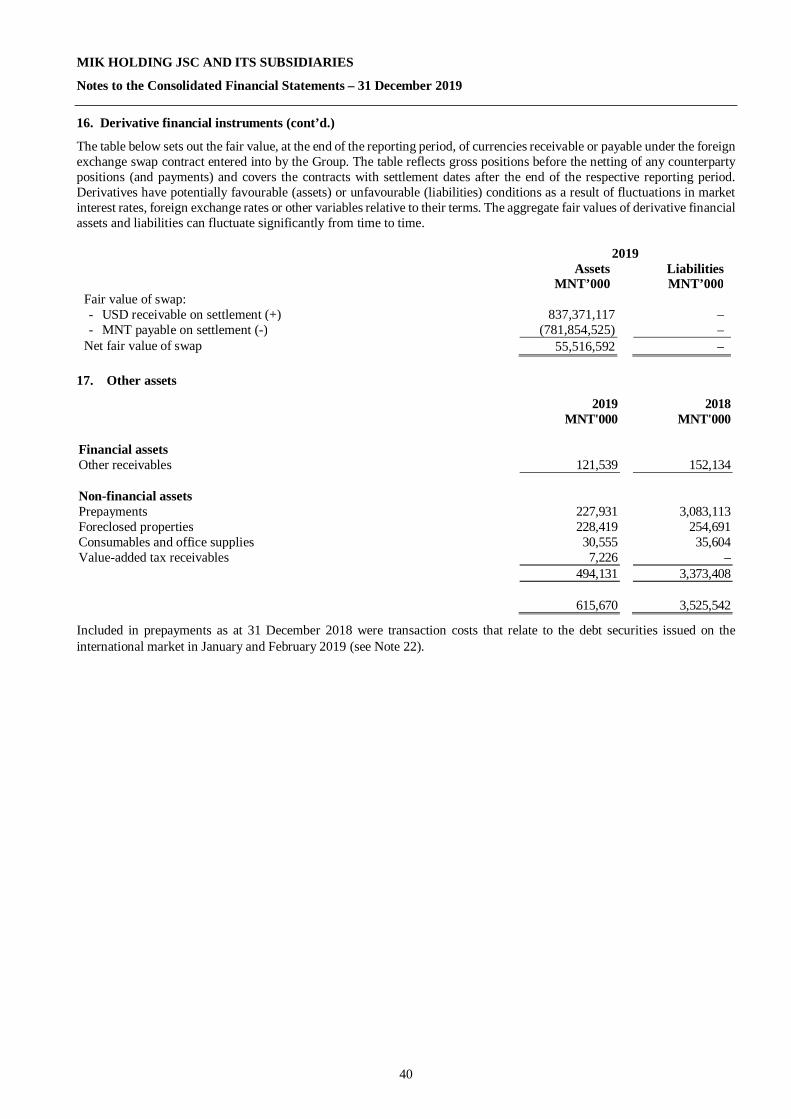
MIK HOLDING JSC AND ITS SUBSIDIARIES
Notes to the Consolidated Financial Statements – 31 December 2019
40
16. Derivative financial instruments (cont’d.)
The table below sets out the fair value, at the end of the reporting period, of currencies receivable or payable under the foreignexchange swap contract entered into by the Group. The table reflects gross positions before the netting of any counterpartypositions (and payments) and covers the contracts with settlement dates after the end of the respective reporting period.Derivatives have potentially favourable (assets) or unfavourable (liabilities) conditions as a result of fluctuations in marketinterest rates, foreign exchange rates or other variables relative to their terms. The aggregate fair values of derivative financialassets and liabilities can fluctuate significantly from time to time.
2019Assets Liabilities
MNT’000 MNT’000Fair value of swap:- USD receivable on settlement (+) 837,371,117 –- MNT payable on settlement (-) (781,854,525) –
Net fair value of swap 55,516,592 –
17. Other assets
2019 2018MNT'000 MNT'000
Financial assetsOther receivables 121,539 152,134
Non-financial assetsPrepayments 227,931 3,083,113Foreclosed properties 228,419 254,691Consumables and office supplies 30,555 35,604Value-added tax receivables 7,226 –
494,131 3,373,408
615,670 3,525,542
Included in prepayments as at 31 December 2018 were transaction costs that relate to the debt securities issued on theinternational market in January and February 2019 (see Note 22).

MIK HOLDING JSC AND ITS SUBSIDIARIES
Notes to the Consolidated Financial Statements – 31 December 2019
41
18. Property and equipment
Furnitureand office
Premises equipment Computers Vehicles TotalAt 31 December 2019 MNT'000 MNT'000 MNT'000 MNT'000 MNT'000
At costAt 1 January 2019 33,609,646 445,181 544,019 1,098,303 35,697,149Additions − 55,206 94,877 75,000 225,083Write-off − (4,010) (21,063) − (25,073)Disposal − − − (160,000) (160,000)At 31 December 2019 33,609,646 496,377 617,833 1,013,303 35,737,159
Accumulated depreciationAt 1 January 2019 1,623,717 117,651 324,009 152,205 2,217,582Charge for the year (Note 7) 851,669 44,411 67,662 103,123 1,066,865Write-off − (1,627) (21,063) − (22,690)Disposal − − − (56,810) (56,810)At 31 December 2019 2,475,386 160,435 370,608 198,518 3,204,947
Net carrying amount 31,134,260 335,942 247,225 814,785 32,532,212
At 31 December 2018
At costAt 1 January 2018 14,458,594 355,939 497,082 662,203 15,973,818Additions 19,151,052 125,465 47,691 436,100 19,760,308Write-off − (739) (216) − (955)Disposal − (35,484) (538) − (36,022)At 31 December 2018 33,609,646 445,181 544,019 1,098,303 35,697,149
Accumulated depreciationAt 1 January 2018 1,003,018 94,272 263,529 85,985 1,446,804Charge for the year (Note 7) 620,699 35,579 61,073 66,220 783,571Write-off − (639) (216) − (855)Disposal − (11,561) (377) − (11,938)At 31 December 2018 1,623,717 117,651 324,009 152,205 2,217,582
Net carrying amount 31,985,929 327,530 220,010 946,098 33,479,567
As at 31 December 2019, premises with carrying amount of MNT 31,134,260 thousand (2018: MNT 13,320,479 thousand)are collateralised for borrowed funds (see Note 21).
Premises with net carrying amount of MNT 5,418,258 were under plan for significant remodelling into an event hall as at 31December 2019. Management expects to capitalize costs of these capital improvements when they are incurred.
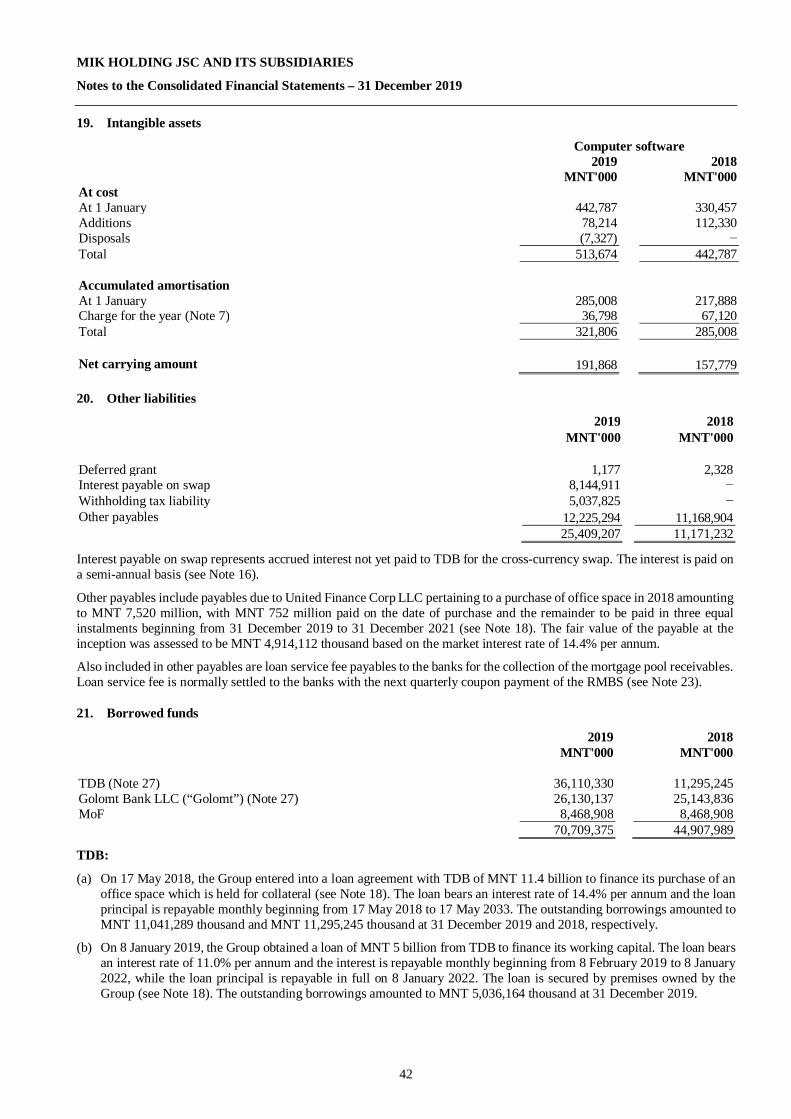
MIK HOLDING JSC AND ITS SUBSIDIARIES
Notes to the Consolidated Financial Statements – 31 December 2019
42
19. Intangible assets
Computer software2019 2018
MNT'000 MNT'000At costAt 1 January 442,787 330,457Additions 78,214 112,330Disposals (7,327) −Total 513,674 442,787
Accumulated amortisationAt 1 January 285,008 217,888Charge for the year (Note 7) 36,798 67,120Total 321,806 285,008
Net carrying amount 191,868 157,779
20. Other liabilities
2019 2018MNT'000 MNT'000
Deferred grant 1,177 2,328Interest payable on swap 8,144,911 −Withholding tax liability 5,037,825 −Other payables 12,225,294 11,168,904
25,409,207 11,171,232
Interest payable on swap represents accrued interest not yet paid to TDB for the cross-currency swap. The interest is paid ona semi-annual basis (see Note 16).
Other payables include payables due to United Finance Corp LLC pertaining to a purchase of office space in 2018 amountingto MNT 7,520 million, with MNT 752 million paid on the date of purchase and the remainder to be paid in three equalinstalments beginning from 31 December 2019 to 31 December 2021 (see Note 18). The fair value of the payable at theinception was assessed to be MNT 4,914,112 thousand based on the market interest rate of 14.4% per annum.
Also included in other payables are loan service fee payables to the banks for the collection of the mortgage pool receivables.Loan service fee is normally settled to the banks with the next quarterly coupon payment of the RMBS (see Note 23).
21. Borrowed funds
2019 2018MNT'000 MNT'000
TDB (Note 27) 36,110,330 11,295,245Golomt Bank LLC (“Golomt”) (Note 27) 26,130,137 25,143,836MoF 8,468,908 8,468,908
70,709,375 44,907,989
TDB:
(a) On 17 May 2018, the Group entered into a loan agreement with TDB of MNT 11.4 billion to finance its purchase of anoffice space which is held for collateral (see Note 18). The loan bears an interest rate of 14.4% per annum and the loanprincipal is repayable monthly beginning from 17 May 2018 to 17 May 2033. The outstanding borrowings amounted toMNT 11,041,289 thousand and MNT 11,295,245 thousand at 31 December 2019 and 2018, respectively.
(b) On 8 January 2019, the Group obtained a loan of MNT 5 billion from TDB to finance its working capital. The loan bearsan interest rate of 11.0% per annum and the interest is repayable monthly beginning from 8 February 2019 to 8 January2022, while the loan principal is repayable in full on 8 January 2022. The loan is secured by premises owned by theGroup (see Note 18). The outstanding borrowings amounted to MNT 5,036,164 thousand at 31 December 2019.

MIK HOLDING JSC AND ITS SUBSIDIARIES
Notes to the Consolidated Financial Statements – 31 December 2019
43
21. Borrowed funds (cont’d.)
TDB (cont’d.)
(c) On 25 September 2019, the Group obtained another loan of MNT 20 billion from TDB to finance its working capital.The loan bears an interest rate of 12.0% per annum and the interest is repayable monthly beginning from 25 October2019 to 25 September 2020, while the loan principal is repayable in full on 25 September 2020. The loan is secured bypremises owned by the Group (see Note 18), as well as future transaction administration fee income and receivablesvalued at MNT 13,320 million to be earned by MIK HFC from providing transaction administration services to MIKAsset One SPC LLC to MIK Asset Nineteen SPC LLC. The outstanding borrowings amounted to MNT 20,032,877thousand at 31 December 2019.
Golomt
(d) The Group obtained a loan of MNT 25 billion from Golomt on 11 December 2018 to finance its purchase of loan notesissued by Bodi (see Note 12). The loan bears an interest rate of 10.0% per annum and the interest is repayable semi-annually beginning from 20 July 2019 to 20 January 2024, while the principal is repayable in full on 20 January 2024.The loan is secured by gross mortgage pool receivables with recourse of MNT 30 billion and cash in a current accountheld with Golomt.
MoF
(e) A sub-lending agreement between MoF and the Group was made on 3 January 2011. The Group has fully drawn the fullamount of the loan in 2012. The loan bears a nominal interest rate of 4% per annum (2018: 4%) and the interest isrepayable on 30 May and 30 November of each year, while the principal is repayable in full in 2020. The borrowing isnot collateralised.
22. Debt securities issued
2019 2018MNT'000 MNT'000
Debt securities at amortised cost 839,131,215 −
On 29 January and 12 February 2019, the Group issued Senior Notes (“Notes”) with nominal value of USD 250 million andUSD 50 million, respectively, on the international capital market. The Notes bear an interest of 9.75% per annum payablesemi-annually in arrears starting from 29 January 2019 to 29 January 2022. The Notes are unconditionally and irrevocablyguaranteed by the Company.
Qualifying transaction costs are capitalised and to be amortised over the life of the financial instruments using EIR.
To comply with the restrictive covenants on use of proceeds from the Notes, the Group is required to use at least 90.0% ofthe net proceeds for purchasing mortgages with recourse and the remaining portion for general corporate purposes.
23. Collateralised bonds
Interest 2019 2018rate MNT'000 MNT'000
Senior bonds 4.5% 2,545,933,710 2,445,252,312Junior bonds 10.5% 403,095,464 453,067,791
2,949,029,174 2,898,320,103
The senior and junior bonds as at 31 December 2019 and 31 December 2018 represent bonds issued by MIK Asset One SPCLLC to MIK Asset Twenty-One SPC LLC to BoM, MoF and commercial banks under the RMBS program of the governmentof Mongolia. The bonds are collateralised by the purchased mortgage pool receivables (see Note 14). The interest rates onthe junior bonds and the senior bonds are 10.5% and 4.5% per annum respectively and are payable on a quarterly basis.
On 15 March 2019, junior bonds of MIK Group previously held by Capital Bank were transferred to the MoF due to thebankruptcy of Capital Bank.
The principal payments of the senior bonds are payable on a quarterly basis and are equal to the quarterly principal repaymentreceived from the purchased mortgage pool receivables acquired under the RMBS program. The principal of the junior bondswill only be redeemed after the full redemption of the principal of the senior bonds and the payments to junior bond holdersare subordinate in right of payment and priority to the senior bonds. Commercial banks are to use the senior bonds to repaytheir loans from BoM and MoF.

MIK HOLDING JSC AND ITS SUBSIDIARIES
Notes to the Consolidated Financial Statements – 31 December 2019
44
23. Collateralised bonds (cont’d.)
The bonds are not publicly traded on an active market (such as the stock exchange) but are sold directly to commercial banks.The Group did not have any defaults of principal, interest or other breaches with respect to the collateralised bonds during2019 and 2018.
24. Ordinary shares
The Company is a joint stock company established under the Company Law of Mongolia and listed on the Mongolian StockExchange on 24 December 2015. The total authorised share capital of the Company represents 30,000,000 ordinary shares(2018: 30,000,000) with nominal value of MNT 1,000 per share.
The movement in number of shares and amount of share capital during the years ended 31 December 2019 and 31 December2018 are as follows:
Number ofoutstanding shares of
MNT 1,000 each
Issued ordinaryshares
MNT’000
SharepremiumMNT’000
At 1 January/31 December 2018 and1 January/31 December 2019 20,709,320 20,709,320 52,225,115
There were 5,462,429 shares held as treasury shares as at 31 December 2019 (2018: 5,462,429 shares). Excluding theseshares, the total number of issued shares as at 31 December 2019 was 15,246,891 shares (2018: 15,246,891 shares). Allissued ordinary shares are fully paid. Each ordinary share carries one vote.
In 2018, MIK Asset One SPC LLC and MIK Asset Two SPC LLC repurchased 892,927 and 432,712 shares, respectively,from Capital Bank LLC at MNT 11,381.68 per share under the share pledge and deposit agreements dated 27 December2018 for a total amount of MNT 15,088,000 thousand (see Note 27).
There were no dividends declared to its shareholders during the years ended 31 December 2019 and 31 December 2018.
The shareholders of the Group as of 31 December 2019 and 31 December 2018 and percentages of ownership are as follows:
2019 2018
Asia Diversified Real Estate Fund One Private Investment Fund 11.16% 9.05%Ulaanbaatar City Bank LLC 10.00% 17.08%Trade and Development Bank of Mongolia LLC 9.99% 9.99%TDB Capital LLC 9.21% 7.49%Golomt Bank LLC 4.94% 4.94%CNB Consulting LLC 2.61% −CEC Group 2.36% −Khan Bank LLC 1.02% 1.02%XacBank LLC 1.02% 1.02%Capitron Bank LLC 1.02% 1.02%Nexus Finance Investment NBFI LLC 0.63% 0.63%Chinggis Khaan Bank LLC 0.30% 0.30%Capital Bank LLC − 1.72%Others 0.10% 0.10%Total private sector share 54.36% 54.36%Development Bank of Mongolia 14.88% 14.88%Bank of Mongolia 2.03% 2.03%State Bank LLC 2.35% 2.35%Total state shares 19.26% 19.26%Treasury shares 26.38% 26.38%Total 100.00% 100.00%
Financial and operating policy decisions, including strategic decisions, are made at the meetings of the Board of Directors(“BOD”). The members of the BOD are appointed at the Shareholders’ Meeting. As of 31 December 2019, each shareholderthat has more than 1% of total shares of the Group, has the ability to nominate one member to the BOD, which consists of 9members, including 2 independent members, one representative of the Bank of Mongolia and representatives of thecommercial banks and state-owned banks. In addition, all bank shareholders have material transactions with the Group during2019 and participated in the policy making procedures.

MIK HOLDING JSC AND ITS SUBSIDIARIES
Notes to the Consolidated Financial Statements – 31 December 2019
45
25. Contingent liabilities and commitments
Legal claims
Litigation is a common occurrence in the financial services industry due to the nature of the business. The Group has anestablished protocol for dealing with such legal claims. Once professional advice has been obtained and the amount ofdamages can be reasonably estimated, the Group makes adjustments to account for any adverse effects which the claim mayhave on its financial standing. At the year end, the Group had no significant outstanding litigation.
Tax legislation
Mongolian tax legislation is subject to varying interpretations, and changes, which can occur frequently. Management'sinterpretation of such legislation as applied to the transactions and activity of the Group may be challenged by tax authorities.
Mongolian tax authorities may be taking a more assertive position in their interpretation of the legislation and assessments,and it is possible that transactions and activities that have not been challenged in the past may be challenged by tax authorities.As a result, significant additional taxes, penalties and interest may be assessed. Fiscal periods remain open to review by theauthorities in respect of taxes for five calendar years preceding the year of review. Under certain circumstances reviews maycover longer periods.
Mongolian transfer pricing legislation provides the possibility for tax authorities to make transfer pricing adjustments andimpose additional tax liabilities in respect of all controllable transactions, including those related to domestic transfer pricing.In case of deviation of transaction terms from market terms, the tax authorities have the right to adjust taxable items and toimpose additional taxes, fines and interest penalties. Given the brief nature of the current Mongolian transfer pricing rules,the impact of any such challenge cannot be reliably estimated. However, it may be significant to the financial position and/orthe overall operations of the entity.
Mongolian tax legislation does not provide definitive guidance in certain areas, specifically in areas such as VAT,withholding tax, corporate income tax, personal income tax and other areas. From time to time, the Group adoptsinterpretations of such uncertain areas that reduce the overall tax rate of the Group. As noted above, such tax positions maycome under heightened scrutiny as a result of recent developments in administrative and court practices. The impact of anychallenge by the tax authorities cannot be reliably estimated; however, it may be significant to the financial position and/orthe overall operations of the entity.
Management performs regular re-assessment of tax risks and its position may change in the future as a result of the changein conditions that cannot be anticipated with sufficient certainty at present.
Assets pledged and restricted
RMBS issued by the Group are fully collateralised by the purchased mortgage pool receivables. As of 31 December 2019,the Group had mortgage pool receivables with the gross amount of MNT 2,900,848,520 thousand (2018: MNT 2,847,637,525thousand) pledged as collateral for the RMBS (see Note 14). The related liabilities amount is MNT 2,949,029,174 thousandas of 31 December 2019 (2018: MNT 2,898,320,103 thousand).

MIK HOLDING JSC AND ITS SUBSIDIARIES
Notes to the Consolidated Financial Statements – 31 December 2019
46
26. Maturity analysis of assets and liabilities
The table shows an analysis of assets and liabilities analysed according to when they are expected to be recovered or settled.See Note 28.3 'Liquidity risk' for the Group’s contractual undiscounted repayment obligations.
Less than More than12 months 12 months TotalMNT'000 MNT'000 MNT'000
At 31 December 2019Financial assetsCash and bank balances 228,337,007 − 228,337,007Debt instrument at amortised cost 63,863,184 192,414,142 256,277,326Mortgage pool receivables with recourse 109,479,969 596,081,277 705,561,246Purchased mortgage pool receivables 184,809,711 2,709,627,505 2,894,437,216Financial investments at fair value through profit or loss − 4,699,931 4,699,931Derivative financial instruments − 55,516,592 55,516,592Other assets 121,539 − 121,539
586,611,410 3,558,339,447 4,144,950,857Non-financial assetsProperty and equipment – 32,532,212 32,532,212Intangible assets – 191,868 191,868Other assets 494,131 – 494,131Deferred tax asset – 3,078,910 3,078,910
494,131 35,802,990 36,297,121Total 587,105,541 3,594,142,437 4,181,247,978
Financial liabilitiesBorrowed funds 30,048,819 40,660,556 70,709,375Debt securities issued 19,075,215 820,056,000 839,131,215Collateralised bonds 199,938,569 2,749,090,605 2,949,029,174Other liabilities 18,113,758 2,256,000 20,369,758
267,176,361 3,612,063,161 3,879,239,522Non-financial liabilitiesOther liabilities 5,039,450 − 5,039,450Income tax payable 1,459,804 − 1,459,804Deferred tax liability − 32,823,469 32,823,469
6,499,254 32,823,469 39,322,723Total 273,675,615 3,644,886,630 3,918,562,245
Net 313,429,926 (50,744,193) 262,685,733

MIK HOLDING JSC AND ITS SUBSIDIARIES
Notes to the Consolidated Financial Statements – 31 December 2019
47
26. Maturity analysis of assets and liabilities (cont’d.)
Less than More than12 months 12 months TotalMNT'000 MNT'000 MNT'000
At 31 December 2018Financial assetsCash and bank balances 86,438,794 − 86,438,794Debt instrument at amortised cost 2,440,521 193,568,348 196,008,869Mortgage pool receivables with recourse 2,402,701 17,915,279 20,317,980Purchased mortgage pool receivables 175,738,749 2,664,374,075 2,840,112,824Financial investments at fair value through profit or loss − 5,000,000 5,000,000Other assets 152,134 − 152,134
267,172,899 2,880,857,702 3,148,030,601Non-financial assetsProperty and equipment – 33,479,567 33,479,567Intangible assets – 157,779 157,779Other assets 3,373,408 – 3,373,408
3,373,408 33,637,346 37,010,754Total 270,546,307 2,914,495,048 3,185,041,355
Financial liabilitiesBorrowed funds 520,937 44,387,052 44,907,989Collateralised bonds 199,375,609 2,698,944,494 2,898,320,103Other liabilities 7,395,160 3,773,744 11,168,904
207,291,706 2,747,105,290 2,954,396,996Non-financial liabilitiesOther liabilities 2,328 − 2,328Income tax payable 1,195,430 − 1,195,430Deferred tax liability − 20,995,169 20,995,169
1,197,758 20,995,169 22,192,927Total 208,489,464 2,768,100,459 2,976,589,923
Net 62,056,843 146,394,589 208,451,432
27. Related party disclosures
A number of transactions were entered into by the Group with related parties in the course of business. As all shareholdershave the right to appoint a director, management considers them to be related parties.
Purchase of preference shares from shareholder of related party
As disclosed in Note 12, the Group purchased through its SPCs a total of 30,000 preference shares of UBC, a shareholder ofTDB, with par value of MNT 5 million per share on 14 November 2018. The preference shares have an 11% annual fixeddividend rate which could be deferred at the option of UBC which would be accumulated and the deferred dividend bears aninterest rate of 11% per annum. The preference shares have no fixed maturity terms, however, in the opinion of management,the Group has the right to request for redemption and UBC has an obligation to repurchase the shares upon maturity ofrespective SPCs. Management assessed that the substance of the preference shares represents a debt instrument. The proceedswere used by UBC to invest in additional shares in its associate

MIK HOLDING JSC AND ITS SUBSIDIARIES
Notes to the Consolidated Financial Statements – 31 December 2019
48
27. Related party disclosures (cont’d.)
Loans from/to shareholder of related party
The Group obtained a loan of MNT 25 billion from Golomt on 11 December 2018 with an interest rate of 10.0% per annum,with interest repayable semi-annually beginning from 20 July 2019 to 20 January 2024 and principal repayable in full on 20January 2024. The loan is secured by gross mortgage pool receivables with recourse of MNT 30 billion and cash in currentaccounts held with Golomt (see Note 21).
On 11 December 2018, the Group purchased through MIK HFC and SPCs loan notes from Bodi, a shareholder of Golomt,for MNT 25.0 billion and MNT 20.0 billion, respectively, using the loan received from Golomt and additional cash. The loannotes bear an interest rate of 12.2% per annum, with interest repayable semi-annually beginning from 20 July 2019 to 20July 2023 and principal repayable in three instalments beginning from 20 January 2023 to 12 December 2023 (see Note 12).Golomt holds 4.95% shares of the Group as of 31 December 2019 (31 December 2018: 4.95%).
Investment made in the Investment Fund
On 25 December 2018, the Group purchased 500,000 investment units of Asia Diversified Real Estate Fund One PrivateInvestment Fund LLC (the “Fund”) at 10,000 per unit at a total amount of MNT 5.0 billion (Note 15). The Fund has issued1,500,000 investment units and is due for liquidation upon maturity in 10 years since its establishment in 2018.
On the same day, the Fund acquired 1,875,000 shares (2019: 437,500 shares) of the Company from Ulaanbaatar City BankLLC (“UBCB”) as part of its investment portfolio. As of 31 December 2019, 500,000 units are held by the Group , 4,002units are held by other parties, while the remaining 995,998 units have not been purchased by any other investor
Purchase of treasury shares from shareholder
In 2018, the Group repurchased through its SPCs 1,325,639 shares of the Company, from Capital Bank LLC at MNT11,381.68 per share under the share pledge and deposit agreements dated 27 December 2018 for a total amount of MNT15,088,000 thousand (see Note 24).
Borrowings
The Group obtained a loan of MNT 5 billion from TDB on 8 January 2019 with an interest rate of 11.0% per annum. Intereston the loan is repayable monthly beginning from 8 February 2019 to 8 January 2022 while the loan principal is repayable infull on 8 January 2022 (see Note 21).
On 25 September 2019, the Group acquired another loan of MNT 20 billion from TDB with a maturity of 25 September2020. The loan bears an interest rate of 12.0% per annum and the interest is repayable monthly and the loan principal isrepayable in full at maturity (see Note 21).
Other payables
Other payables include loan service fee payable to the banks for the collection of the purchased mortgage pool receivablesas follows:
2019 2018MNT'000 MNT'000
TDB 1,308,393 1,253,973Golomt 1,453,019 1,359,292UBCB 384,016 234,720Chinggis Khaan Bank LLC 20,193 17,890Capital Bank LLC − 134,722State Bank LLC 398,258 387,414XacBank LLC 464,107 448,755Khan Bank LLC 1,250,877 1,155,939Capitron Bank LLC 42,578 37,294Total 5,321,441 5,029,999
Loan service fee is normally settled with the banks with the next quarterly coupon payment of the RMBS.
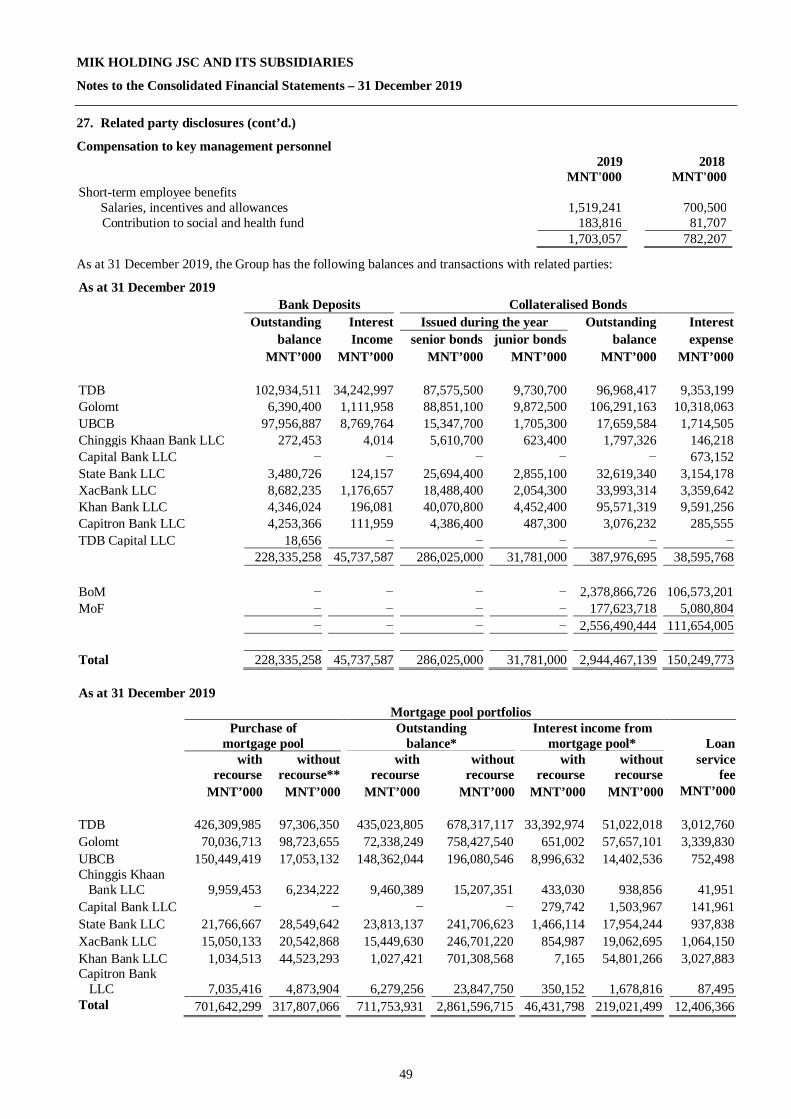
MIK HOLDING JSC AND ITS SUBSIDIARIES
Notes to the Consolidated Financial Statements – 31 December 2019
49
27. Related party disclosures (cont’d.)
Compensation to key management personnel2019 2018
MNT'000 MNT'000Short-term employee benefits
Salaries, incentives and allowances 1,519,241 700,500Contribution to social and health fund 183,816 81,707
1,703,057 782,207
As at 31 December 2019, the Group has the following balances and transactions with related parties:
As at 31 December 2019Bank Deposits Collateralised Bonds
Outstanding Interest Issued during the year Outstanding Interestbalance Income senior bonds junior bonds balance expense
MNT’000 MNT’000 MNT’000 MNT’000 MNT’000 MNT’000
TDB 102,934,511 34,242,997 87,575,500 9,730,700 96,968,417 9,353,199Golomt 6,390,400 1,111,958 88,851,100 9,872,500 106,291,163 10,318,063UBCB 97,956,887 8,769,764 15,347,700 1,705,300 17,659,584 1,714,505Chinggis Khaan Bank LLC 272,453 4,014 5,610,700 623,400 1,797,326 146,218Capital Bank LLC − − − − − 673,152State Bank LLC 3,480,726 124,157 25,694,400 2,855,100 32,619,340 3,154,178XacBank LLC 8,682,235 1,176,657 18,488,400 2,054,300 33,993,314 3,359,642Khan Bank LLC 4,346,024 196,081 40,070,800 4,452,400 95,571,319 9,591,256Capitron Bank LLC 4,253,366 111,959 4,386,400 487,300 3,076,232 285,555TDB Capital LLC 18,656 − − − − −
228,335,258 45,737,587 286,025,000 31,781,000 387,976,695 38,595,768
BoM − − − − 2,378,866,726 106,573,201MoF − − − − 177,623,718 5,080,804
− − − − 2,556,490,444 111,654,005
Total 228,335,258 45,737,587 286,025,000 31,781,000 2,944,467,139 150,249,773
As at 31 December 2019Mortgage pool portfolios
Purchase ofmortgage pool
Outstandingbalance*
Interest income frommortgage pool* Loan
withrecourse
withoutrecourse**
withrecourse
withoutrecourse
withrecourse
withoutrecourse
servicefee
MNT’000 MNT’000 MNT’000 MNT’000 MNT’000 MNT’000 MNT’000
TDB 426,309,985 97,306,350 435,023,805 678,317,117 33,392,974 51,022,018 3,012,760Golomt 70,036,713 98,723,655 72,338,249 758,427,540 651,002 57,657,101 3,339,830UBCB 150,449,419 17,053,132 148,362,044 196,080,546 8,996,632 14,402,536 752,498Chinggis Khaan
Bank LLC 9,959,453 6,234,222 9,460,389 15,207,351 433,030 938,856 41,951Capital Bank LLC − − − − 279,742 1,503,967 141,961State Bank LLC 21,766,667 28,549,642 23,813,137 241,706,623 1,466,114 17,954,244 937,838XacBank LLC 15,050,133 20,542,868 15,449,630 246,701,220 854,987 19,062,695 1,064,150Khan Bank LLC 1,034,513 44,523,293 1,027,421 701,308,568 7,165 54,801,266 3,027,883Capitron Bank
LLC 7,035,416 4,873,904 6,279,256 23,847,750 350,152 1,678,816 87,495Total 701,642,299 317,807,066 711,753,931 2,861,596,715 46,431,798 219,021,499 12,406,366

MIK HOLDING JSC AND ITS SUBSIDIARIES
Notes to the Consolidated Financial Statements – 31 December 2019
50
27. Related party disclosures (cont’d.)
As at 31 December 2018Bank Deposits Collateralised Bonds
Outstanding Interest Issued during the year Outstanding Interestbalance Income senior bonds junior bonds balance expense
MNT’000 MNT’000 MNT’000 MNT’000 MNT’000 MNT’000
TDB 11,517,406 7,257,788 98,454,500 10,939,400 103,931,534 8,451,385Golomt 8,451,705 1,954,202 114,945,500 12,771,800 111,916,898 9,240,540UBCB 52,940,589 7,805,878 46,833,000 5,203,700 21,086,633 1,352,761Chinggis Khaan Bank LLC 56,402 1,709 2,639,900 293,300 1,643,623 107,589Capital Bank LLC 1,318,871 1,361,455 14,006,400 1,556,300 12,081,836 1,007,167State Bank LLC 2,096,748 2,491,600 38,899,500 4,322,300 34,863,300 2,823,405XacBank LLC 3,044,344 307,279 40,382,400 4,487,000 40,341,173 3,048,651Khan Bank LLC 6,471,616 639,291 155,332,200 17,259,100 118,328,051 8,442,834Capitron Bank LLC 201,907 6,251 5,717,000 635,400 3,366,489 228,677
86,099,588 21,825,453 517,210,400 57,468,300 447,559,537 34,703,009
BoM − − − − 2,377,143,831 104,870,314MoF − − − − 68,108,482 1,238,215
− − − − 2,445,252,313 106,108,529
Total 86,099,588 21,825,453 517,210,400 57,468,300 2,892,811,850 140,811,538
As at 31 December 2018Mortgage pool portfolios
Purchase ofmortgage pool
Outstandingbalance*
Interest income frommortgage pool* Loan
withrecourse
withoutrecourse**
withrecourse
withoutrecourse
withrecourse
withoutrecourse
servicefee
MNT’000 MNT’000 MNT’000 MNT’000 MNT’000 MNT’000 MNT’000
TDB 309,670 109,394,123 4,156,106 650,280,312 668,605 49,758,122 2,949,291Golomt − 127,717,509 3,119,478 735,380,772 604,055 55,544,187 3,157,864UBCB 420,587 52,036,921 2,099,249 125,174,779 313,508 8,187,398 481,506Chinggis Khaan
Bank LLC − 2,933,411 − 9,712,270 − 707,212 37,681
Capital Bank LLC − 15,563,009 3,839,324 85,198,588 400,620 6,273,684 331,311State Bank LLC 2,929,876 43,221,975 4,805,392 232,281,701 568,656 17,015,940 897,555XacBank LLC − 44,869,750 1,854,557 249,341,905 349,487 18,536,633 1,015,352Khan Bank LLC − 172,591,617 − 710,294,578 − 50,819,218 2,801,650Capitron Bank LLC − 6,352,539 472,941 20,764,386 112,058 1,407,110 77,513Total 3,660,133 574,680,854 20,347,047 2,818,429,291 3,016,989 208,249,504 11,749,723
* Outstanding balance/interest income from mortgage pool with/without recourse represents the principal/interest incomefrom individual borrowers that are passed through to the Group via the commercial banks.
** Difference between issuance of RMBS (senior and junior) and the purchased mortgage pool (without recourse) is the cashpayment of the Group to the respective commercial banks amounting to MNT 1,420 thousand (2018: MNT 2,154 thousand).
Terms and conditions of transactions with related parties
The above-mentioned outstanding balances arose from the ordinary course of the Group’s business. The interest charged toand by related parties are at normal commercial rates in relation to bank deposits, borrowings and mortgage pools and at therates specified in the RMBS.
MIK HOLDING JSC AND ITS SUBSIDIARIES
Notes to the Consolidated Financial Statements – 31 December 2019
51
28. Risk management
28.1. Introduction
The Group’s business activities expose it to the following major categories of financial risk:· Credit risk. Credit risk is the potential for financial loss resulting from the failure of a borrower or institutional
counterparty to honour its financial or contractual obligations, resulting in a potential loss of earnings or cash flows.· Liquidity risk. Liquidity risk is the risk that the Group will not be able to meet its funding obligations in a timely manner.· Market risk. Market risk is the exposure generated by adverse changes in the value of the Group’s financial assets caused
by a change in interest rates or foreign exchange rates.· Operational risk. Operational risk is the risk of loss resulting from inadequate or failed internal processes, people, systems,
corporate governance, or from external events.
The Group seeks to manage those risks by using an established risk management framework that continues to evolve as theGroup grows and expands its business. This risk management framework is intended to provide the basis of the principlesthat govern the Group’s risk management activities.
Risk management structure
The Company has its dedicated BOD appointed by its shareholders. The BOD is responsible for the oversight of assetmanagement and execution of responsibility through the board committee system, which includes the following standingcommittees: the Risk Committee (“RC”), the Finance and Audit Committee (“FAC”), and the Operations and LegalCommittee (“OLC”).
The RC oversees general risk–related policies, including review of the Group–level risk policies and limits, performanceagainst these policies and limits, and the sufficiency of risk management capabilities. In addition to overseeing liquidity riskand market risk in association with the RC, the FAC reviews the Group’s system of internal controls, and approves purchasesof pools of mortgage loan receivables. The OLC oversees operational risk and legal compliance.
The Group’s risk management policies are established to identify and analyse the risks faced by the Group, to set appropriaterisk limits and controls, and to monitor risks and adherence to limits. Risk management policies and systems are reviewedregularly to reflect changes in market conditions and in the products and services offered. The Group, through its trainingand management standards and procedures, aims to develop a disciplined and constructive control environment.
28.2. Credit risk
Credit risk is the risk that the Group will incur a loss because its counterparties fail to discharge their contractual obligations.Credit risk is monitored by the Risk Management Department of the Group. It is their responsibility to review and managecredit risk, including environmental and social risk for all types of counterparties.
The Group has established a credit quality review process, which assigns each counterparty a risk rating to provide earlyidentification of possible changes in the creditworthiness of counterparties, including regular collateral revisions. Risk ratingsare subject to regular review. The credit quality review process aims to allow the Group to assess the potential loss as a resultof the risks to which it is exposed and take corrective actions.
Treasury assets
The Group’s treasury assets consist of current, trust, savings and collection accounts in ten different commercial banks andone financial organisation operating in Mongolia. Credit risk arising from treasury assets is the risk of the originating bankor financial organisation entering bankruptcy.
Debt instruments
The Group purchased debt instruments of counterparties operating in Mongolia. Credit risk arising from debt instrumentslies on the probability of originating counterparties entering bankruptcy.
MIK HOLDING JSC AND ITS SUBSIDIARIES
Notes to the Consolidated Financial Statements – 31 December 2019
52
28. Risk management (cont’d.)
28.2. Credit risk (cont’d.)
Mortgage loans without recourse
The Group purchases mortgage loan receivables from the commercial banks of Mongolia. Credit risk for mortgage loanreceivables lies on the probability of not receiving principal or interest on a timely basis due to the borrowers not makingpayments on time.
The mortgage pool portfolio purchase procedures include thorough due diligence to ensure that the commercial banks complywith the quality standards based on those established by the BoM and the use of an assessment model that utilises bothqualitative and quantitative measurements related to the overall quality of mortgage loans to be purchased.
The Group has also developed eligibility criteria for the loan receivables that they can acquire. The criteria are set for theborrower, loan, collateral asset and loan documents based on Mongolian Law and the requirements set by BoM. The loanfiles for every loan receivable to be purchased are checked for completeness for each borrower, and management hasprocedures and policy in place to ensure that the eligibility criteria are met.
After the pool of loan receivables are purchased, the Group receives daily settlement reports and reconciles the information,on a monthly basis. A consolidated quality report is obtained from the loan origination banks. These reports are used toclosely monitor the performance of the loan origination banks in collecting loan payments on behalf of the Group. In addition,follow ups are made with the loan origination banks on any loans with slow repayment history. The policies and proceduresfor selecting loan receivables for purchase have been approved and are monitored by the RC.
Mortgage loans with recourse
In addition to mortgage loans without recourse, the Group also purchases mortgage loans with recourse from commercialbanks of Mongolia. The Group has the right to request from the respective commercial bank, when any individual mortgageloan is overdue more than 90 days, either to replace the defaulted loan with another performing mortgage loan with similarterms or to pay immediately in cash an amount equal to the carrying amount of the defaulted loan plus accumulated interest.Therefore, the credit risk for mortgage loan receivables with recourse lies on the probability of the originating bank orfinancial organisation entering bankruptcy.
The mortgage loan purchase procedures are similar to those of mortgage pools without recourse for mortgage loans sourcedby the MoF or the Group’s own funds. For outstanding mortgage pool receivables with recourse balances based on theirsource of funding, please see Note 13.
For mortgage loans purchased with the Senior Note proceeds, the Group has developed eligibility criteria and loan purchaseprocedures that are different than those set for mortgage loans without recourse. Due diligence review procedures includeobtaining loan details from the banks and checking them against the eligibility criteria, but do not include review of borrowerloan files. The final composition and size of the portfolio to be purchased is approved by the Asset and Liability Committee(“ALCO”) of the Group.
After the pool of loan receivables are purchased, the Group receives the settlement reports and reconciles the information ona monthly basis. The policies and procedures for selecting loan receivables for purchase have been approved and aremonitored by the RC.
Definition of default and cure
The Group considers a financial instrument defaulted and therefore Stage 3 (credit-impaired) for ECL calculations in allcases when the borrower becomes 90 days past due on its contractual payments. The Group considers treasury assetsdefaulted and takes immediate action when the required intraday payments are not settled by the close of business as outlinedin the individual agreements.
As a part of a qualitative assessment of whether a customer is in default, the Group also considers a variety of instances thatmay indicate unlikeliness to pay. When such events occur, the Group carefully considers whether the event should result intreating the customer as defaulted and therefore assessed as Stage 3 for ECL calculations or whether Stage 2 is appropriate.Such events include:
· significant financial difficulty of the counterparty or the borrower· a breach of contract, such as a default or past due event· it is becoming probable that the counterparty or the borrower will enter bankruptcy or other financial reorganisation
It is the Group’s policy to consider financial assets as ‘cured’ and therefore re-classified out of Stage 3 when none of thedefault criteria have been present at the end of the reporting period. The decision whether to classify an asset as Stage 2 orStage 1 once cured depends on the updated credit grade, at the time of the cure, and whether this indicates there has been asignificant increase in credit risk compared to initial recognition.

MIK HOLDING JSC AND ITS SUBSIDIARIES
Notes to the Consolidated Financial Statements – 31 December 2019
53
28. Risk management (cont’d.)
28.2. Credit risk (cont’d.)
The Group’s internal rating and PD estimation process
The Group’s Risk Management Department operates its internal rating models. For treasury assets, debt instruments and themortgage loan receivables with recourse Risk Management Department analyses publicly available information such asfinancial information and other external data, e.g., the Moody’s Rating Agency ratings.
For the mortgage loan receivables without recourse, the Risk Management Department first runs an A-score model for itskey portfolios in which its customers are rated from 1 to 5 based on the borrower’s application information. The Group thenruns a B-score model which assigns a rating from 1 to 5 based on the borrower’s payment behaviour. The models incorporateboth qualitative and quantitative. PDs are then adjusted for IFRS 9 ECL calculations to incorporate forward lookinginformation and the IFRS 9 Stage classification of the exposure.
Exposure at default
The exposure at default (EAD) represents the gross carrying amount of the financial instruments subject to the impairmentcalculation, addressing both the client’s ability to increase its exposure while approaching default and potential earlyrepayments too.
To calculate the EAD for a Stage 1 loan, the Group assesses the possible default events within 12 months for the calculationof the 12mECL. However, if a Stage 1 loan that is expected to default in the 12 months from the balance sheet date and isalso expected to cure and subsequently default again, then all linked default events are taken into account. For Stage 2 andStage 3, the exposure at default is considered for events over the lifetime of the instruments.
The Group determines EADs by modelling the range of possible exposure outcomes at various points in time, correspondingthe multiple scenarios. The IFRS 9 PDs are then assigned to each economic scenario based on the outcome of Group’smodels.
Loss given default
In order to calculate the LGD ratio for treasury assets and debt instruments the Group uses Thomson Reuters study wherethey determined the average LGD rate for global corporates based on their credit rating.
The Group uses the same LGD for both residential mortgage loan receivables with recourse and without recourse since bothportfolios consist of identical loans. The Group considered the recoverability rate of defaulted loans from foreclosed collateralproperty and eventual sale of the property. The Group initially calculated the present value of future cash inflows for eachcategory of loans – to be settled in court, to be settled outside court, closed in court, closed outside court – and calculated theLGD rate for each category and the weighted-average LGD ratio for all historically defaulted loans. These LGD rates takeinto account the expected EAD in comparison to the amount expected to be recovered or realised from any collateral held.
Further recent data and forward-looking economic scenarios are used in order to determine the IFRS 9 LGD rate. Whenassessing forward-looking information, the expectation is based on multiple scenarios. Examples of key inputs includeMongolian housing price index, GDP, etc. Under IFRS 9, LGD rates are estimated for the Stage 1, Stage 2 and Stage 3 assetclasses. The inputs for these LGD rates are estimated and, where possible, calibrated through back testing against recentrecoveries.
Credit conversion factor
The Group only purchases mortgage pools from the commercial banks, hence there is no consideration of the creditconversion factor.
Significant increase in credit risk (“SICR”)
The Group continuously monitors all assets subject to ECLs. In order to determine whether an instrument or a portfolio ofinstruments is subject to 12mECL or LTECL, the Group assesses whether there has been a significant increase in credit risksince initial recognition.
The Group considers there is a SICR for the treasury assets and debt instruments when the PD rate of the asset as of thereporting date increased more than 15% compared to the PD rate when the asset was initially recognised or there is clearindication that the counterparty is facing financial difficulties. For mortgage pool receivables with recourse, the Groupconsiders there is a SICR when the PD rate of the assets as of the reporting date increased more than 15% compared to thePD rate when the asset was initially recognised or over 30 days past due.
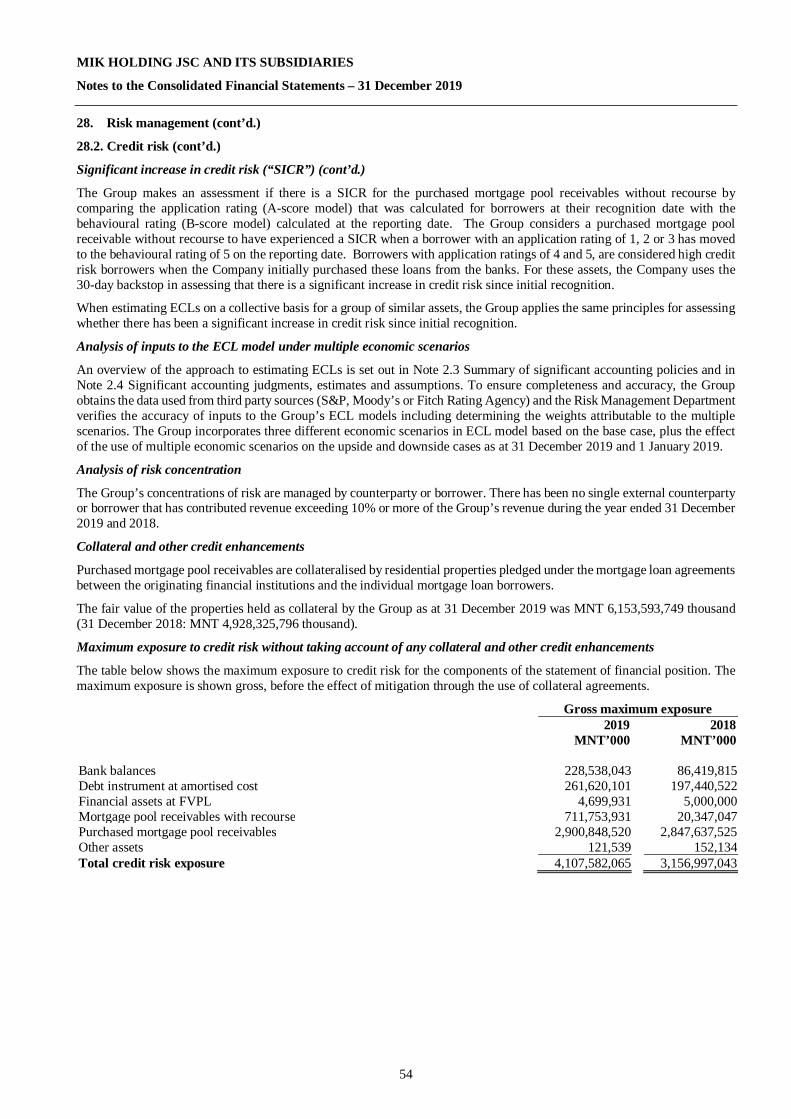
MIK HOLDING JSC AND ITS SUBSIDIARIES
Notes to the Consolidated Financial Statements – 31 December 2019
54
28. Risk management (cont’d.)
28.2. Credit risk (cont’d.)
Significant increase in credit risk (“SICR”) (cont’d.)
The Group makes an assessment if there is a SICR for the purchased mortgage pool receivables without recourse bycomparing the application rating (A-score model) that was calculated for borrowers at their recognition date with thebehavioural rating (B-score model) calculated at the reporting date. The Group considers a purchased mortgage poolreceivable without recourse to have experienced a SICR when a borrower with an application rating of 1, 2 or 3 has movedto the behavioural rating of 5 on the reporting date. Borrowers with application ratings of 4 and 5, are considered high creditrisk borrowers when the Company initially purchased these loans from the banks. For these assets, the Company uses the30-day backstop in assessing that there is a significant increase in credit risk since initial recognition.
When estimating ECLs on a collective basis for a group of similar assets, the Group applies the same principles for assessingwhether there has been a significant increase in credit risk since initial recognition.
Analysis of inputs to the ECL model under multiple economic scenarios
An overview of the approach to estimating ECLs is set out in Note 2.3 Summary of significant accounting policies and inNote 2.4 Significant accounting judgments, estimates and assumptions. To ensure completeness and accuracy, the Groupobtains the data used from third party sources (S&P, Moody’s or Fitch Rating Agency) and the Risk Management Departmentverifies the accuracy of inputs to the Group’s ECL models including determining the weights attributable to the multiplescenarios. The Group incorporates three different economic scenarios in ECL model based on the base case, plus the effectof the use of multiple economic scenarios on the upside and downside cases as at 31 December 2019 and 1 January 2019.
Analysis of risk concentration
The Group’s concentrations of risk are managed by counterparty or borrower. There has been no single external counterpartyor borrower that has contributed revenue exceeding 10% or more of the Group’s revenue during the year ended 31 December2019 and 2018.
Collateral and other credit enhancements
Purchased mortgage pool receivables are collateralised by residential properties pledged under the mortgage loan agreementsbetween the originating financial institutions and the individual mortgage loan borrowers.
The fair value of the properties held as collateral by the Group as at 31 December 2019 was MNT 6,153,593,749 thousand(31 December 2018: MNT 4,928,325,796 thousand).
Maximum exposure to credit risk without taking account of any collateral and other credit enhancements
The table below shows the maximum exposure to credit risk for the components of the statement of financial position. Themaximum exposure is shown gross, before the effect of mitigation through the use of collateral agreements.
Gross maximum exposure2019 2018
MNT’000 MNT’000
Bank balances 228,538,043 86,419,815Debt instrument at amortised cost 261,620,101 197,440,522Financial assets at FVPL 4,699,931 5,000,000Mortgage pool receivables with recourse 711,753,931 20,347,047Purchased mortgage pool receivables 2,900,848,520 2,847,637,525Other assets 121,539 152,134Total credit risk exposure 4,107,582,065 3,156,997,043
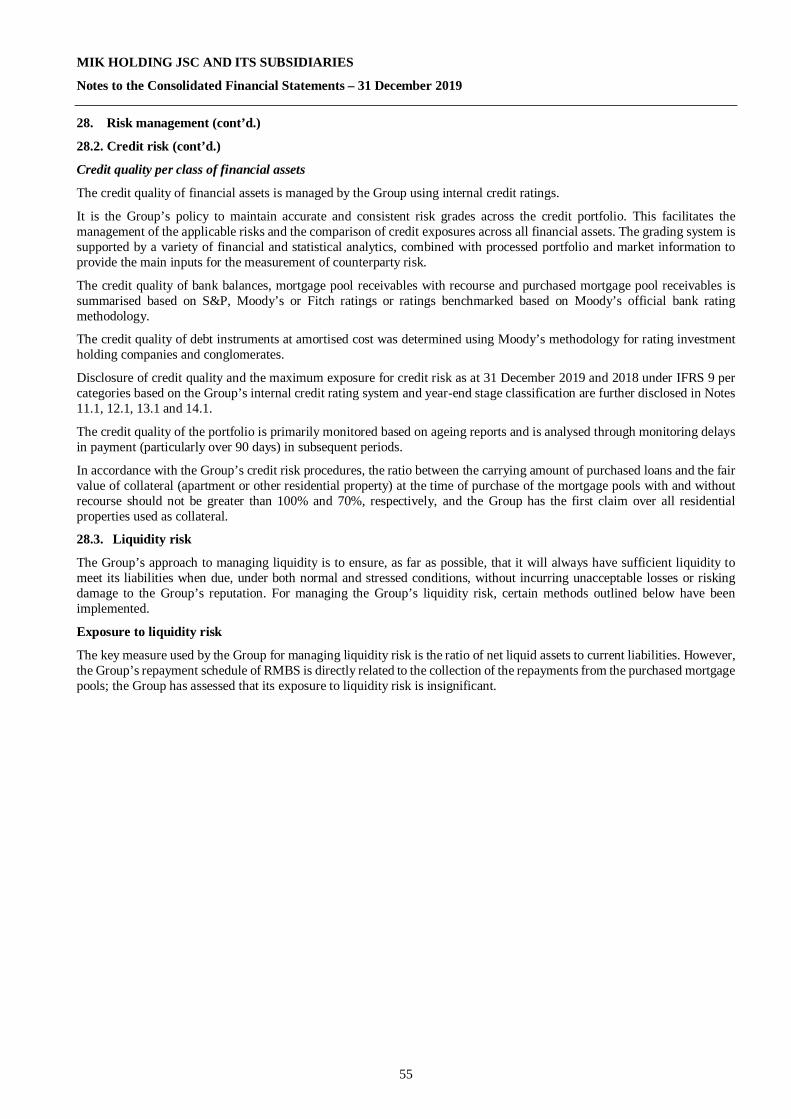
MIK HOLDING JSC AND ITS SUBSIDIARIES
Notes to the Consolidated Financial Statements – 31 December 2019
55
28. Risk management (cont’d.)
28.2. Credit risk (cont’d.)
Credit quality per class of financial assets
The credit quality of financial assets is managed by the Group using internal credit ratings.
It is the Group’s policy to maintain accurate and consistent risk grades across the credit portfolio. This facilitates themanagement of the applicable risks and the comparison of credit exposures across all financial assets. The grading system issupported by a variety of financial and statistical analytics, combined with processed portfolio and market information toprovide the main inputs for the measurement of counterparty risk.
The credit quality of bank balances, mortgage pool receivables with recourse and purchased mortgage pool receivables issummarised based on S&P, Moody’s or Fitch ratings or ratings benchmarked based on Moody’s official bank ratingmethodology.
The credit quality of debt instruments at amortised cost was determined using Moody’s methodology for rating investmentholding companies and conglomerates.
Disclosure of credit quality and the maximum exposure for credit risk as at 31 December 2019 and 2018 under IFRS 9 percategories based on the Group’s internal credit rating system and year-end stage classification are further disclosed in Notes11.1, 12.1, 13.1 and 14.1.
The credit quality of the portfolio is primarily monitored based on ageing reports and is analysed through monitoring delaysin payment (particularly over 90 days) in subsequent periods.
In accordance with the Group’s credit risk procedures, the ratio between the carrying amount of purchased loans and the fairvalue of collateral (apartment or other residential property) at the time of purchase of the mortgage pools with and withoutrecourse should not be greater than 100% and 70%, respectively, and the Group has the first claim over all residentialproperties used as collateral.
28.3. Liquidity risk
The Group’s approach to managing liquidity is to ensure, as far as possible, that it will always have sufficient liquidity tomeet its liabilities when due, under both normal and stressed conditions, without incurring unacceptable losses or riskingdamage to the Group’s reputation. For managing the Group’s liquidity risk, certain methods outlined below have beenimplemented.
Exposure to liquidity risk
The key measure used by the Group for managing liquidity risk is the ratio of net liquid assets to current liabilities. However,the Group’s repayment schedule of RMBS is directly related to the collection of the repayments from the purchased mortgagepools; the Group has assessed that its exposure to liquidity risk is insignificant.
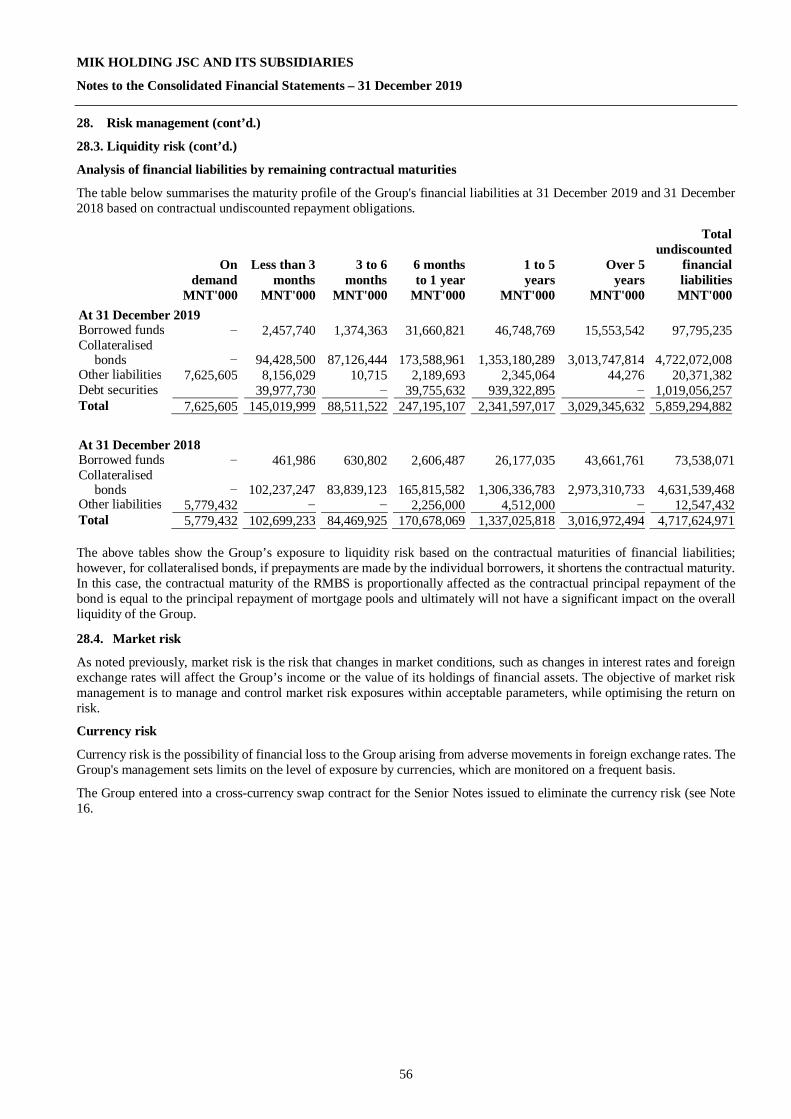
MIK HOLDING JSC AND ITS SUBSIDIARIES
Notes to the Consolidated Financial Statements – 31 December 2019
56
28. Risk management (cont’d.)
28.3. Liquidity risk (cont’d.)
Analysis of financial liabilities by remaining contractual maturities
The table below summarises the maturity profile of the Group's financial liabilities at 31 December 2019 and 31 December2018 based on contractual undiscounted repayment obligations.
The above tables show the Group’s exposure to liquidity risk based on the contractual maturities of financial liabilities;however, for collateralised bonds, if prepayments are made by the individual borrowers, it shortens the contractual maturity.In this case, the contractual maturity of the RMBS is proportionally affected as the contractual principal repayment of thebond is equal to the principal repayment of mortgage pools and ultimately will not have a significant impact on the overallliquidity of the Group.
28.4. Market risk
As noted previously, market risk is the risk that changes in market conditions, such as changes in interest rates and foreignexchange rates will affect the Group’s income or the value of its holdings of financial assets. The objective of market riskmanagement is to manage and control market risk exposures within acceptable parameters, while optimising the return onrisk.
Currency risk
Currency risk is the possibility of financial loss to the Group arising from adverse movements in foreign exchange rates. TheGroup's management sets limits on the level of exposure by currencies, which are monitored on a frequent basis.
The Group entered into a cross-currency swap contract for the Senior Notes issued to eliminate the currency risk (see Note16.
Ondemand
Less than 3months
3 to 6months
6 monthsto 1 year
1 to 5years
Over 5years
Totalundiscounted
financial liabilities
MNT'000 MNT'000 MNT'000 MNT'000 MNT'000 MNT'000 MNT'000At 31 December 2019Borrowed funds − 2,457,740 1,374,363 31,660,821 46,748,769 15,553,542 97,795,235Collateralised
bonds − 94,428,500 87,126,444 173,588,961 1,353,180,289 3,013,747,814 4,722,072,008Other liabilities 7,625,605 8,156,029 10,715 2,189,693 2,345,064 44,276 20,371,382Debt securities 39,977,730 − 39,755,632 939,322,895 − 1,019,056,257Total 7,625,605 145,019,999 88,511,522 247,195,107 2,341,597,017 3,029,345,632 5,859,294,882
At 31 December 2018Borrowed funds − 461,986 630,802 2,606,487 26,177,035 43,661,761 73,538,071Collateralised
bonds − 102,237,247 83,839,123 165,815,582 1,306,336,783 2,973,310,733 4,631,539,468Other liabilities 5,779,432 − − 2,256,000 4,512,000 − 12,547,432Total 5,779,432 102,699,233 84,469,925 170,678,069 1,337,025,818 3,016,972,494 4,717,624,971

MIK HOLDING JSC AND ITS SUBSIDIARIES
Notes to the Consolidated Financial Statements – 31 December 2019
57
28. Risk management (cont’d.)
28.4. Market risk (cont’d.)
The table below summarizes the Group's exposure to foreign exchange risk as at 31 December 2019 and 2018. Included inthe table are the Group’s financial assets and liabilities at carrying amounts, categorized by currencies.
Financial assets and financial 2019 2018liabilities by currency USD EUR Total USD EUR Total
MNT'000 MNT'000 MNT'000 MNT'000 MNT'000 MNT'000AssetsCash and balances 25,545,036 535,238 26,080,274 1,557,988 529,807 2,087,795Mortgage pool receivables with
recourse 30,719,606 − 30,719,606 − − −56,264,642 535,238 56,799,880 1,557,988 529,807 2,087,795
LiabilitiesDebt securities 853,814,972 − 853,814,97
2− − −
Other liabilities 289,352 − 289,352 43,608 − 43,608854,104,324 − 854,104,32 43,608 − 43,608
Derivatives (notional amount) 777,151,290 − 777,151,290
− − −
Interest rate risk
Given that interest rates of the financial assets and liabilities are fixed due to the nature of the Group’s operation, the Group’sexposure to interest rate risk is limited.
As at 31 December 2019 and 31 December 2018, the Group’s interest-bearing assets (bank balances, debt instruments atamortised cost, mortgage pool receivables with recourse and purchased mortgage pool receivables without recourse) andinterest-bearing liabilities (borrowed funds, collateralised bonds and senior notes) have fixed interest rates and are not subjectto repricing until they mature.
The table presents the aggregated amounts of the Group’s interest-bearing financial assets and liabilities at carrying amounts,categorised by their maturity dates.
28.5. Operational risk
Operational risk is the risk of loss arising from systems failure, human errors, fraud or external events. When controls fail toperform, operational risks can cause damage to reputation, have legal or regulatory implications, and lead to financial loss.The Group cannot expect to eliminate all operational risk, but through a dual control framework, segregation of dutiesbetween front-office and back-office functions, controlled access to systems, authorisation and reconciliation procedures,staff education and assessment processes, including the use of internal audit, the Group seeks to manage operational risk.
Less than 3 3 to 6 6 months 1 to 5 Over 5months months to 1 year years years Total
MNT'000 MNT'000 MNT'000 MNT'000 MNT'000 MNT'000At 31 December 2019Interest-bearing financial assets 257,016,311 176,131,249 153,306,823 1,525,192,077 1,972,930,847 4,084,577,307Interest-bearing financial
liabilities 91,403,493 42,772,809 117,057,247 1,592,804,751 2,019,258,410 3,863,296,710Net interest sensitivity gap 165,612,818 133,358,440 36,249,576 (67,612,674) (46,327,563) 221,280,597
At 31 December 2018Interest-bearing financial assets 141,534,764 40,379,063 85,084,621 762,554,811 2,113,302,891 3,142,856,150Interest-bearing financial
liabilities 78,002,141 40,771,071 82,695,776 720,635,237 2,026,470,052 2,948,574,277Net interest sensitivity gap 63,532,623 (392,008) 2,388,845 41,919,574 86,832,839 194,281,873
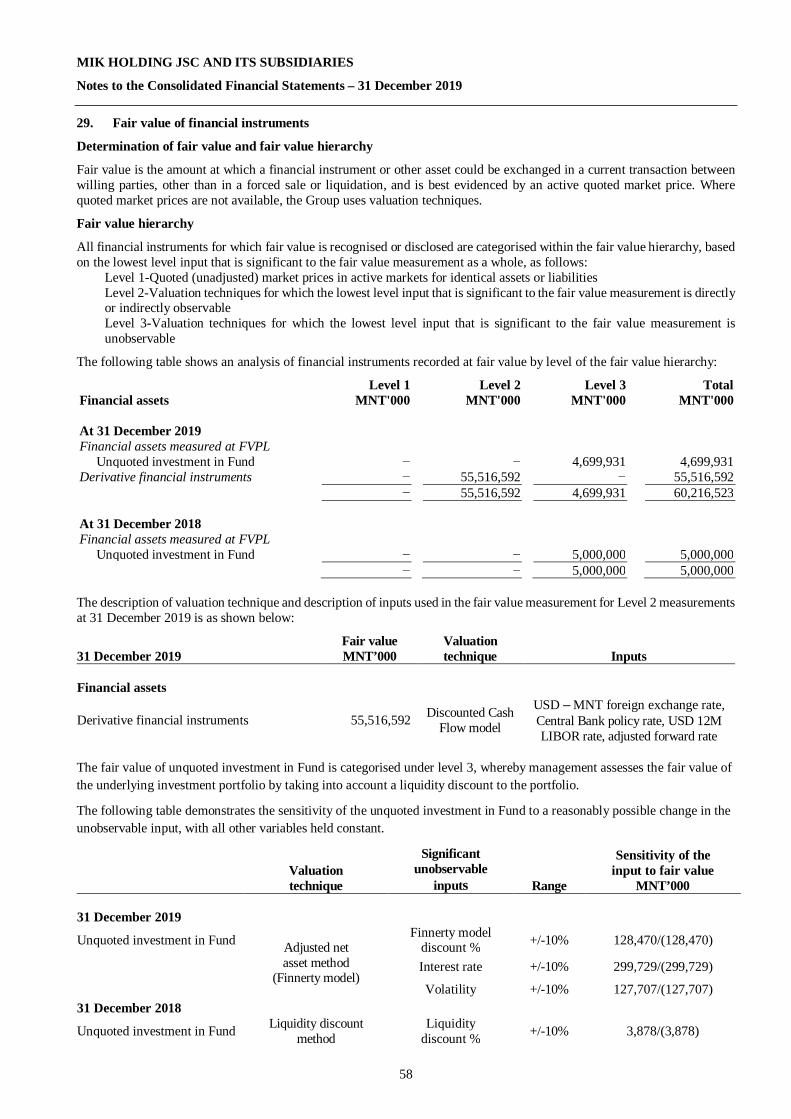
MIK HOLDING JSC AND ITS SUBSIDIARIES
Notes to the Consolidated Financial Statements – 31 December 2019
58
29. Fair value of financial instruments
Determination of fair value and fair value hierarchy
Fair value is the amount at which a financial instrument or other asset could be exchanged in a current transaction betweenwilling parties, other than in a forced sale or liquidation, and is best evidenced by an active quoted market price. Wherequoted market prices are not available, the Group uses valuation techniques.
Fair value hierarchy
All financial instruments for which fair value is recognised or disclosed are categorised within the fair value hierarchy, basedon the lowest level input that is significant to the fair value measurement as a whole, as follows:
Level 1-Quoted (unadjusted) market prices in active markets for identical assets or liabilitiesLevel 2-Valuation techniques for which the lowest level input that is significant to the fair value measurement is directlyor indirectly observableLevel 3-Valuation techniques for which the lowest level input that is significant to the fair value measurement isunobservable
The following table shows an analysis of financial instruments recorded at fair value by level of the fair value hierarchy:
Level 1 Level 2 Level 3 TotalFinancial assets MNT'000 MNT'000 MNT'000 MNT'000
At 31 December 2019Financial assets measured at FVPL
Unquoted investment in Fund − − 4,699,931 4,699,931Derivative financial instruments − 55,516,592 − 55,516,592
− 55,516,592 4,699,931 60,216,523
At 31 December 2018Financial assets measured at FVPL
Unquoted investment in Fund − − 5,000,000 5,000,000− − 5,000,000 5,000,000
The description of valuation technique and description of inputs used in the fair value measurement for Level 2 measurementsat 31 December 2019 is as shown below:
31 December 2019Fair valueMNT’000
Valuationtechnique Inputs
Financial assets
Derivative financial instruments 55,516,592 Discounted CashFlow model
USD – MNT foreign exchange rate,Central Bank policy rate, USD 12MLIBOR rate, adjusted forward rate
The fair value of unquoted investment in Fund is categorised under level 3, whereby management assesses the fair value ofthe underlying investment portfolio by taking into account a liquidity discount to the portfolio.
The following table demonstrates the sensitivity of the unquoted investment in Fund to a reasonably possible change in theunobservable input, with all other variables held constant.
Valuationtechnique
Significantunobservable
inputs Range
Sensitivity of theinput to fair value
MNT’000
31 December 2019
Unquoted investment in Fund Adjusted netasset method
(Finnerty model)
Finnerty modeldiscount % +/-10% 128,470/(128,470)
Interest rate +/-10% 299,729/(299,729)
Volatility +/-10% 127,707/(127,707)31 December 2018
Unquoted investment in Fund Liquidity discountmethod
Liquiditydiscount % +/-10% 3,878/(3,878)

MIK HOLDING JSC AND ITS SUBSIDIARIES
Notes to the Consolidated Financial Statements – 31 December 2019
59
29. Fair value of financial instruments (cont’d.)
Transfers between level 1, 2 and 3
There were no transfers between level 1, 2 and 3 of the assets and liabilities which are recorded at fair value.
Financial instruments for which fair value approximates carrying value
For financial assets and financial liabilities that are liquid or have short term maturity (less than one year), it is assumed thatthe carrying amounts approximate to their fair value. This assumption is also applied to bank balances. Based on fair valueassessments performed by the management, the estimated fair values of instruments with maturity more than one yearapproximate their carrying amounts as shown in the statement of financial position. This is due principally to the fact thatthe current market rates offered for similar deposit products do not differ significantly from market rates at inception.
Fixed rate financial instruments
The carrying value of the Group’s fixed rate financial assets and liabilities approximates the fair value by comparing marketinterest rates when they were first recognised with current market rates offered for similar financial instruments available inMongolia.
30. Capital management
The Group’s objectives when managing capital are to safeguard the Group’s ability to continue as a going concern in orderto provide returns for shareholders and fulfil its obligations to the investors of the RMBS and the Senior Note holders byeffectively managing the subsidiaries. In order to maintain or adjust the capital structure, the Group may issue new shares,obtain borrowings, invest in permitted investments or issue bonds.
Included in retained earnings as at 31 December 2019 are restricted retained earnings of MNT 272,718,090 thousand (31December 2018: MNT 207,827,030 thousand) that are attributable to the Group’s SPCs and are restricted from distributionuntil the liquidation of the respective SPCs in accordance with the Articles of Charter of each SPC and FRC regulation.
The Group was not subject to any externally imposed capital requirements throughout 2019 and 2018.
31. Subsequent events
The expected credit loss as of 31 December 2019 was estimated based on a range of forecast economic conditions as at thatdate. Since early January 2020, the coronavirus outbreak has spread across nearby countries and beyond, causing disruptionto business and economic activity. The impact on GDP and other key economic indicators will be considered whendetermining the severity and likelihood of downside economic scenarios that will be used to estimate ECL under IFRS 9 in2020.
Management is not aware of other events that occurred after the end of the reporting period, which would have any impacton these consolidated financial statements.