Embed Size (px)
DESCRIPTION
In December 2010, the Mayor’s PILOT Task Force issued its final report recommending changes to Boston’s long-standing payment in lieu of taxes (PILOT) program. This article examines the results for the first three fiscal years under the revised PILOT program. This is my third article covering the establishment of the Task Force and its recommendations and the ensuing implementation by the City of Boston Assessing Department. A PILOT agreement is one in which an organization that is otherwise exempt from property taxation under local and state law, agrees to voluntarily make payments in lieu of taxes to a municipality. The municipality typically justifies its need for the PILOT as compensation for foregone revenue when previously taxable property is purchased by a nonprofit that takes it off the tax rolls, as well as for providing basic public services such as police and fire protection.
Citation preview
1
A Continuing Look at Boston’s Revised Payment in Lieu of Taxes (PILOT)
Program: Updated Version 2.0
ERIC A. LUSTIG∗
They were all in the room, and they all agreed to this. . . . You made commitments; you gave your word. Is your word any good?1
[E]veryone understood these were going to be voluntary payments . . . . The City [of Boston] recognizes that these organizations make contributions far above what the formula might recommend in terms of community benefits—scholarships to Boston residents, partnerships with the schools and community centers, partnerships regarding athletic fields and facilities and arts facilities.2
INTRODUCTION
n December 2010, the Mayor’s PILOT Task Force issued its final report recommending changes to Boston’s long-standing payment in lieu of taxes (PILOT) program.3 This article examines the results for the first
∗ Professor of Law and Director of Center for Business Law, New England Law | Boston. The author thanks Barry Stearns for his continuing research assistance. The author also thanks Adam Langely and Betsy Schmidt for their comments.
1 Matt Rocheleau, Many Colleges Not Paying Boston in Full for Services, BOSTON GLOBE (Oct. 27, 2014), https://www.bostonglobe.com/metro/2014/10/26/biggest-colleges-coming-short- voluntary-payments-city/lV2JcTaoNsmbnZGNx7VOYI/story.html (quoting City Council member Stephen Murphy who also was a member of the Boston PILOT Task Force).
2 Id. (quoting Richard Doherty, president of the Association of Independent Colleges and Universities in Massachusetts).
3 CITY OF BOSTON, MAYOR’S PILOT TASK FORCE: FINAL REPORT AND RECOMMENDATIONS (2010), available at http://www.cityofboston.gov/images_documents/PILOT_%20Task%20 Force%20Final%20Report_WEB%20_tcm3-21904.pdf. For an analysis of the Task Force’s work and recommendations, see Eric A. Lustig, The Boston City PILOT Task Force: An Emerging Best Practice, 44 NEW ENG. L. REV. 601, 601 (2010) [hereinafter Lustig, The Boston City PILOT Task Force].
I
2 New England Law Rev i ew On Remand Vol. 50 | 1
three fiscal years under the revised PILOT program. This is my third article covering the establishment of the Task Force and its recommendations and the ensuing implementation by the City of Boston Assessing Department.4
A PILOT agreement is one in which an organization that is otherwise exempt from property taxation under local and state law,5 agrees to voluntarily make payments in lieu of taxes to a municipality.6 The municipality typically justifies its need for the PILOT as compensation for foregone revenue when previously taxable property is purchased by a nonprofit that takes it off the tax rolls, as well as for providing basic public services such as police and fire protection.7
Among the PILOT Task Force’s goals were two specific concerns with Boston’s long-standing program. The first concern was to increase the overall contribution by Boston’s nonprofit community. 8 The second was to improve the fairness of contributions among the Boston nonprofits.9
The key recommendations of the PILOT Task Force were the following: • The PILOT program should remain a voluntary program. The
Task Force considered and rejected the alternative of seeking a legislative change to the property tax exemption.10
• The PILOT program should be expanded from the existing base of largely educational and medical institutions to also include secondary schools, cultural institutions, and other significant nonprofits.11
• Full participation in the PILOT program should be expected from those institutions with a property above a threshold assessed value of $15 million.12
The Task Force recommended the following methodology for determining and implementing the revised PILOT program:
4 See generally Eric A. Lustig, The Boston PILOT Task Force One Year Later: Proposed Change
and Its Aftermath, 46 NEW ENG. L. REV. ON REMAND 14 (2011) [hereinafter Lustig, The Boston PILOT Task Force One Year Later]; Lustig, The Boston City PILOT Task Force, supra note 3 (discussing Boston’s PILOT program since its inception).
5 Lustig, The Boston PILOT Task Force One Year Later, supra note 4, at 14–15. 6 Id. 7 See Ronald W. Rakow, Payments in Lieu of Taxes: The Boston Experience, LAND LINES 5 (Jan.
2013), http://www.lincolninst.edu/pubs/2186_Payments-in-Lieu-of-Taxes--The-Boston- Experience.
8 CITY OF BOSTON, supra note 3, at 9. 9 See id. 10 Id. at 11. 11 See id. 12 Id.
2015 Boston ’s Rev i s ed PILOT Program 3
• The requested PILOT would be based on 25% of the tax that would be payable if the nonprofit were fully taxable,13 with the first $15 million of value exempt from this computation.14
• A credit of up to 50% of the requested PILOT should be permitted for community benefits provided by the nonprofit.15
• The full requested PILOT contribution would be phased in over a transition period of at least five years.16
The Boston Assessing Department began implementing the revised PILOT program by advising the forty-eight institutions falling within the program’s parameters (i.e., with assessed property in excess of $15 million) of their proposed PILOTs and inviting them to discuss the requested PILOTs.17 Formal notices for PILOTs due were then sent out semi-annually.18
I. Analysis of Results Through Third Year of Implementation
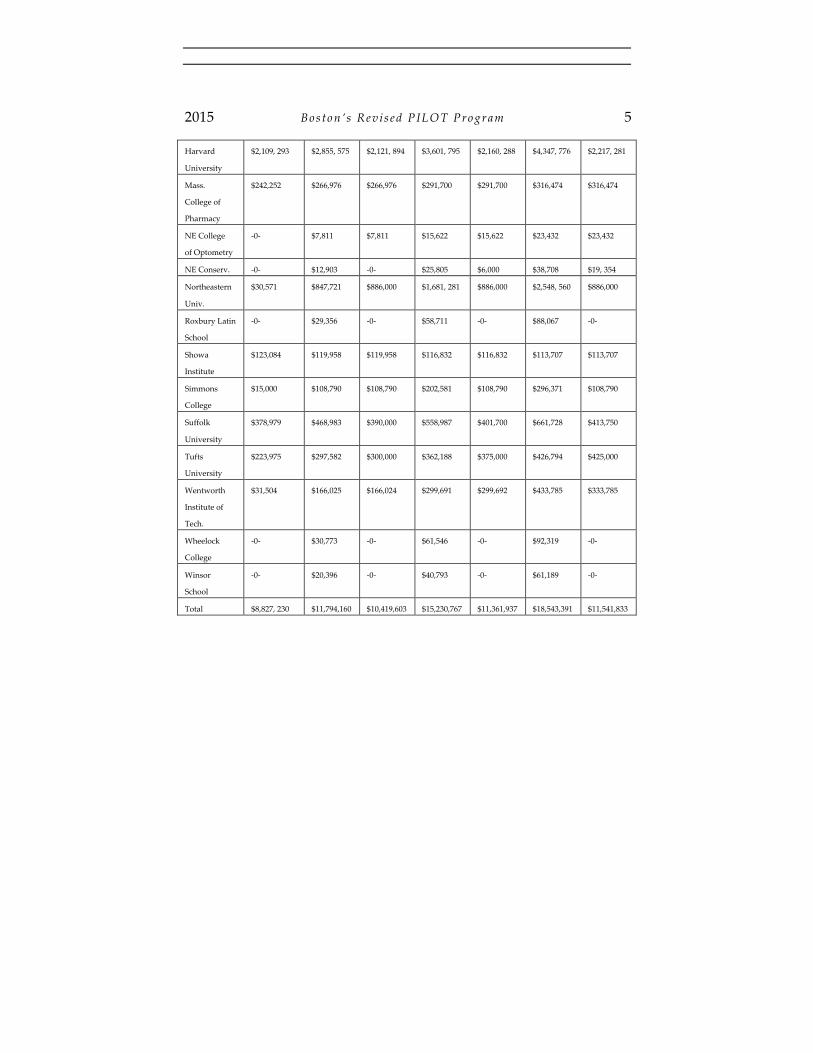
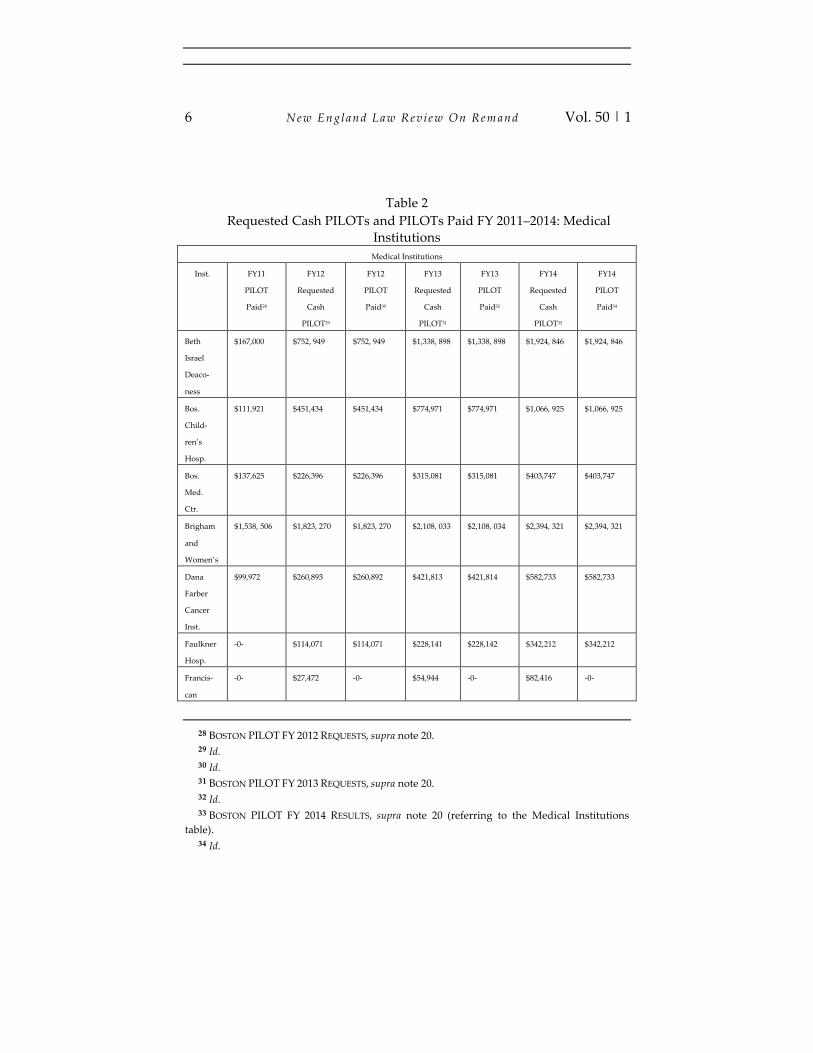
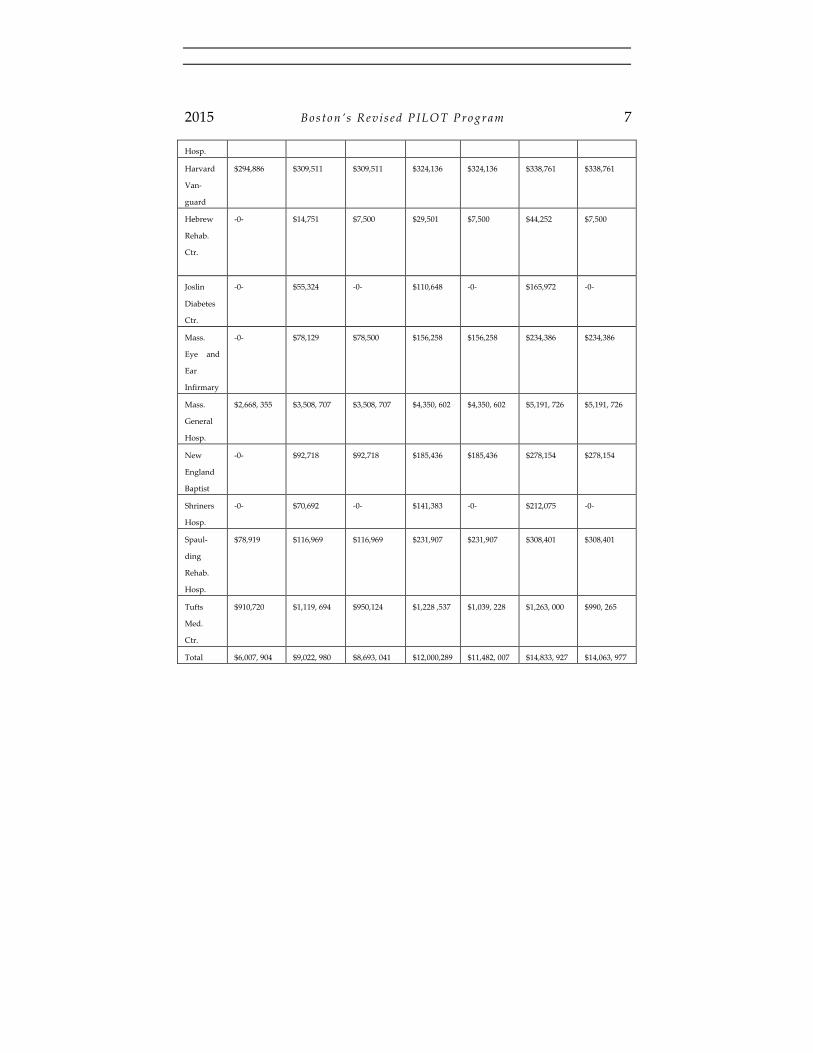
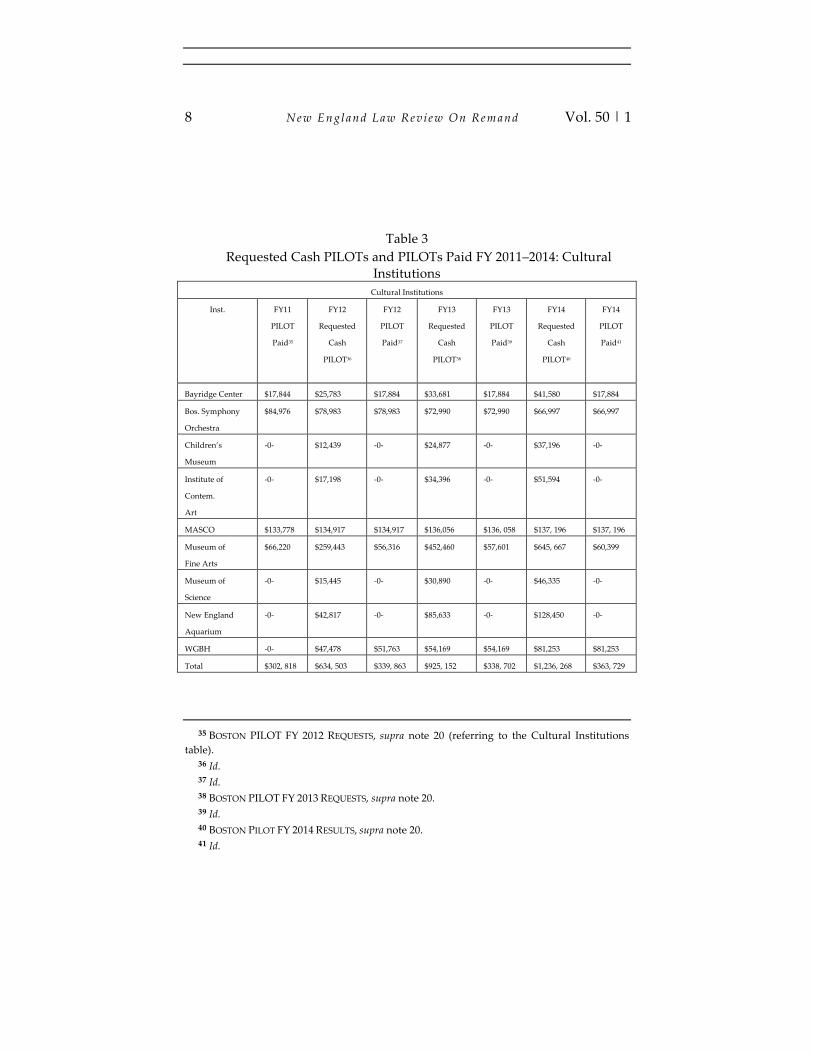
Fiscal year 2012 was the first year in which the revised program was implemented. Fiscal years 2012, 2013, and 2014 also represented the first three years of the planned five-year transition or ramp-up.19 The following charts compile selected data reported on the Boston City Assessor’s website. The analysis focuses on the requested contributions net of the credits for community benefit and other taxes paid.20 Tables 1, 2, and 3 set forth the data on contributions requested and paid for the three sectors (educational, medical, and cultural) over the first three years of implementation (fiscal years 2012, 2013, and 2014) with fiscal year 2011
13 See id. 14 CITY OF BOSTON, supra note 3, at 11. 15 Id. at 11–12. 16 Id. at 12. 17 Lustig, The Boston PILOT Task Force One Year Later, supra note 4, at 17. 18 Id. 19 See supra note 17 and accompanying text. 20 Virtually all institutions were allowed the full community benefit credit of up to 50% of
the requested PILOT contribution. See CITY OF BOSTON ASSESSING DEP’T, PILOT REQUESTS FOR
FY 2012 (2012), available at http://www.cityofboston.gov/images_documents/FY12%20Second %20Half%20PILOT%20Status%20Report%20for%20Web_tcm3-33007.pdf [hereinafter BOSTON PILOT FY 2012 REQUESTS]; CITY OF BOSTON ASSESSING DEP’T, PILOT REQUESTS FOR FY 2013 (2013), available at http://www.cityofboston.gov/images_documents/FY13%20Second%20Half %20PILOT%20Status%20Report%20for%20Web_tcm3-39568.pdf [hereinafter BOSTON PILOT FY 2013 REQUESTS]; CITY OF BOSTON ASSESSING DEP’T, FY 2014 PILOT RESULTS (2015), available at http://www.cityofboston.gov/images_documents/FY14%20Second%20Half%20PILOT% 20Status%20Report%20for%20Web%20-%20Updated%207-7-2015_tcm3-50146.pdf [hereinafter BOSTON PILOT FY 2014 RESULTS].
4 New England Law Rev i ew On Remand Vol. 50 | 1
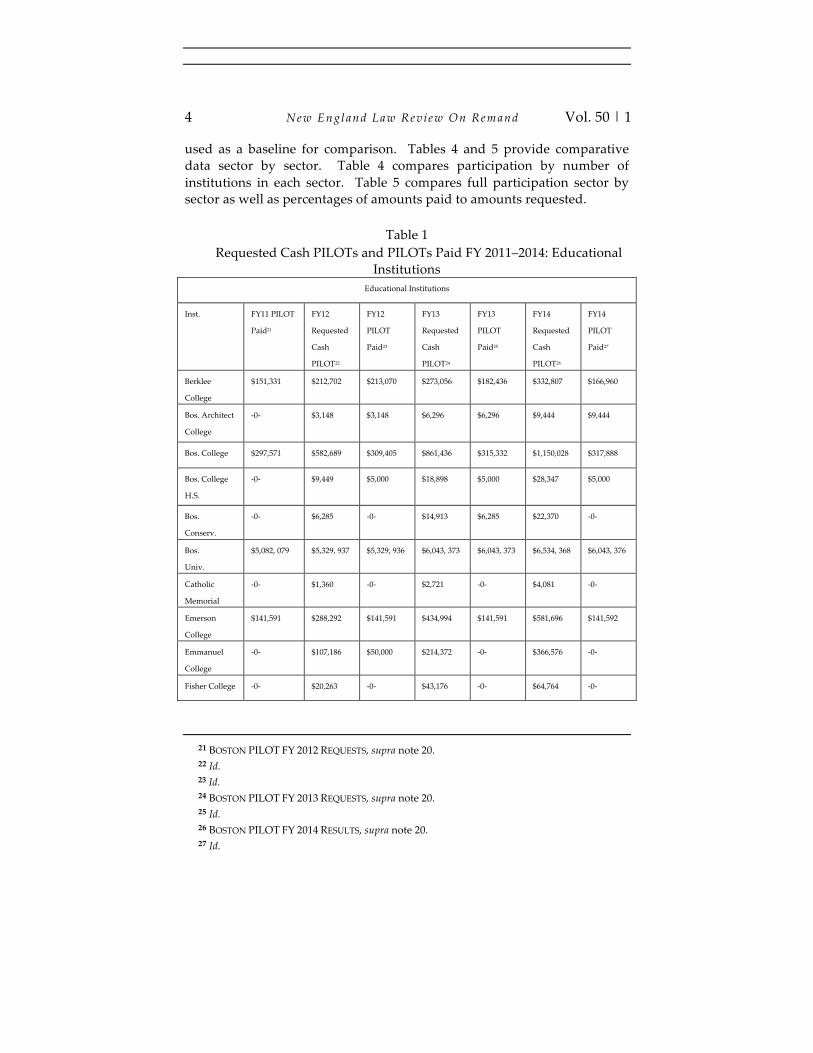
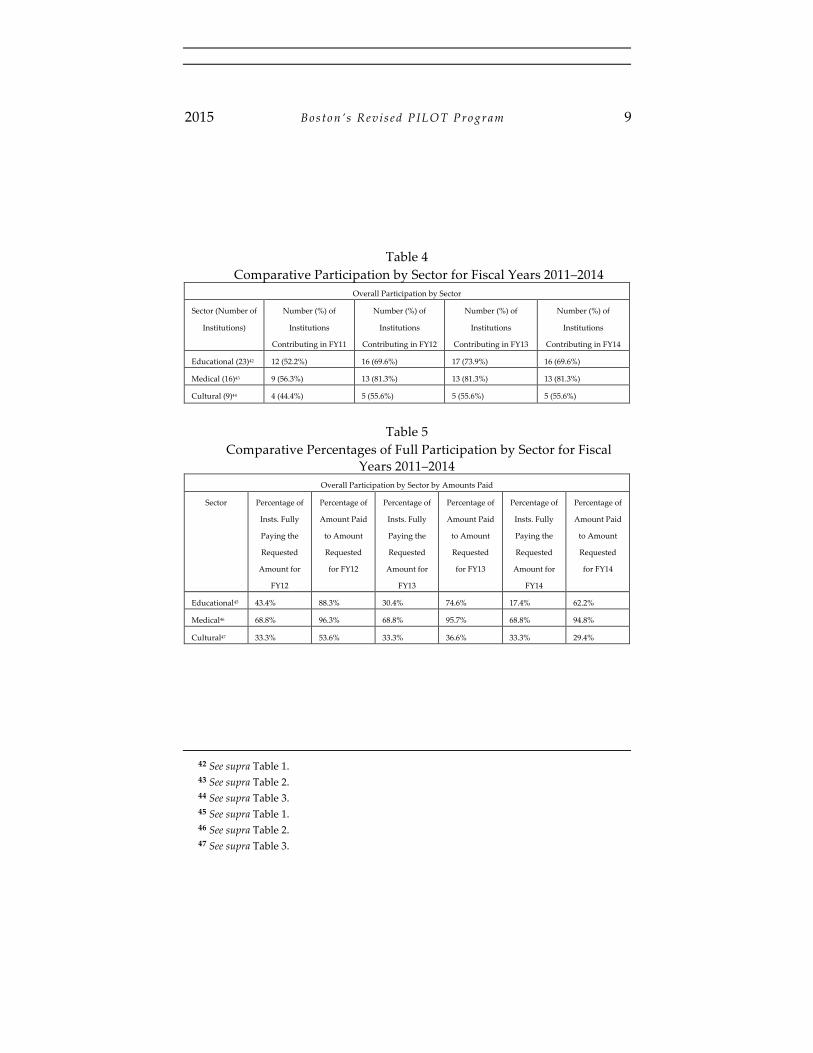
used as a baseline for comparison. Tables 4 and 5 provide comparative data sector by sector. Table 4 compares participation by number of institutions in each sector. Table 5 compares full participation sector by sector as well as percentages of amounts paid to amounts requested.
Table 1
Requested Cash PILOTs and PILOTs Paid FY 2011–2014: Educational Institutions
Educational Institutions
Inst. FY11 PILOT
Paid21
FY12
Requested
Cash
PILOT22
FY12
PILOT
Paid23
FY13
Requested
Cash
PILOT24
FY13
PILOT
Paid25
FY14
Requested
Cash
PILOT26
FY14
PILOT
Paid27
Berklee
College
$151,331 $212,702 $213,070 $273,056 $182,436 $332,807 $166,960
Bos. Architect
College
-0- $3,148 $3,148 $6,296 $6,296 $9,444 $9,444
Bos. College $297,571 $582,689 $309,405 $861,436 $315,332 $1,150,028 $317,888
Bos. College
H.S.
-0- $9,449 $5,000 $18,898 $5,000 $28,347 $5,000
Bos.
Conserv.
-0- $6,285 -0- $14,913 $6,285 $22,370 -0-
Bos.
Univ.
$5,082, 079 $5,329, 937 $5,329, 936 $6,043, 373 $6,043, 373 $6,534, 368 $6,043, 376
Catholic
Memorial
-0- $1,360 -0- $2,721 -0- $4,081 -0-
Emerson
College
$141,591 $288,292 $141,591 $434,994 $141,591 $581,696 $141,592
Emmanuel
College
-0- $107,186 $50,000 $214,372 -0- $366,576 -0-
Fisher College -0- $20,263 -0- $43,176 -0- $64,764 -0-
21 BOSTON PILOT FY 2012 REQUESTS, supra note 20. 22 Id.
23 Id. 24 BOSTON PILOT FY 2013 REQUESTS, supra note 20. 25 Id. 26 BOSTON PILOT FY 2014 RESULTS, supra note 20. 27 Id.
2015 Boston ’s Rev i s ed PILOT Program 5
Harvard
University
$2,109, 293 $2,855, 575 $2,121, 894 $3,601, 795 $2,160, 288 $4,347, 776 $2,217, 281
Mass.
College of
Pharmacy
$242,252 $266,976 $266,976 $291,700 $291,700 $316,474 $316,474
NE College
of Optometry
-0- $7,811 $7,811 $15,622 $15,622 $23,432 $23,432
NE Conserv. -0- $12,903 -0- $25,805 $6,000 $38,708 $19, 354
Northeastern
Univ.
$30,571 $847,721 $886,000 $1,681, 281 $886,000 $2,548, 560 $886,000
Roxbury Latin
School
-0- $29,356 -0- $58,711 -0- $88,067 -0-
Showa
Institute
$123,084 $119,958 $119,958 $116,832 $116,832 $113,707 $113,707
Simmons
College
$15,000 $108,790 $108,790 $202,581 $108,790 $296,371 $108,790
Suffolk
University
$378,979 $468,983 $390,000 $558,987 $401,700 $661,728 $413,750
Tufts
University
$223,975 $297,582 $300,000 $362,188 $375,000 $426,794 $425,000
Wentworth
Institute of
Tech.
$31,504 $166,025 $166,024 $299,691 $299,692 $433,785 $333,785
Wheelock
College
-0- $30,773 -0- $61,546 -0- $92,319 -0-
Winsor
School
-0- $20,396 -0- $40,793 -0- $61,189 -0-
Total $8,827, 230 $11,794,160 $10,419,603 $15,230,767 $11,361,937 $18,543,391 $11,541,833
6 New England Law Rev i ew On Remand Vol. 50 | 1
Table 2 Requested Cash PILOTs and PILOTs Paid FY 2011–2014: Medical
Institutions Medical Institutions
Inst. FY11
PILOT
Paid28
FY12
Requested
Cash
PILOT29
FY12
PILOT
Paid30
FY13
Requested
Cash
PILOT31
FY13
PILOT
Paid32
FY14
Requested
Cash
PILOT33
FY14
PILOT
Paid34
Beth
Israel
Deaco-
ness
$167,000 $752, 949 $752, 949 $1,338, 898 $1,338, 898 $1,924, 846 $1,924, 846
Bos.
Child-
ren’s
Hosp.
$111,921 $451,434 $451,434 $774,971 $774,971 $1,066, 925 $1,066, 925
Bos.
Med.
Ctr.
$137,625 $226,396 $226,396 $315,081 $315,081 $403,747 $403,747
Brigham
and
Women’s
$1,538, 506 $1,823, 270 $1,823, 270 $2,108, 033 $2,108, 034 $2,394, 321 $2,394, 321
Dana
Farber
Cancer
Inst.
$99,972 $260,893 $260,892 $421,813 $421,814 $582,733 $582,733
Faulkner
Hosp.
-0- $114,071 $114,071 $228,141 $228,142 $342,212 $342,212
Francis-
can
-0- $27,472 -0- $54,944 -0- $82,416 -0-
28 BOSTON PILOT FY 2012 REQUESTS, supra note 20. 29 Id. 30 Id. 31 BOSTON PILOT FY 2013 REQUESTS, supra note 20. 32 Id. 33 BOSTON PILOT FY 2014 RESULTS, supra note 20 (referring to the Medical Institutions
table). 34 Id.
2015 Boston ’s Rev i s ed PILOT Program 7
Hosp.
Harvard
Van-
guard
$294,886 $309,511 $309,511 $324,136 $324,136 $338,761 $338,761
Hebrew
Rehab.
Ctr.
-0- $14,751 $7,500 $29,501 $7,500 $44,252 $7,500
Joslin
Diabetes
Ctr.
-0- $55,324 -0- $110,648 -0- $165,972 -0-
Mass.
Eye and
Ear
Infirmary
-0- $78,129 $78,500 $156,258 $156,258 $234,386 $234,386
Mass.
General
Hosp.
$2,668, 355 $3,508, 707 $3,508, 707 $4,350, 602 $4,350, 602 $5,191, 726 $5,191, 726
New
England
Baptist
-0- $92,718 $92,718 $185,436 $185,436 $278,154 $278,154
Shriners
Hosp.
-0- $70,692 -0- $141,383 -0- $212,075 -0-
Spaul-
ding
Rehab.
Hosp.
$78,919 $116,969 $116,969 $231,907 $231,907 $308,401 $308,401
Tufts
Med.
Ctr.
$910,720 $1,119, 694 $950,124 $1,228 ,537 $1,039, 228 $1,263, 000 $990, 265
Total $6,007, 904 $9,022, 980 $8,693, 041 $12,000,289 $11,482, 007 $14,833, 927 $14,063, 977
8 New England Law Rev i ew On Remand Vol. 50 | 1
Table 3 Requested Cash PILOTs and PILOTs Paid FY 2011–2014: Cultural
Institutions Cultural Institutions
Inst. FY11
PILOT
Paid35
FY12
Requested
Cash
PILOT36
FY12
PILOT
Paid37
FY13
Requested
Cash
PILOT38
FY13
PILOT
Paid39
FY14
Requested
Cash
PILOT40
FY14
PILOT
Paid41
Bayridge Center $17,844 $25,783 $17,884 $33,681 $17,884 $41,580 $17,884
Bos. Symphony
Orchestra
$84,976 $78,983 $78,983 $72,990 $72,990 $66,997 $66,997
Children’s
Museum
-0- $12,439 -0- $24,877 -0- $37,196 -0-
Institute of
Contem.
Art
-0- $17,198 -0- $34,396 -0- $51,594 -0-
MASCO $133,778 $134,917 $134,917 $136,056 $136, 058 $137, 196 $137, 196
Museum of
Fine Arts
$66,220 $259,443 $56,316 $452,460 $57,601 $645, 667 $60,399
Museum of
Science
-0- $15,445 -0- $30,890 -0- $46,335 -0-
New England
Aquarium
-0- $42,817 -0- $85,633 -0- $128,450 -0-
WGBH -0- $47,478 $51,763 $54,169 $54,169 $81,253 $81,253
Total $302, 818 $634, 503 $339, 863 $925, 152 $338, 702 $1,236, 268 $363, 729
35 BOSTON PILOT FY 2012 REQUESTS, supra note 20 (referring to the Cultural Institutions
table). 36 Id. 37 Id. 38 BOSTON PILOT FY 2013 REQUESTS, supra note 20. 39 Id. 40 BOSTON PILOT FY 2014 RESULTS, supra note 20. 41 Id.
2015 Boston ’s Rev i s ed PILOT Program 9
Table 4 Comparative Participation by Sector for Fiscal Years 2011–2014
Overall Participation by Sector
Sector (Number of
Institutions)
Number (%) of
Institutions
Contributing in FY11
Number (%) of
Institutions
Contributing in FY12
Number (%) of
Institutions
Contributing in FY13
Number (%) of
Institutions
Contributing in FY14
Educational (23)42 12 (52.2%) 16 (69.6%) 17 (73.9%) 16 (69.6%)
Medical (16)43 9 (56.3%) 13 (81.3%) 13 (81.3%) 13 (81.3%)
Cultural (9)44 4 (44.4%) 5 (55.6%) 5 (55.6%) 5 (55.6%)
Table 5
Comparative Percentages of Full Participation by Sector for Fiscal Years 2011–2014
Overall Participation by Sector by Amounts Paid
Sector Percentage of
Insts. Fully
Paying the
Requested
Amount for
FY12
Percentage of
Amount Paid
to Amount
Requested
for FY12
Percentage of
Insts. Fully
Paying the
Requested
Amount for
FY13
Percentage of
Amount Paid
to Amount
Requested
for FY13
Percentage of
Insts. Fully
Paying the
Requested
Amount for
FY14
Percentage of
Amount Paid
to Amount
Requested
for FY14
Educational45 43.4% 88.3% 30.4% 74.6% 17.4% 62.2%
Medical46 68.8% 96.3% 68.8% 95.7% 68.8% 94.8%
Cultural47 33.3% 53.6% 33.3% 36.6% 33.3% 29.4%
42 See supra Table 1. 43 See supra Table 2. 44 See supra Table 3. 45 See supra Table 1. 46 See supra Table 2. 47 See supra Table 3.
10 New England Law Rev i ew On Remand Vol. 50 | 1
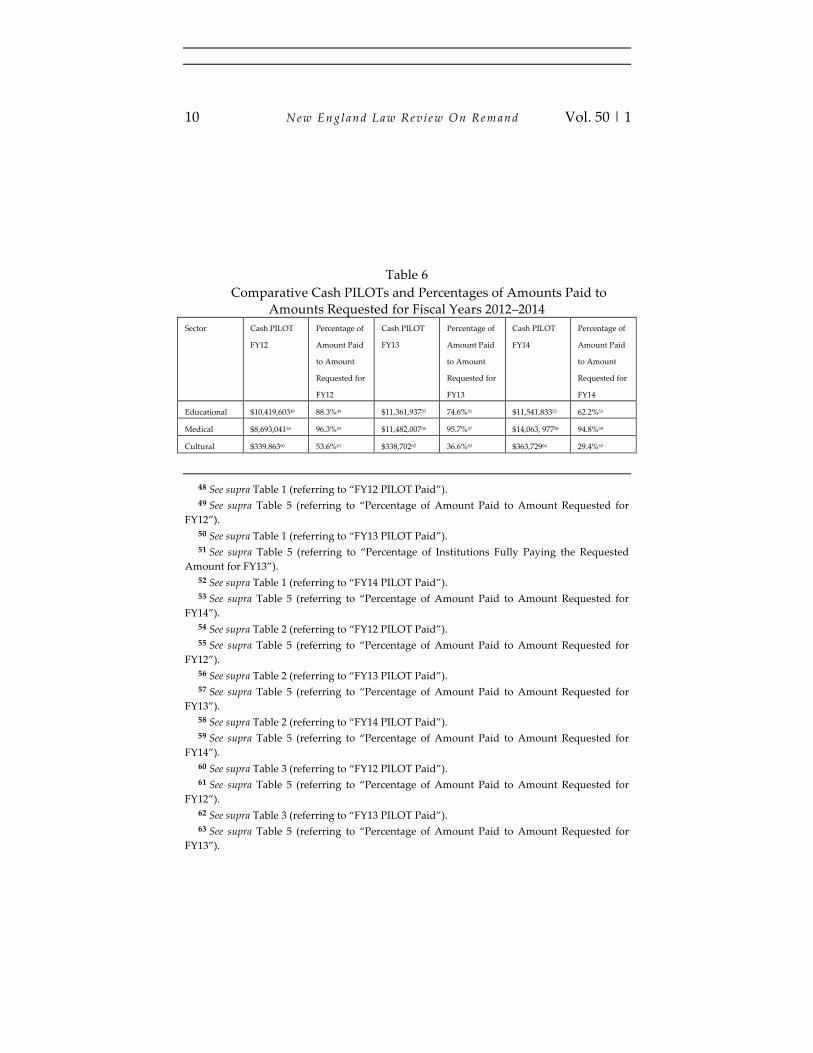
Table 6 Comparative Cash PILOTs and Percentages of Amounts Paid to
Amounts Requested for Fiscal Years 2012–2014 Sector Cash PILOT
FY12
Percentage of
Amount Paid
to Amount
Requested for
FY12
Cash PILOT
FY13
Percentage of
Amount Paid
to Amount
Requested for
FY13
Cash PILOT
FY14
Percentage of
Amount Paid
to Amount
Requested for
FY14
Educational $10,419,60348 88.3%49 $11,361,93750 74.6%51 $11,541,83352 62.2%53
Medical $8,693,04154 96.3%55 $11,482,00756 95.7%57 $14,063, 97758 94.8%59
Cultural $339,86360 53.6%61 $338,70262 36.6%63 $363,72964 29.4%65
48 See supra Table 1 (referring to “FY12 PILOT Paid”). 49 See supra Table 5 (referring to “Percentage of Amount Paid to Amount Requested for
FY12”). 50 See supra Table 1 (referring to “FY13 PILOT Paid”). 51 See supra Table 5 (referring to “Percentage of Institutions Fully Paying the Requested
Amount for FY13”). 52 See supra Table 1 (referring to “FY14 PILOT Paid”). 53 See supra Table 5 (referring to “Percentage of Amount Paid to Amount Requested for
FY14”). 54 See supra Table 2 (referring to “FY12 PILOT Paid”). 55 See supra Table 5 (referring to “Percentage of Amount Paid to Amount Requested for
FY12”). 56 See supra Table 2 (referring to “FY13 PILOT Paid”). 57 See supra Table 5 (referring to “Percentage of Amount Paid to Amount Requested for
FY13”). 58 See supra Table 2 (referring to “FY14 PILOT Paid”). 59 See supra Table 5 (referring to “Percentage of Amount Paid to Amount Requested for
FY14”). 60 See supra Table 3 (referring to “FY12 PILOT Paid”). 61 See supra Table 5 (referring to “Percentage of Amount Paid to Amount Requested for
FY12”). 62 See supra Table 3 (referring to “FY13 PILOT Paid”). 63 See supra Table 5 (referring to “Percentage of Amount Paid to Amount Requested for
FY13”).
2015 Boston ’s Rev i s ed PILOT Program 11
The results from the first three years provide an interim assessment of
the revised Boston PILOT Program. More importantly, these interim results can be examined against the expressed concerns driving the creation of the Boston PILOT Task Force.
With respect to the first stated concern of increasing the overall contribution of the nonprofit sector, the revised program appears to have easily achieved this goal. As Tables 1, 2, and 3 reflect, the revised program has resulted in a greater aggregate contribution from the nonprofit community. The total contributions for each sector have increased each year, albeit at different rates for each sector. Without further detail, it is impossible to conclusively attribute the increases in overall contributions to any particular cause. Nevertheless, it seems obvious that some combination of the very strong public push for increased participation,66 as well as the PILOT Task Force process and methodology bear a strong causal connection to the increased contributions.
While the overall nonprofit PILOT contributions have increased since the revised program was implemented, it remains less clear at this point whether the second concern over relative fairness has been accomplished. As Table 4 reflects, the medical sector has a greater overall participation than the other sectors for FY 2011 and FY 2012 through 2014. Moreover, Table 5 shows the medical sector has a significantly greater percentage of institutions fully participating (i.e., paying the full requested PILOT payment). And as further provided in Table 5, the medical sector has paid in the aggregate an overwhelmingly higher percentage of the requested payments than the other sectors. Indeed, the percentage of fully participating institutions and percentage of requested contributions paid for the education sector has gone down since FY 2012.
From a sector based approach, the significantly higher relative contribution by the medical sector appears unfair relative to other sectors. That is, the medical sector is bearing a higher relative burden. Perhaps there are reasons why the medical sector has been more responsive to the
64 See supra Table 3 (referring to “FY14 PILOT Paid” ). 65 See supra Table 5 (referring to “Percentage of Amount Paid to Amount Requested for
FY14”). 66 See Lawrence Harmon, Cultural Institutions Need to Pay Up, BOSTON GLOBE, Jan. 12, 2013,
available at 2013 WLNR 856102; Matt Rocheleau, College Agrees to Partial Payment, BOSTON
GLOBE, Mar. 2, 2015, available at 2015 WLNR 6175647; Andrew Ryan, City Asks Exempt Sector for Help, BOSTON GLOBE, Apr. 6, 2010, at A1; Editorial, Walsh Should Confront Colleges That Refuse to Pay Fair Share, BOSTON GLOBE, Nov. 3, 2014, available at 2014 WLNR 30737697; Standing Up, Sitting Down, and Crossing the Street, BOSTON PUB. RADIO (July 22, 2015) http://wgbhnews.org/post/bpr-standing-sitting-down-and-crossing-street.
12 New England Law Rev i ew On Remand Vol. 50 | 1
requested PILOT payments than other sectors. On a national level, hospitals’ property tax exemptions have come under scrutiny in several states due to practices involving indigent and low income patients.67 This might make the medical sector more sensitive to challenges to its state and local property tax exemption. Moreover, one think tank has suggested that cultural nonprofits are under different constraints than educational and medical institutions and the PILOT program should be more flexible with respect to the cultural institutions.68 Cultural nonprofits are more susceptible to economic conditions because they are generally more dependent on tourism and admission revenues than endowments.69
Notwithstanding that some external factors discussed above might be behind some of the differences between the levels of contributions among the nonprofit sectors and within each sector, some of these differences are undoubtedly attributable to the voluntary structure of the Boston PILOT Program. As the exchange set forth at the beginning of this article illustrates, the program remains by design (and perhaps by legal necessity) a voluntary one in which participants might be pressured to participate but cannot be compelled to do so.70 This seems to be the ultimate limitation of the effectiveness of the program in terms of participation and contributions raised.
Perhaps this is best illustrated by recent events concerning Northeastern University. Northeastern University came under fire in the past year [2014] for initially contributing nothing during 2014, prompting the college to make a retroactive payment. “But the amount was still far less than the city requested, and in letters accompanying the payment and a subsequent payment . . . the university said that it does not believe the amount[s] . . . it requests are fair.”71
67 See DAPHNE A. KENYON & ADAM H. LANGLEY, PAYMENTS IN LIEU OF TAXES: BALANCING
MUNICIPAL AND NONPROFIT INTERESTS 15 (2010), available at https://www.lincolninst.edu /pubs/dl/1853_1174_PILOTs%20PFR%20final.pdf.
68 BOSTON MUN. RESEARCH BUREAU, SPECIAL REPORT: BOSTON’S NEW PILOT PROGRAM COMPLETES FIRST YEAR 13 (2013), available at http://bmrb.org/wp-content/uploads/2014/11/ sr131PILOT.pdf.
69 Id. 70 In a recent article examining Massachusetts PILOT payments, the authors conclude that
the PILOT receipts correlate with local property tax rates and “function as informal low-rate substitutes for property taxes.” Fan Fei et al., Are PILOTs Property Taxes for Nonprofits? 2 (Nat’l Bureau of Econ. Research, Working Paper No. 21088, 2015), available at http://www.nber.org/papers/w21088. As such, PILOT programs might lead to results that are also characteristic of property taxes such as discouraging the ownership and use of property. Id.
71 Matt Rocheleau, Many Colleges Missing Mark on Voluntary Payments to City, BOSTON
2015 Boston ’s Rev i s ed PILOT Program 13
CONCLUSION
The initial rollout and first three years of the revised Boston PILOT Program has led to increased and broader contributions from the Boston nonprofit community. The voluntary basis of the program, as well as the non-monolithic nature of the nonprofit community, suggests limitations to the ultimate effectiveness of the program as designed. Yet the revised program still provides a good model as PILOT programs continue to be implemented in the northeast and around the country.
GLOBE (July 21, 2015), available at http://www.bostonglobe.com/metro/2015/07/21/many-boston-colleges-fall-short-voluntary-payments-city/D8jVTjEKrPkMOZq8N4q83M/story.html.