Embed Size (px)
Citation preview

Boston’s Economy2015
BOSTON REDEVELOPMENT AUTHORITY

THE BOSTON REDEVELOPMENT AUTHORITY RESEARCH DIVISION (BRA)
We strive to understand the current environment of the city to produce
quality research and targeted information that will inform and benefit
the residents and businesses of Boston. Our Division conducts research
on Boston’s economy, population, and commercial markets for all
departments of the BRA, the City of Boston, and related organizations.
The information provided in this report is the best available at the time of
its publication. All or partial use of this report must be cited.
CITATION
Please cite this publication as:
Boston Redevelopment Authority Research Division, October 2015
INFORMATION
For more information about research produced by the Boston
Redevelopment Authority, please contact the Research Division at
REQUESTS
Research requests can be made through the BRA Research Division’s
Research Inquiries website.
Produced by the BRA Research Division
DIRECTOR
Alvaro Lima
DEPUTY DIRECTOR
Jonathan Lee
RESEARCH MANAGER
Christina Kim
SENIOR RESEARCHER/ECONOMIST
Matthew Resseger
SENIOR RESEARCHER/DEMOGRAPHER
Phillip Granberry
RESEARCH ASSOCIATE
Kevin Kang
RESEARCH ASSISTANT
Kevin Wandrei
INTERNS
Grace RiascosArhan Uguray
DESIGNER
Tajunique Thompson
Follow us on Twittertwitter.com/BostonRedevelop
Visit our websiteBostonRedevelop.org
BOSTON REDEVELOPMENT AUTHORITY

Table of Contents
Report Highlights
03
Health Care + Social Assistance
14 Professional + Technical Services
15
Construction
18Education
19
Boston’s Economy
02
Real Estate Market
20
Moving Forward
24End Notes
30
13
Profiles Of Key Industries
06
Employment & Wages
Finance +Insurance
16
Accomodation + Food Services
17
Resident Unemployment Rate
06
Wages
11
Employmentby Industry
08
Commercial
22Housing
20Real Estate
Value
22

2 | Boston Economy Report 2015
Boston’s economy
Total employment rose to the highest level
in recent decades and unemployment
fell to its pre-recession level in early 2015.
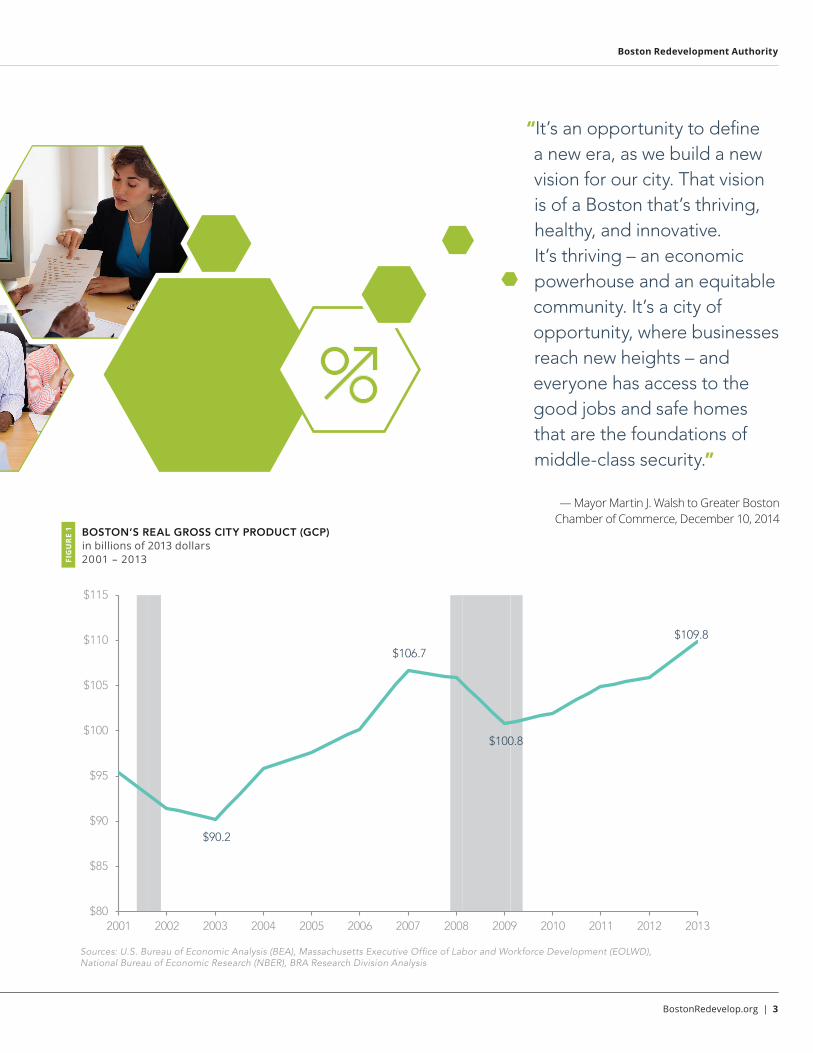
The Boston economy grew by 2.2 percent
annually from 2009 to 2013 as measured
by Gross City Product (GCP).1 Boston’s
estimated GCP of $109.8 billion, as shown
in FIGURE 1 (page 3), represents 24.6
percent of the total economic activity in
Massachusetts for 2013. Boston’s economy
grew 3.7 percent between 2012 and 2013,
surpassing the U.S. GDP growth of 2.2
percent and Massachusetts Gross State
Product (GSP) growth of 1.8 percent.
Boston’s job growth was positive across
most industries since the recession, but
was mostly concentrated in health care
and social assistance, professional and
technical services, and education. The
health care and social assistance industry
employs the largest number of people in
Boston, 18.7 percent of total jobs, while the
professional and technical services industry
is the fastest growing since the recession,
adding more than 12,000 jobs. Educational
Services is an area of specialization for
Boston with an employment share three
times the national average.
The most recent economic conditions show
Boston’s steady growth in the labor market,
high tech industries, and new development.
has grown steadily since the end of the Great Recession in mid-2009, outperforming both Massachusetts and the nation with annual job growth of 2.0 percent between 2010 and 2014.
BostonRedevelop.org | 3
Boston Redevelopment Authority
Sources: U.S. Bureau of Economic Analysis (BEA), Massachusetts Executive Office of Labor and Workforce Development (EOLWD), National Bureau of Economic Research (NBER), BRA Research Division Analysis
$90.2
$106.7
$100.8
$109.8
$80
$85
$90
$95
$100
$105
$110
$115
2001 2002 2003 2004 2005 2006 2007 2008 2009 2010 2011 2012 2013
BOSTON’S REAL GROSS CITY PRODUCT (GCP) in billions of 2013 dollars 2001 – 2013FI
GU
RE
1
“It’s an opportunity to define a new era, as we build a new vision for our city. That vision is of a Boston that’s thriving, healthy, and innovative.It’s thriving – an economic powerhouse and an equitable community. It’s a city of opportunity, where businesses reach new heights – and everyone has access to the good jobs and safe homes that are the foundations of middle-class security.”
— Mayor Martin J. Walsh to Greater Boston Chamber of Commerce, December 10, 2014
4 | Boston Economy Report 2015
Boston’s economy
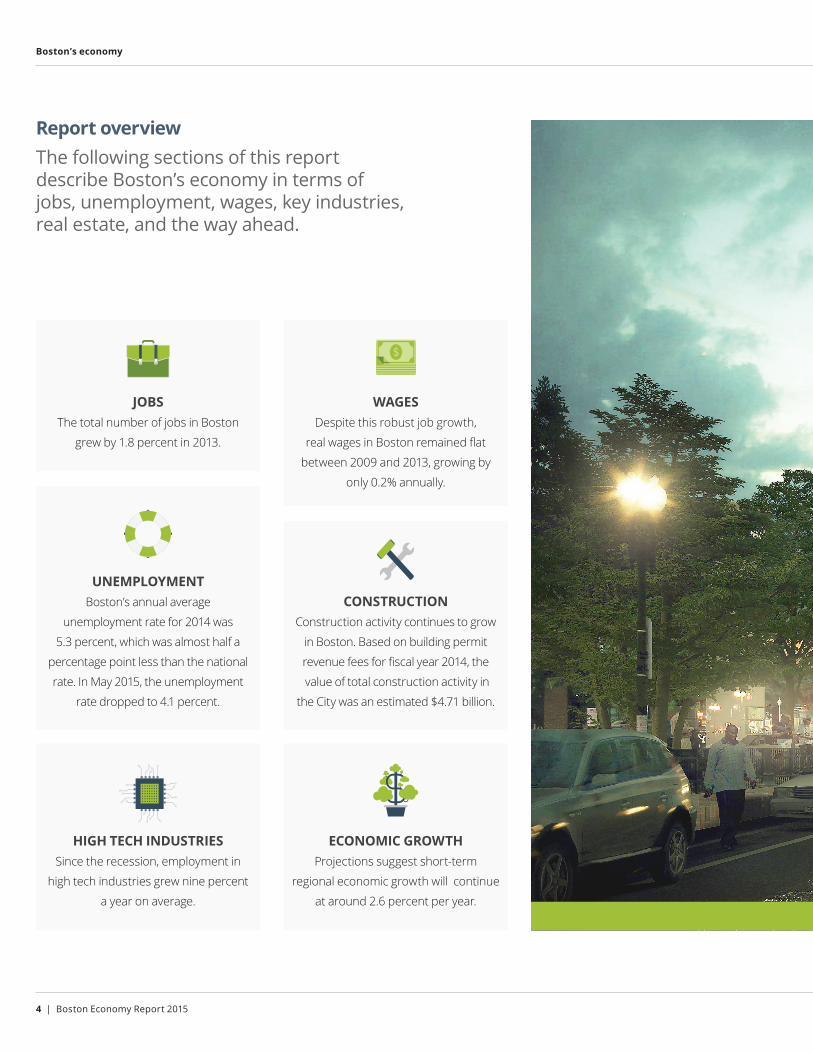
JOBSThe total number of jobs in Boston
grew by 1.8 percent in 2013.
UNEMPLOYMENTBoston’s annual average
unemployment rate for 2014 was
5.3 percent, which was almost half a
percentage point less than the national
rate. In May 2015, the unemployment
rate dropped to 4.1 percent.
HIGH TECH INDUSTRIESSince the recession, employment in
high tech industries grew nine percent
a year on average.
WAGESDespite this robust job growth,
real wages in Boston remained flat
between 2009 and 2013, growing by
only 0.2% annually.
CONSTRUCTIONConstruction activity continues to grow
in Boston. Based on building permit
revenue fees for fiscal year 2014, the
value of total construction activity in
the City was an estimated $4.71 billion.
ECONOMIC GROWTHProjections suggest short-term
regional economic growth will continue
at around 2.6 percent per year.
Report overviewThe following sections of this report describe Boston’s economy in terms of jobs, unemployment, wages, key industries, real estate, and the way ahead.
BostonRedevelop.org | 5
Boston Redevelopment Authority
6 | Boston Economy Report 2015
Employment and Wages
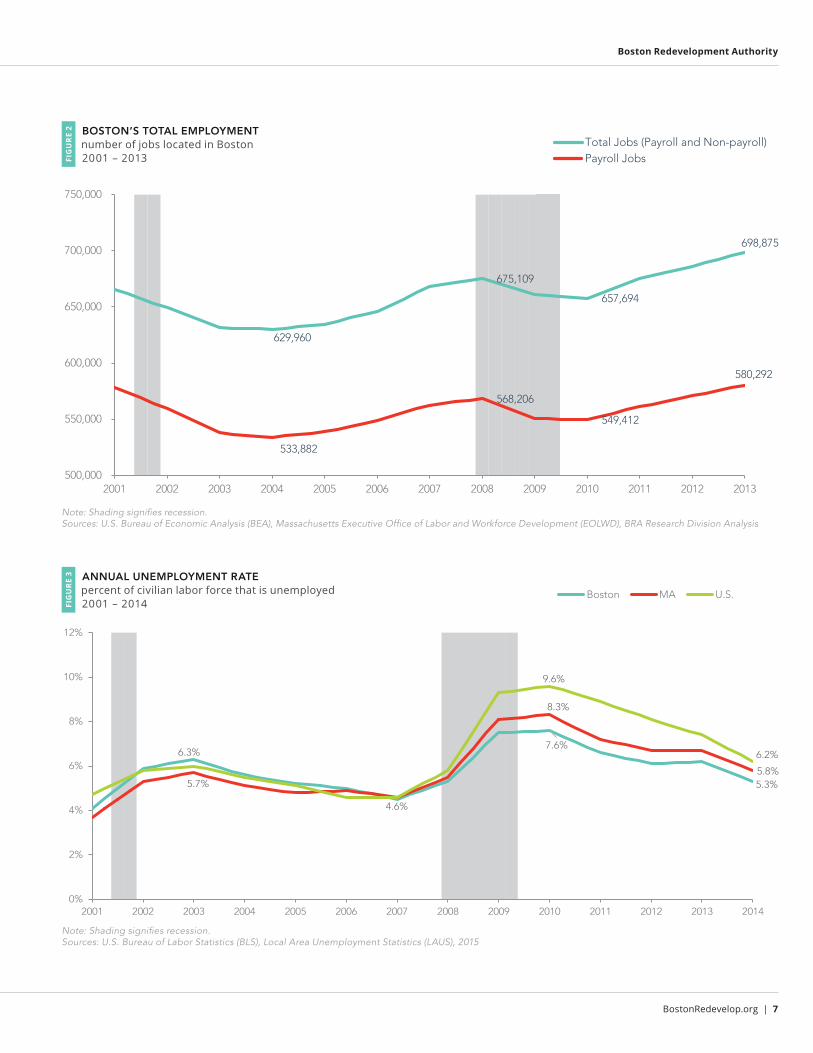
Boston is a major regional employment
center. Boston jobs represent 16.2%
of the total statewide jobs, and 61% of
Boston jobs are held by commuters from
surrounding communities. While final 2014
data is not yet available, the latest payroll
job data provided by the Massachusetts
Executive Office of Labor and Workforce
Development (EOLWD) shows payroll jobs
continued to grow steadily through 2014,
averaging 595,585 jobs in the third quarter.2
FIGURE 2 (page 7) shows Boston’s job
growth for payroll and non-payroll jobs
from 2001 to 2013. Following the Great
Recession, positive job growth returned
in February 2010; however, it was not
until later in 2011 that total jobs returned
to prerecession levels. Between 2010
and 2011, 17,806 total jobs were added,
an increase of 2.7 percent. This was
followed by a 1.6 percent increase in
2012, or 10,922 new jobs. The top five
industries in job creation between 2010
and 2013 were professional, scientific and
technical services; health care and social
assistance; accommodation and food
services; construction; and education.
Most of the other major industries showed
either moderate gains or marginal losses.
Individual industry growth is covered in more
detail in the Industry section. In addition,
the estimated number of non-payroll jobs
grew at an annual rate of 3.1 percent from
2010 to 2013, which could be indicative of
changing economic conditions, the rise in
contract or consulting positions, or the rise in
entrepreneurship and sole proprietorships.
Resident unemployment rate
In 2014, the city’s unemployment rate
dropped to 5.3 percent, the first time under
six percent since the Great Recession. In
the beginning of 2015, the preliminary
unemployment rates for January to May
indicated that Boston’s unemployment has
plunged to pre-recession levels, with an
unemployment rate of 4.1 percent in May.3
FIGURE 3 (page 7) shows that Boston’s
unemployment rate has followed a trend
similar to that of Massachusetts and
the U.S., but maintained a consistently
lower level since 2007. For 2014, Boston’s
unemployment rate was half a percentage
point less than Massachusetts and almost
a full percentage point below the U.S.
Employment and Wages:In 2013, Boston’s total payroll and non-payroll jobs grew by 1.8 percent to 698,875.
BostonRedevelop.org | 7
Boston Redevelopment Authority
629,960
675,109
657,694
698,875
533,882
568,206
549,412
580,292
2001 2002 2003 2004 2005 2006 2007 2008 2009 2010 2011 2012 2013 500,000
550,000
600,000
650,000
700,000
750,000
Total Jobs (Payroll and Non-payroll) Payroll Jobs
6.3%7.6%
5.3%5.7%
8.3%
5.8%
4.6%
9.6%
6.2%
2001 2002 2003 2004 2005 2006 2007 2008 2009 2010 2011 2012 2013 20140%
2%
4%
6%
8%
10%
12%
Boston MA U.S.Note: Shading signifies recession.Sources: U.S. Bureau of Labor Statistics (BLS), Local Area Unemployment Statistics (LAUS), 2015
Note: Shading signifies recession.Sources: U.S. Bureau of Economic Analysis (BEA), Massachusetts Executive Office of Labor and Workforce Development (EOLWD), BRA Research Division Analysis
BOSTON’S TOTAL EMPLOYMENT number of jobs located in Boston 2001 – 2013FI
GU
RE
2
629,960
675,109
657,694
698,875
533,882
568,206
549,412
580,292
2001 2002 2003 2004 2005 2006 2007 2008 2009 2010 2011 2012 2013 500,000
550,000
600,000
650,000
700,000
750,000
Total Jobs (Payroll and Non-payroll) Payroll Jobs
629,960
675,109
657,694
698,875
533,882
568,206
549,412
580,292
2001 2002 2003 2004 2005 2006 2007 2008 2009 2010 2011 2012 2013 500,000
550,000
600,000
650,000
700,000
750,000
Total Jobs (Payroll and Non-payroll) Payroll Jobs
ANNUAL UNEMPLOYMENT RATE percent of civilian labor force that is unemployed 2001 – 2014FI
GU
RE
3
6.3%7.6%
5.3%5.7%
8.3%
5.8%
4.6%
9.6%
6.2%
2001 2002 2003 2004 2005 2006 2007 2008 2009 2010 2011 2012 2013 20140%
2%
4%
6%
8%
10%
12%
Boston MA U.S.
8 | Boston Economy Report 2015
Employment and Wages
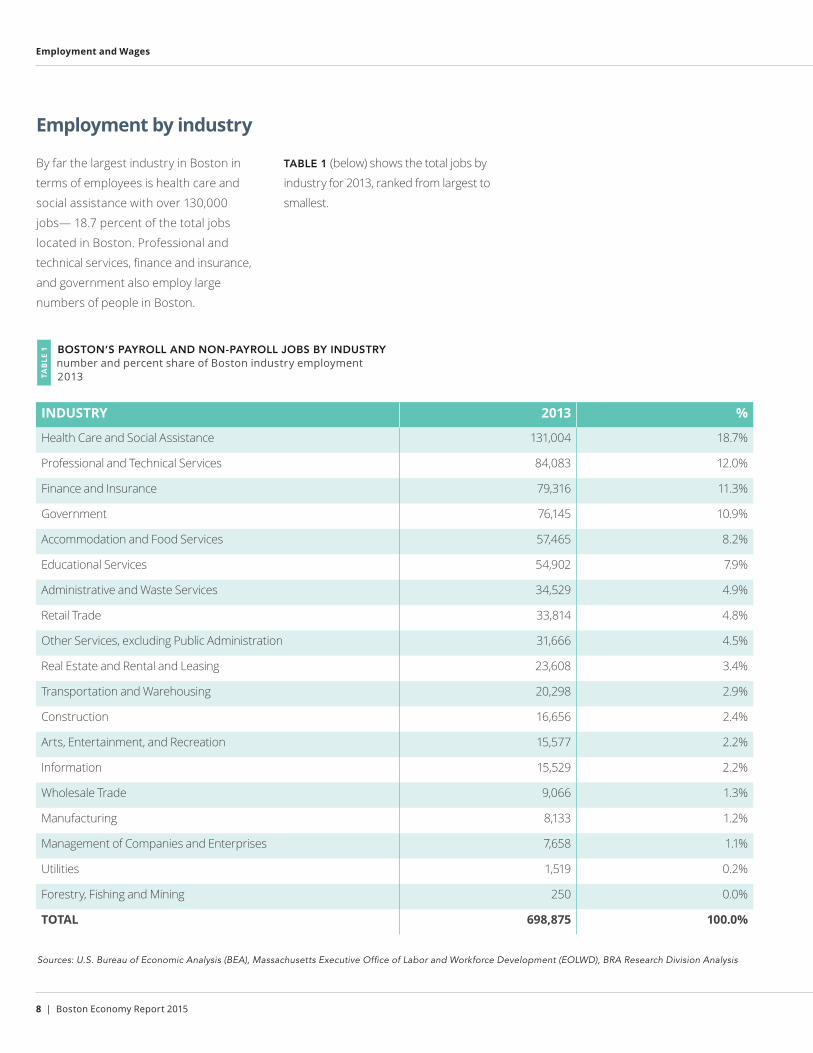
Employment by industry
By far the largest industry in Boston in
terms of employees is health care and
social assistance with over 130,000
jobs— 18.7 percent of the total jobs
located in Boston. Professional and
technical services, finance and insurance,
and government also employ large
numbers of people in Boston.
TABLE 1 (below) shows the total jobs by
industry for 2013, ranked from largest to
smallest.
BOSTON’S PAYROLL AND NON-PAYROLL JOBS BY INDUSTRY number and percent share of Boston industry employment 2013TA
BLE
1
INDUSTRY 2013 %
Health Care and Social Assistance 131,004 18.7%
Professional and Technical Services 84,083 12.0%
Finance and Insurance 79,316 11.3%
Government 76,145 10.9%
Accommodation and Food Services 57,465 8.2%
Educational Services 54,902 7.9%
Administrative and Waste Services 34,529 4.9%
Retail Trade 33,814 4.8%
Other Services, excluding Public Administration 31,666 4.5%
Real Estate and Rental and Leasing 23,608 3.4%
Transportation and Warehousing 20,298 2.9%
Construction 16,656 2.4%
Arts, Entertainment, and Recreation 15,577 2.2%
Information 15,529 2.2%
Wholesale Trade 9,066 1.3%
Manufacturing 8,133 1.2%
Management of Companies and Enterprises 7,658 1.1%
Utilities 1,519 0.2%
Forestry, Fishing and Mining 250 0.0%
TOTAL 698,875 100.0%
Sources: U.S. Bureau of Economic Analysis (BEA), Massachusetts Executive Office of Labor and Workforce Development (EOLWD), BRA Research Division Analysis
BostonRedevelop.org | 9
Boston Redevelopment Authority
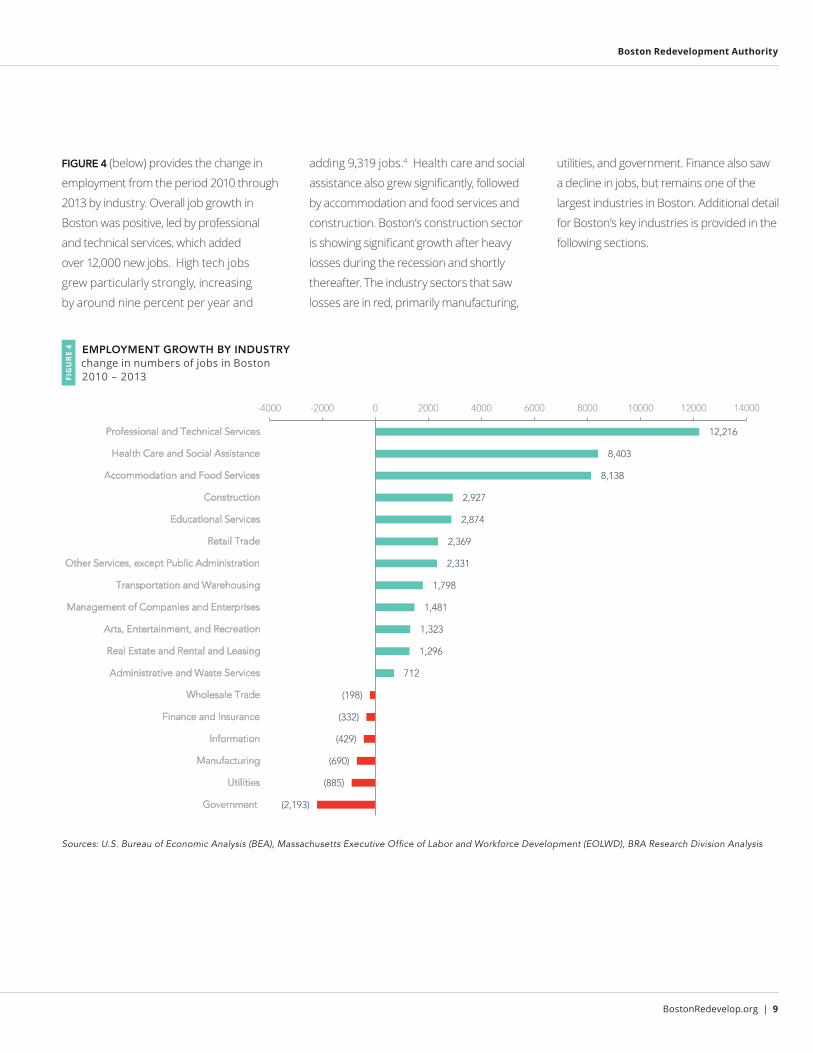
FIGURE 4 (below) provides the change in
employment from the period 2010 through
2013 by industry. Overall job growth in
Boston was positive, led by professional
and technical services, which added
over 12,000 new jobs. High tech jobs
grew particularly strongly, increasing
by around nine percent per year and
adding 9,319 jobs.4 Health care and social
assistance also grew significantly, followed
by accommodation and food services and
construction. Boston’s construction sector
is showing significant growth after heavy
losses during the recession and shortly
thereafter. The industry sectors that saw
losses are in red, primarily manufacturing,
utilities, and government. Finance also saw
a decline in jobs, but remains one of the
largest industries in Boston. Additional detail
for Boston’s key industries is provided in the
following sections.
Sources: U.S. Bureau of Economic Analysis (BEA), Massachusetts Executive Office of Labor and Workforce Development (EOLWD), BRA Research Division Analysis
(2,193)
(885)
(690)
(429)
(332)
(198)
712
1,296
1,323
1,481
1,798
2,331
2,369
2,874
2,927
8,138
8,403
12,216
-4000 -2000 0 2000 4000 6000 8000 10000 12000 14000
Government
Utilities
Manufacturing
Information
Finance and Insurance
Wholesale Trade
Administrative and Waste Services
Real Estate and Rental and Leasing
Arts, Entertainment, and Recreation
Management of Companies and Enterprises
Transportation and Warehousing
Other Services, except Public Administration
Retail Trade
Educational Services
Construction
Accommodation and Food Services
Health Care and Social Assistance
Professional and Technical Services
EMPLOYMENT GROWTH BY INDUSTRY change in numbers of jobs in Boston 2010 – 2013FI
GU
RE
4
10 | Boston Economy Report 2015
Employment and Wages
LOCATION QUOTIENTS OF BOSTON INDUSTRIES ratio of Boston industry employment to national average (1.0) 2013FI
GU
RE
5
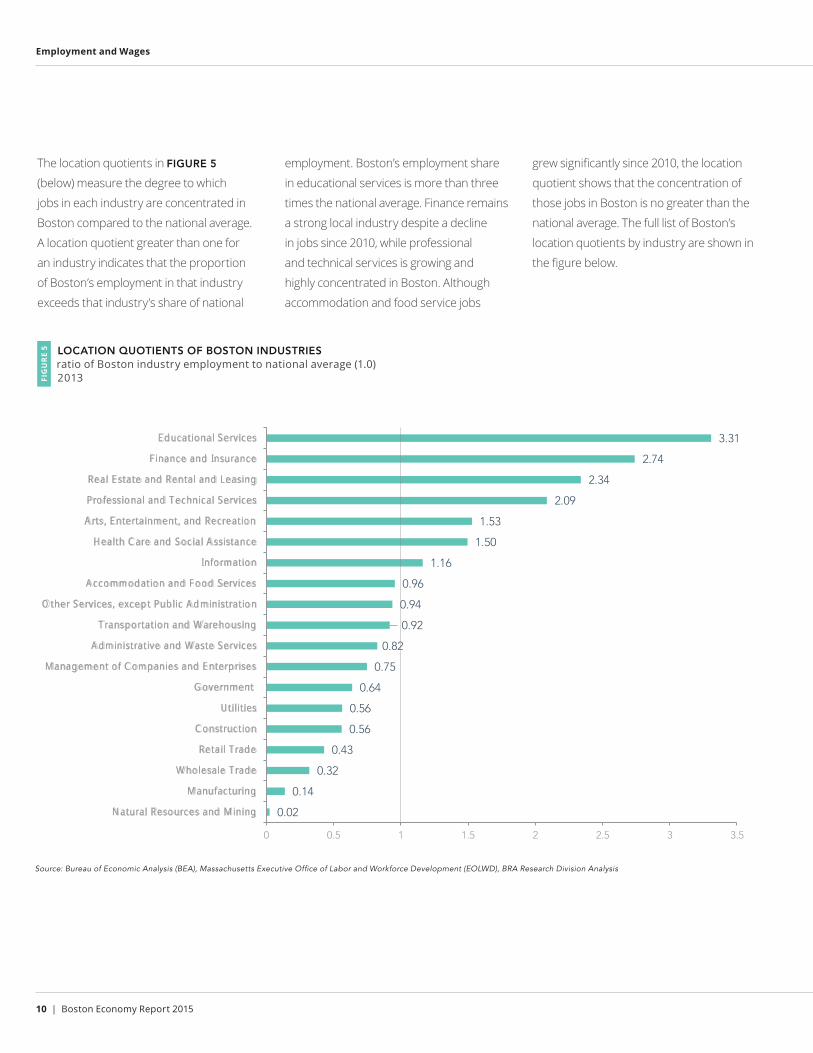
The location quotients in FIGURE 5
(below) measure the degree to which
jobs in each industry are concentrated in
Boston compared to the national average.
A location quotient greater than one for
an industry indicates that the proportion
of Boston’s employment in that industry
exceeds that industry’s share of national
employment. Boston’s employment share
in educational services is more than three
times the national average. Finance remains
a strong local industry despite a decline
in jobs since 2010, while professional
and technical services is growing and
highly concentrated in Boston. Although
accommodation and food service jobs
grew significantly since 2010, the location
quotient shows that the concentration of
those jobs in Boston is no greater than the
national average. The full list of Boston’s
location quotients by industry are shown in
the figure below.
Source: Bureau of Economic Analysis (BEA), Massachusetts Executive Office of Labor and Workforce Development (EOLWD), BRA Research Division Analysis
0.02
0.14
0.32
0.43
0.56
0.56
0.64
0.75
0.82
0.92
0.94
0.96
1.16
1.50
1.53
2.09
2.34
2.74
3.31
0 0.5 1 1.5 2 2.5 3 3.5
Natural Resources and Mining
Manufacturing
Wholesale Trade
Retail Trade
Construction
Utilities
Government
Management of Companies and Enterprises
Administrative and Waste Services
Transportation and Warehousing
Other Services, except Public Administration
Accommodation and Food Services
Information
Health Care and Social Assistance
Arts, Entertainment, and Recreation
Professional and Technical Services
Real Estate and Rental and Leasing
Finance and Insurance
Educational Services

BostonRedevelop.org | 11
Boston Redevelopment Authority
Wages
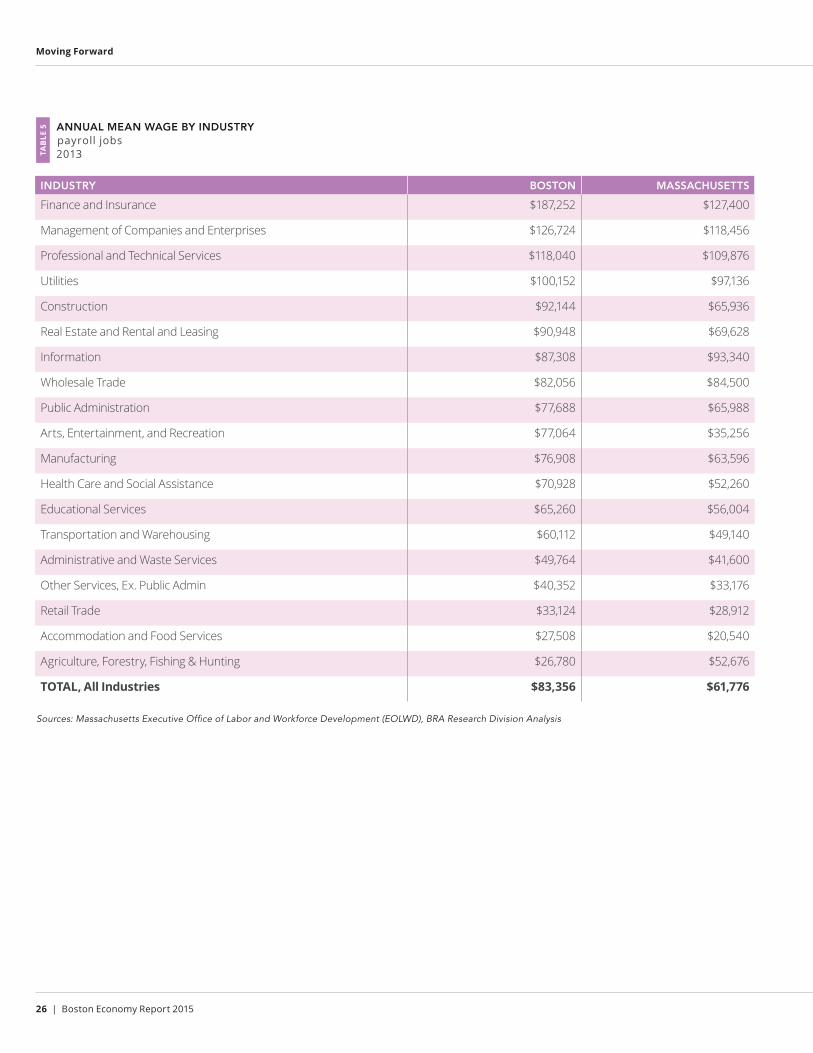
Total payroll wages for Boston in 2013 were
$48.4 billion, resulting in an average annual
payroll wage of $83,356. From 2009 to
2013, the average nominal wage in Boston
grew only slightly faster than inflation,
with a 2.3 percent annual growth rate,
compared to annual inflation of 2.1 percent.
The highest wages were in finance and
insurance at $187,252, 125% higher than
the average annual wage for jobs in the
city. Accommodation and food service has
the lowest annual wage of $27,508, which is
67% below the city’s average annual wage.
While the accommodation and food service
industry provides a large number of jobs,
the low wages may be a concern, as these
wages on an hourly basis are less than the
living wage as defined by Boston’s Living
Wage Ordinance.5
12 | Boston Economy Report 2015
Profiles of Key Industries
GRANTS
A significant portion of Boston’s health
care industry focuses on medical
research. For 20 consecutive years,
Boston has received the most National
Institutes of Health (NIH) research grants
of any city in the country.
HOSPITALS
Four of the six largest employers
in Boston are hospitals:
Brigham and Women’s Hospital,
Massachusetts General Hospital,
Beth Israel Deaconess Medical Center,
and Children’s Hospital.6
LARGEST INDUSTRY
Health care and social assistance is
the largest industry in Boston in 2013,
providing over 130,000 jobs
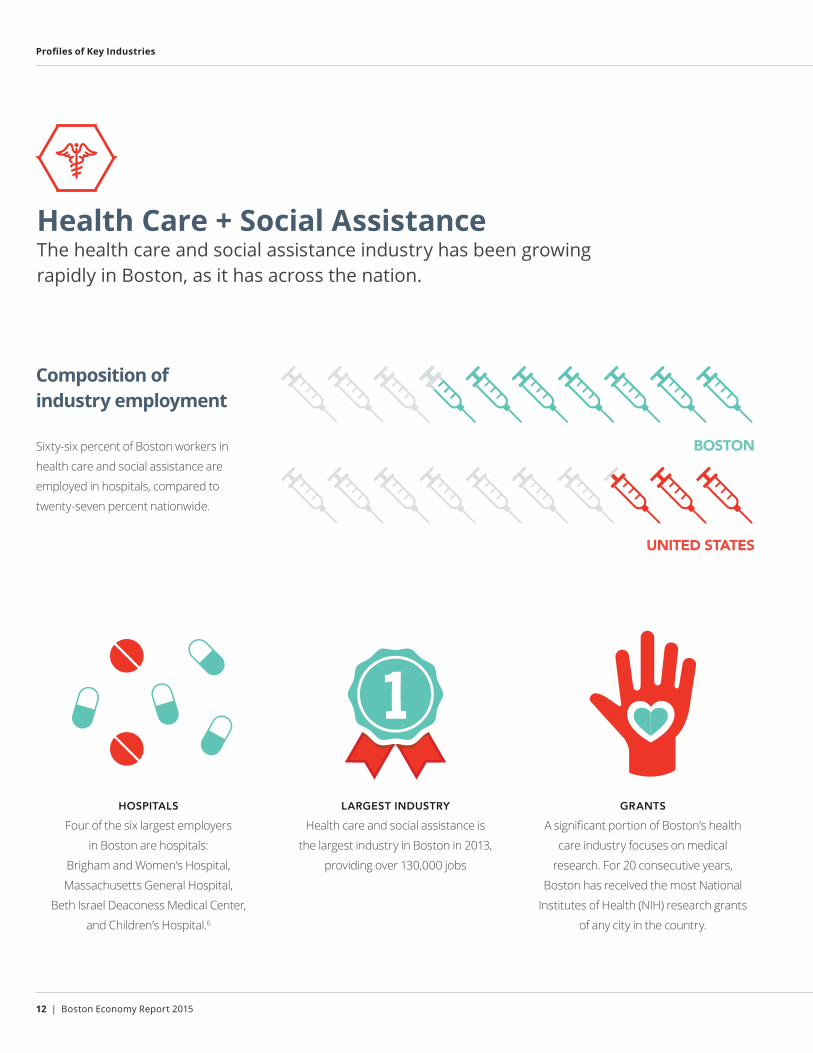
Composition of industry employment
Sixty-six percent of Boston workers in
health care and social assistance are
employed in hospitals, compared to
twenty-seven percent nationwide.
BOSTON
UNITED STATES
Health Care + Social AssistanceThe health care and social assistance industry has been growing rapidly in Boston, as it has across the nation.
BostonRedevelop.org | 13
Boston Redevelopment Authority
0 1 1 0 0 0 1 1 0 0 1
0 1 1 0 0 0 1
0 1 1 0 0 0 1
0 1 1 0 0 0 1
0 1 1 0 0 0 1
0 1 1 0 0 0 1
0 1 1 0 0 0 1
0 1 1 0 0 0 1
0 1 1 0 0 0 1 1 0 0 1
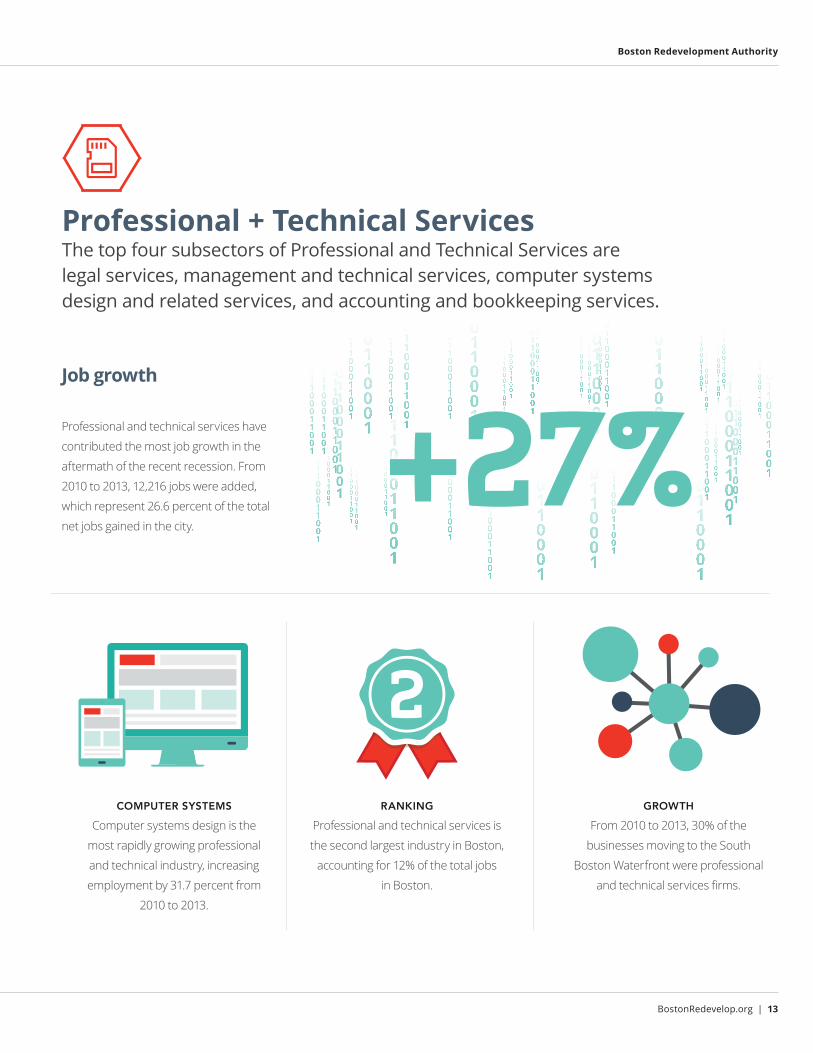
GROWTH From 2010 to 2013, 30% of the
businesses moving to the South
Boston Waterfront were professional
and technical services firms.
COMPUTER SYSTEMS
Computer systems design is the
most rapidly growing professional
and technical industry, increasing
employment by 31.7 percent from
2010 to 2013.
RANKING Professional and technical services is
the second largest industry in Boston,
accounting for 12% of the total jobs
in Boston.
Job growth
Professional and technical services have
contributed the most job growth in the
aftermath of the recent recession. From
2010 to 2013, 12,216 jobs were added,
which represent 26.6 percent of the total
net jobs gained in the city.
0 1 1 0 0 0 1 1 0 0 1
0 1 1 0 0 0 1 1 0 0 1
0 1 1 0 0 0 1 1 0 0 1
0 1 1 0 0 0 1 1 0 0 1
0 1 1 0 0 0 1 1 0 0 1
0 1 1 0 0 0 1 1 0 0 1
0 1 1 0 0 0 1 1 0 0 1
0 1 1 0 0 0 1 1 0 0 1
0 1 1 0 0 0 1 1 0 0 1
0 1 1 0 0 0 1 1 0 0 1
0 1 1 0 0 0 1 1 0 0 1
0 1 1 0 0 0 1 1 0 0 1
0 1 1 0 0 0 1 1 0 0 1
0 1 1 0 0 0 1 1 0 0 1
0 1 1 0 0 0 1 1 0 0 1
0 1 1 0 0 0 1 1 0 0 1
0 1 1 0 0 0 1 1 0 0 1
0 1 1 0 0 0 1 1 0 0 1
0 1 1 0 0 0 1 1 0 0 1
0 1 1 0 0 0 1 1 0 0 1
0 1 1 0 0 0 1 1 0 0 1
0 1 1 0 0 0 1 1 0 0 1
0 1 1 0 0 0 1 1 0 0 1
0 1 1 0 0 0 1 1 0 0 1
0 1 1 0 0 0 1 1 0 0 1
0 1 1 0 0 0 1 1 0 0 1
0 1 1 0 0 0 1 1 0 0 1
0 1 1 0 0 0 1 1 0 0 1
0 1 1 0 0 0 1 1 0 0 1
0 1 1 0 0 0 1 1 0 0 1
0 1 1 0 0 0 1 1 0 0 1
0 1 1 0 0 0 1 1 0 0 1
0 1 1 0 0 0 1 1 0 0 1
0 1 1 0 0 0 1 1 0 0 1
Professional + Technical ServicesThe top four subsectors of Professional and Technical Services are legal services, management and technical services, computer systems design and related services, and accounting and bookkeeping services.
14 | Boston Economy Report 2015
Profiles of Key Industries
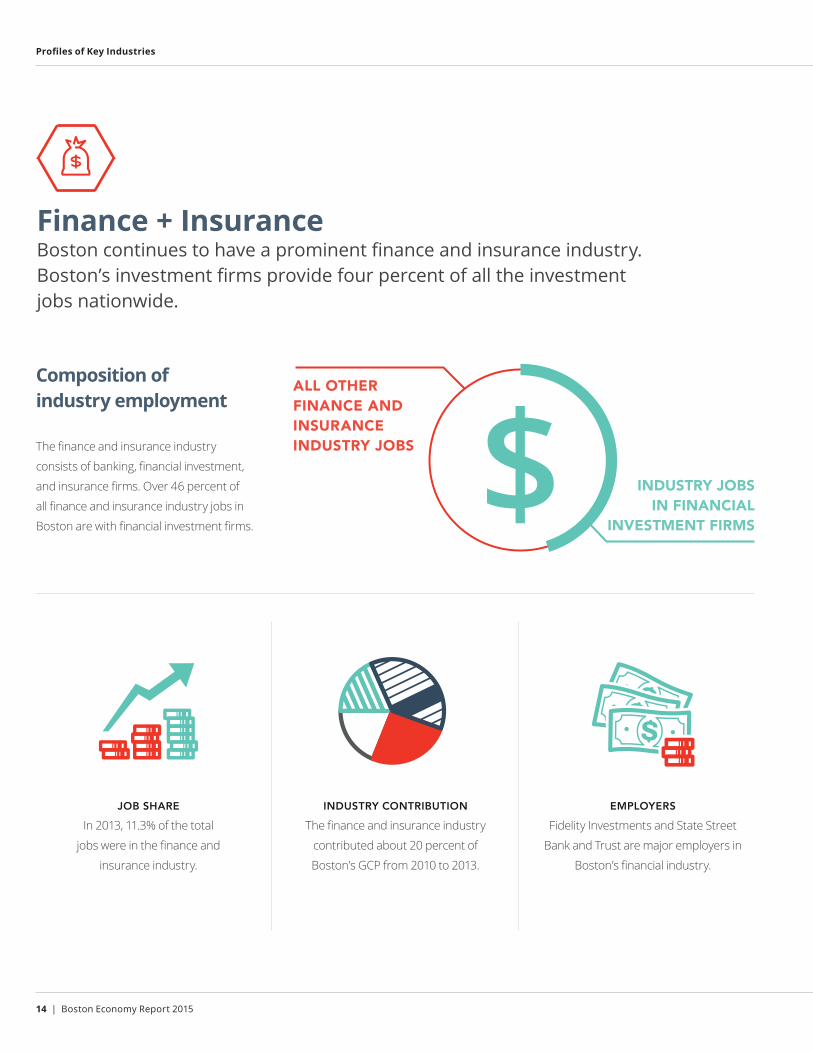
EMPLOYERS
Fidelity Investments and State Street
Bank and Trust are major employers in
Boston’s financial industry.
JOB SHARE
In 2013, 11.3% of the total
jobs were in the finance and
insurance industry.
INDUSTRY CONTRIBUTION
The finance and insurance industry
contributed about 20 percent of
Boston’s GCP from 2010 to 2013.
Composition of industry employment
The finance and insurance industry
consists of banking, financial investment,
and insurance firms. Over 46 percent of
all finance and insurance industry jobs in
Boston are with financial investment firms.
INDUSTRY JOBS IN FINANCIAL
INVESTMENT FIRMS
ALL OTHER FINANCE AND INSURANCE INDUSTRY JOBS
Finance + InsuranceBoston continues to have a prominent finance and insurance industry. Boston’s investment firms provide four percent of all the investment jobs nationwide.
BostonRedevelop.org | 15
Boston Redevelopment Authority
20132010
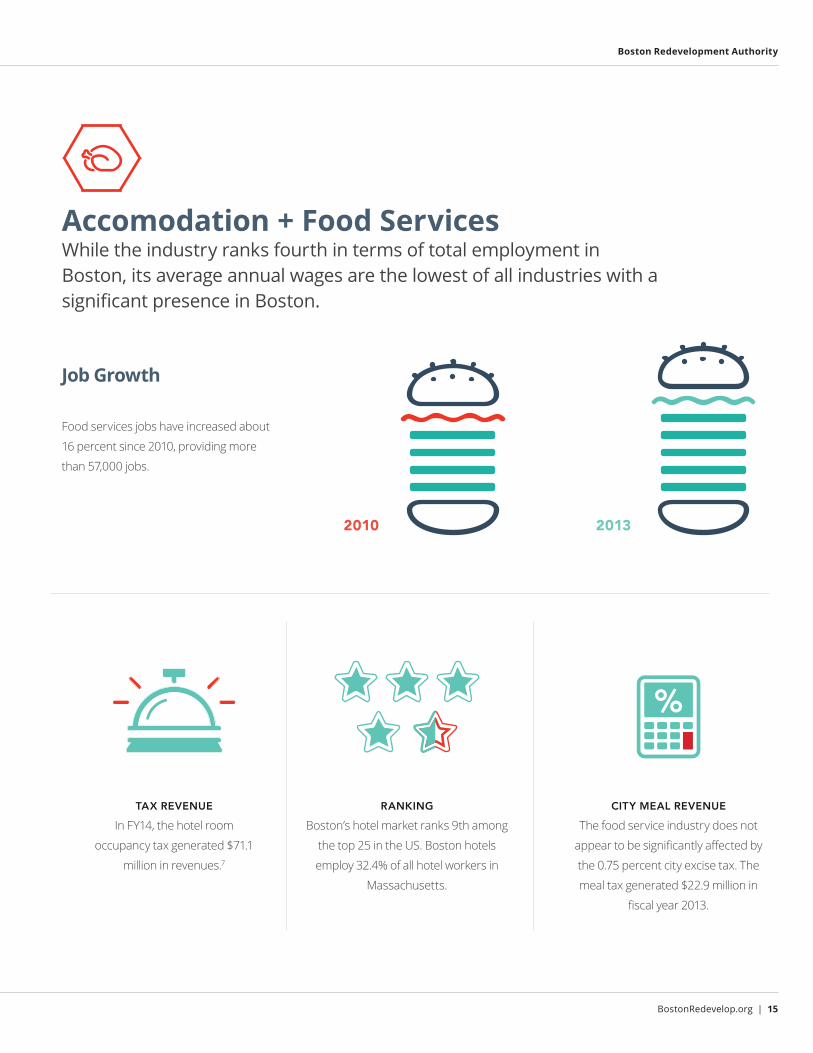
CITY MEAL REVENUE The food service industry does not
appear to be significantly affected by
the 0.75 percent city excise tax. The
meal tax generated $22.9 million in
fiscal year 2013.
TAX REVENUE
In FY14, the hotel room
occupancy tax generated $71.1
million in revenues.7
RANKING Boston’s hotel market ranks 9th among
the top 25 in the US. Boston hotels
employ 32.4% of all hotel workers in
Massachusetts.
Job Growth
Food services jobs have increased about
16 percent since 2010, providing more
than 57,000 jobs.
Accomodation + Food ServicesWhile the industry ranks fourth in terms of total employment in Boston, its average annual wages are the lowest of all industries with a significant presence in Boston.
%
16 | Boston Economy Report 2015
Profiles of Key Industries
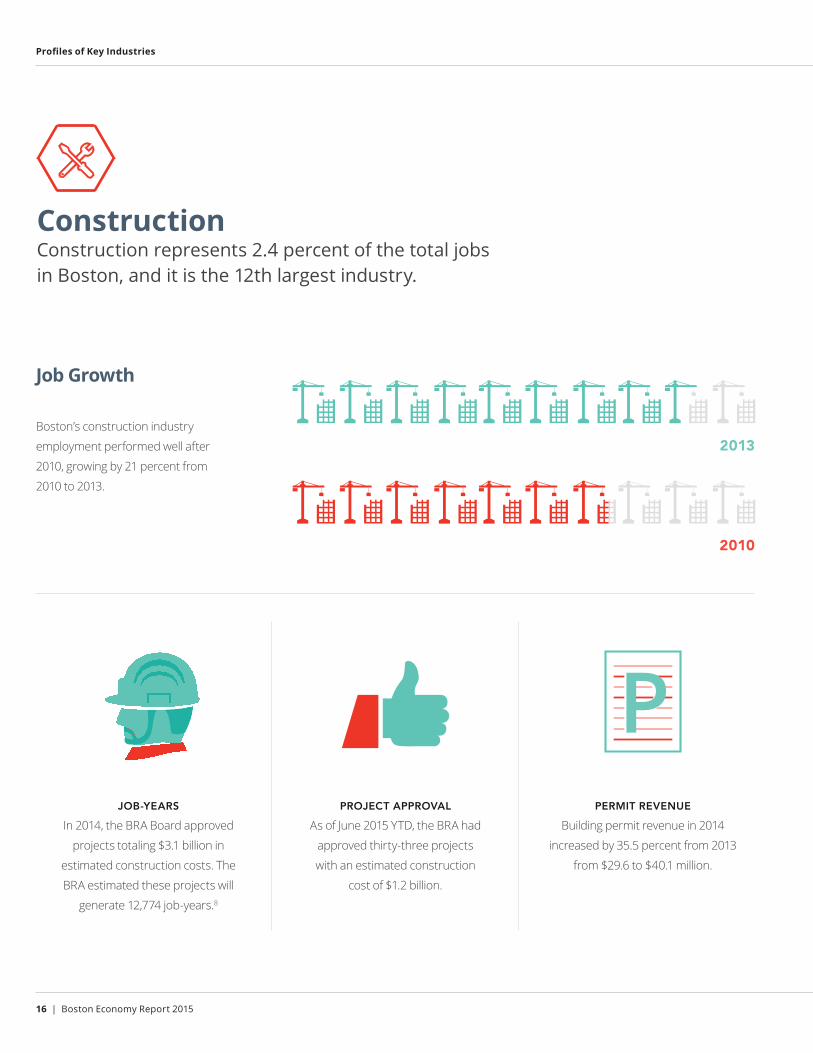
PERMIT REVENUE
Building permit revenue in 2014
increased by 35.5 percent from 2013
from $29.6 to $40.1 million.
JOB-YEARS
In 2014, the BRA Board approved
projects totaling $3.1 billion in
estimated construction costs. The
BRA estimated these projects will
generate 12,774 job-years.8
PROJECT APPROVAL
As of June 2015 YTD, the BRA had
approved thirty-three projects
with an estimated construction
cost of $1.2 billion.
Job Growth
Boston’s construction industry
employment performed well after
2010, growing by 21 percent from
2010 to 2013.
2013
2010
ConstructionConstruction represents 2.4 percent of the total jobs in Boston, and it is the 12th largest industry.
BostonRedevelop.org | 17
Boston Redevelopment Authority
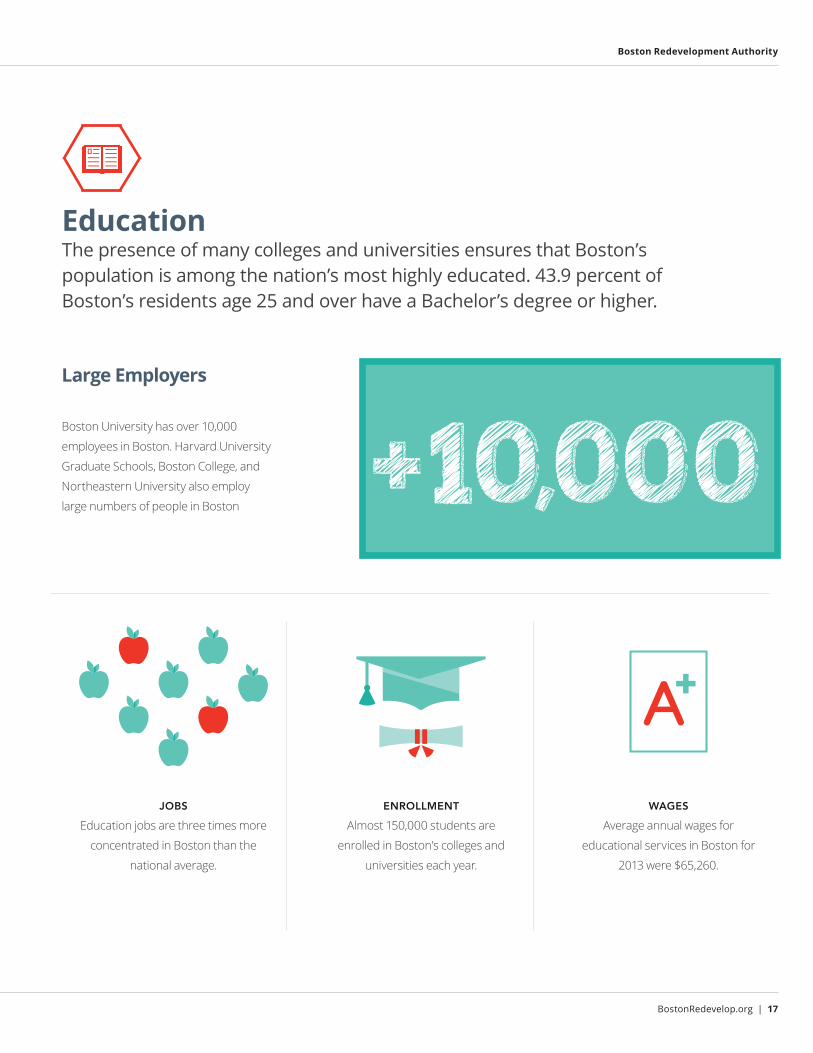
WAGES Average annual wages for
educational services in Boston for
2013 were $65,260.
JOBS
Education jobs are three times more
concentrated in Boston than the
national average.
ENROLLMENT
Almost 150,000 students are
enrolled in Boston’s colleges and
universities each year.
Large Employers
Boston University has over 10,000
employees in Boston. Harvard University
Graduate Schools, Boston College, and
Northeastern University also employ
large numbers of people in Boston
EducationThe presence of many colleges and universities ensures that Boston’s population is among the nation’s most highly educated. 43.9 percent of Boston’s residents age 25 and over have a Bachelor’s degree or higher.

18 | Boston Economy Report 2015
Real Estate Market
The number of new building permits
has increased dramatically since 2010,
demonstrating recovery from the
recession. In 2013, there were 2,561 new
residential building permits. Most of the
new residential housing is in buildings
with five or more units. These large
residential buildings made up 92% of
the residential building permits issued
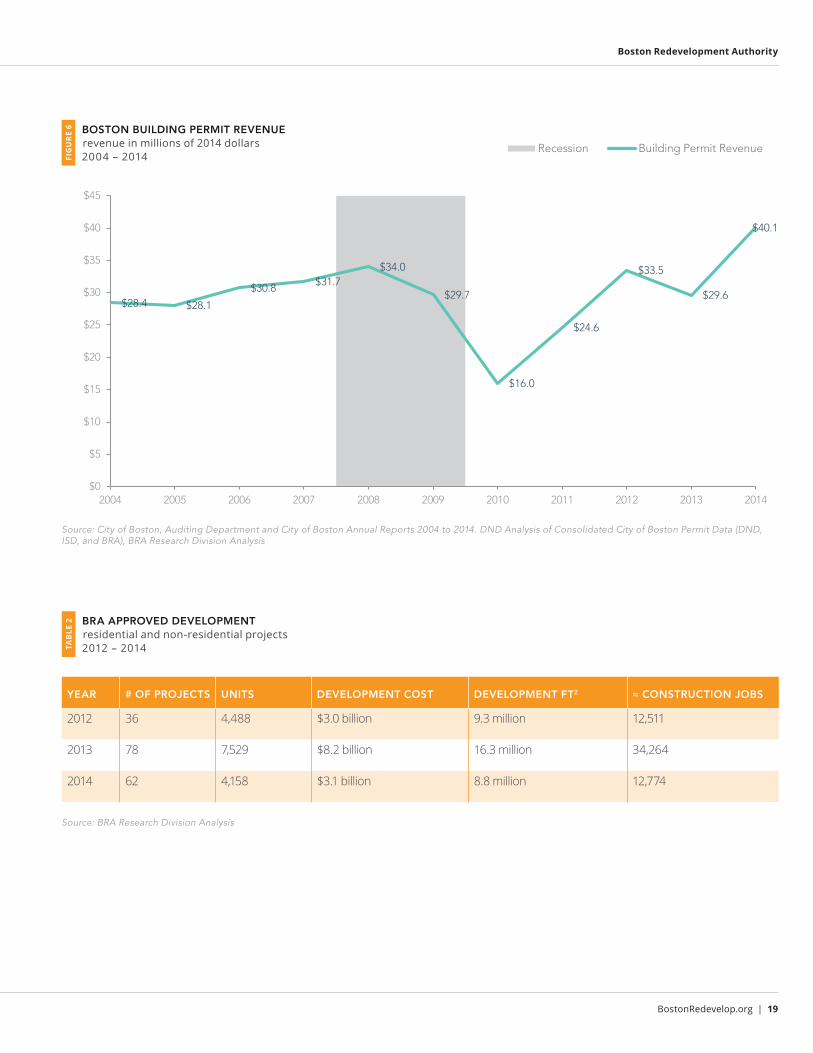
in 2013. FIGURE 6 (page 21) shows the
building permit revenue for the last
decade. Building permits declined
following the recession, but began to pick
up in 2011 and returned to prerecession
levels in 2012. Between 2013 and 2014,
building permit revenue increased 37
percent to $40.1 million, exceeding
revenues for the past ten years. The
building permit fee revenue for fiscal
year 2014 represented total construction
activity of an estimated $4.71 billion,
compared with an estimate of $3.49
billion for fiscal year 2013. The following
provides more detail on recent changes in
the housing and commercial markets.
Housing
In 2013, there were 273,113 housing units
in Boston, with an occupancy rate of
91.3%.
• In 2014, there were sales of 1,191
single family homes and 4,211
condominiums.9 This represented a
small decline relative to 2013.
• The citywide median single-family
home price was $432,750 for 2014.
The median sales price increased by
8.7 percent from 2013 to 2014.10 The
median condominium price increased
by 7.2 percent in 2014 to $470,500.
• Median prices for single family homes
and condominiums increased in the
last year, despite a decline in overall
unit sales, suggesting strong demand
in a market with limited supply.
• According to the Case-Shiller home
price index, Boston area home prices
have risen 15 percent in real terms
since 2012.11
• Boston’s citywide advertised median
monthly rents remained stable at
$2,400 from 2013 to 2014. Median
rents for an apartment in Boston’s
neighborhoods ranged from a high
of $2,750 in the South End to a low of
$1,475 in Hyde Park.12
• The goal of “Housing a Changing City
Boston 2030”, the 2030 housing plan,
is to add 53,000 new housing units by
2030, which will bring the total housing
units in Boston to 301,772.
Real Estate Market:Boston’s residential and commercial real estate markets have been strong in recent years.
BostonRedevelop.org | 19
Boston Redevelopment Authority
$28.4 $28.1
$30.8 $31.7$34.0
$29.7
$16.0
$24.6
$33.5
$29.6
$40.1
$0
$5
$10
$15
$20
$25
$30
$35
$40
$45
2004 2005 2006 2007 2008 2009 2010 2011 2012 2013 2014
Recession Building Permit RevenueSource: City of Boston, Auditing Department and City of Boston Annual Reports 2004 to 2014. DND Analysis of Consolidated City of Boston Permit Data (DND, ISD, and BRA), BRA Research Division Analysis
BOSTON BUILDING PERMIT REVENUE revenue in millions of 2014 dollars 2004 – 2014FI
GU
RE
6
$28.4 $28.1
$30.8 $31.7$34.0
$29.7
$16.0
$24.6
$33.5
$29.6
$40.1
$0
$5
$10
$15
$20
$25
$30
$35
$40
$45
2004 2005 2006 2007 2008 2009 2010 2011 2012 2013 2014
Recession Building Permit Revenue
YEAR # OF PROJECTS UNITS DEVELOPMENT COST DEVELOPMENT FT2 ≈ CONSTRUCTION JOBS
2012 36 4,488 $3.0 billion 9.3 million 12,511
2013 78 7,529 $8.2 billion 16.3 million 34,264
2014 62 4,158 $3.1 billion 8.8 million 12,774
BRA APPROVED DEVELOPMENT residential and non-residential projects 2012 – 2014TA
BLE
2
Source: BRA Research Division Analysis
20 | Boston Economy Report 2015
Real Estate Market
$59,387
$72,346
$28,198
$32,452
$10,000
$20,000
$30,000
$40,000
$50,000
$60,000
$70,000
$80,000
2000 2001 2002 2003 2004 2005 2006 2007 2008 2009 2010 2011 2012 2013 2014 2015
Recession Residential Property Commercial PropertySource: City of Boston Assessing Department, Property Tax Facts & Figures FY 2015, BRA Research Division Analysis
TOTAL ASSESSED VALUE OF RESIDENTIAL AND COMMERCIAL PROPERTY assessed value in millions of dollars 2000 – 2015FI
GU
RE
7
$59,387
$72,346
$28,198
$32,452
$10,000
$20,000
$30,000
$40,000
$50,000
$60,000
$70,000
$80,000
2000 2001 2002 2003 2004 2005 2006 2007 2008 2009 2010 2011 2012 2013 2014 2015
Recession Residential Property Commercial Property
$59,387
$72,346
$28,198
$32,452
$10,000
$20,000
$30,000
$40,000
$50,000
$60,000
$70,000
$80,000
2000 2001 2002 2003 2004 2005 2006 2007 2008 2009 2010 2011 2012 2013 2014 2015
Recession Residential Property Commercial Property
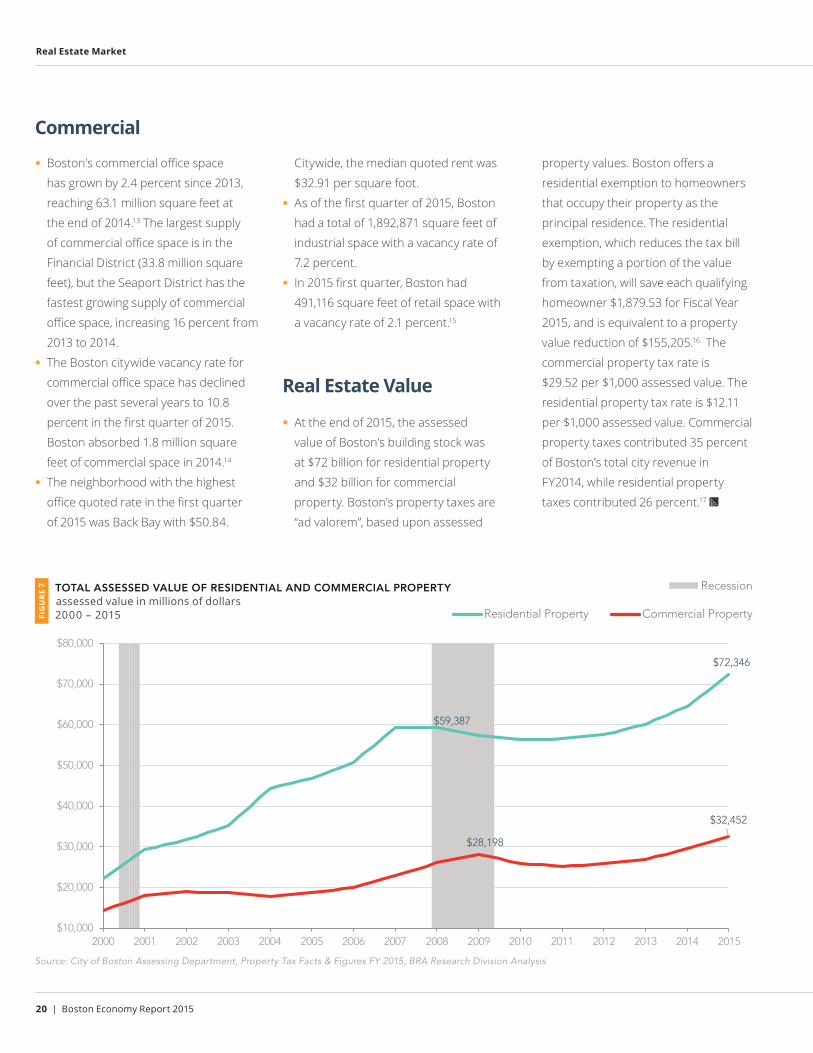
Commercial
• Boston’s commercial office space
has grown by 2.4 percent since 2013,
reaching 63.1 million square feet at
the end of 2014.13 The largest supply
of commercial office space is in the
Financial District (33.8 million square
feet), but the Seaport District has the
fastest growing supply of commercial
office space, increasing 16 percent from
2013 to 2014.
• The Boston citywide vacancy rate for
commercial office space has declined
over the past several years to 10.8
percent in the first quarter of 2015.
Boston absorbed 1.8 million square
feet of commercial space in 2014.14
• The neighborhood with the highest
office quoted rate in the first quarter
of 2015 was Back Bay with $50.84.
Citywide, the median quoted rent was
$32.91 per square foot.
• As of the first quarter of 2015, Boston
had a total of 1,892,871 square feet of
industrial space with a vacancy rate of
7.2 percent.
• In 2015 first quarter, Boston had
491,116 square feet of retail space with
a vacancy rate of 2.1 percent.15
Real Estate Value
• At the end of 2015, the assessed
value of Boston’s building stock was
at $72 billion for residential property
and $32 billion for commercial
property. Boston’s property taxes are
“ad valorem”, based upon assessed
property values. Boston offers a
residential exemption to homeowners
that occupy their property as the
principal residence. The residential
exemption, which reduces the tax bill
by exempting a portion of the value
from taxation, will save each qualifying
homeowner $1,879.53 for Fiscal Year
2015, and is equivalent to a property
value reduction of $155,205.16 The
commercial property tax rate is
$29.52 per $1,000 assessed value. The
residential property tax rate is $12.11
per $1,000 assessed value. Commercial
property taxes contributed 35 percent
of Boston’s total city revenue in
FY2014, while residential property
taxes contributed 26 percent.17
BostonRedevelop.org | 21
Boston Redevelopment Authority
22 | Boston Economy Report 2015
Moving Forward
In 2014 the Massachusetts economy
experienced the strongest expansion
since 200018, and according to the Council
of Economic Advisors (CEA) the U.S.
added jobs “at the fastest pace since
1990s” pushing the unemployment rate
to its lowest level in the past six years.19
Projections for the national economy
from the CEA, Federal Reserve Bank,
and Congressional Budget Office (CBO)
anticipate growth between 2.7 and 3.0
percent through 2017, settling into a
long-run average of 2.3 to 2.5% for 2018
and beyond.20 At the state level, the New
England Economic Partnership (NEEP)
projects the Massachusetts economy will
grow by 2.6 to 2.7 percent in 2016 and 2017.
NEEP also expects statewide growth to
level off in 2018, with slower growth at 2.0
percent per year.
On an industry basis, NEEP’s employment
forecast suggests the following:
• Professional and business services will
outperform other industries;
• Growth in the construction industry will
continue; and
• Job growth in health care, education, and
leisure and hospitality will exceed the
anticipated average growth rate of 2.6
percent.
In the last two years, Boston’s economy
grew significantly, resulting in more jobs,
lower unemployment, and increased
development within the city. Strategic
investments in education, housing, and
transportation infrastructure will be
important to ensure long term economic
growth. The citywide plan “Imagine Boston
2030” will provide a framework for Boston’s
future. The current economic conditions
that support projections of economic
growth include the following:
• INTEREST RATES. Historically low
interest rates of 0 to 0.25 percent have
reduced the cost of borrowing.
• FINANCIAL HEALTH. The City of
Boston’s AAA bond rating was confirmed
in 2015 on the basis of fiscal management
and strong economic activity.
• LABOR MARKETS. Statewide
unemployment forecasts suggest an
unemployment rate in the five percent
range by 2018. Boston’s unemployment
rate is already below five percent, and
has remained lower than the state and
nation since 2007.
While there is still some uncertainty in local
and national markets, the overall economic
indicators and projections suggest positive
Moving Forward:While recent growth in Boston has exceeded statewide and national growth, conditions are improving across all three geographies.
BostonRedevelop.org | 23
Boston Redevelopment Authority
economic growth will continue in the
region.
APPENDIX A: Boston GCP Estimate Methodology
To estimate Gross City Product for Boston,
the BRA Research Division uses data from
the Bureau of Economic Analysis (BEA) on
Gross State Product (GSP) by industry for
Massachusetts, and personal income and
earnings by industry for Massachusetts
and Suffolk County.
GDP is an estimate of the economy’s total
value added, which is equivalent to the total
income accruing to all factors of production
plus any taxes paid directly by businesses.
The BEA estimates state-level GDP based
on data on labor income, capital income
and business taxes, with labor income
accounting for between 65 and 70 percent
of Massachusetts’s GDP each year.21
Precisely estimating corporate income and
business taxes paid at lower geographies
is difficult with existing data, but the BEA’s
personal income and earnings series allows
estimation of labor and proprietorship
income at the county level for each
industry. In the absence of data on the
other components, we use the county-level
fraction of personal income and earnings
by industry to estimate the fraction of
the state’s economic activity occurring in
Suffolk County. To be precise
𝐺𝐺𝐺𝐺𝐺𝐺𝑐𝑐𝑐𝑐𝑐𝑐𝑐𝑐 = ∑ 𝐺𝐺𝐺𝐺𝐺𝐺𝑖𝑖𝑠𝑠𝑐𝑐𝑠𝑠𝑐𝑐𝑠𝑠 𝐸𝐸𝐸𝐸𝐸𝐸𝐸𝐸𝑖𝑖
𝑐𝑐𝑐𝑐𝑐𝑐𝑐𝑐
𝐸𝐸𝐸𝐸𝐸𝐸𝐸𝐸𝑖𝑖𝑠𝑠𝑐𝑐𝑠𝑠𝑐𝑐𝑠𝑠
𝑐𝑐
𝑐𝑐=𝑖𝑖
where i indexes industries, GDPistate is taken
from the BEA’s state GDP estimate for
Massachusetts, and EARNicnty and EARNi
state
are taken from BEA’s county (series CA5N)
and state (series SA5N) personal income
and earnings series.
Using similar logic, we use data on
total earnings in Boston compared to
Suffolk County from the Massachusetts
Executive Office of Labor and Workforce
Development (EOLWD) to estimate the
share of Suffolk earnings that occur in
Boston. We find this ratio varies little over
time, and therefore use a uniform value of
97.75% for simplicity.
We use nominal estimates of GDP and
earnings in our calculations, then index the
final calculations to 2013 real dollars using
the BEA’s national GDP deflator.22
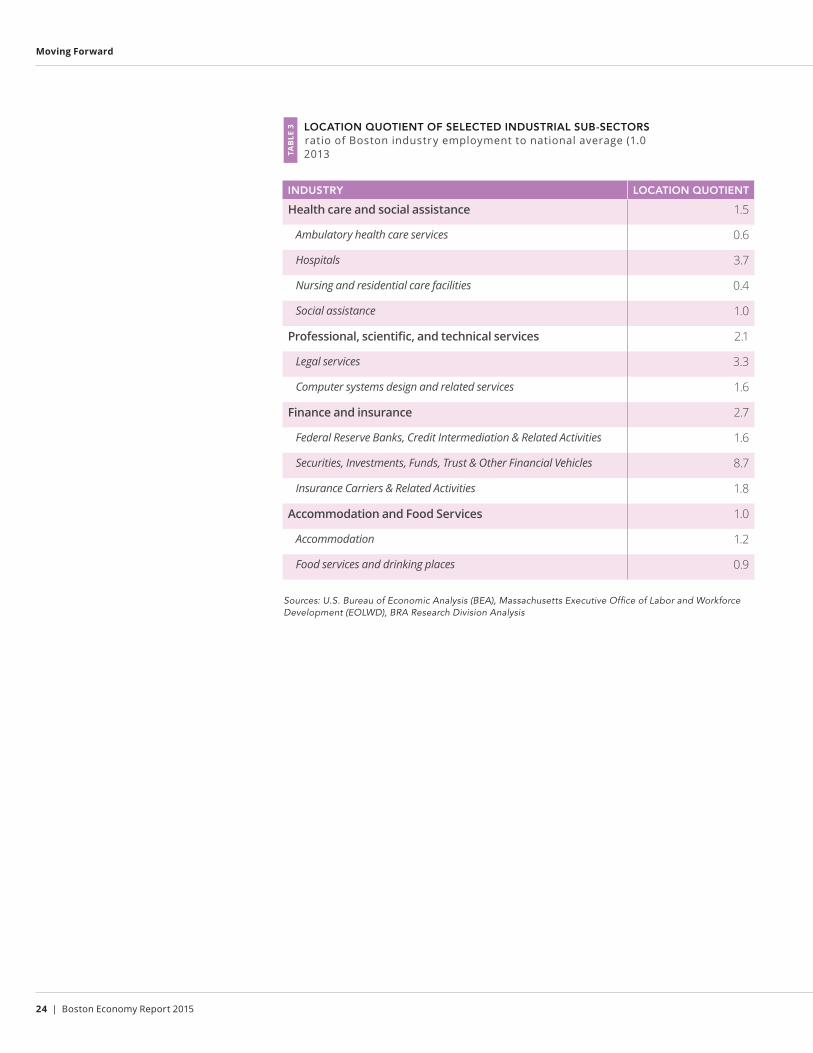
APPENDIX B: Location Quotient Analysis
A location quotient is a relative measure of
local industrial concentration compared
to the national average. In this case, the
location quotient is the percent of total
employment in an industry in Boston
divided by the percent that same industry
makes up in the U.S. economy.
𝐿𝐿𝐿𝐿𝑖𝑖 = 𝑒𝑒𝑖𝑖 𝑒𝑒𝑇𝑇⁄𝐸𝐸𝑖𝑖 𝐸𝐸𝑇𝑇
⁄
Where:
ei= Industry i employment in Boston
eT= Total employment in Boston
Ei= Industry i employment in U.S.
ET= Total employment in U.S.
Values over one indicate a greater industry
concentration in Boston as compared to
the U.S. Values below one denote a local
industry concentration less than the U.S.
The chart below provides location quotients
for the major top four private industries and
their associated sub-industries.
24 | Boston Economy Report 2015
Moving Forward
LOCATION QUOTIENT OF SELECTED INDUSTRIAL SUB-SECTORS ratio of Boston industry employment to national average (1.0 2013TA
BLE
3
INDUSTRY LOCATION QUOTIENT
Health care and social assistance 1.5
Ambulatory health care services 0.6
Hospitals 3.7
Nursing and residential care facilities 0.4
Social assistance 1.0
Professional, scientific, and technical services 2.1
Legal services 3.3
Computer systems design and related services 1.6
Finance and insurance 2.7
Federal Reserve Banks, Credit Intermediation & Related Activities 1.6
Securities, Investments, Funds, Trust & Other Financial Vehicles 8.7
Insurance Carriers & Related Activities 1.8
Accommodation and Food Services 1.0
Accommodation 1.2
Food services and drinking places 0.9
Sources: U.S. Bureau of Economic Analysis (BEA), Massachusetts Executive Office of Labor and WorkforceDevelopment (EOLWD), BRA Research Division Analysis
BostonRedevelop.org | 25
Boston Redevelopment Authority
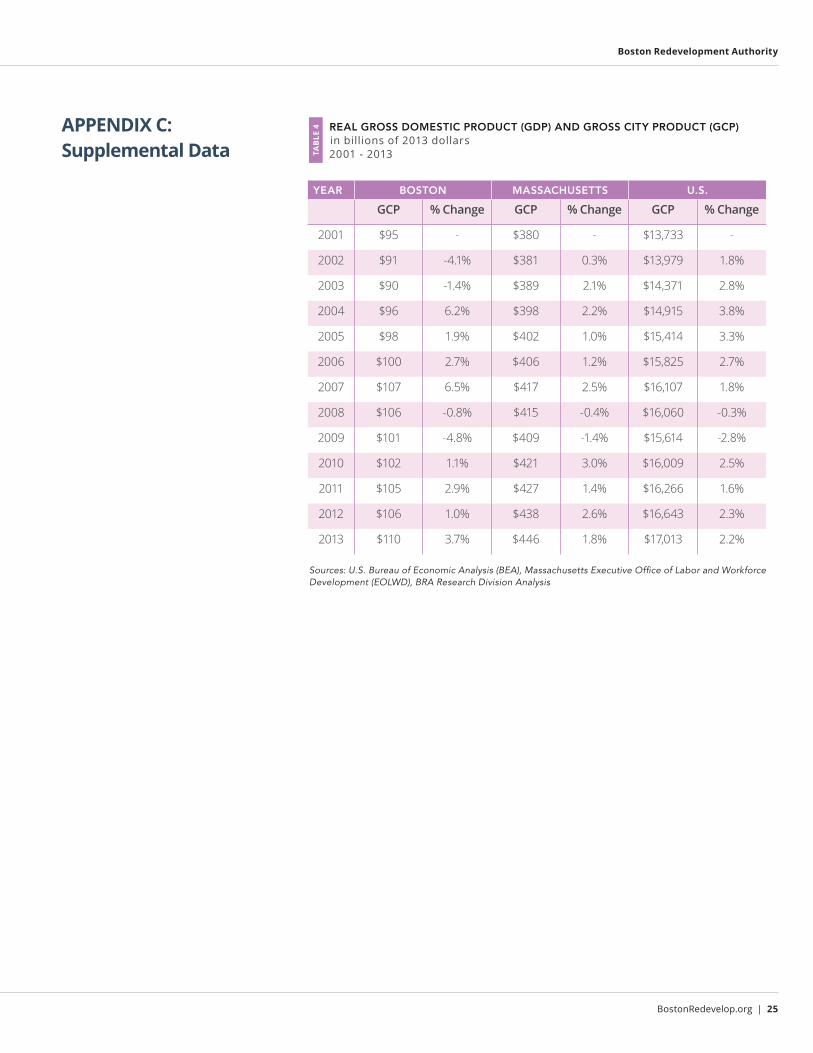
APPENDIX C: Supplemental Data
REAL GROSS DOMESTIC PRODUCT (GDP) AND GROSS CITY PRODUCT (GCP) in billions of 2013 dollars 2001 - 2013TA
BLE
4
YEAR BOSTON MASSACHUSETTS U.S.
GCP % Change GCP % Change GCP % Change
2001 $95 - $380 - $13,733 -
2002 $91 -4.1% $381 0.3% $13,979 1.8%
2003 $90 -1.4% $389 2.1% $14,371 2.8%
2004 $96 6.2% $398 2.2% $14,915 3.8%
2005 $98 1.9% $402 1.0% $15,414 3.3%
2006 $100 2.7% $406 1.2% $15,825 2.7%
2007 $107 6.5% $417 2.5% $16,107 1.8%
2008 $106 -0.8% $415 -0.4% $16,060 -0.3%
2009 $101 -4.8% $409 -1.4% $15,614 -2.8%
2010 $102 1.1% $421 3.0% $16,009 2.5%
2011 $105 2.9% $427 1.4% $16,266 1.6%
2012 $106 1.0% $438 2.6% $16,643 2.3%
2013 $110 3.7% $446 1.8% $17,013 2.2%
Sources: U.S. Bureau of Economic Analysis (BEA), Massachusetts Executive Office of Labor and Workforce Development (EOLWD), BRA Research Division Analysis
26 | Boston Economy Report 2015
Moving Forward
ANNUAL MEAN WAGE BY INDUSTRY payroll jobs 2013TA
BLE
5
INDUSTRY BOSTON MASSACHUSETTS
Finance and Insurance $187,252 $127,400
Management of Companies and Enterprises $126,724 $118,456
Professional and Technical Services $118,040 $109,876
Utilities $100,152 $97,136
Construction $92,144 $65,936
Real Estate and Rental and Leasing $90,948 $69,628
Information $87,308 $93,340
Wholesale Trade $82,056 $84,500
Public Administration $77,688 $65,988
Arts, Entertainment, and Recreation $77,064 $35,256
Manufacturing $76,908 $63,596
Health Care and Social Assistance $70,928 $52,260
Educational Services $65,260 $56,004
Transportation and Warehousing $60,112 $49,140
Administrative and Waste Services $49,764 $41,600
Other Services, Ex. Public Admin $40,352 $33,176
Retail Trade $33,124 $28,912
Accommodation and Food Services $27,508 $20,540
Agriculture, Forestry, Fishing & Hunting $26,780 $52,676
TOTAL, All Industries $83,356 $61,776
Sources: Massachusetts Executive Office of Labor and Workforce Development (EOLWD), BRA Research Division Analysis
BostonRedevelop.org | 27
Boston Redevelopment Authority
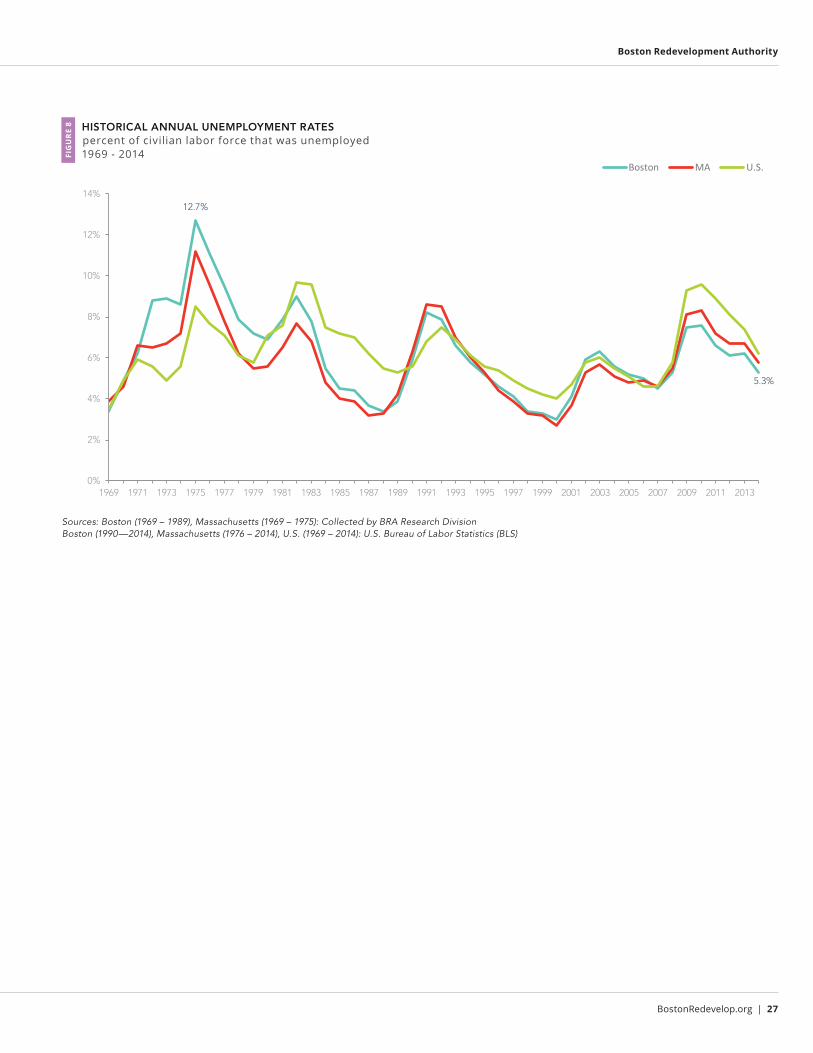
HISTORICAL ANNUAL UNEMPLOYMENT RATES percent of civilian labor force that was unemployed 1969 - 2014FI
GU
RE
8
Sources: Boston (1969 – 1989), Massachusetts (1969 – 1975): Collected by BRA Research DivisionBoston (1990—2014), Massachusetts (1976 – 2014), U.S. (1969 – 2014): U.S. Bureau of Labor Statistics (BLS)
12.7%
5.3%
0%
2%
4%
6%
8%
10%
12%
14%
1969 1971 1973 1975 1977 1979 1981 1983 1985 1987 1989 1991 1993 1995 1997 1999 2001 2003 2005 2007 2009 2011 2013
Boston MA U.S.
12.7%
5.3%
0%
2%
4%
6%
8%
10%
12%
14%
1969 1971 1973 1975 1977 1979 1981 1983 1985 1987 1989 1991 1993 1995 1997 1999 2001 2003 2005 2007 2009 2011 2013
Boston MA U.S.
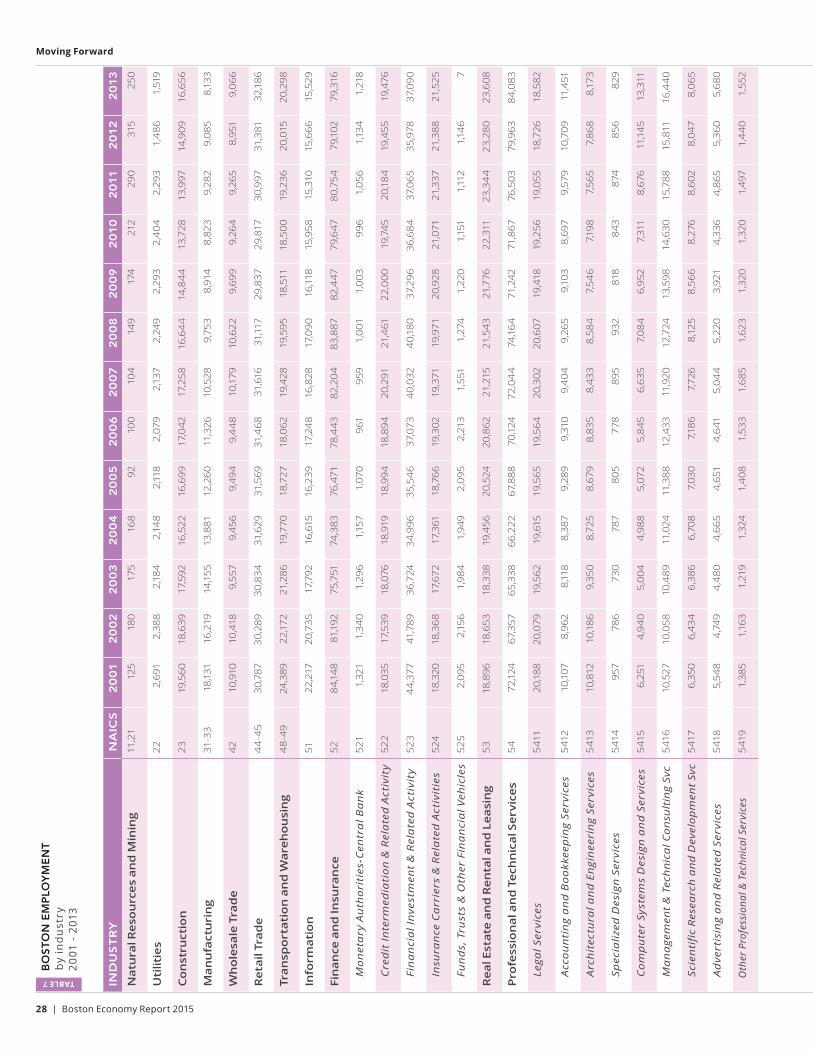
28 | Boston Economy Report 2015
Moving Forward
BO
ST
ON
EM
PLO
YM
EN
T
by
ind
ust
ry 2
001
- 2
013
TABLE 7 IND
US
TR
YN
AIC
S2
001
20
02
20
03
20
04
20
05
20
06
20
07
20
08
20
09
2010
2011
2012
2013
Nat
ura
l Res
ou
rces
an
d M
inin
g11
,21
125
180
175
168
9210
010
414
917
421
229
031
525
0
Uti
litie
s2
22,
691
2,38
82,
184
2,14
82,
118
2,07
92,
137
2,24
92,
293
2,4
042,
293
1,4
861,
519
Co
nst
ruct
ion
23
19,5
6018
,639
17,5
9216
,522
16,6
9917
,042
17,2
5816
,64
414
,84
413
,728
13,9
9714
,909
16,6
56
Man
ufa
ctu
rin
g31
-33
18,1
3116
,219
14,1
5513
,881
12,2
6011
,326
10,5
289,
753
8,91
48,
823
9,28
29,
085
8,13
3
Wh
ole
sale
Tra
de
4210
,910
10,4
189,
557
9,45
69,
494
9,4
48
10,1
7910
,622
9,69
99,
264
9,26
58,
951
9,06
6
Ret
ail T
rad
e4
4-4
530
,787
30,2
8930
,834
31,6
2931
,569
31,4
6831
,616
31,11
729
,837
29,8
1730
,997
31,3
8132
,186
Tran
spo
rtat
ion
an
d W
areh
ou
sin
g4
8-4
924
,389
22,1
7221
,286
19,7
7018
,727
18,0
6219
,428
19,5
9518
,511
18,5
0019
,236
20,0
1520
,298
Info
rmat
ion
5122
,217
20,7
3517
,792
16,6
1516
,239
17,2
48
16,8
2817
,090
16,11
815
,958
15,3
1015
,666
15,5
29
Fin
ance
an
d In
sura
nce
5284
,148
81,1
9275
,751
74,3
8376
,471
78,4
4382
,204
83,8
8782
,447
79,6
4780
,754
79,1
0279
,316
M
on
eta
ry A
uth
ori
ties
-Cen
tra
l Ba
nk
521
1,32
11,
340
1,29
61,
157
1,07
096
195
91,
001
1,00
399
61,
056
1,13
41,
218
C
red
it I
nte
rmed
iati
on
& R
ela
ted
Act
ivit
y52
218
,035
17,5
3918
,076
18,9
1918
,994
18,8
9420
,291
21,4
6122
,000
19,7
4520
,18
419
,455
19,4
76
Fi
na
nci
al I
nve
stm
ent
& R
ela
ted
Act
ivit
y52
34
4,37
741
,789
36,7
2434
,996
35,5
46
37,0
734
0,03
24
0,18
037
,296
36,6
84
37,0
6535
,978
37,0
90
In
sura
nce
Ca
rrie
rs &
Rel
ate
d A
ctiv
itie
s52
418
,320
18,3
6817
,672
17,3
6118
,766
19,3
0219
,371
19,9
7120
,928
21,0
7121
,337
21,3
8821
,525
Fu
nd
s, T
rust
s &
Oth
er F
ina
nci
al V
ehic
les
525
2,09
52,
156
1,98
41,
949
2,09
52,
213
1,55
11,
274
1,22
01,
151
1,11
21,
146
7
Rea
l Est
ate
and
Ren
tal a
nd
Lea
sin
g53
18,8
9618
,653
18,3
3819
,456
20,5
2420
,862
21,2
1521
,543
21,7
7622
,311
23,3
44
23,2
8023
,608
Pro
fess
ion
al a
nd
Tec
hn
ical
Ser
vice
s5
472
,124
67,3
5765
,338
66,2
2267
,888
70,1
2472
,04
474
,16
471
,242
71,8
6776
,503
79,9
638
4,08
3
Le
gal S
ervi
ces
541
120
,188
20,0
7919
,562
19,6
1519
,565
19,5
64
20,3
0220
,607
19,4
1819
,256
19,0
5518
,726
18,5
82
A
cco
un
tin
g a
nd
Bo
okk
eep
ing
Serv
ices
541
210
,107
8,96
28,
118
8,38
79,
289
9,31
09,
404
9,26
59,
103
8,69
79,
579
10,7
0911
,451
A
rch
itec
tura
l an
d E
ngi
nee
rin
g Se
rvic
es5
413
10,8
1210
,186
9,35
08,
725
8,67
98,
835
8,43
38,
584
7,54
67,
198
7,56
57,
868
8,17
3
Sp
ecia
lized
Des
ign
Ser
vice
s5
414
957
786
730
787
805
778
895
932
818
843
874
856
829
C
om
pu
ter
Syst
ems
Des
ign
an
d S
ervi
ces
541
56,
251
4,94
05,
004
4,98
85,
072
5,8
456,
635
7,08
46,
952
7,31
18,
676
11,1
4513
,311
M
an
age
men
t &
Tec
hn
ica
l Co
nsu
ltin
g Sv
c5
416
10,5
2710
,058
10,4
8911
,024
11,3
8812
,433
11,9
2012
,724
13,5
9814
,630
15,7
8815
,811
16,4
40
Sc
ien
tifi
c R
esea
rch
an
d D
evel
op
men
t Sv
c5
417
6,35
06,
434
6,38
66,
708
7,03
07,
186
7,72
68,
125
8,56
68,
276
8,60
28,
047
8,06
5
A
dve
rtis
ing
an
d R
ela
ted
Ser
vice
s5
418
5,54
84,
749
4,4
804,
665
4,65
14,
641
5,04
45,
220
3,92
14,
336
4,86
55,
360
5,68
0
O
ther
Pro
fess
iona
l & T
echn
ical
Ser
vice
s5
419
1,38
51,
163
1,21
91,
324
1,4
081,
533
1,68
51,
623
1,32
01,
320
1,49
71,
44
01,
552
BostonRedevelop.org | 29
Boston Redevelopment Authority
Sour
ces:
U.S
. Bur
eau
of E
cono
mic
Ana
lysi
s (B
EA
), M
assa
chus
etts
Exe
cutiv
e O
ffice
of L
abo
r an
d W
ork
forc
e D
evel
op
men
t (E
OLW
D),
BR
A R
esea
rch
Div
isio
n A
naly
sis
No
te: T
he e
mp
loym
ent
of s
ub-s
ecto
rs m
ay n
ot
add
up
to
sup
er-s
ecto
rs d
ue t
o ro
und
ing
.
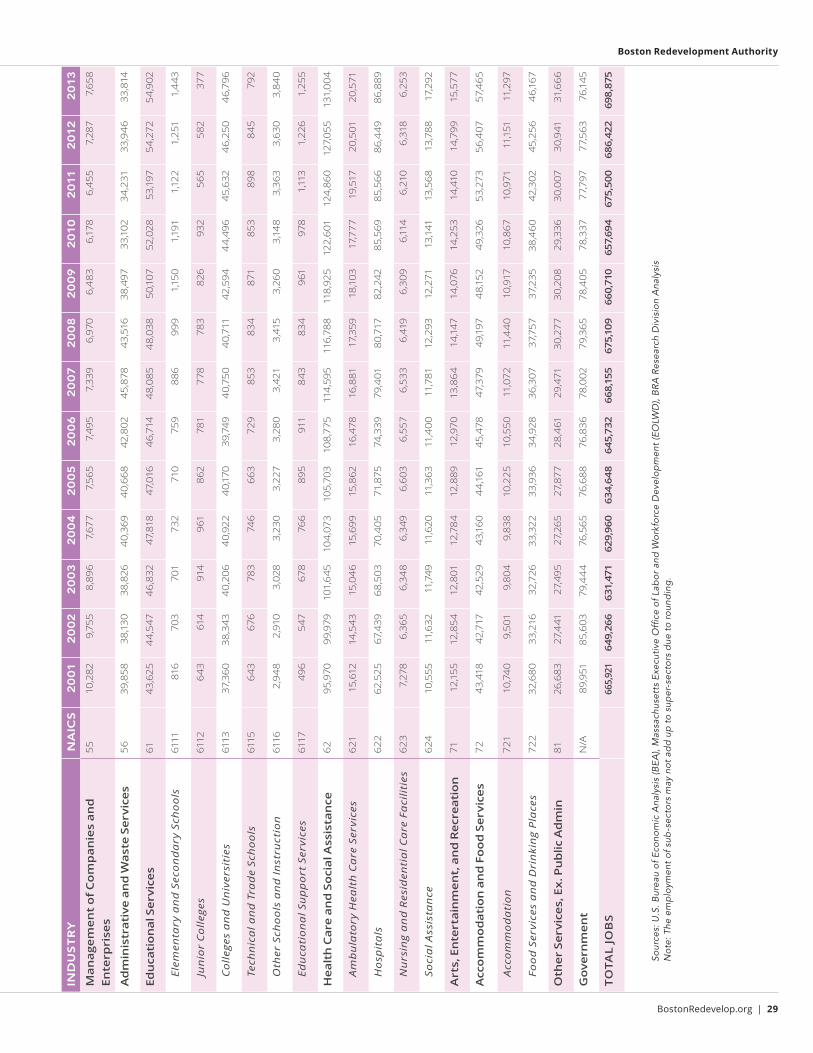
IND
US
TR
YN
AIC
S2
001
20
02
20
03
20
04
20
05
20
06
20
07
20
08
20
09
2010
2011
2012
2013
Ma
na
gem
en
t o
f C
om
pa
nie
s a
nd
En
terp
rise
s55
10,2
829,
755
8,89
67,
677
7,56
57,
495
7,33
96,
970
6,4
836,
178
6,45
57,
287
7,65
8
Ad
min
istr
ativ
e an
d W
aste
Ser
vice
s56
39,8
5838
,130
38,8
264
0,36
94
0,66
842
,802
45,8
7843
,516
38,4
9733
,102
34,2
3133
,94
633
,814
Edu
cati
on
al S
ervi
ces
6143
,625
44,
547
46,
832
47,8
1847
,016
46,
714
48,
085
48,
038
50,1
0752
,028
53,1
9754
,272
54,9
02
El
emen
tary
an
d S
eco
nd
ary
Sch
oo
ls61
1181
670
370
173
271
075
988
699
91,
150
1,19
11,
122
1,25
11,
443
Ju
nio
r C
olle
ges
6112
643
614
914
961
862
781
778
783
826
932
565
582
377
C
olle
ges
an
d U
niv
ersi
ties
6113
37,3
6038
,343
40,
206
40,
922
40,
170
39,7
494
0,75
04
0,71
142
,594
44,
496
45,6
324
6,25
04
6,79
6
Te
chn
ica
l an
d T
rad
e Sc
ho
ols
6115
643
676
783
746
663
729
853
834
871
853
898
845
792
O
ther
Sch
oo
ls a
nd
In
stru
ctio
n61
162,
948
2,91
03,
028
3,23
03,
227
3,28
03,
421
3,41
53,
260
3,14
83,
363
3,63
03,
84
0
Ed
uca
tio
na
l Su
pp
ort
Ser
vice
s61
1749
654
767
876
689
591
18
4383
496
197
81,
113
1,22
61,
255
Hea
lth
Car
e an
d S
oci
al A
ssis
tan
ce62
95,9
7099
,979
101,
645
104,
073
105,
703
108,
775
114,
595
116,
788
118,
925
122,
601
124,
860
127,
055
131,
004
A
mb
ula
tory
Hea
lth
Ca
re S
ervi
ces
621
15,6
1214
,543
15,0
46
15,6
9915
,862
16,4
7816
,881
17,3
5918
,103
17,7
7719
,517
20,5
0120
,571
H
osp
ita
ls62
262
,525
67,4
3968
,503
70,4
0571
,875
74,3
3979
,401
80,7
1782
,242
85,5
6985
,566
86,4
4986
,889
N
urs
ing
an
d R
esid
enti
al C
are
Fa
cili
ties
623
7,27
86,
365
6,34
86,
349
6,60
36,
557
6,53
36,
419
6,30
96,
114
6,21
06,
318
6,25
3
So
cia
l Ass
ista
nce
624
10,5
5511
,632
11,7
4911
,620
11,3
6311
,400
11,7
8112
,293
12,2
7113
,141
13,5
6813
,788
17,2
92
Art
s, E
nte
rtai
nm
ent,
an
d R
ecre
atio
n71
12,1
5512
,854
12,8
0112
,78
412
,889
12,9
7013
,86
414
,147
14,0
7614
,253
14,4
1014
,799
15,5
77
Acc
om
mo
dat
ion
an
d F
oo
d S
ervi
ces
7243
,418
42,7
1742
,529
43,1
604
4,16
145
,478
47,3
7949
,197
48,
152
49,3
2653
,273
56,4
0757
,465
A
cco
mm
od
ati
on
72
110
,74
09,
501
9,80
49,
838
10,2
2510
,550
11,0
7211
,44
010
,917
10,8
6710
,971
11,1
5111
,297
Fo
od
Ser
vice
s a
nd
Dri
nki
ng
Pla
ces
722
32,6
8033
,216
32,7
2633
,322
33,9
3634
,928
36,3
0737
,757
37,2
3538
,460
42,3
0245
,256
46,
167
Oth
er S
ervi
ces,
Ex.
Pu
blic
Ad
min
8126
,683
27,4
4127
,495
27,2
6527
,877
28,4
6129
,471
30,2
7730
,208
29,3
3630
,007
30,9
4131
,666
Go
vern
men
tN
/A89
,951
85,6
0379
,44
476
,565
76,6
8876
,836
78,0
0279
,365
78,4
0578
,337
77,7
9777
,563
76,1
45
TO
TAL
JOB
S66
5,92
164
9,26
663
1,47
162
9,96
063
4,64
864
5,73
266
8,15
567
5,10
966
0,71
065
7,69
467
5,50
068
6,42
269
8,87
5
30 | Boston Economy Report 2015
End Notes
End Notes1 Gross City Product (GCP) is an aggregate
measure of economic activity, synonymous to national gross domestic product (GDP).
2 The BRA Research Division uses the Bureau of Economic Analysis (BEA) definition of total employment, which includes both payroll and non-payroll jobs. The BEA releases county-level estimates by industry, and for each industry the BRA Research Division apportions Suffolk County non-payroll employment to Boston based on the city’s fraction of county payroll employment as estimated using unemployment insurance data (ES-202) made available at the city and county level by the Massachusetts Executive Office of Labor and Workforce Development.
3 The unemployment rate from January to April in 2015 is below 5 percent, similar to the level during the same months in 2007 and 2008.
4 High Tech jobs represent jobs in industries with a high proportion of their workforce in science, technology, engineering and math (STEM) occupations, following a classification developed by the U.S. Bureau of Labor Statistics.
5 Boston’s Living Wage Ordinance requires most firms receiving city contracts or loans to pay a Living Wage of $14.11 an hour to all employees. This amount, updated annually is based on the federal poverty guidelines for a family of four. The Living Wage of $14.11 is in effect through June 30, 2016.
6 InfoUSA; American Hospital Association; National Center for Education Statistics; Direct Employer Contact; BRA Research Division Analysis. Estimates reflect most recent available data.
7 Source: “Revenue Estimates and Analysis FY15”, City of Boston Department of Revenue, http://www.cityofboston.gov/images_documents/Revenue%20Estimates%20and%20Analysis_tcm3-50814.pdf
8 A job-year represents one job for one year. If a project takes three years to complete and a construction worker is employed throughout the duration of the project that worker counts as having worked three job-years.
9 City of Boston, Department of Neighborhood Development using Banker & Tradesman data, February 2015, BRA Research Division Analysis
10 City of Boston, Department of Neighborhood Development using Banker & Tradesman data, February 2015
11 1985 – 2015 S&P/Case-Shiller Home Price Indices Inc., deflated by U.S. Consumer Price Index, BRA Research Division Analysis. The S&P/Case-Shiller Home Price Indices are calculated monthly using a three-month moving average.
12 City of Boston, Department of Neighborhood Development using Multiple Listing Service (MLS), January 2015, BRA Research Division Analysis
13 Colliers International, Market Snapshot 1990-2014 Q4 Statistics
14 Absorption is the net change in the occupied square footage.
15 CoStar Property, Total Market Statistics 1st Quarter 2015
16 Property Tax Facts & Figures, City of Boston Assessing Department, Fiscal year 2015
17 According to City of Boston Office of Budget Management and Assessing Department.
18 Massachusetts Economy Expansion Strongest Since 2000: Rising Tide is Beginning to Lift More Boats but Challenges Remain, UMass Donahue Institute
19 2015 Economic Report of the President, Council of Economic Advisors
20 The GDP was projected jointly by Council of Economic Advisors, the Department of the Treasury, and the Office of Management and Budget
21 Bureau of Economic Analysis, Gross Domestic Product by State Estimation Methodology, http://www.bea.gov/regional/pdf/gsp/gdpstate.pdf
22 Table 1.1.4 Price Indexes for Gross Domestic Product, National Income and Product Accounts Tables (NIPA Tables), BEA, http://www.bea.gov/iTable/index_nipa.cfm

BostonRedevelop.org | 31
Boston Redevelopment Authority