Embed Size (px)
Citation preview

8/8/2019 Lucky Cement Ltd. Detail Report WE Financial Services Ltd. August 2010
http://slidepdf.com/reader/full/lucky-cement-ltd-detail-report-we-financial-services-ltd-august-2010 1/11
URL: www.we.com.pk
Cement Sector
Company Update
LUCKY CEMENTL UCK : R IDING ON E XPORT
August 2010
8/8/2019 Lucky Cement Ltd. Detail Report WE Financial Services Ltd. August 2010
http://slidepdf.com/reader/full/lucky-cement-ltd-detail-report-we-financial-services-ltd-august-2010 2/11
Company Update
KEY DATAKATS code LUCKReuters code LUCK.KACurrent price (Rs) 66.79Year high, low (Rs) 84.31, 58Year ADV (mn) 2.1Adjusted Beta 1.2Market cap (RS'bn) 21.54Market cap (US$ mn) 252Shares outstanding (mn) 323Free float (%) 40Major shareholder Younus BrothersFair value (Rs) 77.2Upside potential (%) 16
Luck: Riding on Export
Continuation of coverage with BUY stance on LUCK with 16% upsidepotential
We continue our detailed coverage on Lucky Cement Company (LUCK) witha DCF value of Rs 77.2/share. We like LUCK due to 1) timely expansion giv-ing Company an edge 2) export market share of more than 30% 3) simulta-neous Presence in both Northern and Southern region of the country 4)attractive price multiples (it is currently trading at FY11 PER and PBV of5.98x & 0.72x). We recommend 'BUY' on LUCK.
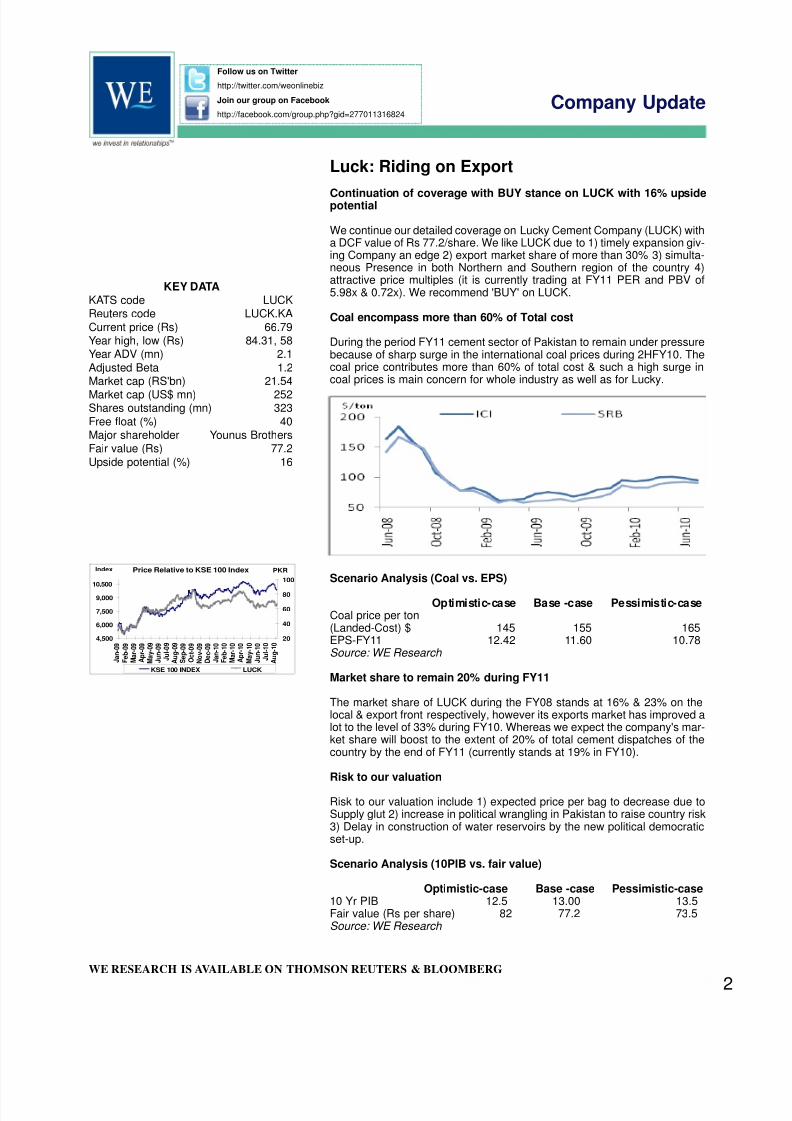
Coal encompass more than 60% of Total cost
During the period FY11 cement sector of Pakistan to remain under pressurebecause of sharp surge in the international coal prices during 2HFY10. Thecoal price contributes more than 60% of total cost & such a high surge incoal prices is main concern for whole industry as well as for Lucky.
Scenario Analysis (Coal vs. EPS)
Optimistic-case Base -case Pessimistic-caseCoal price per ton(Landed-Cost) $ 145 155 165EPS-FY11 12.42 11.60 10.78Source: WE Research
Market share to remain 20% during FY11
The market share of LUCK during the FY08 stands at 16% & 23% on thelocal & export front respectively, however its exports market has improved alot to the level of 33% during FY10. Whereas we expect the company's mar-ket share will boost to the extent of 20% of total cement dispatches of thecountry by the end of FY11 (currently stands at 19% in FY10).
Risk to our valuation
Risk to our valuation include 1) expected price per bag to decrease due toSupply glut 2) increase in political wrangling in Pakistan to raise country risk3) Delay in construction of water reservoirs by the new political democraticset-up.
Scenario Analysis (10PIB vs. fair value)
Optimistic-case Base -case Pessimistic-case10 Yr PIB 12.5 13.00 13.5Fair value (Rs per share) 82 77.2 73.5Source: WE Research
Follow us on Twitter
http://twitter.com/weonlinebiz
Join our group on Facebook
http://facebook.com/group.php?gid=277011316824
WE RESEARCH IS AVAILABLE ON THOMSON REUTERS & BLOOMBERG
Price Relative to KSE 100 Index
4,500
6,000
7,500
9,000
10,500
J a n - 0
9
F e
b - 0
9
M a r - 0
9
A p r - 0
9
M a y - 0
9
J u n - 0
9
J u
l - 0 9
A u g - 0
9
S e p - 0
9
O c t - 0 9
N o v - 0
9
D e c - 0
9
J a n - 1
0
F e
b - 1
0
M a r - 1
0
A p r - 1
0
M a y - 1
0
J u n - 1
0
J u
l - 1 0
A u g - 1
0 20
40
60
80
100
KSE 100 INDEX LUCK
Index PKR
2

8/8/2019 Lucky Cement Ltd. Detail Report WE Financial Services Ltd. August 2010
http://slidepdf.com/reader/full/lucky-cement-ltd-detail-report-we-financial-services-ltd-august-2010 3/11
Company Update
Net sales revenue of the company isexpected to touch Rs. 28.6 billion duringFY13
Valuation remain terrific
LUCK with Fair value of PKR 77.2/ share offering an upside potential of15.6% from current level. We have value LUCK on Discounted cash flowmethod (DCF). Trading at FY11E PER of 5.98x, with estimated ROE of13.31 for the period FY11, we believe LUCK trades at a discount to its worth.
FY09A FY10A FY11F FY12FEPS (Rs) 14.21 9.70 11.60 10.98Book value (Rs/share) 71.90 77.60 88.80 97.25DPS (%) 4.00 4.00 3.50 4.00PE (X) 4.70 6.89 5.76 6.08P/BV (X) 0.93 0.86 0.75 0.69Dividend Yield (%) 6.0 6.0 5.2 6.0Dividend Payout (%) 28.1 41.2 30.2 36.4Source: Company reports & WE Research
Sales revenue to remain lackluster going forward
Net sales revenue of the company is expected to touch Rs. 28.6 billion dur-ing FY13 which will be the highest revenue stream in the form of net salesby LUCK. However net sales of the company have remained weak duringthe past couple of years owing to the domestic dreary cement prices.
Cement dispatches of the company to remained dreary
Going forward we expect cement dispatches of the company to remain drea-ry primarily due to the above mentioned reason of lower exports volumesdue to the massive regional expansion. However cement dispatches on thelocal front is expected to remain balanced on the back of government con-
tinued focus on infrastructure development and work on the floods effectedareas to boost local cement consumption.
Vertical integration to bright the future
Lucky has also made an arrangement with the European company to extractcoal locally from the Thar coal field (the largest coal field in Asia). Howeverwe expect it to be positive for the company in the longer run as 5% lowercoal cost boosts company's EPS by 9%. Moreover as per our estimationextraction cost should not be more than $10 per ton if extract in bulk, thusaround 5% of cost saving in the present scenario and is expected toincrease further, as extraction cost tend to decrease with the passage oftime.
Power sale agreement is also another diversification strategy
Lucky Cement Company is the largest cement producer of the country,expanding its wings to the huge different contracts such as 10-year agree-ment of power sale with KESC having strapped facility. The company'spower sale agreement with KESC is a take and pay agreement of 49.5MWpower supply from its Karachi plant. Sale is expected to start from the startof FY11 with the link to Lucky's power generation unit to KESC's grid inKarachi. However we expect the company will be able to supply only 30MWof excess power utility to KESC out of its total power capacity of 95MW inthe South.
3
Follow us on Twitter
http://twitter.com/weonlinebiz
Join our group on Facebook
http://facebook.com/group.php?gid=277011316824
WE RESEARCH IS AVAILABLE ON THOMSON REUTERS & BLOOMBERG

8/8/2019 Lucky Cement Ltd. Detail Report WE Financial Services Ltd. August 2010
http://slidepdf.com/reader/full/lucky-cement-ltd-detail-report-we-financial-services-ltd-august-2010 4/11
Company Update
Recurring Earnings of the company will
grow at a 3 year CAGR of 7% to Rs 3.5billion as against Rs 3.1 billion in FY10mainly due to lower base effect in FY10earning
Earnings are expected to grow at 3-year CAGR of 7%
Recurring Earnings of the company will grow at a 3 year CAGR of 7% to Rs3.5 billion as against Rs 3.1 billion in FY10 mainly due to lower base effectin FY10 earning. We have positive stance on the company owing to itssimultaneous presence in both the region of the country as well as proximi-ty to sea is another major advantage for the LUCK.
Source: Company Reports & WE Research
Source: Company Reports & WE Research
Closure of PEZU plant operated on 9th August.
As per news reports, production at Lucky Cement's Pezu plant has beenhalted for 5 days (23rd July to 28th July) after 50 unauthorized persons, whoclaim to be union leaders, have infiltrated the premises. However as per ourdiscussion with management the plant is operational from Monday 9thAugust, 2010. As per discussion and analysis out of 15 days closure theworking days was around 12 and as per 300 working days in a year the com-pany has around 65 reserve day to adjust orders and incidental shifts. Weexpect it to be Neutral for company's profitability in FY11 except lowercement dispatches in the month of July only.
4
Follow us on Twitter
http://twitter.com/weonlinebiz
Join our group on Facebook
http://facebook.com/group.php?gid=277011316824
WE RESEARCH IS AVAILABLE ON THOMSON REUTERS & BLOOMBERG
Profit after Taxation
3,000
3,500
4,000
4,500
FY09A FY10A FY11F FY12F
Rs in million

8/8/2019 Lucky Cement Ltd. Detail Report WE Financial Services Ltd. August 2010
http://slidepdf.com/reader/full/lucky-cement-ltd-detail-report-we-financial-services-ltd-august-2010 5/11
Company Update
the recent floods in the country havedestroyed the hopes of 4.5% GDPgrowth. We have now revised our GDPgrowth assumption to 3% for FY11
Sector update
Cement consumption strongly correlated with country's core funda-mentals
Cement consumption & GDP growth are strongly correlated variables allover the world. Pakistan has also emerged as one of the developing nationsduring FY00-07 attained sustainable growth rates in the range of 5% - 8.5%.After that global economic crisis has destroyed the country core fundamen-tals, however some recovery have witnessed during the past few months butthe recent floods in the country have destroyed the hopes of 4.5% GDPgrowth. We have now revised our GDP growth assumption to 3% for FY11.
Sector's eminence by the end of FY10
Pakistan's extensive cement sector consists of 25 cement companies.These companies are operating with a combined 29 cement plants. Out ofthese plants, 19 are located in the northern region of the country andremaining 10 are located in southern region.
The total production capacity of the cement sector stands at 44.82 MTPA(million tonnes per annum) as per data issued by APCMA. Going forward,this capacity will increase during FY11, owing to expansions undertaken byFauji cement and Gharibwal Cement (GWCL), all based in the northern partof the country. Taking cue from that, we estimate total capacity of the indus-try to touch 47.5 MTPA during the current year FY11-FY12.
In light of this, Pakistan's leading producers such as Lucky Cement (LUCK),DG Khan Cement (DGKC) and Attock Cement (ACPL) have taken a firstmover advantage by undergoing expansions and they are in line with tap-ping local demand as well as export opportunities emanating fromAfghanistan, UAE, far east and African countries.
5
Follow us on Twitter
http://twitter.com/weonlinebiz
Join our group on Facebook
http://facebook.com/group.php?gid=277011316824
WE RESEARCH IS AVAILABLE ON THOMSON REUTERS & BLOOMBERG

8/8/2019 Lucky Cement Ltd. Detail Report WE Financial Services Ltd. August 2010
http://slidepdf.com/reader/full/lucky-cement-ltd-detail-report-we-financial-services-ltd-august-2010 6/11
Company Update
PSDP to remain driver again in FY11 dueto the government focus on small Dams,infrastructural development and construc-tion and rehabilitation work on floodsaffected areas.
There are 29 cement units working whichare producing 44 million tonne per annum
Demand drivers
1) Local cement demand has grown by 1.6x the GDP growth over the lastten years.
2) Housing demand.
3) Government's spending on development-related projects.
4) Relatively price inelastic, so price not a major demand influencer.
5) Standardized product.
Cement consumption strongly correlated with country's core funda-mentals...
Cement consumption & GDP growth are strongly correlated variables allover the world. Pakistan has also emerged as one of the developing nationsattaining sustainable growth rates in the range of 5% - 8.5% since FY00. ForFY11, we expect the country to attain GDP growth of 3.0%.
Housing growth to spur consumption going forward
According to public sector based House Building Finance Corporation(HBFC) figures, the average population per housing units in Pakistan isapproximately 9 people per housing unit as compared to the global averageof around 6 persons per housing unit. The units required for a population of165 mn, Pakistani should have 27.5 mn housing units, an addition of 6.7 mil-lion to the current 20 mn units. We anticipate an increase in per capitaincome that will translate into construction of at least 6 - 7 mn homes.
This aspect is facilitated by banking sector's renewed mortgage financebusiness. At present this business is merely less than 1% of GDP inPakistan (total size of mortgage liabilities is nearly Rs 55bn) as against 3%- 4% in neighboring India. Banking industry is aiming for a target of at leastRs 300 bn till FY11-12 under the guidance of State Bank of Pakistan andInternational Finance Corporation (IFC).
PSDP allocation & disbursement- key to cement consumption
At present Pakistan's PSDP program accounts for nearly 45% of the totaldomestic cement consumption. Government's increased focus towardsinfrastructure development in the country over the last few years has alsogiven impetus to our assertion. It has been a main driver of cement con-sumption in recent years. However PSDP cut and its disbursementremained a major cause of concern during FY10. We expect PSDP toremain driver again in FY11 due to the government focus on small Dams,infrastructural development and construction and rehabilitation work onfloods affected areas.
Pakistan per Capita Consumption
Pakistan currently has a per capita consumption of 135kg cement which iscomparable to that of India's 150kg per capita. However it is just a third ofChina's but substantially below the world average of 300kg and the region-al average of over 400kg for peers in Asia and over 600kg in the MiddleEast.
6
Follow us on Twitter
http://twitter.com/weonlinebiz
Join our group on Facebook
http://facebook.com/group.php?gid=277011316824
WE RESEARCH IS AVAILABLE ON THOMSON REUTERS & BLOOMBERG

8/8/2019 Lucky Cement Ltd. Detail Report WE Financial Services Ltd. August 2010
http://slidepdf.com/reader/full/lucky-cement-ltd-detail-report-we-financial-services-ltd-august-2010 7/11
Company Update
We expect cement dispatches of thecounty is expected to remain stagnantYoY in FY11 to 34mn tons (local sales of25mn tons and export sales of 9mn tons).The primary reason behind stagnantsales is expected drop in cement exportsdue to massive regional expansions
TDAP has announced 35% subsidy oninland freight subsidy on sea routedexports in April. However we do notexpect it's to continue going forwardowing to the government budgetary con-straints on the revenue side
Global Cement Production: Pakistan yet to make its mark
Pakistani cement sector is still not in world ranking because of low per pro-duction capacity and its utilization. Currently there are 29 cement units work-ing which are producing 44 million tonne per annum. But our neighboringcountries China and India are on the 1st and 2nd rank in Asia with 900 mil-lion tonnes and 185 million tonnes per annum. If we go through world com-parison USA, Japan and Russia ranked below India and China.
Cement profitability to boost in FY11
We expect cement dispatches of the county is expected to remain stagnantYoY in FY11 to 34mn tons (local sales of 25mn tons and export sales of 9mntons). The primary reason behind stagnant sales is expected drop in cementexports due to massive regional expansions. On local cement consumptionwe expect it to grow significantly on the back of improvement in private sec-tor construction activities and construction and rehabilitation work on floodseffected areas with construction work on small dams.
Sales tax increase to pass through easily
In the recent budget sales increase in the GST by 1% to 17% is expected topass through to the end users easily (i.e. Rs 2.5/bag). On the other handlower cement prices is an issue for the small and inefficient producer wherethey cannot compete with the giants Lucky and DGKC.
FED on gas is not a worry for cements
Enhancement in the rate of FED from 5.09% to 10% (per MMBTu) on natu-
ral gas is neutral for the cement sector owing to no gas allocation to cementplants in the country and the sector is fulfilling its 90% percent of energyrequirement form coal.
Inland freight subsidy if continued may be a trigger
In the budget FY11 the topic of inland freight subsidy totally eliminated. TheTDAP has announced 35% subsidy on inland freight subsidy on sea routedexports in April. However we do not expect it's to continue going forwardowing to the government budgetary constraints on the revenue side. On theother hand if TDAP continues with the current inland freight subsidy in FY11it will boost the country's cement exports routed through sea.
7
Follow us on Twitter
http://twitter.com/weonlinebiz
Join our group on Facebook
http://facebook.com/group.php?gid=277011316824
WE RESEARCH IS AVAILABLE ON THOMSON REUTERS & BLOOMBERG

8/8/2019 Lucky Cement Ltd. Detail Report WE Financial Services Ltd. August 2010
http://slidepdf.com/reader/full/lucky-cement-ltd-detail-report-we-financial-services-ltd-august-2010 8/11
Company Update
The primary reason behind massive earn-ings decline is owing to dreary domesticprices during the 1HFY10 which resultedin a YoY lower retention prices for thecompany
Top line of the company has showed adecent performance over all with thesales revenue declined by nominal 6%during FY10 to Rs 24,508 million asagainst Rs 2,6330million during FY09
FY10 Result Review
Lower domestic prices keep FY10 in dark
Lucky Cement Company Limited (LUCK) announced its results for FY10.The company posted after tax earnings of Rs 3,137 million (EPS; 9.70 pershare) as compared to Rs 4,596 million (EPS; 14.21 per share) in FY09. Thecompany has also announced cash dividend of Rs 4.0/share i.e. (40%), ishighest payout ratio in the company's history which is around 42%. The pri-mary reason behind massive earnings decline is owing to dreary domesticprices during the 1HFY10 which resulted in a YoY lower retention prices forthe company. The domestic prices during the 1HFY10 as remained as lowas Rs 235/bag at the retail level in the North. Moreover the volumetric salesof the company grown significantly by 12.3% to 6.63 million tons for FY10(26% increase in local sales and 2.2% increase in exports).
Sales revenue remained stagnant
Top line of the company has showed a decent performance over all with thesales revenue declined by nominal 6% during FY10 to Rs 24,508 million asagainst Rs 2,6330million during FY09. The major cause behind this stagnantsales revenue despite 12% increase in volumetric sale is only because oflackluster cement prices on domestic level (Net retention prices for domes-tic sales remained around Rs 3,320 per ton on average for Lucky cementduring the FY10).
Production and other cost showed balance
Cost of sales during the FY10 remained poise as during the same periodlast year to Rs 16,529 million as compared to Rs Rs 16,519 million duringFY09. Such stable cost of sales is mainly because of lower coal prices YoY,while increase in volumetric sales to balance the cost of production to FY09level. Moreover the distribution cost of the company boosted by massivelydue to increase in company's inland transportation cost and ocean freights.On the other hand delay in the disbursement of inland freight subsidy fundsalso resulted in a massive increase in distribution cost. In the end financecost of the company showed decent improvement because of the compa-ny's switching to low cost export refinance.
Rs in million FY10A FY09A YoYNet Sales 24,508 26,330 -6.92%Cost of Sales 16,529 16,519 0.6%Gross Profit 7,978 9,811 -18.68%Operating Profit 4,242 7,217 -41-22%Financial Charges 569 1,236 -53.96%Profit before Taxation 3,417 5,177 -33.99%Profit after Taxation 3,137 4,596 -31.74%EPS (Rs) 9.70 14.21 -31.74%Source: Company Report
Outlook and RecommendationLucky cement is one of the largest cement manufacturers in the country withthe added advantage of simultaneous presence of both the regions of coun-try. We expect the ongoing development of waste heat recovery in the com-pany's plant and other business diversification to boost the company's mar-gins in the sky during the years to come. We maintain our Buy rating on theLucky cement with 1-year target price of Rs 77.2/share.
8
Follow us on Twitter
http://twitter.com/weonlinebiz
Join our group on Facebook
http://facebook.com/group.php?gid=277011316824
WE RESEARCH IS AVAILABLE ON THOMSON REUTERS & BLOOMBERG
8/8/2019 Lucky Cement Ltd. Detail Report WE Financial Services Ltd. August 2010
http://slidepdf.com/reader/full/lucky-cement-ltd-detail-report-we-financial-services-ltd-august-2010 9/11
Company Update
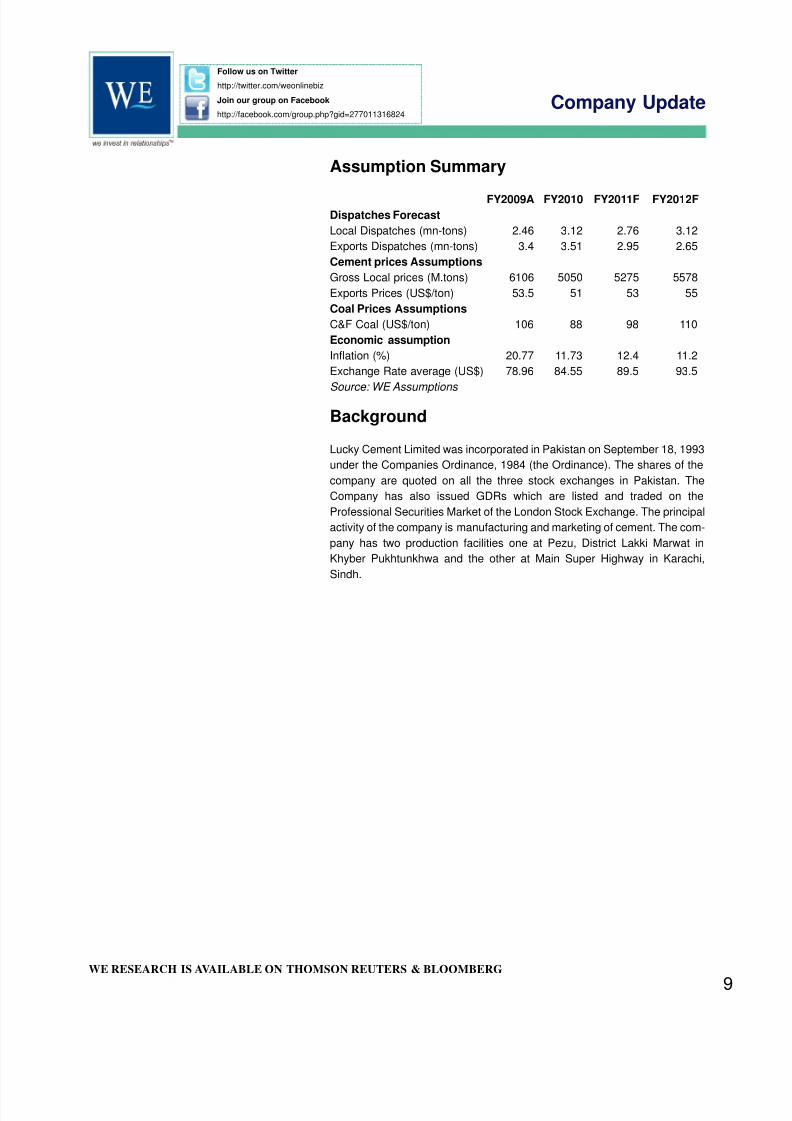
Assumption Summary
FY2009A FY2010 FY2011F FY2012FDispatches ForecastLocal Dispatches (mn-tons) 2.46 3.12 2.76 3.12Exports Dispatches (mn-tons) 3.4 3.51 2.95 2.65Cement prices AssumptionsGross Local prices (M.tons) 6106 5050 5275 5578Exports Prices (US$/ton) 53.5 51 53 55Coal Prices AssumptionsC&F Coal (US$/ton) 106 88 98 110Economic assumptionInflation (%) 20.77 11.73 12.4 11.2Exchange Rate average (US$) 78.96 84.55 89.5 93.5
Source: WE Assumptions
Background
Lucky Cement Limited was incorporated in Pakistan on September 18, 1993under the Companies Ordinance, 1984 (the Ordinance). The shares of thecompany are quoted on all the three stock exchanges in Pakistan. TheCompany has also issued GDRs which are listed and traded on theProfessional Securities Market of the London Stock Exchange. The principalactivity of the company is manufacturing and marketing of cement. The com-pany has two production facilities one at Pezu, District Lakki Marwat inKhyber Pukhtunkhwa and the other at Main Super Highway in Karachi,Sindh.
9
Follow us on Twitter
http://twitter.com/weonlinebiz
Join our group on Facebook
http://facebook.com/group.php?gid=277011316824
WE RESEARCH IS AVAILABLE ON THOMSON REUTERS & BLOOMBERG

8/8/2019 Lucky Cement Ltd. Detail Report WE Financial Services Ltd. August 2010
http://slidepdf.com/reader/full/lucky-cement-ltd-detail-report-we-financial-services-ltd-august-2010 10/11
Company Update
FinancialsIncome Statement
Rs in million FY09A FY10A FY11E FY12FNet Sales 26,547 24,508 24,583 25,666Cost of Sales 16,519 16,529 16,233 17,814Gross Profit 10,027 7,978 8,349 7,851Selling & Admin Expenses 2,594 3,736 2,704 2,480Other Income 23 2 118 (47)Other Charges 827 257 520 506Profit before Taxation 5,177 3,417 4,676 4,556Taxation 580 280 924 1,005Profit after Taxation 4,597 3,137 3,752 3,551
Balance Sheet
Rs in million FY09A FY10A FY11E FY12FShare Capital 3,234 3,234 3,234 3,234Total Equity 23,252 25,095 28,719 31,451Non-current Liabilities 6,042 3,572 3,337 2,762Current Liabilities 9,043 9,641 5,117 4,092Total Liabilities & Equity 38,337 38,310 37,173 38,305Non-current Assets 30,479 31,438 29,774 29,068Current Assets 7,858 6,871 7,398 9,237Total Assets 38,337 38,310 37,173 38,305
Cash Flow Statement
Rs in million FY09A FY10A FY11E FY12FCash from operation 8,422 4,247 4,942 4,557Cash from Investing activities -5,788 -1,377 -510 -541Cash from financing -1,855 -2,241 -4,494 -2,924Net Change in cash 779 629 -62 1,092Beginning Cash Balance 270 1049 1679 1617Ending Cash Balance 1049 1679 1617 2709
Key Ratios Analysis
Key Ratios FY09A FY10E FY11F FY12FEPS 14.21 9.70 11.60 10.98DPS 4.00 4.00 4.00 4.00PER (x) 4.70 6.89 5.76 6.08PBV (x) 0.93 0.86 0.75 0.69EV/ton (USD) 55.3 44.0 36.7 31.4Gross Margin 37.8 32.6 34.0 30.6Operating Margin 28.0 17.3 23.0 20.9EBITDA Margin 28.7 22 26.5 23.6Pretax Margin 19.5 13.9 19.0 17.8Net Margin 17.3 12.8 15.3 13.8Return on Fixed Assets 16.2 11.6 12.7 12.3ROE 19.8 12.5 13.1 11.3ROA 12.0 8.2 10.1 9.3
10
Follow us on Twitter
http://twitter.com/weonlinebiz
Join our group on Facebook
http://facebook.com/group.php?gid=277011316824
WE RESEARCH IS AVAILABLE ON THOMSON REUTERS & BLOOMBERG
8/8/2019 Lucky Cement Ltd. Detail Report WE Financial Services Ltd. August 2010
http://slidepdf.com/reader/full/lucky-cement-ltd-detail-report-we-financial-services-ltd-august-2010 11/11
URL: www.we.com.pk
Disclaimer: All information contained in this publication has been researched and compiled from sources believed to be accu-rate and reliable at the time of publishing. However, we do not accept any responsibility for its accuracy & completeness andit is not intended to be an offer or a solicitation to buy or sell any securities. WE Financial Services & its employees will notbe responsible for the consequence of reliance upon any opinion or statement herein or for any omission. All opinions and esti-mates contained herein constitute our judgment as of the date mentioned in the report and are subject to change without notice.
WE Financial ServicesCorporate Office:
1112-1115, Eleventh Floor, Park Avenue,24-A, Block 6, P.E.C.H.S.
Karachi - 75400
Tel: (92 21) 455-2886, 455-2846 455-2889Fax: (92 21) 452-3048URL: www.we.com.pk
E-mail: [email protected]
Our NetworkSargodha Branch
1st Floor Ala Ahmed Plaza
University RoadSargodha.Tel: (92 048) 3017377Fax: (94 048) 3769961
Jauharabad Branch236-B, Main Bazar College Road
Jauharabad, District KhushabTel: (92 454) 723357-58
Fax: (92 454) 721927