Embed Size (px)
Citation preview


Our belief in bringing a positive change based on our values is the testament of our philosophy for a better
tomorrow. Our dynamic workforce and concrete business ethics have not only resulted in market leadership but also
help us unlock more avenues for progression.
With our diversified business portfolio, we aim to strengthen the economy with innovation, growth and
sustainability.
EMBRACING THE
CHANGE

Directors’ Report
Company Information
Unconsolidated Condensed Interim Statement of Financial Position
Unconsolidated Condensed Interim Statementof Profit or Loss And Other Comprehensive Income
Unconsolidated Condensed Interim Statement of Cash Flows
Unconsolidated Condensed Interim Statement of Changes In Equity
Notes to the Unconsolidated Condensed InterimFinancial Statements
Consolidated Condensed Interim Statement of Financial Position
Consolidated Condensed Interim Statement of Profit or Loss And Other Comprehensive Income
Consolidated Condensed Interim Statement of Cash Flows
Consolidated Condensed Interim Statement of Changes In Equity
Notes to the Consolidated Condensed Interim Financial Statements
02
04
11
12
13
14
15
24
25
26
27
28
012020
A D V O C A T E S O F S U S T A I N A B I L I T YF O R A B E T T E R T O M O R R O W Q U A R T E R L Y R E P O R T

EMBRACING THE
CHANGE02
COMPANY INFORMATION
Board of DirectorsMuhammad Yunus Tabba
Muhammad Ali Tabba Muhammad Sohail TabbaJawed Yunus Tabba Mariam Tabba Khan Manzoor Ahmed Masood Karim Shaikh
Management TeamMuhammad Ali Tabba
Noman Hasan
Muhammad Atif Kaludi
Amin Ganny
Adnan Ahmed
Murtaza Abbas
Faisal Mahmood
Board CommitteesAUDIT COMMITTEEManzoor Ahmed
Muhammad Sohail Tabba Jawed Yunus Tabba Mariam Tabba KhanMasood Karim Shaikh
HUMAN RESOURCE AND REMUNERATION COMMITTEEMasood Karim Shaikh
Muhammad Ali TabbaMuhammad Sohail Tabba Jawed Yunus Tabba Mariam Tabba Khan
BUDGET COMMITTEEMuhammad Sohail Tabba
Muhammad Ali Tabba Jawed Yunus Tabba Mariam Tabba Khan

032020
A D V O C A T E S O F S U S T A I N A B I L I T YF O R A B E T T E R T O M O R R O W Q U A R T E R L Y R E P O R T
BankersAllied Bank LimitedAllied Bank Limited – Islamic BankingAskari Bank LimitedAskari Bank Limited – Islamic BankingBank Alfalah Limited – Islamic BankingBank Al-Habib LimitedBank Al-Habib Limited – Islamic BankingBankIslami Pakistan LimitedCitibank N.A.Dubai Islamic Bank Pakistan LimitedFaysal Bank Limited – Islamic BankingHabib Bank LimitedHabib Bank Limited – Islamic BankingHabib Metropolitan Bank LimitedHabib Metropolitan Bank Limited – Islamic BankingIndustrial and Commercial Bank of China LimitedMCB Bank LimitedMCB Islamic Bank LimitedMeezan Bank LimitedNational Bank of PakistanNational Bank of Pakistan –Aitemaad Islamic BankingStandard Chartered Bank (Pakistan) LimitedUnited Bank LimitedUBL Ameen Islamic Banking
Credit RatingMedium to Long term rating : AA+ (Double A Plus)Short term rating: A-1+ (A-One Plus)(by VIS Credit Rating Company Limited)
AuditorsExternal AuditorsM/s. A.F. Ferguson & Co., Chartered Accountants
Shariah AdvisorM/s. Alhamd Shariah Advisory Services (Pvt). Ltd
Registered Office Main Indus Highway, Pezu, District Lakki Marwat, Khyber Pakhtunkhwa, Pakistan
Head Office 6-A, Muhammad Ali Housing Society, A. Aziz Hashim Tabba Street, Karachi – 75350 UAN: (+92-21) 111-786-555 Website: www.lucky-cement.com Email: [email protected]
Production Facilities1. Main Indus Highway, Pezu, District Lakki Marwat, Khyber Pakhtunkhwa, Pakistan
2. 58 Kilometers on Main M9 Highway, Gadap Town, Karachi, Pakistan
Share RegistrarM/s. CDC Share Registrar Services Limited (CDCSRSL) CDC House, 99-B, Block-B, S.M.C.H.SMain Shahra-e-Faisal, Karachi, Pakistan(Toll Free): 0800 23275

EMBRACING THE
CHANGE04
The Directors have the pleasure in presenting to you the financial results of your Company which include both, stand-alone and consolidated unaudited financial statements for the first quarter ended September 30, 2020.
Overview
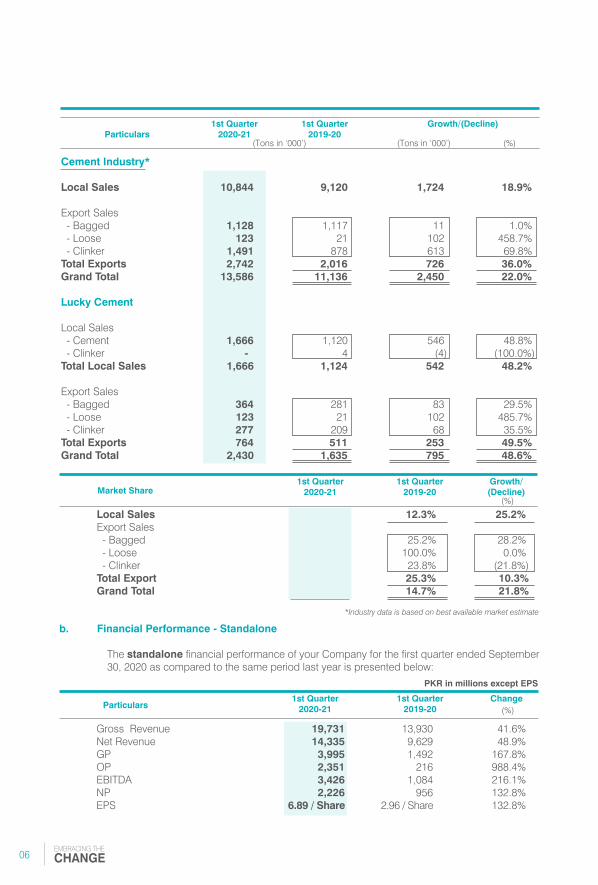
The performance of the Cement Industry has been very encouraging during the current quarter where overall Industry volumes increased by 22.0% to 13.59 million tons for the first quarter ended September 30, 2020 in comparison to 11.14 million tons during same period last year. Export sales volumes registered an increase of 36.0% to reach 2.74 million tons during the current quarter under review as compared to 2.02 million tons during same period last year. The local sales volume registered an increase of 18.9% to reach 10.84 million tons during the quarter under review in comparison to 9.12 million tons during same period last year.
This increase in industry sales volume is mainly attributable to increase in economic activity post-Covid 19 and revival of various infrastructure projects under CPEC.
Your Company’s overall sales volume improved by 48.6% to reach 2.43 million tons during the current first quarter ended September 30, 2020 as compared to the same period last year. The local cement sales volume registered an increase of 48.8% and were 1.67 million tons in comparison to 1.12 million tons during the same period last year. The export sales volumes of the Company also improved by 49.5% to 0.76 million tons as compared to 0.51 million tons during the same period last year.
The increase in Company’s local sales volume during the quarter under review is due to increase in additional capacity at Pezu Plant. Due to increase in economic activities and pent-up demand of last quarter the Company was able to increase its volumes on a quarter-on-quarter basis. Moreover, the increase in export sales volume is due to higher exports of loose cement and clinker.
On a consolidated basis, your Company achieved a gross turnover of PKR 57.85 billion which is 68.03% higher as compared to the same period last year’s turnover of PKR 34.43 billion.
Moreover, consolidated Net Profit of the Company was PKR 5.13 billion of which PKR 0.78 billion is attributable to non-controlling interests. The consolidated net profit attributable to owners of the Holding Company translates into an EPS of PKR 13.45 during the first quarter ended September 30, 2020 as compared to PKR 3.93 during the same period last year.
Financial Performance - Consolidated
The consolidated financial performance of your Company for the first quarter ended September 30, 2020 as compared to last year is presented below:
Directors’ Report
Gross Revenue 57,851 34,430 68%Net Revenue 45,114 27,180 66%GP 8,773 4,344 102%OP 5,298 1,478 258%EBITDA 7,469 3,362 122%NP (Attributable to Owners’ of the holding company) 4,349 1,272 242%EPS (PKR/share) 13.45 3.93 242%
1st Quarter2020-21
1st Quarter2019-20
Change
PKR in millions except EPS
(%)Particulars

052020
A D V O C A T E S O F S U S T A I N A B I L I T YF O R A B E T T E R T O M O R R O W Q U A R T E R L Y R E P O R T
During the first quarter 2020-21 under review, your Company’s overall Consolidated Net Profit increased by 2.36 times as compared to the same period last year.
The increase in Net profit was mainly attributable to increase in Net Profit of Cement segment (Holding Company) which increased by 132% due to absorption of fixed costs and lower input costs (as explained in details below). This increase in Net Profit of holding company was also supported by significant increase in Net Profits of Lucky Motor Corporation and LCL Investment Holdings Limited as compared to same period last year. The better market conditions and increase in economic activities, helped to increase the Net Profit of LCL Investment Holdings Limited that is mainly attributable to a combination of growth in sales volume, increase in retention price and decrease in input costs from both Congo & Iraq projects.
Business Performance
a. Production & Sales Volume Performance - Standalone
The standalone production and sales statistics of your Company for the first quarter ended September 30, 2020 compared to the same period last year are as follows:
The production and sales volume data is graphically presented as under:
A comparison of the dispatches of the Industry and your Company’s standalone business for the first quarter ended 2020-21 in comparison with the same period last year is presented below:
Clinker Production 2,210 1,270 74.0%Cement Production 2,141 1,422 50.6%Cement Sales 2,153 1,422 51.4%Clinker Sales 277 213 30.0%
1st Quarter2020-21
1st Quarter2019-20
Growth(%)
(Tons in ‘000’)Particulars
2,210
1,270
2,141
1,422
2,153
1,422
277 213
1st Quarter 2020-21 1st Quarter 2019-20
Clinker Production Cement Production Cement Sales Clinker Sales
Tons in '000
EMBRACING THE
CHANGE06
*Industry data is based on best available market estimate
Local Sales 15.4% 12.3% 25.2% Export Sales - Bagged 32.3% 25.2% 28.2% - Loose 100.0% 100.0% 0.0% - Clinker 18.6% 23.8% (21.8%) Total Export 27.9% 25.3% 10.3% Grand Total 17.9% 14.7% 21.8%
1st Quarter2020-21
1st Quarter2019-20
Growth/(Decline)
(%)Market Share
1st Quarter2020-21
1st Quarter2019-20
Growth/(Decline)
(%)(Tons in ‘000’) (Tons in ‘000’)Particulars
Cement Industry*
Local Sales 10,844 9,120 1,724 18.9% Export Sales - Bagged 1,128 1,117 11 1.0% - Loose 123 21 102 458.7% - Clinker 1,491 878 613 69.8% Total Exports 2,742 2,016 726 36.0% Grand Total 13,586 11,136 2,450 22.0% Lucky Cement Local Sales - Cement 1,666 1,120 546 48.8% - Clinker - 4 (4) (100.0%)Total Local Sales 1,666 1,124 542 48.2% Export Sales - Bagged 364 281 83 29.5% - Loose 123 21 102 485.7% - Clinker 277 209 68 35.5% Total Exports 764 511 253 49.5% Grand Total 2,430 1,635 795 48.6%
b. Financial Performance - Standalone
The standalone financial performance of your Company for the first quarter ended September 30, 2020 as compared to the same period last year is presented below:
Gross Revenue 19,731 13,930 41.6% Net Revenue 14,335 9,629 48.9% GP 3,995 1,492 167.8% OP 2,351 216 988.4% EBITDA 3,426 1,084 216.1% NP 2,226 956 132.8% EPS 6.89 / Share 2.96 / Share 132.8%
1st Quarter2020-21
1st Quarter2019-20
Change(%)Particulars
PKR in millions except EPS

072020
A D V O C A T E S O F S U S T A I N A B I L I T YF O R A B E T T E R T O M O R R O W Q U A R T E R L Y R E P O R T
Revenue
During the first quarter 2020-21 under review, your Company’s overall gross sales revenue increased by 41.6% as compared to the same period last year. Where both export and local sales revenue showed an increase of 42.3% (PKR 4.57 billion vs PKR 3.21 billion) and 41.4% (PKR 15.17 billion vs PKR 10.72 billion) respectively.
Cost of Sales
During the first quarter 2020-21 under review, per ton cost of sales of your Company decreased by 14.5% as compared to the same period last year. This was due to better absorption of fixed cost as a result of increase in volumes and efficiencies achieved from new production line in the North.
Gross Profit
The Gross profit margins of the company for the first quarter under review were 27.9% as compared to 15.5% reported during the same period last year.
Net Profit
Similarly, your Company achieved a profit before tax of PKR 2,685.4 million during the first quarter under review as compared to PKR 1,021.9 million reported during the same period last year.
Accordingly, after tax profit of PKR 2,226.4 million was achieved during the first quarter under review as compared to PKR 955.8 million reported during the same period last year.
Earnings per share
The earnings per share of your Company for the first quarter ended September 30, 2020 was PKR 6.89 in comparison to PKR 2.96 reported during the same period last year.
956
981
999
409
2,226
Q1-20
Q2-20
Q3-20
Q4-20
Q1-21
Net Profit PKR in Millions
2.96 3.03 3.09
1.26
6.89
Q1-20 Q2-20 Q3-20 Q4-20 Q1-21
EPS Trend PKR
1,492
1,732
1,302
1,551
3,995
Q1-20
Q2-20
Q3-20
Q4-20
Q1-21
PKR in Millions
Gross Profit

EMBRACING THE
CHANGE08
Investment Projects – New and Ongoing
Investment in 1 x 660 MW, supercritical, coal based power project
The construction activity for setting up 660 MW super critical, lignite coal-based power plant was moving as per Schedule before the outbreak of COVID-19 in China with the targeted Commercial Operation on March 1, 2021. The Contractor as a result of the removal of certain restrictions by the Government of Pakistan has notified the cessation of FME on September 3, 2020, which was earlier notified on February 6, 2020. The Company accordingly notified the same to the Central Power Purchasing Agency (CPPA) and Private Power Infrastructure Board (PPIB) that despite FME, it is striving to achieve its COD as per the targeted timeline. The project is completed over 90% by end of this quarter.
The CPPA, based on FME notice received by it from National Transmission and Dispatch Company (NTDC), notified the Company about FME through its letter dated March 25, 2020, stating therein that COVID-19 outbreak has caused a complete halt to transmission planning, design, engineering, project development and execution of the inter-connection works. Subsequently, NTDC notified CPPA about the cessation of FME through its letter of September 30, 2020.
The Company is following up with CPPA, NTDC and PPIB for the earliest availability of an interconnection facility which is essential for achieving the COD.
Greenfield clinker production facility in Samawah, Iraq – 1.2 million tons per annum
Post opening of airspace, additional manpower for preheater/kiln, refractory and electrical works have been mobilized at site. Civil, mechanical and electrical works are in advance stage and work is in full pace. During the quarter, two additional shipments from Sinoma for cement grinding unit also reached site. Remaining shipments of electrical and instrumental equipment’s (from China), Cement packer (from Italy) and Cement Gear Box (from Germany) are expected to reach at site in October / November 2020.
The additional Power Plant (01 Genset and 02 WHR Boilers) reached site and power plant is in commissioning and testing phase.
Target date to achieve commercial production is December 2020.
Corporate Social Responsibility
Your Company has continued its patronage on Education, Women empowerment and Health. Your Company is committed for the development of society and the communities in which it operates.
Education / Scholarships
In continuation of its long-term objective to provide merit-based support for the deserving and less privileged segments of the society. Your Company continued to extend scholarships to various students of leading universities in Pakistan and abroad.
Women Empowerment
To empower women through education has been an ongoing process with the collaboration of Zindagi Trust in which your Company has been supporting two leading Government girls’ schools in Karachi. These schools have been transformed into model girls’ educational institutions in Pakistan. Further to this, Company has collaborated with Shahid Afridi Foundation (SAF) adopted primary school in the remote area of Karachi to improve primary level education for the less privilege.

MUHAMMAD YUNUS TABBAChairman / Director
MUHAMMAD ALI TABBAChief Executive / Director
Karachi: October 24, 2020
On behalf of the Board
Health Initiatives
Provision of quality healthcare for the society at large continues to remain your Company’s priority, especially through financial support of Aziz Tabba Foundation; a prominent philanthropic institution that is running Tabba Heart and Tabba Kidney institutes, which provide vital support in bridging the gap of specialized and modern medical care available in the Country.
Environment Conservation
Your Company always takes responsibility towards the environment seriously and in an effort to highlight the importance of environment conservation; your Company continued with its pro-environment initiatives including tree-plantation drives in and around its manufacturing sites.
Outlook
While the initial outbreak of Covid-19 in Pakistan has receded significantly, a second wave of infections cannot be ruled out at present. We expect that any such spike will be countered through targeted measures instead of general lockdowns. Barring this,in the short to medium term, the Outlook of the Cement industry remains positive. Due to increase in economic activity, the Local demand has increased both in the North and South regions compared to last quarter. As a result, price stability can be seen which is more pronounced in the North. Export sales are anticipated to remain stable. The prices have started to go up due to pick-up in construction activities.
Moreover, we also expect that the package announced for the construction industry by the Federal Government will continue to have a positive impact on the cement demand of the country. Your Company’s strong financial position and free cash flow generating ability are anticipated to further support its Vision to improve operational efficiencies as well as make new investments, which can bring in further improvement in efficiencies and enhance shareholders’ value.
Acknowledgement
Directors of your Company take pleasure in expressing their sincere gratitude and appreciation for the outstanding commitment and contribution of all the employees and continued trust and reliance placed in the Company by all the stakeholders.
092020
A D V O C A T E S O F S U S T A I N A B I L I T YF O R A B E T T E R T O M O R R O W Q U A R T E R L Y R E P O R T

EMBRACING THE
CHANGE10
FINANCIALSTATEMENTS
STRIVING FOR EXCELLENCE IN CORPORATE REPORTING
Unconsolidated & Consolidated
For the Quarter ended Sep 30, 2020

Note (Un-audited)September 30,
2020
(Audited)June 30,
2020(PKR in ‘000’)
Unconsolidated Condensed InterimStatement of Financial Position As at September 30, 2020
Muhammad Ali TabbaChief Executive
Muhammad Yunus TabbaChairman / Director
Atif KaludiChief Financial Officer
ASSETS NON-CURRENT ASSETS Fixed assets Property, plant and equipment 5 59,613,894 60,154,650 Intangible assets 8,426 11,323 59,622,320 60,165,973 Long-term investments 6 48,994,485 47,144,485 Long-term loans and advances 85,215 87,008 Long-term deposits 3,175 3,175 108,705,195 107,400,641 CURRENT ASSETS Stores and spares 7,126,037 6,613,090 Stock-in-trade 2,798,227 2,915,552 Trade debts 2,880,849 3,422,767 Loans and advances 911,942 390,966 Trade deposits and short term prepayments 63,653 81,169 Accrued return 50,809 47,572 Other receivables 4,225,109 3,670,300 Tax refunds due from the Government 538,812 538,812 Short term investment 3,022,979 2,970,999 Cash and bank balances 8,282,152 7,816,606 29,900,569 28,467,833 TOTAL ASSETS 138,605,764 135,868,474
EQUITY AND LIABILITIES SHARE CAPITAL AND RESERVES
Share Capital 3,233,750 3,233,750 Reserves 98,186,490 95,950,111 101,420,240 99,183,861 NON-CURRENT LIABILITIES
Long-term deposits 235,662 233,062 Long-term loan 7 532,570 320,461 Deferred income - Government grant 7 101,065 59,720 Deferred liabilities 8 7,283,613 7,116,018 8,152,910 7,729,261 CURRENT LIABILITIES
Trade and other payables 20,346,718 19,354,794 Current maturity of long-term loan 7 380,181 126,727 Short term borrowings 9 6,550,000 7,931,444 Unclaimed dividend 55,478 55,767 Unpaid dividend 17,580 17,580 Accrued markup 34,173 46,173 Taxation - net 1,648,484 1,422,867 29,032,614 28,955,352 37,185,524 36,684,613 CONTINGENCIES AND COMMITMENTS 10 TOTAL EQUITY AND LIABILITIES 138,605,764 135,868,474 The annexed notes from 1 to 17 form an integral part of these unconsolidated condensed interim financial statements.
112020
A D V O C A T E S O F S U S T A I N A B I L I T YF O R A B E T T E R T O M O R R O W Q U A R T E R L Y R E P O R T

EMBRACING THE
CHANGE12
NoteSeptember 30,
2020
Quarter EndedSeptember 30,
2019(PKR in ‘000’)
Unconsolidated Condensed Interim Statementof Profit or Loss and Other Comprehensive Income For the 1st quarter ended September 30, 2020 (Un-audited)
Muhammad Ali TabbaChief Executive
Muhammad Yunus TabbaChairman / Director
Atif KaludiChief Financial Officer
Gross sales 11 19,731,269 13,929,982 Less: Sales tax and federal excise duty 5,083,135 4,083,620 Rebates, incentive and commission 313,005 217,386 5,396,139 4,301,006 Net sales 14,335,130 9,628,976 Cost of sales (10,340,530) (8,137,147) Gross profit 3,994,600 1,491,829 Distribution cost (1,356,935) (975,317)Administrative expenses (286,476) (300,427)Finance cost (68,104) (19,866)Other expenses (200,110) (104,537)Other income 12 602,395 930,231 Profit before taxation 2,685,370 1,021,913 Taxation - current (371,360) (170,064) - deferred (87,561) 103,995 (458,921) (66,068) Profit after taxation 2,226,449 955,845 Other comprehensive income: Other comprehensive income / (loss) which will not be reclassified to statement of profit or loss in subsequent periods
Unrealized income / (loss) on remeasurement of equity instrument 11,682 (8,089) at fair value through other comprehensive income Deferred tax thereon (1,752) 1,213 9,930 (6,876) Total comprehensive income for the period 2,236,379 948,969 Earnings per share - basic and diluted 6.89 2.96 The annexed notes from 1 to 17 form an integral part of these unconsolidated condensed interim financial statements.
(PKR)

Note September 30,2020
September 30,2019
(PKR in ‘000’)
Unconsolidated Condensed InterimStatement of Cash Flows For the 1st quarter ended September 30, 2020 (Un-audited)
Muhammad Ali TabbaChief Executive
Muhammad Yunus TabbaChairman / Director
Atif KaludiChief Financial Officer
CASH FLOWS FROM OPERATING ACTIVITIES
Cash generated from / (used in) operations 13 3,795,253 (835,430) Income tax paid (145,743) (134,332) Gratuity paid (18,895) (22,353) Finance cost paid (80,104) (14,795) Income from deposits with islamic banks 133,349 510,347 Decrease in long-term loans and advances 1,793 9,094 Increase in long-term deposits (liabilities) 2,600 98,033 Net cash generated from / (used in) operating activities 3,688,254 (389,436) CASH FLOWS FROM INVESTING ACTIVITIES Fixed capital expenditure (550,443) (2,370,288) Long-term investment (1,850,000) (802,299) Short term investment (40,298) (26,378) Sale proceeds on disposal of property, plant and equipment 45,449 10,030 Dividend received from subsidiary companies - 267,053 Dividend received from associated company - 122,273 Dividend received on short term investments 47,410 31,034 Release of bank balance held as lien 1,950,000 - Net cash used in investing activities (397,883) (2,768,575) CASH FLOWS FROM FINANCING ACTIVITIES
Long-term loan obtained 506,908 - Dividends paid (289) (1,208) 506,619 (1,208) Net increase / (decrease) in cash and cash equivalents 3,796,990 (3,159,219) Cash and cash equivalents at the beginning of the period (2,064,838) 4,871,686 Cash and cash equivalents at the end of the period 13.1 1,732,152 1,712,467 The annexed notes from 1 to 17 form an integral part of these unconsolidated condensed interim financial statements.
132020
A D V O C A T E S O F S U S T A I N A B I L I T YF O R A B E T T E R T O M O R R O W Q U A R T E R L Y R E P O R T

Issued, subscribed
and paidup capital
Capitalreserve
Sharepremium
Revenue reserves
Generalreserves
Unappropriatedprofit
Totalreserves
Totalequity
(PKR in ‘000’)
Balance as at July 01, 2019 3,233,750 7,343,422 73,202,650 10,538,595 91,084,667 94,318,417 Transfer to general reserves - - 8,436,657 (8,436,657) - - Transactions with owners in their capacity as owners Final dividend at the rate of PKR 6.5/- per share each for the year ended June 30, 2019 - - - (2,101,938) (2,101,938) (2,101,938) Total comprehensive income for the quarter ended September 30, 2019 - - - 948,969 948,969 948,969 Balance as at September 30, 2019 3,233,750 7,343,422 81,639,307 948,969 89,931,698 93,165,448 Balance as at July 01, 2020 3,233,750 7,343,422 81,639,307 6,967,382 95,950,111 99,183,861 Transfer to general reserves - - 3,508,483 (3,508,483) - - Total comprehensive income for the quarter ended September 30, 2020 - - - 2,236,379 2,236,379 2,236,379 Balance as at September 30, 2020 3,233,750 7,343,422 85,147,790 5,695,278 98,186,490 101,420,240 The annexed notes from 1 to 17 form an integral part of these unconsolidated condensed interim financial statements.
Unconsolidated Condensed InterimStatement of Changes in Equity For the 1st quarter ended September 30, 2020 (Un-audited)
Muhammad Ali TabbaChief Executive
Muhammad Yunus TabbaChairman / Director
Atif KaludiChief Financial Officer
EMBRACING THE
CHANGE14

1 THE COMPANY AND ITS OPERATION 1.1 Lucky Cement Limited (the Company) was incorporated in Pakistan on September 18, 1993
under the Companies Ordinance, 1984 (the Ordinance) [now Companies Act, 2017] and is listed on the Pakistan Stock Exchange. The Company has also issued Global Depository Receipts (GDRs) which are listed and traded on the Professional Securities Market of the London Stock Exchange. The principal activity of the Company is manufacturing and marketing of cement.
The registered office of the Company is located at Pezu, District Lakki Marwat in Khyber
Pakhtunkhwa and the head office is situated at Muhammad Ali Housing Society, A. Aziz Hashim Tabba Street in Karachi. The Company has two production facilities at Pezu, District Lakki Marwat in Khyber Pakhtunkhwa and at Main Super Highway in Karachi, Sindh. Further, the Company's liaison offices are situated in Islamabad, Quetta, Multan, D.I.Khan, Lahore and Peshawar.
1.2 These unconsolidated condensed interim financial statements are separate financial statements
of the Company in which investments in subsidiaries and an associated company have been accounted for at cost less accumulated impairment losses, if any.
2 STATEMENT OF COMPLIANCE These unconsolidated condensed interim financial statements of the Company for the quarter
ended September 30, 2020 have been prepared in accordance with the requirements of the International Accounting Standard (IAS) - 34 "Interim Financial Reporting" and provisions of and directives issued under the Companies Act, 2017. In case where the requirements differ, the provisions of or directives issued under the Companies Act, 2017 have been followed. These unconsolidated condensed interim financial statements do not include all the information and disclosures required in the unconsolidated annual audited financial statements, and should be read in conjunction with Company's unconsolidated annual audited financial statements for the year ended June 30, 2020.
3 SIGNIFICANT ACCOUNTING POLICIES 3.1 The accounting policies and methods of computation adopted in the preparation of these
unconsolidated condensed interim financial statements are consistent with those applied in the preparation of the unconsolidated annual audited financial statements for the year ended June 30, 2020.
3.2 Change in accounting standards, interpretations and amendments to published approved
accounting and financial reporting standards (a) Standards and amendments to published approved accounting standards which are
effective during the quarter ended September 30, 2020 There are certain new standards and amendments to approved accounting standards which are
mandatory for the Company's annual accounting period which began on July 1, 2020. However, these do not have any significant impact on the Company’s financial reporting and, therefore, have not been detailed in these unconsolidated condensed interim financial statements.
Notes to the Unconsolidated CondensedInterim Financial Statements For the 1st quarter ended September 30, 2020 (Un-audited)
152020
A D V O C A T E S O F S U S T A I N A B I L I T YF O R A B E T T E R T O M O R R O W Q U A R T E R L Y R E P O R T

Operating fixed assets (WDV) - opening balance 59,650,770 43,118,520 Add: Additions during the period / year 5.2 313,117 20,412,640 59,963,887 63,531,160 Less: Disposals during the period/year (WDV) 18,872 36,822 Depreciation charge for the period / year 1,072,327 3,843,568 Operating fixed assets (WDV) - closing balance 58,872,688 59,650,770 Add: Capital work-in-progress 5.3 741,206 503,880 59,613,894 60,154,650
(b) Standards and amendments to published approved accounting and financial reporting standards that are not yet effective
There are certain new standards and amendments to the approved accounting standards that
will be mandatory for the Company's annual accounting periods beginning on or after July 1, 2021. However, these amendments will not have any significant impact on the financial reporting of the Company and, therefore, have not been disclosed in these unconsolidated condensed interim financial statements.
4 ACCOUNTING ESTIMATES AND JUDGEMENTS The preparation of interim financial statements requires management to make judgements,
estimates and assumptions that affect the application of accounting policies and the reported amounts. Actual results may differ from these judgements, estimates and assumptions.
Judgements and estimates made by the management in the preparation of these
unconsolidated condensed interim financial statements are the same as those applied in the Company's unconsolidated annual audited financial statements for the year ended June 30, 2020.
5 PROPERTY, PLANT AND EQUIPMENT 5.1 The following is the movement in property, plant and equipment during the period / year:
Note (Un-audited)September 30,
2020
(Audited)June 30,
2020(PKR in ‘000’)
EMBRACING THE
CHANGE16

5.2 The following additions and deletions were made during the period in operating fixed assets:
Operating fixed assets
Buildings on freehold land - Cement plant 119,027 - - Power plant 814 - Buildings on leasehold land - Cement plant 738 - Machinery 168,331 - Vehicles 12,664 47,257 Furniture and fixtures 618 - Office equipment 4,508 - Computer and Accessories 4,152 1,836 Other assets (Laboratory equipment, etc.) 2,264 109 313,117 49,202
5.3 The following is the movement in capital work-in-progress during the period / year: Opening balance 503,880 14,157,664 Add: Additions during the period / year 550,443 6,762,896 1,054,323 20,920,560 Less: Transferred to operating fixed assets 313,117 20,416,680 Closing balance 741,206 503,880 6 LONG-TERM INVESTMENTS - at cost Subsidiaries Lucky Holdings Limited 6.1 32,145 32,145 LCL Investment Holdings Limited 6.2 4,580,500 4,580,500 Lucky Motor Corporation Limited (formerly Kia Lucky Motors Pakistan Limited) 6.3 12,876,384 12,876,384 ICI Pakistan Limited 6.4 9,594,091 9,594,091 Lucky Electric Power Company Limited 6.5 21,300,000 19,450,000 48,383,120 46,533,120 Associate Yunus Energy Limited 6.6 611,365 611,365 48,994,485 47,144,485
6.1 Lucky Holdings Limited (LHL) is a public unlisted Company incorporated in Pakistan. As of the statement of financial position date, the Company owns 75 percent shares of Lucky Holdings Limited.
Additions(Cost)
Deletions(Cost)
(PKR in ‘000’)
Notes to the Unconsolidated CondensedInterim Financial Statements For the 1st quarter ended September 30, 2020 (Un-audited)
Note (Un-audited)September 30,
2020
(Audited)June 30,
2020(PKR in ‘000’)
172020
A D V O C A T E S O F S U S T A I N A B I L I T YF O R A B E T T E R T O M O R R O W Q U A R T E R L Y R E P O R T

6.2 Represents equity investment in LCL Investment Holdings Limited (LCLIHL), a wholly owned subsidiary of the Company, incorporated and domiciled in Mauritius. LCLIHL has entered into joint venture agreements with Al Shamookh group to form Lucky Al Shamookh Holdings Limited (LASHL) for operating a cement grinding unit in Basra, Iraq and Al Shamookh Lucky Investment Limited (ASLIL) for constructing a fully integrated cement manufacturing unit in Samawah, Iraq. LASHL and ASLIL are companies with limited liability registered in Jebel Ali Free Zone, United Arab Emirates. LCLIHL holds 50 percent ownership in the aforesaid joint ventures.
LCLIHL has also entered into a joint venture agreement with Rawsons Investments Limited
(registered in Cayman Islands) for establishing LuckyRawji Holdings Limited (LRHL), incorporated with limited liability under laws of British Virgin Islands, for operating a fully integrated cement manufacturing unit in the Democratic Republic of Congo. LCLIHL holds 50 percent ownership interest in LRHL.
6.3 Represents equity investment in Lucky Motor Corporation Limited (LMC) [formerly Kia Lucky
Motors Pakistan Limited], a public unlisted company incorporated in Pakistan. The Company holds 71.55 percent shares of LMC (June 30, 2020: 71.55%). The amount includes advance against issuance of shares amounting to Nil (June 30, 2020: PKR 1,558 million).
6.4 ICI Pakistan Limited (ICI) was incorporated in Pakistan and is listed on the Pakistan Stock
Exchange. Subsequent to the amalgamation of Lucky Cement Holdings (Pvt) Ltd with Lucky Cement Limited, the Company now directly holds 55 percent shares (50,798,000 shares of PKR 10 each) of ICI. ICI is engaged in the manufacture of polyester staple fiber, POY chips, soda ash, specialty chemicals, sodium bicarbonate and polyurethanes; marketing of seeds, toll manufactured and imported pharmaceuticals and animal health products; and merchanting of general chemicals. It also acts an indenting agent and toll manufacturer. Its manufacturing facilities are situated in Karachi, Lahore and Khewra and its registered office is situated at 5 West Wharf, Karachi.
6.5 Lucky Electric Power Company Limited (LEPCL) was incorporated in Pakistan on June 13, 2014, as a public unlisted company. Subsequent to the amalgamation of LCL Holdings Limited, the Company now directly holds 100 percent shares (2,130,000,000 shares of PKR 10 each) of LEPCL. This includes advance against issuance of shares amounting to PKR 1,450 million. The operations of LEPCL have not yet started. LEPCL is investing in setting up a 660 MW coal based power project in Karachi. Its registered office is situated at 6-A, Muhammad Ali Society, A. Aziz Hashim Tabba Street, Karachi in the province of Sindh.
6.6 Represents equity investment in Yunus Energy Limited (YEL), a public unlisted company incorporated in Pakistan. As of the statement of financial position date, the Company owns 20 percent shares of YEL.
EMBRACING THE
CHANGE18

7 LONG-TERM LOAN Salary refinance loan at beginning of the period / year 506,908 - Loan proceeds received during the period / year 506,908 506,908 Salary refinance loan at end of the period / year 7.1 1,013,816 506,908 Less: Deferred income - Government grant 7.2 (101,065) (59,720) Less: Current maturity of long-term loan (380,181) (126,727) Non-current portion of long-term loan 532,570 320,461
8 DEFERRED LIABILITIES Staff gratuity 2,026,738 1,948,457 Deferred tax liability 8.1 5,256,875 5,167,561 7,283,613 7,116,018 8.1 Deferred tax liability This comprises the following : - Taxable temporary differences arising due to accelerated tax depreciation allowance 6,340,228 5,605,449 - Deferred tax on minimum turnover tax (459,188) - - Deductible temporary differences arising in respect of provisions and taxable losses (624,165) (437,888) 5,256,875 5,167,561 9 This represents Islamic Export Refinance Facilities which carry markup at rates ranging from
2.5% to 3% per annum.
10 CONTINGENCIES AND COMMITMENTS 10.1 There are no significant changes in the status of contingencies and commitments as reported in
note 27 to the unconsolidated annual audited financial statements of the Company for the year ended June 30, 2020, except as disclosed in note 10.2.
7.1 Represents long-term loan obtained under the Refinance Scheme for Payment of Wages and Salaries to the Workers and Employees of Business Concerns by the State Bank of Pakistan, terms and conditions of which are same as those disclosed in the Company's unconsolidated annual audited financial statements for the year ended June 30, 2020.
7.2 The value of benefit of below-market interest rate on the salary refinance loan by the State Bank
of Pakistan has been accounted for as government grant under IAS - 20 Government grants.
Note (Un-audited)September 30,
2020
(Audited)June 30,
2020(PKR in ‘000’)
Note (Un-audited)September 30,
2020
(Audited)June 30,
2020(PKR in ‘000’)
Notes to the Unconsolidated CondensedInterim Financial Statements For the 1st quarter ended September 30, 2020 (Un-audited)
192020
A D V O C A T E S O F S U S T A I N A B I L I T YF O R A B E T T E R T O M O R R O W Q U A R T E R L Y R E P O R T

(Un-audited)September 30,
2020
(Audited)June 30,
2020(PKR in ‘000’)
September 30,2020
For the 1st quarter ended
September 30,2019
(PKR in ‘000’)
Note September 30,2020
For the 1st quarter ended
September 30,2019
(PKR in ‘000’)
10.2 COMMITMENTS Machinery under letters of credit 1,733,900 816,405 Stores, spares, packing material and other supplies under letters of credit 4,200,509 1,636,056 Bank guarantees issued by the Company on behalf of subsidiary companies 19,114,000 19,114,000 Bank guarantees issued on behalf of the Company 2,617,029 2,589,829 Post dated cheques 965,918 883,551 Commitment on behalf of subsidiary company in respect of cost over-run and PSRA support 22,812,208 23,135,522
11 GROSS SALES
Local 15,165,365 10,721,689 Export 4,565,904 3,208,292 19,731,269 13,929,982 12 OTHER INCOME
It mainly includes dividend income, income from deposits with Islamic banks and net income from supply of surplus electricity to Hyderabad Electric Supply Company.
13 CASH GENERATED FROM OPERATIONS Profit before taxation 2,685,370 1,021,913 Adjustments for non cash charges and other items
Depreciation 5.1 1,072,327 867,182 Amortization of intangible assets 2,897 2,517 Gain on disposal of property, plant & equipment (26,577) (3,384) Provision for gratuity 97,176 122,013 Dividend income from subsidiaries (382,690) (267,053) Dividend income from associate - (122,273) Dividend income from short term investments (47,410) (31,034)
EMBRACING THE
CHANGE20

14 TRANSACTIONS WITH RELATED PARTIES
Related parties include subsidiaries, associated entities, directors, the other key management personnel and close family members of directors and other key management personnel. Details of transactions with related parties during the period, other than those which have been disclosed elsewhere in these unconsolidated financial statements, are as follows:
Notes to the Unconsolidated CondensedInterim Financial Statements For the 1st quarter ended September 30, 2020 (Un-audited)
September 30,2020
For the 1st quarter ended
September 30,2019
(PKR in ‘000’)
September 30,2020
For the 1st quarter ended
September 30,2019
(PKR in ‘000’)
Income from deposits with islamic banks (136,586) (485,323) Finance cost 68,104 19,866 Profit before working capital changes 3,332,611 1,124,424 Increase in current assets
Stores and spares (512,947) (1,106,437) Stock in trade 117,325 651,859 Trade debts 541,918 (411,130) Loans and advances (520,976) (121,986) Trade deposits and short term prepayments 17,516 5,785 Other receivables (172,119) 4,019 (529,283) (977,890) Increase / (decrease) in current liabilities Trade and other payables 991,925 (981,964) Cash generated from operations 3,795,253 (835,430) 13.1 CASH AND CASH EQUIVALENTS Cash and bank balances 8,282,152 12,948,027 Bank balance marked as lien - (7,885,560) Short term borrowings (6,550,000) (3,350,000) 1,732,152 1,712,467
Transactions with Subsidiary Companies: Reimbursement of expenses to Company 16 20,699 Sales 9,211 7,920 Purchases 6,551 3,422 Services 4 - Purchase of vehicles 12,084 77,984 Investment made during the period 1,850,000 802,300 Dividend received 382,690 267,053 Payment against claim of tax loss - 32,639 Services received 253 29 Transactions with Directors and their close family members Meeting fee 438 375
212020
A D V O C A T E S O F S U S T A I N A B I L I T YF O R A B E T T E R T O M O R R O W Q U A R T E R L Y R E P O R T
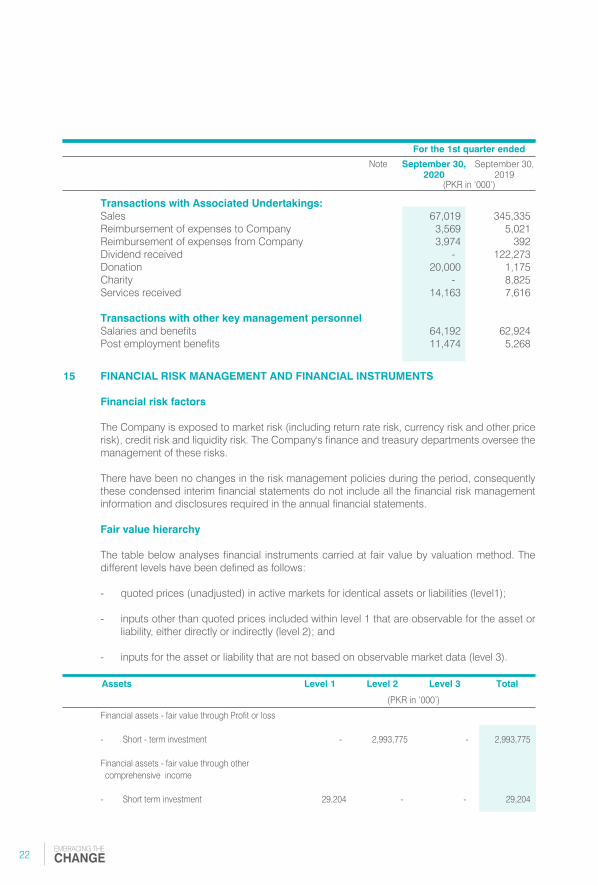
15 FINANCIAL RISK MANAGEMENT AND FINANCIAL INSTRUMENTS
Financial risk factors The Company is exposed to market risk (including return rate risk, currency risk and other price
risk), credit risk and liquidity risk. The Company's finance and treasury departments oversee the management of these risks.
There have been no changes in the risk management policies during the period, consequently
these condensed interim financial statements do not include all the financial risk management information and disclosures required in the annual financial statements.
Fair value hierarchy The table below analyses financial instruments carried at fair value by valuation method. The
different levels have been defined as follows:
- quoted prices (unadjusted) in active markets for identical assets or liabilities (level1);
- inputs other than quoted prices included within level 1 that are observable for the asset or liability, either directly or indirectly (level 2); and
- inputs for the asset or liability that are not based on observable market data (level 3).
Note September 30,2020
For the 1st quarter ended
September 30,2019
(PKR in ‘000’)
(PKR in ‘000’)
Level 2 Level 3 TotalLevel 1Assets
Transactions with Associated Undertakings: Sales 67,019 345,335 Reimbursement of expenses to Company 3,569 5,021 Reimbursement of expenses from Company 3,974 392 Dividend received - 122,273 Donation 20,000 1,175 Charity - 8,825 Services received 14,163 7,616 Transactions with other key management personnel Salaries and benefits 64,192 62,924 Post employment benefits 11,474 5,268
Financial assets - fair value through Profit or loss
- Short - term investment - 2,993,775 - 2,993,775
Financial assets - fair value through other comprehensive income
- Short term investment 29,204 - - 29,204
EMBRACING THE
CHANGE22
16 DATE OF AUTHORISATION FOR ISSUE
These unconsolidated condensed interim financial statements were authorized for issue on October 24, 2020 by the Board of Directors of the Company.
17 GENERAL Figures have been rounded off to the nearest thousand of PKR, unless otherwise stated.
Notes to the Unconsolidated CondensedInterim Financial Statements For the 1st quarter ended September 30, 2020 (Un-audited)
Muhammad Ali TabbaChief Executive
Muhammad Yunus TabbaChairman / Director
Atif KaludiChief Financial Officer
232020
A D V O C A T E S O F S U S T A I N A B I L I T YF O R A B E T T E R T O M O R R O W Q U A R T E R L Y R E P O R T

Note (Un-audited)September 30,
2020
(Audited)June 30,
2020(PKR in ‘000’)
Consolidated Condensed InterimStatement of Financial Position As at September 30, 2020
Muhammad Ali TabbaChief Executive
Muhammad Yunus TabbaChairman / Director
Atif KaludiChief Financial Officer
ASSETS
NON-CURRENT ASSETS Fixed assets Property, plant and equipment 5 196,382,875 190,788,960 Intangible assets 7,257,052 7,341,737 Right-of-use assets 6 297,141 318,279 203,937,068 198,448,976 Long-term investments 7 24,759,652 23,970,762 Long-term loans and advances 643,720 617,130 Long-term deposits and prepayments 48,694 46,672 229,389,134 223,083,540 CURRENT ASSETS Stores, spares and consumables 8,731,294 8,165,751 Stock-in-trade 20,335,176 21,292,185 Trade debts 5,180,802 5,834,590 Loans and advances 2,607,087 1,636,587 Trade deposits and short-term prepayments 1,000,026 1,000,279 Other receivables 9,462,532 9,202,663 Tax refunds due from the Government 538,812 538,812 Taxation receivable 2,110,225 2,335,223 Accrued return 58,171 94,208 Short term investments 3,022,979 2,970,999 Cash and bank balances 28,006,281 15,731,810 81,053,385 68,803,107 TOTAL ASSETS 310,442,519 291,886,647 EQUITY AND LIABILITIES SHARE CAPITAL AND RESERVES
Share capital 3,233,750 3,233,750 Reserves 114,701,237 110,543,591 Attributable to the owners of the Holding Company 117,934,987 113,777,341 Non-controlling interests 18,486,749 17,709,710 Total equity 136,421,736 131,487,051 NON-CURRENT LIABILITIES Long-term finances 8 89,335,855 82,427,884 Long-term deposits 360,662 357,855 Deferred liabilities 9 11,087,712 11,133,530 Deferred income - Government grant 8 217,270 96,256 Leases 238,393 253,591 Other long term liabilities 5,257,264 5,331,774 106,497,156 99,600,890 CURRENT LIABILITIES Current portion of long-term finances 8 2,461,233 2,637,451 Trade and other payables 53,328,628 42,536,979 Provision for taxation 2,018,872 1,792,626 Accrued return 271,778 848,931 Short-term borrowings and running finance 9,214,292 12,830,116 Current portion of leases 68,179 79,256 Unclaimed dividend 143,065 55,767 Unpaid dividend 17,580 17,580 67,523,627 60,798,706 174,020,783 160,399,596 CONTINGENCIES AND COMMITMENTS 10 TOTAL EQUITY AND LIABILITIES 310,442,519 291,886,647 The annexed notes from 1 to 16 form an integral part of these consolidated condensed interim financial statements.
EMBRACING THE
CHANGE24

NoteSeptember 30,
2020
Quarter EndedSeptember 30,
2019(PKR in ‘000’)
Consolidated Condensed Interim Statement ofProfit or Loss and Other Comprehensive Income For the 1st quarter ended September 30, 2020 (Un-audited)
Muhammad Ali TabbaChief Executive
Muhammad Yunus TabbaChairman / Director
Atif KaludiChief Financial Officer
Revenue 11 57,850,843 34,429,646 Less: Sales tax and excise duty 7,886,485 5,683,102 Rebates, incentives and commission 4,850,591 1,566,605 12,737,076 7,249,707 45,113,767 27,179,939 Cost of sales (36,340,792) (22,836,297)Gross profit 8,772,975 4,343,642 Distribution cost (2,278,104) (1,846,745)Administrative expenses (1,196,494) (1,018,820)Finance cost (425,619) (625,003)Other expenses (483,944) (191,640)Other income 12 1,507,934 1,385,695
Profit before taxation 5,896,748 2,047,129 Taxation - current (894,783) (748,827) - deferred 130,270 228,721 (764,513) (520,106) Profit after taxation 5,132,235 1,527,023
Attributable to: Owners of the Holding Company 4,349,491 1,272,179 Non-controlling interests 782,744 254,844 5,132,235 1,527,023 Other comprehensive income for the period
Other comprehensive loss which may be reclassified to statement of profit or loss in subsequent periods
Foreign exchange differences on translation of foreign operations (201,775) (261,420) Other comprehensive income / (loss) which will not be reclassified to statement of profit or loss in subsequent periods
Unrealized gain / (loss) on remeasurement of equity investment at fair value through other comprehensive income 11,682 (8,089) Deferred tax thereon (1,752) 1,213 9,930 (6,876)Total comprehensive income for the period 4,940,390 1,258,727 Attributable to: Owners of the Holding Company 4,157,646 1,003,883 Non-controlling interests 782,744 254,844 4,940,390 1,258,727
Earnings per share - basic and diluted 13.45 3.93 The annexed notes from 1 to 16 form an integral part of these consolidated condensed interim financial statements.
(PKR)
252020
A D V O C A T E S O F S U S T A I N A B I L I T YF O R A B E T T E R T O M O R R O W Q U A R T E R L Y R E P O R T
Note September 30,2020
September 30,2020
(PKR in ‘000’)
Consolidated Condensed InterimStatement of Cash Flows For the 1st quarter ended September 30, 2020 (Un-audited)
Muhammad Ali TabbaChief Executive
Muhammad Yunus TabbaChairman / Director
Atif KaludiChief Financial Officer
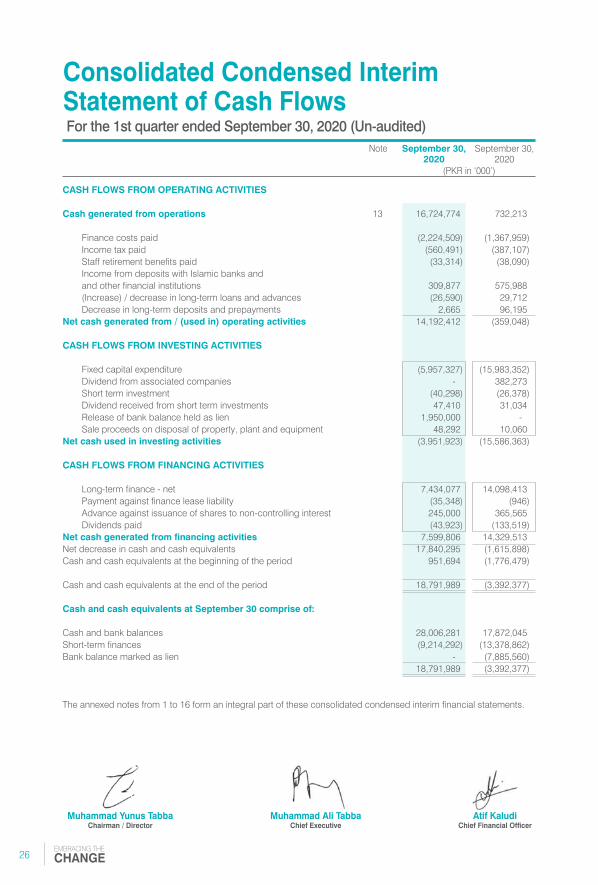
CASH FLOWS FROM OPERATING ACTIVITIES
Cash generated from operations 13 16,724,774 732,213 Finance costs paid (2,224,509) (1,367,959) Income tax paid (560,491) (387,107) Staff retirement benefits paid (33,314) (38,090) Income from deposits with Islamic banks and and other financial institutions 309,877 575,988 (Increase) / decrease in long-term loans and advances (26,590) 29,712 Decrease in long-term deposits and prepayments 2,665 96,195 Net cash generated from / (used in) operating activities 14,192,412 (359,048) CASH FLOWS FROM INVESTING ACTIVITIES
Fixed capital expenditure (5,957,327) (15,983,352) Dividend from associated companies - 382,273 Short term investment (40,298) (26,378) Dividend received from short term investments 47,410 31,034 Release of bank balance held as lien 1,950,000 - Sale proceeds on disposal of property, plant and equipment 48,292 10,060 Net cash used in investing activities (3,951,923) (15,586,363) CASH FLOWS FROM FINANCING ACTIVITIES
Long-term finance - net 7,434,077 14,098,413 Payment against finance lease liability (35,348) (946) Advance against issuance of shares to non-controlling interest 245,000 365,565 Dividends paid (43,923) (133,519)Net cash generated from financing activities 7,599,806 14,329,513 Net decrease in cash and cash equivalents 17,840,295 (1,615,898)Cash and cash equivalents at the beginning of the period 951,694 (1,776,479) Cash and cash equivalents at the end of the period 18,791,989 (3,392,377)
Cash and cash equivalents at September 30 comprise of:
Cash and bank balances 28,006,281 17,872,045 Short-term finances (9,214,292) (13,378,862)Bank balance marked as lien - (7,885,560) 18,791,989 (3,392,377)
The annexed notes from 1 to 16 form an integral part of these consolidated condensed interim financial statements.
EMBRACING THE
CHANGE26

Issued, subscribed
and paidup capital
Revenue reserves
Foreigncurrency
translationreserve
Generalreserves
Unappropriatedprofit
Totalreserves
Non-controllinginterests
Totalequity
(PKR in ‘000’)
Balance as at July 01, 2019 3,233,750 7,343,422 73,202,650 3,936,146 21,305,260 105,787,478 16,249,228 125,270,456
Transfer to general reserves - - 8,436,657 - (8,436,657) - - -
Final dividend at the rate of PKR 6.5/- per share for the year ended June 30, 2019 - - - - (2,101,938) (2,101,938) - (2,101,938)
Dividends paid to non-controlling interests of ICI - - - - - - (188,157) (188,157)
Dividends paid to non-controlling interests of LHL - - - - - - (89,017) (89,017)
Share of non-controlling interests of KLM - - - - - - 365,565 365,565
Profit after taxation - - - - 1,272,179 1,272,179 254,844 1,527,023
Other comprehensive income - - - (261,420) (6,876) (268,296) - (268,296)Total comprehensive income for the quarter ended September 30, 2019 - - - (261,420) 1,265,303 1,003,883 254,844 1,258,727
Balance as at September 30, 2019 3,233,750 7,343,422 81,639,307 3,674,726 12,031,968 104,689,423 16,592,463 124,515,636
Balance as at July 01, 2020 3,233,750 7,343,422 81,639,307 4,625,020 16,935,842 110,543,591 17,709,710 131,487,051
Transfer to general reserves - - 3,508,483 - (3,508,483) - - -
Dividends paid to non-controlling interests of ICI - - - - - - (207,805) (207,805)
Dividends paid to non-controlling interests of LHL - - - - - - (42,900) (42,900)
Shares issued to non-controlling interest of ICI - - - - - - 245,000 245,000
Profit after taxation - - - - 4,349,491 4,349,491 782,744 5,132,235
Other comprehensive income - - - (201,775) 9,930 (191,845) - (191,845)Total comprehensive income for the quarter ended September 30, 2020 - - - (201,775) 4,359,421 4,157,646 782,744 4,940,390
Balance as at September 30, 2020 3,233,750 7,343,422 85,147,790 4,423,245 17,786,780 114,701,237 18,486,749 136,421,736
The annexed notes from 1 to 16 form an integral part of these consolidated condensed interim financial statements.
Capitalreserve
Sharepremium
Consolidated Condensed InterimStatement of Changes in Equity For the 1st quarter ended September 30, 2020 (Un-audited)
Muhammad Ali TabbaChief Executive
Muhammad Yunus TabbaChairman / Director
Atif KaludiChief Financial Officer
272020
A D V O C A T E S O F S U S T A I N A B I L I T YF O R A B E T T E R T O M O R R O W Q U A R T E R L Y R E P O R T

1 THE GROUP AND ITS OPERATIONS The Group consists of Lucky Cement Limited ("the Holding Company") and its subsidiary
companies LCL Investment Holdings Limited, Lucky Holdings Limited, Lucky Motor Corporation Limited (formerly KIA Lucky Motors Pakistan Limited), ICI Pakistan Limited and Lucky Electric Power Company Limited. Brief profiles of the Holding company, its subsidiary companies are as follows :
1.1 Lucky Cement Limited The Holding Company was incorporated in Pakistan on September 18, 1993 under the
Companies Ordinance, 1984 (the Ordinance). The shares of the Holding Company are quoted on the Pakistan Stock Exchange. The Holding Company has also issued Global Depository Receipts (GDRs) which are listed and traded on the Professional Securities Market of the London Stock Exchange. The principal activity of the Holding Company is manufacturing and marketing of cement. The registered office of the Holding Company is located at Pezu, District Lakki Marwat in Khyber Pakhtunkhwa and the head office is situated at Muhammad Ali Housing Society, A. Aziz Hashim Tabba Street in Karachi. The Holding Company has two production facilities at Pezu, District Lakki Marwat in Khyber Pakhtunkhwa and at Main Super Highway in Karachi, Sindh. Further, the Holding Company's liaison offices are situated in Islamabad, Quetta, Multan, D.I.Khan, Lahore and Peshawar.
1.2 Lucky Holdings Limited Lucky Holdings Limited (LHL) was incorporated in Pakistan on September 6, 2012 as a public
unlisted Company limited by shares under the Companies Ordinance, 1984. The registered office of LHL is situated at Third Floor, Syed Towers, University Road, Opp: Custom House, Peshawar, Khyber Pakhtunkhwa. As of the statement of financial position date, the Company owns 75 percent shares of Lucky Holdings Limited (LHL).
1.3 LCL Investment Holdings Limited The Holding Company has made an investment in LCL Investment Holdings Limited (LCLIHL),
incorporated and domiciled in Mauritius. LCLIHL has entered into joint venture agreements with Al Shamookh group to form Lucky Al Shamookh Holdings Limited (LASHL) for operating a cement grinding unit in Basra, Iraq and Al Shamookh Lucky Investment Limited (ASLIL) for constructing a fully integrated cement manufacturing unit in Samawah, Iraq. LASHL and ASLIL are companies with limited liability registered in Jebel Ali Free Zone, United Arab Emirates. LCLIHL holds 50 percent ownership in the aforesaid joint ventures.
LCLIHL has also entered into a joint venture agreement with Rawsons Investments Limited (registered in Cayman Islands) for establishing Lucky Rawji Holdings Limited (LRHL), incorporated with limited liability under laws of British Virgin Islands, for constructing a fully integrated cement manufacturing unit in the Democratic Republic of Congo. LCLIHL holds 50 percent ownership interest in LRHL.
1.4 Lucky Motor Corporation Limited Lucky Motor Corporation Limited (LMC) [formerly KIA Lucky Motors Pakistan Limited] was
incorporated in Pakistan as a public unlisted company. The principal line of business of LMC is to carry on the manufacturing, assembling, distribution, marketing, sale, after-sale-service, import and export of all types of KIA motor vehicles, parts and accessories under license from KIA Motors Corporation. As of the statement of financial position date the Company holds 71.55 percent shares of LMC (June 30, 2020: 71.55%).
Notes to the Consolidated CondensedInterim Financial Statements For the 1st quarter ended September 30, 2020 (Un-audited)
EMBRACING THE
CHANGE28

1.5 ICI Pakistan Limited ICI Pakistan Limited (ICI) was incorporated in Pakistan and is listed on the Pakistan Stock
Exchange. The Holding Company holds 55 percent shares (50,798,000 shares of PKR 10 each) of ICI. ICI is engaged in the manufacture of polyester staple fiber, POY chips, soda ash, specialty chemicals, sodium bicarbonate and polyurethanes; marketing of seeds, toll manufactured and imported pharmaceuticals and animal health products; and merchanting of general chemicals. It also acts an indenting agent and toll manufacturer. Its manufacturing facilities are situated in Karachi, Lahore and Khewra and the registered office of ICI is situated at 5 West Wharf, Karachi.
Details of the investments of ICI are as follows:
1.5.1 ICI Pakistan PowerGen Limited ICI Pakistan PowerGen Limited (ICI PowerGen) was incorporated in Pakistan as an unlisted
public company and is a wholly owned subsidiary company of ICI. ICI PowerGen is engaged in generating, selling and supplying electricity to ICI. The registered office of ICI PowerGen is situated at 5 West Wharf, Karachi.
1.5.2 NutriCo Morinaga (Private) Limited NutriCo Morinaga (Private) Limited (NutriCo) is a private limited company incorporated in
Pakistan. ICI has 51% ownership interest in NutriCo. NutriCo is engaged in manufacturing of infant milk powder. The registered office of NutriCo is situated at ICI House, 5 West Wharf, Karachi.
1.6 Lucky Electric Power Company Limited Lucky Electric Power Company Limited (LEPCL) was incorporated in Pakistan on June 13, 2014,
as a public unlisted company. Subsequent to the amalgamation of LCL Holdings Limited, the Company now directly holds 100 percent shares (2,130,000,000 shares of PKR 10 each) of LEPCL. This includes advance against issuance of shares amounting to PKR 1,450 million. The operations of LEPCL have not yet started. LEPCL is investing in setting up a 660 MW coal based power project in Karachi. Its registered office is situated at 6-A, Muhammad Ali Society, A. Aziz Hashim Tabba Street, Karachi in the province of Sindh.
2 STATEMENT OF COMPLIANCE 2.1 These consolidated condensed interim financial statements of the Company for the quarter
ended September 30, 2020 have been prepared in accordance with the requirements of the International Accounting Standard (IAS) - 34 "Interim Financial Reporting" and provisions of and directives issued under the Companies Act, 2017. In case where the requirements differ, the provisions of or directives issued under the Companies Act, 2017 have been followed. These consolidated condensed interim financial statements do not include all the information and disclosures required in the consolidated annual audited financial statements, and should be read in conjunction with Company's consolidated annual audited financial statements for the year ended June 30, 2020.
292020
A D V O C A T E S O F S U S T A I N A B I L I T YF O R A B E T T E R T O M O R R O W Q U A R T E R L Y R E P O R T

3 SIGNIFICANT ACCOUNTING POLICIES
3.1 The accounting policies and methods of computation adopted in the preparation of these consolidated condensed interim financial statements are consistent with those applied in the preparation of the consolidated annual audited financial statements for the year ended June 30, 2020 except those stated in note 3.2 (a) below.
3.2 Change in accounting standards, interpretations and amendments to published approved accounting standards
(a) New standards, amendments and interpretation to published approved accounting and reporting standards which are effective during the quarter ended September 30, 2020
There are certain amendments and an interpretation to approved accounting and reporting standards which are mandatory for the Company's annual accounting period which began on July 1, 2020. However, these do not have any significant impact on the Holding Company’s financial reporting and, therefore, have not been detailed in these consolidated condensed interim financial statements.
(b) New standards and amendments to published approved accounting and reporting standards that are not yet effective
There are certain new standards and amendments to the approved accounting standards that will be mandatory for the Company's annual accounting periods beginning on or after July 1, 2021. However, these amendments will not have any significant impact on the financial reporting of the Company and, therefore, have not been disclosed in these Holding Company's consolidated condensed interim financial statements.
4 ACCOUNTING ESTIMATES, JUDGEMENTS AND FINANCIAL RISK MANAGEMENT
The preparation of interim financial statements requires management to make judgements, estimates and assumptions that affect the application of accounting policies and the reported amounts. Actual results may differ from these judgements, estimates and assumptions.
However, the management believes that the change in outcome of judgements, estimates and assumptions would not have a material impact on the amounts disclosed in these consolidated condensed interim financial statements.
Judgements and estimates made by the management in the preparation of these consolidated condensed interim financial statements are the same as those applied in the Company's consolidated annual audited financial statements for the year ended June 30, 2020.
The Company’s financial risk management objectives and policies are consistent with those disclosed in the Company's consolidated annual audited financial statements for the year ended June 30, 2020. Further, there were no transfers in fair value hierarchy levels during the quarter.
Notes to the Consolidated CondensedInterim Financial Statements For the 1st quarter ended September 30, 2020 (Un-audited)
EMBRACING THE
CHANGE30

5 PROPERTY, PLANT AND EQUIPMENT 5.1 The following is the movement in property, plant and equipment during the period / year:
Operating fixed assets (WDV) - opening balance 103,464,039 83,666,110 Add: Additions during the period / year 5.2 417,653 27,604,790 103,881,692 111,270,900 Less: Disposals during the period / year (WDV) 20,817 75,470 Depreciation charge for the period / year 2,066,217 7,731,391 Operating fixed assets (WDV) - closing balance 101,794,658 103,464,039 Add: Capital work-in-progress 5.3 94,588,217 87,324,921 196,382,875 190,788,960
Note (Un-audited)September 30,
2020
(Audited)June 30,
2020(PKR in ‘000’)
5.2 The following additions and deletions were made during the period in operating fixed assets:
Operating fixed assets Land 7,225 - Buildings on free hold land - Cement plant 119,027 - - Power plant 814 - Buildings on leasehold land - Cement plant 738 - - Others 5,412 - Machinery 241,468 9,118 Vehicles including cement bulkers 19,934 47,257 Furniture and fixtures 9,043 1,939 Office equipments 4,533 - Computer & Accessories 5,177 1,945 Other assets 4,282 109 417,653 60,369
Additions(Cost)
Deletions(Cost)
(PKR in ‘000’)
5.3 The following is the movement in capital work-in-progress during the period / year: Opening balance 87,324,921 51,809,686 Add: Additions during the period / year 7,650,544 62,890,327 94,975,465 114,700,013 Less: Transferred to operating fixed assets 387,248 27,345,907 Less: Transferred to intangible assets - 29,185 Closing balance 94,588,217 87,324,921
(Un-audited)September 30,
2020
(Audited)June 30,
2020(PKR in ‘000’)
312020
A D V O C A T E S O F S U S T A I N A B I L I T YF O R A B E T T E R T O M O R R O W Q U A R T E R L Y R E P O R T

6 RIGHT-OF-USE ASSETS Cost 318,279 402,827 Less: Depreciation charged during the period / year 21,138 84,548 Closing net book value 297,141 318,279
7 LONG TERM INVESTMENT Equity accounted investment Joint ventures Lucky Al Shumookh Holdings Limited (LASHL) 7.1 7,200,482 6,927,802 LuckyRawji Holdings Limited (LRHL) 7.2 11,846,975 11,471,453 Al Shumookh Lucky Investments Limited (ASLIL) 7.3 3,267,187 3,319,116 22,314,643 21,718,371 Associates NutriCo Pakistan (Pvt) Limited 7.4 1,209,831 1,106,787 Yunus Energy Limited 7.5 1,232,678 1,143,104 2,442,509 2,249,891 24,757,152 23,968,262 Unquoted - at cost Equity security available-for-sale Arabian Sea Country Club Limited (250,000 ordinary shares of PKR 10 each) 2,500 2,500 24,759,652 23,970,762 7.1 Lucky Al Shumookh Holdings Limited Investment at cost 1,912,283 1,912,283 Share of cumulative profit at the beginning of the period / year 2,870,544 1,584,931 Share of profit during the period / year 372,309 1,285,613 3,242,853 2,870,544 Foreign currency translation reserve 2,045,346 2,144,975 7,200,482 6,927,802 The Group's interest in LASHL's assets and liabilities is as follows: Total assets 15,220,910 14,360,913 Total liabilities (819,946) (505,309) Net assets (100%) 14,400,964 13,855,604 Group's share of net assets (50%) 7,200,482 6,927,802 The Group's share in LASHL's profit or loss is as follows: Revenue 2,928,793 10,658,479 Net profit (100%) 744,617 2,571,226 Group's share of net profit (50%) 372,309 1,285,613
Note (Un-audited)September 30,
2020
(Audited)June 30,
2020(PKR in ‘000’)
Notes to the Consolidated CondensedInterim Financial Statements For the 1st quarter ended September 30, 2020 (Un-audited)
EMBRACING THE
CHANGE32

Note (Un-audited)September 30,
2020
(Audited)June 30,
2020(PKR in ‘000’)
7.2 Lucky Rawji Holdings Limited Investment at cost 6,870,050 6,870,050 Share of cumulative loss at the beginning of the period / year 237,439 (494,136) Share of profit during the period / year 539,914 731,575 777,353 237,439 Foreign currency translation reserve 4,199,571 4,363,964 11,846,974 11,471,453 The Group's interest in LRHL's assets and liabilities is as follows:
Total assets 40,925,221 40,765,483 Total liabilities (17,231,272) (17,822,578) Net assets (100%) 23,693,949 22,942,905 Group's share of net assets (50%) 11,846,975 11,471,453 The Group's share in LRHL's profit or loss is as follows: Revenue 4,347,019 11,131,345 Net profit (100%) 1,079,828 1,463,149 Group's share of net profit (50%) 539,914 731,575 7.3 Al Shumookh Lucky Investments Limited Investment at cost - Opening 2,798,978 446,270 Investment made during the period / year - 2,352,708 2,798,978 2,798,978 Share of cumulative profit at the beginning of the period / year 374,794 105,343 Share of (loss) / profit during the period / year (5,547) 269,451 369,247 374,794 Foreign currency translation reserve 98,961 145,344 3,267,186 3,319,116 The Group's interest in ASLIL's assets and liabilities is as follows:
Total assets 18,104,972 16,785,363 Total liabilities (11,570,598) (10,147,131) Net assets (100%) 6,534,374 6,638,232 Group's share of net assets (50%) 3,267,187 3,319,116
332020
A D V O C A T E S O F S U S T A I N A B I L I T YF O R A B E T T E R T O M O R R O W Q U A R T E R L Y R E P O R T

Notes to the Consolidated CondensedInterim Financial Statements For the 1st quarter ended September 30, 2020 (Un-audited)
The Group's share in ASLIL's profit or loss is as follows: Revenue - - Net profit (100%) (11,093) 538,902 Group's share of net profit (50%) (5,547) 269,451 7.4 NutriCo Pakistan (Pvt) Limited Investment at cost 960,000 960,000 Share of profit opening balance 146,787 515,773 Share of profit during the period / year 103,044 431,014 Dividend received during the period / year - (800,000) 249,831 146,787 1,209,831 1,106,787 The Group's share in NutriCo's profit or loss is as follows: Revenue 2,549,559 9,523,528 Net profit (100%) 257,610 1,077,534 Group's share of net profit (40%) 103,044 431,014 The Group has a 40% interest in NutriCo Pakistan (Private) Limited (the associate), which is
involved in marketing and distribution of infant milk and nutritional products.
7.5 Yunus Energy Limited Investment at cost 611,365 611,365 Share of cumulative profit at the beginning of the year 531,739 333,219 Share of profit during the period / year 89,574 320,793 Dividend received during the period / year - (122,273) 621,313 531,739 1,232,678 1,143,104 Represents 20% equity investment of 61,365,500 shares @ PKR 10/- each in Yunus Energy
Limited.
(Un-audited)September 30,
2020
(Audited)June 30,
2020(PKR in ‘000’)
(Un-audited)September 30,
2020
(Audited)June 30,
2020(PKR in ‘000’)
EMBRACING THE
CHANGE34

8 LONG TERM FINANCES Long-term finances 8.1 92,014,358 85,161,591 Deferred income - Government grant 8.2 (217,270) (96,256) Current portion of long term finances (2,461,233) (2,637,451) 89,335,855 82,427,884
8.1 This includes long-term loan obtained under the Refinance Scheme for Payment of Wages and Salaries to the Workers and Employees of Business Concerns by the State Bank of Pakistan, terms and conditions of which are same as those disclosed in the consolidated annual audited financial statements for the year ended June 30, 2020.
8.2 The value of benefit of below-market interest rate on the salary refinance loan by the State Bank of Pakistan has been accounted for as government grant under IAS - 20 Government grants.
9 DEFERRED LIABILITIES Staff gratuity and eligible retired employees' medical scheme 2,191,617 2,104,551 Deferred tax liability 9.1 8,896,095 9,028,979 11,087,712 11,133,530 9.1 Deferred tax liability This comprises of the following : - Taxable temporary differences arising due to accelerated tax depreciation allowance 11,034,151 10,397,926 - Deferred tax on minimum turnover tax (459,188) - - Deductible temporary differences arising in respect of provisions (1,678,868) (1,368,947) 8,896,095 9,028,979 10 CONTINGENCIES AND COMMITMENTS 10.1 CONTINGENCIES There are no major changes in the status of contingencies as reported in the annual audited
consolidated financial statements for the year ended June 30, 2020.
Note
Note
(Un-audited)September 30,
2020
(Audited)June 30,
2020(PKR in ‘000’)
(Un-audited)September 30,
2020
(Audited)June 30,
2020(PKR in ‘000’)
352020
A D V O C A T E S O F S U S T A I N A B I L I T YF O R A B E T T E R T O M O R R O W Q U A R T E R L Y R E P O R T

10.2 COMMITMENTS Machinery under letters of credit and others 16,090,499 13,333,475 Stores, spares, raw / packing material and other supplies under letters of credit 20,253,517 1,636,056 Bank guarantees issued on behalf of the Holding Company and its subsidiaries 26,927,107 20,126,180 Standby Letter of Credit 8,888,342 23,761,570 Post dated cheques 1,856,589 2,036,197 Commitment in connection with LEPCL's project's cost over-run and Payment Service Reserve Account (PSRA) support 22,812,208 23,135,522
10.3 Claims against the Group not acknowledged as debts are as follows: Local bodies 81,500 81,500 Others 22,979 22,979 104,479 104,479 10.4 Commitments for rentals under operating lease / Ijarah agreements in respect of vehicles are as
follows: Year 2020-21 421 646 2021-22 187 287 608 933 Payable not later than one year 421 646 Payable later than one year but not later than five years 187 287 608 933
Notes to the Consolidated CondensedInterim Financial Statements For the 1st quarter ended September 30, 2020 (Un-audited)
(Un-audited)September 30,
2020
(Audited)June 30,
2020(PKR in ‘000’)
EMBRACING THE
CHANGE36

September 30,2020
For the 1st quarter ended
September 30,2019
(PKR in ‘000’)
September 30,2020
For the 1st quarter ended
September 30,2019
(PKR in ‘000’)
11 SEGMENT REPORTING TURNOVER Cement 19,731,269 13,929,982 Polyester 6,575,685 5,892,985 Soda Ash 4,719,947 4,952,463 Pharma 2,063,581 2,015,143 Animal Health 1,303,461 1,091,944 Chemicals and Agri Sciences 2,493,101 2,788,591 Automobiles 20,473,085 3,852,409 NutriCo Morinaga 543,268 - Others 427,293 347,916 Inter-segment eliminations (479,847) (441,787) 57,850,843 34,429,646
11.1 OPERATING RESULT Cement 2,351,189 216,085 Polyester 413,300 199,684 Soda Ash 796,088 1,056,269 Pharma 128,820 101,414 Animal Health 76,811 66,868 Chemicals and Agri Sciences 198,857 215,798 Automobiles 1,542,248 (332,187) Nutrico Morinaga (185,783) - Power Generation (34,009) (28,763) Others 51,460 (15,794) Inter-segment eliminations (40,603) (1,297) 5,298,377 1,478,077
11.2 Transactions among the business segments are recorded at arm's length prices using admissible valuation methods.
11.3 GROSS SALES Local 53,111,353 30,830,752 Export 4,739,490 3,598,893 57,850,843 34,429,646 12 OTHER INCOME It mainly includes income from deposits with Islamic banks and other financial institution and
share of gain in equity-accounted investments.
372020
A D V O C A T E S O F S U S T A I N A B I L I T YF O R A B E T T E R T O M O R R O W Q U A R T E R L Y R E P O R T

13 CASH GENERATED FROM OPERATIONS Profit before taxation 5,896,748 2,047,129 Adjustments for non-cash charges and other items Depreciation 5.1 2,066,217 1,798,443 Amortization on intangible assets 103,924 85,973 Provision for slow moving spares 31,980 - Provision for slow moving and obsolete stock-in-trade 8,446 13,095 Provision / (reversal) for doubtful debts 2,517 (18,803) Gain on disposal of fixed assets (27,475) (3,393) Provision for staff retirement plan 117,464 146,146 Share of profit from equity accounted investees (1,099,252) (753,719) Return from deposits with islamic banks and and other financial institutions (290,286) (506,374) Dividend income from short term investments (47,410) (31,034) Finance cost 409,688 599,012 Profit before working capital changes 7,172,561 3,376,475 Increase in current assets Stores, spares and consumables (536,389) (1,167,391) Stock-in-trade 896,658 (165,268) Trade debts 653,786 (377,912) Loans and advances (976,094) (303,360) Trade deposits and short term prepayments (161,222) (252,675) Other receivables (188,075) (520,252) (311,336) (2,786,858) Increase in current liabilities Trade and other payables 9,863,549 142,596 Cash generated from operations 16,724,774 732,213 14 TRANSACTIONS WITH RELATED PARTIES Related parties comprise of associated entities, directors, other key management personnel and
close family members of directors and other key management personnel. Details of transactions with related parties during the period are as follows:
Notes to the Consolidated CondensedInterim Financial Statements For the 1st quarter ended September 30, 2020 (Un-audited)
Note September 30,2020
For the 1st quarter ended
September 30,2019
(PKR in ‘000’)
EMBRACING THE
CHANGE38

Muhammad Ali TabbaChief Executive
Muhammad Yunus TabbaChairman / Director
Atif KaludiChief Financial Officer
Transactions with Associated Undertakings Sales 569,249 1,060,340 Purchase of goods, materials and services 531,731 428,028 Reimbursement of expenses to Company 5,150 24,645 Reimbursement of expenses from Company 3,974 392 Donation 20,000 3,475 Charity - 8,825 Dividends received - 382,273 Dividends paid 88,659 125,581 Rent paid 3,785 4,082 Services 43,584 7,616 Transactions with Directors and with their close family members Meeting fee 438 375 Rent paid 1,000 - Transactions with other key management personnel Salaries and benefits 165,447 150,890 Post employment benefits 23,885 16,872 Dividends paid 2,369 2,180 Staff retirement benefit plan Contribution 85,743 50,265
15 GENERAL Figures have been rounded off to the nearest thousand of PKR, unless otherwise stated.
16 DATE OF AUTHORISATION FOR ISSUE
These consolidated condensed interim financial statements were authorized for issue on October 24, 2020 by the Board of Directors of the Holding Company.
September 30,2020
For the 1st quarter ended
September 30,2019
(PKR in ‘000’)
392020
A D V O C A T E S O F S U S T A I N A B I L I T YF O R A B E T T E R T O M O R R O W Q U A R T E R L Y R E P O R T