Embed Size (px)
Citation preview
0
\
Fund Managers’ Report AL Meezan Investment Management Limited
Stock Market Review
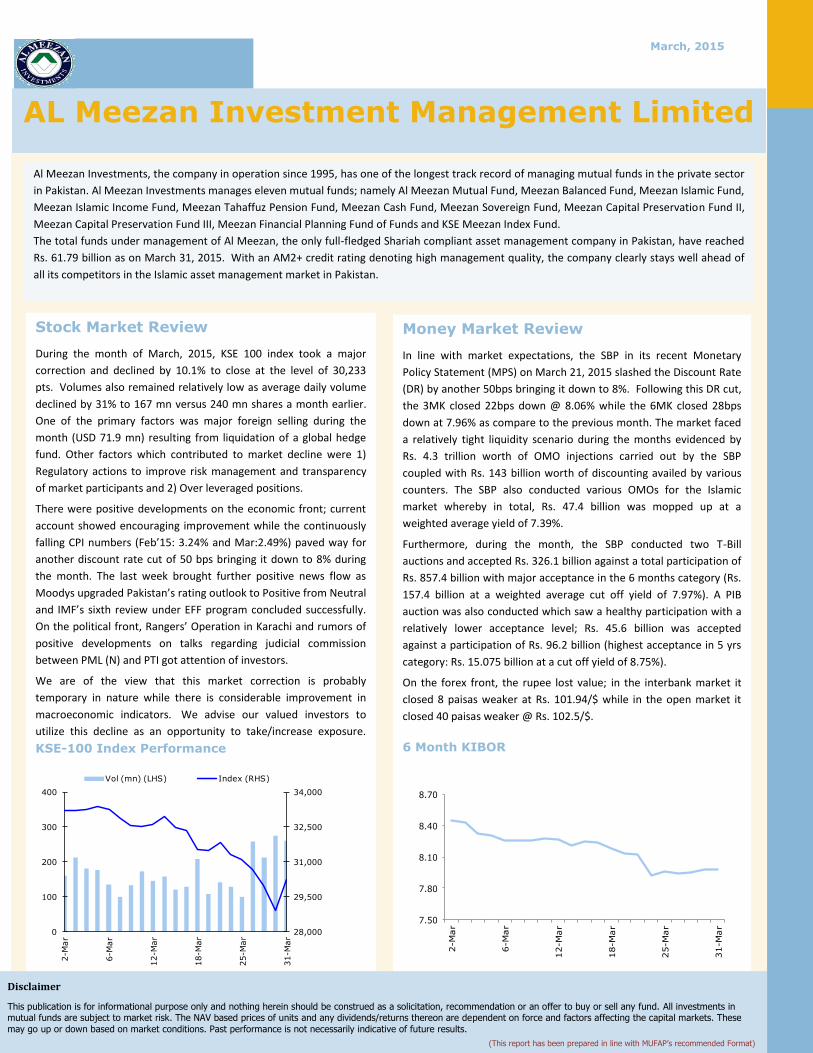
During the month of March, 2015, KSE 100 index took a major
correction and declined by 10.1% to close at the level of 30,233
pts. Volumes also remained relatively low as average daily volume
declined by 31% to 167 mn versus 240 mn shares a month earlier.
One of the primary factors was major foreign selling during the
month (USD 71.9 mn) resulting from liquidation of a global hedge
fund. Other factors which contributed to market decline were 1)
Regulatory actions to improve risk management and transparency
of market participants and 2) Over leveraged positions.
There were positive developments on the economic front; current
account showed encouraging improvement while the continuously
falling CPI numbers (Feb’15: 3.24% and Mar:2.49%) paved way for
another discount rate cut of 50 bps bringing it down to 8% during
the month. The last week brought further positive news flow as
Moodys upgraded Pakistan’s rating outlook to Positive from Neutral
and IMF’s sixth review under EFF program concluded successfully.
On the political front, Rangers’ Operation in Karachi and rumors of
positive developments on talks regarding judicial commission
between PML (N) and PTI got attention of investors.
We are of the view that this market correction is probably
temporary in nature while there is considerable improvement in
macroeconomic indicators. We advise our valued investors to
utilize this decline as an opportunity to take/increase exposure.
KSE-100 Index Performance
Al Meezan Investments, the company in operation since 1995, has one of the longest track record of managing mutual funds in the private sector
in Pakistan. Al Meezan Investments manages eleven mutual funds; namely Al Meezan Mutual Fund, Meezan Balanced Fund, Meezan Islamic Fund,
Meezan Islamic Income Fund, Meezan Tahaffuz Pension Fund, Meezan Cash Fund, Meezan Sovereign Fund, Meezan Capital Preservation Fund II,
Meezan Capital Preservation Fund III, Meezan Financial Planning Fund of Funds and KSE Meezan Index Fund.
The total funds under management of Al Meezan, the only full-fledged Shariah compliant asset management company in Pakistan, have reached
Rs. 61.79 billion as on March 31, 2015. With an AM2+ credit rating denoting high management quality, the company clearly stays well ahead of
all its competitors in the Islamic asset management market in Pakistan.
March, 2015
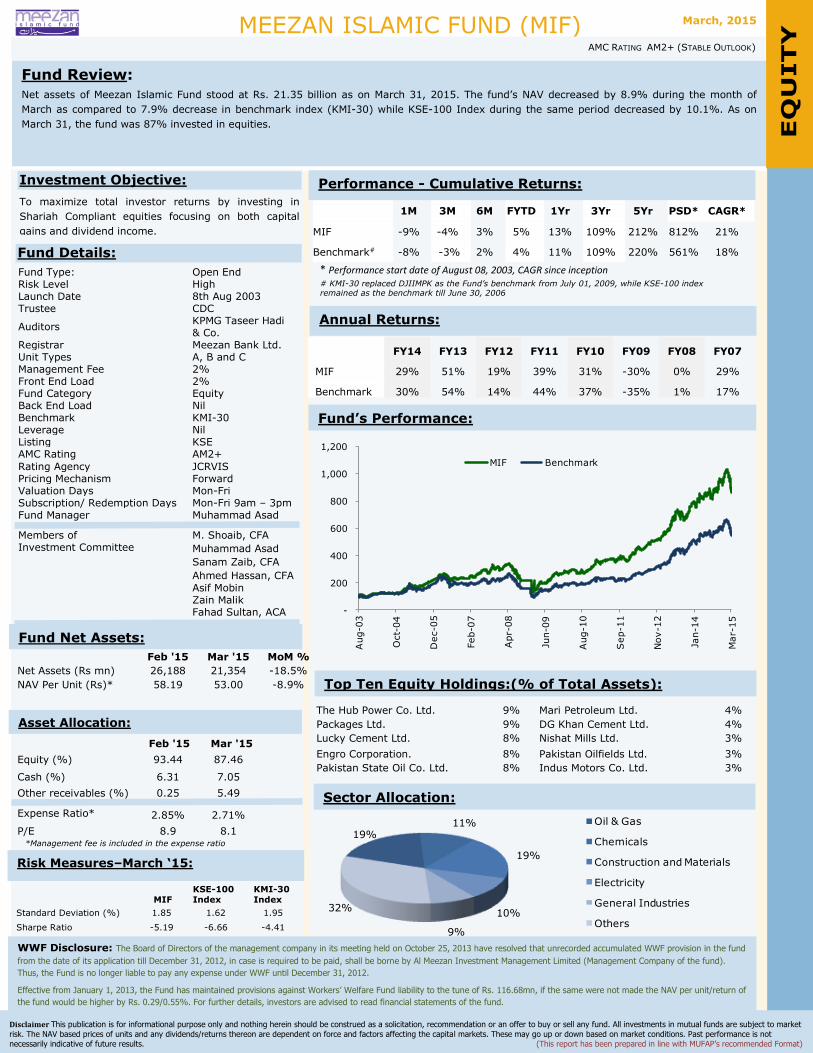
Money Market Review
In line with market expectations, the SBP in its recent Monetary
Policy Statement (MPS) on March 21, 2015 slashed the Discount Rate
(DR) by another 50bps bringing it down to 8%. Following this DR cut,
the 3MK closed 22bps down @ 8.06% while the 6MK closed 28bps
down at 7.96% as compare to the previous month. The market faced
a relatively tight liquidity scenario during the months evidenced by
Rs. 4.3 trillion worth of OMO injections carried out by the SBP
coupled with Rs. 143 billion worth of discounting availed by various
counters. The SBP also conducted various OMOs for the Islamic
market whereby in total, Rs. 47.4 billion was mopped up at a
weighted average yield of 7.39%.
Furthermore, during the month, the SBP conducted two T-Bill
auctions and accepted Rs. 326.1 billion against a total participation of
Rs. 857.4 billion with major acceptance in the 6 months category (Rs.
157.4 billion at a weighted average cut off yield of 7.97%). A PIB
auction was also conducted which saw a healthy participation with a
relatively lower acceptance level; Rs. 45.6 billion was accepted
against a participation of Rs. 96.2 billion (highest acceptance in 5 yrs
category: Rs. 15.075 billion at a cut off yield of 8.75%).
On the forex front, the rupee lost value; in the interbank market it
closed 8 paisas weaker at Rs. 101.94/$ while in the open market it
closed 40 paisas weaker @ Rs. 102.5/$.
6 Month KIBOR
Disclaimer
This publication is for informational purpose only and nothing herein should be construed as a solicitation, recommendation or an offer to buy or sell any fund. All investments in mutual funds are subject to market risk. The NAV based prices of units and any dividends/returns thereon are dependent on force and factors affecting the capital markets. These
may go up or down based on market conditions. Past performance is not necessarily indicative of future results.
(This report has been prepared in line with MUFAP’s recommended Format)
28,000
29,500
31,000
32,500
34,000
0
100
200
300
400
2-M
ar
6-M
ar
12-M
ar
18-M
ar
25-M
ar
31-M
ar
Vol (mn) (LHS) Index (RHS)
7.50
7.80
8.10
8.40
8.70
2-M
ar
6-M
ar
12-M
ar
18-M
ar
25-M
ar
31-M
ar
MEEZAN ISLAMIC FUND (MIF)
Fund Review:
Net assets of Meezan Islamic Fund stood at Rs. 21.35 billion as on March 31, 2015. The fund’s NAV decreased by 8.9% during the month of
March as compared to 7.9% decrease in benchmark index (KMI-30) while KSE-100 Index during the same period decreased by 10.1%. As on
March 31, the fund was 87% invested in equities.
Funds Details
Disclaimer This publication is for informational purpose only and nothing herein should be construed as a solicitation, recommendation or an offer to buy or sell any fund. All investments in mutual funds are subject to market
risk. The NAV based prices of units and any dividends/returns thereon are dependent on force and factors affecting the capital markets. These may go up or down based on market conditions. Past performance is not
necessarily indicative of future results. (This report has been prepared in line with MUFAP’s recommended Format)
AMC RATING AM2+ (STABLE OUTLOOK)
1M 3M 6M FYTD 1Yr 3Yr 5Yr PSD* CAGR*
MIF -9% -4% 3% 5% 13% 109% 212% 812% 21%
Benchmark# -8% -3% 2% 4% 11% 109% 220% 561% 18%
* Performance start date of August 08, 2003, CAGR since inception # KMI-30 replaced DJIIMPK as the Fund’s benchmark from July 01, 2009, while KSE-100 index remained as the benchmark till June 30, 2006
FY14 FY13 FY12 FY11 FY10 FY09 FY08 FY07
MIF 29% 51% 19% 39% 31% -30% 0% 29%
Benchmark 30% 54% 14% 44% 37% -35% 1% 17%
The Hub Power Co. Ltd. 9% Mari Petroleum Ltd. 4%
Packages Ltd. 9% DG Khan Cement Ltd. 4%
Lucky Cement Ltd. 8% Nishat Mills Ltd. 3%
Engro Corporation. 8% Pakistan Oilfields Ltd. 3%
Pakistan State Oil Co. Ltd. 8% Indus Motors Co. Ltd. 3%
Fund Type: Open End Risk Level High Launch Date 8th Aug 2003 Trustee CDC
Auditors KPMG Taseer Hadi & Co.
Registrar Meezan Bank Ltd. Unit Types A, B and C Management Fee 2% Front End Load 2% Fund Category Equity Back End Load Nil Benchmark KMI-30 Leverage Nil Listing KSE AMC Rating AM2+
Rating Agency JCRVIS Pricing Mechanism Forward Valuation Days Mon-Fri Subscription/ Redemption Days Mon-Fri 9am – 3pm Fund Manager Muhammad Asad
Members of Investment Committee
M. Shoaib, CFA
Muhammad Asad
Sanam Zaib, CFA
Ahmed Hassan, CFA
Asif Mobin Zain Malik Fahad Sultan, ACA
Investment Objective:
To maximize total investor returns by investing in
Shariah Compliant equities focusing on both capital
gains and dividend income.
Fund Details:
Feb '15 Mar '15 MoM %
Net Assets (Rs mn) 26,188 21,354 -18.5%
NAV Per Unit (Rs)* 58.19 53.00 -8.9%
Feb '15 Mar '15
Equity (%) 93.44 87.46
Cash (%) 6.31 7.05
Other receivables (%) 0.25 5.49
Expense Ratio* 2.85% 2.71%
P/E 8.9 8.1 *Management fee is included in the expense ratio
adf
MIF KSE-100 Index
KMI-30 Index
Standard Deviation (%) 1.85 1.62 1.95
Sharpe Ratio -5.19 -6.66 -4.41
Fund Net Assets:
Top Ten Equity Holdings:(% of Total Assets):
Annual Returns:
Performance - Cumulative Returns:
Fund’s Performance:
Sector Allocation:
EQ
UITY
qu
ity
Risk Measures–March ‘15:
Asset Allocation:
WWF Disclosure: The Board of Directors of the management company in its meeting held on October 25, 2013 have resolved that unrecorded accumulated WWF provision in the fund
from the date of its application till December 31, 2012, in case is required to be paid, shall be borne by Al Meezan Investment Management Limited (Management Company of the fund).
Thus, the Fund is no longer liable to pay any expense under WWF until December 31, 2012.
Effective from January 1, 2013, the Fund has maintained provisions against Workers’ Welfare Fund liability to the tune of Rs. 116.68mn, if the same were not made the NAV per unit/return of
the fund would be higher by Rs. 0.29/0.55%. For further details, investors are advised to read financial statements of the fund.
March, 2015
-
200
400
600
800
1,000
1,200
Aug-0
3
Oct-
04
Dec-0
5
Feb-0
7
Apr-
08
Jun-0
9
Aug-1
0
Sep-1
1
Nov-1
2
Jan-1
4
Mar-
15
MIF Benchmark
19%11%
19%
10%
9%
32%
Oil & Gas
Chemicals
Construction and Materials
Electricity
General Industries
Others
AL MEEZAN MUTUAL FUND (AMMF)
Fund Review:
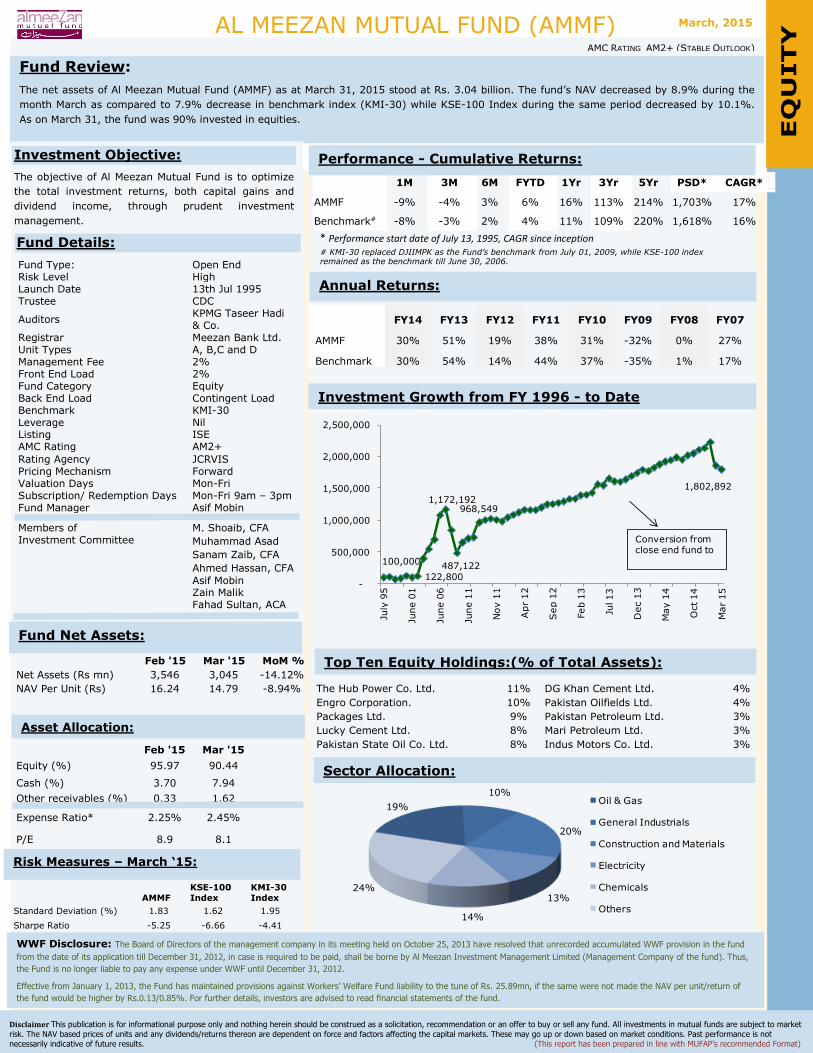
The net assets of Al Meezan Mutual Fund (AMMF) as at March 31, 2015 stood at Rs. 3.04 billion. The fund’s NAV decreased by 8.9% during the
month March as compared to 7.9% decrease in benchmark index (KMI-30) while KSE-100 Index during the same period decreased by 10.1%.
As on March 31, the fund was 90% invested in equities.
Funds Details
Disclaimer This publication is for informational purpose only and nothing herein should be construed as a solicitation, recommendation or an offer to buy or sell any fund. All investments in mutual funds are subject to market
risk. The NAV based prices of units and any dividends/returns thereon are dependent on force and factors affecting the capital markets. These may go up or down based on market conditions. Past performance is not
necessarily indicative of future results. (This report has been prepared in line with MUFAP’s recommended Format)
AMC RATING AM2+ (STABLE OUTLOOK)
1M 3M 6M FYTD 1Yr 3Yr 5Yr PSD* CAGR*
AMMF -9% -4% 3% 6% 16% 113% 214% 1,703% 17%
Benchmark# -8% -3% 2% 4% 11% 109% 220% 1,618% 16%
* Performance start date of July 13, 1995, CAGR since inception # KMI-30 replaced DJIIMPK as the Fund’s benchmark from July 01, 2009, while KSE-100 index remained as the benchmark till June 30, 2006.
FY14 FY13 FY12 FY11 FY10 FY09 FY08 FY07
AMMF 30% 51% 19% 38% 31% -32% 0% 27%
Benchmark 30% 54% 14% 44% 37% -35% 1% 17%
The Hub Power Co. Ltd. 11% DG Khan Cement Ltd. 4%
Engro Corporation. 10% Pakistan Oilfields Ltd. 4%
Packages Ltd. 9% Pakistan Petroleum Ltd. 3%
Lucky Cement Ltd. 8% Mari Petroleum Ltd. 3%
Pakistan State Oil Co. Ltd. 8% Indus Motors Co. Ltd. 3%
Fund Type: Open End Risk Level High Launch Date 13th Jul 1995 Trustee CDC
Auditors KPMG Taseer Hadi & Co.
Registrar Meezan Bank Ltd. Unit Types A, B,C and D Management Fee 2% Front End Load 2% Fund Category Equity Back End Load Contingent Load Benchmark KMI-30 Leverage Nil Listing ISE AMC Rating AM2+
Rating Agency JCRVIS Pricing Mechanism Forward Valuation Days Mon-Fri Subscription/ Redemption Days Mon-Fri 9am – 3pm Fund Manager Asif Mobin
Members of Investment Committee
M. Shoaib, CFA
Muhammad Asad
Sanam Zaib, CFA
Ahmed Hassan, CFA
Asif Mobin Zain Malik Fahad Sultan, ACA
Investment Objective:
The objective of Al Meezan Mutual Fund is to optimize
the total investment returns, both capital gains and
dividend income, through prudent investment
management.
Fund Details:
Feb '15 Mar '15 MoM %
Net Assets (Rs mn) 3,546 3,045 -14.12%
NAV Per Unit (Rs) 16.24 14.79 -8.94%
Feb '15 Mar '15
Equity (%) 95.97 90.44
Cash (%) 3.70 7.94
Other receivables (%) 0.33 1.62
Expense Ratio* 2.25% 2.45%
P/E 8.9 8.1
*Management fee is included in the expense ratio
Fund Net Assets:
Top Ten Equity Holdings:(% of Total Assets):
Annual Returns:
Performance - Cumulative Returns:
Investment Growth from FY 1996 - to Date
Sector Allocation:
EQ
UITY
qu
ity
Asset Allocation:
AMMF
KSE-100
Index
KMI-30
Index
Standard Deviation (%) 1.83 1.62 1.95
Sharpe Ratio -5.25 -6.66 -4.41
Risk Measures – March ‘15:
WWF Disclosure: The Board of Directors of the management company in its meeting held on October 25, 2013 have resolved that unrecorded accumulated WWF provision in the fund
from the date of its application till December 31, 2012, in case is required to be paid, shall be borne by Al Meezan Investment Management Limited (Management Company of the fund). Thus,
the Fund is no longer liable to pay any expense under WWF until December 31, 2012.
Effective from January 1, 2013, the Fund has maintained provisions against Workers’ Welfare Fund liability to the tune of Rs. 25.89mn, if the same were not made the NAV per unit/return of
the fund would be higher by Rs.0.13/0.85%. For further details, investors are advised to read financial statements of the fund.
March, 2015
100,000
122,800
1,172,192
487,122
968,549
1,802,892
-
500,000
1,000,000
1,500,000
2,000,000
2,500,000
July
95
June 0
1
June 0
6
June 1
1
Nov 1
1
Apr
12
Sep 1
2
Feb 1
3
Jul 13
Dec 1
3
May 1
4
Oct 14
Mar
15
Conversion from close end fund to
19%
10%
20%
13%
14%
24%
Oil & Gas
General Industrials
Construction and Materials
Electricity
Chemicals
Others
MEEZAN ISLAMIC INCOME FUND (MIIF)
Fund Review
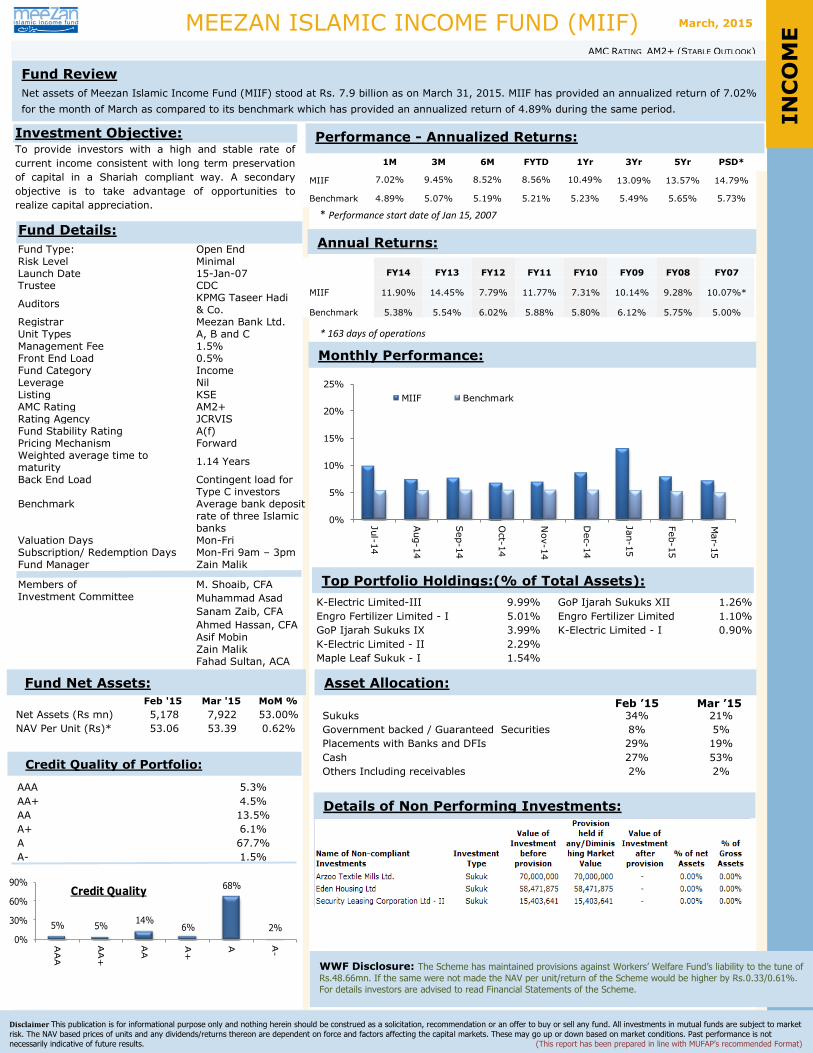
Net assets of Meezan Islamic Income Fund (MIIF) stood at Rs. 7.9 billion as on March 31, 2015. MIIF has provided an annualized return of 7.02%
for the month of March as compared to its benchmark which has provided an annualized return of 4.89% during the same period.
Funds Details
Disclaimer This publication is for informational purpose only and nothing herein should be construed as a solicitation, recommendation or an offer to buy or sell any fund. All investments in mutual funds are subject to market
risk. The NAV based prices of units and any dividends/returns thereon are dependent on force and factors affecting the capital markets. These may go up or down based on market conditions. Past performance is not
necessarily indicative of future results. (This report has been prepared in line with MUFAP’s recommended Format)
AMC RATING AM2+ (STABLE OUTLOOK)
1M 3M 6M FYTD 1Yr 3Yr 5Yr PSD*
MIIF 7.02% 9.45% 8.52% 8.56% 10.49% 13.09% 13.57% 14.79%
Benchmark 4.89% 5.07% 5.19% 5.21% 5.23% 5.49% 5.65% 5.73%
* Performance start date of Jan 15, 2007
FY14 FY13 FY12 FY11 FY10 FY09 FY08 FY07
MIIF 11.90% 14.45% 7.79% 11.77% 7.31% 10.14% 9.28% 10.07%*
Benchmark 5.38% 5.54% 6.02% 5.88% 5.80% 6.12% 5.75% 5.00%
* 163 days of operations
K-Electric Limited-III 9.99% GoP Ijarah Sukuks XII 1.26%
Engro Fertilizer Limited - I 5.01% Engro Fertilizer Limited 1.10%
GoP Ijarah Sukuks IX 3.99% K-Electric Limited - I 0.90%
K-Electric Limited - II 2.29%
Maple Leaf Sukuk - I 1.54%
Feb ’15 Mar ’15 Sukuks 34% 21%
Government backed / Guaranteed Securities 8% 5%
Placements with Banks and DFIs 29% 19%
Cash 27% 53%
Others Including receivables 2% 2%
Fund Type: Open End Risk Level Minimal Launch Date 15-Jan-07 Trustee CDC
Auditors KPMG Taseer Hadi & Co.
Registrar Meezan Bank Ltd. Unit Types A, B and C Management Fee 1.5% Front End Load 0.5% Fund Category Income Leverage Nil Listing KSE AMC Rating AM2+ Rating Agency JCRVIS Fund Stability Rating A(f) Pricing Mechanism Forward Weighted average time to maturity
1.14 Years
Back End Load Contingent load for Type C investors
Benchmark Average bank deposit rate of three Islamic banks
Valuation Days Mon-Fri Subscription/ Redemption Days Mon-Fri 9am – 3pm Fund Manager Zain Malik
Members of Investment Committee
M. Shoaib, CFA
Muhammad Asad
Sanam Zaib, CFA
Ahmed Hassan, CFA
Asif Mobin Zain Malik Fahad Sultan, ACA
Investment Objective: To provide investors with a high and stable rate of
current income consistent with long term preservation
of capital in a Shariah compliant way. A secondary
objective is to take advantage of opportunities to
realize capital appreciation.
Fund Details:
Feb '15 Mar '15 MoM %
Net Assets (Rs mn) 5,178 7,922 53.00%
NAV Per Unit (Rs)* 53.06 53.39 0.62%
Top Portfolio Holdings:(% of Total Assets):
Annual Returns:
Performance - Annualized Returns:
Monthly Performance:
Asset Allocation:
Details of Non Performing Investments:
Fund Net Assets:
Credit Quality of Portfolio:
IN
CO
ME
WWF Disclosure: The Scheme has maintained provisions against Workers’ Welfare Fund’s liability to the tune of
Rs.48.66mn. If the same were not made the NAV per unit/return of the Scheme would be higher by Rs.0.33/0.61%.
For details investors are advised to read Financial Statements of the Scheme.
AAA 5.3%
AA+ 4.5%
AA 13.5%
A+ 6.1%
A 67.7%
A- 1.5%
March, 2015
0%
5%
10%
15%
20%
25%
Jul-
14
Aug-14
Sep-14
Oct-
14
Nov-14
Dec-14
Jan-15
Feb-15
Mar-
15
MIIF Benchmark
5% 5%14%
6%
68%
2%
0%
30%
60%
90%
AAA
AA+
AA
A+
A A-
Credit Quality
MEEZAN CASH FUND (MCF)
Fund Review
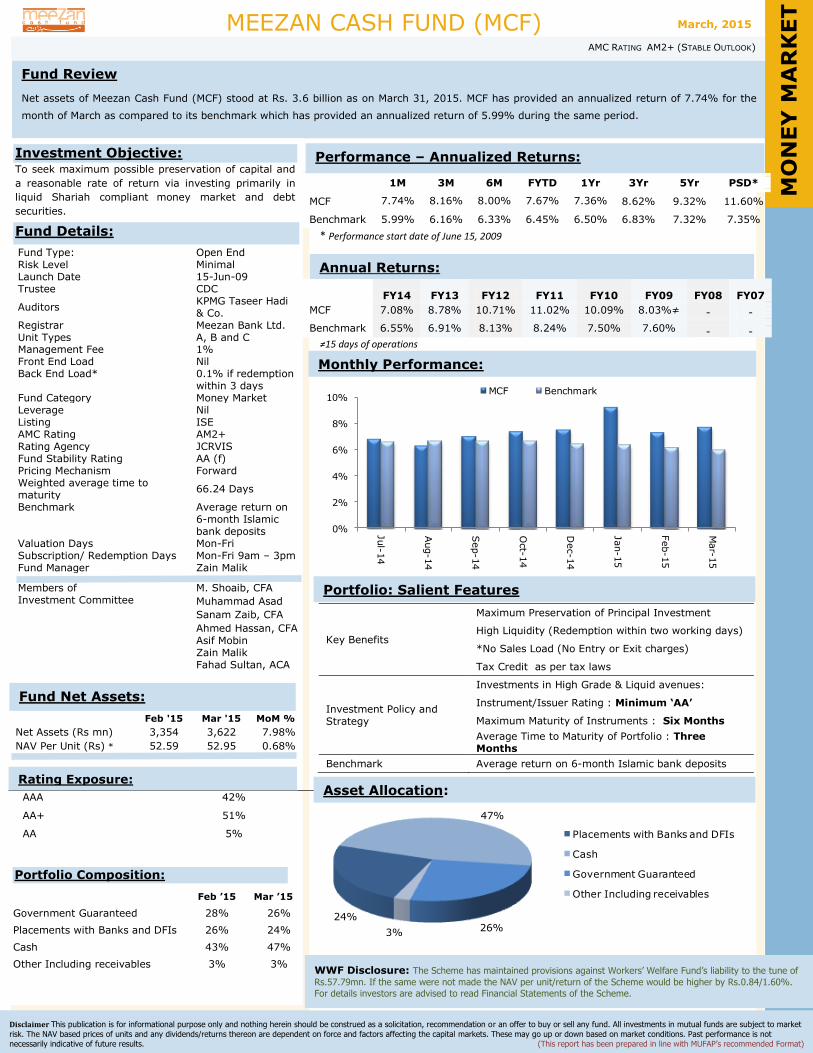
Net assets of Meezan Cash Fund (MCF) stood at Rs. 3.6 billion as on March 31, 2015. MCF has provided an annualized return of 7.74% for the
month of March as compared to its benchmark which has provided an annualized return of 5.99% during the same period.
Funds Details
Disclaimer This publication is for informational purpose only and nothing herein should be construed as a solicitation, recommendation or an offer to buy or sell any fund. All investments in mutual funds are subject to market
risk. The NAV based prices of units and any dividends/returns thereon are dependent on force and factors affecting the capital markets. These may go up or down based on market conditions. Past performance is not
necessarily indicative of future results. (This report has been prepared in line with MUFAP’s recommended Format)
AMC RATING AM2+ (STABLE OUTLOOK)
1M 3M 6M FYTD 1Yr 3Yr 5Yr PSD*
MCF 7.74% 8.16% 8.00% 7.67% 7.36% 8.62% 9.32% 11.60%
Benchmark 5.99% 6.16% 6.33% 6.45% 6.50% 6.83% 7.32% 7.35%
* Performance start date of June 15, 2009
FY14 FY13 FY12 FY11 FY10 FY09 FY08 FY07
MCF 7.08% 8.78% 10.71% 11.02% 10.09% 8.03%≠ - -
Benchmark 6.55% 6.91% 8.13% 8.24% 7.50% 7.60% - -
≠15 days of operations
Fund Type: Open End Risk Level Minimal Launch Date 15-Jun-09 Trustee CDC
Auditors KPMG Taseer Hadi & Co.
Registrar Meezan Bank Ltd. Unit Types A, B and C Management Fee 1% Front End Load Nil Back End Load* 0.1% if redemption
within 3 days Fund Category Money Market Leverage Nil Listing ISE AMC Rating AM2+ Rating Agency JCRVIS Fund Stability Rating AA (f) Pricing Mechanism Forward Weighted average time to maturity
66.24 Days
Benchmark Average return on 6-month Islamic bank deposits
Valuation Days Mon-Fri Subscription/ Redemption Days Mon-Fri 9am – 3pm Fund Manager Zain Malik
Members of Investment Committee
M. Shoaib, CFA
Muhammad Asad
Sanam Zaib, CFA
Ahmed Hassan, CFA
Asif Mobin Zain Malik Fahad Sultan, ACA
Investment Objective: To seek maximum possible preservation of capital and
a reasonable rate of return via investing primarily in
liquid Shariah compliant money market and debt
securities.
Fund Details:
Feb '15 Mar '15 MoM %
Net Assets (Rs mn) 3,354 3,622 7.98%
NAV Per Unit (Rs) * 52.59 52.95 0.68%
AAA 42%
AA+ 51%
AA 5%
Rating Exposure:
Portfolio: Salient Features
Annual Returns:
Performance – Annualized Returns:
Monthly Performance:
Asset Allocation:
Fund Net Assets:
Key Benefits
Maximum Preservation of Principal Investment
High Liquidity (Redemption within two working days)
*No Sales Load (No Entry or Exit charges)
Tax Credit as per tax laws
Investment Policy and Strategy
Investments in High Grade & Liquid avenues:
Instrument/Issuer Rating : Minimum ‘AA’
Maximum Maturity of Instruments : Six Months
Average Time to Maturity of Portfolio : Three Months
Benchmark Average return on 6-month Islamic bank deposits
Portfolio Composition:
Feb ’15 Mar ’15
Government Guaranteed 28% 26%
Placements with Banks and DFIs 26% 24%
Cash 43% 47%
Other Including receivables 3% 3%
M
ON
EY
MA
RK
ET
WWF Disclosure: The Scheme has maintained provisions against Workers’ Welfare Fund’s liability to the tune of
Rs.57.79mn. If the same were not made the NAV per unit/return of the Scheme would be higher by Rs.0.84/1.60%.
For details investors are advised to read Financial Statements of the Scheme.
March, 2015
0%
2%
4%
6%
8%
10%
Jul-
14
Aug-14
Sep-14
Oct-
14
Dec-14
Jan-15
Feb-15
Mar-
15
MCF Benchmark
24%
47%
26%3%
Placements with Banks and DFIs
Cash
Government Guaranteed
Other Including receivables
MEEZAN SOVEREIGN FUND (MSF)
Fund Review
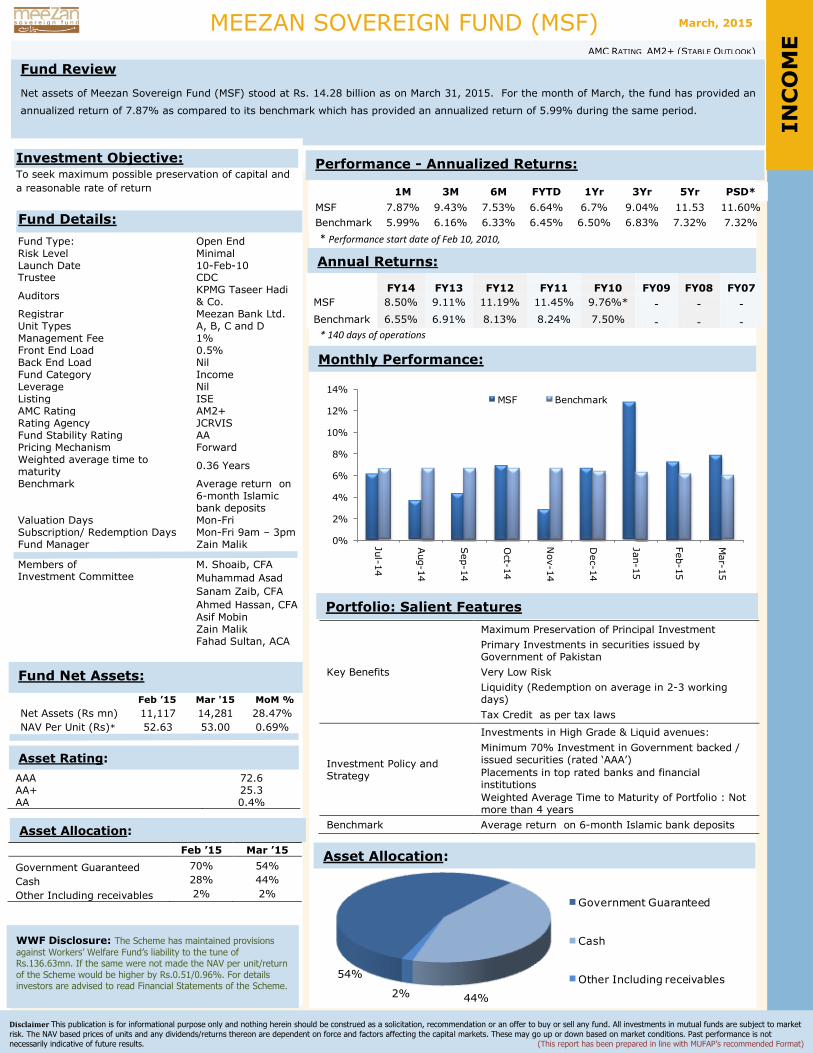
Net assets of Meezan Sovereign Fund (MSF) stood at Rs. 14.28 billion as on March 31, 2015. For the month of March, the fund has provided an
annualized return of 7.87% as compared to its benchmark which has provided an annualized return of 5.99% during the same period.
Funds Details
Disclaimer This publication is for informational purpose only and nothing herein should be construed as a solicitation, recommendation or an offer to buy or sell any fund. All investments in mutual funds are subject to market
risk. The NAV based prices of units and any dividends/returns thereon are dependent on force and factors affecting the capital markets. These may go up or down based on market conditions. Past performance is not
necessarily indicative of future results. (This report has been prepared in line with MUFAP’s recommended Format)
AMC RATING AM2+ (STABLE OUTLOOK)
1M 3M 6M FYTD 1Yr 3Yr 5Yr PSD*
MSF 7.87% 9.43% 7.53% 6.64% 6.7% 9.04% 11.53 11.60%
Benchmark 5.99% 6.16% 6.33% 6.45% 6.50% 6.83% 7.32% 7.32%
* Performance start date of Feb 10, 2010,
FY14 FY13 FY12 FY11 FY10 FY09 FY08 FY07
MSF 8.50% 9.11% 11.19% 11.45% 9.76%* - - -
Benchmark 6.55% 6.91% 8.13% 8.24% 7.50% - - -
* 140 days of operations
Fund Type: Open End Risk Level Minimal Launch Date 10-Feb-10 Trustee CDC
Auditors KPMG Taseer Hadi & Co.
Registrar Meezan Bank Ltd. Unit Types A, B, C and D Management Fee 1% Front End Load 0.5% Back End Load Nil Fund Category Income Leverage Nil Listing ISE AMC Rating AM2+ Rating Agency JCRVIS Fund Stability Rating AA Pricing Mechanism Forward Weighted average time to maturity
0.36 Years
Benchmark Average return on 6-month Islamic bank deposits
Valuation Days Mon-Fri Subscription/ Redemption Days Mon-Fri 9am – 3pm Fund Manager Zain Malik
Members of Investment Committee
M. Shoaib, CFA
Muhammad Asad
Sanam Zaib, CFA
Ahmed Hassan, CFA
Asif Mobin Zain Malik Fahad Sultan, ACA
Investment Objective: To seek maximum possible preservation of capital and
a reasonable rate of return
Fund Details:
Feb ’15 Mar '15 MoM %
Net Assets (Rs mn) 11,117 14,281 28.47%
NAV Per Unit (Rs)* 52.63 53.00 0.69%
AAA 72.6 AA+ 25.3 AA 0.4%
Feb ’15 Mar ’15
Government Guaranteed 70% 54%
Cash 28% 44%
Other Including receivables 2% 2%
Asset Rating:
Portfolio: Salient Features
Annual Returns:
Performance - Annualized Returns:
Monthly Performance:
Asset Allocation:
Fund Net Assets:
Key Benefits
Maximum Preservation of Principal Investment
Primary Investments in securities issued by Government of Pakistan
Very Low Risk
Liquidity (Redemption on average in 2-3 working days)
Tax Credit as per tax laws
Investment Policy and Strategy
Investments in High Grade & Liquid avenues:
Minimum 70% Investment in Government backed / issued securities (rated ‘AAA’)
Placements in top rated banks and financial institutions
Weighted Average Time to Maturity of Portfolio : Not more than 4 years
Benchmark Average return on 6-month Islamic bank deposits
Asset Allocation:
IN
CO
ME
WWF Disclosure: The Scheme has maintained provisions
against Workers’ Welfare Fund’s liability to the tune of Rs.136.63mn. If the same were not made the NAV per unit/return
of the Scheme would be higher by Rs.0.51/0.96%. For details investors are advised to read Financial Statements of the Scheme.
March, 2015
54%
44%2%
Government Guaranteed
Cash
Other Including receivables
0%
2%
4%
6%
8%
10%
12%
14%
Jul-
14
Aug-14
Sep-14
Oct-
14
Nov-14
Dec-14
Jan-15
Feb-15
Mar-
15
MSF Benchmark
MEEZAN TAHAFFUZ PENSION FUND (MTPF)
Fund Review:
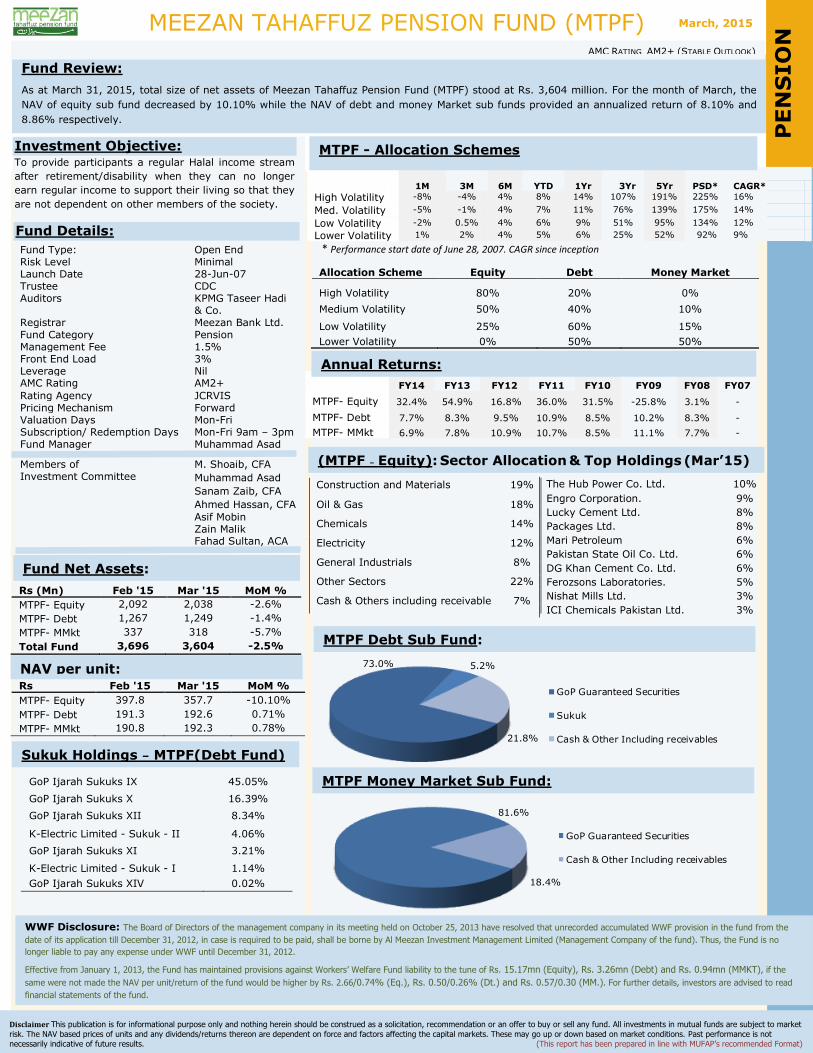
As at March 31, 2015, total size of net assets of Meezan Tahaffuz Pension Fund (MTPF) stood at Rs. 3,604 million. For the month of March, the
NAV of equity sub fund decreased by 10.10% while the NAV of debt and money Market sub funds provided an annualized return of 8.10% and
8.86% respectively.
Funds Details
Disclaimer This publication is for informational purpose only and nothing herein should be construed as a solicitation, recommendation or an offer to buy or sell any fund. All investments in mutual funds are subject to market
risk. The NAV based prices of units and any dividends/returns thereon are dependent on force and factors affecting the capital markets. These may go up or down based on market conditions. Past performance is not
necessarily indicative of future results. (This report has been prepared in line with MUFAP’s recommended Format)
AMC RATING AM2+ (STABLE OUTLOOK)
1M 3M 6M YTD 1Yr 3Yr 5Yr PSD* CAGR*
High Volatility -8% -4% 4% 8% 14% 107% 191% 225% 16%
Med. Volatility -5% -1% 4% 7% 11% 76% 139% 175% 14%
Low Volatility -2% 0.5% 4% 6% 9% 51% 95% 134% 12%
Lower Volatility 1% 2% 4% 5% 6% 25% 52% 92% 9%
* Performance start date of June 28, 2007. CAGR since inception
Allocation Scheme Equity Debt Money Market
High Volatility 80% 20% 0%
Medium Volatility 50% 40% 10%
Low Volatility 25% 60% 15%
Lower Volatility 0% 50% 50%
FY14 FY13 FY12 FY11 FY10 FY09 FY08 FY07
MTPF- Equity 32.4% 54.9% 16.8% 36.0% 31.5% -25.8% 3.1% -
MTPF- Debt 7.7% 8.3% 9.5% 10.9% 8.5% 10.2% 8.3% -
MTPF- MMkt 6.9% 7.8% 10.9% 10.7% 8.5% 11.1% 7.7% -
Fund Type: Open End Risk Level Minimal Launch Date 28-Jun-07 Trustee CDC Auditors KPMG Taseer Hadi
& Co. Registrar Meezan Bank Ltd. Fund Category Pension Management Fee 1.5% Front End Load 3% Leverage Nil AMC Rating AM2+
Rating Agency JCRVIS Pricing Mechanism Forward Valuation Days Mon-Fri Subscription/ Redemption Days Mon-Fri 9am – 3pm Fund Manager Muhammad Asad
Members of Investment Committee
M. Shoaib, CFA
Muhammad Asad
Sanam Zaib, CFA
Ahmed Hassan, CFA
Asif Mobin Zain Malik Fahad Sultan, ACA
Rs (Mn) Feb '15 Mar '15 MoM %
MTPF- Equity 2,092 2,038 -2.6%
MTPF- Debt 1,267 1,249 -1.4%
MTPF- MMkt 337 318 -5.7%
Total Fund 3,696 3,604 -2.5%
Rs Feb '15 Mar '15 MoM %
MTPF- Equity 397.8 357.7 -10.10%
MTPF- Debt 191.3 192.6 0.71%
MTPF- MMkt 190.8 192.3 0.78%
Investment Objective: To provide participants a regular Halal income stream
after retirement/disability when they can no longer
earn regular income to support their living so that they
are not dependent on other members of the society.
Fund Details:
NAV per unit:
Annual Returns:
(MTPF – Equity): Sector Allocation & Top Holdings (Mar’15)
MTPF Debt Sub Fund:
Sukuk Holdings – MTPF(Debt Fund)
GoP Ijarah Sukuks IX 45.05%
GoP Ijarah Sukuks X 16.39%
GoP Ijarah Sukuks XII 8.34%
K-Electric Limited - Sukuk - II 4.06%
GoP Ijarah Sukuks XI 3.21%
K-Electric Limited - Sukuk - I 1.14%
GoP Ijarah Sukuks XIV 0.02%
MTPF Money Market Sub Fund: P
EN
SIO
N
Fund Net Assets:
MTPF - Allocation Schemes
WWF Disclosure: The Board of Directors of the management company in its meeting held on October 25, 2013 have resolved that unrecorded accumulated WWF provision in the fund from the
date of its application till December 31, 2012, in case is required to be paid, shall be borne by Al Meezan Investment Management Limited (Management Company of the fund). Thus, the Fund is no
longer liable to pay any expense under WWF until December 31, 2012.
Effective from January 1, 2013, the Fund has maintained provisions against Workers’ Welfare Fund liability to the tune of Rs. 15.17mn (Equity), Rs. 3.26mn (Debt) and Rs. 0.94mn (MMKT), if the
same were not made the NAV per unit/return of the fund would be higher by Rs. 2.66/0.74% (Eq.), Rs. 0.50/0.26% (Dt.) and Rs. 0.57/0.30 (MM.). For further details, investors are advised to read
financial statements of the fund.
The Hub Power Co. Ltd. 10%
Engro Corporation. 9%
Lucky Cement Ltd. 8%
Packages Ltd. 8%
Mari Petroleum 6%
Pakistan State Oil Co. Ltd. 6%
DG Khan Cement Co. Ltd. 6%
Ferozsons Laboratories. 5%
Nishat Mills Ltd. 3%
ICI Chemicals Pakistan Ltd. 3%
Construction and Materials 19%
Oil & Gas 18%
Chemicals 14%
Electricity 12%
General Industrials 8%
Other Sectors 22%
Cash & Others including receivable 7%
March, 2015
73.0% 5.2%
21.8%
GoP Guaranteed Securities
Sukuk
Cash & Other Including receivables
81.6%
18.4%
GoP Guaranteed Securities
Cash & Other Including receivables
KSE-MEEZAN INDEX FUND (KMIF)
AMC RATING AM2+ (STABLE OUTLOOK)
Fund Review:
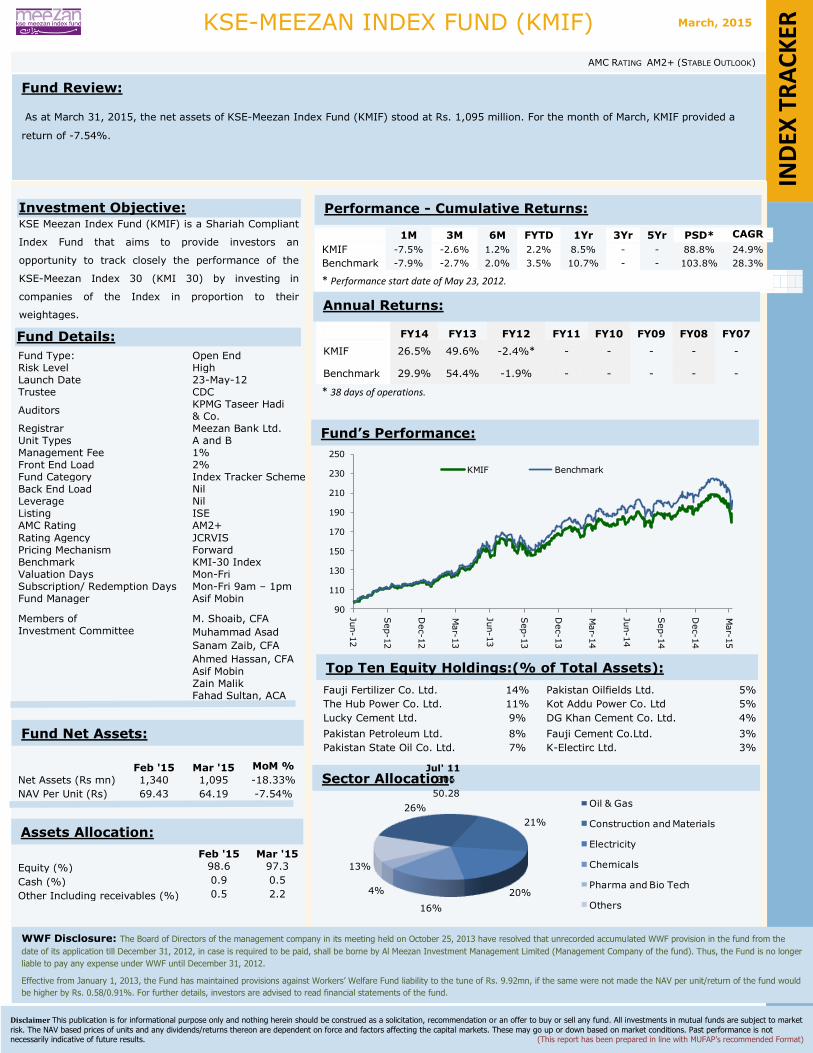
As at March 31, 2015, the net assets of KSE-Meezan Index Fund (KMIF) stood at Rs. 1,095 million. For the month of March, KMIF provided a
return of -7.54%.
Disclaimer This publication is for informational purpose only and nothing herein should be construed as a solicitation, recommendation or an offer to buy or sell any fund. All investments in mutual funds are subject to market
risk. The NAV based prices of units and any dividends/returns thereon are dependent on force and factors affecting the capital markets. These may go up or down based on market conditions. Past performance is not necessarily indicative of future results. (This report has been prepared in line with MUFAP’s recommended Format)
1M 3M 6M FYTD 1Yr 3Yr 5Yr PSD* CAGR
KMIF -7.5% -2.6% 1.2% 2.2% 8.5% - - 88.8% 24.9%
Benchmark -7.9% -2.7% 2.0% 3.5% 10.7% - - 103.8% 28.3%
* Performance start date of May 23, 2012.
FY14 FY13 FY12 FY11 FY10 FY09 FY08 FY07
KMIF 26.5% 49.6% -2.4%* - - - - -
Benchmark 29.9% 54.4% -1.9% - - - - -
* 38 days of operations.
Fauji Fertilizer Co. Ltd. 14% Pakistan Oilfields Ltd. 5%
The Hub Power Co. Ltd. 11% Kot Addu Power Co. Ltd 5%
Lucky Cement Ltd. 9% DG Khan Cement Co. Ltd. 4%
Pakistan Petroleum Ltd. 8% Fauji Cement Co.Ltd. 3%
Pakistan State Oil Co. Ltd. 7% K-Electirc Ltd. 3%
Fund Type: Open End Risk Level High Launch Date 23-May-12 Trustee CDC
Auditors KPMG Taseer Hadi & Co.
Registrar Meezan Bank Ltd. Unit Types A and B Management Fee 1% Front End Load 2% Fund Category Index Tracker Scheme Back End Load Nil Leverage Nil Listing ISE AMC Rating AM2+
Rating Agency JCRVIS Pricing Mechanism Forward Benchmark KMI-30 Index Valuation Days Mon-Fri Subscription/ Redemption Days Mon-Fri 9am – 1pm Fund Manager Asif Mobin
Members of Investment Committee
M. Shoaib, CFA
Muhammad Asad
Sanam Zaib, CFA
Ahmed Hassan, CFA
Asif Mobin Zain Malik Fahad Sultan, ACA
Investment Objective: KSE Meezan Index Fund (KMIF) is a Shariah Compliant
Index Fund that aims to provide investors an
opportunity to track closely the performance of the
KSE-Meezan Index 30 (KMI 30) by investing in
companies of the Index in proportion to their
weightages.
Performance - Cumulative Returns:
Annual Returns:
Fund Net Assets:
Sector Allocation:
Fund Details:
WWF Disclosure: The Board of Directors of the management company in its meeting held on October 25, 2013 have resolved that unrecorded accumulated WWF provision in the fund from the
date of its application till December 31, 2012, in case is required to be paid, shall be borne by Al Meezan Investment Management Limited (Management Company of the fund). Thus, the Fund is no longer
liable to pay any expense under WWF until December 31, 2012.
Effective from January 1, 2013, the Fund has maintained provisions against Workers’ Welfare Fund liability to the tune of Rs. 9.92mn, if the same were not made the NAV per unit/return of the fund would
be higher by Rs. 0.58/0.91%. For further details, investors are advised to read financial statements of the fund.
Feb '15 Mar '15 MoM %
Jul' 11
Net Assets (Rs mn) 1,340 1,095 -18.33% 306
NAV Per Unit (Rs) 69.43 64.19 -7.54% 50.28
Feb '15 Mar '15
Equity (%) 98.6 97.3
Cash (%) 0.9 0.5
Other Including receivables (%) 0.5 2.2
IN
DEX
TR
AC
KER
Fund’s Performance:
Top Ten Equity Holdings:(% of Total Assets):
Assets Allocation:
March, 2015
26%
21%
20%
16%
4%
13%
Oil & Gas
Construction and Materials
Electricity
Chemicals
Pharma and Bio Tech
Others
90
110
130
150
170
190
210
230
250Jun-12
Sep-12
Dec-12
Mar-
13
Jun-13
Sep-13
Dec-13
Mar-
14
Jun-14
Sep-14
Dec-14
Mar-
15
KMIF Benchmark
MEEZAN FINANCIAL PLANNING FUND OF FUNDS (MFPFOF)
Fund Review:
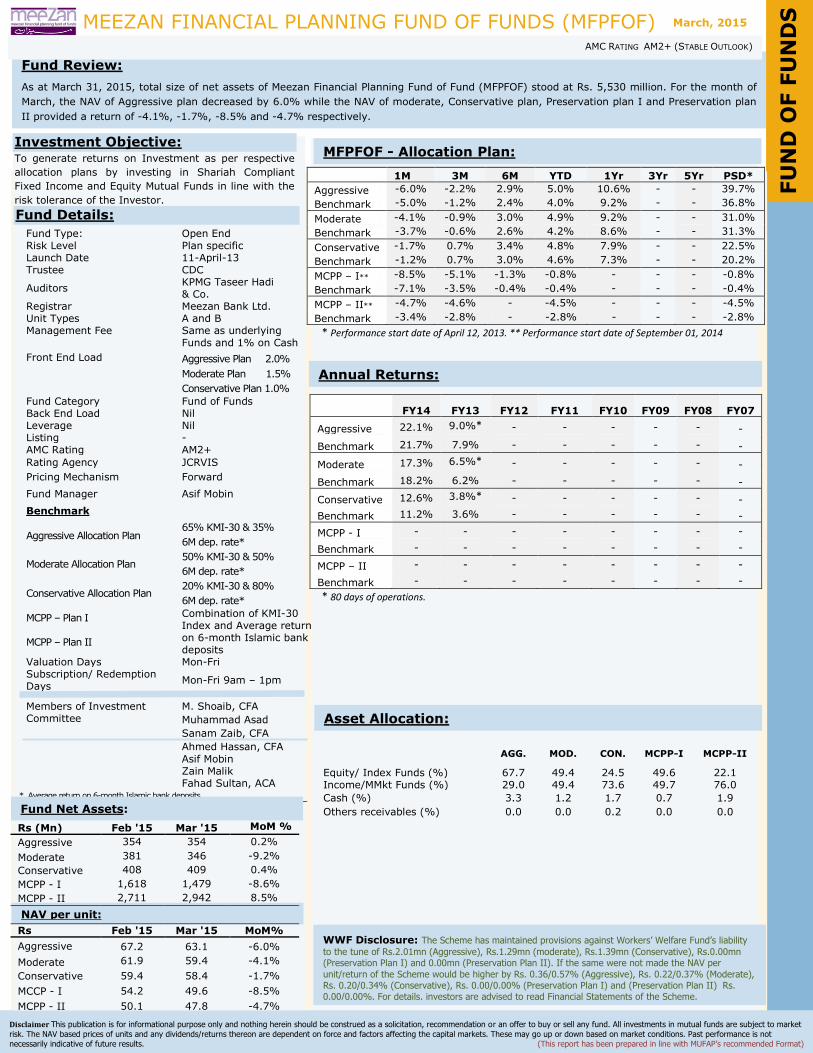
As at March 31, 2015, total size of net assets of Meezan Financial Planning Fund of Fund (MFPFOF) stood at Rs. 5,530 million. For the month of
March, the NAV of Aggressive plan decreased by 6.0% while the NAV of moderate, Conservative plan, Preservation plan I and Preservation plan
II provided a return of -4.1%, -1.7%, -8.5% and -4.7% respectively.
Funds Details
Disclaimer This publication is for informational purpose only and nothing herein should be construed as a solicitation, recommendation or an offer to buy or sell any fund. All investments in mutual funds are subject to market
risk. The NAV based prices of units and any dividends/returns thereon are dependent on force and factors affecting the capital markets. These may go up or down based on market conditions. Past performance is not
necessarily indicative of future results. (This report has been prepared in line with MUFAP’s recommended Format)
AMC RATING AM2+ (STABLE OUTLOOK)
1M 3M 6M YTD 1Yr 3Yr 5Yr PSD*
Aggressive -6.0% -2.2% 2.9% 5.0% 10.6% - - 39.7%
Benchmark -5.0% -1.2% 2.4% 4.0% 9.2% - - 36.8%
Moderate -4.1% -0.9% 3.0% 4.9% 9.2% - - 31.0%
Benchmark -3.7% -0.6% 2.6% 4.2% 8.6% - - 31.3%
Conservative -1.7% 0.7% 3.4% 4.8% 7.9% - - 22.5%
Benchmark -1.2% 0.7% 3.0% 4.6% 7.3% - - 20.2%
MCPP – I** -8.5% -5.1% -1.3% -0.8% - - - -0.8%
Benchmark -7.1% -3.5% -0.4% -0.4% - - - -0.4%
MCPP – II** -4.7% -4.6% - -4.5% - - - -4.5%
Benchmark -3.4% -2.8% - -2.8% - - - -2.8%
* Performance start date of April 12, 2013. ** Performance start date of September 01, 2014
FY14 FY13 FY12 FY11 FY10 FY09 FY08 FY07
Aggressive 22.1% 9.0%* - - - - - -
Benchmark 21.7% 7.9% - - - - - -
Moderate 17.3% 6.5%* - - - - - -
Benchmark 18.2% 6.2% - - - - - -
Conservative 12.6% 3.8%* - - - - - -
Benchmark 11.2% 3.6% - - - - - -
MCPP - I - - - - - - - -
Benchmark - - - - - - - -
MCPP – II - - - - - - - -
Benchmark - - - - - - - -
* 80 days of operations.
AGG. MOD. CON. MCPP-I MCPP-II
Equity/ Index Funds (%) 67.7 49.4 24.5 49.6 22.1 Income/MMkt Funds (%) 29.0 49.4 73.6 49.7 76.0
Cash (%) 3.3 1.2 1.7 0.7 1.9
Others receivables (%) 0.0 0.0 0.2 0.0 0.0
Fund Type: Open End Risk Level Plan specific Launch Date 11-April-13 Trustee CDC
Auditors KPMG Taseer Hadi & Co.
Registrar Meezan Bank Ltd. Unit Types A and B Management Fee Same as underlying
Funds and 1% on Cash
Front End Load Aggressive Plan 2.0%
Moderate Plan 1.5%
Conservative Plan 1.0%
Fund Category Fund of Funds Back End Load Nil Leverage Nil Listing - AMC Rating AM2+
Rating Agency JCRVIS
Pricing Mechanism Forward
Fund Manager Asif Mobin
Benchmark
Aggressive Allocation Plan 65% KMI-30 & 35%
6M dep. rate*
Moderate Allocation Plan 50% KMI-30 & 50%
6M dep. rate*
Conservative Allocation Plan 20% KMI-30 & 80%
6M dep. rate*
MCPP – Plan I Combination of KMI-30 Index and Average return on 6-month Islamic bank deposits
MCPP – Plan II
Valuation Days Mon-Fri Subscription/ Redemption Days
Mon-Fri 9am – 1pm
Members of Investment Committee
M. Shoaib, CFA
Muhammad Asad
Sanam Zaib, CFA
Ahmed Hassan, CFA
Asif Mobin Zain Malik Fahad Sultan, ACA
* Average return on 6-month Islamic bank deposits
Investment Objective: To generate returns on Investment as per respective
allocation plans by investing in Shariah Compliant
Fixed Income and Equity Mutual Funds in line with the
risk tolerance of the Investor.
Fund Details:
NAV per unit:
Annual Returns:
Asset Allocation:
Fund Net Assets:
MFPFOF - Allocation Plan:
FU
ND
OF F
UN
DS
WWF Disclosure: The Scheme has maintained provisions against Workers’ Welfare Fund’s liability
to the tune of Rs.2.01mn (Aggressive), Rs.1.29mn (moderate), Rs.1.39mn (Conservative), Rs.0.00mn (Preservation Plan I) and 0.00mn (Preservation Plan II). If the same were not made the NAV per
unit/return of the Scheme would be higher by Rs. 0.36/0.57% (Aggressive), Rs. 0.22/0.37% (Moderate), Rs. 0.20/0.34% (Conservative), Rs. 0.00/0.00% (Preservation Plan I) and (Preservation Plan II) Rs. 0.00/0.00%. For details, investors are advised to read Financial Statements of the Scheme.
March, 2015
Rs (Mn) Feb '15 Mar '15 MoM %
Aggressive 354 354 0.2%
Moderate 381 346 -9.2%
Conservative 408 409 0.4%
MCPP - I 1,618 1,479 -8.6%
MCPP - II 2,711 2,942 8.5%
Rs Feb '15 Mar '15 MoM%
Aggressive 67.2 63.1 -6.0%
Moderate 61.9 59.4 -4.1%
Conservative 59.4 58.4 -1.7%
MCCP - I 54.2 49.6 -8.5%
MCPP - II 50.1 47.8 -4.7%
MEEZAN CAPITAL PRESERVATION FUND-II
Fund Review:
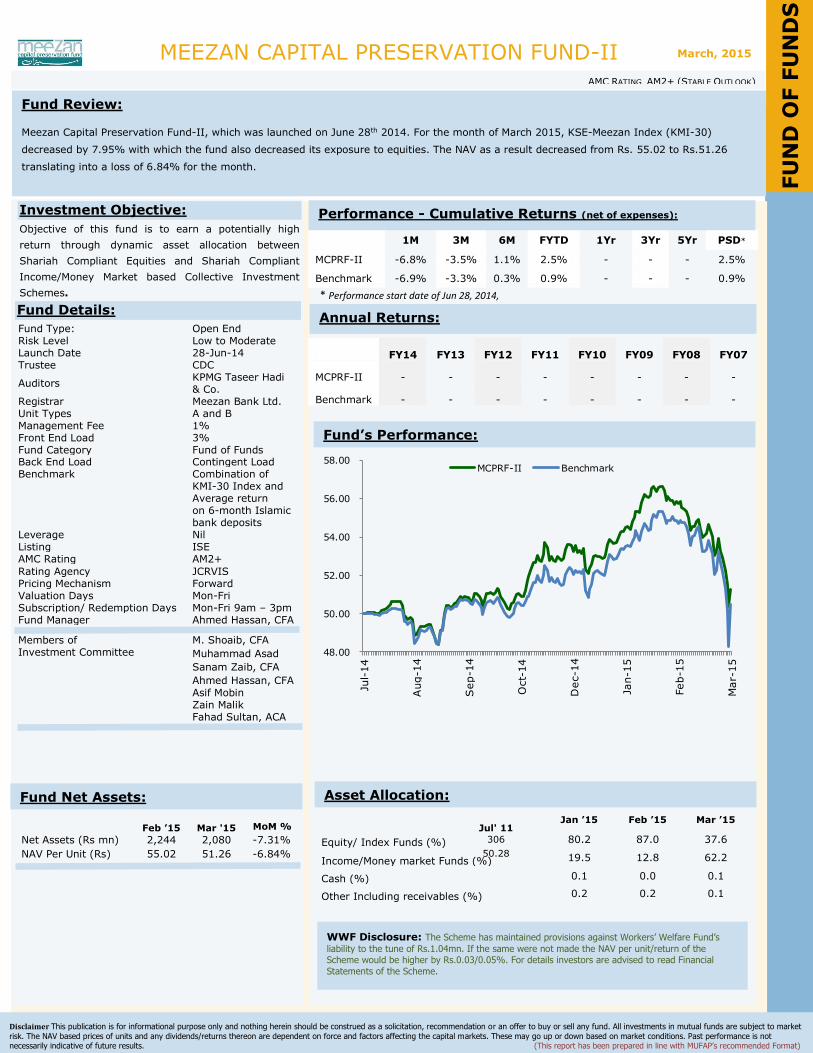
Meezan Capital Preservation Fund-II, which was launched on June 28th 2014. For the month of March 2015, KSE-Meezan Index (KMI-30)
decreased by 7.95% with which the fund also decreased its exposure to equities. The NAV as a result decreased from Rs. 55.02 to Rs.51.26
translating into a loss of 6.84% for the month.
Funds Details
Disclaimer This publication is for informational purpose only and nothing herein should be construed as a solicitation, recommendation or an offer to buy or sell any fund. All investments in mutual funds are subject to market
risk. The NAV based prices of units and any dividends/returns thereon are dependent on force and factors affecting the capital markets. These may go up or down based on market conditions. Past performance is not necessarily indicative of future results. (This report has been prepared in line with MUFAP’s recommended Format)
AMC RATING AM2+ (STABLE OUTLOOK)
1M 3M 6M FYTD 1Yr 3Yr 5Yr PSD*
MCPRF-II -6.8% -3.5% 1.1% 2.5% - - - 2.5%
Benchmark -6.9% -3.3% 0.3% 0.9% - - - 0.9%
* Performance start date of Jun 28, 2014,
FY14 FY13 FY12 FY11 FY10 FY09 FY08 FY07
MCPRF-II - - - - - - - -
Benchmark - - - - - - - -
Jan ’15 Feb ’15 Mar ’15
Equity/ Index Funds (%) 80.2 87.0 37.6
Income/Money market Funds (%) 19.5 12.8 62.2
Cash (%) 0.1 0.0 0.1
Other Including receivables (%) 0.2 0.2 0.1
Fund Type: Open End Risk Level Low to Moderate Launch Date 28-Jun-14 Trustee CDC
Auditors KPMG Taseer Hadi & Co.
Registrar Meezan Bank Ltd. Unit Types A and B Management Fee 1% Front End Load 3% Fund Category Fund of Funds Back End Load Contingent Load Benchmark Combination of
KMI-30 Index and Average return on 6-month Islamic bank deposits
Leverage Nil Listing ISE AMC Rating AM2+
Rating Agency JCRVIS Pricing Mechanism Forward Valuation Days Mon-Fri Subscription/ Redemption Days Mon-Fri 9am – 3pm Fund Manager Ahmed Hassan, CFA
Members of Investment Committee
M. Shoaib, CFA
Muhammad Asad
Sanam Zaib, CFA
Ahmed Hassan, CFA
Asif Mobin Zain Malik Fahad Sultan, ACA
Investment Objective:
Objective of this fund is to earn a potentially high
return through dynamic asset allocation between
Shariah Compliant Equities and Shariah Compliant
Income/Money Market based Collective Investment
Schemes.
Fund Details:
Feb ’15 Mar '15 MoM %
Jul' 11
Net Assets (Rs mn) 2,244 2,080 -7.31% 306
NAV Per Unit (Rs) 55.02 51.26 -6.84% 50.28
Annual Returns:
Performance - Cumulative Returns (net of expenses):
Fund Net Assets: Asset Allocation:
Fund’s Performance:
WWF Disclosure: The Scheme has maintained provisions against Workers’ Welfare Fund’s
liability to the tune of Rs.1.04mn. If the same were not made the NAV per unit/return of the Scheme would be higher by Rs.0.03/0.05%. For details investors are advised to read Financial
Statements of the Scheme.
March, 2015
FU
ND
OF F
UN
DS
48.00
50.00
52.00
54.00
56.00
58.00
Jul-
14
Aug-1
4
Sep-1
4
Oct-
14
Dec-1
4
Jan-1
5
Feb-1
5
Mar-
15
MCPRF-II Benchmark
MEEZAN CAPITAL PRESERVATION FUND (MCPF-III)
Fund Review:
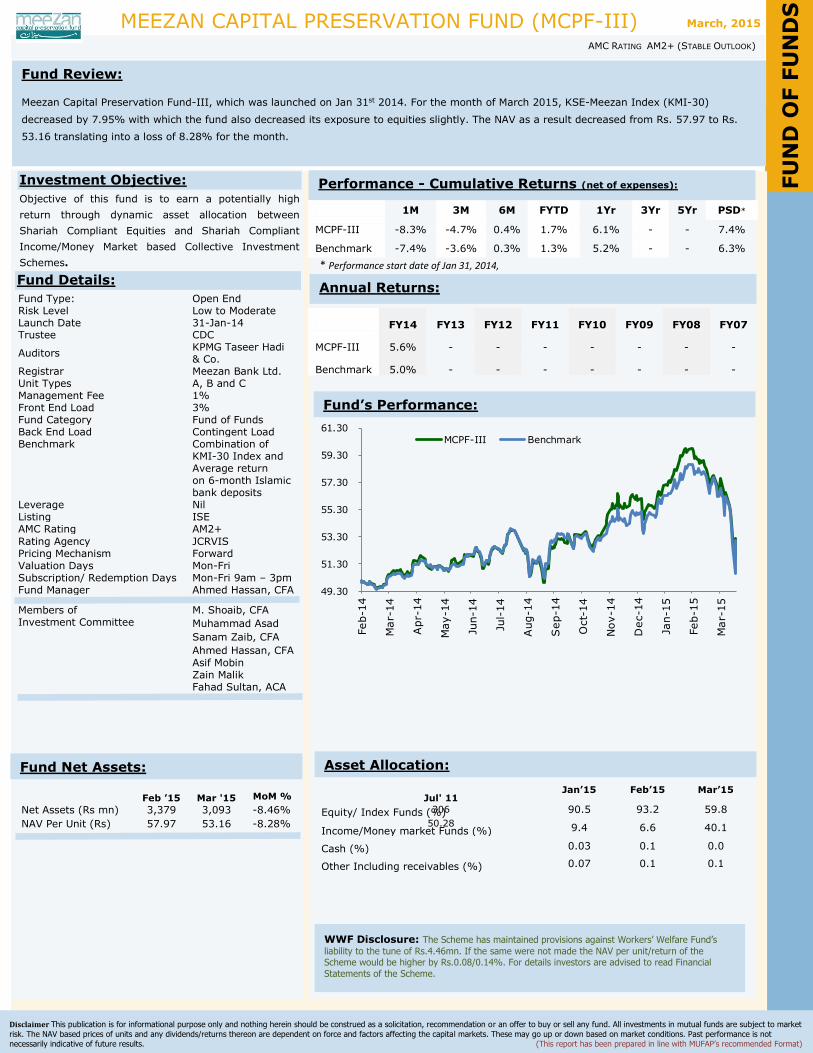
Meezan Capital Preservation Fund-III, which was launched on Jan 31st 2014. For the month of March 2015, KSE-Meezan Index (KMI-30)
decreased by 7.95% with which the fund also decreased its exposure to equities slightly. The NAV as a result decreased from Rs. 57.97 to Rs.
53.16 translating into a loss of 8.28% for the month.
Funds Details
Disclaimer This publication is for informational purpose only and nothing herein should be construed as a solicitation, recommendation or an offer to buy or sell any fund. All investments in mutual funds are subject to market
risk. The NAV based prices of units and any dividends/returns thereon are dependent on force and factors affecting the capital markets. These may go up or down based on market conditions. Past performance is not
necessarily indicative of future results. (This report has been prepared in line with MUFAP’s recommended Format)
AMC RATING AM2+ (STABLE OUTLOOK)
1M 3M 6M FYTD 1Yr 3Yr 5Yr PSD*
MCPF-III -8.3% -4.7% 0.4% 1.7% 6.1% - - 7.4%
Benchmark -7.4% -3.6% 0.3% 1.3% 5.2% - - 6.3%
* Performance start date of Jan 31, 2014,
FY14 FY13 FY12 FY11 FY10 FY09 FY08 FY07
MCPF-III 5.6% - - - - - - -
Benchmark 5.0% - - - - - - -
Jan’15 Feb’15 Mar’15
Equity/ Index Funds (%) 90.5 93.2 59.8
Income/Money market Funds (%) 9.4 6.6 40.1
Cash (%) 0.03 0.1 0.0
Other Including receivables (%) 0.07 0.1 0.1
Fund Type: Open End Risk Level Low to Moderate Launch Date 31-Jan-14 Trustee CDC
Auditors KPMG Taseer Hadi & Co.
Registrar Meezan Bank Ltd. Unit Types A, B and C Management Fee 1% Front End Load 3% Fund Category Fund of Funds Back End Load Contingent Load Benchmark Combination of
KMI-30 Index and Average return on 6-month Islamic bank deposits
Leverage Nil Listing ISE AMC Rating AM2+
Rating Agency JCRVIS Pricing Mechanism Forward Valuation Days Mon-Fri Subscription/ Redemption Days Mon-Fri 9am – 3pm Fund Manager Ahmed Hassan, CFA
Members of Investment Committee
M. Shoaib, CFA
Muhammad Asad
Sanam Zaib, CFA
Ahmed Hassan, CFA
Asif Mobin Zain Malik Fahad Sultan, ACA
Investment Objective:
Objective of this fund is to earn a potentially high
return through dynamic asset allocation between
Shariah Compliant Equities and Shariah Compliant
Income/Money Market based Collective Investment
Schemes.
Fund Details:
Feb ’15 Mar '15 MoM %
Jul' 11
Net Assets (Rs mn) 3,379 3,093 -8.46% 306
NAV Per Unit (Rs) 57.97 53.16 -8.28% 50.28
Annual Returns:
Performance - Cumulative Returns (net of expenses):
Fund Net Assets: Asset Allocation:
Fund’s Performance:
WWF Disclosure: The Scheme has maintained provisions against Workers’ Welfare Fund’s
liability to the tune of Rs.4.46mn. If the same were not made the NAV per unit/return of the Scheme would be higher by Rs.0.08/0.14%. For details investors are advised to read Financial
Statements of the Scheme.
March, 2015
FU
ND
OF F
UN
DS
49.30
51.30
53.30
55.30
57.30
59.30
61.30
Feb-1
4
Mar-
14
Apr-
14
May-1
4
Jun-1
4
Jul-
14
Aug-1
4
Sep-1
4
Oct-
14
Nov-1
4
Dec-1
4
Jan-1
5
Feb-1
5
Mar-
15
MCPF-III Benchmark
Fund Review:
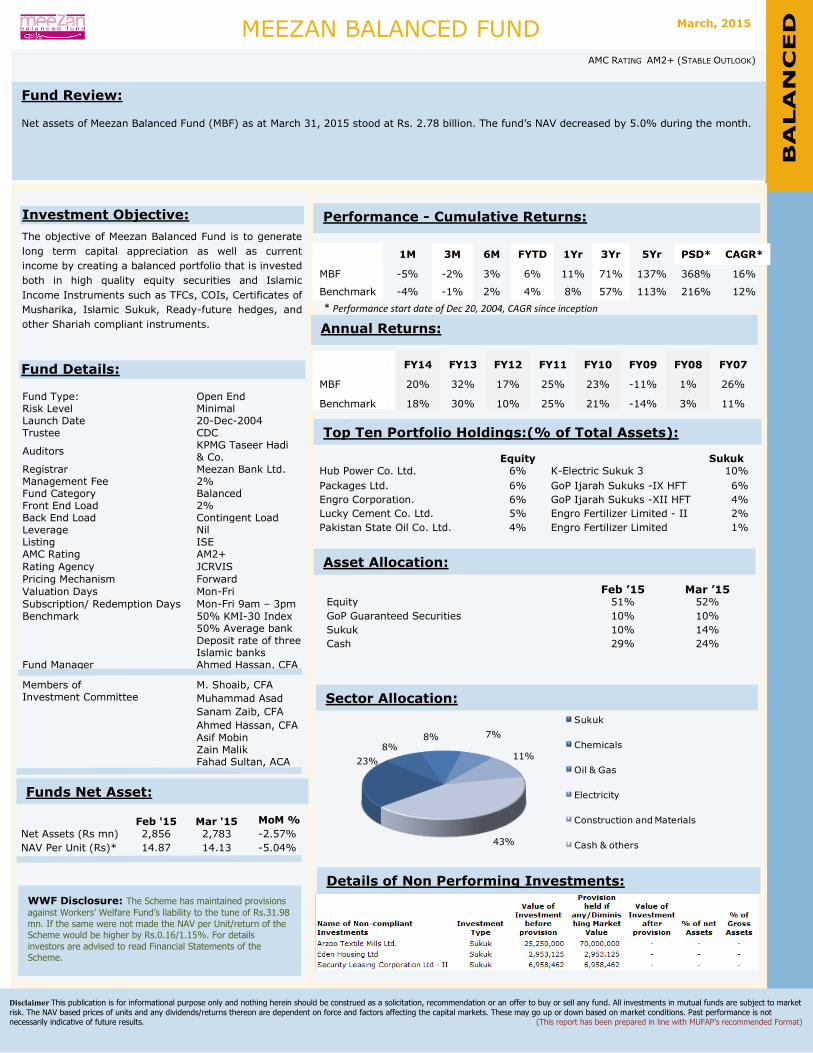
Net assets of Meezan Balanced Fund (MBF) as at March 31, 2015 stood at Rs. 2.78 billion. The fund’s NAV decreased by 5.0% during the month.
Funds Details
Disclaimer This publication is for informational purpose only and nothing herein should be construed as a solicitation, recommendation or an offer to buy or sell any fund. All investments in mutual funds are subject to market
risk. The NAV based prices of units and any dividends/returns thereon are dependent on force and factors affecting the capital markets. These may go up or down based on market conditions. Past performance is not necessarily indicative of future results. (This report has been prepared in line with MUFAP’s recommended Format)
1M 3M 6M FYTD 1Yr 3Yr 5Yr PSD* CAGR*
MBF -5% -2% 3% 6% 11% 71% 137% 368% 16%
Benchmark -4% -1% 2% 4% 8% 57% 113% 216% 12%
* Performance start date of Dec 20, 2004, CAGR since inception
FY14 FY13 FY12 FY11 FY10 FY09 FY08 FY07
MBF 20% 32% 17% 25% 23% -11% 1% 26%
Benchmark 18% 30% 10% 25% 21% -14% 3% 11%
*
Equity
Sukuk
Hub Power Co. Ltd. 6% K-Electric Sukuk 3 10%
Packages Ltd. 6% GoP Ijarah Sukuks -IX HFT 6%
Engro Corporation. 6% GoP Ijarah Sukuks -XII HFT 4%
Lucky Cement Co. Ltd. 5% Engro Fertilizer Limited - II 2%
Pakistan State Oil Co. Ltd. 4% Engro Fertilizer Limited 1%
Feb ’15 Mar ’15 Equity 51% 52%
GoP Guaranteed Securities 10% 10%
Sukuk 10% 14%
Cash 29% 24%
Fund Type: Open End Risk Level Minimal Launch Date 20-Dec-2004 Trustee CDC
Auditors KPMG Taseer Hadi & Co.
Registrar Meezan Bank Ltd. Management Fee 2% Fund Category Balanced Front End Load 2% Back End Load Contingent Load Leverage Nil Listing ISE AMC Rating AM2+
Rating Agency JCRVIS
Pricing Mechanism Forward
Valuation Days Mon-Fri
Subscription/ Redemption Days Mon-Fri 9am – 3pm
Benchmark 50% KMI-30 Index 50% Average bank Deposit rate of three Islamic banks
Fund Manager Ahmed Hassan, CFA
Members of Investment Committee
M. Shoaib, CFA
Muhammad Asad
Sanam Zaib, CFA
Ahmed Hassan, CFA
Asif Mobin Zain Malik Fahad Sultan, ACA
Investment Objective:
The objective of Meezan Balanced Fund is to generate
long term capital appreciation as well as current
income by creating a balanced portfolio that is invested
both in high quality equity securities and Islamic
Income Instruments such as TFCs, COIs, Certificates of
Musharika, Islamic Sukuk, Ready-future hedges, and
other Shariah compliant instruments.
Fund Details:
Annual Returns:
Performance - Cumulative Returns:
Top Ten Portfolio Holdings:(% of Total Assets):
Sector Allocation:
Funds Net Asset:
MEEZAN BALANCED FUND
(MBF) AMC RATING AM2+ (STABLE OUTLOOK)
Feb '15 Mar '15 MoM %
Net Assets (Rs mn) 2,856 2,783 -2.57%
NAV Per Unit (Rs)* 14.87 14.13 -5.04%
B
ALA
NC
ED
Asset Allocation:
WWF Disclosure: The Scheme has maintained provisions
against Workers’ Welfare Fund’s liability to the tune of Rs.31.98
mn. If the same were not made the NAV per Unit/return of the Scheme would be higher by Rs.0.16/1.15%. For details
investors are advised to read Financial Statements of the Scheme.
March, 2015
Details of Non Performing Investments:
23%
8%8% 7%
11%
43%
Sukuk
Chemicals
Oil & Gas
Electricity
Construction and Materials
Cash & others
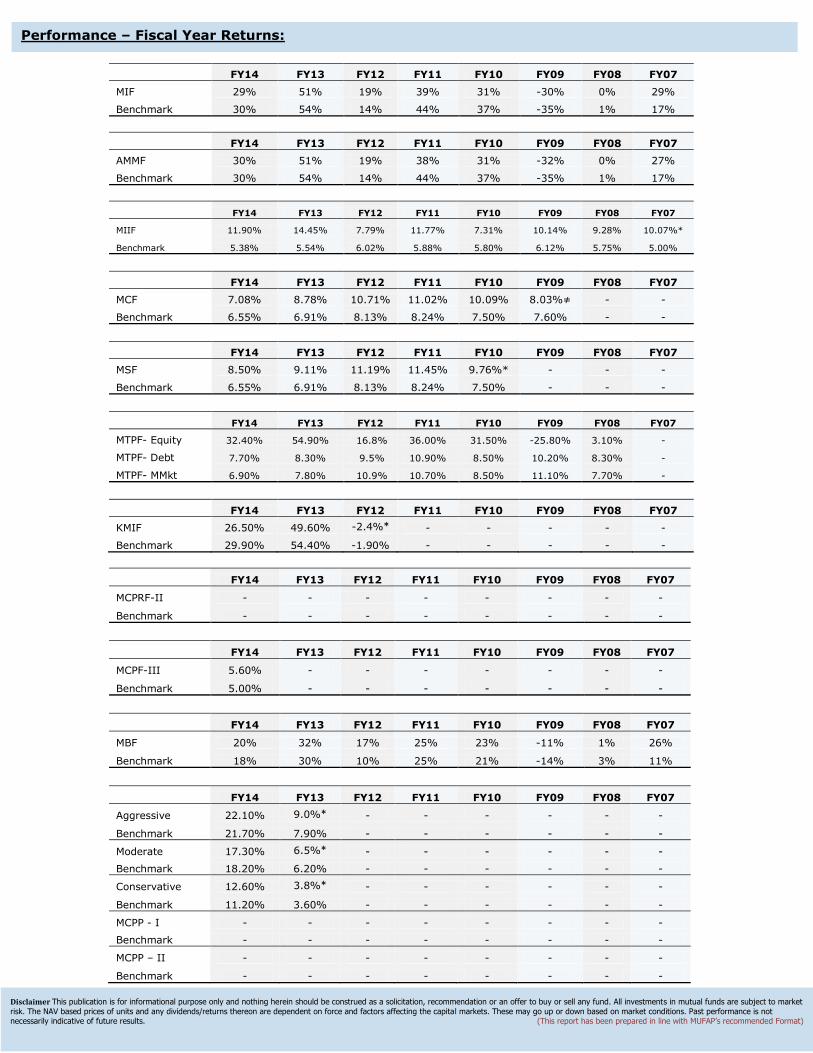
Performance – Fiscal Year Returns:
FY14 FY13 FY12 FY11 FY10 FY09 FY08 FY07
MIF 29% 51% 19% 39% 31% -30% 0% 29%
Benchmark 30% 54% 14% 44% 37% -35% 1% 17%
FY14 FY13 FY12 FY11 FY10 FY09 FY08 FY07
AMMF 30% 51% 19% 38% 31% -32% 0% 27%
Benchmark 30% 54% 14% 44% 37% -35% 1% 17%
FY14 FY13 FY12 FY11 FY10 FY09 FY08 FY07
MIIF 11.90% 14.45% 7.79% 11.77% 7.31% 10.14% 9.28% 10.07%*
Benchmark 5.38% 5.54% 6.02% 5.88% 5.80% 6.12% 5.75% 5.00%
FY14 FY13 FY12 FY11 FY10 FY09 FY08 FY07
MCF 7.08% 8.78% 10.71% 11.02% 10.09% 8.03%≠ - -
Benchmark 6.55% 6.91% 8.13% 8.24% 7.50% 7.60% - -
FY14 FY13 FY12 FY11 FY10 FY09 FY08 FY07
MSF 8.50% 9.11% 11.19% 11.45% 9.76%* - - -
Benchmark 6.55% 6.91% 8.13% 8.24% 7.50% - - -
FY14 FY13 FY12 FY11 FY10 FY09 FY08 FY07
MTPF- Equity 32.40% 54.90% 16.8% 36.00% 31.50% -25.80% 3.10% -
MTPF- Debt 7.70% 8.30% 9.5% 10.90% 8.50% 10.20% 8.30% -
MTPF- MMkt 6.90% 7.80% 10.9% 10.70% 8.50% 11.10% 7.70% -
FY14 FY13 FY12 FY11 FY10 FY09 FY08 FY07
KMIF 26.50% 49.60% -2.4%* - - - - -
Benchmark 29.90% 54.40% -1.90% - - - - -
FY14 FY13 FY12 FY11 FY10 FY09 FY08 FY07
MCPRF-II - - - - - - - -
Benchmark - - - - - - - -
FY14 FY13 FY12 FY11 FY10 FY09 FY08 FY07
MCPF-III 5.60% - - - - - - -
Benchmark 5.00% - - - - - - -
FY14 FY13 FY12 FY11 FY10 FY09 FY08 FY07
MBF 20% 32% 17% 25% 23% -11% 1% 26%
Benchmark 18% 30% 10% 25% 21% -14% 3% 11%
FY14 FY13 FY12 FY11 FY10 FY09 FY08 FY07
Aggressive 22.10% 9.0%* - - - - - -
Benchmark 21.70% 7.90% - - - - - -
Moderate 17.30% 6.5%* - - - - - -
Benchmark 18.20% 6.20% - - - - - -
Conservative 12.60% 3.8%* - - - - - -
Benchmark 11.20% 3.60% - - - - - -
MCPP - I - - - - - - - -
Benchmark - - - - - - - -
MCPP – II - - - - - - - -
Benchmark - - - - - - - -
Disclaimer This publication is for informational purpose only and nothing herein should be construed as a solicitation, recommendation or an offer to buy or sell any fund. All investments in mutual funds are subject to market
risk. The NAV based prices of units and any dividends/returns thereon are dependent on force and factors affecting the capital markets. These may go up or down based on market conditions. Past performance is not necessarily indicative of future results. (This report has been prepared in line with MUFAP’s recommended Format)