Embed Size (px)
Citation preview
LP Gas: An Energy Solution for a Low Carbon World A Comprehensive Analysis Demonstrating the Greenhouse Gas Reduction Potential of LP Gas

LP Gas: An Energy Solution for a Low Carbon World 1
LP GAS: AN ENERGY SOLUTION FOR A LOW
CARBON WORLD A COMPARATIVE ANALYSIS DEMONSTRATING THE GREENHOUSE GAS REDUCTION POTENTIAL OF LP GAS
2 LP Gas: An Energy Solution for a Low Carbon World
FOREWORD BY THE WORLD LP GAS ASSOCIATION (WLPGA)
Energy is essential for economic and social development yet for all the invaluable benefits that energy access brings, its consumption can have a negative effect on the environment, particularly with regard to climate change. However not all kinds of energy have the same impact on our climate. It is therefore important that consumers are informed and able to choose clean energy sources. This study, conducted in accordance with the Intergovernmental Panel on Climate Change (IPCC) methodologies, demonstrates that compared to many other energy sources, Liquefied Petroleum Gas (LP Gas) can help minimize greenhouse gas (GHG) emissions and therefore mitigate climate change in many applications and regions around the world today.
LP Gas is a clean-burning and efficient fuel. It is also a vital source of energy for hundreds of millions of people throughout the world today. It is a modern and safe energy providing heat and power to both urban and rural consumers. LP Gas can be used anywhere and is available now without large investments in technology and infrastructure. It is a multi-purpose energy with literally thousands of applications. It is portable; can be transported, stored and used virtually anywhere in the world and there are sufficient reserves to last for many decades. Importantly, and as this study shows, LP Gas demonstrates lower GHG emissions than petrol, diesel, and electricity, on an energy-equivalent basis.
The World LP Gas Association (WLPGA) is the global voice of the LP Gas industry. Granted, consultative Status with the United Nations Economic and Social Council in 1989, the WLPGA promotes the use of LP Gas worldwide to help foster a cleaner, healthier and more prosperous world.

LP Gas: An Energy Solution for a Low Carbon World 3
ACKNOWLEDGEMENTS
This report was developed with the support of the following WLPGA members who generously shared their time, talent and wisdom.
Makoto Arahata Japan LP Gas Association
Kimball Chen Energy Transportation Group
Arnaud Duvielguerbigny AEGPL
Mauricio Jarovsky Ultragaz
Jin-Sung Jung Korea LPG Association
Greg Kerr PERC
Ian Maloney ELGAS
Sunil Mathur Indian Oil Corporation
This study was prepared by Energetics Incorporated. Matt Antes, Ross Brindle, Joe McGervey, Kristian Kiuru, Mike Lloyd, Matt Munderville, Lindsay Pack, and Beth Zotter, all with Energetics, are the principal authors of this report.
Michael Kelly of WLPGA coordinated this project.
4 LP Gas: An Energy Solution for a Low Carbon World
TABLE OF CONTENTS
Overview ........................................................................................................................................................ 5
LP Gas and Climate Change ......................................................................................................... 14
About Greenhouse Gas Emission from Fuel Combustion ........................................ 14
Methodology for Application Specific Emissions Results ................................... 18
Summary of Findings
Cooking ....................................................................................................................................................... 23
Distributed Power Generation .................................................................................................................. 27
Light-duty Vehicles .................................................................................................................................... 29
Residential Space Heating ......................................................................................................................... 31
Residential Water Heating – Central ........................................................................................................ 34
Residential Water Heating – Point-of-Use ............................................................................................... 36
Application-Specific Analyses
Cooking ....................................................................................................................................................... 38
Distributed Power Generation .................................................................................................................. 41
Light-duty Vehicles .................................................................................................................................... 44
Residential Space Heating ......................................................................................................................... 46
Residential Water Heating ........................................................................................................................ 49
Appendix – Assumptions and References ............................................................................. 52
List of Acronyms .................................................................................................................................... 61
Glossary of Terms ................................................................................................................................ 62
About the World LP Gas Association ................................................................................... 68

LP Gas: An Energy Solution for a Low Carbon World 5
Overview Greenhouse gas (GHG) emissions and global climate change are receiving increased attention from every level of the global community – scientists, politicians, policy makers, business executives, media, and consumers. Businesses and governments around the world are devising workable options in order to address the issue. The purpose of this study is to inform worldwide energy stakeholders such as the LP Gas industry, policymakers, senior decision makers, and other interested parties about the GHG emissions profile of LP Gas as they make important decisions regarding emissions reduction strategies.
The study quantifies the GHG emissions for LP Gas and other competing energy sources like oil, petrol, diesel, and electricity in five applications in seven regions of the world: Western Europe, Eastern Europe, India, Japan, North America, the Republic of Korea, and South America. The five applications selected are important and representative of the global LP Gas industry: cooking, distributed power generation, light-duty vehicles, residential space heating, and residential water heating.
The methodology used to carry out this study takes into account energy consumption rates, emissions factors, and equipment efficiencies for each application and estimates GHG emissions associated with the use of LP Gas and competing energy sources in each region (“end-use emissions”). It also considers the GHG emissions generated during the production and transportation of each energy source from its origins to the point of use (“upstream emissions”). By combining end-use and upstream emissions, it estimates the total GHG emissions associated with the use of each fuel analyzed. To facilitate easy comparison across energy options, all results are normalized to the emissions generated using LP Gas. Regional differences in electricity generation sources and equipment configurations create significant differences in the relative GHG emissions profile for LP Gas and other fuels for each application. The results of this study are summarized in Tables ES-1 through ES-7.
The study remains consistent with the scientific conventions for carbon accounting developed by the Intergovernmental Panel on Climate Change (IPCC).1 These widely accepted conventions include the use of global warming potential factors for greenhouse gas compounds, allocating upstream carbon credits for biomass fuel sources, and reporting GHG emissions in terms of CO2-equivalent units. The IPCC was founded to assess on a comprehensive, objective, open, and transparent basis the latest scientific, technical and socio-economic literature produced worldwide relevant to the understanding of the risk of human-induced climate change, its observed and projected impacts, and options for adaptation and mitigation.
LP Gas is primarily a combination of propane and butane molecules, along with trace amounts of other compounds; the exact composition varies around the world. Propane, n-butane, and iso-butane are not direct GHGs when released into the air. LP Gas vapor is not persistent in the atmosphere—it is commonly removed by natural oxidation in the presence of sunlight or knocked down by precipitation faster than it takes for it to become well-mixed and have impacts on global climate. Current measurements have not found a global climate impact from the emissions of propane or butanes.
The IPCC reports that “Given their short lifetimes and geographically varying sources, it is not possible to derive a global atmospheric burden or mean abundance for most volatile organic compounds (VOCs) from current measurements.” VOCs explicitly include propane and butanes (IPCC TAR 2001).
KEY FINDINGS
1 The IPCC is a scientific intergovernmental body set up by the World Meteorological Organization (WMO) and by the United Nations Environment Programme (UNEP). Because of its intergovernmental nature, the IPCC is able to provide scientific technical and socio-economic information in a policy-relevant but policy neutral way to decision makers. When governments accept the IPCC reports and approve their Summary for Policymakers, they acknowledge the legitimacy of their scientific content.
6 LP Gas: An Energy Solution for a Low Carbon World
The findings of this study clearly demonstrate that LP Gas has an important role to play as global decision-makers seek to address climate change by reducing GHG emissions. Indeed, in many applications and regions LP Gas is among the most attractive energy options for minimizing GHG emissions.
• Cooking—LP Gas is among the lowest carbon-emitting fuel sources for cooking in many regions of the world. In India, for example, LP Gas emits 60% fewer GHGs than electric coil cook tops, 50% fewer emissions than some biomass stoves, and 19% fewer GHGs than kerosene stoves.
• Distributed Power Generation—LP Gas offers lower GHG emissions than diesel generators in every region and for every generator size considered in this study. In regions that rely heavily on liquid natural gas (LNG) such as Japan and the Republic of Korea, LP Gas even out-performs natural gas generators. When factoring in ease of transport in the absence of natural gas distribution infrastructure, it is clear that, from a GHG emissions perspective, LP Gas is the best choice for distributed power generation.
• Light-duty Vehicles—LP Gas offers the lowest “well-to-wheels” GHG emissions per 100 km driven of any fuel analyzed—lower than petrol and diesel in almost every region and 12% lower than corn-based ethanol (E85) in North America. In Japan, LP Gas generates 30% lower GHG emissions than petrol and 33% lower emissions than diesel.
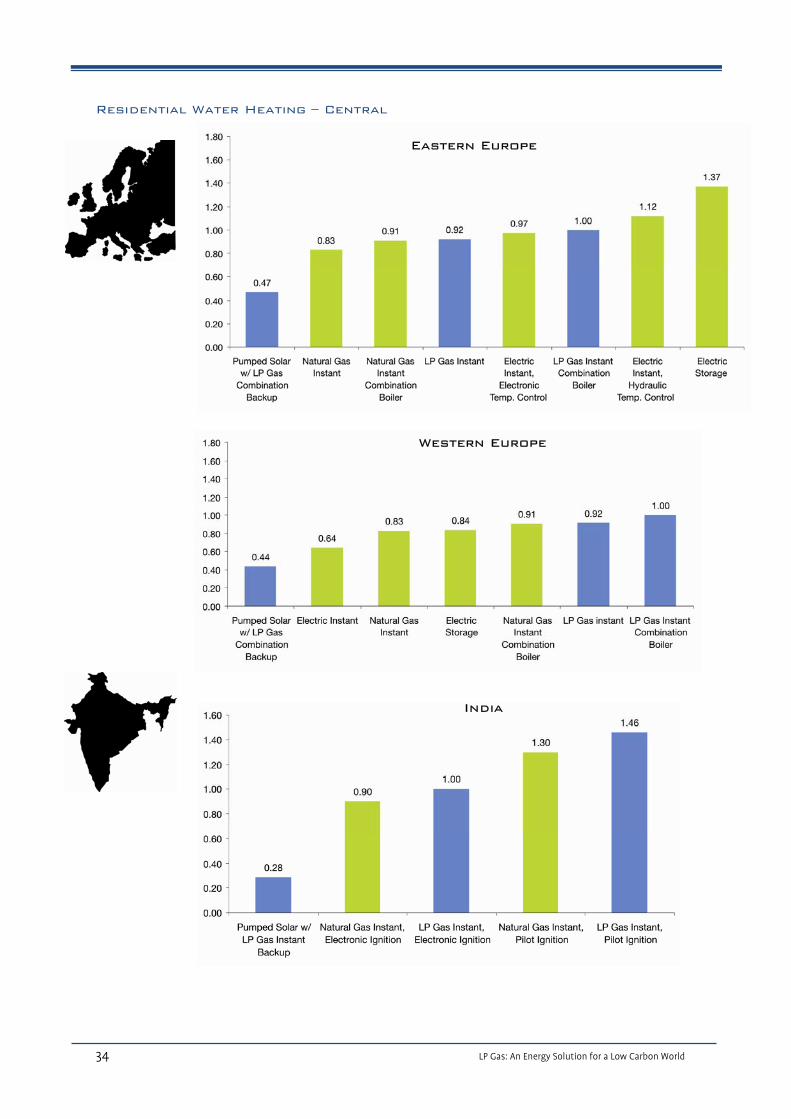
• Residential Space Heating—When heating a home, LP Gas helps consumers significantly reduce their carbon footprints. In Europe, LP Gas offers 15% lower GHG emissions than heating using fuel oil. LP Gas’s advantage over electricity is even more dramatic: 30% lower GHG emission in South America, 35% lower in Japan, 38% lower in the Republic of Korea, and up to 54% lower in North America.
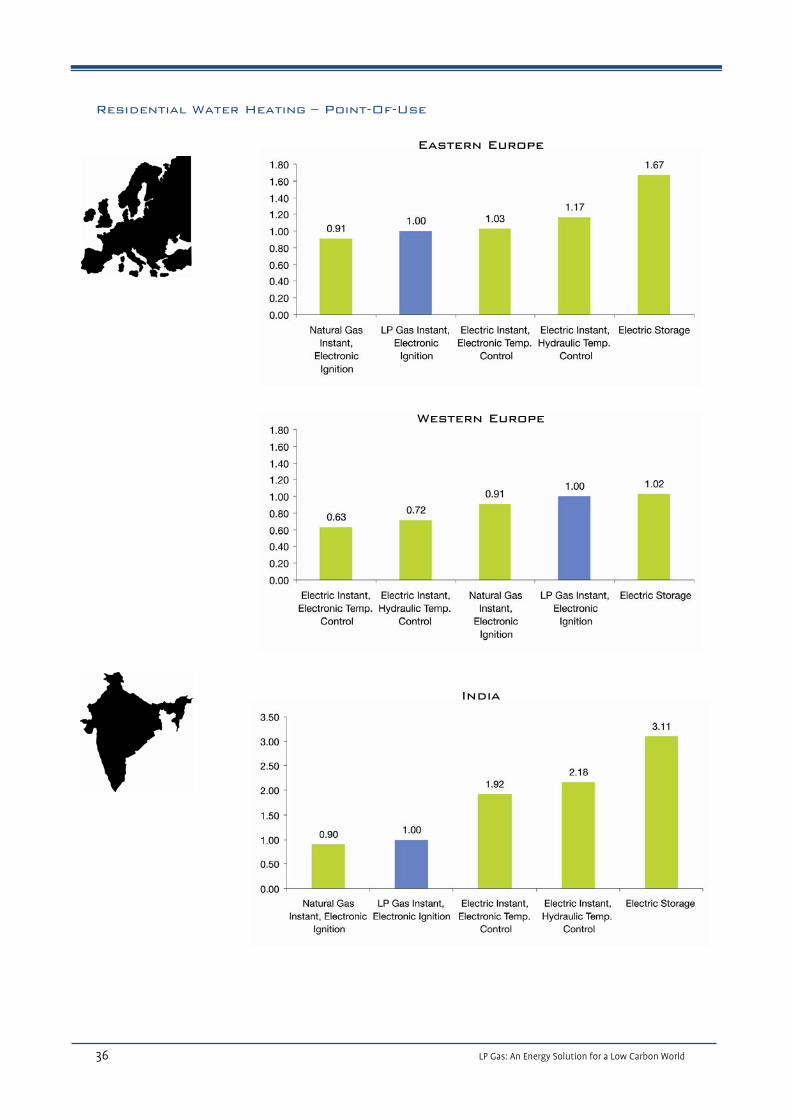
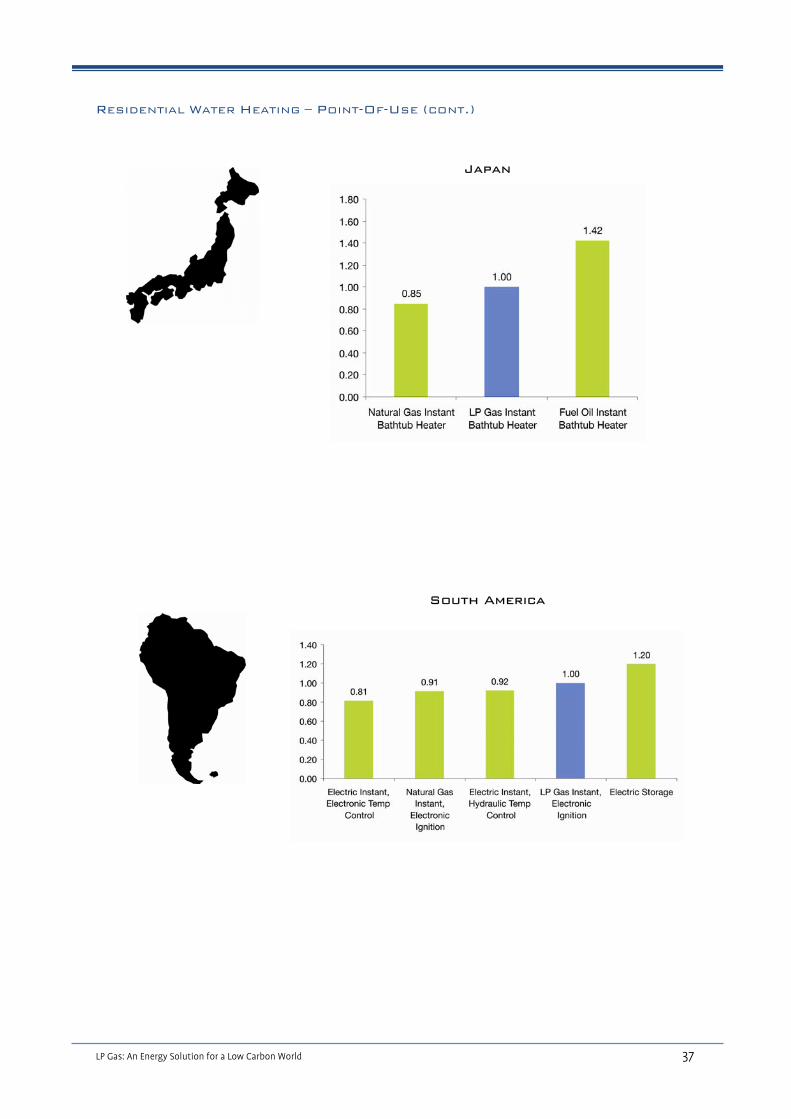
• Residential Water Heating—LP Gas is also among the most attractive fuels for heating water. In South America, an LP Gas instant water heater with electronic ignition offers 14% lower GHG emissions than an electric storage water heater. In Japan, switching from fuel oil to LP Gas can lower GHG emissions by 15%. In North America, upgrading from an electric storage water heater to an LP Gas system can reduce GHG emissions by more than 35%. In India, using an LP Gas instant water heater instead of comparable electric units can lower GHG emissions by more than 50%. Finally, pumped solar water heating with an LP Gas instant water heater backup offers the best combination of low GHG emissions and reliability of any hot water supply system assessed in this study.
As global decision makers continue to debate the effects of climate change and seek ways to reduce GHG emissions, LP Gas can offer significant near-term solutions. LP Gas is not only among the most attractive options for reducing GHG emissions, but it is abundantly available today in many parts of the world through existing distribution channels. Switching to LP Gas can help to immediately reduce GHG emissions in many applications and parts of the world. LP Gas also can be easily delivered to developing regions which may not have existing natural gas or electricity distribution infrastructures, offering an immediate, cost-effective, and low-carbon energy solution. When combined with other environmental, cost, and performance advantages, it is clear that LP Gas is an ideal clean energy for a low-carbon world.

LP Gas: An Energy Solution for a Low Carbon World 7
Table ES-2. Greenhouse Gas Emissions Profiles: LP Gas and Other Energy Sources – Western Europe Results normalized to LP Gas GHG emissions per unit of comparison and include both upstream and end-use emissionsa
Cookingb Distributed Power Generationc
Light-duty Vehiclesd Residential Space Heatinga
Residential Water Heating: Central
Residential Water Heating: Point-of-
Use
Electric Induction
0.73 Natural Gas 0.92 Diesel 0.99 High-efficiency Electric Heat Pump
0.47 Solar, LP Gas Instant Backup
0.44 Electric Instant, Electronic Temper-ature Control
0.63
Electric Coil
0.83 LP Gas 1.00 LP Gas (0% butane)
1.00 High-efficiency Boiler: Natural Gas
0.88 Electric Instant
0.64 Electric Instant, Hydraulic Temper-ature Control
0.72
High-efficiency Natural Gas
0.88 Diesel 1.08 LP Gas (80% butane)
1.01 High-efficiency Boiler: LP Gas
1.00 Natural Gas Instant
0.83 Natural Gas Instant, Electronic Ignition
0.91
High-efficiency LP Gas
1.00 LP Gas (50% butane)
1.01 High-efficiency Boiler: Fuel Oil
1.17 Electric Storage
0.84 LP Gas Instant, Electronic Ignition
1.00
Petrol 1.24 High-efficiency Wood Stove
1.96 Natural Gas Instant Combi-nation Boiler
0.91 Electric Storage
1.02
High-efficiency Wood Stove w/ Carbon Credit
0.20 LP Gas Instant
0.92
LP Gas instant combi-nation boiler
1.00
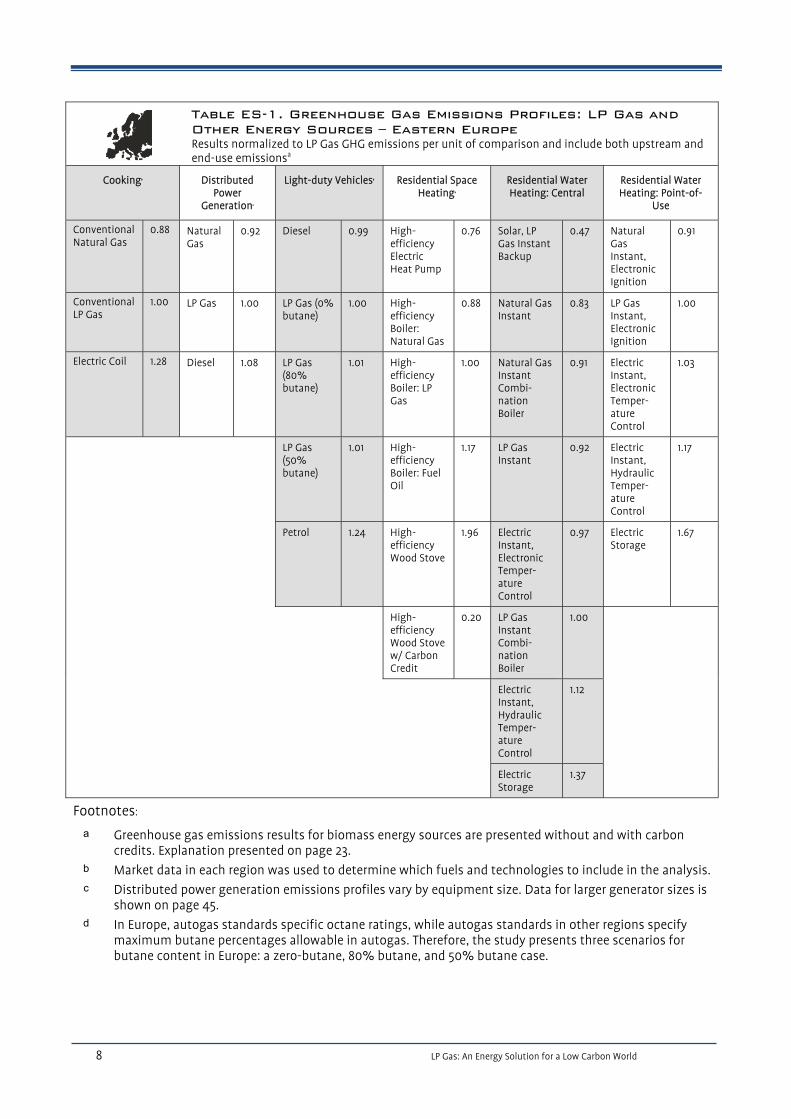
Footnotes:
a Greenhouse gas emissions results for biomass energy sources are presented without and with carbon credits. Explanation presented on page 23.
b Market data in each region was used to determine which fuels and technologies to include in the analysis. c Distributed power generation emissions profiles vary by equipment size. Data for larger generator sizes is
shown on page 45. d In Europe, autogas standards specific octane ratings, while autogas standards in other regions specify
maximum butane percentages allowable in autogas. Therefore, the study presents three scenarios for butane content in Europe: a zero-butane, 80% butane, and 50% butane case.
8 LP Gas: An Energy Solution for a Low Carbon World
Table ES-1. Greenhouse Gas Emissions Profiles: LP Gas and Other Energy Sources – Eastern Europe Results normalized to LP Gas GHG emissions per unit of comparison and include both upstream and end-use emissionsa
Cookingb Distributed Power
Generationc
Light-duty Vehiclesd Residential Space Heatinga
Residential Water Heating: Central
Residential Water Heating: Point-of-
Use
Conventional Natural Gas
0.88 Natural Gas
0.92 Diesel 0.99 High-efficiency Electric Heat Pump
0.76 Solar, LP Gas Instant Backup
0.47 Natural Gas Instant, Electronic Ignition
0.91
Conventional LP Gas
1.00 LP Gas 1.00 LP Gas (0% butane)
1.00 High-efficiency Boiler: Natural Gas
0.88 Natural Gas Instant
0.83 LP Gas Instant, Electronic Ignition
1.00
Electric Coil 1.28 Diesel 1.08 LP Gas (80% butane)
1.01 High-efficiency Boiler: LP Gas
1.00 Natural Gas Instant Combi-nation Boiler
0.91 Electric Instant, Electronic Temper-ature Control
1.03
LP Gas (50% butane)
1.01 High-efficiency Boiler: Fuel Oil
1.17 LP Gas Instant
0.92 Electric Instant, Hydraulic Temper-ature Control
1.17
Petrol 1.24 High-efficiency Wood Stove
1.96 Electric Instant, Electronic Temper-ature Control
0.97 Electric Storage
1.67
High-efficiency Wood Stove w/ Carbon Credit
0.20 LP Gas Instant Combi-nation Boiler
1.00
Electric Instant, Hydraulic Temper-ature Control
1.12
Electric Storage
1.37
Footnotes:
a Greenhouse gas emissions results for biomass energy sources are presented without and with carbon credits. Explanation presented on page 23.
b Market data in each region was used to determine which fuels and technologies to include in the analysis. c Distributed power generation emissions profiles vary by equipment size. Data for larger generator sizes is
shown on page 45. d In Europe, autogas standards specific octane ratings, while autogas standards in other regions specify
maximum butane percentages allowable in autogas. Therefore, the study presents three scenarios for butane content in Europe: a zero-butane, 80% butane, and 50% butane case.
LP Gas: An Energy Solution for a Low Carbon World 9
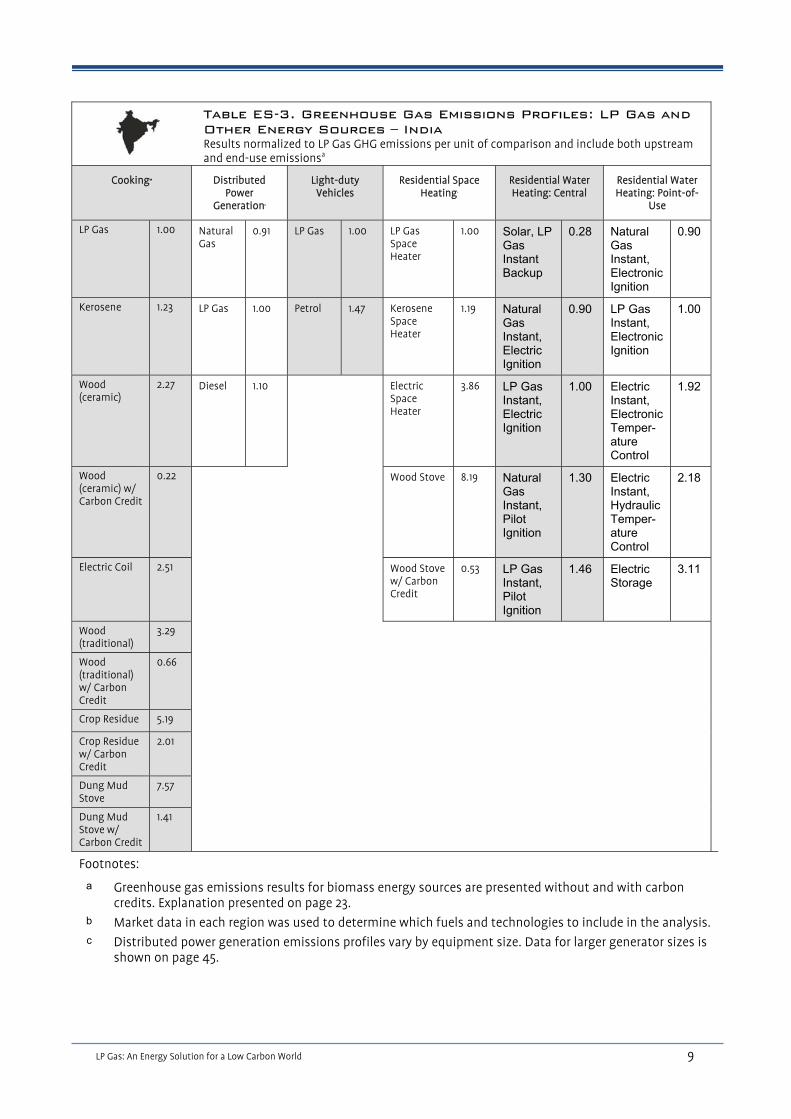
Table ES-3. Greenhouse Gas Emissions Profiles: LP Gas and Other Energy Sources – India Results normalized to LP Gas GHG emissions per unit of comparison and include both upstream and end-use emissionsa
Cookingab Distributed Power
Generationc
Light-duty Vehicles
Residential Space Heatinga
Residential Water Heating: Central
Residential Water Heating: Point-of-
Use
LP Gas 1.00 Natural Gas
0.91 LP Gas 1.00 LP Gas Space Heater
1.00 Solar, LP Gas Instant Backup
0.28 Natural Gas Instant, Electronic Ignition
0.90
Kerosene 1.23 LP Gas 1.00 Petrol 1.47 Kerosene Space Heater
1.19 Natural Gas Instant, Electric Ignition
0.90 LP Gas Instant, Electronic Ignition
1.00
Wood (ceramic)
2.27 Diesel 1.10 Electric Space Heater
3.86 LP Gas Instant, Electric Ignition
1.00 Electric Instant, Electronic Temper-ature Control
1.92
Wood (ceramic) w/ Carbon Credit
0.22 Wood Stove 8.19 Natural Gas Instant, Pilot Ignition
1.30 Electric Instant, Hydraulic Temper-ature Control
2.18
Electric Coil 2.51 Wood Stove w/ Carbon Credit
0.53 LP Gas Instant, Pilot Ignition
1.46 Electric Storage
3.11
Wood (traditional)
3.29
Wood (traditional) w/ Carbon Credit
0.66
Crop Residue 5.19 Crop Residue w/ Carbon Credit
2.01
Dung Mud Stove
7.57
Dung Mud Stove w/ Carbon Credit
1.41
Footnotes:
a Greenhouse gas emissions results for biomass energy sources are presented without and with carbon credits. Explanation presented on page 23.
b Market data in each region was used to determine which fuels and technologies to include in the analysis. c Distributed power generation emissions profiles vary by equipment size. Data for larger generator sizes is
shown on page 45.

10 LP Gas: An Energy Solution for a Low Carbon World
Table ES-4. Greenhouse Gas Emissions Profiles: LP Gas and Other Energy Sources – Japan Results normalized to LP Gas GHG emissions per unit of comparison and include both upstream and end-use emissions
Cookinga Distributed Power
Generationb
Light-duty Vehicles Residential Space Heating
Residential Water Heating: Central
Residential Water Heating: Point-of-
Use
Electric Induction
0.93 LP Gas 1.00 LP Gas 1.00 Natural Gas Direct Vent Heater
0.95 Solar, LP Gas Instant Backup
0.46 Natural Gas Instant Bathtub Heater
0.85
High-efficiency Natural Gas
0.95 Natural Gas
1.00 Petrol 1.42 LP Gas Direct Vent Heater
1.00 Electric Heat Pump
0.63 LP Gas Instant, Bathtub Heater
1.00
High-efficiency LP Gas
1.00 Diesel 1.07 Diesel 1.50 Kerosene Direct Vent Heater
1.14 Natural Gas Instant
0.98 Fuel Oil Instant Bathtub Heater
1.42
Electric Space Heater
1.53 LP Gas Instant
1.00
Fuel Oil Instant
1.17
Footnotes:
a Market data in each region was used to determine which fuels and technologies to include in the analysis.
b Distributed power generation emissions profiles vary by equipment size. Data for larger generator sizes is shown on page 45.

LP Gas: An Energy Solution for a Low Carbon World 11
Table ES-5. Greenhouse Gas Emissions Profiles: LP Gas and Other Energy Sources – North America Results normalized to LP Gas GHG emissions per unit of comparison and include both upstream and end-use emissionsa
Cookingb Distributed Power
Generationc
Light-duty Vehiclesa Residential Space Heating
Residential Water Heating: Central
Residential Water Heating: Point-of-
Use
High-efficiency Natural Gas
0.86 Natural Gas
0.92 LP Gas 1.00 High-efficiency Electric Heat Pump
0.73 Natural Gas Instant
0.86 N/A
Point-of-use water heating not frequently used in North America High-
efficiency LP Gas
1.00 LP Gas 1.00 Ethanol (E85, Corn-Based)
1.14 High-efficiency furnace: Natural Gas
0.86 Natural Gas Storage
0.88
Electric Induction
1.07 Diesel 1.07 Petrol 1.21 High-efficiency furnace: LP Gas
1.00 LP Gas Storage
0.99
Electric Coil 1.22 Furnace: Fuel Oil
1.34 LP Gas Instant
1.00
Electric Baseboard
1.83 Electric Storage
1.55
Electric Furnace
2.15
Footnotes:
a Greenhouse gas emissions results for biomass energy sources are presented without and with carbon credits. Explanation presented on page 23.
b Market data in each region was used to determine which fuels and technologies to include in the analysis.
c Distributed power generation emissions profiles vary by equipment size. Data for larger generator sizes is shown on page 45.

12 LP Gas: An Energy Solution for a Low Carbon World
Table ES-6. Greenhouse Gas Emissions Profiles: LP Gas and Other Energy Sources – Republic of Korea Results normalized to LP Gas GHG emissions per unit of comparison and include both upstream and end-use emissions
Cookinga Distributed Power
Generationb
Light-duty Vehicles Residential Space Heating
Residential Water Heating: Central
Residential Water Heating: Point-of-Use
Electric Induction
0.91 LP Gas 1.00 LP Gas 1.00 High-efficiency Electric Heat Pump
0.63 Solar, LP Gas Instant Backup
0.46 N/A
Point-of-use water heating not frequently used in the Republic of Korea High-
efficiency Natural Gas
0.95 Natural Gas
1.02 Diesel 1.13 High-efficiency Heater: Natural Gas
0.95 Natural Gas Instant
0.98
High-efficiency LP Gas
1.00 Diesel 1.04 Petrol 1.19 High-efficiency Boiler: LP Gas
1.00 LP Gas Instant
1.00
High-efficiency Boiler: Fuel Oil
1.20 Fuel Oil Instant
1.17
Electric Space Heater
1.61
Footnotes:
a Market data in each region was used to determine which fuels and technologies to include in the analysis.
b Distributed power generation emissions profiles vary by equipment size. Data for larger generator sizes is shown on page 45.

LP Gas: An Energy Solution for a Low Carbon World 13
Table ES-7. Greenhouse Gas Emissions Profiles: LP Gas and Other Energy Sources – South America Results normalized to LP Gas GHG emissions per unit of comparison and include both upstream and end-use emissionsa
Cookingab Distributed Power
Generationc
Light-duty Vehicles Residential Space Heating
Residential Water Heating: Central
Residential Water Heating: Point-of-
Use
High-efficiency Natural Gas
0.88 Natural Gas
0.95 N/A
LP Gas is not used significantly as a motor fuel in this region
High-efficiency Boiler: Natural Gas
0.89 Solar, LP Gas Instant Backup
0.21 Electric Instant, Electronic Temper-ature Control
0.81
Electric Coil 0.88 LP Gas 1.00 High-efficiency Boiler: LP Gas
1.00 Natural Gas, Instant Electronic Ignition
0.91 Natural Gas Instant, Electronic Ignition
0.91
High-efficiency LP Gas
1.00 Diesel 1.04 High-efficiency Boiler: Fuel Oil
1.21 LP Gas Instant, Electronic Ignition
1.00 Electric Instant, Hydraulic Temper-ature Control
0.92
Wood 6.61 Electric Space Heater
1.44 Electric Storage
1.16 LP Gas Instant, Electronic Ignition
1.00
Wood w/ Carbon Credit
0.43 Wood Stove
7.37 Natural Gas Instant, Pilot Ignition
1.32 Electric Storage
1.20
Wood Stove w/ Carbon Credit
0.48 LP Gas Instant, Pilot Ignition
1.46
Natural Gas Storage
2.42
Footnotes:
a Greenhouse gas emissions results for biomass energy sources are presented without and with carbon credits. Explanation presented on page 23.
b Market data in each region was used to determine which fuels and technologies to include in the analysis.
c Distributed power generation emissions profiles vary by equipment size. Data for larger generator sizes is shown on page 45.

14 LP Gas: An Energy Solution for a Low Carbon World
LP GAS AND CLIMATE CHANGE
The GHG footprint of LP Gas is relatively small compared to other fuels in terms of total emissions and emissions per unit of energy consumed. LP Gas has the lowest on-site emission rate of the major energy sources, with the exception of natural gas. Furthermore, LP Gas is not a GHG when released into the air as it is primarily a combination of propane and butane molecules, along with trace amounts of other compounds; the exact composition of which varies around the world. LP Gas vapor is not persistent in the atmosphere, it is commonly removed by natural oxidation in the presence of sunlight or knocked down by precipitation faster than it takes for it to become well-mixed and have impacts on global climate. Current measurements have not found a global climate impact from the emissions of propane or butanes. The Intergovernmental Panel on Climate Change (IPCC) reports that “Given their short lifetimes and geographically varying sources, it is not possible to derive a global atmospheric burden or mean abundance for most volatile organic compounds (VOCs) from current measurements.” VOCs explicitly include propane and butanes (IPCC TAR 2001).
ABOUT GREENHOUSE GAS EMISSIONS FROM FUEL COMBUSTION
The most prevalent greenhouse gas – carbon dioxide (CO2) – is a necessary byproduct of fossil fuel combustion. The amount of carbon dioxide released during fuel combustion depends on two primary factors: the amount of carbon in the fuel and the amount of fuel consumed to achieve some measure of useful output (e.g., kilometers driven, liters of water heated, etc.).
In general, lighter hydrocarbons release less carbon dioxide during combustion than heavier hydrocarbons, because lighter hydrocarbons consist of fewer carbon atoms per molecule. However, carbon content of the fuel being consumed represents only part of the CO2 emissions equation. The amount of fuel consumed to achieve a comparable amount of useful output plays an equally important role. Fuel consumption varies by fuel type and technology for each application. For example, while diesel fuel contains more carbon than LP Gas due to its chemical composition, diesel (compression) engines are generally more efficient than spark-ignition engines today. This efficiency advantage offsets some of the GHG emissions disadvantage of diesel compared to other fuels. As the efficiency of spark-ignition engines improve due to advances such as downsizing, turbo charging, and direct injection, the difference in GHG emissions due to differences in efficiency will narrow.
Small amounts of methane (CH4) and nitrous oxide (N2O) are also emitted during combustion due to unconsumed fuel. While the amounts of these emissions are far smaller than the amounts of CO2 emitted, they have been shown to have significantly greater greenhouse effects due to their stability in the atmosphere and their ability to absorb and reflect certain types of solar energy. The IPCC has developed global warming potential factors for these compounds and has advocated the widely accepted convention of reporting GHG emissions in terms of CO2 equivalent units (IPCC 2007). The global warming potential factors for CO2, CH4, and N2O are 1, 25, and 298, respectively. These factors indicate that one kilogram of methane has 25 times the greenhouse gas effect as one kilogram of CO2.
UPSTREAM VS. END-USE EMISSIONS
When quantifying the GHG emissions that result from the use of energy, it is important to distinguish between the emissions released at the location where the energy is consumed and the emissions released as a result of extracting and processing a refined and usable energy product to that location. The fuel lifecycle begins where the raw feedstock is extracted from the well or mine and ends where the fuel is consumed to power a vehicle, appliance, or other piece of equipment. Emissions released at the point of use are termed “end-use emissions,” while those emissions that occur along the delivery pathway are termed “upstream emissions.”
Energy use is not the only source of upstream emissions. Other production processes also release GHGs. For example, the growing of crops for biofuels production requires the application of nitrogen fertilizer, which causes the formation of nitrous oxide, while natural gas refining causes the release of fugitive emissions of methane. These processes have been quantified by several available models, including the Greenhouse Gases, Regulated Emissions, and Energy Use in Transportation (GREET) Model, making such models valuable tools for comparative lifecycle analyses of fuel systems (GREET 2007).

LP Gas: An Energy Solution for a Low Carbon World 15
This analysis is intended to give a full lifecycle accounting of GHG emissions resulting from the use of LP Gas and other fuels for specific applications and regions.
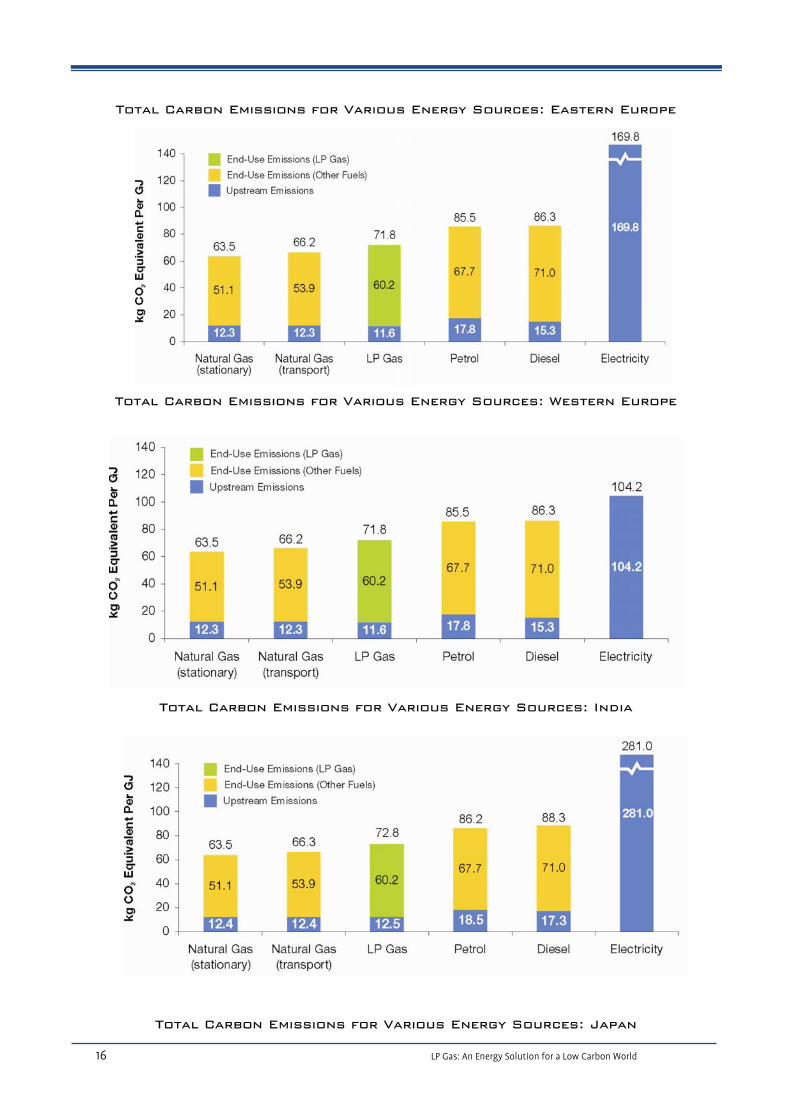
GREENHOUSE GAS EMISSIONS OF ENERGY SOURCES ON AN ENERGY
BASIS
The charts below present the GHG emissions profiles of select energy sources on an equal energy basis, in units of kg CO2-equivalent per GJ. The energy sources included represent the major fuels that are used in all regions of the world for the applications considered in this analysis. The first chart shown reflects the average GHG emissions per unit of energy across the regions included in this study and is followed by seven regional-specific charts. Regional variations in upstream emissions yield different carbon intensities for each region.
Despite these variations, LP Gas emits fewer GHGs than all energy sources analysed per unit of energy, with the exception of natural gas. This small carbon footprint for LP Gas is an important advantage that should be factored in to energy and climate change policy considerations.
Total Carbon Emissions for Various Energy Sources: Average of
Regions
16 LP Gas: An Energy Solution for a Low Carbon World
Total Carbon Emissions for Various Energy Sources: Eastern Europe
Total Carbon Emissions for Various Energy Sources: Western Europe
Total Carbon Emissions for Various Energy Sources: India
Total Carbon Emissions for Various Energy Sources: Japan
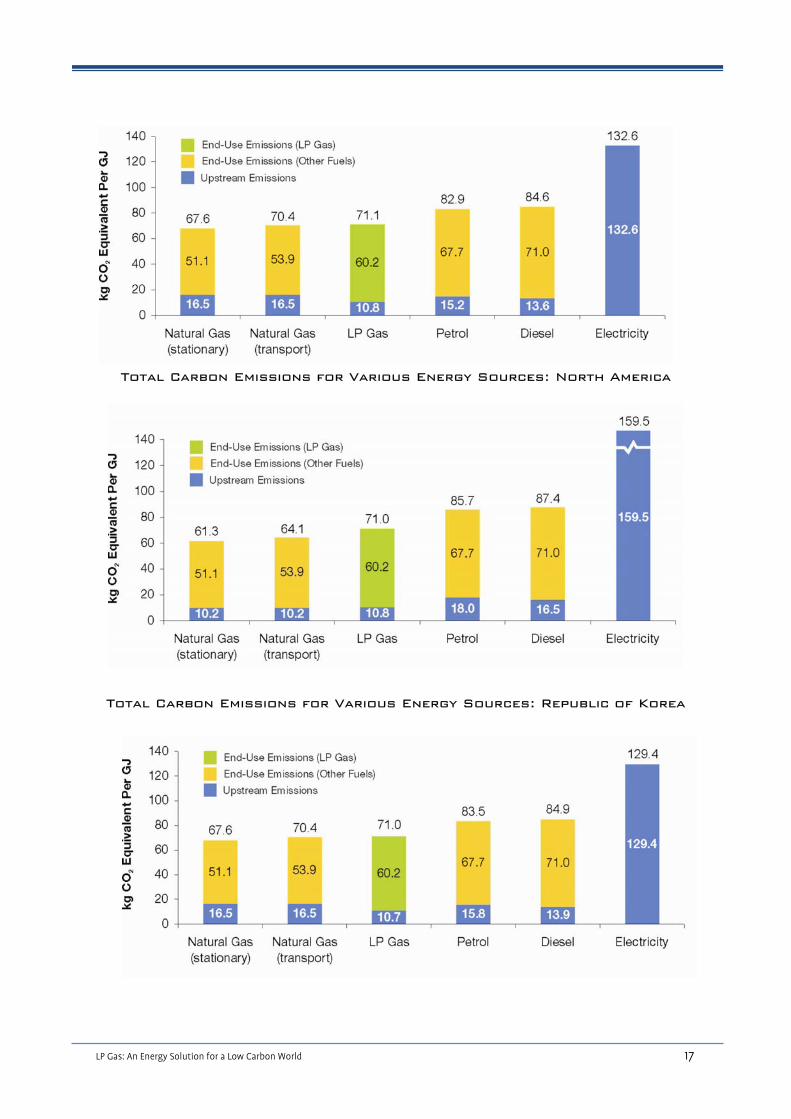
LP Gas: An Energy Solution for a Low Carbon World 17
Total Carbon Emissions for Various Energy Sources: North America
Total Carbon Emissions for Various Energy Sources: Republic of Korea

18 LP Gas: An Energy Solution for a Low Carbon World
Total Carbon Emissions for Various Energy Sources: South America
METHODOLOGY FOR APPLICATION-SPECIFIC EMISSIONS RESULTS
The following describes the basic methodology used to determine the greenhouse gas emissions profile for all applications in all of the regions examined in this study. For application-specific assumptions, please see the Appendix. The overall methodology used in this analysis is similar to that used in the study, Propane Reduces Greenhouse Gas Emissions: A Comparative Analysis, published by the U.S. Propane Education & Research Council (Energetics, 2007).
BASIS OF COMPARISON This study examined five different applications important to the global LP Gas industry in seven different regions of the world. For each application, the study compared LP Gas -fueled equipment to that fueled or powered by other energy sources. To create a meaningful basis for comparison of relative GHG emissions profiles of LP Gas and other fuels, analysts defined a base case for each application. Each base case and the rationale used to determine it are described below:
• Cooking – This analysis compares the relative greenhouse gas emissions from heating food in a pot on a stovetop. This application is sufficiently generic to allow the comparison of a wide range of stovetop cookers. Other cooking technologies, including ovens, microwave ovens, toasters, griddles, and traditional “three stone” arrangements were not included in this analysis.
• Distributed Power Generation – This analysis calculated energy use based on manufacturer specifications (specs) for power-only (i.e., no combined heat and power) generator sets, or “gensets,” operating at 1,800 rpm for 60 Hz output and at 1,500 rpm for 50 Hz output and 100% nameplate load. The study analyzed manufacturing specs from more than 150 commercially available units that contained adequate data and were available in the regions analyzed (see the Appendix for a full list of manufactures and models analyzed). Statistical log-linear regression of genset data of a given power frequency and size were used to estimate energy end use. Gensets fuel usage for North America, South America, and Korea are based on 60 Hz power. Europe, India, and Japan are based on 50 Hz power. The analysis considers a range of sizes of generators used for both prime and standby use.
• Light-duty Vehicles – The study sought a single vehicle platform that was available from the car makers in multiple fuel configurations, including LP Gas, and representative of a significant portion of light-duty vehicles in the region. By doing so, analysts can isolate the differences in GHG emissions resulting from the use of LP Gas versus other fuels, rather than GHG emissions differences that may result from different vehicle weights, systems configurations, or other factors that influence GHG emissions when comparing one vehicle make and model to another. The unit of comparison was one vehicle traveling 100 km.
LP Gas: An Energy Solution for a Low Carbon World 19
• Residential Space Heating – To make a fair comparison of LP Gas -fueled and competing space heating technology, we chose to compare the most efficient units commercially available for all fuels, reflecting the “best-in-class” technologies available in each region. The basis for analysis was the energy required to heat a typical home or room in the region for one year. The analysis reflected the differences in technologies used in each region. These differences are driven by government regulations, climate, availability of fuels, and the cost of various technology options.
• Residential Water Heating – While there is substantial regional variation in both water heating technologies and their application, all regions tend to rely on central and/or point-of-use systems for their water heating needs. Central residential water heating heats all of a household’s water from one source, while point-of-use heaters are used to heat water for independent needs like dishwashing, hand washing, and showering. This study analyzes both central and point-of-use water heaters on the basis of the amount of energy typically used by in one year.
The study compares LP Gas fueled technology to equipment fueled by other energy sources commonly used for the same application. The study selected operational variables such as size, hours of operation, and frequency of use to represent an average or typical use of the technology or equipment. Analysts obtained data from published test results, vendor-supplied specifications, and government studies to determine what constituted a typical use and energy efficiencies of each fuel system. For most applications, the efficiencies were used to determine the amount of fuel needed to deliver an equivalent energy service (e.g., kilometers traveled or heat supplied) using LP Gas and each competing energy option. For some energy sources, such as electricity or diesel, differences in energy efficiencies between LP Gas and the other fuel are the result of different technology designs. In other instances (most notably natural gas), there are only slight differences in technology design between the LP Gas -configured technology and alternate fuel configurations.
Available equipment configurations can vary significantly across regions in applications considered. Therefore, the study attempted to analyze the range of technologies used in a given region. However, comparisons of the relative GHG emissions profiles of LP Gas versus other fuels across regions in one application may be misleading.
UPSTREAM EMISSIONS
Upstream emissions as defined in this analysis are the sum of all emissions resulting from the recovery, processing, and transport of fuel from the wellhead to the point of delivery to the end-user. Upstream emission factors vary depending on the type, fractional share, and efficiency of power plants used to generate electricity; market shares of different fuel formulations; fuel feedstock shares and refining efficiencies; and fuel transportation mode, distance, and mode share.
The upstream emissions associated with LP Gas production depend on its feedstock. LP Gas is separated from natural gas during production and from crude oil during refining. Upstream emissions calculations attribute to LP Gas, on a MJ-fractional basis2, the emissions produced from the recovery and refining of these feedstocks before the separation of LP Gas.3 As a result, the upstream emissions attributed to LP Gas depend on the relative contribution of natural gas and crude oil to LP Gas production and the amount of LP Gas and natural gas imported.
The differences among regions in fuels used to generate electricity have a significant impact on the upstream emissions associated with electricity. For example, electricity in North America, where coal-based electricity generation is significant, has a higher “carbon footprint” than an equivalent amount of electricity generated in South America, where hydropower (which produces minimal GHG emissions) is a higher percentage of the overall electricity generation mix. Similarly, because liquefied natural gas (LNG) requires significant energy to produce and ship via tanker, the relative percentage of natural gas imported via pipeline versus that imported as LNG is reflected in the upstream emissions factors for regions in which LNG plays a significant role in the region’s energy mix.
2 There are several bases on which one can allocate the upstream GHG emissions associated with natural gas processing and petroleum refining to individual product streams, including LP Gas. For this study, analysts use energy content, as opposed to volume, economic value, or other possible metrics. Accordingly, the proportion of the GHG emissions generated during natural gas and crude oil refining are attributed to LP Gas in proportion to its energy content (i.e., the “MJ-fractional basis”), relative to the energy content of all product streams. 3 All products produced from either crude or natural gas are assumed to begin their lifecycle at the wellhead, even though they have not been physically separated from the feedstock. If a given product stream represents 5% of the Btu content of the feedstock, for example, then that product is assigned 5% of the emissions attributed to the feedstock before refining and separation. This method of assigning emissions is not influenced by the economic value of the product or feedstock.

20 LP Gas: An Energy Solution for a Low Carbon World
There are several models that attempt to quantify these emissions, including:
• E3 database – Ludwig-Bölkow-Systemtechnik GmbH (LBST), Germany4 • GHGenius Model – Natural Resources Canada, Canada5 • Global Emission Model for Integrated Systems (GEMIS) – Öko-Institut (Institute for Applied
Ecology), Germany6 • Greenhouse Gases, Regulated Emissions, and Energy Use in Transportation (GREET) Model –
Argonne National Laboratory, United States7 To estimate upstream emissions factors, the study modified the GREET model to reflect regional-specific variations in technology, resource characteristics, operational efficiency, and infrastructure of the region being modeled. See page 53 in the Appendix for a detailed explanation of the assumptions used in this analysis.
A NOTE ON BIOMASS AND CARBON ACCOUNTING Biomass energy sources receive special consideration when estimating GHG emissions, according to accounting conventions approved by the IPCC and broadly accepted by scientists. These conventions attempt to account for the CO2 removed from the atmosphere by plants as they grow by giving biomass sources a negative CO2 upstream emissions factor (see Ethanol column in Table 1). Therefore, while the end-use GHG emissions generated by the use of bio-based fuels can be significant, these emissions are largely offset by upstream credits per this accounting convention. Whether biomass is harvested in a sustainable manner plays a complex role in total GHG emissions and climate change. Quantifying the precise nature of the climate impacts of sustainable versus unsustainable biomass collection is a matter of significant debate and scientific uncertainty. Accordingly, in this report analysts remain consistent with IPCC conventions regarding biomass carbon accounting but also present GHG emissions profiles without carbon credits for biomass carbon uptake in end-use applications. In the global regions were significant deforestation and other unsustainable biomass harvesting approaches occur, the precise GHG emissions profile of biomass is likely between the two extreme values presented here.
4 http://www.e3database.com/ 5 http://www.ghgenius.ca/ 6 http://www.oeko.de/service/gemis/en/index.htm 7 http://www.transportation.anl.gov/software/GREET/

LP Gas: An Energy Solution for a Low Carbon World 21
Table 1. Upstream Emissions Factors (kg per TJ fuel, gross calorific value)
LP G
as
Nat
ural
Gas
Gas
olin
e
Die
sel
Elec
tric
itya
Etha
nolb
Dom
estic
LP
Gas
Impo
rted
LP
Gas
(%)
% L
P G
as
Impo
rted
Pipe
line
Nat
ural
Gas
Impo
rted
Li
quid
N
atur
al G
as
% N
atur
al
Gas
Im
port
ed a
s LN
G
CO2 8,374 5,216 14,477 12,09396,096 (W) 161,301 (E) 8,374 7,207 4,947 11,136
CH4 140 283 130 127290 (W) 305 (E) 129 168 295 335
N2O 0.2 0.1 0.3 0.22.9 (W) 3.1 (E) 0.2 0.1 0.1 0.3
Total 11,593 12,330 17,808 15,334104,219 (W) 169,828 (E) 11,653 11,444 29% 12,357.7 19,591.2 9%
CO2 8,450 5,776 13,888 13,225 270,318 9,276 7,470 5,026 11,306CH4 160 263 169 161 385 172 158 278 276N2O 0.2 0.1 1.4 0.2 3.6 0.2 0.1 0.1 0.3Total 12,507 12,387 18,530 17,326 281,025 13,630 11,461 20% 12,003 18,272 17%CO2 7,338 10,551 12,149 10,917 124,674 7,773 7,731 10,551CH4 138 235 114 106 284 107 158 235N2O 0.1 0.2 0.6 0.2 2.8 0.1 0.1 0.2Total 10,828 16,506 15,166 13,626 132,615 10,500 11,732 75% 16,506 100%CO2 7,602 4,746 14,000 12,780 151,744 -9,744CH4 125 217 149 144 276 113N2O 0.1 0.1 1.0 0.2 2.9 25Total 10,780 10,196 18,009 16,462 159,513 655CO2 7,441 10,537 12,582 11,146 121,555 8,023 7,731 10,537CH4 131 235 121 107 281 108 158 235N2O 0.1 0.2 0.6 0.2 2.8 0.1 0.1 0.2Total 10,747 16,491 15,786 13,876 129,409 10,773 11,732 59% 16,491 ~100%CO2 7,175 4,503 10,862 11,640 107,187 -55,598CH4 153 301 114 105 337 286N2O 0.1 0.1 2.1 0.2 3.2 22Total 11,034 12,056 14,315 14,326 116,581 -41,761
a Electricity emission factors are defined for Western (W) and Eastern (E) European regions to reflect differences in electricity generation mixes in these regions.b Ethanol is assumed to be corn-based E85 in North America and 100% sugarcane ethanol in South America
Note: Total GHG emissions are shown as CO2-equivalents. Columns do not add due to multiplicaton of global warming potential factors for CH4 and N2O (25 and 298, respectively).
Fuel Consumed in Region Fuel Source (LP Gas and Natural Gas)
Republic of Korea
South America
Europe
India
Japan
North America

22 LP Gas: An Energy Solution for a Low Carbon World
END-USE EMISSIONS
End-use emissions are the emissions generated at the point of energy use, such as the vehicle, generator, or space heater. These emissions are specific to the technologies used for each application in each region, and therefore different sources are necessary to estimate end-use emission factors. Generally, the study considers energy consumption and efficiency data provided by equipment manufacturers. For some applications, such as distributed power generation, the study analyzed data from dozens of equipment manufacturers and averaged energy consumption and efficiency data for various fuels analyzed. For others (e.g., vehicles), analysts sought a single vehicle platform that was available from the vehicle manufacturer in multiple fuel configurations, including LP Gas, and representative of a large portion of light-duty vehicles in the region being analyzed. This approach allowed analysts to isolate the differences in GHG emissions resulting from the use of LP Gas versus other fuels, rather than GHG emissions differences that may result from different vehicle weights or systems configurations. The specific assumptions and data sources used for each application are presented in detail in the Appendix of this report.
LP Gas: An Energy Solution for a Low Carbon World 23
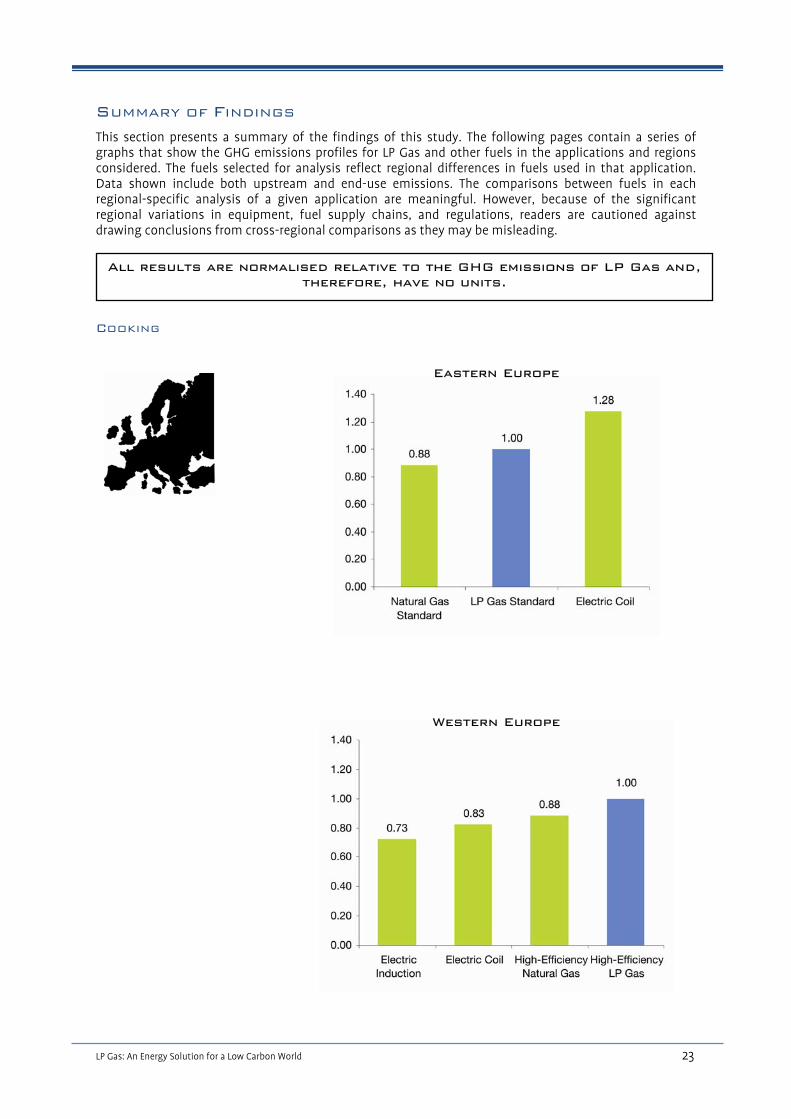
SUMMARY OF FINDINGS
This section presents a summary of the findings of this study. The following pages contain a series of graphs that show the GHG emissions profiles for LP Gas and other fuels in the applications and regions considered. The fuels selected for analysis reflect regional differences in fuels used in that application. Data shown include both upstream and end-use emissions. The comparisons between fuels in each regional-specific analysis of a given application are meaningful. However, because of the significant regional variations in equipment, fuel supply chains, and regulations, readers are cautioned against drawing conclusions from cross-regional comparisons as they may be misleading.
COOKING
Eastern Europe
Western Europe
All results are normalised relative to the GHG emissions of LP Gas and, therefore, have no units.

24 LP Gas: An Energy Solution for a Low Carbon World
Cooking (cont.)
India
India
(with carbon sequestration for biofuels)

LP Gas: An Energy Solution for a Low Carbon World 25
COOKING (CONT.) Japan
North America
Republic of Korea
26 LP Gas: An Energy Solution for a Low Carbon World
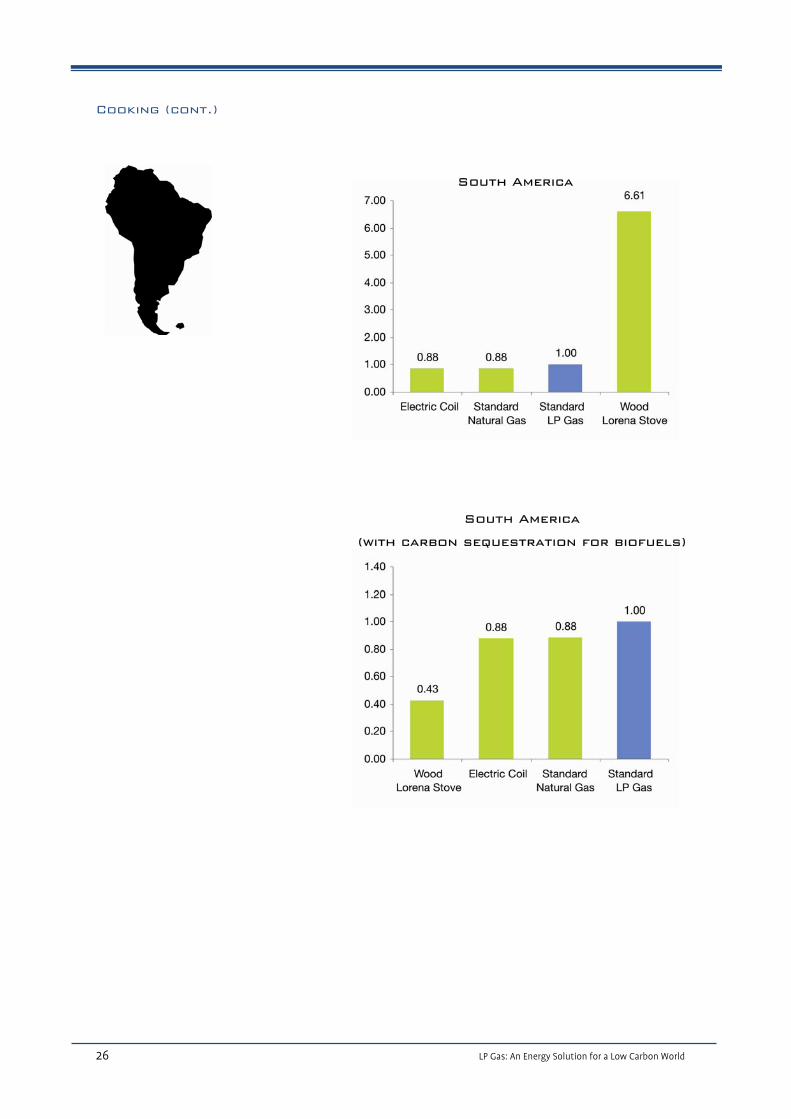
Cooking (cont.)
South America
(with carbon sequestration for biofuels)
South America

LP Gas: An Energy Solution for a Low Carbon World 27
Distributed Power Generation
India
25 kW Prime 50 kW Standby 100 kW Prime
Europe
25 kW Prime 50 kW Standby 100 kW Prime
Japan
25 kW Prime 50 kW Standby 100 kW Prime
Europe
25 kW Prime 50 kW Standby 100 kW Prime

28 LP Gas: An Energy Solution for a Low Carbon World
DISTRIBUTED POWER GENERATION (CONT.)
North America
25 kW Prime 50 kW Standby 100 kW Prime
Republic of Korea
25 kW Prime 50 kW Standby 100 kW Prime
South America
25 kW Prime 50 kW Standby 100 kW Prime

LP Gas: An Energy Solution for a Low Carbon World 29
Light-Duty Vehicles
Japan (Toyota Crown Taxi)
India (Maruti 800)
Europe (Average of 13 Vehicles)
1.01
1.24
1.01
0.20 0.40 0.60 0.80 1.00 1.20 1.40 1.60
1.00
Low-ButaneLP Gas
High-ButaneLP Gas
Average LPGas PetrolDiesel
0.99

30 LP Gas: An Energy Solution for a Low Carbon World
Light-Duty Vehicles (cont.)8
8 Ethanol (E85) receives an upstream carbon credit per IPCC convention for carbon accounting of biomass-based fuel sources. The specific value of this credit can be found in Table 1 of this report.
North America (Ford F-150)
Republic of Korea (Kia Carens)

LP Gas: An Energy Solution for a Low Carbon World 31
Residential Space Heating
Western Europe
Western Europe (with carbon sequestration for
biofuels)
Eastern Europe
Eastern Europe (with carbon sequestration for
biofuels)

32 LP Gas: An Energy Solution for a Low Carbon World
RESIDENTIAL SPACE HEATING (CONT.)
India (with carbon sequestration for
biofuels)
India
Japan
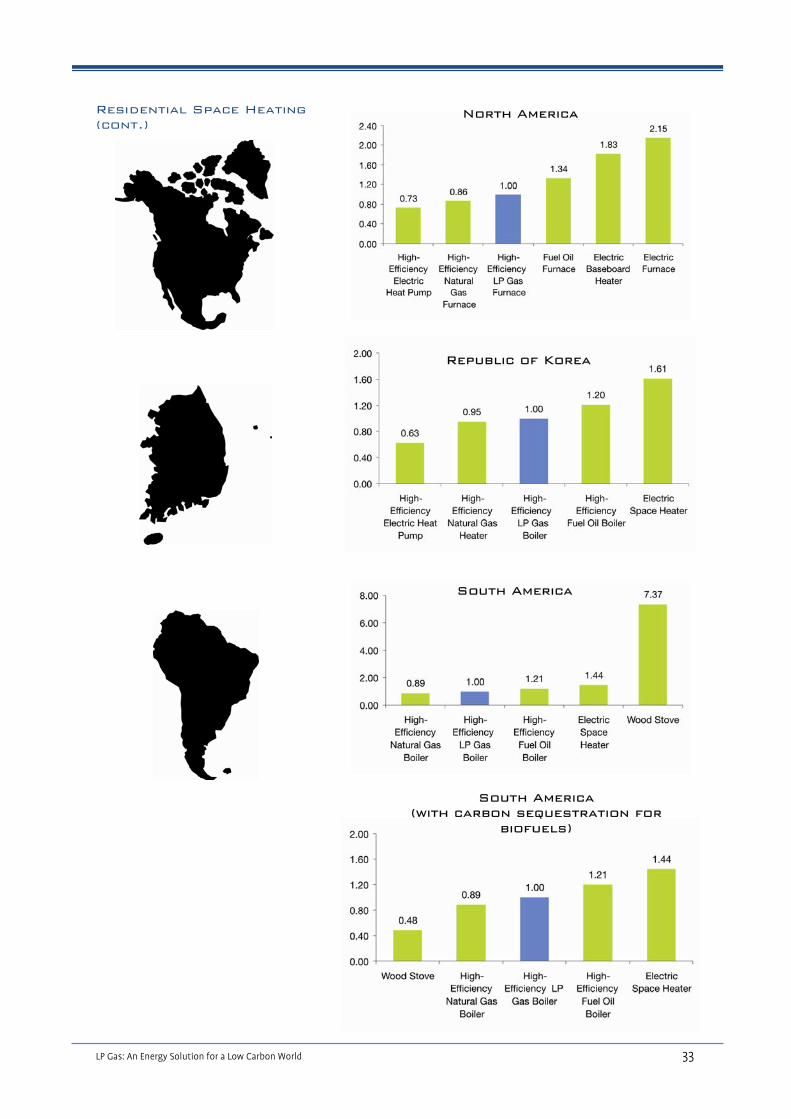
LP Gas: An Energy Solution for a Low Carbon World 33
Residential Space Heating (cont.)
South America (with carbon sequestration for
biofuels)
South America
Republic of Korea
North America
34 LP Gas: An Energy Solution for a Low Carbon World
Residential Water Heating – Central
Eastern Europe
Western Europe
India

LP Gas: An Energy Solution for a Low Carbon World 35
Residential Water Heating – Central (cont.)
Japan
North America
Republic of Korea
South America
36 LP Gas: An Energy Solution for a Low Carbon World
Residential Water Heating – Point-Of-Use
Eastern Europe
Western Europe
India
LP Gas: An Energy Solution for a Low Carbon World 37
RESIDENTIAL WATER HEATING – POINT-OF-USE (CONT.)
Japan
South America

38 LP Gas: An Energy Solution for a Low Carbon World
Application-Specific Analyses
The following pages present detailed information regarding the five applications considered in this study. Each section includes a brief description of the application area; energy use and upstream, end-use, and total GHG emissions data; market data or information; key assumptions made in the analysis; and additional notes to explain the analysis. A complete list of assumptions and references for each application is provided in the Appendix.
Cooking
Consumers in industrialized countries choose from numerous stove tops and ovens using LP Gas, natural gas, and electricity. In developing countries people use more basic LP Gas, natural gas, or kerosene cookers or locally manufactured stoves that burn biomass (e.g., wood, crop residues, and animal dung), often with significant adverse human health and environmental consequences.
Cooking efficiencies may vary widely with the size and composition of the cooking pot and whether a lid is used. In standardized tests, the efficiency of electric stovetop cookers does not vary substantially between manufacturers. Governments have not issued efficiency standards for stovetop cookers. In developing countries, food may be cooked on a smaller single or double cooker that sits on the floor or tabletop. Biomass cookers in this analysis are stoves burning locally available fuels. In all cases the stoves incorporate simple chimneys or vents to improve efficiency and remove smoke.
Europe: Cooking practices vary by country according to fuel availability and local preferences. Sales of electric stoves slightly outpace gas stoves across the region; however gas stoves are nearly universal in Italy while nearly all stoves sold in Germany and Sweden are electric. High-efficiency gas and electric equipment was analyzed for Western Europe, where consumers place a high value on efficiency. In Eastern Europe standard gas and electric stovetops are more commonly sold.
India: Efficiency data is specific to India and is based on a boiler water test using locally available cooking equipment and fuels. This analysis uses only seven of the 28 combinations tested by the Tata Energy Research Institute.
Japan: Gas stovetops have traditionally been dominant in Japan. Interest is growing in electric induction stovetops due to strong interest in technology, efficiency, and reducing dependence on imported natural gas.
North America: Standard-efficiency gas and electric stovetops dominate consumer sales in this region.
Republic of Korea: Technology options are assumed to be the same as in Japan.
South America: Standard efficiency gas and electric stovetops are typical in this region. In rural areas locally produced Lorena stoves are common.
Market

LP Gas: An Energy Solution for a Low Carbon World 39
Key Assumptions
Energy End-Use Data*
Fuel / Technology Energy Use (kj)
Upstream (kg CO2e)
Downstream (kg CO2e)
Total (kg CO2e)
E. Europe
Natural Gas: Standard 839 10.3 42.9 53.3
LP Gas: Standard 839 9.7 50.6 60.3
Electric: Coil 454 77.2 0 77.2
W. Europe
Electric: Induction 399 41.5 0 41.5
Electric: Coil 454 47.4 0 47.4
Natural Gas: High Efficiency 797 9.8 40.8 50.6
LP Gas: High Efficiency 797 9.2 48.0 57.3
LP Gas: Single Burner Stove 625 7.8 42.7 50.5
Kerosene: Pump-Type Stove 713 12.3 49.6 61.9
Wood: Ceramic Stove 1,155 0 114.4 114.4
Wood: Ceramic Stove with Biomass Carbon Credit
1,155 - 103.2 114.4 11.2
Electric: Coil 451 126.8 0 126.8
Wood: Traditional Stove 1,522 0 166.0 166.0
Wood: Traditional Stove with Biomass Carbon Credit
1,522 - 132..8 166.0 33.1
Crop Residue: Improved Stove 2,481 0 262.11 262.11
Crop Residue: Improved Stove with Biomass Carbon Credit
2,481 - 160.4 262.11 101.7
Dung: Mud Stove 3,563 0 382.1 382.1
Dung: Mud Stove with Biomass Carbon Credit
3,563 - 311.1 382.1 71.0
1. The base case analysis was heating one liter of water from 20°C to 100°C on a stovetop. This corresponds to0.335 MJ of heat being delivered to the cooking vessel.
2. The efficiencies of gas and electric stovetop cookers are based on standardized tests performed by the U.S.government. (DOE 1996).
a. LP Gas or natural gas stovetop: Standard (open flame burner): 39.9%. High efficiency (thermostaticallycontrolled, sealed burner design): 42.0%.
b. Electric stovetop: Coil: 73.7%. Induction: 84.0%. The coil uses electrical resistance to generate heat,which is conducted directly to the pot. The induction element generates a high-frequency magneticfield that produces eddy currents in the cooking vessel, causing it to heat up. Some electric stoves usesmooth heating elements, but performance is similar (74.2%) to electric coils.
3. LP Gas and natural gas burners are assumed to have the same efficiencies.
4. The biomass used for cooking is assumed to be 100% renewable.

40 LP Gas: An Energy Solution for a Low Carbon World
Fuel / Technology Energy Use (kj)
Upstream (kg CO2e)
Downstream (kg CO2e)
Total (kg CO2e)
Electric: Induction 399 52.9 0 52.9
Natural Gas: High Efficiency 797 13.2 40.8 53.9
LP Gas: High Efficiency 797 8.6 48.0 56.7
Natural Gas: Standard 839 8.6 42.9 51.5
LP Gas: Standard 839 9.0 50.6 59.6
Electric: Induction 399 63.6 0 63.6
Electric: Coil 454 72.5 0 72.5
Electric: Induction 399 51.6 0 51.6
Natural Gas: High Efficiency 797 13.2 40.8 53.9
LP Gas: High Efficiency 797 8.6 48.0 56.6
Natural Gas: Standard 839 10.3 42.9 53.3
Electric: Coil 454 53.0 0 53.0
LP Gas: Standard 839 9.7 50.6 60.3
Wood: Lorena Stove 3,721 0 398.8 398.8
Wood: Lorena Stove with Biomass Carbon Credit
3,721 - 372.8 398.8 26.0
* Unit of comparison: Heating one liter of water from 20°C to 100°C on a stovetop. (Note: This data is not intended for cross-regional comparison. Each region’s results should be examined separately due to inherent differences in applications across regions.)
Notes
1 Some governments are encouraging consumers to switch from electric to gas appliances (EU) while other governments encourage the use of electric appliances (Japan).
2 The major energy-saving measure available to manufacturers is the replacement of pilot lights with electronic ignition. Standing pilot lights can consume more energy than is used for cooking over the life of a stovetop. This analysis assumes that none of the stovetops have a pilot light.
3 Because LP Gas and natural gas stovetops are assumed to have the same efficiency, differences in GHG emissions within a region are due to upstream and downstream emission factors.
4 Biomass stove emissions are not zero because combustion produces CH4 and N2O which have high GHG multipliers. However, upstream GHG emissions associated with biomass cooking are assumed to be zero.

LP Gas: An Energy Solution for a Low Carbon World 41
Figure 1. Small and mid-sized spark engine distributed generators (Honda 2008, Cummins 2008)
Cummins15%
Kohler 12%
Generac 10%
Caterpillar 8%Honda
8%
Other 47%
Distributed power generation
Distributed power-generation provides small-scale production of electricity at or near the location where the power is used. Distributed generation is employed for a variety of applications and users. Commercial users operate distributed generators as backup power (standby generators) for critical functions such as data centers or hospitals, or as primary power (prime generators) for operations off the electric grid. Residential users employ standby generators to supplement interrupted grid electricity, or use prime generators in remote areas not reached by the electric grid.
Reciprocating internal combustion engines represent the most widespread and mature distributed generation technology. These engines come in two varieties: spark-ignition and compression-ignition. Spark-ignition engines commonly operate on LP Gas or natural gas, and compression engines operate on diesel fuel. Both engine types can by designed for standby use, which normally run for less than about 500 hours per year in short intervals, or they can be designed for prime use, which are rated and designed for regular use throughout the year. These enginges are packaged with supporting systems into generator sets, or “gensets.”
The type of genset technology does not vary significantly among the regions evaluated in this study. Major manufacturers in each region supply generators to customers worldwide. The electric power frequency does vary among world regions, so only generators that are able to supply power at the region-specific electric frequency were considered in this analysis. North America, South America, and Korea primarily use 60 Hz power, while Europe, India, and Japan use 50 Hz power in most cases.
Distributed generators for onsite use typically range from a few kW to several hundred kW (Figure 1).
1. Energy use is based on manufacturer specifications (specs) for power-only (no CHP) gensets operating at 180 rpm for 60 Hz output and at 1500 rpm for 50 Hz output and 100% nameplate load.
2. Manufacturer specifications used to calculate energy use is based on over 150 commercially available units that contained adequate data and were available in regions of interest (see appendix). Different manufacturers provide different energy use requirements for genset ratings. Statistical log-linear regression of genset data of a given power frequency and size were used to estimate energy end use.
3. Gensets fuel usage for North America, South America, and Korea are based on 60 Hz power. Europe, India, and Japan are based on 50 Hz power.
Key Assumptions
Five of the most common manufacturer brands worldwide are Cummins/Onan, Kohler, Generac, Caterpillar, and Honda (Figure 2). These manufactures offer diesel, natural gas, and LP Gas-fueled standby and prime gensets. The most regularly sold gensets deliver power of 100 kW or less. Gensets of several hundred kW to several MW are also offered, but are less common.
In developed regions of the world, the genset market is mainly driven by the need to protect local electricity supply against interruptions from natural disasters or other catastrophic events. In less-developed regions, increasing wealth has enabled greater purchasing power to procure electricity-driven applications, such as household appliances, but the electric grid is often unreliable and intermittent. Generators are increasingly common in these regions as a regular supplement to grid power.
Market
Figure 2. Fraction of genset brands offered by distributors, worldwide sample (Power Systems Research 2005)

LP Gas: An Energy Solution for a Low Carbon World 42
*Energy Use in MJ per hour operating at nameplate rating. Upstream, Downstream, and Total Emissions in kg CO2-equivalent per hour operating at nameplate rating. (Note: This data is not intended for cross-regional comparison. Each region’s results should be examined separately due to inherent differences in applications across regions.)
25 kW Prime Genset 50 kW Standby Genset 100 kW Prime Genset
Region Fuel Energy Use
(MJ/h)
Up-stream
(kg CO2e)
End-Use (kg
CO2e)
Total (kg
CO2e)
Energy Use (MJ/h)
Up-stream
(kg CO2e)
End-Use (kg
CO2e)
Total (kg
CO2e)
Energy Use
(MJ/h)
Up-stream
(kg CO2e)
End-Use (kg
CO2e)
Total (kg
CO2e)
Natural Gas
367 4.53 18.78 23.3 716 8.83 36.62 45.4
1,457 17.96 74.51 92.5
LP Gas 351 4.07 21.15 25.2 672 7.79 40.47 48.3 1,395 16.18 84.07 100.2
Diesel 317 4.86 22.50 27.4 585 8.97 41.51 50.5 1,169 17.93 83.02 100.9
Natural Gas
367
4.55 18.78 23.3 716 8.87 36.62 45.5
1,457 18.05
74.51 92.6
LP Gas 351 4.39 21.15 25.5 672 8.40 40.47 48.9 1,395 17.45 84.07 101.5
Diesel 317 5.49 22.50 28.0 585 10.13 41.51 51.6 1,169 20.26 83.02 103.3
Natural Gas
367 6.06 18.78 24.8 716 11.82 36.62 48.4
1,457 24.05 74.51 98.6
LP Gas 351 3.80 21.15 25.0 672 7.27 40.47 47.7 1,395 15.11 84.07 99.2
Diesel 317 4.32 22.50 26.8 585 7.97 41.51 49.5 1,169 15.94 83.02 99.0
Natural Gas
377 3.84 19.27 23.1 741 7.55 37.88 45.4
1,404 14.32 71.82 86.1
LP Gas 352 3.80 21.22 25.0 698 7.53 42.07 49.6 1,318 14.21 79.43 93.6
Diesel 305 5.03 21.67 26.7 599 9.86 42.53 52.4 1,123 18.48 79.71 98.2
Natural Gas
377 6.21 19.27 25.5 741 12.21 37.88 50.1
1,404 23.16 71.82 95.0
LP Gas 352 3.79 21.22 25.0 698 7.51 42.07 49.6 1,318 14.17 79.43 93.6
Diesel 305 4.24 21.67 25.9 599 8.31 42.53 50.8 1,123 15.58 79.71 95.3
Natural Gas
377 4.54 19.27 23.8 741 8.93 37.88 46.8 1,404 16.93 71.82 88.7
LP Gas 352 3.89 21.22 25.1 698 7.71 42.07 49.8 1,318 14.55 79.43 94.0
Diesel 305 4.37 21.67 26.0 599 8.58 42.53 51.1 1,123 16.09 79.71 95.8

LP Gas: An Energy Solution for a Low Carbon World 43
,
Gensets fueled by natural gas emits fewer total emissions than LP Gas and diesel in most regions due to the lower carbon-equivalent emissions factor for combusted natural gas compared to LP Gas and diesel.
LP Gas gensets emits fewer total emissions than diesel in nearly all regions and sizes evaluated.
LP Gas gensets emits about the same amount of GHGs as natural gas in regions that import their natural gas via LNG (e.g., Japan and Korea).
Energy use and end-use emissions are the same for regions using the same electric power frequency (50 Hz or 60 Hz). Upstream emissions account for most of the variability between regions.
Additional comments
Actual emissions vary significantly based on use and maintenance/upkeep. Well-maintained generator sets generally operate more efficiently and emit fewer emissions than systems that are not well-maintained. Fuel usage for both prime and standby gensets are based on performance at manufacturer-specified conditions and ratings. Fuel usages required for startup or for not-well-maintained units are not incorporated into manufactures specs.
Energy efficiency of diesel (compression) engines improves with larger gensets compared to natural gas and LP Gas -powered (spark-ignition) engines.
Energy use is based on well-maintained gensets operating at an elevation below 500 m and at 25°C. Energy use increases about 4% for spark-engine (LP Gas and natural gas) generators operating above 1000 m, and 1% per every 5°C above 40°C. For diesel gensets, energy use increases about 4% for every 300 m above 500 m, and 2% per every 11°C above 25°C (Cummins 2008).
Emissions should be compared for a single genset size/usage in a given region; avoid making comparisons between regions and between standby and prime gensets within a region.
Notes

LP Gas: An Energy Solution for a Low Carbon World 44
Light-duty automobiles Light duty vehicles consist of passenger cars, light-duty trucks, sport utility vehicles (SUV), minivans and pick-up trucks. These vehicles constitute approximately seventy percent of all vehicles in use around the world. While petrol engines power the majority of these vehicles, the demand for vehicles running on fuels such as diesel, biodiesel, ethanol, and autogas has increased. The rising costs of petrol and concerns about global climate change have driven many consumers to consider cheaper clean alternative fuels and automobile manufacturers have begun to introduce flex and alternative fuel vehicles to meet this demand.
Autogas (LP Gas) is an alternative motor fuel consisting of mainly propane and butane. The use of autogas as an automotive fuel varies widely from region to region, based on the cost and availability of the fuel in comparison to other fuels, the availability of LP Gas conversion kits and dedicated LP Gas vehicles, the availability of LP Gas refueling stations, and safety standards. Many governments are utilizing the advantages of autogas fleets to decrease urban pollution and GHG emission
Region Vehicle Platform LP Gas Standards
North America Ford F-150
● US Standard ASTM D1835-97
● HD-5 propylene <5%
● Butane and heavier < 2.5%
● Sulphur <120 ppm
Europe Average of 13 vehicles for LP Gas and petrol;
● EN 589 for automotive LP Gas
● Minimum Octane Number 89
Republic of Korea Kia Carens ● Propane and Propylene < 10%
● Butane and Butylene > 90%
Propane content may increase to 35% in winter months
India Maruti 800 ● <2% heavy hydrocarbons
● Minimum Octane Number 88
Japan Toyota Crown Taxi
● JIS K 2240-2007, class 2
● Propane and Propylene 20%
● Butane and Butylene 80%
Precise propane:butane ratio varies by season and location throughout Japan
1. Vehicle data is based on original manufacturer LP Gas, Petrol, Diesel, and E85 engines. No aftermarket kits were considered.
2. Where not indicated the butane content was assumed to be the maximum allowed depending on the fuel standards in each region.
3. For the calculation of carbon emission factors and energy use, Autogas was assumed to only consist of propane and butane. Other hydrocarbons were not considered.
4. The Republic of Korea was assumed to have the same Autogas standards as Japan.
Key Assumptions

LP Gas: An Energy Solution for a Low Carbon World 45
*Unit of comparison: per 100 km traveled (Note: This data is not intended for cross-regional comparison. Each region’s results should be examined separately due to inherent differences in applications across regions.)
Fuel Energy Use (MJ) Upstream (kg CO2e)
End-Use (kg CO2e)
Total (kg CO2e)
Diesel 22,069 339.1 1,565.9 1905.0
Low Butane LP Gas2
26,535 307.6 1598.7 1906.4
Average Butane LP Gas4
26,535 307.6 1616.6 1924.2
High Butane LP Gas3
26,535 307.6 1627.2 1934.8
Petrol 27,685 493.0 1874.0 2367.0
LP Gas 15,974 199.8 962.5 1162.3
Petrol 19,350 397.6 1310.2 1707.8
LP Gas 34,669 375.4 2079.0 2454.4
Petrol 42,160 639.4 2853.8 3493.2
Diesel 43,532 593.2 3090.1 3683.3
LP Gas 54,631 589.0 3268.5 3857.4
E85 68,969 45.2 4353.6 4398.9
Petrol 54,631 983.9 3698.3 4682.2
LP Gas 29,668 318.9 1779.2 2098.1
Diesel 27,832 386.2 1975.5 2361.7
Petrol 29,953 472.9 2027.9 2500.8
● A high octane fuel such as LP Gas has a lower energy content than a lower octane petrol, resulting in an overall lower power output at the regular compression ratio an engine ran at on petrol. However, with an engine tuned to the use of LP Gas (i.e. via higher compression ratios such as 12:1 instead of 8:1), this lower power output can be overcome.
Notes
Energy End-Use

LP Gas: An Energy Solution for a Low Carbon World 46
Residential space heating Residential space heating utilizes either a centralized system to distribute warm air or hot water throughout the home or individual heating units that heat either a single room or a part of a room. Warm air for a centralized system can be generated by a furnace or electric heat pump. In other centralized systems, a boiler produces hot water that is distributed to each room in a home. Furnaces and boilers can use LP Gas, natural gas, fuel oil or electricity. Unlike an electric furnace, which generates heat by electric resistance, heat pumps use an energy-efficient vapor-compression refrigeration cycle to heat the home.
Single-room heaters are smaller and can operate independently in a home. Single-room heaters that burn LP Gas, natural gas, fuel oil, or wood typically incorporate a “direct vent” design in which room air is heated and re-circulated while combustion gases are exhausted to the outdoors. In developing countries small space heaters using LP Gas or kerosene may not incorporate heat exchangers and all combustion gases are released into the living space. Electric baseboard heaters and space heaters use electric resistance to generate heat.
The amount and type of space heating technologies used in homes vary by region, reflecting differences in home construction, cultural attitudes, fuel availability, climate, and cost. This analysis compares the relative GHG emissions associated with space heating for one year. In general, the technologies analyzed reflect the most efficient commonly used systems in each region.
Market Data
Europe: Europe is a highly diverse region in terms of climate and housing stock. Historically high energy costs and strong government requirements for efficiency and labeling result in the use of highly efficient space heating equipment, especially boilers. Sophisticated wood stoves are used in northern Europe. Many urban homes utilize district heating systems, which are not included in this analysis.
India: Space heating is not common in India and limited to northern areas. Centralized furnaces and boilers are almost unknown. Small electric resistance space heaters are a common heating option. Biomass-fired cook stoves may be kept in use throughout the day to provide space heating.
Japan: Most homes do not have central heat and are maintained at cooler temperatures (15°C) than other regions. Individual room heaters using a direct vent design are highly efficient as required by government standards.
North America: North America features larger and warmer (20°C) homes than in other regions. Warm air systems are dominant, and a large number of manufacturers produce equipment to meet energy-efficiency labeling and efficiency requirements. Older heating systems used plentiful and affordable natural gas and electricity, but recent price increases have boosted consumer interest in more efficient technologies.
Republic of Korea: Rising incomes and government policies have resulted in fuel oil displacing coal and wood as the dominant heating fuels over the past 20 years. Central heating systems using boilers are common.
South America: Heating demands generally are lower than other regions, but some form of home heating is universal. About half of rural homes use wood to cook and heat. Energy policies in the region’s largest country, Brazil, include energy labeling and efficiency requirements, although space heating is not specifically targeted.

LP Gas: An Energy Solution for a Low Carbon World 47
Key Assumptions
Notes 1 Differences in calculating the efficiency of boiler and furnaces by manufacturers makes it difficult to compare systems between regions. For instance, the duration and frequency of equipment cycling is determined by government regulations, which can affect overall performance. 2 Heat pump performance is based on a U.S. government test, which incorporates periodic operation of (less efficient) electric resistance backup heating during extremely cold weather. 3 The efficiencies of central heating systems are diminished by losses in ductwork (15%) and boiler system piping (5%).
1. The analysis uses a typical seasonal space heating requirement that varies by region:
a. Europe: 18,191 MJ based on an average E.U. household in 2005.
b. India and Japan: 3,600 MJ based on 1,000 hours of heating from a typical space heater.
c. North America: 40,095 MJ based an average-sized (U.S.) home in a climate with 4,000-5,499 heating degree days.
d. Korea: 19,200 MJ based on estimated average residential energy use in 1994.
e. South America: 10,551 MJ
2. Technology selection varies by region:
a. Europe: Based on highest boiler efficiencies in practice as identified by E.U. maximum heat pump efficiency data from North America.
b. India: Small space heaters (LP Gas, kerosene, electricity) are not vented to the outdoors and 100% of energy is delivered to the living space. Wood stove efficiency is typical as identified by United Nations data.
c. Japan: Gas and oil heater efficiencies are based on Japanese “Top Runner” standards. Electric space heater is assumed to deliver 100% of energy to the living space.
d. North America: Energy efficiencies based on the highest annual fuel utilization efficiency (AFUE) reported in the GAMA Directory of Certified Efficiency Ratings (GAMA 2006) for gas and fuel oil furnaces with greater than 60,000 Btu-hour ratings. Assumed 100% conversion efficiency of electric heaters and electric furnaces.
e. Korea: Boiler efficiencies are based on the highest efficiencies reported by manufacturers. Maximum heat pump efficiency data from North America. Electric space heater is assumed to deliver 100% of energy to the living space.
f. South America: Boiler efficiencies are based on the highest efficiencies reported by manufacturers. Maximum heat pump efficiency data from North America. Electric space heater is assumed to deliver 100% of energy to the living space. Wood stove efficiency is typical as identified by United Nations data.
3. Centralized heating systems experience distribution losses in the pipes and ductwork that do not occur in single room and portable heaters. These losses are added to the heating demand assumed for the region. In boiler systems the heat losses in the pipes are assumed to be 5%. In furnace systems the heat losses in ductwork are assumed to be 15% in this analysis.

LP Gas: An Energy Solution for a Low Carbon World 48
Energy End-Use Data*
Fuel Energy Use (MJ)
Upstream (kg CO2e)
End Use (kg CO2e)
Total (kg CO2e)
Electricity: High-Efficiency Heat Pump 7,134
743 (W)
1,212 (E) 0
743 (W)
1,212 (E)
Natural Gas: High-Efficiency Boiler 22,063 272 1,128 1,400
LP Gas: High-Efficiency Boiler 22,063 256 1,329 1,585
Fuel Oil: High-Efficiency Boiler 22,063 338 1,520 1,858
Wood: High-Efficiency Stove 26,404 0 3,114 3,114
Wood: High-Efficiency Stove with Biomass Carbon Credit
26,404 - 2,803 3,114 311
LP Gas: Space Heater 4,390 45 217 262
Kerosene: Space Heater 4,390 62 248 310
Electricity: Space Heater 4,390 1,012 0 1,012
Wood: Stove 20,000 0 2,144 2,144
Wood: Stove with Biomass Carbon Credit 20,000 - 2,004 2,144 140
Natural Gas: Direct-Vent Heater 4,390 72 225 297
LP Gas: Direct-Vent Heater 4,390 48 264 312
Kerosene: Direct-Vent Heater 4,311 59 297 356
Electricity: Space Heater 3,600 477 0 477
Electricity: High-Efficiency Heat Pump 16,095 2,567 0 2,567
Natural Gas: High-Efficiency Furnace 49,291 503 2,521 3,023
LP Gas: High-Efficiency Furnace 49,291 531 2,969 3,501
Fuel Oil: Furnace 54,851 903 3,778 4,681
Electricity: Baseboard Heater 40,096 6,396 0 6,396
Electricity: Furnace 47,172 7,524 0 7,524
Electricity: High-Efficiency Heat Pump 7,529 974 0 974
Natural Gas: High-Efficiency Heater 21,755 359 1,113 1,471
LP Gas: High-Efficiency Boiler 21,755 234 1,311 1,544
Fuel Oil: High-Efficiency Boiler 22,456 312 1,547 1,859
Electricity: Space Heater 19,200 2,485 0 2,485
Natural Gas: High-Efficiency Boiler 11,955 144 611 755
LP Gas: High-Efficiency Boiler 11,955 132 720 852
Fuel Oil: High-Efficiency Boiler 12,340 177 850 1,027
Electricity: Space Heater 10,551 1,230 0 1,230
Wood: Stove 58,614 0 6,283 6,283
Wood: Stove with Biomass Carbon Credit 58,614 - 5,873 6,283 408 *Unit of comparison: Energy consumption for one heating season (varies by region) (Note: This data is not intended for cross-regional comparison. Each region’s results should be examined separately due to inherent differences in applications across regions)

LP Gas: An Energy Solution for a Low Carbon World 49
Residential water heating
While there is substantial regional variation in both water heating technologies and their application, all regions tend to rely on central and/or point-of-use systems for their water heating needs. Central residential water heating heats all of a household’s water from one source, while point-of-use heaters are used to heat water for independent needs like dishwashing, hand washing, and showering. A wide variety of technologies are used in each region for these two types of water heating, including:
● Storage tank – Maintains a readily available reservoir of hot water ● Instantaneous (“tankless” or “demand”) – Heats water as it is supplied to the end-
user ● Combination or “combi” boilers – Water is heated by a space heating boiler system ● Solar thermal – Fluid absorbs solar energy in a collector; common designs use electricity to circulate
fluid and connect the system to a conventional heater for cloudy days ● Electric heat pump (Japan) – Use electricity to move heat rather than directly generating heat
There are many design features that impact energy consumption of a water heater. For example, the ignition mechanism of gas water heaters can impact the energy use of small units, while instantaneous water heaters with electronic temperature control have an efficiency advantage over heaters that control temperature hydraulically.
MARKET DATA
While gas and electricity are popular fuels for water heating in every region, the use of fuel oil for water heating is significant in North America and Japan. Solar water heaters have a substantial market share in India and South America, where abundant solar energy makes this technology cost-effective, but are also gaining significant market share Europe and Japan. Electric heat pumps water heaters are rare in most regions, but are being aggressively subsidized in Japan.
Europe ● gas-fired combination boilers ● electric storage heaters
● instantaneous heaters (gas or electric) ● small electric storage heaters
India ● solar thermal systems ● electric storage heaters
● instantaneous heaters (gas or electric) ● small electric storage heaters
Japan ● large dedicated instantaneous gas heaters
● bathtub heaters (common household appliance
North America ● dedicated gas-fired storage heaters Republic of Korea ● instantaneous (gas or electric)
● solar thermal
South America ● solar thermal ● electric storage heaters
● instantaneous water heaters (gas or electric)
● small electric storage heaters
1. Water heating performance in North America is based on government-mandated minimum energyperformance standards in the United States.
2. Water heating performance in Europe and Japan is based on the estimated energy efficiency of theexisting stock of water heaters. 1, 2
3. Water heating technologies in Korea were assumed to have the same performance of Japanese waterheaters.
4. Solar water heaters were assumed to employ backup water heating for 15% of the hot water load in Indiaand South America, and 40% in Europe, Japan, and Korea.
5. LP Gas water heaters was assumed to be 3% more efficient than natural gas water heaters. 3
KEY ASSUMPTIONS
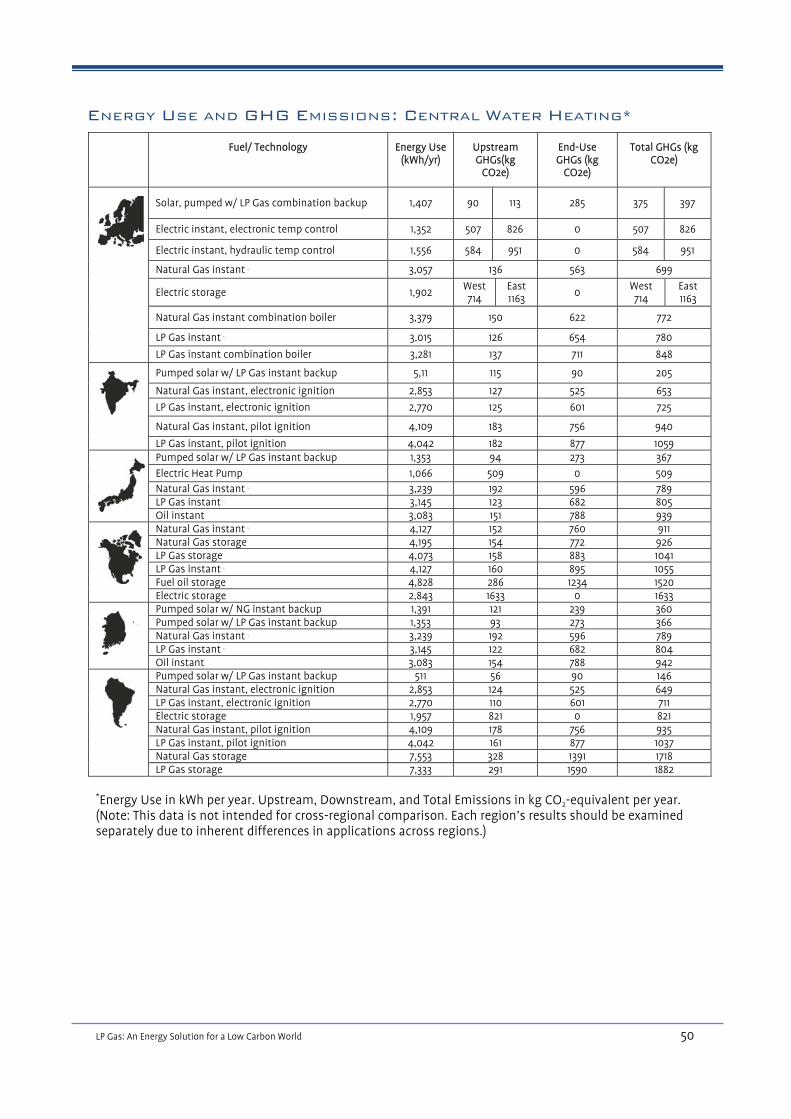
LP Gas: An Energy Solution for a Low Carbon World 50
*Energy Use in kWh per year. Upstream, Downstream, and Total Emissions in kg CO2-equivalent per year. (Note: This data is not intended for cross-regional comparison. Each region’s results should be examined separately due to inherent differences in applications across regions.)
Fuel/ Technology Energy Use (kWh/yr)
Upstream GHGs(kg
CO2e)
End-Use GHGs (kg
CO2e)
Total GHGs (kg CO2e)
Solar, pumped w/ LP Gas combination backup 1,407 90 113 285 375 397
Electric instant, electronic temp control 1,352 507 826 0 507 826
Electric instant, hydraulic temp control 1,556 584 951 0 584 951
Natural Gas instant 5 3,057 136 563 699
Electric storage 1,902 West 714
East 1163
0 West 714
East 1163
Natural Gas instant combination boiler 3,379 150 622 772
LP Gas instant 5 3,015 126 654 780
LP Gas instant combination boiler 3,281 137 711 848
Pumped solar w/ LP Gas instant backup 5,11 115 90 205
Natural Gas instant, electronic ignition 2,853 127 525 653
LP Gas instant, electronic ignition 2,770 125 601 725
Natural Gas instant, pilot ignition 4,109 183 756 940
LP Gas instant, pilot ignition 4,042 182 877 1059
Pumped solar w/ LP Gas instant backup 1,353 94 273 367
Electric Heat Pump 1,066 509 0 509 Natural Gas instant 5 3,239 192 596 789 LP Gas instant 5 3,145 123 682 805 Oil instant 3,083 151 788 939
Natural Gas instant 5 4,127 152 760 911 Natural Gas storage 4,195 154 772 926 LP Gas storage 4,073 158 883 1041 LP Gas instant 5 4,127 160 895 1055 Fuel oil storage 4,828 286 1234 1520 Electric storage 2,843 1633 0 1633
Pumped solar w/ NG instant backup 1,391 121 239 360 Pumped solar w/ LP Gas instant backup 1,353 93 273 366 Natural Gas instant 5 3,239 192 596 789 LP Gas instant 5 3,145 122 682 804 Oil instant 3,083 154 788 942
Pumped solar w/ LP Gas instant backup 511 56 90 146 Natural Gas instant, electronic ignition 2,853 124 525 649 LP Gas instant, electronic ignition 2,770 110 601 711 Electric storage 1,957 821 0 821 Natural Gas instant, pilot ignition 4,109 178 756 935 LP Gas instant, pilot ignition 4,042 161 877 1037 Natural Gas storage 7,553 328 1391 1718 LP Gas storage 7,333 291 1590 1882
ENERGY USE AND GHG EMISSIONS: CENTRAL WATER HEATING*

LP Gas: An Energy Solution for a Low Carbon World 51
Fuel/ Technology Energy Use (kWh/yr)
Upstream GHGs (kg CO2e)
End-Use GHGs (kg CO2e)
Total GHGs (kg CO2e)
Electric instant, electronic temp control 542 203 332 0 203 332
Electric instant, hydraulic temp control 615 231 376 0 231 376
Natural Gas instant, electronic ignition 1,281 57 236 293
LP Gas instant, electronic ignition 1,243 52 270 322
Electric storage 878 West 329
East 537
0 West 329
East 537
Natural Gas instant, electronic ignition 900 40 166 206
LP Gas instant, electronic ignition 873 39 189 229
Electric instant, electronic temp control 434 439 0 439
Electric instant, hydraulic temp control 492 497 0 497
Electric storage 702 711 0 711
Natural Gas instant bathtub heater 1,712 58 315 373
LP Gas instant bathtub heater 1,662 78 360 439
Oil instant bathtub heater 1,945 127 497 624
Electric instant, electronic temp control 434 182 0 182
Natural Gas instant, electronic ignition 900 39 166 205
Electric instant, hydraulic temp control 492 206 0 206
LP Gas instant, electronic ignition 873 35 189 224
Electric storage 641 269 0 269 *Energy Use in kWh per year. Upstream, Downstream, and Total Emissions in kg CO2-equivalent per year. (Note: This data is not intended for cross-regional comparison. Each region’s results should be examined separately due to inherent differences in applications across regions.)
ENERGY USE AND GHG EMISSIONS: POINT-OF-USE WATER HEATING*
1 Average system efficiency of European water heaters (also applied to Indian and South American heaters) is based on analysis contained in VHK 2007. 2 Japan’s voluntary Top Runner program bases efficiency targets on a percent improvement from estimated efficiency of existing stock in 2000. 3 A survey of manufacturer specifications indicates that LP Gas water heaters are on average 3-5% more efficient than natural gas water heaters. The lower end of the range is assumed as a conservative estimate and is applied to reported efficiencies for gas water heaters. 4 Demand assumptions for central water heating: North America, Japan, and Korea – 2560 kWh per year of useful heating per household. Europe – 1280 kWh per year. India and South America – 1160 kWh per year. 5 Average of pilot and electronic ignition shown for Europe due to small (<2%) difference in results. Non-specificity of ignition type in data for other regions. India and South America have larger differences between results since smaller units can be used for the same flow rate (due to a lower ∆T). 6 Demand assumptions for point-of-use water heating: Europe – 460 kWh per year of useful heating per household. India and South America – 400 kWh per year. Japan (bathtub heating) – 1280 kWh per year.
NOTES
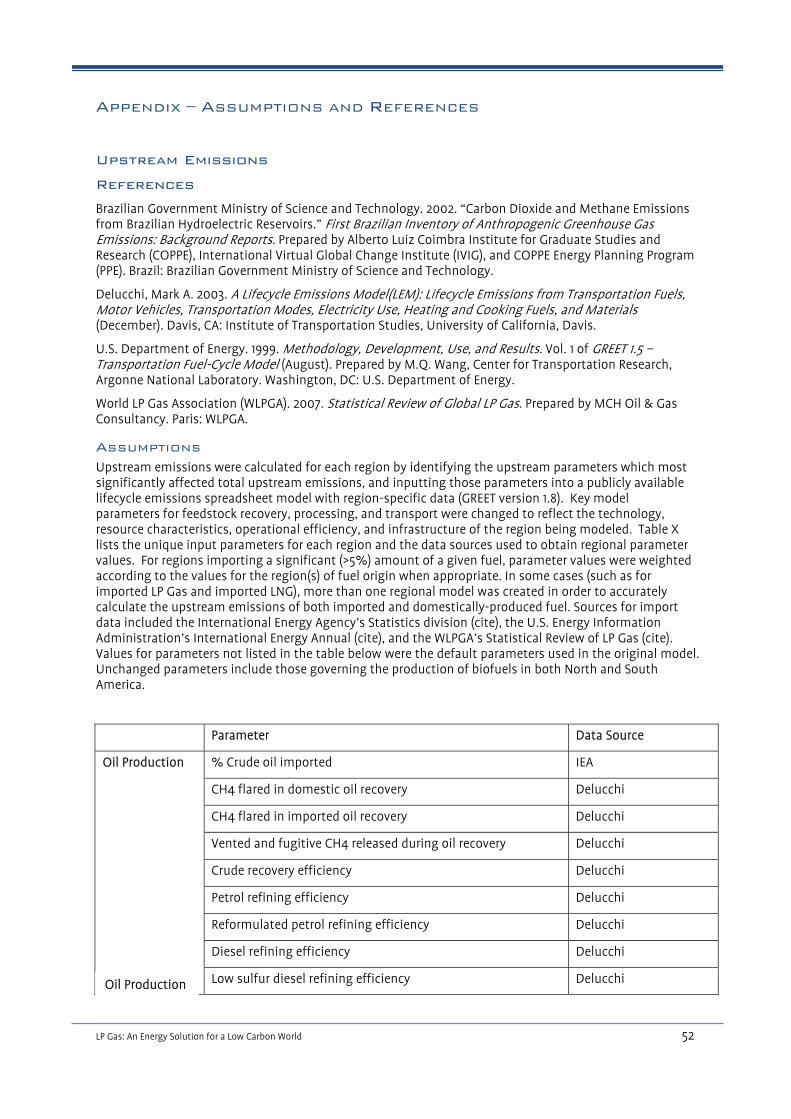
LP Gas: An Energy Solution for a Low Carbon World 52
APPENDIX – ASSUMPTIONS AND REFERENCES
Upstream Emissions
References
Brazilian Government Ministry of Science and Technology. 2002. “Carbon Dioxide and Methane Emissions from Brazilian Hydroelectric Reservoirs.” First Brazilian Inventory of Anthropogenic Greenhouse Gas Emissions: Background Reports. Prepared by Alberto Luiz Coimbra Institute for Graduate Studies and Research (COPPE), International Virtual Global Change Institute (IVIG), and COPPE Energy Planning Program (PPE). Brazil: Brazilian Government Ministry of Science and Technology.
Delucchi, Mark A. 2003. A Lifecycle Emissions Model(LEM): Lifecycle Emissions from Transportation Fuels, Motor Vehicles, Transportation Modes, Electricity Use, Heating and Cooking Fuels, and Materials (December). Davis, CA: Institute of Transportation Studies, University of California, Davis.
U.S. Department of Energy. 1999. Methodology, Development, Use, and Results. Vol. 1 of GREET 1.5 – Transportation Fuel-Cycle Model (August). Prepared by M.Q. Wang, Center for Transportation Research, Argonne National Laboratory. Washington, DC: U.S. Department of Energy.
World LP Gas Association (WLPGA). 2007. Statistical Review of Global LP Gas. Prepared by MCH Oil & Gas Consultancy. Paris: WLPGA.
ASSUMPTIONS Upstream emissions were calculated for each region by identifying the upstream parameters which most significantly affected total upstream emissions, and inputting those parameters into a publicly available lifecycle emissions spreadsheet model with region-specific data (GREET version 1.8). Key model parameters for feedstock recovery, processing, and transport were changed to reflect the technology, resource characteristics, operational efficiency, and infrastructure of the region being modeled. Table X lists the unique input parameters for each region and the data sources used to obtain regional parameter values. For regions importing a significant (>5%) amount of a given fuel, parameter values were weighted according to the values for the region(s) of fuel origin when appropriate. In some cases (such as for imported LP Gas and imported LNG), more than one regional model was created in order to accurately calculate the upstream emissions of both imported and domestically-produced fuel. Sources for import data included the International Energy Agency’s Statistics division (cite), the U.S. Energy Information Administration’s International Energy Annual (cite), and the WLPGA’s Statistical Review of LP Gas (cite). Values for parameters not listed in the table below were the default parameters used in the original model. Unchanged parameters include those governing the production of biofuels in both North and South America.
Parameter Data Source
Oil Production % Crude oil imported IEA
CH4 flared in domestic oil recovery Delucchi
CH4 flared in imported oil recovery Delucchi
Vented and fugitive CH4 released during oil recovery Delucchi
Crude recovery efficiency Delucchi
Petrol refining efficiency Delucchi
Reformulated petrol refining efficiency Delucchi
Diesel refining efficiency Delucchi
Low sulfur diesel refining efficiency Delucchi Oil Production
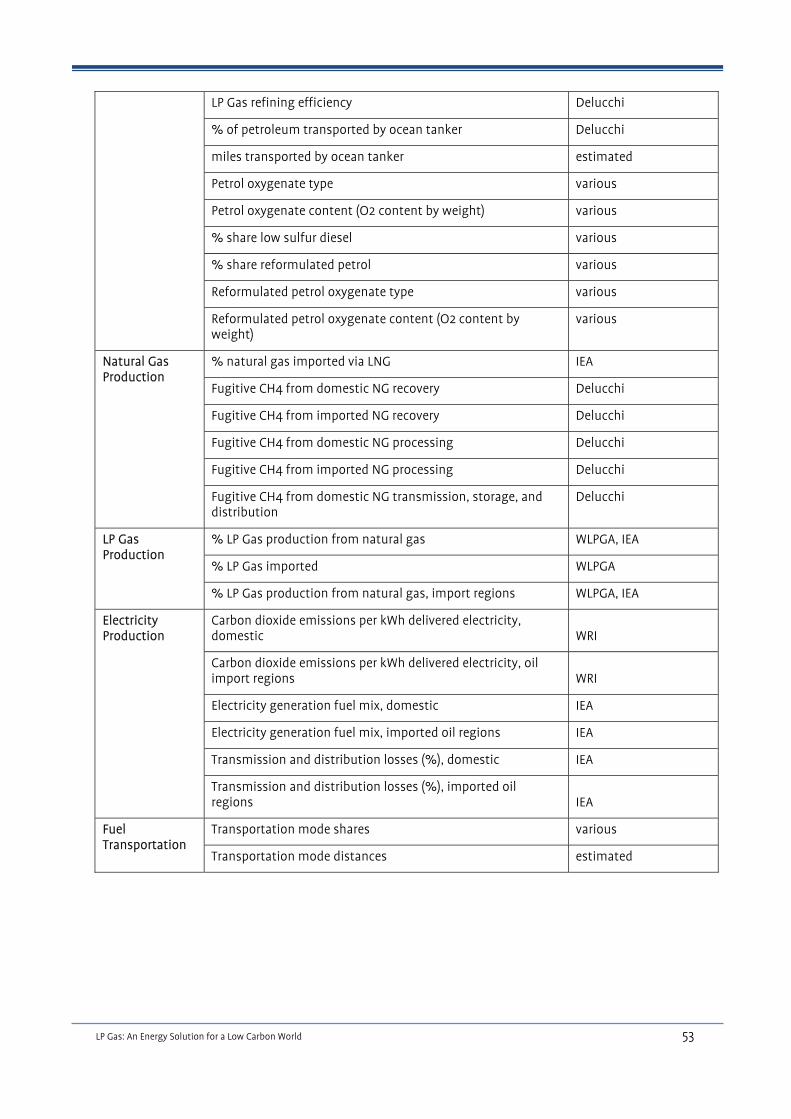
LP Gas: An Energy Solution for a Low Carbon World 53
LP Gas refining efficiency Delucchi
% of petroleum transported by ocean tanker Delucchi
miles transported by ocean tanker estimated
Petrol oxygenate type various
Petrol oxygenate content (O2 content by weight) various
% share low sulfur diesel various
% share reformulated petrol various
Reformulated petrol oxygenate type various
Reformulated petrol oxygenate content (O2 content by weight)
various
Natural Gas Production
% natural gas imported via LNG IEA
Fugitive CH4 from domestic NG recovery Delucchi
Fugitive CH4 from imported NG recovery Delucchi
Fugitive CH4 from domestic NG processing Delucchi
Fugitive CH4 from imported NG processing Delucchi
Fugitive CH4 from domestic NG transmission, storage, and distribution
Delucchi
LP Gas Production
% LP Gas production from natural gas WLPGA, IEA
% LP Gas imported WLPGA
% LP Gas production from natural gas, import regions WLPGA, IEA
Electricity Production
Carbon dioxide emissions per kWh delivered electricity, domestic WRI
Carbon dioxide emissions per kWh delivered electricity, oil import regions WRI
Electricity generation fuel mix, domestic IEA
Electricity generation fuel mix, imported oil regions IEA
Transmission and distribution losses (%), domestic IEA
Transmission and distribution losses (%), imported oil regions IEA
Fuel Transportation
Transportation mode shares various
Transportation mode distances estimated

LP Gas: An Energy Solution for a Low Carbon World 54
COOKING
REFERENCES
Carniero de Miranda, R. 1998. “Forest replacement schemes in Latin America: An effective model to achieve sustainability of supply for industrial fuelwood consumers.” Unasylva 192. Rome: Food and Agriculture Organization (FAO) of the United Nations. http://www.fao.org/docrep/w7126e/w7126e0a.htm (accessed May 2008).
Electronic Code of Federal Regulations (e-CFR). 2008. Appendix I to Subpart B of Part 430—Uniform Test Method for Measuring the Energy Consumption of Conventional Ranges, Conventional Cooking Tops, Conventional Ovens, and Microwave Ovens (May 7). Washington, DC: U.S. Government Printing Office (GPO). http://ecfr.gpoaccess.gov/cgi/t/text/text-idx?c=ecfr;sid=76a0c2194d8b367d90c6fd26fe702502;rgn=div5;view=text;node=10%3A3.0.1.4.16;idno=10;cc=ecfr#10:3.0.1.4.16.2.9.7.9 (accessed May 2008).
Energy Information Administration. 2007. Emissions of Greenhouse Gas Report (November): Appendix H of the instructions to Form EIA-1605. DOE/EIA-0573(2006). http://www.eia.doe.gov/oiaf/1605/excel/Fuel%20EFs_2.xls (accessed May 2008).
European Commission Institute for Environment and Sustainability. 2007. Electricity Consumption and Efficiency Trends in the Enlarged European Union: Status report 2006. Prepared by Paolo Bertoldi and Bogdan Atanasiu. Italy: European Communities.
Intergovernmental Panel on Climate Change (IPCC). 2006. Energy. Vol. 2 of 2006 IPCC Guidelines for National Greenhouse Gas Inventories. Prepared by the National Greenhouse Gas Inventories Programme, ed. Eggleston H.S., Buenida L., Miwa K., Ngara T., and Tanabe K. Japan: IPCC. http://www.ipcc-nggip.iges.or.jp/public/2006gl/index.html (accessed May 2008).
Intergovernmental Panel on Climate Change (IPCC). 1996. Technologies, Policies and Measures for Mitigating Climate Change. Ed. Robert T. Watson, Maraufu C. Zinyowera, and Richard H. Moss. IPCC.
International Energy Agency (IEA). 2006. World Energy Outlook 2006. Paris: Organisation for Economic Co-operation and Development (OECD)/IEA.
International Energy Initiative (IEI). 2004. Report on the use of LPG as a domestic cooking fuel option in India (June). Prepared by Antonette D’Sa and K.V. Narasimha Murthy. Bangalore: IEI.
Lebot, Benoit, Alan Meier and Alain Anglade. 2000. “Global Implications of Standby Power Use.” Proceedings of ACEEE Summer Study on Energy Efficiency in Buildings. Asilomar: American Council for An Energy Efficient Economy. Also published as Lawrence Berkley National Laboratory Report LBNL-26019 (June 2000).
Ramakrishna, K., L. Jacobsen, R. Thomas, E. Woglom, and G. Zubkova. 2003. “Country Case Study: India.” Action Versus Words: Implementation of the UNFCCC by Select Developing Countries (February). Woods Hole, MA: The Woods Hole Research Center.
Roggema, Paul. 2006. “Energy Saving in Gas Cooking.” Appliance Magazine (June). http://www.appliancemagazine.com/editorial.php?article=1431&zone=208&first=1 (accessed May 2008).
Smith, Kirk R., R. Uma, V.V.N. Kishore, Junfeng Zhang, V. Joshi, M.A.K. Khalil. 2000. “Greenhouse Implications of Household Stoves: An Analysis for India.” Annual Review of Energy and the Environment, no. 25 (November): 741-763.
United Nations Department of Economic and Social Affairs. 1999. Trends in Consumption and Production: Household Energy Consumption (April). Prepared by Oleg Dziuobinski and Ralph Chipman. A Discussion Paper of the United Nations Department and Social Affairs, New York.
United States Agency International Development (USAID). 1997. Fuel Efficient Stove Programs in IDP Settings – Summary Evaluation Report, Uganda (September). Prepared by the Academy for Educational Development (AED). Washington, DC: AED.
U.S. Department of Energy Office of Codes and Standards. 1996. Potential Impact of Alternative Efficiency Levels for Residential Cooking Products. Vol. 2 of Technical Support Document for Residential Cooking Products. Prepared by Lawrence Berkley National Laboratory. Berkley, CA: Lawrence Berkley National Laboratory.

LP Gas: An Energy Solution for a Low Carbon World 55
U.S. Environmental Protection Agency (EPA) Office of Air and Radiation. 2000. Greenhouse Gases from Small-Scale Combustion Devices in Developing Countries: Phase IIA – Household Stoves in India (June). Prepared by National Risk Management Research Laboratory. Washington, DC: EPA. EPA/600/R-00/052.
World LP Gas Association (WLPGA). 2005. Household Fuels and Ill-Health in Developing Countries: What improvements can be brought by LP Gas? Prepared by Kirk R. Smith, Jamesine Rogers, and Shannon C. Cowlin of the University of California, Berkley. Paris: WLPGA.
DISTRIBUTED GENERATION
REFERENCES
Armstrong Power Systems. 2006. “Wide range of electric generators available.” Gas product list. http://www.armstrongpower.com/products/gas.htm (accessed May 2008).
Armstrong Power Systems. 2006. “Wide range of electric generators available.” Diesel product list. http://www.armstrongpower.com/products/power.htm (accessed May 2008).
Baldor. “Industrial Diesel Liquid Cooled Generators (IDLC) – Standby/Prime Power. http://www.baldor.com/products/generators/idlc.asp (accessed May 2008).
Baldor. “Industrial Gaseous Standby/Prime Power Generators (IGLC) – Industrial Gaseous Liquid Cooled.” http://www.baldor.com/products/generators/iglc.asp (accessed May 2008).
Caterpillar. “Spec Sheets: CAT Gensets Powered by CAT engines, Olympian Gensets Available from your CAT Dealer.” http://www.cat.com/cda/layout?m=39280&x=7 (accessed May 2008).
Cummins Power Generation. “Generator Sets: Spark-ignited Gas Generator Sets.” http://cumminspower.com/na/products/generators/sparkignited#results (accessed May 2008).
FG Wilson. “10 to 30 kVA.“ Gas generator set models. http://www.fgwilson.com/cda/layout?m=147961&x=7 (accessed May 2008).
Generac Power Systems, Inc. “Home Standby Air-Cooled Spec Sheets.” http://www.generac.com/Products/Residential/AirCooled/SpecSheets.aspx (accessed May 2008).
Intergovernmental Panel on Climate Change (IPCC). 2006. Energy. Vol. 2 of 2006 IPCC Guidelines for National Greenhouse Gas Inventories. Prepared by the National Greenhouse Gas Inventories Programme, ed. Eggleston H.S., Buenida L., Miwa K., Ngara T., and Tanabe K. Japan: IPCC. http://www.ipcc-nggip.iges.or.jp/public/2006gl/index.html (accessed May 2008).
Kohler Power. “Residential Power: All Residential Generators.” Product list. http://www.kohlerpower.com/residential/filterresults.htm?categoryNumber=13061§ionNumber=13561 (accessed May 2008).
Kohler Power. “Industrial Power: All Gas Generators.” Product list. http://www.kohlerpower.com/industrial/filterresults.htm?categoryNumber=12061§ionNumber=13261 (accessed May 2008)
Lareya, Nathan. 2008. “Gen-sets: A Transition from Industrial to Commercial Use?” (April 4). Frost & Sullivan Market Insight. http://www.frost.com/prod/servlet/market-insight-print.pag?docid=126684096 (accessed May 2008).
McNeely, Mark. 2007. “31st Power Generation Order Survey.” Diesel & Gas Turbine Worldwide (October). http://www.dieselgasturbine.com/pdf/power_2007.pdf (accessed May 2008).
Power Systems Research. 2005. PowerTracker Dealer/Distributor Survey (November 23). http://www.powersys.com/pdf/DealerSampleReport.pdf (accessed May 2008).

LP Gas: An Energy Solution for a Low Carbon World 56
ASSUMPTIONS 1. Energy use is based on manufacturer specifications (specs) for power-only (no CHP) gensets operating
at 1800 rpm for 60 Hz output and at 1500 rpm for 50 Hz output and 100% nameplate load.
2. Manufacturer specs used to calculate energy use is based on over 150 commercially available units that contained adequate data and were available in regions of interest. A full list of manufactures and models analyzed is provided in the table below.
3. Different manufacturers provide different energy use requirements for generator set ratings.
Statistical log-linear regression of genset data of a given power frequency and size were used to estimate energy end use.
4. Gensets fuel usage for North America, South America, and Korea are based on 60 Hz power. Europe, India, and Japan are based on 50 Hz power.
Make Model kW Fuel Hz Prime/Stby Make Model kW Fuel Hz Prime/StbyCaterpillar GEP13.5-2 10 Diesel 50 Prime Olympian GEP65-2 52 Diesel 50 StandbyCaterpillar GEP13.5-2 11 Diesel 50 Standby Cummins GGHF 55 Nat gas 50 StandbyOlympian G12U3 11 LPG 60 Prime Generac QT055 55 LPG 60 StandbyOlympian G12U3 11 Nat Gas 60 Prime Generac QT055 55 Nat gas 60 StandbyOlympian GEUG16-1 11.5 Nat Gas 50 Prime Cummins DGCB 56 Diesel 50 StandbyCaterpillar D13-2 12 Diesel 60 Prime Cummins C80 D5 58 Diesel 50 PrimeCaterpillar GEP13.5-2 12 Diesel 60 Prime Armstrong AGM60Si 60 Nat gas 60 StandbyOlympian G12U3 12 LPG 60 Standby Cummins DGCB 60 Diesel 60 StandbyOlympian G12U3 12 Nat gas 60 Standby Cummins GGHE 60 Nat gas 60 StandbyOlympian GEUG16-1 12.8 LPG 50 Prime Cummins GGHF 60 LPG 60 StandbyCaterpillar D13-2 13 Diesel 60 Standby Cummins GGHF 60 Nat gas 60 StandbyCaterpillar GEP13.5-2 13 Diesel 60 Standby Cummins GGHF 60 LPG 50 StandbyOlympian GEUG16-1 13.7 Nat gas 50 Standby Generac SD060 60 Diesel 60 StandbyOlympian GEUG16-1 15 Nat gas 60 Standby Generac SD060 60 Diesel 50 StandbyOlympian GEUG16-1 15 LPG 50 Standby Kohler 60REOZJC 60 Diesel 60 StandbyOlympian GEUG16-1 15.8 LPG 60 Prime Kohler 60RES 60 Nat gas 60 StandbyOlympian GEUG16-1 15.8 Nat Gas 60 Prime Olympian D60-4 60 Diesel 60 StandbyOlympian GEUG16-1 16 LPG 60 Standby Kohler 80RES 60 Nat Gas 50 PrimeCummins C30 D6 24 Diesel 50 Prime Armstrong AGM60Si 62 LPG 60 StandbyCummins C33 D5 24 Diesel 50 Prime Kohler 80REOZJC 62 Diesel 50 PrimeCummins GGFE 25 Nat Gas 50 Prime Kohler 60RES 63 LPG 60 StandbyCummins GGMC 25 Nat Gas 50 Prime Olympian G80-F3 63.5 Nat Gas 60 PrimeKohler 30REOZJB 26 Diesel 50 Standby Cummins C80 D5 64 Diesel 50 StandbyKohler 30RZG (alt. 4P5W) 26 LPG 50 Standby Kohler 80RES 64 LPG 50 PrimeKohler 30RZG (alt. 4P5W) 26 Nat gas 50 Standby Kohler 80RES (alt. 4S7W) 66 Nat gas 50 StandbyCummins GGMC 26 LPG 60 Prime Olympian G80-F3 68 LPG 60 PrimeCummins GGMC 26 Nat Gas 60 Prime Kohler 80REOZJC 70 Diesel 50 StandbyKohler 30REOZJB 26 Diesel 50 Prime Kohler 80RES (alt. 4S7W) 70 LPG 50 StandbyKohler 30RZG 26 LPG 50 Prime Armstrong A80PE 72 Diesel 60 PrimeKohler 30RZG 26 Nat Gas 50 Prime Caterpillar D80-6 72 Diesel 60 PrimeCummins C30 D5 26.4 Diesel 50 Standby Kohler 80REOZJC 72 Diesel 60 PrimeArmstrong AGM30Si 27 Nat Gas 60 Prime Kohler 80RES 72 LPG 60 PrimeArmstrong A30PE 27 Diesel 60 Prime Kohler 80RES 72 Nat Gas 60 PrimeCaterpillar D30-8 27 Diesel 60 Prime Armstrong AGM80Si 73 LPG 60 PrimeCummins C30 D6 27 Diesel 60 Prime Armstrong AGM80Si 73 Nat Gas 60 PrimeOlympian G30F3 27 LPG 60 Prime Baldor IGLC150N/L-CB 73 Nat Gas 50 PrimeOlympian G30F3 27 Nat Gas 60 Prime Kohler 100RZG 73 Nat Gas 50 PrimeArmstrong AGM30Si 29 LPG 60 Prime Olympian G80F3 75 Nat gas 60 StandbyCummins GGMC 29 Nat gas 60 Standby Armstrong A80PE 80 Diesel 60 StandbyArmstrong AGM30Si 30 Nat gas 60 Standby Armstrong AGM80Si 80 LPG 60 StandbyCaterpillar D30-8 30 Diesel 60 Standby Armstrong AGM80Si 80 Nat gas 60 StandbyCummins C30 D5 30 Diesel 60 Standby Baldor IDLC150-3J 80 Diesel 50 PrimeCummins GGFE 30 Nat gas 50 Standby Baldor IGLC150N/L-CB 80 LPG 50 PrimeCummins GGMC 30 LPG 60 Standby Caterpillar D80-6 80 Diesel 60 StandbyCummins GGMC 30 LPG 60 Standby Cummins C80 D5 80 Diesel 60 StandbyOlympian G30F3 30 LPG 60 Standby Kohler 100 RZG (alt. 4S13W 80 Nat gas 50 StandbyOlympian G30F3 30 Nat gas 60 Standby Kohler 100REOZJC 80 Diesel 50 PrimeCummins DGGD 30 Diesel 60 Prime Kohler 100RZG 80 LPG 50 PrimeCummins GGFE 30 LPG 50 Prime Kohler 80REOZJC 80 Diesel 60 StandbyCummins GGMC 30 LPG 50 Prime Kohler 80RES (alt. 4S7W) 80 LPG 60 StandbyArmstrong AGM30Si 32 LPG 60 Standby Kohler 80RES (alt. 4S7W) 80 Nat gas 60 StandbyKohler 30REOZJB 33 Diesel 60 Prime Olympian G80F3 80 LPG 60 StandbyKohler 30RZG 33 LPG 60 Prime FG Wilson P100P2 80.4 Diesel 50 PrimeKohler 30RZG 33 Nat Gas 60 Prime Armstrong AGM100Si 81 Nat Gas 60 PrimeKohler 45RES 33 Nat gas 50 Standby FG Wilson P110E2 88 Diesel 50 StandbyCummins DGGD 35 Diesel 60 Standby Kohler 100 RZG (alt. 4S13W 88 LPG 50 StandbyCummins GGFE 35 LPG 50 Standby Kohler 100REOZJC (alt. 4S1 88 Diesel 50 StandbyKohler 30REOZJB 35 Diesel 60 Standby Armstrong A100PE 89 Diesel 60 PrimeKohler 30RZG (alt. 4P5W) 35 Nat gas 60 Standby Kohler 100REOZJC 90 Diesel 60 PrimeKohler 40REOZJB 35 Diesel 50 Standby Armstrong AGM100Si 91 LPG 60 PrimeOlympian GEP44-2 35.2 Diesel 50 Standby Armstrong AGM100Si 91 Nat gas 60 StandbyKohler 45RES 36 LPG 50 Standby Kohler 100RZG 91 LPG 60 PrimeArmstrong AGM45Si 40 Nat gas 60 Standby Kohler 100RZG 91 Nat Gas 60 PrimeCummins DGBC 40 Diesel 60 Standby Armstrong AGM100Si 100 LPG 60 StandbyGenerac SD040 40 Diesel 60 Standby Baldor IGLC150N/L-CB 100 LPG 50 PrimeGenerac SD040 40 Diesel 50 Standby Kohler 100 RZG (alt. 4S13W 100 LPG 60 StandbyKohler 40REOZJB 40 Diesel 60 Standby Kohler 100 RZG (alt. 4S13W 100 Nat gas 60 StandbyOlympian D40-4 40 Diesel 60 Standby Kohler 100REOZJC (alt. 4S1 100 Diesel 60 StandbyOlympian GEP44-2 40 Diesel 60 Standby Kohler 150RZGB (alt. 4S13) 125 Nat gas 50 StandbyKohler 45RES 41 Nat gas 60 Standby Baldor IGLC150N/L-CB 125 LPG 60 PrimeCummins GGFE 42 Nat gas 60 Standby Kohler 150REOZJC (alt. 4S1 132 Diesel 50 StandbyCummins C55 D5 44 Diesel 50 Standby Baldor IGLC150N/L-CB 135 Nat Gas 60 PrimeArmstrong A45PE 45 Diesel 60 Standby Baldor IDLC150-3J 140 Diesel 60 PrimeArmstrong AGM45Si 45 LPG 60 Standby Baldor IDLC150-3J 140 Diesel 50 PrimeGenerac QT045 45 LPG 60 Standby Cummins C200 D5S 148 Diesel 50 PrimeGenerac QT045 45 Nat gas 60 Standby Baldor IDLC150-3J (alt. UCI 150 Diesel 60 StandbyKohler 60REOZJC 45 Diesel 50 Standby Baldor IGLC215N/L-CB 150 LPG 50 PrimeKohler 45RES 46 LPG 60 Standby Baldor IGLC215N/L-CB 150 Nat Gas 50 PrimeCummins GGFE 47 LPG 60 Standby Kohler 150REOZJC (alt. 4S1 150 Diesel 60 StandbyKohler 60RES 49 Nat gas 50 Standby Kohler 150RZGB (alt. 4S13) 150 Nat gas 60 StandbyKohler 60RES 51 LPG 50 Standby
LP Gas: An Energy Solution for a Low Carbon World 57
5. CO2-equivalent emissions factors are based on default values reported by IPCC for stationary combustion in residential sector applications applicable throughout the world. Emissions factors include CO2, CH4, and N2O emissions assuming complete oxidation of the carbon contained in the fuel (carbon oxidation factor equal to 1). Emission factors assume steady and optimal conditions and do not account for start-ups, shut downs or combustion with partial loads (IPCC 2006). Emission factors for CH4 and N2O are based on IPCC expert judgment and uncertainty ranges are set at +/- factor of 3. Post-combustion emissions of CH4 and N2O are less than 1% of the total emissions (on a carbon-equivalent basis) for natural gas, LP Gas, and diesel in stationary combustion applications.
6. Actual emissions vary significantly based on fuel type, combustion technology, operating conditions, control technology, quality of maintenance, and age of combustion equipment. Fuel usage in this study is based on performance at manufacturer-specified conditions and ratings.
7. Energy use is based on gensets operating at an elevation below 500 m and at 25°C (LP Gas vaporizers are not necessary). Energy use increases about 4% for spark-engine (LP Gas and natural gas) generators operating above 1000 m, and 1% per every 5°C above 40°C. For diesel gensets, energy use increases about 4% for every 300 m above 500 m, and 2% per every 11°C above 25°C (Cummins 2008).
8. Upstream emissions are based on region-specific factors applied to the Greenhouse Gases, Regulated Emissions, and Energy Use in Transportation model (GREET 2007).
LIGHT-DUTY VEHICLES
REFERENCES
Car Directory. “2000 Toyota Crown: Modification Royal saloon Four U package specs.” http://www.cars-directory.net/specs/toyota/crown/2000_8/3212/ (accessed May 2008).
Channel 4. 2003. “Top Ten Used Cars.” http://www.channel4.com/4car/ft/null/null/1709/ (accessed June 2008).
Ciao! Shopping Intelligence. 2008. “Citroen Xantia 1.9 TD Review.” http://www.ciao.co.uk/Citroen_Xantia_1_9_TD__Review_63948 (accessed June 2008).
IndianOil. 2008. “Auto LPG.” (May 1). http://www.iocl.com/Products/AutoGas.aspx (accessed May 2008).
Intergovernmental Panel on Climate Change (IPCC). 2006. Energy. Vol. 2 of 2006 IPCC Guidelines for National Greenhouse Gas Inventories. Prepared by the National Greenhouse Gas Inventories Programme, ed. Eggleston H.S., Buenida L., Miwa K., Ngara T., and Tanabe K. Japan: IPCC. http://www.ipcc-nggip.iges.or.jp/public/2006gl/index.html (accessed May 2008).
International Energy Agency. 2004. Energy Statistics Manual. Paris: Organisation for Economic Co-operation and Development (OECD)/IEA.
International Energy Agency. 2001. Saving Oil and Reducing CO2 Emissions in Trasnport: Options & Srategies. Paris: Organisation for Economic Co-operation and Development (OECD)/IEA.
KIA Motors (UK) Limited. “Carens Specification.”
Nakahara, Yasuo. 2001. LPG Vehicle: Introducing LPG Vehicle which is ecological and complies with variety of resources PowerPoint presentation (January 10). Toyota Motor Corporation.
Republic of Korea Ministry of Environment. 2005. CNG Vehicle Programme (July 5). PowerPoint presentation. Republic of Korea.
Research and Library Services Division Legislative Council Secretariat. 1997. A Study on LPG as a Fuel for Vehicles (March). Prepared by Eva Liu, S.Y. Yue, and Joseph Lee. Hong Kong: Research Library Services Division. RP05/96-97.
reviewcentre. 2008. “Nissan Primera Dci Se D 2.2 Hatchback Review.” http://www.reviewcentre.com/review141968.html (accessed June 2008).
World LP Gas Association (WLPGA). 2002. Clearing the Air: A Technical Guide on Autogas – Emissions, Test Methods, Standards and Technology. Paris: WLPGA.

LP Gas: An Energy Solution for a Low Carbon World 58
World LP Gas Association (WLPGA). 2001, Developing a Sustainable Autogas Market: A Guide for Policymakers. Paris: WLPGA.
Yahoo! UK & Ireland. 2007. “Ford Mondeo 1.8 SCi range.” http://uk.cars.yahoo.com/car-reviews/car-and-driving/ford-mondeo-1.8-sci-range-1003851.html (accessed June 2008).
ASSUMPTIONS 1. Different fuel systems were evaluated based on the emissions resulting from the delivery of an
equivalent energy service – kilometers traveled.
2. A typical vehicle was estimated to travel 10,000 km per year.
3. Vehicle data is based on OEM manufactured LP Gas, Petrol, Diesel, and E85 engines. No aftermarket kits were considered.
4. Where not indicated the butane content was assumed to be the maximum allowed depending on the fuel standards in each region.
5. For the calculation of carbon emission factors and energy use, Autogas was assumed to only consist of propane and butane. Other hydrocarbons were not considered.
6. The Republic of Korea was assumed to have the same Autogas standards as Japan.
7. European vehicle fuel efficiencies were based on Table 1.5 in Clearing the Air: A Technical Guide on Autogas by the World LP Gas Associations.
8. All other end-use energy consumption data based on vehicle manufacturer reported fuel efficiency for each vehicle platform based on km/l.
9. Energy content of fuels based on EIA 2007: Pure Propane 25.5 MJ/l, Pure Butane 28.8 MJ/l, Petrol 34.8 MJ/l, Ethanol 23.5 MJ/l, E85 33.105 MJ/l.
10. Carbon fuel emission factors based on 2006 IPCC Guidelines for National Greenhouse Gas Inventories, Volume 2 (Table 2.5) (http://www.ipcc-nggip.iges.or.jp/public/2006gl/index.html).
RESIDENTIAL SPACE HEATING
REFERENCES
Euroheat & Power. 2006. Ecoheatcool Work Package 1: The European Heat Market (Final Report). Brussels, Belgium: Ecoheatcool and Euroheat & Power.
European Commission Altener Programme. 2003. Benchmarking for Existing European Dwellings. Task 1 of Energy Performance Assessment Method for Existing Dwellings (EPA-ED). (April). Prepared by C.A. Balaras, E. Dascalaki, S. Geissler, K.B. Wittchen, and G. van Cruchten. Athens, Hellas: European Commission.
European Commission BOILeff project. 2008. Summary report on studies and field test reports dealing with boiler efficiency in practice. Deliverable 2.1 of Raising the efficiency of boiler installations. Prepared by CREVER – Universitat Rovira I Virgili. European Commission.
European Commission DG for Energy and Transport Save II Action. 2002. Labelling and other measures for heating systems in dwellings: Final Technical Report (January). European Commission.
Hayden, Skip. 2006. Heating System Choices & Installation: Maximizing Comfort and Efficiency. Burlington, VT: Better Buildings by Design 2006 (February). PowerPoint slides.
Intergovernmental Panel on Climate Change (IPCC). 2006. Energy. Vol. 2 of 2006 IPCC Guidelines for National Greenhouse Gas Inventories. Prepared by the National Greenhouse Gas Inventories Programme, ed. Eggleston H.S., Buenida L., Miwa K., Ngara T., and Tanabe K. Japan: IPCC. http://www.ipcc-nggip.iges.or.jp/public/2006gl/index.html (accessed May 2008).
United Nations Department of Economic and Social Affairs. 1999. Trends in Consumption and Production: Household Energy Consumption (April). Prepared by Oleg Dziuobinski and Ralph Chipman. A Discussion Paper of the United Nations Department and Social Affairs, New York.

LP Gas: An Energy Solution for a Low Carbon World 59
U.S. Department of Energy Office of Energy Efficiency and Renewable Energy (EERE). Prepared by Roger Taylor of National Renewable Energy Laboratory (NREL). Residential Wood Heating Economics. NAEMI Biomass Training Workshop. PowerPoint slides.
RESIDENTIAL WATER HEATING
REFERENCES
ECOHOTWATER. 2007. “Water Heater Model Draft v.2.” (May 9).
Alibaba Group. 2008. Homepage. www.alibaba.com (accessed May 2008).
European Commission. 2007. Preparatory Study on Eco-design of Water Heaters: Task 5 Report (Final) – Definition of Basecase (September 30). Prepared by René Kemna, Martijn van Elburg, William Li, and Rob van Holsteijn of Van Holsteijn en Kemna BV (VHK). Delft, Holland: VHK.
European Commission. 2007. Preparatory Study on Eco-design of Water Heaters: Task 6 Design Options(Final) (September 30). Prepared by René Kemna, Martijn van Elburg, William Li, and Rob van Holsteijn of Van Holsteijn en Kemna BV (VHK). Delft, Holland: VHK.
European Commission. 2006. Preparatory Study on Eco-design of Water Heaters: Task 1 Report – Definition, Test Standards, Current Legislation & Measures (Draft) (December 3). Prepared by René Kemna, Martijn van Elburg, William Li, and Rob van Holsteijn of Van Holsteijn en Kemna BV (VHK). Delft, Holland: VHK.
Indiasolar.com. “Survey on Solar Water Heater Uses.” http://www.indiasolar.com/survey-swh.htm (accessed May 2008).
Intergovernmental Panel on Climate Change (IPCC). 2006. Energy. Vol. 2 of 2006 IPCC Guidelines for National Greenhouse Gas Inventories. Prepared by the National Greenhouse Gas Inventories Programme, ed. Eggleston H.S., Buenida L., Miwa K., Ngara T., and Tanabe K. Japan: IPCC. http://www.ipcc-nggip.iges.or.jp/public/2006gl/index.html (accessed May 2008).
Pillai, Indu R. and Banerjee Rangan. 2006. Impact of Hot Water Usage Pattern and Location on Economics of Solar Water Heating Systems. Bombay, India: Energy Systems Engineering, Indian Institute of Technology. http://www.me.iitb.ac.in/~rangan/publications/recent%20papers%20published_homepage/Solar%20paper.pdf (accessed May 2008).
ASSUMPTIONS 11. An extensive study of water heaters in the EU (“Eco-design of water heaters”), conducted by the
Netherlands consulting firm VHK, was used to obtain many of the parameters in the analysis.
12. Efficiencies for water heaters in Europe, India, and South America were based on modeled and tested system efficiencies of water heaters in the “base case” reported in VHK 2007a). Currently, each country in the EU has independent efficiency standards for water heaters.
13. Average efficiencies for North American water heaters were assumed to correspond to the United States minimum energy performance standards established for 2004. This was chosen to represent the typical performance of the existing stock of water heaters, reflecting a mix of sub-standard models purchased before 2004 as well as models that exceed the minimum standard.
14. Japanese water heater efficiencies were based on the performance of existing water heaters, which was inferred from the Japanese Top Runner program voluntary efficiency targets, which are based on a set percentage improvement from average efficiency in 2000. Each data source calculates efficiency differently. The U.S. government and the Japanese Top Runner program base minimum efficiency on a prescribed test procedure; the VHK study tends to include higher losses in its estimation of total system efficiency. Although some of the difference may be due to actual efficiency differences (such as the much more stringent standards for standby losses in the U.S. compared to Europe), caution is advised in drawing conclusions from cross-regional comparisons of results.
15. Size classes assigned in the VHK study were used to estimate heating energy demand in each region (the heating energy needed for useful hot water service after efficiency losses - see notes in main

LP Gas: An Energy Solution for a Low Carbon World 60
report for values). For Europe, the efficiencies of water heaters for central heating were based on the “medium” size class, which represented the largest number of water heating units sold in the EU. Average storage size in the medium size class is 80 liters. The flow rate of instantaneous heaters in this size category is 6-8 l/min (corresponding to a power input of 21-27 kW). For North America, Japan, and Korea, heating demand for the “large” size class was used. Average storage size in the large size class is 120 liters, which agrees well with the average size of United States water heaters (EIA 2001). The flow rate of instantaneous heaters in the large size class is 10 l/min. The large size class was chosen for Japan based on the popularity of bathtub use in that country. The water heating demand of Korean households were assumed to be similar to Japan.
16. Heating demand for point-of-use heaters was assumed to correspond to the “small” size class in the VHK study. Average storage size in the small size class is 20 liters. The flow rate of small instantaneous heaters is 5 l/min.
17. Central water heater efficiencies for India and South America were based on the “medium” size class for storage heaters, but used efficiencies from the “small” size class for instantaneous heaters (18 kW) due to tendency in those regions for smaller water heaters to be used to match the same flow rate demanded by the medium size class (reflecting a lower temperature change, possibly due to a higher inlet temperature or a lower outlet temperature in those regions, or both). Similarly, efficiencies for instantaneous technologies in the “extra small” category were used to estimate energy consumption for meeting the “small” energy requirements for point-of-use applications in these regions.
18. A lower heating energy demand than used for other regions was assumed for India and South America due to higher ambient temperatures. The VHK model assumes a ∆T of 50 °C from inlet to outlet. A ∆T of 40 °C was assumed for India and South America. Total heating demand for those regions was therefore reduced by 20% from the heating energy requirement assigned to each respective size category in the VHK study.
19. The backup fraction for solar water heating applications was assumed to be 15% for India and South America, based on data presented in Pillai and Banerjee 2004. The backup fraction of 40% assumed for Europe, Japan, and Korea were based on typical backup fractions for solar water heaters in the United States (DOE 2005). (Solar water heaters were not analyzed for the United States due to a small market share relative to other regions.)
20. Efficiencies for small and extra small gas instantaneous, electronic ignition technologies were taken from efficiencies reported in the VHK design options study (VHK 2007b). The efficiency used for the medium gas instantaneous water heater was calculated using the VHK spreadsheet model (VHK 2008).
21. The relative market shares of water heating technologies in India and South America was gleaned from a number of different sources, in particular the global trade website alibaba.com, which indicates the number of different water heater types available by regional export market.

LP Gas: An Energy Solution for a Low Carbon World 61
List of Acronyms AED Academy for Educational Development
AFUE Annual fuel utilization efficiency
CH4 Methane
CHP Combined heat and power
COPPE Coimbra Institute for Graduate Studies and Research
DOE U.S. Department of Energy
E85 Corn-based ethanol
e-CFR Electronic Code of Federal Regulations
EPA U.S. Environmental Protection Agency
EPA-ED Energy Performance Assessment Method for Existing Dwellings
EERE U.S. Department of Energy Office of Energy Efficiency and Renewable Energy
EU European Union
FAO Food and Agriculture Organization
GHG Greenhouse gas
GJ gigajoule
GREET Greenhouse Gases, Regulated Emissions, and Energy Use in Transportation Model
IDLC Industrial Diesel Liquid Cooled Generators
IEA International Energy Agency
IEI International Energy Initiative
IGLC Industrial Gaseous Standby/Prime Power Generators
IPCC Intergovernmental Panel on Climate Change
IVIG International Virtual Global Change Institute
LEM Lifecycle Emissions Model
LNG Liquid natural gas
LP Gas Liquefied petroleum gas
N2O Nitrous oxide
NREL National Renewable Energy Laboratory
OECD Organisation for Economic Co-operation and Development
OEM Original equipment manufacturer
PPE COPPE Energy Planning Program
SUV Sport utility vehicle
USAID United States Agency International Development
VHK Van Holsteijn en Kemna BV
VOC Volatile organic compound
WLPGA World LP Gas Association
WRI World Resources Institute
LP Gas: An Energy Solution for a Low Carbon World 62
Glossary of Terms
Aerosols: Solid or liquid particles suspended within the atmosphere (see "sulfate aerosols" and "black carbon aerosols").
Afforestation: Planting of new forests on lands that have not been recently forested.
Anthropogenic Emissions: Emissions of greenhouse gasses resulting from human activities.
Annex I Parties: The 40 countries plus the European Economic Community listed in Annex I of the UNFCCC that agreed to try to limit their GHG emissions: Australia, Austria, Belarus, Belgium, Bulgaria, Canada, Croatia, Czech Republic, Denmark, European Economic Community, Estonia, Finland, France, Germany, Greece, Hungary, Iceland, Italy, Japan, Latvia, Liechtenstein, Lithuania, Luxembourg, Monaco, The Netherlands, New Zealand, Norway, Poland, Portugal, Romania, Russian Federation, Slovakia, Slovenia, Spain, Sweden, Switzerland, Turkey, Ukraine, United States.
Baselines: The baseline estimates of population, GDP, energy use and hence resultant greenhouse gas emissions without climate policies, determine how big a reduction is required, and also what the impacts of climate change without policy will be.
Base Year: Targets for reducing GHG emissions are often defined in relation to a base year. In the Kyoto Protocol, 1990 is the base year for most countries for the major GHGs; 1995 can be used as the base year for some of the minor GHGs.
Basket of Gases: This refers to the group six of greenhouse gases regulated under the Kyoto Protocol. They are listed in Annex A of the Kyoto Protocol and include: carbon dioxide (CO2), methane (CH4), nitrous oxide (N2O), hydrofluorocarbons (HFCs), perfluorocarbons (PFCs), and sulphur hexafluoride (SF6).
Black Carbon Aerosols: Particles of carbon in the atmosphere produced by inefficient combustion of fossil fuels or biomass. Black carbon aerosols absorb light from the sun, shading and cooling the Earth's surface, but contribute to significant warming of the atmosphere (see "radiative forcing").
Bubble: An option in the Kyoto Protocol that allows a group of countries to meet their targets jointly by aggregating their total emissions. The member states of the European Union are utilizing this option.
Biodiversity: The variety of organisms found within a specified geographic region.
Capital Stock: Existing investments in energy plant and equipment that may or may not be modified once installed.
Carbon Dioxide (CO2): CO2 is a colorless, odorless, non-poisonous gas that is a normal part of the ambient air. Of the six greenhouse gases normally targeted, CO2 contributes the most to human-induced global warming. Human activities such as fossil fuel combustion and deforestation have increased atmospheric concentrations of CO2 by approximately 30 percent since the industrial revolution. CO2 is the standard used to determine the "global warming potentials" (GWPs) of other gases. CO2 has been assigned a 100-year GWP of 1 (i.e., the warming effects over a 100-year time frame relative to other gases).
Carbon Dioxide (CO2) equivalent: The amount of carbon dioxide, by weight, emitted into the atmosphere that would produce the same estimated radiative forcing as a given weight of another radiatively active gas. Carbon dioxide equivalents are computed by multiplying the weight of the gas being measured (for example, methane) by its estimated global warming potential. "Carbon equivalent units" are defined as carbon dioxide equivalents multiplied by the carbon content of carbon dioxide (i.e., 12/44).

LP Gas: An Energy Solution for a Low Carbon World 63
Carbon Sinks: Processes that remove more carbon dioxide from the atmosphere than they release. Both the terrestrial biosphere and oceans can act as carbon sinks.
Carbon Taxes: A surcharge on the carbon content of oil, coal, and gas that discourages the use of fossil fuels and aims to reduce carbon dioxide emissions.
Certified Emissions Reduction (CER): Reductions of greenhouse gases achieved by a Certified Development Mechanism (CDM) project. A CER can be sold or counted toward Annex I countries' emissions commitments. Reductions must be additional to any that would otherwise occur.
Chlorofluorocarbons (CFCs): CFCs are synthetic industrial gases composed of chlorine, fluorine, and carbon. They have been used as refrigerants, aerosol propellants, cleaning solvents and in the manufacture of plastic foam. There are no natural sources of CFCs. CFCs have an atmospheric lifetime of decades to centuries, and they have 100-year "global warming potentials" thousands of times that of CO2, depending on the gas. In addition to being greenhouse gases, CFCs also contribute to ozone depletion in the stratosphere and are controlled under the Montreal Protocol.
Clean Development Mechanism (CDM): One of the three market mechanisms established by the Kyoto Protocol. The CDM is designed to promote sustainable development in developing countries and assist Annex I Parties in meeting their greenhouse gas emission reduction commitments. It enables industrialized countries to invest in emission reduction projects in developing countries and to receive credits for reductions achieved.
Climate: The long-term average weather of a region including typical weather patterns, the frequency and intensity of storms, cold spells, and heat waves. Climate is not the same as weather.
Climate change: Refers to changes in long-term trends in the average climate, such as changes in average temperatures. In IPCC usage, climate change refers to any change in climate over time, whether due to natural variability or as a result of human activity. In UNFCCC usage, climate change refers to a change in climate that is attributable directly or indirectly to human activity that alters atmospheric composition.
Climate Sensitivity: The average global air surface temperature change resulting from a doubling of pre-industrial atmospheric CO2 concentrations. The IPCC estimates climate sensitivity at 1.5-4.5oC (2.7-8.1oF).
Climate Variability: Refers to changes in patterns, such as precipitation patterns, in the weather and climate.
Commitment Period: The period under the Kyoto Protocol during which Annex I Parties' GHG emissions, averaged over the period, must be within their emission targets. The first commitment period runs from January 1, 2008 to December 31, 2012.
Early Crediting: A provision that allows crediting of emission reductions achieved prior to the start of a legally imposed emission control period. These credits can then be used to assist in achieving compliance once a legally imposed system begins.
Ecosystem: A community of organisms and its physical environment.
Emissions: The release of substances (e.g., greenhouse gases) into the atmosphere.
Emissions Cap: A mandated restraint in a scheduled timeframe that puts a "ceiling" on the total amount of anthropogenic greenhouse gas emissions that can be released into the atmosphere. This can be measured as gross emissions or as net emissions (emissions minus gases that are sequestered).
Emissions Trading: A market mechanism that allows emitters (countries, companies or facilities) to buy emissions from or sell emissions to other emitters. Emissions trading is expected to bring down the costs of meeting emission targets by allowing those who can achieve reductions less expensively to sell excess

LP Gas: An Energy Solution for a Low Carbon World 64
reductions (e.g. reductions in excess of those required under some regulation) to those for whom achieving reductions is more costly.
End-use: Pertaining to the ultimate consumption of energy or fuel.
Energy Resources: The available supply and price of fossil and alternative resources will play a huge role in estimating how much a greenhouse gas constraint will cost. In the U.S. context, natural gas supply (and thus price) is particularly important, as it is expected to be a transition fuel to a lower carbon economy.
Enhanced Greenhouse Effect: The increase in the natural greenhouse effect resulting from increases in atmospheric concentrations of GHGs due to emissions from human activities.
Evapotranspiration: The process by which water re-enters the atmosphere through evaporation from the ground and transpiration by plants.
General Circulation Model (GCM): A computer model of the basic dynamics and physics of the components of the global climate system (including the atmosphere and oceans) and their interactions which can be used to simulate climate variability and change.
Global Warming: The progressive gradual rise of the Earth's average surface temperature thought to be caused in part by increased concentrations of GHGs in the atmosphere.
Global Warming Potential (GWP): An index used to compare the relative radiative forcing of different gases without directly calculating the changes in atmospheric concentrations. GWPs are calculated as the ratio of the radiative forcing that would result from the emission of one kilogram of a greenhouse gas to that from the emission of one kilogram of carbon dioxide over a fixed period of time, such as 100 years.
Greenhouse Effect: The insulating effect of atmospheric greenhouse gases (e.g., water vapor, carbon dioxide, methane, etc.) that keeps the Earth's temperature about 60°F warmer than it would be otherwise.
Greenhouse Gases (GHG): Those gases, such as water vapor, carbon dioxide, nitrous oxide, methane, hydrofluorocarbons (HFCs), perfluorocarbons (PFCs) and sulfur hexafluoride, that are transparent to solar (short-wave) radiation but opaque to long-wave (infrared) radiation, thus preventing long-wave radiant energy from leaving Earth's atmosphere. The net effect is a trapping of absorbed radiation and a tendency to warm the planet's surface.
HGWP (High Global Warming Potential): Some industrially produced gases such as sulfur hexafluoride (SF6), perfluorocarbons (PFCs), and hydrofluorocarbons (HFCs) have extremely high GWPs. Emissions of these gases have a much greater effect on global warming than an equal emission (by weight) of the naturally occurring gases. Most of these gases have GWPs of 1,300 - 23,900 times that of CO2. These GWPs can be compared to the GWPs of CO2, CH4, and N2O which are presently estimated to be 1, 23 and 296, respectively.
Hydrofluorocarbons (HFCs): HFCs are synthetic industrial gases, primarily used in refrigeration and semi-conductor manufacturing as commercial substitutes for chlorofluorocarbons (CFCs). There are no natural sources of HFCs. The atmospheric lifetime of HFCs is decades to centuries, and they have 100-year "global warming potentials" thousands of times that of CO2, depending on the gas. HFCs are among the six greenhouse gases to be curbed under the Kyoto Protocol.
Intergovernmental Panel on Climate Change (IPCC): The IPCC was established in 1988 by the World Meteorological Organization and the UN Environment Programme. The IPCC is responsible for providing the scientific and technical foundation for the United Nations Framwork Convention on Climate Change (UNFCCC), primarily through the publication of periodic assessment reports (see "Second Assessment Report" and "Third Assessment Report").

LP Gas: An Energy Solution for a Low Carbon World 65
Joint Implementation (JI): One of the three market mechanisms established by the Kyoto Protocol. Joint Implementation occurs when an Annex B country invests in an emissions reduction or sink enhancement project in another Annex B country to earn emission reduction units (ERUs).
Kyoto Mechanisms: The Kyoto Protocol creates three market-based mechanisms that have the potential to help countries reduce the cost of meeting their emissions reduction targets. These mechanisms are Joint Implementation (Article 6), the Clean Development Mechanisms (Article 12), and Emissions Trading (Article 17).
Kyoto Protocol: An international agreement adopted in December 1997 in Kyoto, Japan. The Protocol sets binding emission targets for developed countries that would reduce their emissions on average 5.2 percent below 1990 levels.
Land Use, Land-Use Change and Forestry (LULUCF): Land uses and land-use changes can act either as sinks or as emission sources. It is estimated that approximately one-fifth of global emissions result from LULUCF activities. The Kyoto Protocol allows Parties to receive emissions credit for certain LULUCF activities that reduce net emissions.
Lifecycle: The process from raw material acquisition (including exploration and production) through end-use by the consumer. Liquefied Natural Gas (LNG): is natural gas that has been processed to remove either valuable components e.g. helium, or those impurities that could cause difficulty downstream, e.g. water, and heavy hydrocarbons and then condensed into a liquid at almost atmospheric pressure (Maximum Transport Pressure set around 25 kPa) by cooling it to approximately -163 degrees Celsius. LNG is transported by specially designed cryogenic sea vessels and cryogenic road tankers; and stored in specially designed tanks.
Liquefied Petroleum Gas (LPG): It is the term widely used to describe a family of light hydrocarbons called “gas liquids”. The most prominent members of this family are propane (C3H8) and butane (C4H10). The term “liquefied gas” may seem a contradiction in terms since all things in nature are either a liquid, a solid or a gas. Yet, it is the unique character of LP Gas that makes it such a popular and widely used fuel. LP Gas at normal temperature and pressure is a gas. It changes to a liquid when subjected to modest pressure or cooling. In liquid form the tank pressure is about twice the pressure in a normal truck tire. Methane (CH4): CH4 is among the six greenhouse gases to be curbed under the Kyoto Protocol. Atmospheric CH4 is produced by natural processes, but there are also substantial emissions from human activities such as landfills, livestock and livestock wastes, natural gas and petroleum systems, coalmines, rice fields, and wastewater treatment. CH4 has a relatively short atmospheric lifetime of approximately 10 years, but its 100-year GWP is currently estimated to be approximately 23 times that of CO2.
Nitrous Oxide (N2O): N2O is among the six greenhouse gases to be curbed under the Kyoto Protocol. N2O is produced by natural processes, but there are also substantial emissions from human activities such as agriculture and fossil fuel combustion. The atmospheric lifetime of N2O is approximately 100 years, and its 100-year GWP is currently estimated to be 296 times that of CO2.
Perfluorocarbons (PFCs): PFCs are among the six types of greenhouse gases to be curbed under the Kyoto Protocol. PFCs are synthetic industrial gases generated as a by-product of aluminum smelting and uranium enrichment. They also are used as substitutes for CFCs in the manufacture of semiconductors. There are no natural sources of PFCs. PFCs have atmospheric lifetimes of thousands to tens of thousands of years and 100-year GWPs thousands of times that of CO2, depending on the gas.
ppm or ppb: Abbreviations for "parts per million" and "parts per billion," respectively - the units in which concentrations of greenhouse gases are commonly presented. For example, since the pre-industrial era, atmospheric concentrations of carbon dioxide have increased from 270 ppm to 370 ppm.

LP Gas: An Energy Solution for a Low Carbon World 66
Radiative Forcing: The term radiative forcing refers to changes in the energy balance of the earth-atmosphere system in response to a change in factors such as greenhouse gases, land-use change, or solar radiation. The climate system inherently attempts to balance incoming (e.g., light) and outgoing (e.g. heat) radiation. Positive radiative forcings increase the temperature of the lower atmosphere, which in turn increases temperatures at the Earth's surface. Negative radiative forcings cool the lower atmosphere. Radiative forcing is most commonly measured in units of watts per square meter (W/m2).
Reforestation: Replanting of forests on lands that have recently been harvested.
Renewable Energy: Energy obtained from sources such as geothermal, wind, photovoltaic, solar, and biomass.
Secretariat of the UN Framework Convention on Climate Change: The United Nations staff assigned the responsibility of conducting the affairs of the UNFCCC. In 1996 the Secretariat moved from Geneva, Switzerland, to Bonn, Germany.
Sequestration: Opportunities to remove atmospheric CO2, either through biological processes (e.g. plants and trees), or geological processes through storage of CO2 in underground reservoirs.
Sinks: Any process, activity or mechanism that results in the net removal of greenhouse gases, aerosols, or precursors of greenhouse gases from the atmosphere
Source: Any process or activity that results in the net release of greenhouse gases, aerosols, or precursors of greenhouse gases into the atmosphere.
Stratosphere: The region of the Earth's atmosphere 10-50 km above the surface of the planet.
Substitution: The economic process of trading off inputs and consumption due to changes in prices arising from a constraint on greenhouse gas emissions. How the extremely flexible U.S. economy adapts to available substitutes and/or finds new methods of production under a greenhouse gas constraint will be critical in minimizing overall costs of reducing emissions.
Sulfate Aerosols: Sulfur-based particles derived from emissions of sulfur dioxide (SO2) from the burning of fossil fuels (particularly coal). Sulfate aerosols reflect incoming light from the sun, shading and cooling the Earth's surface (see "radiative forcing") and thus offset some of the warming historically caused by greenhouse gases.
Sulfur Hexafluoride (SF6): SF6 is among the six types of greenhouse gases to be curbed under the Kyoto Protocol. SF6 is a synthetic industrial gas largely used in heavy industry to insulate high-voltage equipment and to assist in the manufacturing of cable-cooling systems. There are no natural sources of SF6. SF6 has an atmospheric lifetime of 3,200 years. Its 100-year GWP is currently estimated to be 22,200 times that of CO2.
Targets and Timetables: Targets refer to the emission levels or emission rates set as goals for countries, sectors, companies, or facilities. When these goals are to be reached by specified years, the years at which goals are to be met are referred to as the timetables. In the Kyoto Protocol, a target is the percent reduction from the 1990 emissions baseline that the country has agreed to. On average, developed countries agreed to reduce emissions by 5.2% below 1990 emissions during the period 2008-2012, the first commitment period.
Technological Change: How much technological change will be additionally induced by climate policies is a crucial, but not well quantified, factor in assessing the costs of long-term mitigation of greenhouse gas emissions.

LP Gas: An Energy Solution for a Low Carbon World 67
Thermal expansion: Expansion of a substance as a result of the addition of heat. In the context of climate change, thermal expansion of the world's oceans in response to global warming is considered the predominant driver of current and future sea-level rise.
Trace Gas: A term used to refer to gases found in the Earth's atmosphere other than nitrogen, oxygen, argon and water vapor. When this terminology is used, carbon dioxide, methane, and nitrous oxide are classified as trace gases. Although trace gases taken together make up less than one percent of the atmosphere, carbon dioxide, methane and nitrous oxide are important in the climate system.
Troposphere: The region of the Earth's atmosphere 0-10 km above the planet's surface.
United Nations Framework Convention on Climate Change (UNFCCC): A treaty signed at the 1992 Earth Summit in Rio de Janeiro that calls for the "stabilization of greenhouse gas concentrations in the atmosphere at a level that would prevent dangerous anthropogenic interference with the climate system." The treaty includes a non-binding call for developed countries to return their emissions to 1990 levels by the year 2000. The treaty took effect in March 1994 upon ratification by more than 50 countries. The United States was the first industrialized nation to ratify the Convention.
Upstream: Pertaining to any process, or the sum total of processes, used to produce or deliver energy up to the point of consumption by the end-user. Concerns all processes used in the transformation of raw feedstock into fuel, including raw material extraction, processing, transportation, distribution, and storage. Water Vapor (H2O): Water vapor is the primary gas responsible for the greenhouse effect. It is believed that increases in temperature caused by anthropogenic emissions of greenhouse gases will increase the amount of water vapor in the atmosphere, resulting in additional warming (see "positive feedback").
Weather: Describes the short-term (i.e., hourly and daily) state of the atmosphere. Weather is not the same as climate.

LP Gas: An Energy Solution for a Low Carbon World 68
ABOUT THE WORLD LP GAS ASSOCIATION The World LP Gas Association is the authoritative voice of the global LP Gas industry representing all sectors of industry. The primary aim of the association is to add value to the sector through driving premium demand for LP Gas, while also promoting compliance to good business and safety practices. It brings together private and public companies involved in one several or all activities of the industry, it develops long term partnerships with international organizations and implements projects on local and global scales. The association was established in 1987 and granted Special Consultative Status with the United Nations Economic and Social Council in 1989 World LP Gas Association Mission
Demonstrate the benefits of LP Gas and position it as a clean energy for a low carbon world Create the environment to develop and sustain LP Gas markets Identify and stimulate innovation Promote compliancy with health, safety and environment standards and good business practices Facilitate and drive communication among all stakeholders
As the global voice for LP Gas, the World LP Gas Association (WLPGA) promotes the use of this
fuel to foster a cleaner, healthier and more prosperous world.
WLPGA was officially granted Consultative Status with the United Nations Economic and Social
Council in 1989 and actively represents the interests of the LP Gas industry in numerous UN
processes including the UN Framework Convention on Climate Change (UNFCCC) negotiations.
world LP Gas Association
9, rue Anatole de la Forge, 75017 Paris, France Tel. +33 (0)1 58 05 28 00 Fax +33 (0)1 58 05 20 01
Email: to [email protected] Web: www.worldlpgas.com