Embed Size (px)
Citation preview

Journal of Population and Social Security (Population), Supplement to Volume 1
1
Low Fertility and Family Policy in Japan -in an International Comparative Perspective
Makoto Atoh , Mayuko Akachi
Introduction Japanese fertility started to decline below the replacement level since the middle of the 1970s and continued its declining trend already for more than a quarter of a century. Since the middle of the 1990s it came to be closer to among the lowest levels in the world. Although demographers in Japan had had keen interest into this below-replacement- fertility phenomenon and tried to analyze its demographic as well as social and economic causes, the Japanese government took “wait-and-see” attitude towards it during the 1970s and 80s. In 1990 the Japanese government, all of a sudden, sharply responded to the “1.57 shock”1and established a special coordinating committee dealing with low fertility issues, namely a Committee for Creating a Good Environment for Having and Bringing- up Children, in the Office of Cabinet’s Council on Internal Affairs (Atoh, 2002). Although a dozen years have been already spent since then for improving social environment for childcare, however, Japanese fertility continued to decrease up until now. In January 2002, the latest revision of the official population projections for Japan was released by the National Institute of Population and Social Security Research, revealing that Japan would face with hyper-aging and population decline at least in the next half a century due to the prospect of persistent low fertility (NIPSSR, 2002a). Such prospects of Japanese population aroused a sense of crisis among many politicians and bureaucrats, especially with regards to the sustainability of the social security system. The Prime Minister told last spring, it is reported, the Minister of Health, Labor and Welfare (MHLW) to strengthen “Shosika-taisaku”, that is, measures to cope with low fertility issues. But how could a government affect fertility? What kind of policy options are effective for fertility change? A research project, the Comparative Study of Fertility and Family Policies in Developed Countries, lasted between 1999 and 2001, sponsored by the Research Fund for Welfare Policies from the MHLW (Kojima, 2002).2 The purpose was to derive policy recommendations on low fertility issues for the Japanese Government from the comparative analysis of fertility trends and their 1 In 1990, a figure of the total fertility rate in 1989, 1.57, was released by the government, which was lower than the lowest figure of TFR, 1.58, in 1966 which had been ever recorded in the history of Japanese Vital Statistics. The popularity of the term “1.57 shock” in Japan is reflected in the fact that it was introduced to the Encyclopedia of Families (Kobun-sha Publishing) published in 1996 in Japan. 2 The project was organized and managed by the first author of this paper. Since he became a member of the Evaluation Committee of the Research Fund for Welfare Policies in 2001, however, he had to give up nominally the role of the head of this project only for the final year. Therefore, the final report of this project was authored by one of the project members as a surrogate of the head of the project.

Journal of Population and Social Security (Population), Supplement to Volume 1
2
background factors and family policies among developed countries. For pursing this purpose, the research team was divided into two groups: One is a group to deal with cross-national analyses of the comparable data from all the developed countries and the other is regional research groups to analyze the country-specific detailed data within a certain region. Five regional groups were constructed according to geographic location and/or cultural identity, notably language: They are (1) Northern European countries(NEC), (2) German -speaking countries and Netherlands(GSC), (3) French-speaking countries(FSC), (4) Southern European countries(SEC) and (5) English-speaking countries(ESC). 3 Japan was not included in these five regional groups because she is culturally and historically so unique among the developed countries. This paper came up from the efforts by the first cross-national analysis group to collect comparative time-series data on both demographic, social and economic factors and family policies. The aim of this paper is to analyze trends in fertility and its proximate determinants, their social and economic background and family policies in Japan in an internationally comparative perspective, clarify their similarities with and differences from other developed countries and derive, if possible, any possible recommendations for the Japanese government from these comparative analyses. Ⅰ.Fertility, its Proximate Determinants, and its Social and Economic Context 1. Fertility trends
The Western societies had mostly completed fertility transition from the traditional high fertility regime to the modern low fertility regime during 1930’s and 40’s, but experienced a long-term baby-boom after the Second World War. Their fertility resumed decline since the middle of the 1960s, plunged under the replacement level in the 1970s and remained there up to now, though with not a small diversity. On the other hand, Japan completed fertility transition in the 1950s with much higher speed than the Western societies. Her fertility remained around the replacement level up to the middle of the 1970s, but started to decline thereafter and reached 1.33 of the total fertility rate (TFR) in 2001 (NIPSSR, 2002b).
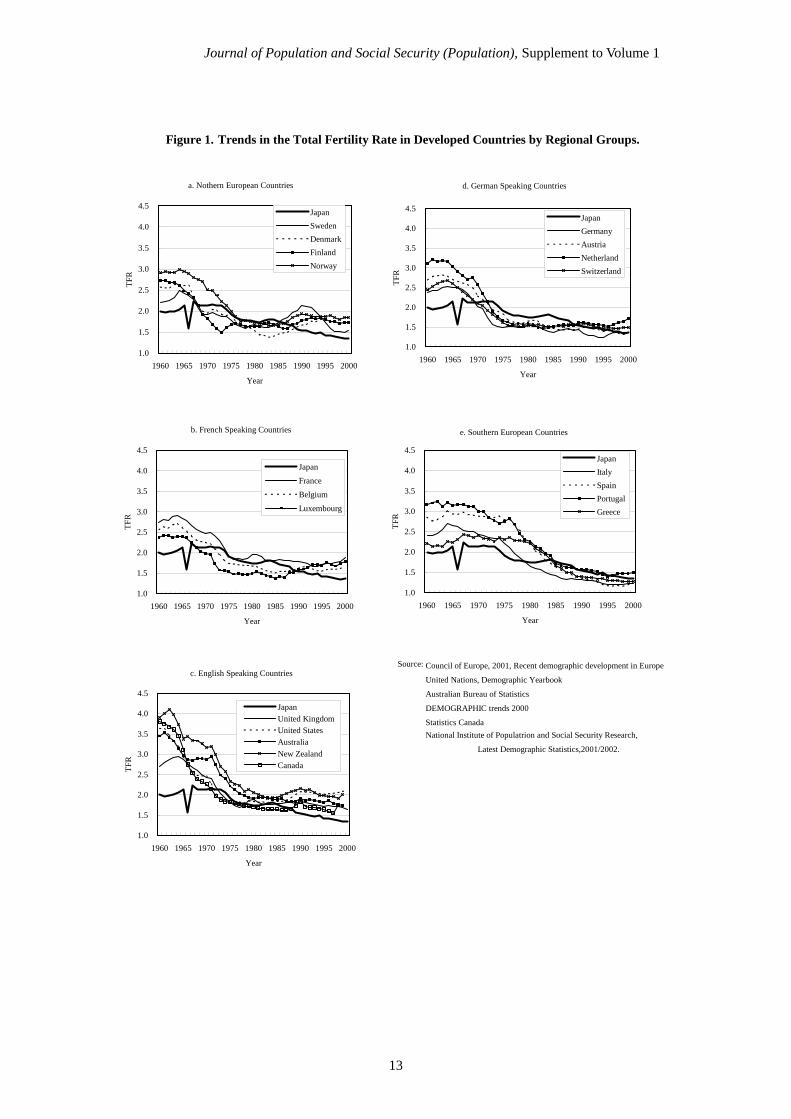
Comparing the trends in TFR between 1960 and 2000 among developed countries by regional groups (Figure 1), TFR in Northern European countries (NEC), French-speaking countries (FSC) and English-speaking countries (ESC) showed upswing since the middle of the 1980s and remained relatively higher levels, between 1.6 and 2.1. On the other hand, while TFR in German-speaking countries (GSC) remained relatively lower levels, between 1.3 and 1.5, up to now with the exception of Netherlands having TFR of 1.7, after it plunged under the 3 Five regional groups were constructed based also on the similarities of fertility trends and family policies or welfare policies in general which had been clarified by previous comparative studies (Gauthier, 1996; Esping-Anderson, 1990). Netherlands was included in a group of German-speaking countries only because her language is more similar to German than to other languages.

Journal of Population and Social Security (Population), Supplement to Volume 1
3
replacement level in the 1970s, TFR in Southern European countries (SEC) began to decline in the 1980s under the replacement level but continued to decline, reaching the lowest levels, between 1.2 and 1.5, among developed countries.
Of course, as is well-known among demographers, as TFR is a period fertility measure affected by both “quantum factor” (the effect of changes in the level of cohort completed fertility) and “tempo factor” (the effect of changes in the timing of childbearing), it may not reflect an appropriate long-term fertility level (Bongaarts, 1998). According to the data from the Council of Europe, however, even the estimated cohort completed fertility has started to decrease far below two children on average for the cohorts born in 1960s in GSC and SEC (Council of Europe, 2001). Similarly, since the cohort cumulative fertility at age 35 has decreased continuously for younger cohorts in Japan, the cohort completed fertility is expected to decrease much under the replacement level for the cohorts born in the 1960s (NIPSSR, 2002b).4
It is clear that TFR trends in Japan since early 1980s are very much similar to those in GSC and SEC. Therefore, it is expected that some hints might be given with respect to effective measures to cope with low fertility if we could understand adequately socio-economic, cultural and policy conditions common to Japan and GSC and SEC and those conditions in Japan different from NEC, FSC and ESC.
2. Proximate Determinants of Fertility
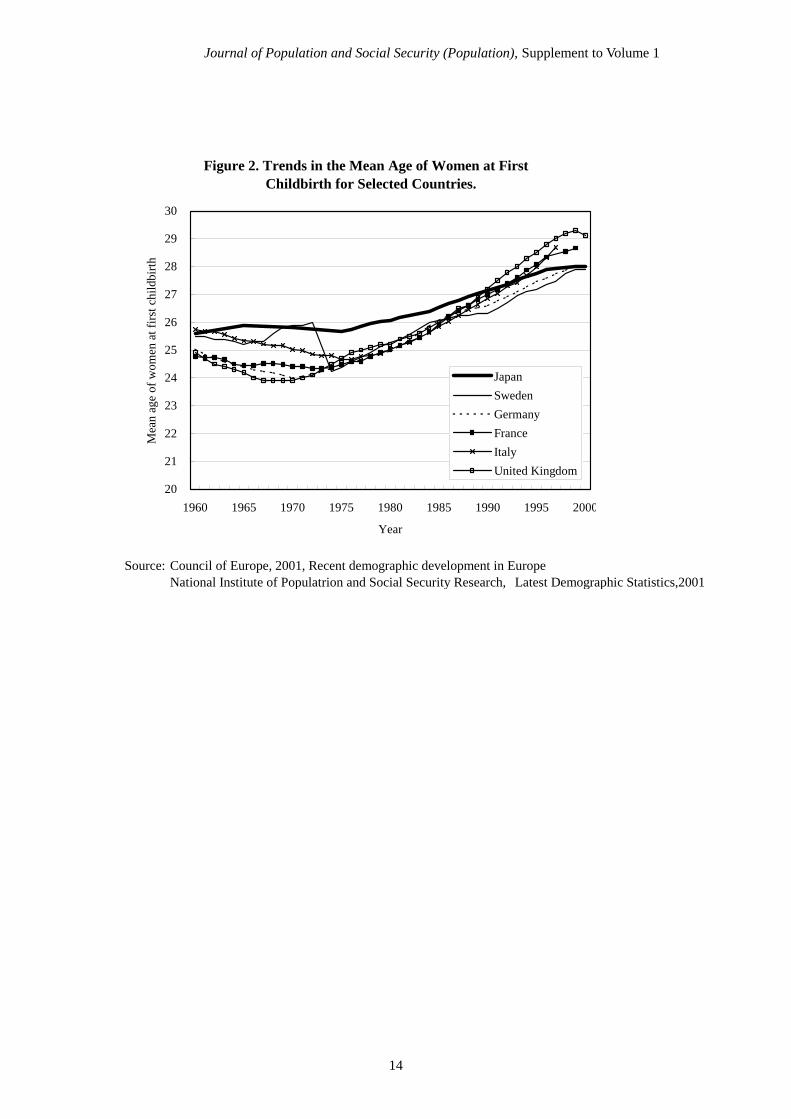
The common demographic determinant of fertility decline since around 1970 among developed countries including Japan was the postponement of childbearing (Lesthaeghe et al., 2000). The mean age at first birth increased by 2 to 4 years between 1975 and 2000, as is shown in Figure 2. The degree of its increase in Japan, 2.3 years, was the smallest among developed countries: This is partly because she was one of the latest childbearing-age countries already in the 1960s and partly because she has experienced only a weak upswing of childbearing at women’s age of 30s, or the so-called “catch-up” phenomenon, in the 1980s and 90s. In fact, countries with TFR increase since the middle of the 1980s, such as those in NEC, FSC and ESC, have experienced “catch-up” phenomenon, resulting in larger rise in the mean age at the first birth.
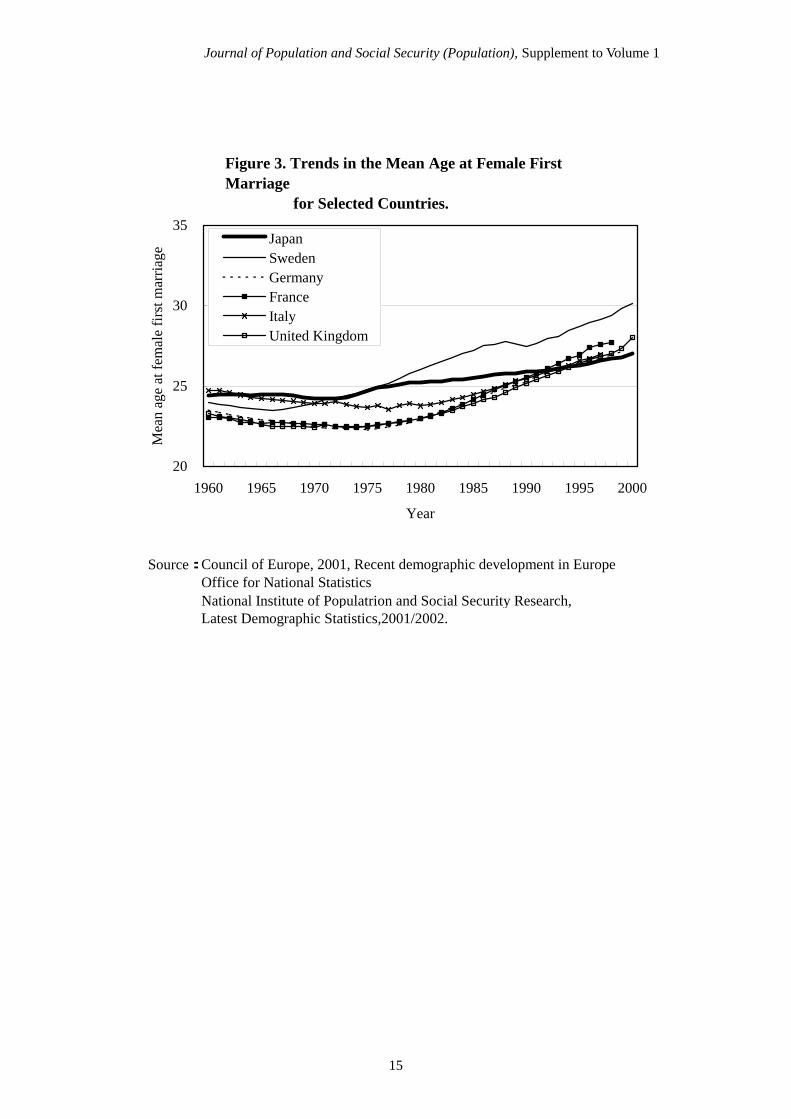
The postponement of childbearing common to most developed countries is generally related to the postponement of marriage in the same period. The mean age at first marriage increased by 2 to 5 years among developed countries between 1975 and 2000, as is shown in Figure 3. In the same period when later marriage and later childbearing continued, however, the proportion of cohabiting couples and that of extra-marital births have drastically increased in NEC, FSC and ESC (Figure 4). Notably in NEC, the proportion of extra-marital births increased from 4-11% to 39-55% between 1960 and 2000. In these countries such tendency has come to be strengthened that young people first enter into a 4 Completed fertility measured at women’s age of 45 was recorded as between 1.96 and 2.10 for the birth cohorts between 1932 and 1955. Cohort cumulative fertility at age 35 started to decline continuously from 1.88 for the 1957 birth cohort, through 1.73 for the 1960 cohort, up to 1.46 for the 1965 cohort (NIPSSR, 2002b).
Journal of Population and Social Security (Population), Supplement to Volume 1
4
cohabiting relationship, have the first baby in it and later enter into a marital relationship. Because of it, the relationship between marriage age and the age at the first birth has been weakened among them.
Whereas the proportions of cohabiting couples and extra-marital births have also increased in GSC, SEC and Japan, the proportion of extra-marital births in GSC and SEC are much lower than that in NEC, FSC and ESC, 10 to 31% and 4 to 22% respectively in 2000 and the same proportion in Japan has been much lower than that in GSC and SEC, only less than 2% in the year 2000.5
The proportion of extra-marital births and fertility levels are strongly and positively correlated among developed countries (Figure 5). It suggests that a society which can allow for various family forms, such as cohabitation and non-marital couples with children, can have higher fertility. The low prevalence of cohabitation and extra-marital fertility in Japan and SEC might be explained mainly by such strong traditional family norms that premarital cohabitation is undesirable and only married couples are allowed to bear children. But their low prevalence in Japan may be partly due to such traditional family norm as the breadwinner-homemaker family model (Atoh, 2001). This is because young women in Japan are expected to do most household chores even in a cohabiting couple, in spite that cohabitation became prevalent in NEC, FSC and ESC because of its nature of equal partnership.6 Therefore, it appears to be improbable for cohabiting couples, let alone extra-marital births, to dramatically increase in the near future in such countries with strong traditional family and gender norms as Japan and SEC.
3. Economic and Social Background of Fertility Change
According to an economic theory of fertility, marital fertility decline, or in other words, choice of married couples to have fewer children can be explained by four conditions: (1) a decline in the utility or the value of children, (2) a rise in the direct cost of childrearing, (3) a rise in the indirect (or the opportunity) cost of childrearing and (4) a decline in income levels (Leibenstein, 1957; Becker, 1960). (1) The decline in the utility or the value of children is connected with the decrease of labor force and security values of children for their parents which is brought about by the long-term transition from agrarian and rural societies with both more family businesses and less developed welfare policies to industrialized and urban societies with both more employees and more developed welfare policies.
This argument may be consistent with the historical trend that people came to be less likely to have or want to have a large family with more than three children according to various surveys undertaken among many developed countries like Japan (NIPSSR, 1998 and 1999; Atoh, 1996). But the same surveys have also persistently revealed that most people think of two or three as
5 According to the latest National Fertility Survey, the proportion of single women aged 20-29 who were cohabiting was only 1.8 percent in 1997 (NIPSSR, 1999). 6 The low prevalence of cohabitation in Japan may also be related to the low prevalence of female-dominant contraceptive methods, because under this situation women are more exposed to the risk of their unwanted pregnancy in a cohabiting relationship (Atoh, 2001).

Journal of Population and Social Security (Population), Supplement to Volume 1
5
the desired or ideal number of children for them. They seem to refute the idea that children have lost any utility or value for parents in developed societies.7 (2) Has the direct cost of childcare increased relative to income levels among developed countries? Of course, industrialization, urbanization and the rise in educational levels brought about, in the long-run, the increase of general living cost including cost for childrearing. But among European states which have supported most of the financial cost for public education including national universities, it is not probable that the direct cost of childrearing relative to income levels has increased much since the 1970s when the college enrollement rate has started to increase (Figure 6).
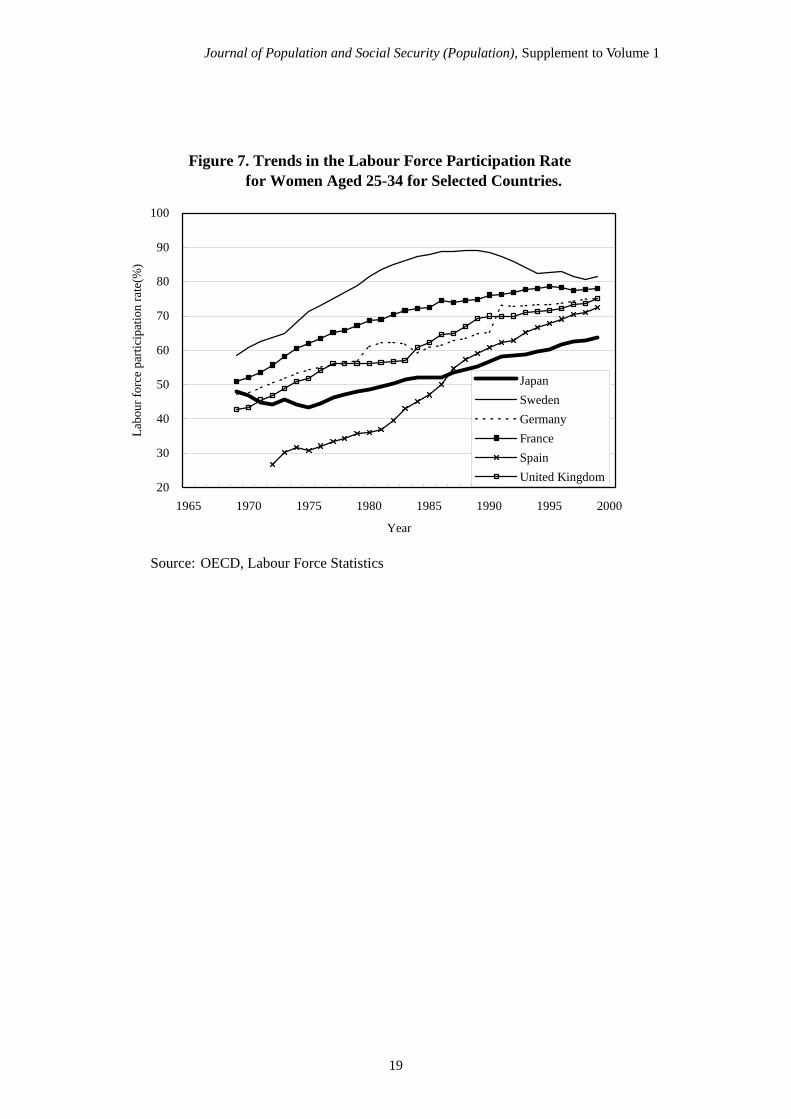
In contrast, parents have to pay huge money for their children’s education in the contemporary Japan where about 40 percent of the same age cohort go to universities (NIPSSR, 2002b). According to various opinion surveys, education expenses are the largest factor for Japanese couples to limit their family size (IPP, 1993; Atoh, 1996). The total amount of education expenses of one child is estimated to be 9.34 million yen in 1998, 2.2 times of the average annual income of employed workers, if the child goes to public schools from elementary school to university, commuting from his or her parents’ home (EPA, 1993). If parents send their children to private universities and if they live separately from them, the amount is estimated to rise to 19 million yen, 4.4 times of the average annual income of employed workers. Therefore, for cross-national comparisons of fertility, the direct cost of childrearing, especially educational cost and housing cost relative to income levels may explain the part of its variance.8 (3) The rise in the indirect cost or opportunity cost of childcare is closely related to the increase of women’s educational attainment and their labor force participation. Between 1960 and the middle of the 1990s, women’s college enrollment rates increased from less than 10% to more than 40% among most developed countries, with a dramatic increase since the middle of the 1980s (Figure 6). Also, between 1970 and 2000, women’s labor force participation rates during main reproductive years increased among all the developed countries (Figure 7). By regional comparisons, NEC, FSC and ESC have been higher for both indicators than GSC and SEC. Japan is among the lowest for both indicators.
Theories of labor economics teach us that higher education leads to higher wage potential, which is, in turn, connected with higher employment opportunity and higher income. Therefore, the increase in women’s educational attainment and employment should have caused the rise in women’s time cost, that is, their opportunity cost of childcare, which should have contributed to fertility decline, if other conditions are equal, in many developed countries including Japan.9 7 In fact, the majority of women of reproductive ages in Japan think, as the value or the benefit of having children, that children are fun, they make their family happier, or they make their parents mature, according to fertility surveys (Atoh, 1996). Economists call it utility of children as consumption goods. 8 In such southern European countries as Italy and Spain, housing cost is said to be so expensive for young people due to the shortage of cheap rent-houses that it is prohibitive for their marriage (Nishioka, 2002). 9 The Economic Planning Agency of Japanese government compared estimated life time incomes

Journal of Population and Social Security (Population), Supplement to Volume 1
6
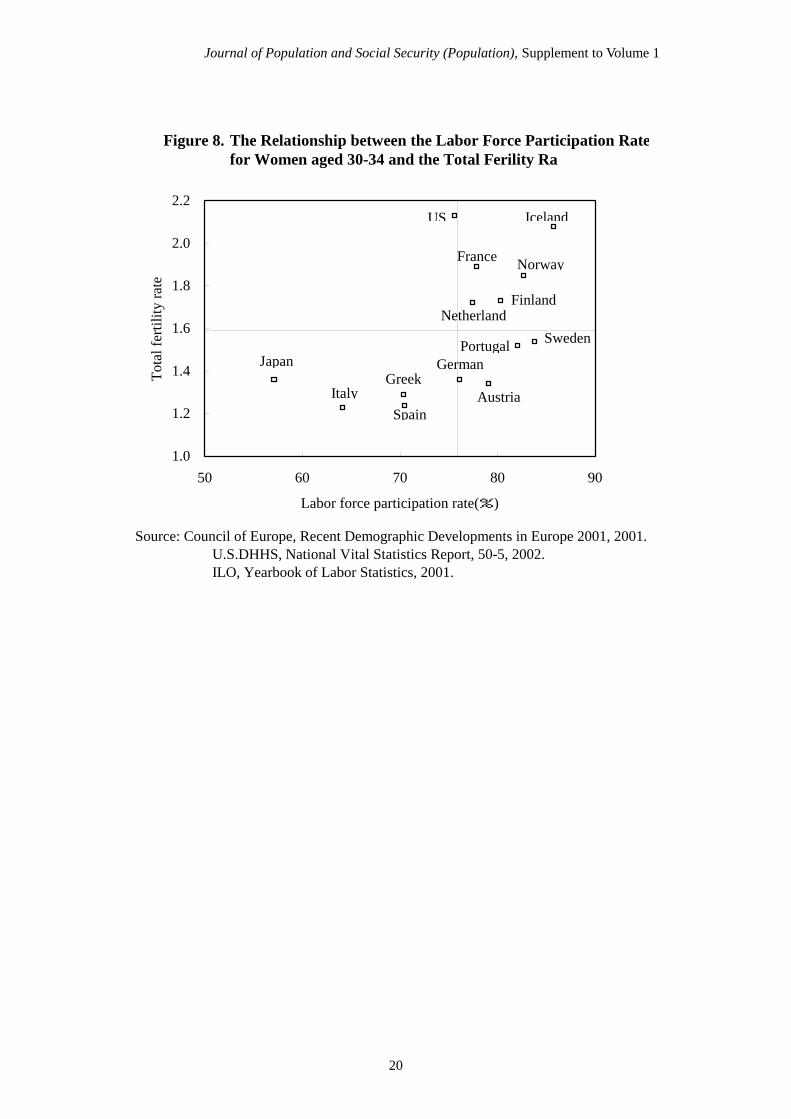
In the year 2000, the cross-national comparison of women’s labor force participation rates and fertility shows, however, that both indicators are generally high for NEC, FSC and ESC, only labor force rates are high for GSC and both indicators are low for Japan and SEC (Figure 8). Such a cross-national relationship which is apparently puzzling from the viewpoint of labor economics suggests that, in the first three country groups, although women’s educational levels and labor force rates have increased, the opportunity cost of childcare has been reduced by changes in “other conditions”, resulting in easier compatibility of occupational work with childcare. In contrast, it also suggests that in the other two country groups, SEC and GSC, and Japan “other conditions” have been conducive to the relatively higher levels of opportunity cost of childcare, resulting in the difficulty of balancing work and childcare.
How do relatively low levels of both indicators, women’s work and fertility, coexist at the aggregate level in Japan? The main demographic reason for fertility decline in Japan has been the rise in the proportion never married in reproductive years and, the higher is women’s educational level, the higher is their proportion never married (Atoh, 1994). The proportion of working women aged 25-34 who are never married are very high in 2000, 78% for women aged25-29 and 47% for women aged 30-34, because about two out of three working women quit their job at the time of either marriage or the first birth (Ogawa, 1996). Consequently, those who remained in the labor market, more educated, tend to have very few children on average. That is the reason of the coexistence of relatively low levels of women’s work and fertility.
What are “other conditions” which help or hinder the compatibility of work and childcare? The first one is conditions of labor market and employment policies of companies and companies’ labor unions, such as commuting time, work hours, flexibility of daily work hours and companies’ support systems for childcare. Since it is difficult to collect comparable data for these factors from various countries, however, we would like to just mention their importance for easier childcare of working mothers. The second is traditional gender role relations. The cross-national comparison of husbands’ share of family works including childcare and levels of fertility shows that those countries which have higher husbands’ share of family works tend to have higher fertility (Figure 9). Japan and Italy are conspicuous in low levels of husbands’ share of family works. The time spent by husbands for family matters remained very little, less than twenty minutes on average on weekdays, at least for these twenty years in Japan (Atoh, 2000a). The third is family and labor policies of the government which regulates companies’ employment conditions, affects the supply of childcare services and provides with economic support for childcare and which will be discussed in the next section.
of two types of two-year college graduating women: One is those who continue full-time jobs until the age of 60 and the other is those who quit their jobs at their marriage and resume part-time jobs until the age of 60 after five-year leave for childrearing. The difference between life time incomes of both types, that is, the latter having 78% less than the former, was regarded as an estimate of opportunity cost of childrearing in the contemporary Japan (EPA, 1993).

Journal of Population and Social Security (Population), Supplement to Volume 1
7
Ⅱ.Family Policies 1. Concern about low fertility and family policies
Among only a portion of European countries, such as France and Luxemburg, governments have expressed explicitly their interest into fertility aspect of family policies, at least officially (United Nations, 2002). Similarly in Japan, the government had not much interest into low fertility up until the end of the 1980s, probably because TFR remained among the highest in the developed countries until the middle of the 1980s.
The government of Japan started to take policy responses to low fertility issues in 1990, the year of “1.57 shock”, by establishing the aforementioned committee in the Office of Cabinet’s Council on Internal Affairs (Atoh, 2002). Parental Leave Act was implemented in 1992, in which full-time employees have a right to take a parental leave to raise a child below one year old without any income compensation. In 1994 the so-called “Angel Plan” was formulated and childcare services were improved and expanded for the 1995-1999 period, including the increase of the capacity of public nursery schools, the expansion of services of nursery schools, such as infant care, extended hours of childcare, temporary or part-time childcare and community childcare support, the introduction of after-school care services for elementary school children, encouraging kindergartens to render part-time childcare services and the establishment of family support centers (MHW, 1998).
Starting in 1995 parental leave takers came to be given 25 percent of their wage and be exempted from paying premiums of the Employees’ Pensions and Health Insurance while they are on leave. In 1999, a New Angel Plan was formulated to extend the Angel Plan for another five years and in 2001 parental leave benefit was raised to 40 percent of leave takers’ wage and the duration of parental leave was extended to three years for government employees and the eligible age of child allowance was raised from below 3 years old to 6 years old (MHLW, 2002a).
Japanese Government defined their policy related to low fertility not as a pro-natalist policy but as a welfare policy or a policy for improving childcare environment, when it revealed policy guidelines related to it in 1991. This attitude may be related partly to the concern that such policies might be identified by the public with the pro-natalist policy which was taken by the military government in prewar years. In fact, Japanese Government responded to the Enquiry on Population Policies by the Population Division of the United Nations in the 1990s in such a way that it was concerned about low fertility but it did not take any measures to raise fertility (United Nations, 2002). This official position is identical to such European countries as Italy and Germany. The public opinion seems to support such government approach to low fertility issues: About two out of three respondents think that the government should make efforts to improve the environment for raising children in several national surveys undertaken in the 1990s (Atoh, 2000b).
Although Japanese Government has introduced a series of policies supporting childcare and improved them gradually in the 1990s, fertility has

Journal of Population and Social Security (Population), Supplement to Volume 1
8
continued to decline, approaching one of the lowest levels in the world. Why has fertility continued to decline in Japan in spite of her governments’ efforts to improve childcare environment? For answering this question at least partially, it would be needed to evaluate the levels of public childcare support, or family policies in general terms, implemented by Japanese government in an international comparative perspective.
Below, two major components of family policies are discussed in turn: (1) Policies supporting the compatibility of work and family and (2) policies for economic support of childcare. 2. Policies supporting the compatibility of work and family (1) Maternity/Parental leave
Maternity leave, giving employed women the right to have a certain period of leave when they had a baby, had already been established at least in 1960 among all the developed countries except US and Australia. Today, there is only a small difference in the duration and cash benefit of maternal leave for most of the developed countries, around 15 weeks and about 80 percent of their wage at the time of childbearing. Maternity leave in Japan started before 1960 and its duration is 14 weeks, close to the average of all the developed countries, but the rate of cash benefit is 60 percent, one of the lowest among developed countries except ESC (US. DHEW, various years).
Parental leave, giving mothers or fathers who are working the right to take leave for childcare, has become prevalent since the middle of the 1970s among most developed countries as working women have increased. Compared with maternal leave, there is much wider difference in the duration and the allowance of parental leave among developed countries, from 10 weeks to 3 years for the duration and from no allowance to 100% wage compensation for the allowance. There are three types of allowances for parental leave: (a) wage compensation type, (b) a fixed allowance type and (c) no allowance (Furuhashi, 1993). Generally speaking, NEC belongs to (a), FSC and GSC to (b) and ESC and SEC to(c). Japan and Italy belongs to (a).
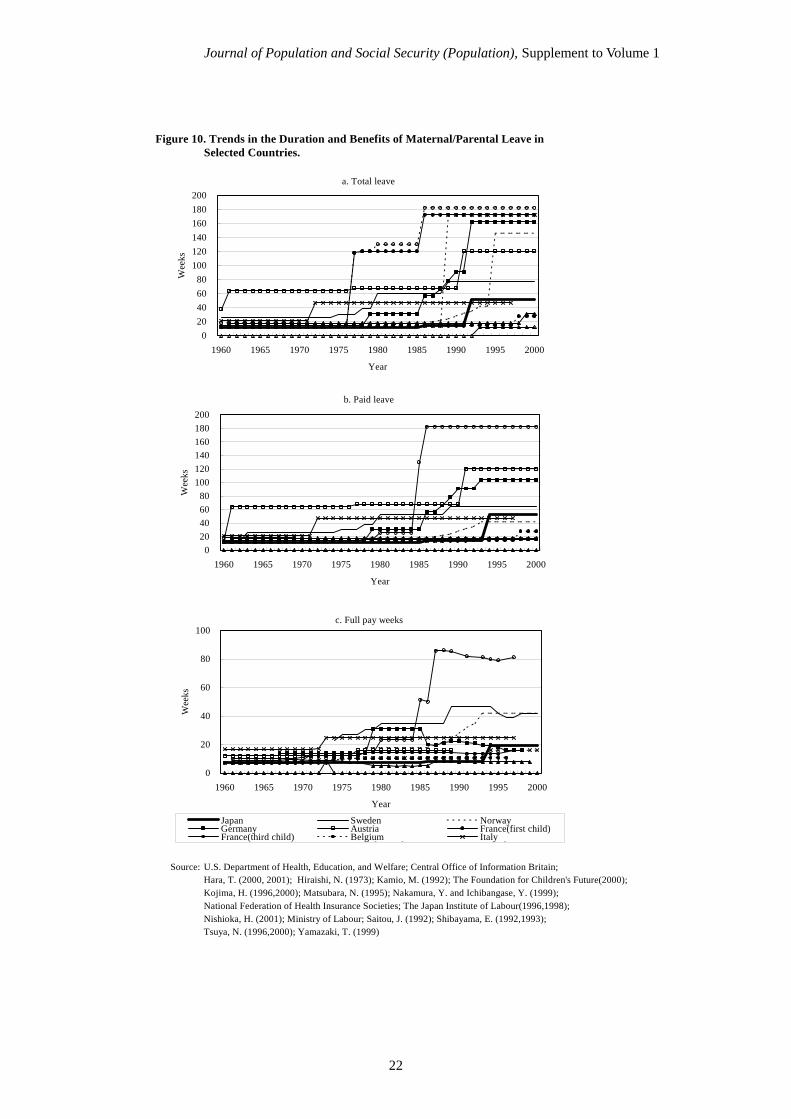
Let us compare maternity and parental leave together among developed countries in terms of three indicators for them: (a) total leave, namely the maximum duration allowed by the law, (b) paid leave, namely the duration covered by any type of allowance, and (c) full pay weeks, that is, the result of total allowance for the maximum duration divided by weekly payment according to wage levels before taking leave (Ruhm et al., 1995). In the case of a fixed allowance type, (c) is calculated by the division of total allowance by the average female weekly wage for manufacturing industry.
Figure 10 shows that there is a tendency that the duration of total leave, paid leave or full pay weeks has been extended, with their wider variations, since the middle of the 1970s when the parental leave was introduced in many countries. By examining these trends by the three types of parental leave, it is found that, while such long duration as 2 to 3 years is given for countries of a fixed allowance type, about one year seems to be a norm for countries of a wage compensation type. As for “full pay weeks”, whereas they are over 40 weeks for NEC and
Journal of Population and Social Security (Population), Supplement to Volume 1
9
France (only for children of the third or higher parity), about 20 weeks are common for other countries, except ESC (Figure 10-(c)).
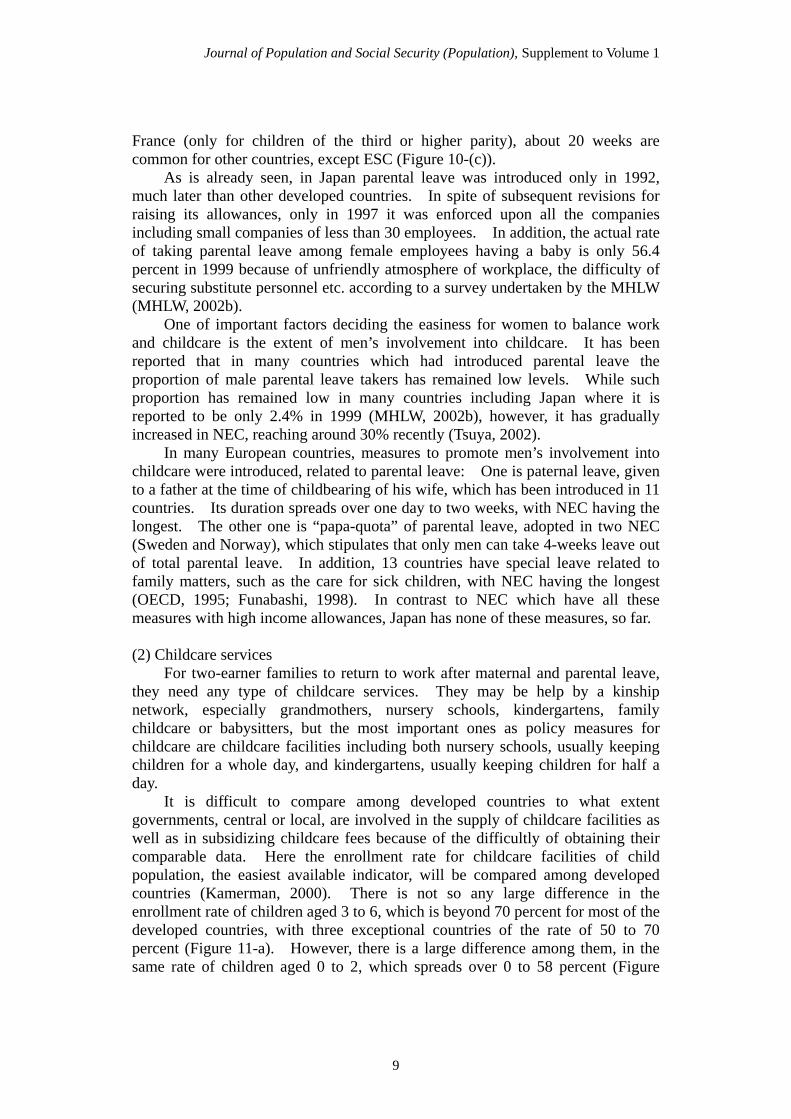
As is already seen, in Japan parental leave was introduced only in 1992, much later than other developed countries. In spite of subsequent revisions for raising its allowances, only in 1997 it was enforced upon all the companies including small companies of less than 30 employees. In addition, the actual rate of taking parental leave among female employees having a baby is only 56.4 percent in 1999 because of unfriendly atmosphere of workplace, the difficulty of securing substitute personnel etc. according to a survey undertaken by the MHLW (MHLW, 2002b).
One of important factors deciding the easiness for women to balance work and childcare is the extent of men’s involvement into childcare. It has been reported that in many countries which had introduced parental leave the proportion of male parental leave takers has remained low levels. While such proportion has remained low in many countries including Japan where it is reported to be only 2.4% in 1999 (MHLW, 2002b), however, it has gradually increased in NEC, reaching around 30% recently (Tsuya, 2002).
In many European countries, measures to promote men’s involvement into childcare were introduced, related to parental leave: One is paternal leave, given to a father at the time of childbearing of his wife, which has been introduced in 11 countries. Its duration spreads over one day to two weeks, with NEC having the longest. The other one is “papa-quota” of parental leave, adopted in two NEC (Sweden and Norway), which stipulates that only men can take 4-weeks leave out of total parental leave. In addition, 13 countries have special leave related to family matters, such as the care for sick children, with NEC having the longest (OECD, 1995; Funabashi, 1998). In contrast to NEC which have all these measures with high income allowances, Japan has none of these measures, so far. (2) Childcare services
For two-earner families to return to work after maternal and parental leave, they need any type of childcare services. They may be help by a kinship network, especially grandmothers, nursery schools, kindergartens, family childcare or babysitters, but the most important ones as policy measures for childcare are childcare facilities including both nursery schools, usually keeping children for a whole day, and kindergartens, usually keeping children for half a day.
It is difficult to compare among developed countries to what extent governments, central or local, are involved in the supply of childcare facilities as well as in subsidizing childcare fees because of the difficultly of obtaining their comparable data. Here the enrollment rate for childcare facilities of child population, the easiest available indicator, will be compared among developed countries (Kamerman, 2000). There is not so any large difference in the enrollment rate of children aged 3 to 6, which is beyond 70 percent for most of the developed countries, with three exceptional countries of the rate of 50 to 70 percent (Figure 11-a). However, there is a large difference among them, in the same rate of children aged 0 to 2, which spreads over 0 to 58 percent (Figure
Journal of Population and Social Security (Population), Supplement to Volume 1
10
11-b). Regionally, these rates of NEC and FSC are more likely to be higher than those of GSC and SEC, with an ambiguous position of ESC. The rate in Japan is in the middle level, 21%, for children aged 0 to 2, but among the lowest, 52% for children aged 3 to 6.
Looking at the cross-national relationship between the enrollment rate of nursery facilities and fertility in Figure 11, the rate for children aged 0 to 2 has a weak but positive correlation, while the rate for children aged 3 to 6 has no correlation with fertility. Since the enrollment rate has a lower value if the proportion of full-time housewives is higher, it may not necessarily measure the extent fulfilling the need for childcare facilities. But these data may suggest roughly that low availability of childcare facilities especially for children aged 0-2 is connected to low fertility.
Comparing public measures as a whole to balance work and family by regional groups, NEC is the strongest in both maternal/parental leave and childcare facilities, FSC is next to it in both indicators and GSC, SEC, ESC and Japan are at weaker levels in both indicators. 3. Economic support for childcare
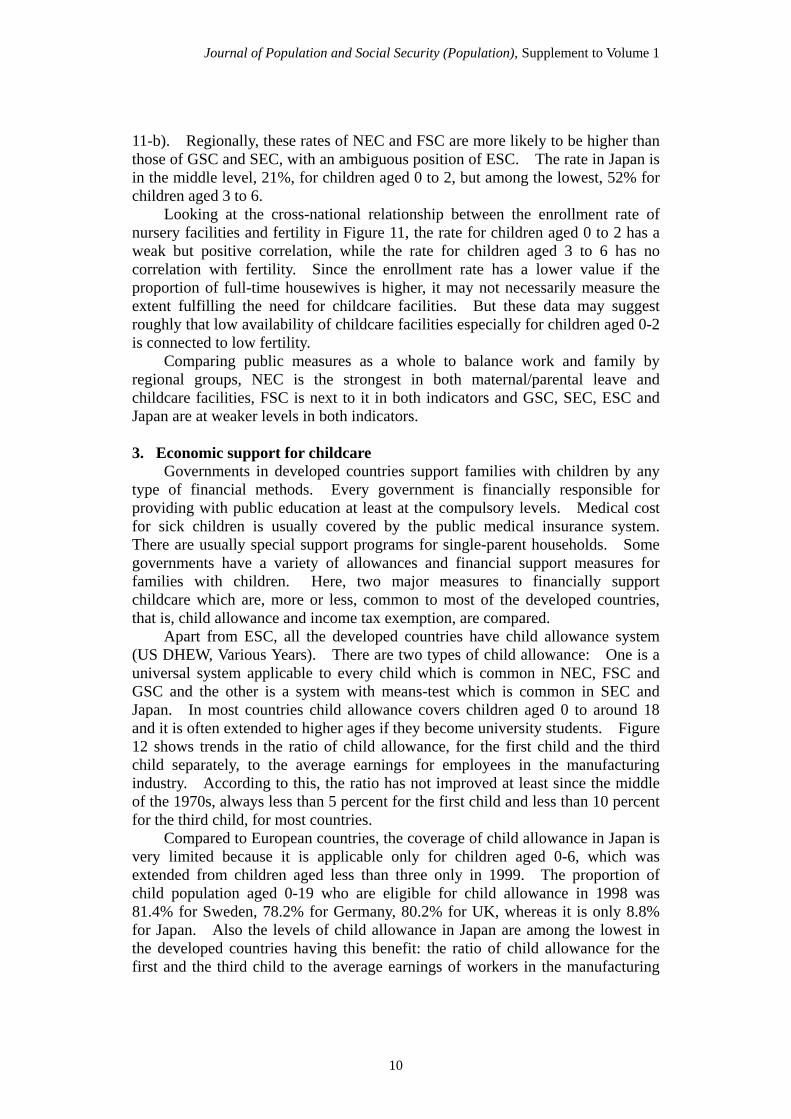
Governments in developed countries support families with children by any type of financial methods. Every government is financially responsible for providing with public education at least at the compulsory levels. Medical cost for sick children is usually covered by the public medical insurance system. There are usually special support programs for single-parent households. Some governments have a variety of allowances and financial support measures for families with children. Here, two major measures to financially support childcare which are, more or less, common to most of the developed countries, that is, child allowance and income tax exemption, are compared.
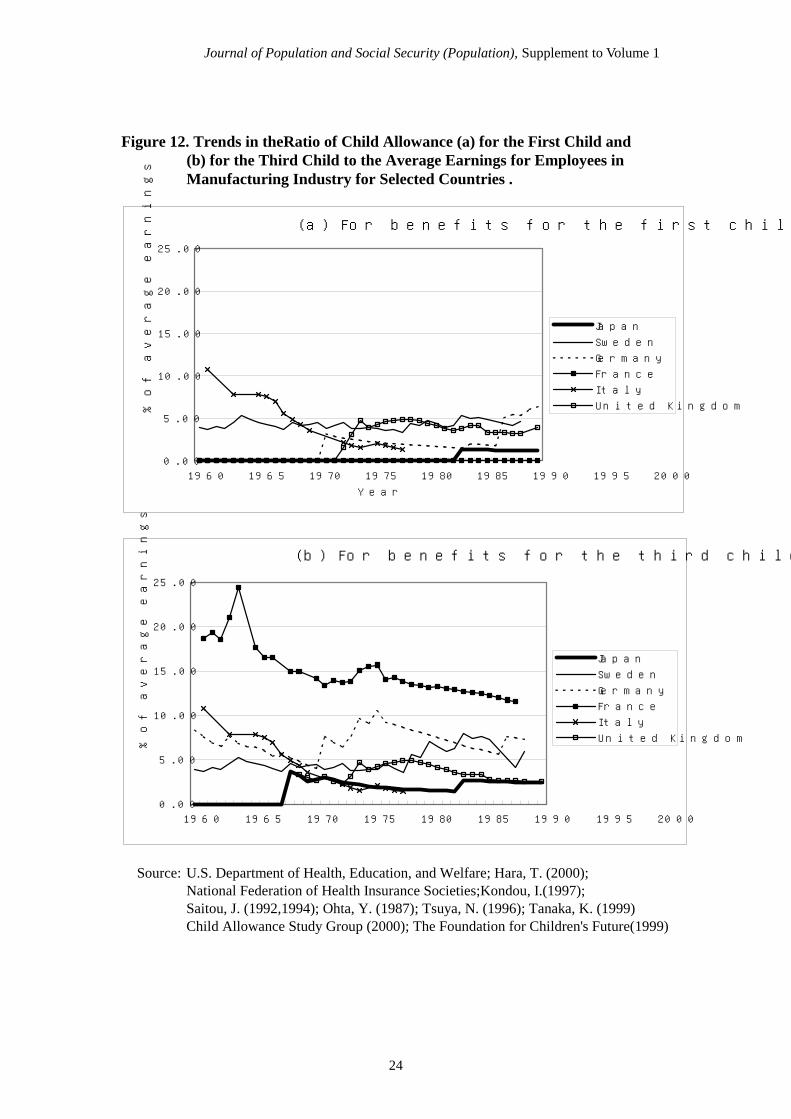
Apart from ESC, all the developed countries have child allowance system (US DHEW, Various Years). There are two types of child allowance: One is a universal system applicable to every child which is common in NEC, FSC and GSC and the other is a system with means-test which is common in SEC and Japan. In most countries child allowance covers children aged 0 to around 18 and it is often extended to higher ages if they become university students. Figure 12 shows trends in the ratio of child allowance, for the first child and the third child separately, to the average earnings for employees in the manufacturing industry. According to this, the ratio has not improved at least since the middle of the 1970s, always less than 5 percent for the first child and less than 10 percent for the third child, for most countries.
Compared to European countries, the coverage of child allowance in Japan is very limited because it is applicable only for children aged 0-6, which was extended from children aged less than three only in 1999. The proportion of child population aged 0-19 who are eligible for child allowance in 1998 was 81.4% for Sweden, 78.2% for Germany, 80.2% for UK, whereas it is only 8.8% for Japan. Also the levels of child allowance in Japan are among the lowest in the developed countries having this benefit: the ratio of child allowance for the first and the third child to the average earnings of workers in the manufacturing
Journal of Population and Social Security (Population), Supplement to Volume 1
11
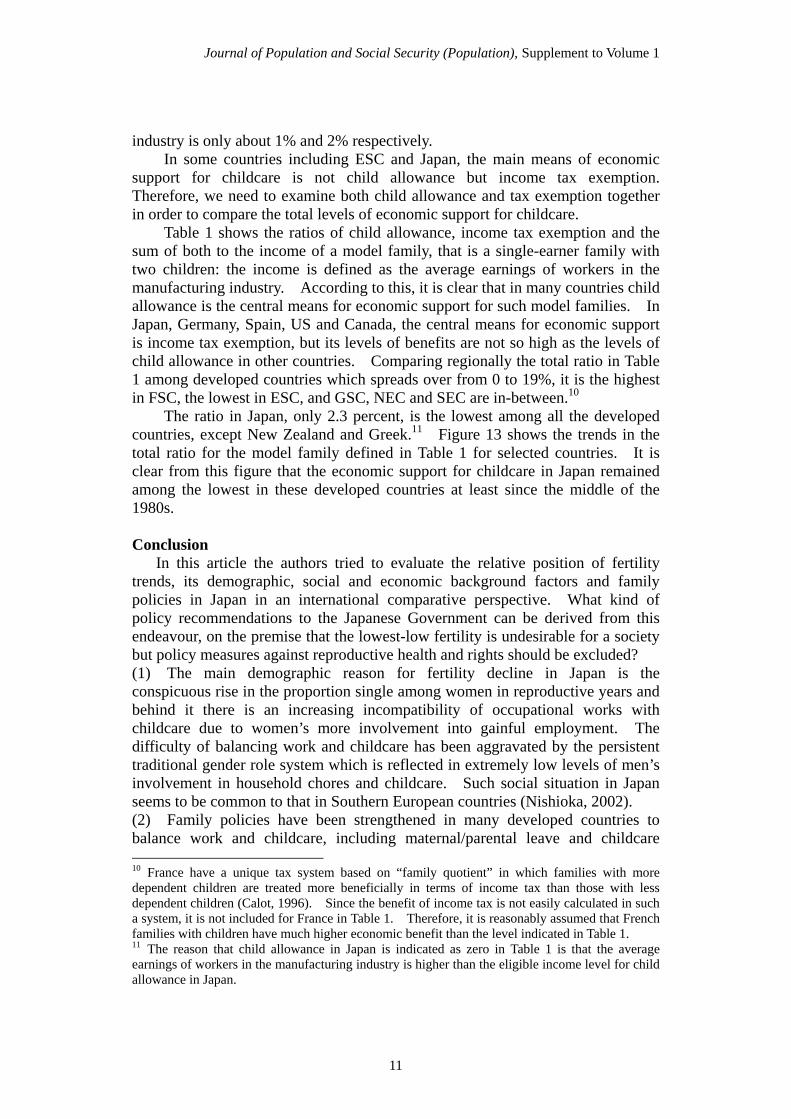
industry is only about 1% and 2% respectively. In some countries including ESC and Japan, the main means of economic
support for childcare is not child allowance but income tax exemption. Therefore, we need to examine both child allowance and tax exemption together in order to compare the total levels of economic support for childcare.
Table 1 shows the ratios of child allowance, income tax exemption and the sum of both to the income of a model family, that is a single-earner family with two children: the income is defined as the average earnings of workers in the manufacturing industry. According to this, it is clear that in many countries child allowance is the central means for economic support for such model families. In Japan, Germany, Spain, US and Canada, the central means for economic support is income tax exemption, but its levels of benefits are not so high as the levels of child allowance in other countries. Comparing regionally the total ratio in Table 1 among developed countries which spreads over from 0 to 19%, it is the highest in FSC, the lowest in ESC, and GSC, NEC and SEC are in-between.10
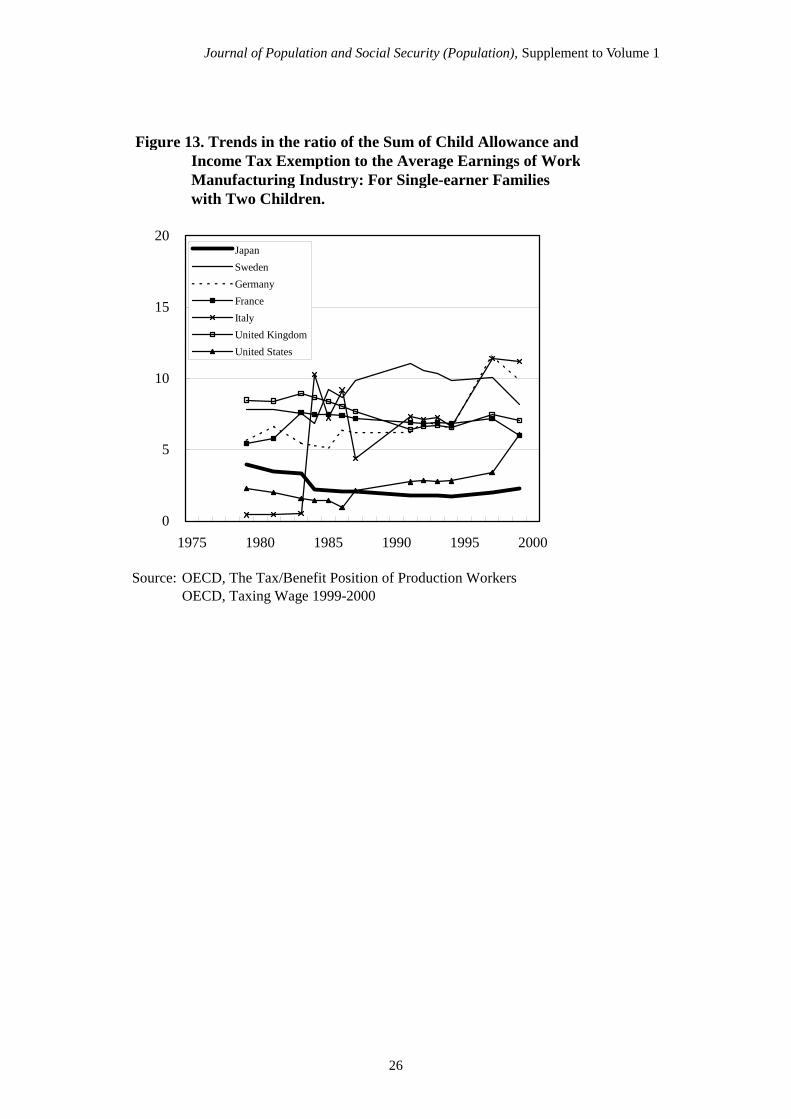
The ratio in Japan, only 2.3 percent, is the lowest among all the developed countries, except New Zealand and Greek.11 Figure 13 shows the trends in the total ratio for the model family defined in Table 1 for selected countries. It is clear from this figure that the economic support for childcare in Japan remained among the lowest in these developed countries at least since the middle of the 1980s. Conclusion In this article the authors tried to evaluate the relative position of fertility trends, its demographic, social and economic background factors and family policies in Japan in an international comparative perspective. What kind of policy recommendations to the Japanese Government can be derived from this endeavour, on the premise that the lowest-low fertility is undesirable for a society but policy measures against reproductive health and rights should be excluded? (1) The main demographic reason for fertility decline in Japan is the conspicuous rise in the proportion single among women in reproductive years and behind it there is an increasing incompatibility of occupational works with childcare due to women’s more involvement into gainful employment. The difficulty of balancing work and childcare has been aggravated by the persistent traditional gender role system which is reflected in extremely low levels of men’s involvement in household chores and childcare. Such social situation in Japan seems to be common to that in Southern European countries (Nishioka, 2002). (2) Family policies have been strengthened in many developed countries to balance work and childcare, including maternal/parental leave and childcare 10 France have a unique tax system based on “family quotient” in which families with more dependent children are treated more beneficially in terms of income tax than those with less dependent children (Calot, 1996). Since the benefit of income tax is not easily calculated in such a system, it is not included for France in Table 1. Therefore, it is reasonably assumed that French families with children have much higher economic benefit than the level indicated in Table 1. 11 The reason that child allowance in Japan is indicated as zero in Table 1 is that the average earnings of workers in the manufacturing industry is higher than the eligible income level for child allowance in Japan.

Journal of Population and Social Security (Population), Supplement to Volume 1
12
services. Such countries as Northern European countries and French-speaking countries which have relatively stronger family policies tend to have relatively higher levels of both women’s labor force participation rates and fertility. In Japan parental leave was introduced only a dozen years ago and it was improved only recently in terms of income compensation. Since it is often reported that there are some difficulties for employees to take parental leave, it is needed for the government to make efforts to strictly enforce Parental Leave Act on private companies. Although the government has extended and improved childcare services in this decade, its availability is not yet sufficient especially in large metropolitan areas. Further efforts are needed to reduce the number of children waiting for childcare services in these areas.12 (3) To balance work and childcare it will be needed that the traditional gender role system will change in a way that men are more involved in family matters, especially childcare. There have been policy efforts especially in Northern European countries to encourage men to be more involved in childcare, such as paternal leave and “papa quota” of parental leave. There may be some possibility that such policy measures would affect gender role relations in Japan, which would result in the easier compatibility of work and childcare. (4) It is not clear that policies supporting childcare economically have significant influence on fertility, but France and Luxemburg which have emphasized economic support for childcare tend to have relatively higher fertility. A level of economic support for childcare in Japan is among the lowest in developed countries and educational cost and housing cost for Japanese parents are extremely high compared with many European counterparts. Strengthening economic support for childcare in any means will be helpful for reducing the direct cost of childrearing, which may be conducive to higher fertility in Japan.
12 According to surveys undertaken by MHLW, the number of children waiting for being accepted by the public nursery facilities was estimated to be about 25,000 in the whole Japan in 2002 (MHLW, 2002b).
Journal of Population and Social Security (Population), Supplement to Volume 1
13
Figure 1. Trends in the Total Fertility Rate in Developed Countries by Regional Groups.
Source: Council of Europe, 2001, Recent demographic development in Europe
United Nations, Demographic Yearbook
Australian Bureau of Statistics
DEMOGRAPHIC trends 2000
Statistics CanadaNational Institute of Populatrion and Social Security Research,
Latest Demographic Statistics,2001/2002.
a. Nothern European Countries
1.0
1.5
2.0
2.5
3.0
3.5
4.0
4.5
1960 1965 1970 1975 1980 1985 1990 1995 2000
Year
TFR
JapanSwedenDenmarkFinlandNorway
d. German Speaking Countries
1.0
1.5
2.0
2.5
3.0
3.5
4.0
4.5
1960 1965 1970 1975 1980 1985 1990 1995 2000
Year
TFR
JapanGermanyAustriaNetherlandSwitzerland
b. French Speaking Countries
1.0
1.5
2.0
2.5
3.0
3.5
4.0
4.5
1960 1965 1970 1975 1980 1985 1990 1995 2000
Year
TFR
JapanFranceBelgium
Luxembourg
e. Southern European Countries
1.0
1.5
2.0
2.5
3.0
3.5
4.0
4.5
1960 1965 1970 1975 1980 1985 1990 1995 2000
Year
TFR
JapanItalySpainPortugalGreece
c. English Speaking Countries
1.0
1.5
2.0
2.5
3.0
3.5
4.0
4.5
1960 1965 1970 1975 1980 1985 1990 1995 2000
Year
TFR
JapanUnited KingdomUnited StatesAustraliaNew ZealandCanada
Journal of Population and Social Security (Population), Supplement to Volume 1
14
Source: Council of Europe, 2001, Recent demographic development in EuropeNational Institute of Populatrion and Social Security Research, Latest Demographic Statistics,2001/
Figure 2. Trends in the Mean Age of Women at First Childbirth for Selected Countries.
20
21
22
23
24
25
26
27
28
29
30
1960 1965 1970 1975 1980 1985 1990 1995 2000
Year
Mea
n ag
e of
wom
en a
t firs
t chi
ldbi
rth
JapanSwedenGermanyFranceItalyUnited Kingdom
Journal of Population and Social Security (Population), Supplement to Volume 1
15
Source: Council of Europe, 2001, Recent demographic development in EuropeOffice for National StatisticsNational Institute of Populatrion and Social Security Research,Latest Demographic Statistics,2001/2002.
Figure 3. Trends in the Mean Age at Female FirstMarriage for Selected Countries.
20
25
30
35
1960 1965 1970 1975 1980 1985 1990 1995 2000
Year
Mea
n ag
e at
fem
ale
first
mar
riage
JapanSwedenGermanyFranceItalyUnited Kingdom

Journal of Population and Social Security (Population), Supplement to Volume 1
16
Source:Council of Europe, 2001, Recent demographic development in EuropeNational Institute of Populatrion and Social Security Research,Latest Demographic Statistics,2001/2002.
Figure 4. Trends in the Proportion of Extra-marital Births in All Live Births for Selected Countries.
0
10
20
30
40
50
60
1960 1965 1970 1975 1980 1985 1990 1995 2000
Year
Extra
-mar
ital B
irths
(%)
JapanSwedenGermanyFranceItalyUnited Kingdom

Journal of Population and Social Security (Population), Supplement to Volume 1
17
Figure 5. The Relationship between the Proportion of Extra-marital Births and the Total Fertility Rate(2000)
Source: Council of Europe, Recent Demographic Developments in Europe, 2001.
1
1.2
1.4
1.6
1.8
2
2.2
2.4
0 10 20 30 40 50 60 70
Extra-marital Births(%)
TFR
Austria
DenmarkFinland
France
GermanGreece
IcelandIreland
Italy
Luxembourg
Netherlands
Norway
Portugal SwedenSwiss
Japan
UK

Journal of Population and Social Security (Population), Supplement to Volume 1
18
Source: UNESCO, Statistical Yearbook
Figure 6. Trends in the Gross Enrolment Rate for the Levelof Tertiary Education for Selected Countries.
0.0
10.0
20.0
30.0
40.0
50.0
60.0
70.0
80.0
90.0
1960 1965 1970 1975 1980 1985 1990 1995 2000
Year
Gro
ss e
nrol
men
t rat
e(%
)
JapanSwedenGermanyFranceItalyUnited Kingdom
Journal of Population and Social Security (Population), Supplement to Volume 1
19
Source: OECD, Labour Force Statistics
Figure 7. Trends in the Labour Force Participation Rate for Women Aged 25-34 for Selected Countries.
20
30
40
50
60
70
80
90
100
1965 1970 1975 1980 1985 1990 1995 2000
Year
Labo
ur fo
rce
parti
cipa
tion
rate
(%)
JapanSwedenGermanyFranceSpainUnited Kingdom
Journal of Population and Social Security (Population), Supplement to Volume 1
20
Figure 8. The Relationship between the Labor Force Participation Rate
Source: Council of Europe, Recent Demographic Developments in Europe 2001, 2001. U.S.DHHS, National Vital Statistics Report, 50-5, 2002. ILO, Yearbook of Labor Statistics, 2001.
for Women aged 30-34 and the Total Ferility Ra
1.0
1.2
1.4
1.6
1.8
2.0
2.2
50 60 70 80 90
Labor force participation rate(%)
Tota
l fer
tility
rate
US
Japan
AustriaSpain
Finland
France
GermanGreek
Italy
Netherland
Norway
Portugal Sweden
Iceland

Journal of Population and Social Security (Population), Supplement to Volume 1
21
Source: UNDP, Human Development Report 1995, 1995.
Figure 9. The Relationship between the Proportion of the Total WorkHours Spent by Men Which was Devoted to Family Work and theTotal Fertility Rate (1985-92).
1
1.1
1.2
1.3
1.4
1.5
1.6
1.7
1.8
1.9
2
0 10 20 30 40 50 60Time Spent for Family Work
Tota
l fer
tility
rate
( %)
Japan
Italy
Denmark
Austria
UK
Netherlands
Germany(FRG)
Finland
NorwayAustralia
USFrance
Journal of Population and Social Security (Population), Supplement to Volume 1
22
Figure 10. Trends in the Duration and Benefits of Maternal/Parental Leave inSelected Countries.
Source: U.S. Department of Health, Education, and Welfare; Central Office of Information Britain;Hara, T. (2000, 2001); Hiraishi, N. (1973); Kamio, M. (1992); The Foundation for Children's Future(2000);Kojima, H. (1996,2000); Matsubara, N. (1995); Nakamura, Y. and Ichibangase, Y. (1999);National Federation of Health Insurance Societies; The Japan Institute of Labour(1996,1998); Nishioka, H. (2001); Ministry of Labour; Saitou, J. (1992); Shibayama, E. (1992,1993); Tsuya, N. (1996,2000); Yamazaki, T. (1999)
a. Total leave
020406080
100120140160180200
1960 1965 1970 1975 1980 1985 1990 1995 2000
Year
Wee
ks
b. Paid leave
020406080
100120140160180200
1960 1965 1970 1975 1980 1985 1990 1995 2000
Year
Wee
ks
c. Full pay weeks
0
20
40
60
80
100
1960 1965 1970 1975 1980 1985 1990 1995 2000
Year
Wee
ks
Japan Sweden NorwayGermany Austria France(first child)France(third child) Belgium ItalyS i U i d Ki d U i d S

Journal of Population and Social Security (Population), Supplement to Volume 1
23
Figure 11. The Relationship between Fertility and Childcare Facility Enrollment Rate of (a) Children aged 0-2 or (b) Children aged 3-6 (2000). (a) For Children aged 0-2.
Enrollment rate of children aged 0-2
100 90 80 70 60 50 40 30 20 10 0
Total fertility rate
2.5
2.0
1.5
1.0
New Zealand United States
United Kingdom
Portugal
Spain Italy
Belgium
France
Netherlands
Austria Germany
Finland Denmark
Sweden
Japan
(b) Children aged 3-6.
Enrollment rate of children aged 3-6
100 90 80 70 60 50 40 30 20 10 0
Total fertility rate
2.5
2.0
1.5
1.0
New Zealand United States
United Kingdom Portugal
Spain Italy
Belgium
France
Netherland
Austria Germany
Finland Denmark
Sweden
Japan
Source: (Kamerman S.B., 2000.)
Journal of Population and Social Security (Population), Supplement to Volume 1
24
Figure 12. Trends in theRatio of Child Allowance (a) for the First Child and(b) for the Third Child to the Average Earnings for Employees in Manufacturing Industry for Selected Countries .
Source: U.S. Department of Health, Education, and Welfare; Hara, T. (2000); National Federation of Health Insurance Societies;Kondou, I.(1997); Saitou, J. (1992,1994); Ohta, Y. (1987); Tsuya, N. (1996); Tanaka, K. (1999)Child Allowance Study Group (2000); The Foundation for Children's Future(1999)
(a) For benefits for the first child
0.00
5.00
10.00
15.00
20.00
25.00
1960 1965 1970 1975 1980 1985 1990 1995 2000
Year
% o
f av
era
ge e
arnin
gs
Japan
Sweden
Germany
France
Italy
United Kingdom
(b) For benefits for the third child
0.00
5.00
10.00
15.00
20.00
25.00
1960 1965 1970 1975 1980 1985 1990 1995 2000
% o
f av
era
ge e
arnin
gs
Japan
Sweden
Germany
France
Italy
United Kingdom

Journal of Population and Social Security (Population), Supplement to Volume 1
25
Table1. The ratio of Child Allowance, Income Tax Exemption and the Sum of Both to the Average Earnings of Workers in Manufacturing Industry: For Single-earner Families with Two Children.
Social Security
Child allowances Tax credit Tax allowances TotalJapan 0 - 2.28 2.28
Sweden 8.16 - - 8.16Denmark 6.67 - - 6.67Finland 9.77 - - 9.77Norway 8.36 1.37 9.73
Germany 9.86 9.86Austria 12.92 4.34 - 17.26
Netherland 7.13 0 7.13Switzerland 8.22 0.07 8.30
France 6.02 - 6.02Belgium 10.21 2.58 - 12.79
Luxembourg 15.02 3.98 - 19.00Italy 9.44 1.73 - 11.17Spain 3.35 3.35
Portugal 5.05 2.71 - 7.76Greece 0
United Kingdom 7.02 0 - 7.02United States - 3.34 2.75 6.09
Australia 3.13 3.13New Zealand - 0 0
Canada - 6.32 6.32Source: OECD, Taxing Wage 1999-2000Note:- indicates that there is no such system.0 indicates that benefits are zero because the average earmings of workers in manufacturing industry surpass the levels of income limitations applicable to either child allowances or tax benefits.Blank means no information
Income tax
Journal of Population and Social Security (Population), Supplement to Volume 1
26
Figure 13. Trends in the ratio of the Sum of Child Allowance and Income Tax Exemption to the Average Earnings of Work Manufacturing Industry: For Single-earner Families with Two Children.
Source: OECD, The Tax/Benefit Position of Production WorkersOECD, Taxing Wage 1999-2000
0
5
10
15
20
1975 1980 1985 1990 1995 2000
JapanSwedenGermanyFranceItalyUnited KingdomUnited States

Journal of Population and Social Security (Population), Supplement to Volume 1
27
Reference Atoh, Makoto, 1994. The Recent Fertility Decline in Japan: Changes in Women’s
Role and Status and the Policy Implications, in Population Problems Research Council (PPRC), Mainichi Newspapers, The Population and Society of Postwar Japan, Tokyo, The Mainichi Newspapers, 1994, pp.49-72.
Atoh, Makoto, 1996. “The Direction of Changes in Japanese Families in terms of Parent-Child Relationship,” Population Problems Research Council, Toward a New Century of “Equality and Symbiosis” –The Report on the 23rd National Opinion Survey on Family Planning, The Mainichi Newspapers, pp.45-63.
Atoh, Makoto, 2000a. The Contemporary Demography, Nihon Hyoronsha. (Japanese) Atoh, Makoto, 2000b “Measures to Cope with Below-Replacement Fertility:
What is Needed?,” Population Problems Research Council (ed.), Japanese Population: Postwar Fifty-Years Trajectory, Mainichi Newspapers, pp.153-178.
Atoh, Makoto, 2001. “Why are Cohabitation and Extra-marital Births so Few in Japan?” paper presented at EURESCO Conference on the Second Demographic Transition held in Germany in 2001.
Atoh, Makoto, 2002. “Family Policies in Japan” in the Population Association of Japan (ed.), Encyclopedia of Population, Baifukan, 2002, pp. 924-928. (Japanese)
Becker, Gary, 1960. “An Economic Analysis of Fertility,” National Bureau of Economic Research, Demographic and Economic Changes in Developed Countries, Princeton University Press.
Bongaarts, John, 1998. “On the Quantum and Tempo of Fertility” Population and Development Preview 24-2, pp.271-292.
Calot, Gerard, 1996. “Fertility Trends and Family Policies in France,” in Atoh, Makoto, Population Issues in Developed Countries, Tokyo University Press, pp.195-220. (Japanese)
Council of Europe, 2001. Recent Demographic Developments in Europe. Economic Planning Agency (EPA), 1993. The 1992 White Paper on Living
Conditions: The Coming of Low Fertility Society -Its Impact and Policy Responses. (Japanese)
Esping-Andersen, G. 1990. The Three Worlds of Welfare Capitalism, Cambridge, Polity Press.
Funabashi, Keiko, 1998. “Gendering Parental Leave Arrangements: Changing Men’s Roles in the Nordic Countries,” Kazoku Shakaigaku Kenkyu(Japanese Journal of Family Sociology) No.10(2), pp.55-70. (Japanese)
Furuhashi, Etuko, 1993. “Parental Leave and Care Leave,” Institute for Social Security Research (ed.), Women and Social Security, Tokyo-Daigaku Shuppankai, pp.113-133. (Japanese)
Gauthier, Anne, 1996. The State and the Family: A Comparative Analysis of Family Policies in Industrialized Countries, Oxford, Clarendon Press.
Hara, Toshihiko, 2000. “German-speaking Countries,” The 1999 Report of the Project on the Comparative Study of Below-Replacement Fertility and

Journal of Population and Social Security (Population), Supplement to Volume 1
28
Family Policies in Developed Countries, Research Fund for Welfare Policies, pp.87-224. (Japanese)
Hara, Toshihiko, 2001. “German-speaking Countries,” The Comprehensive Report of the Project on the Comparative Study of Below-Replacement Fertility and Family Policies in Developed Countries, Research Fund for Welfare Policies, pp.57-160. (Japanese)
Hiraishi, Nagahisa, 1973. “The Protection of Female Workers in Italy,” Overseas Information on Social Security, No.22, pp.11-20. (Japanese)
Institute of Population Problems (IPP), 1993. Marriage and Fertility among Japanese Married –The Report on the Tenth National Fertility Survey. (Japanese)
Japan Institute of Labor (ed.), 1996. Research Report 83: Studies on the Impact of Parental Leave Act on Employment Management and Labor Activities, JIL, pp.125-140. (Japanese)
Japan Institute of Labor (ed.), 1998. Research Report 81: Studies on Male Participation into Childcare in Foreign Countries, JIL, pp.87-161. (Japanese)
Kamerman, S. B. 2000. “Early Childhood Education and Care: An Overview of Developments in the OECD Countries,” International Journal of Educational Research Vol.33, pp.7-29.
Kamio, Machiko, 1992. “Parental Leave Act in France,” Labor Law Quarterly, No.163, pp.68-79. (Japanese)
Kojima, Hiroshi, 1996. “Fertility Decline and Family Policy in France,” in Atoh, Makoto, Population Issues in Developed Countries, Tokyo University Press, pp.157-193. (Japanese)
Kojima, Hiroshi, 2000. “French-speaking Countries,” The 1999 Report of the Project on the Comparative Study of Below-Replacement Fertility and Family Policies in Developed Countries, Research Fund for Welfare Policies, pp.225-330. (Japanese)
Kojima, Hiroshi(ed.), 2002. The Comprehensive Report of the Project on the Comparative Study of Below-Replacement Fertility and Family Policies in Developed Countries: 1999-2001, Research Fund for Welfare Policies. (Japanese)
Kondou, Isao, 1997. Fifty Years of Social Security, Koudan-sha Service Center, pp.304-342. (Japanese)
Leibenstein, Harvey, 1957. Economic Backwardness and Economic Growth: Studies in the Theory of Economic Development. John Wilely & Sons.
Lesthaeghe, Ron et al., 2000. “Recent Trends in Fertility and Household Formation in the Industrialized World,” Jinko Mondai Kenkyu (Journal of Population Problems), 56-3, pp.1-23. (Japanese)
Matsubara, Nobuko, 1995. Childcare & Long-term Care Act, Romu Gyosei Kenkyujo. (Japanese)
Ministry of Health and Welfare (Bureau of Families and Children), 1992. Interprelation of Child Allowance Code, Chuo-hoki. (Japanese)
Ministry of Health and Welfare (Bureau of Families and Children), 1994. Interpretation of Child Allowance Code. Kosei-Koho Kenkyukai. (Japanese)
Ministry of Health and Welfare (MHW), 1998. The 1998 white Paper on Health
Journal of Population and Social Security (Population), Supplement to Volume 1
29
and Welfare. (Japanese) Ministry of Health, Labor and Welfare (MHLW), 2002a. The 2002 White Paper
on Health, Labor and Welfare. (Japanese) Ministry of Health, Labor and Welfare (MHLW), 2002b. The Report on
Shosika-Taisaku (Measures to Cope with Low Fertility) Plus One -Proposal for Further Extension of Shosika-Taisaku. (Japanese)
Ministry of Labor (Bureau of Labor Regulation) ed., 1975. Labor Regulation Code, Romu-Gyosei Kenkyujo. (Japanese)
Ministry of Labor, The State of Working Women. (Japanese) Nakamura, Yuichi et al., 1999. Social Welfare in the World: 5, France and Ltaly,
Junpo-sha. (Japanese) National Federation of Health Insurance Societies, various years, Social Security
Yearbook. (Japanese) National Institute of Population and Social Security Research (NIPSSR), 1998.
The First Report on the Eleventh National Fertility Survey. (Japanese) National Institute of Population and Social Security Research (NIPSSR), 1999.
The Second Report on the Eleventh National Fertility Survey. (Japanese) National Institute of Population and Social Security Research (NIPSSR), 2002a.
Population Projections for Japan as of January 2002, NIPSSR Research Series, No.303. (Japanese)
National Institute of Population and Social Security Research (NIPSSR), 2002b. Latest Demographic Statistics, 2001/2002. (Japanese)
Nishioka, Hachiro, 2001. “Southern European Countries,” The 2000 Report of the Project on the Comparative Study of Below-Replacement Fertility and Family Policies in Developed Countries, Research Fund for Welfare Policies, pp. 407-514. (Japanese)
Nishioka, Hachiro, 2002. “Southern European Countries”, The 2001 Report of the Project on the Comparative Study of Below-Replacement Fertility and Family Policies in Developed Countries, Research Fund for Welfare Policies, pp.293-428. (Japanese)
OECD, 1995. Employment Outlook, Paris, July. Ogawa, Naohiro, 1996. Single Japanese Women’s Attitudes toward Marriage and
their Career Plans, Population Problems Research Council, The Mainichi Newspapers, The Report on the 23rd National Opinion Survey on Family Planning, Tokyo, The Mainichi Newspapers, 1996, pp.145-170.
Ohta, Yoshitake, 1987. “Social Allowances,” Institute of Social Policies, Social Security in Sweden, University of Tokyo Press, pp.10-12. (Japanese)
Ruhm, C.J., et al., 1995. “Parental Leave Policies in Europe and North America,” NBER Working Paper.
Saitou, Junko, 1992. “Austria: The State and Issues of Parental Leave,” Japan Labor Research Review, No.396, pp.62-64. (Japanese)
Shibayama, Emiko, 1992. “Parental Leave and Childcare in the 1990’s: EC and Italy,” Labor Law Quarterly, No.163, pp.89-97. (Japanese)
Shibayama, Emiko, 1993. Low Fertility and Egalitarianism: Current States and Issues in Five European Countries, Shakai Hyoron-sha. (Japanese)
Study Group on Child Allowance (ed.), 2000. Interpretation of Child Allowance

Journal of Population and Social Security (Population), Supplement to Volume 1
30
(RevisedEdition), Chuo-Hoki. (Japanese) Tanaka, Koutaro, 1999. “Family Allowances,” in Furuse, Toru et al., (ed.), Social
Security in Developed Countries 4: Germany, University of Tokyo Press, pp.131-149. (Japanese)
The Foundation of Children’s Future, 1999. Overseas Study Report: Survey on Policies for Improving Childcare Environment in Foreign Countries, pp.35-68. (Japanese)
Tsuya, Noriko, 1996. “Fertility Decline and Family Policy in Sweden,” in Atoh, Makoto, Population Issues in Developed Countries, Tokyo University Press, pp.49-82. (Japanese)
Tsuya, Noriko, 2000. “Northern European Countries,” The 1999 Report of the Project on the Comparative Study of Below-Replacement Fertility and Family Policies in Developed Countries, Research Fund for Welfare Policies, pp.331-402. (Japanese)
Tsuya, Noriko, 2002. “Northern European Countries”, The 2001 Report of the Project on the Comparative Study of Below-Replacement Fertility and Family Policies in Developed Countries, Research Fund for Welfare Policies, pp.99-200. (Japanese)
United Nations, 2002. National Population Policies, 2001. US. Department of Health, Education and Welfare (US-DHEW), various years.
Social Security Programs throughout the World. US Government Printing Office.
Yamazaki, Takashi, 1999. “The State of Parental Leave in European Countries,” Reference No.577, pp.53-79. (Japanese)
Makoto Atoh (The National Institute of Population and Social Security Research) [email protected] Mayuko Akachi (The National Institute of Population and Social Security Research) [email protected]