Embed Size (px)
DESCRIPTION
Family Planning to Reduce Fertility Rates. Family Planning / Birth Control. Family Planning is about choice It is tied closely to: Infant mortality Maternal mortality Health of families, including reproductive health Education Income Religious and social values. - PowerPoint PPT Presentation
Citation preview

Family Planning to Reduce Fertility Rates
Family Planning / Birth Control
• Family Planning is about choice• It is tied closely to:
– Infant mortality– Maternal mortality– Health of families, including reproductive
health– Education– Income– Religious and social values

Family Planning / Birth Control
• 150 million women do not want another child, but do not use contraception (Campbell)
• Technology is a means to an end, but the ends (number of children / family) will vary by many factors
• High prevalence of contraceptive usage from surveys does not mean that fertility rates will be low

Family Planning / Birth Control
• Institutional barriers to availability• Cultural and religious• Legal (rules on abortion/contraception)• Medical and other practices• Provider bias
– Rx needed for OCs
• Cost• Lack of supply

Family Planning and Birth Control
• Personal/familial barriers to availability– Financial
• More children required for familial support part of the cycle of poverty
• too expensive if >1% of income– Lack of knowledge, misinformation– Fear of side effects– Family and social disapproval– Ambivalence to future childbearing– Method of choice


Relationship between Prevalence of Usage of Methods of Contraception
Women (1,000s)
Year Prevalence-any
method
Fertility rates
1970-75
Fertility rates
2000-5
% change in population 1970-2000
World 1,134,650 2003 63.1 4.1 2.6 62.6
More developed
154,469 1999 67.4 2.1 1.6 N/A
Less developed
980,181 2004 62.4 5.2 2.6 N/A
China 260,743 2004 90.2 5.7 1.4 46.9
Bangladesh 32,074 2004 58.1 6.1 3.0 96.7
India 223,179 2005-6 56.3 4.9 2.8 87.5
Europe 96,762 1997 67.5 2.2 1.4 9.5
Canada 4,239 1995 74.7 2.3 1.5 40.4
USA 35,491 2002 72.8 2.5 2.0 35.9

Lack of Support for Family Planning
• 1994 International Conference on Population and Development
• Estimated costs for family planning, safe childbirth, HIV/AIDS: $25 billion / annum (2005)

Lack of International Assistance

Not Meeting Priorities

Case Study: USA, Factors Affecting Fertility Rates

The USA• Current population: 316.9 million• Population 2050 (medium variant): 403.1
million• % population 0-15: 20%• Population density: 42/km2

US Population, by Variant
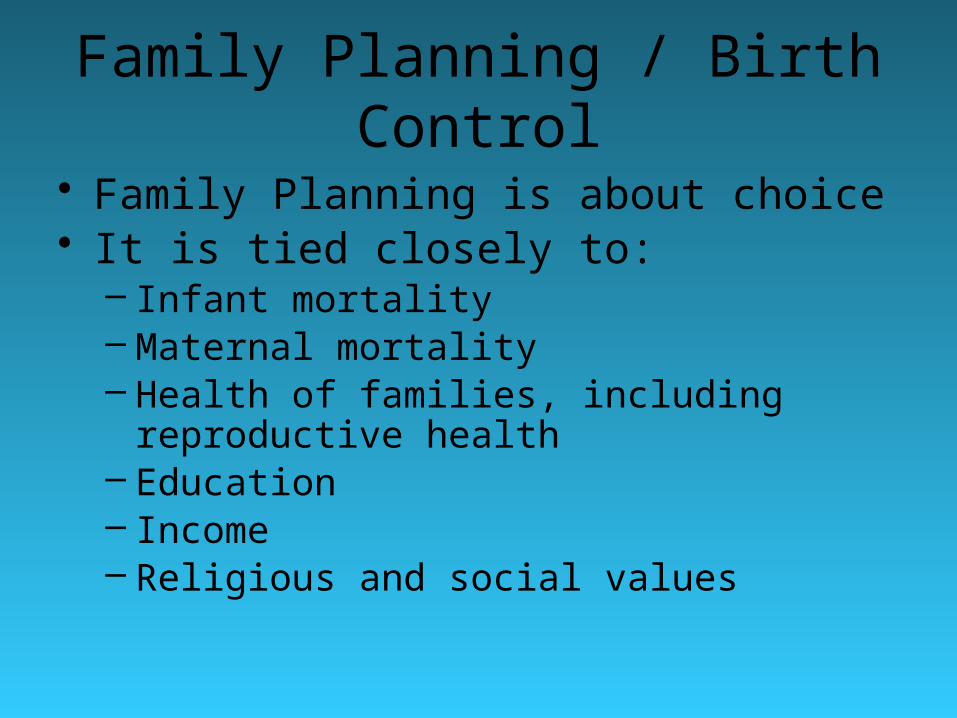
Other Parameters

Population Pyramids: US and Canada, 2010
TFR:
2.06
1.69

Population Pyramids: US and Italy, 2010
TFR:
2.06
1.39
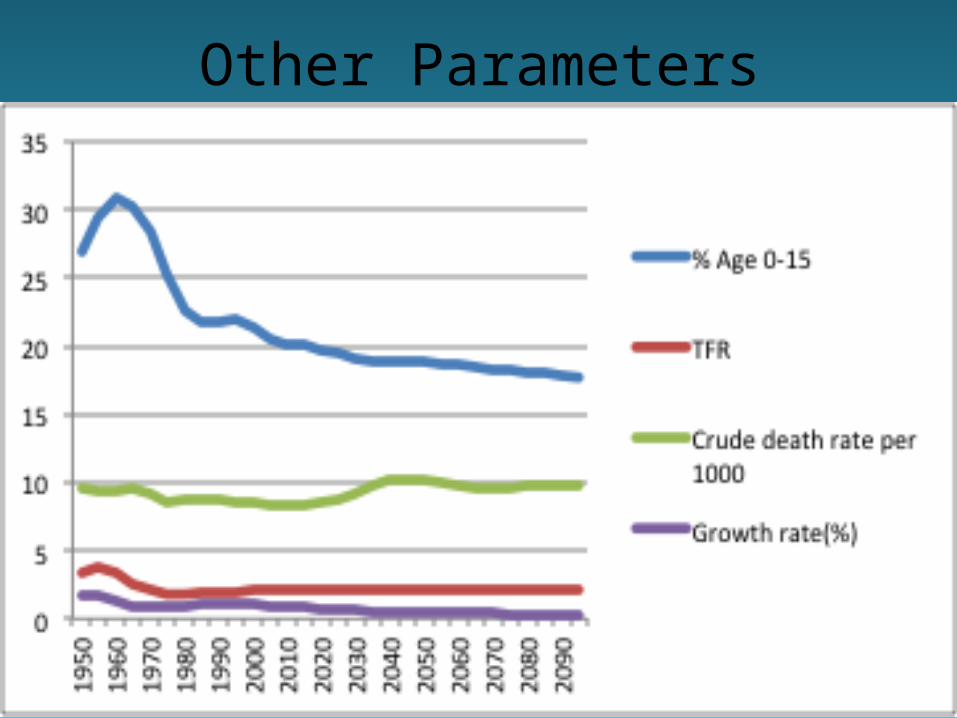
Population Pyramids: US 2010 and 2050
TFR:
2.06
2.09

Population Pyramids: US and Italy 2050
TFR
2.09
1.91

Effect of Immigration in the US: Comparison of Simplified Estimates
(in millions)
US
With (0.9%) Without (0.6%)
2008 304.5
2025 354.6 337.1
Natural increase 17.5 (~35%)

Potential Effect of Adequate Birth Control on the US Population
• ~60% of population growth from births exceeding deaths
• 4.1 million births, 2.4 million deaths (2003)
• ~40% due to immigration• Unintended pregnancies: 1.4 million• If unintended pregnancies were prevented natural increase in the US population would be about 340,000
• Total annual increase with immigration = 340,000 + 1,160,000 = 1.5 million instead of 2.9 million From Speidel et al.

Race is a Predictor of Pregnancy Rate in the USA
From: Trends in Pregnancy Rates for the US 1976 – 1997.National Vital Statistics Report, Vol. 49, No. 4, June 6, 2001


Race is Associated with Income: USA, 2001
Race Population (1,000) $
All 109,297 42,900
White 90,682 45,225
White, not Hispanic 80,818 47,041
Black 13,315 29,939
Asian/Pacific Islander 4,071 54,488
Hispanic, any race 10,497 34,099
Income in the United States: 2002. US Census Bureau

Issues
• The conservative and religious right and the Catholic Church
• No universal access to abortion• No universal programs for birth control• Poverty and lack of education• ~17 million US women require services
– Requires ~$3.5b of which $1.3b have been made available

Case Study: The Philippines

The Philippines• ~7000 islands• Current population: 93.3 million (12th most populous country)• Expected population 2050 (medium variant): 155 million• Population density: 311/km2
• Religion: 81% Roman Catholic• Per capita income: $US1,400

Population Pyramids: 2010 and 2050
TFR
3.05
2.06
Population
93 million
155 million

Population Projections: The Philippines


The Philippines
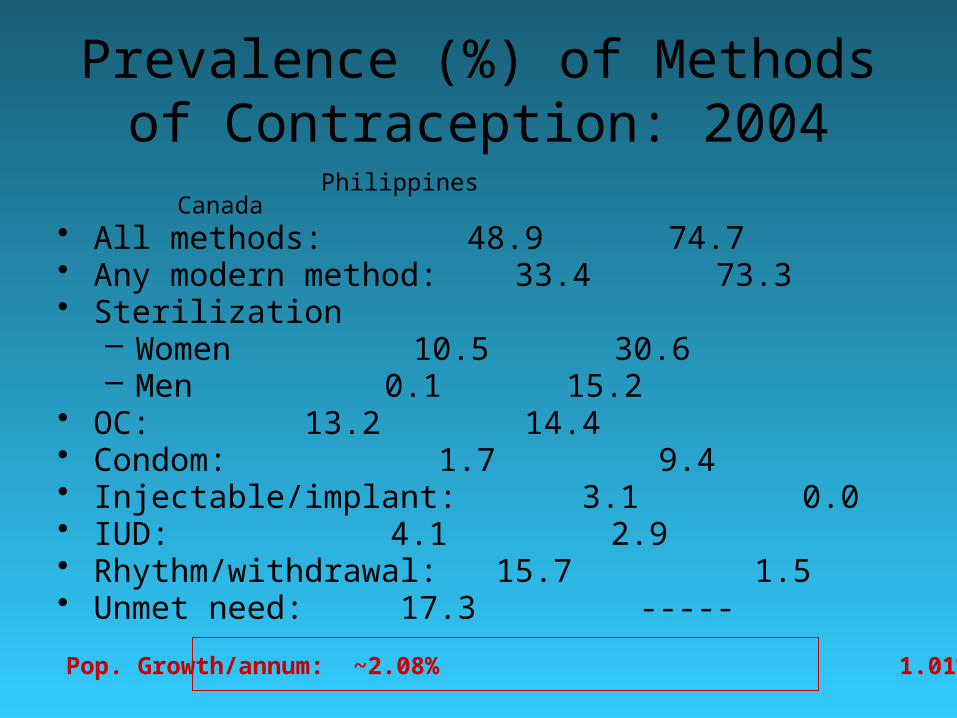
Prevalence (%) of Methods of Contraception: 2004
Philippines Canada• All methods: 48.9 74.7• Any modern method: 33.4 73.3• Sterilization
– Women 10.5 30.6– Men 0.1 15.2
• OC: 13.2 14.4• Condom: 1.7 9.4• Injectable/implant: 3.1 0.0• IUD: 4.1 2.9• Rhythm/withdrawal: 15.7 1.5• Unmet need: 17.3 -----
Pop. Growth/annum: ~2.08% 1.01%
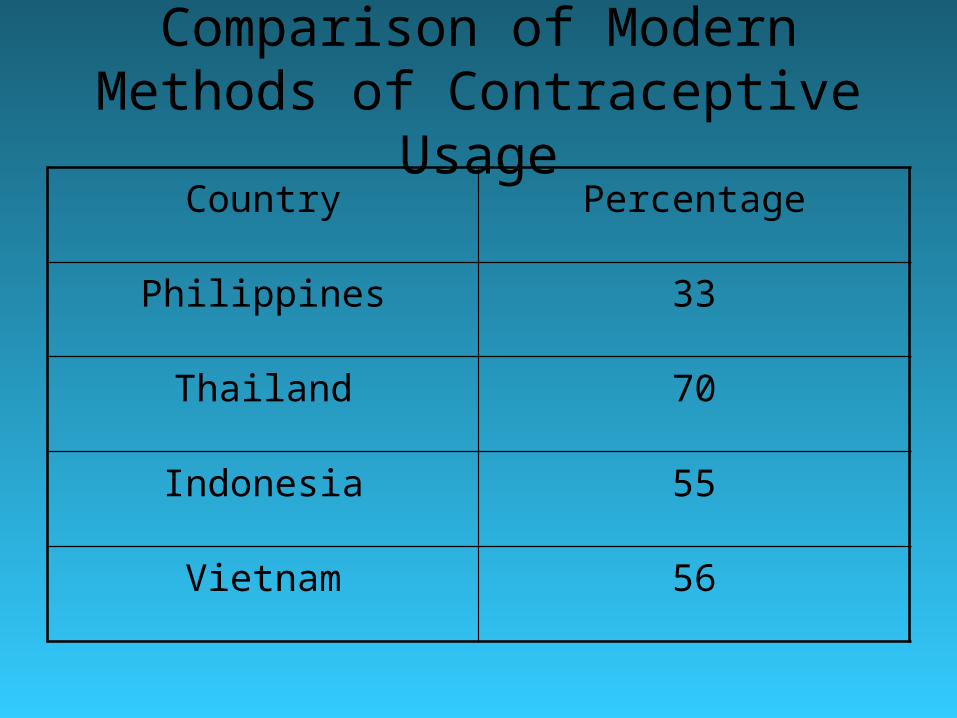
Comparison of Modern Methods of Contraceptive Usage
Country Percentage
Philippines 33
Thailand 70
Indonesia 55
Vietnam 56

Philippino National Policies Affect Fertility
• Population Commission established in 1970 and adopted by Congress
• Two opposing principles from the outset:– Achieve “optimal” population size– Choose methods of family planning according
to “cultural values” • Shift away from national
administration/oversight to a regional one

Barriers to Family Planning in the Philippines
• Marriage– Pre-marriage counseling for family planning
required for marriage license• Many locals delegated authority to Parish priests

Barriers to Family Planning in the Philippines
• Health care– Few MDs write prescriptions; law stipulates
that nurses and midwives can, but this is not done
– “Magna carta” for health workers 80% of resources to salaries and benefits
– Lack of training to health care providers to provide counseling continuing education
– Assumed that spousal consent required for tubal ligation

Barriers
• Pharmaceuticals (mostly oral contraceptives)– Drug formulary a barrier because of limited
number of listed drugs• No new oral contracpetives listed since the 1980s!
– Lack of coverage in private insurance– Lower prices
• Importation of generics prices• Bulk purchasing between countries in region• 10% VAT

Barriers
• Legal– Some regions banned access to modern-day
treatment (including Manila), in violation of national law
• Religion– The Roman Catholic Church has a profound
effect on family planning in the Philippines

Sea Level Increase of 1m

Case study: Bangladesh

Bangladesh• Current population: 148.7 million• Population 2050 (medium variant): 194.3 million• Population density: 1,033/km2 • Religion: 89.7% Islam; 9.2% Hinduism• Per capita income: $US 470

Population Pyramids: 2010 and 2050
TFR
2.2
1.6
Population
148.7
194.3

Bangladesh: Projections of the Population

Medium Projections
• 2020: 167.3 million– TFR = 1.84 (current: 2.2)– Population density ~ 1,162 / km2
• Expected to stabilize by 2050: 194.4 million – TFR = 1.58– Population density ~ 1,350 / km2
• Much lower than previous estimates Population density of Montreal: 4,439/ km2

Highly Urbanised
City City population Metro population
Dhaka 11,918,442 23,024,863
Chittagong 6,920,222 11,256,369
Khulna 3,400,689 8,492,659
Rajshahi 2,727,083 4,983,641
Sylhet 1,339,368 2,658,025
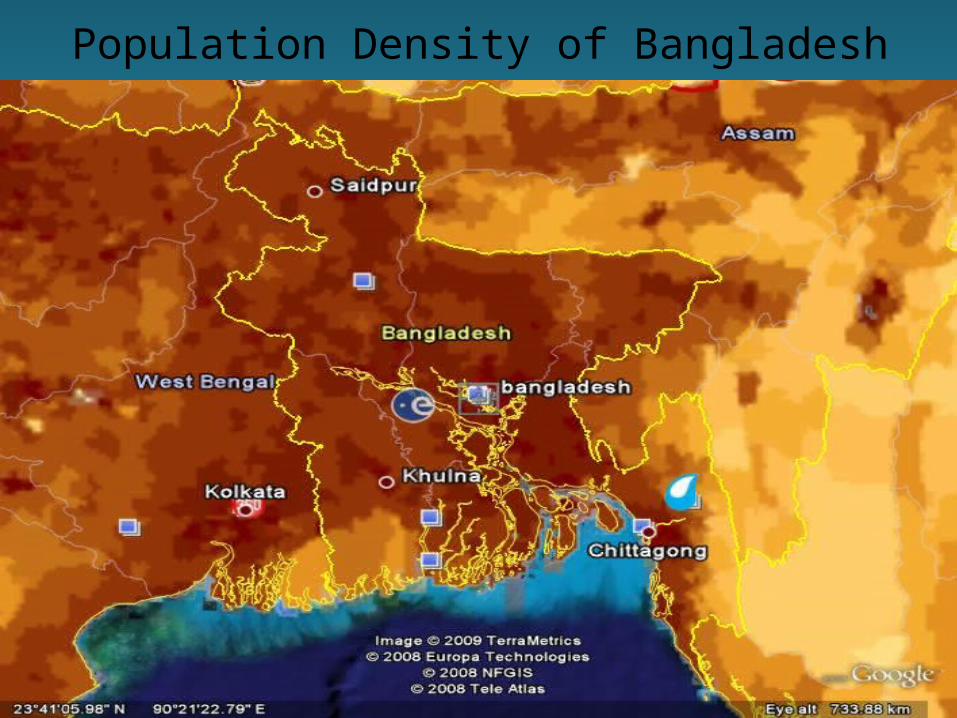
Population Density of Bangladesh

Bangladesh: Population Density
Per km2

Bangladesh: Selected Indicators
Medium variant (2010)

Age Structure: US and Bangladesh

Prevalence (%) of Methods of Contraception: 2004
Bangladesh Canada• All methods 58.1 74.7• Any modern method 47.3 73.3• Sterilization
– Women 5.2 30.6– Men 0.6 15.2
• OC 26.2 14.4• Condom 4.2 9.4• Injectable/implant 10.5 0.0• IUD 0.6 2.9• Rhythm/withdrawal 10.7 1.5• Unmet need 11.3 -----
Pop. Growth/annum: ~1.89% 1.01%

Abbreviated History
• Family planning seen as important when Bangladesh was part of Pakistan (circa 1970)
• Early 1970s:– “No civilized measure would be too drastic to
keep the population of Bangladesh on the smaller side of 150 million for the sheer ecological viability of the nation”


Factors Associated with Discontinuation of Oral Contraceptives
in Rural Bangladesh
• Efficacy of OCs: in first year, one pregnancy per 1,000 women
• Effectiveness: – Thailand: 45 pregnancies / 1,000 women– Egypt: 165 pregnancies / 1,000 women– Bangladesh: 30 - 150 pregnancies / 1,000
women within first year of use

Factors Associated with Discontinuation of Oral Contraceptives
in Rural Bangladesh
• Reasons for failure: – Discontinuation of OCs
• 58% have ever taken OCs (2000)• 23% currently taking OCs
– Not taking OCs as prescribed– Side effects

Survey in 1995-96 in Rural Bangladesh
Mean age of women 29 years
Mean no. of children 3 (+2)
Muslim 91%
Any education 46%
Mean use of OC 27.5 months
Other contraceptives 22%
Side effects within 3 months 60%
Support of husbands 55%
Discontinued within 12 months 47%
Missed one or more active pill(s) during the 6 months before the survey
50%

Reasons for Discontinuation of OCs

Predictors for Discontinuation
Probability of stopping
More children Lower
Husband not supportive Higher
Longer use of OC Lower
Side effects Higher
Visited by welfare assistantPositive about OCs and provided information
Lower
Lower

Some Major Factors
• Deteriorating interactions between workers and clients– Poor quality interactions– Not frequent enough
• Door-to-door distribution of services highly dependent on foreign aid (NGOs, etc…)– Shift to fixed-site service from door-to-door– Moving to “one stop shopping” clinics (1998-2002)– Education of husbands essential– Proper management of side effects will reduce
discontinuation

Awareness of Husbands to Different Methods of Contraception, age 15-59, 1999-
2000Pill 94%
IUD 20
Injectable 45
Condom 80
Female sterilization 45
Male sterilization 27
Diaphragm 20
Abstinence 12
Withdrawal 3

Effectiveness of “Program”: Changes in Fertility Rates
Year
Fertility (mean number of
children per woman)
Prevalence of use of modern
contraceptive methods (%)
Population growth (%)
Population (millions)
19506.70 1.98 44
19706.15 2.47 70
1975 5.60 7 2.35 79
1980 5.25 2.47 89
1985 4.63 54 2.35 101
1990 4.12 2.22 113
1995 3.50 1.98 126
2000 3.22 58.1 1.89 139
2005 2.83 55.8 1.67 153
2010 2.63 1.56 167

New Directions
• Clinic-based approach– A big gamble
• Requires massive funding from developed countries
• Integrated Plan including overall health and welfare

Climate Change and Population
Effect of Climate Change in Bangladesh


Flooding from Rain in October 2005


Bangladesh, M. A. Mohit at his family village, Bhola Island, where6-7 Km of the town has eroded away.
http://www.worldviewofglobalwarming.org/pages/rising-seas.html
Bangladesh erosion along river cuts a town in the middle, an increasing threat from global warming


Projected Sea Level Increases
Study by Vermeer et al. 2009 PNAS

http://maps.grida.no/go/graphic/potential-impact-of-sea-level-rise-on-bangladesh
(1989)
Based on IPCC TAR
By 2020, expected population ~ 167 million 28 million affected
Chitagong (11.3 million)

Sea levels could rise by up to 1.5m by the end of this century

Population Density and Some Cascading Effects

Population Density
From Wikipedia, based on UN data

Population Density
1
10
100
1000
10000
Year
Den
sit
y (
pers
on
s p
er
km
2)
World
Canada
USA
Europe
China
India
Bangladesh

Some Population DensitiesRank Persons/km2
World 48
1 Monaco 23,660
3 Hong Kong 6,407
30 Japan 339
EU 112
172 US 31
219 Canada 3.2
Montreal 4,439
New York 10,456
Chennai, India 24,000

Influenza Pandemic: Overcrowding and Questionable
Animal Husbandry Practises

1918-1919 Spanish Flu (H1N1) Pandemic
• Within 10 months:– 500 million people infected– 20-50 million deaths (4-10%)– 50% of deaths were among people age 20-40

Influenza Today
• US: 36,000 deaths annually attributed to influenza-related complications (JAMA 2002;289[2]:179-86)
• Canada: ~4,000 deaths annually (Epidemiol. Infect. 2007;1-8)– Rate of 13/100,000 persons or 2% of all
deaths

Schanzer et al. Epidemiol. Infect. 2007;1-8

Other Pandemics
• 1957-58: “Asian flu” (H2N2) 70,00 deaths in the U.S.
• 1968: “Hong Kong flu” (H3N2) ½ million deaths worldwide
• 1976: “Swine flu”• 1977: “Russian flu”• 2009-10: “Swine flu” (H1N1/09)

New Threat in China (Avian H7N9)
• Usually restricted to birds but last year people were infected
• May 2013: 132 cases, • 37 deaths (~30% case-fatality)• Shandong, Zhejiang, Henan, Hunan,
Fujian, Jiangxi, Jiangsu, Beijing

H7N9
• Natural infections with H7N9 viruses in chickens, ducks and other birds are asymptomatic
• An immune response can be detected through blood tests
• Currently no human to human transmission
• Human transmission was limited by closing live poultry markets

Avian Flu as a Source of Human Influenza

Onset of Pandemic
• Mutation of virus• Mixing of this avian and a human flu
– “Naturally” (transformation in pigs)– From infected individuals (e.g., workers
involved in the cull)
See paper by Webster on DVD

Proposed Model

Other Avian Outbreaks
• 1999: Influenza A (H9N2) in 2 children– likely infected from poultry
• 2003: Influenza A (H5N1) in 2 members of a Hong Kong family who visited China ( 1 death)– Unknown source of infection

Other Avian Outbreaks
• 2003: Influenza A (H7N7) in poultry workers and their families in the Netherlands– 80 cases of infection
• 2003: Influenza A (H9N2) in 1 child in Hong Kong
• 2004: “US avian flu”– Delaware: H7 strain
• 12,00 chickens culled so far


Chickens in a market in Shanghai.

A vendor sells chickens in a market in Ho Chi Minh City in early January 2004.

Cock Fighting in Bangkok

A bundle of live chickens gets a quick squirt of disinfectant Long Bien market, Hanoi

A masked man on a motorcycle carries ducks from Long An to market in Ho Chi Minh City, Vietnam, on Jan. 15, 2004.


Farmers in Indonesia burn their dead chickens:
Jakarta said it would vaccinate infected birds

Hong Kong Outbreak 1997
• 1 million birds slaughtered after the spread of the “bird flu”
• influenza A virus (H5N1)• 18 people infected; six died
– “The world is teetering on the edge of a pandemic that could kill a large fraction of the human population” Webster and Walker, Am Scientist 2003

Recent Threats
• H5N1 avian flu in Asia• Highly pathogenic
– 14 people infected and 11 have died– Human-human transmission may have been
observed in Vietnam on February 1
• Containment– Culling: 20 million chickens slaughtered in 8 countries– Need to protect workers involved in the cull

2009 Pandemic
• H1N1 variant• Affected all age groups• Can develop pneumonia or acute
respiratory distress syndrome• Started in Mexico and was pandemic
between June 2009 and August 2010• About 14,000 deaths worldwide

Recent Pandemics and Epidemics
Pandemic YearInfluenza virus type
People infected
Estimated deaths worldwide
Spanish flu 1918–1919 A/H1N133% (500 million)
20–100 million
Asian flu 1956–1958 A/H2N2 ? 2 million
Hong Kong flu 1968–1969 A/H3N2 ? 1 million
Seasonal flu Every year
mainly A/H3N2, A/H1N1, and B
5–15% (340 million – 1 billion)
250,000–500,000 per year
Swine flu 2009–2010Pandemic H1N1/09
> 622,482 (lab-confirmed)
~18,036
http://en.wikipedia.org/wiki/2009_flu_pandemic

http://whyfiles.org/230birdflu2/


Carrying Capacity to Support Human Populations: What about
Other Species?

Just South of Dakha

Bangladesh
• What is the capacity of agriculture to generate employment and absorb the expanding population into gainful employment? What is the capacity of agriculture to feed the growing population?
• 88% of 8.774 million hectares has been cultivated
• Double (59%) and triple (22%) cropping increases the effective crop production by 150%– Can the land support this?

Has Bangladesh Reached the Limits of Agriculture?
• Key factors, all related to climate change – Availability of water
• seasonality of precipitation• lack of infrastructure to capture water from rivers
– Flooding – Increases in temperature
• Affecting crops and human health
• Will likely require massive influxes in food– See paper by Hardin “Carrying capacity as an ethical
concept”

Carrying Capacity
• Definitions of carrying capacity:– The supportable population of an organism, given the
food, habitat, water and other necessities available within an environment is known as the ... (en.wikipedia.org/wiki/Carrying_capacity)
– The number of people that an area can support given the quality of the natural environment and the level of technology of the population (www.let.rug.nl/usa/GEO/glossary.htm)
– The maximum population size that an ecosystem can support. (www.macmillanmh.com/science/2008/student/sc/grade5/glossary/c.html)

Carrying Capacity
• Ecological Footprint is supposed to estimate this for people– Other estimators?
• Is this the wrong question?• Is it answerable?

Additional Slides

Eliminating Unintended Pregnancies
• 2001: 6.4 million pregnancies (811,000 in teens)– 1.1 million miscarriages– 1.3 million abortions– 4 million births
• 3.1 million pregnancies were unintended (48.4%)– ~640,000 in teens (78.9%)
• 1.4 of 4 million births were unintended (35%)• Increment in the total US population is about 2.9 million
per annum• Natural increment is 60% x 2.9 million = 1.74 million• If unintended pregnancies were prevented (1.4 million)
natural increase in the US population would be about 340,000
• Total annual increase with immigration = 340,000 + 1,160,000 = 1.5 million instead of 2.9 million
From Speidel et al.