Embed Size (px)
Citation preview

Low cost sensor networks for measuring urban air quality
Rod Jones (and others)Centre for Atmospheric Science
University of [email protected]

Measuring Environmental Exposure, Montreal 2011
Granularity in urban air quality on all measured scales
• Substantial inhomogeneity exists in urban A/Q (sources, meteorology, chemistry)
• Non-linearity in chemical processes –main atmospheric science driver
• Precision (e.g. UK: AURN) fixed monitoring sites costly and sparse (capture real variability?)
• Low cost solutions (e.g. NO2 diffusion tubes) give time (>bi-week) averages (precision?)
® Alternative solutions?

2mm
Basis for sensor network system approach:
Low cost miniature gas Sensor technologies
• Electrochemical• Non Dispersive IR• Photo-ionisation Detection• Metal Oxide• SAW• ……..
>factor of 100 cheaper (and smaller) than traditional methods- if they can be made sensitive enough
Measuring Environmental Exposure, Montreal 2011
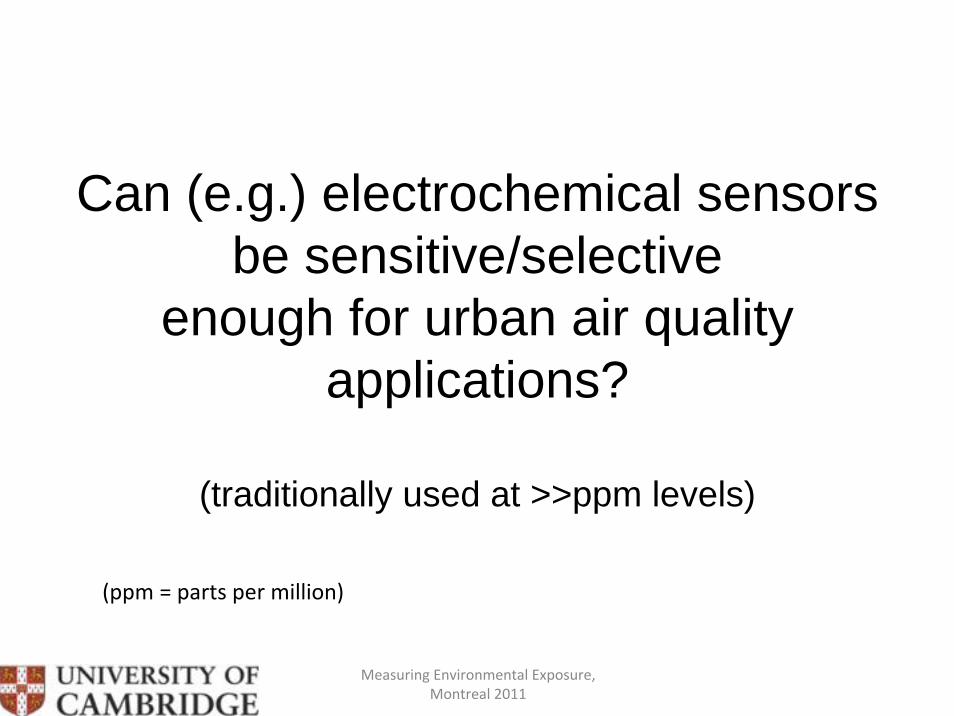
Can (e.g.) electrochemical sensors be sensitive/selective
enough for urban air quality applications?
(traditionally used at >>ppm levels)
(ppm = parts per million)
Measuring Environmental Exposure, Montreal 2011
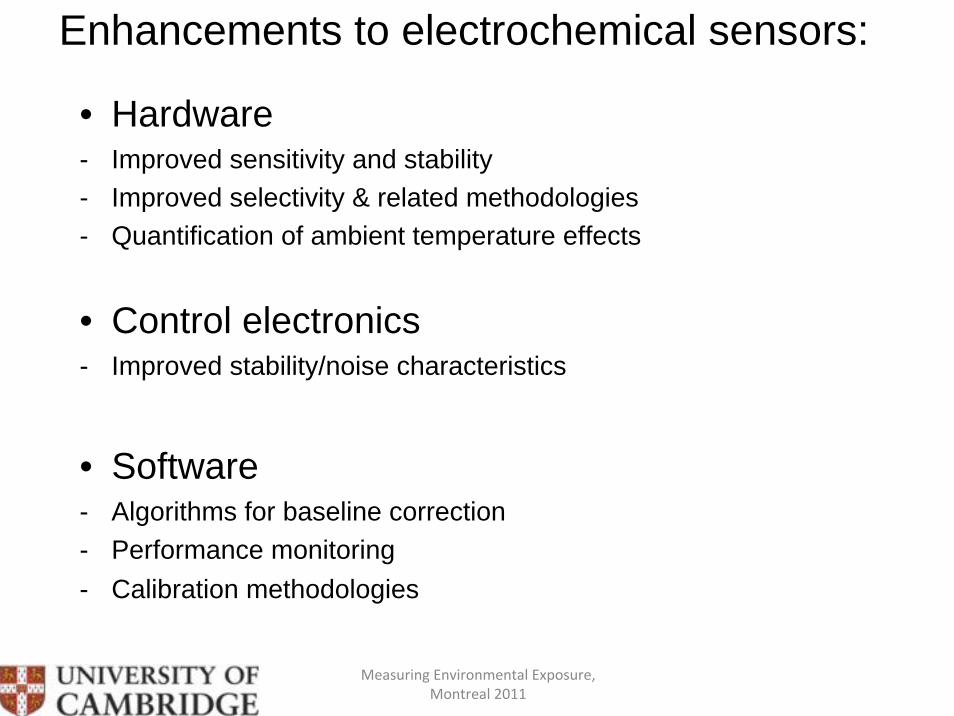
Enhancements to electrochemical sensors:
• Hardware- Improved sensitivity and stability- Improved selectivity & related methodologies- Quantification of ambient temperature effects
• Control electronics- Improved stability/noise characteristics
• Software - Algorithms for baseline correction- Performance monitoring- Calibration methodologies

Measuring Environmental Exposure, Montreal 2011
70ppb
35ppb
17ppb
8ppb3ppb
0ppb
(20 ppb of NO2 ~ 40⎧g/m3)
Performance of (enhanced) electrochemical sensors NO2 sensitivity (laboratory)
Measuring Environmental Exposure, Montreal 2011
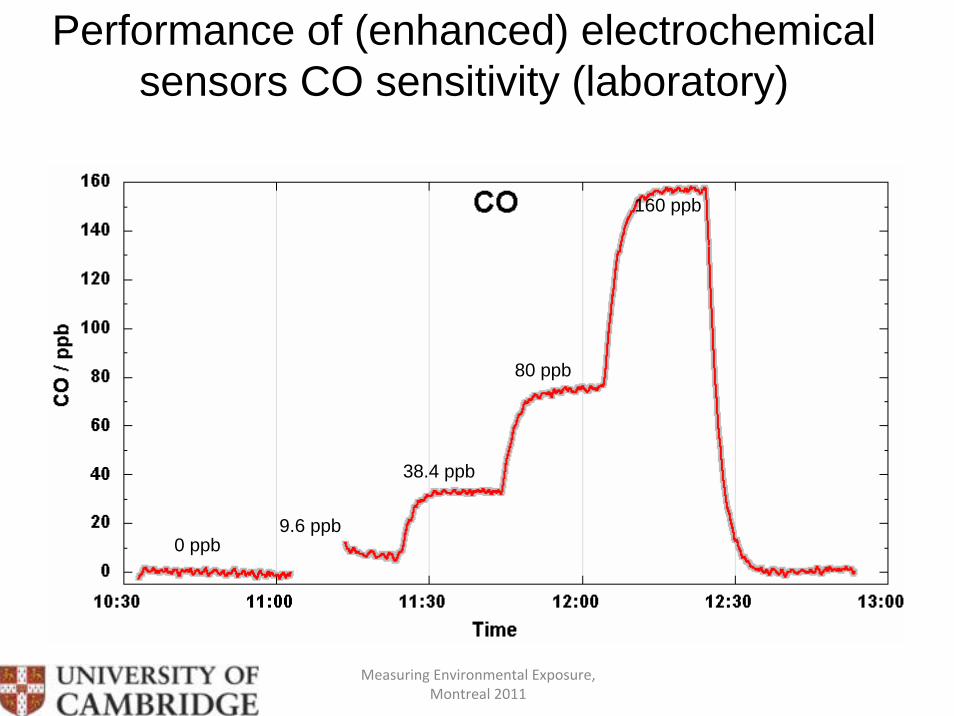
160 ppb
80 ppb
38.4 ppb
9.6 ppb0 ppb
Performance of (enhanced) electrochemical sensors CO sensitivity (laboratory)

Measuring Environmental Exposure, Montreal 2011
130 ppb
31.2 ppb
15.6 ppb7.8 ppb0 ppb 2.6 ppb
Performance of (enhanced) electrochemical sensors NO sensitivity (laboratory)

Measuring Environmental Exposure, Montreal 2011
Sensitivity at the ppb level, (repeatability + selectivity*) in laboratory
Current UK/EU threshold
Electrochemical sensor CO/NO/NO2sensitivity (laboratory)
* Some exceptions, but…

Measuring Environmental Exposure, Montreal 2011
Electrochemical sensor performance (laboratory)
Typical sensor sensitivities/LoD are < 5ppb (< 7⎧g/m3) for CO, 1-2 ppb (~2-4 ⎧g/m3) for NO and NO2.
SO2, O3 have comparable performance to NOx.
Typical sensor T90 ~ 10-20s (determined by diffusion)
Very low power consumption (⎧W)
Noise characteristics:

Measuring Environmental Exposure, Montreal 2011
Electrochemical sensor performance:
Is laboratory performance replicated in the field?
•Ambient temperature corrections…•Cross interferences…..•…….•…•..

Measuring Environmental Exposure, Montreal 2011
Electrochemical sensor baseline temperature dependence correction
Raw data (electrochemical, chemiluminescence)
Sensor temperature and baseline correction
Baseline temperature corrected(comparison with ratified data)
Measuring Environmental Exposure, Montreal 2011
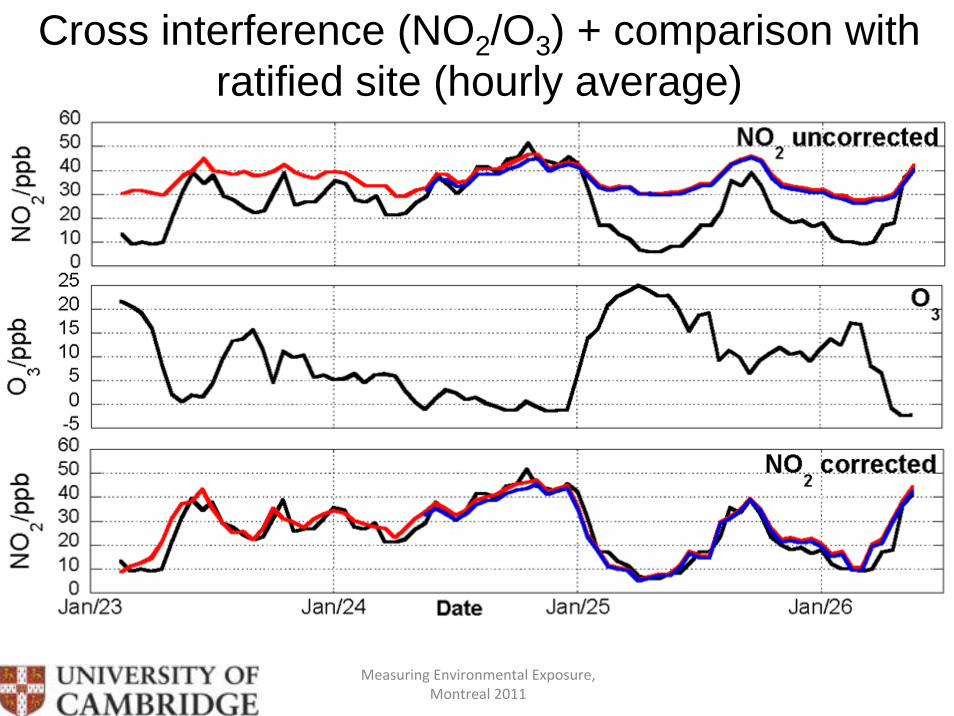
Cross interference (NO2/O3) + comparison with ratified site (hourly average)

Measuring Environmental Exposure, Montreal 2011
‘Real world’ comparison of NO2 and NO with ratified AURN site
Performance replicated in the field….* Corrected for O3 interference
* *

Measuring Environmental Exposure, Montreal 2011
Reproduced in field? – single sensor
NO2

Measuring Environmental Exposure, Montreal 2011
Co-located sensors (NO2) – real structure
(Uncorrected for O3)

Measuring Environmental Exposure, Montreal 2011
Co-located sensors (NO)

Measuring Environmental Exposure, Montreal 2011
Co-located sensors (CO)
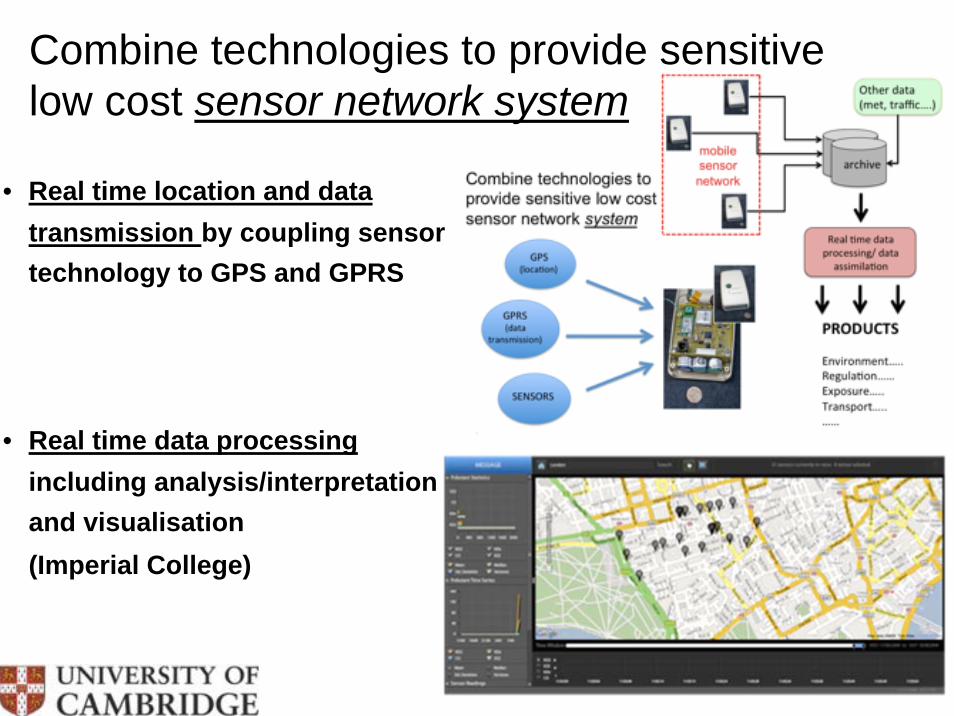
Combine technologies to provide sensitive low cost sensor network system
• Real time location and data transmission by coupling sensor technology to GPS and GPRS
• Real time data processing including analysis/interpretation and visualisation(Imperial College)

Measuring Environmental Exposure, Montreal 2011
Multi-species real time mobile measurements of air quality in complex environments
Multiple sensors, (NO2)
QuickTime™ and a decompressor
are needed to see this picture.
QuickTime™ and aCinepak decompressor
are needed to see this picture.
Relating traffic and CO, NO, NO2
CO ( ⎟ 50)NO ( ⎟ 5)NO2
Measuring Environmental Exposure, Montreal 2011
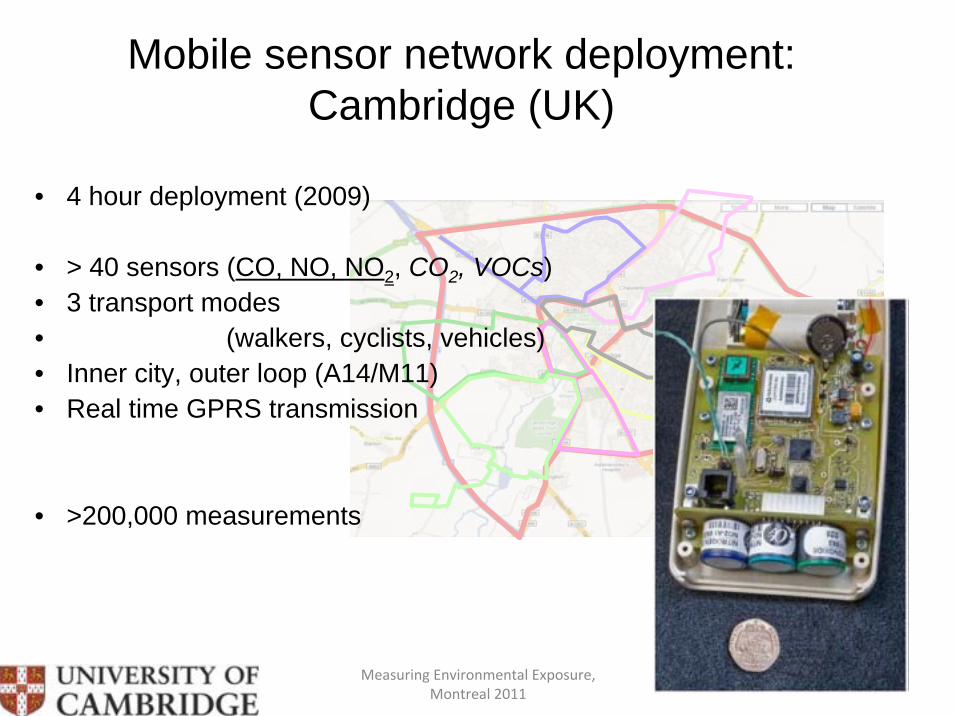
Mobile sensor network deployment: Cambridge (UK)
• 4 hour deployment (2009)
• > 40 sensors (CO, NO, NO2, CO2, VOCs)• 3 transport modes • (walkers, cyclists, vehicles)• Inner city, outer loop (A14/M11)• Real time GPRS transmission
• >200,000 measurements

Measuring Environmental Exposure, Montreal 2011
Cambridge deployment September 2009: NOx

Measuring Environmental Exposure, Montreal 2011
Visual determination of pollution hotspots – not possible with static sites

Measuring Environmental Exposure, Montreal 2011
Statistical assessment of mobile A/Q data by transport mode (simplest possible!)

Measuring Environmental Exposure, Montreal 2011
Derive ensemble averaged statistics –distinguish between transport modes:

Measuring Environmental Exposure, Montreal 2011
An example: NO2: car vs bicycle– rural vs motorway
Wind direction
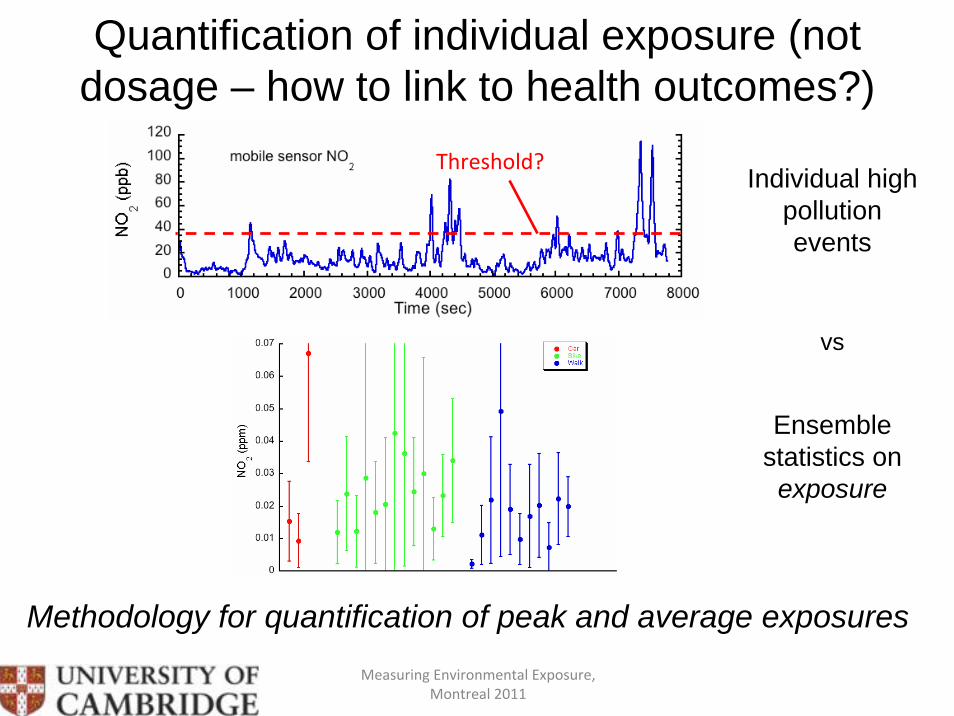
Personal exposure vs activity……..
Measuring Environmental Exposure, Montreal 2011
Quantification of individual exposure (not dosage – how to link to health outcomes?)
Methodology for quantification of peak and average exposures
Individual high pollution events
Ensemble statistics on exposure
vs
Threshold?

Comparison of different environments: (Cambridge vs Valencia (Spain))
Significant differences e.g. CO, NO2
- representativeness??
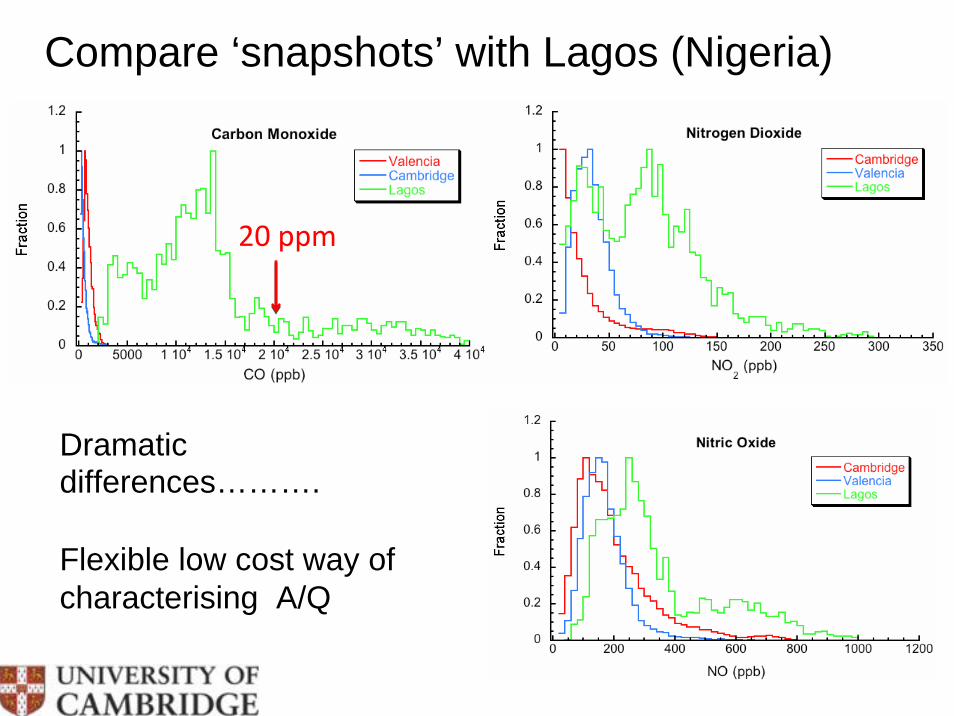
Compare ‘snapshots’ with Lagos (Nigeria)
Dramatic differences……….
Flexible low cost way of characterising A/Q
20 ppm

Validation of models
CERC ADMS model (David Carruthers)
Structure within street canyons?
Mobile sensor network quantification of personal exposure
Determine personal exposures rather than ‘simple’ spatial
distribution?

Measuring Environmental Exposure, Montreal 2011
Static Sensor Deployment, Cambridge (UK)
• >2 month deployment (May-July 2010)• >40 sensors (CO, NO, NO2) , T, RH• Lamp post mounted, GPRS (GPS)• Inner city, mixed urban, rural• Real time GPRS transmission
• >25,000,000 measurements

Measuring Environmental Exposure, Montreal 2011
1 month
1 week
1 day
4 hours (individual pollution events)
Static deployments (carbon monoxide)
Grid(46 sites)
vs

Measuring Environmental Exposure, Montreal 2011
A) High density statistical evaluations of A/Q
B) Source attribution in urban environment
• Industrial emissions (in this case airports)
BB
AA CC
Sensor network applications:
NO2
CO
NO
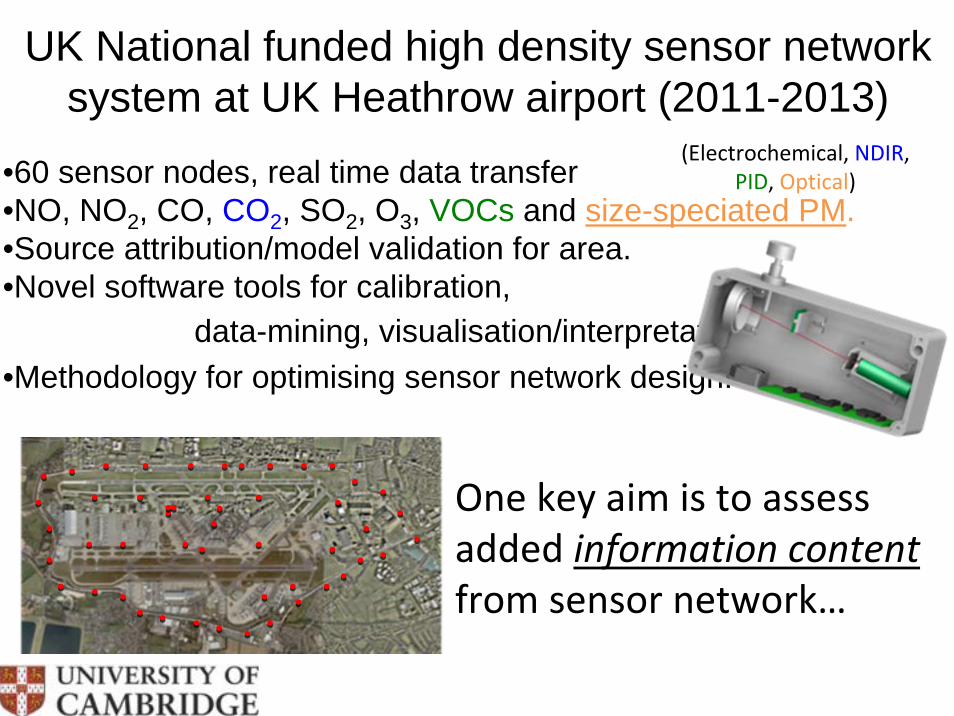
UK National funded high density sensor network system at UK Heathrow airport (2011-2013)
•60 sensor nodes, real time data transfer •NO, NO2, CO, CO2, SO2, O3, VOCs and size-speciated PM.•Source attribution/model validation for area. •Novel software tools for calibration,
data-mining, visualisation/interpretation.•Methodology for optimising sensor network design.
(Electrochemical, NDIR, PID, Optical)
One key aim is to assess added information content from sensor network…

High density sensor network system for air quality studies at Heathrow airport
Participants:Institution
InputUniversity of Cambridge (PI) sensors, a/q models
Imperial College London traffic models, visualisation
University of Hertfordshire aerosol measurements
University of Manchester aerosol measurements
CERC Ltd a/q modelling – ADMS
National Physical Lab. metrology, calibration
Alphasense Ltd sensor Monitoring Ambient Air 2011Royal Society of Chemistry

Measuring Environmental Exposure, Montreal 2011
High density sensor network system for air quality studies at Heathrow airport
Timeline:
Year 1 (2011): planning, sensor node manufactureYear 2 (2012, Q2): sensor network deployment Year 3 (2012-13): data mining, source attribution, network
design
watch this space!Monitoring Ambient Air 2011Royal Society of Chemistry

Measuring Environmental Exposure, Montreal 2011
Summary Remarks• Ultra small low cost A/Q sensors viable for relevant gas phase species
(demonstrated at least scientifically) at the ppb level- Quantification of air quality at high “actual” spatial resolution - “Real” personal exposure vs spatial maps- Source attribution
• Added value of dense networks (Heathrow Airport high density network?)
• Complement existing FSM networks
• Combine with air quality models (e.g. exposure quantification)
• Extend low cost philosophy……- Individual VOCs, other….- PM…..- Indoor air quality

Measuring Environmental Exposure, Montreal 2011
AcknowledgementsSensors and Sensor NetworksIq MeadLekan PopoolanGregor StewartJohn Saffell, AlphasenseMark HayesMark CallejaRobin NorthJeremy CohenPaul Kaye and UH teamDavid Carruthers (CERC)
Earlier workImperial CollegePeter Landshoff…….