Embed Size (px)
Citation preview

Understanding and Measuring the Urban Pervasive Infrastructure
Vassilis Kostakos, Tom Nicolai, Eiko Yoneki, Eamonn O’Neill, Holger Kenn, Jon Crowcroft
Department of Computer Science, University of Bath, UK TZI – Wearable Computing Lab, University of Bremen, Germany
Computer Laboratory, University of Cambridge, UK
Abstract The increasing popularity of mobile computing devices has allowed for new research and application areas. Specifically, urban areas exhibit an elevated concentration of such devices, enabling potential ad-hoc cooperation and sharing of resources among citizens. Here, we argue that people, architecture and technology together provide the infrastructure for these applications and an understanding of this infrastructure is important for an effective design and development. We focus on describing metrics for describing this infrastructure, and elaborate on a set of observation, analysis and simulation methods for capturing, deriving and utilizing those metrics.
Keywords Mobile applications, pervasive computing, computing methodologies, simulation and modeling, mobility.
Introduction No two cities are identical. Cities within a country can be as diverse as cities in different countries. Additionally, cities gradually change over time. Intuitively, we are aware of these differences, yet how can we express them in ways that are meaningful and useful to the designers of urban pervasive applications? The range of complex factors making a city unique, in respect to urban pervasive applications, includes that city’s urban spatial form, the people who inhabit it, and the technologies that operate in it. Taking a systemic view, these factors may be considered as the infrastructure of a city. These aspects are concrete enough and possible to measure with today’s technology. Just as traditional desktop-bound applications utilize technological infrastructure for their operation (e.g. networks, software services, etc), we propose that urban pervasive applications can draw on the available urban pervasive infrastructure. In designing urban pervasive computing systems, therefore, it is essential to take account of this infrastructure.
Previous work has shown the particular components – human [e.g. 1], technical [e.g. 2] and spatial [e.g. 3] – of the urban pervasive infrastructure to be important. We can benefit from drawing on the lessons of this disparate work. Furthermore, a richer understanding, and more successful system design practice, can be achieved by taking a holistic approach that integrates these lessons. In viewing the city as a system, the elements of people, space and technology combine in an Urban Pervasive Infrastructure
(UPI) over which urban pervasive applications can be deployed. The research approach put forward in this paper is to
1. empirically collect data about the UPI of a specific city using observation methods,
2. use the analysis methods to derive specific characteristics of the UPI, 3. feed the raw data or analysis results into an urban simulator, and
4. test and evaluate an urban application in the simulator. In independent studies, we have explored each aspect of this approach. Here we present our results in the following manner: after reviewing related work, we describe a set of concrete metrics that we use to measure and understand the UPI. We then present a set of observation, analysis and simulation methods that we have developed and use to study the urban pervasive infrastructure. As part of our ongoing research we continue to integrate our findings to develop a detailed design methodology for urban applications.
Related work In coining the term UPI we have created an umbrella term that includes work that has been done in the past, albeit in isolation. A key requirement for studying the UPI is capturing trace data of the real world (e.g. human mobility and intermittency of connections between people). This data can then be used to construct realistic synthetic models. For example, the Reality Mining project1 collected proximity, location and activity information, with proximity nodes being discovered through periodic Bluetooth scans and location information by cell tower IDs. Several other groups have performed similar studies [1,4,5,6,7]. Most of these, such as [4] and [7], use Bluetooth to measure mobility, while others, such as [5] and [6], rely on WiFi. The duration of experiments varies from 2 days to over 100 days, and the numbers of participants vary from 8 to over 5000 (see the Haggle2 project). The Crawdad database3 provides extensive traces, which are useful for the validation of forwarding algorithms and routing protocols that operate through learning characteristics of node mobility. A number of projects measure various aspects of the UPI on a large scale. For example, the MetroSense project4 explores the use of people-centric sensing with personal as well as consumer oriented sensing applications such as Nike+,5 and sensor-enabled mobile phone applications. Sensing can potentially cover a campus, metropolitan area, or a whole city, with many potential applications such as noise mapping and pollution mapping.6 The Pervasive Mobile Environmental Sensor Grids (MESSAGE) project7 aims to collect data at a metropolitan scale through smart phones carried by cyclists, cars, and
1 Reality Mining: http://reality.media.mit.edu, accessed 14/07/2007. 2 Haggle Project: http://www.haggleproject.org, accessed 14/07/2007. 3 Crawdad project: http://crawdad.cs.dartmouth.edu, accessed 14/07/2007. 4 MetroSense Project: http://metrosense.cs.dartmouth.edu, accessed 14/07/2007. 5 Nike+: http://www.nikeplus.com, accessed 14/07/2007. 6 Noise Mapping England: http://noisemapping.org, accessed 14/07/2007. 7 MESSAGE Project: http://155.198.92.106/pmesg.html, accessed 14/07/2007.

pedestrians monitoring carbon dioxide values to control traffic in the city of Cambridge. Similarly, the urban sensing project CENS8 seeks to develop cultural and technological approaches for using embedded and mobile sensing to invigorate public space and enhance civic life.
We can consider a number of instances where an understanding and modeling of the UPI can produce better or new applications. For example, previous research on GSM positioning for mobile phones highlights the need for detailed maps of celltower identifiers and reception in urban areas [2], which are essential elements of the UPI. In addition to location, the UPI can provide information about a user’s social context. Social network analysts typically use questionnaires and interviews to investigate social networks. Shortcomings of this method are that it is resource and time consuming, longitudinal data collection is difficult, and the data is biased by self-report errors. A study involving about one hundred users of mobile phones running a Bluetooth scanning application has shown that it is possible to derive affiliation networks and to model friendship relationships from the scan data automatically [1]. Although, this data is not subject to the shortcomings noted for the traditional questionnaire and interview methods, there are numerous problems and inaccuracies associated with the technical approach. Although that study does not seem to be affected by measurement errors, more knowledge is needed about these errors and how they can be compensated. So far, such studies have been carried out in a controlled environment considering only contacts between study participants. When merged with an understanding of the UPI, the results of these studies can be extended beyond this controlled setting and related to the wider social context. Understanding the UPI can also improve the evaluation of urban pervasive applications, which is intrinsically difficult. This is especially true if they are designed for opportunistic events or require a certain critical mass of users or devices. Several qualitative methods were applied to research the habits, problems and needs of people in urban environments. For instance, the authors in [8] focus on the items being carried by 28 subjects in three different cities to identify commonalities regarding their mobile kits, while in another study [[9], the use of social networking software was studied in three residential apartment complexes. Qualitative methods are well understood in this context, however, the breadth of such studies is limited, in terms of the number of participants, the duration of study and the size of observable space. The methods we introduce in this paper are basically quantitative. They complement the qualitative methods with longitudinal data that can be used for the identification of patterns and the development of automated tools. For instance, from a usability perspective, it is common to conduct expensive tests in a manageable setting, or to capture users’ opinions in focus groups, interviews, and questionnaires. Models based on real-world measurements of the UPI can be a valuable evaluation tool, saving considerable resources and providing helpful directions at the start of a project. By analyzing the UPI, it becomes possible to identify a priori settings and communities where potential applications might be successful. Many systems can benefit from this type of analysis, such as those explored in the Wearable Communities project
8 Urban Sensing: http://research.cens.ucla.edu/projects/2006/systems/Urban_Sensing,
accessed 14/07/2007.

[10], which leverages an epidemic approach to forward messages to people based on physical proximity.
Finally, modifications and extensions to the UPIs can benefit from an understanding of its structure and internal workings. For example, architects and city planners use tools like space syntax [3] to model existing cities and design new ones. In addition to physical architecture, the habits of the inhabitants, such as the routes they take, are also important. With this knowledge, pervasive applications can be optimized for the characteristics of a specific urban context. For example, the installation of wireless access points can be informed by the spatial structure, the patterns of pedestrian movements which result in expected bandwidth requirements, and even knowledge of the types of mobile devices in the city. Our premise is that a systemic understanding of the UPI can help us develop urban applications that play to the strengths of this infrastructure. Previous research lacks an integrated approach that considers the various aspects of the UPI – people, spaces and technologies – as a system. Examining aspects of the UPI in isolation, even when large datasets are available, can provide results that are not easily transferable to new settings. On the other hand, considering the UPI as a system gives us a more integrated picture of a city and provides the foundations for an integrated approach to building urban pervasive applications and services. This allows for the correlation of findings from various cities, and the transferring of those findings. In the following sections, we describe a set of concepts, metrics and methods for describing the urban spaces, people and technologies that together provide the UPI for urban pervasive applications. We demonstrate these concepts by drawing on previous work and our own research.
Characteristics and Metrics of the Urban Pervasive Infrastructure Before describing our methods for dealing with the UPI, we first identify a set of characteristics that our research has been successful in describing. We have found these characteristics helpful in furthering our understanding of the pervasive infrastructure of cities. In this section we describe these characteristics, along with metrics, and explain their use. Of course, there are potentially infinite aspects of a city to be studied, however here we focus on those aspects that available technology permits and for which adequate datasets can be captured and analyzed. In this paper we deal with the following characteristics of the UPI:
• Mobility
• Social structure • Spatial structure
• Temporal rhythms • Facts and figures
Mobility Mobility is a key feature of both humans and technology [4]. Each city has a unique pattern of mobility. Considered from an ego-centric perspective, useful metrics are distance traveled (km per day) and speed (km per hour). When considering mobility from an exo-centric perspective, flow becomes a useful metric (people/hour), as well as visit duration (in the form of a time-based distribution). The observed mobility of a city can be considered as the amount of randomness or entropy in a city. Conceptually, a city with zero mobility is similar to a static network such as a LAN, and can be described and understood as a traditional network. The introduction of human mobility, however, turns the city into a living organism. The mobility metrics described here measure the observable aspects of this mobility. We can use these measures to quantify and compare mobility across cities. People and devices that travel more and at higher speeds are, conceptually, the information highways of a city. Similarly, places with higher flows act as large hubs where many people can potentially interact and large volumes of information can be routed.
Social structure A feature of the UPI that directly relates to the human element, and thus to the element that sets apart cities from static networks, is the social structure. By social structure we mean the social groups, social behavior and patterns of encounter within a city. Social structures can be examined from an ego-centric or exo-centric perspective and involve measures like group size, number of singles vs. couples, etc. Numerous concrete metrics can be adopted from traditional social network analysis such as average degree (number of people someone interacts with), betweenness (0 to 1 indicating the importance of a person as a link in the chain of information spreading) and closeness (0 to 1 indicating the reachability of a person within the social network) [12].
To a large extent each person plays a unique role in the city’s social structure. Understanding these differences, and designing for them can be quite beneficial: who are the connectors, mavens and bridges? Which communities exist in a city, who are the members, and how do they interact? How centralized or decentralized are these social networks? These questions can be answered in the context of social network analysis. In other domains, similar analyses have been used to, for example, improve project teams’ functioning, analyze book selling patterns to position new books, build grass roots political campaigns, and analyze criminal behavior.9 In the context of urban pervasive systems, we expect network analysis to become crucial in both development and evaluation.
Spatial structure Spatial structure gives us insight into aggregate behaviors and patterns observed in a city. Space syntax provides us with tools to examine the city from a purely structural perspective, and to compare cities and sites in terms of structure. Concrete metrics for spatial structure include integration (0 to 1 indicating the reachability of a street from any
9 http://www.orgnet.com/sna.html, accessed 14/07/2007.
other street) and choice (0 to 1 indicating the importance of a street in terms of how many alternative streets can be used to replace it in a route).
Spatial structure has been shown to affect various high-level human behaviors such as shopping patterns and crime [13]. Effectively, space syntax indicates that pure spatial structure is the reason why some streets are busy and why others are quiet. This allows us to link spatial structure with both the observed mobility, as well as the social structure of a city.
Temporal rhythms Cities are not static, but have their own rhythms: daily, weekly and seasonal. Typically, cities’ temporal patterns are affected by laws and restrictions (e.g. pubs must close at 11pm), work schedules (at the daily and weekly scale) as well as seasonal variations such as the weather and holiday seasons. Concrete metrics of such rhythms can be expressed as time-based distributions (see [4] and [14]). For instance, a city like New York may be full of activity throughout a day and seasonally peak in winter, while a tourist destination like the island of Mykonos may have low daily activity and peak in the summer. A further example is the afternoon break known as “siesta”, typically observed in the Mediterranean and South America, which adds a unique element to a city’s rhythm.
Facts and figures Finally, facts and figures refer to any statistical characteristic that is applicable to people, technologies and spaces. For example, facts and figures about humans include the number of people that go to nightclubs, or the number of teenagers living in a city. A technological characteristic can refer to the spread of WiFi or Bluetooth. An architectural characteristic is, for example, the number of parks or restaurants. Facts and figures are obtained by applying classic empirical methods such as surveys, by consulting maps and census data, or can be recorded technically.
Facts and figures can be used to gain insight into further properties of the UPI. For instance, low mobility might be related to a high age average in a city, while increased centralization of the social networks might be attributed to the small number of pubs and bars.
Methods We now describe the methods we have applied and developed to study the concepts described above. There is no one-to-one mapping between the methods we describe here and the concepts of the UPI, and in many cases we have used combinations of methods, through observation, analysis or simulation, to generate our results. For example, to understand mobility we have used various observation methods to gather data and one or more of our analysis methods described in this section.
Observation methods A challenge we face is recording, representing and understanding the patterns of mobility and presence in our cities through the use of pervasive technologies. Most wireless technologies have characteristics that render them appropriate for study by our methods.
For instance, the vast majority of Bluetooth devices, such as mobile phones, have a relatively short range and map very closely to the movements of people around the city. In contrast, typically static WiFi or GSM access points can be used to identify locations in a city, while the signals emitted by WiFi devices can be related to both static and mobile devices such as desktop and laptop computers. A common observation method used to capture aspects of the UPI is “wardriving.” It involves systematically moving about a city to record various detectable or visible features of technology. This includes WiFi and Bluetooth activity, the presence of mobile phone masts, the use of mobile phones and cameras, all of which produce maps10 with color-coded information about the presence or levels of activity of certain technologies. Additionally, physical aspects of the city itself can be recorded in maps highlighting features such as parks, schools, graffiti, and housing vs. commercial areas.
A further observation method we have used is the “augmented gatecount” [14]. Gatecounts are used to establish the flows of people at sampled locations within the city. A gate is a conceptual line across a street, and gatecounts record the number of people crossing that line. The observer counts the number of people crossing the gate in either direction. We have augmented this process by providing the human observer with equipment to monitor the presence of technologies, in our case by Bluetooth inquiries [14]. Additionally, the observer manually records technology related behavior such as the number of people using mobile devices like phones or cameras. This method provides data correlating the presence of a technology (e.g. Bluetooth) or behavior (e.g. use of mobile phones) with the local population.
To observe the open spaces of a city (outside, such as a plaza, or inside, such as a café) we have used a method called “augmented static snapshot” [14]. A human observer manually records human activity, including apparent technology use, while simultaneously recording technology use with appropriate scanning devices. The method is used to record both stationary and moving activities, and is particularly useful when directly comparing the two types of space use. This method highlights the different types of space use in an urban area. It gives us an understanding of how people visit and use a particular space, and how these habits bring people into contact with each other. For example, we may observe that a seating area in a park is actually not used for seating but for playing by children. A common observation is the use of certain spaces by people making calls on their mobile phones or using their laptop computers, and the way these people locate themselves with respect to their surroundings and other people.
People’s mobile devices, when used as mobile scanners, can capture a personal view of the UPI. Focusing on the personal perspective gives us an understanding of the contexts and habits of individuals. To achieve this, we instruct participants to interact naturally with their environment during the measurement. Depending on the aspect of interest, different scanning technologies are utilized. For example, GPS gives insight into spatial behavior while Bluetooth scanners emphasize social behavior.
The above methods offer us longitudinal data, too, by installing the scanning equipment for long periods of time [e.g. 14]. In this case, there may be no human observations to
10 For sample WiFi maps, visit http://www.wifimaps.com, last accessed 14/07/2007.

correlate with the data, however such long-term scans can provide richness in terms of patterns of the city over time and relationships between people. This is especially true when combining data from multiple locations, as well as combining data from mobile scanners and stationary scanners.
As part of the Cityware and Wireless Rope projects we designed and implemented a Bluetooth based infrastructure consisting of various components to combine these observation methods in a single system. There is a long-term installation in the city of Bath, UK. Demonstrations of Wireless Rope were given at the PerCom 2006 and Ubicomp 2006 conferences. A program for J2ME phones samples proximity data from the personal perspective (see Figure 1). It displays the current state of the environment visually to the user and provides basic statistical summaries, such as number of encounters and average meeting durations. Computers or embedded devices are installed at fixed locations of interest to perform augmented gate counts and augmented static snapshots. Additionally, these devices receive sample data from the mobile scanners via Bluetooth when in range. The stationary devices are connected to a central server, aggregating the data in a single database. We provide parts of this infrastructure to other researchers under the GPL license.11 At the time of writing, we have collected 3.5 million records for about 60,000 unique devices in the course of a year in the city of Bath.
Figure 1. A screenshot of the Wireless Rope J2ME software. The black circle represents the owner, while devices in the environment are classified as familiar (green) or strangers (grey). Devices move closer to the black circle as they spend more time within range.
Analysis methods In the previous section, we described a number of observation methods we have developed and used. Here, we discuss how to analyze the data from observations. Analysis of wardriving data is quite commonplace,12 and is used to indicate areas of
11 Wireless Rope: http://wrp.auriga.wearlab.de and
http://sourceforge.net/projects/wirelessrope, accessed 14/07/2007. 12 For sample WiFi maps, visit http://www.wifimaps.com, accessed 14/07/2007.
interest, as well as patterns of behavior and use over time. Similarly, facts and figures can be calculated using statistics tools, depending on the exact facet of the UPI in question. For instance, we can calculate a city’s WiFi coverage by analyzing wardriving data.
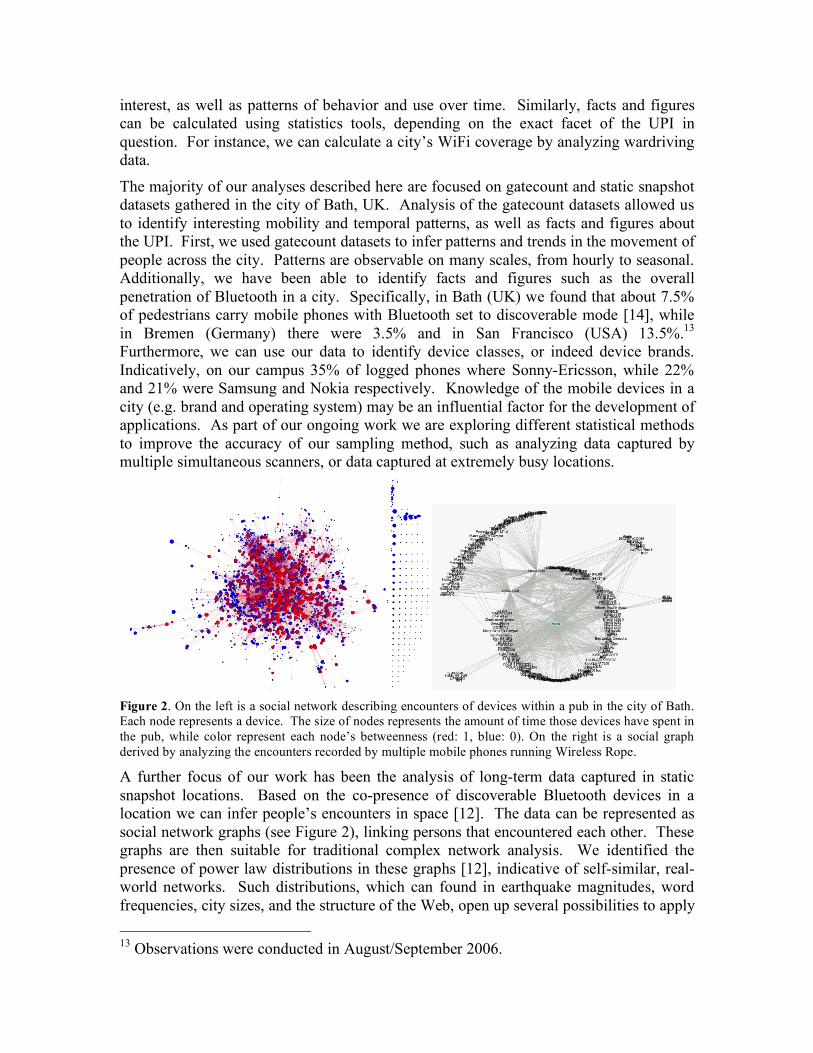
The majority of our analyses described here are focused on gatecount and static snapshot datasets gathered in the city of Bath, UK. Analysis of the gatecount datasets allowed us to identify interesting mobility and temporal patterns, as well as facts and figures about the UPI. First, we used gatecount datasets to infer patterns and trends in the movement of people across the city. Patterns are observable on many scales, from hourly to seasonal. Additionally, we have been able to identify facts and figures such as the overall penetration of Bluetooth in a city. Specifically, in Bath (UK) we found that about 7.5% of pedestrians carry mobile phones with Bluetooth set to discoverable mode [14], while in Bremen (Germany) there were 3.5% and in San Francisco (USA) 13.5%.13 Furthermore, we can use our data to identify device classes, or indeed device brands. Indicatively, on our campus 35% of logged phones where Sonny-Ericsson, while 22% and 21% were Samsung and Nokia respectively. Knowledge of the mobile devices in a city (e.g. brand and operating system) may be an influential factor for the development of applications. As part of our ongoing work we are exploring different statistical methods to improve the accuracy of our sampling method, such as analyzing data captured by multiple simultaneous scanners, or data captured at extremely busy locations.
Figure 2. On the left is a social network describing encounters of devices within a pub in the city of Bath. Each node represents a device. The size of nodes represents the amount of time those devices have spent in the pub, while color represent each node’s betweenness (red: 1, blue: 0). On the right is a social graph derived by analyzing the encounters recorded by multiple mobile phones running Wireless Rope.
A further focus of our work has been the analysis of long-term data captured in static snapshot locations. Based on the co-presence of discoverable Bluetooth devices in a location we can infer people’s encounters in space [12]. The data can be represented as social network graphs (see Figure 2), linking persons that encountered each other. These graphs are then suitable for traditional complex network analysis. We identified the presence of power law distributions in these graphs [12], indicative of self-similar, real-world networks. Such distributions, which can found in earthquake magnitudes, word frequencies, city sizes, and the structure of the Web, open up several possibilities to apply 13 Observations were conducted in August/September 2006.
established analysis techniques to the datasets. We have found that, on average, residents in Bath are 3.3 hops away, and there is a 45% chance that if A is linked to B and B is linked to C then A and C are linked. Furthermore, by adjusting the rules used to derive the graphs, we can focus on different aspects of a city. For example, we can emphasize devices that appear and disappear together, indicating possible groups of people and thus social ties. This allows us to infer communities within the city. Preliminary analysis of our data indicates the presence of 22 distinct communities in the city of Bath. The combination of multiple static snapshots or gatecount datasets provides useful insights into trails and patterns of movement. For instance, [15] have analyzed a WiFi dataset for trails, or hops, between various locations in the city. These show people's movement through the city in terms of their connection to WiFi hotspots. We are currently running similar analyses on our Bluetooth datasets. This type of analysis provides insights into questions like “Which trail in the city is mostly followed on Friday evenings?”, which in turn can shape the design of urban applications.
Within the Wireless Rope project (see Figure 1) we measure social context by considering contacts with Bluetooth devices in the environment from the user’s perspective, drawing on the concept of Familiar Strangers [16]. In a pilot study, we classified activities during a conference visit without prior knowledge about how many people in the surroundings had discoverable Bluetooth devices with them or about the identities of these people [7]. A participant in our study carried the scanner for six days at the conference venue, including workshop attendance, and a day for recreation. Additionally, our participant kept a diary of his activities. In the analysis, we first distinguished devices that were discovered often from those discovered rarely. This resulted in two sets, with the devices at the conference location in one set, and devices discovered in the city in the other set. Subsequently, we considered the appearance and disappearance of devices in each set, in relation to the overall amount of surrounding Bluetooth devices. The different patterns that emerged were correlated with the documented activities, such as moving through the city, arriving at and departing from the conference venue, and coffee and lunch breaks among others. These results indicate ego-centric proximity data can be used to infer patterns in users’ activities, and thus we can design applications that make use of this knowledge. Another technique we have used in our work is space syntax [3]. It models the structure of cities and its effect on pedestrian movement. This analysis is done in two steps. First, we use ordinance survey maps to analyze the spatial structure of a city, purely in terms of lines of sight in the open spaces, such as streets. This results in theoretical predictions about which streets are likely to be busy and which are likely to be quiet. In the second step, observation data of the actual pedestrian flows are compared to the theoretical predictions. In this step, we fine-tune our theoretical predictions by changing the weighting on different variables used in the predictions. Thus, using observation data as a guide, space syntax identifies the important variables that can be used to accurately model pedestrian flow. Knowledge of these variables allows for more accurate explanations of the spatial dynamics, as well as more accurate predictions of the effect of space on behavior.

Finally, we have used device contact patterns such as contact duration and inter-contact duration14 to study the network opportunities that arise in a city. Our analysis of data from static snapshots recording Bluetooth traffic has uncovered inter-connection patterns and has been used to develop data forwarding algorithms [4]. Specifically, the distribution of inter-contact time follows an approximate power law over a large period of time. Inter-contact durations are of particular importance because their distributions determine the viability of forwarding algorithms, as shown in [4]. Furthermore, we are working on detecting “familiar strangers” by observing the distribution of contact times versus contact duration. Additionally, temporal graphs can be used to determine admissible and optimal paths through the multitude of devices in a city’s UPI. Furthermore, our forwarding algorithms can consider the levels of clustering in pedestrians’ movement and the affiliation networks in a city.
Emulation and simulation A benefit of augmented gatecounts and static snapshots is that they produce time-stamped records of events that can be used for replay in sequence. By emulation, we examine “what-if” situations, and study the effects of different technologies or different circumstances. In emulation, we studied the diffusion patterns of information through the social networks derived from the analysis of static snapshot, by testing different types of rules. For example, we can consider how a small (1KB) and a large (1MB) application spreads through the city, based on our recorded device encounters in Bath. We can further re-play inter-connection times in order to adjust the forwarding algorithms. Emulation can act as an initial testbed for many applications, where facets of the pervasive infrastructure can be brought into action inside the lab. Having a lab testbed is important, as working and observing in the city is expensive, both in terms of money and time. For instance, installing and maintaining long-term scanners requires equipment, bandwidth, and personnel time. Furthermore, it is not always possible to install scanners in desired locations. For these reasons, we simulate and augment our observational datasets and emulations. Simulations can generate large amounts of data inexpensively, but often with less confidence in their validity than that of empirical data.
The most common mobility models used in simulation for mobile ad hoc networks are the Random Walk Mobility Model [17] and the Random Waypoint Mobility Model [17]. Both simulate node movement in a rectangular area. In the City Section Mobility Model [17], nodes move on streets choosing destinations at random and follow the shortest paths to them. However, these mobility models rarely reflect accurate real world situations, and the use of real world traces is important, albeit often difficult to obtain. One of our ongoing projects involves the optimization of existing simulation models provided by space syntax. These models simulate pedestrian movement in the city, and effectively allow us to flood a (simulated) city with mobile agents and information packets (see Figure 3 for a sample visual representation).
14 The duration between two successive direct contacts for a pair of nodes.

Currently, we are working on changing properties of the agents’ cognition [11] to match our observations of flow, encounter, and interconnection times of the (real) city. Once we have achieved a good fit between our observational data and the simulation data, we can use simulations as an additional source of data. For example, we can carry out virtual gatecounts and static snapshots within the simulation, thus giving us a large dataset to augment our field observations.
Figure 3. Snapshots of a city simulation. The left map depicts the center of the city of Bath, and on the right is a “Bluetooth map” of the same area. The white areas on the right map indicate high Bluetooth activity. The yellow dots indicate information packets that move about the city via Bluetooth.
Conclusion and Ongoing Work In this paper we argued for a systemic approach to understanding the system of people, spaces and technologies, which we term the Urban Pervasive Infrastructure. Such an integrated approach allows for the transferability of results across cities, and allows for comparisons between cities or over time. Our main focus has been to describe certain aspects of the UPI, and methods of measuring and analyzing them, as shown in Table 1. Our work so far, as summarized in Table 1, has focused on developing the enabling tools and methods to carry our research forward. Our ongoing work involves the refinement of our methods and techniques, as well as their integration. Specifically, we are interested in exploring how to improve our observation techniques for use in different environments, and how to fine-tune the associated statistical tests. We are also exploring new ways of deriving and analyzing social networks to capture a richer picture of the social context. Finally, we are developing and refining our forwarding algorithms for opportunistic ad hoc networking in the city. The concepts, metrics and methods presented here may be used to gain an insight into and understanding of the UPI of a city. Such an understanding can have a profound effect on how we develop pervasive applications and can greatly improve our ability to do so. Ultimately, we aim to develop a “city simulator”. Such a system, when used in emulation mode, would be loaded with observational data and would help test or evaluate
a pervasive application. Alternatively, a city simulator could be used without any observational data, but simply by entering the values of various UPI features, such as the ones described here. In this case, it would allow for an approximation of a city in the absence of raw observation data.
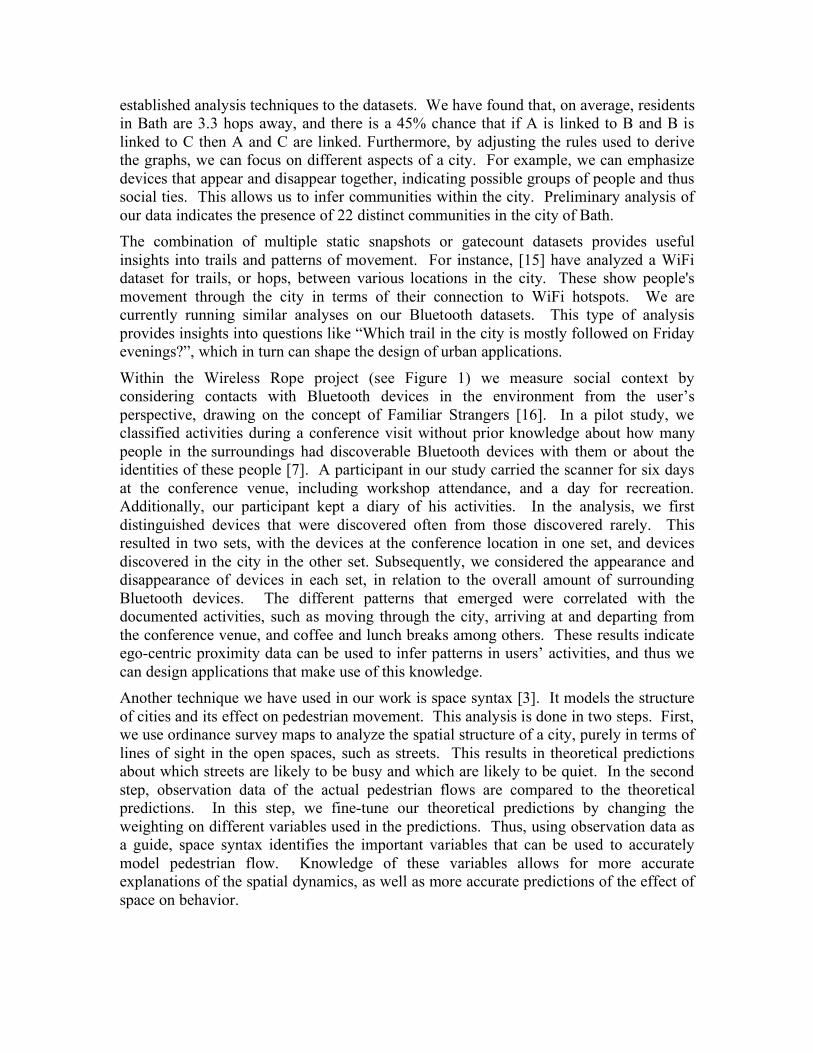
UPI characteristics Metrics Methods
Mobility Distance traveled Speed Flow Visit duration
Gatecounts Mobile Scanners Emulation Simulation
Temporal structure Laws and rules Time-based distributions
Inter-connection analysis Longitudinal gatecounts Emulation Simulation
Social structure Network analysis metrics (e.g. degree, betweenness, closeness)
Longitudinal static snapshots Mobile scanners Emulation Simulation
Spatial structure Space syntax metrics (e.g. integration, choice)
Space syntax Simulation
Facts and figures Statistical characteristics Wardriving Gatecounts Static snapshots Mobile Scanners
Table 1. Aspects of the UPI and the associated analysis and observation methods. Finally, in our ongoing work we are considering the extent to which UPI measurements affect people’s behavior. Specifically, we aim to study the effect of reflecting back at people various characteristics of the UPI. Our intention is to determine whether or not a positive feedback loop is develops, whereby people’s behavior affects and is affected by the UPI measurements.
Acknowledgments We would like to thank Alan Penn, Ava Fatah gen. Schiek, Alidstair Turner, Tim Kindberg, Przemyslaw Jaworski, George Roussos, Dikaios Papadogkonas, Nils Behrens, Andreas Kemnade, Michael Lawo, Otthein Herzog and Pan Hui. This research is partly funded by the UK Engineering and Physical Sciences Research Council grant EP/C547683/1 (Cityware: urban design and pervasive systems), the European Union under the Haggle integrated project FP6-IST-027918, and the ACCA coordination action FP6-IST-6475.
References 1. Eagle N, Pentland A (2006) Reality mining: sensing complex social systems.
Personal and Ubiquitous Computing, 10(4):255-268, Springer-Verlag, London.
2. Chen M, Haehnel D, Hightower J, Sohn T, LaMarca A, Smith I, Chmelev D, Hughes J, Potter F (2006) Practical Metropolitan-Scale Positioning for GSM Phones. Ubicomp 2006: 8th Int'l Conf. on Ubiquitous Computing, LNCS 4206:225-242, Springer Berlin/Heidelberg.
3. Hillier B, Hanson J (1984) The Social Logic of Space, Cambridge University Press. 4. Balazinska M, Castro P (2003) Characterizing Mobility and Network Usage in a
Corporate Wireless Local-Area Network. MobiSys '03: Proc. 1st Int'l Conf. on Mobile Systems, Applications and Services, ACM Press, New York, pp. 303-316.
5. Chaintreau A, Hui P, Crowcroft J, Diot C, Gass R, Scott J (2006) Impact of Human Mobility on the Design of Opportunistic Forwarding Algorithms. Proc. 25th IEEE Conf. on Computer Communications (INFOCOM), IEEE CS Press, New York, NY, USA, 2006.
6. McNett M, Voelker GM (2005) Access and Mobility of Wireless PDA Users. SIGMOBILE Mob. Comput. Commun. Rev., 9(2):40-55.
7. Nicolai T, Yoneki E, Behrens N, Kenn H (2005) Exploring Social Context with the Wireless Rope. On the Move to Meaningful Internet Systems 2006: OTM 2006 Workshops, Part I, LNCS 4277:874-883, Springer Berlin/Heidelberg.
8. Mainwaring SD, Anderson K, Chang MF (2005) Living for the Global City: Mobile Kits, Urban Interfaces, and Ubicomp. In Proc. Ubicomp, pp. 269-286.
9. Foth M (2006) Facilitating Social Networking in Inner-City Neighborhoods. IEEE Computer, 39(9):44-50.
10. Kortuem G, Segall Z (2003) Wearable Communities: Augmenting Social Networks with Wearable Computers. IEEE Pervasive Computing, 2(1):71-78.
11. Turner A, Penn A. (2002) Encoding Natural Movement as an Agent-Based System: An Investigation into Human Pedestrian Behaviour in the Built Environment. Environment and Planning B: Planning and Design, 29(4):473-490.
12. Kostakos V, O’Neill E (2007) Quantifying the Effects of Space on Encounter. To appear in Proc. 6th Int'l Space Syntax Symposium, Istanbul, Turkey.
13. Hillier B, Burdett R, Peponis J, Penn A (1987) Creating Life: Or, Does Architecture Determine Anything? Architecture & Behaviour, 3(3):233-250.
14. O’Neill E, Kostakos V, Kindberg T, Schieck AFG, Penn A, Fraser DS, Jones T (2006) Instrumenting the City: Developing Methods for Observing and Understanding the Digital Cityscape. UbiComp 2006: 8th Int'l Conf. on Ubiquitous Computing, LNCS 4206:315-332, Springer, Berlin/Heidelberg.
15. Papadogkonas D, Roussos G, and Levene M (2006) Discovery and Ranking of Significant Trails. 2nd Int'l Workshop on Exploiting Context Histories in Smart Environments (ECHISE) at UbiComp 2006: 8th Int'l Conf. on Ubiquitous Computing, online proceedings.

16. Paulos E, Goodman E (2004) The Familiar Stranger: Anxiety, Comfort, and Play in Public Places. CHI '04: Proc. SIGCHI Conf. on Human Factors in Computing Systems, ACM Press, New York, pp. 223-230.
17. Camp T, Boleng J, and Davies V (2002) A Survey of Mobility Models for Ad Hoc Network Research. Wireless Communications and Mobile Computing, 2(5):483-502.