Embed Size (px)
Citation preview

1
Louisiana Deer Report
2015-2016
LDWF Wildlife Division
July 28, 2016
Introduction
The Louisiana deer program is administered by the Office of Wildlife and implemented through 6 field offices where
wildlife biologists and technicians perform year round research and management activities on public and private lands.
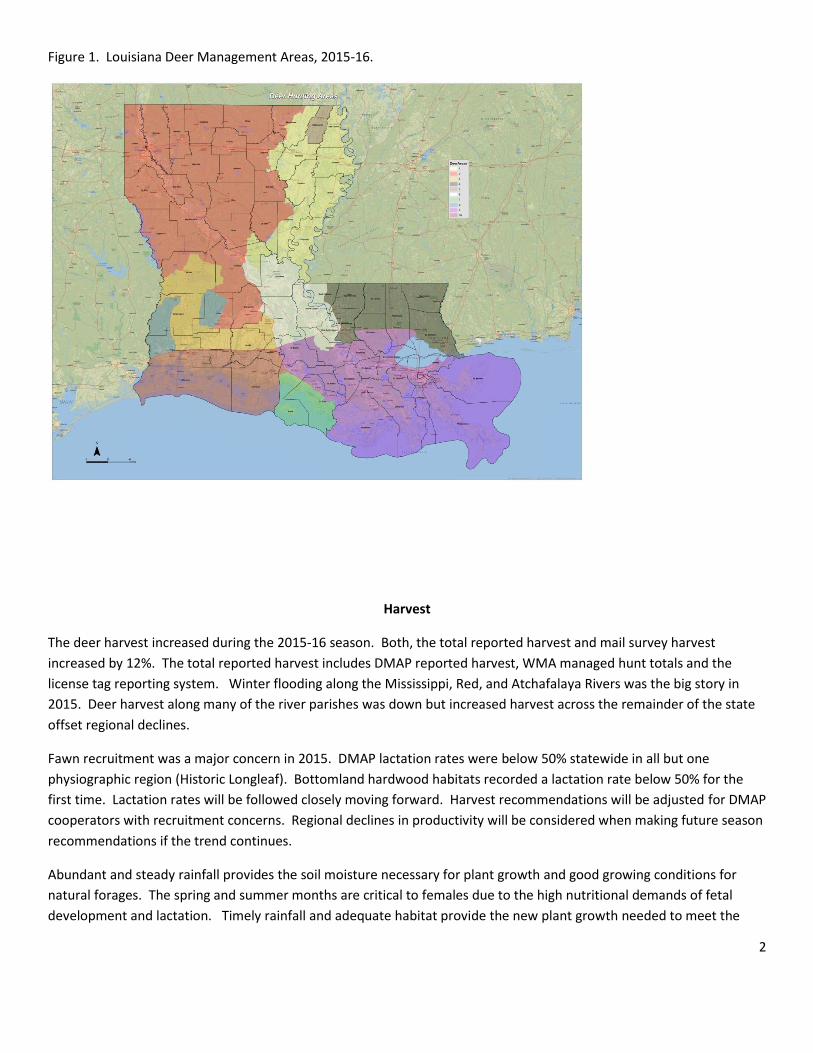
The state is presently divided into 10 deer management areas (DMAs, Figure 1).
Seasons are set according to general breeding periods, habitat productivity, and landscape features. The statewide limit
is 2 antlered, 1 either sex, and 3 antlerless deer per year. Antlerless deer may be taken during the entire season in
DMAs 1, 2, 3, 6, and 8. In DMAs 4, 5, 7, 9, and 10, antlerless hunting will only be allowed on designated days. All deer
must be tagged prior to being moved from the harvest site.
December and January flooding on the Mississippi, Atchafalaya and Red Rivers did impact deer and hunters during the
2015-16 season. A 20 day closure (Jan 10-29) was implemented within the Atchafalaya Protection levees of Area 9 due
to water levels exceeding the benchmark closure level of 18.0’ msl at Butte la Rose. The previous 18.0’ level during deer
season occurred 12 years earlier. In addition to the Atchafalaya Basin, emergency closures were implemented in
Northeast Louisiana for one week in January. The closure area included lands east of Highway 65 in East Carroll,
Madison, Tensas and Concordia Parishes north of Vidalia.
A couple of major changes will occur in 2016-17 regarding DMAs. The first will be the incorporation of former Deer
Management Area 5 (West Carroll Parish) into Area 1. Expanding deer numbers and harvest were experienced in West
Carroll Parish. Currently harvest per forested acre is 4th highest in the state (Table 5). The second change was the
creation of a new Deer Management Area 5 within former Area 9. The new DMA 5 consists of lands located within the
Atchafalaya River Protection Levees in Iberville, St. Martin, St. Mary and Iberia Parishes. Area 5 will have two benchmark
closures based on Atchafalaya River levels at Butte La Rose. Portions of Area 5 below Alligator Bayou and Bayou Sorrel
will close when levels reach 15.0’ msl at Butte La Rose. Portions of Area 5 above will close once levels reach 18.0’ msl.
All deer must be reported through the phone or internet system, a wildlife management area (WMA) weigh station, or
the Deer Management Assistance Program (DMAP). This harvest information along with other data is used to develop
deer seasons and regulations.
2
Figure 1. Louisiana Deer Management Areas, 2015-16.
Harvest
The deer harvest increased during the 2015-16 season. Both, the total reported harvest and mail survey harvest
increased by 12%. The total reported harvest includes DMAP reported harvest, WMA managed hunt totals and the
license tag reporting system. Winter flooding along the Mississippi, Red, and Atchafalaya Rivers was the big story in
2015. Deer harvest along many of the river parishes was down but increased harvest across the remainder of the state
offset regional declines.
Fawn recruitment was a major concern in 2015. DMAP lactation rates were below 50% statewide in all but one
physiographic region (Historic Longleaf). Bottomland hardwood habitats recorded a lactation rate below 50% for the
first time. Lactation rates will be followed closely moving forward. Harvest recommendations will be adjusted for DMAP
cooperators with recruitment concerns. Regional declines in productivity will be considered when making future season
recommendations if the trend continues.
Abundant and steady rainfall provides the soil moisture necessary for plant growth and good growing conditions for
natural forages. The spring and summer months are critical to females due to the high nutritional demands of fetal
development and lactation. Timely rainfall and adequate habitat provide the new plant growth needed to meet the

3
high protein and energy requirements to raise fawns. We have had abundant rainfall over much of the state during this
growing season.
High mosquito populations can reduce fawn survival. Hunters should also remember that the 2009, 2011 and 2012
droughts could still be impacting deer populations through reduced cohorts and the lag effects of maternal stress.
Hogs continue to be a primary concern. Research has shown that deer detection rates can be up to 49% less where hogs
occur. Hog populations affect deer numbers through direct competition for food resources and fawn predation. Hogs
carry infectious diseases such as Leptospirosis, brucellosis, and pseudo-rabies. Wildlife veterinarians are studying the
impacts of these diseases on wildlife species. The mail survey hog harvest estimate was 172,300, which is higher than
the recorded deer harvest.
The number of deer tags issued continues to trend up (Table 1.)
Table 1. Number of sets of deer and turkey
tags issued in Louisiana, 2008-2014.
Year Tags
2008-09 227,001
2009-10 231,935
2010-11 224,725
2011-12 253,669
2012-13 259,824
2013-14 270,730
2014-15 273,541
Areas of concerns for the statewide deer populations continue to be:
Feral hog transport
Feral hog disease issues and population spread
Landscape scale factors:
Residential, commercial, and energy development
Intensive forest management practices
Fragmentation/Exurbia
Mail survey
A 6% sample of licensed hunters receives a harvest survey by mail. Participants return the survey and statistics are
compiled. The mail survey index for hunters and harvest for the 2015/16 season is 192,200 and 156,100 respectively.
\

4
Figure 2. Mail survey estimate of Louisiana deer hunters and deer harvested, 1970-2015.
*= 2012 mail survey forward estimates for hunters and harvest include senior hunters (hunters >60).
The hunter number index has remained stable the past two years. The harvest sex ratio according to the 2015-16 mail
survey was 56% male, 44% female. Total number of hunters that hunted deer last season was 192,200 compared to
192,600 the previous season.
The harvest allocation by weapon type (Table 2.) reveals that modern weapons are still by far the most popular method
for harvesting deer in Louisiana.
Table 2. Louisiana deer harvest distributed by weapon
type, based on the mail survey, 2015-16.
Weapon Harvest %
modern gun 126,800 81%
primitive 16,700 11%
bow 7,700 5%
crossbow 4,800 3%
Totals 156,000
0
50000
100000
150000
200000
250000
300000
Louisiana deer hunters and harvest as estimated by the mail survey, 1970-2015*.
Hunters Harvest

5
Internet/phone reporting results/total reported harvests
The 2015/16 reported harvest of 73,174 was a 12.4% increase from 2014-15. However, declines in reported harvests
were observed in both DMAP and WMA lands across the state last season. Weather was a major factor in the WMA
managed hunt harvest decline. The majority of WMA managed hunts occurred on Thanksgiving Weekend. Warm
temperatures, strong winds and storms resulted in less than desirable hunting conditions. When total reported public
land harvest is combined with the WMA managed harvest the decline was only 3%. In general, reported harvest has
declined significantly from the initial year of mandatory deer tagging but has leveled off. The 2015/16 year marks the 8th
year of mandatory tagging and reporting.
Table 3. Private Public WMA managed DMAP Total
2008/09 87,237 8,481 2,877 17,976 116,571
2009/10 78,444 9,035 2,335 17,641 107,455
2010/11 74,346 9,742 3,004 17,740 104,832
2011/12 53,860 5,596 2,526 14,396 76,378
2012/13 46,814* na 2,425 14,039 63,278
2013/14 51,319* na 2,713 14,956 68,988
2014/15 41,563 6,735 2,655 14,128 65,081
2015/16 50,634 7,845 1,279 13,416 73,174
The top 20 total harvest parishes are presented in Table 4. The top 20 harvest parishes by forested acres per deer are
presented in Table 4.
Table 4. Top 20 harvest parishes in Louisiana derived from
the reporting system through February 23, 2016.
Parish Harvest Parish Harvest
Union 4124
Iberville 2005
Bienville 3167
Webster 1934
Vernon 3021
Avoyelles 1930
Claiborne 2971
Rapides 1830
Natchitoches 2519
Beauregard 1714
Tensas 2280
St. Landry 1602
Bossier 2110
Sabine 1577
Jackson 2104
Morehouse 1541
Madison 2062
DeSoto 1540
Winn 2030 Grant 1515
6
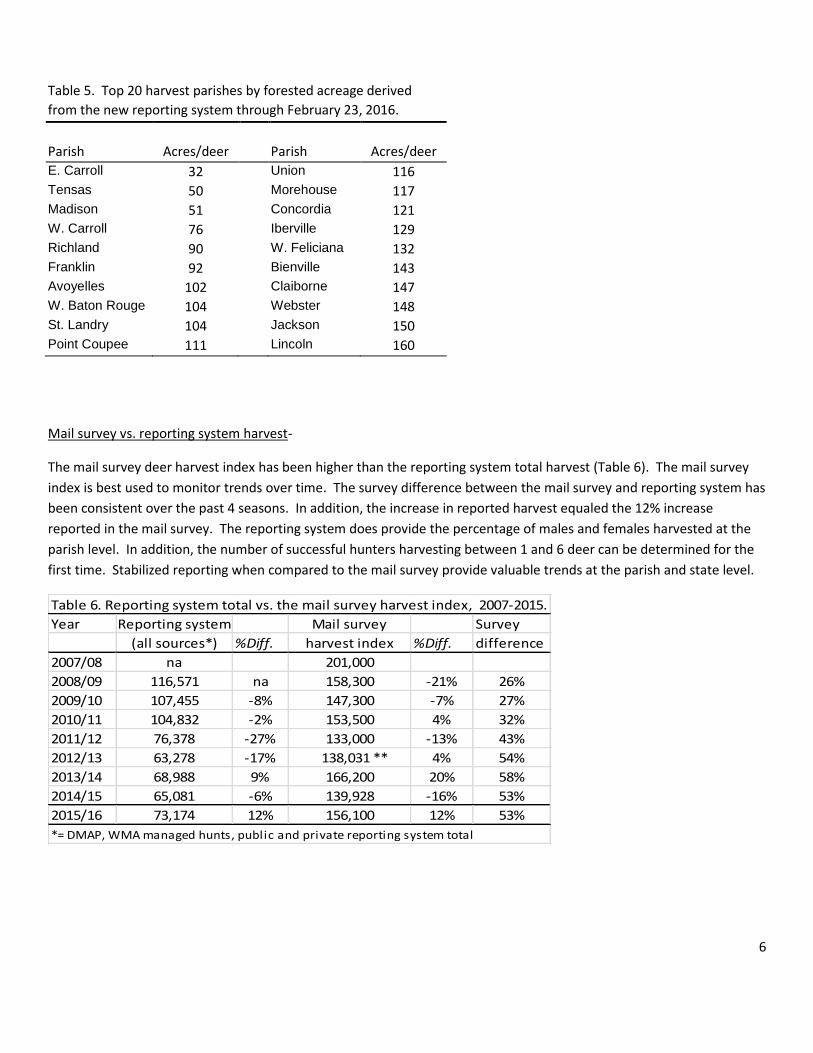
Table 5. Top 20 harvest parishes by forested acreage derived
from the new reporting system through February 23, 2016.
Parish Acres/deer Parish Acres/deer
E. Carroll 32 Union 116 Tensas 50 Morehouse 117 Madison 51 Concordia 121 W. Carroll 76 Iberville 129 Richland 90 W. Feliciana 132 Franklin 92 Bienville 143 Avoyelles 102 Claiborne 147 W. Baton Rouge 104 Webster 148 St. Landry 104 Jackson 150 Point Coupee 111 Lincoln 160
Mail survey vs. reporting system harvest-
The mail survey deer harvest index has been higher than the reporting system total harvest (Table 6). The mail survey
index is best used to monitor trends over time. The survey difference between the mail survey and reporting system has
been consistent over the past 4 seasons. In addition, the increase in reported harvest equaled the 12% increase
reported in the mail survey. The reporting system does provide the percentage of males and females harvested at the
parish level. In addition, the number of successful hunters harvesting between 1 and 6 deer can be determined for the
first time. Stabilized reporting when compared to the mail survey provide valuable trends at the parish and state level.
Table 6. Reporting system total vs. the mail survey harvest index, 2007-2015.
Year Reporting system Mail survey Survey
(all sources*) %Diff. harvest index %Diff. difference
2007/08 na 201,000
2008/09 116,571 na 158,300 -21% 26%
2009/10 107,455 -8% 147,300 -7% 27%
2010/11 104,832 -2% 153,500 4% 32%
2011/12 76,378 -27% 133,000 -13% 43%
2012/13 63,278 -17% 138,031 ** 4% 54%
2013/14 68,988 9% 166,200 20% 58%
2014/15 65,081 -6% 139,928 -16% 53%
2015/16 73,174 12% 156,100 12% 53%
*= DMAP, WMA managed hunts, public and private reporting system total
7
Wildlife Management Areas-
The Department manages over 1,000,000 acres that provide deer hunting opportunities. Modern firearm, primitive
firearm, and archery either-sex hunts are the primary methods for keeping deer numbers in balance with the habitat.
Youth and handicapped hunts are also available on many areas. Bucks only seasons provide extended hunting
opportunity and generally are held near or during the rut. Harvest rates are variable on the WMAs according to deer
physiographic region, habitat conditions, and hunter efforts. In some years WMA harvest rates equal or surpass
intensively managed DMAP properties. On some WMAs, harvest rates are low due to habitat type, forest conditions,
accessibility issues, or other management objectives. In general, WMA deer herds are managed in a way that helps
ensure long term forest regeneration, diversity, sustainability, and a healthy deer herd. WMAs are not managed for
maximum residual numbers, but rather maximum sustained harvest and recreational opportunity, which means deer
herds at or below maximum biological carrying capacity.
The recorded harvest for either-sex managed hunts was 1,332 deer on the WMAs this year (Table 7). Managed either-
sex hunts had an average hunter success rate of 17.4 efforts per deer (Figure 3). The sex ratio of the managed either-sex
hunt harvest was 52% male, 48% female. The total recorded WMA harvest, including self clearing data (SCD) was 4,759
deer (-22%). The minimum known harvest rate was 1 deer per 236 acres across all WMAs and habitat types. The known
sex ratio for the total recorded WMA harvest, including SCD, was 57% male, 43% female.
Severe storms and flash floods created difficult hunting during the October 31 and November 1st hunts which impacted
harvest totals for some of the larger West Louisiana WMAs. In addition, warm weather and strong winds were
experienced during the Thanksgiving weekend managed hunts. Reduced WMA hunter success during the managed
hunts may have impacted the annual WMA harvest. 52% of deer harvested on WMAs over the past ten years were
harvested during managed either-sex deer hunts.

8
Table 7. 2015 WMA either sex hunt weekends1.
WMA Hunter efforts Total harvest Bucks Does Efforts per deer
Alexander State Forest (10 - 11 Oct) 224 14 6 8 16.0
Alexander State Forest (7 - 8 Nov) 111 11 8 3 10.1
Attakapas * 236 13 6 7 18.2
Bayou Macon (21-22 Nov) 208 33 14 19 6.3
Big Lake** 642 29 11 18 22.1
Boeuf** 1,255 147 65 82 8.5
Buckhorn 346 9 5 4 38.4
Camp Beauregard 565 59 27 32 9.6
Camp Beauregard (13-14 Dec) 199 11 9 2 18.1
Clear Creek 639 17 10 7 37.6
Clear Creek(Oct 31- Nov 1) 515 45 25 20 11.4
Dewey Wills (13-14 Dec) 856 65 32 33 13.2
Fort Polk 1,954 135 60 75 14.5
Fort Polk (Oct 31- Nov 1) 228 19 10 9 12.0
Grassy Lake ** 519 27 12 15 19.2
Jackson Bienville (21 - 22 Nov) 491 99 45 54 5.0
JC Sonny Gilbert** 151 10 6 4 15.1
Joyce* 0 0 0 0 0.0
Loggy Bayou 278 49 28 21 5.7
Maurepas Swamp * 574 42 21 21 13.7
Pearl River * 296 10 4 6 29.6
Peason Ridge 1,018 58 34 24 17.6
Peason Ridge (Oct 31 - Nov 1) 160 10 7 3 16.0
Pomme de Terre** 326 11 4 7 29.6
Russell Sage** 682 49 23 26 13.9
Sabine (24 - 25 Oct) 87 8 7 1 10.9
Sandy Hollow * 137 4 1 3 34.3
Sherburne ** 2,016 38 16 22 53.1
Sherburne ( 6-8 Dec) 1,625 90 38 52 18.1
Spring Bayou * 364 17 3 14 21.4
Thistlethwaite 739 16 6 10 46.2
Thistlethwaite (6-7 Dec) 603 35 22 13 17.2
Tunica Hills ** 205 2 2 0 102.5
West Bay (Oct 31 - Nov 1) 839 53 27 26 15.8
West Bay 602 11 6 5 54.7
Yancey** 3,451 86 46 40 40.1
23,141 1,332 646 686 17.4
2015 Managed Either Sex Deer Hunts 23,141 1,332 -0.49 17.4
2014 Managed Either Sex Deer Hunts 26,545 2,603 -0.02 10.2
2013 Managed Either Sex Deer Hunts 25,401 2,654 0.09 9.6
2012 Managed Either Sex Deer Hunts 23,449 2,416 0.01 9.7
2011 Managed Either Sex Deer Hunts 22,144 2,378 -0.21 9.3
2010 Managed Either Sex Deer Hunts 24,925 3,019 0.16 8.3
2009 Managed Either Sex Deer Hunts 27,643 2,603 0.01 10.6
2008 Managed Either Sex Deer Hunts 28,363 2,589 -0.16 11
2007 Managed Either Sex Deer Hunts 28,813 3,094 -0.04 9.3
2006 Managed Either-Sex Deer Hunts 30,008 2,895 -0.02 10.4
*= self clearing
**= combined mandatory check and self clearing

9
Figure 3. WMA managed hunt effort per deer harvested, 1960-2015.
Hunter success and harvest vary, sometimes substantially, from year to year. The 2015 season is an example of this
variation. The long term trend for WMA hunter success illustrates fewer efforts needed to harvest a deer. Additionally,
many exceptional deer are harvested on the WMAs.
Research
Effects of Predation on White-tailed Deer Recruitment on Tensas NWR- The 3rd and final season of fawn capture and
collaring wrapped up in summer 2015. Monitoring of fawns wrapped up during the fall of 2015. 98 mature females
were captured, collared, and fitted with VITs during the three year study. In addition, 70 fawns were collared and 49
parturition sites were identified. For the first 2 years, there has been only about 30% survival of fawns with predation
being the cause of most mortality. Primary predators are black bears, coyotes and bobcats. Results from the third year
are being finalized. (University of Georgia)
0.0
5.0
10.0
15.0
20.0
25.0
30.0
Long term WMA managed hunt Effort/kill, 1960-2015
10
Buck Disturbance Associated with Small Game Hunting with Dogs – Deer seasons in portions of Louisiana are very late to
allow hunters the opportunity to hunt peak breeding periods. This can cause a conflict with small game hunters, and
particularly rabbit hunters. Some managers or landowners will not allow any form of small game hunting to occur
during the long deer season, reducing opportunity to small game hunt. This study is designed to determine if rabbit
hunting with dogs impacts deer home range or movement patterns. (Louisiana State University)
Protocol Validation for Genetic Differentiation of Wild and Pen-raised White-tailed Deer - Development of a protocol for
use in identification of deer with genetic lineages originating from breeding pens would allow state agencies to protect
wild, native populations from being negatively affected by release of genetically-manipulated deer. Further, genetic
sampling of free-ranging deer population across a region would increase knowledge on the relative effectiveness of
different populations of origin released during restoration of white-tailed deer within the Southeast (Demarais et al.
2015). (Mississippi State University)
Disease
Disease monitoring is administered by the LDWF wildlife veterinarians and accomplished through necropsy efforts of
sick or dead individuals when observed by Department personnel or when reported by the public. Herd health
collections and managed hunts provide additional data and sampling opportunity. Biological samples are sent to the
Southeastern Cooperative Wildlife Disease Study (SCWDS) at the University of Georgia, LSU’s School of Veterinary
Medicine, Texas Veterinary Medical Diagnostic Lab, Mississippi Veterinary Diagnostic Laboratory, or the National
Veterinary Services Laboratory (NVSL) for diagnostic testing.
Eighty-six samples were submitted for serological analysis of exposure to various diseases as part of the LDWF herd
health monitoring program. These samples are used to evaluate the health status of the Louisiana deer herd. These
samples revealed 50% seroprevalence for Bluetongue Virus and 44% seroprevalence for Epizootic Hemorrhagic Disease
Virus. The results indicate likely recent infection of those animals with either Bluetongue Virus or Epizootic Hemorrhagic
Disease Virus or both. LDWF had 12 reported and confirmed cases of death due to hemorrhagic disease in wild white-
tailed deer during the 2015-16 season.
Additionally, 95 samples were collected from “target” white-tailed deer for Chronic Wasting Disease analysis at SCWDS
and NVSL. No samples tested positive. This brings the total number of wild white-tailed deer tested in Louisiana to
7,870 animals since the inception of the program in 2002.
White- tailed deer are being serologically evaluated for leptospirosis, a bacterial disease cause by multiple serovars of
Leptospira interrogans. Leptospirosis may be contracted from feral hogs and other animals and can cause illness and
abortions in deer. The exposure rate based on serological titers this year was 46.5%.
Deer Pens
Commercial deer pens are regulated by the Louisiana Department of Agriculture and Forestry. There are 214 breeding
facilites and 78 shooting preserves for a total of 292 LDAF licensed high fenced enclosures in 58 of 64 parishes (Figure 4).
Importing cervids from other states is prohibited by LDWF due to disease and other long term population threats.
Tangipahoa (24), Calcasieu (20), Beauregard (14), Lafourche (13) and Livingston (13) have the highest pen densities by
parish.

11
Figure 4. Louisiana Department of Agriculture and Forestry licensed deer pens by parish, 2016.

12