Embed Size (px)
Citation preview

Look4MySounds
Sound Platform for Remote Auscultation
Ana Margarida Alves Martins
Coimbra, 2009

Dissertation submitted to the Faculty of Sciences and Technology (Physics Department) of the University
of Coimbra in fulfillment of the requirements for the degree of Integrated Master in Biomedical
Engineering

ACKNOWLEGMENTS
First of all, I would like to thank Miguel for all the aid and support given so many
times during the project course, even when he was overwhelmed with work. Thanks for never
stop believing in my capabilities to achieve a good result.
I want to address my most grateful acknowledgement to my family for instilling in me
confidence for pursuing my MsC. Thanks for all the love, patience and support during this
year. Thanks for standing by my side when I needed the most and for always give me strength
to carry on.
I am thankful to ISA collaborators for their sympathy. And to some of them, thanks for
their help and interest in the project.
I also would like to thank to my closest friends and CI-GEI colleagues for the good
ambient of work and the relaxing moments kindly provided. Thanks also for their tips in some
programming doubts.
My grateful thanks go also to Doctors José Moutinho and Ana Filipa for their
availability, knowledge and patience in helping me to gain insight and deep understanding of
the medical reality.
Abstract
Look4MySounds
i
Abstract
Respiratory diseases are pathologies that affect the air passages, including the nasal
passages, the bronchi and the lungs. Their variety can go from acute infections, such as
pneumonia and bronchitis, to chronic conditions, like asthma and chronic obstructive
pulmonary disease (COPD). These pathologies result of changes in the lung structure or
airways obstruction, causing additional respiratory sounds (such as crackles and wheezes)
superimposed on normal ones.
Auscultation through the stethoscope is the most important and established non-
invasive method to distinguish between normal and abnormal sounds. However, this is a
subjective tool that extremely relies on medical experience and hearing capabilities. Besides
that, one of the basic requirements of this examination procedure is the need to maintain a
doctor-patient interaction. In many situations, it reveals unreachable and expensive for both
patient and healthcare unit. Recently, due to the concern in errors and costs reduction, while
improving the care quality, there was a significant increase of studies on computer-assisted
acquisition and analysis of respiratory sounds. In addition, the remote monitoring is becoming
an interesting and useful technology in health care services due to its clinical, economic and
social benefits.
The aim of this project is to develop an autonomous, portable and inexpensive sound
platform for remote auscultation of respiratory sounds. The system will allow continuous
monitoring of chronic diseases in a domestic environment over extended periods of time to
access its severity and progression, avoiding constant patient displacement to healthcare
units. Besides that, the screening of pulmonary conditions and/or pathologies through the
sounds, which allows the early detection of potential danger situations, will also be a
possible. The sound platform prototype includes: three boards that work integrated, a
stethoscope with a microphone incorporated to acquire the respiratory sounds and a memory
card to store them. The respiratory sound data is then classified through an algorithm
implemented in a microcontroller.
The present document describes the entire system specifications, the algorithm
implemented and the experimental evaluation/validation in real life situations, which points
towards the commercialization potential of the developed prototype.

Resumo
Look4MySounds
ii
Resumo
As doenças respiratórias são doenças que afectam as vias respiratórias, incluindo as
vias nasais, os brônquios e os pulmões. Estas podem ser agrupadas em duas grandes
categorias: infecções agudas, como a pneumonia e a bronquite; e condições crónicas que
incluem a asma e a doença pulmonar obstrutiva crónica (DPOC). As alterações estruturais dos
pulmões e a obstrução das vias respiratórias que resultam em doenças causam sons
respiratórios adicionais (como as crepitações e os sibilos) que se sobrepõem aos sons
respiratórios normais.
A auscultação, através do estetoscópio, é o mais importante e estabelecido método
não invasivo para distinguir entre sons normais e patológicos. No entanto, é uma ferramenta
subjectiva que depende muito da experiência médica e das capacidades auditivas de cada
um. Para além disso, o principal requisito deste procedimento é a necessidade de manter uma
interacção médico-paciente. Em muitas situações, isto torna-se inacessível e dispendioso
tanto para o paciente como para a unidade de saúde. Nos últimos anos, devido à preocupação
na redução de erros e custos enquanto se melhora a qualidade dos cuidados de saúde, tem-se
verificado um aumento significativo de estudos sobre a aquisição e análise de sons
respiratórios assistidas por computador. Para além disso, a monitorização remota está a
tornar-se uma tecnologia interessante e útil na área da saúde devido aos seus benefícios
clínicos, económicos e sociais.
O objectivo deste projecto é desenvolver uma plataforma de som autónoma, portátil
e económica para auscultação remota de sons respiratórios. Este sistema irá permitir a
monitorização contínua de doenças crónicas num ambiente familiar durante longos períodos
de tempo de modo a avaliar a severidade e progressão da doença, evitando assim as
constantes deslocações dos pacientes às unidades de saúde. O rastreio de
condições/patologias pulmonares através dos sons, ajudando na identificação precoce de
situações de perigo, também será possível com este equipamento. A plataforma de som inclui
três placas que funcionam integradas, um estetoscópio com um microfone incorporado para a
aquisição de sons e um cartão de memória para os armazenar. Os sons respiratórios são
depois classificados através de um algoritmo implementado num microcontrolador.
Através deste documento, pretende-se descrever as especificações de todo o sistema,
o algoritmo implementado e a avaliação/validação experimental em situações reais tendo em
vista a potencial comercialização do protótipo desenvolvido.

Contents
Look4MySounds
iii
Contents
Abstract ............................................................................................. i
Resumo ............................................................................................ ii
Contents .......................................................................................... iii
List of Tables .................................................................................... vi
List of Figures .................................................................................... vii
Acronyms ......................................................................................... ix
1. INTRODUCTION .............................................................................. 1
1.1 Look4MySounds Project ................................................................. 1
1.2 Motivation ................................................................................. 1
1.3 Objectives ................................................................................. 2
1.4 Audience .................................................................................. 2
1.5 Document Structure and Organization ................................................ 3
2. PROJECT MANAGEMENT .................................................................... 4
2.1 Project Members ......................................................................... 4
2.2 Tasks Division ............................................................................. 4
2.3 Entities Involved in the Project ........................................................ 5
2.3.1 ISA ...................................................................................... 5
2.3.2 CI-GEI .................................................................................. 6
2.3.3 HC ...................................................................................... 6
2.4 Scheduling ................................................................................. 7
2.4.1 Initial Planning ....................................................................... 7
2.4.1 Final Planning ........................................................................ 8
3. THEORETICAL BACKGROUND .............................................................. 9
3.1 Lungs: Anatomy and Physiology ........................................................ 9
3.2 Respiratory Diseases .................................................................... 10
3.3 Respiratory Sounds ...................................................................... 11

Contents
Look4MySounds
iv
3.3.1 Normal Sounds ...................................................................... 11
3.3.2 Adventitious Sounds ................................................................ 12
3.4 Auscultation Technique ................................................................ 13
4. LOOK4MYSOUNDS SYSTEM ................................................................ 15
4.1 Hardware Requirements ............................................................... 15
4.2 System Architecture .................................................................... 16
5. RELATED WORKS ........................................................................... 17
5.1 Problem Analysis ........................................................................ 17
5.1.1 Costs Context ........................................................................ 17
5.1.2 Diagnosis Context ................................................................... 18
5.2 State of the Art .......................................................................... 18
5.2.1 RP-7TM................................................................................. 18
5.2.2 CareTone® ........................................................................... 20
5.2.3 Web-based Remote Digital Stethoscope ......................................... 21
5.2.4 Intelligent Stethoscope ............................................................ 23
5.3 Review of the System ................................................................... 24
6. RESPIRATORY SOUNDS CLASSIFICATION ................................................. 25
6.1 Wheezes Classification ................................................................. 26
6.1.1 Implementation ..................................................................... 26
6.1.2 Flowchart ............................................................................ 30
6.2 Noise Filtering ........................................................................... 31
6.2.1 Implementation ..................................................................... 32
6.2.2 Flowchart ............................................................................ 35
6.3 Crackles Classification .................................................................. 36
6.3.1 Implementation ..................................................................... 36
6.3.2 Flowchart ............................................................................ 39
7. EXPERIMENTAL DATA ...................................................................... 42
7.1 Algorithm Performance ................................................................. 43
7.2 Discussion of the System Validation .................................................. 44
7.3 Graphical User Interface (GUI) ........................................................ 45
8. CONCLUSIONS .............................................................................. 46
9. FUTURE WORK .............................................................................. 47
Contents
Look4MySounds
v
10. REFERENCES .............................................................................. 48
11. ANNEXES .................................................................................. 52
11.1 Sound Platform Prototype Specifications .......................................... 52
11.2 Matlab Pseudo-code ................................................................... 53
11.3 Algorithm Tests ........................................................................ 54
11.4 GUI Functionalities .................................................................... 56

List of Tables
Look4MySounds
vi
List of Tables
Table 1 - Project team. ....................................................................................... 4
Table 2 – Tasks assignment. ................................................................................. 5
Table 3 - CareTone® specifications. ..................................................................... 21
Table 4 – Hardware modules specifications. ............................................................ 23
Table 5 – Algorithm general performance. .............................................................. 43
Table 6 – Algorithm stages performance. ............................................................... 44

List of Figures
Look4MySounds
vii
List of Figures
Figure 1 – Lungs anatomy. .................................................................................... 9
Figure 2 – Normal sound signal. ........................................................................... 11
Figure 3 – Wheezes signal. ................................................................................. 12
Figure 4 – Crackles signal. .................................................................................. 12
Figure 5 – Locations for auscultation on the anterior chest. ......................................... 13
Figure 6 – Locations for auscultation on the lateral chest. .......................................... 13
Figure 7 – Locations for auscultation on the posterior chest. ....................................... 14
Figure 8 – Sound platform prototype. .................................................................... 15
Figure 9 – a) Stethoscope with a microphone incorporated; b) Memory card..................... 16
Figure 10 – Look4MySounds physical architecture. .................................................... 16
Figure 11 – RP-7TM Remote Presence System. ........................................................... 19
Figure 12 – Robot's panoramic Virtually There visualization system. ............................... 19
Figure 13 – a) LapTop ControlStation; b) DeskTop ControlStation. ................................. 20
Figure 14 – CareTone® Telephonic Stethoscopes devices. ........................................... 21
Figure 15 – System architecture of the Web-based remote digital stethoscope.................. 22
Figure 16 – The interface hardware of the design. .................................................... 22
Figure 17 – Plot of the signal input. Wheezes epochs are pointed out by arrows. ............... 27
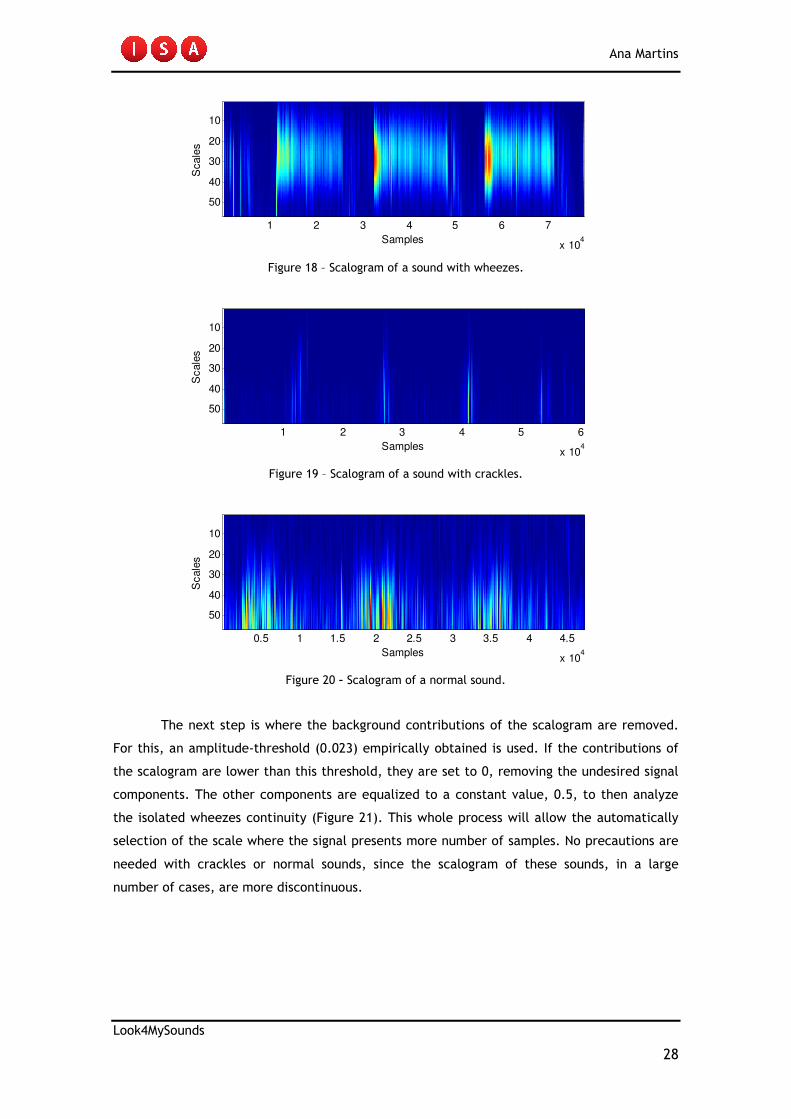
Figure 18 – Scalogram of a sound with wheezes. ....................................................... 28
Figure 19 – Scalogram of a sound with crackles. ....................................................... 28
Figure 20 – Scalogram of a normal sound. ............................................................... 28
Figure 21 – Wheezes continuity properties. ............................................................. 29
Figure 22 – Wheezes classification flowchart: a) Matlab; b) dsPIC. ................................ 31
Figure 23 – Heart sound signal overlay on the respiratory sound. .................................. 32
Figure 24 – Normal sound where no peaks are detected. ............................................ 33
Figure 25 – Normal sound with noise. .................................................................... 33
Figure 26 – Peaks detection. The local maxima are plotted as red stars. ......................... 33
Figure 27 – Sound with noise removed. .................................................................. 34
Figure 28 – Sound with crackles. .......................................................................... 34
Figure 29 – Peaks detection. The local maxima are plotted as red stars. ......................... 34
Figure 30 – Sound with noise removed. .................................................................. 35
Figure 31 – Noise filtering flowchart. .................................................................... 35
Figure 32 – Plot of the signal input. Crackles are pointed out by arrows. ......................... 36
Figure 33 – Normal sound histogram’s entropy. ........................................................ 38
Figure 34 – Histogram’s entropy of a sound with crackles. .......................................... 38

List of Figures
Look4MySounds
viii
Figure 35 – Crackles classification flowchart. .......................................................... 40
Figure 36 – Algorithm flowchart implemented in the dsPIC. ......................................... 41

Acronyms
Look4MySounds
ix
Acronyms
Abbreviation Definition
OSAS Obstructive Sleep Apnoea Syndrome
ISA Intelligent Sensing Anywhere
WHO World Health Organization
COPD Chronic Obstructive Pulmonary Disease
PC Personal Computer
M2M Machine-to-Machine
R&D Research and Development
CI Centro de Instrumentação
GEI Grupo de Electrónica e Instrumentação
UC Universidade de Coimbra
HC Hospital dos Covões
CHC Centro Hospitalar de Coimbra
DSC Digital Signal Controller
DC Direct Current
kB Kilobyte
GB Gigabyte
GPRS General Packet Radio Service
INE Instituto Nacional de Estatística
FDA Food and Drug Administration
RP Remote Presence
POTS Plain Old Telephone Services
DSL Digital Subscriber Line
ISDN Integrated Services Digital Network
IP Internet Protocol
NASA National Aeronautics and Space Administration
PLC Power Line Communications
PHS Personal Handy-phone System
PPP Point-to-Point Protocol
LCD Liquid Crystal Display
CORSA Computerized Respiratory Sound Analysis
FT Fourier Transform
FFT Fast Fourier Transform

Acronyms
Look4MySounds
x
IFFT Inverse Fast Fourier Transform
LED Light Emitting Diode
AR/MA Auto-Regressive/Moving Average
TEWA Time-Expanded Waveform Analysis
TP True Positives
FN False Negatives
TN True Negatives
FP False Positives
GUI Graphical User Interface

Ana Martins
Look4MySounds
1
1. INTRODUCTION
1.1 Look4MySounds Project
The idea of a sound platform for remote auscultation arose following the Sleep@Home
project context, developed in the previous two years. The goal of the Sleep@Home was the
home screening of Obstructive Sleep Apnoea Syndrome (OSAS). The system prototype was
composed of a video camera, an oximeter and a video server where the data was stored. The
physicians pointed as main limitation of this system the need to listen the patient’s
breathing. For example, snore during sleep time, is a significant feature of respiratory
problems, often associated with Sleep Apnoea. Based in these medical advices, ISA decided to
create a new project that could diagnose this disease, but also many others where the sounds
analysis is important.
The Look4MySounds project is intended to cover three biomedical applications:
pulmonology, roncopathy and cardiology. The pulmonology application is presented along this
thesis.
Pulmonology Roncopathy Cardiology
1.2 Motivation
Respiratory diseases are a leading cause of hospitalization and death. The diseases
that reveal the most worrying numbers are asthma, chronic obstructive pulmonary disease
(COPD) and pneumonia. The World Health Organization (WHO) estimates that, in 2007, 300
millions of people in the world have asthma and 255 000 people died of asthma in 2005.
Besides that, 210 million people suffer from COPD and 3 million died in 2005. WHO predicts
that COPD will become the third leading cause of death in 2030. Additionally, pneumonia is a
largest worldwide cause of death in children. Statistics reveal that this disease kills 1,8
millions of children (under the age of 5 years) every year, more than AIDS, malaria and
measles combined [1,2].
In many situations is complicate to provide the required medical monitoring of
patients, mainly by lack of human resources and infrastructures, but also by the difficult
Look4MySounds

Ana Martins
Look4MySounds
2
access to health services of a considerable number of people (mostly elderly). Furthermore,
the governmental politics require that health entities increase their productivity and, at the
same time, impose a spending restraint in their services. The daily life activities, the stress
and the lack of time are also reasons for many people to not control their vital signs in a
medical care unit. These signs may be indicative of a possible disease.
Concerning errors and costs reduction while improving the care quality, wireless
technologies are becoming interesting and useful medical solutions. The remote monitoring,
with its clinical, economic and social benefits, enables the vital signs monitoring of patients
from their homes by healthcare providers. In fact, if diagnosed in time, many diseases can
easily be treated at home with antibiotics and a supervision of the patient’s respiratory
sounds. The access to patients’ data is simplified, being only necessary when an alarm is
emitted or just for diagnostic routine purposes. In the latter situation, another advantage to
the patient is that they avoid constant displacements to healthcare units just to deliver
measured values.
Advanced techniques in signal processing, combined with data remote transmission,
allow the development of portable systems with low power, great autonomy and more
comfortable for household.
1.3 Objectives
The aim of this project is the development of an autonomous, portable and
inexpensive sound platform for remote auscultation. The system must be able to acquire,
store and process respiratory sounds. In addition, each type of pathologic sound should be
distinguished. The sound data must be saved into a memory card. It should also be possible to
transfer the data to the patient’s personal computer (PC) by a RS-232 serial port or remotely
sent to a doctor or a healthcare unit. The respiratory sounds should be collected through a
stethoscope with a microphone incorporated.
1.4 Audience
Along this document is reported what was done during the project in order to reach
the main goal proposed. All the research, the execution, the knowledge acquired and the
decisions made will be evaluated by supervisors who followed the entire system development
process.
Ana Martins
Look4MySounds
3
1.5 Document Structure and Organization
The present document is divided in 9 organized chapters. This section makes a brief
description of each one.
1 – Introduction – describes the main purposes of a product like this on the market.
Also, the objectives of the master’s project are provided;
2 – Project Management – refers to the team members, including supervisors and
entities involved in the project. The tasks division and its initial/final planning were
presented as well;
3 – Theorical Background – provides all the information related to the respiratory
sounds field. The anatomy of the lungs, the respiratory diseases and associated sounds as well
as the auscultation technique used to acquire the patient’s sounds will be described in this
chapter;
4 – Look4MySounds System - reports a brief description of the system. All the
components of the acquisition solution will be enunciated and the general architecture will
be presented;
5 – Related Works – contains the problem analysis and a general view of the
equipments for remote transmission/classification of respiratory sounds. The final section
summarizes the advantages that the pretended solution may offer when comparing with the
already existing;
6 – Experimental Data – refers to the subjects data used to perform the
evaluation/validation of the prototype. Furthermore, the conditions in which the tests were
made will be described. The statistical results obtained after algorithm conclusion and a
discussion of the same is also presented;
8 – Conclusions – final impressions concerning the system (hardware plus software)
developed during the year. A doctor’s appreciation will also be presented;
9 – Future Work – this chapter concludes the project report with some issues that the
student considers important to develop in the future to increase the robustness of the
equipment.

Ana Martins
Look4MySounds
4
2. PROJECT MANAGEMENT
2.1 Project Members
A Biomedical Engineering student, from the Faculty of Sciences and Technology –
University of Coimbra, and their supervisors, composed the project team (Table 1). The
student and the Engineer Inês Fonseca, her technical supervisor, carried out the development
of the sound platform (software and firmware modules). The supervisors had an important
role in the orientation and coordination of their work.
Table 1 - Project team.
Name Contribute Email contact
Ana Margarida Martins Student [email protected]
Engineer Inês Fonseca Technical Supervisor [email protected]
Engineer Soraia Rocha Supervisor [email protected]
Engineer Catarina Pereira Supervisor [email protected]
Engineer José Luís Malaquias Supervisor [email protected]
Professor José Basílio Simões Supervisor [email protected]
Professor Carlos Correia Supervisor [email protected]
Doctor Helena Estevão Medical Supervisor
Doctor José Moutinho Medical Supervisor
2.2 Tasks Division
The assignment of the tasks that Margarida and Engineer Inês Fonseca would perform
was made at the beginning of the project. In the first semester, both team members were
responsible for the development of respiratory sounds classification algorithms. During this
period, they implemented several computer-assisted diagnosis techniques, taking into
account methods already used in the literature. However, the results of the implemented
algorithms did not work with the sounds collected with the student’s PC at HC (the same
pathology gave different results for each patient). So, a redefinition of Margarida’s tasks was
accorded and, from the middle of the second semester, she became the only responsible for
the implementation of a simple algorithm for respiratory sounds classification.

Ana Martins
Look4MySounds
5
Table 2 – Tasks assignment.
Project Members Assigned Tasks
Ana Martins • Collect respiratory sounds from healthy
people and patients at the Hospital;
• Analysis of the sounds data and
identification of the obvious pathologies;
• Programming the sound platform with an
algorithm for respiratory sounds
classification.
Inês Fonseca • Programming the sound platform to
acquire and store respiratory sounds;
• Firmware implementation to remote
communication.
2.3 Entities Involved in the Project
2.3.1 ISA
Intelligent Sensing Anywhere (ISA) is a spin-off company of the University of Coimbra
founded in 1990. Currently, it is an award-winning global company specialized in Telemetry
and Machine-to-Machine (M2M) Communications.
The company has a Research and Development (R&D) department that works focused
in providing complete solutions in several fields like telemetry, industrial automation,
environment and healthcare. With a team of highly specialized engineers, which has been
growing since its formation, ISA made possible the integration of several students in its
software team to help in market viability studies and in the development of simple solutions
with commercialization potential.
In the first semester, the Engineers José Luís Malaquias and Catarina Pereira were
responsible for the supervision at ISA. In the middle of the second semester, with the arrival
of the Engineer Soraia Rocha, she became the most effective supervisor of the project.
Several meetings were arranged to briefs presentations of the project state and to clarify
some doubts. These meeting were always very profitable in order to point new directions for
the work progression.
After the change of ISA installations to the current address, the student began to
develop the work, twice a week, in company desks reserved for temporary workers,
benefiting of a closer accompaniment by the supervisors.

Ana Martins
Look4MySounds
6
Entity Name Main Responsible Website
ISA Engineer José Basílio Simões http://www.isa.pt
2.3.2 CI-GEI
CI is a research group integrated in GEI, which had been recently created in the
Physics Department of the University of Coimbra (UC). Its research areas include Atomic and
Nuclear Instrumentation, Biomedical Instrumentation, Plasma Physics Instrumentation,
Optical Signal Processing and Telemetry and Industrial Control. CI was the institution
responsible for the connection between ISA and UC.
The supervisor at CI was Professor Carlos Correia. His knowledge and assistance was
important in the signal processing field. Professor Carlos Correia was always available to point
towards new directions of work.
Most of the work was developed in this research centre, mainly when the student was
not in ISA installations.
Entity Name Main Responsible Website
CI-GEI Professor Carlos Correia http://lei.fis.uc.pt
2.3.3 HC
HC is a general Hospital that is integrated in CHC. The CHC mission is to provide
differentiated healthcare throughout the cycle of human life, from prevention to
rehabilitation, as a regional and national reference centre in diverse medical areas, such as
cardiology, neurology, pulmonary, among with many others. It also made possible the
investigation, education and formation. HC includes the Sleep Studies Laboratory, were
Doctor José Moutinho works, and the Pulmonology Service, where the respiratory sounds from
patients interned were collected. Doctor José Moutinho, with his knowledge and extensive
experience, made the entire medical accompaniment helping in the auscultation process
definition and the respiratory sounds classification collected.
Entity Name Main Responsible Website
HC Doctor Rui Pato http://www.chc.min-saude.pt

Ana Martins
Look4MySounds
7
2.4 Scheduling
2.4.1 Initial Planning
The initial scheduling was defined by the Engineer Inês Fonseca with the supervision of the Engineer José Malaquias.
The tasks 7 and 17, marked with green colour, were carried out by the student and her technical supervisor, Engineer Inês Fonseca.

Ana Martins
Look4MySounds
8
2.4.1 Final Planning
As it was already mentioned in the chapter 2.2, the results of the implemented algorithms were not the expected. So, in the beginning of April,
Margarida’s tasks were redefined by the Engineer Soraia Rocha.
ID Task Name Start Finish Duration
Abr 2009 Mai 2009 Jun 2009 Jul 2009 Ago 2009
12-4 19-4 26-4 3-5 10-5 17-5 24-5 31-5 7-6 14-6 21-6 28-6 5-7 12-7 19-7 26-7 2-8 9-8 16-8 23-8 30-8 6-9
1 5d17-04-200913-04-2009Test the algorithm implemented by Inês
Fonseca for respiratory phases detection
2 20d15-05-200920-04-2009Development of an algorithm in Matlab for
respiratory sounds classification
4 10d22-05-200911-05-2009Draft of a Graphical User Interface (GUI)
5 10d29-05-200918-05-2009Algorithm optimization (noise filtering stage)
6 8d03-06-200925-05-2009Preparation for the second project
presentation
7 5d05-06-200901-06-2009Intensive study in C programming language
8 10d19-06-200908-06-2009Convert the implemented algorithm to C
10 2d23-06-200922-06-2009MPLab User’s Guide and dsPICs
programming study
11 26d29-07-200924-06-2009Implement the algorithm in C to the dsPIC
12 3d16-07-200914-07-2009Elaboration of the User’s Guide document for
the Look4MySounds project
13 36d09-09-200922-07-2009Project final report
3 5d24-04-200920-04-2009Elaboration of the project’s technical
specifications document
9 1d22-06-200922-06-2009Participation in the Innovation Days (Lisbon)

Ana Martins
Look4MySounds
9
3. THEORETICAL BACKGROUND
3.1 Lungs: Anatomy and Physiology
The human lungs are a pair of organs responsible for the respiration, i.e. transport
the oxygen (O2) from the atmosphere to the bloodstream and release carbon dioxide (CO2)
from the bloodstream to the atmosphere. This process of gas exchange is accomplished for
small amounts of other gases, floating bacteria, and viruses. So, the lungs also protect the
body against these airborne irritants and infections agents.
The lungs are spongy and cone-shaped; they extend from the trachea to below the
heart and occupy most of the thorax.
During respiration, which includes inspiration and expiration phases, the air enters
the body through the nose or the mouth and travels down the throat and trachea into the
chest through the bronchi. The bronchi subdivide into successive generations of narrower and
shorter branching tubes. The final destination for inhaled air is a network of about 3 millions
air sacs, called alveoli. Movement of the air into the lungs is controlled by the respiratory
muscles of the thorax, the diaphragm and the muscles that move the ribs [3,4].
Figure 1 – Lungs anatomy.
Ana Martins
Look4MySounds
10
3.2 Respiratory Diseases
Medical problems at birth or during infancy and growth can affect lung development.
Also, later in life the lungs may be damaged by smoking, occupational exposures, or
accidents. These abnormalities allow air pollutants to break through the lung's defences and
the result can be respiratory diseases [3].
Respiratory diseases are pathologies that affect the air passages, including the nasal
passages, the bronchi and the lungs. They can be classified in many different ways: by the
organ involved, by the pattern or symptoms or by the cause of the disease. However, the
most common fall into two broad categories: acute infections, such as pneumonia and
bronchitis, and chronic conditions, like asthma or chronic obstructive pulmonary disease
[2,5].
Pneumonia is a disease that results from the infection of the lung tissues by certain
germs, such as bacteria, viruses, and fungi. As microorganisms multiply, the alveoli become
inflamed, red, and accumulate fluid. It is difficult for the person to breathe properly and may
lead to death within 3-4 days, if not treated. Fever, chills and cough are also symptoms of
this disease. It can affect people of any age, although it is more serious in the very young
(children under 5 years of age) and people over the age of 65 [2,6].
Bronchitis is an acute inflammation of the mucous membranes of the bronchi. The
thin mucous lining of these airways become irritated and swollen. People who have bronchitis
often have a cough that brings up mucous, wheezing (subject described in the following
chapter), chest pain or discomfort, a low fever, and breathlessness. Bronchitis can be
classified into two categories, acute and chronic; each one has unique etiologies, pathologies,
and therapies. Both adults and children can have this disease [6,7].
Asthma is a chronic (long-term) lung disease in which the airways (bronchi) are
reversibly narrowed. It is characterized by current attacks of breathlessness and wheezing.
Asthma affects people of all ages, but it most often starts in childhood [2,6].
Chronic obstructive pulmonary disease (COPD) is a progressive disease in which
airways become narrowed. The most common symptoms of COPD are breathlessness,
excessive sputum production, wheezing, and a chronic cough. Cigarette smoking is the
leading cause of COPD. Long-term exposure to other lung irritants, such as air pollution,
chemical fumes, or dust, also can trigger an abnormal inflammatory response of the lung. In
contrast to asthma, the limitation of airflow is poorly reversible and usually gets progressively
worse over time [2,6].
Ana Martins
Look4MySounds
11
According to WHO, pneumonia, asthma and COPD are under-diagnosed and under-
treated diseases, creating a substantial burden to individuals and families and possibly
restricting individuals’ activities for a lifetime [2].
3.3 Respiratory Sounds
Respiratory sounds are all the sounds related to respiration that can be heard or
detected at the mouth, over the trachea or the chest wall. They can be classified as normal
sounds (also called breath sounds) or adventitious sounds. The adventitious sounds are related
to additional sounds superimposed on breath sounds. They can be continuous sounds (like
wheezes, rhonchus and stridor) or discontinuous sounds (such as crackles). The presence of
these sounds usually indicates a pulmonary disorder. The most common and more studied
noises are wheezes and crackles [5,8,9]. So, this thesis will focus on these sounds. Rhonchus
has similar features to wheezes and some physicians do not distinguish between them. Stridor
is a very rare sound and usually is associated with children.
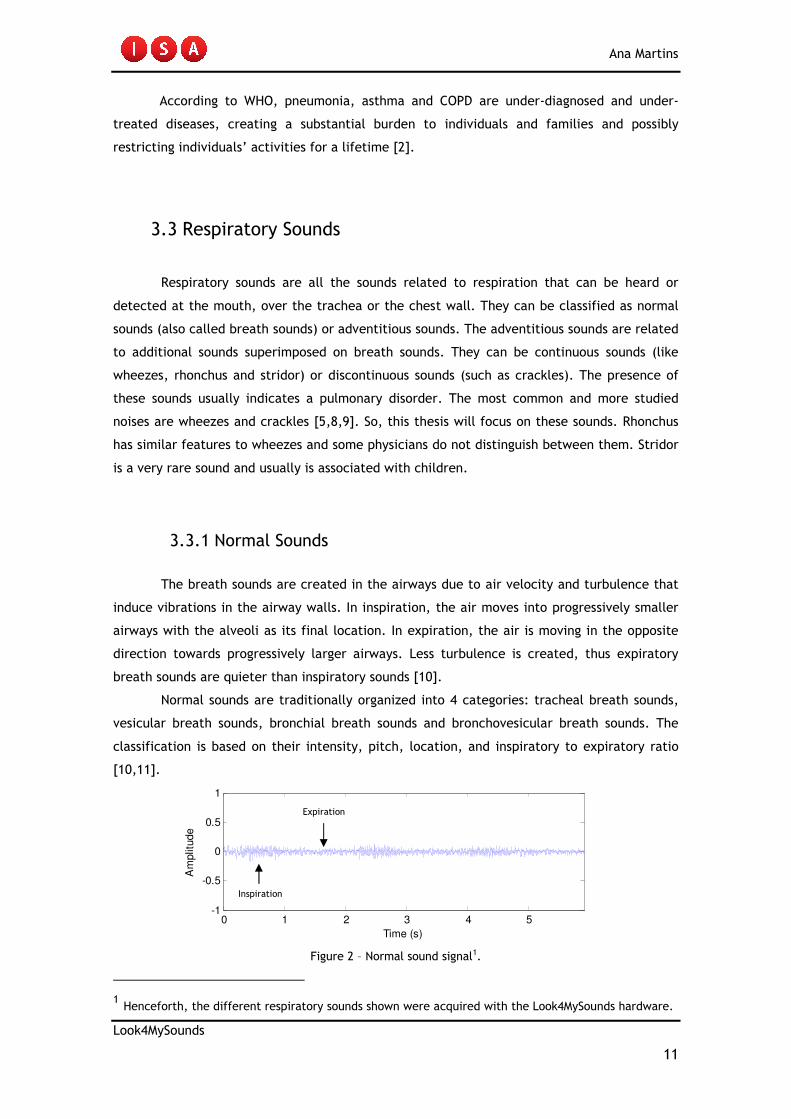
3.3.1 Normal Sounds
The breath sounds are created in the airways due to air velocity and turbulence that
induce vibrations in the airway walls. In inspiration, the air moves into progressively smaller
airways with the alveoli as its final location. In expiration, the air is moving in the opposite
direction towards progressively larger airways. Less turbulence is created, thus expiratory
breath sounds are quieter than inspiratory sounds [10].
Normal sounds are traditionally organized into 4 categories: tracheal breath sounds,
vesicular breath sounds, bronchial breath sounds and bronchovesicular breath sounds. The
classification is based on their intensity, pitch, location, and inspiratory to expiratory ratio
[10,11].
0 1 2 3 4 5-1
-0.5
0
0.5
1
Time (s)
Am
plit
ude
Figure 2 – Normal sound signal1.
1 Henceforth, the different respiratory sounds shown were acquired with the Look4MySounds hardware.
Inspiration
Expiration

Ana Martins
Look4MySounds
12
3.3.2 Adventitious Sounds
Wheezes are continuous sounds characterized mainly by their pitch and duration. The
frequency of this pathologic sound lies within 100 and 2500 Hz, with a fundamental frequency
between 400 and 1000 Hz. Wheezes, predominant of expiratory phase, are very often
approximately by a pure sinusoidal signal, which justifies their musical character. According
to Computerized Respiratory Sound Analysis (CORSA) guidelines, the dominant frequency of
this adventitious sound is over 100 Hz and the duration is greater than 80 ms. Wheezes are
produced when air passes through slightly occluded airways, causing the walls of the airways
to oscillate. They usually identify the presence of an obstructive pathology, for example,
asthma or COPD [5,12].
0 1 2 3 4 5 6 7 8 9-1
-0.5
0
0.5
1
Time (s)
Am
plit
ude
Figure 3 – Wheezes signal.
Crackles are discontinuous, explosive, non-musical sounds characterized by their
specific waveform, duration, and location in the respiratory cycle. Concerning the last two
features, crackles can be fine (short duration and typically occurs in the inspiratory phase) or
coarse (long duration and is present in both respiratory phases). The crackles can be heard
over the chest wall and are produced by the sudden opening of peripheral airways (especially
the alveoli) from fully a deflated state. However, they also can be heard over the trachea
and, in these cases, are produced by the passage of air bubbles through partially obstructed
main airways. The principal pathologies where these adventitious sounds can be found are
pulmonary fibrosis, bronchiectasis, COPD and pneumonia [5,8,10].
0 1 2 3 4 5 6 7-1
-0.5
0
0.5
1
Time (s)
Am
plit
ude
Figure 4 – Crackles signal.

Ana Martins
Look4MySounds
13
3.4 Auscultation Technique
Auscultation is one of the most important and effective technique employed by a
physician to evaluate the patient’s respiratory function. The examination symmetrically is
used to allow comparing and detecting unilateral injuries. However, in terms of positions to
place the stethoscope there is no consensus in the literature. The opinion differs from doctor
to doctor, institution to institution, paper to paper. So, it was decided to adopt the technique
used by the Doctor José Moutinho, the pulmonology specialist that made all the medical
accompaniment of the project.
1. Anterior (3 positions switching between the right and left side)
Figure 5 – Locations for auscultation on the anterior chest.
2. Lateral (3 positions switching between the right and left side)
Figure 6 – Locations for auscultation on the lateral chest.
1 2
3 4
5 6
2
3
6

Ana Martins
Look4MySounds
14
3. Posterior (4 positions switching between the right and left side)
Figure 7 – Locations for auscultation on the posterior chest.
During the auscultation, the stethoscope must be in contact with the patient’s skin
whenever is possible to avoid the rubbing of the clothes against the stethoscope. This may
lead to a misinterpretation of the sounds as being abnormal. Besides that, the stethoscope is
pressed firmly. Thus, the respiratory sounds are clearer, less suitable to background noise and
the friction due the stethoscope contact with the skin decreases. It is also important to
acquire the sound in a silent environment, without television/radio noise or people talking.
The patient must be in a proper position, i.e. sitting up in bed or chair. All the twenty
sounds are collected with the patient breathing normally through the mouth. It is required
that the patient remain silent while being auscultate.
2 1
4 3
5 6
7 8

Ana Martins
Look4MySounds
15
4. LOOK4MYSOUNDS SYSTEM
4.1 Hardware Requirements
The Look4MySounds system was designed to be as portable and autonomous as
possible to enable the patient’s sounds monitoring at his own home. So, the system hardware
only requires a sound platform, a memory card and a stethoscope. The sound platform was
chosen by the Engineer José Malaquias after a pre-selection of the student Eduardo Domingos.
The prototype includes three boards from Microchip® that work integrated:
1. Development Board: Explorer 16 Development Board® [13]
2. Audio Board: Audio PICtail Plus Daughter Board® [14]
3. Cards Board: PICtail Daughter Board For SD&MMC Cards® [15]
Figure 8 – Sound platform prototype.
The first board includes the dsPIC33F Digital Signal Controller (DSC) and is responsible
for the communication between the other two boards. The audio board is responsible for the
sound acquisition through the stethoscope, which is connected on the left side of the board.
The last board allows reading and writing data on the memory card.
The sound platform is powered by 9V (DC) voltage, provided by a power supply home
plugged (220V) (for more details see the annex Sound Platform Prototype Specifications).

Ana Martins
Look4MySounds
16
1
2 3
4
A Littmann Select Stethoscope® was chosen for the respiratory sounds acquisition
[16,17]. This simple stethoscope offers reliable and clear acoustics to healthcare
professionals listening to lung, heart or blood pressure sounds. In order to amplify the sounds,
an electret microphone, suitable to acquiring the sounds frequency range, was introduced in
the stethoscope.
The sounds are stored in a memory card SD with 2 GB from the SanDisk® [18].
Figure 9 – a) Stethoscope with a microphone incorporated; b) Memory card.
4.2 System Architecture
Look4MySounds is a system that understands two sides of interaction: patient and
healthcare provider. The first step of the process is the patient’s respiratory sounds
acquisition with the help of a family member, taking into account a pre-defined order of
auscultation. The sounds are stored in a memory card folder and, when the sounds recording
finish, the algorithm will classify all the sounds recorded. In addition, a brief medical report
with all the classifications is made. This information and the sound data could be transfer to
the patient’s PC by a RS-232 serial port or remotely sent to a doctor or a healthcare unit. The
healthcare provider receives the data and takes the procedures that seem necessary. The
wireless technology that will be used for data remote transmission is under study by the
Engineer Inês Fonseca. However GPRS could be a possible solution.
Legend: 1-Patient; 2-Patient’s Family Member; 3-Sound Platform; 4-Doctor/Healthcare unit.
Figure 10 – Look4MySounds physical architecture.
Acquisition Module

Ana Martins
Look4MySounds
17
5. RELATED WORKS
5.1 Problem Analysis
The Europe is facing relevant demographic changes that will cause a major impact on
the whole society. From 2005 to 2030, the number of people over 65 years old will rise by
52,3%, while the age group of 15-64 will decrease by 6,8% [19]. In Portugal, the scenario is
identical. According to INE, in 2008 for each 100 juveniles there were 114 elders [20]. The
increase in life expectancy is one of the main causes of this phenomenon.
In 1920, the life expectancy was 35,8 and 40,0 years for men and women,
respectively. In 2008 reached to 75,4 years for men and 82,0 years for women. In addition,
INE studies predict that in 2060, these values will increase more than 5 years in both sexes
[21].
The incidence of chronic diseases augments with the people’s age. Due to this fact, it
is essential to provide long term observation to those patients. Their fragile health, and the
tendency to chronic diseases, made this age group one of the most sensible that must be
closely observed by caregivers.
The most well established and used medical technique is the examination through the
stethoscope. One of the basic requirements of this procedure is the need to maintain a
doctor-patient interaction. Consequently, patients who need frequent – perhaps even daily -
examinations are faced with the burdensome prospect of frequently visiting their doctor at a
hospital or clinic. These geographic constraints are particularly difficult to patients who live a
long distance from healthcare units and, consequently, have difficulty in moving (most elderly
people). Additionally, in Portugal, the large majority of elder people have low pensions and
the daily visits to the doctor become too expensive.
Nowadays, and due to the economic constraints along with all the others, there is an
urgent need to increase the quality of care while reducing costs and errors.
5.1.1 Costs Context
In what concerns to respiratory diseases monitoring, up to 84% of direct costs
associated with COPD are due to patients’ hospitalization. The total costs of asthma in Europe
is €17,7 billion per year, and the productivity lost is estimated at €9,8 billion [22,23].
As the number of people requiring healthcare is increasing, while the number of
healthcare providers is diminishing, the healthcare units are encouraged to reduce the length
of patient’s stay. Besides that, when is required to hire a caregiver to visit or stay with the

Ana Martins
Look4MySounds
18
patient at his home, the costs are intolerable for many people. Another relevant point is the
waiting lists to get a regular visit for the physician. On units that are visited by a large
number of patients, it is essential to regulate the patients’ appointments concerning the
gravity of the disease of each person.
Accordingly to governments and healthcare units, it is critical the need to focus on
products that can supervise remotely the patients maximizing, thus, the relation between
costs and benefits. Wireless solutions, that combine remote monitoring equipment with
communications technologies, seem to be very promising. In the patient point of view, this
means fewer offices and emergency room visits, reducing the inherent duration of
hospitalization as well as the travel time and costs. These technologies, from the physician
side, mean a more efficient case management for each particular patient [24].
Monitoring the progression of diseases, based on a remote notion, can lead to better
treatment of the disease. These equipments will also incentive a preventive healthcare
system, avoiding the increasing of chronic diseases gravity. Besides that, the pos-treatment at
home, in a comfortable and domestic environment, can lead to an acceleration of the
patient’s recovery.
5.1.2 Diagnosis Context
As it was already mentioned, the auscultation through the stethoscope is one of the
most important and established non-invasive method to distinguish between normal and
abnormal sounds. Despite being a low cost instrument, this is a subjective tool that extremely
relies on medical experience and hearing capabilities [25,26]. Developing the skill to make a
good diagnosis takes years of study and practice. Acquiring expertise in identifying some lung
sounds requires experience that many physicians do not have the opportunity to acquire.
Concerning this, recently, there was a significant increase of studies on computer-assisted
acquisition and analysis of respiratory sounds. Moreover, applications, including diagnosis
establishment, monitoring and data exchange through Internet, for example, are obviously
complementary tools to objective and automatic auscultation sound analysis.
5.2 State of the Art
5.2.1 RP-7TM
The RP-7TM Remote Presence System is a registered trademark of InTouch
Technologies [27]. InTouch Health® (founded in January 2002) is a leading provider of
Remote Presence (RP) telehealth solutions that empower physicians to easily and more
Ana Martins
Look4MySounds
19
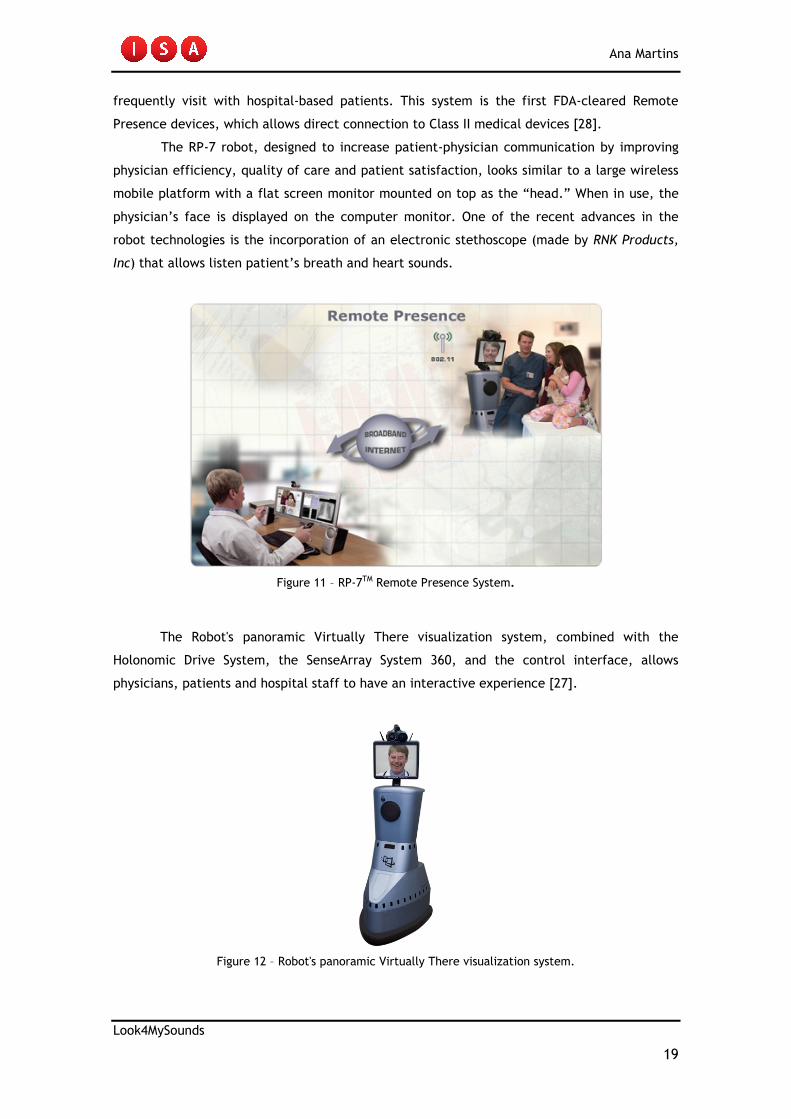
frequently visit with hospital-based patients. This system is the first FDA-cleared Remote
Presence devices, which allows direct connection to Class II medical devices [28].
The RP-7 robot, designed to increase patient-physician communication by improving
physician efficiency, quality of care and patient satisfaction, looks similar to a large wireless
mobile platform with a flat screen monitor mounted on top as the “head.” When in use, the
physician’s face is displayed on the computer monitor. One of the recent advances in the
robot technologies is the incorporation of an electronic stethoscope (made by RNK Products,
Inc) that allows listen patient’s breath and heart sounds.
Figure 11 – RP-7TM Remote Presence System.
The Robot's panoramic Virtually There visualization system, combined with the
Holonomic Drive System, the SenseArray System 360, and the control interface, allows
physicians, patients and hospital staff to have an interactive experience [27].
Figure 12 – Robot's panoramic Virtually There visualization system.

Ana Martins
Look4MySounds
20
Using a ControlStation, the remote physician, which may be in his home or office,
manoeuvres the RP-7® Robot through a joystick while interacting with patients, family
members and staff. There are three varieties of ControlStations: Laptop, Desktop or
ControlStation Kit. All of these include the Remote Presence software, camera, microphone,
speaker and joystick. The camera, speaker and microphone allow real-time, high-quality,
two-way audio and video communication [27,29].
Figure 13 – a) LapTop ControlStation; b) DeskTop ControlStation.
The Shawnee Mission Medical Centre (SMMC) at Kansas City was the first hospital in
the world to acquire this new version of RP-7 [29].
The robot can be leased for about 2110€ a month and the company believe that the
Hospital can benefit of over 6 millions of euros annually [27].
5.2.2 CareTone®
American TeleCare's® patented family of CareTone® Telephonic Stethoscopes allows
high-quality, real-time heart, lung and bowel sounds to transmit over ordinary (POTS) or
digital (DSL, ISDN, T1) telephone lines. American TeleCare, Inc. is an established leader in the
TeleHomecare field providing solutions combined sophisticated technology with sound clinical
expertise to develop systems for patients and health care providers [30,31].
The CareTone consists of a sending and receiving unit that enables a doctor or other
healthcare provider to perform a stethoscope examination on a remotely-located patient. The
sending unit contains a high-quality chest piece, a power indicator light and a stereo jack for
headphones in consultations where there is a clinician at both the remote and central sites.
The receiving unit includes headphones, volume control and a switch to select either bell or
diaphragm frequency sounds [32].
The acoustic stethoscope sounds are converted into electrical signals, and then
transmitted over a conventional telephone line. At the doctor’s location, the signals are
shifted down to their original frequencies and then converted back to audible sound for the
doctor’s analysis [32].

Ana Martins
Look4MySounds
21
American TeleCare's CareTone IP Software enables the transmission of auscultation
sounds from the CareTone (ordinary telephone line) and CareTone Ultra Digital (digital
telephone line) Telephonic Stethoscopes over an IP network [30].
Figure 14 – CareTone® Telephonic Stethoscopes devices.
The good quality of this industry-leading stethoscope has been recognized by
institutions such as NASA, which employed the device in its space shuttle program. The
CareTone also has been integrated into many institutional and prison telemedicine programs
both at the USA national and international panorama [30].
Table 3 - CareTone® specifications.
Dimensions 2.6x9.3x1.4 mm (BxLxT)
Weight 362,87 gr
Power +12 V DC
Interface RJ-11C to POTS (ordinary telephone line)
FDA Clearance Device Class II
Frequency Range Bell-20 to 250 Hz
Diaphragm-20 to 500 Hz
5.2.3 Web-based Remote Digital Stethoscope
The Electronic Engineering Department of the Fu Jen Catholic University in Taiwan
presents a Web-Based remote digital stethoscope that stores, transmits and processes both
breathing and heart sounds.
The prototype system consists of a traditional stethoscope, a microphone, a sound
card, and a headphone. In the network hardware, the system uses a power line
communication (PLC) to take the place of the Ethernet, because it does not require
constructing new wires. Besides that PLC module supports good expansibility and

Ana Martins
Look4MySounds
22
compatibility. The users use a browser in his PC to connect the Web page server to get the
patient’s digital sound signals from a remote location.
In order to medical professionals and patients conveniently use the network to
transmit the digital sound files; it was designed two programs, the “Dialup Network” and
“FTP”. The “Dialup Network” program can let users use the remote dialling network service
function in Microsoft Windows. The doctors can use a modem or a PHS cell-phone to connect
to the Remote Access Server by the Point-to-Point Protocol (PPP). When the Internet is
available, they can use the Wireless WAN network environment through PHS. The reason for
the PHS be selected is because it is low power with a small amount of interference to the
medical instruments. With the “FTP” program the patients and medical professionals can
upload and download the digital sound files.
Figure 15 – System architecture of the Web-based remote digital stethoscope.
Figure 16 – The interface hardware of the design.

Ana Martins
Look4MySounds
23
Table 4 – Hardware modules specifications.
Microphone Headphones
Frequency Response 380 Hz to 15 KHz 20 Hz to 20 KHz
Impedance >10 Ω 32 Ω
Sensitivity -65 dB 116 dB
Sound Card (typical PC interface)
Sample frequency 8 to 48 KHz
Sample default format 16 or 24 bits
Signal-to-Noise Ratio 100 dB
Cross Talk -100 dB
Total Harmonic Distortion+Noise at 1 KHz 0.004%
Frequency Response at -3 dBr <10 Hz to 22 KHz
Data acquisition software was developed under Windows platform and includes two
programs. The first one, “Digital Stethoscope Recorder”, controls the remote PC to record
and save sounds files, and the other one, “Digital Stethoscope Player”, is responsible for
playing the sounds files.
The remote digital stethoscope use software and hardware with low cost components
and is assembled both at home and at a healthcare unit [33].
5.2.4 Intelligent Stethoscope
Bloodline Technology holds a patent for an intelligent stethoscope to perform
auscultation and automatically diagnose lung, heart and vascular disorders through the body
sounds.
The body sounds are recorded from many locations on the body and all of the sounds
are categorized according to specific characteristics to form an array of information. This
array is compared with stored arrays of information through a waveform analysis procedure in
conjunction with a medical algorithm. The latter arrays are indicative of known
abnormalities, when an array match is determined, the operator is informed and the diagnosis
is displayed.
The system consists of a conventional stethoscope, acoustically coupled to an
electronic interface. The audio signals are processed and digitized via a sampled analogue to
digital waveform acquisition procedure. The digitized audio is stored in data base memory for
further analysis, while simultaneously being displayed on a LCD. A keypad to control the
operation of the microprocessor based stethoscope is also part of the device. And, a

Ana Martins
Look4MySounds
24
peripheral data port is used for the transfer of data base memory to a digital plotter, and/or
storage in a larger memory media. The system is powered from rechargeable batteries, and
controlled by an intelligent power control system [34,35].
5.3 Review of the System
The three first systems presented in the previous section are available on the market
and allow remote auscultation of respiratory sounds using different types of data
transmission. The first one is a mobile wireless platform, the second transmit the information
over telephones lines and the third uses the Microsoft Internet Explorer browser to control
the remote PC in order to record and save the sound files. It must be regard that none of
them made automatic classification of the sounds collected.
The main limitation of the RP-7TM Remote Presence System is the need of a healthcare
provider in the patient’s home to perform the stethoscope examination. In our system, a
family member can easily place the stethoscope in the chest positions pre-defined by the
doctor. The robot price is expensive for a healthcare unit and is not easy to support the costs
associated with the robot services. Look4MySounds is an inexpensive product that includes
low-cost technologies. Therefore, any institution may acquire and borrow it to the patient
take to his home or even any consumer can buy it with a medical prescription.
The CareTone® and the Web-based Remote Digital Stethoscope are non-expensive
devices that allow the remote sending of the sounds to the doctor. Indeed, these mechanisms
are very appealing in terms of reducing the patient’s costs due to the healthcare unit
travelling. However, they do not make an improvement for the doctor’s side since he will
always have to hear and analyze the patient’s sounds. In here, the Look4MySounds project
presents the same advantages of the both systems, coping also their main limitations.
The last device of the state of the art is a stethoscope that automatically classifies
respiratory sounds but do not have the remote component, being only for medical use.
Regarding the sounds recognition, this equipment has a great disadvantage in relation to
Look4MySounds. The need to have an extensive database to allow the comparison of recorded
arrays with saved arrays that represent known abnormalities. Moreover, the price of these
intelligent stethoscopes is high, rounding the 2000 or 3000 euros.

Ana Martins
Look4MySounds
25
6. RESPIRATORY SOUNDS CLASSIFICATION
The main purpose of the project is the development of an algorithm to detect pathologies in
respiratory sounds and also discriminate them as wheezes or crackles, the most common
types of adventitious sounds in respiratory diseases. The original code was implemented on a PC (Pentium Dual [email protected]) using Matlab
7.5.0. After the experimental evidence of the algorithm efficiency, the Matlab code was
converted to C programming language, using Dev-C++, and, finally, implemented in the dsPIC
through the MPLAB IDE 8.20 program.
The algorithm is divided into three main stages, which are summarized below:
1. Wheezes Classification – the first step detects and classifies the sound as
containing wheezes taking into consideration their continuity properties and
duration.
2. Noise Filtering – this step reduces or even eliminates the friction of the signal
due the stethoscope contact with the skin, allowing the algorithm to better
distinguish between normal sounds and sounds with crackles.
3. Crackles Classification – the last step classifies the sounds as normal or
containing crackles using an approach based on the histogram’s entropy.
In the algorithm presented for respiratory sounds classification, the properties of each
sound were explored in the most efficient way in order to perform a reliable detection of the
pathologies. A method to reduce/eliminate the noise, caused by friction between the skin
and the stethoscope, was also developed due its frequent interference in the signal. This
sometimes led to wrong diagnosis, even by a specialist. As the final goal is to process the sounds in the dsPIC, the methods used should be
quickly and not expensive in terms of memory consuming. In this chapter, it is explored the
resolution of some problems concerning the wheezes detection in the dsPIC due to the lack of
memory available.

Ana Martins
Look4MySounds
26
6.1 Wheezes Classification
In the past decades, a variety of techniques have been employed by researchers to
analyze and classify wheezes. They range from Fourier transform (FT) [12], linear prediction
of coefficients [36][37], genetic algorithms [38], neural networks [38] and wavelets
[39][40][41]. These methods rely extensively on the fields of digital signal processing and
machine learning. The most commonly used signal-processing tool is the FT (equation (6.1)), which
represents the signal in terms of its frequency components. Time-frequency analysis is
particularly useful in the application of respiratory sounds analysis because of its ability to
temporally resolve the frequency components of a signal, giving rise to a more accurate
representation of a typically non-stationary data.
N
ni21
0
][)(
πω
ω−
−
=
∑= enxXN
n
(6.1)
Based on this approach, it was decided to analyze wheezes using this method, not
only because it is a simpler and a much studied concept, but also because dsPIC, with it
memory available, would be able to process this transform, unlike other heavy and complex
techniques such as wavelets or genetic algorithms.
Machine learning techniques, like linear prediction of coefficients or neural networks,
refer to teaching a system to assign class labels to data samples using an existing set of
labeled data. Although these methods are revealing promising techniques, a large and
validated database is needed. The number of respiratory sounds (and patients) required to
build a reliable database [42] would take more than one year to collect, being incompatible
with the project duration.
6.1.1 Implementation
To describe the implementation details of the wheezes classification process it is
assumed that the input of the algorithm is the respiratory sound containing wheezes, as
shown in Figure 17.

Ana Martins
Look4MySounds
27
0 1 2 3 4 5 6 7
x 104
-1
-0.5
0
0.5
1
Samples
Am
plit
ude
Figure 17 – Plot of the signal input. Wheezes epochs are pointed out by arrows.
The scalogram computation for a time-scale analysis of wheezes is the first step of
the process. Wheezes analysis through a scalogram was chosen, instead the periodogram or
spectrogram analysis mentioned in [12][39] because, after explore the three techniques, it
was concluded that the scalogram provides a much clear representation of wheezes.
Scalogram eliminates most of the undesired information allowing a better study of wheezes
continuity properties. Besides that, studying features in 56 scales it is simpler than working
within a frequency range of 100-2500 Hz that contains this adventitious sound.
Although MathWorks® provides a built-in function (wscalogram.m), it was decided to
use Kovesi’s scalogram [43]. This function is simpler and faster, being as well efficient. One
more advantage is the fact that sometimes it is impossible to access the code of Matlab’s
built-in functions. Using Kovesi’s scalogram, the posterior conversion to C language will be
simplified since all the code can be directly accessed. This function requires some default
specifications, which include the number of scales used to represent the respiratory sound. It
was empirically determined that 56 scales allow to have a sufficient representation of the
signal. This scalogram calculates phase and amplitude of one-dimensional signal. However, to
perform the algorithm only the amplitude output is enough. Thus, the phase component was
removed from the code.
After the computation of the Fast Fourier Transform (FFT) of the signal, a Gabor filter
is computed in each scale of the signal’s representation. The filter is used to select the most
meaningful frequency components of the signal at each level of scale. After multiply the
original signal FFT with the Gabor filter, the Inverse Fast Fourier Transform (IFFT) is applied
to reconstruct the signal (see the annex Matlab Pseudo-code for further details about the
scalogram computation).
Comparing the Figures 20 and 21, it can be seen that obvious differences exist
between wheezes and crackles scalograms. Unlike crackles, which are characterized by rapid
amplitude deviations in time-domain, wheezes have a large amplitude deviation. Figure 22
describe the scalogram of the normal sound signal shown in Figure 2 (Chapter 3.3.1), where
the hot colours segment represents the inspiratory phase.
Wheeze Wheeze Wheeze
Ana Martins
Look4MySounds
28
Samples
Scale
s
1 2 3 4 5 6 7
x 104
10
20
30
40
50
Figure 18 – Scalogram of a sound with wheezes.
Samples
Scale
s
1 2 3 4 5 6
x 104
10
20
30
40
50
Figure 19 – Scalogram of a sound with crackles.
Samples
Scale
s
0.5 1 1.5 2 2.5 3 3.5 4 4.5
x 104
10
20
30
40
50
Figure 20 – Scalogram of a normal sound.
The next step is where the background contributions of the scalogram are removed.
For this, an amplitude-threshold (0.023) empirically obtained is used. If the contributions of
the scalogram are lower than this threshold, they are set to 0, removing the undesired signal
components. The other components are equalized to a constant value, 0.5, to then analyze
the isolated wheezes continuity (Figure 21). This whole process will allow the automatically
selection of the scale where the signal presents more number of samples. No precautions are
needed with crackles or normal sounds, since the scalogram of these sounds, in a large
number of cases, are more discontinuous.

Ana Martins
Look4MySounds
29
13202
8000*)250,008,0()( =
+=samplesduration
Samples
Scale
s
1 2 3 4 5 6 7
x 104
10
20
30
40
50
Figure 21 – Wheezes continuity properties.
Biomedical signal processing is a hard task to achieve. Each breath sound has its own
properties that can differ from the same pathologic sound of the same patient. As stated
before, the selection of the scale is automatically done by choosing the one which have the
maximum mean of continuous samples. With the scale selected, many sounds were tested
(Table I of the annex Algorithm Tests) in order to verify the differences in the number of
continuous samples between the various sounds types.
The experimental tests reveal the obvious differences in the continuity properties of
each sound. As the crackles present continuity values higher than 640 samples, a simple
criterion based on the wheezes duration (greater than 80 ms) referred in section 3.3.2 was
not enough. So, a criterion based on the wheezes durations (between 80 and 250 ms)
explained in [5] was defined:
(6.2)
where 8000 stands for the sampling frequency of the acquired sounds. Therefore, if the signal
amplitude presents higher continuity than this value (equation (6.3)), it is classified as a
sound with wheezes.
(6.3)
The final goal of the project is to process the sounds on the dsPIC. Although the
technique adopted allows a good classification of the wheezes collected, it turns out to be a
method very expensive in terms of memory available on the dsPIC. In this case, the signal was
treated in segments of 256 samples. For example, in a sound with 64000 samples (the
minimum size of the respiratory sounds acquired), 250 FFTs and IFFTs are needed, for each
one of 56 scales. Thus, when the code was implemented in the dsPIC, it presented lack of
memory to store all the information processed.
1320)( ≥samplesduration

Ana Martins
Look4MySounds
30
Due to this set back, a simple solution that can give similar results to those obtained
in Matlab was explored. Even if the wheezes automatic detection is usually made in the
frequency domain (as the original code made in Matlab does) it was implemented in the sound
platform a convolution with the same filter with the signal. In fact, if the frequency spectrum
of two signals is multiplied in the frequency domain, this corresponds to a convolution
between the two signals in the time domain (equation (6.4)) [44].
Y (ω) = X(ω)H(ω) ↔ y[n] = x[n]∗ h[n] (6.4)
In here, a default scale was selected to handle the sounds. The filter representation
in time domain, to convolve it with the sound signal, was obtained through the Matlab IFFT
function. The next steps are equal to those explain before, with the amplitude-threshold
(0.012) being empirically selected to this new case and then converted to integers range
(0.012*32767=393). As it will be seen in the next chapter, this turns out to be a good solution.
6.1.2 Flowchart
Figure 22 shows the flowchart of the wheezes classification stage for the code
implemented in Matlab and in the dsPIC. The algorithm inputs are the respiratory sound file in
wave format, the sampling frequency and the sound length. The system output is the
classification of the sound, which can be visualized in the sound platform (LED9) if a wheeze
is detected. In this case, the algorithm stops the analysis of the respiratory sound and starts
to analyze the next sound.

Ana Martins
Look4MySounds
31
Respiratory Sound
FFT
Gabor Filter
IFFT
Strengthen Wheezes
Continuity Properties
(amp=0.023)
Scale Selection
duration(samples)
>=1320?
SOUND WITH
WHEEZES
Next Stage
No
Yes
Figure 22 – Wheezes classification flowchart: a) Matlab; b) dsPIC.
6.2 Noise Filtering
The “cleaning” of the respiratory sounds is one of the most important parts of the
algorithm. Two different noises are present in the recordings: the friction due the
stethoscope contact with the skin and the heart sounds. These artifacts introduce
perturbations during the sounds analysis, resulting in wrong classifications, even by a
specialist.
Heart sounds spectrum is located between 20 and 100 Hz. The main components of
respiratory sounds are also located in this frequency range. Among several methods that have
been tested, the better results were obtained with adaptive filtering and auto-
regressive/moving average (AR/MA) estimation [5]. During the project, the same elimination
Scalogram Function

Ana Martins
Look4MySounds
32
technique of the friction noise was applied to the heartbeat but without success. The
resulting signal did not have quality to be classified. So, as a matter of time, and because the
cardiac sound affects at most two sounds (in twenty) recorded closely to the six position on
the anterior side (section 3.4), this task was left for future work.
0 1 2 3 4 5 6 7 8 9-1
-0.5
0
0.5
1
Time (s)
Am
plit
ude
Figure 23 – Heart sound signal overlay on the respiratory sound.
The friction noise exhibits isolated peaks where the signal rapidly falls of in
amplitude. This type of artifact is present in many recorded sounds and makes the algorithm
to classify the normal sounds as sounds with crackles.
It must be regard that the algorithm only performs this step if no wheezes are
detected. In fact, it is clear that the scalogram eliminates most of the undesired information
related to the background noise, and because of that the friction noise does not affect the
wheezes classification performance.
6.2.1 Implementation
The first step of this stage is the detection of signal peaks (local maxima) [45]. The
input threshold (0<delta<1) was tested with many sounds and the best value, that efficiently
detects all the peaks due the friction, was found: delta=0.3. This means that it is required a
difference of at least 0.3 (amplitude) between the peak and its neighbourhood in order to
declare it as a peak. Local minima are also detected in the function, but it was concluded
that only the maxima is needed to remove the sound friction. The local maxima are stored in
a matrix with the amplitude of the peaks and the corresponding indices (X-value).
During the selection of the delta value, it was observed that, in some normal sounds
(as the illustrated in Figure 24), no maxima was detected due to the low amplitudes covered
by the signal. So, in this case, the sound is classified as normal and the sound analysis process
finish.

Ana Martins
Look4MySounds
33
0 0.5 1 1.5 2 2.5 3 3.5 4 4.5 5
x 104
-1
-0.5
0
0.5
1
Samples
Am
plit
ude
Figure 24 – Normal sound where no peaks are detected.
After finding the peaks, each one is selected and the 30 samples back and forward of
the respective index are equated to the sound mean. At this point, the friction noise is
reduce or eliminated.
The following block of three graphs describes how this stage performs in normal
sounds.
0 1 2 3 4 5 6 7
x 104
-1
-0.5
0
0.5
1
Samples
Am
plit
ude
Figure 25 – Normal sound with noise.
0 1 2 3 4 5 6 7
x 104
-1
-0.5
0
0.5
1
Samples
Am
plit
ude
Figure 26 – Peaks detection. The local maxima are plotted as red stars.

Ana Martins
Look4MySounds
34
0 1 2 3 4 5 6 7
x 104
-1
-0.5
0
0.5
1
Samples
Am
plit
ude
Figure 27 – Sound with noise removed.
In sounds with crackles, as the illustrated in Figure 28, the noise filtering output is
different from the obtained in normal sounds. As many maxima are detected in close samples
(Figure 29), the result is a distorted signal with failures (Figure 30) that will be classified, in
next stage, as pathologic. This is not the case on normal sounds where local maxima appear
as isolated peaks. Here, the signal remains almost equal after their elimination.
0 0.5 1 1.5 2 2.5 3 3.5 4 4.5 5
x 104
-1
-0.5
0
0.5
1
Samples
Am
plit
ude
Figure 28 – Sound with crackles.
0 0.5 1 1.5 2 2.5 3 3.5 4 4.5 5
x 104
-1
-0.5
0
0.5
1
Samples
Am
plit
ude
Figure 29 – Peaks detection. The local maxima are plotted as red stars.

Ana Martins
Look4MySounds
35
0 0.5 1 1.5 2 2.5 3 3.5 4 4.5 5
x 104
-1
-0.5
0
0.5
1
Samples
Am
plit
ude
Figure 30 – Sound with noise removed.
This stage of the algorithm was implemented in the dsPIC without changes. Only the
variable delta to selected the peaks of the signal was converted to fall in the -
32768<integer<32767 range (0,3*32767=9830).
6.2.2 Flowchart
Figure 31 illustrates the flowchart of the noise filtering stage performed in the dsPIC.
The input of the algorithm is the respiratory sound file in wave format and the threshold for
peaks detection. The output is the sound with the friction reduced or, in some cases,
completely eliminated.
Figure 31 – Noise filtering flowchart.

Ana Martins
Look4MySounds
36
6.3 Crackles Classification
One technique that is found to be particularly useful in crackles characterization is
called time-expanded waveform analysis (TEWA). This adventitious sound have a distinct
morphology when observed in TEWA; a sudden short deflection followed by deflections with
greater amplitude [12][46]. Other analysis methods like wavelets [47][48][49], fuzzy non-
stationary filter [50], neural networks and genetic algorithms [38] have also been presented
in the literature.
Once again, considering the final goal of the project, a simple and robust algorithm
based on the histogram’s entropy was developed. After many experiences and tests, it was
concluded that the proposed solution could provide good results.
6.3.1 Implementation
When a normal sound acquired with the sound platform is compared with one that
present pathologic sounds, it is noticeable the difference between them. The histogram
processing is a classic tool to summarize and display data. On the other hand, the entropy,
with its basis on thermodynamics concepts, allows measuring the system disorganization. In
fact, it can be observed, when comparing two sounds (normal and crackles), that both have
different levels of entropy, being the pathologic sound more susceptible to be a disorganized
distribution. In this section it is presented the strategy followed to distinguish crackles from
normal sounds, which uses the entropy of the histogram to achieve it.
To describe the implementation details of the crackles classification process it is
assumed that the input of the algorithm is a respiratory sound containing crackles, as shown
in Figure 32.
0 1 2 3 4 5 6
x 104
-1
-0.5
0
0.5
1
Samples
Am
plit
ude
Figure 32 – Plot of the signal input. Crackles are pointed out by arrows.
Crackles Crackles Crackles Crackles

Ana Martins
Look4MySounds
37
The first step of the algorithm is the computation of the ideal number of bins for the
histogram to each sound. In here, several methods from [51] were tested to check which
allows a better discrimination of the sound data. The one that reveal more different features
between normal sounds and crackles was the Scott’s criteria [52], given by:
(6.5)
This formula gives the bin width, where σ and n are the standard deviation and the
length of the signal, respectively. From h , the number of bins is determinate by:
h
soundsoundk
)min()max( −= (6.6)
After obtained the number of bins ( k ), each sample value is used to assign it to the
respective bin using the following formula:
h
soundsamplebin
)min(−= (6.7)
For each sample that falls into a bin, the number of elements of that bin is
incremented by one.
The friction elimination of the respiratory sound changes considerable the amplitude
spectrum of the source signal (Figure 30). Actually, the output signal is a distorted version of
the original sound. The entropy, along with the measure of the signal disorder, provides a
representation on the log scale that allows a more efficient classification of the pathologic
sounds, since small differences between the histograms will be more noticeable. The entropy
of the histogram is computed taken into account the signal histogram characteristics. Then,
the histogram is normalized2 to the unit length to be treated as reflecting the probability
distribution of the signal [53]. Considering this assumption, the overall entropy ( S ) of
histogram ( normh ) is computed by:
∑=
=
k
j
jquojquoS1
])[log(][ (6.8)
where ))(][(][ normnorm hmeanjhabsjquo −= and kj ,...,1= bins.
2 Henceforth, when histogram is mentioned should be understood normalized histogram.
3/1
5,3
nh
σ=
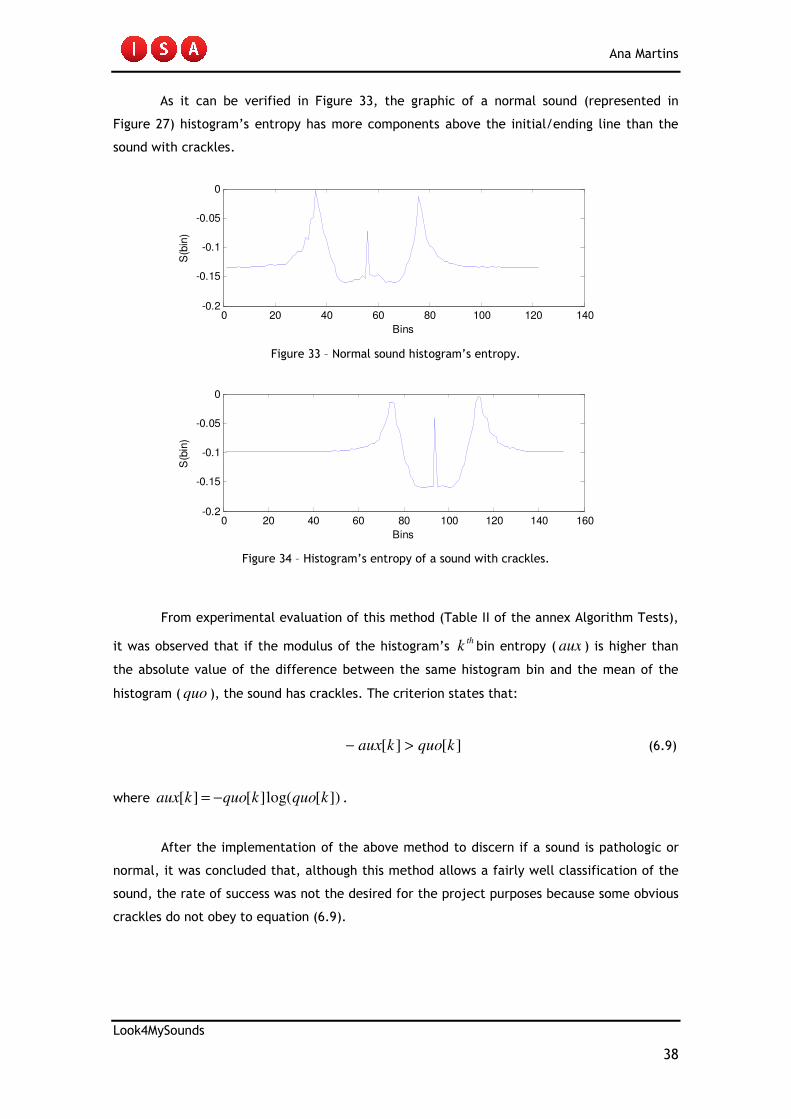
Ana Martins
Look4MySounds
38
As it can be verified in Figure 33, the graphic of a normal sound (represented in
Figure 27) histogram’s entropy has more components above the initial/ending line than the
sound with crackles.
0 20 40 60 80 100 120 140-0.2
-0.15
-0.1
-0.05
0
Bins
S(b
in)
Figure 33 – Normal sound histogram’s entropy.
0 20 40 60 80 100 120 140 160-0.2
-0.15
-0.1
-0.05
0
Bins
S(b
in)
Figure 34 – Histogram’s entropy of a sound with crackles.
From experimental evaluation of this method (Table II of the annex Algorithm Tests),
it was observed that if the modulus of the histogram’s thk bin entropy ( aux ) is higher than
the absolute value of the difference between the same histogram bin and the mean of the
histogram ( quo ), the sound has crackles. The criterion states that:
][][ kquokaux >− (6.9)
where ])[log(][][ kquokquokaux −= .
After the implementation of the above method to discern if a sound is pathologic or
normal, it was concluded that, although this method allows a fairly well classification of the
sound, the rate of success was not the desired for the project purposes because some obvious
crackles do not obey to equation (6.9).

Ana Martins
Look4MySounds
39
In order to improve the classifications success rate, without increasing significantly
the computational time and to make use of the entropy procedures adopted, a new criterion
was established. Considering the entropy of each bin of the histogram, the entropy’s mean is
computed. The usual methods employ the modulus of equation (6.8) to compare the disorder
of the systems. In this case, since the number of bins of the histogram change from sound to
sound, the use of the entropy’s mean appears to be more reasonable. After testing normal
sounds and sounds with crackles that not obey to the first criterion (Table III of the annex
Algorithm Tests) it was observed that it could be defined a threshold of 0,10 (entropy’s mean)
to distinguish the sounds in consideration. The final criterion is given below:
∑=
≤−
k
j
jquojquok 1
10,0])[log(][1
(6.10)
If the sound obeys this criterion, it is classified as a sound with crackles.
Concerning the implementation on the dsPIC, the proposed stage of the algorithm was
implemented in a straightforward manner. Only the threshold of the entropy’s mean, used as
the second criterion of this algorithm stage, was converted to the integers range
(0,10*32767=3277). No problems with memory constraint as in the wheezes classification
stage occurred here.
6.3.2 Flowchart
Figure 35 represents the flowchart of the crackles classification stage implemented in
the dsPIC. The inputs of the algorithm are the respiratory sound file in wave format with the
noise removed and the sound length. The system output is the classification of the sound,
which can be visualized in the sound platform (LED8) if a crackle is detected.
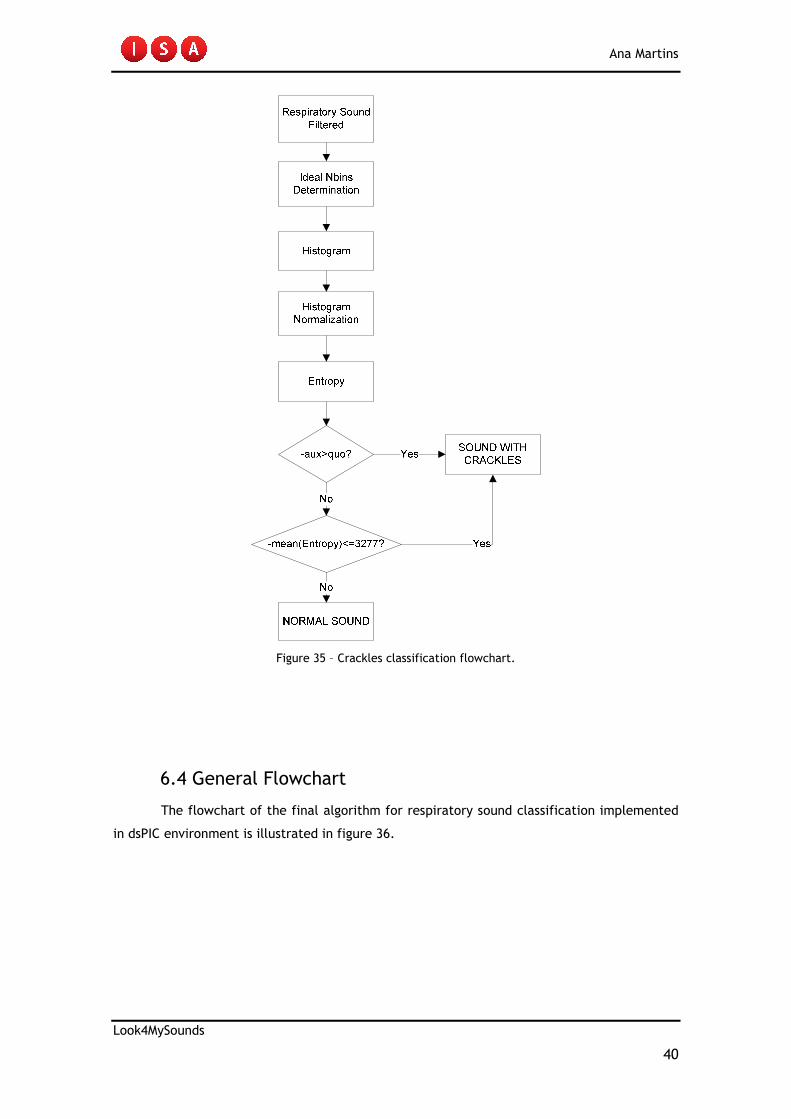
Ana Martins
Look4MySounds
40
Figure 35 – Crackles classification flowchart.
6.4 General Flowchart
The flowchart of the final algorithm for respiratory sound classification implemented
in dsPIC environment is illustrated in figure 36.

Ana Martins
Look4MySounds
41
START
Respiratory
Sound
Convolution between
Signal and Gabor
Filter in time domain
duration(samples)
>=1320?
Noise Filtering
No
Histogram
Entropy
-aux>quo?
-mean(Entropy)<=3277?
NORMAL SOUND
SOUND WITH
CRACKLESYes
No
Yes
SOUND WITH
WHEEZESYes
No
Peaks=0?
No
Yes
Respiratory Sound
Filtered
Figure 36 – Algorithm flowchart implemented in the dsPIC.

Ana Martins
Look4MySounds
42
7. EXPERIMENTAL DATA
In order to evaluate the performance of the proposed algorithm, 440 respiratory sounds from
22 people (12 men and 10 women) with ages between 12 and 91 years old were collected. 6
normal subjects and 16 pathological subjects with different types of respiratory diseases,
such as asthma, COPD, bronchitis, pneumonia and bronchiectasis, were studied during the
analysis.
The normal class was recorded at student’s home in a quiet room. The pathologic
class, which includes 13 patients with crackles and 3 ‘wheezing’ patients, was recorded at
Pulmonology Service of HC. In this case, the sounds were acquired during the morning when
the patients have clearer adventitious sounds due to the presence of mucus that obstruct the
airways. The major disadvantage of recordings is at this time of day was the background noise
in the room, which coincides with the time when the healthcare providers handle for the
breakfast, the hygiene and the treatments of the patients. The patients with adventitious
respiratory sounds were indicated by the Doctor Ana Filipa, who did the pre-auscultation and
the identification of the type of disease, as well as the related adventitious sounds. When the
doctor was not available, other specialists’ doctors helped in this task.
The sounds were acquired with the hardware presented in chapter 4 at 8 kHz of
sampling frequency and a resolution of 16 bits. Each person’s sound has a duration
approximated to 10 seconds, including 3 to 4 respiratory cycles.
The sounds recordings were performed between the 2nd of April and the 28th of May.
Afterwards, the Pulmonology Service entered into building improvement works and it became
impossible to record sounds with quality for analysis, due to the excessive environment noise.
Since the main purpose of the sound platform is the home use by the patients, a
favorable environment to record the respiratory sound data can be easily created. Therefore,
from the universe of the collected sounds only the ones with no significant background noise
and no heart beating were used to evaluate the algorithm for sounds classification, which
totalize 378 of the 440 collected. This means that an average of 17 respiratory sounds per
person was used for analysis.

Ana Martins
Look4MySounds
43
7.1 Algorithm Performance
Concerning the evaluation of medical devices, the rate of true positives detections
(diseases) and true negative detections (non disease) are broadly the most used [5][25]. This
type of measures allows the user to easily perceive the effectiveness of a certain medical
method. As so, sensitivity and specificity are the statistical measures employed to evaluate
the performance of a binary classification test.
The sensitivity (also called recall rate) measures the proportion of actual positives
which are correctly identified as such (e.g. the percentage of pathologic sounds that are
correctly identified); and the specificity measures the proportion of negatives correctly
identified (e.g. the percentage of healthy sounds correctly identified). In theory, an optimal
prediction should achieve 100% sensitivity (i.e. predict all people from the sick group as sick)
and 100% specificity (i.e. not predict anyone from the healthy group as sick).
)()(
)(
FNNegativesFalseTPPositivesTrue
TPPositivesTrueySensitivit
+
= (7.1)
)()(
)(
FPPositivesFalseTNNegativesTrue
TNNegativesTrueySpecificit
+
= (7.2)
The system evaluation (hardware plus software for sounds classification) was
performed using 378 respiratory sounds from the 22 patients collected (Table IV of annex
Algorithm Tests).
Table 5 – Algorithm general performance.
Medical Diagnosis
Algorithm
POSITIVE NEGATIVE
POSITIVE
NEGATIVE
TP=121 FP=6
FN=27 TN=224
SENSITIVITY=81,8% SPECIFICITY=97,4%

Ana Martins
Look4MySounds
44
Table 6 – Algorithm stages performance.
7.2 Discussion of the System Validation
The presented method for respiratory sounds classification is a simple and fast
technique that reveals a good rate of classification. The whole system (sound acquisition plus
classification) performs better than some methods proposed in the literature [5].
In the experimental tests, sounds from the same patient were considered. It must be
regarded that not all the auscultation positions of a sick patient presents pathologic sounds
superimposed in the regular breath sound. For example, if the patient has an injury on the
left lung, usually only the sounds recorded at the left side present adventitious sounds. So,
the sounds acquired on the right side will be normal. In addition, if the patient has a disease
that causes coarse crackles, the pathologic sounds will appear in the inferior auscultation
positions.
All the obvious pathologic sounds are detected. This means that if the doctor
specifies the place where the adventitious sound is more intense, the algorithm is able to
accurately detect it. The sounds recorded in close positions could also present pathologies.
However, these signals are not as intense as in the place specified by the doctor. The 18% of
sensitivity loss is exactly due to this fact. It must also be regarded that in all the patients at
least 2 sounds are classified as pathologic. This is meaningful in the sense that, if a patient
has a disease the algorithm is able to detect it. The doctor will be informed about how many
pathologic sounds the patient has and takes the procedures seem necessary.
Regarding the normal sounds of all the people collected, only 6 from 230 were
misclassified. This means that the algorithm is very robust in the normal sounds classification
not only due to their inherent features but also because the noise (friction) is filtered before
the analysis. Nevertheless, if this artifact is too intense, the noise filtering stage does not
remove completely this misleading artifact. Another relevant point, according to Doctor
Moutinho, is that smoking people, although not present a respiratory disease diagnosed, may
have sounds with similar profile to crackles.
WHEEZES
CRACKLES
Algorithm stages TOTAL(CORRECT CLASSIFICATIONS) PERFORMANCE
20 (17)
128 (101)
85,0%
78,9%

Ana Martins
Look4MySounds
45
The replacement of the FFT technique for the convolution method in time domain
due to the lack of dsPIC memory available makes some changes in the algorithm results. In
fact, 3 sounds that were misclassified in the Matlab code are on the dsPIC correctly classified
as wheezes. On the other hand, 2 sounds with crackles are wrong detected in the wheezes
classification stage. This is in contrast with the Matlab results, where any crackle are
detected as wheeze.
The measure of the overall accuracy is computed using the coefficient between the
total number of correct classifications and the total number of observations in test:
FPFNTNTP
TNTPAccuracy
+++
+= (7.3)
Given the previous formula, it can be concluded that the algorithm for respiratory
sound classification provides an accuracy of 91,3%. Comparing with other methods, the
algorithm developed reports one of the highest rate of success of recent publication studies in
automatic computer-assisted diagnose tools for respiratory sounds [5].
7.3 Graphical User Interface (GUI)
Under the project purpose, a simple and intuitive graphical user interface (GUI) was
developed in Matlab environment to present the algorithm results to the student’s
supervisors. The GUI allows the selection of a patient and the visualization of the data related
to the sound patient selected. This interface also provide an easy and fast way to supply
useful information, such as the patients included in the system and the sounds available of
each one. Some functionalities of the GUI are presented in the annex GUI Functionalities.

Ana Martins
Look4MySounds
46
8. CONCLUSIONS
Along the document are reported the steps done to develop a system able to acquire, store
and automatic classify respiratory sounds, distinguish them in normal and pathologic sounds
(wheezes or crackles).
During this year, several methods reported in [39][54][55] were implemented in order
to perform the computer assisted diagnosis. However, these algorithms do not show the
desired results when classifying sounds collected at HC. Therefore, a method based on the
scalogram strategy was implemented to detect wheezes and another based on the histogram’s
entropy was employed to make the distinction between sounds with crackles and the normal
ones. The original code was implemented in Matlab environment because it is a more intuitive
language and more easily show graphics and variables values. The intermediary conversion to
C language allowed the implementation of basic routines. In the dsPIC final code all the
variables were processed as integers, instead the float type used in Matlab code. As so, the
thresholds and the constants were multiply by the factor 32767, the limit of the integer range
(-32768<integer<32767). This approximation was used to allow the comparison between the
variables’ values obtained in the Matlab and in the MPLAB programs ensuring that the
implementation was being well done.
In order to evaluate the performance of the method, both healthy subjects and
patients with various respiratory diseases were tested. The algorithm presents a sensitivity of
82% and a specificity of 97%, being the overall accuracy of the system equal to 91%.
Comparing with other methods, the algorithm developed reports one of the highest rate of
success of recent publication studies in automatic computer-assisted diagnose tools for
respiratory sound [5].
In a meeting with Doctor José Moutinho, he considered the sounds recorded by the
hardware of high quality. He mentioned that the sounds allow to clearly identifying the most
evident adventitious sounds. He also shows a great enthusiasm with the final results of the
classification algorithm, saying that these are good results for an automatic technique for
respiratory sounds discrimination.
The experimental evaluation/validation in real life situations allows to conclude that,
after the remote transmission of sound data is finished, the low-cost prototype developed has
a good commercialization potential on the healthcare market.
Ana Martins
Look4MySounds
47
9. FUTURE WORK
The first improvement in the system/algorithm point that needs to be overcome is the noise
issue caused by the friction between the skin and the stethoscope. The noise filtering stage
proposed in the algorithm performs correctly in many respiratory sounds. However, when this
artifact is too intense, the algorithm starts to lose the effectiveness.
The heart sound overlay in some respiratory sounds, which lead to wrong
classification by the algorithm proposed, is other issue that can be study in the future. As
mentioned in the section 6.3, a method for reduce this artifact was tested. Nevertheless, the
resulting sound had not quality to be classified and is always detected as a pathologic sound.
So, as a matter of time project, this task was sideline.
The relationship between respiratory sounds and airflow during the
inspiratory/expiratory phases has always been of researchers’ and physicians’ interest. The
phase at which the adventitious sounds occur is important to the doctors in order to better
discriminate the different lung diseases. For example, wheezes are predominant of the
expiration. The crackles, if they are fine appear in the inspiration and the coarse are present
in both phases. Also in several clinical applications, such as sleep disorders (sleep apnoea)
and monitorizations of ill patients, the presence/absence of breathing provides crucial
information about the patient condition. During this year, an algorithm for respiratory phase’s
detection through sound data analysis, without airflow measurements, was developed [56].
However, the results were not the expected. Various problems related to the threshold
definition and the index determination of the start/end of each phase has not been achieved.
Thus, a future point of work, in order to solve this issue that the physicians consider
important, is the optimization of the algorithm implemented or the use of a thermocouple in
the user’s nose to measure the respiratory flow.
The development of an algorithm to differentiate fine and coarse crackles would be
interesting to help the doctor to better relate the patient’s sounds with a disease, since these
two types of sound occur in different pathophysiological conditions. Patients with pulmonary
fibrosis usually have fine crackles and patients with chronic bronchitis have mainly coarse
crackles.
Under the project, a graphical user interface was developed in Matlab environment to
present the algorithm results to the student’s supervisors. Designing a new GUI as a windows
application would allow to the physician the access and visualization of the data of each
patient.

Ana Martins
Look4MySounds
48
10. REFERENCES
[1] “Respiratory disease”, 2005. [Online] Available: http://www.lho.org.uk/viewResource.aspx?id=9576 [Accessed: May 30, 2009]
[2] “Health topics”. [Online] Available: http://www.who.int/topics/en/ [Accessed: Aug. 3, 2009]
[3] “The lungs in health and disease”, 1997. [Online] Available: http://www.thefreelibrary.com/THE+LUNGS+IN+HEALTH+AND+DISEASE-a059163049 [Accessed: July 30, 2009]
[4] G.A. Yi, “A Software Toolkit for Acoustic Respiratory Analysis”. May 24, 2004. [Online] Available: http://dspace.mit.edu/handle/1721.1/33391 [Accessed: July 30, 2009]
[5] S. Reichert, R. Gass, C. Brandt, E. Andrès. “Analysis of Respiratory Sounds: State of the Art”. Clinical Medicine: Circulatory, Respiratory and Pulmonary Medicine, no. 2, pp. 45-58, 2008.
[6] “Diseases and Conditions Index (DCI)”. [Online] Available: http://www.nhlbi.nih.gov/health/dci/index.html [Accessed: July 30, 2009]
[7] “Bronchitis”. [Online] Available: http://www.emedicinehealth.com/bronchitis/article_em.htm [Accessed: July 30, 2009]
[8] A.R.A Sovijärvi, F. Dalmasso, J. Vandesrchoot, L.P. Malmberg, G. Righini, S.A. Stoneman. “Definition of terms for applications of respiratory sounds”. Eur Respir Rev, vol. 10, no. 77, pp. 597-610, 2000.
[9] J.E. Earis, B.M. Cheetham. “Future perspectives for respiratory sound research”. Eur Respir Rev, vol. 10, no. 77, pp. 641-646, 2000.
[10] “MVS Pulmonary Auscultation”. [Online] Available: http://sprojects.mmi.mcgill.ca/mvs/RESP01.HTM [Accessed: July 31, 2009]
[11] “Normal Breath Sounds”. [Online] Available: http://www.rnceus.com/resp/respnorm.html [Accessed: July 31, 2009]
[12] G. Charbonneau, E. Ademovic, B.M. Cheetham, L.P. Malmberg, J. Vanderschoot, A.R.A Sovijärvi. “Basic techniques for respiratory sound analysis”. Eur Respir Rev, vol. 10, no. 77, pp. 625-635, 2000.
[13] “Explorer 16 Development Board”. [Online] Available: http://www.microchip.com/stellent/idcplg?IdcService=SS_GET_PAGE&nodeId=1406&dDocName=en024858&part=DM240001 [Accessed: July 27, 2009]
[14] “Audio PICtail Plus Daughter Card”. [Online] Available: http://www.microchip.com/stellent/idcplg?IdcService=SS_GET_PAGE&nodeId=1406&dDocName=en535873 [Accessed: July 27, 2009]
[15] “PICtail Board for SD& MMC”. [Online] Available: http://www.microchip.com/stellent/idcplg?IdcService=SS_GET_PAGE&nodeId=1406&dDocName=en537238 [Accessed: July 27, 2009]
[16] “Stethoscopes and Stethoscope Accessories”. [Online] Available: http://solutions.3m.com/wps/portal/3M/en_US/Littmann/stethoscope/products/product-catalog-us/ [Accessed: July 27, 2009]

Ana Martins
Look4MySounds
49
[17] “3MTM Littmann® Select Stethoscopes”. [Online] Available: http://solutions.3m.com/wps/portal/3M/en_US/Littmann/stethoscope/products/product-catalog-us/?PC_7_RJH9U5230GE3E02LECIE20KFI1_nid=GSQBLH6386beD77LGQCVJWgl [Accessed: July 27, 2009]
[18] “SanDisk Standard SD™ and SDHC™ Card”. [Online] Available: http://www.sandisk.com/products/imaging-cards/sandisk-standard-sd-and-sdhc.aspx [Accessed: July 27, 2009]
[19] “Europe's population is getting older. How will this affect us and what should we do about it?”. March 17, 2005. [Online] Available: http://ec.europa.eu/employment_social/news/2005/mar/demog_gp_en.html [Accessed: July 22, 2009]
[20] Estimativas de População Residente, Portugal, NUTS II, NUTS III e Municípios. Instituto Nacional de Estatística.s.l.: INE, 2008. [Online] Available: http://www.ine.pt/xportal/xmain?xpid=INE&xpgid=ine_destaques [Accessed: July 22, 2009]
[21] Projecções de população residente: Portugal - 2008-2060 - Metodologia. Instituto Nacional de Estatística. s.l.: INE, 2009. [Online] Available: http://www.ine.pt/xportal/xmain?xpid=INE&xpgid=ine_estudos [Accessed: July 22, 2009]
[22] Wouters EFM. The societal impact of COPD in North America and Europe: an economic analysis of the Confronting COPD survey. Eur. Respir. Med., no. 97, pp. 314, 2003.
[23] “Asthma”. [Online] Available: http://www.efanet.org/asthma/index.html [Accessed: July 22, 2009]
[24] M. Stachura, E. Khasanshina. “Telehomecare and Remote Monitoring: An Outcomes Overview”. The Advanced Medical Technology Association.
[25] Y. Kahya, U. Çini, Ö. Cerid. “Real-time regional respiratory sound diagnosis instrument”. Proceedings of the 25th Annual International Conference of the IEEE EBMS, Mexico, September 17-21, 2003, pp. 3098-3101.
[26] S. Alsmadi, Y. Kahya. “Online classification of lung sounds using DSP”. Proceedings of the Second Joint EMBS/BMES Conference, USA, October 23-26, 2002.
[27] “RP-7TM Technology Description”. [Online] Available: http://robotics-tamucc.com/rp7tech.aspx [Accessed: July 24, 2009]
[28] “InTouch Health®, extending your reach”. [Online] Available: http://www.intouchhealth.com/ [Accessed: July 24, 2009]
[29] “Robot Allows Kansas City Physicians to Utilize Remote Stethoscope”. Published November 27, 2006. [Online] Available: http://www.roboticstrends.com/robotics_features/article/robot_allows_physicians_remote_stethoscope/ [Accessed: July 24, 2009]
[30] “Caretone® Telephonic Stethoscope”. [Online] Available: http://www.americantelecare.com/prod_caretone.html [Accessed: July 24, 2009]
[31] “AmericanTelecare®. Pratical solutions. Positive outcomes”. [Online] Available: http://www.americantelecare.com/ [Accessed: July 24, 2009]
[32] “Remote Stethoscope System”. [Online] Available: http://www.wipo.int/pctdb/en/wo.jsp?wo=1996005687&IA=US1995010462&DISPLAY=DESC [Accessed: July 24, 2009]

Ana Martins
Look4MySounds
50
[33] Y. Bai, C. Lu. “Web-based Remote Digital Stethoscope”. Proceedings of the Ninth IASTED International Conference, Switzerland, February 21-23, 2005, pp. 423-428.
[34] “Intelligent stethoscope”. [Online] Available: http://www.patentstorm.us/patents/5010889.html [Accessed: July 25, 2009]
[35] “Bloodline, Technology Hits Home”. [Online] Available: http://www.pbs.org/bloodlines/ [Accessed: July 25, 2009]
[36] A. Cohen, D. Landsberg. “Analysis and automatic classification of breath sounds”. IEEE Transactions on Biomedical Engineering, vol. 31, no. 9, pp. 585-590, 1984.
[37] B. Sankur, Y.P. Kahya, E.C. Güler, T. Engin. “Comparison of AR-based algorithms for respiratory sound classification”. Comp. Biol. Med., no. 24, pp. 67-76, 1994.
[38] H. Guler, U. Ergun. “Combining neural network and genetic algorithm for prediction of lung sounds”. J. Med. Syst., no. 29, pp. 217-231, 2005.
[39] L.J. Hadjileontiadis, K. Panoulas, T. Penzel, V. Gros, S. Panas. “On applying continuous wavelet transform in wheeze analysis”. Proceedings of the 26th Annual International Conference of the IEEE EMBS, USA, September 1-5, pp. 3832-3835, 2004.
[40] L. Pesu, P. Helistö, E. Adomovic, J.C. Pesquet, A. Saarinen, A.R.A Sovijärvi. “Classification of respiratory sounds based on wavelet packet decomposition and learning vector Quantization”. Technology and Health Care, vol. 6, no. 1, pp. 65-74, 1998.
[41] A. Marshall, S. Boussakta. “Signal analysis of medical acoustic sounds with applications to chest medicine”. Journal of the Franklin Institute, no. 344, pp. 230-242, 2007.
[42] V. Gross, L.J. Hadjileontiadis, Th. Penzel, U. Koehler, C. Vogelmeier. “Multimedia Database-Marburg Respiratory Sounds (MARS)”. Proceedings of the 25th Annual International Conference of the IEEE EMBS, Mexico, September 17-21, 2003.
[43] P. Kovesi. “Scalogram”. March 1997. [Online] Available: http://www.csse.uwa.edu.au/~pk/Research/MatlabFns/FrequencyFilt/scalogram.m [Accessed: May 4, 2009]
[44] S. Smith. “Convolution via the Frequency Domain”. [Online] Available: http://www.dspguide.com/ch9/3.htm [Accessed: Aug. 26, 2009]
[45] E. Billauer. “Peakdet: Peak Detection using Matlab”. [Online] Available: http://www.billauer.co.il/peakdet.html [Accessed: May 19, 2009]
[46] R.L. Jr Murphy, S.K. Holford, W.C. Knowler. “Visual lung-sound characterization by time-expanded waveform analysis”. N. Engl. J. Med., no. 296, pp. 968-971, 1977.
[47] M. Bahoura, X. Lu. “An automatic system for crackles detection and classification”. Electrical and Computer Engineering Canadian Conference on, pp. 725-729, 2006.
[48] L.J. Hadjileontiadis, L. Rekanos. “Detection of explosive lung and bowel sounds by means of fractal dimension”. Signal Processing Letters IEEE, no. 10, pp. 311-314, 2003.
[49] M. Du, F.H.Y. Chan, F.K. Chan, J. Sun. “Crackles detection and classification based on matched wavelet analysis”. IEEE/EMBS, pp. 1638-1641, 1997.
[50] L. Vannuccini, M. Rossi, G. Pasquali. “A new method to detect crackles in respiratory sounds”. Technology and Health Care, no. 6, pp. 75-79, 1998.

Ana Martins
Look4MySounds
51
[51] R. Cotton. “Calculate number of bins for histogram”. August 21, 2008. [Online] Available: http://www.mathworks.com/matlabcentral/fileexchange/21033 [Accessed: April 27, 2009]
[52] D. Scott. “An optimal and data-based histograms”. Biometrika, vol. 66, no. 3, pp. 605-610, 1979.
[53] S. Smith. “The Histogram, Pmf and Pdf”. [Online] Available: http://www.dspguide.com/ch2/4.htm [Accessed: Sept. 1, 2009]
[54] K.S. Baydar, A. Ertuzun; Y. Kahya. “Analysis and Classification of Respiratory Sounds by Signal Coherence Method”. Proceedings of the 25th Annual International Conference of the IEEE EMBS, Mexico, September 17-21, 2003, pp. 2950-2953.
[55] S. Sello, S. Strambi, G. Michele, N. Ambrosino. “Respiratory sound analysis in healthy and pathological subjects: A wavelet approach”. Biomedical Signal Processing and Control, no. 3, pp. 181-191, 2008.
[56] Y.L. Yap, Z. Moussavi. “Acoustic airflow estimation from traqueal sound power”. Electrical and Computer Engineering Canadian Conference on, vol. 2, pp. 1073-1076, 2002.

Ana Martins
Look4MySounds
52
11. ANNEXES
11.1 Sound Platform Prototype Specifications
Explorer 16 Development Board:
• dsPIC33FJ256GP710:
MIPS Pins Program Flash Memory
(kB) RAM (kB)
16-bit
Timer
Input
Capture
Output Compare (std.
PWM)
40 100 256 30 9 8 8
Codec Interface ADC UART SPI I2C Enhanced CAN I/O Pins (Max)
1 2 ADC, 32 Ch 2 2 2 2 85
• Powered between 9V a 15V (DC), preferably by 9V;
• RS-232 serial port;
• Temperature sensor;
• Connectivity USB support by PIC18LF4550;
• LCD;
• Buttons (4) e LEDs (8);
• Oscillator: the microcontroller has 2 circuits of oscillators connected. The primary oscillator uses a crystal of 8 MHz, while secondary uses a crystal of 32,768 kHz. The PIC18LF4550 has its own crystal of 20 MHz;
• PICtail™ Plus Card Edge Modular Expansion Connectors.
Audio PICtail Plus Daughter Board:
• Codec: WM8510
o Allows various sampling rates (8000, 11025, 16000, 22050, 24000, 32000, 44100 e 48000 kHz);
o Communicates with dsPIC33F through the I2C module.
• 4 Mb of Serial Flash;
• Works with Explorer 16 through PICtail Plus interface;
• Powered through Explorer 16.

Ana Martins
Look4MySounds
53
PICtail Daughter Board for SD and MMC Cards:
• Supports different types of SD cards;
• Powered through Explorer 16.
11.2 Matlab Pseudo-code
In the section 6.1.1 was describe the implementation details of the wheezes
classification stage. For better understanding of what was written, below is present the
Matlab pseudo-code for sound scalogram computation. The signal variable is taken as the
recorded sound.
%Initialize variables needed
nscales=56; minwavelength=4; mult=1.05; sigmaOnf=0.55;
ndata = length(signal); %Length of the respiratory sound recorded
signalfft = fft(signal); %Take FFT of signal
radius=[0:fix(ndata/2)]/fix(ndata/2)/2; %Frequency values 0 - 0.5
radius(1) = 1; %Fudge to stop log function complaining at origin.
%Computing the respiratory sound scalogram
wavelength = minwavelength;
for row = 1:nscales
fo = 1.0/wavelength; %Centre frequency of filter.
logGabor(1:ndata/2+1) = exp((-(log(radius/fo)).^2) / ...
(2*log(sigmaOnf)^2));
logGabor(1) = 0; %Set value at zero frequency to 0
%Multiply filter and FFT of signal, then take inverse FFT.
EO = ifft(signalfft .* logGabor);
amplitude(row,:) = abs(EO); %Record the amplitude of the result
wavelength = wavelength * mult; %Increment the filter wavelength.
end

Ana Martins
Look4MySounds
54
11.3 Algorithm Tests
Table I - Experimental tests to define the threshold for wheezes classification stage.
Sounds Continuous Samples
Wheezes Bernardes 1759 Luís 3478 Lucília 3777 Moltina 4971
Crackles Conceição 874 Carminda 995 Maria 1268
Normal Daniel 240 Margarida 250 Miguel 265
Table II - Experimental tests to define the first criterion of the crackles classification stage.
Sounds aux quo
Obvious crackles António -0,0816 0,0710 Carminda -0,0657 0,0508 Joaquim -0,0941 0,0900 José -0,0896 0,0828 Vitória -0,0875 0,0796
Normal Catarina -0,1336 0,1785 Daniel -0,1391 0,1972 Ilda -0,1172 0,1346 Margarida -0,1500 0,2473 Miguel -0,1227 0,1477
Table III – Experimental tests to define the threshold of the second criterion of the crackles
classification stage.
Sounds Entropy’s Mean
Obvious crackles
Maria 0.0974 Maria 0.0992 Conceição 0.0994
Normal Miguel 0.1021 Ilda 0.1075 Emílio 0.1162 Margarida 0.1237
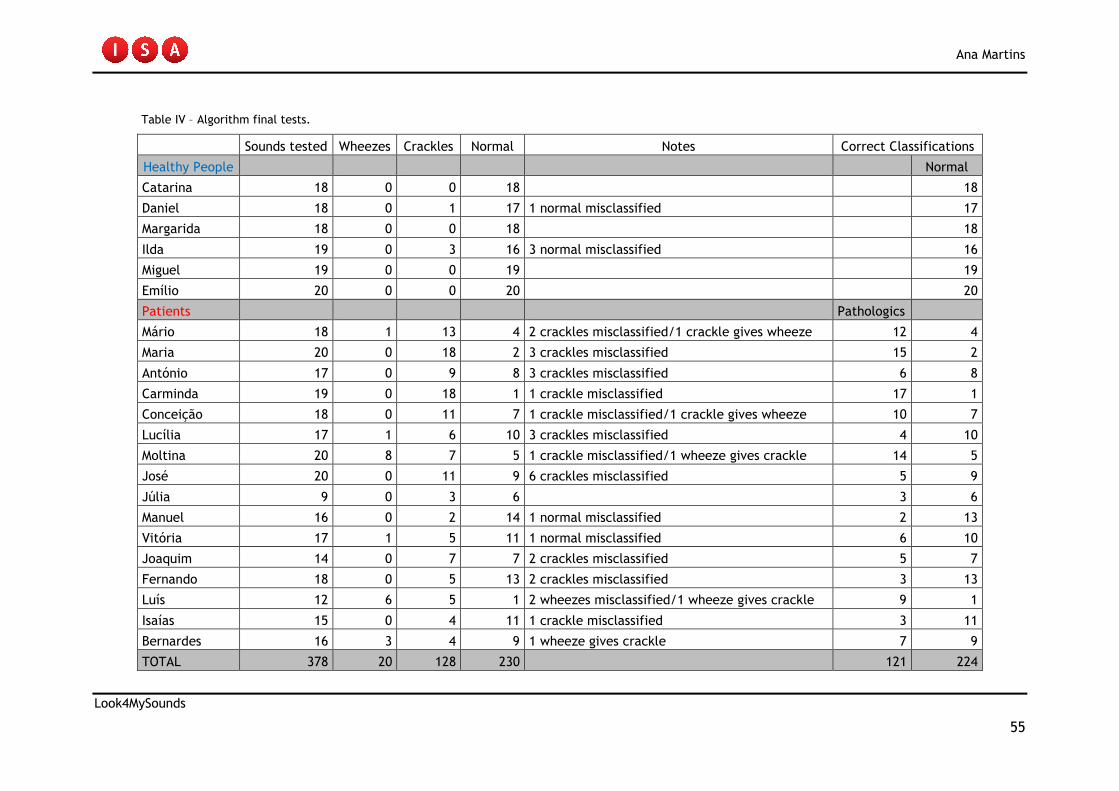
Ana Martins
Look4MySounds
55
Table IV – Algorithm final tests.
Sounds tested Wheezes Crackles Normal Notes Correct Classifications
Healthy People Normal
Catarina 18 0 0 18 18
Daniel 18 0 1 17 1 normal misclassified 17
Margarida 18 0 0 18 18
Ilda 19 0 3 16 3 normal misclassified 16
Miguel 19 0 0 19 19
Emílio 20 0 0 20 20
Patients Pathologics
Mário 18 1 13 4 2 crackles misclassified/1 crackle gives wheeze 12 4
Maria 20 0 18 2 3 crackles misclassified 15 2
António 17 0 9 8 3 crackles misclassified 6 8
Carminda 19 0 18 1 1 crackle misclassified 17 1
Conceição 18 0 11 7 1 crackle misclassified/1 crackle gives wheeze 10 7
Lucília 17 1 6 10 3 crackles misclassified 4 10
Moltina 20 8 7 5 1 crackle misclassified/1 wheeze gives crackle 14 5
José 20 0 11 9 6 crackles misclassified 5 9
Júlia 9 0 3 6 3 6
Manuel 16 0 2 14 1 normal misclassified 2 13
Vitória 17 1 5 11 1 normal misclassified 6 10
Joaquim 14 0 7 7 2 crackles misclassified 5 7
Fernando 18 0 5 13 2 crackles misclassified 3 13
Luís 12 6 5 1 2 wheezes misclassified/1 wheeze gives crackle 9 1
Isaías 15 0 4 11 1 crackle misclassified 3 11
Bernardes 16 3 4 9 1 wheeze gives crackle 7 9
TOTAL 378 20 128 230 121 224

Ana Martins
Look4MySounds
56
11.4 GUI Functionalities
Legend: 1- Load patient to sound analysis; 2 – Menu.
Figure 1 – Main window of the GUI.
Figure 2 – Patient’s and sound’s selection.
1
2

Ana Martins
Look4MySounds
57
Legend: 3- Patient sound details; 4- Graphic of the signal; 5- Sound classification.
Figure 3 – Visualization of all the sound information.
Figure 4 - Histogram’s entropy visualization of a sound with crackes (button 7).
3
5
4
7
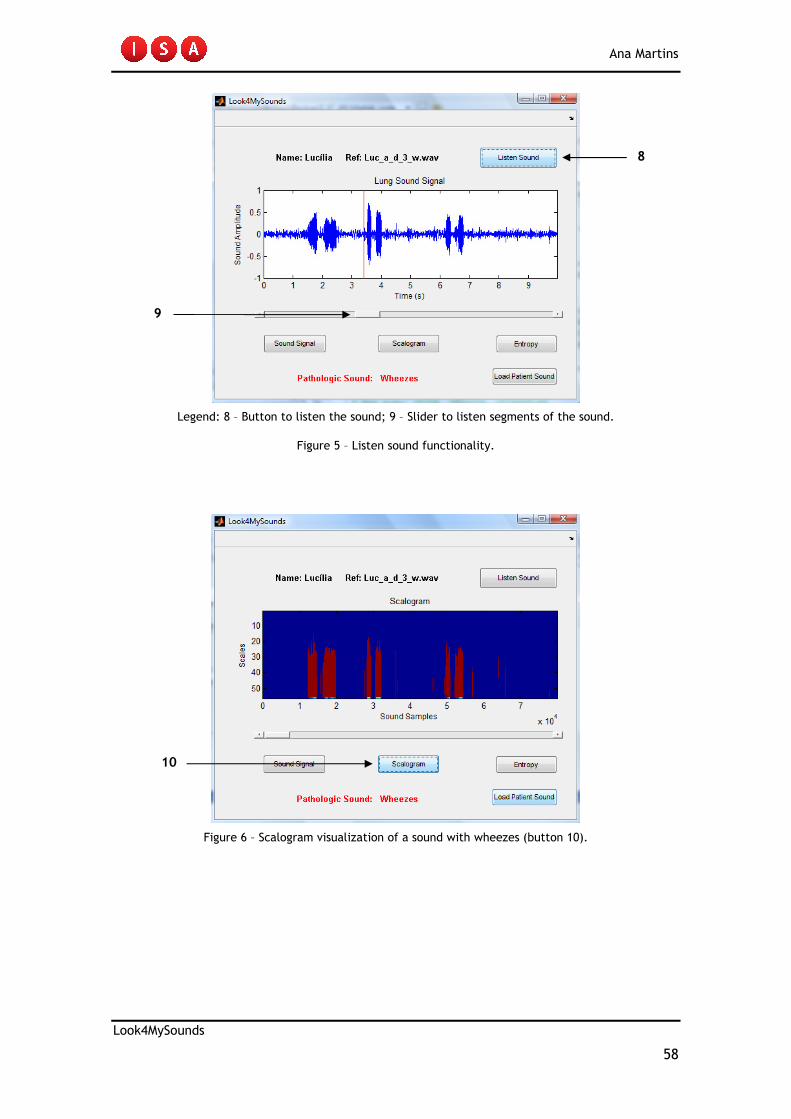
Ana Martins
Look4MySounds
58
Legend: 8 – Button to listen the sound; 9 – Slider to listen segments of the sound.
Figure 5 – Listen sound functionality.
Figure 6 – Scalogram visualization of a sound with wheezes (button 10).
8
9
10