Embed Size (px)
Citation preview

1
BIS RESEARCH PAPER NUMBER 290
Longitudinal Small Business Survey Year 1 (2015): Businesses with no employees
MAY 2016

Acknowledgements/ Disclaimer The authors would like to thank the project manager at BIS, Ian Drummond and other members of the steering group, in particular Andrew Ledger, Sumit Rahman, Anne-Gaelle Roche and James Phipps, for their guidance during the research and comments on the draft of the report. The findings and interpretations in this report are those of the authors and do not necessarily represent the view of BIS.
1

Contents 1. Executive summary ........................................................................................................ 1
Introduction .......................................................................................................................... 1
Profiles of businesses .......................................................................................................... 1
Business performance .......................................................................................................... 2
Business capability ............................................................................................................... 3
Access to finance ................................................................................................................. 4
Major obstacles to the success of the business .................................................................... 4
Business support .................................................................................................................. 5
Future plans ......................................................................................................................... 6
2. Introduction .................................................................................................................... 7
Aims of the survey ................................................................................................................ 7
Survey method ..................................................................................................................... 8
Note on the report ................................................................................................................ 9
Statistical confidence.......................................................................................................... 10
3. Profile of businesses ................................................................................................... 12
Employment size (based on BPE 2015) ............................................................................. 12
Sector (based on BPE 2015) .............................................................................................. 12
Number of sites .................................................................................................................. 13
Whether business premises are somebody’s home ........................................................... 14
Legal status ........................................................................................................................ 14
Registered charity status .................................................................................................... 15
Age of business .................................................................................................................. 16
2

Number of owners/partners ................................................................................................ 16
Number of working partners/directors ................................................................................. 17
Family-owned businesses .................................................................................................. 17
Women-led businesses ...................................................................................................... 18
MEG-led businesses .......................................................................................................... 18
Types of customers ............................................................................................................ 19
Location of customers ........................................................................................................ 19
4. Business performance ................................................................................................. 21
Number of people expected to be employed in 12 months’ time ......................................... 21
Turnover now compared with 12 months previously ........................................................... 22
Expectations of turnover in 12 months’ time ....................................................................... 23
Profit .................................................................................................................................. 23
5. Business capability ...................................................................................................... 25
Perceptions of business capability...................................................................................... 25
Business capability: business plans ................................................................................... 26
Business capability: innovation ........................................................................................... 27
Business capability: exporting ............................................................................................ 31
Business capability: technology .......................................................................................... 34
6. Access to external finance .......................................................................................... 38
Types of external finance currently being used................................................................... 38
Whether sought external finance in the last 12 months ...................................................... 39
Reasons for applying for external finance ........................................................................... 40
Type of external finance sought ......................................................................................... 40
Success in obtaining external finance ................................................................................ 41
3

Amount of external finance obtained .................................................................................. 42
Reasons for not applying for external finance ..................................................................... 43
Credit granting and late payment ....................................................................................... 44
Whether likely to approach external finance providers in the next three years .................... 45
7. Major obstacles to the success of the business ........................................................ 46
Major obstacles to the success of the business .................................................................. 46
Regulations ........................................................................................................................ 47
Taxation/VAT/PAYE ........................................................................................................... 48
8. Business support ......................................................................................................... 50
Awareness of government organisations offering business support ................................... 50
Awareness of government organisations offering business support – England and Wales . 51
Awareness of government organisations offering business support – Scotland .................. 52
Awareness of government organisations offering business support – Northern Ireland ...... 52
Whether sought external information or advice in the last 12 months ................................. 53
Type of information or advice sought (England and Wales) ................................................ 54
Where information and advice was sought (England and Wales) ....................................... 55
How information or advice was delivered (England and Wales) ......................................... 56
Amount of advice received (England and Wales) ............................................................... 56
Paying for advice (England and Wales) .............................................................................. 57
Un-met information and advice needs (England and Wales only) ....................................... 58
Networks (England and Wales only) ................................................................................... 58
9. Future plans .................................................................................................................. 60
Aiming to grow ................................................................................................................... 60
Closure or transfer of the business in the next 5 years ....................................................... 60
4

Ways in which business plans to grow over the next three years ....................................... 61
10. Glossary ........................................................................................................................ 63
Most common sub-sectors in broad sector categories ........................................................ 63
5
1. Executive summary Introduction
This report sets out the key findings from the Longitudinal Small Business Survey (LSBS), a large-scale telephone survey of 15,502 owners and managers, commissioned by the Department for Business, Innovation and Skills (BIS). This survey is the latest in a series of annual and biennial Small Business Surveys (SBS) dating back to 2003. The survey on this occasion was conducted between July 2015 and January 2016 by BMG Research Ltd.
The sampling method differed from previous SBSs, and full details of this method are available in a separate technical report for LSBS Year One. For registered businesses, the Inter Departmental Business Register (IDBR) was used as the sample source. For unregistered businesses with zero employees Dun & Bradstreet’s database was used. Dun & Bradstreet contacts were screened out if it was found that they either had employees on their payroll or paid VAT, as these would have duplicated contacts found within the IDBR.
This report is based on business with no employees only. These are defined as having no employees on the payroll at the time of interviewing, excluding owners and partners. A separate report on SME employers is also available.
The changes made to LSBS Year One in terms of questionnaire design and (in particular) the sampling procedure mean that time series comparisons for businesses with no employees cannot be made.
Profiles of businesses
Based on government statistics1, upon which the survey’s weighting is based, 76 per cent of all UK enterprises were zero employee businesses. The bulk of these (56 per cent of all UK enterprises) were unregistered businesses.
The most populous sectors among zero employee businesses in 2015 were construction (20 per cent) and professional/ scientific (15 per cent).
Ninety-three per cent of zero employee businesses operated from a single site.
Fifty-nine per cent of zero employee businesses had a main work premises that was also their home, or the home of the business’s owner. This was most likely to be the case for unregistered businesses (61 per cent).
Sixty-one per cent of zero employee businesses had sole proprietorship as their legal status. Twenty-eight per cent were private companies limited by shares, and five per cent
1 Business Population Estimates (BPE) 2015.
1
were partnerships. The legal statuses of registered and unregistered zero employee businesses were very different: 77 per cent of unregistered businesses were sole proprietorships, compared to 16 per cent of registered businesses; while 65 per cent of registered businesses were limited companies, compared to 16 per cent of unregistered businesses.
Two per cent of zero employee businesses were registered charities. These were most likely to exist in the other services (11 per cent of these), arts/entertainment (10 per cent) and health sectors (nine per cent).
Seventy-nine per cent of zero employee businesses had a single owner. Fifty per cent of registered zero employee businesses had just one owner, compared to 89 per cent of unregistered businesses.
Seventy-seven per cent of zero employee businesses had only one partner/director in day-to-day control of the business. Forty-eight per cent of registered zero employee businesses had just one owner, compared to 87 per cent of unregistered businesses.
Ninety-one per cent of zero employee businesses were defined as family-owned businesses, defined as one which is majority owned by members of the same family, including businesses with just a single owner or partner.
Twenty-two per cent of zero employee businesses were majority-led by women, defined as controlled by a single woman or having a management team of which a majority were women. Twenty-five per cent of unregistered businesses were women-led, compared to 14 per cent of registered zero employee businesses.
Five per cent of Zero employee businesses were minority ethnic group (MEG-led), defined as having a person from an ethnic minority in sole control of the business or having a management team with at least half of its members from an ethnic minority. There was no difference in this proportion by size or status of business, but MEG-led businesses were more likely than average to be found in the information/communications (11 per cent) sector.
Business performance
Six per cent of zero employee businesses employed people 12 months previously. This was the case for 13 per cent of registered zero employee businesses, and four per cent of unregistered businesses.
Twelve per cent of zero employee businesses expected to employ people in 12 months’ time. This was the case for 17 per cent of registered zero employee businesses, and ten per cent of unregistered businesses.
Twenty-five per cent of zero employee businesses had greater turnover (value of sales) than a year previously. Fifty per cent had approximately the same turnover and 23 per cent had lower turnover. Registered zero employee businesses were more likely to have had increased turnover (29 per cent) than unregistered businesses (23 per cent).
2

Thirty-one per cent of zero employee businesses expected turnover to increase in the next 12 months, 50 per cent thought it would remain roughly the same and 13 per cent thought it would be less. Thirty-five per cent of registered zero employee businesses thought that turnover would increase, compared with 30 per cent of registered businesses.
Seventy-six per cent of zero employee businesses generated a profit in their last financial year. This proportion was similar for both registered and unregistered zero employee businesses, and for SME employers.
Business capability
Overall, 38 per cent of businesses with no employees had innovated in the last three years, be this the introduction of new or significantly improved goods or services, or the introduction of new or significantly improved processes. Registered zero employee businesses were more likely to have done so (44 per cent) than unregistered businesses (36 per cent).
Thirty-four per cent of businesses with no employees had introduced new or significantly improved goods or services in the last three years (16 per cent goods, 29 per cent services). Sixteen per cent had introduced new or significantly improved processes in the last three years.
Ten per cent of zero employee businesses had exported goods or services in the last 12 months (four per cent goods, seven per cent services). The proportion of registered zero employee businesses that exported (20 per cent) was about the same as the figure for all SME employers (19 per cent). Fifteen per cent of these zero employee registered businesses exported services, compared to 11 per cent of SME employers. Only seven per cent of unregistered businesses exported.
Four per cent of zero employee businesses had not exported in the previous 12 months, but planned to export in future, the same proportion as for SME employers.
Ninety per cent of zero employee businesses had access to the internet for work purposes. Fifty-nine per cent had their own website. Less likely to have their own website were zero employee businesses in the primary (30 per cent), construction (42 per cent) and transport/storage (48 per cent) sectors.
Seventy per cent of zero employee businesses were digitally engaged, meaning that they had a website, used a third party website such as Amazon, Etsy or Ebay, or had their own social media profile. The proportions of registered and unregistered zero employee businesses that were digitally engaged were about the same. Unregistered businesses were more likely to use third party websites than registered businesses (21 per cent compared with 14 per cent).
Eleven per cent of all Zero employee businesses had websites where goods and services could be ordered directly, but 28 per cent engaged in some form of e-commerce, including goods and services being ordered from third party websites, goods and services ordered from social media, bookings or orders made directly from their own website
3
without payment at the time, or bookings or orders being made directly from third party websites without payment at the time.
Unregistered businesses were more likely to engage in any form of e-commerce (30 per cent) than registered zero employee businesses (22 per cent).
Access to finance
Nine per cent of zero employee businesses had sought external finance in the 12 months preceding interview. Registered businesses with no employees were more likely to have done this (11 per cent) than unregistered businesses (eight per cent), but these proportions were lower than for SME employers (17 per cent).
Of those that had applied for external finance in the previous 12 months, the reasons for seeking it included working capital or cash flow reasons for 47 per cent, 36 per cent to acquire capital equipment or vehicles, 10 per cent to buy land or buildings, and six per cent for each of research & development and marketing.
The most commonly sought types of external finance in the previous 12 months were loans from financial institutions (41 per cent), bank overdrafts (40 per cent), credit cards (20 per cent) and leasing/hire purchase (18 per cent). Compared to SME employers, zero employee businesses were less likely to seek overdrafts, leasing/HP, factoring/invoice discounting and commercial mortgages.
Seventy-one per cent of zero employee businesses that applied for external finance obtained at least some of what they wanted. Sixteen per cent did not obtain any, and for the remaining 13 per cent the decision was still pending. This success rate was lower than for SME employers (81 per cent of these obtained some money), and was about the same for both registered and unregistered zero employee businesses.
Eleven per cent of Zero employee businesses had a need for finance in the previous 12 months but did not apply for it. This proportion was three percentage points lower than that observed in SBS 2014.
The median average amount of finance sought by unregistered businesses was £5,000, compared with £20,000 for registered zero employee businesses, and £30,000 for SME employers.
Fourteen per cent of zero employee businesses said they would be likely to approach external finance providers in the next three years.
Major obstacles to the success of the business
The main major obstacles to the success of the business were competition (44 per cent), regulations/red tape (35 per cent), late payment (26 per cent), taxation (26 per cent) and obtaining finance (17 per cent).
4

Of those considering regulations to be a major obstacle, the regulations most likely to be named were sector specific ones (17 per cent), tax-related (15 per cent), and health and safety (14 per cent).
Of those that thought taxation was a major obstacle, 56 per cent said it was the level of taxation that made them think this, and 60 per cent the effort required in compliance. By contrast, SME employers were more likely to think the level of taxation the major obstacle rather than the effort required in compliance.
Business support
Nineteen per cent of zero employee businesses had sought external advice or information in the previous 12 months. This proportion was 28 per cent among registered zero employee businesses, and 16 per cent among unregistered businesses. By sector, advice or information was more likely than average to be sought in primary (31 per cent), professional/scientific (29 per cent), financial/real estate (26 per cent) and information/communication (25 per cent).
In England and Wales2, 11 per cent of zero employee businesses had sought any external information, and eight per cent any external advice.
In England and Wales, external advice was mainly sought for business growth (34 per cent of those seeking it), for marketing (18 per cent), to improve business efficiency (14 per cent) or financial advice for the general running of the business was sought (14 per cent). Twenty-five per cent of those that sought advice approached accountants, 19 per cent consultants, and 18 per cent business networks.
In England and Wales, external information was mainly sought for the general running of the business (23 per cent) and for taxation queries (18 per cent). Information was most likely to have been sought from accountants (31 per cent), business networks (15 per cent) and via internet searches (ten per cent).
In England and Wales, 63 per cent of external advice, and 48 per cent of external information, was delivered face-to-face.
Forty-seven per cent of zero employee businesses in England and Wales paid for advice. The median average amount paid was £750.
Four per cent of zero employee businesses in England and Wales had had opportunities, difficulties or important information or advice needs that they did not get external advice or support for in the previous 12 months.
2 Information and advice were split out in England and Wales, but not in Scotland and Northern Ireland.
5
Future plans
Forty-seven per cent of businesses with no employees aimed to grow the sales over the next three years. This compares with 69 per cent of SME employers. Registered zero employee businesses were more likely to want to grow sales (53 per cent) than unregistered businesses (45 per cent).
Fourteen per cent of zero employee businesses anticipated the closure of their business in the next five years, while a further five per cent anticipated the full transfer of ownership. The proportion anticipating closure was much higher than for SME employers (four per cent).
In terms of planned growth-related activities over the next three years, 40 per cent of zero employee businesses plan to increase the skills of the owners, 32 per cent plan to develop and launch new products or services, 28 per cent plan to introduce new working practices, 24 per cent plant to invest in premises, machinery or other types of capital investment, and 17 per cent plan to increase the leadership capability of managers.
Steve Lomax, June Wiseman,
Emma Parry, BMG Research Ltd,
May 2016.
6

2. Introduction Aims of the survey
This report sets out the key findings from the Longitudinal Small Business Survey (LSBS), a large-scale telephone survey of 15,502 owners and managers, commissioned by the Department for Business, Innovation and Skills (BIS). This survey is the latest in a series of annual and biennial Small Business Surveys dating back to 2003. The survey on this occasion was conducted between July 2015 and January 2016 by BMG Research Ltd.
The 2015 LSBS is the largest SBS yet undertaken. The main reason for this is to allow the survey to have a longitudinal tracking element, establishing a ‘panel’ or businesses that will be re-surveyed in subsequent years. This will allow a detailed analysis of how combinations of factors affect business performance. Any panel will have an element of attrition, hence the need for a large sample size in Year One which should result in a robust sample size for the Year Four and Five analyses.
The main aims of the survey are:
• To collect a range of information on small businesses. The survey measures:
o The characteristics of Small and Medium-sized Enterprises (SMEs3) such as their type (number of sites, number of owners, whether they have separate business premises etc.).
o The characteristics of their owners and leaders.
o Recent turnover and employment growth.
o Capabilities (in terms of their ability to innovate, export, train staff, etc.).
o Experience of accessing finance.
o Use of business support.
o Expectations to grow turnover and employment.
o The obstacles that prevent SMEs fulfilling their potential.
• To obtain a high level of willingness to take part in further LSBS studies.
3 Defined here as having fewer than 250 employees.
7
Survey method
BIS commissioned 15,500 CATI4 interviews for the LSBS Year One survey distributed in proportion to the SME populations of the UK nations. Within this, the number of interviews in Northern Ireland was boosted slightly in order to generate a total sample size of 500 in this nation.
The sample was stratified within each of the four UK nations. Targets were set according to the size of enterprises and, within those targets, for sector (SIC 2007) and legal status (companies vs. non companies) for businesses with between zero and four employees. The targets by employment size were as follows:
• 12 per cent of interviews with unregistered businesses with zero employees.
• 11 per cent of interviews with registered businesses with zero employees that were companies.
• Five per cent of interviews with registered businesses with zero employees that were not companies.
• Ten per cent of interviews with registered micro businesses with between one and four employees that were companies.
• Seven per cent of interviews with registered micro businesses with between one and four employees that were not companies.
• Nine per cent of interviews with registered micro businesses with between five and nine employees.
• 26 per cent of interviews with registered small businesses with between ten and 49 employees.
• 20 per cent of interviews with registered medium-sized businesses with between 50 and 249 employees.
These targets over-represent businesses with five to 249 employees substantially in comparison to their actual numbers within the business population. However, the proportion of targeted businesses with zero employees (28 per cent) was greater than was the case in previous SBSs (17 per cent).
The sampling method differed from previous SBSs, and full details of this method are available in a separate technical report for LSBS Year One. For registered businesses, the Inter Departmental Business Register (IDBR) was used as the sample source. For unregistered businesses with zero employees, Dun & Bradstreet’s database was used.
4 Computer Assisted Telephone Interviews.
8

Dun & Bradstreet contacts were screened out if it was found that they either had employees on their payroll or paid VAT, as these would have duplicated contacts found within the IDBR.
The IDBR is a record of all UK enterprises that pay VAT or PAYE. As such it has around 2.3 million entries, compared with the estimate from BIS’ Business Population Estimates (BPE), that there are around 5.4 million enterprises in the UK. The difference in the figures is explained by the number of unregistered enterprises that do not pay VAT or PAYE, estimates of which come from the Labour Force Survey (LFS). This is the reason why Dun & Bradstreet was retained as the source for businesses with no employees, as it contains records for both registered and unregistered businesses.
The targets within the sample stratification matrix were informed by the 2014 BPE5, the latest available at the time. However, survey findings were weighted to the 2015 BPE6 which had become available at the end of fieldwork. The 2015 BPE was used for weighting as it more properly represented the IDBR contacts used for the survey, as well as providing a more up-to-date picture of UK small businesses than the 2014 BPE.
A review of the 2014 questionnaire was undertaken through consultations with stakeholders before LSBS Year One. This resulted in a substantial number of alterations to existing questions from previous SBSs, new question additions and deletions. The changes were informed by the requirement to balance stakeholders’ emergent needs with the desire to exploit the longitudinal power of the survey. The consultation was followed up by an extensive round of 15 cognitive tests and a ‘live’ pilot of 100 interviews of the adjusted 2015 questionnaire.
Note on the report
Please note that the findings presented in this report relate to enterprises with no employees – the findings relating to SME employers are presented for comparison purposes only. The overall sample size for enterprises with no employees across the UK is 4,355. A separate report relating to SME employers is also available.
Registered zero employee businesses are those that appear in the IDBR, i.e. they are registered for VAT, but not PAYE. Unregistered businesses are those that are not registered for VAT, and have no employees on their payroll at the time of interview.
5 https://www.gov.uk/government/statistics/business-population-estimates-2014. The figures were drawn from a combination of the Inter Departmental Business Register (IDBR) which contains all businesses operating VAT or PAYE schemes or which were registered at Companies House and the household survey-based Labour Force Survey (LFS) which is the main source for estimating the number of the self-employed and very small businesses. 6 https://www.gov.uk/government/statistics/business-population-estimates-2015. Method of data collection as above.
9
The changes made to LSBS Year One in terms of sampling and questionnaire design mean that time series comparisons for businesses with no employees cannot be made. In 2014, businesses with no employees were sourced from Dun & Bradstreet but were not screened to ensure they were unregistered. Furthermore, because of size band slippage7, the 2014 zero employee sample mainly comprised businesses sourced from IDBR that were supposed to be employers.
Statistical confidence
This overall sample is sufficiently large to allow reporting on findings with a high degree of statistical reliability. Most findings are reported in terms of differences between a sub-group (e.g. a particular sector or nation) and the overall finding (excluding that sub-group). For example, a difference of just +/- 1.0% against the overall finding is statistically significant for findings in which 10% of enterprises with no employees in England give one response and a difference of +/- 1.6% is statistically significant in cases where 50% of enterprises with no employees in England give an answer. Table 2.1 overleaf shows the differences required between certain sub-groups and the overall total in order for findings to be statistically significant.
Unless stated otherwise, all findings reported in bold in the tables were statistically significant, whether reported as a finding for a sub-group compared with the overall total or as a LSBS Year One finding compared with SBS 2014.
Please note that the figures in some tables may not add to 100 per cent due to rounding of percentages, or exclusion of ‘don’t know’ and/or ‘refused’ responses.
7 E.g. where the IDBR indicated that the business had employees, but the business itself said this was not the case.
10
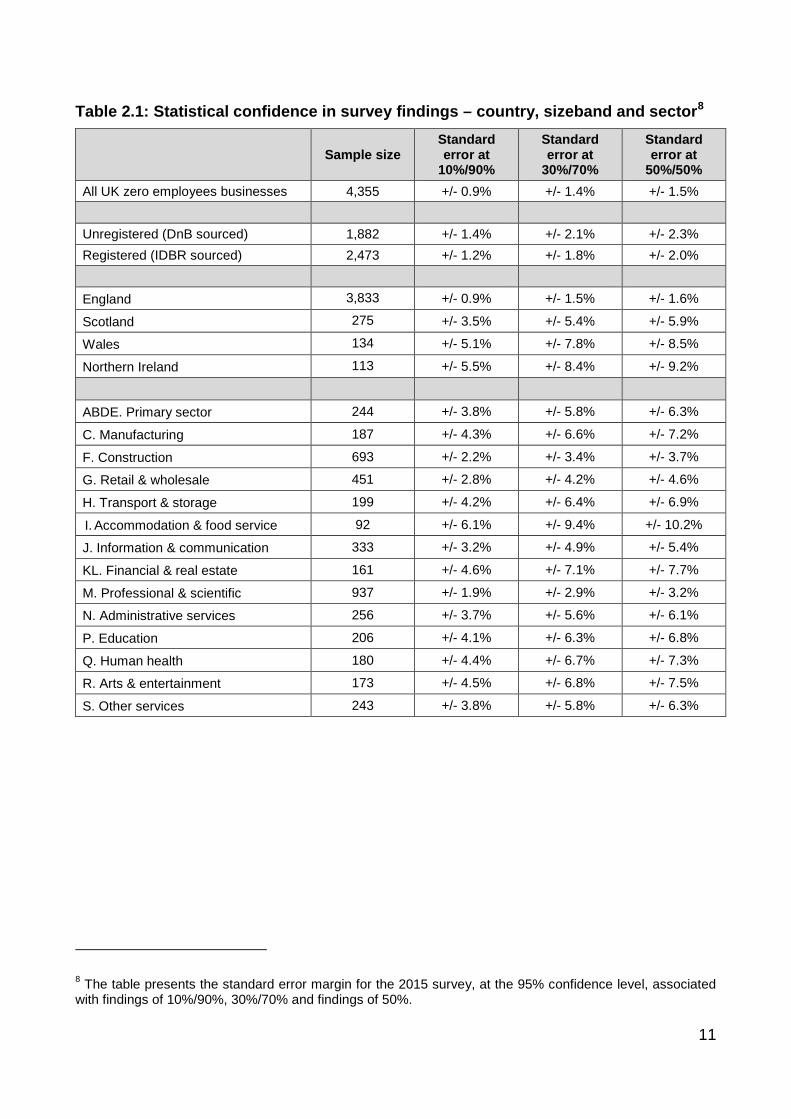
Table 2.1: Statistical confidence in survey findings – country, sizeband and sector8
Sample size Standard error at
10%/90%
Standard error at
30%/70%
Standard error at
50%/50% All UK zero employees businesses 4,355 +/- 0.9% +/- 1.4% +/- 1.5% Unregistered (DnB sourced) 1,882 +/- 1.4% +/- 2.1% +/- 2.3% Registered (IDBR sourced) 2,473 +/- 1.2% +/- 1.8% +/- 2.0%
England 3,833 +/- 0.9% +/- 1.5% +/- 1.6%
Scotland 275 +/- 3.5% +/- 5.4% +/- 5.9%
Wales 134 +/- 5.1% +/- 7.8% +/- 8.5%
Northern Ireland 113 +/- 5.5% +/- 8.4% +/- 9.2%
ABDE. Primary sector 244 +/- 3.8% +/- 5.8% +/- 6.3%
C. Manufacturing 187 +/- 4.3% +/- 6.6% +/- 7.2%
F. Construction 693 +/- 2.2% +/- 3.4% +/- 3.7%
G. Retail & wholesale 451 +/- 2.8% +/- 4.2% +/- 4.6%
H. Transport & storage 199 +/- 4.2% +/- 6.4% +/- 6.9%
I. Accommodation & food service 92 +/- 6.1% +/- 9.4% +/- 10.2%
J. Information & communication 333 +/- 3.2% +/- 4.9% +/- 5.4%
KL. Financial & real estate 161 +/- 4.6% +/- 7.1% +/- 7.7%
M. Professional & scientific 937 +/- 1.9% +/- 2.9% +/- 3.2%
N. Administrative services 256 +/- 3.7% +/- 5.6% +/- 6.1%
P. Education 206 +/- 4.1% +/- 6.3% +/- 6.8%
Q. Human health 180 +/- 4.4% +/- 6.7% +/- 7.3%
R. Arts & entertainment 173 +/- 4.5% +/- 6.8% +/- 7.5%
S. Other services 243 +/- 3.8% +/- 5.8% +/- 6.3%
8 The table presents the standard error margin for the 2015 survey, at the 95% confidence level, associated with findings of 10%/90%, 30%/70% and findings of 50%.
11
3. Profile of businesses This section explores the characteristics of enterprises with no employees, for example in terms of their sector, legal status, age and the characteristics of their owners. LSBS Year One data is weighted9 to estimates derived from BIS’ Business Population Estimates (BPE). For that reason, the data shown below sector is drawn from the BPE rather than LSBS.
Employment size (based on BPE 2015)
The 2015 Business Population Estimates calculated that there were 5,389,450 businesses in the UK private sector. This was an increase of 146,315 on the 2014 estimates.
Seventy-six per cent of these businesses (4,077,585) had no employees and fall within the scope of this report.
The bulk of these (3,037,290, 56 per cent of all enterprises) were unregistered businesses).
Businesses with no employees accounted for 17 per cent of all employment in the UK private sector, and six per cent of all turnover.
Sector (based on BPE 2015)
Standard Industrial Classification (SIC) is used as a means of classifying business establishments by the type of economic activity in which they were engaged. It has been revised several times, the latest revision producing the SIC 2007 classification.
The most populous sectors among SMEs with no employees in 2015 were construction (20 per cent) and professional/scientific (15 per cent).
Compared with SME employers, there were a greater proportion of SMEs with no employees in the construction (20 per cent of no employees, 12 per cent of employers), education (six per cent compared with one per cent), health (eight per cent compared with five per cent) and arts/recreation (six per cent compared with two per cent) sectors. There were a smaller proportion of businesses with no employees in retail/wholesale (seven per cent compared with 19 per cent) and food/accommodation (one per cent compared with ten per cent) sectors.
9 See technical report for more detail on the weighting.
12
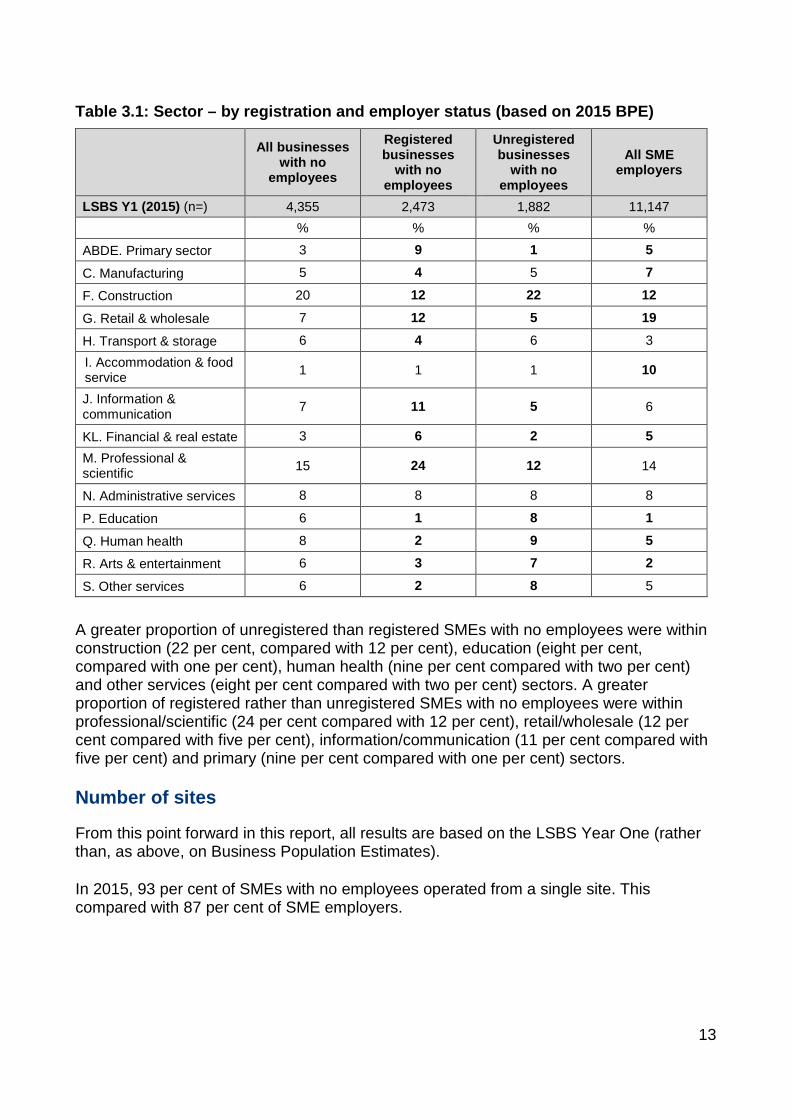
Table 3.1: Sector – by registration and employer status (based on 2015 BPE)
All businesses
with no employees
Registered businesses
with no employees
Unregistered businesses
with no employees
All SME employers
LSBS Y1 (2015) (n=) 4,355 2,473 1,882 11,147 % % % %
ABDE. Primary sector 3 9 1 5
C. Manufacturing 5 4 5 7
F. Construction 20 12 22 12
G. Retail & wholesale 7 12 5 19
H. Transport & storage 6 4 6 3 I. Accommodation & food service 1 1 1 10
J. Information & communication 7 11 5 6
KL. Financial & real estate 3 6 2 5 M. Professional & scientific 15 24 12 14
N. Administrative services 8 8 8 8
P. Education 6 1 8 1
Q. Human health 8 2 9 5
R. Arts & entertainment 6 3 7 2
S. Other services 6 2 8 5
A greater proportion of unregistered than registered SMEs with no employees were within construction (22 per cent, compared with 12 per cent), education (eight per cent, compared with one per cent), human health (nine per cent compared with two per cent) and other services (eight per cent compared with two per cent) sectors. A greater proportion of registered rather than unregistered SMEs with no employees were within professional/scientific (24 per cent compared with 12 per cent), retail/wholesale (12 per cent compared with five per cent), information/communication (11 per cent compared with five per cent) and primary (nine per cent compared with one per cent) sectors.
Number of sites
From this point forward in this report, all results are based on the LSBS Year One (rather than, as above, on Business Population Estimates).
In 2015, 93 per cent of SMEs with no employees operated from a single site. This compared with 87 per cent of SME employers.
13

Whether business premises are somebody’s home
Fifty-nine per cent of SMEs with no employees had a main work premises that was also somebody’s home. This compared with 24 per cent of SME employers. The proportion was higher among unregistered businesses with no employees than those that were registered (61 per cent compared with 54 per cent).
Table 3.2: Whether main business/work premise is owner’s home – by registration and employer status
All businesses
with no employees
Registered businesses
with no employees
Unregistered businesses
with no employees
All SME employers
LSBS Y1 (2015) (n=) 4,355 2,473 1,882 11,147 % % % % Work/home at same address 59 54 61 24
Base = all SMEs. Figures in bold were statistically significant at the 95% confidence level against the overall finding for all businesses with no employees (minus the sub-group tested). A10. Single answer only allowed at this question.
Among SMEs with no employees, home-based businesses were more common within construction (82 per cent), education (76 per cent), primary (69 per cent), and transport/storage (67 per cent) sectors.
Legal status
Sixty-one per cent of businesses with no employees were sole proprietorships. Twenty-eight per cent were private limited companies limited by shares (Ltd) and five per cent were partnerships.
While 77 per cent of unregistered businesses with no employees were sole proprietorships, just 16 per cent of registered businesses with no employees were. The latter were more likely than unregistered businesses with no employees to be companies limited by shares (65 per cent, compared with 16 per cent), or partnerships (11 per cent, compared with three per cent).
14
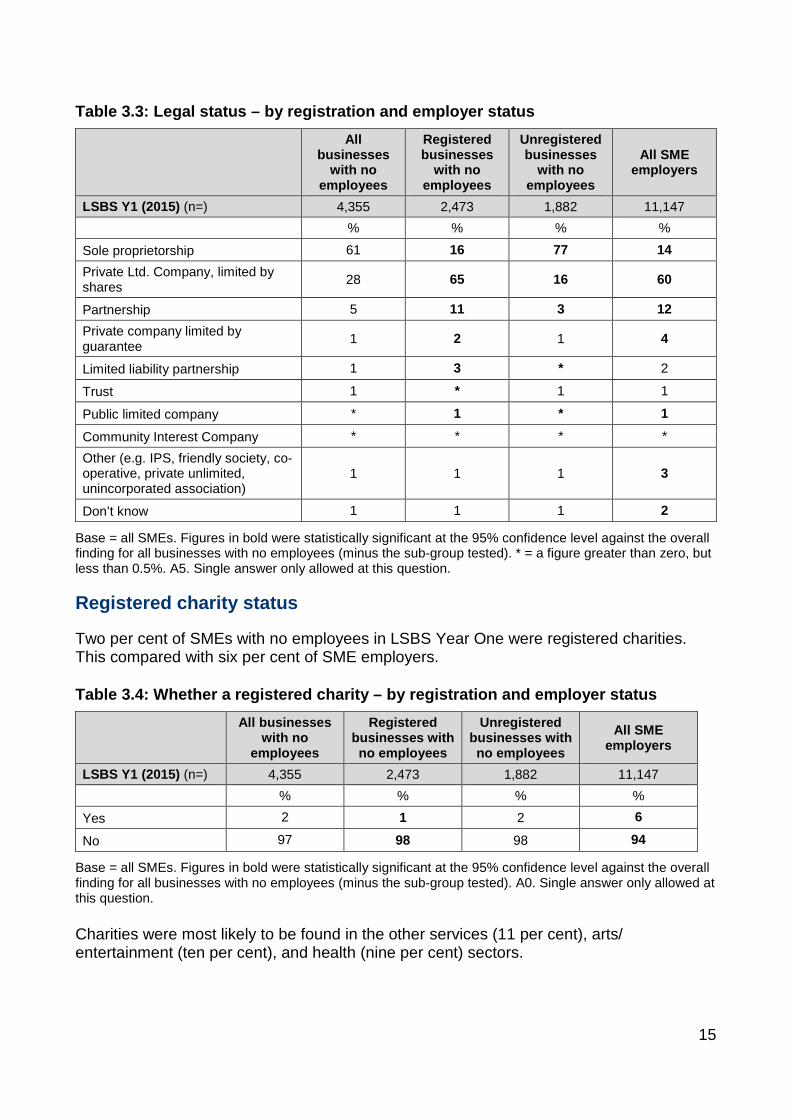
Table 3.3: Legal status – by registration and employer status
All businesses
with no employees
Registered businesses
with no employees
Unregistered businesses
with no employees
All SME employers
LSBS Y1 (2015) (n=) 4,355 2,473 1,882 11,147 % % % %
Sole proprietorship 61 16 77 14 Private Ltd. Company, limited by shares 28 65 16 60
Partnership 5 11 3 12 Private company limited by guarantee 1 2 1 4
Limited liability partnership 1 3 * 2
Trust 1 * 1 1
Public limited company * 1 * 1
Community Interest Company * * * * Other (e.g. IPS, friendly society, co-operative, private unlimited, unincorporated association)
1 1 1 3
Don’t know 1 1 1 2
Base = all SMEs. Figures in bold were statistically significant at the 95% confidence level against the overall finding for all businesses with no employees (minus the sub-group tested). * = a figure greater than zero, but less than 0.5%. A5. Single answer only allowed at this question.
Registered charity status
Two per cent of SMEs with no employees in LSBS Year One were registered charities. This compared with six per cent of SME employers.
Table 3.4: Whether a registered charity – by registration and employer status
All businesses
with no employees
Registered businesses with no employees
Unregistered businesses with no employees
All SME employers
LSBS Y1 (2015) (n=) 4,355 2,473 1,882 11,147 % % % %
Yes 2 1 2 6
No 97 98 98 94
Base = all SMEs. Figures in bold were statistically significant at the 95% confidence level against the overall finding for all businesses with no employees (minus the sub-group tested). A0. Single answer only allowed at this question.
Charities were most likely to be found in the other services (11 per cent), arts/ entertainment (ten per cent), and health (nine per cent) sectors.
15

Age of business
Two-fifths of SMEs with no employees (39 per cent) were found to be aged more than 20 years. This compared with over half of all SME employers (54 per cent). The proportion was higher among registered businesses with no employees (54 per cent) than unregistered businesses (34 per cent). Fifteen per cent of SMEs with no employees were found to have been formed in the last five years, with just one per cent having formed in the last year10.
Table 3.5: Age of business – by registration and employer status
All businesses
with no employees
Registered businesses with no employees
Unregistered businesses with no employees
All SME employers
LSBS Y1 (2015) (n=) 4,355 2,473 1,882 11,147 % % % %
Less than one 1 1 1 1
1 year 1 2 1 1
2 years 2 3 2 3
3 years 3 4 3 3
4 years 3 4 2 3
5 years 5 5 5 4
6-10 years 20 13 22 14
11-20 years 26 15 30 17
More than 20 years 39 54 34 54
Base = all SMEs. Figures in bold were statistically significant at the 95% confidence level against the overall finding for all businesses with no employees (minus the sub-group tested). A6. Single answer only allowed at this question.
Number of owners/partners
The definition for being an employer excludes owners and partners. Therefore, SMEs with no employees may have multiple owners and partners.
Excluding charities, 79 per cent of SMEs with no employees had just one owner or partner. This compared with 37 per cent of SME employers. Nineteen per cent had two, three per cent had between three and five and less than one per cent had six or more.
Registered businesses with no employees were less likely than unregistered businesses with no employees to have a single owner (50 per cent compared with 89 per cent).
10 This proportion for registered zero employee businesses was much lower than that indicated by the IDBR, due to the lack of telephone numbers for businesses aged up to two years in the IDBR, and the difficulty in finding numbers for young businesses by other means.
16
Sectors that were less likely than average to have a single owner were primary (36 per cent), financial/real estate (58 per cent) and accommodation/food (58 per cent).
Number of working partners/directors
Owners are not necessarily working partners or directors. The survey also asked about the number of these working partners/directors.
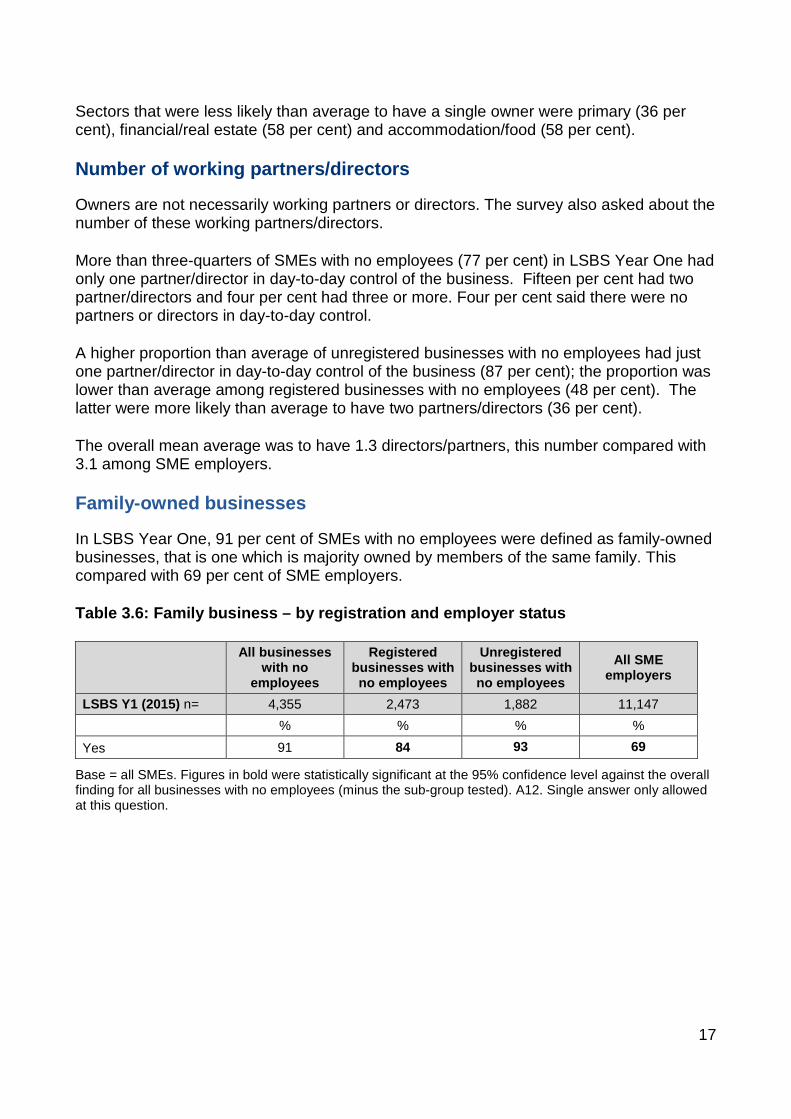
More than three-quarters of SMEs with no employees (77 per cent) in LSBS Year One had only one partner/director in day-to-day control of the business. Fifteen per cent had two partner/directors and four per cent had three or more. Four per cent said there were no partners or directors in day-to-day control.
A higher proportion than average of unregistered businesses with no employees had just one partner/director in day-to-day control of the business (87 per cent); the proportion was lower than average among registered businesses with no employees (48 per cent). The latter were more likely than average to have two partners/directors (36 per cent).
The overall mean average was to have 1.3 directors/partners, this number compared with 3.1 among SME employers.
Family-owned businesses
In LSBS Year One, 91 per cent of SMEs with no employees were defined as family-owned businesses, that is one which is majority owned by members of the same family. This compared with 69 per cent of SME employers.
Table 3.6: Family business – by registration and employer status
All businesses
with no employees
Registered businesses with no employees
Unregistered businesses with no employees
All SME employers
LSBS Y1 (2015) n= 4,355 2,473 1,882 11,147 % % % %
Yes 91 84 93 69
Base = all SMEs. Figures in bold were statistically significant at the 95% confidence level against the overall finding for all businesses with no employees (minus the sub-group tested). A12. Single answer only allowed at this question.
17
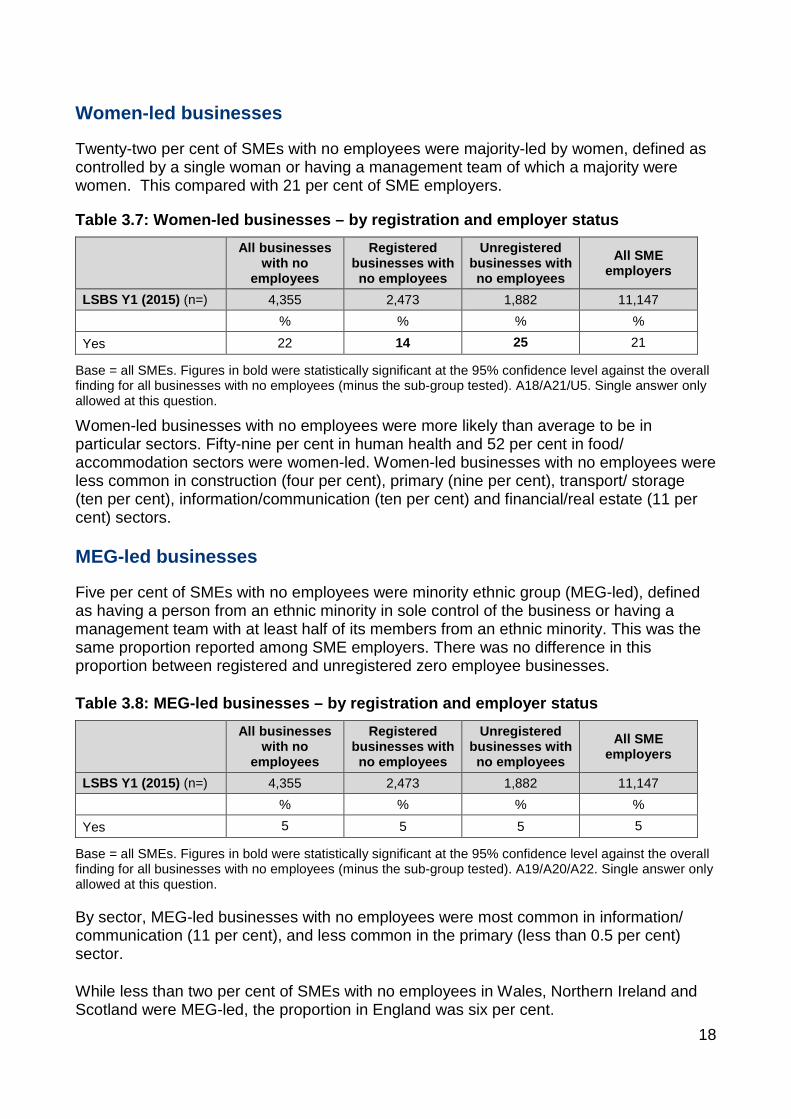
Women-led businesses
Twenty-two per cent of SMEs with no employees were majority-led by women, defined as controlled by a single woman or having a management team of which a majority were women. This compared with 21 per cent of SME employers.
Table 3.7: Women-led businesses – by registration and employer status
All businesses
with no employees
Registered businesses with no employees
Unregistered businesses with no employees
All SME employers
LSBS Y1 (2015) (n=) 4,355 2,473 1,882 11,147 % % % %
Yes 22 14 25 21
Base = all SMEs. Figures in bold were statistically significant at the 95% confidence level against the overall finding for all businesses with no employees (minus the sub-group tested). A18/A21/U5. Single answer only allowed at this question.
Women-led businesses with no employees were more likely than average to be in particular sectors. Fifty-nine per cent in human health and 52 per cent in food/ accommodation sectors were women-led. Women-led businesses with no employees were less common in construction (four per cent), primary (nine per cent), transport/ storage (ten per cent), information/communication (ten per cent) and financial/real estate (11 per cent) sectors.
MEG-led businesses
Five per cent of SMEs with no employees were minority ethnic group (MEG-led), defined as having a person from an ethnic minority in sole control of the business or having a management team with at least half of its members from an ethnic minority. This was the same proportion reported among SME employers. There was no difference in this proportion between registered and unregistered zero employee businesses.
Table 3.8: MEG-led businesses – by registration and employer status
All businesses
with no employees
Registered businesses with no employees
Unregistered businesses with no employees
All SME employers
LSBS Y1 (2015) (n=) 4,355 2,473 1,882 11,147 % % % %
Yes 5 5 5 5
Base = all SMEs. Figures in bold were statistically significant at the 95% confidence level against the overall finding for all businesses with no employees (minus the sub-group tested). A19/A20/A22. Single answer only allowed at this question.
By sector, MEG-led businesses with no employees were most common in information/ communication (11 per cent), and less common in the primary (less than 0.5 per cent) sector.
While less than two per cent of SMEs with no employees in Wales, Northern Ireland and Scotland were MEG-led, the proportion in England was six per cent.
18
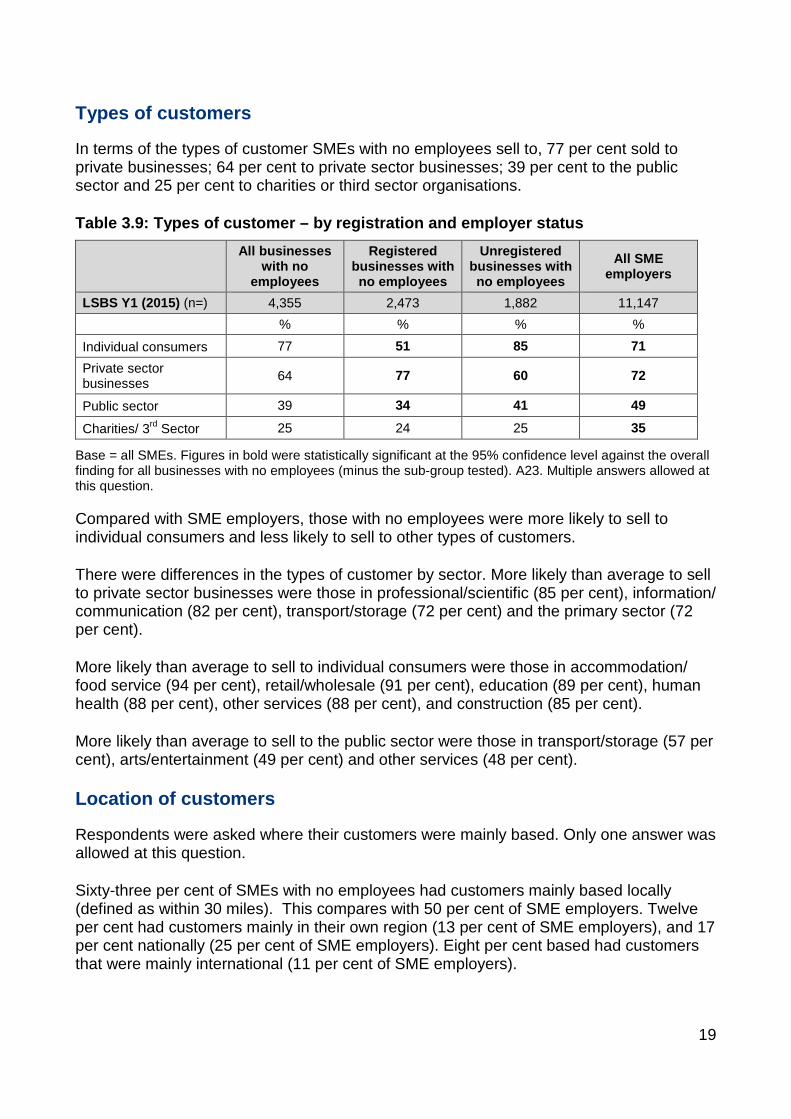
Types of customers
In terms of the types of customer SMEs with no employees sell to, 77 per cent sold to private businesses; 64 per cent to private sector businesses; 39 per cent to the public sector and 25 per cent to charities or third sector organisations.
Table 3.9: Types of customer – by registration and employer status
All businesses
with no employees
Registered businesses with no employees
Unregistered businesses with no employees
All SME employers
LSBS Y1 (2015) (n=) 4,355 2,473 1,882 11,147 % % % %
Individual consumers 77 51 85 71 Private sector businesses 64 77 60 72
Public sector 39 34 41 49
Charities/ 3rd Sector 25 24 25 35
Base = all SMEs. Figures in bold were statistically significant at the 95% confidence level against the overall finding for all businesses with no employees (minus the sub-group tested). A23. Multiple answers allowed at this question.
Compared with SME employers, those with no employees were more likely to sell to individual consumers and less likely to sell to other types of customers.
There were differences in the types of customer by sector. More likely than average to sell to private sector businesses were those in professional/scientific (85 per cent), information/ communication (82 per cent), transport/storage (72 per cent) and the primary sector (72 per cent).
More likely than average to sell to individual consumers were those in accommodation/ food service (94 per cent), retail/wholesale (91 per cent), education (89 per cent), human health (88 per cent), other services (88 per cent), and construction (85 per cent).
More likely than average to sell to the public sector were those in transport/storage (57 per cent), arts/entertainment (49 per cent) and other services (48 per cent).
Location of customers
Respondents were asked where their customers were mainly based. Only one answer was allowed at this question.
Sixty-three per cent of SMEs with no employees had customers mainly based locally (defined as within 30 miles). This compares with 50 per cent of SME employers. Twelve per cent had customers mainly in their own region (13 per cent of SME employers), and 17 per cent nationally (25 per cent of SME employers). Eight per cent based had customers that were mainly international (11 per cent of SME employers).
19
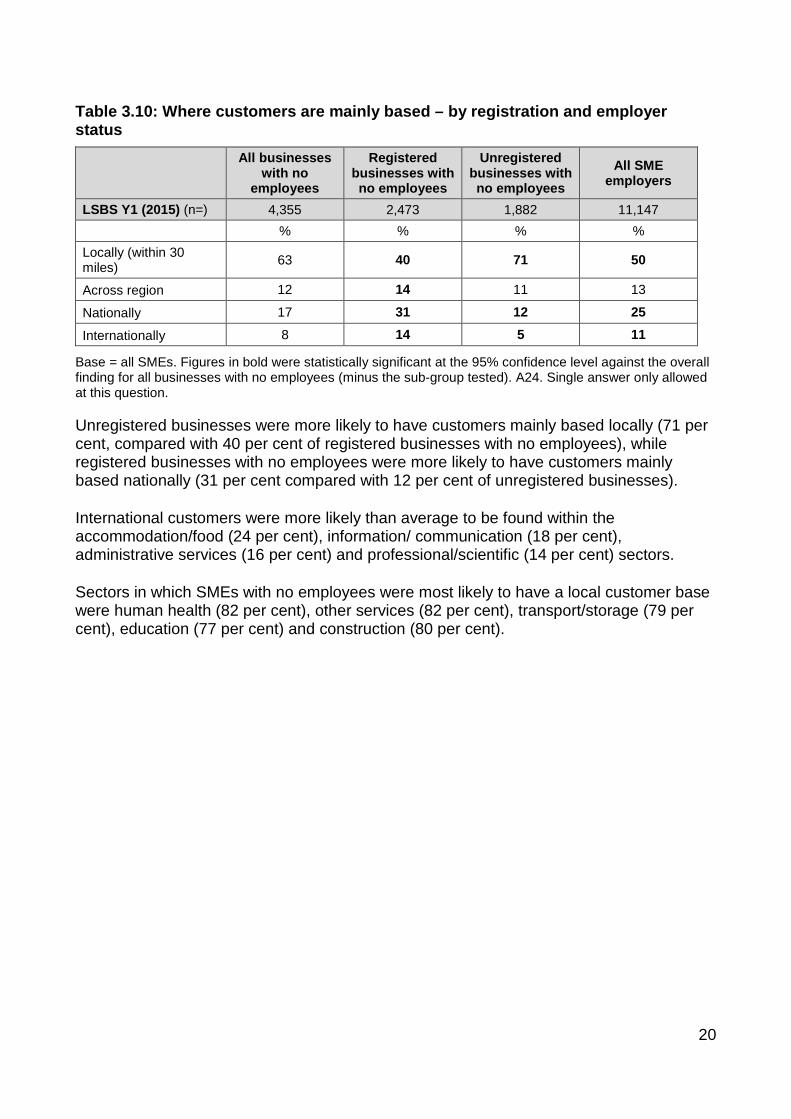
Table 3.10: Where customers are mainly based – by registration and employer status
All businesses
with no employees
Registered businesses with no employees
Unregistered businesses with no employees
All SME employers
LSBS Y1 (2015) (n=) 4,355 2,473 1,882 11,147 % % % % Locally (within 30 miles) 63 40 71 50
Across region 12 14 11 13
Nationally 17 31 12 25
Internationally 8 14 5 11
Base = all SMEs. Figures in bold were statistically significant at the 95% confidence level against the overall finding for all businesses with no employees (minus the sub-group tested). A24. Single answer only allowed at this question.
Unregistered businesses were more likely to have customers mainly based locally (71 per cent, compared with 40 per cent of registered businesses with no employees), while registered businesses with no employees were more likely to have customers mainly based nationally (31 per cent compared with 12 per cent of unregistered businesses).
International customers were more likely than average to be found within the accommodation/food (24 per cent), information/ communication (18 per cent), administrative services (16 per cent) and professional/scientific (14 per cent) sectors.
Sectors in which SMEs with no employees were most likely to have a local customer base were human health (82 per cent), other services (82 per cent), transport/storage (79 per cent), education (77 per cent) and construction (80 per cent).
20

4. Business performance This section explores how SMEs with no employees have performed in the last 12 months in terms of employment and turnover, and their expectations for performance in the next 12 months.
Numbers employed compared with 12 months ago The vast majority of SMEs with no employees also employed no one 12 months ago (94 per cent). A minority (six per cent) employed at least one person a year ago.
Table 4.1: Numbers employed now compared to 12 months ago – by registration and employer status
Businesses with no employees trading for at least one year
Registered no employee
businesses trading for at least one year
Unregistered no employee
businesses trading for at least one year
SME employers trading for at least one year
LSBS Y1 (2015) (n=) 4,327 2,457 1,870 11,080 % % % % More than 12m ago 0 0 0 24 Same as 12m ago 94 87 96 66 Fewer than 12m ago 6 13 4 10
Base = all SMEs trading for at least one year. Figures in bold were statistically significant at the 95% confidence level against the overall finding for all businesses with no employees (minus the sub-group tested). B1/B2. Single answer only allowed at this question.
Registered businesses with no employees were more likely to have had at least one employee a year ago than those that were unregistered (13 per cent compared with four per cent).
By nation, SMEs with no employees in Wales and Northern Ireland were more likely than average to have employed someone 12 months ago (15 per cent and 13 per cent respectively). The proportion in England was six per cent, and four per cent in Scotland.
Number of people expected to be employed in 12 months’ time
Twelve per cent of SMEs with no employees expected to employ more people in 12 months’ time, 87 per cent expected to employ the same number and the remaining one per cent were not sure.
Registered zero employee businesses were more likely to expect to employ people in 12 months time (17 per cent) than unregistered businesses (ten per cent).
21
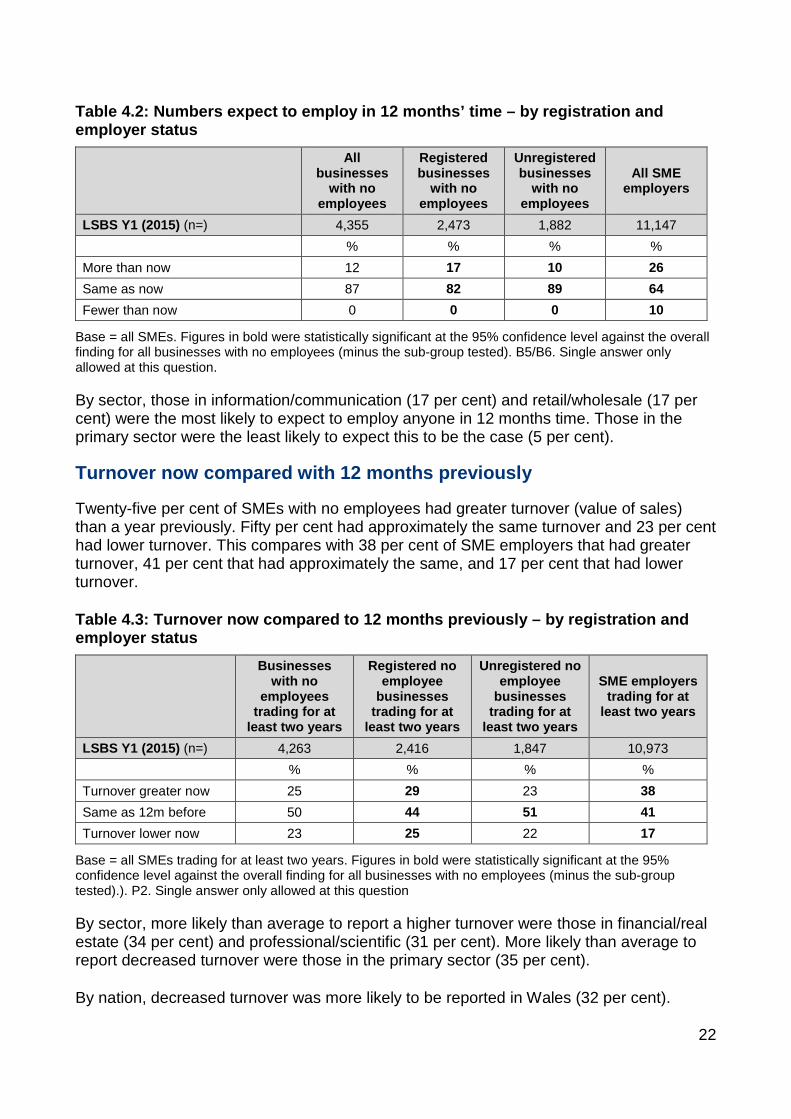
Table 4.2: Numbers expect to employ in 12 months’ time – by registration and employer status
All businesses
with no employees
Registered businesses
with no employees
Unregistered businesses
with no employees
All SME employers
LSBS Y1 (2015) (n=) 4,355 2,473 1,882 11,147 % % % % More than now 12 17 10 26 Same as now 87 82 89 64 Fewer than now 0 0 0 10
Base = all SMEs. Figures in bold were statistically significant at the 95% confidence level against the overall finding for all businesses with no employees (minus the sub-group tested). B5/B6. Single answer only allowed at this question.
By sector, those in information/communication (17 per cent) and retail/wholesale (17 per cent) were the most likely to expect to employ anyone in 12 months time. Those in the primary sector were the least likely to expect this to be the case (5 per cent).
Turnover now compared with 12 months previously
Twenty-five per cent of SMEs with no employees had greater turnover (value of sales) than a year previously. Fifty per cent had approximately the same turnover and 23 per cent had lower turnover. This compares with 38 per cent of SME employers that had greater turnover, 41 per cent that had approximately the same, and 17 per cent that had lower turnover.
Table 4.3: Turnover now compared to 12 months previously – by registration and employer status
Businesses with no
employees trading for at
least two years
Registered no employee
businesses trading for at
least two years
Unregistered no employee
businesses trading for at
least two years
SME employers trading for at
least two years
LSBS Y1 (2015) (n=) 4,263 2,416 1,847 10,973 % % % % Turnover greater now 25 29 23 38 Same as 12m before 50 44 51 41 Turnover lower now 23 25 22 17
Base = all SMEs trading for at least two years. Figures in bold were statistically significant at the 95% confidence level against the overall finding for all businesses with no employees (minus the sub-group tested).). P2. Single answer only allowed at this question
By sector, more likely than average to report a higher turnover were those in financial/real estate (34 per cent) and professional/scientific (31 per cent). More likely than average to report decreased turnover were those in the primary sector (35 per cent).
By nation, decreased turnover was more likely to be reported in Wales (32 per cent).
22

Expectations of turnover in 12 months’ time
Thirty-one per cent of SMEs with no employees expected turnover in the next 12 months to increase, 50 per cent thought it would remain roughly the same and 13 per cent expected it to decrease. This compared with 45 per cent of SME employers that expected turnover to increase in the next 12 months, 43 per cent that thought it would remain roughly the same and eight per cent that thought it would be less.
Table 4.4: Expectations of turnover in 12 months’ time – by registration and employer status
All businesses
with no employees
Registered businesses
with no employees
Unregistered businesses
with no employees
All SME employers
LSBS Y1 (2015) (n=) 4,355 2,473 1,882 11,147 % % % % More than now 31 35 30 45 Same as now 50 47 50 43 Less than now 13 14 13 8
Base = all SMEs. Figures in bold were statistically significant at the 95% confidence level against the overall finding for all businesses with no employees (minus the sub-group tested). P7. Single answer only allowed at this question.
Registered zero employee businesses were more likely to expect increased turnover (35 per cent) than unregistered businesses (30 per cent).
By sector, those in information/communication (41 per cent) and financial/real estate (40 per cent) were more likely than average to think turnover would increase. Those in the primary (18 per cent) and professional/scientific (17 per cent) sectors were more likely than average to think that turnover would decrease.
Profit
Seventy-six per cent of SMEs with no employees generated a profit in their last financial year (the same proportion as in 2014). This compared with 78 per cent of SME employers. Registered zero employee businesses were more likely than unregistered ones to have generated profit (79 per cent, compared with 75 per cent).
23

Table 4.5: Whether generated a profit or surplus in the last financial year – by registration and employer status
All businesses
with no employees
Registered businesses
with no employees
Unregistered businesses
with no employees
All SME employers
LSBS Y1 (2015) (n=) 4,355 2,473 1,882 11,147 % % % % Yes - profit 76 79 75 78
Base = all SMEs. Figures in bold were statistically significant at the 95% confidence level against the overall finding for all businesses with no employees (minus the sub-group tested). P12. Single answer only allowed at this question.
SMEs with no employees in the professional/scientific sector (84 per cent) were the most likely to have made a profit.
SMEs with no employees in Wales were less likely than average to have made a profit (68 per cent).
24
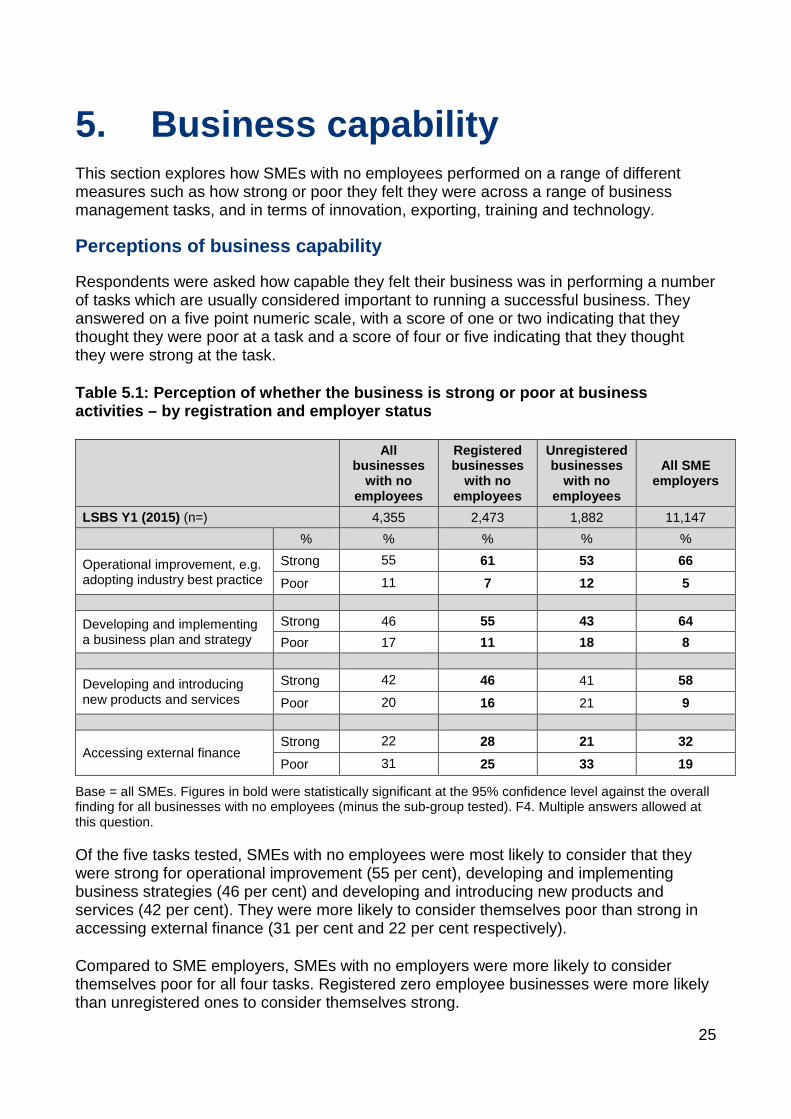
5. Business capability This section explores how SMEs with no employees performed on a range of different measures such as how strong or poor they felt they were across a range of business management tasks, and in terms of innovation, exporting, training and technology.
Perceptions of business capability
Respondents were asked how capable they felt their business was in performing a number of tasks which are usually considered important to running a successful business. They answered on a five point numeric scale, with a score of one or two indicating that they thought they were poor at a task and a score of four or five indicating that they thought they were strong at the task.
Table 5.1: Perception of whether the business is strong or poor at business activities – by registration and employer status
All businesses
with no employees
Registered businesses
with no employees
Unregistered businesses
with no employees
All SME employers
LSBS Y1 (2015) (n=) 4,355 2,473 1,882 11,147 % % % % %
Operational improvement, e.g. adopting industry best practice
Strong 55 61 53 66 Poor 11 7 12 5
Developing and implementing a business plan and strategy
Strong 46 55 43 64 Poor 17 11 18 8
Developing and introducing new products and services
Strong 42 46 41 58 Poor 20 16 21 9
Accessing external finance Strong 22 28 21 32 Poor 31 25 33 19
Base = all SMEs. Figures in bold were statistically significant at the 95% confidence level against the overall finding for all businesses with no employees (minus the sub-group tested). F4. Multiple answers allowed at this question.
Of the five tasks tested, SMEs with no employees were most likely to consider that they were strong for operational improvement (55 per cent), developing and implementing business strategies (46 per cent) and developing and introducing new products and services (42 per cent). They were more likely to consider themselves poor than strong in accessing external finance (31 per cent and 22 per cent respectively).
Compared to SME employers, SMEs with no employers were more likely to consider themselves poor for all four tasks. Registered zero employee businesses were more likely than unregistered ones to consider themselves strong.
25

Operational improvement, e.g. adopting industry best practice The businesses with no employees most likely to consider themselves strong in this area were those in finance/real estate (70 per cent), education (65 per cent), human health (62 per cent), the primary sector (62 per cent), information/communication (62 per cent) and professional/scientific (60 per cent). Those least likely to consider themselves strong were in the retail/wholesale (44 per cent), manufacturing (44 per cent) and transport/storage (47 per cent) sectors.
Developing and implementing a business strategy The businesses with no employees most likely to consider themselves strong in this area were those in financial/real estate (64 per cent), education (55 per cent), professional/ scientific (54 per cent) and administrative services (53 per cent). Those least likely to consider themselves strong were those in the primary sector (39 per cent), information/communication (39 per cent) and arts/entertainment (39 per cent).
Developing and introducing new products and services The businesses with no employees most likely to consider themselves strong in this area were those in retail/wholesale (52 per cent), information/communication (52 per cent) and education (52 per cent). Those less likely to consider themselves strong were those in transport/storage (30 per cent), the primary sector (32 per cent), and construction (36 per cent).
Accessing external finance The businesses with no employees most likely to consider themselves strong in this area were those in human health (38 per cent), the primary sector (31 per cent), financial/real estate (31 per cent), and transport/storage (28 per cent). Those less likely to consider themselves strong were those in accommodation/food (18 per cent) and manufacturing (18 per cent).
Business capability: business plans
Twenty-one per cent of SMEs with no employees had a business plan. The majority of these (13 per cent of all) had one that they kept up to date. This compares with 42 per cent of SME employers that had a business plan, and 32 per cent of all SME employers that had one they kept up to date.
Registered zero employee businesses were more likely to have had a business plan (29 per cent) than unregistered businesses (19 per cent).
26

Table 5.2: Has a business plan – by registration and employer status
All businesses
with no employees
Registered businesses
with no employees
Unregistered businesses
with no employees
All SME employers
LSBS Y1 (2015) (n=) 4,355 2,473 1,882 11,147 % % % % Has a business plan 21 29 19 42
- Kept up to date 13 20 11 32 - Not kept up to date 8 8 8 10
No – do not have business plan 78 71 81 56 Don’t know * 1 * 2
Base = all SMEs. Figures in bold were statistically significant at the 95% confidence level against the overall finding for all businesses with no employees (minus the sub-group tested). F5. * = a figure greater than zero, but less than 0.5%. Single answer only allowed at this question.
By sector, those in financial/real estate (36 per cent) and administrative services (31 per cent) were more likely than average to have had business plans. Those in construction (11 per cent) and transport/storage (13 per cent) were less likely than average to have had a business plan.
Business capability: innovation
Overall, 38 per cent of SMEs with no employees had undertaken some form of innovation in the last three years, be this the introduction of new products or services, significant improvements to existing products or services, or the introduction or significant improvement of processes.
New/significantly improved products/services Thirty-four per cent of SMEs with no employees had introduced new or significantly improved goods or services in the last three years. This compared with 43 per cent of SME employers.
Sixteen per cent of SMEs with no employees said they had introduced or improved goods, and 29 per cent that they had introduced or improved services. This compared with 22 per cent and 36 per cent of SME employers respectively.
27
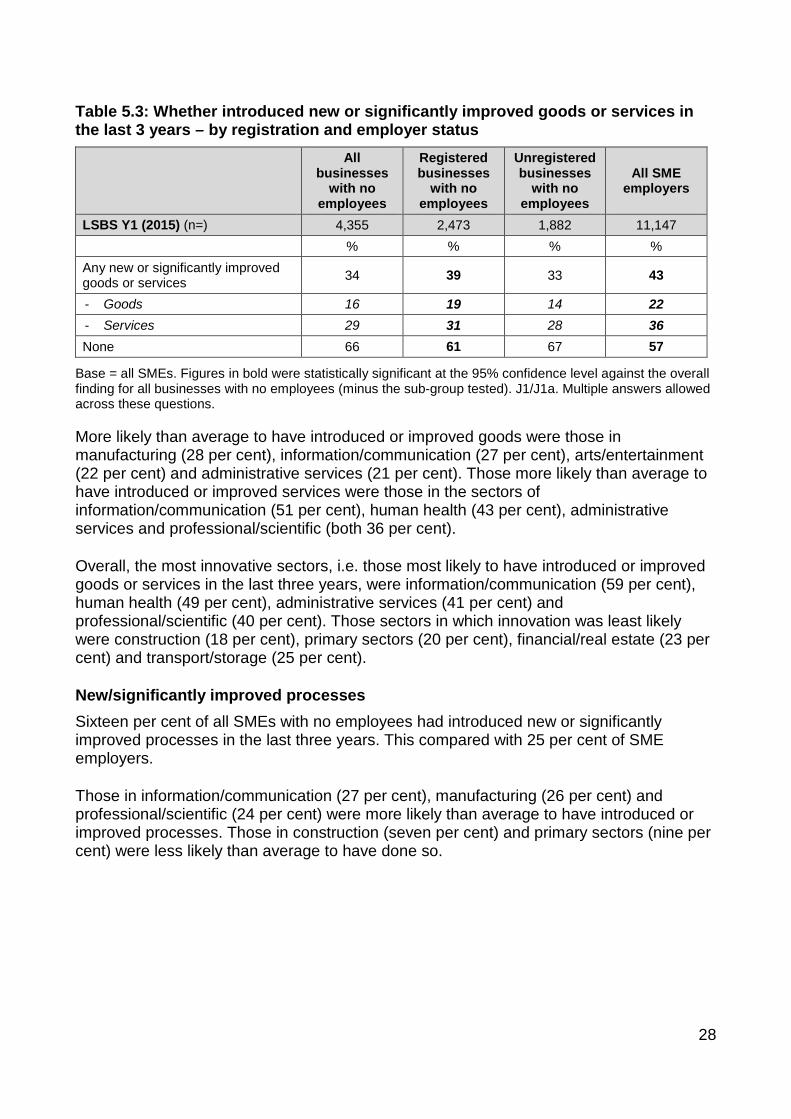
Table 5.3: Whether introduced new or significantly improved goods or services in the last 3 years – by registration and employer status
All businesses
with no employees
Registered businesses
with no employees
Unregistered businesses
with no employees
All SME employers
LSBS Y1 (2015) (n=) 4,355 2,473 1,882 11,147 % % % % Any new or significantly improved goods or services 34 39 33 43
- Goods 16 19 14 22 - Services 29 31 28 36 None 66 61 67 57
Base = all SMEs. Figures in bold were statistically significant at the 95% confidence level against the overall finding for all businesses with no employees (minus the sub-group tested). J1/J1a. Multiple answers allowed across these questions.
More likely than average to have introduced or improved goods were those in manufacturing (28 per cent), information/communication (27 per cent), arts/entertainment (22 per cent) and administrative services (21 per cent). Those more likely than average to have introduced or improved services were those in the sectors of information/communication (51 per cent), human health (43 per cent), administrative services and professional/scientific (both 36 per cent).
Overall, the most innovative sectors, i.e. those most likely to have introduced or improved goods or services in the last three years, were information/communication (59 per cent), human health (49 per cent), administrative services (41 per cent) and professional/scientific (40 per cent). Those sectors in which innovation was least likely were construction (18 per cent), primary sectors (20 per cent), financial/real estate (23 per cent) and transport/storage (25 per cent).
New/significantly improved processes Sixteen per cent of all SMEs with no employees had introduced new or significantly improved processes in the last three years. This compared with 25 per cent of SME employers.
Those in information/communication (27 per cent), manufacturing (26 per cent) and professional/scientific (24 per cent) were more likely than average to have introduced or improved processes. Those in construction (seven per cent) and primary sectors (nine per cent) were less likely than average to have done so.
28
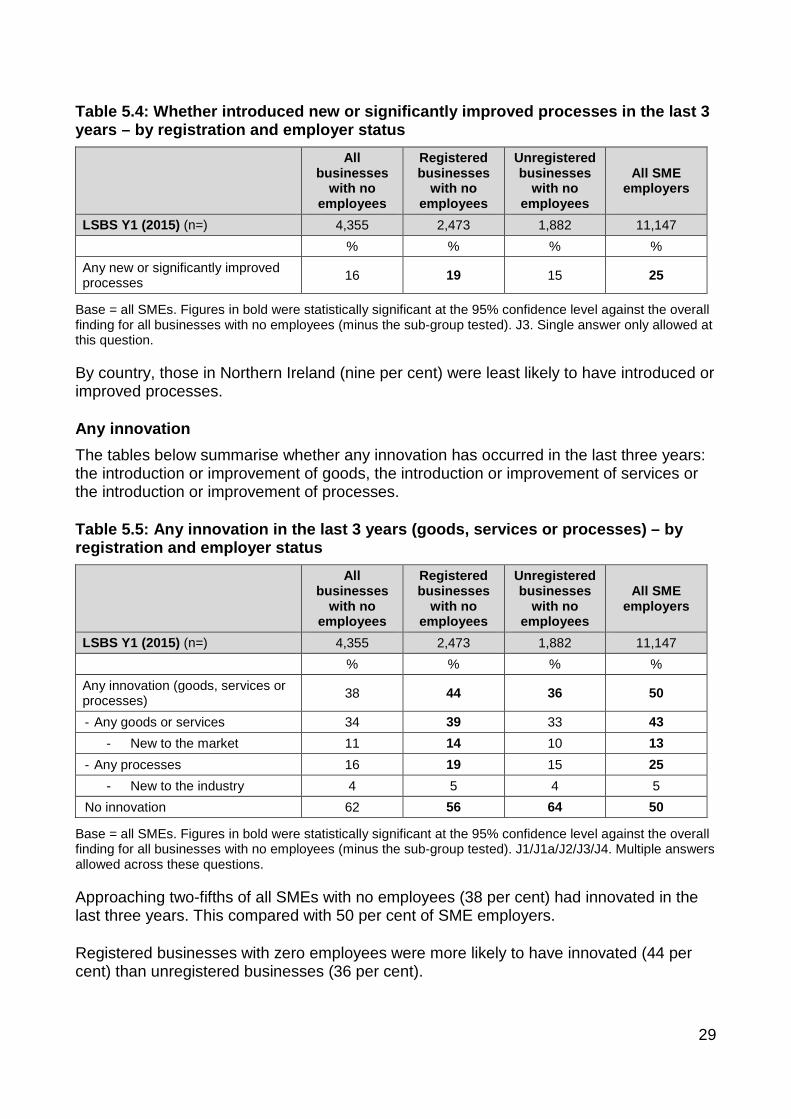
Table 5.4: Whether introduced new or significantly improved processes in the last 3 years – by registration and employer status
All businesses
with no employees
Registered businesses
with no employees
Unregistered businesses
with no employees
All SME employers
LSBS Y1 (2015) (n=) 4,355 2,473 1,882 11,147 % % % % Any new or significantly improved processes 16 19 15 25
Base = all SMEs. Figures in bold were statistically significant at the 95% confidence level against the overall finding for all businesses with no employees (minus the sub-group tested). J3. Single answer only allowed at this question.
By country, those in Northern Ireland (nine per cent) were least likely to have introduced or improved processes.
Any innovation The tables below summarise whether any innovation has occurred in the last three years: the introduction or improvement of goods, the introduction or improvement of services or the introduction or improvement of processes.
Table 5.5: Any innovation in the last 3 years (goods, services or processes) – by registration and employer status
All businesses
with no employees
Registered businesses
with no employees
Unregistered businesses
with no employees
All SME employers
LSBS Y1 (2015) (n=) 4,355 2,473 1,882 11,147 % % % % Any innovation (goods, services or processes) 38 44 36 50
- Any goods or services 34 39 33 43 - New to the market 11 14 10 13
- Any processes 16 19 15 25 - New to the industry 4 5 4 5
No innovation 62 56 64 50
Base = all SMEs. Figures in bold were statistically significant at the 95% confidence level against the overall finding for all businesses with no employees (minus the sub-group tested). J1/J1a/J2/J3/J4. Multiple answers allowed across these questions.
Approaching two-fifths of all SMEs with no employees (38 per cent) had innovated in the last three years. This compared with 50 per cent of SME employers.
Registered businesses with zero employees were more likely to have innovated (44 per cent) than unregistered businesses (36 per cent).
29
Eleven per cent of all SMEs with no employees had introduced goods or services that were new to the market. Four per cent had introduced or significantly improved processes that were new to their industry. These proportions compared with 13 per cent and five per cent of all SME employers respectively.
By sector, any innovation was above average in information/communication (61 per cent), human health (53 per cent), professional/scientific and manufacturing (both 47 per cent). Innovation was below average in construction (20 per cent), primary sectors (25 per cent) and transport/storage (28 per cent).
By country, 43 per cent had innovated in Scotland, compared to 38 per cent in England, 34 per cent in Wales and 26 per cent in Northern Ireland.
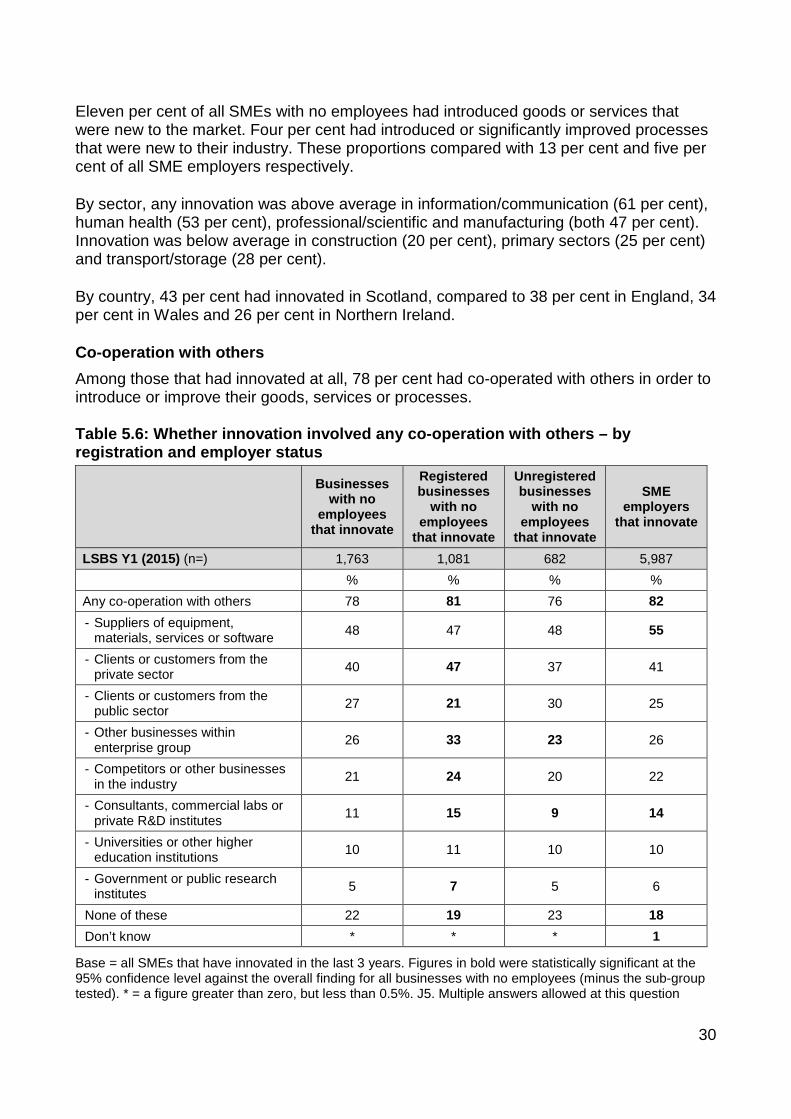
Co-operation with others Among those that had innovated at all, 78 per cent had co-operated with others in order to introduce or improve their goods, services or processes. Table 5.6: Whether innovation involved any co-operation with others – by registration and employer status
Businesses with no
employees that innovate
Registered businesses
with no employees
that innovate
Unregistered businesses
with no employees
that innovate
SME employers
that innovate
LSBS Y1 (2015) (n=) 1,763 1,081 682 5,987 % % % % Any co-operation with others 78 81 76 82 - Suppliers of equipment,
materials, services or software 48 47 48 55
- Clients or customers from the private sector 40 47 37 41
- Clients or customers from the public sector 27 21 30 25
- Other businesses within enterprise group 26 33 23 26
- Competitors or other businesses in the industry 21 24 20 22
- Consultants, commercial labs or private R&D institutes 11 15 9 14
- Universities or other higher education institutions 10 11 10 10
- Government or public research institutes 5 7 5 6
None of these 22 19 23 18 Don’t know * * * 1
Base = all SMEs that have innovated in the last 3 years. Figures in bold were statistically significant at the 95% confidence level against the overall finding for all businesses with no employees (minus the sub-group tested). * = a figure greater than zero, but less than 0.5%. J5. Multiple answers allowed at this question
30

This compared with 82 per cent of SME employers. SMEs with no employees that had innovated were most likely to have co-operated with suppliers (48 per cent of all innovators) or private sector clients (40 per cent).
Eleven per cent of innovators overall co-operated with consultants, commercial labs or private R&D institutes. This was most likely to have been the case in the primary (27 per cent) and professional/scientific (18 per cent) sectors.
Ten per cent of innovators overall co-operated with universities or other higher education institutions. This was most likely to have been the case in the human health (17 per cent), and professional/scientific (15 per cent) sectors.
Five per cent of innovators overall co-operated with Government or public research institutes. This was most likely to have been the case in the education sector (18 per cent).
Registered businesses with zero employees were more likely to have collaborated with others (81 per cent) than unregistered businesses (76 per cent).
Business capability: exporting
Whether sold goods or services outside of the UK in the last 12 months Ten per cent of SMEs with no employees reported that they had sold goods or services or licensed products outside of the UK in the last 12 months. This compared with 19 per cent of SME employers.
Table 5.7: Whether have sold goods or services or licensed products outside of the UK in the last 12 months – by registration and employer status
All businesses
with no employees
Registered businesses
with no employees
Unregistered businesses
with no employees
All SME employers
LSBS Y1 (2015) (n=) 4,355 2,473 1,882 11,147 % % % %
Export goods or services 10 20 7 19 - Export goods 4 7 3 11 - Export services 7 15 5 11
Base = all SMEs. Figures in bold were statistically significant at the 95% confidence level against the overall finding for all businesses with no employees (minus the sub-group tested). C1/C2. Multiples answers allowed across the questions.
The LSBS Year One survey separated out goods exports and service exports. Four per cent exported goods and seven per cent exported services.
The proportion of registered zero employee businesses that export (20 per cent) was slightly higher than the figure for all SME employers. They were most likely to have had
31

service exports (15 per cent of all registered zero employee businesses11). The proportion of unregistered businesses that exported was much lower at seven per cent.
By sector, exports were most likely in information/communication (28 per cent any export: 22 per cent export services), manufacturing (23 per cent any export: 18 per cent export goods), professional/scientific (18 per any export: 17 per cent export services) and retail/wholesale (17 per cent any export: 14 per export goods)..
The sectors least likely to have had any exports were construction (one per cent), transport/storage (three per cent), human health (four per cent), education (five per cent) and primary (five per cent).
Eight per cent of women-led businesses were exporters.
Exports as a percentage of annual turnover Service exports accounted for less than five per cent of turnover for 34 per cent of service exporting SMEs with no employees.
Table 5.8: Percentage of turnover accounted for by service exports – by registration and employer status
Businesses with no
employees that export
services
Registered no employee businesses that export
services
Unregistered no employee businesses that export
services
All SME employers that export
services
LSBS Y1 (2015) (n=) 436 350 86 1,544 % % % %
Up to 5% 34 25 43 41 5.1% - 10% 15 17 13 12
10.1% - 25% 13 15 10 12
25.1% - 50% 12 14 10 15
50.1% - 75% 6 6 7 6
75.1% - 90% 7 8 6 4 90.1% - 100% 12 12 11 7 Don’t know 2 3 1 2
Mean average 32% 35% 28% 25%
Base = all SMEs that export services. Figures in bold were statistically significant at the 95% confidence level against the overall finding for all businesses with no employees (minus the sub-group tested). C1a. Single answer only at this question.
11 The proportion of service exporters was higher than average among zero employee registered businesses in the arts/entertainment (33 per cent), information/communications (27 per cent) and professional/scientific (25 per cent) sectors.
32
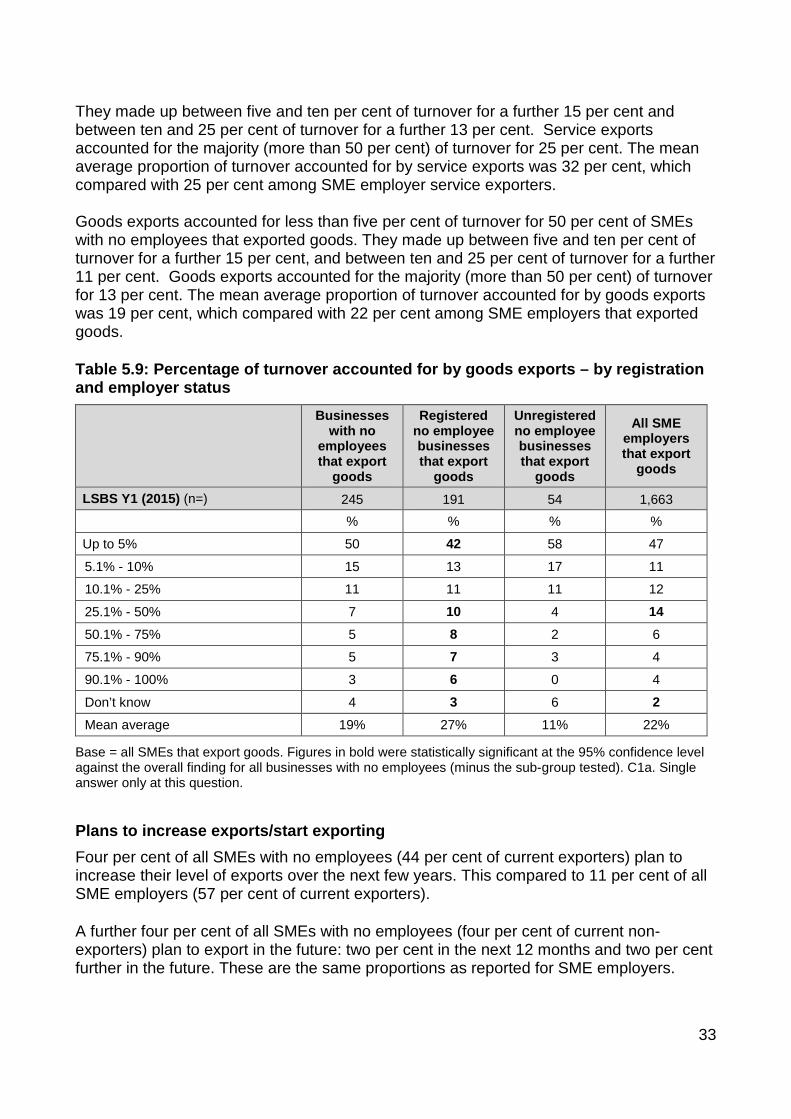
They made up between five and ten per cent of turnover for a further 15 per cent and between ten and 25 per cent of turnover for a further 13 per cent. Service exports accounted for the majority (more than 50 per cent) of turnover for 25 per cent. The mean average proportion of turnover accounted for by service exports was 32 per cent, which compared with 25 per cent among SME employer service exporters. Goods exports accounted for less than five per cent of turnover for 50 per cent of SMEs with no employees that exported goods. They made up between five and ten per cent of turnover for a further 15 per cent, and between ten and 25 per cent of turnover for a further 11 per cent. Goods exports accounted for the majority (more than 50 per cent) of turnover for 13 per cent. The mean average proportion of turnover accounted for by goods exports was 19 per cent, which compared with 22 per cent among SME employers that exported goods.
Table 5.9: Percentage of turnover accounted for by goods exports – by registration and employer status
Businesses with no
employees that export
goods
Registered no employee businesses that export
goods
Unregistered no employee businesses that export
goods
All SME employers that export
goods
LSBS Y1 (2015) (n=) 245 191 54 1,663 % % % %
Up to 5% 50 42 58 47
5.1% - 10% 15 13 17 11
10.1% - 25% 11 11 11 12
25.1% - 50% 7 10 4 14 50.1% - 75% 5 8 2 6
75.1% - 90% 5 7 3 4
90.1% - 100% 3 6 0 4
Don’t know 4 3 6 2 Mean average 19% 27% 11% 22%
Base = all SMEs that export goods. Figures in bold were statistically significant at the 95% confidence level against the overall finding for all businesses with no employees (minus the sub-group tested). C1a. Single answer only at this question.
Plans to increase exports/start exporting Four per cent of all SMEs with no employees (44 per cent of current exporters) plan to increase their level of exports over the next few years. This compared to 11 per cent of all SME employers (57 per cent of current exporters).
A further four per cent of all SMEs with no employees (four per cent of current non-exporters) plan to export in the future: two per cent in the next 12 months and two per cent further in the future. These are the same proportions as reported for SME employers.
33

Registered zero employees businesses were more likely than unregistered businesses to want to export more (ten per cent compared with two per cent), and export for the first time in the future (six per cent compared with three per cent).
Table 5.10: Plans to increase level of exports or to start exporting – by registration and employer status
All businesses
with no employees
Registered businesses
with no employees
Unregistered businesses
with no employees
All SME employers
LSBS Y1 (2015) (n=) 4,355 2,473 1,882 11,147 % % % %
Export goods or services already 10 20 7 19 - Plan to export more 4 10 2 11 Do not currently export 90 80 93 81 - Plan to export in future 4 6 3 4
Base = all SMEs. Figures in bold were statistically significant at the 95% confidence level against the overall finding for all businesses with no employees (minus the sub-group tested). C3/C4a. Single answer only at this question.
By sector, the highest proportions of non-exporters with a desire to export were found in the information/communication sector (10 per cent of current non-exporters).
Nine per cent of zero employee exporters had been exporting for less than two years, 25 per cent for between two and five years, 22 per cent for between six and ten years, 19 per cent for between 11 and 20 years, and 18 per cent for more than 20 years.
Of those that had been exporting for more than two years, 66 per cent have had overseas sales every year and 32 per cent have had some years with no overseas sales. Compared with SME employers, SMEs with no employees were less likely to be continuous in their exporting activity; 77 per cent of SME employers that exported did so every year; 20 per cent had years without overseas sales.
Of those exporters that had some years without overseas sales, the main reason for this was that they only got occasional orders from overseas (60 per cent). Fourteen per cent said that they preferred to concentrate on UK markets and ten per cent said they did not have the time to pursue exporting. Four per cent said that exporting was not profitable for them and the same proportion said they lacked knowledge of how best to export.
Business capability: technology
Internet access Ninety per cent of SMEs with no employees had access to the internet for work purposes. This compared with 95 per cent of SME employers.
The proportion was higher for zero employee registered businesses than unregistered businesses (96 per cent compared with 87 per cent). The proportion was particularly high within service sectors, namely information/communication (100 per cent),
34
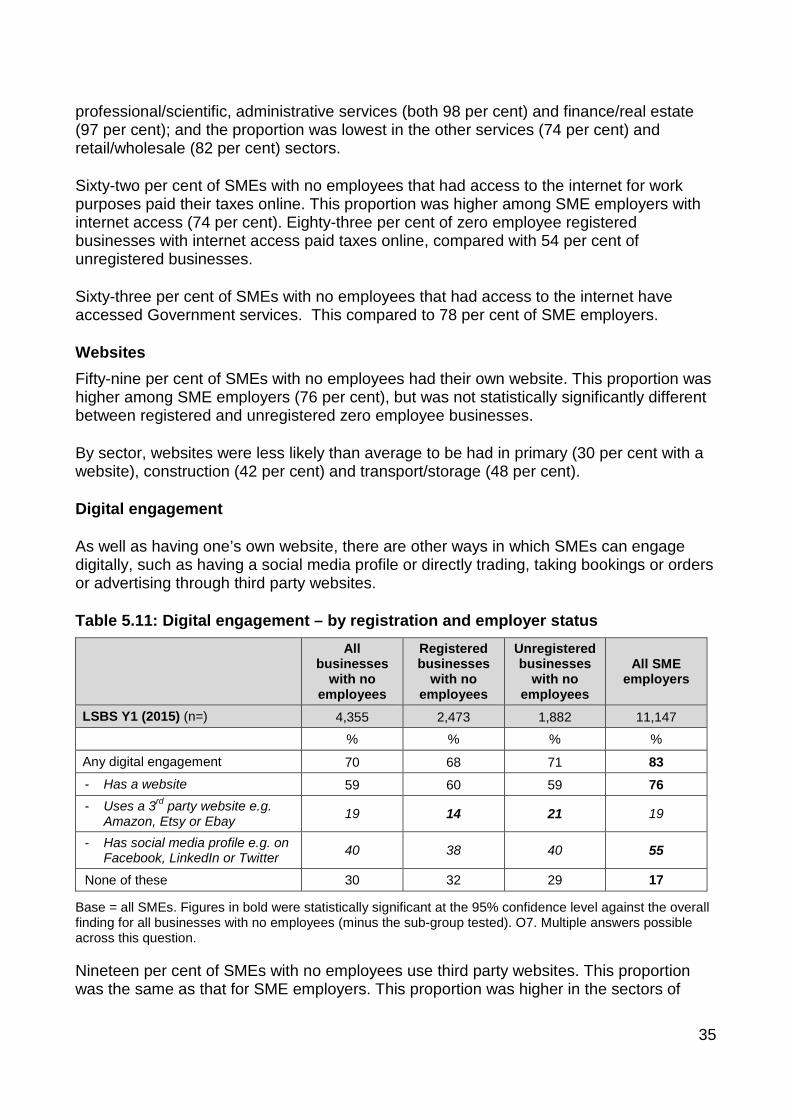
professional/scientific, administrative services (both 98 per cent) and finance/real estate (97 per cent); and the proportion was lowest in the other services (74 per cent) and retail/wholesale (82 per cent) sectors.
Sixty-two per cent of SMEs with no employees that had access to the internet for work purposes paid their taxes online. This proportion was higher among SME employers with internet access (74 per cent). Eighty-three per cent of zero employee registered businesses with internet access paid taxes online, compared with 54 per cent of unregistered businesses.
Sixty-three per cent of SMEs with no employees that had access to the internet have accessed Government services. This compared to 78 per cent of SME employers.
Websites Fifty-nine per cent of SMEs with no employees had their own website. This proportion was higher among SME employers (76 per cent), but was not statistically significantly different between registered and unregistered zero employee businesses.
By sector, websites were less likely than average to be had in primary (30 per cent with a website), construction (42 per cent) and transport/storage (48 per cent).
Digital engagement
As well as having one’s own website, there are other ways in which SMEs can engage digitally, such as having a social media profile or directly trading, taking bookings or orders or advertising through third party websites.
Table 5.11: Digital engagement – by registration and employer status
All businesses
with no employees
Registered businesses
with no employees
Unregistered businesses
with no employees
All SME employers
LSBS Y1 (2015) (n=) 4,355 2,473 1,882 11,147 % % % %
Any digital engagement 70 68 71 83 - Has a website 59 60 59 76 - Uses a 3rd party website e.g.
Amazon, Etsy or Ebay 19 14 21 19
- Has social media profile e.g. on Facebook, LinkedIn or Twitter 40 38 40 55
None of these 30 32 29 17
Base = all SMEs. Figures in bold were statistically significant at the 95% confidence level against the overall finding for all businesses with no employees (minus the sub-group tested). O7. Multiple answers possible across this question.
Nineteen per cent of SMEs with no employees use third party websites. This proportion was the same as that for SME employers. This proportion was higher in the sectors of
35

information/communication (37 per cent), human health (28 per cent) and education (27 per cent).
Forty per cent of SMEs with no employees had a social media profile. This compared with 55 per cent of SME employers. Social media profiles were most commonly found in arts/entertainment (64 per cent), education (57 per cent), information/communication (54 per cent) and retail/wholesale (50 per cent) sectors.
For most aspects of business capability registered zero employee businesses were considerably ahead of unregistered ones. This was not the case for digital engagement, where unregistered businesses were as likely as registered businesses to have websites and social media profiles, and were more likely than them to engage with third party websites.
E-commerce Overall, 28 per cent of SMEs with no employees engaged in some form of e-commerce. This compared with 31 per cent of SME employers. This overall definition covers a range of activities, including the ordering of goods and services from own websites or third party websites, with payment at the time of ordering or booking/ordering via own websites, third party websites and social media without payment at the time.
Table 5.12: E-commerce – by registration and employer status
All businesses
with no employees
Registered businesses
with no employees
Unregistered businesses
with no employees
All SME employers
LSBS Y1 (2015) (n=) 4,355 2,473 1,882 11,147 % % % %
Any e-commerce 28 22 30 31 - Goods and services ordered
directly from own website 11 9 11 15
- Goods and services ordered directly from 3rd party website 5 5 5 7
- Goods and services ordered from social media 10 8 11 10
- Bookings or orders can be made via own website, without payment at the time
16 11 17 20
- Bookings or orders can be made via 3rd party website, without payment at the time
6 4 7 6
Has a website, but no e-commerce 35 40 33 46 No website, no e-commerce 37 38 37 22
Base = all SMEs. Figures in bold were statistically significant at the 95% confidence level against the overall finding for all businesses with no employees (minus the sub-group tested). O7/O8/O9/O10. Multiple answers possible across the questions.
36
Eleven per cent had websites with the facility to allow customers to order and pay for goods and services directly; five per cent used third party websites which customers could order from and pay directly; ten per cent had social media profiles that customers could order or buy goods from; 16 per cent had their own websites that could be used to make bookings or orders, without payment at the time; and six per cent used third party websites, where customers could make bookings or orders, without payment at the time.
Unregistered businesses were more likely to engage in e-commerce (30 per cent) than zero employee registered businesses (22 per cent). The proportion of unregistered businesses engaged in e-commerce was similar to that for SME employers (31 pe rcent).
Those in accommodation/food service (53 per cent), education (45 per cent), arts/ entertainment (44 per cent) and retail/wholesale (38 per cent) were the most likely sectors to be involved in e-commerce. Those in finance/real estate (12 per cent), primary (17 per cent), construction (17 per cent), other services (22 per cent) and professional/scientific (23 per cent) were less likely than average to engage in any form of e-commerce.
Orders directly from their own website were most common in accommodation/food service (25 per cent), retail/wholesale (21 per cent), information/communication (19 per cent) and education (18 per cent).
Bookings without payment at the time were most common in accommodation/food service (40 per cent), education (33 per cent), arts/entertainment (31 per cent) and transport/storage (26 per cent).
By nation, overall engagement with e-commerce was highest in Scotland (35 per cent) and lowest in Northern Ireland (19 per cent). This compared with 28 per cent in England and 24 per cent in Wales.
37

6. Access to external finance This section deals with the subject of business finance and access to external finance in particular.
Types of external finance currently being used
Around a fifth of all SMEs with no employees (21 per cent) had applied for external finance in the last five years. This compared with 33 per cent of all SME employers.
By sector, those in primary and transport/storage (both 32 per cent) were the most likely to have applied.
Thirty-six per cent of those that applied for external finance in the last five years were using credit cards at the time of interview, with a slightly higher proportion using bank overdrafts (39 per cent). Thirty per cent were using a loan from a bank or other financial institution. Eighteen per cent were using leasing or hire purchase, four per cent a commercial mortgage, four per cent equity finance, three per cent a grant or trust fund, and two per cent were using a peer to peer lending or a crowd funding platform for debt. One per cent were using factoring/invoicing discounting.
Table 6.1: Types of external finance currently being used – by registration and employer status
Businesses with no
employees that applied for external finance in
last 5 years
Registered businesses
with no employees that applied for external finance in
last 5 years
Unregistered businesses
with no employees that applied for external finance in
last 5 years
SME employers
that applied for external finance in
last 5 years
LSBS Y1 (2015) (n=) 1,025 634 391 4,482 % % % %
Bank overdraft 39 44 37 47 Credit cards 36 34 37 47 Loan from bank or other financial institution 30 31 30 35
Leasing/HP 18 22 16 37 Equity finance 4 8 2 7 Commercial mortgage 4 6 3 16 Grant/trust 3 2 3 4 P2P/crowd funding platform for debt 2 2 1 2
Factoring/invoice discounting 1 2 1 7
Base = all SMEs that applied for external finance in the last 5 years. Figures in bold were statistically significant at the 95% confidence level against the overall finding for all businesses with no employees (minus the sub-group tested). H6a. Multiple answers possible across this question.
38

Zero employee businesses were less likely than SME employers to use all forms of finance, with the exception of grants/trusts and P2P/crowd funding for debt. Registered zero employee businesses were more likely than unregistered businesses to be using bank overdrafts, leasing/hire purchase, equity finance and mortgages.
Different sectors use different types of external finance to suit their needs. Credit cards were most likely to be used in manufacturing (51 per cent), construction and professional/scientific (50 per cent) sectors.
Bank overdrafts were particularly likely to be used in primary (68 per cent), manufacturing (59 per cent) and construction (47 per cent).
Leasing/hire purchase was used most in primary (41 per cent), transport/storage (36 per cent), and education (33 per cent).
Mortgages were most used in accommodation/food services (33 per cent), financial/real estate (25 per cent) and primary (20 per cent).
Equity finance was most used in information/communication (15 per cent).
Whether sought external finance in the last 12 months
Nine per cent of SMEs with no employees had sought external finance in the 12 months preceding interview. This compared with 17 per cent of all SME employers. Registered zero employee businesses (11 per cent) were more likely than unregistered businesses (eight per cent) to have sought finance in this period.
Table 6.2: Whether sought external finance in the last 12 months – by registration and employer status
All businesses
with no employees
Registered businesses
with no employees
Unregistered businesses
with no employees
All SME employers
LSBS Y1 (2015) (n=) 4,355 2,473 1,882 11,147 % % % % YES - ANY 9 11 8 17
- Once 6 8 6 11 - More than once 3 3 2 6
NO 91 89 92 81
Base = all SMEs. Figures in bold were statistically significant at the 95% confidence level against the overall finding for all businesses with no employees (minus the sub-group tested). H4. Single answer only allowed at this question.
By sector, demand for external finance in the previous 12 months was highest in the primary (17 per cent) and retail/wholesale (12 per cent) sectors.
39

Reasons for applying for external finance
Of those that had applied for external finance in the last 12 months, 47 per cent had done so to acquire working capital or for cash flow reasons, 36 per cent to acquire capital equipment or vehicles, 10 per cent to buy land or buildings, six per cent to fund marketing, six per cent to fund research and development, five per cent to fund improving buildings and three per cent to fund expansion in the UK.
Table 6.3: Main reasons for seeking external finance in the last 12 months – by registration and employer status
Businesses with no
employees that sought
external finance in last year
Registered businesses
with no employees that sought
external finance in last year
Unregistered businesses
with no employees that sought
external finance in last year
SME employers that sought
external finance in last year
LSBS Y1 (2015) (n=) 446 289 157 2,437 % % % %
Working capital/cashflow 47 50 46 52 Acquiring capital equipment or vehicles 36 28 40 39
Buying land or buildings/building premises 10 16 7 14
Research & development 6 6 5 3 Marketing 6 5 6 3 Improving buildings 5 5 5 8 To fund UK expansion 3 6 2 9
Base = all SMEs that sought external finance in the last 12 months. Figures in bold were statistically significant at the 95% confidence level against the overall finding for all businesses with no employees (minus the sub-group tested). H8. Multiple answers possible across this question.
The sectors that had an above average demand for working capital were construction (65 per cent of those in this sector seeking external finance in the last year) and retail/ wholesale (60 per cent).
The primary (26 per cent) and accommodation/food service (42 per cent) sectors were the most likely to seek external finance to buy land or buildings.
Type of external finance sought
Forty-one per cent of SMEs with no employees that sought external finance in the previous 12 months applied for loans. Forty per cent applied for overdrafts (including extensions and renewals of existing facilities). Twenty per cent applied for credit cards and 18 per cent for leasing/HP.
40
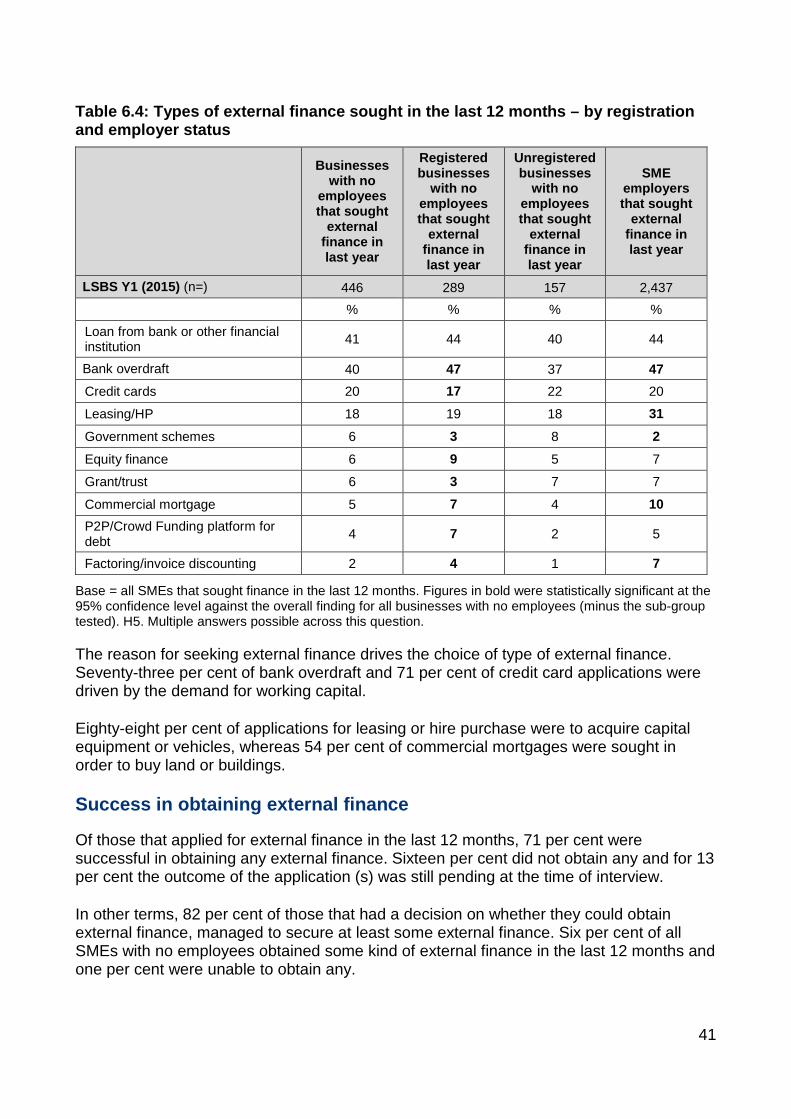
Table 6.4: Types of external finance sought in the last 12 months – by registration and employer status
Businesses with no
employees that sought
external finance in last year
Registered businesses
with no employees that sought
external finance in last year
Unregistered businesses
with no employees that sought
external finance in last year
SME employers that sought
external finance in last year
LSBS Y1 (2015) (n=) 446 289 157 2,437 % % % % Loan from bank or other financial institution 41 44 40 44
Bank overdraft 40 47 37 47 Credit cards 20 17 22 20
Leasing/HP 18 19 18 31 Government schemes 6 3 8 2 Equity finance 6 9 5 7
Grant/trust 6 3 7 7
Commercial mortgage 5 7 4 10 P2P/Crowd Funding platform for debt 4 7 2 5
Factoring/invoice discounting 2 4 1 7
Base = all SMEs that sought finance in the last 12 months. Figures in bold were statistically significant at the 95% confidence level against the overall finding for all businesses with no employees (minus the sub-group tested). H5. Multiple answers possible across this question.
The reason for seeking external finance drives the choice of type of external finance. Seventy-three per cent of bank overdraft and 71 per cent of credit card applications were driven by the demand for working capital.
Eighty-eight per cent of applications for leasing or hire purchase were to acquire capital equipment or vehicles, whereas 54 per cent of commercial mortgages were sought in order to buy land or buildings.
Success in obtaining external finance
Of those that applied for external finance in the last 12 months, 71 per cent were successful in obtaining any external finance. Sixteen per cent did not obtain any and for 13 per cent the outcome of the application (s) was still pending at the time of interview.
In other terms, 82 per cent of those that had a decision on whether they could obtain external finance, managed to secure at least some external finance. Six per cent of all SMEs with no employees obtained some kind of external finance in the last 12 months and one per cent were unable to obtain any.
41

Table 6.5: Whether obtained any external finance in the last 12 months – by registration and employer status
Businesses with no
employees that sought
external finance in last year
Registered businesses
with no employees that sought
external finance in last year
Unregistered businesses
with no employees that sought
external finance in last year
SME employers that sought
external finance in last year
LSBS Y1 (2015) (n=) 446 289 157 2,437 % % % %
Obtained any external finance 71 70 71 81 Did not obtain any 16 14 17 8 Decision pending 13 16 13 11
Base = all SMEs that sought finance in the last 12 months. Figures in bold were statistically significant at the 95% confidence level against the overall finding for all businesses with no employees (minus the sub-group tested). H5. Single answer only for this question.
Zero employee businesses were less able to obtain any finance than SME employers (81 per cent successful). There was no statistically significant difference in the proportion that were successful between registered and unregistered zero employee businesses.
By sector there were above average success rates in the primary sector (85 per cent of those that sought any in the last 12 months) and retail/wholesale (84 per cent). The least likely to have been successful were to be found in the sectors of information/ communication (60 per cent) and finance/real estate (61 per cent).
Amount of external finance obtained
Of those that obtained any external finance, 56 per cent gained less than £10,000 (compared with 18 per cent of SME employers that obtained any). Twenty-eight per cent obtained between £10,000 and £49,999, five per cent between £50,000 and £99,999, seven per cent between £100,000 and £499,999, less than half a per cent between £500,000 and £999,999 and two per cent £1 million or more. Two per cent did not know how much external finance had been gained or refused to say.
The mean average amount obtained was £63,000, which compared with £549,000 among SME employers.
The mean average is exaggerated by some instances of very high amounts obtained (eight applicants in the survey obtained £50 million or more. The median average is a better reflection of the amounts that SMEs typically obtain and this was £7,500 overall, which compared with £30,000 for SME employers.
42
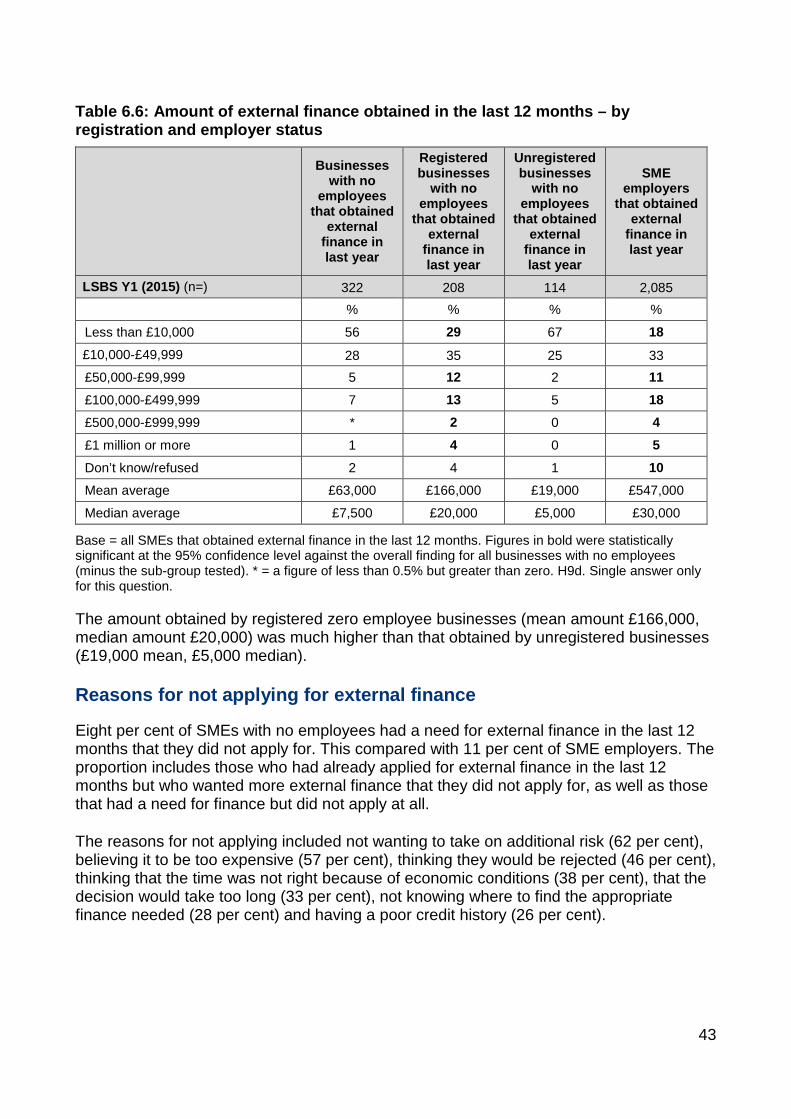
Table 6.6: Amount of external finance obtained in the last 12 months – by registration and employer status
Businesses with no
employees that obtained
external finance in last year
Registered businesses
with no employees
that obtained external
finance in last year
Unregistered businesses
with no employees
that obtained external
finance in last year
SME employers
that obtained external
finance in last year
LSBS Y1 (2015) (n=) 322 208 114 2,085 % % % %
Less than £10,000 56 29 67 18 £10,000-£49,999 28 35 25 33 £50,000-£99,999 5 12 2 11 £100,000-£499,999 7 13 5 18 £500,000-£999,999 * 2 0 4 £1 million or more 1 4 0 5 Don’t know/refused 2 4 1 10 Mean average £63,000 £166,000 £19,000 £547,000
Median average £7,500 £20,000 £5,000 £30,000
Base = all SMEs that obtained external finance in the last 12 months. Figures in bold were statistically significant at the 95% confidence level against the overall finding for all businesses with no employees (minus the sub-group tested). * = a figure of less than 0.5% but greater than zero. H9d. Single answer only for this question.
The amount obtained by registered zero employee businesses (mean amount £166,000, median amount £20,000) was much higher than that obtained by unregistered businesses (£19,000 mean, £5,000 median).
Reasons for not applying for external finance
Eight per cent of SMEs with no employees had a need for external finance in the last 12 months that they did not apply for. This compared with 11 per cent of SME employers. The proportion includes those who had already applied for external finance in the last 12 months but who wanted more external finance that they did not apply for, as well as those that had a need for finance but did not apply at all.
The reasons for not applying included not wanting to take on additional risk (62 per cent), believing it to be too expensive (57 per cent), thinking they would be rejected (46 per cent), thinking that the time was not right because of economic conditions (38 per cent), that the decision would take too long (33 per cent), not knowing where to find the appropriate finance needed (28 per cent) and having a poor credit history (26 per cent).
43
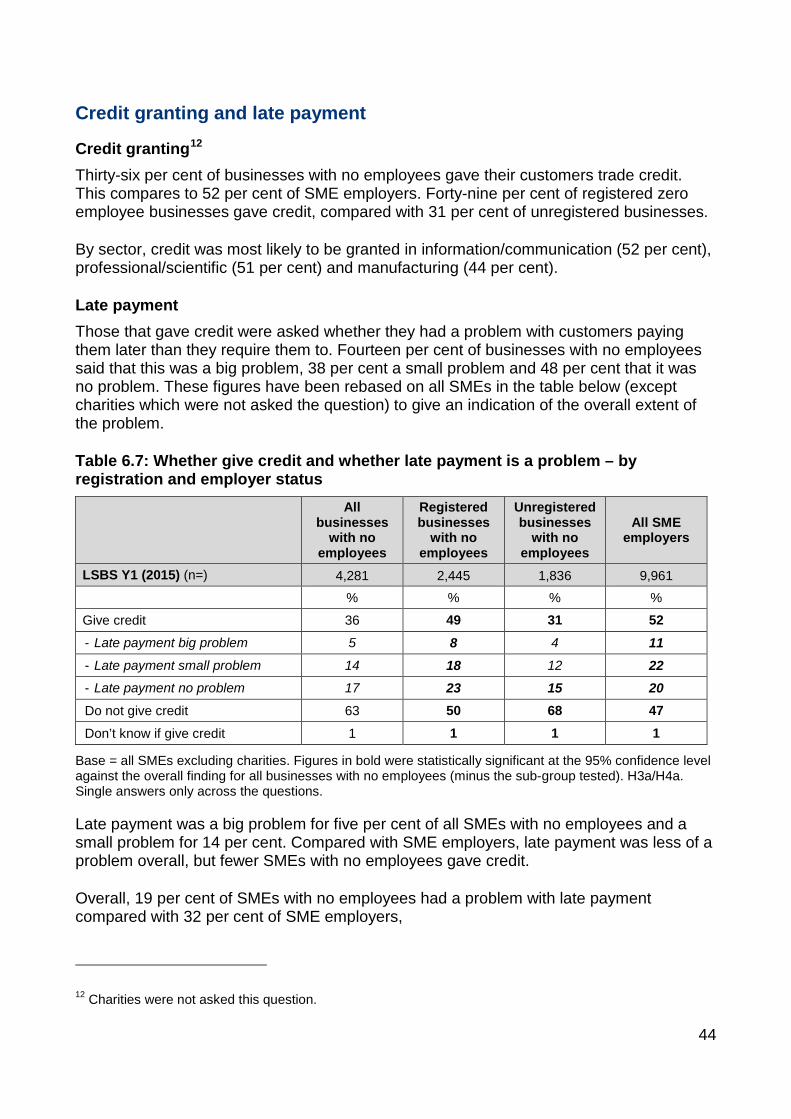
Credit granting and late payment
Credit granting12 Thirty-six per cent of businesses with no employees gave their customers trade credit. This compares to 52 per cent of SME employers. Forty-nine per cent of registered zero employee businesses gave credit, compared with 31 per cent of unregistered businesses.
By sector, credit was most likely to be granted in information/communication (52 per cent), professional/scientific (51 per cent) and manufacturing (44 per cent).
Late payment Those that gave credit were asked whether they had a problem with customers paying them later than they require them to. Fourteen per cent of businesses with no employees said that this was a big problem, 38 per cent a small problem and 48 per cent that it was no problem. These figures have been rebased on all SMEs in the table below (except charities which were not asked the question) to give an indication of the overall extent of the problem.
Table 6.7: Whether give credit and whether late payment is a problem – by registration and employer status
All businesses
with no employees
Registered businesses
with no employees
Unregistered businesses
with no employees
All SME employers
LSBS Y1 (2015) (n=) 4,281 2,445 1,836 9,961 % % % %
Give credit 36 49 31 52 - Late payment big problem 5 8 4 11 - Late payment small problem 14 18 12 22 - Late payment no problem 17 23 15 20 Do not give credit 63 50 68 47 Don’t know if give credit 1 1 1 1
Base = all SMEs excluding charities. Figures in bold were statistically significant at the 95% confidence level against the overall finding for all businesses with no employees (minus the sub-group tested). H3a/H4a. Single answers only across the questions.
Late payment was a big problem for five per cent of all SMEs with no employees and a small problem for 14 per cent. Compared with SME employers, late payment was less of a problem overall, but fewer SMEs with no employees gave credit.
Overall, 19 per cent of SMEs with no employees had a problem with late payment compared with 32 per cent of SME employers,
12 Charities were not asked this question.
44

Receipt of credit Forty-three per cent of SMEs with no employees receive trade credit from their suppliers. This compared with 69 per cent of SME employers.
Those most likely to be in receipt of credit were in the construction (72 per cent), manufacturing (68 per cent) and retail/wholesale (67 per cent) sectors. Less likely to receive credit were those in education (18 per cent), financial/real estate (22 per cent), transport/storage (22 per cent), accommodation/food services (22 per cent), arts/entertainment (24 per cent) and human health (29 per cent) sectors.
By nation, those in Northern Ireland were more likely to be in receipt of credit (56 per cent) than those in England (43 per cent), Wales (48 per cent) and Scotland (45 per cent).
Whether likely to approach external finance providers in the next three years
SMEs with no employees were asked how likely they would be to approach external finance providers in the next three years.
Fourteen per cent overall said it was likely (five per cent very likely, eight per cent fairly likely). This compared with a quarter of SME employers (25 per cent; 12 per cent very likely; 13 per cent fairly likely).
Table 6.8: Whether likely to approach external finance providers in the next three years – by registration and employer status
All businesses
with no employees
Registered businesses with no employees
Unregistered businesses with no employees
All SME employers
LSBS Y1 (2015) (n=) 4,355 2,473 1,882 11,147 % % % %
Likely 14 16 13 25
- Very likely 5 7 5 12
- Fairly likely 8 9 8 13
Not likely 85 83 86 73
- Not very likely 19 20 19 25
- Not at all likely 66 62 67 48
Don’t know 1 1 1 3
Base = all SMEs. Figures in bold were statistically significant at the 95% confidence level against the overall finding for all businesses with no employees (minus the sub-group tested). R2. Single answer only allowed at this question.
Registered zero employee businesses (16 per cent) were more likely than unregistered businesses (13 per cent) to think they would approach external finance providers in future.
By sector, those in the transport/storage (24 per cent), primary (22 per cent) and information/communication (18 per cent) sectors were more likely than average to think they would approach finance providers in the next three years.
45

7. Major obstacles to the success of the business
This section explores the obstacles that SMEs with no employees report as restricting their business success.
Major obstacles to the success of the business
Respondents were read a list of issues and asked which, if any, represented major obstacles to the success of their business. Overall, 44 per cent of businesses with no employees said that competition in the market was a major obstacle, 35 per cent said regulations/red tape, 27 per cent late payment, 26 per cent taxation (including VAT, PAYE, NI and rates), 17 per cent obtaining finance, 16 per cent the availability/cost of suitable premises, 13 per cent staff recruitment and skills, and seven per cent workplace pensions.
Table 7.1: Major obstacles to the success of the business – by registration and employer status
All businesses
with no employees
Registered businesses
with no employees
Unregistered businesses
with no employees
All SME employers
LSBS Y1 (2015) (n=) 4,355 2,473 1,882 11,147 % % % %
Competition in the market 44 47 43 49 Regulations/red tape 35 43 32 49 Late payment 27 33 25 33 Taxation, VAT, PAYE, NI, rates 26 35 23 43 Obtaining finance 17 19 17 22 Availability/cost of suitable premises 16 15 16 21
Staff recruitment and skills 13 17 11 32 Workplace pensions 7 10 7 23 Other spontaneous mentions 12 14 12 11
No obstacles 20 14 23 10
Base = all SMEs. Figures in bold were statistically significant at the 95% confidence level against the overall finding for all businesses with no employees (minus the sub-group tested). G2. Multiple answers allowed at this question.
In all instances, SME employers were more likely than businesses with no employees to consider these to be major obstacles. This was particularly likely to be the case for employment related tasks such as staff recruitment and skills, and workplace pensions.
Registered zero employee businesses were more likely than unregistered businesses to consider these tasks major obstacles. This was particularly the case with taxation (a major
46

obstacle to 35 per cent of registered zero employee businesses, and 23 per cent of unregistered businesses).
Competition was particularly likely to be a major obstacle for those in transport/storage (56 per cent), education (52 per cent), administrative services (52 per cent), retail/wholesale (50 per cent) and information/communication (50 per cent).
Regulations/red tape was more likely than average to be a major obstacle in primary (71 per cent), financial/real estate (60 per cent), transport/storage (42 per cent) and construction (40 per cent).
Late payment was more likely than average to be a major obstacle in the administrative services (37 per cent), professional/scientific (35 per cent), information/communication (34 per cent) and construction (34 per cent) sectors.
Retail/wholesale (37 per cent) and the primary sector (35 per cent) were more likely than other sectors to think taxation was a major obstacle.
Obtaining finance was particularly likely to be a major obstacle in the information/ communication (24 per cent) sector.
The availability and cost of suitable premises was more likely than average to be a major obstacle in retail/wholesale (28 per cent), manufacturing (26 per cent) and human health (24 per cent).
Regulations
Those that thought regulations and red tape were major obstacles were asked to name the regulations that particularly affected them.
Sector specific regulations (covering a wide variety of different regulations applicable to specific sectors) was mentioned by 17 per cent, tax-related regulations by 15 per cent, health and safety by 14 per cent, financial services regulations by nine per cent, employment regulations by eight per cent, Local Authority regulations by seven per cent, and both building/construction and planning regulations by six per cent.
Tax-related regulations were most likely to have been mentioned in information/ communication (31 per cent) and professional/scientific (20 per cent).
Health and safety regulations were most mentioned in construction (24 per cent).
Financial services regulations were mentioned by 43 per cent in the financial/real estate sector, and by 18 per cent in arts/education.
Employment regulations were mentioned by 17 per cent in retail/wholesale.
Local Authority regulations were mentioned by 22 per cent in transport/storage.
47
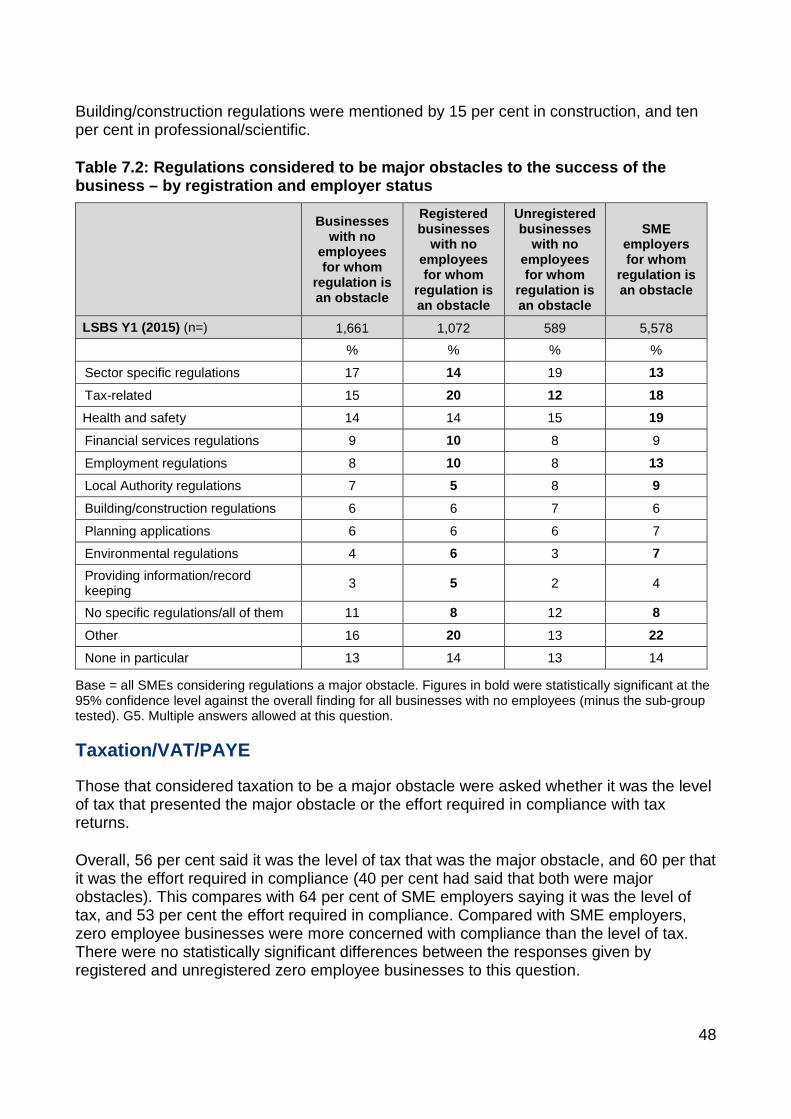
Building/construction regulations were mentioned by 15 per cent in construction, and ten per cent in professional/scientific.
Table 7.2: Regulations considered to be major obstacles to the success of the business – by registration and employer status
Businesses with no
employees for whom
regulation is an obstacle
Registered businesses
with no employees for whom
regulation is an obstacle
Unregistered businesses
with no employees for whom
regulation is an obstacle
SME employers for whom
regulation is an obstacle
LSBS Y1 (2015) (n=) 1,661 1,072 589 5,578 % % % %
Sector specific regulations 17 14 19 13 Tax-related 15 20 12 18 Health and safety 14 14 15 19 Financial services regulations 9 10 8 9
Employment regulations 8 10 8 13 Local Authority regulations 7 5 8 9 Building/construction regulations 6 6 7 6
Planning applications 6 6 6 7
Environmental regulations 4 6 3 7 Providing information/record keeping 3 5 2 4
No specific regulations/all of them 11 8 12 8 Other 16 20 13 22 None in particular 13 14 13 14
Base = all SMEs considering regulations a major obstacle. Figures in bold were statistically significant at the 95% confidence level against the overall finding for all businesses with no employees (minus the sub-group tested). G5. Multiple answers allowed at this question.
Taxation/VAT/PAYE
Those that considered taxation to be a major obstacle were asked whether it was the level of tax that presented the major obstacle or the effort required in compliance with tax returns.
Overall, 56 per cent said it was the level of tax that was the major obstacle, and 60 per that it was the effort required in compliance (40 per cent had said that both were major obstacles). This compares with 64 per cent of SME employers saying it was the level of tax, and 53 per cent the effort required in compliance. Compared with SME employers, zero employee businesses were more concerned with compliance than the level of tax. There were no statistically significant differences between the responses given by registered and unregistered zero employee businesses to this question.
48

The level of tax was most likely to be an issue in the retail/wholesale (67 per cent), primary (65 per cent) and information/communications (60 per cent) sectors. Compliance was most likely to have been an issue in professional/scientific (69 per cent).
49
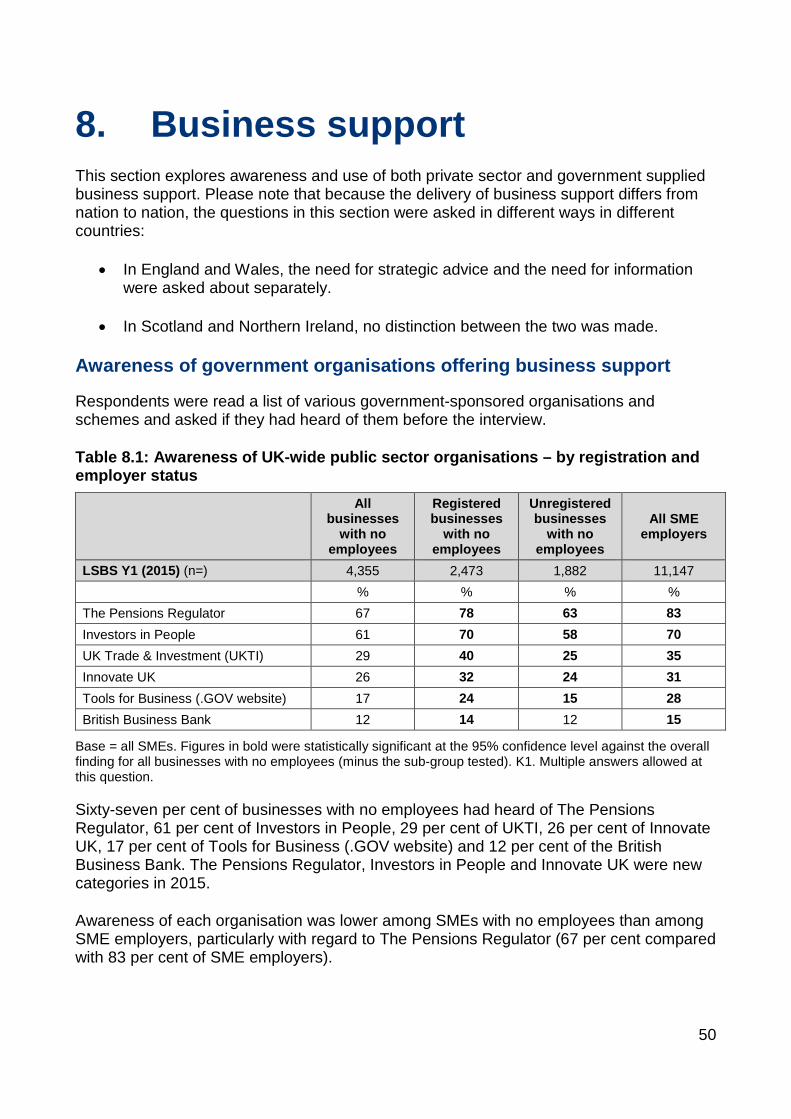
8. Business support This section explores awareness and use of both private sector and government supplied business support. Please note that because the delivery of business support differs from nation to nation, the questions in this section were asked in different ways in different countries:
• In England and Wales, the need for strategic advice and the need for information were asked about separately.
• In Scotland and Northern Ireland, no distinction between the two was made.
Awareness of government organisations offering business support
Respondents were read a list of various government-sponsored organisations and schemes and asked if they had heard of them before the interview.
Table 8.1: Awareness of UK-wide public sector organisations – by registration and employer status
All businesses
with no employees
Registered businesses
with no employees
Unregistered businesses
with no employees
All SME employers
LSBS Y1 (2015) (n=) 4,355 2,473 1,882 11,147 % % % % The Pensions Regulator 67 78 63 83 Investors in People 61 70 58 70 UK Trade & Investment (UKTI) 29 40 25 35 Innovate UK 26 32 24 31 Tools for Business (.GOV website) 17 24 15 28 British Business Bank 12 14 12 15
Base = all SMEs. Figures in bold were statistically significant at the 95% confidence level against the overall finding for all businesses with no employees (minus the sub-group tested). K1. Multiple answers allowed at this question.
Sixty-seven per cent of businesses with no employees had heard of The Pensions Regulator, 61 per cent of Investors in People, 29 per cent of UKTI, 26 per cent of Innovate UK, 17 per cent of Tools for Business (.GOV website) and 12 per cent of the British Business Bank. The Pensions Regulator, Investors in People and Innovate UK were new categories in 2015.
Awareness of each organisation was lower among SMEs with no employees than among SME employers, particularly with regard to The Pensions Regulator (67 per cent compared with 83 per cent of SME employers).
50

Registered businesses with no employees had higher awareness levels than unregistered businesses for all these organisations. The level of awareness for UKTI among registered businesses (40 per cent) was higher than its awareness for SME employers.
The sectors that were most likely to export had higher than average awareness of UKTI (information/ communication, 42 per cent; professional/scientific, 41 per cent).
Awareness of Innovate UK was higher than average in professional/scientific (37 per cent) and information/communication (34 per cent).
Awareness of the Tools for Business section of the .GOV website was higher than average in professional/scientific (24 per cent) and financial/real estate (also 24 per cent).
Awareness of the British Business Bank was higher than average in financial/real estate (20 per cent), retail/wholesale (18 per cent), and professional/scientific (16 per cent).
Awareness of government organisations offering business support – England and Wales
In addition to the UK-wide public sector organisations, zero employee businesses were asked if they had heard of organisations that operated on a country level rather than across the UK.
Growth Hubs Awareness of Growth Hubs was asked about in England only, for the first time in 2015.
Eleven per cent of zero employee businesses in England had heard of Growth Hubs. This was the case for 14 per cent of zero employee registered businesses, and nine per cent of unregistered businesses
Awareness was higher than average in information/communication (21 per cent) and professional/scientific (17 per cent).
Local Enterprise Partnerships (LEPs) Local Enterprise Partnerships (LEPs) were asked about in England only. Zero employee businesses were asked if they had heard of the main LEP in their area.
Forty-two per cent of zero employee businesses in England were aware of their own LEP. This proportion was the same for both registered and unregistered zero employee businesses.
Awareness of LEPs was above average in the accommodation/food service (55 per cent) and professional/scientific (53 per cent) sectors.
51

Awareness of government organisations offering business support – Scotland
The following is a summary of awareness levels of business support organisations among SMEs with no employees that operate in Scotland.
• Scottish Enterprise or Highland and Islands Enterprise: 92 per cent aware (compared with 93 per cent of SME employers).
• Business Gateway: 83 per cent aware (compared with 85 per cent of SME employers).
• Skills Development Scotland: 49 per cent aware (57 per cent of SME employers).
• Scottish Development International: 21 per cent aware (30 per cent of SME employers).
• Co-operative Development Scotland: 12 per cent aware (13 per cent of SME employers).
• Scottish Manufacturing Advice Service: 11 per cent aware (the same proportion as for SME employers).
Awareness of government organisations offering business support – Northern Ireland
The following is a summary of awareness levels of business support organisations among SMEs with no employees that operate in Northern Ireland.
• Invest Northern Ireland: 89 per cent aware (compared with 92 per cent of SME employers).
• Department for Employment and Learning: 80 per cent aware (81 per cent of SME employers).
• Department for Enterprise, Trade and Investment: 70 per cent aware (77 per cent of SME employers).
• NI Business info.co.uk: 57 per cent aware (56 per cent of SME employers).
• InterTrade Ireland: 34 per cent aware (41 per cent of SME employers).
52
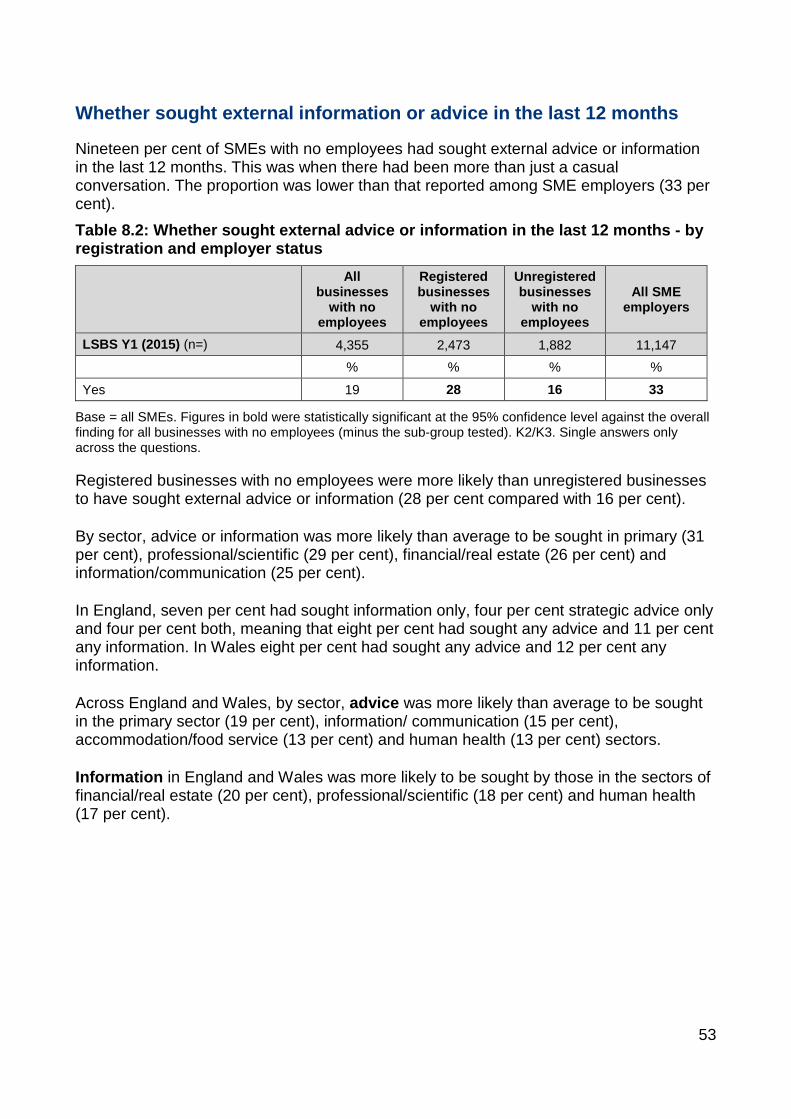
Whether sought external information or advice in the last 12 months
Nineteen per cent of SMEs with no employees had sought external advice or information in the last 12 months. This was when there had been more than just a casual conversation. The proportion was lower than that reported among SME employers (33 per cent). Table 8.2: Whether sought external advice or information in the last 12 months - by registration and employer status
All businesses
with no employees
Registered businesses
with no employees
Unregistered businesses
with no employees
All SME employers
LSBS Y1 (2015) (n=) 4,355 2,473 1,882 11,147 % % % %
Yes 19 28 16 33
Base = all SMEs. Figures in bold were statistically significant at the 95% confidence level against the overall finding for all businesses with no employees (minus the sub-group tested). K2/K3. Single answers only across the questions.
Registered businesses with no employees were more likely than unregistered businesses to have sought external advice or information (28 per cent compared with 16 per cent).
By sector, advice or information was more likely than average to be sought in primary (31 per cent), professional/scientific (29 per cent), financial/real estate (26 per cent) and information/communication (25 per cent).
In England, seven per cent had sought information only, four per cent strategic advice only and four per cent both, meaning that eight per cent had sought any advice and 11 per cent any information. In Wales eight per cent had sought any advice and 12 per cent any information.
Across England and Wales, by sector, advice was more likely than average to be sought in the primary sector (19 per cent), information/ communication (15 per cent), accommodation/food service (13 per cent) and human health (13 per cent) sectors.
Information in England and Wales was more likely to be sought by those in the sectors of financial/real estate (20 per cent), professional/scientific (18 per cent) and human health (17 per cent).
53

Type of information or advice sought (England and Wales)13
In England and Wales, advice was mainly sought for business growth (34 per cent), marketing (18 per cent), improving business efficiency and productivity (14 per cent) and financial advice for the general running of the business (also 14 per cent).
Table 8.3: What information or advice was sought for in the last twelve months – split by whether information or advice (England and Wales only)
No
employees - Advice
SME Employers -
Advice
No employees - Information
SME Employers - Information
LSBS Y1 (2015) (n=) 393 2,121 564 2,627 % % % %
Business growth 34 36 11 9
Marketing 18 10 6 4 Financial advice/info for general running of business 14 16 23 18
Improving business efficiency/productivity 14 18 6 5
E-commerce/technology 11 8 7 5
Regulations 6 5 9 7
Advice/info on where to get finance 6 8 4 5
Legal issues 5 7 8 10
Innovation 5 3 1 1
Exporting 5 2 1 2
Employment law/redundancies 5 10 3 12 Tax/national insurance law and payments 4 6 18 11
Training/skills needs 4 4 4 3
Management/leadership development 2 3 2 2
Health and safety 2 4 3 8
Relocation 2 1 1 *
Workplace pensions 1 6 3 8
Other 8 9 17 12
Don’t know 1 2 10 13
Base = all SMEs in England and Wales that received information or advice in the last 12 months. Figures in bold are statistically significant differences between figures for businesses with no employees, and SME employers. * = a figure greater than zero, but less than 0.5%. K4/K5. Multiple answers allowed at this question.
13 Because these sets of questions were asked differently according to country, the data is not comparable across the UK and only results from England and Wales are shown here.
54
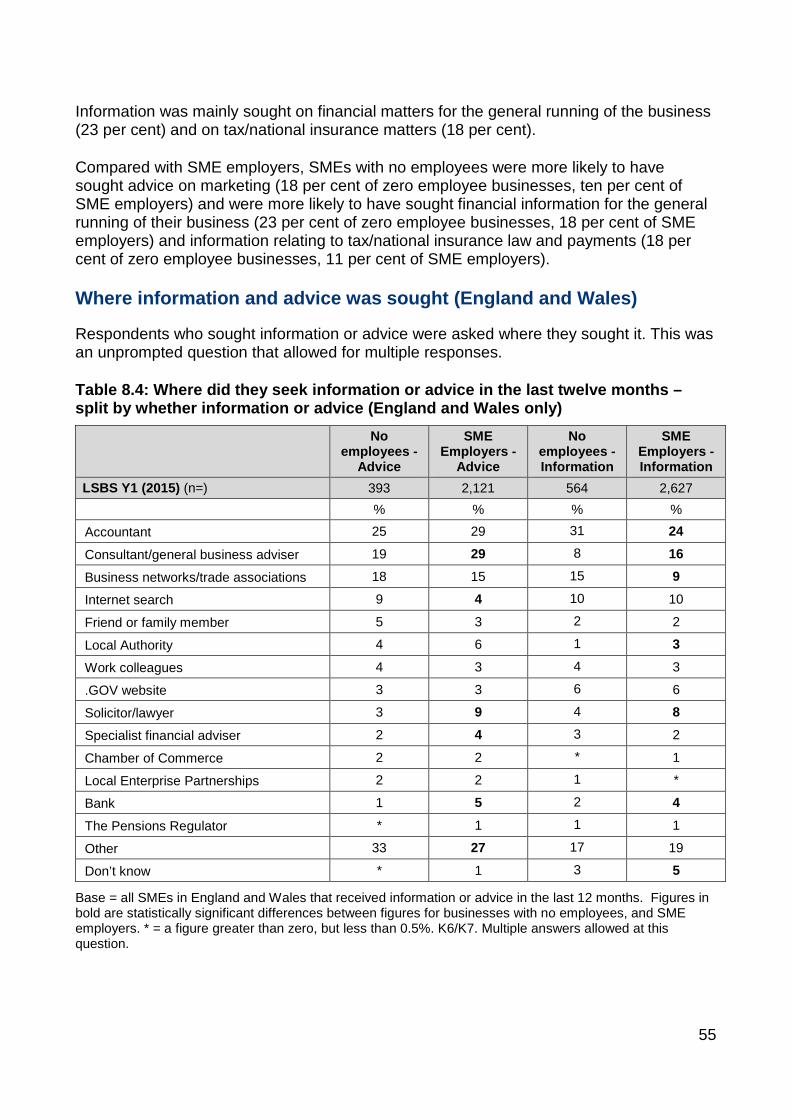
Information was mainly sought on financial matters for the general running of the business (23 per cent) and on tax/national insurance matters (18 per cent).
Compared with SME employers, SMEs with no employees were more likely to have sought advice on marketing (18 per cent of zero employee businesses, ten per cent of SME employers) and were more likely to have sought financial information for the general running of their business (23 per cent of zero employee businesses, 18 per cent of SME employers) and information relating to tax/national insurance law and payments (18 per cent of zero employee businesses, 11 per cent of SME employers).
Where information and advice was sought (England and Wales)
Respondents who sought information or advice were asked where they sought it. This was an unprompted question that allowed for multiple responses.
Table 8.4: Where did they seek information or advice in the last twelve months – split by whether information or advice (England and Wales only)
No
employees - Advice
SME Employers -
Advice
No employees - Information
SME Employers - Information
LSBS Y1 (2015) (n=) 393 2,121 564 2,627 % % % %
Accountant 25 29 31 24
Consultant/general business adviser 19 29 8 16
Business networks/trade associations 18 15 15 9
Internet search 9 4 10 10
Friend or family member 5 3 2 2
Local Authority 4 6 1 3
Work colleagues 4 3 4 3
.GOV website 3 3 6 6
Solicitor/lawyer 3 9 4 8
Specialist financial adviser 2 4 3 2
Chamber of Commerce 2 2 * 1
Local Enterprise Partnerships 2 2 1 *
Bank 1 5 2 4
The Pensions Regulator * 1 1 1
Other 33 27 17 19
Don’t know * 1 3 5
Base = all SMEs in England and Wales that received information or advice in the last 12 months. Figures in bold are statistically significant differences between figures for businesses with no employees, and SME employers. * = a figure greater than zero, but less than 0.5%. K6/K7. Multiple answers allowed at this question.
55

In the last 12 months, external advice was most frequently sought from an accountant (25 per cent of SMEs with no employees that sought advice). Around a fifth had sought advice from consultants/business advisers (19 per cent) and from business networks (18 per cent).
Those that had sought information were most likely to consult accountants (31 per cent). Fifteen per cent sought information from business networks, and ten per cent used internet searches.
Accountants were more likely than average to be used for advice by those in the accommodation/ food service (38 per cent), administrative service (37 per cent) and retail/wholesale (35 per cent) sectors.
How information or advice was delivered (England and Wales)
Table 8.5: How information or advice was mainly delivered – split by whether information or advice (England and Wales only)
No employees - Advice
SME Employers - Advice
No employees - Information
SME Employers - Information
LSBS Y1 (2015) (n=) 393 2,121 564 2,627 % % % %
Face to face 63 71 48 56
On the phone 13 10 17 17
Through a website 10 4 17 10
By email 9 9 13 9
Social media 1 1 1 1
Other 3 5 4 6
Base = all SMEs in England and Wales that received information or advice in the last 12 months. Figures in bold are statistically significant differences between figures for businesses with no employees, and SME employers. K9a/K9d. Single answer only allowed at this question.
Of SMEs with no employees that received advice in England and Wales in the previous 12 months, 63 per cent mainly received it face-to-face, 13 per cent over the phone, ten per cent through a website, nine per cent by email and one per cent via social media.
Information received was less likely than advice to have been delivered face to face (48 per cent) and was more likely to have been given over the phone or through a website (both 17 per cent).
Amount of advice received (England and Wales)
Thirty-one per cent of SMEs with no employees in England and Wales that received advice had up to three hours of advice in total, 45 per cent had up to three days and 23 per cent had three days or more.
56

SME employers were more likely to have received longer periods of advice; 22 per cent received up to three hours; 46 per cent up to three days and 31 per cent had three days or more.
Paying for advice (England and Wales)
Forty-seven per cent of those in England and Wales that received advice in the last 12 months paid for it. This compared with 65 per cent of SME employers. By sector, those in primary industries (74 per cent) and finance/real estate (77 per cent) were more likely than average to have paid.
Table 8.6: Whether paid for advice in the last 12 months and amount paid - by registration and employer status (England & Wales only)
All businesses
with no employees
Registered businesses
with no employees
Unregistered businesses
with no employees
All SME employers
LSBS Y1 (2015) (n=) 393 266 127 2,121 % % % %
Yes – paid for advice 47 56 43 65 - Under £500 18 14 21 11 - £500 - £999 6 10 4 9 - £1,000 - £2,499 13 15 12 14
- £2,500 - £4,999 3 4 2 8 - £5,000 - £9,999 2 3 2 8 - £10,000 - £49,999 2 5 1 7 - Over £50,000 1 2 0 3 - Don’t know how much
paid/refused to say 2 4 1 5
No – did not pay for advice 53 44 57 34 Mean average paid £2,800 £5,060 £1,350 £10,250
Median average paid £750 £1,000 £500 £2,000
Base = all SMEs in England and Wales that received information or advice in the last 12 months Figures in bold are statistically significant differences between figures for businesses with no employees, and SME employers. K12a/K12b/K12d. Single answers only across the questions.
The mean average paid by SMEs with no employees that paid for advice was just under £3,000, compared with the mean average of £10,250 paid by SME employers. However, because of some high sums paid, the median gives a better indication of the amounts that were typically paid by SMEs for advice. Overall, the median was £750 for zero employee businesses, compared with £2,000 paid by SME employers.
Registered zero employee businesses were more likely than the unregistered to have paid for advice, and those that did so tended to pay larger amounts (median £1,000, compared with £500 for unregistered businesses).
57
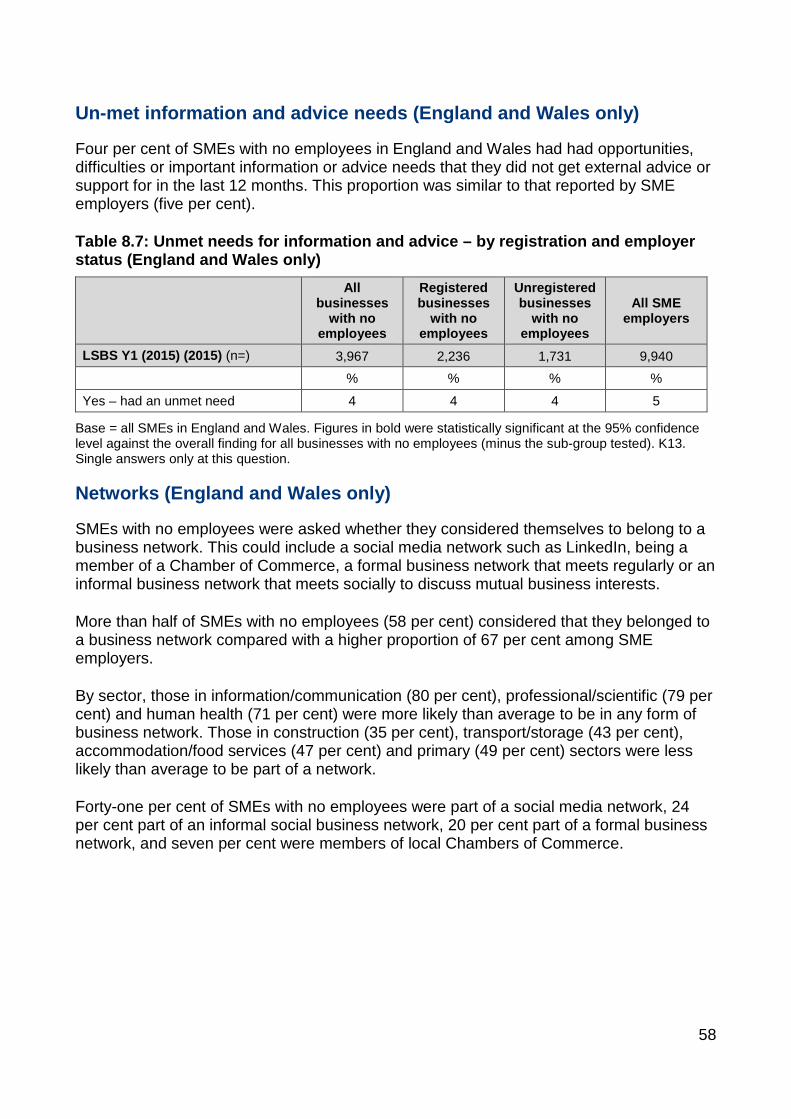
Un-met information and advice needs (England and Wales only)
Four per cent of SMEs with no employees in England and Wales had had opportunities, difficulties or important information or advice needs that they did not get external advice or support for in the last 12 months. This proportion was similar to that reported by SME employers (five per cent).
Table 8.7: Unmet needs for information and advice – by registration and employer status (England and Wales only)
All businesses
with no employees
Registered businesses
with no employees
Unregistered businesses
with no employees
All SME employers
LSBS Y1 (2015) (2015) (n=) 3,967 2,236 1,731 9,940 % % % %
Yes – had an unmet need 4 4 4 5
Base = all SMEs in England and Wales. Figures in bold were statistically significant at the 95% confidence level against the overall finding for all businesses with no employees (minus the sub-group tested). K13. Single answers only at this question.
Networks (England and Wales only)
SMEs with no employees were asked whether they considered themselves to belong to a business network. This could include a social media network such as LinkedIn, being a member of a Chamber of Commerce, a formal business network that meets regularly or an informal business network that meets socially to discuss mutual business interests.
More than half of SMEs with no employees (58 per cent) considered that they belonged to a business network compared with a higher proportion of 67 per cent among SME employers.
By sector, those in information/communication (80 per cent), professional/scientific (79 per cent) and human health (71 per cent) were more likely than average to be in any form of business network. Those in construction (35 per cent), transport/storage (43 per cent), accommodation/food services (47 per cent) and primary (49 per cent) sectors were less likely than average to be part of a network.
Forty-one per cent of SMEs with no employees were part of a social media network, 24 per cent part of an informal social business network, 20 per cent part of a formal business network, and seven per cent were members of local Chambers of Commerce.
58
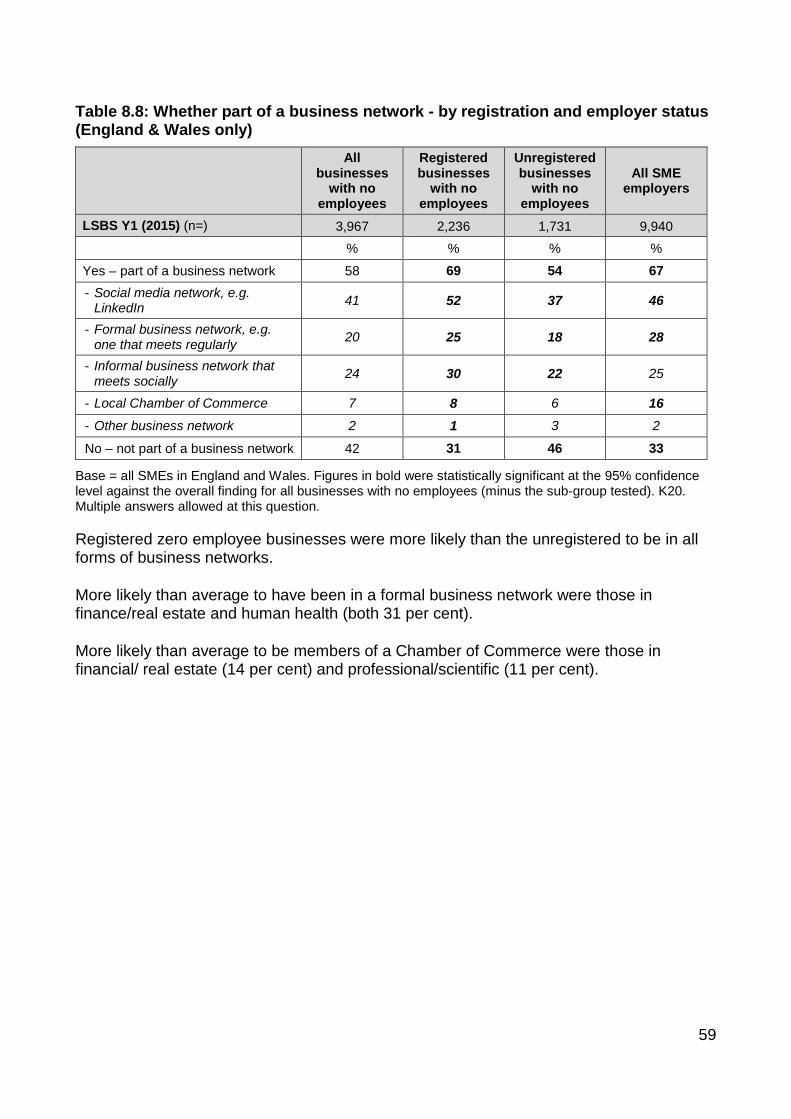
Table 8.8: Whether part of a business network - by registration and employer status (England & Wales only)
All businesses
with no employees
Registered businesses
with no employees
Unregistered businesses
with no employees
All SME employers
LSBS Y1 (2015) (n=) 3,967 2,236 1,731 9,940 % % % %
Yes – part of a business network 58 69 54 67 - Social media network, e.g.
LinkedIn 41 52 37 46
- Formal business network, e.g. one that meets regularly 20 25 18 28
- Informal business network that meets socially 24 30 22 25
- Local Chamber of Commerce 7 8 6 16 - Other business network 2 1 3 2
No – not part of a business network 42 31 46 33
Base = all SMEs in England and Wales. Figures in bold were statistically significant at the 95% confidence level against the overall finding for all businesses with no employees (minus the sub-group tested). K20. Multiple answers allowed at this question.
Registered zero employee businesses were more likely than the unregistered to be in all forms of business networks.
More likely than average to have been in a formal business network were those in finance/real estate and human health (both 31 per cent).
More likely than average to be members of a Chamber of Commerce were those in financial/ real estate (14 per cent) and professional/scientific (11 per cent).
59
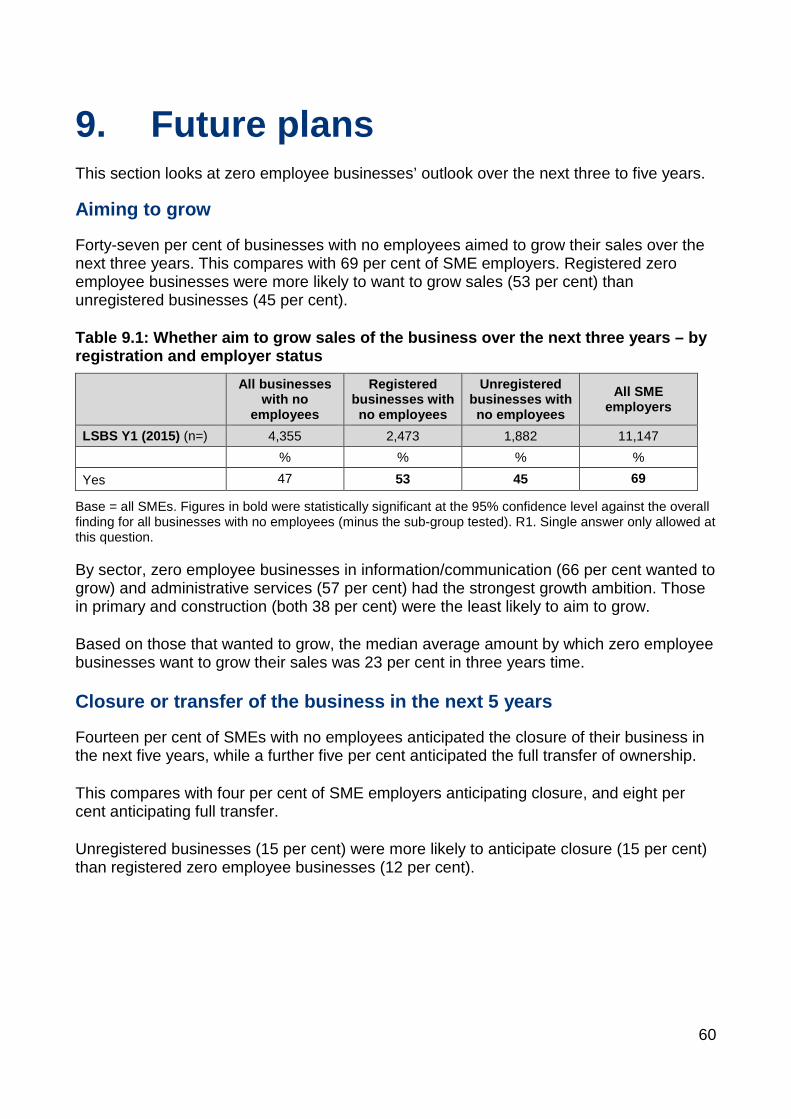
9. Future plans This section looks at zero employee businesses’ outlook over the next three to five years.
Aiming to grow
Forty-seven per cent of businesses with no employees aimed to grow their sales over the next three years. This compares with 69 per cent of SME employers. Registered zero employee businesses were more likely to want to grow sales (53 per cent) than unregistered businesses (45 per cent).
Table 9.1: Whether aim to grow sales of the business over the next three years – by registration and employer status
All businesses
with no employees
Registered businesses with no employees
Unregistered businesses with no employees
All SME employers
LSBS Y1 (2015) (n=) 4,355 2,473 1,882 11,147 % % % %
Yes 47 53 45 69
Base = all SMEs. Figures in bold were statistically significant at the 95% confidence level against the overall finding for all businesses with no employees (minus the sub-group tested). R1. Single answer only allowed at this question.
By sector, zero employee businesses in information/communication (66 per cent wanted to grow) and administrative services (57 per cent) had the strongest growth ambition. Those in primary and construction (both 38 per cent) were the least likely to aim to grow.
Based on those that wanted to grow, the median average amount by which zero employee businesses want to grow their sales was 23 per cent in three years time.
Closure or transfer of the business in the next 5 years
Fourteen per cent of SMEs with no employees anticipated the closure of their business in the next five years, while a further five per cent anticipated the full transfer of ownership.
This compares with four per cent of SME employers anticipating closure, and eight per cent anticipating full transfer.
Unregistered businesses (15 per cent) were more likely to anticipate closure (15 per cent) than registered zero employee businesses (12 per cent).
60

Table 9.2: Plans for closure or transfer of business in the next 5 years – by registration and employer status
All businesses
with no employees
Registered businesses
with no employees
Unregistered businesses
with no employees
All SME employers
LSBS Y1 (2015) (n=) 4,355 2,473 1,882 11,147 % % % % Yes – anticipate closure 14 12 15 4 Yes – anticipate full transfer 5 5 4 8 Neither 77 79 76 84 Don’t know 4 4 5 4
Base = all SMEs. Figures in bold were statistically significant at the 95% confidence level against the overall finding for all businesses with no employees (minus the sub-group tested). R3. Single answer only allowed at this question.
By sector, those most likely to anticipate closure were those in professional/scientific (18 per cent). Most likely to anticipate transfer of ownership were those in accommodation/ food service (12 per cent) and other services (seven per cent).
Of those zero employee businesses that anticipate the transfer of ownership, 13 per cent thought ownership would pass partly or wholly to somebody within their own family, 81 per cent to somebody else, while six per cent did not know.
Ways in which business plans to grow over the next three years
Zero employee businesses were asked whether they planned to do any of five growth-related activities over the next three years.
Forty per cent said they planned to increase the skills of the workforce. This refers to the skills of the respondent themselves, or other partners/owners who are not counted as employees in this survey. This proportion compared with 70 per cent of SME employers.
Thirty-two per cent of zero employee businesses planned to develop and launch new products and services, compared to 47 per cent of SME employers.
Twenty-eight per cent planned to introduce new working practices (49 per cent of SME employers), 24 per cent planned to make capital investment (40 per cent of SME employers) and 17 per cent planned to increase the leadership of their managers (44 per cent of SME employers).
Registered zero employee businesses were more likely to plan to do all of these activities than unregistered businesses.
61

Table 9.3: Whether business plans to grow in any of the following ways over the next three years – by registration and employer status
All businesses
with no employees
Registered businesses with no employees
Unregistered businesses with no employees
All SME employers
LSBS Y1 (2015) (n=) 4,355 2,473 1,882 11,147
% % % % Increase skills of the owners 40 46 38 70
Develop and launch new products/ services 32 37 30 47
Introduce new working practices 28 32 27 49
Capital investment (in premises, machinery etc.)
24 28 23 40
Increase the leadership capability of managers 17 24 15 44
Base = all SMEs. Figures in bold were statistically significant at the 95% confidence level against the overall finding for all businesses with no employees (minus the sub-group tested). R4. Multiple answers allowed at this question.
Most likely to want to increase the skills of the owners were those in information/ communication (67 per cent), human health (56 per cent), and professional/scientific (48 per cent).
Most likely to develop and introduce new products and services were those in information/ communication (60 per cent), manufacturing (47 per cent), arts/entertainment (41 per cent), retail/wholesale (38 per cent), administrative services (38 per cent) and professional/ scientific (36 per cent).
More likely than average to want to introduce new working practices were those in the information/communication (39 per cent) and human health (36 per cent) sectors.
Most likely to plan to make capital investments were those in the primary sector (47 per cent) and information/communications (35 per cent).
More likely than average to want to increase leadership capability were those in the professional/scientific (21 per cent) sector.
62

10. Glossary Most common sub-sectors in broad sector categories
The following table illustrates the most common sub-sectors within the broader sector categories analysed within this report. Data is based upon the 2015 BPE on businesses with no employees, rather than all SMEs or all businesses.
Table 10.1: Breakdown of most common sub-sectors within sector groupings (SIC 2007 – 2 digits14) – SMEs with no employees
Broad sector (SIC 2007)
UK zero employee population
Largest sub-sector
2nd largest sub-sector
3rd largest sub-sector Notes
ABDE Primary (01-09, 35-39) 121,995 Agriculture (01)
– 87,750 (72%)
Forestry & logging (02) – 8,895 (7%)
Utilities supply (35) – 8,150 (7%)
Dominated by farming
C Manufacturing (10-33) 187,595
Repair /installation of machinery (33) – 22,335 (12%)
Other’ manufacturing (32) – 21,020 (11%)
Fabricated metal manufacturing (25) – 18,495 (10%)
Many different categories for manufacturers
F Construction (41-43) 801,880
Specialised construction (43) – 469,335 (59%)
Construction of buildings (41) – 296,635 (37%)
Civil engineering (42) – 35,905 (4%)
Specialised construction includes electrical, plumbing, demolition etc.
G Wholesale/ Retail (45-47) 279,595 Retail (47) –
146,330 (59%) Wholesale (46) – 76,145 (27%)
Motor trade (45) – 57,120 (20%)
H Transport/ Storage (49-53) 237,020
Land transport (49) – 193,015 (81%)
Postal/courier (53) –28,750 (12%)
Warehousing (52) – 12,855 (5%)
Dominated by land transport - mainly lorry and taxi drivers
I Accommodation/ Food (55-56)
54,485 Food and drink (56) – 28,580 (52%)
Accomm-odation (55) – 25,905 (48%)
n/a
J Information/ Communication (58-63)
265,870
Computer programming & consultancy (62) – 155,450 (58%)
Film, TV, music (59) – 40,450 (15%)
Publishing (58) – 39,975 (15%)
Dominated by computing and software
KL Financial/ Real Estate (64-68)
128,240 Real estate (68) – 64,395 (50%)
Auxiliary financial services (66) – 31,600 (25%)
Non-insurance/ pension financial services (64) – 28,650 (22%)
Financial accounts for half – mainly IFAs/brokers
M Professional/ Scientific (69-75)
611,290 Consultancy (70) - 186,255 (30%)
‘Other’ professional/ scientific (71) – 143,170 (23%)
Architecture/ engineering (71) – 120,530 (20%)
Contains a number of distinct categories
14 The BPE does not show a breakdown for non-employers to below the two digit level.
63

Table 10.1: Breakdown of most common sub-sectors within sector groupings (SIC 2007 – 2 digits) – SMEs with no employees (continued)
Broad sector (SIC 2007)
UK zero employee population
Largest sub-sector
2nd largest sub-sector
3rd largest sub-sector Notes
N Administrative/ Support (77-82)
335,790 Building/ landscape services (81) – 232,700 (69%)
Office administrative services and ‘other’ services (82) – 48,270 (14%)
Employment activities (78) – 15,370 (5%)
Sector includes gardeners and head hunters. The coding of ‘other’ business services can be suspect.
P Education (85) 248,575 n/a n/a n/a No sub-sector analysis available
Q Human health(86-88) 308,370
Human health (86) -170,650 (55%)
Social work without accommodation (88) – 109,610 (36%)
Residential care (87) – 28,110 (9%)
Includes consultant doctors and dentists
R Arts/ Entertainment (90-93)
243,330 Creative & arts (90) – 153,800 (63%)
Sports & recreation (93) – 83,060 (34%)
Other cultural (91) – 4,830 (2%)
Mainly creative and arts
S Other Service (94-96) 253,550
‘Other’ personal services (96) – 175,305 (69%)
Membership organisations (94) – 44,860 (18%)
Repair of personal goods (95) – 33,380 (13%)
Other personal includes hairdressers and beauticians
64
© Crown copyright 2016 This publication is licensed under the terms of the Open Government Licence v3.0 except where otherwise stated. To view this licence, visit nationalarchives.gov.uk/doc/open-government-licence/version/3 or write to the Information Policy Team, The National Archives, Kew, London TW9 4DU or email: [email protected]. Where we have identified any third party copyright information you will need to obtain permission from the copyright holders concerned. This publication available from www.gov.uk/bis Contacts us if you have any enquiries about this publication, including requests for alternative formats, at: Department for Business, Innovation and Skills 1 Victoria Street London SW1H 0ET Tel: 020 7215 5000 Email: [email protected] BIS/16/226