Embed Size (px)
Citation preview

Technical Report Documentation Page 1. Report No. FHWA/TX-09/0-6069-1
2. Government Accession No.
3. Recipient's Catalog No.
4. Title and Subtitle LONG-TERM PERFORMANCE OF GFRP REINFORCEMENT: TECHNICAL REPORT
5. Report Date February 2009 Published: December 2009
6. Performing Organization Code
7. Author(s) David Trejo, Paolo Gardoni, Jeong Joo Kim, and Jason Zidek
8. Performing Organization Report No. Report 0-6069-1
9. Performing Organization Name and Address Texas Transportation Institute The Texas A&M University System College Station, Texas 77843-3135
10. Work Unit No. (TRAIS) 11. Contract or Grant No. Project 0-6069
12. Sponsoring Agency Name and Address Texas Department of Transportation Research and Technology Implementation Office P. O. Box 5080 Austin, Texas 78763-5080
13. Type of Report and Period Covered Technical Report: September 2007 – August 2008 14. Sponsoring Agency Code
15. Supplementary Notes Project performed in cooperation with the Texas Department of Transportation and the Federal Highway Administration. Project Title: Long-Term Performance of GFRP Reinforcement URL: http://tti.tamu.edu/documents/0-6069-1.pdf 16. Abstract Significant research has been performed on glass fiber-reinforced polymer (GFRP) concrete reinforcement. This research has shown that GFRP reinforcement exhibits high strengths, is lightweight, can decrease time of construction, and is corrosion resistant. Regarding the corrosion resistance, research has shown that the chemical reactions that occur in GFRP bars do not result in expansive products—products that can damage the concrete surrounding the reinforcement. Although not classical steel corrosion, much research that has been performed shows that GFRP reinforcing bars do corrode, reducing the tensile capacity of the GFRP reinforcing bars as a function of time. The American Concrete Institute (ACI) recognized this and places a reduction factor on the allowable design strength of GFRP reinforcing bars. A drawback of the majority of the research is that GFRP reinforcing bars have typically been directly exposed to aggressive solutions, exposure conditions possibly not similar to the exposure they would encounter while embedded in concrete. Limited research has been performed evaluating the tensile capacity reduction of bars embedded in concrete; however, these bars were only exposed for relatively short durations.
This research investigated the characteristics of GFRP reinforcing bars embedded in concrete for 7 years and exposed to a mean annual temperature of 69 oF (23 oC) and an average precipitation of 39.7 inches (1008 mm), fairly evenly distributed throughout the year. Three manufacturers provided #5 and #6 bars for this research. Results indicate that GFRP reinforcing bars do exhibit reduced capacities when embedded in concrete. A model was developed to assess the tensile capacity of bars embedded in concrete. The model was based on a general diffusion model, where diffusion of water or ions penetrate the bar matrix and degrade the glass fibers. The model is dependent on time, diffusion characteristics of the matrix material, and the radius of the GFRP reinforcing bar. The model indicates that GFRP reinforcement bars with larger diameters exhibit lower rates of capacity loss. However, the times required for the tensile capacity of the GFRP bars to drop below the ACI design requirements for #3, #5, and #6 bars were less than 6 years. Further research is needed to determine how this will affect the design of GFRP-reinforced concrete structures; however, consideration of changing the ACI design requirement may be warranted. 17. Key Words Glass, Fiber-Reinforcement, Glass Fiber-Reinforced Polymer, Polymer, Durability, Deterioration, Service Life, Concrete Reinforcement
18. Distribution Statement No restrictions. This document is available to the public through NTIS: National Technical Information Service Springfield, Virginia 22161 http://www.ntis.gov
19. Security Classif.(of this report) Unclassified
20. Security Classif.(of this page) Unclassified
21. No. of Pages 140
22. Price
Form DOT F 1700.7 (8-72) Reproduction of completed page authorized


LONG-TERM PERFORMANCE OF GFRP REINFORCEMENT: TECHNICAL REPORT
by
David Trejo, Ph.D., P.E. Associate Research Engineer
Paolo Gardoni, Ph.D.
Assistant Research Engineer
Jeong Joo Kim Graduate Student Researcher
Jason Zidek
Undergraduate Student Researcher
Zachry Department of Civil Engineering Texas A&M University
Report 0-6069-1 Project 0-6069
Project Title: Long-Term Performance of GFRP Reinforcement
Performed in cooperation with the Texas Department of Transportation
and the Federal Highway Administration
February 2009
Published: December 2009
TEXAS TRANSPORTATION INSTITUTE The Texas A&M University System College Station, Texas 77843-3135


TxDOT 0-6069-1 Long-term performance of GFRP reinforcement
v
DISCLAIMER
The contents of this report reflect the views of the authors, who are responsible for the
facts and accuracy of the data herein. The contents do not necessarily reflect the official view or
policies of the Federal Highway Administration (FHWA) or the Texas Department of
Transportation (TxDOT). This report does not constitute a standard, specification, or regulation.
The researcher in charge was David Trejo, P.E. #93490.
The United States Government and the State of Texas do not endorse products or
manufacturers. Trade or manufacturers’ names appear herein solely because they are considered
essential to the objective of this report.

TxDOT 0-6069-1 Long-term performance of GFRP reinforcement
vi

TxDOT 0-6069-1 Long-term performance of GFRP reinforcement
vii
ACKNOWLEDGMENTS
This project was conducted in cooperation with TxDOT and FHWA. The researchers
would like to gratefully acknowledge the assistance provided by TxDOT officials, in particular,
Timothy Bradberry, David Hohmann, and German Claros. The assistance on the original GFRP
project (9-1520) from Doug Gremel and Sam Steere was very much appreciated. The assistance
of Matt Potter of the High Bay Structural and Materials Laboratory is always very much
appreciated. The authors also appreciate the help of Paul Mostella and Brad Shinpaugh, students
who contributed to the project.
TxDOT 0-6069-1 Long-term performance of GFRP reinforcement
viii

TxDOT 0-6069-1 Long-term performance of GFRP reinforcement
ix
TABLE OF CONTENTS
Page
LIST OF FIGURES ..................................................................................................................... xi
LIST OF TABLES .......................................................................................................................xv
1. INTRODUCTION AND RESEARCH SIGNIFICANCE ....................................................1
2. LITERATURE REVIEW .......................................................................................................5
2.1. GFRP REINFORCING BAR PERFORMANCE: SOLUTION EXPOSURE .....................................5
2.2. GFRP REINFORCING BAR PERFORMANCE: BARS EMBEDDED IN CONCRETE ....................12
2.3. PREDICTION MODELS FOR LONG-TERM PERFORMANCE ..................................................15
2.3.1. Models from the Literature .................................................................................16
2.4. TENSILE STRENGTH DESIGN REQUIREMENTS ...................................................................20
3. MATERIALS .........................................................................................................................21
3.1. CONCRETE USED IN TXDOT PROJECT 9-1520 .................................................................23
3.2. GFRP CHARACTERIZATION – POST-EXTRACTION ...........................................................24
3.2.1. GFRP Characterization – Post-Exposure ............................................................24
3.2.1.1. Scanning Electron Microscopy and Energy Dispersive X-ray Analyses ...............................................................................................24
3.2.1.2. Thermogravimetric Analyses ...............................................................25
3.3. CONCRETE CHARACTERIZATION – POST-EXTRACTION ....................................................25
3.3.1. Alkalinity of Concrete Pore Solution ..................................................................25
3.3.2. Permeable Voids in Concrete ..............................................................................27
3.4. SUMMARY ........................................................................................................................29
4. EXPERIMENTAL PROGRAM AND PROCEDURES .....................................................31
4.1. ANALYSIS OF LOAD CONDITIONS FROM PREVIOUS TESTING ............................................31
4.2. GFRP BAR EXTRACTION .................................................................................................34
4.2.1. GFRP Bar Inspection ..........................................................................................35
TxDOT 0-6069-1 Long-term performance of GFRP reinforcement
x
4.3. TEST PROCEDURES ...........................................................................................................37
4.3.1. Tensile Tests .......................................................................................................37
4.3.2. Modulus of Elasticity Tests ................................................................................38
5. RESULTS AND DISCUSSION ............................................................................................41
5.1. TENSION TEST RESULTS ...................................................................................................41
5.1.1. Potential Influence of Beam Storage Position on GFRP Bar Tensile Capacity ..............................................................................................................46
5.1.2. Potential Influence of Depth of Cover on GFRP Bar Tensile Capacity .............47
5.1.3. Potential Influence of Concrete Alkalinity on GFRP Bar Tensile Capacity ..............................................................................................................48
5.1.4. Potential Influence of Concrete Porosity on GFRP Bar Tensile Capacity .........50
5.2. MODULUS OF ELASTICITY TEST RESULTS ........................................................................51
5.3. SUMMARY ........................................................................................................................52
6. TIME-VARIANT CAPACITY MODEL FOR GFRP BARS EMBEDDED IN CONCRETE ...........................................................................................................................53
6.1 FORMULATION OF THE PROBABILISTIC PREDICTION MODEL............................................53
6.2 BAYESIAN PARAMETER ESTIMATION ...............................................................................54
6.3 PROBABILITY OF NOT MEETING DESIGN SPECIFICATIONS OVER TIME .............................59
7. SUMMARY AND CONCLUSIONS ....................................................................................65
REFERENCES .............................................................................................................................67
APPENDIX A – T-TEST RESULTS FOR MODULUS OF ELASTICITY(MOE) ..............71
APPENDIX B – BEAM CARDS ................................................................................................79
APPENDIX C – MODULUS OF ELASTICITY (MOE) TEST RESULTS .........................117

TxDOT 0-6069-1 Long-term performance of GFRP reinforcement
xi
LIST OF FIGURES
Figure 3-1. Surface of GFRP Bar Types P, V1, and V2. ..............................................................22
Figure 3-2. Cross-section Views of GFRP Bar Types P, V1, and V2. .........................................22
Figure 3-3. pH Results from Concrete Beams. .............................................................................27
Figure 3-4. Volume of Permeable Voids for Concrete with All Bar Types. .................................29
Figure 4-1. (a) Bar Layout; (b) Beam Loading (after Trejo et al., 2005). ....................................33
Figure 4-2. Extracted Bars. ...........................................................................................................35
Figure 4-3. Example of Information Collected on Beam Cards. ..................................................37
Figure 4-4. (a) LVDT Being Attached to GFRP Bar before Testing; (b) Close-up of LVDT Device. ......................................................................................................................39
Figure 5-1. Tensile Capacities of GFRP Bars with and without Exposure in Concrete. ..............42
Figure 5-2. Storage Positions of GFRP-Reinforced Beams..........................................................46
Figure 5-3. Comparison of Capacities of Bars Stored at Different Locations. .............................47
Figure 5-4. Influence of Cover Depth on Bar Capacity. ...............................................................48
Figure 5-5. GFRP Bar Capacity as a Function of Concrete Pore Solution Alkalinity. .................49
Figure 5-6. Tensile Capacity as a Function of Concrete Porosity. ...............................................50
Figure 5-7. MOE as a Function of Time and Cover Depth (Note: All samples except the “no exposure” samples were embedded in concrete for 7 years). ...................................52
Figure 6-1. Comparison between the Predicted and Measured Normalized Stress 0
/t over
Time. .........................................................................................................................58
Figure 6-2. Values of t and 0R̂ for which 0 0,[ / ] ( ) /t E u aveE C f k for 3, ,6k . ....58
Figure 6-3. Conceptual Plot of the Probability of Not Meeting ACI 440 Specification as a Function of Time and Bar Size. ................................................................................60
Figure 6-4. Probability of Not Meeting ACI 440 Specifications as a Function of t for #6 Bars (solid line), #5 Bars (dashed line), and #3 Bars (dotted line). ..................................62

TxDOT 0-6069-1 Long-term performance of GFRP reinforcement
xii
Figure 6-5. Probability of Not Meeting ACI 440 Specification as a Function of 0R̂ for 25t
years (solid line), 50t years (dashed line), 75t years (dashed-dotted line), and 100t years (dotted line). .......................................................................................62
Figure 6-6. Contour Lines for the Probability of Not Meeting ACI 440 as a Function of t and
the 0R̂ . .......................................................................................................................63
Figure B-1 Beam Card #1 .............................................................................................................81
Figure B-2 Beam Card #2 .............................................................................................................82
Figure B-3 Beam Card #3 .............................................................................................................83
Figure B-4 Beam Card #4 .............................................................................................................84
Figure B-5 Beam Card #5 .............................................................................................................85
Figure B-6 Beam Card #6 .............................................................................................................86
Figure B-7 Beam Card #7 .............................................................................................................87
Figure B-8 Beam Card #8 .............................................................................................................88
Figure B-9 Beam Card #9 .............................................................................................................89
Figure B-10 Beam Card #10 .........................................................................................................90
Figure B-11 Beam Card #11 .........................................................................................................91
Figure B-12 Beam Card #12 .........................................................................................................92
Figure B-13 Beam Card #13 .........................................................................................................93
Figure B-14 Beam Card #14 .........................................................................................................94
Figure B-15 Beam Card #15 .........................................................................................................95
Figure B-16 Beam Card #16 .........................................................................................................96
Figure B-17 Beam Card #17 .........................................................................................................97
Figure B-18 Beam Card #18 .........................................................................................................98
Figure B-19 Beam Card #19 .........................................................................................................99
Figure B-20 Beam Card #20 .......................................................................................................100
Figure B-21 Beam Card #21 .......................................................................................................101

TxDOT 0-6069-1 Long-term performance of GFRP reinforcement
xiii
Figure B-22 Beam Card #22 .......................................................................................................102
Figure B-23 Beam Card #23 .......................................................................................................103
Figure B-24 Beam Card #24 .......................................................................................................104
Figure B-25 Beam Card #25 .......................................................................................................105
Figure B-26 Beam Card #26 .......................................................................................................106
Figure B-27 Beam Card #27 .......................................................................................................107
Figure B-28 Beam Card #28 .......................................................................................................108
Figure B-29 Beam Card #29 .......................................................................................................109
Figure B-30 Beam Card #30 .......................................................................................................110
Figure B-31 Beam Card #31 .......................................................................................................111
Figure B-32 Beam Card #32 .......................................................................................................112
Figure B-33 Beam Card #33 .......................................................................................................113
Figure B-34 Beam Card #34 .......................................................................................................114
Figure B-35 Beam Card #35 .......................................................................................................115
Figure B-36 Beam Card #36 .......................................................................................................116

TxDOT 0-6069-1 Long-term performance of GFRP reinforcement
xiv

TxDOT 0-6069-1 Long-term performance of GFRP reinforcement
xv
LIST OF TABLES
Table 4-1. Available Test Specimens with Nominal Cover Depths. ............................................36
Table 5-1. Tensile Strength Data for Type V1 GFRP Reinforcing Bars. .....................................43
Table 5-2. Tensile Strength Data for Type V2 GFRP Reinforcing Bars. .....................................44
Table 5-3. Tensile Strength Data for Type P GFRP Reinforcing Bars. .......................................45
Table 6-1. Posterior Statistics of Unknown Parameter 0( , , , )s s Θ .......................................56
Table A-1 The t-test results for Modulus of elasticity of V1 #5 bars ...........................................73
Table A-2 The t-test results for Modulus of elasticity of V2 #5 bars ...........................................74
Table A-3 The t-test results for Modulus of elasticity of P #5 bars ..............................................75
Table A-4 The t-test results for Modulus of elasticity of V1 #6 bars ...........................................76
Table A-5 The t-test results for Modulus of elasticity of V2 #6 bars ...........................................77
Table A-6 The t-test results for Modulus of elasticity of P #6 bars ..............................................78
Table C-7 MOE test results for V1 #5 bars ................................................................................119
Table C-8 MOE test results for V2 #5 bars ................................................................................120
Table C-9 MOE test results for P #5 bars ...................................................................................121
Table C-10 MOE test results for V1 #6 bars ..............................................................................122
Table C-11 MOE test results for V2 #6 bars ..............................................................................123
Table C-12 MOE test results for P #6 bars .................................................................................124


TxDOT 0-6069-1 Long-term performance of GFRP reinforcement
1
1. INTRODUCTION AND RESEARCH SIGNIFICANCE
Glass fiber-reinforced polymer (GFRP) reinforcement has emerged as a potential
candidate as an alternative reinforcement to conventional steel reinforcing bars for concrete
structures. GFRP reinforcing bars are non-corrosive, have high tensile strength, are lightweight,
and have high strength to weight ratios. Considering the significant rehabilitation costs
associated with the deterioration of existing bridges, mostly a result of steel corrosion, the
potential corrosion resistance of GFRP reinforcing bars could provide significant value for
structures containing reinforcement. The use of GFRP reinforcing bars has increased
significantly in many infrastructure applications, including bridge decks, pavements, walls, and
other systems. However, there still is a reluctance to use GFRP reinforcing bars; this reluctance
mostly results from the lack of long-term performance data of GFRP reinforcing bars embedded
in concrete.
Although GFRP reinforcing bars do not exhibit “classical” corrosion, many publications
have reported a significant reduction in the tensile capacity of GFRP reinforcement when
exposed to various solutions. Classical corrosion in reinforced concrete is defined as reactions
that take place between the base reinforcement material and its environment to form a product of
increased volume that creates internal tensile forces that exceed the tensile capacity of the
concrete, causing cracking and spalling of the concrete. Significant literature exists on the
reduction in GFRP reinforcement tensile capacity when the GFRP is exposed to various
solutions. Some literature is available on the reduction in the tensile capacity of GFRP
reinforcement when embedded in concrete, but these data are based on short-term exposure
durations. Because GFRP reinforcing bars are specifically designed for use in concrete and
because the environmental exposure conditions inside concrete are likely significantly different

TxDOT 0-6069-1 Long-term performance of GFRP reinforcement
2
than direct exposure conditions, research is needed to better determine the influence of the
concrete environment on the tensile capacity of GFRP reinforcement. Also, because the potential
benefits of using GFRP could provide significant value to owners, managers, and users of
infrastructure systems, the performance of GFRP reinforcement should be determined such that
value is optimized while maintaining safety.
Over the past several decades significant research has been performed assessing the
durability of GFRP reinforcing bars by measuring the reduction of mechanical properties after
exposure to various environments. Research evaluating changes in the tensile strength and
modulus of elasticity (MOE) has been prevalent. Based on many accelerated exposure tests,
researchers have developed models to predict the long-term performance of these GFRP
reinforcing bars. However, significant debate exists on the recommended models and the limits
published in the design codes. This debate is a direct result of the lack of performance data from
GFRP reinforcing bars embedded in concrete for longer periods. A “valid” prediction model that
includes influencing parameters is needed. Once this model is defined, the actual value of using
GFRP reinforcing bars in concrete can be determined.
Research Project 9-1520, performed by Trejo et al. (2005), evaluated the performance of
GFRP reinforcing bars. Research on three different GFRP reinforcing bars included evaluating
the solution uptake of the bars, bar tensile tests, bar shear strength, and bar creep tests. In
addition, the research evaluated GFRP-reinforced concrete specimens for cracking, deflections
due to cyclic loading, bond tests, and evaluation of the thermal expansion of GFRP bars
embedded in concrete. In general, the GFRP reinforcing bars performed well with the exception
of the tensile strength. The researchers exposed the GFRP reinforcing bars to water and alkaline
solutions and reported that the capacity of the GFRP bars could be lower than the design tensile

TxDOT 0-6069-1 Long-term performance of GFRP reinforcement
3
strength within a period of 7 years. However, these results were based on exposing the GFRP
bars directly to water and alkaline solutions. It has been well established that concrete not
continuously exposed to water does not have saturated pores and thus exposing the GFRP
reinforcing bars to solution represents a “worst” case scenario of the GFRP performance.
Considering that GFRP bars are being used in applications where the concrete is not
continuously exposed to wet conditions, an alternative model may be warranted.
At the conclusion of the testing program reported by Trejo et al. (2005), the researchers
stored the tested GFRP-reinforced concrete samples at the Riverside campus at Texas A&M
University in College Station, Texas, with the understanding that these samples could be used to
assess the residual strength of the GFRP bars at a later time. These GFRP-reinforced samples
were fabricated in 2000 and exposed to a mean annual temperature of 69 oF (23 oC) and average
precipitation of 39.7 inches (1008 mm), fairly evenly distributed throughout the year. The
minimum and maximum average daily temperatures were 40 oF (5 oC) and 96 oF (32.2 oC),
respectively. In 2007, funding was provided to assess the tensile capacity and MOE of the GFRP
reinforcing bars embedded in the concrete specimens.
This research consisted of extracting the GFRP reinforcing bars from the concrete
specimens stored at the Riverside campus and testing these bars for residual tensile capacity and
MOE. After performing a literature review, the 7-year exposure period seems to be the longest
duration in which the residual properties will be reported. Using data from the original research
project and data from this research project, the researchers developed models to assess the
residual tensile capacity. The researchers then used this model to assess requirements for the
design tensile strength of GFRP reinforcing bars embedded in concrete.

TxDOT 0-6069-1 Long-term performance of GFRP reinforcement
4
Three types of GFRP bars were extracted in this research. The bars were manufactured
by Hughes Brothers, Pultrall Inc., and Marshall Industries, and are referred to as Types V1, V2,
and P, respectively.

TxDOT 0-6069-1 Long-term performance of GFRP reinforcement
5
2. LITERATURE REVIEW
Many studies assessed the degree and mechanisms of degradation and characterized the
parameters that impact the long-term characteristics of GFRP reinforcing bars. GFRP reinforcing
bars are composed of aligned glass fibers surrounded by a polymer matrix. When GFRP
reinforcement is used as an internal reinforcement in concrete, tensile strength decreases as a
function of time. This is a result of “corrosion” of the glass fibers as a result of the presence of
moisture and/or alkaline solution. Because this is a chemical reaction, the rate of the degradation
reactions would be expected to increase at elevated temperatures, and this has been established in
the literature.
In addition to being exposed to moisture and alkaline solutions, GFRP reinforcing bars
placed in service are exposed to sustained loads. Moisture or alkaline solutions can diffuse into
the polymer matrix, eventually reaching the depth of the glass fibers and deteriorating these
fibers. However, if in-service loads crack the polymer matrix, moisture and other deleterious
solutions can be transported to the glass fibers at a faster rate than the diffusion rate. Thus, the
diffusion coefficient of the polymer matrix and cracking of the polymer matrix as a function of
the level of the sustained load would be a useful parameter for assessing the residual strength of
GFRP reinforcing bars. Several studies (Benmokrane et al. 2002 and Micelli and Nanni 2004)
have assessed the diffusivity, matrix cracking, and residual strength of GFRP bars exposed to
various environments for relatively short durations.
2.1. GFRP REINFORCING BAR PERFORMANCE: SOLUTION EXPOSURE
A critical parameter influencing the deterioration rate of GFRP is the rate at which
solution is transported into the GFRP reinforcing bar. A significant amount of research has been

TxDOT 0-6069-1 Long-term performance of GFRP reinforcement
6
performed assessing the residual tensile strength of GFRP reinforcing bars exposed to various
solutions. These studies provide valuable information on the general mechanisms of deterioration
and the level of deterioration as a function of time and are essential for developing models to
predict the deterioration and residual strength of GFRP reinforcing bars in concrete. Although
essential for modeling the performance of GFRP reinforcing bars, challenges do exist on how to
correlate the mechanical property performance from the samples exposed to solution with the
mechanical property performance of samples embedded in concrete—no correlation exists.
In addition to the condition of the environment surrounding the GFRP reinforcing bars,
the mechanical properties could be affected by the imposed load on the bars, bar size, diffusion
characteristics of the polymer matrix material, and temperature. This section of the report will
provide a literature review summarizing papers and reports on GFRP reinforcing bars exposed to
solutions under various conditions. The following section will provide a review of the
performance of GFRP bars embedded in concrete and subjected to various conditions. It should
be noted that most publications do not provide specific information on the constituent materials
used to fabricate the GFRP bars. In cases where this information was reported, the authors have
provided this information in this review. The reader is cautioned when specific information was
not provided, as the performance could deviate from the anticipated performance.
Katsuki and Uomoto (1995) provided an early report on the performance of GFRP
reinforcing bars. The researchers conducted accelerated tests in alkaline solution (simulated
concrete pore solution) to evaluate the residual tensile strength of GFRP bars as a function of
exposure time. They also developed a prediction model based on diffusion of moisture into the
polymer resin matrix of the GFRP bar. After exposure to the simulated concrete pore solution,
the authors assessed the GFRP bars for tension capacity and degradation. Degradation was
TxDOT 0-6069-1 Long-term performance of GFRP reinforcement
7
assessed with an electron microscope analyzer (EMA). The authors reported a residual tensile
strength of 28 percent after 120 days of exposure to the alkaline solution.
Tannous and Saadatmanesh (1999) studied the durability of GFRP bars made with alkali
resistant (AR) glass. They subjected a total of 160 GFRP reinforcing bars to seven different
exposure solutions at temperatures of 77 °F (25 °C) and 140°F (60 °C) with and without
ultraviolet radiation. They evaluated two polymer matrix materials, polyester and vinyl ester.
The authors reported that higher exposure temperatures led to higher reductions in tensile
strength and that the ultraviolet exposure had limited effect on the tensile strength. The authors
also reported a reduction in tensile capacity after a 1-year exposure to Ca(OH)2 solution of
20.8 percent for GFRP bars made with polyester resin and 12.8 percent for GFRP bars made with
vinyl ester resin. Similar to Katsuki and Uomoto (1995), the authors developed a model to
estimate the residual tensile strength and reported that the model predicted this strength within
15 percent of the actual residual tensile strength. The authors reported that exposing the GFRP
bars to a NaCl and MgCl2 (2:1) solution (7 percent by weight) resulted in the highest reduction in
tensile strength (26.2 percent after 1 year). The authors also noted that Fick’s law is appropriate
for predicting the residual strength for short-term exposures only, as the polymer matrix tended
to crack after longer exposure times. The authors also investigated the residual strength of GFRP
bars embedded in concrete. These results will be reported in the next section.
Tannous and Saadatmanesh (1998) conducted accelerated aging tests using different
types of resin matrix at different ranges of temperature. The authors concluded that the diffusion
rate of solutions increases with increasing temperatures. Moreover, they found that the
degradation of tensile strength is dependent on the combination of the bars’ constituent materials
and that vinyl ester resin has higher resistance to alkaline attack than the polyester resin matrix.

TxDOT 0-6069-1 Long-term performance of GFRP reinforcement
8
This was believed to be due to the lower diffusivity and absorption of the vinyl ester resin
material evaluated.
Mukherjee and Arwikar (2005) later reported that although vinyl ester resin could protect
the glass fibers from the alkaline solution, the tensile strength can be reduced due to the
synergetic effects of other environmental factors.
Abbasi and Hogg (2005) evaluated the effect of alkaline solution and water not only on
the strength and stiffness of GFRP reinforcing bars, but also on the bond strength between
concrete and the bars at different temperature ranges. The researchers evaluated three types of
GFRP reinforcing bars, subjecting these to an alkaline solution at 140 °F (60 °C) for 30, 120, and
240 days. Tension tests were performed to characterize the material properties of the exposed
GFRP rebar. The authors reported a reduction in the MOE and tensile strength and linked these
reductions to reductions in the glass fiber strength when exposed to the alkaline solution—higher
temperatures exhibited larger decreases in properties.
Uomoto (1996) reported that when loaded, the resin matrix transfers the stress from the
resin matrix to the glass fibers. As the resin matrix is exposed to the solution, the resin is
damaged. This damage results in non-uniform stress transfer from the resin to the glass fibers.
This non-uniform stress transfer increases the rate of failure of the glass fibers, thereby reducing
the capacity of the GFRP bar.
Nishizaki and Meiarashi (2002) also evaluated the deterioration of GFRP specimens
exposed to water and moist environments at different temperatures (140 °F [60 °C] and 104 °F
[40 °C]). The authors reported higher reductions in bending strength for the samples exposed to
the higher temperatures and reported that this was a result of the dissolution of the resin matrix

TxDOT 0-6069-1 Long-term performance of GFRP reinforcement
9
and separation between the glass fibers and resin. The researchers reported that water absorption
is the critical factor in determining the long-term behavior of GFRP.
Sen et al. (2002) performed accelerated tests to evaluate the performance of E-glass/vinyl
ester reinforcement subjected to sustained loads for a 9-month period. They evaluated
36 specimens. One-third of the samples were unstressed, one-third were stressed to 10 percent of
ultimate, and one-third were stressed to 15 percent of the ultimate strength or higher. All
specimens were exposed to simulated pore solution with a pH in the range of 13.35 to 13.5 for
1-, 3-, 6-, and 9-month durations. After exposure, tension tests were performed to evaluate the
residual tensile strength of each bar. The researchers reported that specimens stressed to 25 and
15 percent of their ultimate strength failed at 25 and 180 days of exposure, respectively. In the
case of the unstressed samples, the residual tensile strength was 70 percent of the initial strength
after 9 months of exposure. Of the samples subjected to the 10 percent load that did not fail, the
residual strength was 63 percent of the original unexposed ultimate strength. The authors
concluded that higher stress levels result in resin cracking and accelerate the degradation process.
Vijay and GangaRao (1999) and Porter and Barnes (1998) reported similar findings.
Sen et al. (2002) performed further testing on GFRP, Aramid-fiber reinforced polymer
(AFRP), and carbon-fiber-reinforced polymer (CFRP) to investigate the relationship between
exposure and residual properties in a marine environment. The researcher exposed GFRP
specimens to simulated tidal and thermal cycles for a 20-month period and assessed the residual
strength. The test results indicated that the GFRP specimens containing epoxy resin were not
resistant to the marine exposure environment. The author used scanning electron microscopy
(SEM) to identify evidence of degradation of the glass fiber’s surface.

TxDOT 0-6069-1 Long-term performance of GFRP reinforcement
10
Karbhari et al. (2002, 2007) also evaluated the performance of GFRP specimens,
exposing the samples to elevated temperatures to accelerate deterioration. Moisture uptake tests
were conducted in de-ionized water and alkaline solutions at different temperatures. Results
indicated that immersion in the alkaline solution resulted in higher weight gains and higher
diffusivities than samples immersed in de-ionized water. The researchers assessed the residual
strength of wet and dry samples exposed for 75 weeks of exposure. The dry samples that were
immersed in water and exposed to lower temperatures exhibited limited deterioration. However,
the samples exposed to water and elevated temperature exhibited irreversible degradation of the
interface and glass fibers. For the samples immersed in alkaline solution the degradation was
irreversible—degradation caused by exposure to high alkali solutions was reported to be more
harmful than exposure to de-ionized water. The authors also reported that the accelerated aging
test is appropriate for predicting the long-term behavior of GFRP samples.
The changes in tensile strength, ultimate elongation, and MOE of GFRP reinforcing bars
were also evaluated by Debaiky et al. (2006). The researchers used accelerated aging tests and
found that the maximum reduction of tensile strength was 11 percent below the guaranteed
ultimate tensile strength (GUTS) when exposed to a temperature of 140 °F (60 °C) and a
sustained load of 29 percent of the GUTS. The ultimate strain was 43 percent higher than that
recommended in the ACI 440.1R-03 (ACI 2003) design guidelines. No significant reduction in
the elastic modulus was detected.
Similar tests were performed by Micelli and Nanni (2004) to evaluate the reduction of
tensile strength. In this study the tensile strength of the GFRP specimens decreased by up to
59 and 70 percent after 21 and 42 days of immersion in alkaline solution, respectively. Electron
microscopy was used to identify the deterioration of the fiber, resin, and interfacial areas. This
TxDOT 0-6069-1 Long-term performance of GFRP reinforcement
11
research demonstrated the importance of the resin in resisting the transport of elements or
compounds toward the glass fibers and recommended the use of thermoplastic resins. Earlier
accelerated testing was performed by Micelli et al. (2001); this research concluded that after
exposure to alkaline solution the reduction in tensile strength as a function of time was
dependent on resin type, specifically the absorption characteristics.
Although much research has been performed using accelerated aging tests with elevated
temperatures, Kajorncheappunngam et al. (2002) reported that the degradation mechanisms are
different at different temperatures and using elevated temperatures as an accelerating factor may
not always be appropriate. The researchers immersed glass-reinforced epoxy samples in four
different aqueous media (distilled water, a saturated salt solution [30 g/100 cc NaCl], 5-molar
NaOH solution, and a 1-molar hydrochloric acid solution) at two different temperatures for up to
5 months. Accelerated aging was performed by exposing the specimens at room temperature and
at 140 °F (60 °C). After 5 months the residual tensile strengths of the specimens were assessed.
The tensile strengths of the specimens immersed in hydrochloric acid at room temperature were
higher than specimens subjected to the 140 °F (60 °C) environment. As such, the authors advised
caution when using accelerated tests. However, it should be noted that the mechanisms of
degradation are different for acidic and alkaline exposure and that these exposure conditions
likely have a more significant impact on residual strength than temperature. Exposing GFRP
specimens to elevated temperatures and the environment in which they are to be exposed can
provide an indication of deterioration.
Benmokrane et al. (2002) categorized the degradation mechanisms of GFRP into three
types: stress dominated, crack propagation dominated, and diffusion dominated. In this study,
GFRP reinforcing bars composed of different constituent materials were exposed to simulated

TxDOT 0-6069-1 Long-term performance of GFRP reinforcement
12
alkaline solution combined with sustained loads at various temperatures for specific periods.
Tension tests and assessment of the microstructure were performed to estimate the changes in the
mechanical properties of the specimens. The authors concluded that the degradation mechanism
changed depending on stress level. The diffusion rate of the alkaline solution dominates the
degradation at low stress level, while the crack propagation on the surface of the resin matrix
influences the rate of degradation at higher stress levels. Clearly, the transport of solution
increases with the cracking of the resin matrix. Bank et al. (1998), Bakis et al. (1998), and
Tannous and Saadatmanesh (1999) also made similar findings.
2.2. GFRP REINFORCING BAR PERFORMANCE: BARS EMBEDDED IN
CONCRETE
A number of studies have evaluated the influence of the concrete pore solution on the
tensile capacity of GFRP reinforcement. Almusallam et al. (2002) reported up to a 10.3 percent
reduction in tensile capacity for unstressed GFRP bars and up to 27.9 percent reduction in tensile
capacity for stressed bars after only 120 days of embedment in concrete. Giernacky et al. (2002)
reported almost a 20 percent reduction in tensile capacity of GFRP bars for beams subjected to a
service load after only 180 days of embedment in concrete. Svecova et al. (2002) also reported
significant reductions in GFRP tensile capacity; 36 to 53 percent reduction in tensile capacity for
GFRP bars embedded in concrete beams immersed in a 140 oF (60 oC) water bath. Mukherjee
and Arwikar (2005) reported GFRP reinforcing bars embedded in concrete beams and
conditioned outdoors for 18 and 30 months exhibited residual strengths of approximately
61 percent of the unexposed GFRP bars.

TxDOT 0-6069-1 Long-term performance of GFRP reinforcement
13
Bakis et al. (2005) proposed that the residual tensile strength of GFRP depends on the
environmental conditions and duration of loading. In this study, GFRP specimens with E-glass
and vinyl ester resin were embedded in concrete beams. Beams were pre-cracked and subjected
to a sustained load. After loading, specimens were placed in four separate environmental
conditions (outdoor, indoor, Ca(OH)2 solution, and freeze-thaw). After exposure the beams were
unloaded and evaluated for capacity. The mean tensile strength of the bars was determined to be
a function of conditioning times from each environmental condition. The authors reported that
the residual tensile strength of the GFRP reinforcement embedded in concrete beams was only
2.5 percent lower than the control samples (samples not embedded in concrete nor loaded). The
influence of the indoor and outdoor exposure conditions were reported to have no significant
affect on the rebar capacity. However, the rebar immersed in 2Ca(OH) exhibited a 25 percent
reduction in capacity after 1 year of exposure. Moreover, the specimens subjected to freeze-thaw
cycles exhibited a 15 percent loss in capacity after 6 months. It was reported that the MOE of the
GFRP bars was not significantly affected by the different exposure conditions.
Salts and alkaline solutions can influence the performance of GFRP bars. Vijay and
GangaRao (1999) evaluated the performance of GFRP bars embedded in concrete specimens
exposed to salt with and without sustained load conditioning at various temperatures. The
authors reported that all specimens exhibited linear stress-strain relationships. For the samples
without loads the maximum reductions of strength were as high as 32.2 percent after 15 months
of exposure. The specimens that were subjected to freeze-thaw conditions exhibited a reduction
in capacity of up to 37.5 percent. The authors concluded that the alkaline environment had a
more significant affect than the salt exposure on the strength of the GFRP specimens.

TxDOT 0-6069-1 Long-term performance of GFRP reinforcement
14
A field study conducted by Laoubi et al. (2006) investigated the damage to GFRP
reinforcing bars embedded in concrete beams exposed to freeze-thaw cycles and sustained
bending. The GFRP reinforcing bar used in the study was sand-coated, second-generation GFRP
bar made with 75.9 percent E-glass and vinyl ester resin. A total of 21 concrete beams were
exposed to a sustained load for 50, 100, and 150 days at room temperature while undergoing
freeze-thaw cycles. The authors concluded that exposure to freeze-thaw cycles and sustained
stress were not critical environmental factors affecting the performance of GFRP reinforcement.
Dejke (2001) evaluated the performance of GFRP bars from different manufacturers.
These GFRP bars were embedded in concrete for up to approximately 600 days. Dejke reported
that the residual tensile strength decreases with both time and temperature. For one
manufacturer, he reported a loss in tensile strength of almost 50 percent at 176oF (80 oC) after
less than 250 days of embedment in concrete. The same GFRP bars embedded in concrete and
exposed to 60 oC and 20 oC exhibited approximately 42 and 25 percent loss in tensile capacity
after 520 days. He also reported that another manufacturer’s GFRP bars tested lost
approximately 15 and 56 percent of their strength after 528 days of embedment in concrete when
exposed to 20 oC and 60 oC, respectively. It should be noted that Dejke maintained the humidity
of the exposure environments at 100 percent relative humidity and he concluded that the
deterioration in “real” concrete would likely be lower, as the relative humidity of the concrete
pores is typically lower (80 to 85 percent relative humidity).
Although much research has reported significant loss in the tensile capacity of GFRP
bars, a field study conducted by Mufti et al. (2007a, 2007b) concluded that the GFRP
reinforcement is durable when embedded in concrete. Concrete cores reinforced with GFRP
were removed from five structures located in North America. The GFRP bars were made with

TxDOT 0-6069-1 Long-term performance of GFRP reinforcement
15
E-glass embedded in a vinyl ester resin, and embedment ages were from 5 to 8 years. The
structures were exposed to a wide range of environmental conditions. SEM and energy
dispersive X-ray analyses (EDX) were performed to detect possible degradation of the matrix
and glass fibers. Fourier transform infrared spectroscopy (FTIR) was also used to estimate the
changes in the glass transition temperature (Tg) of the resin. Based on these tests the authors
reported no evidence of deterioration due to alkaline ingress and/or moisture absorption. The
authors concluded that GFRP reinforcement is appropriate for use as reinforcement in concrete
structures. It should be noted that no data on mechanical test results of the GFRP bars after
embedment in the concrete environment were reported.
2.3. PREDICTION MODELS FOR LONG-TERM PERFORMANCE
Significant work has assessed the performance and deterioration of GFRP reinforcement
for concrete. A wide range of results reports that clearly bar constituent materials and exposure
conditions play a significant role in the performance of these systems. Researchers have used
these results to generate deterioration models. These models can be used to predict the residual
strengths at different times, thereby providing the designer with possible estimates of bar
capacity at later ages. These residual strengths, or factored residual strengths, could then be used
in the design of GFRP reinforced concrete elements. The following sections provide a review of
proposed models for assessing the residual strength of GFRP bars embedded in concrete. It
should be noted that only limited longer-term data are available on the performance of GFRP
bars embedded in concrete and all data on the residual strength of these bars are for exposure
periods of less than 3 years.

TxDOT 0-6069-1 Long-term performance of GFRP reinforcement
16
2.3.1. Models from the Literature
Research has been performed to correlate the mechanical degradation of GFRP
reinforcing bars and the diffusion rate of alkaline solution into the GFRP matrix. As noted in the
earlier sections, the rate of transport, or the rate of diffusion of elements or compounds, has a
significant impact on the bars’ residual strength. The apparent diffusion coefficient is a common
parameter used to predict the reduction of mechanical properties of GFRP, as this coefficient is
directly related to the rate of transport of the aggressive compound. Fick’s law and the Arrhenius
model have been used to predict the residual strength of GFRP bars embedded in concrete. Shen
and Springer (1976) recommended that the diffusion coefficient (required in Fick’s law) be
obtained using the following equation:
2222 1
2 1
1
16 m
M MrDM t t
(2.1)
where, M1, M2, and Mm are the moisture contents of the bar (in percent) at time t1, t2, and at
saturation, respectively.
Katsuki and Uomoto (1995) proposed a prediction model based on Fick’s first law. The
authors assumed that the tensile strength of GFRP bar can be determined quantitatively by the
amount of alkali penetration area into the bars and recommended that the depth of penetration be
calculated using the following:
2X D C t (2.2)

TxDOT 0-6069-1 Long-term performance of GFRP reinforcement
17
Where, X is the depth of penetration from the surface, C is the alkaline concentration (percent), t
is the curing time, and D is the diffusion coefficient. It should be noted that various units can be
used in this equation and the units of the square root of the product should result in a length unit.
The authors assumed that as glass fibers were exposed to the diffusing solution these
fibers exhibited complete failure and no longer contributed to the bars’ capacity. Using this
assumption the authors proposed the following equation for estimating the residual strength:
2
00
21t
D C tR
(2.3)
where, 0 and t are the tensile strengths before and after exposure (stress units), respectively,
and R0 is the radius of GFRP bar.
A similar approach was proposed by Tannous and Saadatmanesh (1998). Using results
from moisture absorption and tensile strength tests the authors recommended that Fick’s law be
used to predict the residual strength. The authors recommended that moisture absorption be used
to estimate the diffusion coefficient.
Trejo et al. (2005) reported that the assumption of complete loss of glass fiber capacity
likely overestimated the loss of capacity and proposed an exposure factor, λ, to account for this
time-dependent deterioration of the bond between the glass and resin. The proposed modified
formula, modified with the exposure factor, is as follows:
2
00
21t
D tR
(2.4)

TxDOT 0-6069-1 Long-term performance of GFRP reinforcement
18
where, the definition of the variables has already been reported and is the reduction factor less
than unity.
The Arrhenius equation has been widely used to establish relationships between
degradation data from laboratory accelerated aging tests and service-life of field structures.
Proctor et al. (1982) suggested that the time-temperature relationship can be obtained using the
deterioration data of material after exposure in concrete at different temperatures. If the shape of
the residual strength curves is a function of the logarithm of time and is similar for different
temperatures, the Arrhenius equation could be applicable. Katsuki and Uomoto (1995) reported
that the Arrhenius equation offers a good correlation between the temperature and the rate of
diffusivity and chemical reaction. The Arrhenius equation is shown as follows:
exp aEk ART
(2.5)
where, k = the rate constant,
A = the frequency factor,
aE = activation energy (KJ),
R = the universal gas constant, and
T = the absolute temperature (Kelvin).
Equation 2.5 can also be used to determine the influence of temperature on the apparent
diffusion coefficient, Dat, at some temperature, T, by substituting k and A with and Dat and Da0 as
follows:
/0
aE RTat aD D e (2.6)

TxDOT 0-6069-1 Long-term performance of GFRP reinforcement
19
This approach was used by Dejke (2001) to generate a relative time shift factor (TSF ).
Dejke (2001) proposed using the TSF to transform the time in the accelerated test to actual
service lives for GFRP reinforcement. Because the time for a certain reaction to take place must
be proportional to the inverse of the rate of reaction, Dejke (2001) proposed determining the TSF
as follows:
2
1 2
1
1 1
1 1
2 2
aa
a
EERTR T T
ERT
t c k A et c k
A eTSF e
(2.7)
where, T1 and T2 are the exposure temperatures (in Kelvin) and t1 and t2 are the times required
for a certain decrease in some mechanical property at temperatures T1 and T2, respectively. The
TSF is sensitive to the activation energy, and a good estimate of this is needed to generate a
reasonable TSF.
Vijay and GangaRao (1999) also developed a formula to associate the time between an
accelerated aging test in an alkaline solution with in-service field performance as follows:
0.05580.098 TN eC
(2.8)
where, N is the in-service field performance in days and C is the accelerated exposure age (in
days) in the laboratory exposed to temperature, T .
This correlation model was based on climate conditions of the Northeastern United
States, with the assumption that the average annual temperature was 53 oF (11.7 oC). Based on
this equation, if 104 days of laboratory exposure at 140 oF (60 oC) resulted in a 10 percent loss in

TxDOT 0-6069-1 Long-term performance of GFRP reinforcement
20
tensile capacity the same reduction in tensile capacity would occur at 69 years of in-service
conditions in a standard concrete environment exposed to a temperature of 53 oF (11.7 oC).
2.4. TENSILE STRENGTH DESIGN REQUIREMENTS
The American Concrete Institute’s (ACI) Committee 440 and the American Association
of State Highway and Transportation Officials Load and Resistance Factor Design (AASHTO
LRFD) Specifications 2008 require using an environmental reduction factor as a design
parameter when considering the reduction in tensile strength of GFRP in actual structures. This
reduction factor, CE, is dependent on the exposure conditions of the GFRP-reinforced concrete;
for concrete not exposed to earth and weather the reduction factor is 0.8 and for concrete
exposed to earth and weather the reduction factor is 0.7. The design tensile strength, ffu, of FRP
reinforcing bar considering these required reductions can then be determined as follows:
fu E fuf C f (2.9)
where, fuf is the GUTS of a FRP bar. The GUTS is defined as the mean tensile strength of a set
of test specimens minus three standard deviations ( , 3fu u avef f ).

TxDOT 0-6069-1 Long-term performance of GFRP reinforcement
21
3. MATERIALS
Project 9-1520 reported on the performance of GFRP bars with diameters of 0.625 and
0.75 inch (16 and 19 mm) provided by three different manufacturers. The bars contained
approximately 70 percent of unidirectional glass fibers by volume—the remaining volume being
resin and air voids. Three different bar types representing each manufacturer were evaluated. The
bars were identified in that report as P, V1, and V2 and were manufactured by Marshall
Industries, Hughes Brothers, and Pultrall Inc., respectively. Type P bars are no longer being
produced.
Schaefer (2002) reported that bar Type P bar was made with a polyethylene terephthalate
(PET) polyester matrix and E-glass fibers. Bar Type V1 contained E-glass fibers embedded in a
vinyl ester resin. This bar was made with external helical fiber wrapping and the surface of the
bar was coated with fine sand. Bar Type V2 was composed of E-glass fibers embedded in a vinyl
ester resin and had a circular cross section coated with coarser sand. Figures 3.1 and 3.2 show the
surface and cross section of this bar type (Trejo et al., 2005). Trejo et al. (2005) also reported a
range of diffusion coefficients for the different GFRP bars from 4.4710-10 in2/sec (2.8810-13
m2/sec) to 2.3910-9 in2/sec (1.5410-12 m2/sec), with a mean value of 1.3810-9 in2/sec
(8.910-13 m2/sec). The mean value was used for the modeling.

TxDOT 0-6069-1 Long-term performance of GFRP reinforcement
22
Figure 3-1. Surface of GFRP Bar Types P, V1, and V2.
Figure 3-2. Cross-section Views of GFRP Bar Types P, V1, and V2.
Bar P Bar V1 Bar V2
Bar P Bar V1 Bar V2

TxDOT 0-6069-1 Long-term performance of GFRP reinforcement
23
Schaefer (2002) conducted an examination of the bars under SEM and found that the
thickness of the resin around the circumference of all three bar types was non-uniform. A layer
of resin needed to protect the fibers was present on most of the surface of the bars and was more
prevalent on one side of the bar (likely a result of gravity during the production process). This
resulted in portions of the glass fibers having no protective resin. None of the bar types exhibited
a uniform resin matrix cover over the glass fibers.
It should be noted that bars not used in research Project 9-1520 served as control
specimens for this research project. In addition, bars that were embedded in concrete and tested
were also used in this research project—these bars, embedded in concrete for 7 years, were
characterized to assess the change in properties as a function of time. These beams were
embedded in concrete and exposed to the outside environment in College Station, Texas, for
approximately 7 years.
3.1. CONCRETE USED IN TXDOT PROJECT 9-1520
The GFRP-reinforced concrete specimens were fabricated with Texas Department of
Transportation (TxDOT) class “S” concrete. The 28-day design compressive strength was
4000 psi (28 MPa) and the target water-cement ratio was 0.35. The concrete mixture contained
the following proportions: 1895 lb/cy (1224 kg/m3) of limestone (maximum size aggregate
[MSA] = 1 inch [25 mm]), 1180 lb/cy (762 kg/m3) of sand, 488 lb/cy (315 kg/m3) of TxDOT
type-1-3 aggregate, 116 lb/cy (75 kg/m3) of Type C fly ash, 210 lb/cy (136 kg/m3) of water, 4 fl.
oz. (118 mL) of air entraining (Type AE90), 24 fl. oz. (710 mL) of superplasticizer, and
603 lb/cy (390 kg/m3) of cement. The 28-day compressive strengths ranged from approximately
4200 to 6000 psi (29 to 41 MPa).
TxDOT 0-6069-1 Long-term performance of GFRP reinforcement
24
3.2. GFRP CHARACTERIZATION – POST-EXTRACTION
Sufficient samples were available from research Project 9-1520 such that a statistically
valid number of samples could be extracted and tested for the current research project. The
following sections provide a description of the GFRP bar characteristics.
3.2.1. GFRP Characterization – Post-Exposure
The research team extracted and tested each of the three different reinforcement types,
with each bar type having two different diameters (0.625 inch [#5] and 0.75 inch [#6]). This
resulted in six bar type/size combinations. The researchers extracted the bars from the concrete,
taking care not to damage the bar surface. In some cases the bars had residual concrete bound to
their surfaces; this had no influence on the property characterization of the bars. Several
characterization tests were performed on the post-extracted bars: SEM, EDX, and
thermogravimetric analysis (TGA) tests.
3.2.1.1. Scanning Electron Microscopy and Energy Dispersive X-ray Analyses
SEM analysis identified potential damage to the glass-matrix interface. However, no
micrographs were collected during the initial research and the researchers had no micrographs
for comparison. As such, the researchers could not determine if the glass fiber-resin interface
was damaged. EDX tests validated the glass type used in the different bars: E-glass or AR-glass.
According to Mufti et al. (2007a, 2007b), the absence of zirconium (Zr) is used to determine if
the glass fibers are E-glass. Zirconium was not identified in any of the bar types and researchers
determined that each bar type contained E-glass.

TxDOT 0-6069-1 Long-term performance of GFRP reinforcement
25
3.2.1.2. Thermogravimetric Analyses
Thermogravimetric analysis provides the mass fraction of the fibers in the composite. For
this test the bars were ground into a powder. The sample was then heated to a temperature of
approximately 620 °F (327 °C), effectively burning away the polymer resin and leaving behind
the glass fibers. The mass of the specimen before and after the test was documented, and the
mass volumes of the fibers were determined. The testing indicated that the approximate fiber
content of the Type V1 and P bars was 79 and 71 percent, respectively. Bar V2 was not
evaluated. These values meet the 70 percent minimum glass fiber content required by
ASTM D2584, Standard Test Method for Ignition Loss of Cured Reinforced Resins (ASTM,
2008).
3.3. CONCRETE CHARACTERIZATION – POST-EXTRACTION
One objective of this research is to determine how the environment influences the
properties of GFRP bars; more specifically, how the embedment of GFRP bars in concrete
influences the residual tensile capacity and MOE of the GFRP bars. Because the concrete
environment may have a significant influence on the GFRP properties, the research team
evaluated the concrete in which the GFRP bars were embedded. The following sections describe
the tests and characteristics of the concrete.
3.3.1. Alkalinity of Concrete Pore Solution
It has been reported that GFRP bars embedded in concrete are susceptible to the high pH
pore solution typical of concrete, which could lead to a reduction in tensile strength and MOE
(Ceroni et al., 2006). The issue of how the alkalinity (pH level) of the concrete pore solution

TxDOT 0-6069-1 Long-term performance of GFRP reinforcement
26
affects the degradation and long-term performance of GFRP bars needs to be addressed. As
presented earlier, significant research on the deterioration of GFRP specimens exposed to high
pH solutions has been performed and models have been developed from these solution studies.
However, the concrete pore solution differs from many of the simpler solutions and is more
complex. The objective of this work is not to assess the constituents of the concrete pore solution
but simply to assess the pH and to determine if the deterioration, if any, is a function of the pH of
the concrete pore solution.
Researchers collected two to three small concrete samples from each of the 36 beams that
contained GFRP bars. In cases where large deviations in the pH were observed, a third sample
was collected and evaluated. The mean value of the pH results from each beam is reported.
Statistical analyses determined if a correlation exists between concrete pore solution pH values
and GFRP bar tensile capacity.
The researchers used Environmental Protection Agency (EPA) Method 9045D, Soil and
Waste pH, to obtain pH values of the pore solution from the concrete beams. Specimens were
collected from as close to the GFRP as possible. A 1:1 weight ratio of concrete to water was
used. A Denver Instrument model 250 pH meter with a Denver Instrument pH electrode was
used to evaluate the pH.
The pH values of the pore solution ranged from 12.25 to 13.05 for all tests, which is
typical of field concrete. These values are also representative of the values used in many
accelerated aging tests identified in the literature. The results of the pH tests are shown in
Figure 3.3, with the data separated according to the type of bar that was embedded in each beam.
Although the concrete containing the GFRP Type P bars indicates that the pore solution pH may
be higher, based on a statistical t-test of equality, at a 0.05 level of significance (which is the

TxDOT 0-6069-1 Long-term performance of GFRP reinforcement
27
probability of erroneously rejecting the hypothesis), the hypothesis that the mean pore solution
pH of the concrete containing the GFRP Type P bars is the same as the mean pore solution pH of
the concrete containing the GFRP Types V1 and V2 bars cannot be rejected.
12.4
12.5
12.6
12.7
12.8
12.9
13
Concrete Specimenswith Bar P
Concrete Specimenswith Bar V1
Concrete Specimenswith Bar V2
pH
Figure 3-3. pH Results from Concrete Beams.
3.3.2. Permeable Voids in Concrete
Because the exposure of GFRP to moisture influences the rate of deterioration, it is
important to know if the concrete has sufficient moisture to cause deterioration. The literature
has shown that moisture uptake by GFRP bars can result in changes in properties of the bars.
Therefore, the research team assessed the amount of voids in the concrete. As with the pH test,
the data collected from these tests will be correlated with the tensile capacity of the GFRP bars.

TxDOT 0-6069-1 Long-term performance of GFRP reinforcement
28
The standard test procedure (ASTM C642 [1997], Standard Test Method for Density,
Absorption, and Voids in Hardened Concrete) used to determine the quantity of permeable voids
of the concrete requires that a 21 in3 (350 cm3) or 1.75 lb (800 g) specimen be used for the test.
The research team used two 4-inch (101.6 mm) diameter cores from each beam to assess these
characteristics (a total of 72 tests). Mean values of the permeable voids from each beam were
used to determine if a correlation exists between permeable voids and the GFRP tensile capacity
data.
The volume of permeable voids as determined by the ASTM standard ranges from
approximately 11 to 17 percent and the average for all beams was 13.9 percent. These data will
be used in an attempt to correlate any reduction in capacity with void density. The results of the
void density tests are shown in Figure 3.4. Based on a statistical t-test of equality, at a 0.05 level
of significance, the hypotheses that the means of the volumes of permeable voids of the
concretes containing the GFRP Types P, V1, and V2 bars are the same cannot be rejected.

TxDOT 0-6069-1 Long-term performance of GFRP reinforcement
29
12
12.5
13
13.5
14
14.5
15
15.5
16
Concrete Specimenswith Bar P
Concrete Specimenswith Bar V1
Concrete Specimenswith Bar V2
Per
cent
of
Per
mea
ble
Voi
ds
Figure 3-4. Volume of Permeable Voids for Concrete with All Bar Types.
3.4. SUMMARY
The investigation on the existing samples from Project 9-1520 consisted of assessing the
concrete and GFRP bars from the project. The pH values of the concrete pore solution varied
from 12.25 to 13.05, and no significant differences were identified between beams with different
bar types. The permeable voids in the concrete from the beams ranged from 11 to 17 percent, and
no significant differences were identified between beams with different bar types. All GFRP bar
types had E-glass fibers and bar Types V1 and P had more than 70 percent fibers, as required by
the ASTM D2584 standard.


TxDOT 0-6069-1 Long-term performance of GFRP reinforcement
31
4. EXPERIMENTAL PROGRAM AND PROCEDURES
The primary objective of this research is to generate long-term data on the residual
strength of GFRP reinforcing bars that have been embedded in concrete for 7 years. If possible,
correlations will be made with material characteristics. Samples from a previous research project
(9-1520, Fiber-Reinforced Polymer Bars for Reinforcement in Bridge Decks) were stored in the
outside environment in College Station, Texas. Most samples had been tested in the previous
research project. The researchers identified undamaged GFRP samples to use in this research
program. Using these data from this research project, a probabilistic model will be developed to
estimate the residual strength of GFRP bars embedded in concrete.
4.1. ANALYSIS OF LOAD CONDITIONS FROM PREVIOUS TESTING
The beams that contained the GFRP bars were previously tested in a four-point beam
bending test as part of research Project 9-1520. Because GFRP bars can be damaged when
loaded, the research team needed to establish if these tests resulted in reduced capacities for the
bars embedded in the concrete samples and subjected to the test loads. The research team
subjected untested bars to the stresses imposed on the GFRP bars embedded in concrete and
subjected to the four-point bending tests. In most cases, GFRP bars were removed from locations
that exhibited limited damage and lower stresses (i.e., the beam ends).
The bar layout and test setup used in research Project 9-1520 are shown in Figure 4.1.
During this test program the center 32 inches (0.813 m) of the beam was subjected to a constant
maximum moment, calculated to be approximately 15 kips (66.72 N). The researchers were
concerned that the test may have damaged the GFRP reinforcement and reductions in strength
after 7 years of exposure could be a result of this loading instead of the deterioration of the bars.

TxDOT 0-6069-1 Long-term performance of GFRP reinforcement
32
To assess the influence of load on residual strength the researchers evaluated the tensile capacity
of unexposed, unstressed bars that remained from the original test program (Project 9-1520).
However, to determine if these bars were damaged during the original testing, the unexposed,
unstressed bars had to be subjected to similar stresses. Unexposed, unstressed GFRP specimens
were loaded to 15 kips (66.72 N), the load was removed, and the specimens were then loaded to
failure. The team then compared the ultimate tensile strength of these unexposed, unstressed bars
subjected to 15 kips (66.72 N) with the reported values of the new GFRP bars to determine if the
bars experienced significant damage during the initial test program.

TxDOT 0-6069-1 Long-term performance of GFRP reinforcement
33
(a)
(b)
Figure 4-1. (a) Bar Layout; (b) Beam Loading (after Trejo et al., 2005).
Not to scale.
The research team performed 60 tension tests with unexposed, unstressed bars (control).
The stresses in the embedded GFRP bars were calculated by Trejo et al. (2005). For each bar
type (V1, V2, and P) and bar diameter (0.625 inches and 0.750 inches) two sets of five
specimens each were cast. For each set of two, one set was preloaded to 15 kips, unloaded, and
loaded again until failure to simulate stress caused by the bending and releasing during the beam
testing. The second set of bars was loaded directly to failure.
Analysis of the results from the preliminary tension test showed that the beam bending
test had no effect on the ultimate tensile properties of the GFRP bars. Based on the statistical
t-test of equality, at a 0.05 level of significance (which is the probability of erroneously rejecting
the hypothesis), the hypothesis that the mean tensile stress for the preloaded bars is the same as

TxDOT 0-6069-1 Long-term performance of GFRP reinforcement
34
the mean tensile stress for the non-preloaded bars cannot be rejected. Hence, the research team
was able to conclude that the bending test did not affect the tensile properties of the embedded
bars, and bar sections could be used from any part of the concrete beam. The t-test results are
provided in Appendix A.
4.2. GFRP BAR EXTRACTION
Before tests could be performed, the GFRP bars had to be extracted from the concrete
beams. The research team used the following method to extract the bars, as this method proved
to eliminate damage to the bar surface:
A diamond blade saw was used to make cuts parallel to the bars over the full length
of the beam.
Small pneumatic chipping hammers were used to break the concrete from around the
bars.
The bars were removed from the concrete and stored in the laboratory until tested.
After each bar was extracted, details such as bar type, bar size, number of bars,
cover, and any exposed surfaces or concrete damage were noted on beam
documentation cards. Figure 4.2 shows three extracted bars and Figure 4.3 shows an
example of the information recorded on the beam cards. Beam cards for each beam
are provided in Appendix B.

TxDOT 0-6069-1 Long-term performance of GFRP reinforcement
35
Figure 4-2. Extracted Bars.
4.2.1. GFRP Bar Inspection
Although bars were removed from all of the beams, not all parts of all the GFRP bars
could be used. The bending test damaged some small portions of the beams, which in turn
damaged or exposed parts of the GFRP bars. Because the objective of the program is to assess
the reduction in GFRP properties for bars embedded in concrete, the research team avoided using
bars that were exposed to larger cracks or delaminations. Also, prior to testing the GFRP bars the
research team closely examined each individual bar for any signs of physical damage to the
surface. Damaged areas were identified on the GFRP bars and documented on the beam cards. A
section of bar was only tested if it was clear that there was no damage in the test area (i.e., the
center section of the bar). After extraction and inspection, 160 GFRP bars were deemed usable
for testing. A summary of the tested bars with nominal cover depths is shown in Table 4-1. The
nominal cover was reported by Trejo et al. (2005). During the extraction of the bars, the actual
measured cover was not always consistent with that provided in the report. Both covers were
noted and analyzed in this report.

TxDOT 0-6069-1 Long-term performance of GFRP reinforcement
36
Table 4-1. Available Test Specimens with Nominal Cover Depths.
Bar Type Bar Size 1 inch
(25 mm) cover
2 inch (50 mm)
cover
3 inch (75 mm)
cover
Number of Bars Available for Testing
V1 #5 10 14 11 35
#6 9 10 10 29
V2 #5 10 10 10 30
#6 8 5 5 18
P #5 5 5 5 15
#6 11 11 11 33
TOTAL 53 55 52 160
Several factors possibly influence the capacity of the GFRP bars embedded in concrete:
cover depth, concrete pH, concrete porosity, and beam position within the exposure stack.
Statistical analyses were performed to determine if any of these factors influenced the capacity
and/or stiffness of the GFRP bars. The data attained from the tests were normalized to evaluate
the influence of the conditions.

TxDOT 0-6069-1 Long-term performance of GFRP reinforcement
37
4.3. TEST PROCEDURES
GFRP bars were assessed for tensile capacity and MOE. The following sections describe
the procedures used to assess these bars.
4.3.1. Tensile Tests
GFRP bars were embedded in concrete and exposed to a natural environment for
approximately 7 years. The research team extracted the GFRP bars and evaluated the tensile
capacity of these exposed GFRP bars. To evaluate this capacity loss, the tensile capacities of
unexposed GFRP bars also had to be assessed. The research team had data from unexposed
GFRP bars from the earlier research (Project 9-1520) but also performed additional tests on
GFRP bars that were not exposed to the concrete environment. These were used by the research
Figure 4-3. Example of Information Collected on Beam Cards.

TxDOT 0-6069-1 Long-term performance of GFRP reinforcement
38
team to evaluate the degradation of the bars and for developing a time-variant model for
predicting residual capacity as a function of time.
Tension tests were performed on 160 extracted specimens. A 110 kip (489.3 kN) load
frame with 0.5 percent load accuracy (within the range tested) was used. Data were documented
automatically with a data acquisition system. The tensile tests were performed with the same
procedure as reported by Trejo et al. (2005). All efforts were made to be consistent with the
previous sample test preparation and test methods; however, some modifications had to be
implemented. The GFRP bars were prepared and tested in the following manner:
The GFRP bars were cut into 41-inch (1041 mm) lengths, ensuring that the bar
sample was taken from an area that exhibited no physical damage on the bar surface.
Steel pipe sections (1.5-inch [38 mm] diameter) were cut into 12-inch (300 mm)
sections for the grips. The grips are necessary when testing GFRP bars to prevent
damage to the GFRP bar.
A high-performance expansive grout was cast in the void between the pipe and
GFRP bar and allowed to cure for a minimum of 24 hours before testing.
The specimens were then placed in the testing apparatus. A small preload was
applied prior to testing to prevent slippage during the test.
A linear variable differential transducer (LVDT) was mounted to the GFRP
specimen, the data acquisition was started, and the bar was loaded to failure at a load
rate of 0.11 inch/minute (2.8 mm/minute).
4.3.2. Modulus of Elasticity Tests
The MOE of the GFRP reinforcement has a direct impact on the performance of
reinforced concrete systems. The MOE can affect crack widths, deflections, and other

TxDOT 0-6069-1 Long-term performance of GFRP reinforcement
39
performance indicators (Nkurunziza et al., 2005a, 2005b). The research team assessed the
modulus of elasticity of GFRP bars embedded in concrete for 7 years.
The MOE was determined for each of the 160 GFRP samples extracted. The researchers
fabricated a tensiometer for determining the strain in the GFRP bars with LVDTs spaced 120
degrees apart, as shown in Figure 4.4. The gage length of the tensiometer was 2.64 inches (67
mm) and the load rate for the testing was 0.11 inch/min (2.8 mm/min). Strain data were collected
until the GFRP samples were loaded to approximately 50 percent of their ultimate strength. The
tensiometer was then removed and the samples were tested to failure.
Figure 4-4. (a) LVDT Being Attached to GFRP Bar before Testing; (b) Close-up of LVDT Device.


TxDOT 0-6069-1 Long-term performance of GFRP reinforcement
41
5. RESULTS AND DISCUSSION
To develop a model for predicting the change in tensile capacity and MOE of GFRP
reinforcing bars embedded in concrete, the research team had to generate sufficient data on the
bars embedded in the concrete for 7 years, as limited data are available in the literature. The
following sections present the data from the test program.
5.1. TENSION TEST RESULTS
The researchers evaluated the tension capacity of 60 unloaded and unexposed GFRP bars
and used these data as the control data. The research team used statistical analyses to assess the
potential influence of concrete cover, alkalinity of the concrete pore solution, concrete porosity,
and beam storage position on the time-variant changes in tensile capacity and MOE. Figure 5.1
shows the tensile capacities for the extracted GFRP bars with and without exposure as a function
of bar type and size. Tables 5-1, 5-2, and 5-3 show the tensile strength results for the three
different bar types. In all cases the mean bar capacity decreased as a function of time, indicating
that the tensile capacity of GFRP bars is reduced when embedded in concrete. Of more
importance is the rate at which the capacity of these bars decreases and how this rate correlates
with design parameters. These issues will be addressed in Chapter 6 on modeling. The
following sections attempt to identify other variables that influenced the reduction in capacities
of the GFRP bars.
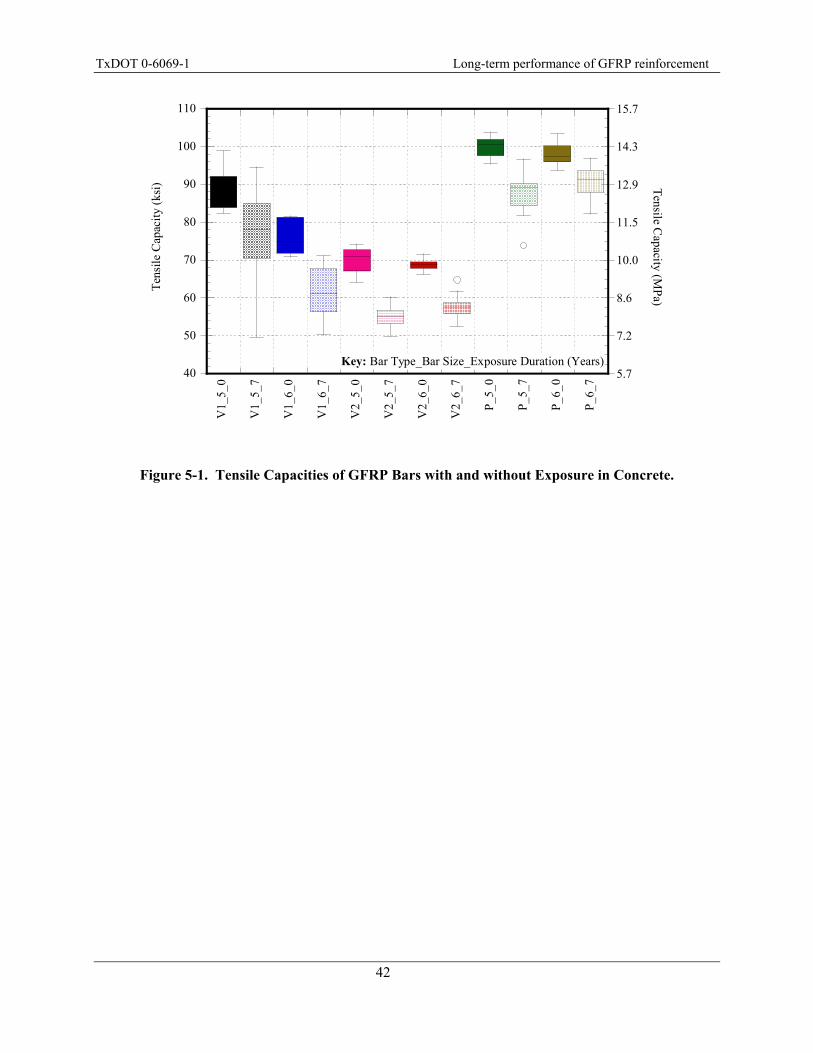
TxDOT 0-6069-1 Long-term performance of GFRP reinforcement
42
40
50
60
70
80
90
100
110
V1_
5_0
V1_
5_7
V1_
6_0
V1_
6_7
V2_
5_0
V2_
5_7
V2_
6_0
V2_
6_7
P_5
_0
P_5
_7
P_6
_0
P_6
_7
5.7
7.2
8.6
10.0
11.5
12.9
14.3
15.7
Ten
sile
Cap
acit
y (k
si)
Tensile C
apacity (MP
a)
Key: Bar Type_Bar Size_Exposure Duration (Years)
Figure 5-1. Tensile Capacities of GFRP Bars with and without Exposure in Concrete.

TxDOT 0-6069-1 Long-term performance of GFRP reinforcement
43
Table 5-1. Tensile Strength Data for Type V1 GFRP Reinforcing Bars.
V1 #5 V1 #6 Tensile Strength - No
Exposure ksi (MPa)
Tensile Strength - After Exposure ksi (MPa)
Tensile Strength - No Exposure ksi (MPa)
Tensile Strength - After Exposure
ksi (MPa) 76.39 (526.71) 70.31 (484.78) 83.28 (574.19) 69.19 (477.05) 93.26 (642.99) 76.87 (530.03) 73.79 (508.74) 63.18 (435.63) 96.78 (667.26) 69.35 (478.14) 73.32 (505.54) 68.13 (469.75) 90.77 (625.81) 92.23 (635.90) 83.18 (573.51) 52.89 (364.68) 85.34 (588.39) 51.90 (357.86) 77.17 (532.04) 56.44 (389.12)
74.45 (513.34) 82.95 (571.93) 68.28 (470.78) 49.51 (341.37) 72.31 (498.56) 56.44 (389.12) 70.79 (488.06) 73.32 (505.54) 56.30 (388.14) 72.89 (502.54) 79.03 (544.90) 54.91 (378.62) 84.97 (585.88) 75.44 (520.13) 65.03 (448.39) 84.51 (582.66) 71.29 (491.51) 88.98 (613.50) 63.67 (438.98) 69.15 (476.80) 64.00 (441.24) 74.24 (511.86) 65.48 (451.48) 65.91 (454.41) 67.93 (468.36) 66.32 (457.29) 67.65 (466.40) 72.32 (498.66) 58.50 (403.37) 67.06 (462.38) 56.80 (391.64) 93.59 (645.28) 61.10 (421.28) 94.65 (652.59) 50.24 (346.36) 77.90 (537.07) 51.19 (352.95) 89.55 (617.39) 69.16 (476.85) 92.88 (640.39) 55.91 (385.47) 88.88 (612.83) 58.98 (406.67) 88.40 (609.48) 67.83 (467.69) 69.80 (481.22) 56.19 (387.42) 84.95 (585.68) 58.61 (404.09) 84.11 (579.91) 58.99 (406.72) 83.36 (578.17) 62.57 (431.42) 80.54 (555.31) 83.75 (577.43) 79.92 (551.02) 72.01 (496.51) 82.55 (569.19) 77.96 (537.54)
Mean Standard Deviation
Mean Standard Deviation
Mean Standard Deviation
Mean Standard Deviation
88.51 (610.23) 77.92 (537.21) 77.38 (533.51) 61.27 (422.46) 7.95 (54.82) 10.91 (75.23) 4.44 (30.62) 5.99 (41.31)

TxDOT 0-6069-1 Long-term performance of GFRP reinforcement
44
Table 5-2. Tensile Strength Data for Type V2 GFRP Reinforcing Bars.
V2 #5 V2 #6 Tensile Strength - No
Exposure ksi (MPa)
Tensile Strength - After Exposure
ksi (MPa)
Tensile Strength - No Exposure ksi (MPa)
Tensile Strength - After Exposure
ksi (MPa) 76.67 (528.62) 58.06(400.31) 75.87 (523.12) 56.53 (389.76) 77.10 (531.56) 56.42(388.98) 72.29 (498.42) 58.71 (404.82) 75.10 (517.79) 60.25 (415.40) 73.70 (508.15) 55.90 (385.43) 71.67 (494.17) 57.85 (398.87) 73.00 (503.31) 57.38 (395.64) 71.82 (495.15) 56.65 (390.61) 70.22 (484.15) 52.45 (361.61)
54.85 (378.18) 73.94 (509.79) 58.26 (401.67) 50.04 (344.99) 72.72 (501.41) 57.34 (395.36) 52.83 (364.26) 73.32 (505.55) 57.23 (394.60) 55.31 (381.37) 71.97 (496.22) 60.67 (418.28) 52.94 (365.04) 71.46 (492.68) 52.90 (364.76) 56.55 (389.89) 55.89 (385.33) 56.62 (390.41) 53.30 (367.49) 53.80 (370.96) 59.37 (409.34) 54.93 (378.70) 57.47 (396.25) 49.82 (343.50) 56.58 (390.09) 54.73 (377.34) 61.80 (426.10) 56.39 (388.79) 64.80 (446.76) 54.46 (375.51) 54.78 (377.73) 55.95 (385.73) 52.87 (364.52) 56.76 (391.33) 53.32 (367.64) 53.03 (365.62) 51.97 (358.33) 55.90 (385.40) 56.34 (388.46) 54.18 (373.56) 55.38 (381.83) 56.95 (392.63)
Mean Standard Deviation
Mean Standard Deviation
Mean Standard Deviation
Mean Standard Deviation
74.47 (513.46) 55.00 (379.20) 72.85 (502.28) 57.45 (396.08) 2.60 (17.91) 2.28 (15.72) 1.54 (10.59) 3.15 (21.71)

TxDOT 0-6069-1 Long-term performance of GFRP reinforcement
45
Table 5-3. Tensile Strength Data for Type P GFRP Reinforcing Bars.
P #5 P #6 Tensile Strength - No
Exposure ksi (MPa)
Tensile Strength - After Exposure
ksi (MPa)
Tensile Strength - No Exposure ksi (MPa)
Tensile Strength - After Exposure
ksi (MPa) 98.93 (682.07) 96.71 (666.78) 103.47 (713.41) 93.00 (641.20) 95.42 (657.86) 92.25 (636.06) 97.34 (671.17) 92.60 (638.48)
101.32 (698.60) 90.48 (623.83) 97.59 (672.83) 82.81 (570.95) 103.81 (715.71) 82.65 (569.89) 93.82 (646.88) 82.23 (566.93) 99.98 (689.36) 90.41 (623.38) 94.41 (650.90) 92.75 (639.49)
103.84 (715.97) 88.34 (609.06) 101.12 (697.21) 94.78 (653.47) 101.98 (703.15) 89.16 (614.72) 96.31 (664.03) 93.22 (642.71) 97.66 (673.35) 85.52 (589.67) 99.94 (689.07) 90.41 (623.35)
101.42 (699.25) 86.72 (597.93) 100.29 (691.48) 93.60 (645.37) 97.26 (670.55) 83.50 (575.74) 96.02 (662.02) 96.48 (665.18)
73.91 (509.56) 85.82 (591.72) 90.01 (620.58) 86.06 (593.33) 89.28 (615.57) 87.52 (603.44) 89.40 (616.41) 93.78 (646.58) 81.78 (563.83) 86.71 (597.85) 94.04 (648.39) 96.62 (666.19) 96.97 (668.55) 92.61 (638.53) 94.68 (652.76) 87.95 (606.40) 91.34 (629.73) 87.46 (602.98) 92.39 (636.97) 88.08 (607.31) 88.59 (610.78) 92.08 (634.86) 89.88 (619.73) 90.17 (621.69) 89.80 (619.17) 91,09 (628.02) 93.68 (645.87)
Mean Standard Deviation
Mean Standard Deviation
Mean Standard Deviation
Mean Standard Deviation
100.16 (690.59) 87.34 (602.20) 98.03 (675.90) 90.91 (626.81) 2.83 (19.48) 5.36 (36.96) 3.10 (21.37) 3.77 (26.03)

TxDOT 0-6069-1 Long-term performance of GFRP reinforcement
46
5.1.1. Potential Influence of Beam Storage Position on GFRP Bar Tensile Capacity
Figure 5.2 shows how the GFRP-reinforced beams were stored for the 7-year exposure
period. The researchers hypothesized that the beams at the tops of the stacks were exposed to
higher temperatures and likely higher moisture conditions. To assess if the beam storage position
influenced the beam capacity, the researchers compared the bar capacities of the top beams with
the bar capacities from the beams below the top position. Figure 5.3 shows a box plot of the bar
capacities from the top beams and the beams below the top. Note that none of the top beams
contained Type P bars, so these were not assessed. Although the Type V1 bars embedded in the
top beams seem to have lower tensile capacities, statistical t-tests of equality conducted for
Types V1 #5, V1 #6, V2 #5, and V2 #6 bars at a 0.05 level of significance indicated that the
hypothesis that the mean tensile stress for the bars embedded in the top beams is the same as the
mean tensile stress for the bars embedded in the beams below the top cannot be rejected. That is,
there is no statistically significant evidence to conclude that beam storage position results in a
different mean tensile stress.
Figure 5-2. Storage Positions of GFRP-Reinforced Beams.

TxDOT 0-6069-1 Long-term performance of GFRP reinforcement
47
40
50
60
70
80
90
100
Top Below Top Below Top Below Top Below5.8
7.3
8.7
10.2
11.6
13.1
14.5
Ten
sile
Cap
acit
y (k
si)
V1 #5 V1 #6 V2 #5 V2 #6
Tensile C
apacity (MP
a)
Figure 5-3. Comparison of Capacities of Bars Stored at Different Locations.
5.1.2. Potential Influence of Depth of Cover on GFRP Bar Tensile Capacity
It has been well documented that exposure conditions can influence the tensile capacity
of GFRP reinforcement. Project 9-1520 evaluated the load-carrying capacity of GFRP-reinforced
beams. GFRP bars were embedded in concrete beams with different depths of cover. Because the
moisture in the concrete could vary as a function of depth and because the amount of moisture
could influence the GFRP bar capacity, the researchers assessed if the depth of bar placement
influenced the change, as a function of time, in the tensile capacity of the bars.
To compare the influence of concrete cover depth, the capacities of all GFRP bars were
normalized to the capacity at time zero. These normalized capacities were then plotted as a
function of depth of cover, as shown in Figure 5.4. The figure indicates that the depth of cover
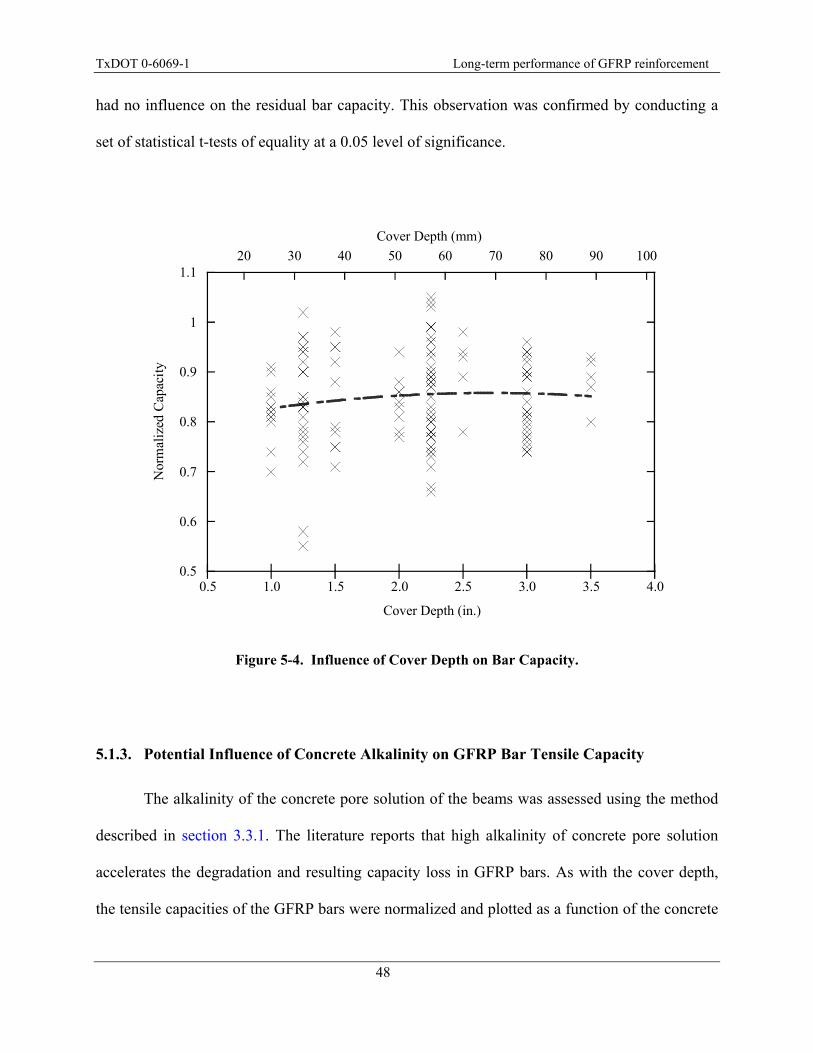
TxDOT 0-6069-1 Long-term performance of GFRP reinforcement
48
had no influence on the residual bar capacity. This observation was confirmed by conducting a
set of statistical t-tests of equality at a 0.05 level of significance.
0.5
0.6
0.7
0.8
0.9
1
1.1
0.5 1.0 1.5 2.0 2.5 3.0 3.5 4.0
20 30 40 50 60 70 80 90 100
Nor
mal
ized
Cap
acit
y
Cover Depth (in.)
Cover Depth (mm)
Figure 5-4. Influence of Cover Depth on Bar Capacity.
5.1.3. Potential Influence of Concrete Alkalinity on GFRP Bar Tensile Capacity
The alkalinity of the concrete pore solution of the beams was assessed using the method
described in section 3.3.1. The literature reports that high alkalinity of concrete pore solution
accelerates the degradation and resulting capacity loss in GFRP bars. As with the cover depth,
the tensile capacities of the GFRP bars were normalized and plotted as a function of the concrete

TxDOT 0-6069-1 Long-term performance of GFRP reinforcement
49
pore solution pH (Figure 5.5). The figure indicates that there is no significant influence of
concrete pore solution pH on the tensile capacity of GFRP bars. However, it should be noted that
the range of the pore solution pH values only ranged from approximately 12.5 to 13—relatively
high values. This indicates that variation in the alkalinity of the concrete pore solution, in the
range of 12.5 to 13 pH for the specimens evaluated in this study had no influence on the tensile
capacity of the GFRP bars. However, if the range of this pore solution pH had been larger, some
influence may have been identified.
0.5
0.6
0.7
0.8
0.9
1
1.1
12.4 12.5 12.6 12.7 12.8 12.9 13
Nor
mal
ized
Cap
acit
y
Alkalinity of Concrete Pore Solution (pH)
Figure 5-5. GFRP Bar Capacity as a Function of Concrete Pore Solution Alkalinity.

TxDOT 0-6069-1 Long-term performance of GFRP reinforcement
50
5.1.4. Potential Influence of Concrete Porosity on GFRP Bar Tensile Capacity
Moisture and concrete pore solution can influence the residual capacity of GFRP bars. A
concrete having high porosity could have more pore solution; therefore, more pore solution can
be transported into the GFRP bar to degrade the bar. As noted in section 3.3.2, the amounts of
permeable voids were assessed for the different beams. Figure 5.6 shows the normalized
capacities of the GFRP bars as a function of concrete porosity. Although the “best fit” line has an
increasing slope, this slope is small and insignificant when compared to the scatter of the data.
As such, for the porosity ranges observed in this research, no influence on GFRP bar capacity
was observed.
0.5
0.6
0.7
0.8
0.9
1.0
1.1
12.0 12.5 13.0 13.5 14.0 14.5 15.0 15.5 16.0
Nor
mal
ized
Cap
acit
y
Percent Porosity
Figure 5-6. Tensile Capacity as a Function of Concrete Porosity.

TxDOT 0-6069-1 Long-term performance of GFRP reinforcement
51
5.2. MODULUS OF ELASTICITY TEST RESULTS
The MOE was assessed for all bars and these are plotted in Figure 5.7 as a function of
concrete cover depth. Appendix C includes the test data from the MOE testing. Note that no
significant change is observed between the unexposed GFRP samples and GFRP samples
embedded in concrete for 7 years. Statistical t-tests of equality at a 0.05 level of significance
indicated that the hypothesis that the mean MOE for the bars embedded in concrete is the same
as the mean MOE for the unexposed bars cannot be rejected. That is, there is no statistically
significant evidence to conclude that embedding the bars results in a mean MOE that differs
from the mean MOE of unexposed bars. Because no significant changes in the MOE could be
observed, no further analysis of the MOE is necessary, as it seems that no factors from this study
impacted this GFRP characteristic. This research indicates that the MOE of GFRP is not reduced
as a function of time (up to 7 years).

TxDOT 0-6069-1 Long-term performance of GFRP reinforcement
52
2000
3000
4000
5000
6000
7000
8000
No
expo
sure
1.25
(32
)
2.25
(57
)
2.5
(64)
3.5
(89)
No
expo
sure
1.0
(25)
1.5
(38)
2.25
(57
)
3.0
(76)
No
expo
sure
1.25
(32
)
2.25
(57
)
3.0
(76)
290
435
580
725
870
1015
1160
Mod
ulus
of
Ela
stic
ity
(ksi
)
Concrete Cover Depth, inches (mm)
V1 V2 P
#5 GFRP Bars
Modulus of E
lasticity (MP
a)
Figure 5-7. MOE as a Function of Time and Cover Depth (Note: All samples except the “no exposure” samples were embedded in concrete for 7 years).
5.3. SUMMARY
The test results indicate that none of the parameters evaluated, with the exception of
embedment time, had a significant influence on the tensile capacity or MOE of the GFRP
reinforcing bars. The tensile capacity of the GFRP bars exhibited a significant reduction, in some
cases more than 20 percent, after 7 years of being embedded in concrete. The following chapter
will develop a model to assess the time-dependent tensile capacity of GFRP bars.

TxDOT 0-6069-1 Long-term performance of GFRP reinforcement
53
6. TIME-VARIANT CAPACITY MODEL FOR GFRP BARS EMBEDDED
IN CONCRETE
The data from the experimental program of this project and the additional data available
from the literature were used by the research team to better understand the long-term
performance of GFRP reinforcing bars embedded in concrete. In particular, the data were used to
construct a probabilistic model that captures the dependency of the tensile strength on time and
other influencing variables. The developed model is probabilistic to properly account for the
relevant sources of uncertainties, including the statistical uncertainty in the estimation of the
unknown model parameters and the model error associated to the inexact model form. This is a
state-of-the-art model to predict the actual performance of GFRP bars embedded in concrete. The
developed time-variant model provides the required information to assess the safety and
performance of GFRP reinforcing bars embedded in decks, pavements, and other infrastructure
elements reinforced with these materials.
6.1 FORMULATION OF THE PROBABILISTIC PREDICTION MODEL
The model in Eq. (2.3) was first modified to provide more flexibility to fit the experimental
data as follows:
020
1tD tR
(6.1)
where, each term has the same definition as in Eq. (2.3). To account for the uncertainty in 0
and t , Eq. (6.1) was then modified as follows:

TxDOT 0-6069-1 Long-term performance of GFRP reinforcement
54
00 0 2
0
, 1 1tD ts sR
x Θ
(6.2)
where, 0( , )D Rx is a vector of basic variables (i.e., diffusion coefficient and radius at 0t ),
0 0s is an error term that captures the variability of 0 around its mean 0
, s is an error
term that captures the variability in the reduction term 20( / )D t R , 0 and are statistically
independent identically distributed random variables with zero mean and unit variance, 0s and s
are the standard deviation of the two error terms, and 0( , , , )s s Θ is a vector of unknown
empirical model parameters introduced to fit the data. Two assumptions were made in
formulating the model: (a) 0s and s are independent of x (homoskedasticity assumption), and
(b) 0 and have a normal distribution (normality assumption). Diagnostic plots of the data and
the residuals against model predictions (Rao and Toutenburg, 1997) were used to verify the
validity of these assumptions.
Based on the normality assumption, Eq. (6.2) was rewritten as:
0
2
2 2 202 2
0 0
,1t D t D ts s
R R
x Θ (6.3)
6.2 BAYESIAN PARAMETER ESTIMATION
The unknown model parameters Θ (i.e., , s0, and s) are empirical and therefore they
have no direct physical meaning. These parameters were used to fit the experimental data. The
parameters were estimated using the Bayesian updating rule (Box and Tiao, 1992):

TxDOT 0-6069-1 Long-term performance of GFRP reinforcement
55
f L pΘ Θ Θ (6.4)
where, ( )p Θ is the prior distribution of Θ based on the knowledge about Θ before observing
the set of data D of size n (i.e., tensile strength data from n number of GFRP reinforcing
samples); ( )L Θ is the likelihood function that represents the information on the model
parameters Θ from the tensile strength data D and is proportional to the conditional probability,
( | )p D Θ , of observing D (i.e., tensile strength corresponding to the parameters in the model) for
given values of Θ ; is a normalizing factor; and ( )f Θ is the posterior distribution of Θ
determined using the Bayesian rule in Equation (6.4), which captures both the information in
( )p Θ and in D. The vector of posterior mean values of Θ were obtained once ( )f Θ was
determined using the Equation (6.4). In the analysis presented in this report, a non-informative
prior distribution provided in Box and Tiao (1992) was assumed to reflect that there is no or little
information available about the model parameters before collecting the experimental data.
For ith data point among the tensile strength data, the residual, ( , )ir , was calculated by
subtracting the mean strength predicted using the proposed model in Equation (6.3) from the
actual strength measured in the laboratory. This is expressed as follows:
0
20
actual strength predictedstrength using the modelmeasured
, 1 ; 1, ...,t i ii
i i
D tr i nR
(6.5)
The likelihood function, ( )L Θ , was written as the product of the probability of observing each
residual, ( , )ir :

TxDOT 0-6069-1 Long-term performance of GFRP reinforcement
56
2
2 2 210 1 12
01
2
2 2 20 2
0
2
2 2 20 2
1 0
,
,
,
nn n
n
ni
i ii i
D tL P s s rR
D tP s s rR
D tP s s rR
Θ
(6.6)
Since has the standard normal distribution, ( )L Θ was rewritten as:
2 2
12 2 2 2 2 20 02 2
0 0
,1ni
ii i
i i
rL
D t D ts s s sR R
Θ (6.7)
where, ( ) denotes the standard normal probability density function (PDF). Table 6-1 lists the
means, standard deviations, and the correlation coefficients of the empirical parameters Θ
obtained using the data from the experimental program of this project and the additional data
available from the literature.
Table 6-1. Posterior Statistics of Unknown Parameter 0( , , , )s s Θ .
Parameter Mean Standard Deviation
Correlation Coefficient
0s
s
0.135 0.011 1 0.207 0.082 0.84 1
0s
0.039 0.003 0.04 0.04 1
s 0.557 0.043 0.28 0.02 0.25 1

TxDOT 0-6069-1 Long-term performance of GFRP reinforcement
57
Figure 6.1 shows a comparison between the predicted and measured normalized stress
capacity, 0
/t , over time. The experimental data are shown as unfilled circles () for all bar
types. The mean prediction ( 0 0 ) is shown as a solid curve (in the left plot for the #3 bars,
in the center plot for the #5 bars, and in the right plot for the #6 bars). The dashed curves delimit
the region within 1 standard deviation of the mean. In addition, the horizontal solid line
(at normalized stress equal to 0.6) represents the ACI 440 minimum capacity requirement,
0ACI440 / , discussed in the last paragraph in Section 2 (i.e., ACI440 ,( 3 )E fu E u aveC f C f ).
An analysis of the data from the experimental program and the additional data available from the
literature showed that 0
/ varies between 0.02 and 0.09. For the purpose of the analysis
conducted in this section, the ACI requirement was computed using 0
/ 0.05 . Note that the
developed model is unbiased and properly accounts for the scatter in the experimental data. It
can also be observed that the decrease in the mean normalized stress capacity, 0
[ / ]tE , is
rapid over the first few years and gradually slows down as time increases. Furthermore, this
reduction in 0
[ / ]tE is more pronounced for smaller bars than for larger bars. Note that there
is no physical relationship between CE and the “normalized stress.” This is explained in
Section 2 of the report. The term CE is the reduction factor representing the detrimental effect of
environmental parameters. The “normalized stress” is the tensile stress capacity at time, t,
divided by the mean capacity at time, t=0.
Figure 6.2 shows the relationship between t and 0R̂ for which the predicted mean of the
normalized stress capacity reaches the corresponding ACI 440 minimum requirement,
0 0,[ / ] ( ) /t E u aveE C f k for 3, ,6k (for example, 3k indicates the 3-standard
deviation and is the value specified by ACI 440). It can be seen that for small GFRP bar sizes,

TxDOT 0-6069-1 Long-term performance of GFRP reinforcement
58
0 0ACI440[ / ] /tE at a time less than the typical service life of a structure. For small
GFRP bar sizes a larger value of k may be required so that 0 0,[ / ] ( ) /t E u aveE C f k
during service time.
0 20 40 60 80 1000.2
0.3
0.4
0.5
0.6
0.7
0.8
0.9
1
1.1
1.2
Time (yr)
Nor
mal
ized
str
ess
0 20 40 60 80 1000.2
0.3
0.4
0.5
0.6
0.7
0.8
0.9
1
1.1
1.2
Time (yr)
Nor
mal
ized
str
ess
0 20 40 60 80 1000.2
0.3
0.4
0.5
0.6
0.7
0.8
0.9
1
1.1
1.2
Time (yr)
Nor
mal
ized
str
ess
Figure 6-1. Comparison between the Predicted and Measured Normalized Stress
0/t over Time.
Figure 6-2. Values of t and 0R̂ for which 0 0,[ / ] ( ) /t E u aveE C f k for 3, ,6k .
#3 GFRP bar #5 GFRP bar #6 GFRP bar

TxDOT 0-6069-1 Long-term performance of GFRP reinforcement
59
6.3 PROBABILITY OF NOT MEETING DESIGN SPECIFICATIONS OVER TIME
Following the conventional notation in reliability theory (Ditlevsen and Madsen, 1996), a
limit state function ( )g was introduced such that the event { ( ) 0}g denotes not meeting a
specified capacity requirement. In particular, the ACI 440 minimum capacity
requirement, ACI440 , was considered.
Using the probabilistic model described in Eq. (6.2), a limit state function was written as:
ACI440 ACI440, , ,tg x Θ x Θ (6.8)
Therefore, the probability of not meeting the design specifications at any time t was written as:
ACI440 , , 0P g x Θ (6.9)
The uncertainty in Eq. (6.9) arises from the inexact nature of the model ( , )t x Θ captured
in 0 and , the inherent randomness (or aleatory uncertainty) in x , and the statistical
uncertainty in Θ . Because the uncertainty in 0 and typically prevails over the other sources,
a point estimate of Eq. (6.9) was obtained using point estimates (e.g., the nominal values or the
means) x̂ and Θ̂ in place of x and Θ as follows:
0
ˆ
ACI44020
ACI440 ˆ2
2 2 20 2
0
ˆˆ1
ˆˆˆ, , 0
ˆˆˆ ˆ
ˆ
D tR
P gD ts sR
x Θ (6.10)

TxDOT 0-6069-1 Long-term performance of GFRP reinforcement
60
where, ( ) denotes the standard normal cumulative distribution function. Furthermore, the
reliability index (Ditlevsen and Madsen, 1996) corresponding to the probability in Eq. (6.10) was
obtained as
1ACI440 ACI440
ˆ ˆˆ ˆ, , 1 , , 0P g x Θ x Θ (6.11)
where, 1( ) denotes the inverse of the standard normal cumulative distribution function. The
probability of not meeting the ACI 440 design specifications and the corresponding reliability
index are functions of the initial radius of a GFRP bar, 0R , and time, t . Figure 6.3 shows a
conceptual three-dimensional plot of the probability of not meeting the ACI 440 Code as a
function of the nominal radius, 0R̂ , and t . Consistent with the observations made for Figure 6.1,
it can be seen that for a specified bar size, the probability increases with t . Conversely, at the
same time, t , the probability decreases as the bar size increases.
Time, t
Radius,
Probability of not Meeting ACI 440
P2
P1
0R̂
Figure 6-3. Conceptual Plot of the Probability of Not Meeting ACI 440 Specification as a Function of Time and Bar Size.

TxDOT 0-6069-1 Long-term performance of GFRP reinforcement
61
Figure 6.4 shows the ACI440[ ( , , ) 0]P g x Θ as a function of time. The dotted line shows
the probability for the #3 bars, the dashed line shows the probability for #5 bars, and the solid
line shows the probability for #6 bars. Consistent with the observations made from Figure 6.1, in
100 years #3 bars reach a 0.44 probability of not meeting the ACI 440 requirement, #5 bars reach
a 0.25 probability, and #6 bars reach a 0.2 probability. Figure 6.5 shows the
ACI440[ ( , , ) 0]P g x Θ as a function of 0R̂ . The solid line shows the probability for
25t years, the dashed line shows the probability for 50t years, the dashed-dotted line
shows the probability for 75t years, and the dotted line shows the probability for
100t years. It can be seen that ACI440[ ( , , ) 0]P g x Θ decreases as 0R̂ increases and that the
effect of 0R̂ is more pronounced shortly after the bars are embedded in concrete than later times.
Finally, Figure 6.6 shows a contour plot of the iso-probability lines for ACI440[ ( , , ) 0]P g x Θ as
a function of t and 0R̂ . The iso-probability lines connect pairs of values of t and 0R̂ that
correspond to the same ACI440[ ( , , ) 0]P g x Θ . Consistent with what was observed in Figures 6.4
and 6.5, Figure 6.6 shows that ACI440[ ( , , ) 0]P g x Θ increases as t increases and that bars with
larger 0R̂ are less prone to deteriorate than bars with smaller 0R̂ .

TxDOT 0-6069-1 Long-term performance of GFRP reinforcement
62
Figure 6-4. Probability of Not Meeting ACI 440 Specifications as a Function of t for #6 Bars (solid line), #5 Bars (dashed line), and #3 Bars (dotted line).
Figure 6-5. Probability of Not Meeting ACI 440 Specification as a Function of 0R̂
for 25t years (solid line), 50t years (dashed line), 75t years (dashed-dotted line), and 100t years (dotted line).

TxDOT 0-6069-1 Long-term performance of GFRP reinforcement
63
0.050.05
0.05
0.1
0.1
0.1
0.1
0.15
0.15
0.15
0.15
0.2
0.2
0.2
0.2
0.25
0.25
0.25
0.3
0.3
0.3
0.35
0.35
0.35
0.4
0.4
0.45
0.45
0.5
0.5
0.55
R (in)
Tim
e (y
r)
0.1 0.15 0.2 0.25 0.3 0.35 0.40
20
40
60
80
100
Figure 6-6. Contour Lines for the Probability of Not Meeting ACI 440 as a Function
of t and the 0R̂ .


TxDOT 0-6069-1 Long-term performance of GFRP reinforcement
65
7. SUMMARY AND CONCLUSIONS
GFRP reinforcing bars can provide many advantages to the owners and constructors of
infrastructure systems. These advantages have been widely reported. Although the advantages
are many, the acceptance of using GFRP bars has been hampered by longer-term data on residual
strengths when embedded in concrete. This research evaluated the residual capacity and modulus
of elasticity of GFRP embedded in concrete for 7 years. The authors found no information in the
literature that provides results from GFRP-reinforced beams beyond 3 years. These data can
provide valuable information to the GFRP engineering community.
A state-of-the-art model to predict the actual performance of GFRP bars embedded in
concrete was developed. The data from the experimental program of this project and the
additional data available from the literature were used to construct the probabilistic model
capturing the dependency of the tensile strength on time and the initial bar size. The developed
probabilistic model is unbiased and properly accounts for the relevant sources of uncertainties,
including the statistical uncertainty in the estimation of the unknown model parameters and the
model error associated to the inexact model form. The developed time-variant model can provide
required information to assess the safety and performance of GFRP reinforcing bars embedded in
decks, pavements, and other infrastructure elements over time.
The model indicates that the decay of the mean stress capacity is rapid over the first few
years and gradually slows as time increases. Furthermore, the decay is more pronounced for
smaller bars than for larger bars. The developed probabilistic model was also used to assess the
probability that the actual stress capacity of GFRP bars does not meet the ACI 440 minimum
capacity requirement over time. The model predicted that for a specified bar size, the probability
of not meeting the ACI 440 requirement increases with time. Conversely, at the same time, the

TxDOT 0-6069-1 Long-term performance of GFRP reinforcement
66
probability decreases as the bar size increases. In particular, in 100 years #3 bars reach a
0.44 probability of not meeting the ACI 440 requirement, #5 bars reach a 0.25 probability, and
#6 bars reach a 0.2 probability.
While the developed model provides valuable information on the long-term performance
of GFRP bars embedded in concrete, additional research is needed to assess the time-variant
structural reliability of whole structures. A reliability analysis would answer the fundamental
question on the actual safety of structures with GFRP bars. The developed probabilistic model
should be used in assessing the structural capacity over time needed for a time-variant structural
reliability analysis. It should also be noted that the GFRP reinforcing bars assessed in this
research were embedded in concrete that was not subjected to loads other than the self-weight of
the beam. The literature indicates that the residual capacity of GFRP subjected to load is less
than GFRP bars subjected to no load.

TxDOT 0-6069-1 Long-term performance of GFRP reinforcement
67
REFERENCES
Abbasi, A., and Hogg, P. J. (2005). "Temperature and Environmental Effects on Glass Fiber Rebar: Modulus, Strength and Interfacial Bond Strength with Concrete." Composites Part B-Engineering, 36(5), pp. 394-404.
ACI Committee 440 (2003). "Guide for the Design and Construction of Concrete Reinforced with FRP Bars." Farmington Hills, MI, American Concrete Institute.
Almusallam, T. H., Al-Salloum, Y. A., Alsayed, S. H., and Alhozaimy, A. M. (2002). “Tensile Strength of GFRP Bars in Concrete Beams Under Sustained Loads at Different Environments,” Second International Conference on Durability of Fiber Reinforced Polymer (FRP) Composites for Construction, Sherbooke, Quebec, Canada, May 29-31, 2002, pp. 523-533.
American Association of State Highway and Transportation Officials Load and Resistance Factor Design (AASHTO LRFD), Bridge Design Guide Specifications for GFRP Reinforced Concrete Decks and Traffic Railings, American Association of State Highway and Transportation Officials, Washington, D. C., 2008.
ASTM C642 (1997). "Standard Test Method for Density, Absorption, and Voids in Hardened Concrete," Annual Book of ASTM Standards, ASTM.
ASTM D2584 (2008). "Standard Test Method for Ignition Loss of Cured Reinforced Resins," Annual Book of ASTM Standards, ASTM.
Bakis, C., Freimanis, A., Gremel, D., and Nanni, A., (1998). “Effect of Material on Bond and Tensile Properties of Unconditioned and Conditioned FRP Reinforcement Rods, Proceedings of the First International Conference (CDCC’98) on Durability of Fiber Reinforced Polymer (FRP) Composites for Construction,” 1998, pp. 525-535.
Bakis, C. E., Boothby, T. E., Schaut, R. A., and Pantano, C. G. (2005). "Tensile Strength of GFRP Bars Under Sustained Loading in Concrete Beams." Preceedings of the 7th International Symposium. Fiber Reinforced Polymer Reinforcement for Concrete Structures, FRPRCS-7, American Concrete Institute, pp. 1429-1446.
Bank, L. C., Puterman, M. and Katz, A. (1998). “The Effect of Material Degradation on Bond Properties of FRP Reinforcing Bars in Concrete.” ACI Material Journal, 95(3), pp. 232-243.
Benmokrane, B., Wang, P., Ton-That, T. M., Rahman, H., and Robert, J. F. (2002). "Durability of Glass Fiber-Reinforced Polymer Reinforcing Bars in Concrete Environment." Journal of Composites for Construction, 6(3), pp. 143-153.
Box, G. E. P., and Tiao, G. C. (1992). Bayesian Inference in Statistical Analysis, Addison–Wesley, Reading, Mass.
Ceroni, F., Cosenza, E., Gaetano, M., and Pecce, M. (2006). "Durability Issues of FRP Rebars in Reinforced Concrete Members." Cement & Concrete Composites, 28(10), pp. 857-868.
Debaiky, A. S., Nkurunziza, G., Benmokrane, B., and Cousin, P. (2006). "Residual Tensile Properties of GFRP Reinforcing Bars After Loading in Severe Environments." Journal of Composites for Construction, 10(5), pp. 370-380.
Dejke, V. (2001). Durability of FRP Reinforcement in Concrete. Thesis, Department of Building Materials, Chalmers University of Technology, Sweden.
Ditlevsen, O., and Madsen, H. O. (1996). Structural Reliability Methods, Wiley, New York.
Environmental Protection Agency, Test Method 9045D "Soil and Waste pH." No Date Provided, Washington, D.C.
Giernacky, R. G., Bakis, C. E., Mostoller, J. D., Boothby, T. E., and Mukherjee, A. (2002). “Evaluation of Concrete Beams Reinforced with Internal GFRP Bars: A Long-Term Durability Study,” Second International Conference on Durability of Fiber Reinforced Polymer (FRP) Composites for Construction (CDCC 02), Montreal, Quebec, Canada, May, pp. 39-45.
Kajorncheappunngam, S., Gupta, R. K., and GangaRao, H. V. S. (2002). "Effect of Aging Environment on Degradation of Glass-Reinforced Epoxy." Journal of Composite for Construction, 6(1), pp. 61-69.
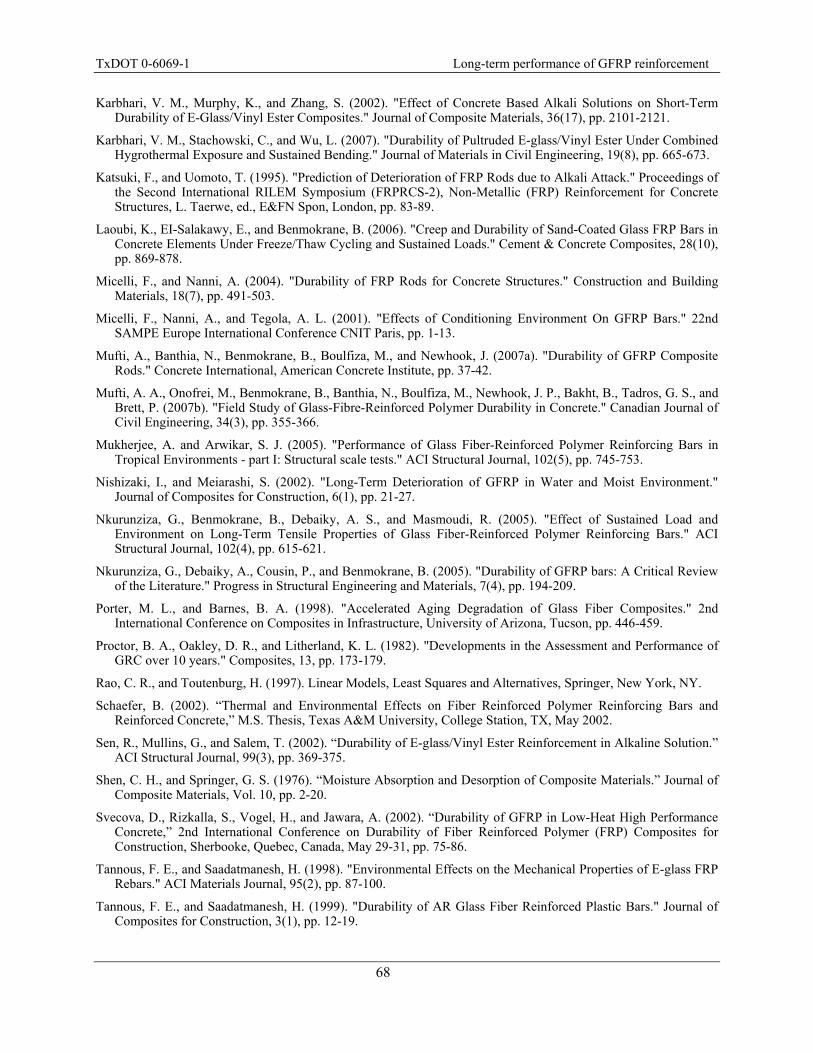
TxDOT 0-6069-1 Long-term performance of GFRP reinforcement
68
Karbhari, V. M., Murphy, K., and Zhang, S. (2002). "Effect of Concrete Based Alkali Solutions on Short-Term Durability of E-Glass/Vinyl Ester Composites." Journal of Composite Materials, 36(17), pp. 2101-2121.
Karbhari, V. M., Stachowski, C., and Wu, L. (2007). "Durability of Pultruded E-glass/Vinyl Ester Under Combined Hygrothermal Exposure and Sustained Bending." Journal of Materials in Civil Engineering, 19(8), pp. 665-673.
Katsuki, F., and Uomoto, T. (1995). "Prediction of Deterioration of FRP Rods due to Alkali Attack." Proceedings of the Second International RILEM Symposium (FRPRCS-2), Non-Metallic (FRP) Reinforcement for Concrete Structures, L. Taerwe, ed., E&FN Spon, London, pp. 83-89.
Laoubi, K., EI-Salakawy, E., and Benmokrane, B. (2006). "Creep and Durability of Sand-Coated Glass FRP Bars in Concrete Elements Under Freeze/Thaw Cycling and Sustained Loads." Cement & Concrete Composites, 28(10), pp. 869-878.
Micelli, F., and Nanni, A. (2004). "Durability of FRP Rods for Concrete Structures." Construction and Building Materials, 18(7), pp. 491-503.
Micelli, F., Nanni, A., and Tegola, A. L. (2001). "Effects of Conditioning Environment On GFRP Bars." 22nd SAMPE Europe International Conference CNIT Paris, pp. 1-13.
Mufti, A., Banthia, N., Benmokrane, B., Boulfiza, M., and Newhook, J. (2007a). "Durability of GFRP Composite Rods." Concrete International, American Concrete Institute, pp. 37-42.
Mufti, A. A., Onofrei, M., Benmokrane, B., Banthia, N., Boulfiza, M., Newhook, J. P., Bakht, B., Tadros, G. S., and Brett, P. (2007b). "Field Study of Glass-Fibre-Reinforced Polymer Durability in Concrete." Canadian Journal of Civil Engineering, 34(3), pp. 355-366.
Mukherjee, A. and Arwikar, S. J. (2005). "Performance of Glass Fiber-Reinforced Polymer Reinforcing Bars in Tropical Environments - part I: Structural scale tests." ACI Structural Journal, 102(5), pp. 745-753.
Nishizaki, I., and Meiarashi, S. (2002). "Long-Term Deterioration of GFRP in Water and Moist Environment." Journal of Composites for Construction, 6(1), pp. 21-27.
Nkurunziza, G., Benmokrane, B., Debaiky, A. S., and Masmoudi, R. (2005). "Effect of Sustained Load and Environment on Long-Term Tensile Properties of Glass Fiber-Reinforced Polymer Reinforcing Bars." ACI Structural Journal, 102(4), pp. 615-621.
Nkurunziza, G., Debaiky, A., Cousin, P., and Benmokrane, B. (2005). "Durability of GFRP bars: A Critical Review of the Literature." Progress in Structural Engineering and Materials, 7(4), pp. 194-209.
Porter, M. L., and Barnes, B. A. (1998). "Accelerated Aging Degradation of Glass Fiber Composites." 2nd International Conference on Composites in Infrastructure, University of Arizona, Tucson, pp. 446-459.
Proctor, B. A., Oakley, D. R., and Litherland, K. L. (1982). "Developments in the Assessment and Performance of GRC over 10 years." Composites, 13, pp. 173-179.
Rao, C. R., and Toutenburg, H. (1997). Linear Models, Least Squares and Alternatives, Springer, New York, NY.
Schaefer, B. (2002). “Thermal and Environmental Effects on Fiber Reinforced Polymer Reinforcing Bars and Reinforced Concrete,” M.S. Thesis, Texas A&M University, College Station, TX, May 2002.
Sen, R., Mullins, G., and Salem, T. (2002). “Durability of E-glass/Vinyl Ester Reinforcement in Alkaline Solution.” ACI Structural Journal, 99(3), pp. 369-375.
Shen, C. H., and Springer, G. S. (1976). “Moisture Absorption and Desorption of Composite Materials.” Journal of Composite Materials, Vol. 10, pp. 2-20.
Svecova, D., Rizkalla, S., Vogel, H., and Jawara, A. (2002). “Durability of GFRP in Low-Heat High Performance Concrete,” 2nd International Conference on Durability of Fiber Reinforced Polymer (FRP) Composites for Construction, Sherbooke, Quebec, Canada, May 29-31, pp. 75-86.
Tannous, F. E., and Saadatmanesh, H. (1998). "Environmental Effects on the Mechanical Properties of E-glass FRP Rebars." ACI Materials Journal, 95(2), pp. 87-100.
Tannous, F. E., and Saadatmanesh, H. (1999). "Durability of AR Glass Fiber Reinforced Plastic Bars." Journal of Composites for Construction, 3(1), pp. 12-19.

TxDOT 0-6069-1 Long-term performance of GFRP reinforcement
69
Trejo, D., Aguiniga, F., Yuan, R., James, R. W., and Keating, P. B. (2005). Characterization of Design Parameters for Fiber Reinforced Polymer Composite Reinforced Concrete Systems, Texas Transportation Institute Research Report 9-1520-3, June 2005.
Uomoto, T. (1996). "Durability of FRP Reinforcement as Concrete Reinforcement." FRP Composites in Civil Engineering, 1, pp. 85-96.
Vijay and GangaRao,(1999)."Accelerated and Natural Weathering of Glass Fiber Reinforced Plastic Bars," SP 188-53, pp. 605-614, American Concrete Institute, Farmington Hills, MI.


TxDOT 0-6069-1 Long-term performance of GFRP reinforcement
71
APPENDIX A – T-TEST RESULTS FOR MODULUS OF
ELASTICITY(MOE)


TxDOT 0-6069-1 Long-term performance of GFRP reinforcement
73
Table A-1 The t-test results for Modulus of elasticity of V1 #5 bars
BAR
V1
#5(1.25"-2.25") #5(2.25"-2.5") #5(2.5"-3.5")
Beam 20/1.25"
A+B
Beam 5/2.25"
A+B
Beam 8/2.5"
A+B Beam 19/1.25" Beam 31/2.25" Beam 29/3.5"
Beam 5/2.25" Beam 8/2.5"
Beam 31/2.25"
1 5616.67 5840.88 5695.93 5840.88 5829.48 5840.88
2 5688.72 5736.80 5505.01 5736.80 5698.19 5736.80
3 5488.62 5789.00 5397.25 5789.00 5727.73 5789.00
4 5758.70 5738.12 5855.19 5738.12 4325.29 5738.12
5 2150.77 5807.65 6132.69 5807.65 6056.01 5807.65
6 5823.07 5384.50 5977.75 5384.50 5780.36 5384.50
7 5270.64 5827.72 5830.41 5827.72 5919.23 5827.72
8 5326.62 5806.35 5894.28 5806.35 5859.67 5806.35
9 5695.93 5807.60 5345.61 5807.60 5486.71 5807.60
10 5505.01 5637.36 5319.06 5637.36 6026.31 5637.36
11 5397.25 5913.39 5605.20
12 5855.19 5414.58
13 6132.69 5717.65
14 5977.75 5091.94
15 5830.41 5829.48
16 5894.28 5698.19
17 5345.61 5727.73
18 5319.06 4325.29
19 5913.39 6056.01
20 5414.58 5780.36
21 5717.65
22 5091.94
n 22 10 20 10 11 10
x(mean) 5464.30 5737.60 5625.39 5737.60 5664.93 5737.60
S 787.09 137.72 408.46 137.72 475.56 137.72
SP^2 439342.41 119306.73 128013.17
SP 662.83 345.41 357.79
to -1.08 -0.84 -0.46
n1+n2-2 30 28 19
t0.025, n1+n2-2 2.042 2.048 2.093
reject or not (assume σ1=σ2)
not rejected not rejected not rejected
T0* -1.58 -1.11 -0.48
ν 24 26 12
t0.025, ν 2.07 2.06 2.20
reject or not (assume σ1≠σ2)
not rejected not rejected not rejected

TxDOT 0-6069-1 Long-term performance of GFRP reinforcement
74
Table A-2 The t-test results for Modulus of elasticity of V2 #5 bars
BAR
V2
#5(1"-1.5") #5(1.5"-2.25") #5(2.25"-3")
Beam 23/1"
A+B
Beam 14/1.5"
A+B
Beam 13/2.25"
A+B Beam 14/1.5" Beam 13/2.25" Beam 30/2.25"
Beam 30/2.25" Beam 2/3"
Beam 32/3"
1 5393.72 5637.46 5039.75 5637.46 5510.66 5637.46
2 5394.14 5625.96 5308.68 5625.96 5627.79 5625.96
3 5381.73 5635.50 5946.71 5635.50 5563.81 5635.50
4 5375.92 5532.84 5606.58 5532.84 5418.80 5532.84
5 5604.16 5482.28 5510.66 5482.28 5602.45 5482.28
6 5039.75 5558.43 5627.79 5558.43 5103.36 5558.43
7 5308.68 5659.64 5563.81 5659.64 5679.22 5659.64
8 5946.71 5327.22 5418.80 5327.22 5633.96 5327.22
9 5606.58 5546.25 5602.45 5546.25 5964.18 5546.25
10 5103.36 5309.70
11 5679.22 5495.00
12 5633.96 5418.45
13 5964.18 5604.78
14 5309.70 5952.53
15 5495.98
16 5316.11
17 5276.02
18 3539.92
19 5551.02
20 5626.41
Average 5450.15 5556.18 5522.55 5556.18 5434.51 5556.18
Standard Deviation 249.93 104.29 270.17 104.29 490.85 104.29
Coefficients of Variation 0.05 0.02 0.05 0.02 0.09 0.02
n 9 9 14 9 20 9
x(mean) 5450.15 5556.18 5522.55 5556.18 5434.51 5556.18
S 249.93 104.29 270.17 104.29 490.85 104.29
SP^2 36670.27 49328.99 172770.82
SP 191.49 222.10 415.66
to -1.17 -0.35 -0.73
n1+n2-2 16 21 27
t0.025, n1+n2-2 2.120 2.080 2.052
reject or not not rejected not rejected not rejected
T0* -1.17 -0.42 -1.06
ν 11 18 22
t0.025, ν 2.23 2.10 2.07
reject or not not rejected not rejected not rejected

TxDOT 0-6069-1 Long-term performance of GFRP reinforcement
75
Table A-3 The t-test results for Modulus of elasticity of P #5 bars
BAR
P #5(1.25"-1.5") #5(1.5"-2.25") #5(2.25"-3")
Beam 22/1.25"
A+B
Beam 25/1.5"
A+B
Beam 3/2.25"
A+B Beam 25/1.5" Beam 3/2.25" Beam 10/2.25"
Beam 10/2.25" Beam 6/3" Beam 27/3"
1 3500.89 5647.66 5379.32 5647.66 5379.32 5647.66 2 5050.61 5572.83 6546.79 5572.83 6546.79 5572.83 3 5335.64 5539.47 5693.19 5539.47 5693.19 5539.47 4 5591.08 4670.91 5671.06 4670.91 5671.06 4670.91 5 5653.92 5580.77 5497.83 5580.77 5497.83 5580.77 6 5635.37 5635.37 5861.20 5635.37 7 7364.90 7364.90 5322.72 7364.90 8 5396.92 5396.92 5757.13 5396.92 9 4713.67 4713.67 5404.21 4713.67 10 5639.40 5639.40 5788.80 5639.40
Average 5026.43 5576.19 5757.64 5576.19 5692.23 5576.19 Standard Deviation 885.44 730.99 459.63 730.99 354.02 730.99
Coefficients of Variation 0.18 0.13 0.08 0.13 0.06 0.13 n 5 10 5 10 10 10
x(mean) 5026.43 5576.19 5757.64 5576.19 5692.23 5576.19 S 885.44 730.99 459.63 730.99 354.02 730.99
SP^2 611163.46 434932.60 329838.71 SP 781.77 659.49 574.32 to -1.28 0.50 0.45
n1+n2-2 13 13 18 t0.025, n1+n2-2 2.160 2.160 2.101
reject or not not rejected not rejected not rejected T0* -1.20 0.59 0.45 ν 7 12 13
t0.025, ν 2.45 2.20 2.16 reject or not not rejected not rejected not rejected

TxDOT 0-6069-1 Long-term performance of GFRP reinforcement
76
Table A-4 The t-test results for Modulus of elasticity of V1 #6 bars
BAR V1
#6(1"-1.25") #6(1.25"-2") #6(2"-2.25") #6(2.25"-2.5") #6(2.5"-3")
Beam 15/1" A+B
Beam 21/1.25"A+B
Beam 9/2" A+B
Beam 4/2.25" A+B
Beam 1/2.5"A+B
Beam 21/1.25" Beam 9/2" Beam 4/2.25" Beam 1/2.5" Beam 28/3"
1 4289.85 6255.60 6012.01 6255.60 6276.71 6255.60 6116.05 6255.60 5963.91 6255.60
2 5915.13 6031.66 5990.28 6031.66 6461.15 6031.66 6666.26 6031.66 5838.12 6031.66
3 5865.57 6441.40 5392.63 6441.40 5840.45 6441.40 5535.70 6441.40 6025.85 6441.40
4 5819.50 6557.23 6450.36 6557.23 6418.52 6557.23 5974.52 6557.23 5829.82 6557.23
5 6745.94 6264.67 6276.71 6264.67 6206.84 6264.67 5944.82 6264.67 6379.49 6264.67
6 6012.01 6304.24 6461.15 6304.24 6116.05 6304.24 5963.91 6304.24 6279.60 6304.24
7 5990.28 6413.70 5840.45 6413.70 6666.26 6413.70 5838.12 6413.70 5469.75 6413.70
8 5392.63 6525.39 6418.52 6525.39 5535.70 6525.39 6025.85 6525.39 6683.71 6525.39
9 6450.36 6939.83 6206.84 6939.83 5974.52 6939.83 5829.82 6939.83 5134.17 6939.83
10 5944.82 6379.49 6439.16
Average 5831.25 6414.86 6116.55 6414.86 6144.10 6414.86 6027.45 6414.86 6004.36 6414.86
Standard Deviation 694.13 253.92 350.42 253.92 333.60 253.92 310.96 253.92 467.89 253.92
Coefficients of Variation 0.12 0.04 0.06 0.04 0.05 0.04 0.05 0.04 0.08 0.04
n 9 9 9 9 10 9 10 9 10 9
x(mean) 5831.25 6414.86 6116.55 6414.86 6144.10 6414.86 6027.45 6414.86 6004.36 6414.86
S 694.13 253.92 350.42 253.92 333.60 253.92 310.96 253.92 467.89 253.92
SP^2 273148.18 93632.90 89258.66 81531.67 146239.63
SP 522.64 305.99 298.76 285.54 382.41
to -2.37 -2.07 -1.97 -2.95 -2.34
n1+n2-2 16 16 17 17 17
t0.025, n1+n2-2 2.120 2.120 2.110 2.110 2.110
reject or not rejected not rejected not rejected rejected rejected
T0* -2.37 -2.07 -2.00 -2.99 -2.41
ν 10 15 17 17 14
t0.025, ν 2.23 2.14 2.12 2.12 2.14
reject or not rejected not rejected not rejected rejected rejected

TxDOT 0-6069-1 Long-term performance of GFRP reinforcement
77
Table A-5 The t-test results for Modulus of elasticity of V2 #6 bars
BAR
V2
#6(1"-1.5") #6(1.5"-2.25") #6(2.25"-3")
Beam 18/1"
A+B
Beam 16/1.25"
A+B
Beam 7/2"
A+B Beam 16/1.25" Beam 7/2" Beam 36/2"
Beam 36/2" Beam 12/3"
Beam 26/3"
1 5865.81 5511.40 5621.59 5511.40 5977.32 5511.40
2 5763.73 5609.25 6050.58 5609.25 5909.22 5609.25
3 3814.28 5742.67 6031.56 5742.67 5604.56 5742.67
4 5621.59 5730.33 5779.07 5730.33 5939.71 5730.33
5 6050.58 5532.02 5977.32 5532.02 5541.90 5532.02
6 6031.56 5810.13 5909.22 5810.13 5751.97 5810.13
7 5779.07 5723.58 5604.56 5723.58 6087.03 5723.58
8 5826.71 5939.71 5826.71 5900.86 5826.71
9 5849.82 5541.90 5849.82 5749.47 5849.82
10 5674.41 5674.41 5836.87 5674.41
Average 5560.94 5701.03 5828.39 5701.03 5829.89 5701.03
Standard Deviation 785.00 118.60 196.57 118.60 169.16 118.60
Coefficients of Variation 0.14 0.02 0.03 0.02 0.03 0.02
n 7 10 9 10 10 10
x(mean) 5560.94 5701.03 5828.39 5701.03 5829.89 5701.03
S 785.00 118.60 196.57 118.60 169.16 118.60
SP^2 254931.40 25630.98 21341.21
SP 504.91 160.10 146.09
to -0.56 1.73 1.97
n1+n2-2 15 17 18
t0.025, n1+n2-2 2.131 2.110 2.101
reject or not not rejected not rejected not rejected
T0* -0.47 1.69 1.97
ν 6 13 16
t0.025, ν 2.45 2.18 2.12
reject or not not rejected not rejected not rejected
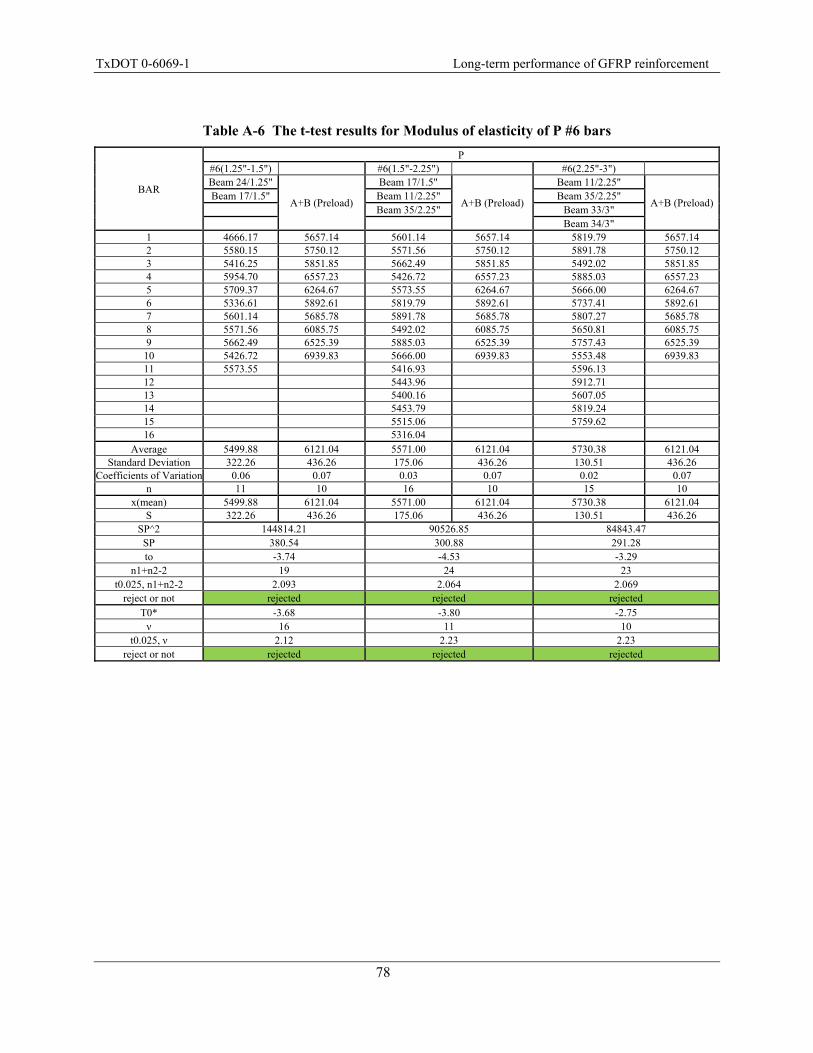
TxDOT 0-6069-1 Long-term performance of GFRP reinforcement
78
Table A-6 The t-test results for Modulus of elasticity of P #6 bars
BAR
P #6(1.25"-1.5") #6(1.5"-2.25") #6(2.25"-3") Beam 24/1.25"
A+B (Preload)
Beam 17/1.5"
A+B (Preload)
Beam 11/2.25"
A+B (Preload)Beam 17/1.5" Beam 11/2.25" Beam 35/2.25"
Beam 35/2.25" Beam 33/3" Beam 34/3"
1 4666.17 5657.14 5601.14 5657.14 5819.79 5657.14 2 5580.15 5750.12 5571.56 5750.12 5891.78 5750.12 3 5416.25 5851.85 5662.49 5851.85 5492.02 5851.85 4 5954.70 6557.23 5426.72 6557.23 5885.03 6557.23 5 5709.37 6264.67 5573.55 6264.67 5666.00 6264.67 6 5336.61 5892.61 5819.79 5892.61 5737.41 5892.61 7 5601.14 5685.78 5891.78 5685.78 5807.27 5685.78 8 5571.56 6085.75 5492.02 6085.75 5650.81 6085.75 9 5662.49 6525.39 5885.03 6525.39 5757.43 6525.39 10 5426.72 6939.83 5666.00 6939.83 5553.48 6939.83 11 5573.55 5416.93 5596.13 12 5443.96 5912.71 13 5400.16 5607.05 14 5453.79 5819.24 15 5515.06 5759.62 16 5316.04
Average 5499.88 6121.04 5571.00 6121.04 5730.38 6121.04 Standard Deviation 322.26 436.26 175.06 436.26 130.51 436.26
Coefficients of Variation 0.06 0.07 0.03 0.07 0.02 0.07 n 11 10 16 10 15 10
x(mean) 5499.88 6121.04 5571.00 6121.04 5730.38 6121.04 S 322.26 436.26 175.06 436.26 130.51 436.26
SP^2 144814.21 90526.85 84843.47 SP 380.54 300.88 291.28 to -3.74 -4.53 -3.29
n1+n2-2 19 24 23 t0.025, n1+n2-2 2.093 2.064 2.069
reject or not rejected rejected rejected T0* -3.68 -3.80 -2.75 ν 16 11 10
t0.025, ν 2.12 2.23 2.23 reject or not rejected rejected rejected

TxDOT 0-6069-1 Long-term performance of GFRP reinforcement
79
APPENDIX B – BEAM CARDS


TxDOT 0-6069-1 Long-term performance of GFRP reinforcement
81
Figure B-1 Beam Card #1

TxDOT 0-6069-1 Long-term performance of GFRP reinforcement
82
Figure B-2 Beam Card #2

TxDOT 0-6069-1 Long-term performance of GFRP reinforcement
83
Figure B-3 Beam Card #3
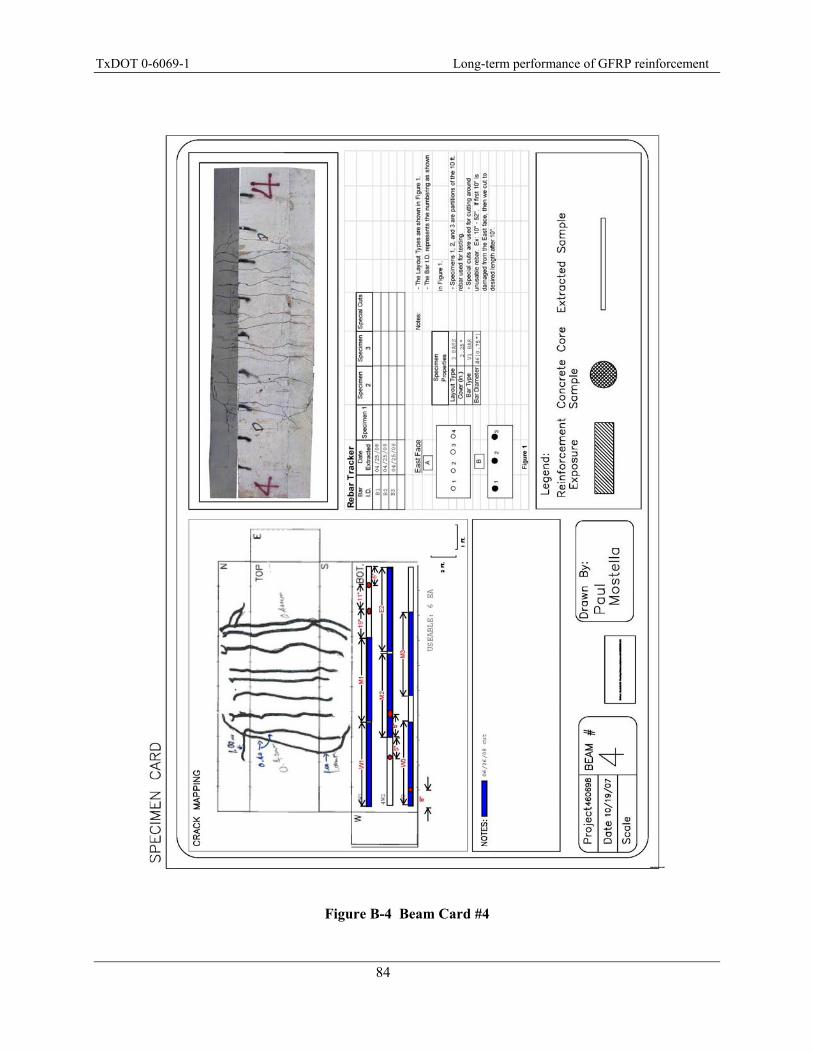
TxDOT 0-6069-1 Long-term performance of GFRP reinforcement
84
Figure B-4 Beam Card #4

TxDOT 0-6069-1 Long-term performance of GFRP reinforcement
85
Figure B-5 Beam Card #5

TxDOT 0-6069-1 Long-term performance of GFRP reinforcement
86
Figure B-6 Beam Card #6

TxDOT 0-6069-1 Long-term performance of GFRP reinforcement
87
Figure B-7 Beam Card #7
TxDOT 0-6069-1 Long-term performance of GFRP reinforcement
88
Figure B-8 Beam Card #8

TxDOT 0-6069-1 Long-term performance of GFRP reinforcement
89
Figure B-9 Beam Card #9

TxDOT 0-6069-1 Long-term performance of GFRP reinforcement
90
Figure B-10 Beam Card #10

TxDOT 0-6069-1 Long-term performance of GFRP reinforcement
91
Figure B-11 Beam Card #11

TxDOT 0-6069-1 Long-term performance of GFRP reinforcement
92
Figure B-12 Beam Card #12

TxDOT 0-6069-1 Long-term performance of GFRP reinforcement
93
Figure B-13 Beam Card #13

TxDOT 0-6069-1 Long-term performance of GFRP reinforcement
94
Figure B-14 Beam Card #14

TxDOT 0-6069-1 Long-term performance of GFRP reinforcement
95
Figure B-15 Beam Card #15

TxDOT 0-6069-1 Long-term performance of GFRP reinforcement
96
Figure B-16 Beam Card #16

TxDOT 0-6069-1 Long-term performance of GFRP reinforcement
97
Figure B-17 Beam Card #17

TxDOT 0-6069-1 Long-term performance of GFRP reinforcement
98
Figure B-18 Beam Card #18

TxDOT 0-6069-1 Long-term performance of GFRP reinforcement
99
Figure B-19 Beam Card #19

TxDOT 0-6069-1 Long-term performance of GFRP reinforcement
100
Figure B-20 Beam Card #20

TxDOT 0-6069-1 Long-term performance of GFRP reinforcement
101
Figure B-21 Beam Card #21

TxDOT 0-6069-1 Long-term performance of GFRP reinforcement
102
Figure B-22 Beam Card #22

TxDOT 0-6069-1 Long-term performance of GFRP reinforcement
103
Figure B-23 Beam Card #23
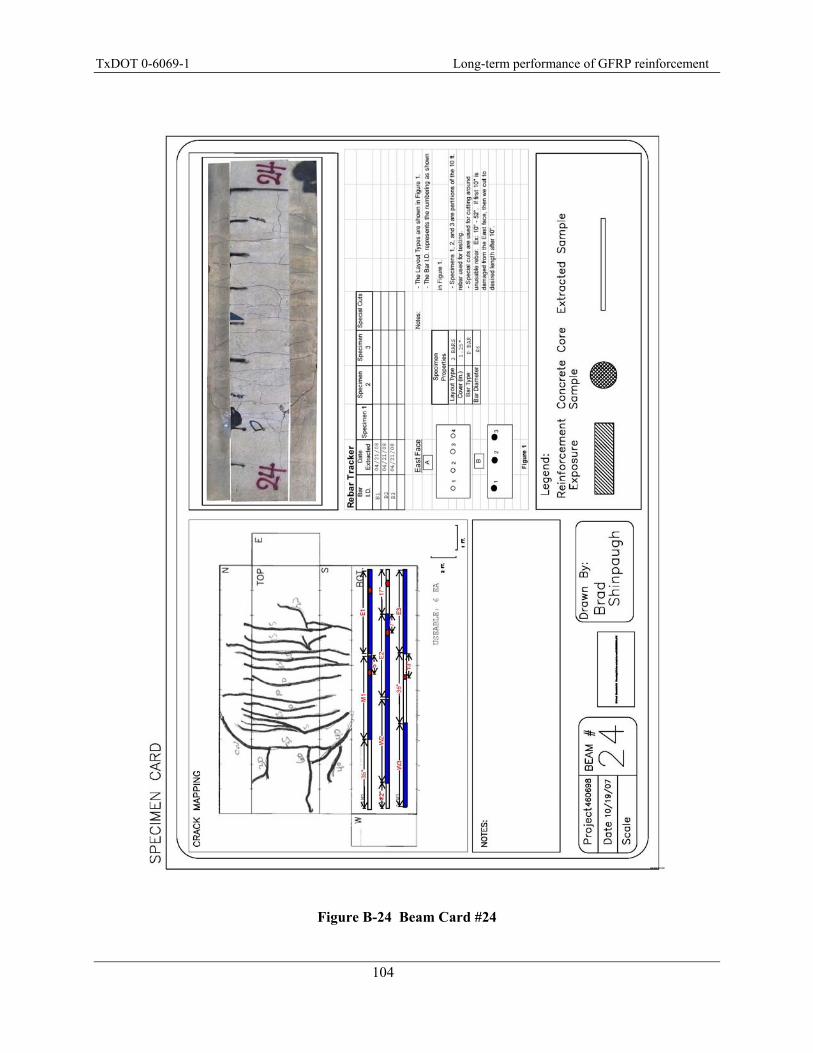
TxDOT 0-6069-1 Long-term performance of GFRP reinforcement
104
Figure B-24 Beam Card #24

TxDOT 0-6069-1 Long-term performance of GFRP reinforcement
105
Figure B-25 Beam Card #25

TxDOT 0-6069-1 Long-term performance of GFRP reinforcement
106
Figure B-26 Beam Card #26

TxDOT 0-6069-1 Long-term performance of GFRP reinforcement
107
Figure B-27 Beam Card #27

TxDOT 0-6069-1 Long-term performance of GFRP reinforcement
108
Figure B-28 Beam Card #28

TxDOT 0-6069-1 Long-term performance of GFRP reinforcement
109
Figure B-29 Beam Card #29

TxDOT 0-6069-1 Long-term performance of GFRP reinforcement
110
Figure B-30 Beam Card #30

TxDOT 0-6069-1 Long-term performance of GFRP reinforcement
111
Figure B-31 Beam Card #31

TxDOT 0-6069-1 Long-term performance of GFRP reinforcement
112
Figure B-32 Beam Card #32
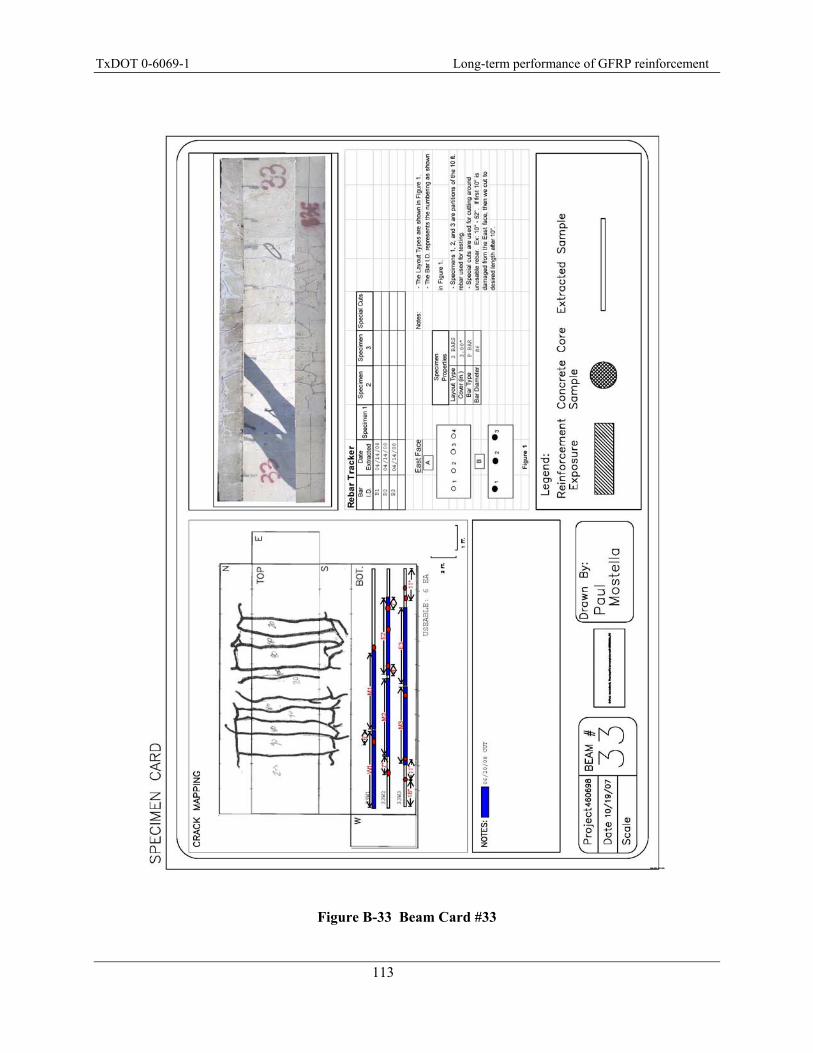
TxDOT 0-6069-1 Long-term performance of GFRP reinforcement
113
Figure B-33 Beam Card #33

TxDOT 0-6069-1 Long-term performance of GFRP reinforcement
114
Figure B-34 Beam Card #34

TxDOT 0-6069-1 Long-term performance of GFRP reinforcement
115
Figure B-35 Beam Card #35

TxDOT 0-6069-1 Long-term performance of GFRP reinforcement
116
Figure B-36 Beam Card #36

TxDOT 0-6069-1 Long-term performance of GFRP reinforcement
117
APPENDIX C – MODULUS OF ELASTICITY (MOE) TEST RESULTS


TxDOT 0-6069-1 Long-term performance of GFRP reinforcement
119
Table C-7 MOE test results for V1 #5 bars
Bar Type MOE - No exposure
ksi (MPa)
MOE after 7 years of Embedment in Concrete ksi (MPa)
V1 #5
6952( 47932) 5617( 38726) 5922( 40831) 5689( 39222) 6459( 44533) 5489( 37843) 5864( 40431) 5759( 39705) 6212( 42830) 2151( 14829)
5823( 40149) 5271( 36340) 5327( 36726) 5696( 39272) 5505( 37956) 5397( 37213) 5855( 40370) 6133( 42283) 5978( 41215) 5830( 40199) 5894( 40640) 5346( 36857) 5319( 36674) 5913( 40771) 5415( 37332) 5718( 39422) 5092( 35108) 5829( 40193) 5698( 39288) 5728( 39491) 4325( 29822) 6056( 41755) 5780( 39854) 5919( 40812) 5860( 40401) 5487( 37830) 6026( 41550) 5605( 38646)
Mean 6282( 43311) 5531( 38136) Standard Deviation 444( 3063) 697( 4809)

TxDOT 0-6069-1 Long-term performance of GFRP reinforcement
120
Table C-8 MOE test results for V2 #5 bars
Bar Type MOE - No exposure
ksi (MPa)
MOE after 7 years of Embedment in Concrete ksi (MPa)
V2 #5
6923( 47732) 5394( 37188) 6880( 47436) 5394( 37191) 6328( 43630) 5382( 37106) 6110( 42127) 5376( 37066) 5660( 39024) 5604( 38639)
5040( 34748) 5309( 36602) 5947( 41001) 5607( 38656) 5511( 37995) 5628( 38802) 5564( 38361) 5419( 37361) 5602( 38628) 5103( 35186) 5679( 39157) 5634( 38845) 5964( 41122) 5310( 36609) 5495( 37887) 5418( 37359) 5605( 38644) 5953( 41041) 5496( 37893) 5316( 36653) 5276( 36377) 3540( 24407) 5551( 38273) 5626( 38793)
Mean 6380( 43990) 5439( 37503) Standard Deviation 534( 3679) 426( 2937)

TxDOT 0-6069-1 Long-term performance of GFRP reinforcement
121
Table C-9 MOE test results for P #5 bars
Bar Type MOE - No exposure
ksi (MPa)
MOE after 7 years of Embedment in Concrete ksi (MPa)
P #5
6241( 43030) 3501( 24138) 4862( 33522) 5051( 34823) 5849( 40327) 5336( 36788) 5196( 35825) 5591( 38549)
5654( 38982) 5379( 37089) 6547( 45139) 5693( 39253) 5671( 39101) 5498( 37906) 5861( 40412) 5323( 36699) 5757( 39694) 5404( 37261) 5789( 39912)
Mean 5537( 38176) 5470( 37716) Standard Deviation 623( 4296) 640( 4415)

TxDOT 0-6069-1 Long-term performance of GFRP reinforcement
122
Table C-10 MOE test results for V1 #6 bars
Bar Type MOE - No exposure
ksi (MPa)
MOE after 7 years of Embedment in Concrete ksi (MPa)
V1#6
6256( 43131) 4290( 29577) 6032( 41587) 5915( 40783) 6441( 44412) 5866( 40442) 6557( 45211) 5820( 40124) 6265( 43193) 6746( 46512) 6304( 43466) 6012( 41451) 6414( 44221) 5990( 41302) 6525( 44991) 5393( 37181) 6940( 47848) 6450( 44474)
6277( 43276) 6461( 44548) 5840( 40268) 6419( 44254) 6207( 42795) 6116( 42169) 6666( 45962) 5536( 38167) 5975( 41193) 5945( 40988) 5964( 41120) 5838( 40252) 6026( 41547) 5830( 40195) 6379( 43985) 6280( 43296) 5470( 37713) 6684( 46083) 5134( 35399) 6439( 44396)
Mean 6415( 44229) 5999( 41360) Standard Deviation 254( 1751) 510( 3518)

TxDOT 0-6069-1 Long-term performance of GFRP reinforcement
123
Table C-11 MOE test results for V2 #6 bars
Bar Type MOE - No exposure
ksi (MPa)
MOE after 7 years of Embedment in Concrete ksi (MPa)
V2 #6
5810( 40059) 5866( 40443) 5724( 39463) 5764( 39740) 5827( 40174) 3814( 26299) 5850( 40333) 5622( 38759) 5674( 39124) 6051( 41717) 5511( 38000) 6032( 41586) 5609( 38674) 5779( 39845) 5743( 39594) 5977( 41212) 5730( 39509) 5909( 40743) 5532( 38142) 5605( 38642)
5940( 40953) 5542( 38210) 5752( 39658) 6087( 41969) 5901( 40685) 5749( 39641) 5837( 40244)
Mean 5701( 39307) 5719( 39432) Standard Deviation 119( 818) 516( 3555)

TxDOT 0-6069-1 Long-term performance of GFRP reinforcement
124
Table C-12 MOE test results for P #6 bars
Bar Type MOE - No exposure
ksi (MPa)
MOE after 7 years of Embedment in Concrete ksi (MPa)
P#6
5893( 40628) 4666( 32172) 5686( 39202) 5580( 38474) 6086( 41960) 5416( 37344) 6525( 44991) 5955( 41056) 6940( 47848) 5709( 39365) 5657( 39005) 5337( 36795) 5750( 39646) 5601( 38619) 5852( 40347) 5572( 38415) 6557( 45211) 5662( 39041) 6265( 43193) 5427( 37416)
5574( 38428) 5820( 40126) 5892( 40622) 5492( 37866) 5885( 40576) 5666( 39066) 5417( 37348) 5444( 37535) 5400( 37233) 5454( 37603) 5515( 38025) 5316( 36653) 5737( 39558) 5807( 40040) 5651( 38961) 5757( 39696) 5553( 38290) 5596( 38584) 5913( 40767) 5607( 38659) 5819( 40122) 5760( 39711)
Mean 6121( 42203) 5594( 38568) Standard Deviation 436( 3008) 244( 1683)