Embed Size (px)
Citation preview
FINAL PROJECT REPORT #00042134-04-103A
Volume I
GRANT: DTRT13-G-UTC45 Project Period: 10/1/2015 –6/1/16
FRP Reinforcement for Concrete: Performance
Assessment and New Construction
Volume I: Sierrita De La Cruz Creek
Bridge
Participating Consortium Member: University of Miami
Missouri University of Science and Technology
Authors: Omid Gooranorimi Timothy Bradberry
Edward Dauer John Myers
Antonio Nanni
RE-CAST: Research on Concrete Applications For Sustainable Transportation

Tier 1 University Transportation Center DISCLAIMER
The contents of this report reflect the views of the authors, who are responsible for the facts and
the accuracy of the information presented herein. This document is disseminated under the
sponsorship of the U.S. Department of Transportation's University Transportation Centers
Program, in the interest of information exchange. The U.S. Government assumes no liability for
the contents or use thereof.
TECHNICAL REPORT DOCUMENTATION PAGE
Report No. RECAST UTC #00042134-04-103A 2. Government Accession No.
3. Recipient's Catalog No.
4. Title and Subtitle 5. Report Date FRP Reinforcement for Concrete: Performance Assessment and New Construction Volume I: Sierrita De La Cruz Creek Bridge
July 1, 2016 6. Performing Organization Code:
7. Author(s) O. Gooranorimi, T. Bradberry, E. Dauer, J. Myers, A. Nanni
8. Performing Organization Report No. Project #00042134-04-103A103(A)
9. Performing Organization Name and Address 10. Work Unit No. RE-CAST - University of Miami 1251 Memorial Drive, Room 325 Coral Gables, FL 33146-0630
11. Contract or Grant No. USDOT: DTRT13-G-UTC45
12. Sponsoring Agency Name and Address Office of the Assistant Secretary for Research and Technology U.S. Department of Transportation 1200 New Jersey Avenue, SE Washington, DC 20590
13. Type of Report and Period Covered: Final Report Period: 10/1/15 – 7/1/16 14. Sponsoring Agency Code:
15. Supplementary Notes The investigation was conducted in cooperation with the U. S. Department of Transportation. 16. Abstract Glass fiber reinforced polymer (GFRP) composites are emerging as a feasible economical solution to eliminate the corrosion problem of steel reinforcements in the concrete industry. Confirmation of GFRP long-term durability is crucial to extend its application in aggressive environments. The objective of this study is to investigate the performance of GFRP materials exposed to the concrete alkalinity and ambient conditions after 15 years of service in a field application. “Sierrita de la Cruz Creek” Bridge (built in 2000, located 25 miles Northwest of Amarillo, Texas) was chosen as a case study since it was one of the first bridges that included GFRP as both primary and secondary top mat reinforcements in the deck. In order to monitor possible changes in GFRP and concrete after fifteen years of service, samples were extracted from different locations on the bridge for various analyses. Carbonation depth and pH of the concrete surrounding the GFRP bars were measured. Scanning electron microscopy (SEM) imaging and energy dispersive X-Ray spectroscopy (EDS) were performed to monitor any microstructural degradation or change in the GFRP chemical compositions. Finally, GFRP interlaminar (horizontal) shear strength, glass transition temperature (Tg) and fiber content were determined and compared with the results of similar tests performed on control samples at the time of construction. SEM and EDS did not show any sign of GFRP microstructural deterioration or change of chemical composition. Inter-laminar shear strength results were inconclusive as the No. 5 showed a slight improvement, while the strength of No. 6 decreased. Tg and fiber content were comparable to pristine values. The results of this study represent an additional data point to validate the notion that GFRP bar properties are maintained during 15 years of service as concrete reinforcement in a field application.
17. Key Words 18. Distribution Statement GFRP, corrosion resistance, reinforced concrete, durability, SEM
No restrictions. This document is available to the public.
19. Security Classification (of this report) Unclassified
20. Security Classification (of this page) Unclassified
21. No of Pages 36
Form DOT F 1700.7 (8-72) Reproduction of form and completed page is authorized.
II
FRP REINFORCEMENT FOR CONCRETE: PERFORMANCE ASSESSMENT AND NEW CONSTRUCTION
VOLUME I: SIERRITA DE LA CRUZ CREEK BRIDGE
PREPARED FOR THE
UNIVERSITY TRANSPORTATION CENTER
IN COOPERATION WITH THE
MISSOURI UNIVERSITY OF SCIENCE AND TECHNOLOGY AND
OWENS CORNING
Written By:
Omid Gooranorimi1, Tim Bradberry2, Edward Dauer3, John Myers4, Antonio Nanni5
1Ph.D. Candidate in Civil Engineering, University of Miami 2Engineering Support Lead, Bridge Division, Texas Department of Transportation
3 Research Associate Professor of Biomedical Engineering, University of Miami 4 Professor of Civil, Arch. & Environ. Engineering, Missouri University of Science and Technology
5Professor and Chair of Civil, Arch & Environ. Engineering, University of Miami
UNIVERSITY OF MIAMI RE-CAST
Submitted June 2016

III
FRP REINFORCEMENT FOR CONCRETE: PERFORMANCE ASSESSMENT AND NEW CONSTRUCTION
VOLUME I: SIERRITA DE LA CRUZ CREEK BRIDGE
EXECUTIVE SUMMARY Confirmation of long-term durability is perhaps the only barrier to widespread acceptance of glass fiber reinforced polymer (GFRP) in field applications. Accelerated laboratory tests are used to investigate the GFRP durability in concrete structures by exposure to simulated concrete pore water solution at high temperature. These tests are typically performed in an alkaline environment which is different from that present in field structures while monitoring the performance of existing projects would give a real indication of GFRP durability. The main objective of this research is to monitor the performance of GFRP bars after 15 years of service as concrete reinforcement in a bridge deck. Sierrita de la Cruz Creek Bridge located 25 miles northwest of Amarillo, Texas was built in 2000 to replace the original bridge that was structurally deficient, having extensive damage caused by the corrosion of steel reinforcement. It was the first bridge in the state of Texas that implemented GFRP as primary concrete reinforcement and operates under the following environmental conditions: thermal range of 22 to 95 °F (-6 to +35 °C), wet and dry cycles, freeze-thaw cycles and exposure to de-icing salt. GFRP reinforcement was implemented at the top mat in two spans of the concrete deck. Technical personnel performed the extraction of concrete cores in May 2015. The pH and carbonation depth measurements were conducted on concrete cores to characterize the concrete environment. Microscopic examination and mechanical tests including scanning electron microscopy (SEM), energy dispersive X-ray spectroscopy (EDS), inter-laminar shear, glass transition temperature (Tg) and fiber content were performed on GFRP coupons to monitor possible changes in microstructure and mechanical properties. The results of the inter-laminar shear test and fiber content measurement were compared with results of similar tests performed in 2000 at the time of construction. Since no historic data was available for EDS and Tg analysis, these tests were performed on GFRP bars produced in 2015 from the same manufacturer to serve as a benchmark for comparison. This study confirms that GFRP materials maintained their microstructural integrity and mechanical properties after 15 years of service in field application. Microscopic examination did not show any GFRP degradation. Fibers did not lose any cross-sectional areas, the matrix was intact and no damage was observed at fiber-matrix interface. Additionally, concrete-GFRP interface was maintained properly and no interfacial bond loss was observed.

IV
ACKNOWLEDGMENTS
The authors gratefully acknowledge: a) the University Transportation Center “Research on Concrete; Applications for Sustainable Transportation (RE-CAST)” under grant US DOT, DTRT13-G-UTC45; b) the National Science Foundation (NSF) and its industrial members for the support provided to the Industry/University Center for Integration of Composites into Infrastructure (CICI) under grant NSF IIP-1439543; c) Hughes Brothers Inc. for their openness in describing past and present production processes, resin formulations and assistance in field extraction; and, d) the Texas Department of Transportation Amarillo District for allowing the extraction of samples from their bridge and for providing the traffic control that kept the technicians safe during the coring operations.
Findings and opinions expressed herein, however, are those of the authors alone and do not necessarily reflect the views of the sponsors.

V
TABLE OF CONTENTS
TABLE OF CONTENTS ................................................................................................... V LIST OF FIGURES .......................................................................................................... VI LIST OF TABLES ........................................................................................................... VII 1 INTRODUCTION ...................................................................................................... 1 2 FIELD STRUCTURE ................................................................................................. 2 3 SAMPLE EXTRACTION .......................................................................................... 4 4 GFRP SAMPLE PREPARATION AT UM ............................................................... 6 5 CONCRETE TEST RESULTS ................................................................................... 7
5.1 pH .........................................................................................................................7 5.2 Carbonation Depth ...............................................................................................8
6 GFRP TEST RESULTS .............................................................................................. 8 6.1 Scanning Electron Microscopy (SEM) ................................................................8 6.2 Energy Dispersive X-Ray Spectroscopy (EDS) ................................................10 6.3 Interlaminar Shear Strength ...............................................................................13 6.4 Glass Transition Temperature (Tg) ....................................................................15 6.5 Fiber Content .....................................................................................................16
7 CONCLUSIONS ....................................................................................................... 17 8 RECOMMENDATION FOR FUTURE WORKS ................................................... 17 9 REFERENCES ......................................................................................................... 18 APPENDIX 1 .................................................................................................................... 20 APPENDIX 2 .................................................................................................................... 23 APPENDIX 3 .................................................................................................................... 25 APPENDIX 4 .................................................................................................................... 26

VI
LIST OF FIGURES
Figure 1: Sierrita de la Cruz Creek Bridge, Amarillo, Texas ......................................................... 2 Figure 2: Sierrita de la Cruz Creek Bridge drawings ...................................................................... 3 Figure 3: A set of three GFRP witness bars in an overhang [7] ..................................................... 4 Figure 4: Concrete core extraction from the bridge deck ............................................................... 5 Figure 5: GFRP bars viewed from a cored section (left) and a close-up view of the GFRP bar
implemented in transverse direction (right) ............................................................................ 5 Figure 6: Five extracted concrete cores with the GFRP bars.......................................................... 6 Figure 7: GFRP extraction from the concrete cores ....................................................................... 6 Figure 8: Prepared samples prior to SEM analysis: GFRP (left) and concrete-GFRP (right) ........ 7 Figure 9: Concrete pH measurement: ground concrete from extracted cores (left) and pH
evaluation using the pH strip (right) ....................................................................................... 7 Figure 10: Carbonation depth measurement of the concrete cores ................................................. 8 Figure 11: SEM images of the fibers at magnification levels of 300x (left) and 1400x (right) ..... 9 Figure 12: Crack at the edge of the bar at magnification levels of 40x (left) and 850x (right) ...... 9 Figure 13: SEM image of a single glass fiber at magnification of 3500x ...................................... 9 Figure 14: SEM images of the concrete-GFRP interface at magnification levels of 27x (left) and
50x (right) ............................................................................................................................. 10 Figure 15: Result of the EDS analysis performed on GFRP bars after 15-years of service ......... 10 Figure 16: Result of the EDS analysis performed on control GFRP samples .............................. 11 Figure 17: Elemental scatter in GFRP bars after 15 years of service at magnification level of
300x: SEM image of GFRP (a) and elemental distributions of: Ca (b), Si (c), Al (d), C (e), and O (f) ................................................................................................................................ 12
Figure 18: Elemental scatter in GFRP bars after 15 years of service in magnification level of 1800x: SEM image of GFRP (a) and elemental distributions of Ca (b), Si (c), Al (d), C (e), and O (f) ................................................................................................................................ 13
Figure 19: No. 6 (left) and No. 5 (right) GFRP bars tested for horizontal shear strength ............ 14 Figure 20: Interlaminar horizontal shear test of GFRP coupons after 15 years of service: No. 5
(left) and No. 6 (right) GFRP bars ........................................................................................ 14

VII
LIST OF TABLES Table 1: Constituents of GFRP bars produced in 2000 and 2015 [5] ............................................. 2 Table 2: Results of the horizontal shear test on GFRP coupons ................................................... 15 Table 3: Result of Tg measurement ............................................................................................... 16 Table 4: Result of fiber content measurement .............................................................................. 16

1
1 INTRODUCTION
The use of glass fiber reinforced polymer (GFRP) bars as flexural and shear reinforcements of concrete members is rapidly increasing due to corrosion resistance, electromagnetic transparency and high strength to weight ratio offered by these composite materials [1]. While various aspects of GFRP structural behavior are still investigated, confirmation of its long-term durability is perhaps the most critical barrier to widespread acceptance in field applications. Other barriers include: 1) resistance by practicing bridge engineers to accept new materials, especially non-ductile reinforcement; 2) concern about how to widen or repair GFRP reinforced concrete bridge decks; and, 3) initial cost when compared to steel reinforcement. Accelerated laboratory tests are used to investigate the GFRP durability in concrete structures by exposure to simulated concrete pore water solution at high temperature. These tests are typically performed in an alkaline environment which is different from that presents in field structures [2]. Monitoring the performance of existing projects would give a real indication of GFRP durability; however, there has been only a few studies of this type [3, 4]. In order to contribute to existing literature, the main objective of this research is to monitor the performance of GFRP bars after 15 years of service as concrete reinforcement in a bridge deck. First, pH and carbonation depth measurements were conducted on concrete cores to characterize the concrete environment. Next, microscopic examination and mechanical tests including scanning electron microscopy (SEM), energy dispersive X-ray spectroscopy (EDS), inter-laminar shear, glass transition temperature (Tg) and fiber content were performed on GFRP coupons to monitor possible changes in microstructure and mechanical properties. The results of the inter-laminar shear test and fiber content measurement were compared with results of similar tests performed in 2000 at the time of construction. Since no historic data was available for EDS and Tg analysis, these tests were performed on GFRP bars produced in 2015 from the same manufacturer to serve as a benchmark for comparison. The bars in this evaluation were the Aslan 100 series manufactured by Hughes Brothers, Inc. of Seward NE. Hughes Brothers maintained thorough documentation of the original production lot quality control testing and provided the details of the production process and formulations from the time the bridge was constructed. In 2000, the bars were made of the E-glass fibers while E-CR glass fibers were used in GFRP bars produced in 2015. Vinyl ester resin was used in GFRP bars produced both in 2000 and 2015. The resin formulation was slightly different for larger bar diameter produced in 2000, to help mitigate plastic thermal cracking during fast curing. Table 1 provides the fiber type, resin formulation and the detailed catalysts/additives used in the production of GFRP bars.

2
Table 1: Constituents of GFRP bars produced in 2000 and 2015 [5]
Diameter (in)
Year of production Fiber Resin Additive &
Filler Catalyst Type Formulation
5/8 2000
E- glass
Vinyl Ester
Ashland Hetron 922 (90%), 8722 (10%)
Styrene,
ASP 400, BYK A555 & Fumed silica
P16 & TBPB
6/8 Ashland Hetron 922
(70%), 8722 (30%)
5/8 2015 E-CR glass
Vinyl Ester
VEX 10-962 CoRezyn
Styrene & ASP 400
BPO
Note: 1 in= 25.4 mm
2 FIELD STRUCTURE
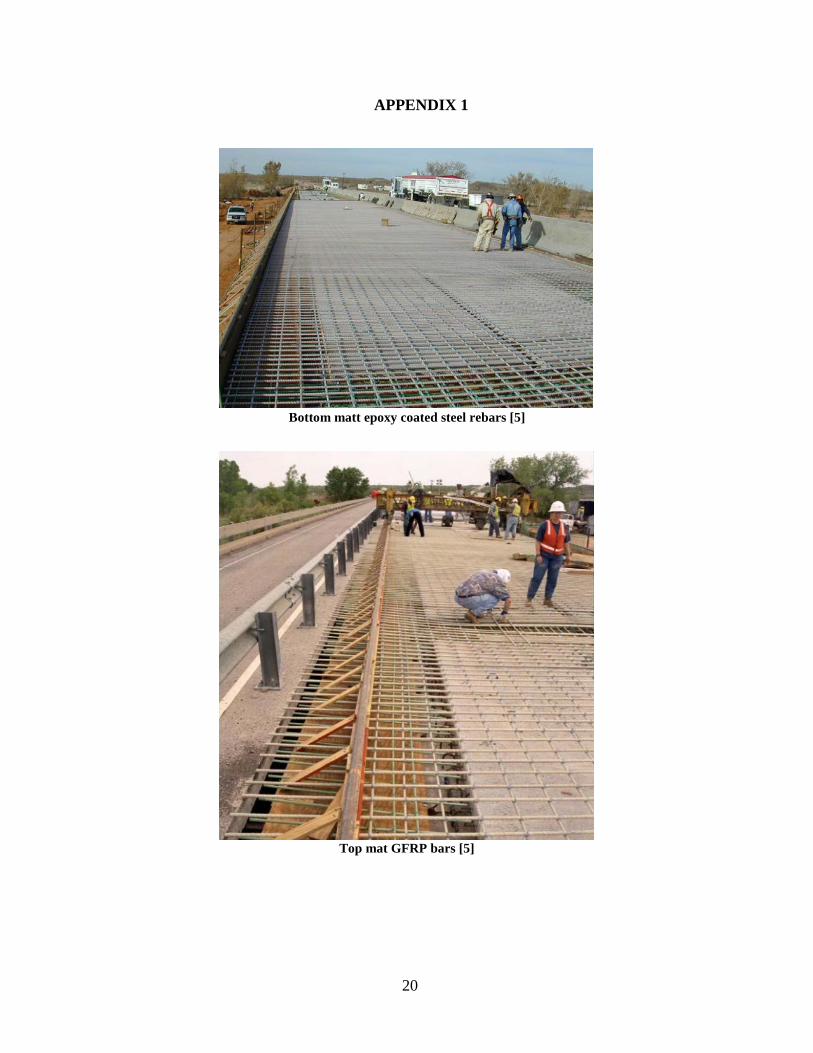
Sierrita de la Cruz Creek Bridge located 25 miles northwest of Amarillo, Texas (Figure 1) was built in 2000 to replace the original bridge that was structurally deficient, having extensive damage caused by corrosion of the steel reinforcement. It was the first bridge in the state of Texas that implemented GFRP as primary concrete reinforcement. This bridge consists of seven spans, 24.079 m (79.0 ft.) long and 13.800 m (45.3 ft.) wide supported by six pre-stressed (PC) Texas type “C” concrete I-beams. A plan view of the bridge is shown in Figure 2-a. The bridge operates under the following environmental conditions: thermal range of 22 to 95 °F (-6 to +35 °C), wet and dry cycles, freeze-thaw cycles with the annual average frequency of 30% [6] and exposure to de-icing salt. Appendix 1 provides photos of the bridge during construction.
Figure 1: Sierrita de la Cruz Creek Bridge, Amarillo, Texas

3
a) Plan view (All the dimensions are in meter) [7]
b) GFRP bridge deck plans - transverse section (through slab overhang) [8]
Figure 2: Sierrita de la Cruz Creek Bridge drawings
GFRP reinforcement was used in the top mat of two spans of the concrete deck (span 6 and 7) while prestressed precast concrete panels reinforced with epoxy coated steel (ECS) rebars, in addition to the uncoated prestressing strands, constituted the bottom half of the concrete deck of these two spans. Furthermore, ECS rebars were used in the bottom of the full depth portion of the deck between construction phases and in the two deck overhangs. The other five spans were reinforced entirely with ECS rebars in the top mat and the same mix of panels and ECS rebar in the bottom mat as spans 6 and 7. The GFRP-RC spans were reinforced with top mat GFRP bars having nominal diameters of 5/8 in (16 mm) and 6/8 in (19 mm). GFRP bars were made of E-glass fibers and vinyl ester resin with the nominal fiber content of 70% by volume. The surface of the bars was sand coated and helically fiber wrapped to provide the additional mechanical bond to surrounding concrete. No. 5 bars were placed in the longitudinal direction with the spacing of 225 mm (9 in) and No. 6 bars were placed in the transverse direction with the spacing of 140 mm (5.5 in). Figure 2-b shows a part transverse section illustrating the placement of the precast concrete “sub-deck” panels, the ECS bars in the deck overhangs, the top GFRP bars and

4
the ECS bars, designated “OM”, to be placed only at the Engineer’s direction. Bars OM were provided in the plans due to uncertainty regarding the performance of the GFRP reinforced concrete deck overhang in a vehicle impact event. The deck overhang was tested before construction of the bridge, by pendulum impact of a segment of bridge rail and deck overhang, and exhibited adequate performance to eliminate the need for bars OM. Additionally, during bridge deck construction, twelve sets of 2 ft. (609.6 mm) long witness bars were installed at three different locations (overhang, mid-span and control joints) of four spans (1, 2, 6, and 7). Each set included three samples, one of each rebar type (i.e., black steel, ECS, and GFRP). The bars were intended to be extracted at undefined intervals of time during the service life of the structure to monitor and compare the long-term performance of these reinforcements. Fifteen years just happened to be the age when the cores for this project were taken. Figure 3 shows a set of GFRP witness bars in the overhang of span 2 [7].
Figure 3: A set of three GFRP witness bars in an overhang [7]
3 SAMPLE EXTRACTION
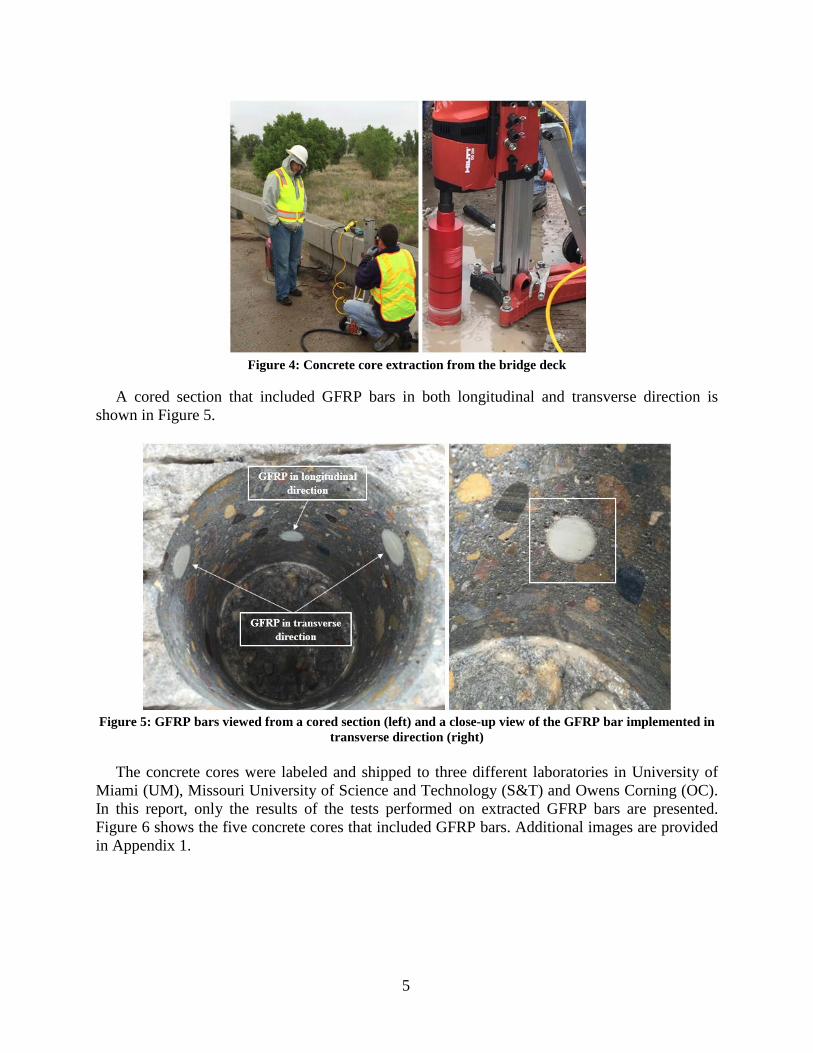
Technical personnel performed the extraction of concrete cores in May 2015 (Figure 4). A total of nine 4 in (101.6 mm) diameter concrete cores were extracted from various locations on the bridge deck to include GFRP (5 cores), ECS (3 cores) and black steel rebars (1 core). The holes from sample extraction were repaired using a fast-curing cementitious grout.
5
Figure 4: Concrete core extraction from the bridge deck
A cored section that included GFRP bars in both longitudinal and transverse direction is shown in Figure 5.
Figure 5: GFRP bars viewed from a cored section (left) and a close-up view of the GFRP bar implemented in
transverse direction (right) The concrete cores were labeled and shipped to three different laboratories in University of Miami (UM), Missouri University of Science and Technology (S&T) and Owens Corning (OC). In this report, only the results of the tests performed on extracted GFRP bars are presented. Figure 6 shows the five concrete cores that included GFRP bars. Additional images are provided in Appendix 1.

6
Figure 6: Five extracted concrete cores with the GFRP bars
4 GFRP SAMPLE PREPARATION AT UM
GFRP coupons were extracted from core C and D as presented in Figure 7 and were sliced to an approximate width of 0.27 in (7 mm) using a diamond saw for microscopic examination.
Figure 7: GFRP extraction from the concrete cores
The specimen surface was prepared by sanding using different grit levels (i.e., 180, 300, 600 and 1200) of sand paper and employing dedicated grinding and polishing equipment. Fine polishing completed the specimen preparation using a wet-polishing agent and polycrystalline diamond paste. Prior to imaging, specimens were placed in an oven at 140 °F (60 °C) for 24 hours to remove moisture produced during polishing. Samples were properly cleaned using an air-blower which also saved the SEM chamber from being contaminated. Additionally, a concrete sample was prepared following the mentioned procedure to monitor the concrete-GFRP interface. Since GFRP is a non-conductive material, an ion sputtering device was used to coat the samples with gold prior to SEM examination as shown in Figure 8. The specimens used in SEM imaging were also employed in EDS analysis.
7
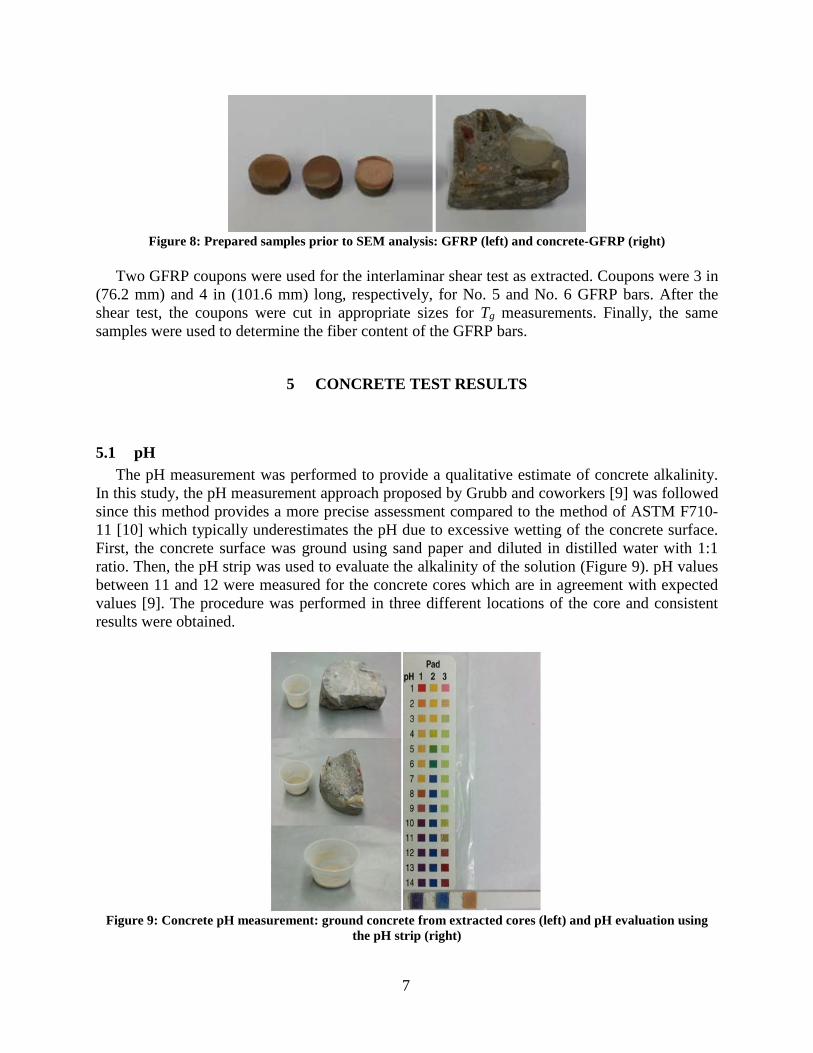
Figure 8: Prepared samples prior to SEM analysis: GFRP (left) and concrete-GFRP (right)
Two GFRP coupons were used for the interlaminar shear test as extracted. Coupons were 3 in (76.2 mm) and 4 in (101.6 mm) long, respectively, for No. 5 and No. 6 GFRP bars. After the shear test, the coupons were cut in appropriate sizes for Tg measurements. Finally, the same samples were used to determine the fiber content of the GFRP bars.
5 CONCRETE TEST RESULTS
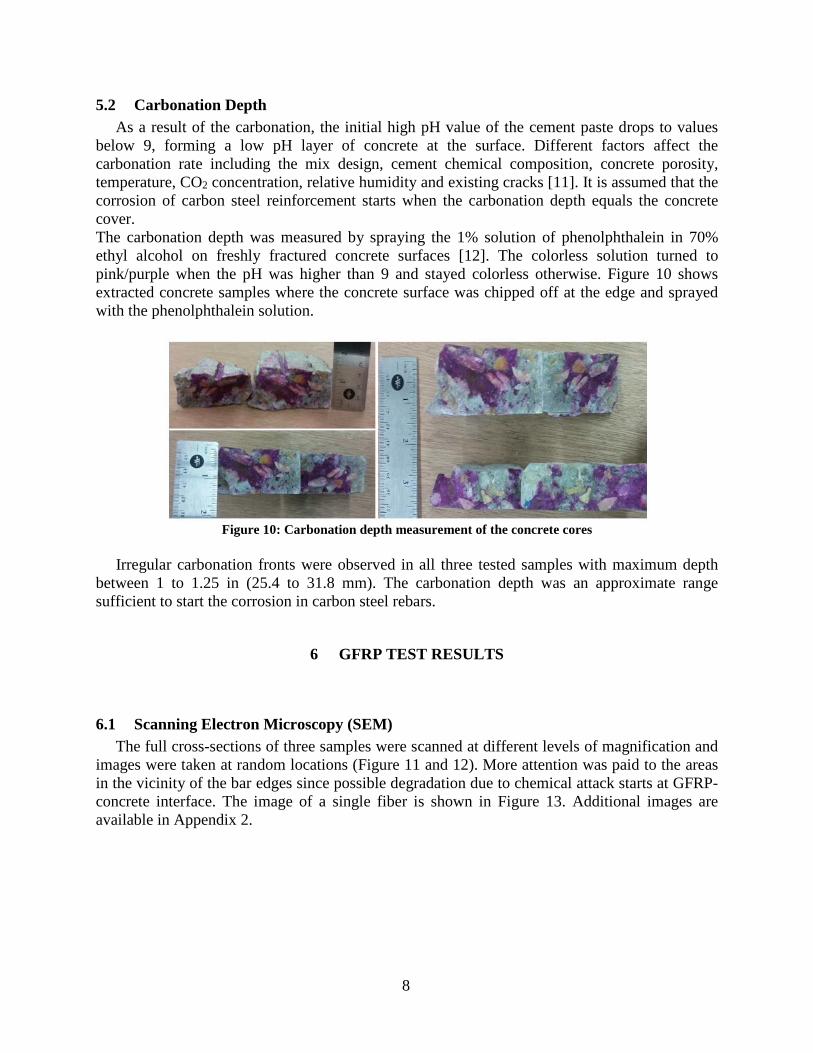
5.1 pH The pH measurement was performed to provide a qualitative estimate of concrete alkalinity. In this study, the pH measurement approach proposed by Grubb and coworkers [9] was followed since this method provides a more precise assessment compared to the method of ASTM F710-11 [10] which typically underestimates the pH due to excessive wetting of the concrete surface. First, the concrete surface was ground using sand paper and diluted in distilled water with 1:1 ratio. Then, the pH strip was used to evaluate the alkalinity of the solution (Figure 9). pH values between 11 and 12 were measured for the concrete cores which are in agreement with expected values [9]. The procedure was performed in three different locations of the core and consistent results were obtained.
Figure 9: Concrete pH measurement: ground concrete from extracted cores (left) and pH evaluation using
the pH strip (right)
8
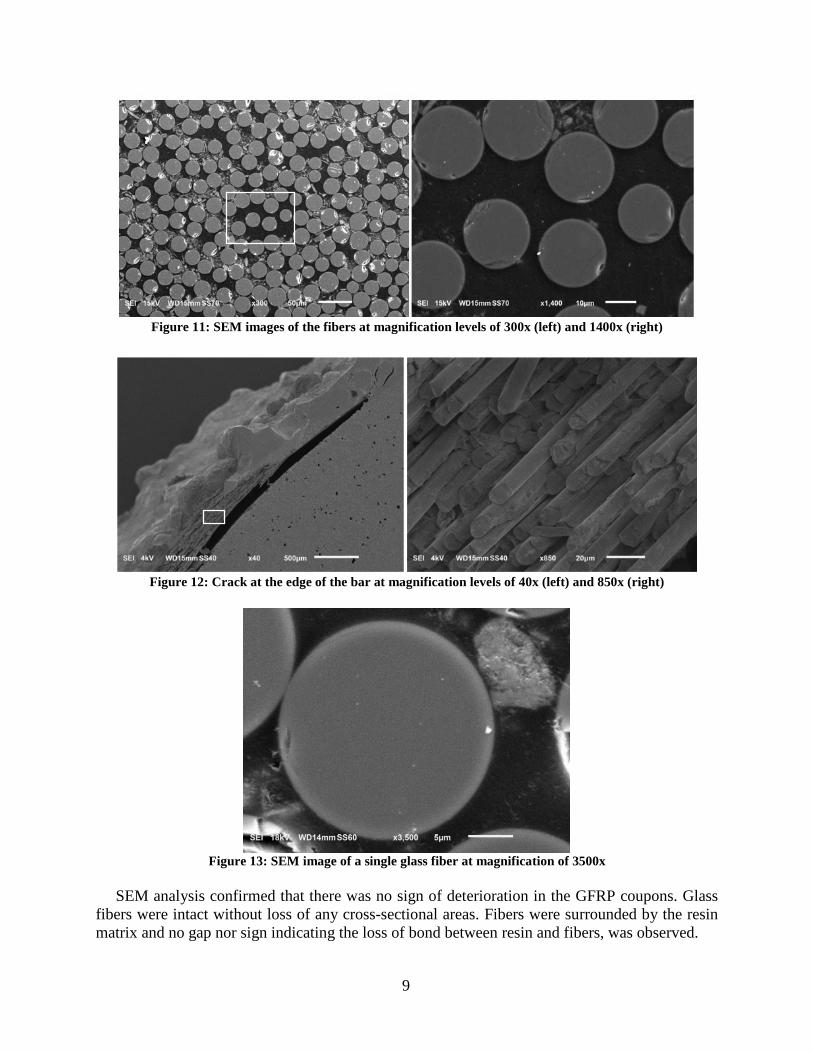
5.2 Carbonation Depth As a result of the carbonation, the initial high pH value of the cement paste drops to values below 9, forming a low pH layer of concrete at the surface. Different factors affect the carbonation rate including the mix design, cement chemical composition, concrete porosity, temperature, CO2 concentration, relative humidity and existing cracks [11]. It is assumed that the corrosion of carbon steel reinforcement starts when the carbonation depth equals the concrete cover. The carbonation depth was measured by spraying the 1% solution of phenolphthalein in 70% ethyl alcohol on freshly fractured concrete surfaces [12]. The colorless solution turned to pink/purple when the pH was higher than 9 and stayed colorless otherwise. Figure 10 shows extracted concrete samples where the concrete surface was chipped off at the edge and sprayed with the phenolphthalein solution.
Figure 10: Carbonation depth measurement of the concrete cores
Irregular carbonation fronts were observed in all three tested samples with maximum depth between 1 to 1.25 in (25.4 to 31.8 mm). The carbonation depth was an approximate range sufficient to start the corrosion in carbon steel rebars.
6 GFRP TEST RESULTS
6.1 Scanning Electron Microscopy (SEM) The full cross-sections of three samples were scanned at different levels of magnification and images were taken at random locations (Figure 11 and 12). More attention was paid to the areas in the vicinity of the bar edges since possible degradation due to chemical attack starts at GFRP-concrete interface. The image of a single fiber is shown in Figure 13. Additional images are available in Appendix 2.
9
Figure 11: SEM images of the fibers at magnification levels of 300x (left) and 1400x (right)
Figure 12: Crack at the edge of the bar at magnification levels of 40x (left) and 850x (right)
Figure 13: SEM image of a single glass fiber at magnification of 3500x
SEM analysis confirmed that there was no sign of deterioration in the GFRP coupons. Glass fibers were intact without loss of any cross-sectional areas. Fibers were surrounded by the resin matrix and no gap nor sign indicating the loss of bond between resin and fibers, was observed.
10
Additionally, GFRP to concrete interfacial bond was maintained properly and no sign of bond degradation nor loss of contact was observed as presented in Figure 14. The visible interfacial damage may be the result of sample preparation and drying in the SEM chamber [4].
Figure 14: SEM images of the concrete-GFRP interface at magnification levels of 27x (left) and 50x (right)
6.2 Energy Dispersive X-Ray Spectroscopy (EDS) EDS was performed at seven selected locations with a focus on the edge of the bar to identify existing chemical elements in GFRP bars. The results were compared with pristine samples produced in 2015 from the same manufacturer. The results are shown in Figure 15 and 16 where the vertical axis corresponds to the counts (number of X-rays received and processed by the detector) and the horizontal axis presents the energy level of those counts.
Figure 15: Result of the EDS analysis performed on GFRP bars after 15-years of service

11
Figure 16: Result of the EDS analysis performed on control GFRP samples
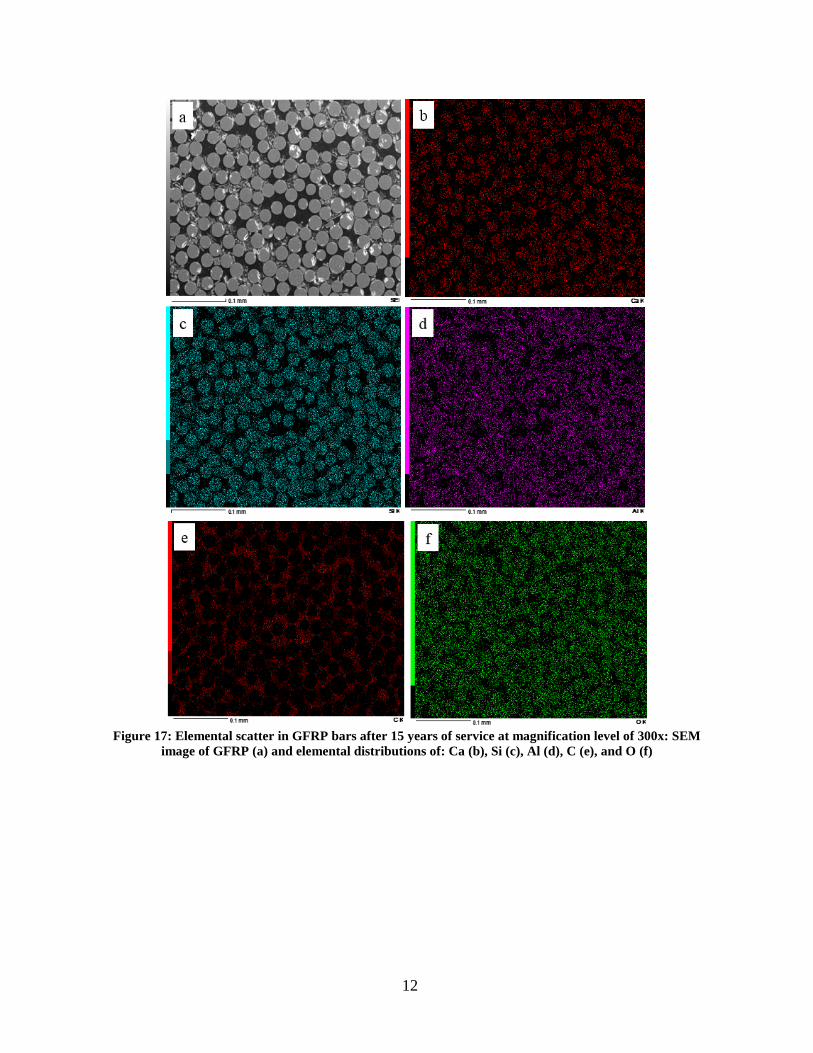
Si, Al, Ca (from glass fibers) and C (from the matrix) were the predominant chemical elements in the extracted samples which were also identical to the control samples. Although, there is a variation in fiber/resin constituents for GFRP bars produced in 2015 compared to the ones manufactured in 2000 (as provided in Table 1), the only difference in detected elements was the presence of Mg in control samples which was not found in extracted ones. Additionally, the presence of Na in the extracted samples was not a sign of degradation or alkaline attack since Na was observed in both control and extracted samples. It may be due to contamination during sample preparation. Backscattered electron images are provided at different magnification levels to display compositional contrast of existing chemical elements and their distribution in fibers and resin matrix. The images were taken at the edge of the GFRP bars and results are shown in Figure 17 and 18.
12
Figure 17: Elemental scatter in GFRP bars after 15 years of service at magnification level of 300x: SEM
image of GFRP (a) and elemental distributions of: Ca (b), Si (c), Al (d), C (e), and O (f)

13
Figure 18: Elemental scatter in GFRP bars after 15 years of service in magnification level of 1800x: SEM
image of GFRP (a) and elemental distributions of Ca (b), Si (c), Al (d), C (e), and O (f) Comparing the result of EDS analysis performed on the in-service and control samples confirmed that no change in chemical composition of fiber and matrix occurred after 15 years of service and the silica was not dissolved in the alkaline environment of concrete. Additional EDS result performed on a different location of GFRP cross section is available in Appendix 2.
6.3 Interlaminar Shear Strength The interlaminar horizontal shear strength of the extracted GFRP segments was determined following ASTM D4475 as a useful parameter for durability evaluation [13]. The test was performed on two GFRP coupons extracted from concrete cores: i) one No. 5 GFRP bar with the total length of 3.5 in (88.9 mm), and ii) one skewed end No. 6 GFRP bar with the total non-skewed length of 3 in (76.2 mm) as shown in Figure 19.

14
Figure 19: No. 6 (left) and No. 5 (right) GFRP bars tested for horizontal shear strength
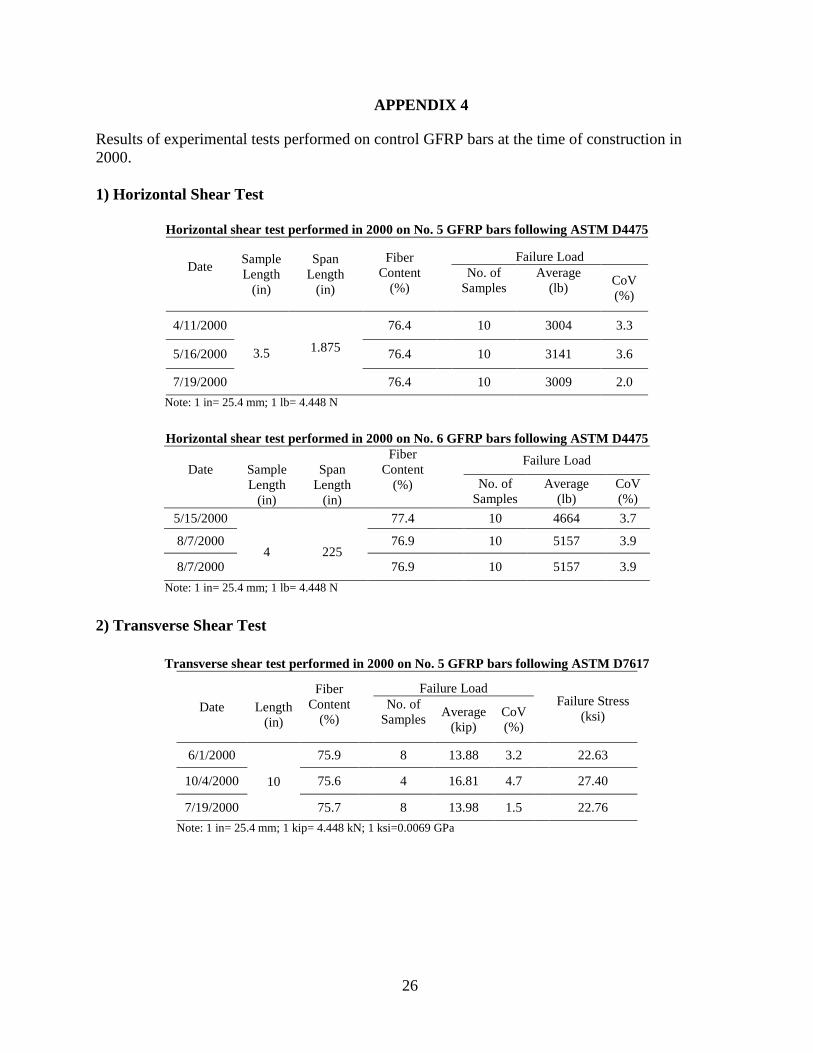
The same test was performed by the bar manufacturer prior to construction in 2000 on 3.5 in (88.9 mm) long No. 5 GFRP and 4 in (101.6 mm) long No. 6 GFRP samples and their results were used as a benchmark for comparison. Specimens were tested with the span to diameter ratio equal to 3, according to standard and compared with control samples. The test was performed in displacement control using a screw-driven testing machine with the rate of 0.05 in/min (1.27 mm/min) of the cross head as shown in Figure 20.
Figure 20: Interlaminar horizontal shear test of GFRP coupons after 15 years of service: No. 5 (left) and No. 6
(right) GFRP bars Both specimens presented the horizontal shear mode of failure and the shear strengths were determined as [13]:
20.849 PSd
=
Where S is the horizontal shear strength, P refers to the breaking load and d corresponds to the nominal diameter of the specimen. Summary of the results is shown in Table 2 where Sc and Ss, respectively, refer to the shear strength of control and in-service samples. The same notation is employed for the failure load.

15
Table 2: Results of the horizontal shear test on GFRP coupons
Diameter (in)
Pc Ps Span
Length (in)
No. of Samples
Ave. (lb)
CoV (%)
No. of Samples
Ave. (lb)
Sc (psi)
Ss (psi)
Ratio (Ss/Sc
)
5/8 1.875 10 3009.0 2.0
1 3143.7
6539.9
6832.7
1.04
6/8 2.25 10 4664.0 3.7
1 3552.0
7039.5
5361.2
0.76
Note: 1 in= 25.4 mm; 1 lb= 4.448 N; 1 psi=0.0069 MPa An increase of 4% in the inter-laminar shear strength of No. 5 GFRP bar was observed. Since the interlaminar shear is dominated by the resin, the increase may be a result of resin crosslinking over time. On the other hand, the inter-laminar shear strength of No. 6 GFRP bar decreased by 23% compared to average results of control samples. In both instances, since only one coupon was available for the in-service condition, additional testing is required to comment on the change or no change of interlaminar shear property. In order to investigate the effect of bar diameter, span length and the total length of the specimen on horizontal shear strength, additional tests were performed on pristine GFRP bars produced by the same manufacturer in 2016. It is observed that the interlaminar shear strength strongly depends on the selected span length while it is independent of the total length of the specimen. It is critical to choose consistent span to diameter ratio for comparison purposes. Interlaminar shear strength slightly increases by the increase of bar diameter however due to dependency on the chemical composition of fiber/resin, fiber-resin mixture ratio, and manufacturing parameters; it may change to some extent for each production lot. Results are shown in Appendix 3.
6.4 Glass Transition Temperature (Tg) The changes in the glass transition temperature, Tg, of the polymer matrix was determined by performing dynamic mechanical analysis (DMA) test on three specimens. The Tg is generally desired to be higher than 212 °F (100 °C) as a critical parameter in load transfer capability of the resin [14]. The rectangular specimens of 0.04×0.2×2.0 in (1 5 50× × mm) were extracted from the outer core of the bars according to ASTM E1640 [15]. The DMA test was performed with a three-point-bending fixture for a temperature ranging from 95 to 302 °F (35 to 150 °C), and a heating rate of 1.8 °F/min (1 °C/min). Due to lack of Tg test data on GFRP bars prior to construction, Tg test was performed at University of Miami on samples produced in 2015 from the same manufacturer, to serve as a benchmark for comparison. Table 3 provides the result summary, where Tg
c and Tgs respectively refer to glass transition temperature of the control and
in-service GFRP samples.

16
Table 3: Result of Tg measurement
Tgc Tg
s Ratio
(Tgs/ Tg
c)
No. of Samples
Average(°F)
CoV (%)
No. of Samples
Average (°F)
CoV (%)
3 177.9 16.9 3 238.8 7.1 1.41 Note: °F=1.8 °C+32 The Tg of the extracted samples were 40% higher than the control samples performed in 2015. As provided in Table 1, due to changes in glass fibers, resin formulation, additive, and catalysts of the bars manufactured in 2015 compared to the ones tested in 2000, the result of the tests performed on these samples does not precisely represent the samples produced in 2000. Additionally, similar to the interlaminar shear strength, Tg may increase to some extent over time, due to cross-linking of the resin.
6.5 Fiber Content The fiber content of GFRP samples was determined following the ASTM D2584 test method [16]. Three samples for each bar diameter were tested. Samples were first placed inside the furnace for 40 minutes at 797 °F (425 °C) and then were left inside the furnace at 1292 °F (700 °C) for 30 minutes to completely remove the resin. The change of mass was calculated after the furnace exposure. The weight of sand particles and wrapping strand at the GFRP surface was also eliminated to provide a precise estimation of fiber content. The result was compared with the same test performed in 2000 prior to construction. Table 4 shows the summary of the result where αc and αs respectively correspond to fiber ratio of control and in-service samples.
Table 4: Result of fiber content measurement
Diameter (in)
αc αs Ratio (αs/αc)
No. of
Samples Average
(%) CoV (%)
No. of Samples
Average (%)
CoV (%)
5/8 4 75.7 1.2 3 77.9 1.8 1.03
6/8 2 80.5 2.2 3 79.50 0.2 0.99 Note: 1 in=25.4 mm The measured fiber content after 15 years of field exposure was in close agreement with the original samples and still well above the minimum fiber content requirement of 70% by mass [17]. The negligible change of measured fiber content compared to the control samples is an additional data confirming that no loss in fiber content occurred after 15-years of field exposure.
17
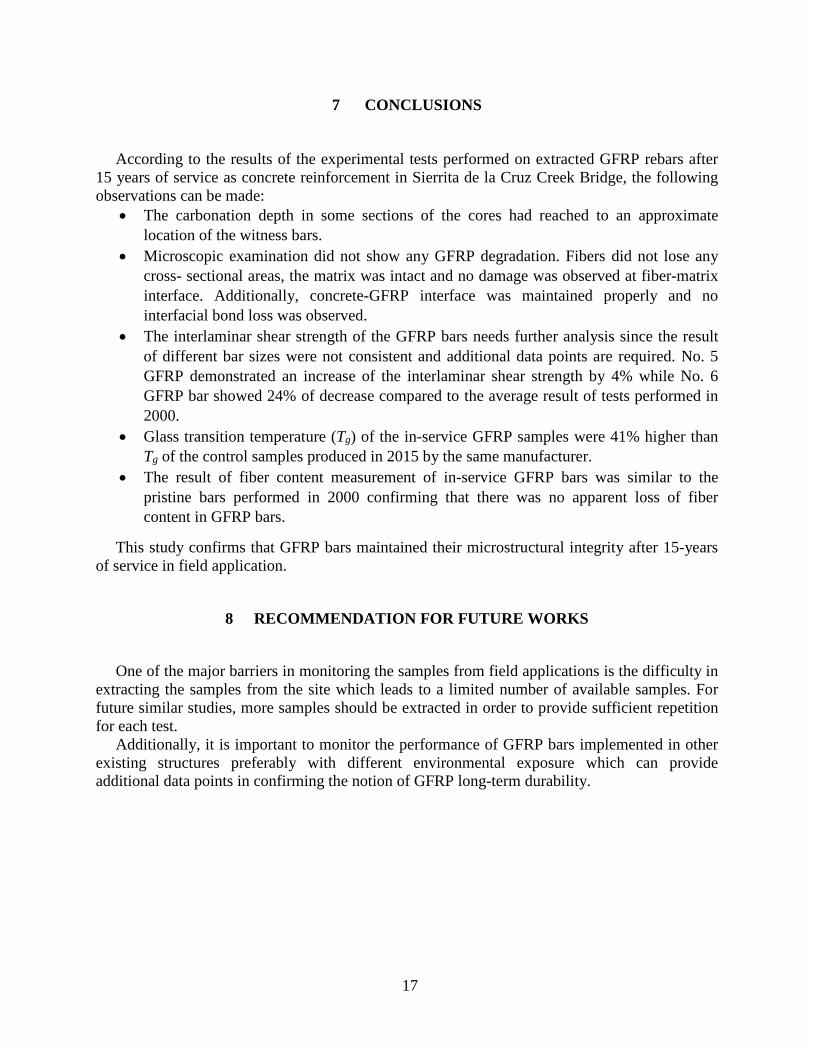
7 CONCLUSIONS
According to the results of the experimental tests performed on extracted GFRP rebars after 15 years of service as concrete reinforcement in Sierrita de la Cruz Creek Bridge, the following observations can be made:
• The carbonation depth in some sections of the cores had reached to an approximate location of the witness bars.
• Microscopic examination did not show any GFRP degradation. Fibers did not lose any cross- sectional areas, the matrix was intact and no damage was observed at fiber-matrix interface. Additionally, concrete-GFRP interface was maintained properly and no interfacial bond loss was observed.
• The interlaminar shear strength of the GFRP bars needs further analysis since the result of different bar sizes were not consistent and additional data points are required. No. 5 GFRP demonstrated an increase of the interlaminar shear strength by 4% while No. 6 GFRP bar showed 24% of decrease compared to the average result of tests performed in 2000.
• Glass transition temperature (Tg) of the in-service GFRP samples were 41% higher than Tg of the control samples produced in 2015 by the same manufacturer.
• The result of fiber content measurement of in-service GFRP bars was similar to the pristine bars performed in 2000 confirming that there was no apparent loss of fiber content in GFRP bars.
This study confirms that GFRP bars maintained their microstructural integrity after 15-years of service in field application.
8 RECOMMENDATION FOR FUTURE WORKS
One of the major barriers in monitoring the samples from field applications is the difficulty in extracting the samples from the site which leads to a limited number of available samples. For future similar studies, more samples should be extracted in order to provide sufficient repetition for each test. Additionally, it is important to monitor the performance of GFRP bars implemented in other existing structures preferably with different environmental exposure which can provide additional data points in confirming the notion of GFRP long-term durability.

18
9 REFERENCES
[1] Nanni, A., De Luca, A., Jawaheri Zadeh, H., “Reinforced Concrete with FRP Bars: Mechanics and Design”, CRC Press, 2014
[2] Micelli, F., Nanni, A., “Durability of FRP Rods for Concrete Structures”, Journal of Construction and Building Materials, V 18, 491-503, 2004
[3] Mukherji, S., Arwikar, S. J., “Performance of Glass Fiber-Reinforced Polymer Reinforcing Bars in Tropical Environments-Part II: Microstructural Test”, ACI Structural Journal, V 102, 816-822, 2005
[4] Mufti, A., Banthia, N., Benmokrane, B., Boulfiza, M., Newhook, J. “Durability of GFRP Composite Rods”, Concrete International, V 29, 37-42, 2007
[5] Gremel, D., Private communication, 2016
[6] Haley, J.S., “Climatology of Freeze-Thaw Days in the Conterminous United States: 1982-2009”, Master of Art thesis, Kent University, 2011
[7] Phelan, R.S., Vann, W.P., Bice, J., “FRP Reinforcement Bars in Bridge Decks: Field Instrumentation and Short-Term Monitoring”, Research report: 9-1520-04, Texas Department of Transportation, 2003
[8] Bradberry, T. E., “Concrete Bridge Decks Reinforced with Fiber-Reinforced Polymer Bars.” Design of Structures, Transportation Research Record 1770, Transportation Research Board, National Research Council, Washington D.C., pp. 94-104, December 2001, (Figure is from the author’s presentation at TRB)
[9] Grubb, J., Limaye, H., Kakade, A., “Testing pH of Concrete: Need for A Standard Procedure”, Concrete International, V 29, 78-83, 2007
[10] ASTM F710-11, “Standard Practice for Preparing Concrete Floors to Receive Resilient Flooring”, ASTM International, West Conshohocken, PA, 2008
[11] Sagues, A., “Carbonation in Concrete and Effect on Steel Corrosion”, Final Report, University of South Florida, 1997
[12] CPC-18, RILEM Recommendations, “Measurement of Hardened Concrete Carbonation Depth”, V 21, 453- 455, 1988
[13] ASTM D4475, “Apparent Horizontal Shear Strength of Pultruded Reinforced Plastic Rods by the Short-Beam Method”, ASTM International, West Conshohocken, PA, 2008
[14] ACI 440.6, “Specification for Carbon and Glass Fiber-Reinforced Polymer Bar Materials for Concrete Reinforcement”, American Concrete Institute, Farmington Hills, MI, 2008
[15] ASTM E1640, “Standard Test Method for Assignment of the Glass Transition Temperature by Dynamic Mechanical Analysis”, ASTM International, West Conshohocken, PA, 2013
[16] ASTM D2584, “Standard Test Method for Ignition Loss of Cured Reinforced Resins”, ASTM International, West Conshohocken, PA, 2011

19
[17] AC 454, “Acceptance Criteria for Fiber-Reinforced Polymers (FRP) Bars for Internal Reinforcement of Concrete Members”, International Code Council-Evaluation Services, 2015
20
APPENDIX 1
Bottom matt epoxy coated steel rebars [5]
Top mat GFRP bars [5]

21
GFRP bars in slab overhang adjacent to phased construction [8]
A set of witness GFRP, black and epoxy coated steel rebars at mid-span [6]
Extracted epoxy-coated steel rebar sent to OC (left) and its footprint (right)

22
The only extracted concrete core with the black steel rebar (sent to OC)

23
APPENDIX 2
Additional SEM images and EDS analysis of GFRP bars after 15-years of service.
SEM images at edge of GFRP bar at magnification levels of 85x (left) and 200x (right)
SEM images of a void at the center of the GFRP bar at magnification levels of 70x (left) and 140x (right)
SEM images of GFRP bar at the edge at magnification level of 55x (left) and at the center at magnification
level of 200x (right)

24
Result of the EDS analysis performed on GFRP coupons after 15 years of service
Elemental scatter in GFRP bars after 15 years of service in magnification level of 1000x: SEM image of
GFRP (a), and elemental distributions of Ca (b), Si (c), Al (d), C (e), and O (f)
25
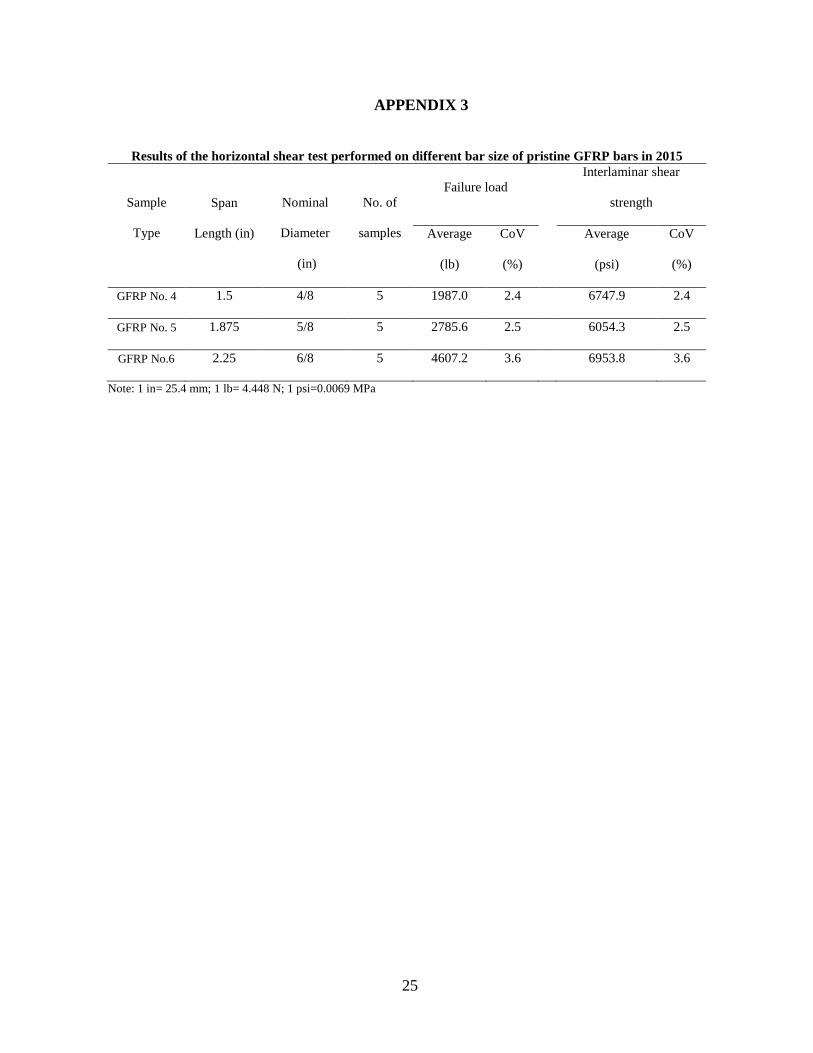
APPENDIX 3
Results of the horizontal shear test performed on different bar size of pristine GFRP bars in 2015
Sample
Type
Span
Length (in)
Nominal
Diameter
(in)
No. of
samples
Failure load Interlaminar shear
strength
Average
(lb)
CoV
(%)
Average
(psi)
CoV
(%)
GFRP No. 4 1.5 4/8 5 1987.0 2.4 6747.9 2.4
GFRP No. 5 1.875 5/8 5 2785.6 2.5 6054.3 2.5
GFRP No.6 2.25 6/8 5 4607.2 3.6 6953.8 3.6
Note: 1 in= 25.4 mm; 1 lb= 4.448 N; 1 psi=0.0069 MPa
26
APPENDIX 4
Results of experimental tests performed on control GFRP bars at the time of construction in 2000. 1) Horizontal Shear Test
Horizontal shear test performed in 2000 on No. 5 GFRP bars following ASTM D4475
Date
Sample Length
(in)
Span Length
(in)
Fiber Content
(%)
Failure Load
No. of Samples
Average (lb)
CoV (%)
4/11/2000
3.5
76.4 10 3004 3.3
5/16/2000 1.875 76.4 10 3141 3.6
7/19/2000 76.4 10 3009 2.0 Note: 1 in= 25.4 mm; 1 lb= 4.448 N
Horizontal shear test performed in 2000 on No. 6 GFRP bars following ASTM D4475
Date
Sample Length
(in)
Span
Length (in)
Fiber Content
(%)
Failure Load
No. of Samples
Average (lb)
CoV (%)
5/15/2000
4
225
77.4 10 4664 3.7
8/7/2000 76.9 10 5157 3.9
8/7/2000 76.9 10 5157 3.9 Note: 1 in= 25.4 mm; 1 lb= 4.448 N 2) Transverse Shear Test
Transverse shear test performed in 2000 on No. 5 GFRP bars following ASTM D7617
Date
Length
(in)
Fiber Content
(%)
Failure Load
Failure Stress
(ksi)
No. of Samples
Average (kip)
CoV (%)
6/1/2000
10
75.9 8 13.88 3.2 22.63
10/4/2000 75.6 4 16.81 4.7 27.40
7/19/2000 75.7 8 13.98 1.5 22.76 Note: 1 in= 25.4 mm; 1 kip= 4.448 kN; 1 ksi=0.0069 GPa

27
3) Tensile Strength Measurement
Tensile test performed on GFRP bars following ASTM D7205
Date
Diameter (in)
Ultimate Load (Kips) Ultimate
Tensile Stress (ksi)
No. of Samples
Average (kip)
CoV (%)
2/1/2000 5/8 4 34.95 2.1 113.92
8/10/2000 5/8 4 35.67 5.2 116.27
6/14/2000 5/8 7 33.23 4.4 108.31
8/17/2000 6/8 4 47.05 5.4 106.49
5/12/2000 6/8 6 39.86 3.9 90.22 Note: 1 in= 25.4 mm; 1 kip= 4.448 kN; 1 ksi=0.0069 GPa 4) Dye Penetration Test
Result of dye wicked test performed on GFRP bars following ASTM D5117
Date Diameter (in)
Length (in)
No. of Samples
Results
7/19/2000 5/8
1
8 Small voids or hollow fibers observed in two samples 4/13/2000 5/8 8 Small voids or hollow fibers observed in one sample
5/9/2000 6/8 6 Small voids or hollow fibers observed but not in line and not continuous in all six samples
Note: 1 in= 25.4 mm

![REINFORCEMENT OF MASONRY PANELS WITH GFRP … · Reinforcement of Masonry Panels with GFRP Grids 3 has been recently investigated by Prota et al. [16] for tuff masonry wall panels,](https://img.pdfslide.us/doc/110x75/5acfd3717f8b9a56098da1f7/reinforcement-of-masonry-panels-with-gfrp-of-masonry-panels-with-gfrp-grids.jpg)