Embed Size (px)
Citation preview

Long-Term Care in Minnesota:
Past, Present, and Future Trends for
Senior Services in Minnesota
Todd Bergstrom
Care Providers of Minnesota

Topics
Past (a review of trends)
Present (a look at the Gaps Summary Analysis
Future (Where do present trends may take us)
The Past
Length of Stay Number of providers Demographics
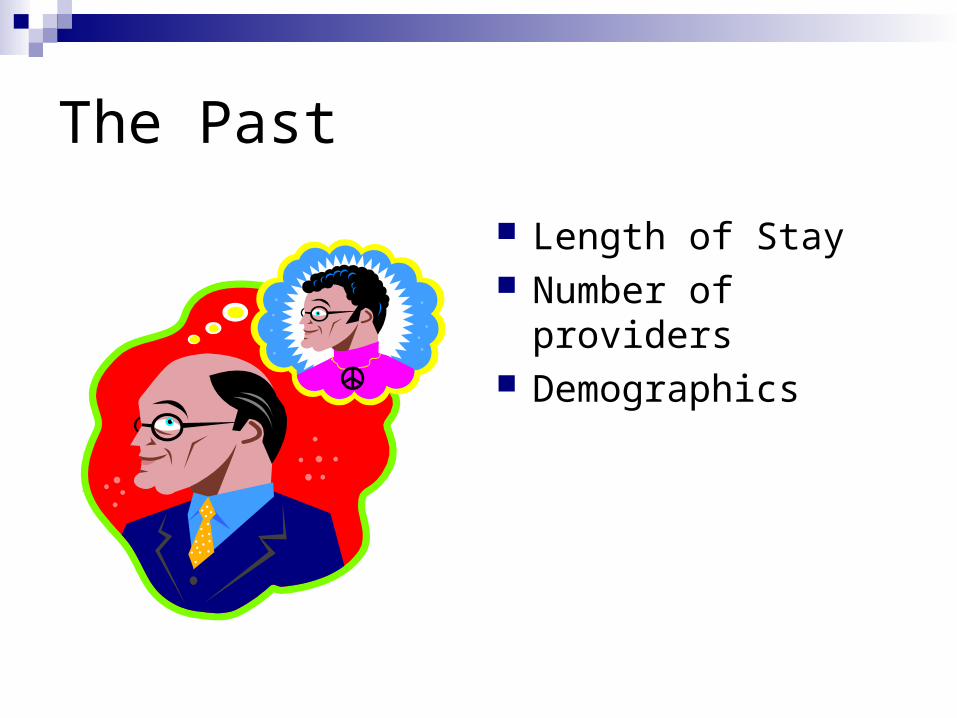
Declining Length of Stay in Minnesota Nursing Facilities
Source: Minnesota Department of Health
405
658
4099
0
100
200
300
400
500
600
700
1990 1992 1994 1996 1998 2000 2002 2004
Mean Median
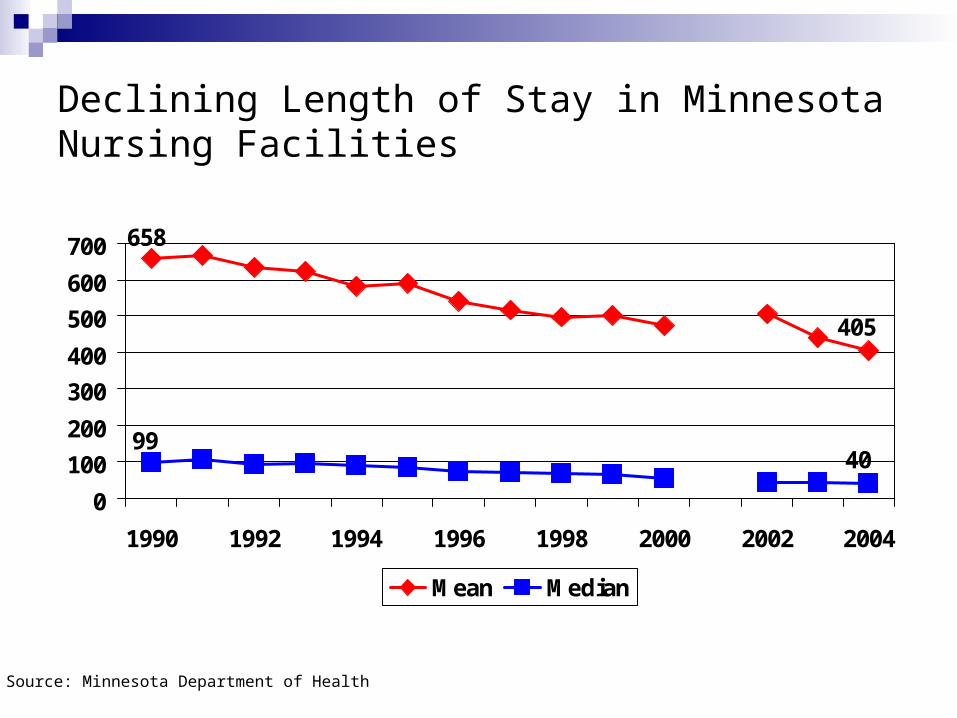
Minnesota Nursing Facility Resident Days
0
200,000
400,000
600,000
800,000
1,000,000
1,200,000
1991 1994 1997 2000 2003
Medicare Days Other Days
0
2,000,000
4,000,000
6,000,000
8,000,000
10,000,000
12,000,000
1991 1994 1997 2000 2003
Private Days Medicaid Days
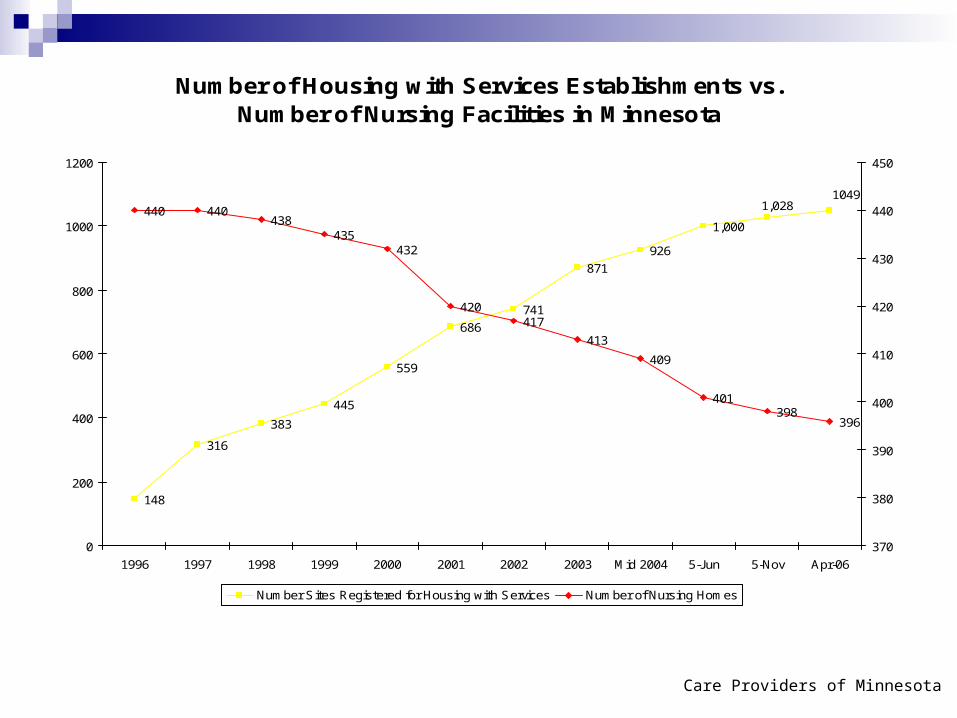
Number of Housing with Services Establishments vs. Number of Nursing Facilities in Minnesota
148
316
383
445
559
686
741
871
926
1,000
10491,028440 440
438435
432
420417
413
409
401398
396
0
200
400
600
800
1000
1200
1996 1997 1998 1999 2000 2001 2002 2003 Mid 2004 5-Jun 5-Nov Apr-06
370
380
390
400
410
420
430
440
450
Number Sites Registered for Housing with Services Number of Nursing Homes
Care Providers of Minnesota
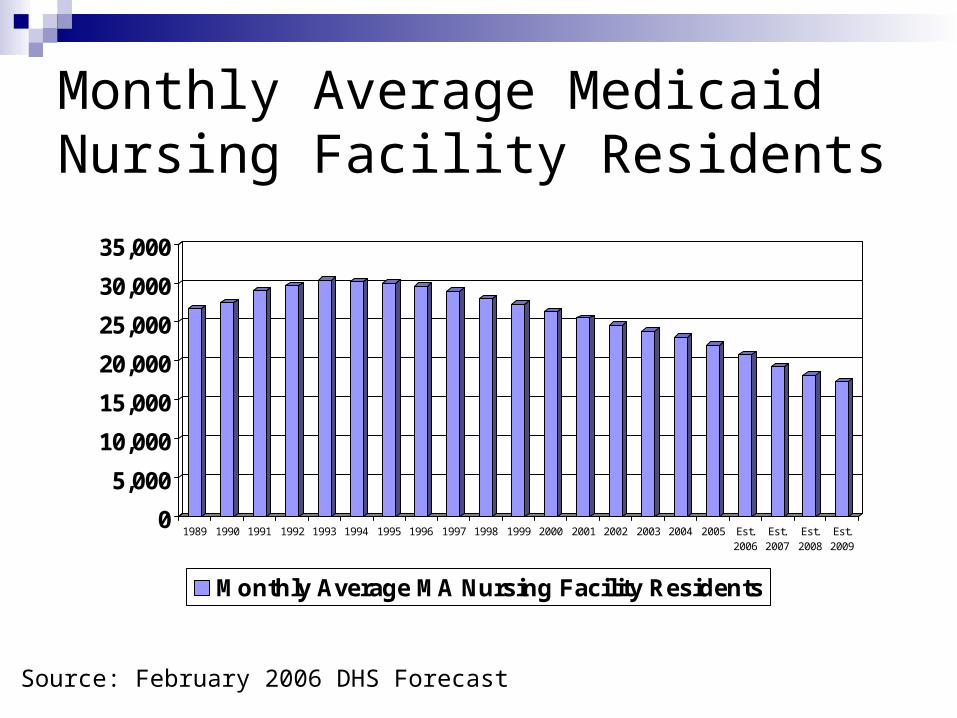
Monthly Average Medicaid Nursing Facility Residents
0
5,000
10,000
15,000
20,000
25,000
30,000
35,000
1989 1990 1991 1992 1993 1994 1995 1996 1997 1998 1999 2000 2001 2002 2003 2004 2005 Est.2006
Est.2007
Est.2008
Est.2009
Monthly Average MA Nursing Facility Residents
Source: February 2006 DHS Forecast

Monthly Average Medicaid EW Service Recipients
0
5,000
10,000
15,000
20,000
25,000
1989 1990 1991 1992 1993 1994 1995 1996 1997 1998 1999 2000 2001 2002 2003 2004 2005 Est.2006
Est.2007
Est.2008
Est.2009
EW - Fee for Service EW - Managed Care
Source: February 2006 DHS Forecast

Monthly Average Medicaid LTC Waivers & Home Care*
0
10,000
20,000
30,000
40,000
50,000
60,000
1990 1991 1992 1993 1994 1995 1996 1997 1998 1999 2000 2001 2002 2003 2004 2005 Est.2006
Est.2007
Est.2008
Est.2009
Monthly Average
Source: February 2006 DHS Forecast
* Payments for MA home and community-based waivers, home health agency services, personal care and private duty nursing services.
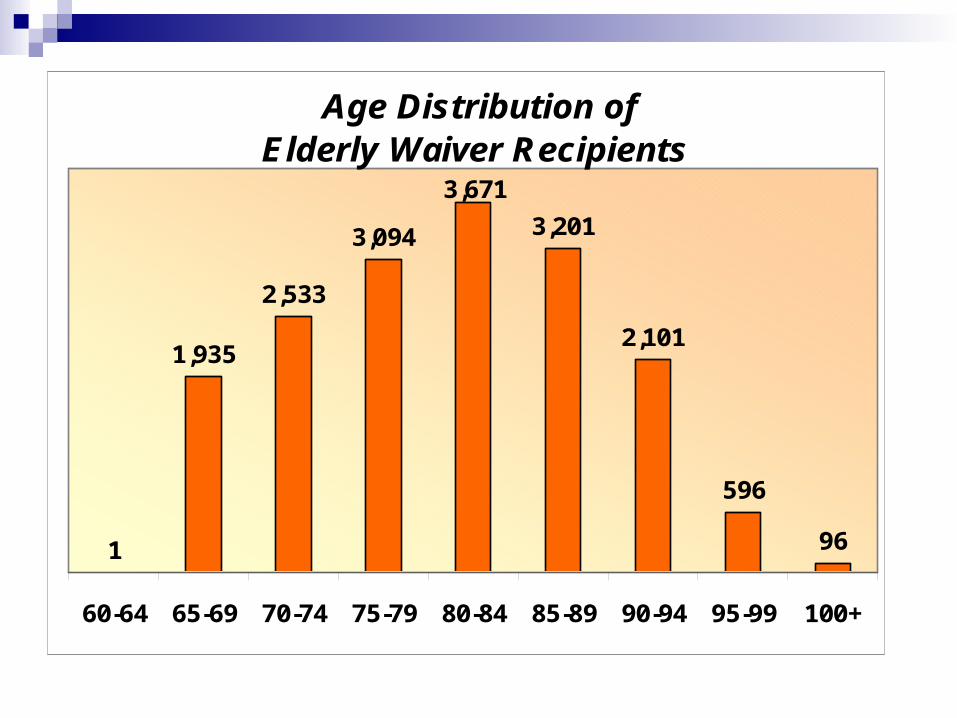
Age Distribution ofElderly Waiver Recipients
96
596
2,101
3,2013,094
2,533
1,935
1
3,671
100+95-9990-9485-8980-8475-7970-7465-6960-64
FY 2005
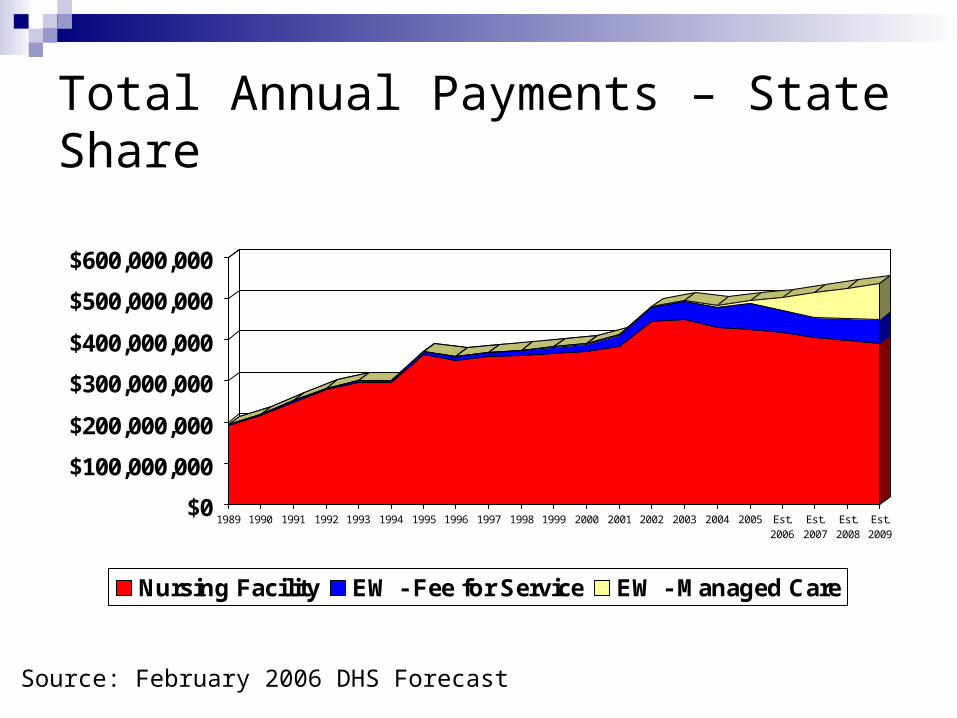
Total Annual Payments – State Share
$0
$100,000,000
$200,000,000
$300,000,000
$400,000,000
$500,000,000
$600,000,000
1989 1990 1991 1992 1993 1994 1995 1996 1997 1998 1999 2000 2001 2002 2003 2004 2005 Est.2006
Est.2007
Est.2008
Est.2009
Nursing Facility EW - Fee for Service EW - Managed Care
Source: February 2006 DHS Forecast

Operating Margin
-3.00%
-2.00%
-1.00%
0.00%
1.00%
2.00%
3.00%
4.00%
5.00%
6.00%
Me
dia
n
Region
2001 3.20% 3.60% 5.90% 2.20% 4.70% 1.00% -1.70% 2.30%
2002 1.32% 3.51% 3.93% 1.50% 3.74% 1.06% -0.82% 1.31%
2003 1.32% -0.20% 2.53% 1.58% 2.33% 0.15% -0.84% 0.38%
2004 3.58% 1.41% 0.52% 1.67% -0.76% -0.05% -0.38% 0.46%
2005 0.98% -0.04% 2.63% 0.01% -2.48% -1.01% 0.60% 0.14%
North West
North EastWest
CentralEast
CentralSouth West
South East
Metro Total
Imperative Nursing Facility SurveyPrepared by Larson, Allen, Weishair & Co., LLP
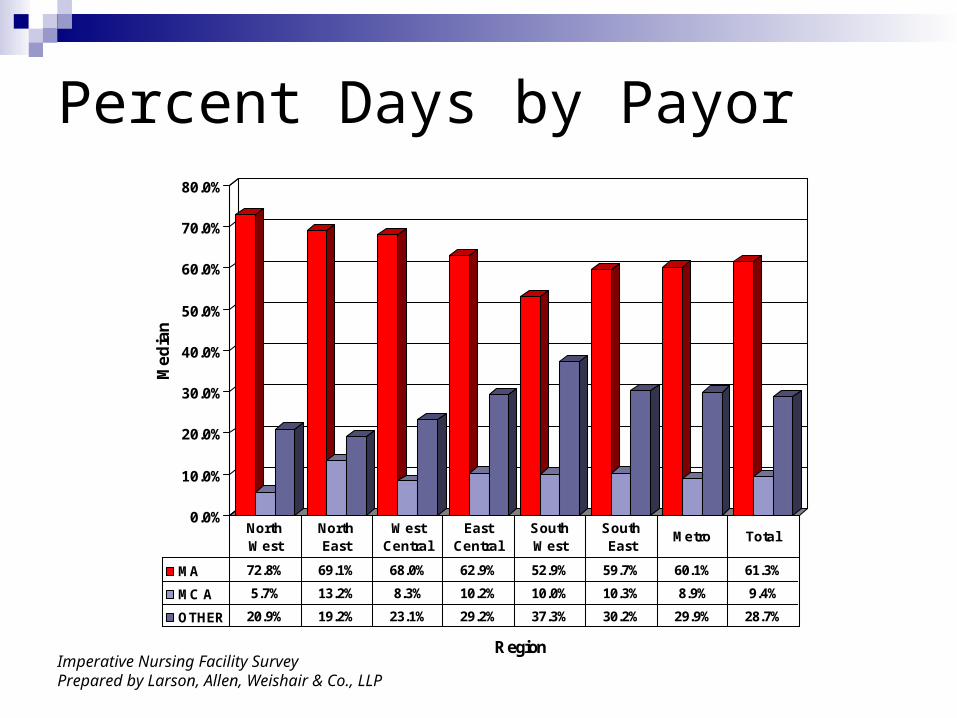
Percent Days by Payor
0.0%
10.0%
20.0%
30.0%
40.0%
50.0%
60.0%
70.0%
80.0%
Me
dia
n
Region
MA 72.8% 69.1% 68.0% 62.9% 52.9% 59.7% 60.1% 61.3%
MC A 5.7% 13.2% 8.3% 10.2% 10.0% 10.3% 8.9% 9.4%
OTHER 20.9% 19.2% 23.1% 29.2% 37.3% 30.2% 29.9% 28.7%
North West
North East
West Central
East Central
South West
South East
Metro Total
Imperative Nursing Facility SurveyPrepared by Larson, Allen, Weishair & Co., LLP
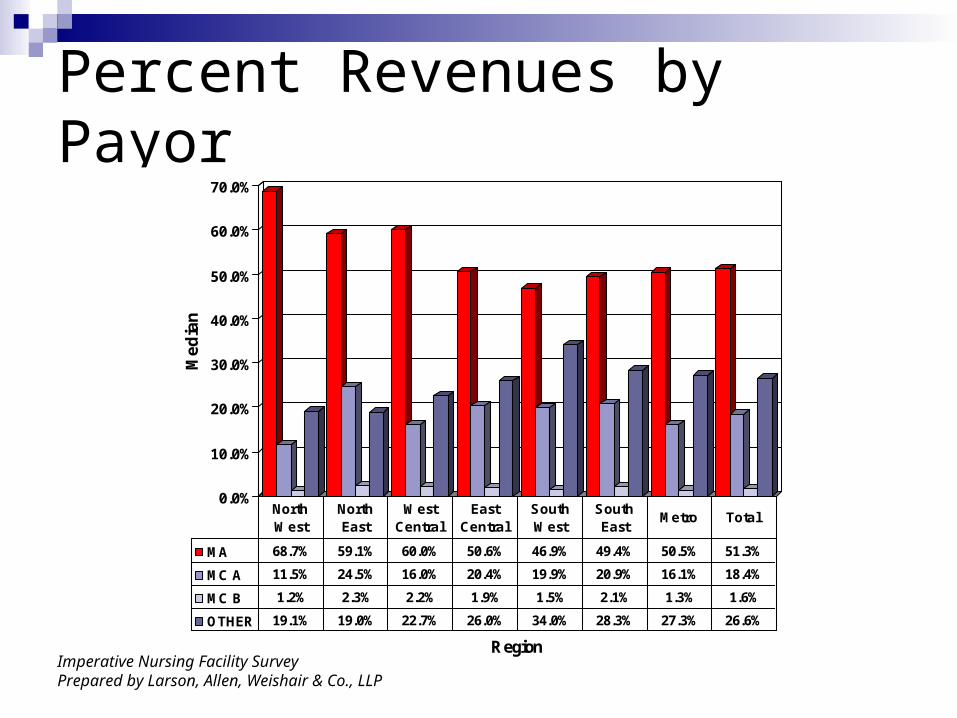
Percent Revenues by Payor
0.0%
10.0%
20.0%
30.0%
40.0%
50.0%
60.0%
70.0%M
ed
ian
Region
MA 68.7% 59.1% 60.0% 50.6% 46.9% 49.4% 50.5% 51.3%
MC A 11.5% 24.5% 16.0% 20.4% 19.9% 20.9% 16.1% 18.4%
MC B 1.2% 2.3% 2.2% 1.9% 1.5% 2.1% 1.3% 1.6%
OTHER 19.1% 19.0% 22.7% 26.0% 34.0% 28.3% 27.3% 26.6%
North West
North East
West Central
East Central
South West
South East
Metro Total
Imperative Nursing Facility SurveyPrepared by Larson, Allen, Weishair & Co., LLP
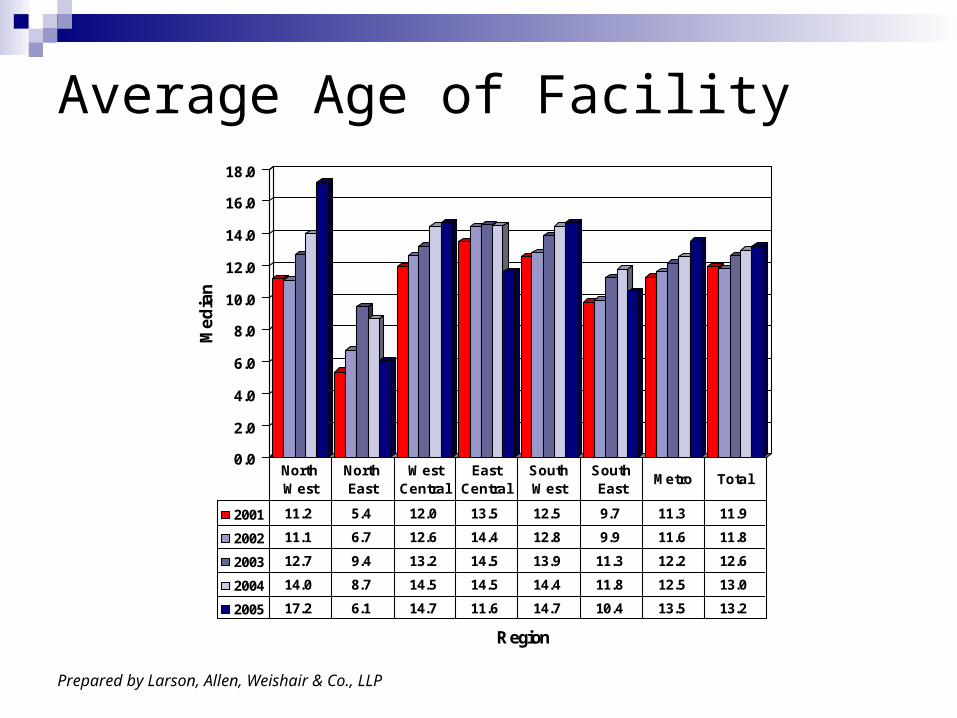
Average Age of Facility
Imperative Nursing Facility SurveyPrepared by Larson, Allen, Weishair & Co., LLP
0.0
2.0
4.0
6.0
8.0
10.0
12.0
14.0
16.0
18.0
Me
dia
n
Region
2001 11.2 5.4 12.0 13.5 12.5 9.7 11.3 11.9
2002 11.1 6.7 12.6 14.4 12.8 9.9 11.6 11.8
2003 12.7 9.4 13.2 14.5 13.9 11.3 12.2 12.6
2004 14.0 8.7 14.5 14.5 14.4 11.8 12.5 13.0
2005 17.2 6.1 14.7 11.6 14.7 10.4 13.5 13.2
North West
North East
West Central
East Central
South West
South East
Metro Total
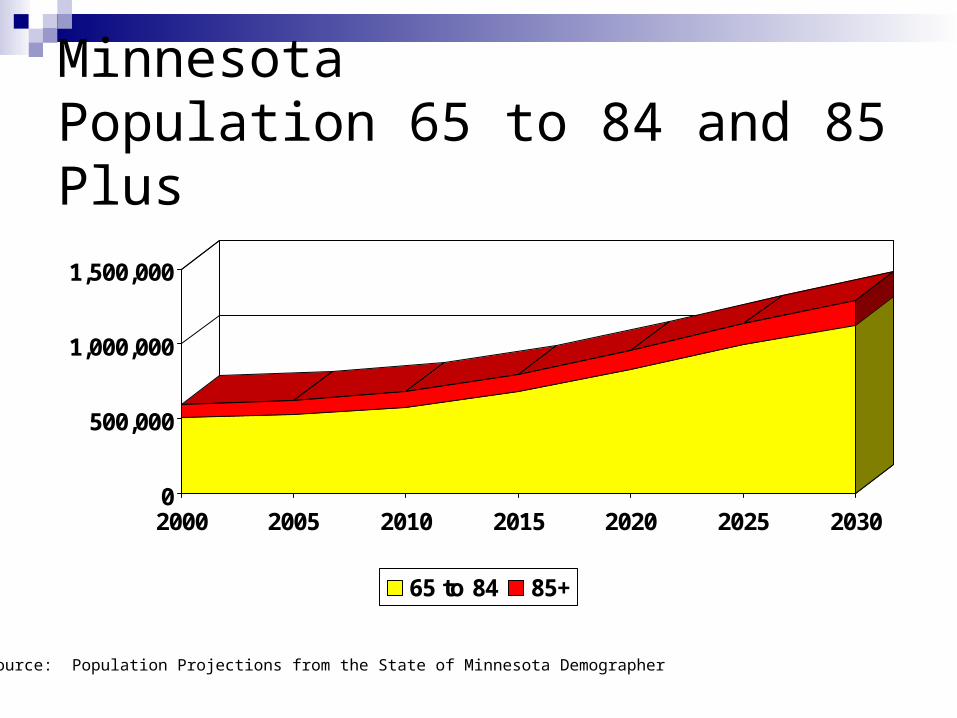
MinnesotaPopulation 65 to 84 and 85 Plus
0
500,000
1,000,000
1,500,000
2000 2005 2010 2015 2020 2025 2030
65 to 84 85+
Source: Population Projections from the State of Minnesota Demographer
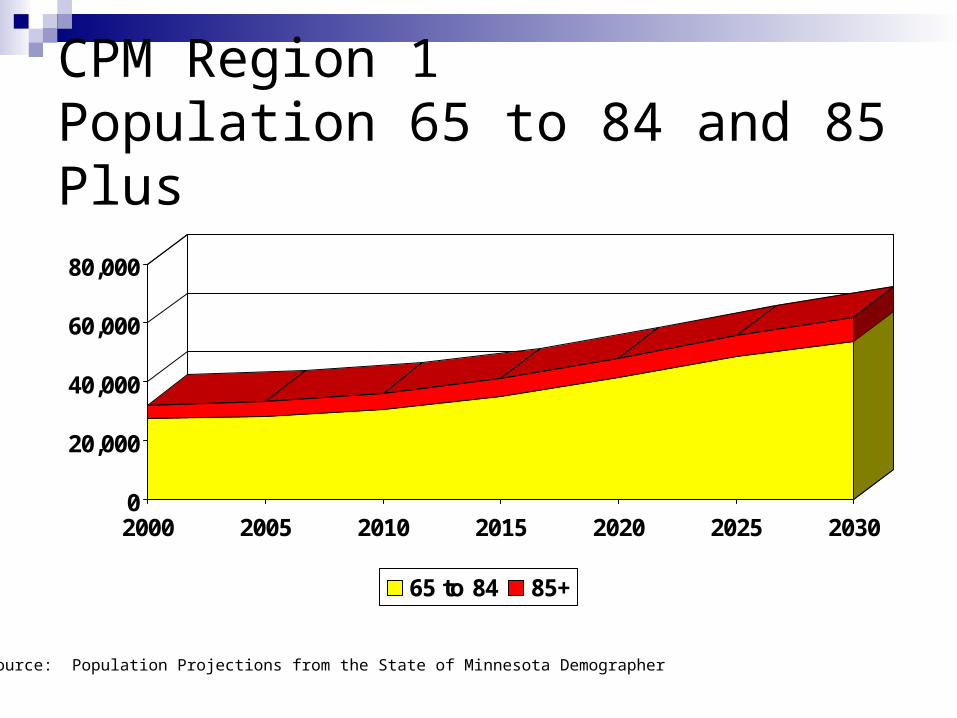
CPM Region 1 Population 65 to 84 and 85 Plus
0
20,000
40,000
60,000
80,000
2000 2005 2010 2015 2020 2025 2030
65 to 84 85+
Source: Population Projections from the State of Minnesota Demographer
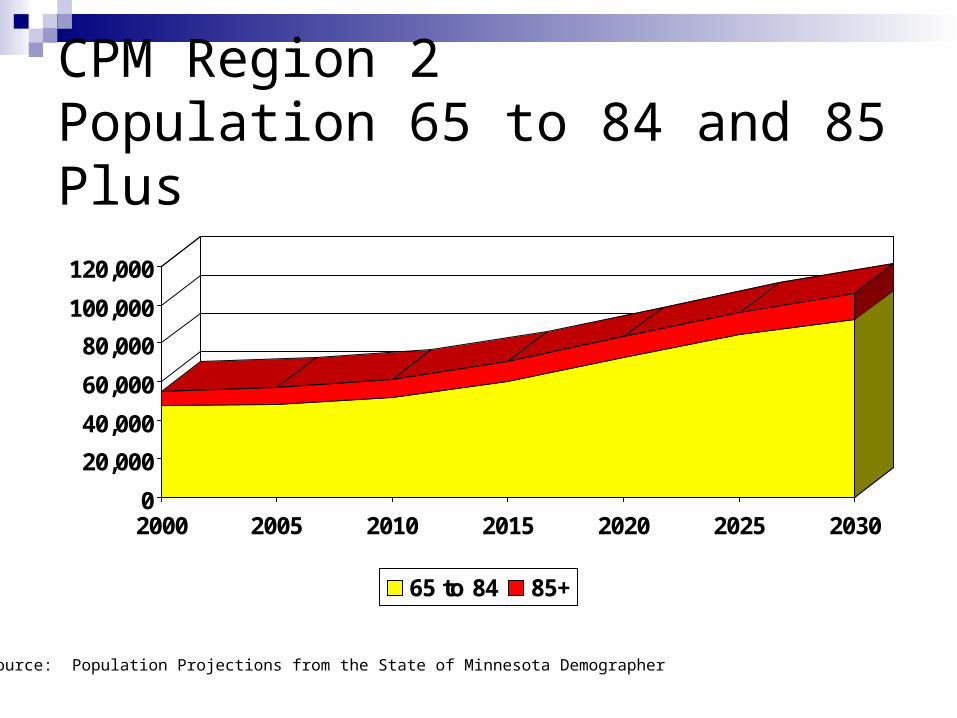
CPM Region 2 Population 65 to 84 and 85 Plus
0
20,000
40,000
60,000
80,000
100,000
120,000
2000 2005 2010 2015 2020 2025 2030
65 to 84 85+
Source: Population Projections from the State of Minnesota Demographer
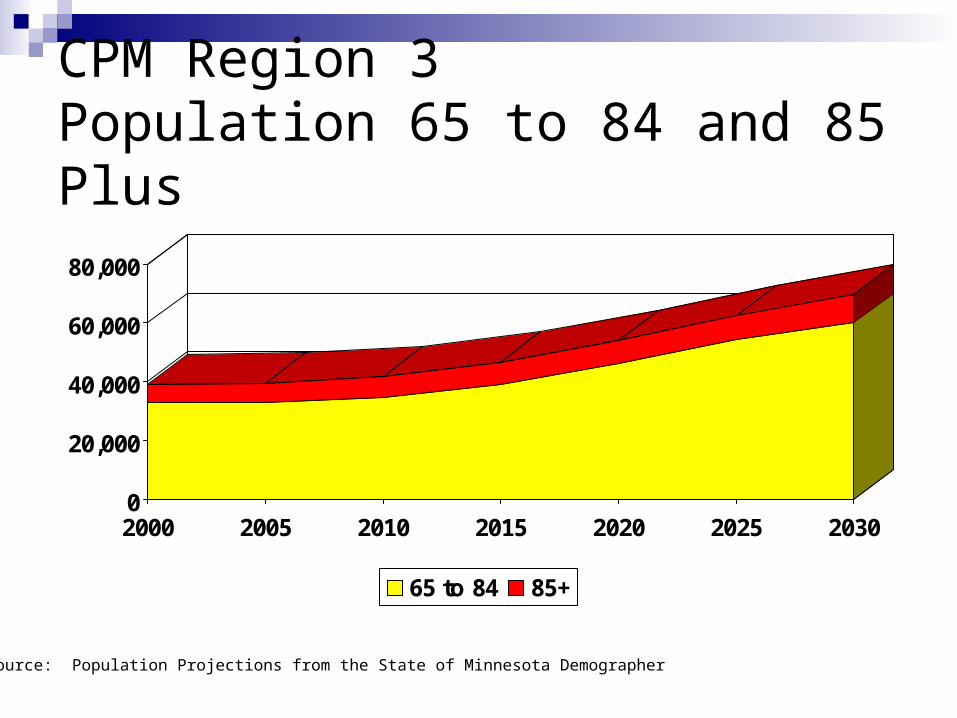
CPM Region 3Population 65 to 84 and 85 Plus
0
20,000
40,000
60,000
80,000
2000 2005 2010 2015 2020 2025 2030
65 to 84 85+
Source: Population Projections from the State of Minnesota Demographer
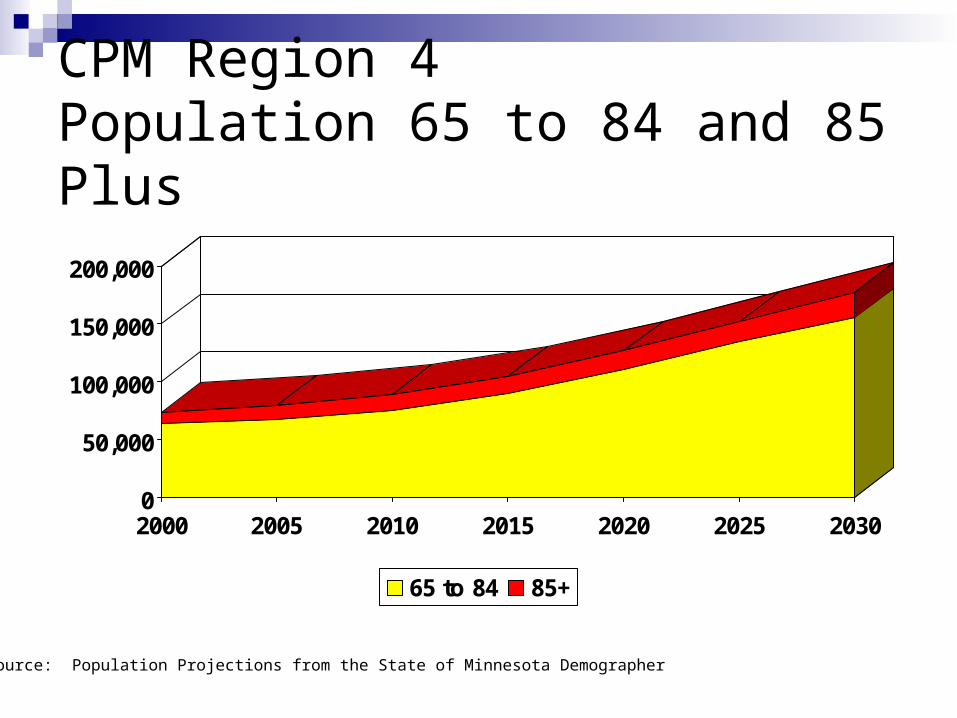
CPM Region 4Population 65 to 84 and 85 Plus
0
50,000
100,000
150,000
200,000
2000 2005 2010 2015 2020 2025 2030
65 to 84 85+
Source: Population Projections from the State of Minnesota Demographer
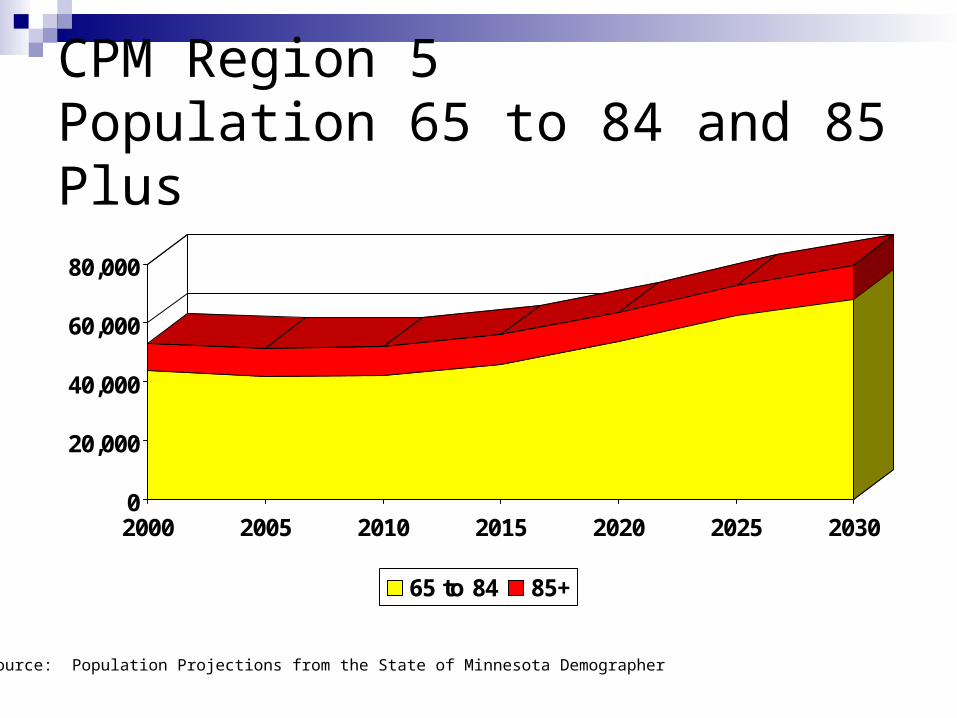
CPM Region 5Population 65 to 84 and 85 Plus
0
20,000
40,000
60,000
80,000
2000 2005 2010 2015 2020 2025 2030
65 to 84 85+
Source: Population Projections from the State of Minnesota Demographer
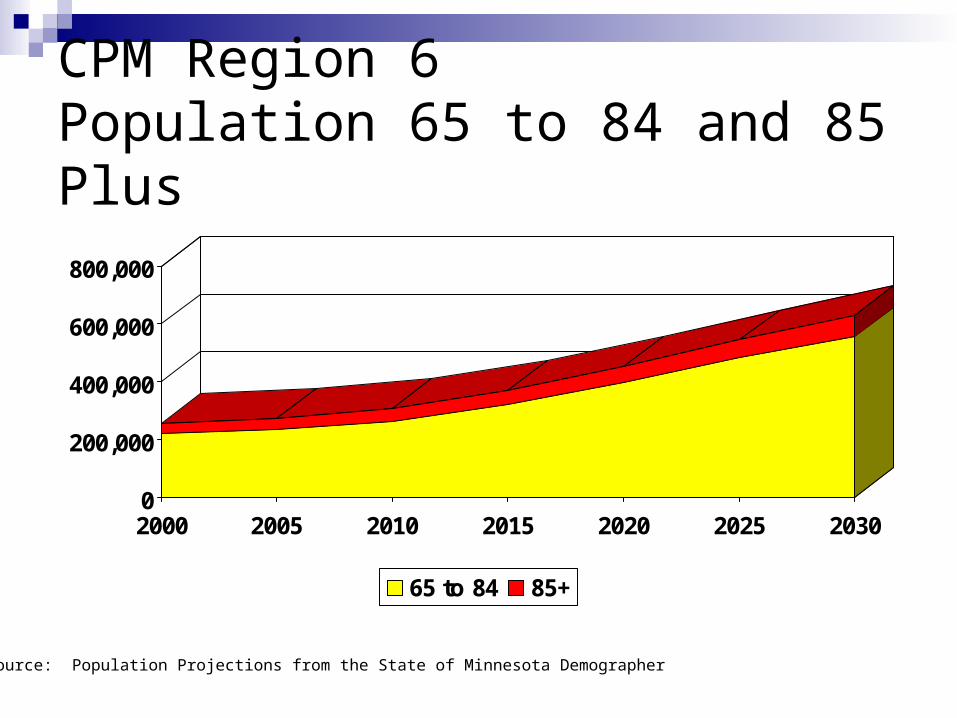
CPM Region 6Population 65 to 84 and 85 Plus
0
200,000
400,000
600,000
800,000
2000 2005 2010 2015 2020 2025 2030
65 to 84 85+
Source: Population Projections from the State of Minnesota Demographer

CPM Region 7Population 65 to 84 and 85 Plus
0
20,000
40,000
60,000
80,000
100,000
2000 2005 2010 2015 2020 2025 2030
65 to 84 85+
Source: Population Projections from the State of Minnesota Demographer
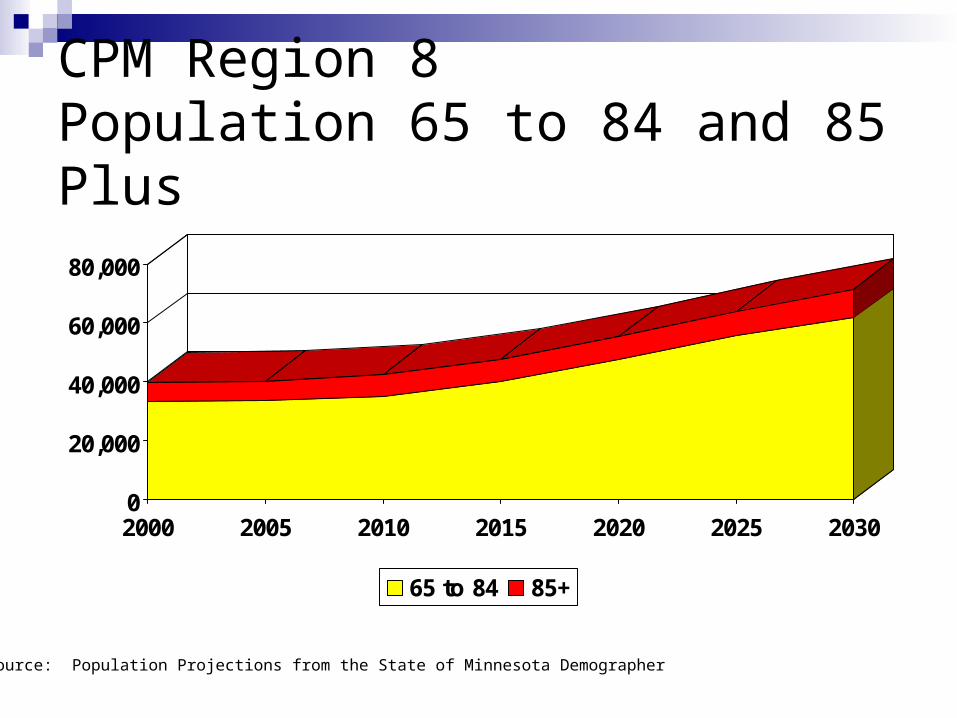
CPM Region 8Population 65 to 84 and 85 Plus
0
20,000
40,000
60,000
80,000
2000 2005 2010 2015 2020 2025 2030
65 to 84 85+
Source: Population Projections from the State of Minnesota Demographer
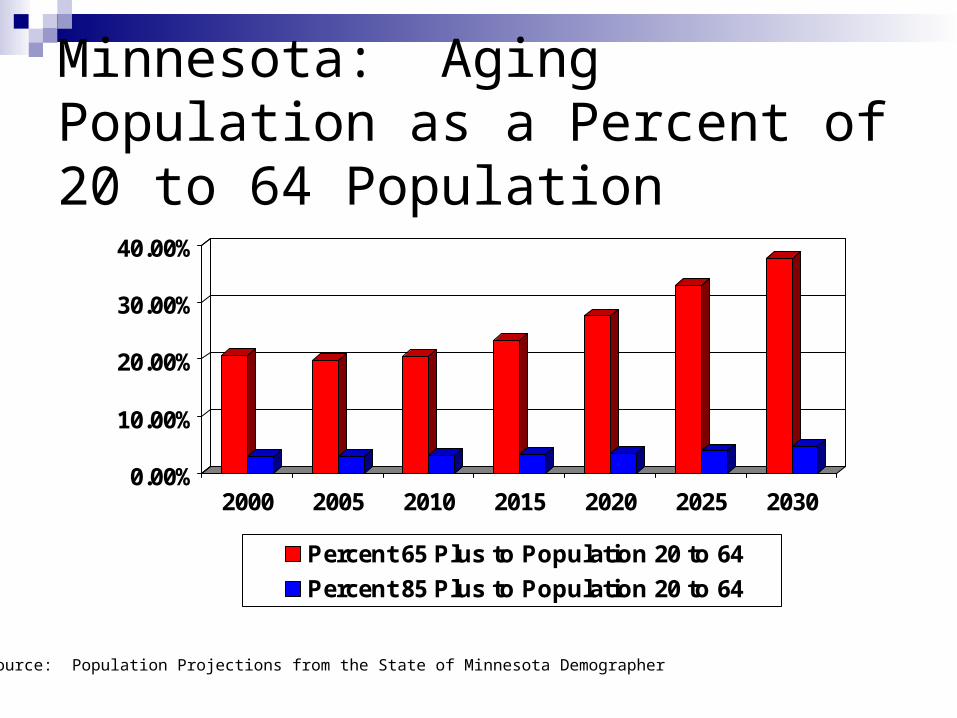
Minnesota: Aging Population as a Percent of 20 to 64 Population
0.00%
10.00%
20.00%
30.00%
40.00%
2000 2005 2010 2015 2020 2025 2030
Percent 65 Plus to Population 20 to 64
Percent 85 Plus to Population 20 to 64
Source: Population Projections from the State of Minnesota Demographer
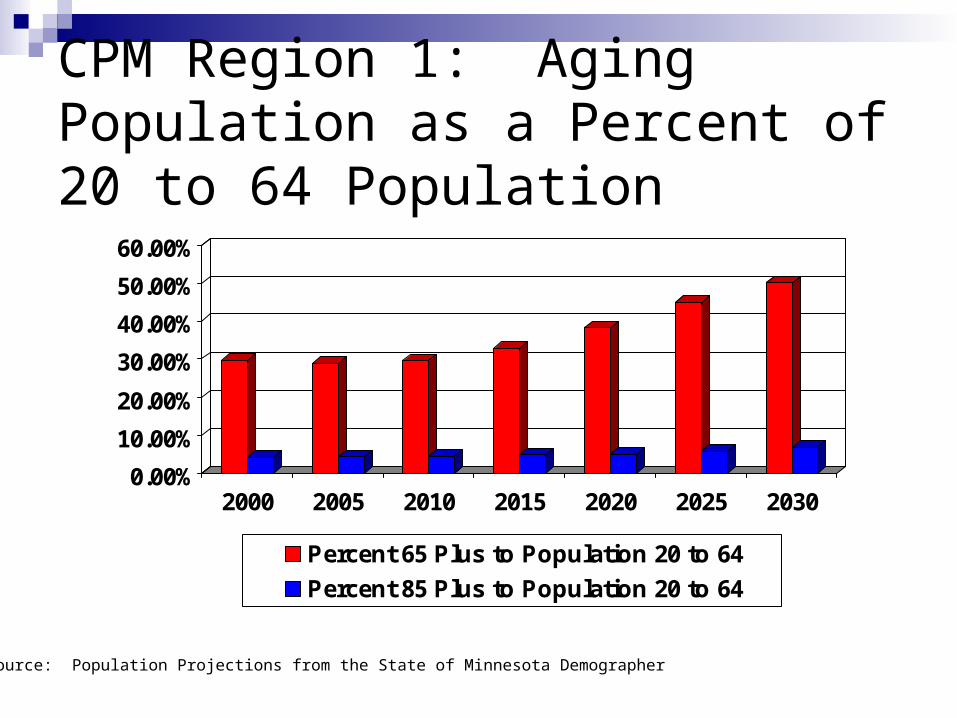
CPM Region 1: Aging Population as a Percent of 20 to 64 Population
0.00%
10.00%
20.00%
30.00%
40.00%
50.00%
60.00%
2000 2005 2010 2015 2020 2025 2030
Percent 65 Plus to Population 20 to 64
Percent 85 Plus to Population 20 to 64
Source: Population Projections from the State of Minnesota Demographer
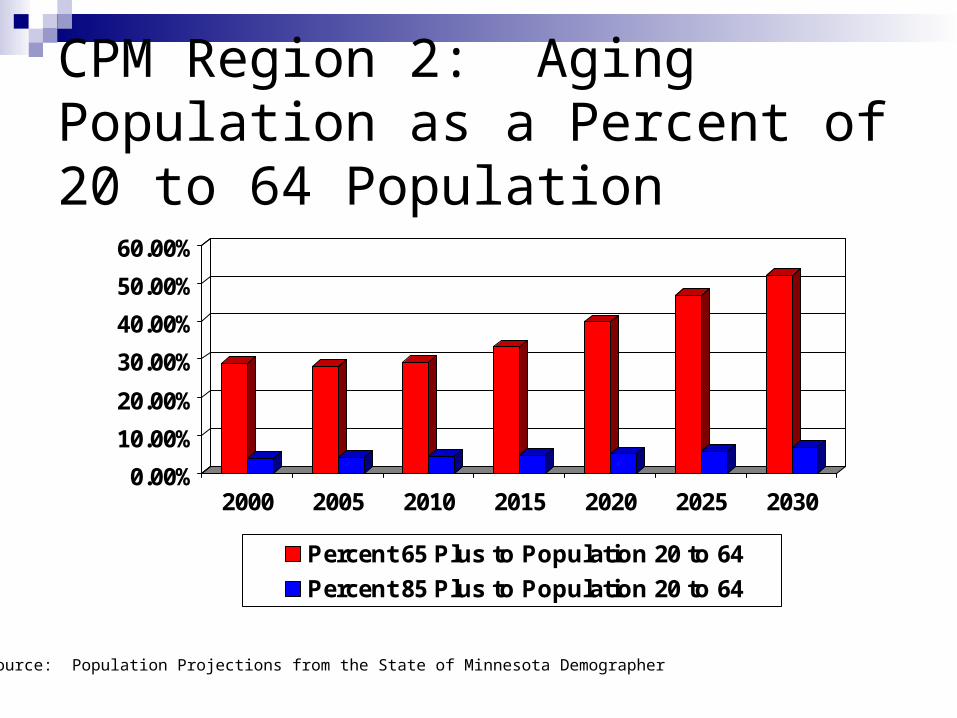
CPM Region 2: Aging Population as a Percent of 20 to 64 Population
0.00%
10.00%
20.00%
30.00%
40.00%
50.00%
60.00%
2000 2005 2010 2015 2020 2025 2030
Percent 65 Plus to Population 20 to 64
Percent 85 Plus to Population 20 to 64
Source: Population Projections from the State of Minnesota Demographer
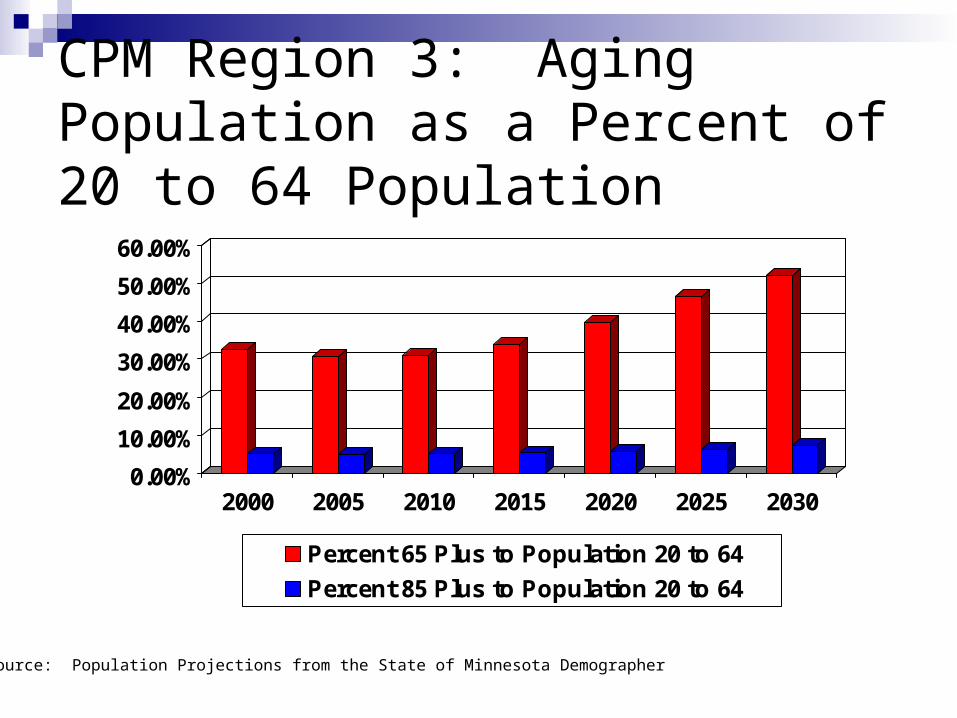
CPM Region 3: Aging Population as a Percent of 20 to 64 Population
0.00%
10.00%
20.00%
30.00%
40.00%
50.00%
60.00%
2000 2005 2010 2015 2020 2025 2030
Percent 65 Plus to Population 20 to 64
Percent 85 Plus to Population 20 to 64
Source: Population Projections from the State of Minnesota Demographer
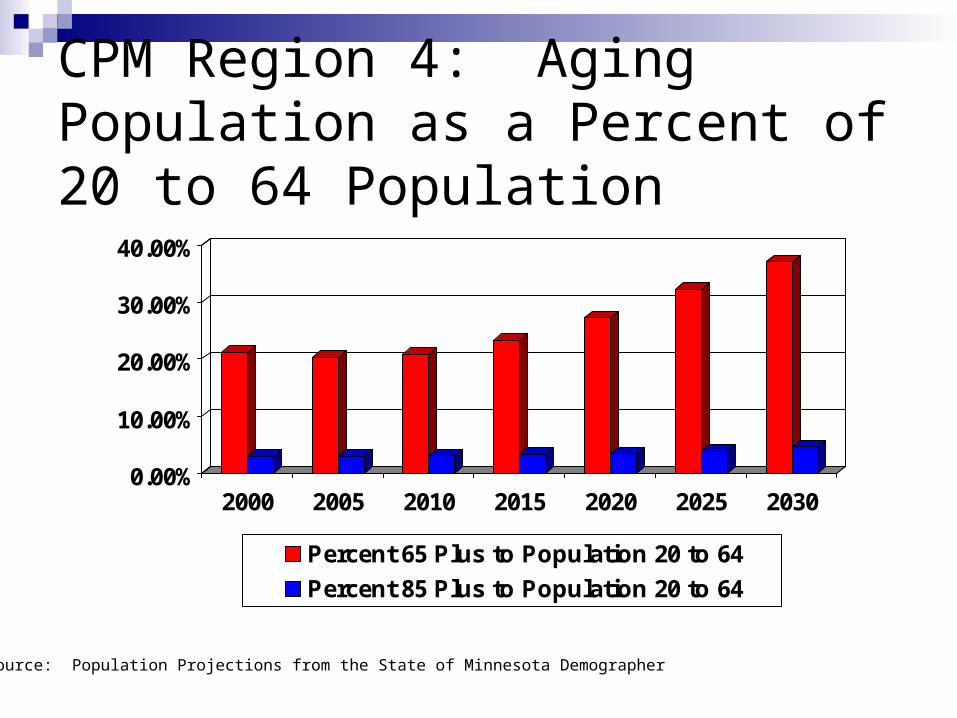
CPM Region 4: Aging Population as a Percent of 20 to 64 Population
0.00%
10.00%
20.00%
30.00%
40.00%
2000 2005 2010 2015 2020 2025 2030
Percent 65 Plus to Population 20 to 64
Percent 85 Plus to Population 20 to 64
Source: Population Projections from the State of Minnesota Demographer
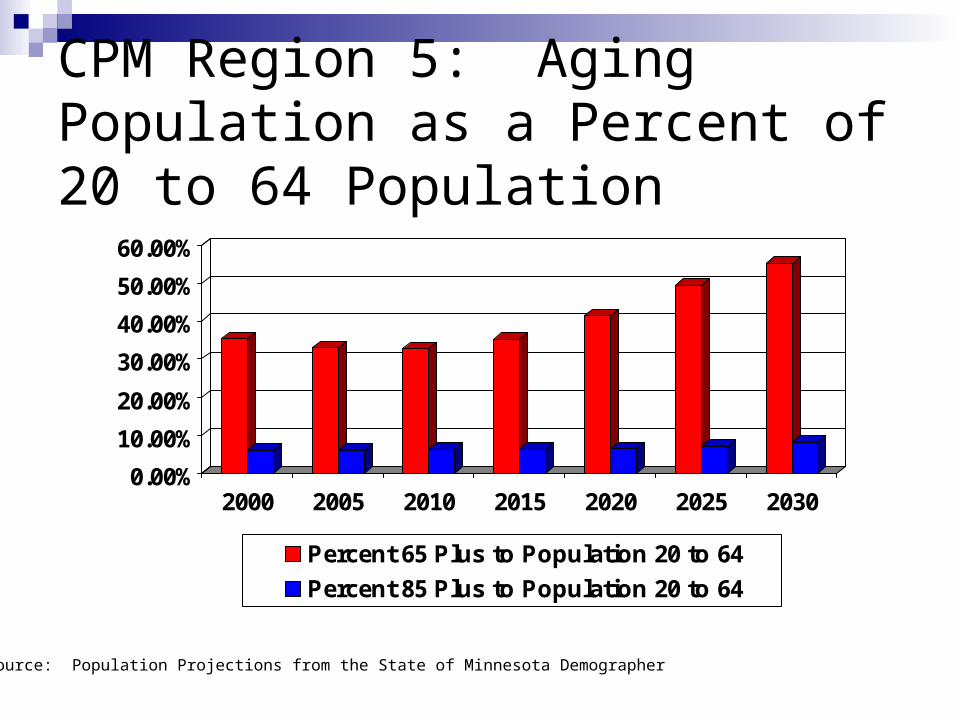
CPM Region 5: Aging Population as a Percent of 20 to 64 Population
0.00%
10.00%
20.00%
30.00%
40.00%
50.00%
60.00%
2000 2005 2010 2015 2020 2025 2030
Percent 65 Plus to Population 20 to 64
Percent 85 Plus to Population 20 to 64
Source: Population Projections from the State of Minnesota Demographer
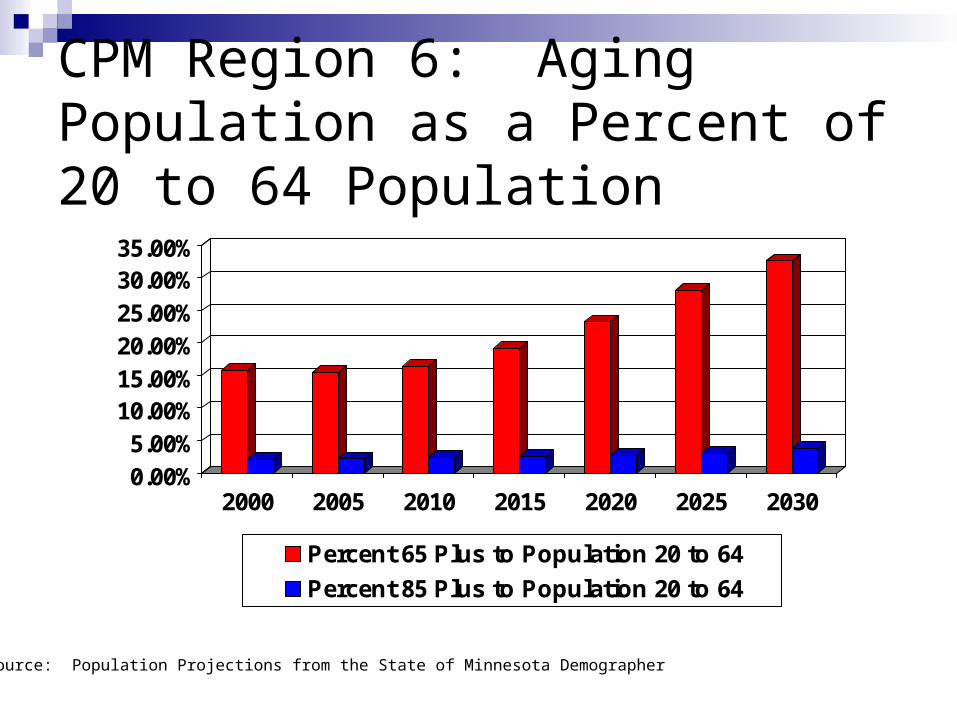
CPM Region 6: Aging Population as a Percent of 20 to 64 Population
0.00%5.00%
10.00%15.00%20.00%25.00%30.00%35.00%
2000 2005 2010 2015 2020 2025 2030
Percent 65 Plus to Population 20 to 64
Percent 85 Plus to Population 20 to 64
Source: Population Projections from the State of Minnesota Demographer

CPM Region 7: Aging Population as a Percent of 20 to 64 Population
0.00%
10.00%
20.00%
30.00%
40.00%
50.00%
2000 2005 2010 2015 2020 2025 2030
Percent 65 Plus to Population 20 to 64
Percent 85 Plus to Population 20 to 64
Source: Population Projections from the State of Minnesota Demographer

CPM Region 8: Aging Population as a Percent of 20 to 64 Population
0.00%
10.00%
20.00%
30.00%
40.00%
50.00%
2000 2005 2010 2015 2020 2025 2030
Percent 65 Plus to Population 20 to 64
Percent 85 Plus to Population 20 to 64
Source: Population Projections from the State of Minnesota Demographer
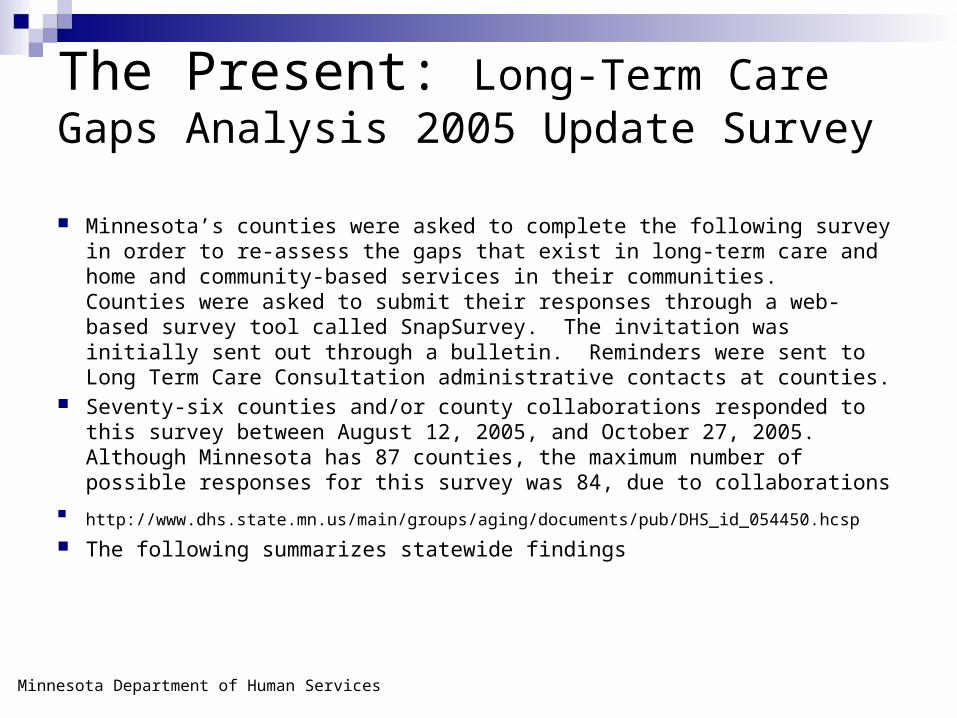
The Present: Long-Term Care Gaps Analysis 2005 Update Survey
Minnesota’s counties were asked to complete the following survey in order to re-assess the gaps that exist in long-term care and home and community-based services in their communities. Counties were asked to submit their responses through a web-based survey tool called SnapSurvey. The invitation was initially sent out through a bulletin. Reminders were sent to Long Term Care Consultation administrative contacts at counties.
Seventy-six counties and/or county collaborations responded to this survey between August 12, 2005, and October 27, 2005. Although Minnesota has 87 counties, the maximum number of possible responses for this survey was 84, due to collaborations
http://www.dhs.state.mn.us/main/groups/aging/documents/pub/DHS_id_054450.hcsp The following summarizes statewide findings
Minnesota Department of Human Services
General Findings HCBS. Generally speaking, counties believe that home and community-based
services around the state are adequate. However, there is still need for service development in particular counties and
in particular services, including transportation, evening and weekend care and respite services, chore services, and adult day services.
Counties are also concerned about how the migration of HCBS into managed care will affect access and quality of services.
Housing. Housing needs for average income and high-functioning persons with disabilities and elderly are adequate around the state. There is still a great need to address affordable housing for people around the
state, and to develop housing options for persons with complex needs. In addition, there is a need for home and apartment modifications, so people
can continue to live in their own communities with limited mobility. Nursing facilities. The number of nursing home beds around the state is generally
adequate. Although some communities have concerns about the distance that people
must travel to get to them. There is still a need to develop nursing home beds for special needs
populations. The most pressing concern for nursing home care is the lack of adequate
workforce to serve the population.
Minnesota Department of Human Services
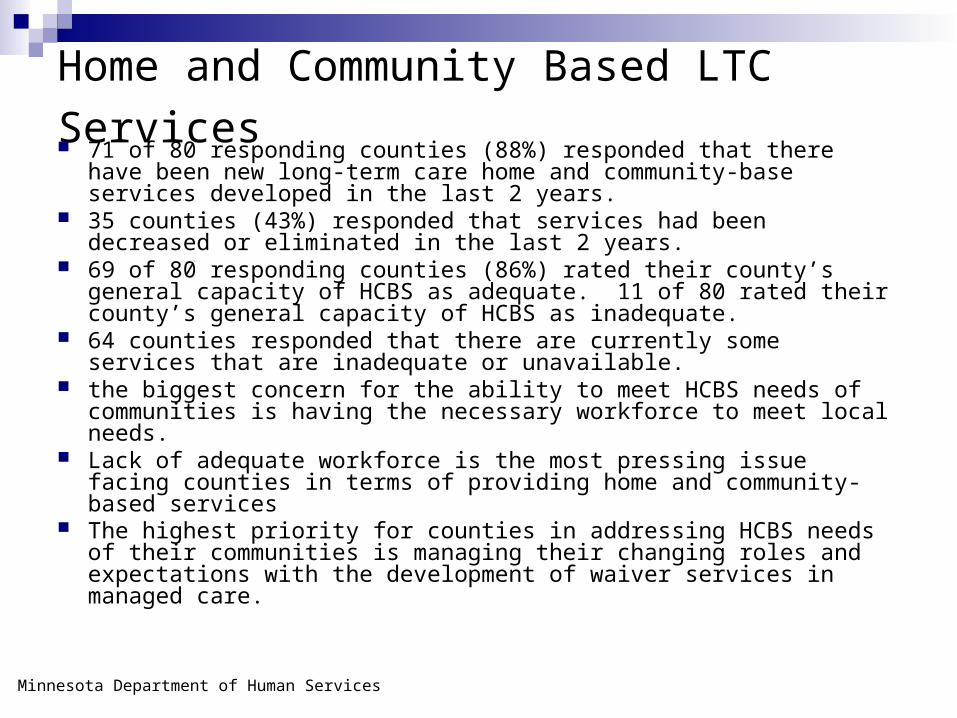
Home and Community Based LTC Services 71 of 80 responding counties (88%) responded that there have been
new long-term care home and community-base services developed in the last 2 years.
35 counties (43%) responded that services had been decreased or eliminated in the last 2 years.
69 of 80 responding counties (86%) rated their county’s general capacity of HCBS as adequate. 11 of 80 rated their county’s general capacity of HCBS as inadequate.
64 counties responded that there are currently some services that are inadequate or unavailable.
the biggest concern for the ability to meet HCBS needs of communities is having the necessary workforce to meet local needs.
Lack of adequate workforce is the most pressing issue facing counties in terms of providing home and community-based services
The highest priority for counties in addressing HCBS needs of their communities is managing their changing roles and expectations with the development of waiver services in managed care.
Minnesota Department of Human Services
Home and Community Based LTC Services
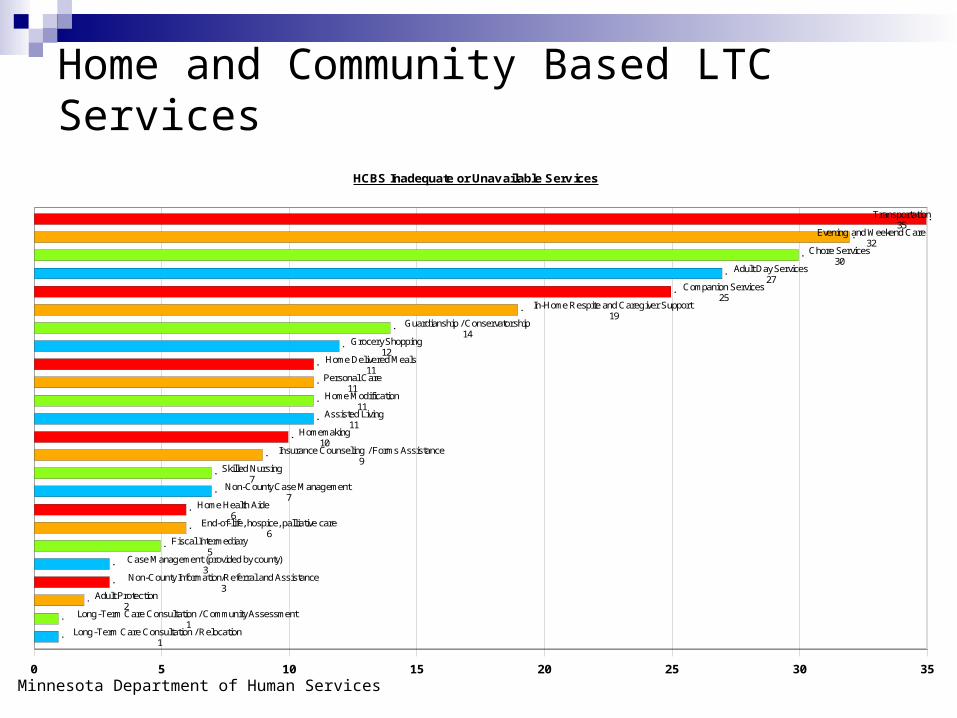
0 5 10 15 20 25 30 35
Long-Term Care Consultation / Relocation 1
Long-Term Care Consultation / Community Assessment1
Adult Protection2
Non-County Information/Referral and Assistance3
Case Management (provided by county)3
Fiscal Intermediary5
End-of-life, hospice, palliative care6
Home Health Aide6
Non-County Case Management7
Skilled Nursing7
Insurance Counseling / Forms Assistance9
Homemaking10
Assisted Living11
Home Modification11
Personal Care11
Home Delivered Meals11
Grocery Shopping12
Guardianship / Conservatorship14
In-Home Respite and Caregiver Support19
Companion Services25
Adult Day Services27
Chore Services30
Evening and Weekend Care32
Transportation35
HCBS Inadequate or Unavailable Services
Minnesota Department of Human Services
Housing Options
Inadequate
32.5%
Adequate
57.5%
Surplus/underutilized
10.0%
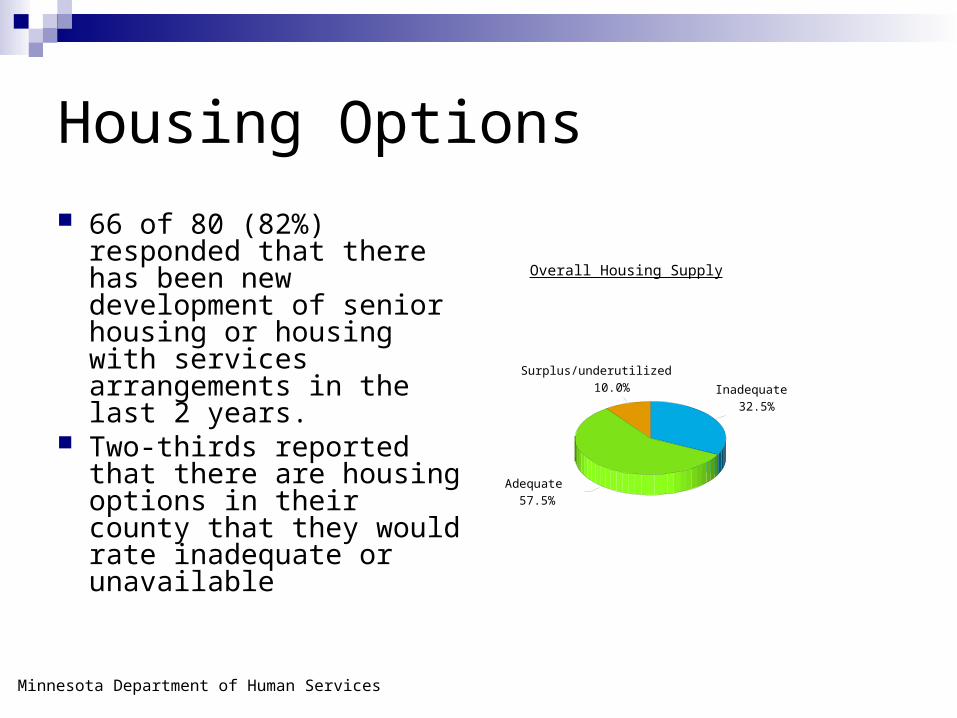
Overall Housing Supply
66 of 80 (82%) responded that there has been new development of senior housing or housing with services arrangements in the last 2 years.
Two-thirds reported that there are housing options in their county that they would rate inadequate or unavailable
Minnesota Department of Human Services
Housing Options
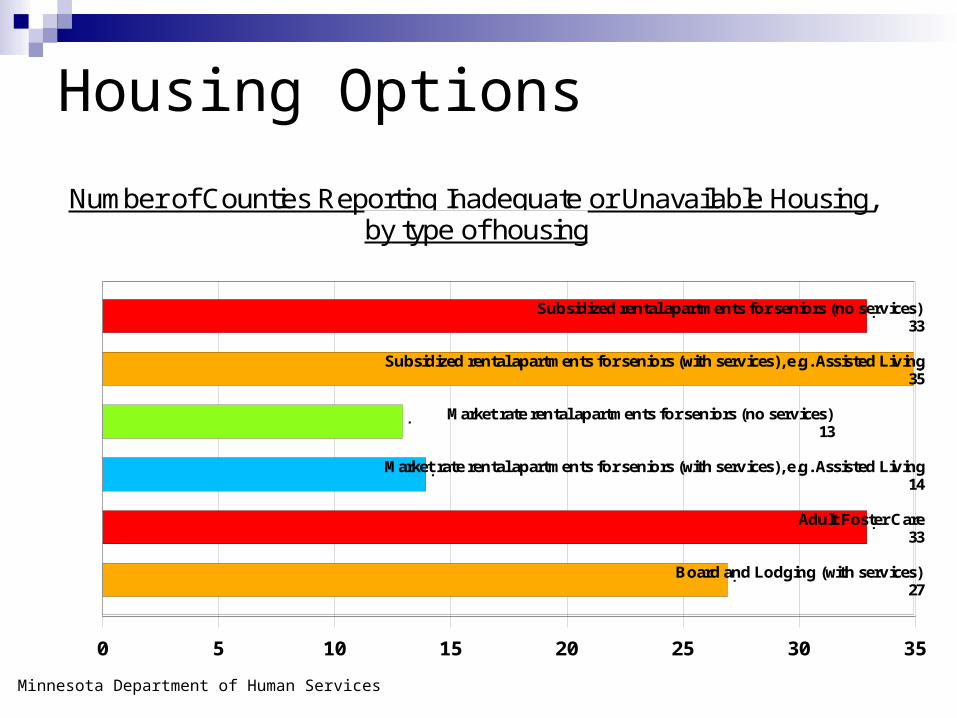
0 5 10 15 20 25 30 35
Board and Lodging (with services)27
Adult Foster Care33
Market rate rental apartments for seniors (with services), e.g. Assisted Living14
Market rate rental apartments for seniors (no services)13
Subsidized rental apartments for seniors (with services), e.g. Assisted Living35
Subsidized rental apartments for seniors (no services)33
Number of Counties Reporting Inadequate or Unavailable Housing,by type of housing
Minnesota Department of Human Services
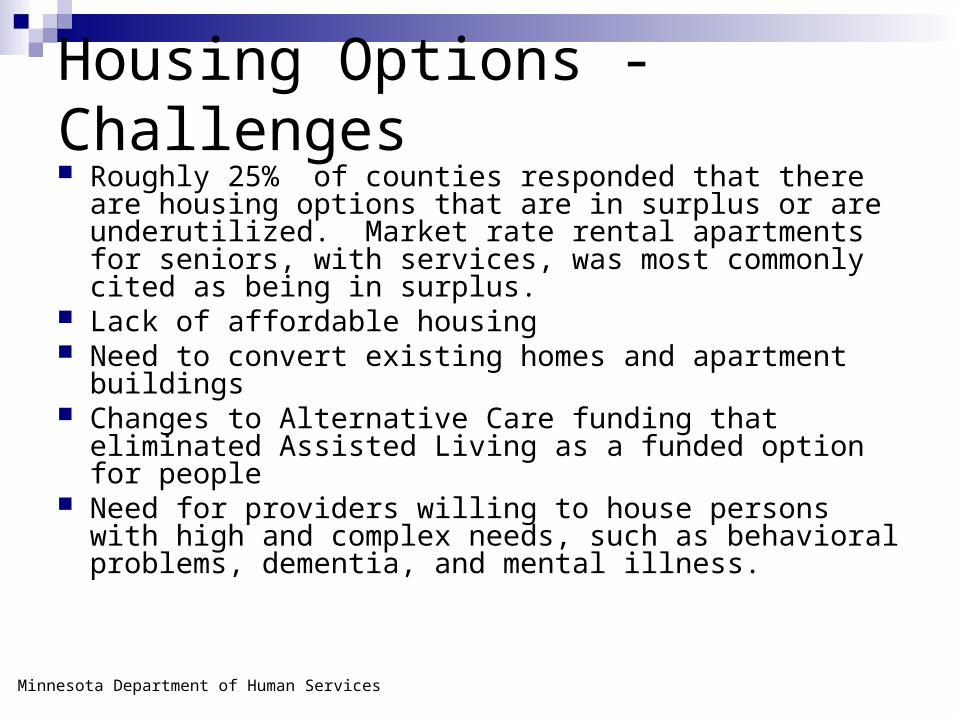
Housing Options - Challenges Roughly 25% of counties responded that there are
housing options that are in surplus or are underutilized. Market rate rental apartments for seniors, with services, was most commonly cited as being in surplus.
Lack of affordable housing Need to convert existing homes and apartment buildings Changes to Alternative Care funding that eliminated
Assisted Living as a funded option for people Need for providers willing to house persons with high
and complex needs, such as behavioral problems, dementia, and mental illness.
Minnesota Department of Human Services
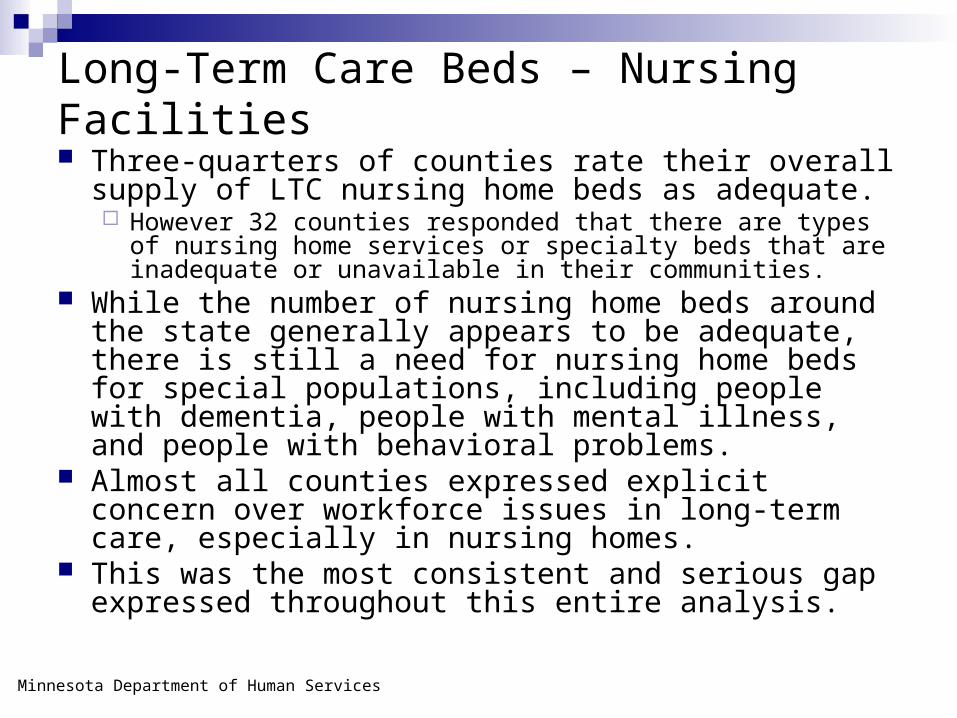
Long-Term Care Beds – Nursing Facilities Three-quarters of counties rate their overall supply of
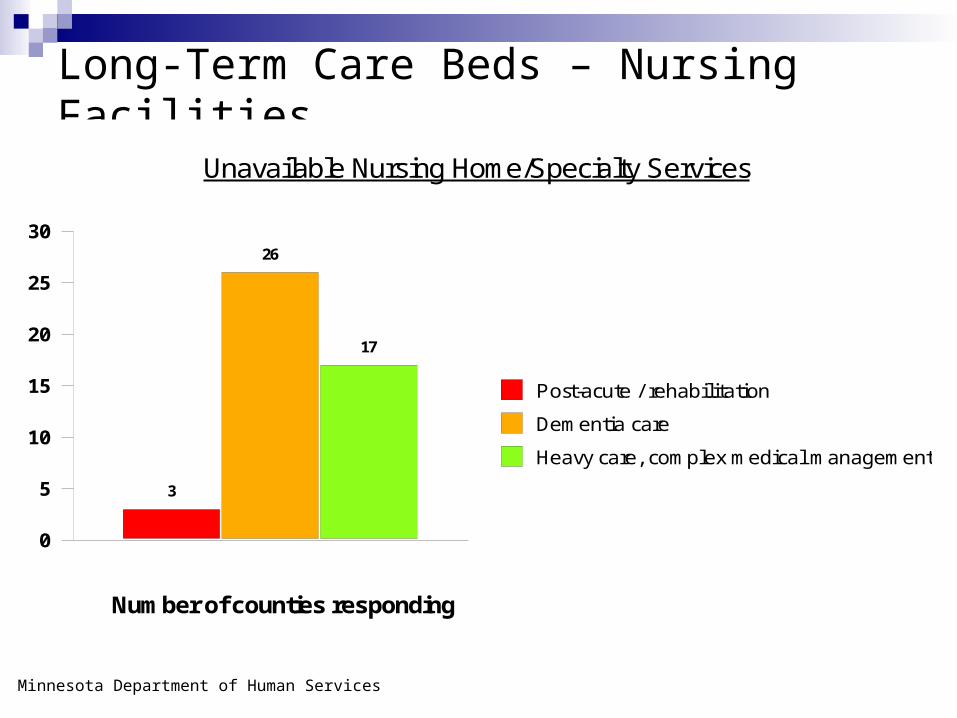
LTC nursing home beds as adequate. However 32 counties responded that there are types of nursing
home services or specialty beds that are inadequate or unavailable in their communities.
While the number of nursing home beds around the state generally appears to be adequate, there is still a need for nursing home beds for special populations, including people with dementia, people with mental illness, and people with behavioral problems.
Almost all counties expressed explicit concern over workforce issues in long-term care, especially in nursing homes.
This was the most consistent and serious gap expressed throughout this entire analysis.
Minnesota Department of Human Services
Long-Term Care Beds – Nursing Facilities
0
5
10
15
20
25
30
Number of counties responding
17
26
3
Post-acute / rehabilitation
Dementia care
Heavy care, complex medical management
Unavailable Nursing Home/Specialty Services
Minnesota Department of Human Services
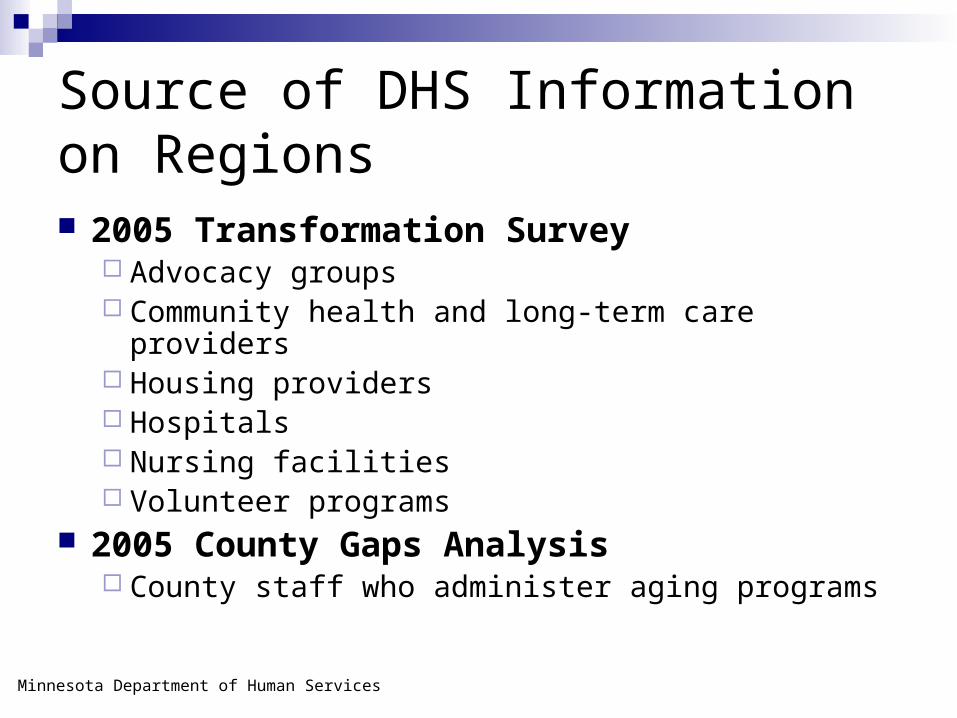
Source of DHS Information on Regions 2005 Transformation Survey
Advocacy groups Community health and long-term care providers Housing providers Hospitals Nursing facilities Volunteer programs
2005 County Gaps Analysis County staff who administer aging programs
Minnesota Department of Human Services

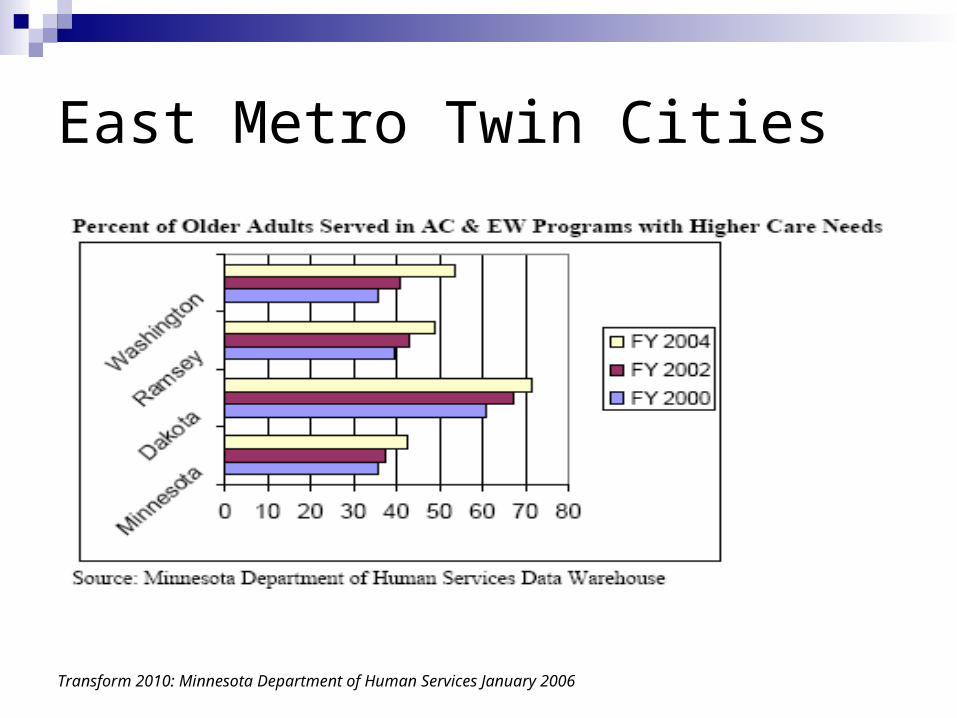
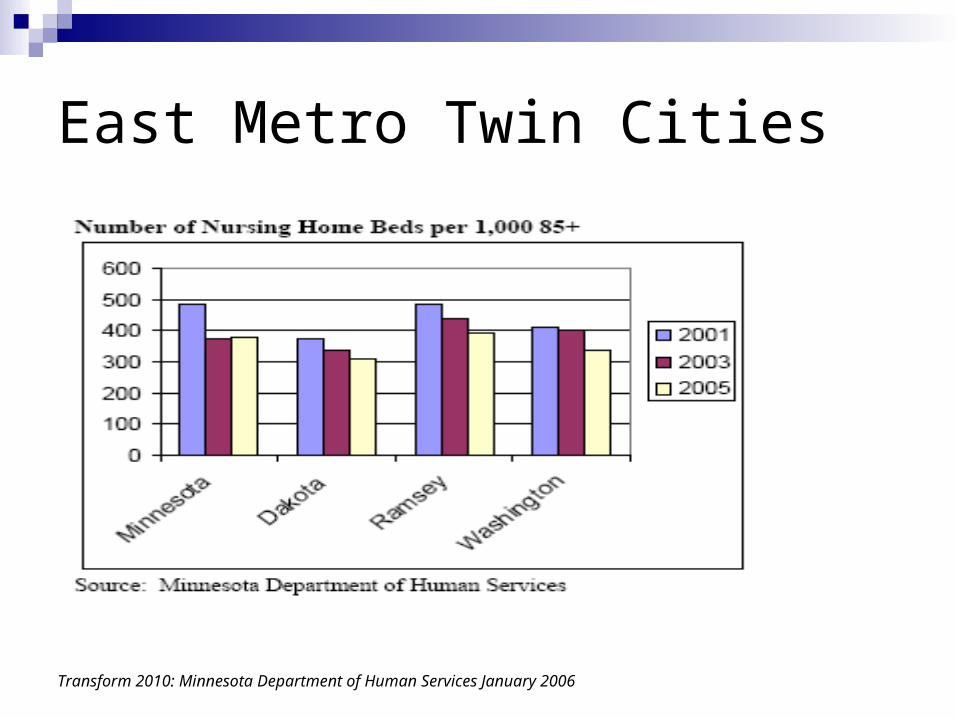
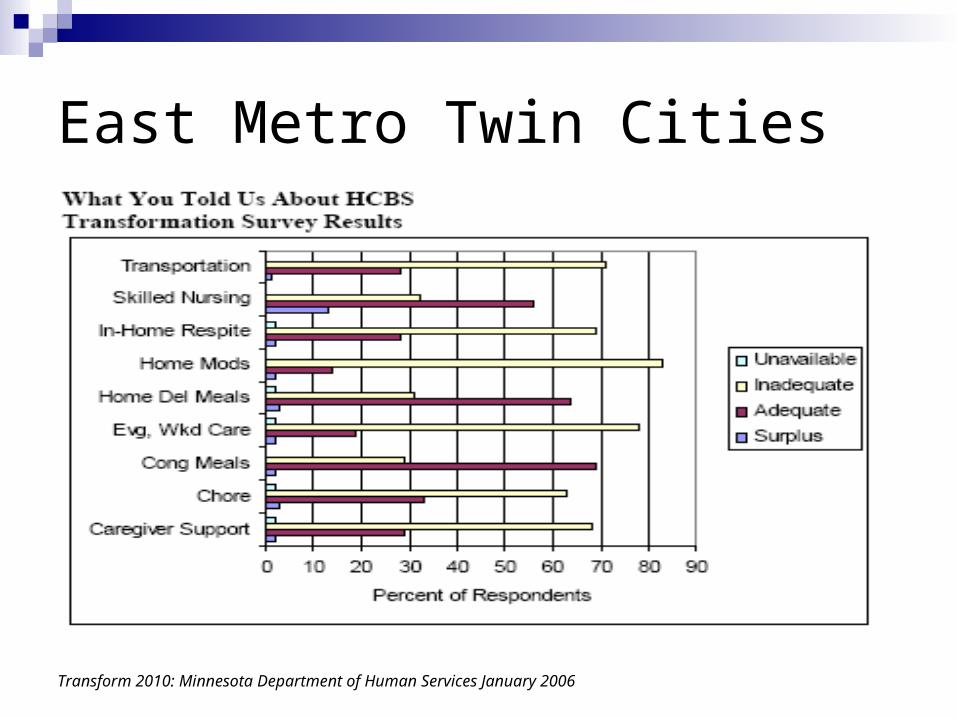
East Metro Twin Cities
Counties Dakota County Ramsey County Washington County
Percent 65/85+: The percent of the population that is 65+ and 85+ from now until 2030 is VERY LOW compared to the rest of the state.
Workforce: The number of workers age 15-64 to support the 65+ population is VERY HIGH for the region overall, although Ramsey County has significantly fewer.
Caregivers: The availability of potential family caregivers for the 85+ population is VERY HIGH for the region overall, although Ramsey County has significantly fewer.
Living Alone: The percent of persons 65+ living alone is LOW in Dakota and Washington counties and HIGH in Ramsey County.
Transform 2010: Minnesota Department of Human Services January 2006
East Metro Twin Cities
Transform 2010: Minnesota Department of Human Services January 2006
East Metro Twin Cities
Transform 2010: Minnesota Department of Human Services January 2006
East Metro Twin Cities
Transform 2010: Minnesota Department of Human Services January 2006
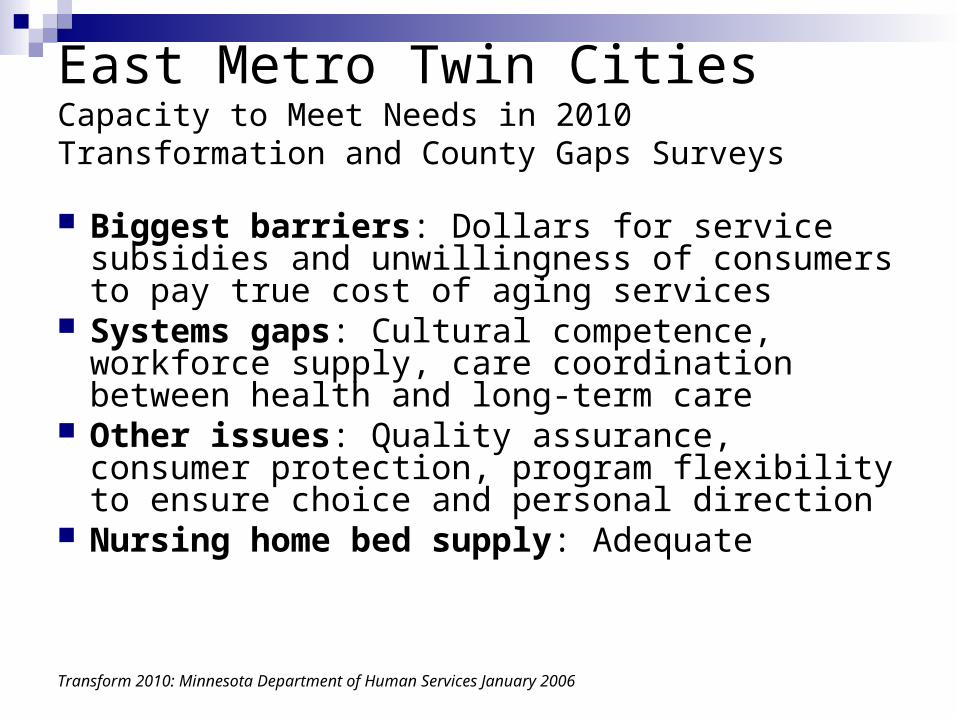
East Metro Twin CitiesCapacity to Meet Needs in 2010Transformation and County Gaps Surveys
Biggest barriers: Dollars for service subsidies and unwillingness of consumers to pay true cost of aging services
Systems gaps: Cultural competence, workforce supply, care coordination between health and long-term care
Other issues: Quality assurance, consumer protection, program flexibility to ensure choice and personal direction
Nursing home bed supply: Adequate
Transform 2010: Minnesota Department of Human Services January 2006
East Metro Twin Cities
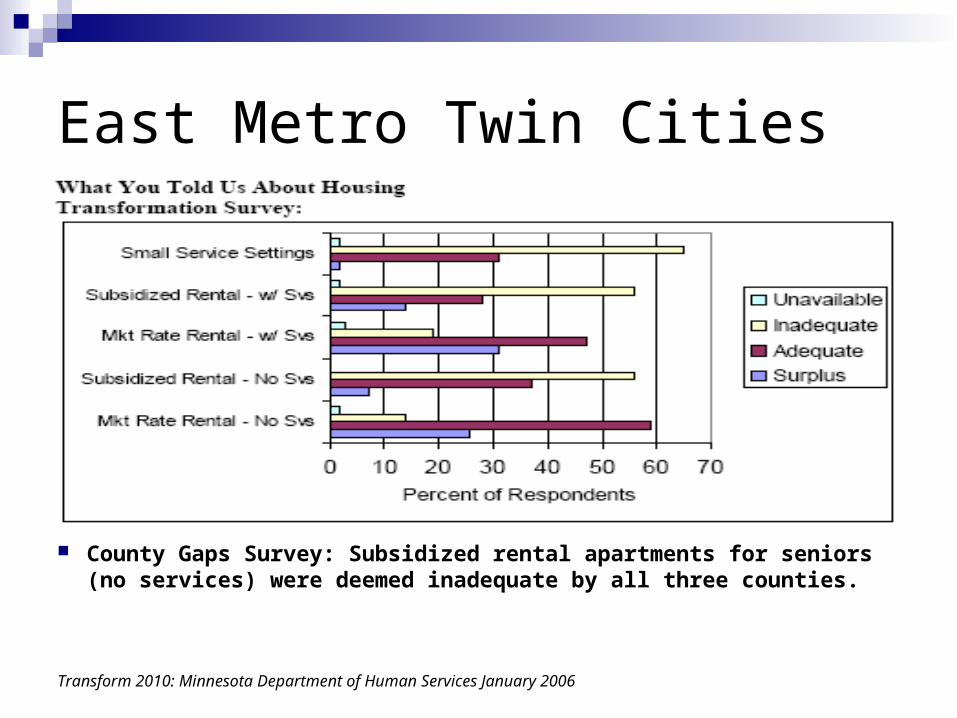
County Gaps Survey: Subsidized rental apartments for seniors (no services) were deemed inadequate by all three counties.
Transform 2010: Minnesota Department of Human Services January 2006
East Metro Twin Cities
Transform 2010: Minnesota Department of Human Services January 2006
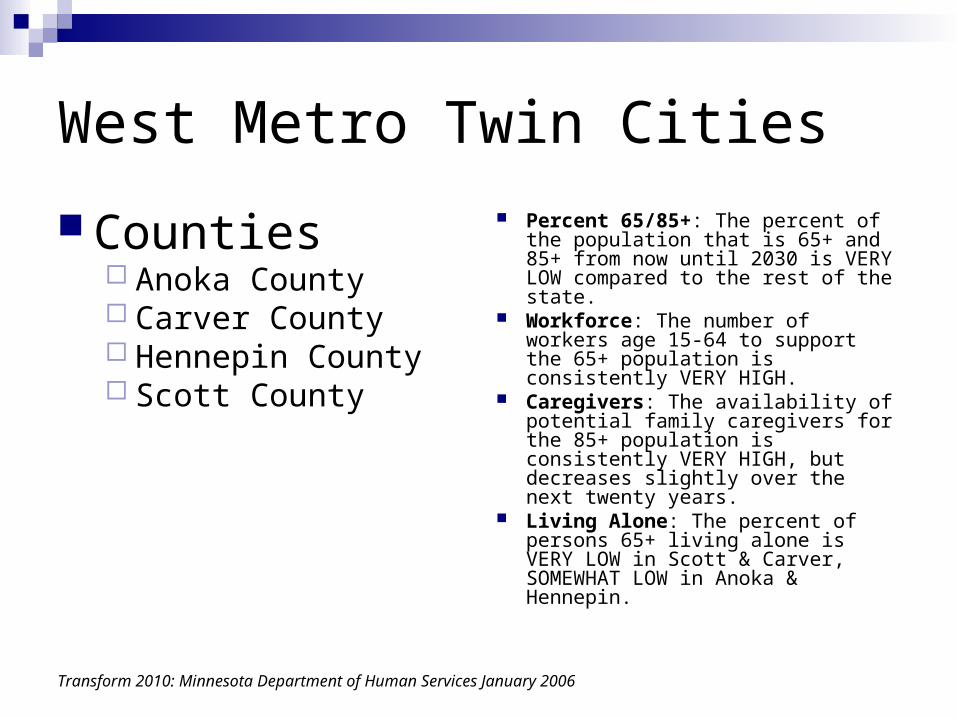
West Metro Twin Cities
Counties Anoka County Carver County Hennepin County Scott County
Percent 65/85+: The percent of the population that is 65+ and 85+ from now until 2030 is VERY LOW compared to the rest of the state.
Workforce: The number of workers age 15-64 to support the 65+ population is consistently VERY HIGH.
Caregivers: The availability of potential family caregivers for the 85+ population is consistently VERY HIGH, but decreases slightly over the next twenty years.
Living Alone: The percent of persons 65+ living alone is VERY LOW in Scott & Carver, SOMEWHAT LOW in Anoka & Hennepin.
Transform 2010: Minnesota Department of Human Services January 2006
West Metro Twin Cities
Transform 2010: Minnesota Department of Human Services January 2006

West Metro Twin Cities
Transform 2010: Minnesota Department of Human Services January 2006
West Metro Twin Cities
Transform 2010: Minnesota Department of Human Services January 2006
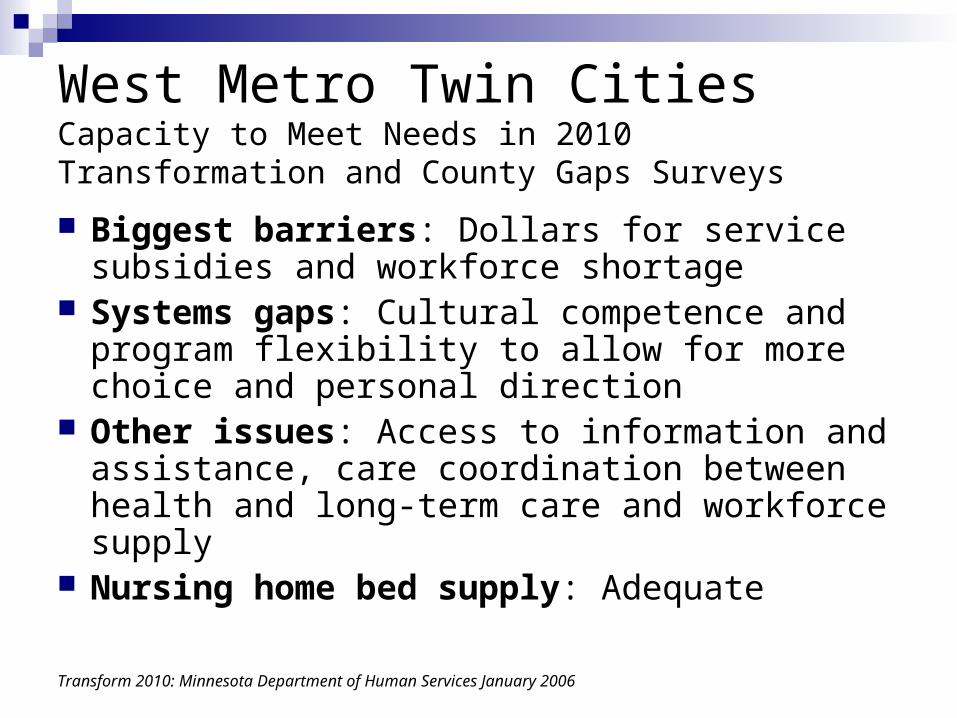
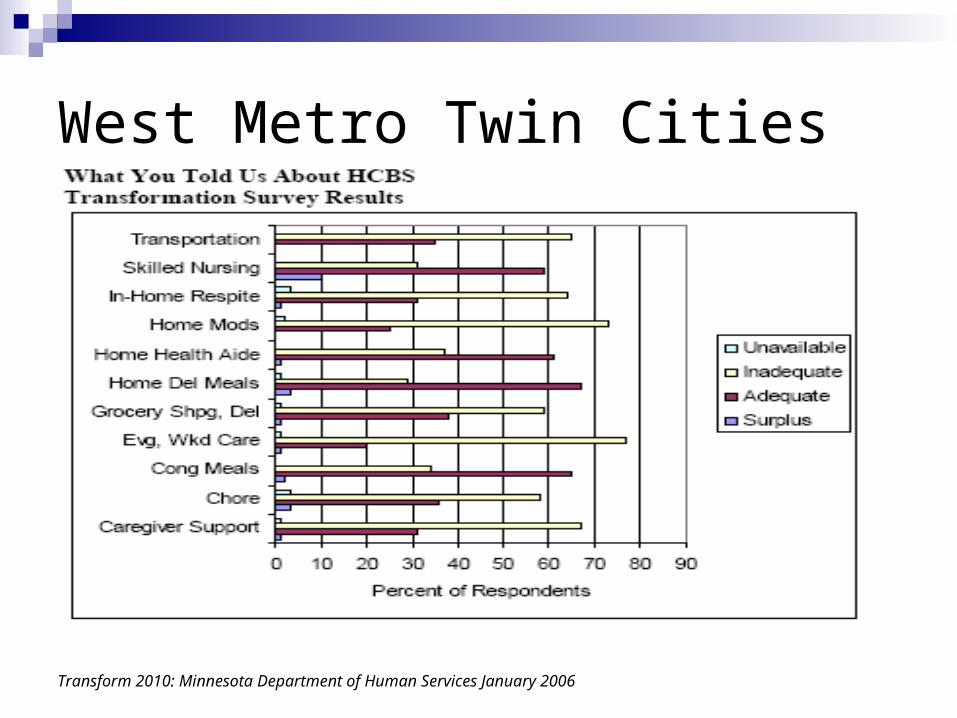
West Metro Twin CitiesCapacity to Meet Needs in 2010Transformation and County Gaps Surveys
Biggest barriers: Dollars for service subsidies and workforce shortage
Systems gaps: Cultural competence and program flexibility to allow for more choice and personal direction
Other issues: Access to information and assistance, care coordination between health and long-term care and workforce supply
Nursing home bed supply: Adequate
Transform 2010: Minnesota Department of Human Services January 2006
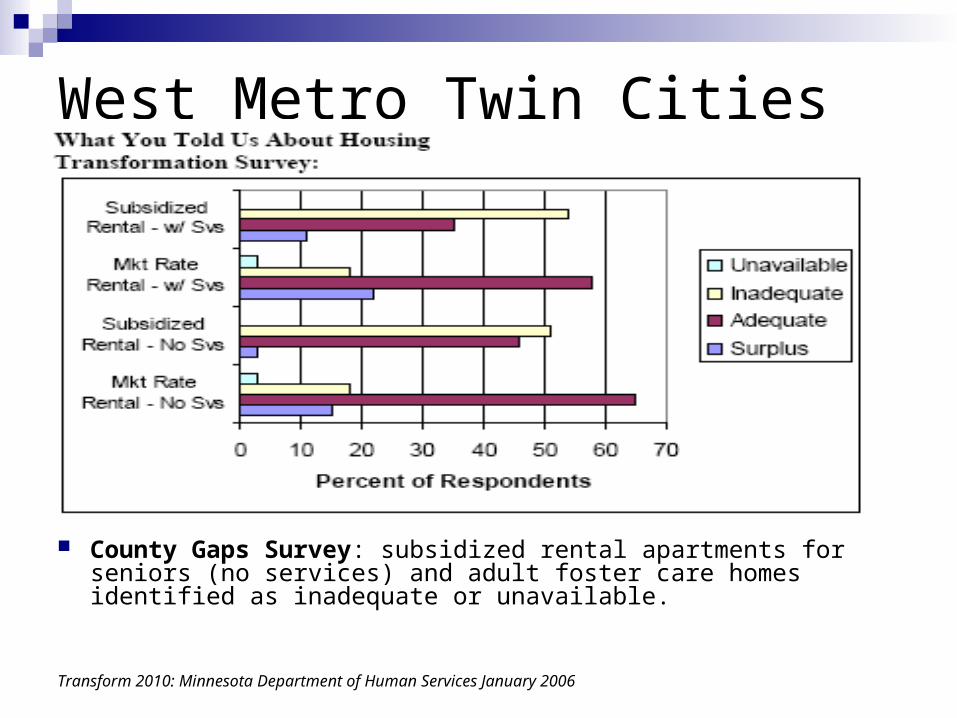
West Metro Twin Cities
County Gaps Survey: subsidized rental apartments for seniors (no services) and adult foster care homes identified as inadequate or unavailable.
Transform 2010: Minnesota Department of Human Services January 2006
West Metro Twin Cities
Transform 2010: Minnesota Department of Human Services January 2006
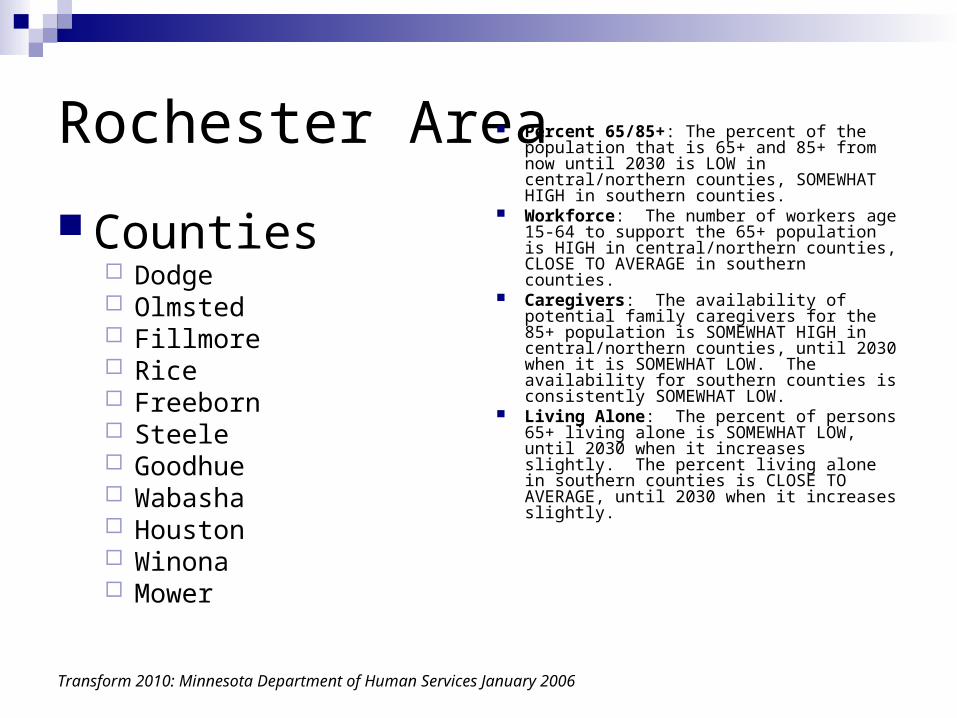
Rochester Area
Counties Dodge Olmsted Fillmore Rice Freeborn Steele Goodhue Wabasha Houston Winona Mower
Percent 65/85+: The percent of the population that is 65+ and 85+ from now until 2030 is LOW in central/northern counties, SOMEWHAT HIGH in southern counties.
Workforce: The number of workers age 15-64 to support the 65+ population is HIGH in central/northern counties, CLOSE TO AVERAGE in southern counties.
Caregivers: The availability of potential family caregivers for the 85+ population is SOMEWHAT HIGH in central/northern counties, until 2030 when it is SOMEWHAT LOW. The availability for southern counties is consistently SOMEWHAT LOW.
Living Alone: The percent of persons 65+ living alone is SOMEWHAT LOW, until 2030 when it increases slightly. The percent living alone in southern counties is CLOSE TO AVERAGE, until 2030 when it increases slightly.
Transform 2010: Minnesota Department of Human Services January 2006
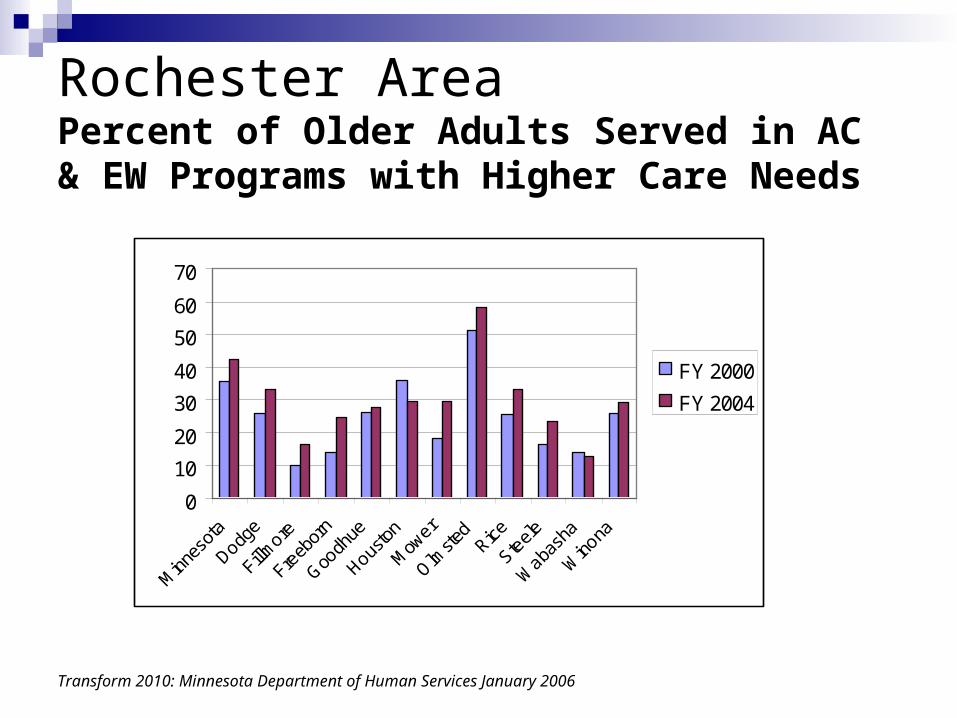
Rochester AreaPercent of Older Adults Served in AC & EW Programs with Higher Care Needs
Transform 2010: Minnesota Department of Human Services January 2006
0
10
20
30
40
50
60
70
Minn
esot
a
Dodge
Fillmore
Freeb
orn
Goodh
ue
Housto
n
Mow
er
Olmste
dRice
Steele
Waba
sha
Wino
na
FY 2000
FY 2004
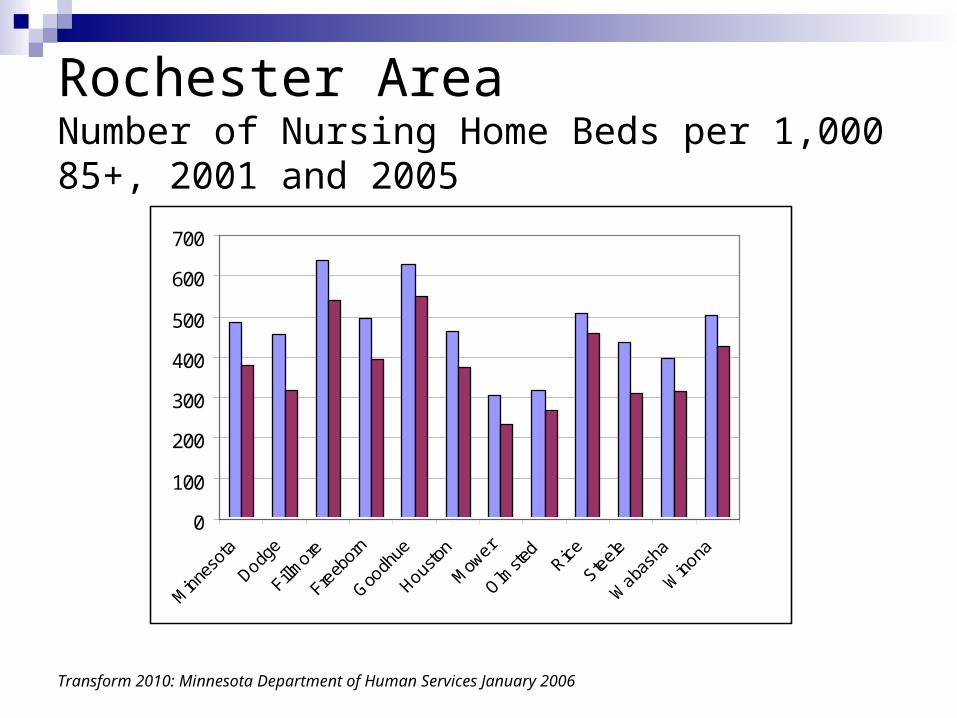
Rochester AreaNumber of Nursing Home Beds per 1,000 85+, 2001 and 2005
Transform 2010: Minnesota Department of Human Services January 2006
0
100
200
300
400
500
600
700
Minn
esot
a
Dodge
Fillmore
Freeb
orn
Goodh
ue
Housto
n
Mow
er
Olmste
dRice
Steele
Waba
sha
Wino
na
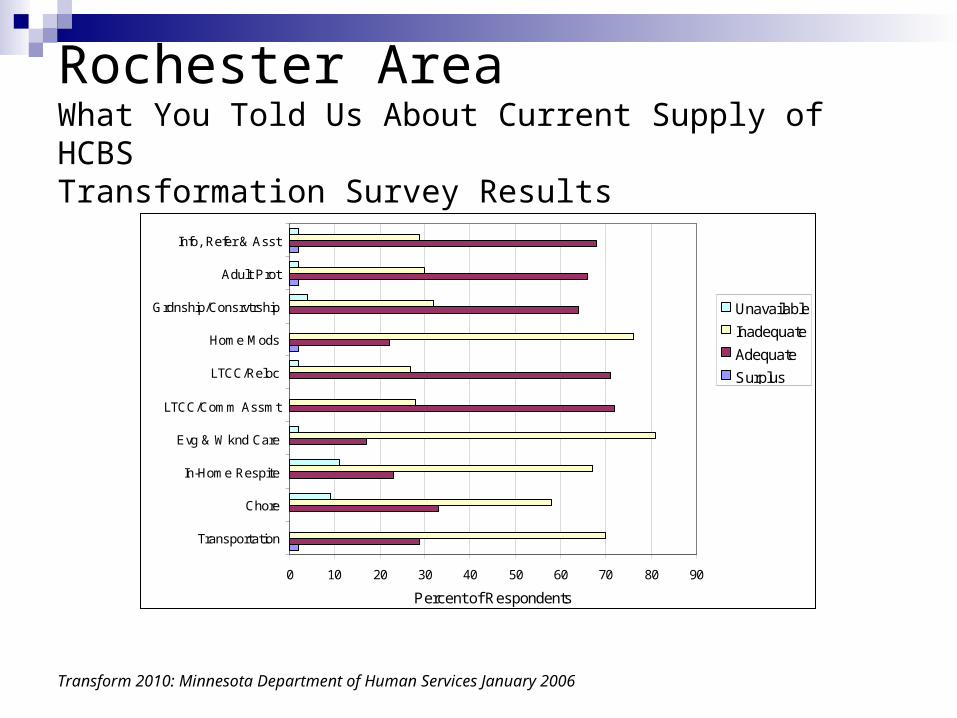
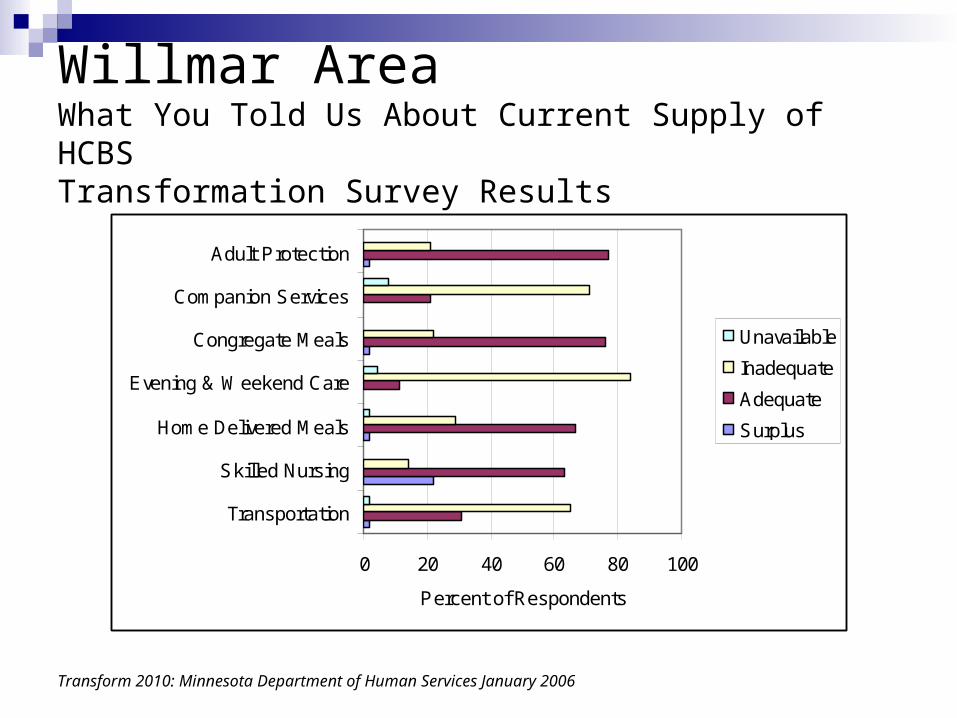
Rochester AreaWhat You Told Us About Current Supply of HCBSTransformation Survey Results
Transform 2010: Minnesota Department of Human Services January 2006
0 10 20 30 40 50 60 70 80 90
Transportation
Chore
In-Home Respite
Evg & Wknd Care
LTCC/Comm Assmt
LTCC/Reloc
Home Mods
Grdnship/Consrvtrship
Adult Prot
Info, Refer & Asst
Percent of Respondents
Unavailable
Inadequate
Adequate
Surplus
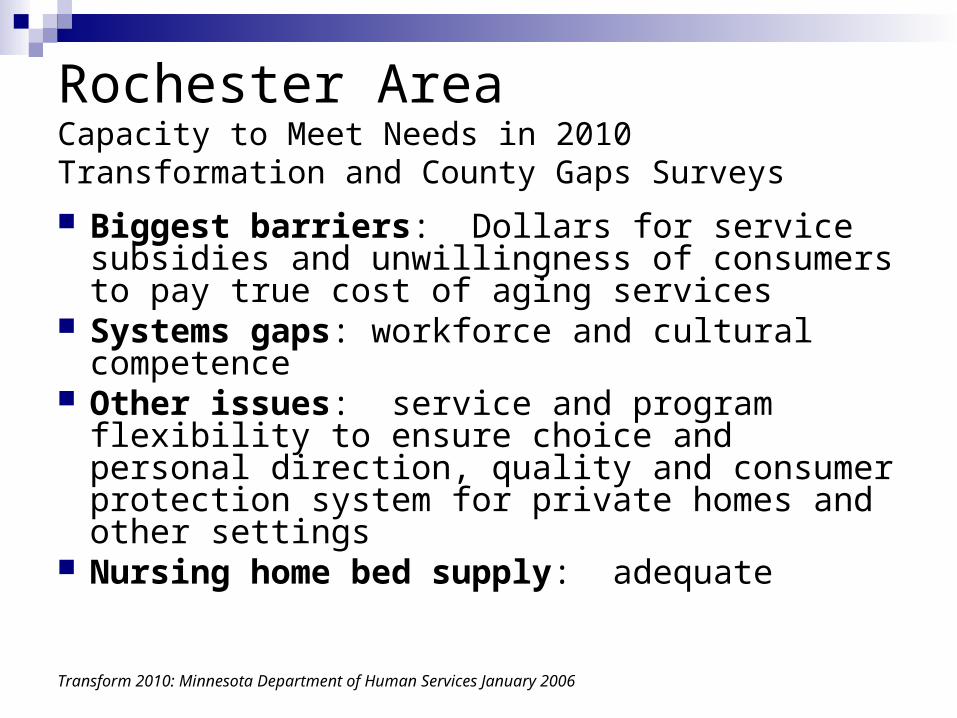
Rochester Area Capacity to Meet Needs in 2010Transformation and County Gaps Surveys
Biggest barriers: Dollars for service subsidies and unwillingness of consumers to pay true cost of aging services
Systems gaps: workforce and cultural competence
Other issues: service and program flexibility to ensure choice and personal direction, quality and consumer protection system for private homes and other settings
Nursing home bed supply: adequate
Transform 2010: Minnesota Department of Human Services January 2006
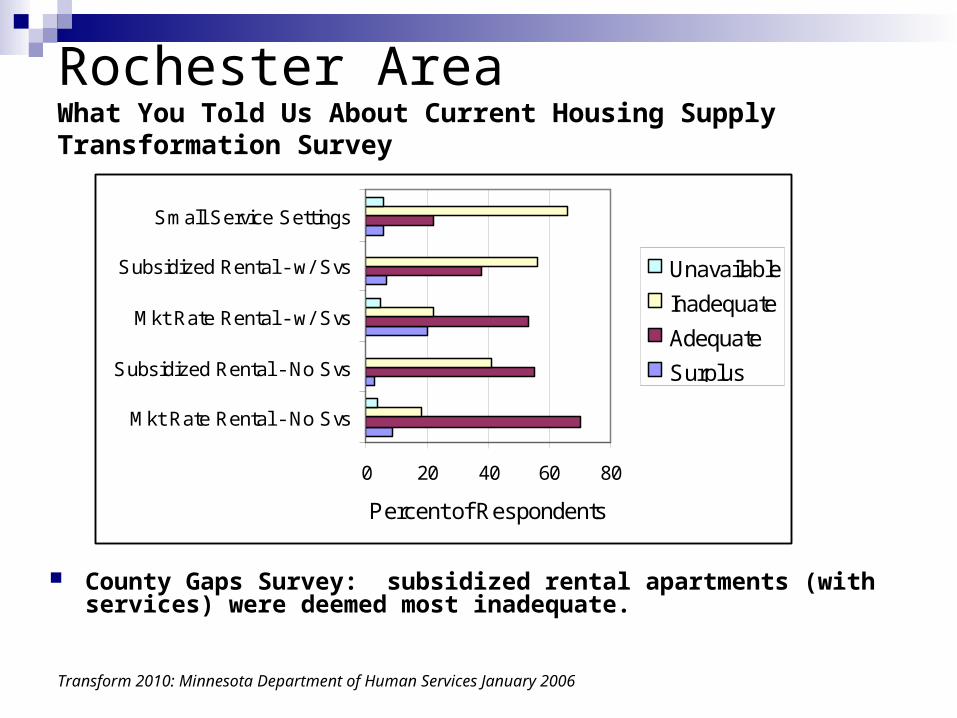
Rochester AreaWhat You Told Us About Current Housing SupplyTransformation Survey
County Gaps Survey: subsidized rental apartments (with services) were deemed most inadequate.
Transform 2010: Minnesota Department of Human Services January 2006
0 20 40 60 80
Mkt Rate Rental - No Svs
Subsidized Rental - No Svs
Mkt Rate Rental - w/ Svs
Subsidized Rental - w/ Svs
Small Service Settings
Percent of Respondents
Unavailable
Inadequate
Adequate
Surplus
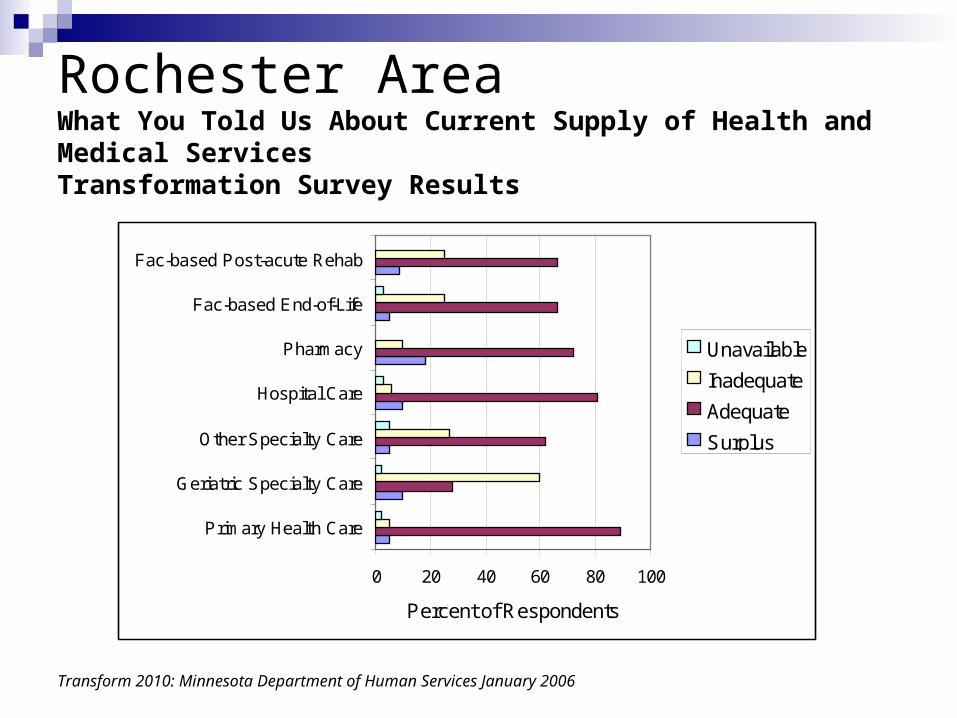
Rochester AreaWhat You Told Us About Current Supply of Health and Medical ServicesTransformation Survey Results
Transform 2010: Minnesota Department of Human Services January 2006
0 20 40 60 80 100
Primary Health Care
Geriatric Specialty Care
Other Specialty Care
Hospital Care
Pharmacy
Fac-based End-of-Life
Fac-based Post-acute Rehab
Percent of Respondents
Unavailable
Inadequate
Adequate
Surplus

Willmar Area
Counties Big Stone Meeker Chippewa Renville Kandiyohi Swift Lac qui Parle Yellow Medicine McLeod
Percent 65/85+: The percent of the population that is 65+ and 85+ from now until 2030 is HIGH in the western counties and SOMEWHAT LOW in the eastern counties.
Workforce: The number of workers age 15-64 to support the 65+ population is LOW in the western counties and CLOSE TO STATE AVERAGE in the eastern counties.
Caregivers: The availability of potential family caregivers for the 85+ population is LOW in the western counties, until 2030 when it becomes even lower. The availability in the eastern counties is consistently SOMEWHAT LOW.
Living Alone: The percent of persons 65+ living alone is HIGH in the western counties but decreases slightly by 2030. The percent is LOW in the eastern counties but increases by 2030.
Transform 2010: Minnesota Department of Human Services January 2006

Willmar AreaPercent of Older Adults Served in AC & EW Programs with Higher Care Needs
Transform 2010: Minnesota Department of Human Services January 2006
0102030405060708090
Minn
esot
a
Big Sto
ne
Chippew
a
Kandiy
ohi
Lac q
ui Parle
McL
eod
Mee
ker
Renville
Swift
Yellow
Med
icine
FY 2000
FY 2004
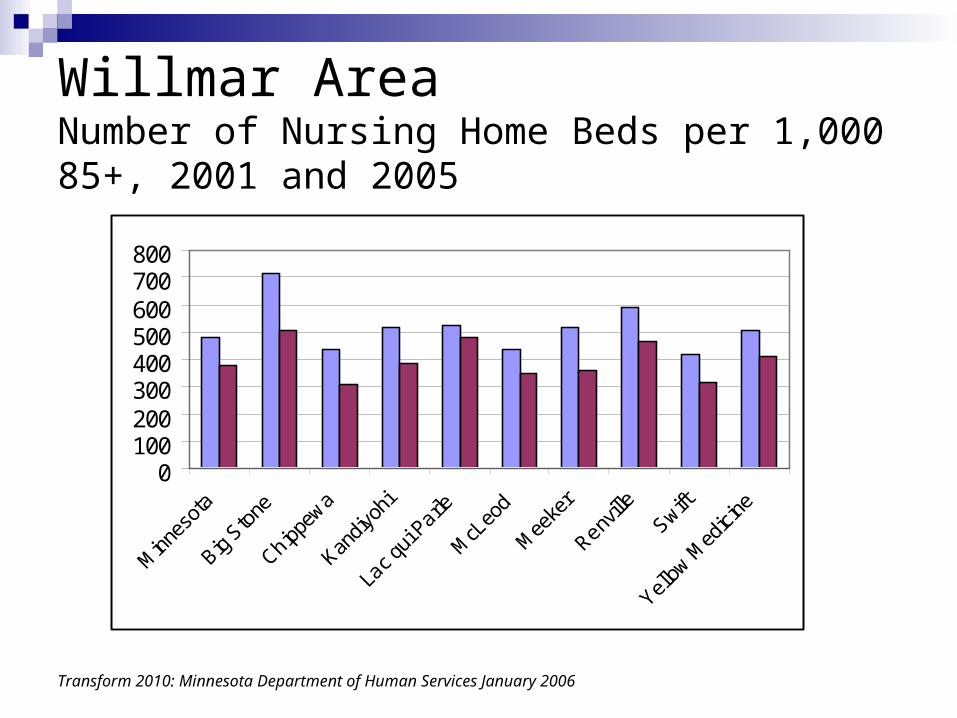
Willmar AreaNumber of Nursing Home Beds per 1,000 85+, 2001 and 2005
Transform 2010: Minnesota Department of Human Services January 2006
0100200300400500600700800
Minn
esot
a
Big Sto
ne
Chippew
a
Kandiy
ohi
Lac q
ui Parle
McL
eod
Mee
ker
Renville
Swift
Yellow
Med
icine
Willmar AreaWhat You Told Us About Current Supply of HCBSTransformation Survey Results
Transform 2010: Minnesota Department of Human Services January 2006
0 20 40 60 80 100
Transportation
Skilled Nursing
Home Delivered Meals
Evening & Weekend Care
Congregate Meals
Companion Services
Adult Protection
Percent of Respondents
Unavailable
Inadequate
Adequate
Surplus
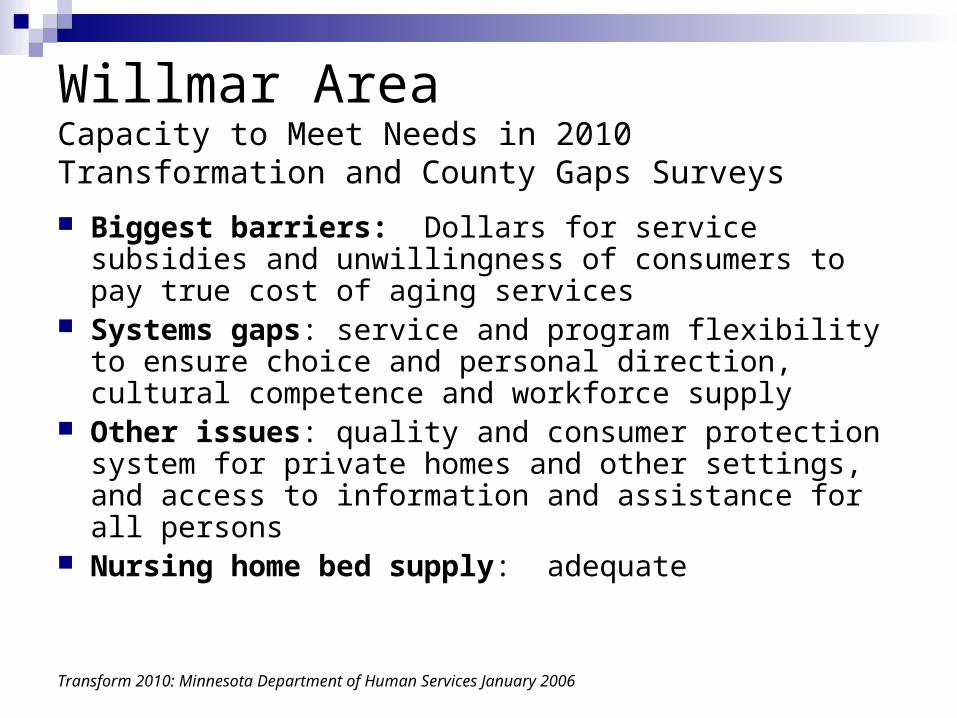
Willmar Area Capacity to Meet Needs in 2010Transformation and County Gaps Surveys
Biggest barriers: Dollars for service subsidies and unwillingness of consumers to pay true cost of aging services
Systems gaps: service and program flexibility to ensure choice and personal direction, cultural competence and workforce supply
Other issues: quality and consumer protection system for private homes and other settings, and access to information and assistance for all persons
Nursing home bed supply: adequate
Transform 2010: Minnesota Department of Human Services January 2006

Willmar AreaWhat You Told Us About Current Housing SupplyTransformation Survey
County Gaps Survey: adult foster care and board & lodging were deemed inadequate by two counties. Adult foster care was also deemed in surplus or underutilized by two counties.
Transform 2010: Minnesota Department of Human Services January 2006
0 20 40 60 80 100
Mkt Rate Rental - No Svs
Subsidized Rental - No Svs
Mkt Rate Rental - w/ Svs
Subsidized Rental - w/ Svs
Small Service Settings
Home Mods
Percent of Respondents
Unavailable
Inadequate
Adequate
Surplus
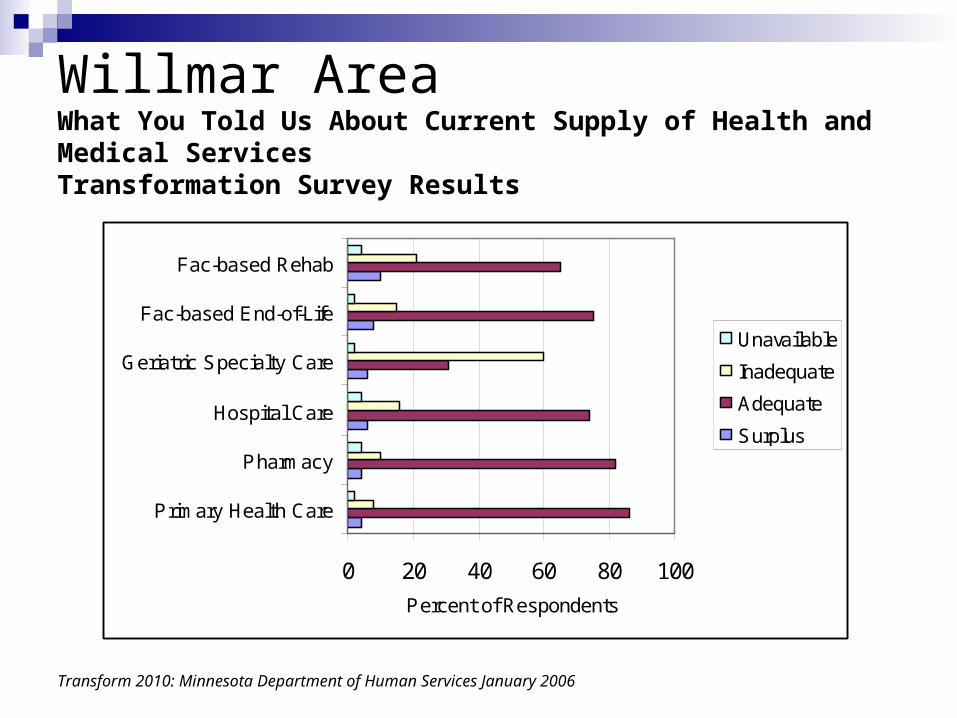
Willmar AreaWhat You Told Us About Current Supply of Health and Medical ServicesTransformation Survey Results
Transform 2010: Minnesota Department of Human Services January 2006
0 20 40 60 80 100
Primary Health Care
Pharmacy
Hospital Care
Geriatric Specialty Care
Fac-based End-of-Life
Fac-based Rehab
Percent of Respondents
Unavailable
Inadequate
Adequate
Surplus
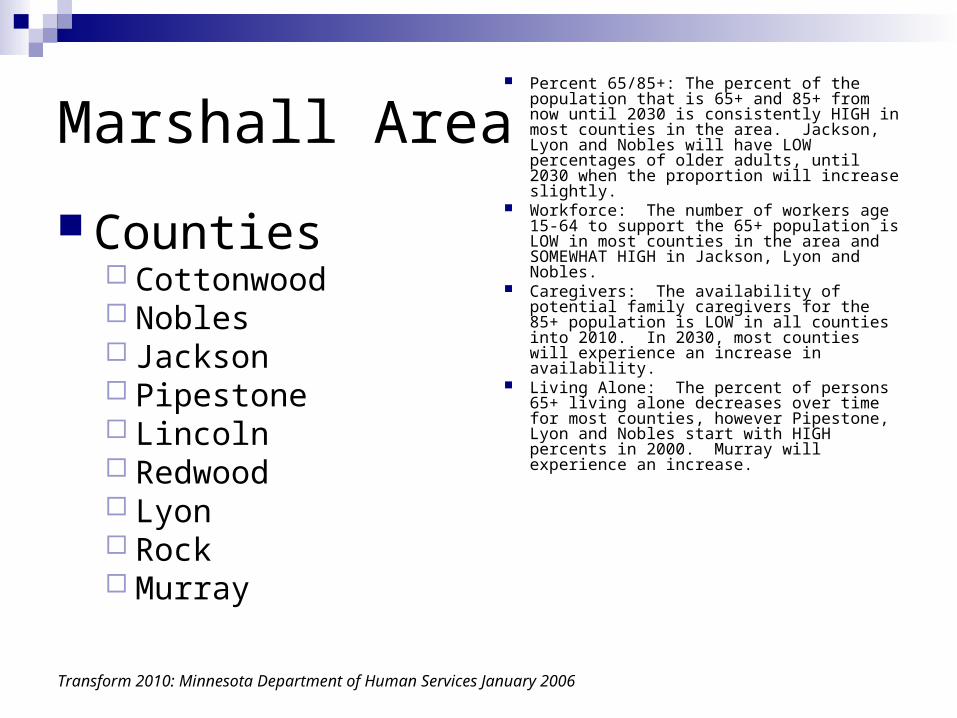
Marshall Area
Counties Cottonwood Nobles Jackson Pipestone Lincoln Redwood Lyon Rock Murray
Percent 65/85+: The percent of the population that is 65+ and 85+ from now until 2030 is consistently HIGH in most counties in the area. Jackson, Lyon and Nobles will have LOW percentages of older adults, until 2030 when the proportion will increase slightly.
Workforce: The number of workers age 15-64 to support the 65+ population is LOW in most counties in the area and SOMEWHAT HIGH in Jackson, Lyon and Nobles.
Caregivers: The availability of potential family caregivers for the 85+ population is LOW in all counties into 2010. In 2030, most counties will experience an increase in availability.
Living Alone: The percent of persons 65+ living alone decreases over time for most counties, however Pipestone, Lyon and Nobles start with HIGH percents in 2000. Murray will experience an increase.
Transform 2010: Minnesota Department of Human Services January 2006
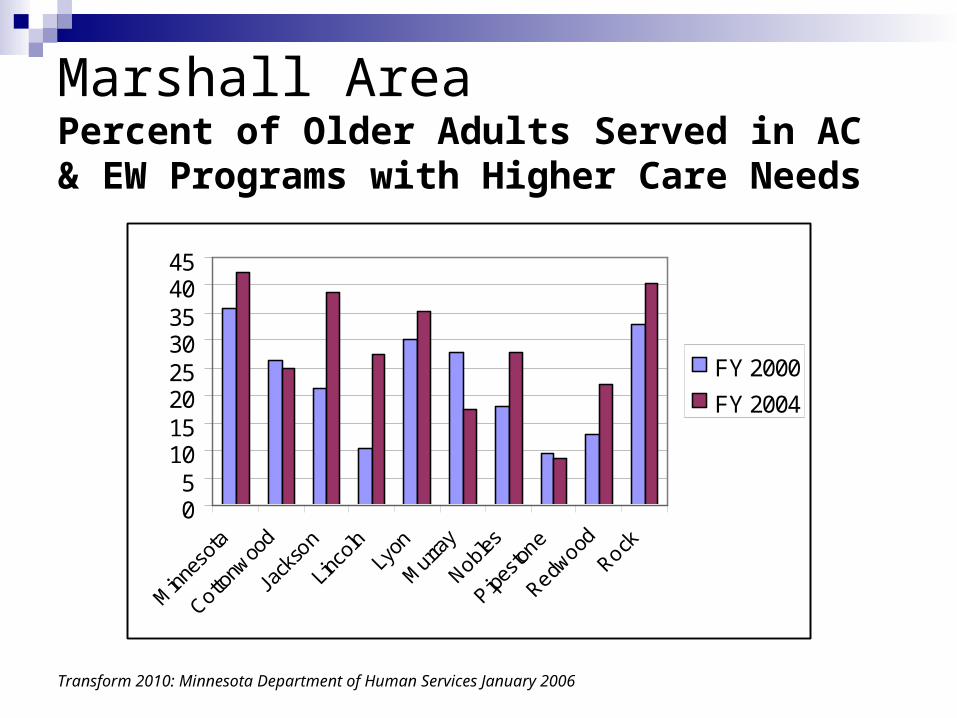
Marshall Area Percent of Older Adults Served in AC & EW Programs with Higher Care Needs
Transform 2010: Minnesota Department of Human Services January 2006
05
1015202530354045
Minn
esot
a
Cottonw
ood
Jack
son
Linco
lnLy
on
Mur
ray
Nobles
Pipesto
ne
Redwood
Rock
FY 2000
FY 2004
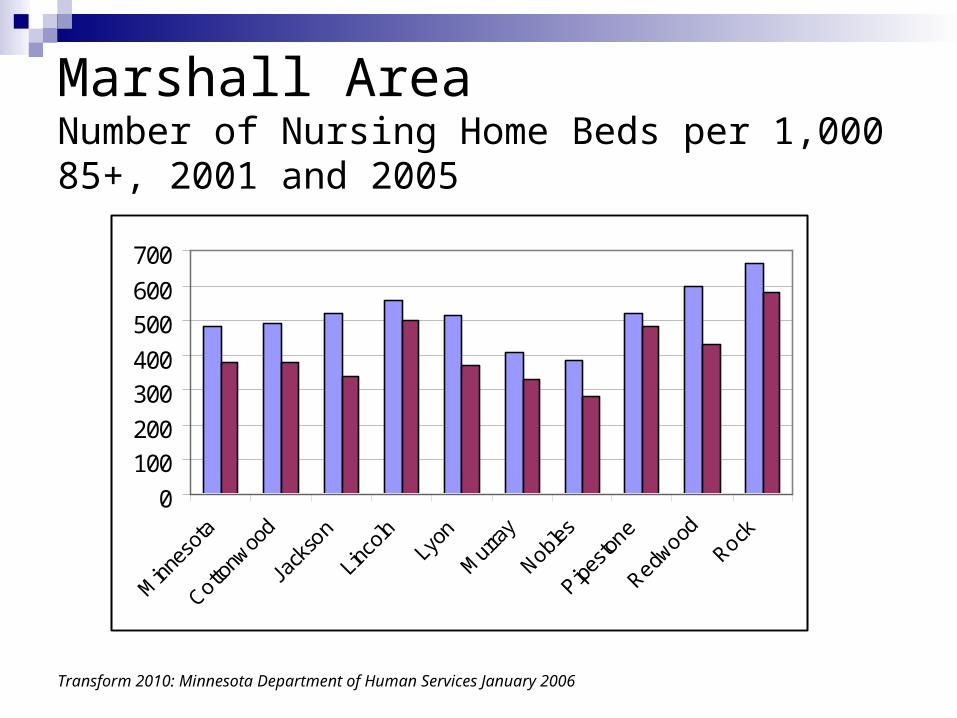
Marshall Area Number of Nursing Home Beds per 1,000 85+, 2001 and 2005
Transform 2010: Minnesota Department of Human Services January 2006
0
100
200
300
400
500
600
700
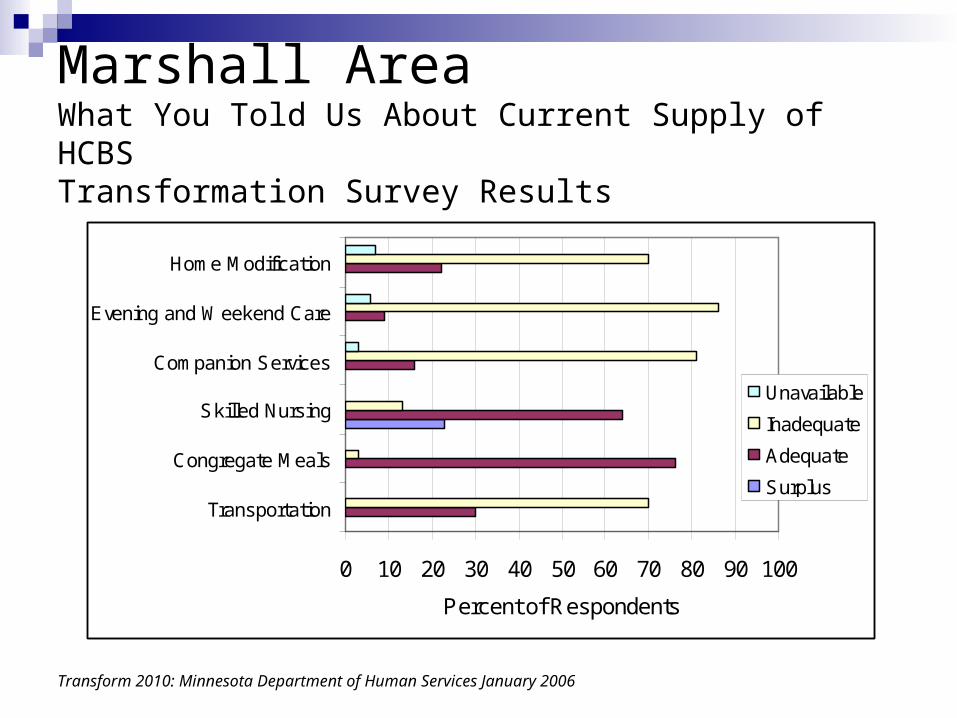
Marshall AreaWhat You Told Us About Current Supply of HCBSTransformation Survey Results
Transform 2010: Minnesota Department of Human Services January 2006
0 10 20 30 40 50 60 70 80 90 100
Transportation
Congregate Meals
Skilled Nursing
Companion Services
Evening and Weekend Care
Home Modification
Percent of Respondents
Unavailable
Inadequate
Adequate
Surplus
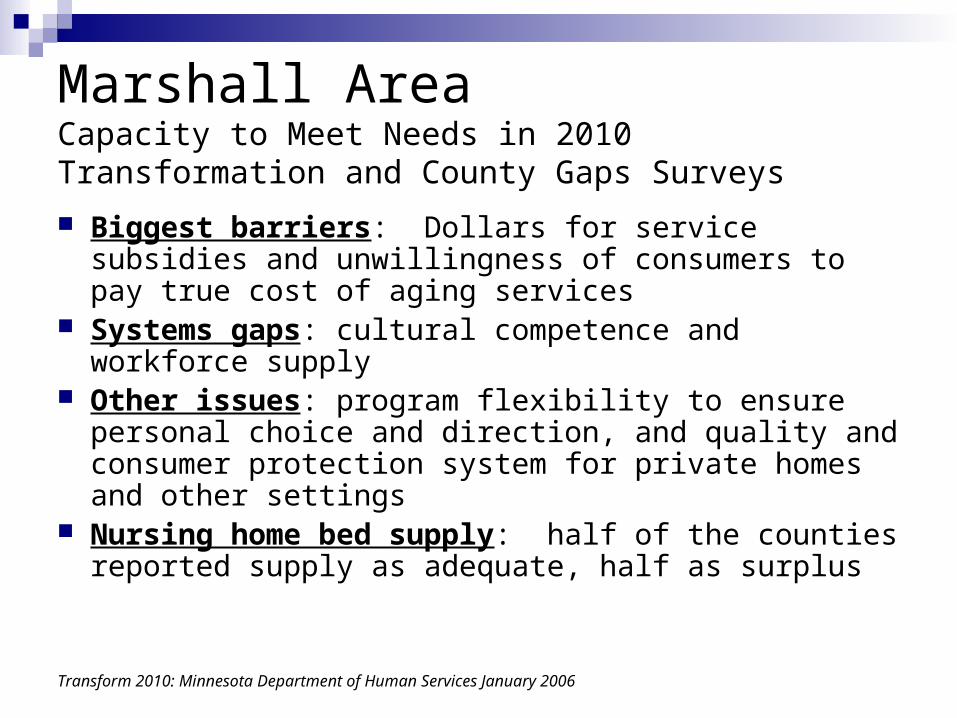
Marshall Area Capacity to Meet Needs in 2010Transformation and County Gaps Surveys
Biggest barriers: Dollars for service subsidies and unwillingness of consumers to pay true cost of aging services
Systems gaps: cultural competence and workforce supply
Other issues: program flexibility to ensure personal choice and direction, and quality and consumer protection system for private homes and other settings
Nursing home bed supply: half of the counties reported supply as adequate, half as surplus
Transform 2010: Minnesota Department of Human Services January 2006
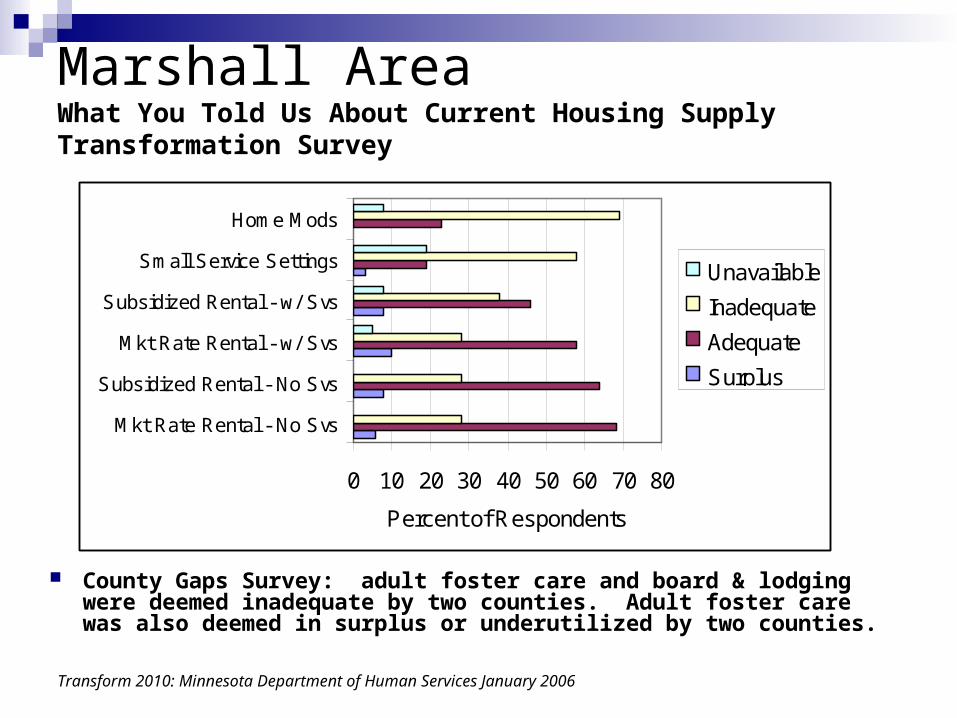
Marshall Area What You Told Us About Current Housing SupplyTransformation Survey
County Gaps Survey: adult foster care and board & lodging were deemed inadequate by two counties. Adult foster care was also deemed in surplus or underutilized by two counties.
Transform 2010: Minnesota Department of Human Services January 2006
0 10 20 30 40 50 60 70 80
Mkt Rate Rental - No Svs
Subsidized Rental - No Svs
Mkt Rate Rental - w/ Svs
Subsidized Rental - w/ Svs
Small Service Settings
Home Mods
Percent of Respondents
Unavailable
Inadequate
Adequate
Surplus
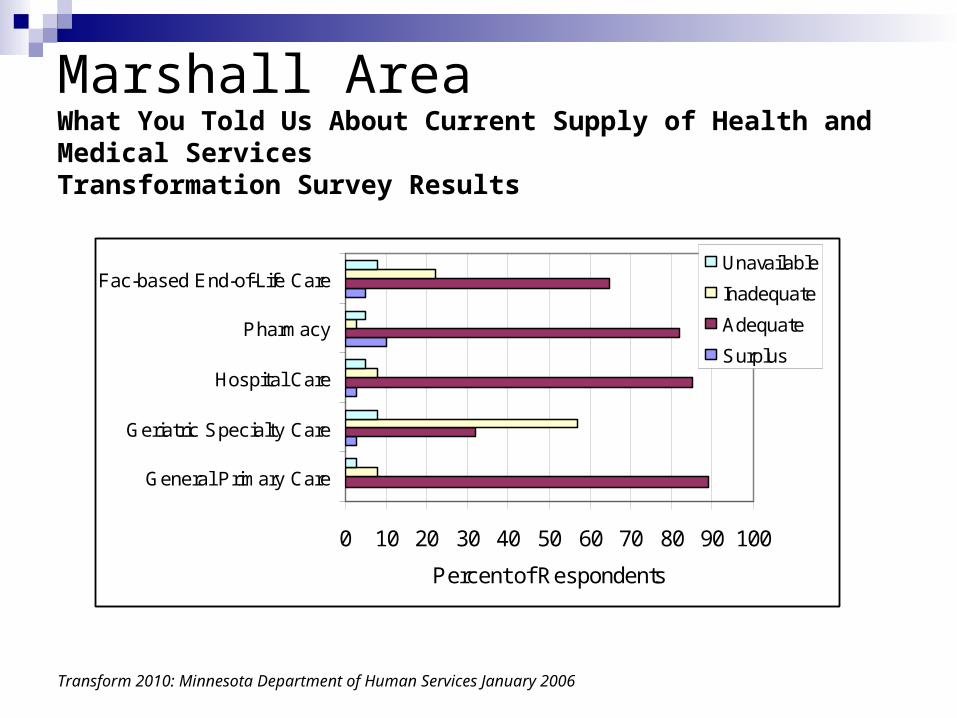
Marshall Area What You Told Us About Current Supply of Health and Medical ServicesTransformation Survey Results
Transform 2010: Minnesota Department of Human Services January 2006
0 10 20 30 40 50 60 70 80 90 100
General Primary Care
Geriatric Specialty Care
Hospital Care
Pharmacy
Fac-based End-of-Life Care
Percent of Respondents
Unavailable
Inadequate
Adequate
Surplus
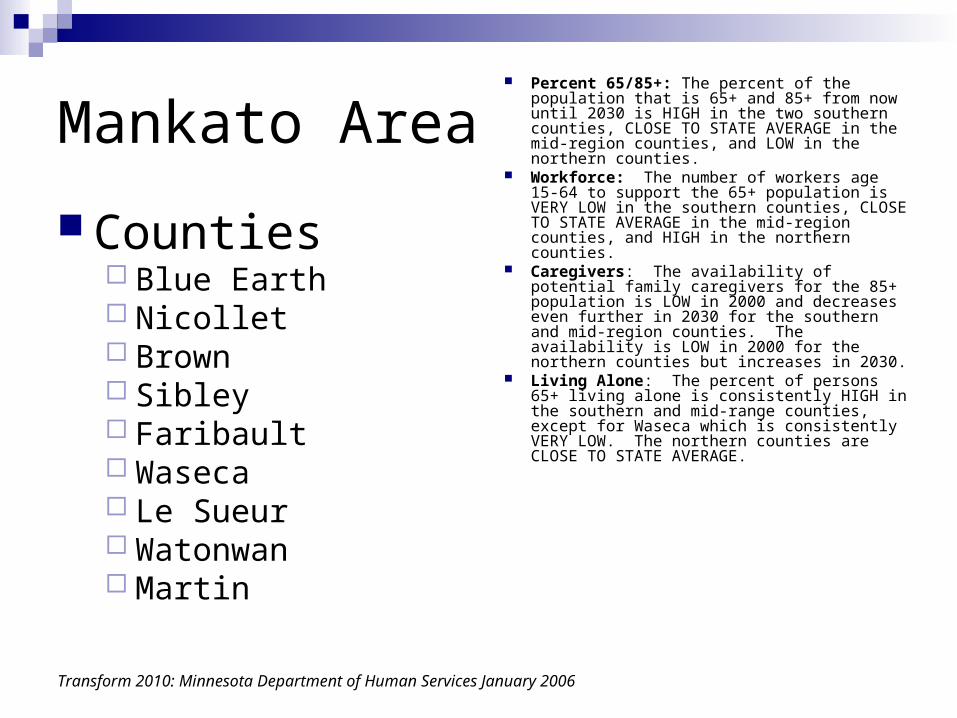
Mankato Area
Counties Blue Earth Nicollet Brown Sibley Faribault Waseca Le Sueur Watonwan Martin
Percent 65/85+: The percent of the population that is 65+ and 85+ from now until 2030 is HIGH in the two southern counties, CLOSE TO STATE AVERAGE in the mid-region counties, and LOW in the northern counties.
Workforce: The number of workers age 15-64 to support the 65+ population is VERY LOW in the southern counties, CLOSE TO STATE AVERAGE in the mid-region counties, and HIGH in the northern counties.
Caregivers: The availability of potential family caregivers for the 85+ population is LOW in 2000 and decreases even further in 2030 for the southern and mid-region counties. The availability is LOW in 2000 for the northern counties but increases in 2030.
Living Alone: The percent of persons 65+ living alone is consistently HIGH in the southern and mid-range counties, except for Waseca which is consistently VERY LOW. The northern counties are CLOSE TO STATE AVERAGE.
Transform 2010: Minnesota Department of Human Services January 2006
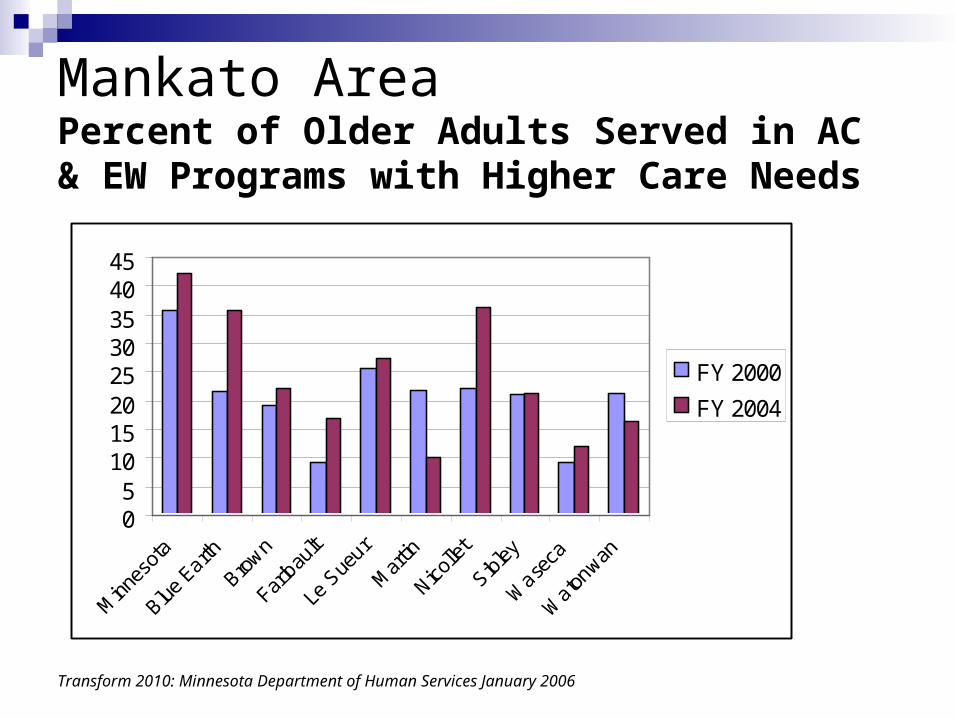
Mankato Area Percent of Older Adults Served in AC & EW Programs with Higher Care Needs
Transform 2010: Minnesota Department of Human Services January 2006
05
1015202530354045
Minn
esot
a
Blue E
arth
Brown
Faribau
lt
Le S
ueur
Mar
tin
Nicolle
t
Sibley
Wase
ca
Waton
wan
FY 2000
FY 2004
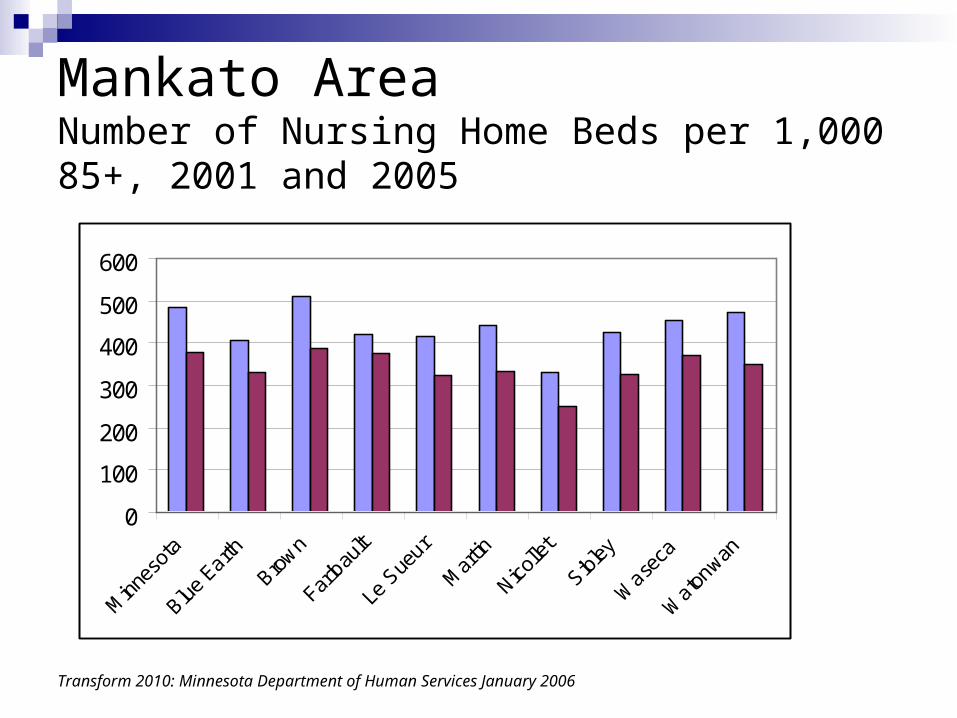
Mankato Area Number of Nursing Home Beds per 1,000 85+, 2001 and 2005
Transform 2010: Minnesota Department of Human Services January 2006
0
100
200
300
400
500
600
Minn
esot
a
Blue E
arth
Brown
Faribau
lt
Le S
ueur
Mar
tin
Nicolle
t
Sibley
Wase
ca
Waton
wan
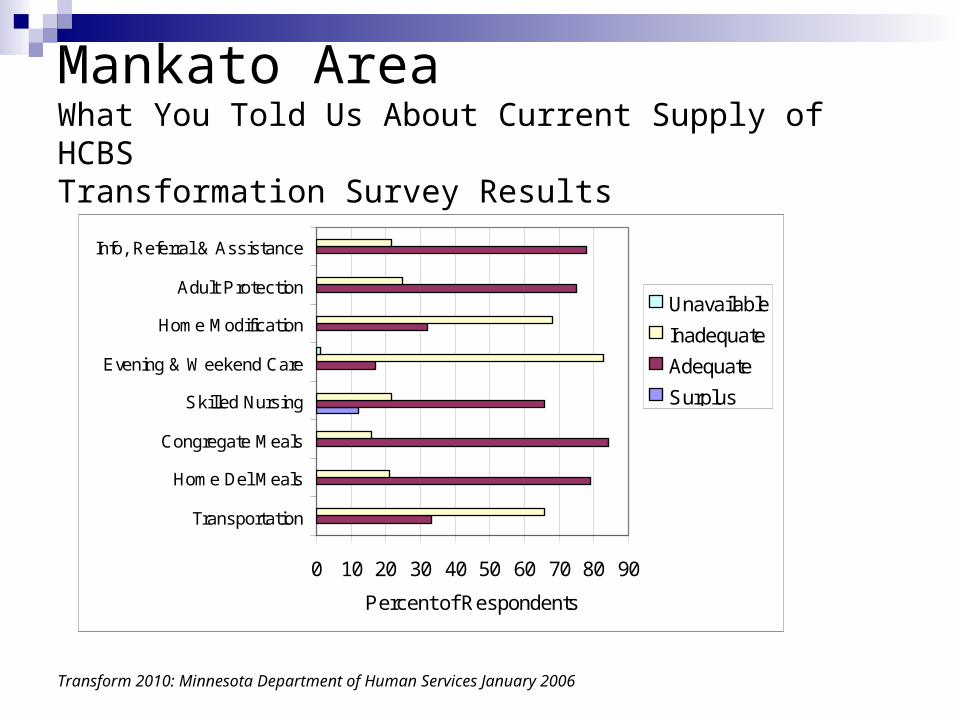
Mankato Area What You Told Us About Current Supply of HCBSTransformation Survey Results
Transform 2010: Minnesota Department of Human Services January 2006
0 10 20 30 40 50 60 70 80 90
Transportation
Home Del Meals
Congregate Meals
Skilled Nursing
Evening & Weekend Care
Home Modification
Adult Protection
Info, Referral & Assistance
Percent of Respondents
Unavailable
Inadequate
Adequate
Surplus
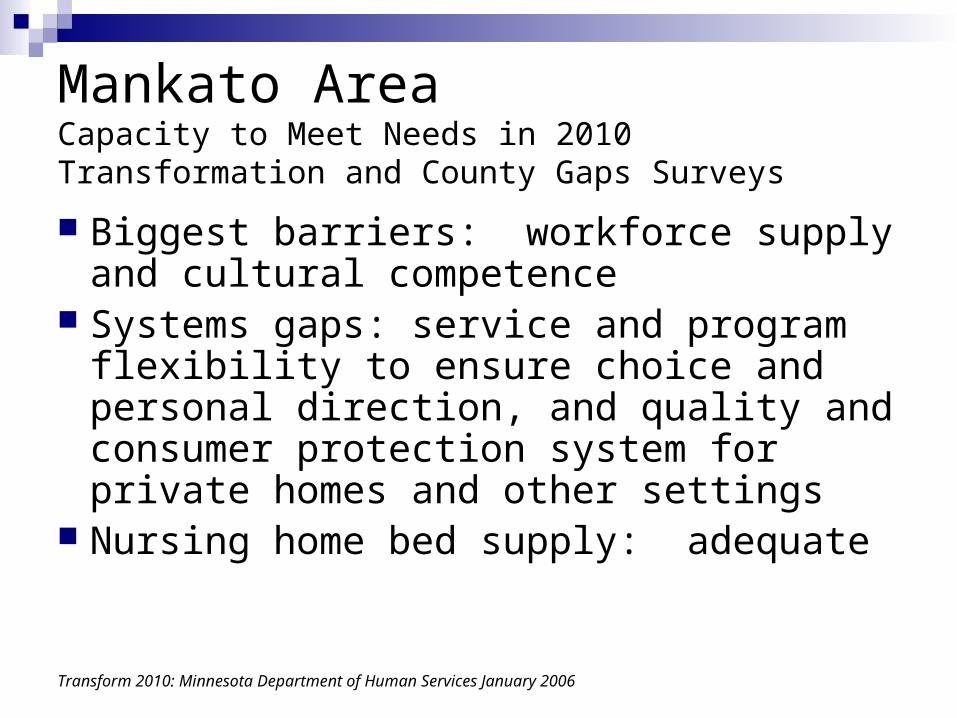
Mankato Area Capacity to Meet Needs in 2010Transformation and County Gaps Surveys
Biggest barriers: workforce supply and cultural competence
Systems gaps: service and program flexibility to ensure choice and personal direction, and quality and consumer protection system for private homes and other settings
Nursing home bed supply: adequate
Transform 2010: Minnesota Department of Human Services January 2006
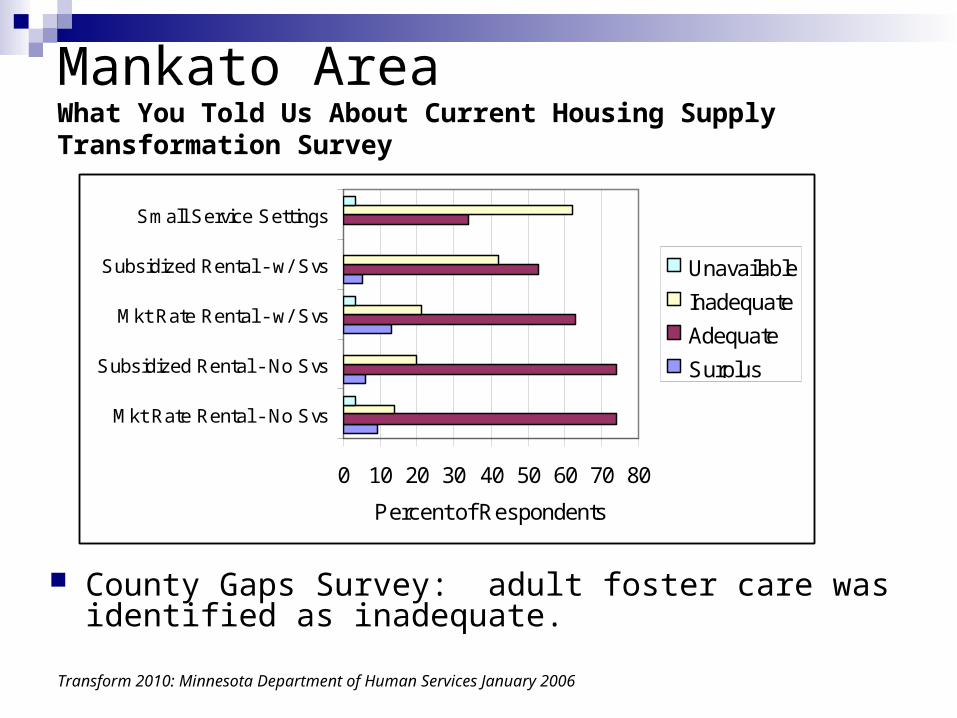
Mankato Area What You Told Us About Current Housing SupplyTransformation Survey
County Gaps Survey: adult foster care was identified as inadequate.
Transform 2010: Minnesota Department of Human Services January 2006
0 10 20 30 40 50 60 70 80
Mkt Rate Rental - No Svs
Subsidized Rental - No Svs
Mkt Rate Rental - w/ Svs
Subsidized Rental - w/ Svs
Small Service Settings
Percent of Respondents
Unavailable
Inadequate
Adequate
Surplus
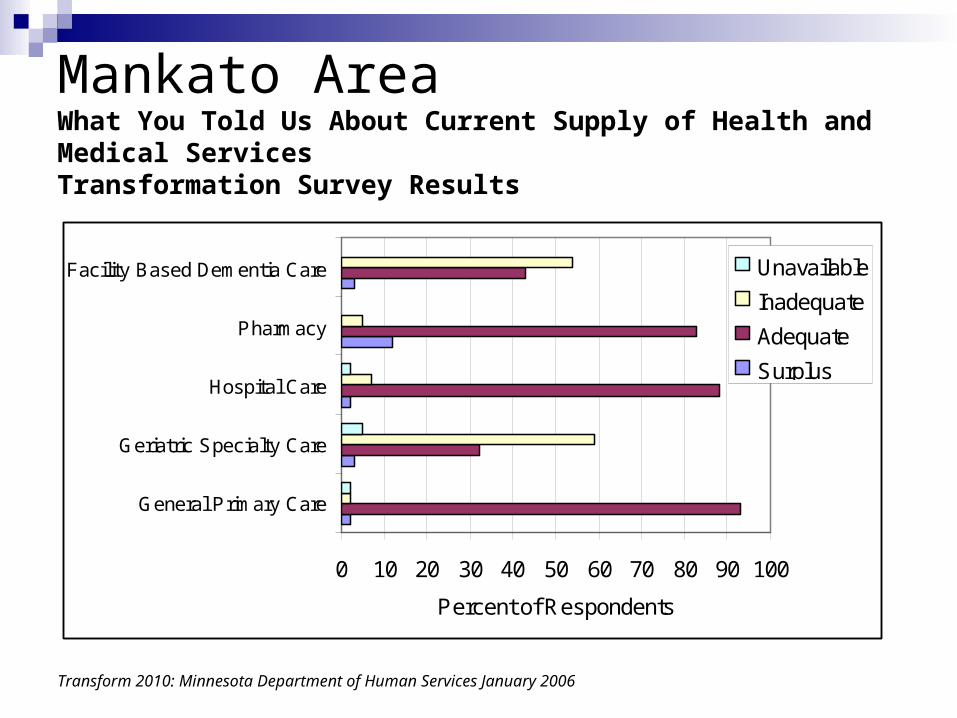
Mankato Area What You Told Us About Current Supply of Health and Medical ServicesTransformation Survey Results
Transform 2010: Minnesota Department of Human Services January 2006
0 10 20 30 40 50 60 70 80 90 100
General Primary Care
Geriatric Specialty Care
Hospital Care
Pharmacy
Facility Based Dementia Care
Percent of Respondents
Unavailable
Inadequate
Adequate
Surplus
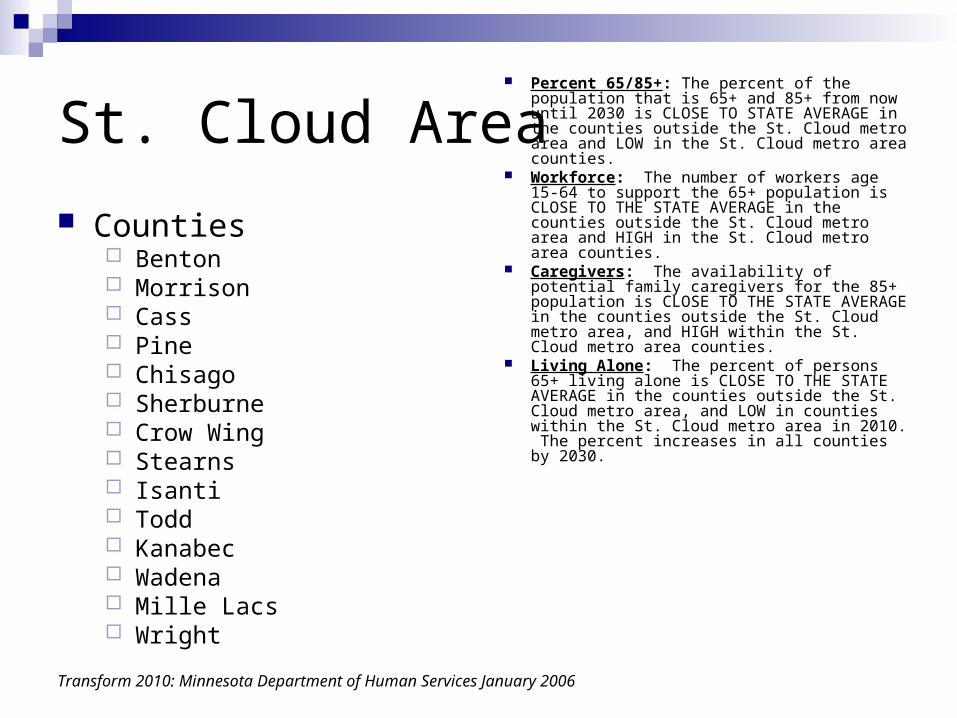
St. Cloud Area
Counties Benton Morrison Cass Pine Chisago Sherburne Crow Wing Stearns Isanti Todd Kanabec Wadena Mille Lacs Wright
Percent 65/85+: The percent of the population that is 65+ and 85+ from now until 2030 is CLOSE TO STATE AVERAGE in the counties outside the St. Cloud metro area and LOW in the St. Cloud metro area counties.
Workforce: The number of workers age 15-64 to support the 65+ population is CLOSE TO THE STATE AVERAGE in the counties outside the St. Cloud metro area and HIGH in the St. Cloud metro area counties.
Caregivers: The availability of potential family caregivers for the 85+ population is CLOSE TO THE STATE AVERAGE in the counties outside the St. Cloud metro area, and HIGH within the St. Cloud metro area counties.
Living Alone: The percent of persons 65+ living alone is CLOSE TO THE STATE AVERAGE in the counties outside the St. Cloud metro area, and LOW in counties within the St. Cloud metro area in 2010. The percent increases in all counties by 2030.
Transform 2010: Minnesota Department of Human Services January 2006
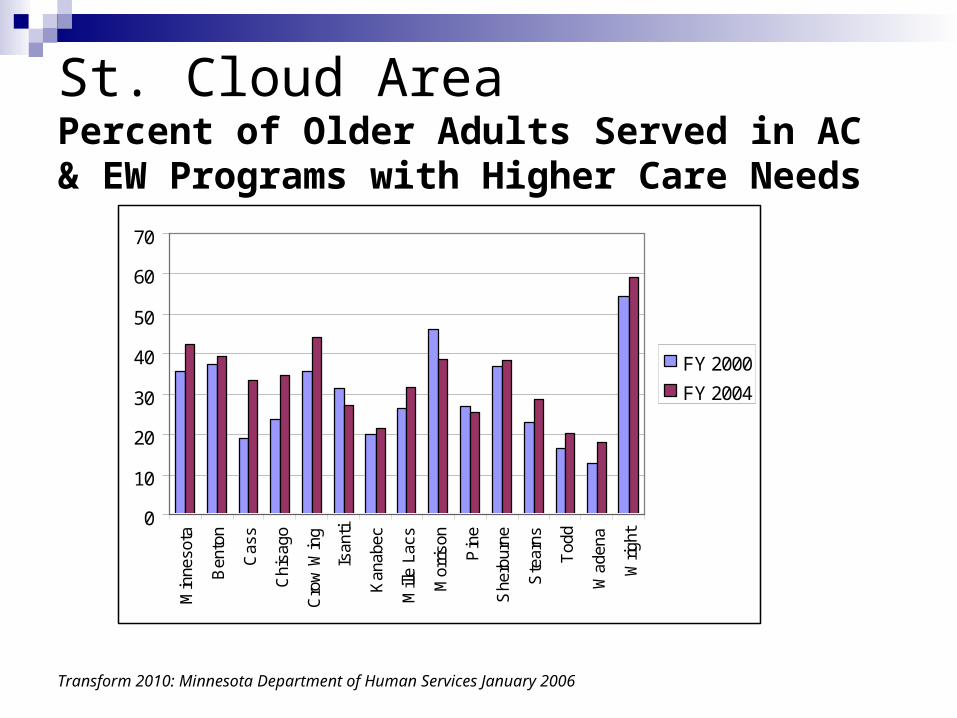
St. Cloud Area Percent of Older Adults Served in AC & EW Programs with Higher Care Needs
Transform 2010: Minnesota Department of Human Services January 2006
0
10
20
30
40
50
60
70
Min
neso
ta
Ben
ton
Cas
s
Chi
sago
Cro
w W
ing
Isan
ti
Kan
abec
Mill
e La
cs
Mor
rison
Pin
e
She
rbur
ne
Ste
arns
Tod
d
Wad
ena
Wrig
ht
FY 2000
FY 2004
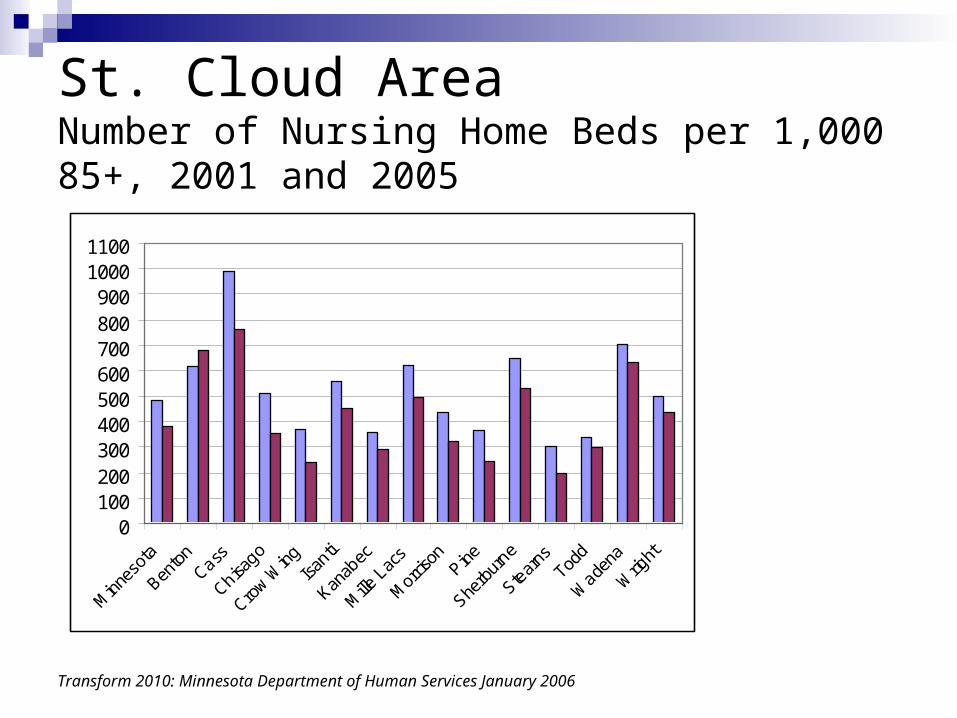
St. Cloud Area Number of Nursing Home Beds per 1,000 85+, 2001 and 2005
Transform 2010: Minnesota Department of Human Services January 2006
0100200300400500600700800900
10001100
Minn
esot
a
Bento
nCass
Chisago
Crow W
ingIsa
nti
Kanab
ec
Mille
Lac
s
Mor
rison
Pine
Sherb
urne
Stear
nsTod
d
Wade
na
Wrig
ht
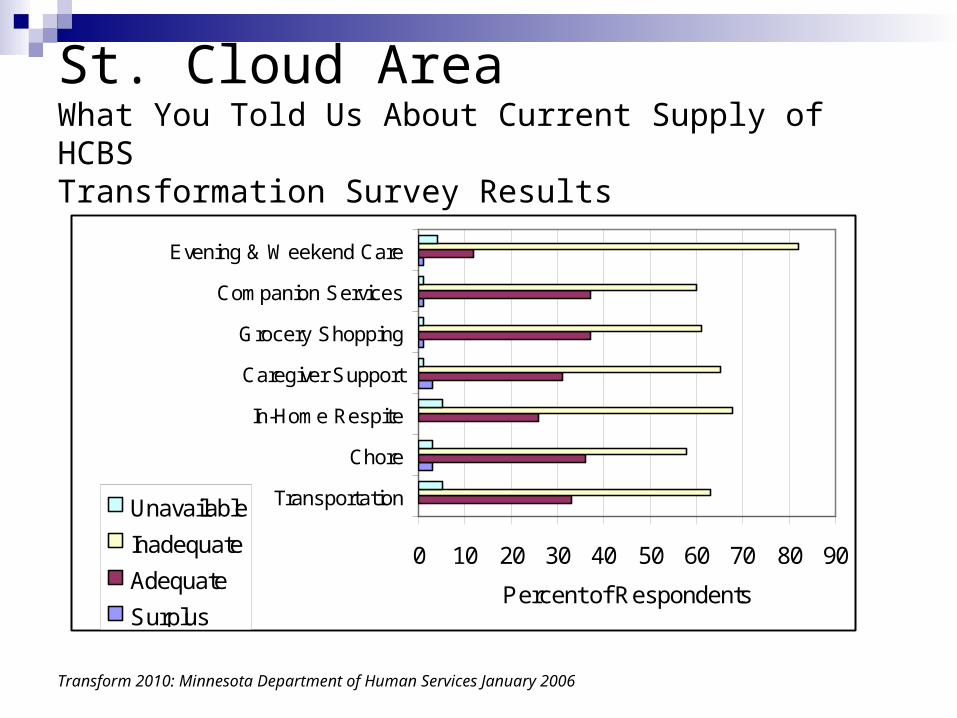
St. Cloud Area What You Told Us About Current Supply of HCBSTransformation Survey Results
Transform 2010: Minnesota Department of Human Services January 2006
0 10 20 30 40 50 60 70 80 90
Transportation
Chore
In-Home Respite
Caregiver Support
Grocery Shopping
Companion Services
Evening & Weekend Care
Percent of Respondents
Unavailable
Inadequate
Adequate
Surplus
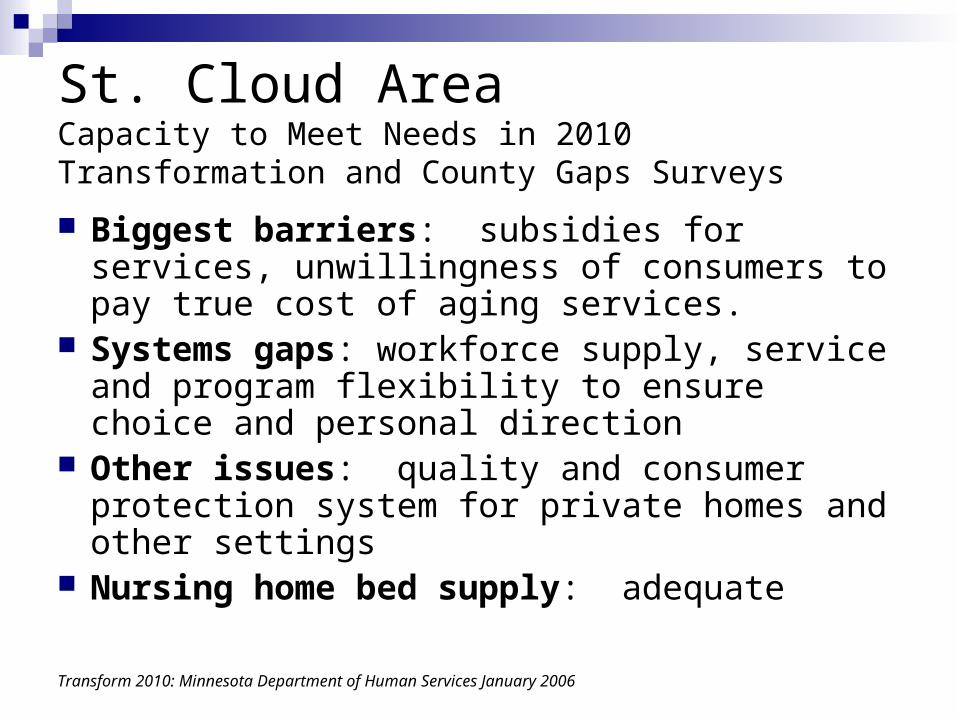
St. Cloud Area Capacity to Meet Needs in 2010Transformation and County Gaps Surveys
Biggest barriers: subsidies for services, unwillingness of consumers to pay true cost of aging services.
Systems gaps: workforce supply, service and program flexibility to ensure choice and personal direction
Other issues: quality and consumer protection system for private homes and other settings
Nursing home bed supply: adequate
Transform 2010: Minnesota Department of Human Services January 2006

St. Cloud Area What You Told Us About Current Housing SupplyTransformation Survey
County Gaps Survey: subsidized rental (with and without services) was identified as inadequate.
Transform 2010: Minnesota Department of Human Services January 2006
0 10 20 30 40 50 60 70 80 90
Mkt Rate Rental - No Svs
Subsidized Rental - No Svs
Mkt Rate Rental - w/ Svs
Subsidized Rental - w/ Svs
Small Service Settings
Home Modifications
Percent of Respondents
Unavailable
Inadequate
Adequate
Surplus

St. Cloud Area What You Told Us About Current Supply of Health and Medical ServicesTransformation Survey Results
Transform 2010: Minnesota Department of Human Services January 2006
0 10 20 30 40 50 60 70 80 90 100
Primary Care
Geriatric Specialty Care
Other Specialty Care
Hospital Care
Pharmacy
Facility-based Dementia Care
Facility-based Complex Medical Mgmt
Percent of Respondents
Unavailable
Inadequate
Adequate
Surplus
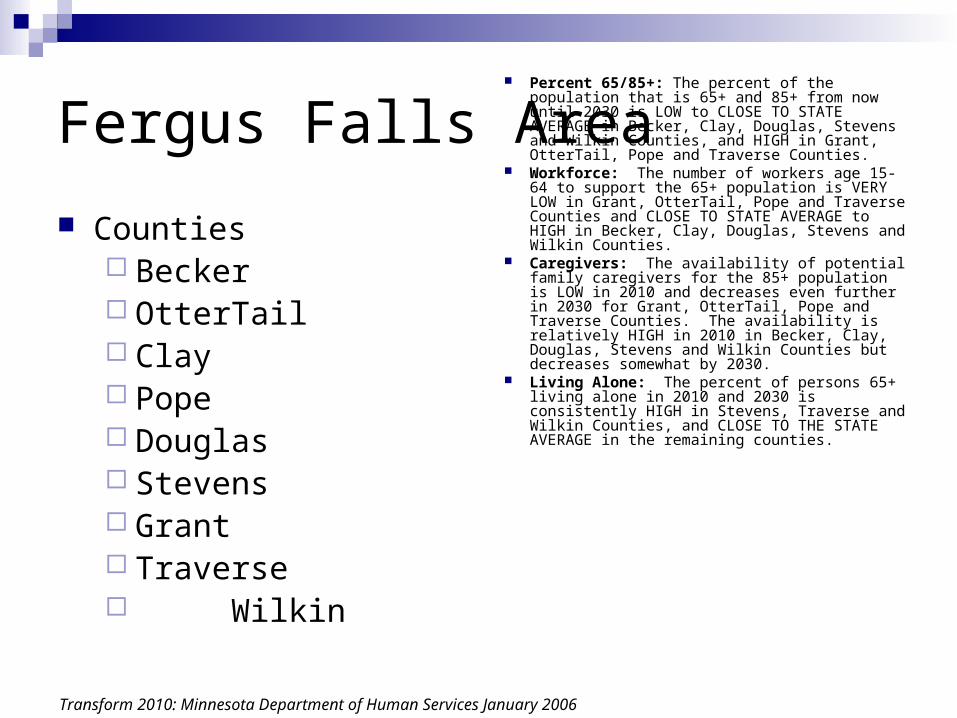
Fergus Falls Area
Counties Becker OtterTail Clay Pope Douglas Stevens Grant Traverse Wilkin
Percent 65/85+: The percent of the population that is 65+ and 85+ from now until 2030 is LOW to CLOSE TO STATE AVERAGE in Becker, Clay, Douglas, Stevens and Wilkin Counties, and HIGH in Grant, OtterTail, Pope and Traverse Counties.
Workforce: The number of workers age 15-64 to support the 65+ population is VERY LOW in Grant, OtterTail, Pope and Traverse Counties and CLOSE TO STATE AVERAGE to HIGH in Becker, Clay, Douglas, Stevens and Wilkin Counties.
Caregivers: The availability of potential family caregivers for the 85+ population is LOW in 2010 and decreases even further in 2030 for Grant, OtterTail, Pope and Traverse Counties. The availability is relatively HIGH in 2010 in Becker, Clay, Douglas, Stevens and Wilkin Counties but decreases somewhat by 2030.
Living Alone: The percent of persons 65+ living alone in 2010 and 2030 is consistently HIGH in Stevens, Traverse and Wilkin Counties, and CLOSE TO THE STATE AVERAGE in the remaining counties.
Transform 2010: Minnesota Department of Human Services January 2006
Fergus Falls Area Percent of Older Adults Served in AC & EW Programs with Higher Care Needs
Transform 2010: Minnesota Department of Human Services January 2006
0
5
10
15
20
25
30
35
40
45
Minn
esot
a
Becke
rCla
y
Douglas
Grant
Otter T
ail
Pope
Steve
ns
Trave
rse
Wilk
in
FY 2000
FY 2004
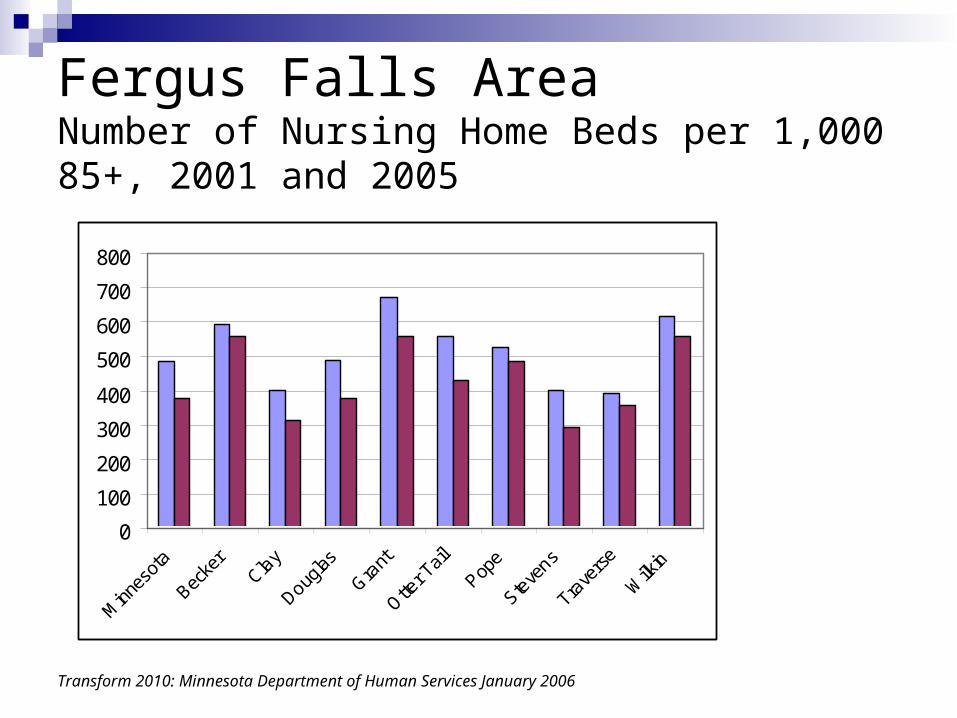
Fergus Falls Area Number of Nursing Home Beds per 1,000 85+, 2001 and 2005
Transform 2010: Minnesota Department of Human Services January 2006
0
100
200
300
400
500
600
700
800
Minn
esot
a
Becke
rCla
y
Douglas
Grant
Otter T
ail
Pope
Steve
ns
Trave
rse
Wilk
in
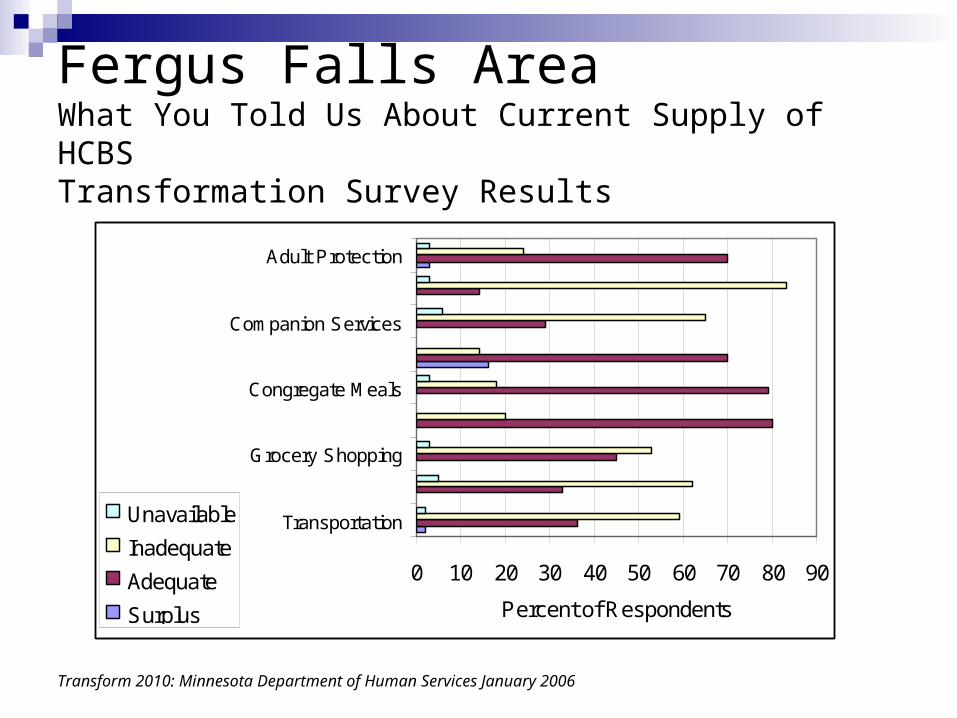
Fergus Falls Area What You Told Us About Current Supply of HCBSTransformation Survey Results
Transform 2010: Minnesota Department of Human Services January 2006
0 10 20 30 40 50 60 70 80 90
Transportation
Grocery Shopping
Congregate Meals
Companion Services
Adult Protection
Percent of Respondents
Unavailable
Inadequate
Adequate
Surplus
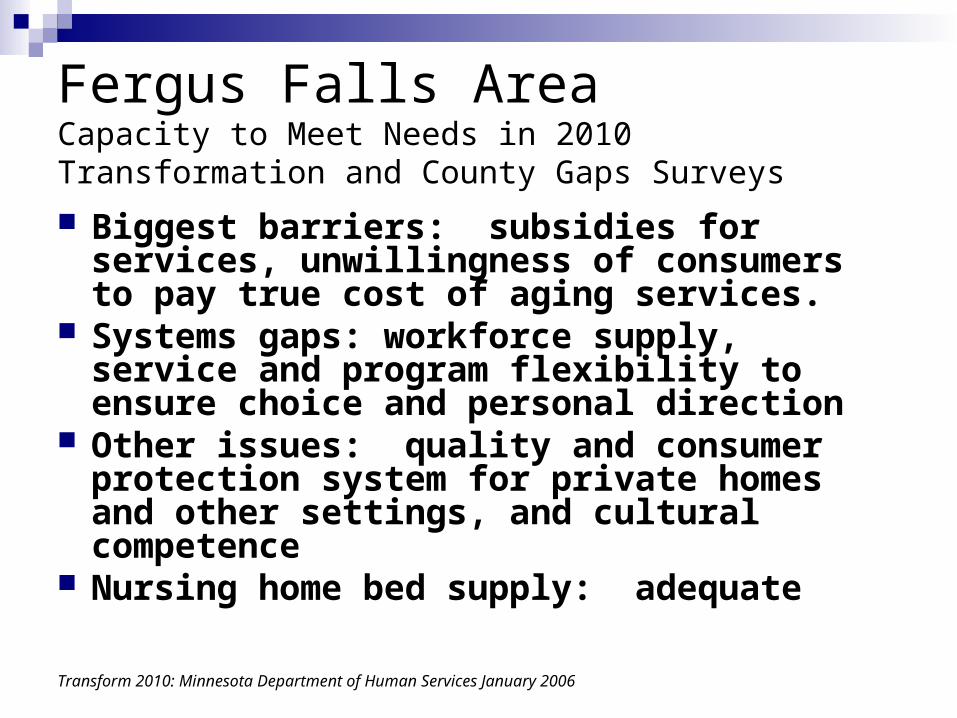
Fergus Falls Area Capacity to Meet Needs in 2010Transformation and County Gaps Surveys
Biggest barriers: subsidies for services, unwillingness of consumers to pay true cost of aging services.
Systems gaps: workforce supply, service and program flexibility to ensure choice and personal direction
Other issues: quality and consumer protection system for private homes and other settings, and cultural competence
Nursing home bed supply: adequate
Transform 2010: Minnesota Department of Human Services January 2006
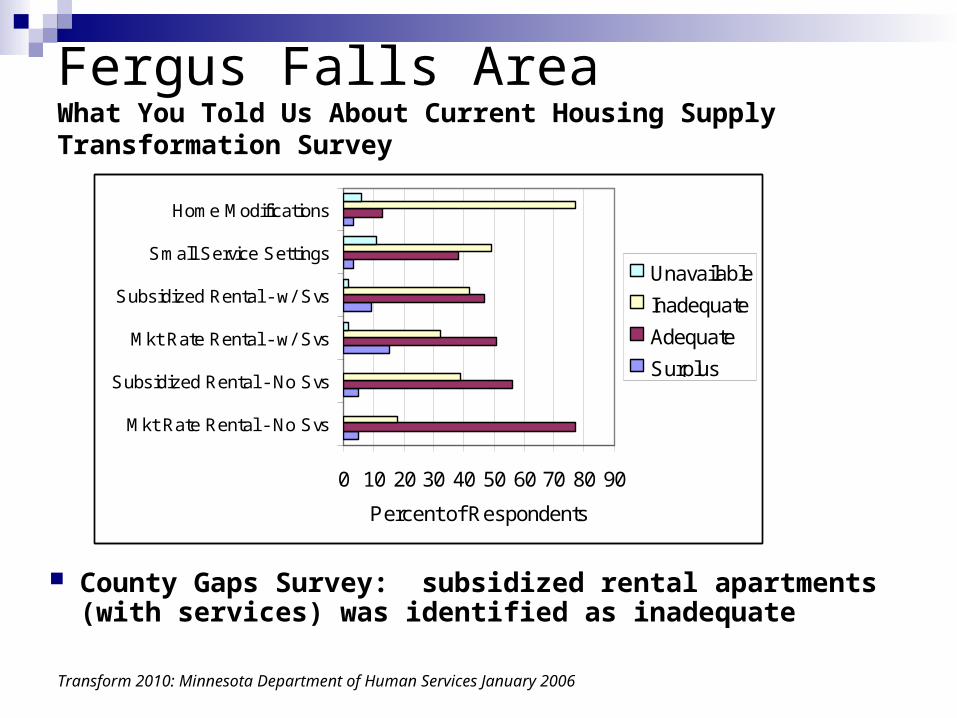
Fergus Falls Area What You Told Us About Current Housing SupplyTransformation Survey
County Gaps Survey: subsidized rental apartments (with services) was identified as inadequate
Transform 2010: Minnesota Department of Human Services January 2006
0 10 20 30 40 50 60 70 80 90
Mkt Rate Rental - No Svs
Subsidized Rental - No Svs
Mkt Rate Rental - w/ Svs
Subsidized Rental - w/ Svs
Small Service Settings
Home Modifications
Percent of Respondents
Unavailable
Inadequate
Adequate
Surplus

Fergus Falls Area What You Told Us About Current Supply of Health and Medical ServicesTransformation Survey Results
Transform 2010: Minnesota Department of Human Services January 2006
0 10 20 30 40 50 60 70 80 90 100
Hospital Care
Pharmacy
General Primary Care
Geriatric Specialty Care
Other Specialty Care
Facility-based Dementia Care
Facility-based Complex Medical Mgmt
Percent of Respondents
Unavailable
Inadequate
Adequate
Surplus
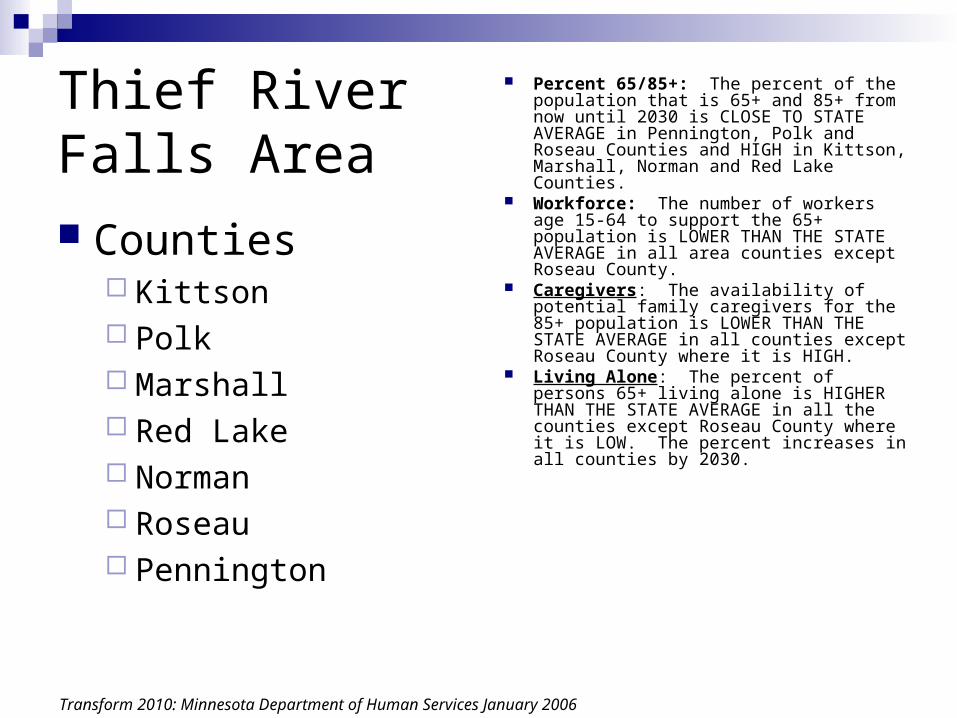
Thief River Falls Area Counties
Kittson Polk Marshall Red Lake Norman Roseau Pennington
Percent 65/85+: The percent of the population that is 65+ and 85+ from now until 2030 is CLOSE TO STATE AVERAGE in Pennington, Polk and Roseau Counties and HIGH in Kittson, Marshall, Norman and Red Lake Counties.
Workforce: The number of workers age 15-64 to support the 65+ population is LOWER THAN THE STATE AVERAGE in all area counties except Roseau County.
Caregivers: The availability of potential family caregivers for the 85+ population is LOWER THAN THE STATE AVERAGE in all counties except Roseau County where it is HIGH.
Living Alone: The percent of persons 65+ living alone is HIGHER THAN THE STATE AVERAGE in all the counties except Roseau County where it is LOW. The percent increases in all counties by 2030.
Transform 2010: Minnesota Department of Human Services January 2006
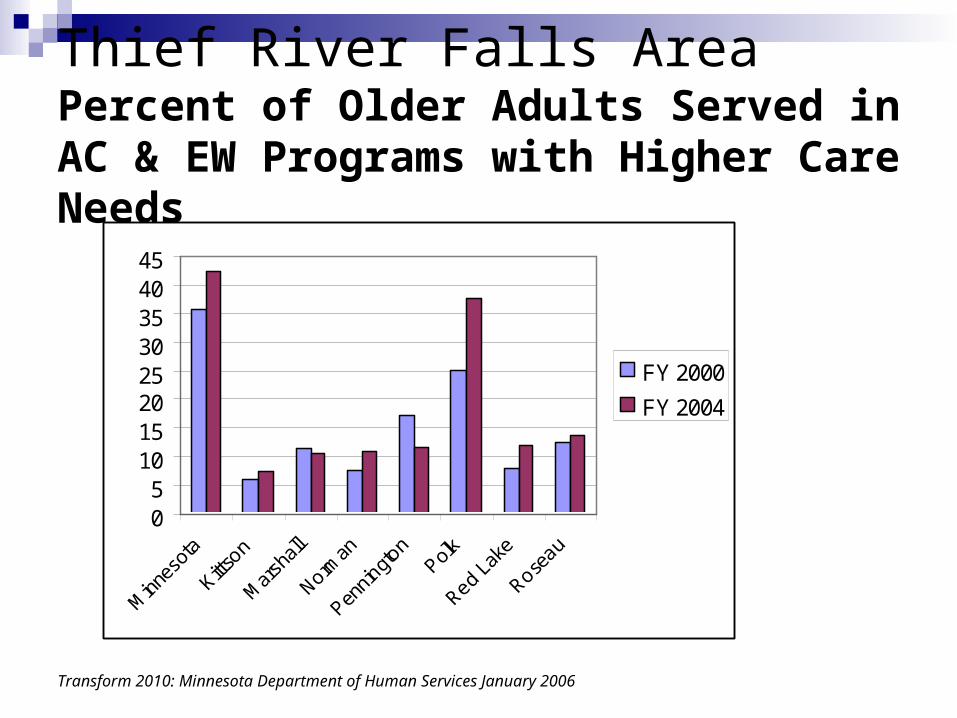
Thief River Falls Area Percent of Older Adults Served in AC & EW Programs with Higher Care Needs
Transform 2010: Minnesota Department of Human Services January 2006
05
1015202530354045
Minn
esot
a
Kittson
Mar
shall
Norman
Pennin
gton
Polk
Red La
ke
Roseau
FY 2000
FY 2004
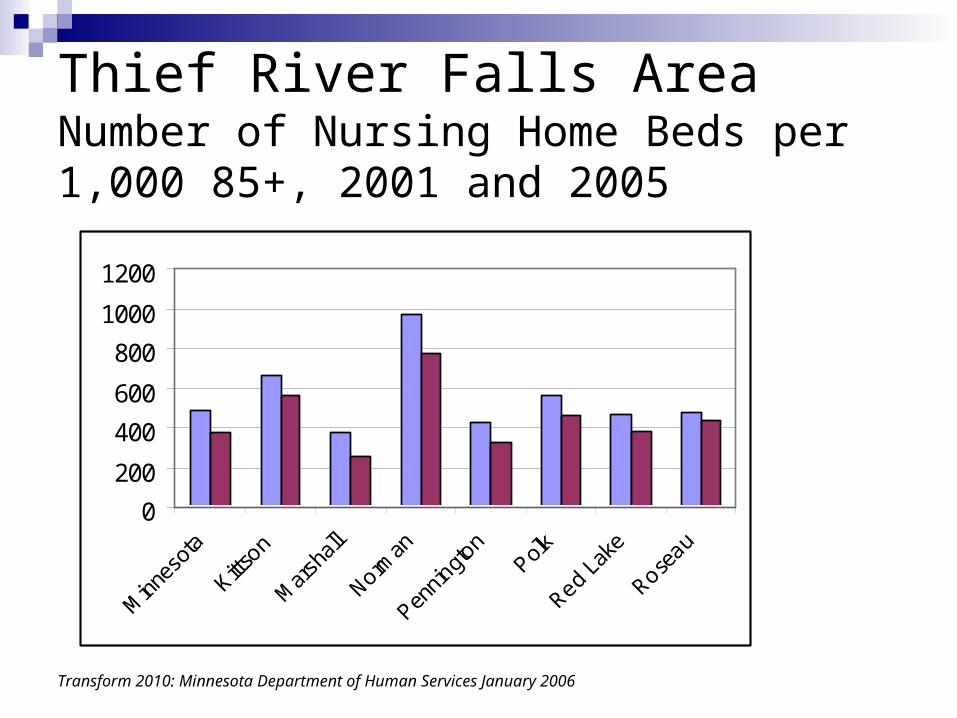
Thief River Falls Area Number of Nursing Home Beds per 1,000 85+, 2001 and 2005
Transform 2010: Minnesota Department of Human Services January 2006
0
200
400
600
800
1000
1200
Minn
esot
a
Kittson
Mar
shall
Norman
Pennin
gton
Polk
Red La
ke
Roseau
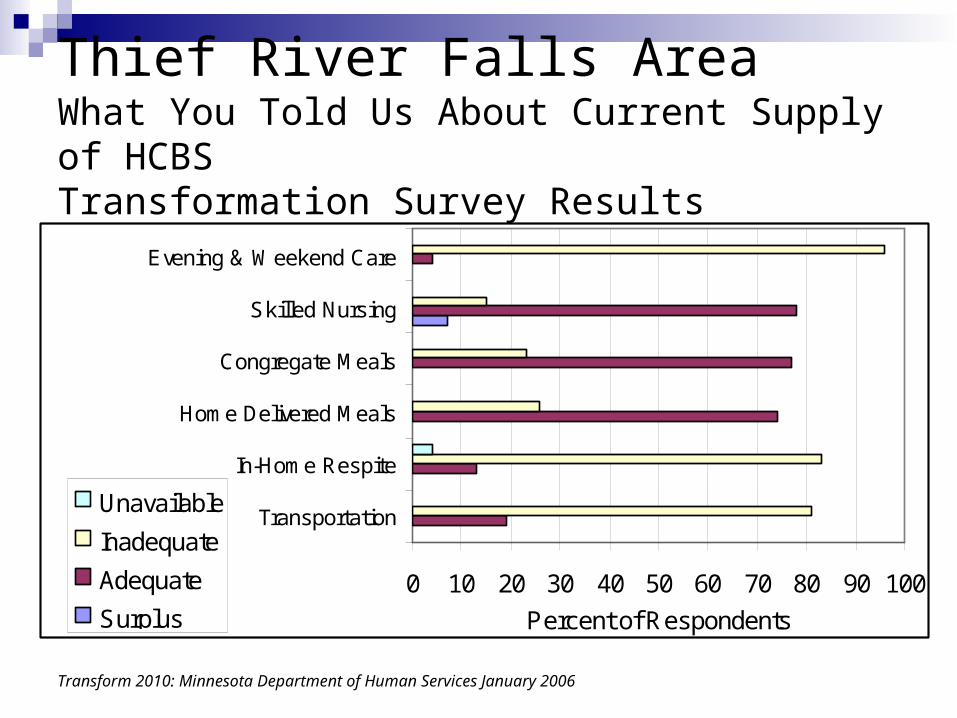
Thief River Falls Area What You Told Us About Current Supply of HCBSTransformation Survey Results
Transform 2010: Minnesota Department of Human Services January 2006
0 10 20 30 40 50 60 70 80 90 100
Transportation
In-Home Respite
Home Delivered Meals
Congregate Meals
Skilled Nursing
Evening & Weekend Care
Percent of Respondents
Unavailable
Inadequate
Adequate
Surplus
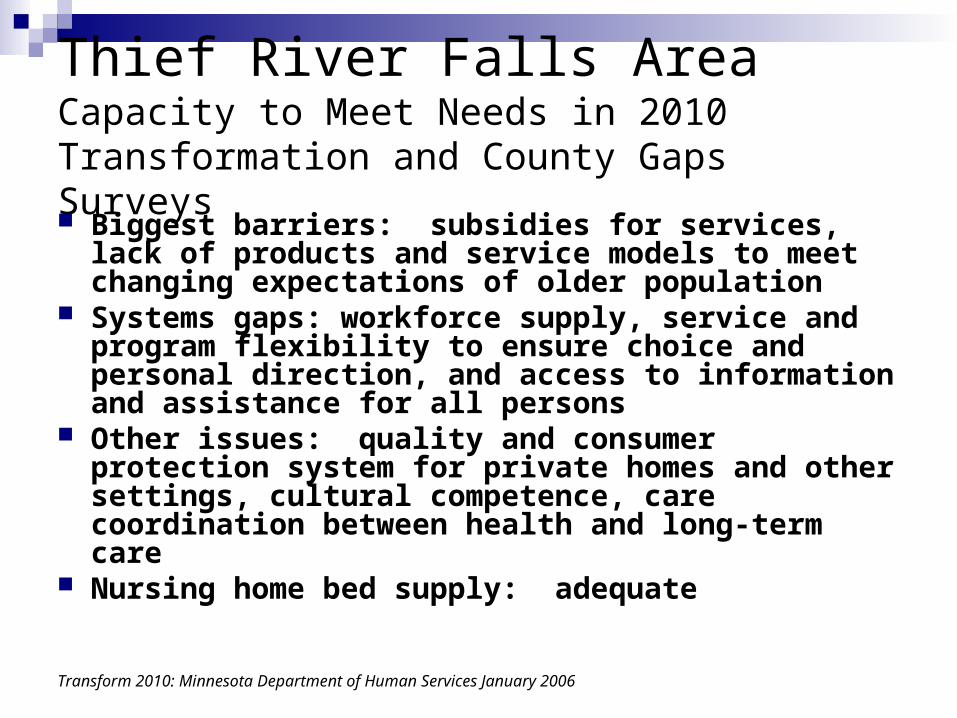
Thief River Falls Area Capacity to Meet Needs in 2010Transformation and County Gaps Surveys Biggest barriers: subsidies for services, lack of
products and service models to meet changing expectations of older population
Systems gaps: workforce supply, service and program flexibility to ensure choice and personal direction, and access to information and assistance for all persons
Other issues: quality and consumer protection system for private homes and other settings, cultural competence, care coordination between health and long-term care
Nursing home bed supply: adequate
Transform 2010: Minnesota Department of Human Services January 2006
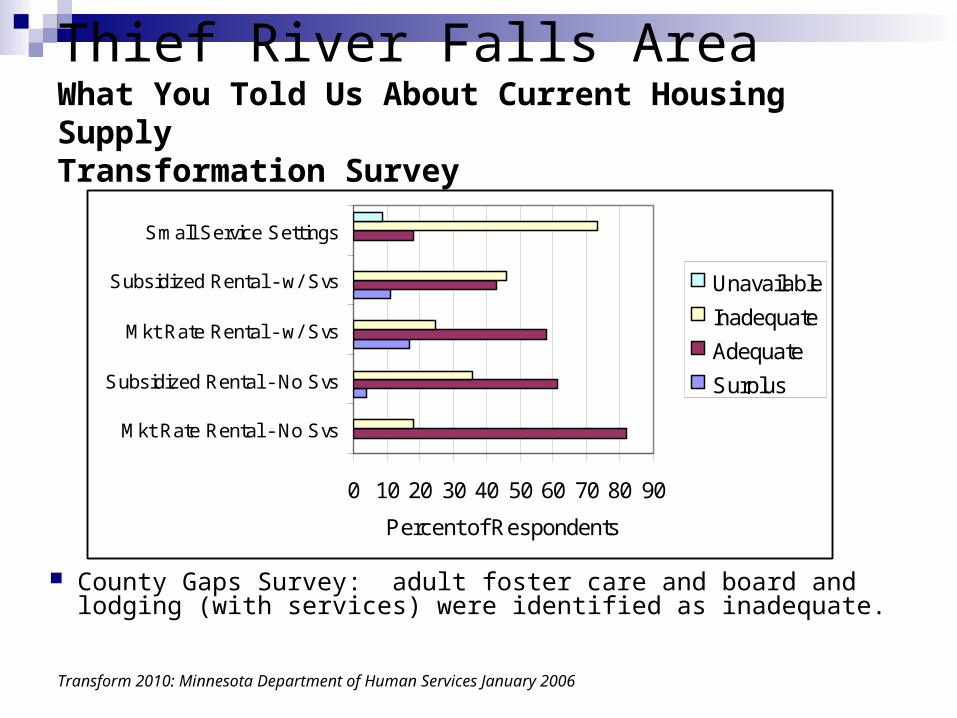
Thief River Falls Area What You Told Us About Current Housing SupplyTransformation Survey
County Gaps Survey: adult foster care and board and lodging (with services) were identified as inadequate.
Transform 2010: Minnesota Department of Human Services January 2006
0 10 20 30 40 50 60 70 80 90
Mkt Rate Rental - No Svs
Subsidized Rental - No Svs
Mkt Rate Rental - w/ Svs
Subsidized Rental - w/ Svs
Small Service Settings
Percent of Respondents
Unavailable
Inadequate
Adequate
Surplus
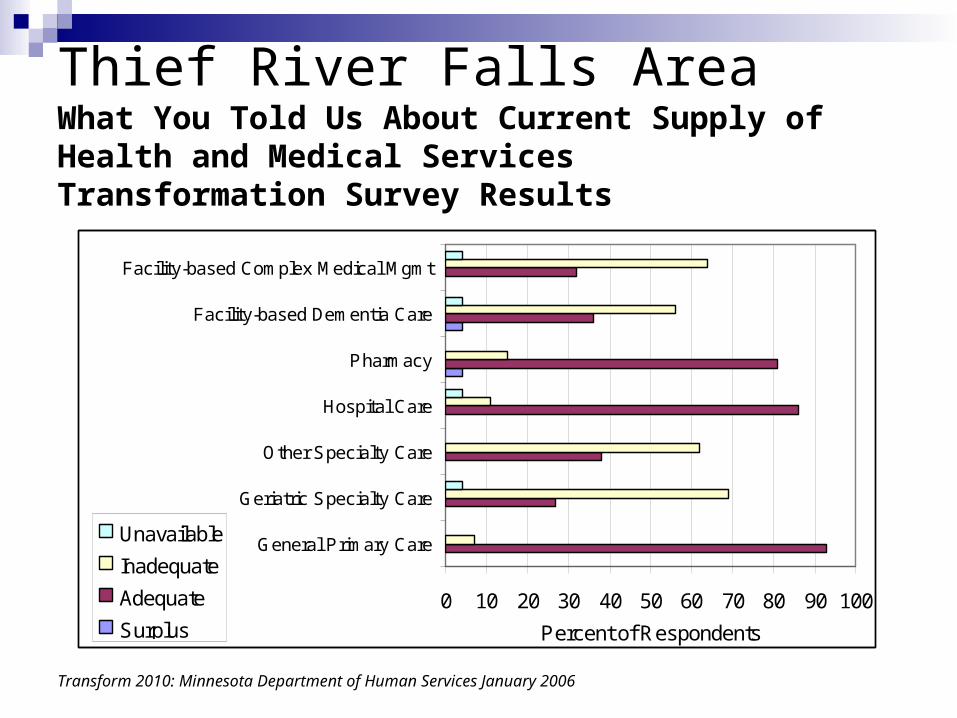
Thief River Falls Area What You Told Us About Current Supply of Health and Medical ServicesTransformation Survey Results
Transform 2010: Minnesota Department of Human Services January 2006
0 10 20 30 40 50 60 70 80 90 100
General Primary Care
Geriatric Specialty Care
Other Specialty Care
Hospital Care
Pharmacy
Facility-based Dementia Care
Facility-based Complex Medical Mgmt
Percent of Respondents
Unavailable
Inadequate
Adequate
Surplus
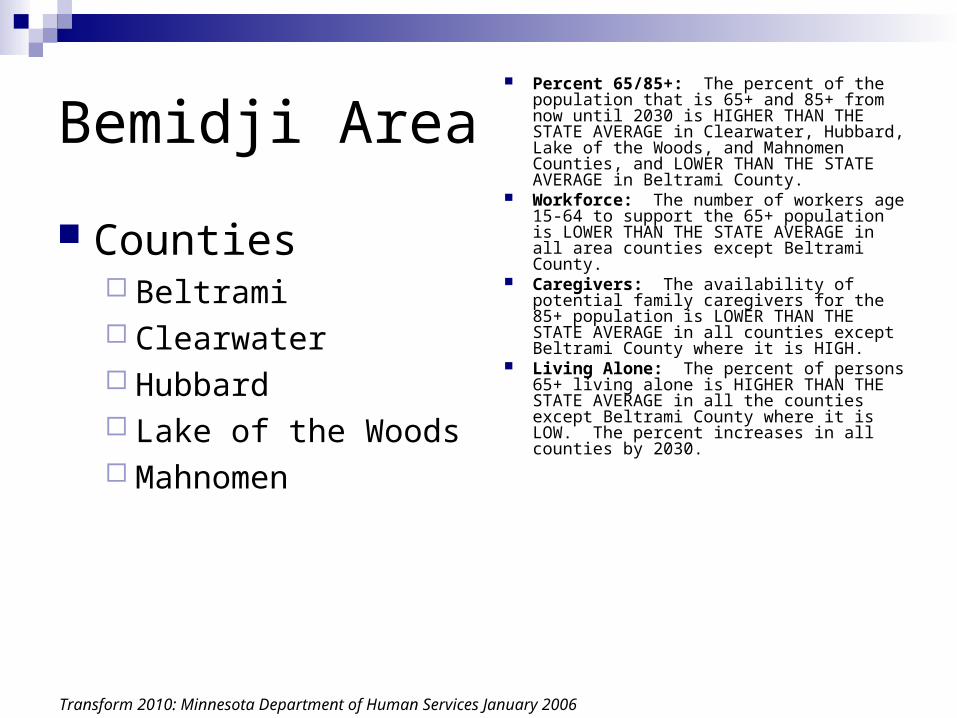
Bemidji Area
Counties Beltrami Clearwater Hubbard Lake of the Woods Mahnomen
Percent 65/85+: The percent of the population that is 65+ and 85+ from now until 2030 is HIGHER THAN THE STATE AVERAGE in Clearwater, Hubbard, Lake of the Woods, and Mahnomen Counties, and LOWER THAN THE STATE AVERAGE in Beltrami County.
Workforce: The number of workers age 15-64 to support the 65+ population is LOWER THAN THE STATE AVERAGE in all area counties except Beltrami County.
Caregivers: The availability of potential family caregivers for the 85+ population is LOWER THAN THE STATE AVERAGE in all counties except Beltrami County where it is HIGH.
Living Alone: The percent of persons 65+ living alone is HIGHER THAN THE STATE AVERAGE in all the counties except Beltrami County where it is LOW. The percent increases in all counties by 2030.
Transform 2010: Minnesota Department of Human Services January 2006
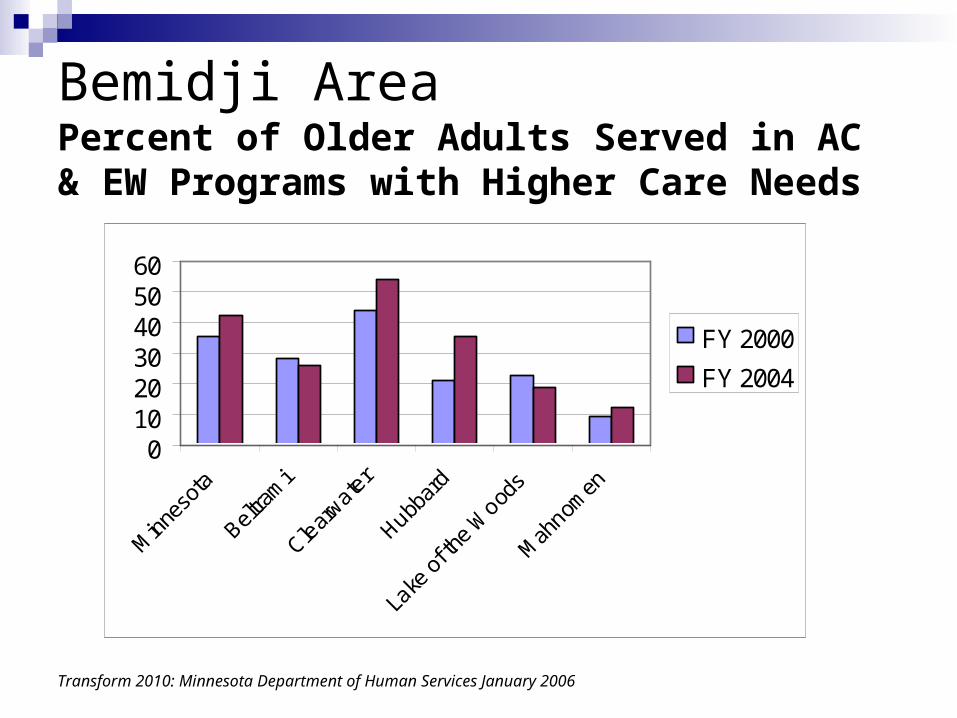
Bemidji Area Percent of Older Adults Served in AC & EW Programs with Higher Care Needs
Transform 2010: Minnesota Department of Human Services January 2006
0102030405060
Minn
esot
a
Beltra
mi
Clear
water
Hubbar
d
Lake
of t
he W
oods
Mah
nomen
FY 2000
FY 2004
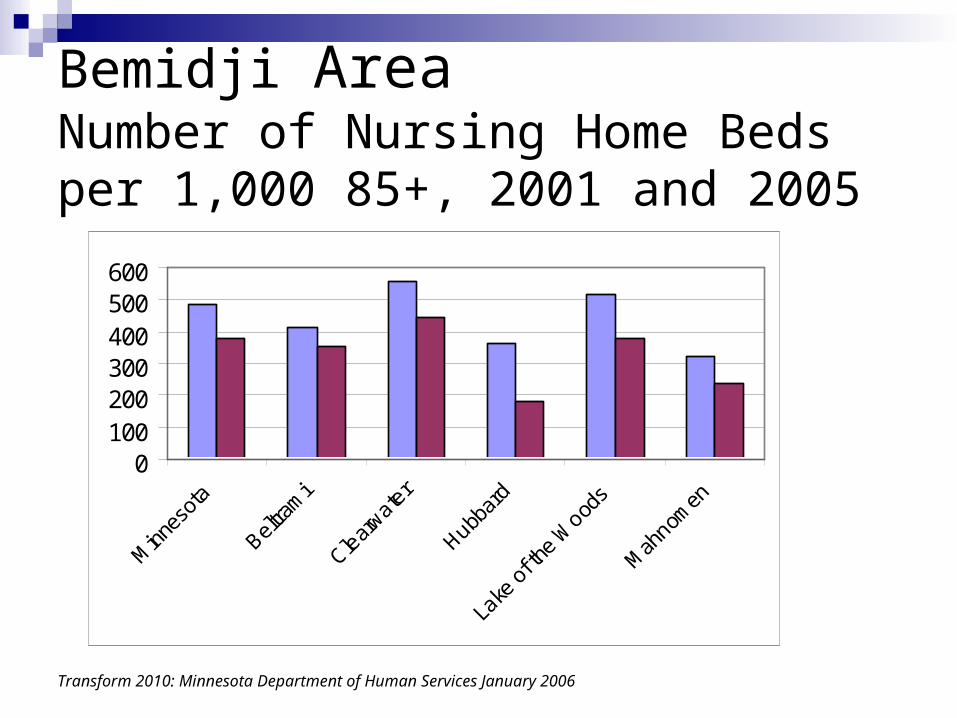
Bemidji Area Number of Nursing Home Beds per 1,000 85+, 2001 and 2005
Transform 2010: Minnesota Department of Human Services January 2006
0100200300400500600
Minn
esot
a
Beltra
mi
Clear
water
Hubbar
d
Lake
of t
he W
oods
Mah
nomen
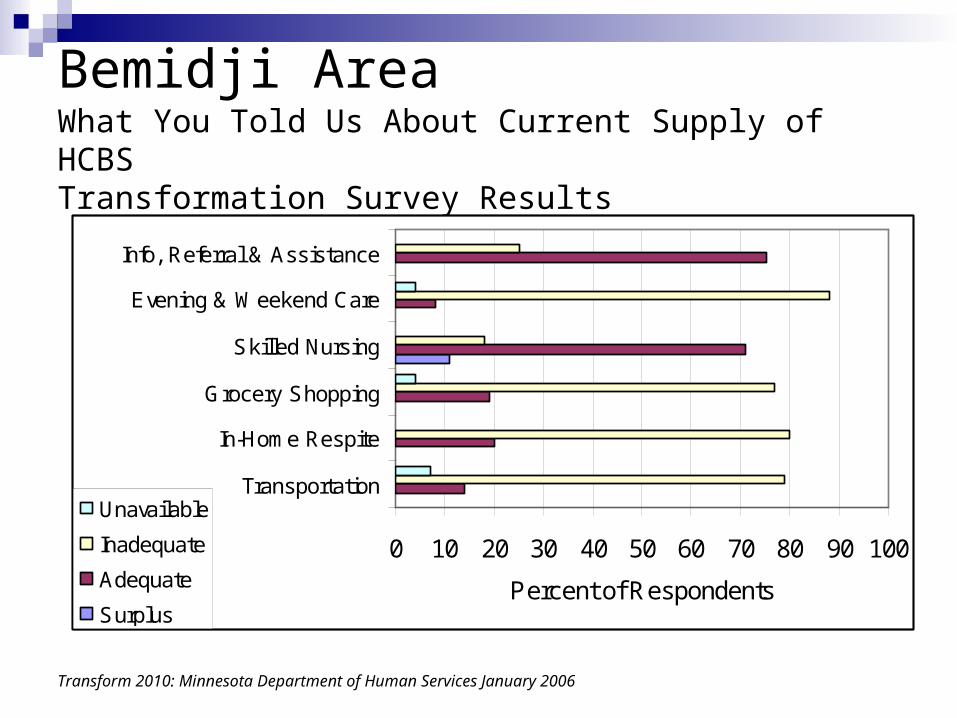
Bemidji Area What You Told Us About Current Supply of HCBSTransformation Survey Results
Transform 2010: Minnesota Department of Human Services January 2006
0 10 20 30 40 50 60 70 80 90 100
Transportation
In-Home Respite
Grocery Shopping
Skilled Nursing
Evening & Weekend Care
Info, Referral & Assistance
Percent of Respondents
Unavailable
Inadequate
Adequate
Surplus
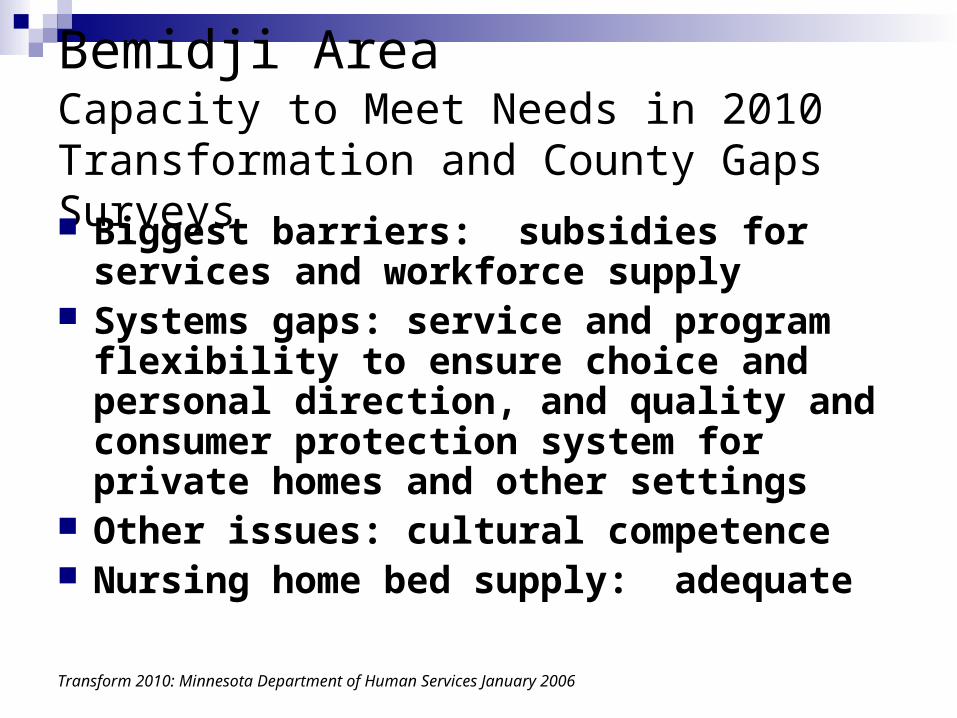
Bemidji Area Capacity to Meet Needs in 2010Transformation and County Gaps Surveys Biggest barriers: subsidies for services and
workforce supply Systems gaps: service and program
flexibility to ensure choice and personal direction, and quality and consumer protection system for private homes and other settings
Other issues: cultural competence Nursing home bed supply: adequate
Transform 2010: Minnesota Department of Human Services January 2006
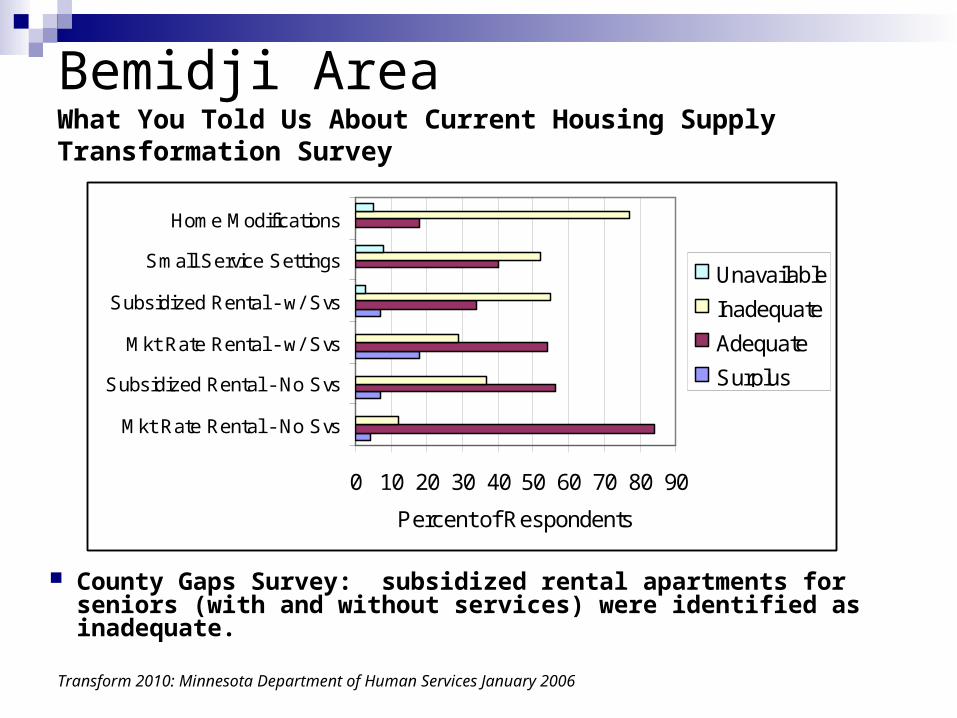
Bemidji Area What You Told Us About Current Housing SupplyTransformation Survey
County Gaps Survey: subsidized rental apartments for seniors (with and without services) were identified as inadequate.
Transform 2010: Minnesota Department of Human Services January 2006
0 10 20 30 40 50 60 70 80 90
Mkt Rate Rental - No Svs
Subsidized Rental - No Svs
Mkt Rate Rental - w/ Svs
Subsidized Rental - w/ Svs
Small Service Settings
Home Modifications
Percent of Respondents
Unavailable
Inadequate
Adequate
Surplus
Bemidji Area What You Told Us About Current Supply of Health and Medical ServicesTransformation Survey Results
Transform 2010: Minnesota Department of Human Services January 2006
0 10 20 30 40 50 60 70 80 90 100
General Primary Care
Geriatric Specialty Care
Hospital Care
Pharmacy
Facility-based Complex Medical Mgmt
Percent of Respondents
Unavailable
Inadequate
Adequate
Surplus
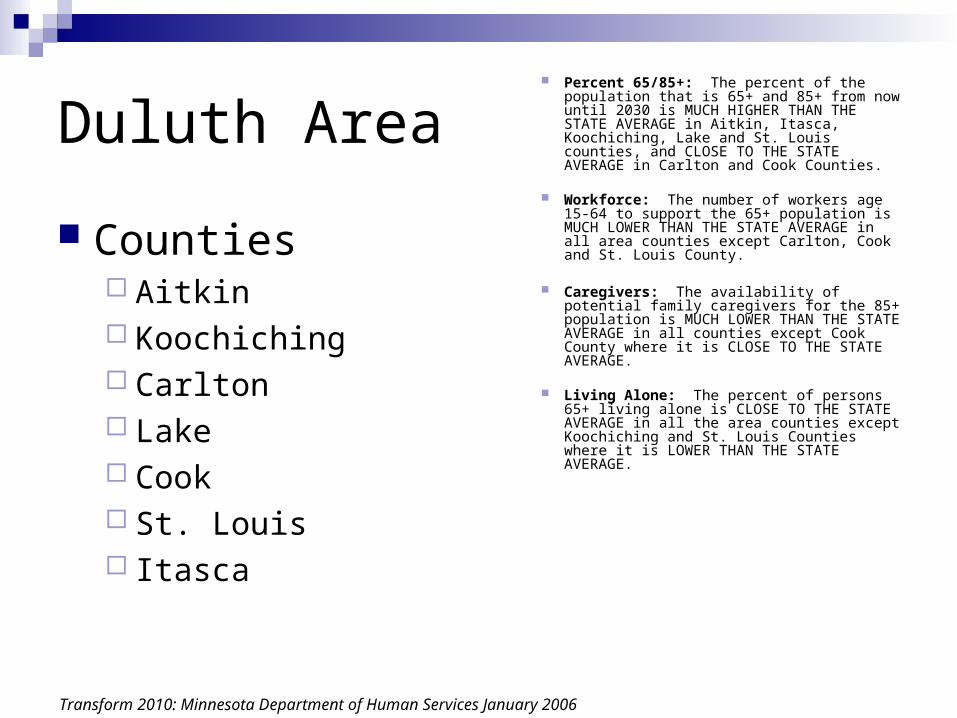
Duluth Area
Counties Aitkin Koochiching Carlton Lake Cook St. Louis Itasca
Percent 65/85+: The percent of the population that is 65+ and 85+ from now until 2030 is MUCH HIGHER THAN THE STATE AVERAGE in Aitkin, Itasca, Koochiching, Lake and St. Louis counties, and CLOSE TO THE STATE AVERAGE in Carlton and Cook Counties.
Workforce: The number of workers age 15-64 to support the 65+ population is MUCH LOWER THAN THE STATE AVERAGE in all area counties except Carlton, Cook and St. Louis County.
Caregivers: The availability of potential family caregivers for the 85+ population is MUCH LOWER THAN THE STATE AVERAGE in all counties except Cook County where it is CLOSE TO THE STATE AVERAGE.
Living Alone: The percent of persons 65+ living alone is CLOSE TO THE STATE AVERAGE in all the area counties except Koochiching and St. Louis Counties where it is LOWER THAN THE STATE AVERAGE.
Transform 2010: Minnesota Department of Human Services January 2006
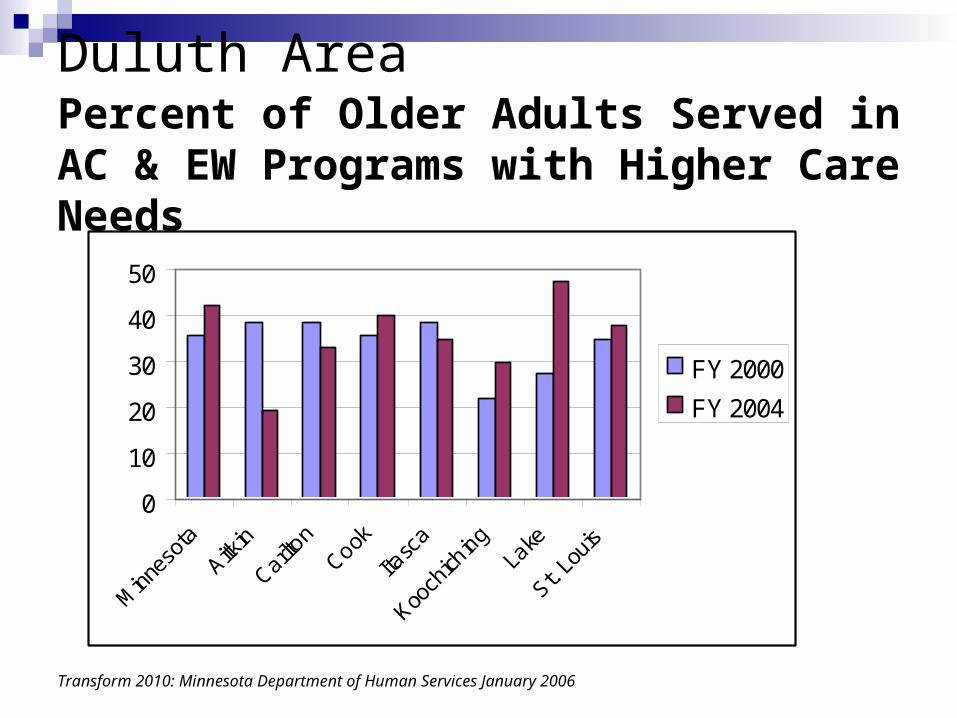
Duluth Area Percent of Older Adults Served in AC & EW Programs with Higher Care Needs
Transform 2010: Minnesota Department of Human Services January 2006
0
10
20
30
40
50
Minn
esot
a
Aitkin
Carlton
Cook
Itasc
a
Kooch
iching
Lake
St. Lo
uis
FY 2000
FY 2004
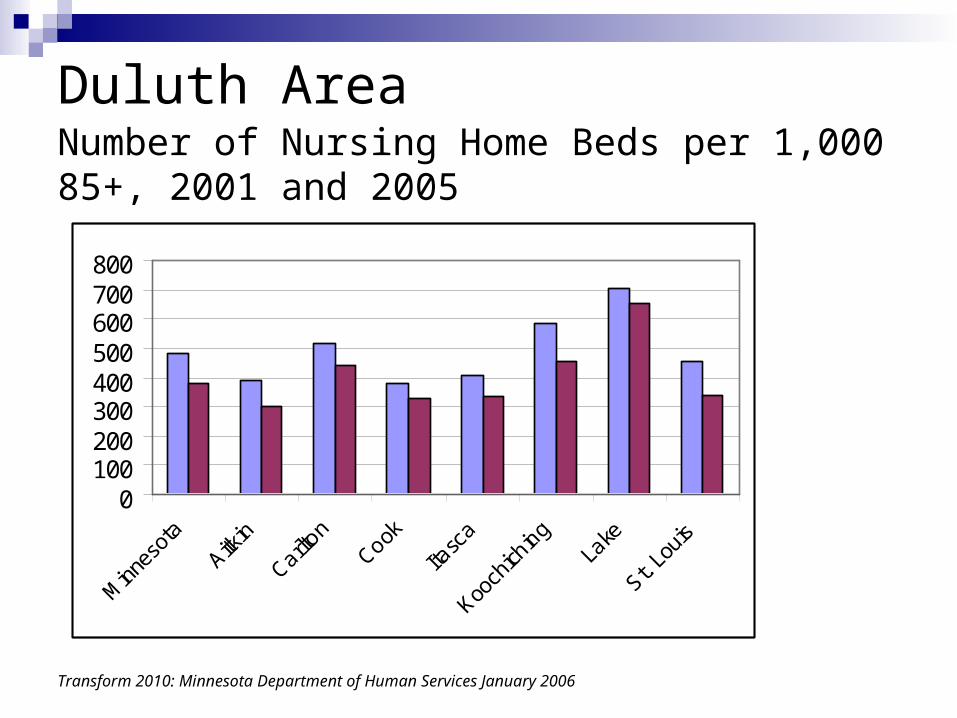
Duluth Area Number of Nursing Home Beds per 1,000 85+, 2001 and 2005
Transform 2010: Minnesota Department of Human Services January 2006
0100200300400500600700800
Minn
esot
a
Aitkin
Carlton
Cook
Itasc
a
Kooch
iching
Lake
St. Lo
uis
Duluth Area What You Told Us About Current Supply of HCBSTransformation Survey Results
Transform 2010: Minnesota Department of Human Services January 2006
0 10 20 30 40 50 60 70 80 90
Transportation
Chore
In-Home Respite
Homemaking
Home Delivered Meals
Congregate Meals
Companion Services
Evening & Weekend Care
Adult Protection
Percent of Respondents
Unavailable
Inadequate
Adequate
Surplus
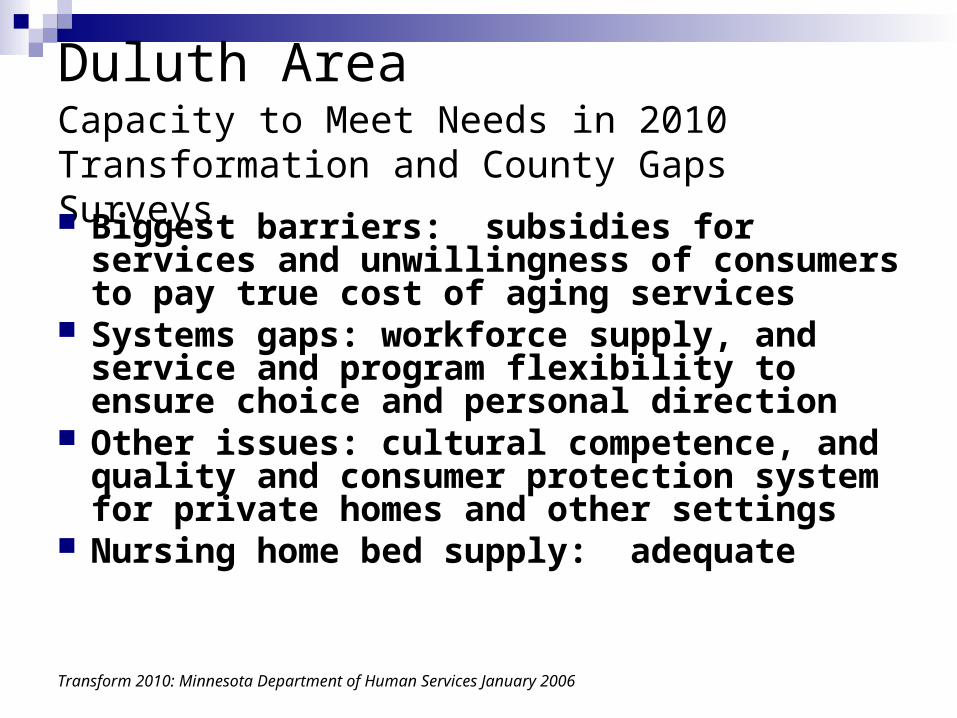
Duluth Area Capacity to Meet Needs in 2010Transformation and County Gaps Surveys Biggest barriers: subsidies for services and
unwillingness of consumers to pay true cost of aging services
Systems gaps: workforce supply, and service and program flexibility to ensure choice and personal direction
Other issues: cultural competence, and quality and consumer protection system for private homes and other settings
Nursing home bed supply: adequate
Transform 2010: Minnesota Department of Human Services January 2006
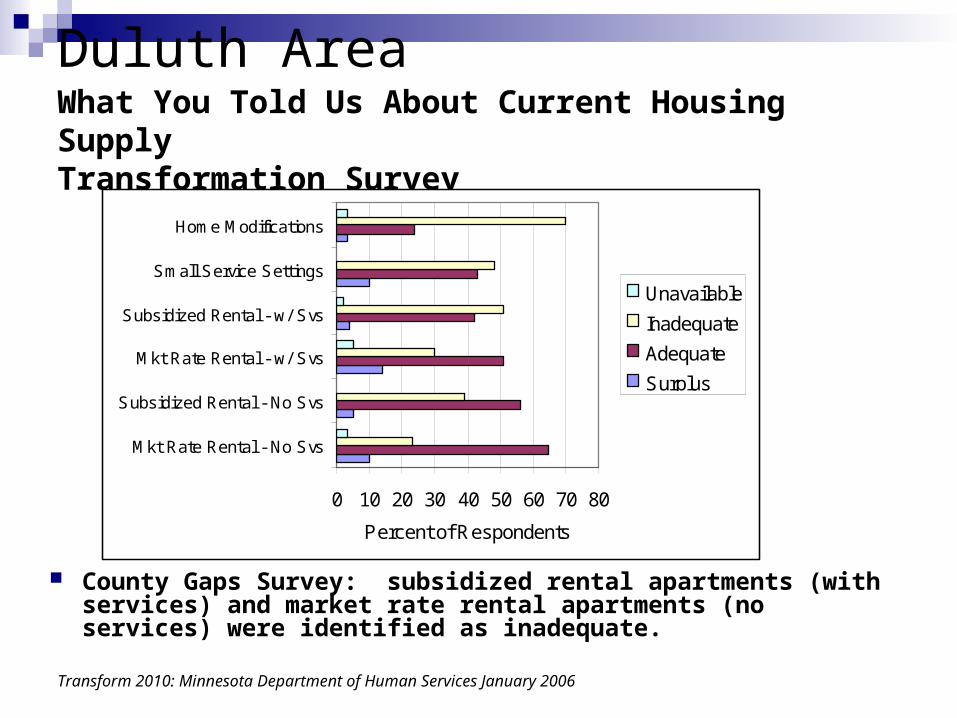
Duluth Area What You Told Us About Current Housing SupplyTransformation Survey
County Gaps Survey: subsidized rental apartments (with services) and market rate rental apartments (no services) were identified as inadequate.
Transform 2010: Minnesota Department of Human Services January 2006
0 10 20 30 40 50 60 70 80
Mkt Rate Rental - No Svs
Subsidized Rental - No Svs
Mkt Rate Rental - w/ Svs
Subsidized Rental - w/ Svs
Small Service Settings
Home Modifications
Percent of Respondents
Unavailable
Inadequate
Adequate
Surplus
Duluth Area What You Told Us About Current Supply of Health and Medical ServicesTransformation Survey Results
Transform 2010: Minnesota Department of Human Services January 2006
0 10 20 30 40 50 60 70 80 90 100
General Primary Care
Geriatric Specialty Care
Other Specialty Care
Hospital Care
Pharmacy
Facility-based Dementia Care
Facility-based Complex Medical Mgmt
Percent of Respondents
Unavailable
Inadequate
Adequate
Surplus
The Future
Where the present trends may take us Informal Care Utilization Labor
When family caregiving decreases, public costs increase
Sources of Long-Term Care for Older Minnesotans
97 95 91
50
0%
20%
40%
60%
80%
100%
1988 1995 2001 2030
Agencies
Families
For every 1% decline in family caregiving, it costs the public sector $30 million?
Source: DHS 2010 Initiative
Nursing Facility Projections: Scenario 1
0
5,000
10,000
15,000
20,000
25,000
30,000
35,000
40,000
2005 2010 2015 2020 2025 2030
Three Year Trend 2002-2004 (Annualized LOS Decreases, Population and Admissions)
Annualized Residents Beds per 95% Occupancy
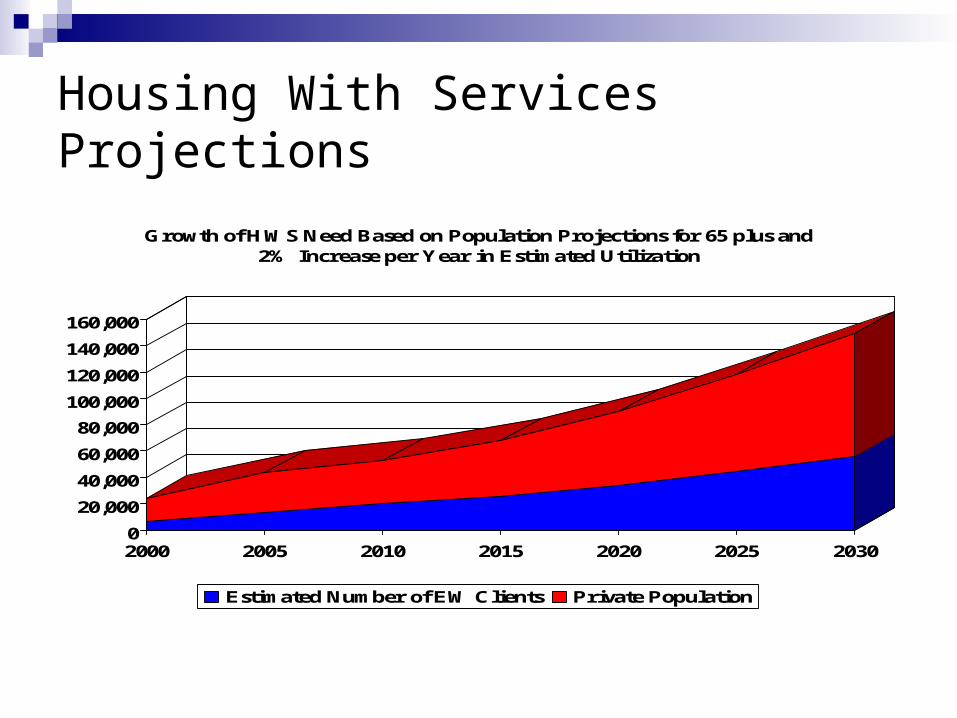
Housing With Services Projections
0
20,000
40,000
60,000
80,000
100,000
120,000
140,000
160,000
2000 2005 2010 2015 2020 2025 2030
Growth of HWS Need Based on Population Projections for 65 plus and 2% Increase per Year in Estimated Utilization
Estimated Number of EW Clients Private Population
Estimated and Annualized Resident Demand
0
20,000
40,000
60,000
80,000
100,000
120,000
140,000
160,000
2000 2005 2010 2015 2020 2025 2030
Hou
sing
wit
h Se
rvic
es
0
5,000
10,000
15,000
20,000
25,000
30,000
35,000
40,000
Nur
sing
Fac
ilit
y
Housing with Services Annualized Number of Nursing Facility Residents
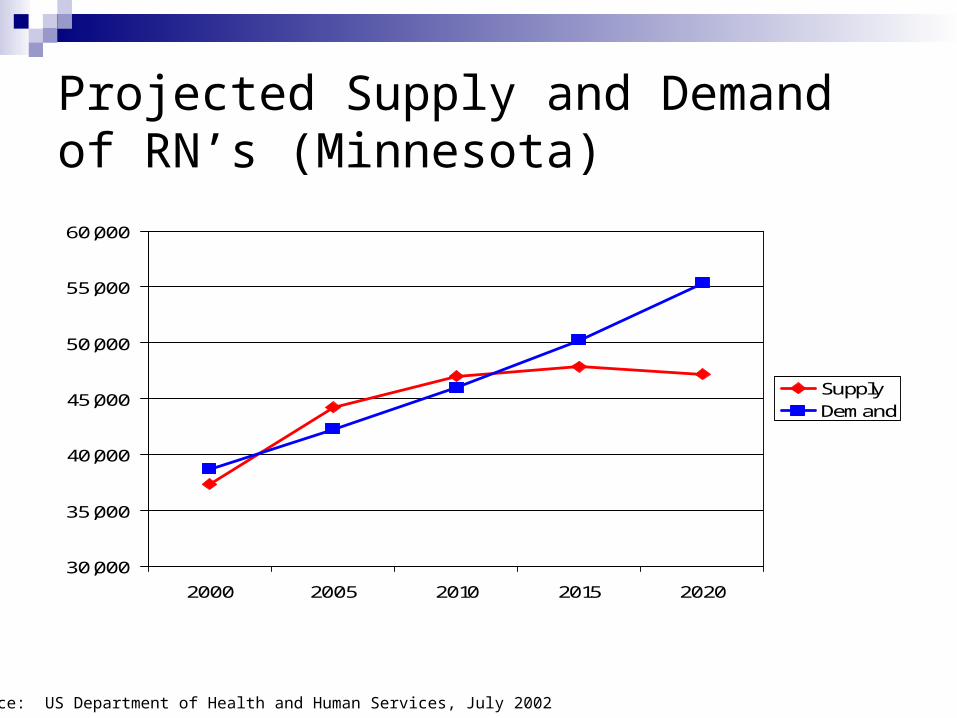
Projected Supply and Demand of RN’s (Minnesota)
30,000
35,000
40,000
45,000
50,000
55,000
60,000
2000 2005 2010 2015 2020
Supply Demand
Source: US Department of Health and Human Services, July 2002