Embed Size (px)
Citation preview
Region 3
2010 MinnesotaHealth Care Quality
RepoRt
Minnesota DepartMent of HealtH, HealtH eConoMiCs prograM85 east seventh place, st. paul, Mn 55164-0882phone: 651-201-3555 | tDD: 651-201-5797 www.health.state.mn.us/healthreform/measurement

Quality HealtH Care Measures | November 2010 | 2010 Health Care Quality Report2
This report was updated in January 2011 to incorporate minor technical corrections.
November 2010 | 2010 Health Care Quality Report | Quality HealtH Care Measures 3
November 2010
Dear Community Member:
We are pleased to provide this report of the Minnesota Statewide Quality Reporting and Measurement System. It enhances our state’s quality data and market transparency for health care and is a building block for trans-formation of health care.
This quality report is a critical component of Minnesota’s nation-leading health reform law of 2008. The law requires the Minnesota Department of Health (MDH) to develop a standardized set of quality measures for hospitals and physician clinics across the state and to produce a public report on health care quality. These efforts build on important work that has been done in Minnesota for many years by MN Community Measure-ment (MNCM), Stratis Health and the Minnesota Hospital Association (MHA) and have drawn upon their multi-stakeholder, community-wide processes for measure development and selection. Through the require-ments in the 2008 law, MDH has expanded the reach of this work:
1. scope. Approximately 520 Minnesota clinics have reported data to the state system in the first year of required data submission, increasing by over 40 percent the number of physician clinics that reported voluntarily to MNCM. We now have a more complete picture of health care in urban and rural areas. Hospitals are also now submitting data on more than 40 quality measures.
2. risk adjustment. The information on quality builds on the work done by MNCM. The results have been risk-adjusted to reflect the complex-ity of the patients that providers serve. This requirement aims to ensure that the results are fair for all providers, regardless of the makeup of their patient populations.
Comprehensive information about health care quality is a cornerstone of our health reform initiative – which has been called “Minnesota’s Vision for a Better State of Health.” Throughout the implementation of our vi-sion, we have been working hard to achieve the “Triple Aim” of improving the health of the population, the patient experience of care and the afford-ability of health care. Quality reporting is a vital component of these
goals; if we want to truly improve our state’s health in the future, we must first have robust, fair and accurate information about the quality of health care being provided today. This information is also a critical building block of provider peer grouping (PPG), another component of the 2008 state health reform law. PPG will compare providers on a combined measure of risk-adjusted cost and quality. The risk-adjusted quality information presented in this report will be part of the peer grouping analysis. In the future, the release of these risk-adjusted results will be part of the yearly release of PPG.
I thank the providers who have been important partners as we have expanded Minnesota’s quality measurement system. I also want to thank our partners at MNCM and Minnesota’s non-profit health plans for playing a key role in developing new quality measures and supporting providers’ efforts to submit data. We also appreciate the effective collaboration with MHA, Stratis Health, the Institute for Clinical Systems Improvement and the Minnesota Medical Association in supporting providers’ efforts both to submit data and to improve quality. We have had substantive conversa-tions about these efforts, and I hope these discussions will continue as we work to improve health care value in Minnesota – and the health of all Minnesotans.
In summary, this quality report is an important stepping stone toward a value-based health care system in Minnesota – one that reflects both quality and cost. Together, those elements will provide a better picture of health care value in our state, encourage redesign of care and payment based on value and allow consumers to choose providers based on both quality and cost. With such information we can reach our vision of a bet-ter state of health care – and a better state of health.
Sincerely,
Sanne Magnan, M.D., Ph.D. Commissioner
Quality HealtH Care Measures | November 2010 | 2010 Health Care Quality Report4
Table of Contentsregion Detail . . . . . . . . . . . . . . . . . . . . . . . . . . . . . . . . . . . . . . . . . . . . . . 6
What is High Quality Care? . . . . . . . . . . . . . . . . . . . . . . . . . . . . . . . . . . . 8
Methods overview . . . . . . . . . . . . . . . . . . . . . . . . . . . . . . . . . . . . . . . . . 9
report introduction . . . . . . . . . . . . . . . . . . . . . . . . . . . . . . . . . . . . . . . . 10
physician Clinic Measures . . . . . . . . . . . . . . . . . . . . . . . . . . . . . . . . . . 12
Introduction . . . . . . . . . . . . . . . . . . . . . . . . . . . . . . . . . . . . . . . . . . 13
Quality of Care for Chronic (Ongoing) Conditions Measures . . . . 15
The Best Care for…
Adults with Diabetes . . . . . . . . . . . . . . . . . . . . . . . . . . . . 16
Adults with Vascular Disease . . . . . . . . . . . . . . . . . . . . . . 16
Adults with High Blood Pressure . . . . . . . . . . . . . . . . . . . 17
Children and Adults with Asthma . . . . . . . . . . . . . . . . . . 17
Quality of Care for Acute (Shorter Term) Conditions Measures . 18
The Best Care for…
Children with a Cold . . . . . . . . . . . . . . . . . . . . . . . . . . . . . 19
Children with a Sore Throat . . . . . . . . . . . . . . . . . . . . . . . 19
Adults with Bronchitis . . . . . . . . . . . . . . . . . . . . . . . . . . . 20
Quality of Preventive Care Measures . . . . . . . . . . . . . . . . . . . . . 21
The Best Care to…
Help Prevent Breast Cancer . . . . . . . . . . . . . . . . . . . . . . . 22
Help Prevent Cervical Cancer . . . . . . . . . . . . . . . . . . . . . 22
Help Prevent Colorectal Cancer . . . . . . . . . . . . . . . . . . . . 23

November 2010 | 2010 Health Care Quality Report | Quality HealtH Care Measures 5
Help Prevent Cancer . . . . . . . . . . . . . . . . . . . . . . 23
Detect Chlamydia . . . . . . . . . . . . . . . . . . . . . . . . . 24
Provide Childhood Immunizations . . . . . . . . . . . . 24
Table of Results . . . . . . . . . . . . . . . . . . . . . . . . . . . . . . . . . . 25
Hospital Measures . . . . . . . . . . . . . . . . . . . . . . . . . . . . . . . . . . . 48
Introduction . . . . . . . . . . . . . . . . . . . . . . . . . . . . . . . . . . . . 49
Quality of Care for Heart Conditions Measures . . . . . . . . 51
Heart Attacks . . . . . . . . . . . . . . . . . . . . . . . . . . . . . . . 51
Heart Failure . . . . . . . . . . . . . . . . . . . . . . . . . . . . . . . 56
Table of Results . . . . . . . . . . . . . . . . . . . . . . . . . . . . . 59
Quality of Care for Surgeries Measures . . . . . . . . . . . . . 61
Heart Surgeries . . . . . . . . . . . . . . . . . . . . . . . . . . . . . 61
Other Surgeries . . . . . . . . . . . . . . . . . . . . . . . . . . . . . 63
Table of Results . . . . . . . . . . . . . . . . . . . . . . . . . . . . . 66
Quality of Care for Medical Complications and
Infections Measures . . . . . . . . . . . . . . . . . . . . . . . . . . . . 68
Medical Complications . . . . . . . . . . . . . . . . . . . . . . . . 68
Infection Prevention . . . . . . . . . . . . . . . . . . . . . . . . . . 71
Table of Results . . . . . . . . . . . . . . . . . . . . . . . . . . . . . 76
Quality of Care for Other Conditions Measures . . . . . . . 78
Pneumonia . . . . . . . . . . . . . . . . . . . . . . . . . . . . . . . . . 78
Hip Fracture Treatment . . . . . . . . . . . . . . . . . . . . . . . 83
Childbirth . . . . . . . . . . . . . . . . . . . . . . . . . . . . . . . . . . 84
Table of Results . . . . . . . . . . . . . . . . . . . . . . . . . . . . . 86
appendices
AppendIx 1: physician Clinic Measures . . . . . . . . . . . . . . 88
Guide to Understanding the Detailed Measure Result Data . . . . . . . . . . . . . . . . . . . . . . . . . . . . . . . . . . . 89
Quality of Care for Chronic Conditions Measure Result Data . . . . . . . . . . . . . . . . . . . . . . . . . . . . . . . . . . . 90
Quality of Care for Acute Conditions Measure Result Data . . . . . . . . . . . . . . . . . . . . . . . . . . . . . . . . . . 136
Quality of Preventive Care Measure Result Data . . . . . 182
Methods . . . . . . . . . . . . . . . . . . . . . . . . . . . . . . . . . . . 251
AppendIx 2: Hospital Measures . . . . . . . . . . . . . . . . . . . 259
Guide to Understanding the Detailed Measure Result Data . . . . . . . . . . . . . . . . . . . . . . . . . . . . . . . . . . 260
Quality of Care for Heart Conditions Measure Result Data . . . . . . . . . . . . . . . . . . . . . . . . . . . . . . . . . . 262
Quality of Care for Heart Surgeries Measure Result Data . . . . . . . . . . . . . . . . . . . . . . . . . . . . . . . . . . 264
Quality of Care for Other Surgeries Measure Result Data . . . . . . . . . . . . . . . . . . . . . . . . . . . . . . . . . . 266
Quality of Care for Medical Complications Measure Result Data . . . . . . . . . . . . . . . . . . . . . . . . . . . 270
Quality of Infection Prevention Measure Result Data . . . . . . . . . . . . . . . . . . . . . . . . . . . . . . . . . . 272
Quality of Care for Other Conditions Measure Result Data . . . . . . . . . . . . . . . . . . . . . . . . . . . . . . . . . . 274
Methods . . . . . . . . . . . . . . . . . . . . . . . . . . . . . . . . . . . 278
Quality HealtH Care Measures | November 2010 | 2010 Health Care Quality Report6
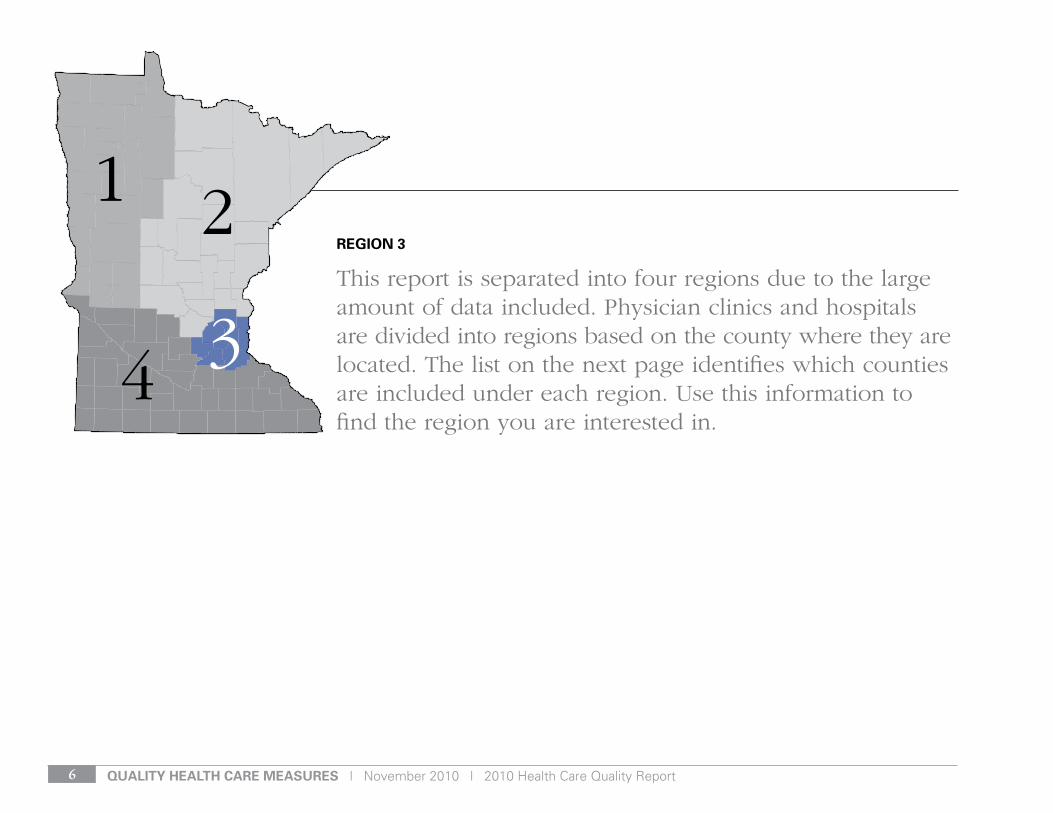
region 3
This report is separated into four regions due to the large amount of data included. Physician clinics and hospitals are divided into regions based on the county where they are located. The list on the next page identifies which counties are included under each region. Use this information to find the region you are interested in.
November 2010 | 2010 Health Care Quality Report | Quality HealtH Care Measures 7
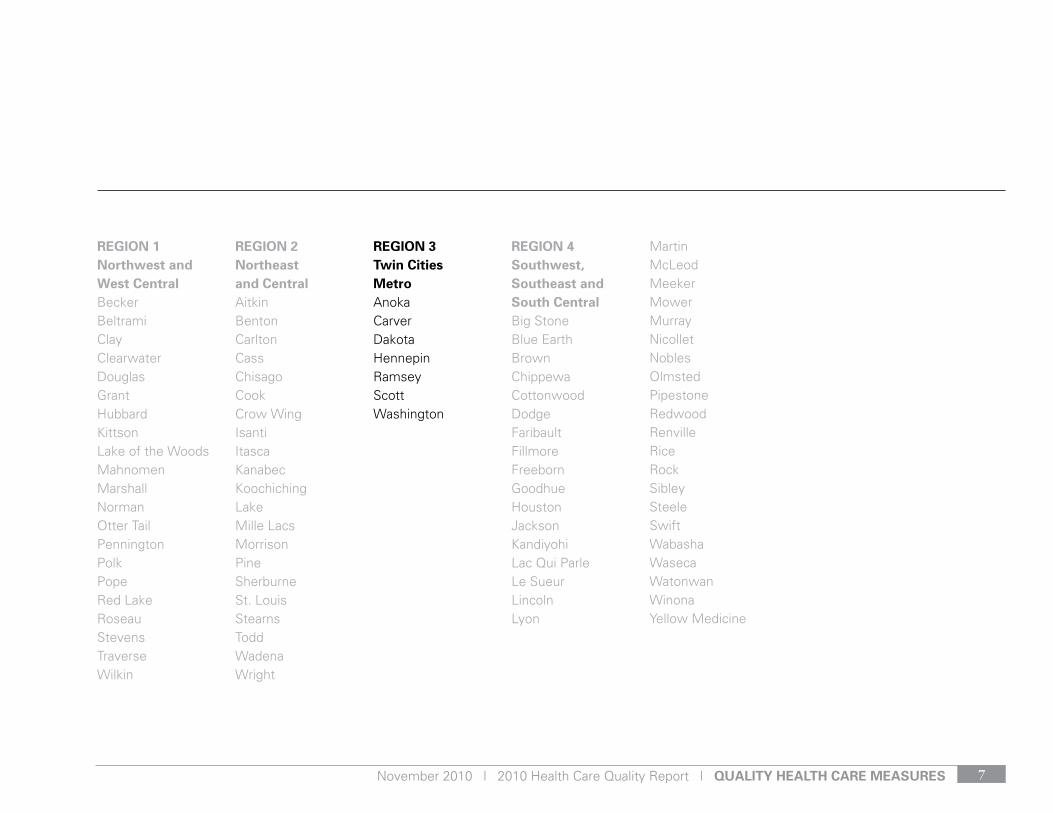
region 1northwest and West CentralBeckerBeltramiClayClearwaterDouglasGrantHubbardKittsonLake of the WoodsMahnomenMarshallNormanOtter TailPenningtonPolkPopeRed LakeRoseauStevensTraverseWilkin
region 2northeast and CentralAitkinBentonCarltonCassChisagoCookCrow WingIsantiItascaKanabecKoochichingLakeMille LacsMorrisonPineSherburneSt. LouisStearnsToddWadenaWright
region 3twin Cities MetroAnokaCarverDakotaHennepinRamseyScottWashington
region 4southwest, southeast and south CentralBig StoneBlue EarthBrownChippewaCottonwoodDodgeFaribaultFillmoreFreebornGoodhueHoustonJacksonKandiyohiLac Qui ParleLe SueurLincolnLyon
MartinMcLeodMeekerMowerMurrayNicolletNoblesOlmstedPipestoneRedwoodRenvilleRiceRockSibleySteeleSwiftWabashaWasecaWatonwanWinonaYellow Medicine
Quality HealtH Care Measures | November 2010 | 2010 Health Care Quality Report8
What is high quality health care?
High quality in health care can be described as “doing the right thing, at the right time, in the right way – and having the best possible results.”
The Institute of Medicine states that high quality health care is:
effective: Treatment uses scientific knowledge and medical experience to increase the chances of getting the best results, and decrease the chances of getting bad results, including death.
safe: Treatment does not result in medical complications or cause harm to the patient that can be prevented.
patient-centered: Doctors, nurses, and other medical staff treat patients with respect, dignity and compassion, and are responsive to patients’ needs, values, and preferences.
timely: Patients get the care they need without harmful delays.
efficient: Treatment does not waste doctors’ or patients’ time or money.
equitable: The same level of care is available to everyone, including men, women and children of all cultures, incomes, education level, social status or any other characteristics.
November 2010 | 2010 Health Care Quality Report | Quality HealtH Care Measures 9
n This report includes information about the quality of care provid-ed by physician clinics and hospitals in one region of the state. Readers may easily compare the results of a particular physician clinic or hospital with a statewide average on most measures.
n Much of the data for this report was collected as part of the Min-nesota Statewide Quality Reporting and Measurement System.
– Physician clinics are required to report data at the clinic level. Data collected directly from physician clinics included in this report relates to care provided in 2009. While participation in these data collection systems is required under state law, not all physician clinics submitted data. Those clinics are included in this report with a note they did not submit required data. For more information on which physician clinics are included, see the Physician Clinic Inclusion section on page 120.
– Hospital results are available on 43 measures. The time peri-ods covered by each measure vary; more details are available in Appendix Two.
n Results are publicly reported for those physician clinics submit-ting data on 30 or more patients for each measure, while hos-pital results are reported for those hospitals with data on 25 or more patients for each measure. These numbers are considered the minimum standards for valid public reporting and align with established reporting standards in Minnesota and at the national level. Physician clinics and hospitals that submitted data on fewer numbers of patients are included in this report with a note they did not have sufficient data for public reporting purposes.
n Some physician clinic measures were “not applicable” for a par-ticular clinic given the specialties at the clinic site and have been noted as such in this report.
n Results are risk-adjusted, meaning that results are adjusted to account for differences in patient populations that are beyond the control of a doctor or hospital. This is done in order to make results comparable regardless of patient characteristics. For example, hospital outcome measures, such as death rates for patients with a broken hip, take into account how sick individual patients are. Similarly, results for physician clinics assume that physician clinics have the same proportion of patients covered by commercial insurance, Medicare, and MN health care pro-grams or are uninsured. More details about how risk adjustment was carried out for particular categories of measures is available in Appendices One and Two.
n This report uses the terms “physician clinic” and “medical group” to describe the settings in which physicians provide medical services. For purposes of this report, a physician clinic is a specific location in which a physician practices, while a medical group may be a larger organization that includes multiple physician clinics.
n Some results are calculated at the medical group level. For those measures, each physician clinic associated with a particu-lar medical group has been given the medical group’s score for that measure. While those measure results include a broader population of patients than any one individual clinic, each indi-vidual physician clinic contributed to the medical group’s score.
n More detail about physician performance, data collection and methodology is available in Appendix One. Additional informa-tion about hospital performance, data collection and methodol-ogy is available in Appendix Two.
Methods overview

Quality HealtH Care Measures | November 2010 | 2010 Health Care Quality Report10
Quality in health care, including in doctor’s offices and hospitals, can be described as “doing the right thing, at the right time, in the right way – and having the best possible results.”
This report provides information on how well physician clinics, like your doctor’s office, and hospitals in Minnesota care for patients with a wide range of health problems. It can:
n Help you choose a hospital or physician clinic for yourself,
n Provide useful information for your loved ones if they need to visit the doctor’s office or hospital for care,
n Encourage clinics and hospitals to improve their quality, and
n Help everyone learn more about health care quality.
Why should you look at this information? Don’t people receive high quality care in all physician clinics or hospi-tals? Here are the facts:
n All clinics and hospitals do not provide the same quality of care. Some are better than others.
n A particular clinic or hospital might do a very good job on some health problems and not on other health issues.
n Your doctor, or the specialist or surgeon he or she recommends, may be highly skilled, but clinic and hospital quality also depend on how well all of the staff, such as nurses, take care of you, and on how well the clinic or hospital is organized.
n For the physician measures, some clinics do better at managing chronic or ongoing conditions than others. Some physician clin-ics may also do a better job of treating different conditions like asthma or diabetes. Keep in mind that clinics vary in how well they do at managing these different conditions.
n Whenever people go to the hospital, they risk getting a new health problem while getting medical care for an existing problem. Hospitals vary in how well they protect patients from these risks.
Health Care Quality in Minnesota
November 2010 | 2010 Health Care Quality Report | Quality HealtH Care Measures 11
Given these facts, the goal of this report is to give you information you can use to increase your chances of getting the best possible care when you need it.
How should you use this report? How can this information help you? First, you can use this informa-tion to help you choose a clinic or hospital. The physician clinic measures are for different health conditions and preventive care. If you or someone you care about has one of these conditions, you can use this information to choose a clinic. This also applies to hospitals where you can use the hospital measures to choose a hospital that’s right for you if you are being admitted to the hospital in the near future. It can help you find a clinic or hospital that is especially good at treating the conditions you face, or especially good at avoiding complications in the case of the hospital measures.
The best way to use this particular report is also to look for pat-terns in the scores. Some clinics or hospitals may do very well across the board; others may do well in some areas and not in others; still others may really show problems in a wide range of areas. Look carefully for these patterns. At the same time, if there is a particular operation, medical condition, or complication that is of particular concern to you, you will want to give more consideration to information related to those concerns.
A few things to keep in mind as you use this information: This information is a starting point for looking at the quality of care at a particular clinic or hospital. The overall scores and specific topic results are not the final word. There are a few things to keep in mind when looking at this report.
n this report doesn’t cover all conditions, preventive treat-ments, surgeries or complications.
Additional information may be included in future reports.
n Don’t presume that because a clinic or hospital does well (or poorly) in one area of health care, that it will do well (or poorly) in all areas.
Physician clinics and hospitals have strengths and weaknesses in providing different types of care.
n in some cases the specific measures track serious failures in a hospital’s performance which happen only once in a great while.
You have to be careful when comparing hospitals on these very rare events. The numbers are so small that it is hard to know when a difference means something or just happened by chance. For example, only a handful of patients experience bad reactions to a blood transfusion out of a million people each year.
n Don’t give too much weight to small differences between clinics or hospitals.
Even on more common events, be careful not to give too much weight to small differences. For example, if in one hospital, 25 people out of a thousand had too much bleeding after an opera-tion, and in another hospital, 26 people out a thousand did, that’s a really small difference and you shouldn’t worry about it.
pHysiCian CliniC Measures | November 2010 | 2010 Health Care Quality Report12
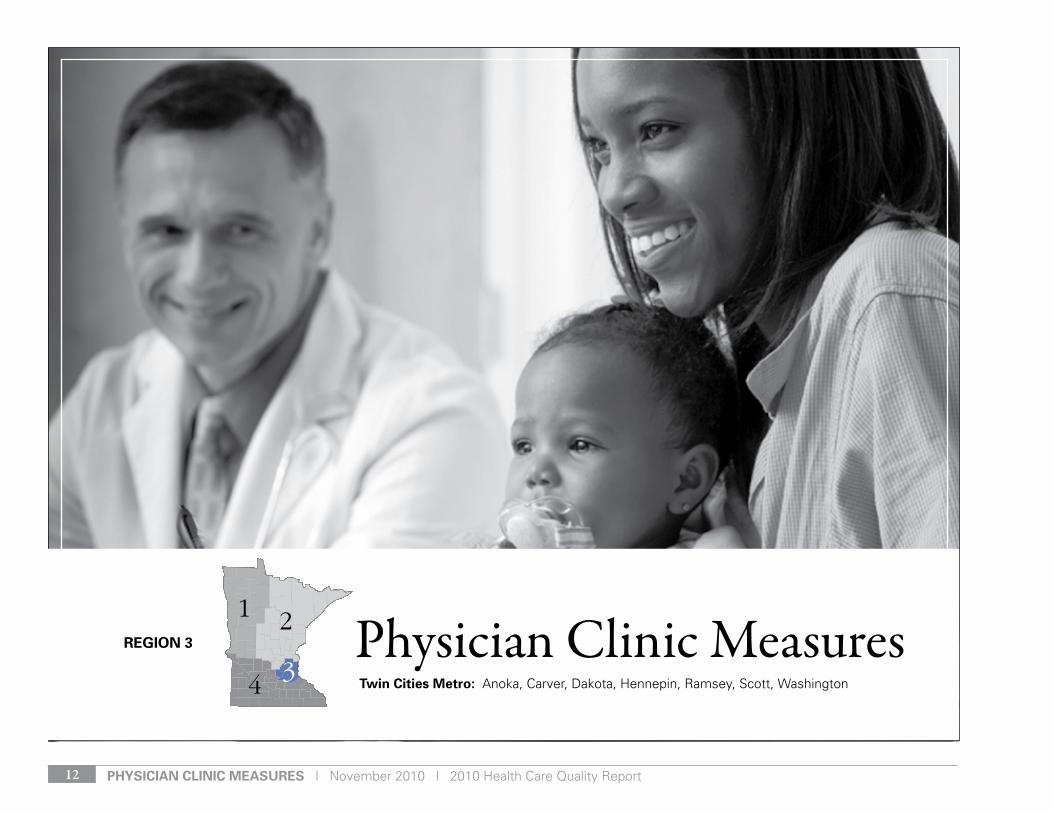
region 3
twin Cities Metro: Anoka, Carver, Dakota, Hennepin, Ramsey, Scott, Washington
Physician Clinic Measures
November 2010 | 2010 Health Care Quality Report | pHysiCian CliniC Measures 13
Quality of Care for CHroniC ConDitions . . . . . . . . . . . . . . . . . . . . . . . . . . 15
Table of Results . . . . . . . . . . . . . . . . . . . . . . . . . . . . . . . . . . . . . . . . . . . . . . . . . . . . 25
Quality of Care for aCute ConDitions . . . . . . . . . . . . . . . . . . . . . . . . . . . . 18
Table of Results . . . . . . . . . . . . . . . . . . . . . . . . . . . . . . . . . . . . . . . . . . . . . . . . . . . . 25
Quality of preventive Care . . . . . . . . . . . . . . . . . . . . . . . . . . . . . . . . . . . . . 21
Table of Results . . . . . . . . . . . . . . . . . . . . . . . . . . . . . . . . . . . . . . . . . . . . . . . . . . . . 25
Choose the health care quality topic you want to learn about. Physician clinic quality information is available for three main topics in this section. These areas include:
n Chronic Conditions (Ongoing Conditions)
n Acute Conditions (Shorter Term Illnesses)
n Preventive Care (Avoiding Illness)
One topic may be of greater interest to you than others. For ex-ample, if you or a loved one has a chronic or ongoing condition like diabetes, you will probably be interested in the “Chronic Conditions” topic. However, if you are interested in finding out how well your clinic does with keeping you healthy, check out the “Preventive Care” section.
Physician Clinic Measures

Quality HealtH Care Measures | November 2010 | 2010 Health Care Quality Report14
Each topic includes information on several different quality indica-tors. A quality indicator is information, in this case a percentage rate, that shows how often patients had a particular experience when they received medical care. These experiences reflect a par-ticular aspect of health care quality. Each health topic is briefly de-scribed below, with examples of quality indicators for that topic. To learn about all the indicators presented for each topic, please turn to the appropriate page noted in the index at the start of this section.
Chronic Conditions: Chronic conditions are ongoing and cannot be cured, but can be managed with the right kinds of treatments. This section includes measures related to chronic conditions like diabe-tes, vascular care, high blood pressure, and asthma.
acute Conditions: Acute conditions are illnesses that don’t last very long, typically less than three months. This section includes measures for the treatment of acute conditions like colds and sore throats in children, as well as bronchitis in adults.
preventive Care: Preventive care can help keep you healthy, as well as detect certain illnesses early, when treatment can be more effective. This section includes preventive measures like cancer screenings, chlamydia tests, and childhood immunizations.
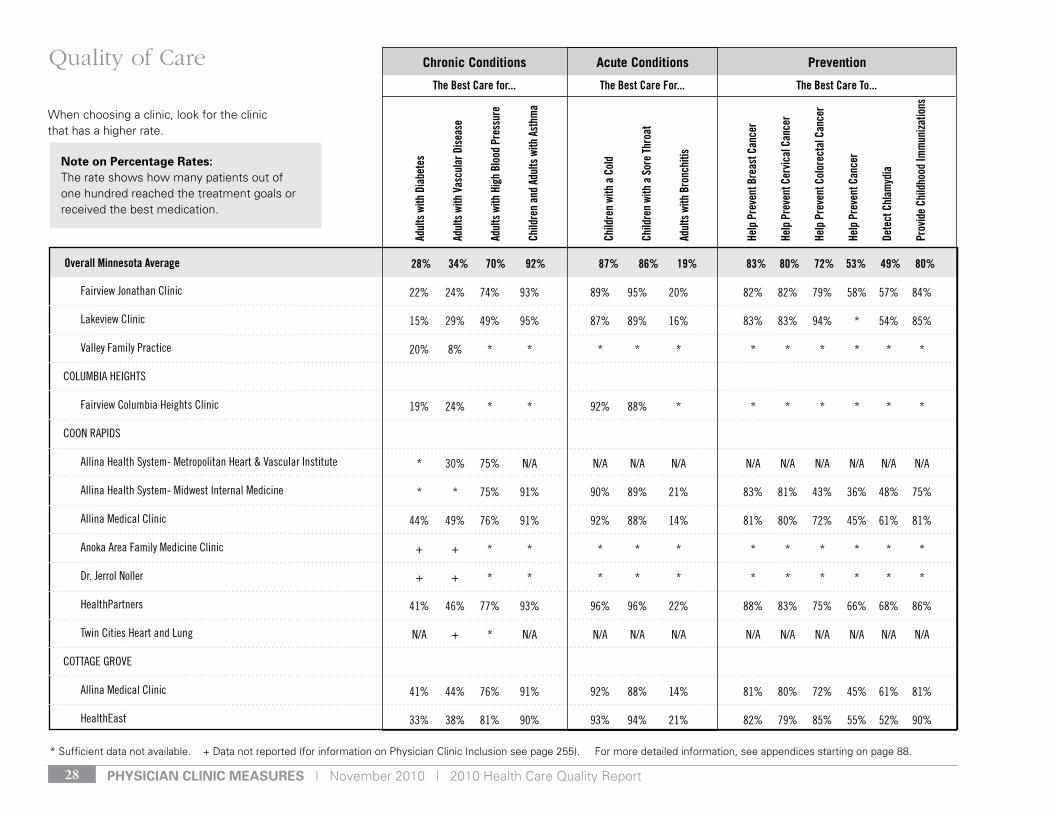
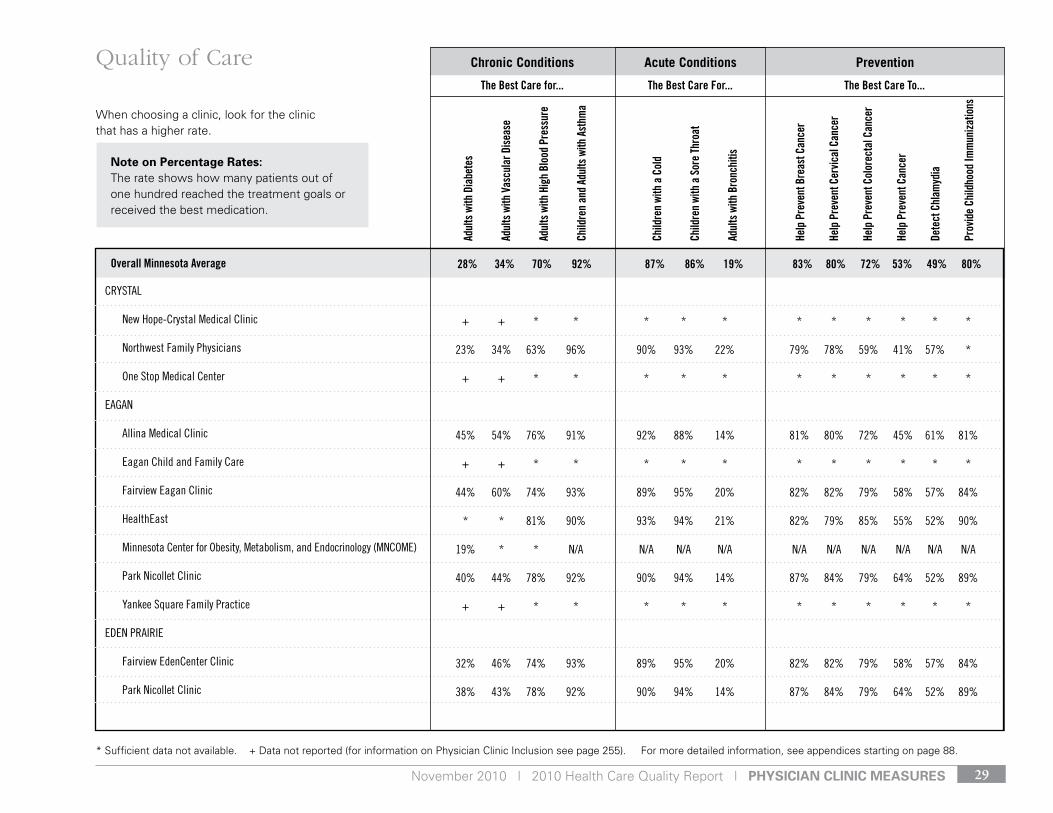
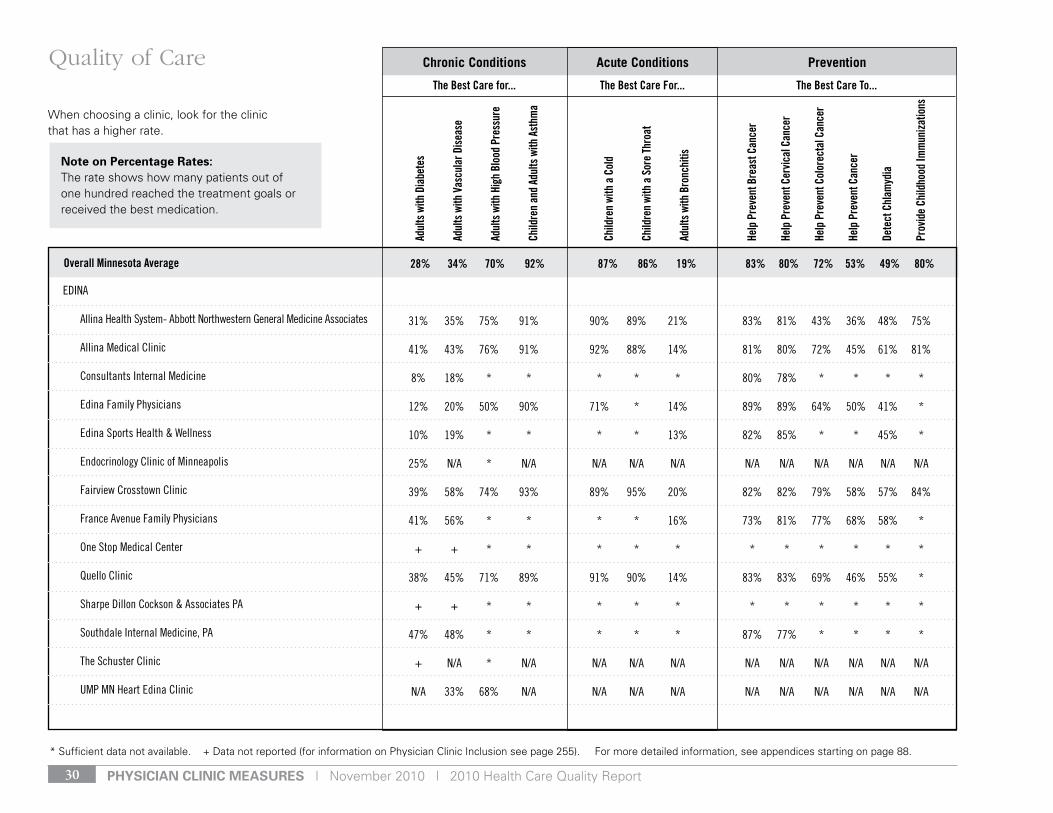
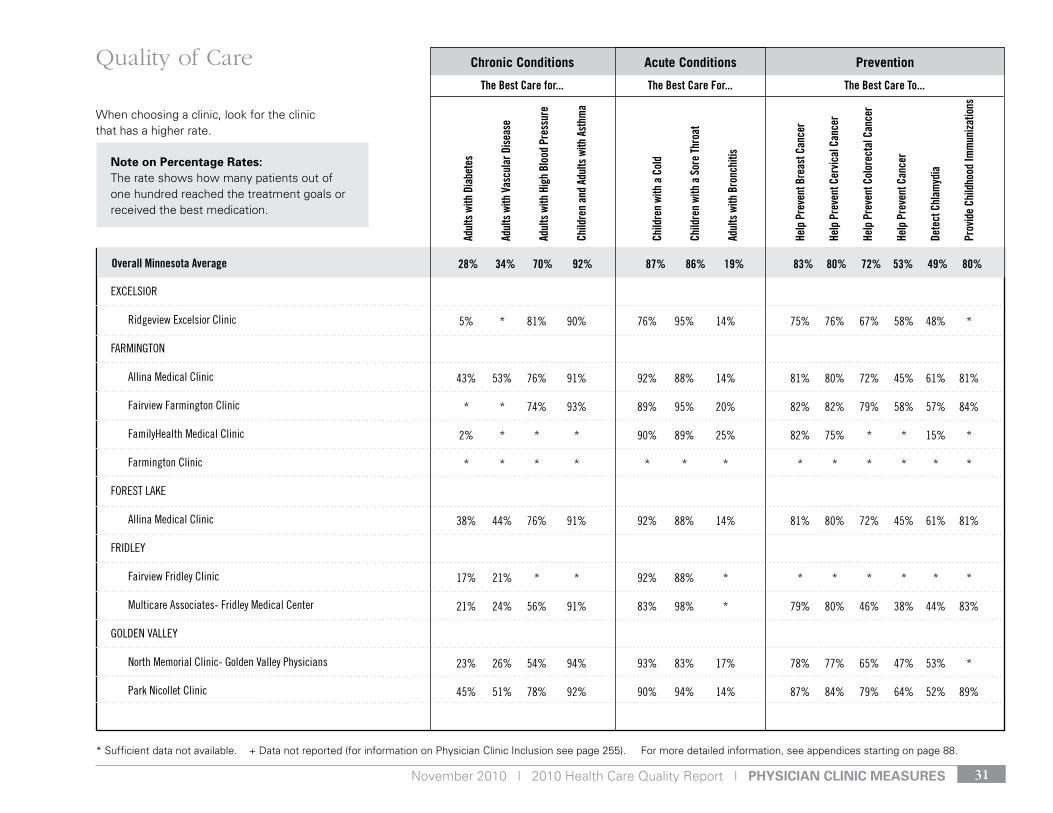
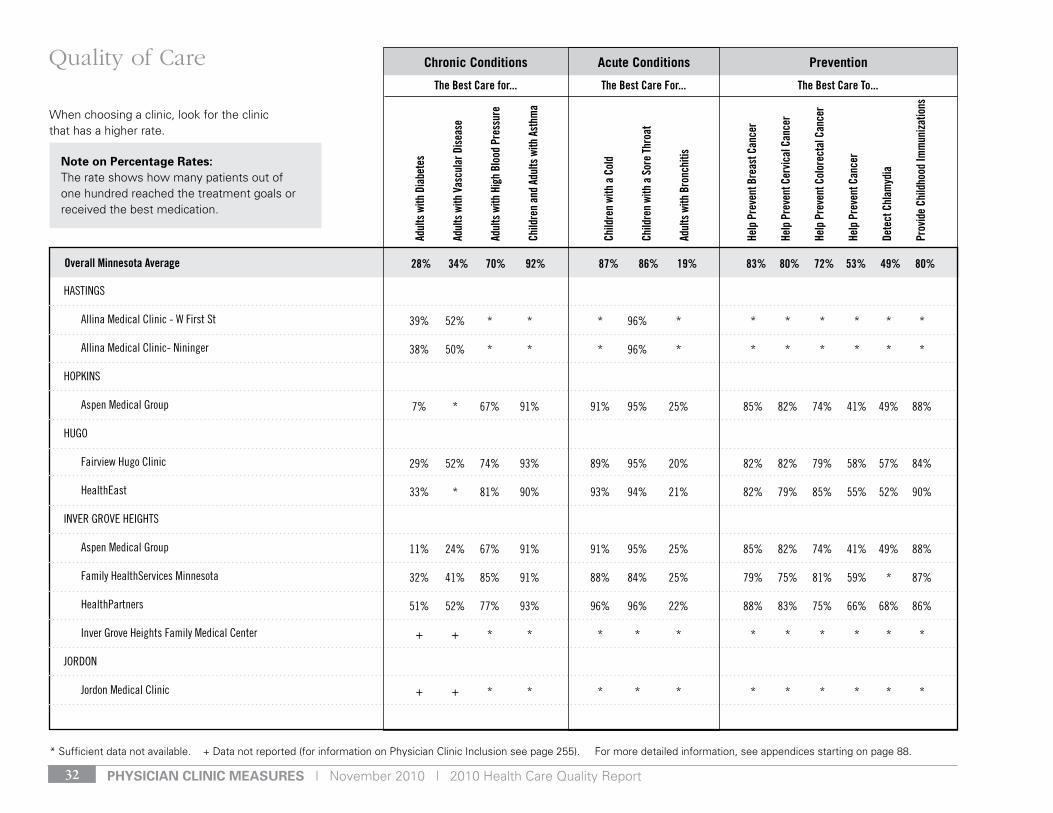
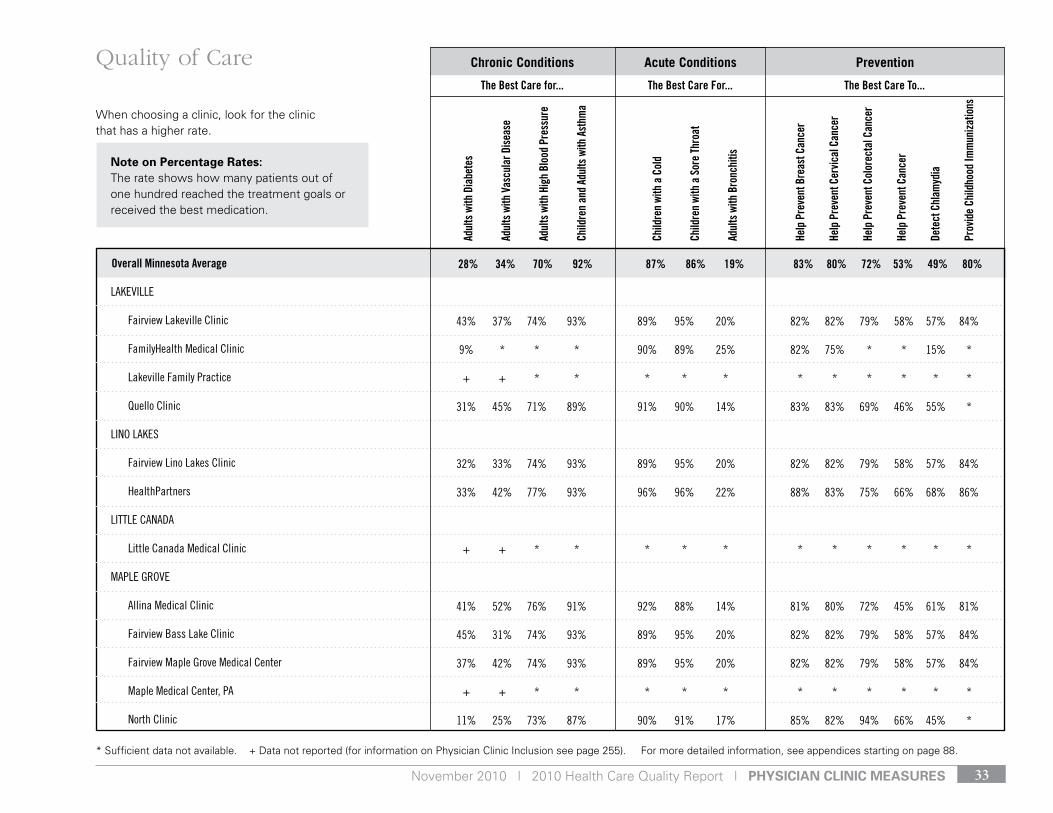
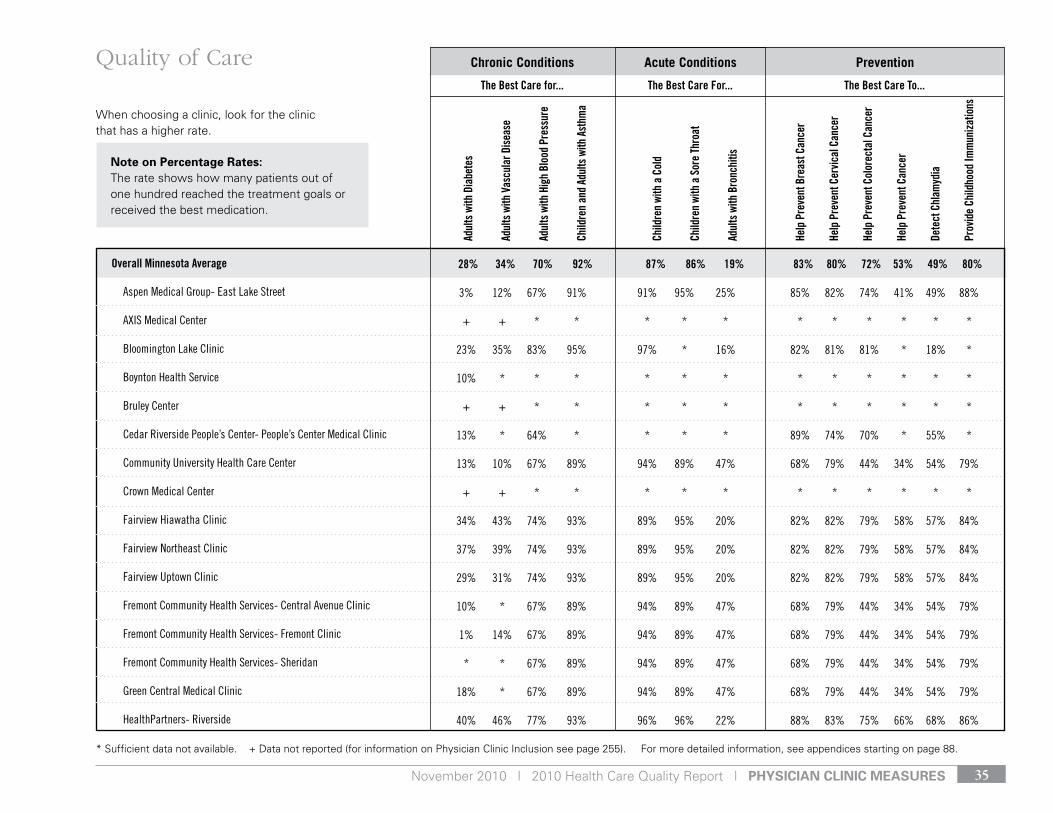
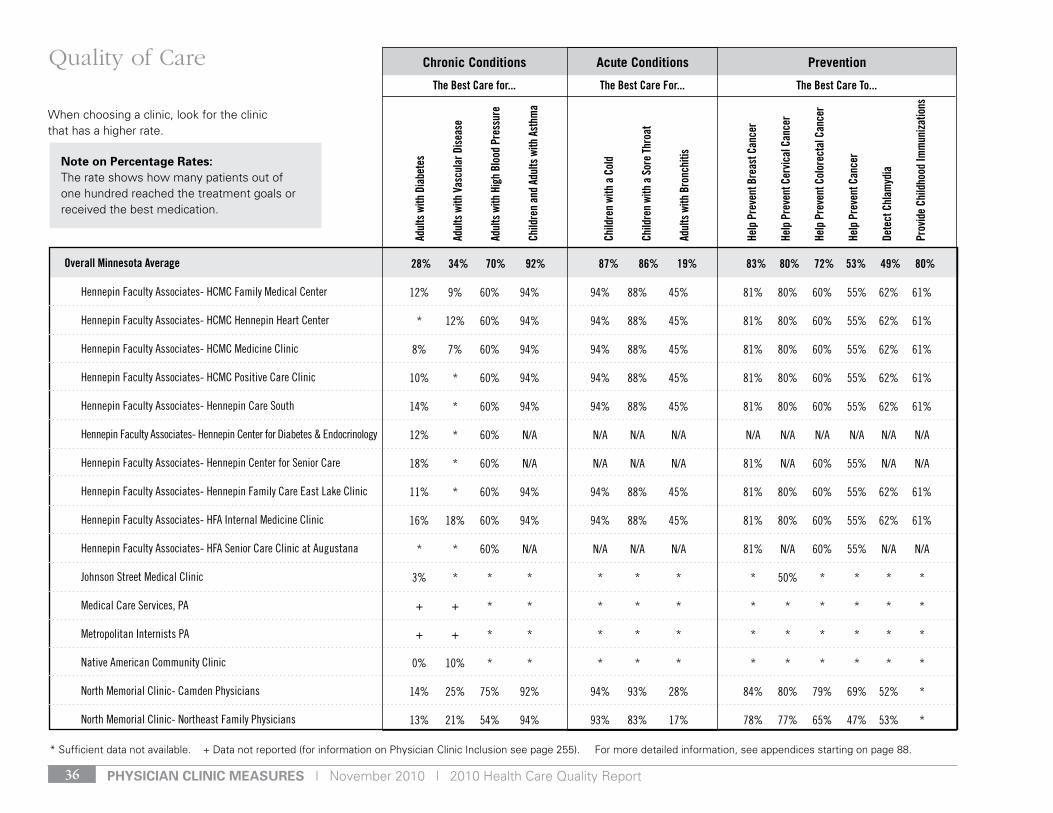
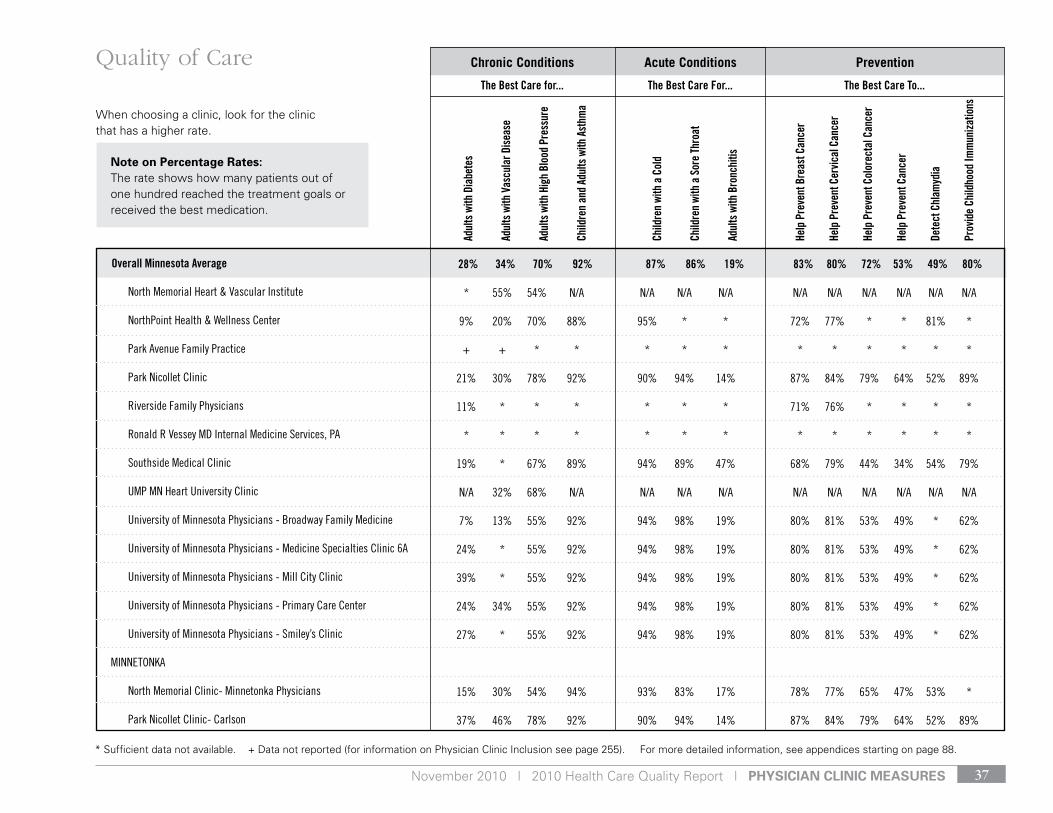
More Information about the ResultsBe sure to note whether a higher or lower percentage rate is bet-ter for the measure you are interested in. for all of the physician clinic measures, a higher percentage rate is always going to be better. Keep in mind the percentage rate is related to how many patients out of one hundred reached the treatment goals, or received the right type of medication. For example, if the clinic rate for the “Best Care for Adults with Diabetes” measure is 36%, this means 36 out of 100 patients achieved the five goals outlined in this measure.
November 2010 | 2010 Health Care Quality Report | pHysiCian CliniC Measures 15
Quality of Care for Chronic Conditions
Quality of Care for CHroniC ConDitions seCtion Contents
The Best Care for Adults with Diabetes . . . . . . . . . . . . . . . . . . . . . . . . . . . . 16
The Best Care for Adults with Vascular Disease . . . . . . . . . . . . . . . . . . . . . . 16
The Best Care for Adults with High Blood Pressure . . . . . . . . . . . . . . . . . . . 17
The Best Care for Children and Adults with Asthma . . . . . . . . . . . . . . . . . . . 17
Table of Results . . . . . . . . . . . . . . . . . . . . . . . . . . . . . . . . . . . . . . . . . . . . . . . 25
Appendix Table . . . . . . . . . . . . . . . . . . . . . . . . . . . . . . . . . . . . . . . . . . . . . . . . 90
Chronic health conditions are ongoing health conditions like diabetes or heart disease. These conditions are preva-lent and costly. For example, in 2007 about 7.8% of the US population had diabetes. This translates to a cost of $174 billion in direct costs like medical expenses, and indirect costs like disability and work loss. Not only are these con-ditions expensive, but they can be difficult to manage and lead to other medical conditions. However, there are treat-ments and treatment goals which have been proven to help those with chronic conditions stay healthy and limit their risk of other complications. The following section includes measures that help patients with chronic conditions stay healthy.

pHysiCian CliniC Measures | November 2010 | 2010 Health Care Quality Report16
The Best Care for Adults with Diabetes
What is the measure?The best care for diabetes includes helping patients achieve five goals. This measure shows the percentage of diabetes patients, ages 18-75, who met all five goals:
1) Blood Sugar Control: Most recent HbA1C test in the last 12 months has a level of less than 8%
2 Blood Pressure Control: Most recent blood pressure in the last 12 months was less than 130/80 mm Hg
3) Cholesterol Control: Most recent LDL or “bad” cholesterol was less than 100 mg/dl
4) Daily aspirin use (or a documented contraindication) for those ages 41 or older
5) Tobacco free status: No smoking or chewing of tobacco
Why is this important?The five goals identified in this measure have been shown to have the greatest impact on the health of those with diabetes. Heart disease and stroke are the leading causes of early death among people with diabetes. Those diabetes patients who meet the five goals outlined in this measure will greatly lower their risk of heart attacks, blood vessel damage and other vas-cular diseases. They will also experience fewer problems with their kidneys, eyes and nervous system.
performance on this measure ranged from zero percent to 57 percent.
Measure sourCe: optimal Diabetes Care Composite
The Best Care for Adults with Vascular Disease
What is the measure?The best care for vascular disease includes helping patient achieve four goals. This measure shows the percentage of vascular patients ages 18-75, who met all four goals:
1) Blood Pressure Control: Most recent blood pressure in the last 12 months was less than 130/80 mm Hg
2) Cholesterol Control: Most recent LDL or “bad” cholesterol was less than 100 mg/dl
3) Daily aspirin use (or a documented contraindication) 4) Tobacco Free Status: No smoking or chewing of tobacco
Why is this important? Vascular disease is any condition that affects the blood vessels and limits their ability to supply blood, oxygen and nutrients to the body from the heart. Vascular disease is most commonly due to hardening of the arteries or the slow build-up of fatty substances over time along the blood vessel wall, which make it harder for the heart to pump blood through the artery. De-pending on which arteries become blocked, different parts of the body can be affected by this reduction in blood flow, which is also called ischemia. A blockage in the coronary arteries, or the blood vessels of the heart, can lead to chest pain or a heart attack. Achieving the four treatment goals in this measure will help stop the build-up of fatty substances along the blood vessel wall that make it harder for the heart to pump blood.
performance on this measure ranged from zero percent to 63 percent.
Measure sourCe: optimal vascular Care Composite
When choosing a clinic, look for the clinic that has a
higher rate.
When choosing a clinic, look for the clinic that has a
higher rate.
November 2010 | 2010 Health Care Quality Report | pHysiCian CliniC Measures 17
When choosing a clinic, look for the clinic that has a
higher rate.
When choosing a clinic, look for the clinic that has a
higher rate.
The Best Care for Adults with High Blood Pressure
What is the measure?The best treatment for high blood pressure includes keeping blood pressure below 140/90 mmHg. This measure shows the percentage of adults, ages 18-85, diagnosed with high blood pressure that had a blood pressure reading lower than 140/90 mmHg.
Why is this important?High blood pressure, also known as hypertension, is a major risk factor for other diseases including heart attack, heart disease, kidney failure and stroke. Having your blood pressure monitored regularly and working with your doctor to keep your blood pres-sure below 140/90 mmHg can reduce your risk of developing these conditions.
High blood pressure is often called the “silent killer” because many people don’t know they have it. The only way to know is to have your blood pressure checked.
performance on this measure ranged from 34 percent to 85 percent.
Measure sourCe: HeDis: Controlling High Blood pressure
The Best Care for Children and Adults with Asthma
What is the measure?The best treatment for asthma includes a prescription medica-tion (such as an inhaler) to control the symptoms. This measure shows the percentage of asthma patients, ages 5-56, who were prescribed appropriate medication.
Why is this important? Asthma is one of the most common chronic conditions in the United States. It causes the tiny airways that bring air to the lungs to narrow, reducing the flow of oxygen to the body. For asthma sufferers, a trigger such as cigarette smoke, perfume, allergies or dust in the air can cause the tiny airways to constrict, choking the flow of oxygen to the body’s systems. Symptoms of asthma include difficulty breathing or shortness of breath, a tight feeling in the chest, coughing and wheezing. Inhaled corticosteroids are the recommended therapy for those with moder-ate to severe asthma. When used regularly they are proven to reduce the inflammation in the airways caused by asthma.
performance on this measure ranged from 81 percent to 97 percent.
Measure sourCe: HeDis: use of appropriate Medications for people
with asthma
pHysiCian CliniC Measures | November 2010 | 2010 Health Care Quality Report18
Quality of Care for Acute Conditions
Quality of Care for aCute ConDitions seCtion Contents
The Best Care for Children with a Cold . . . . . . . . . . . . . . . . . . . . . . . . . . . . . 19
The Best Care for Children with a Sore Throat . . . . . . . . . . . . . . . . . . . . . . . 19
The Best Care for Adults with Bronchitis . . . . . . . . . . . . . . . . . . . . . . . . . . . . 20
Table of Results . . . . . . . . . . . . . . . . . . . . . . . . . . . . . . . . . . . . . . . . . . . . . . . 25
Appendix Table . . . . . . . . . . . . . . . . . . . . . . . . . . . . . . . . . . . . . . . . . . . . . . . 136
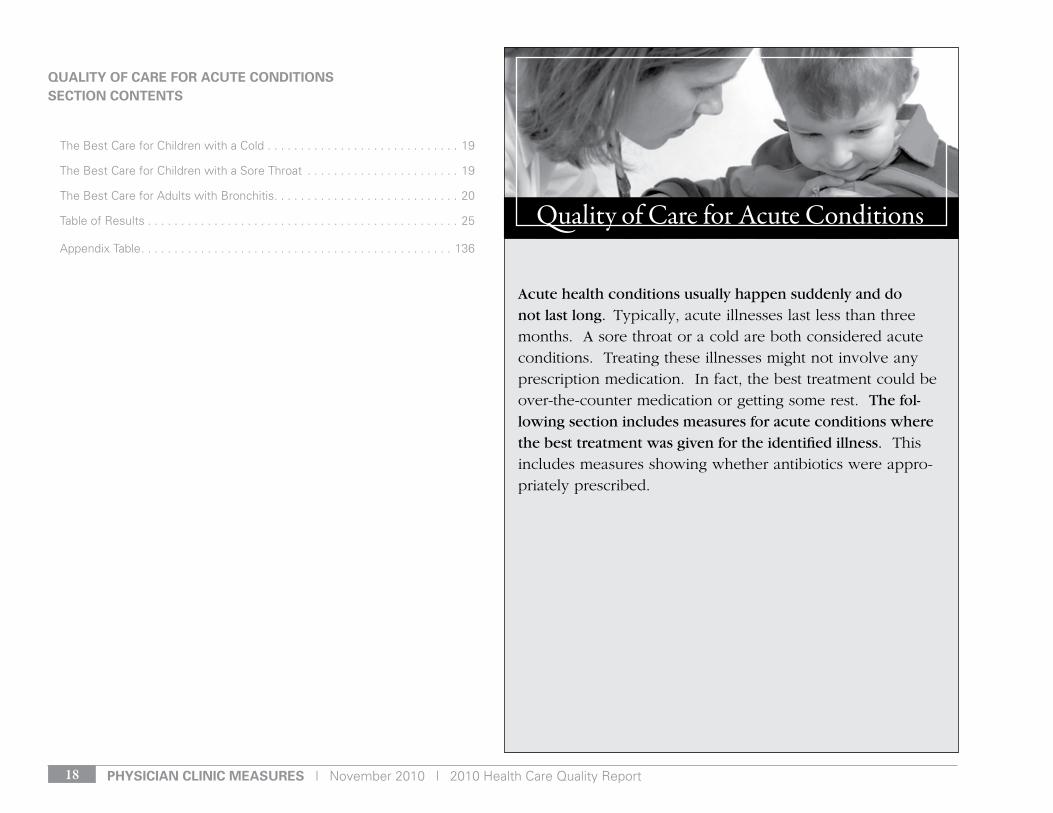
Acute health conditions usually happen suddenly and do not last long. Typically, acute illnesses last less than three months. A sore throat or a cold are both considered acute conditions. Treating these illnesses might not involve any prescription medication. In fact, the best treatment could be over-the-counter medication or getting some rest. The fol-lowing section includes measures for acute conditions where the best treatment was given for the identified illness. This includes measures showing whether antibiotics were appro-priately prescribed.
November 2010 | 2010 Health Care Quality Report | pHysiCian CliniC Measures 19
When choosing a clinic, look for the clinic that has a
higher rate.
When choosing a clinic, look for the clinic that has a
higher rate.
The Best Care for Children with a Cold
What is the measure?Treatment of the common cold should not include prescribing antibiotics. This measure shows the percentage of children, 3 months to 18 years, diagnosed with a cold and not given an antibiotic.
Why is this important?The most effective cure for the common cold is self-care at home. This can include over-the-counter medication, drinking fluids, and getting plenty of rest. There are over 200 viruses which can cause this illness, and antibiotics are not effective against viruses such as colds.
Remember, antibiotics are medicines that kill bacteria, not vi-ruses. Taking antibiotics for viral illnesses, like the common cold, will not work. Even worse, using antibiotics when they are not needed may make them less likely to work for other illnesses in the future.
performance on this measure ranged from 40 percent to 97 percent.
Measure sourCe: HeDis: appropriate treatment for Children with
upper respiratory infection
The Best Care for Children with a Sore Throat
What is the measure?In some cases, the treatment of a sore throat includes prescrib-ing antibiotics. This measure shows the percentage of children, ages 2-18, diagnosed with a sore throat and given a strep test and antibiotics rather than just receiving antibiotics without a strep test.
Why is this important? Most sore throats are caused by viruses and go away on their own after about a week. Sore throats not caused by viruses are usually caused by a bacterium called group A Streptococcus, and commonly called strep throat. Strep throat can be treated with antibiotics. Untreated strep throat can lead to rare but serious complications.
performance on this measure ranged from 27 percent to 99 percent.
Measure sourCe: HeDis: appropriate testing for Children with
pharyngitis

pHysiCian CliniC Measures | November 2010 | 2010 Health Care Quality Report20
When choosing a clinic, look for the clinic that has a
higher rate.
The Best Care for Adults with Bronchitis
What is the measure?Treatment of bronchitis in adults should not include prescribing antibiotics. This measure shows the percentage of adults 18 - 64 years, diagnosed with acute bron-chitis and not given an antibiotic.
Why is this important?Acute bronchitis is sometimes also called a chest cold. The most effec-tive cure for acute bronchitis is similar to when you have a cold. It can include over-the-counter medication to help quiet your cough, drinking fluids and getting plenty of rest.
Antibiotics are medicines that kill bacteria. Only one in ten cases of bronchitis are bacterial, which means 9 out of 10 cases of bronchitis won’t be cured with an antibiotic. Also, using antibi-otics when they are not needed may make them less likely to work for other illnesses in the future.
performance on this measure ranged from seven percent to 57 percent.
Measure sourCe: HeDis: avoidance of antibiotic treatment in adults
with acute Bronchitis

November 2010 | 2010 Health Care Quality Report | pHysiCian CliniC Measures 21
Quality of Preventive Care
Quality of preventive Care seCtion Contents
The Best Care to Help Prevent Breast Cancer . . . . . . . . . . . . . . . . . . . . . . . . 22
The Best Care to Help Prevent Cervical Cancer . . . . . . . . . . . . . . . . . . . . . . 22
The Best Care to Help Prevent Colorectal Cancer . . . . . . . . . . . . . . . . . . . . . 23
The Best Care to Help Prevent Cancer . . . . . . . . . . . . . . . . . . . . . . . . . . . . . 23
The Best Care to Detect Chlamydia . . . . . . . . . . . . . . . . . . . . . . . . . . . . . . . . 24
The Best Care to Provide Childhood Immunizations . . . . . . . . . . . . . . . . . . . 24
Table of Results . . . . . . . . . . . . . . . . . . . . . . . . . . . . . . . . . . . . . . . . . . . . . . . 25
Appendix Table . . . . . . . . . . . . . . . . . . . . . . . . . . . . . . . . . . . . . . . . . . . . . . . 182
Preventive care keeps you healthy by avoiding an illness altogether or detecting it early when treatment can be most effective. Receiving the right screenings and treatments are an important part of health care quality. For example, cancer screenings done at the right time can help detect abnormal cells early before they turn into cancer. The following section includes preventive care measures where the right screenings or treatments were given at the right time for the identified illness.
pHysiCian CliniC Measures | November 2010 | 2010 Health Care Quality Report22
When choosing a clinic, look for the clinic that has a
higher rate.
When choosing a clinic, look for the clinic that has a
higher rate.
The Best Care to Help Prevent Breast Cancer
What is the measure?Women of a certain age should get a regular mammogram to check for signs of breast cancer. This measure shows the percentage of women, ages 52-69, who had a mammogram during the past two years.
Why is this important?A mammogram is the screening test used to check for breast cancer. It detects cancer early, when it can be treated most successfully. Breast can-cer is the most common cancer affecting women in the United States. It is also the second leading cause of cancer death in women.
performance on this measure ranged from 55 percent to 91 percent.
Measure sourCe: HeDis: Breast Cancer screening
The Best Care to Help Prevent Cervical Cancer
What is the measure?Prevention of cervical cancer in women includes getting a regular Pap test. This measure shows the percentage of wom-en, ages 24-64, who received a Pap test in the last 3 years.
Why is this important? Cervical cancer develops slowly. Getting regular screenings can lead to early detection and successful treatment. Screening is done using Pap tests in which cells are taken from the cervix. The cells are then examined for abnormalities.
performance on this measure ranged from 50 percent to 89 percent.
Measure sourCe: HeDis: Cervical Cancer
screening

November 2010 | 2010 Health Care Quality Report | pHysiCian CliniC Measures 23
The Best Care to Help Prevent Colorectal Cancer
What is the measure?Adults of a certain age should receive a test to check for col-orectal cancer. This measure shows the percentage of adults, ages 51-80, who received one or more of four proven screening tests:
n Fecal occult blood test n Flexible sigmoidoscopy n Double contrast barium enema n Colonoscopy
Why is this important?Most colorectal cancer begins as a polyp. A polyp is a growth projecting from the colon or rectum. Polyps can be detected during screening exams. The removal of the polyp can be the key to preventing colon cancer.
performance on this measure ranged from 43 percent to 94 percent.
Measure sourCe: HeDis: Colorectal Cancer screening
The Best Care to Help Prevent Cancer
What is the measure?Tests to check for cancer are an important part of preventive care for people of a certain age. This measure shows the per-centage of adults, ages 51-80, who received appropriate cancer tests.
For women, this measure includes getting tested for:n Breast cancern Cervical cancer, and n Colorectal cancer
For men, this measure includes getting tested for:n Colorectal cancer
Why is this important? Cancer is the result of uncontrolled growth and spread of abnor-mal cells. Each type of cancer varies in how fast it grows and how it may spread in the body. The causes of cancer are com-plex and they may involve the individual’s inherited genetics, as well as outside factors such as exposure to chemicals, smoke and the sun. Getting the right cancer screenings can catch the cancer early, leading to more successful treatment.
performance on this measure ranged from 15 percent to 89 percent.
Measure sourCe: HeDis: Cancer screening Combined
When choosing a clinic, look for the clinic that has a
higher rate. When choosing a clinic, look for the clinic that has a
higher rate.
pHysiCian CliniC Measures | November 2010 | 2010 Health Care Quality Report24
The Best Care to Detect Chlamydia
What is the measure?Testing for Chlamydia is important for the health of teenage and young women who are having sex. This measure shows the percentage of sexually-active females, ages 16-25, who re-ceived a Chlamydia test.
Why is this important?Chlamydia is the most common sexually-transmitted infection in the United States. Many infected people have no symptoms. If left untreated, it can lead to infertility, or complications during pregnancy.
performance on this measure ranged from 15 percent to 81 percent.
Measure sourCe: HeDis: Chlamydia screening in Women
The Best Care to Provide Childhood Immunizations
What is the measure?Protecting children from diseases involves getting important shots (vaccinations) when they will do the most good. This mea-sure shows the percentage of children who received all of these vaccinations by the age of two:
n Diphtheria and Tetanusn Polion Measles, Mumps and Rubella n H Influenza Type B n Hepatitis B n Chicken Pox n Pneumococcal
Why is this important? Before immunizations, infectious diseases often harmed or even killed infants, children and adults. While some of these diseases have been greatly reduced or even eliminated, these diseases could return and spread if children are not immunized against them. It is important that vaccinations are given at the right time for them to work the best.
performance on this measure ranged from 54 percent to 92 percent.
Measure sourCe: HeDis: Childhood immunization status
When choosing a clinic, look for the clinic that has a
higher rate. When choosing a clinic, look for the clinic that has a
higher rate.
November 2010 | 2010 Health Care Quality Report | pHysiCian CliniC Measures 25
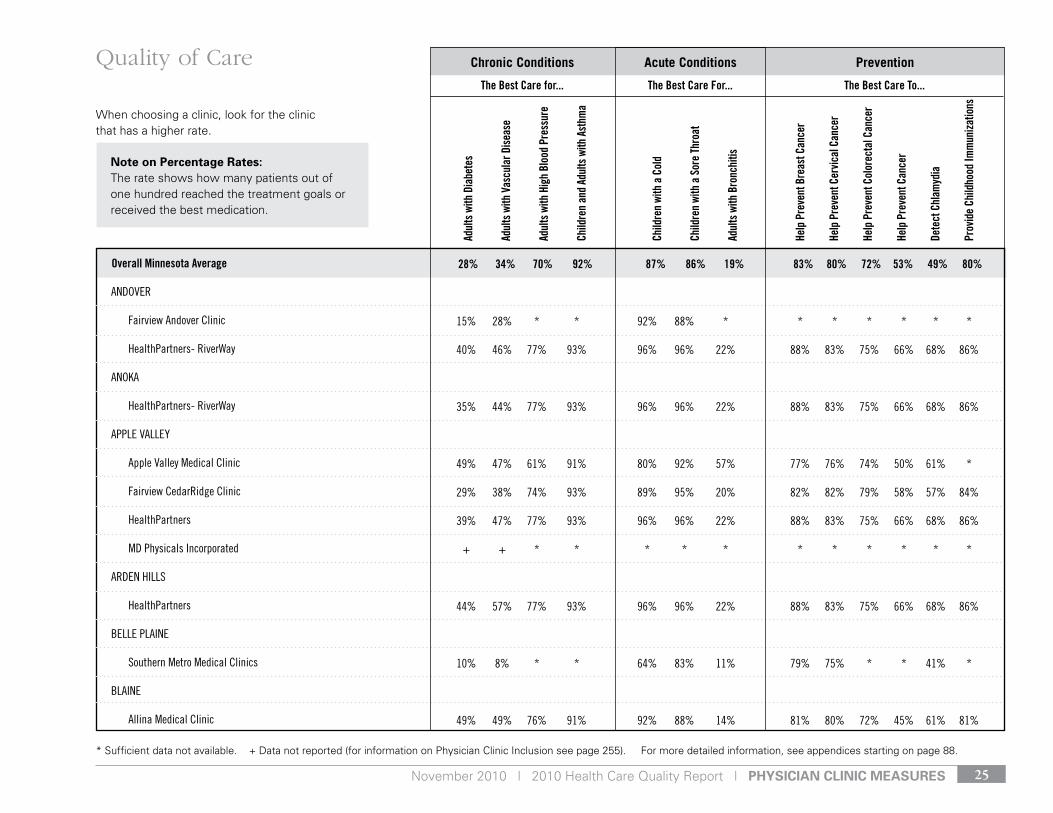
Overall Minnesota Average 28% 34% 70% 92% 87% 86% 19% 83% 80% 72% 53% 49% 80%
Andover
Fairview Andover Clinic
HealthPartners- riverWay
AnokA
HealthPartners- riverWay
APPle vAlley
Apple valley Medical Clinic
Fairview Cedarridge Clinic
HealthPartners
Md Physicals Incorporated
Arden HIlls
HealthPartners
Belle PlAIne
southern Metro Medical Clinics
BlAIne
Allina Medical Clinic
* Sufficient data not available. + Data not reported (for information on Physician Clinic Inclusion see page 255). For more detailed information, see appendices starting on page 88.
Chronic Conditions PreventionAcute Conditions
The Best Care for... The Best Care For... The Best Care To...
When choosing a clinic, look for the clinic that has a higher rate.
15% 28% * * 92% 88% * * * * * * *
40% 46% 77% 93% 96% 96% 22% 88% 83% 75% 66% 68% 86%
35% 44% 77% 93% 96% 96% 22% 88% 83% 75% 66% 68% 86%
49% 47% 61% 91% 80% 92% 57% 77% 76% 74% 50% 61% *
29% 38% 74% 93% 89% 95% 20% 82% 82% 79% 58% 57% 84%
39% 47% 77% 93% 96% 96% 22% 88% 83% 75% 66% 68% 86%
+ + * * * * * * * * * * *
44% 57% 77% 93% 96% 96% 22% 88% 83% 75% 66% 68% 86%
10% 8% * * 64% 83% 11% 79% 75% * * 41% *
49% 49% 76% 91% 92% 88% 14% 81% 80% 72% 45% 61% 81%
Adul
ts w
ith D
iabe
tes
Adul
ts w
ith V
ascu
lar D
iseas
e
Adul
ts w
ith H
igh
Bloo
d Pr
essu
re
Child
ren
and
Adul
ts w
ith A
sthm
a
Child
ren
with
a C
old
Child
ren
with
a S
ore
Thro
at
Adul
ts w
ith B
ronc
hitis
Help
Pre
vent
Bre
ast C
ance
r
Help
Pre
vent
Cer
vical
Can
cer
Help
Pre
vent
Col
orec
tal C
ance
r
Help
Pre
vent
Can
cer
Dete
ct C
hlam
ydia
Prov
ide
Child
hood
Imm
uniza
tions
Quality of Care
note on percentage rates:The rate shows how many patients out of one hundred reached the treatment goals or received the best medication.
pHysiCian CliniC Measures | November 2010 | 2010 Health Care Quality Report26
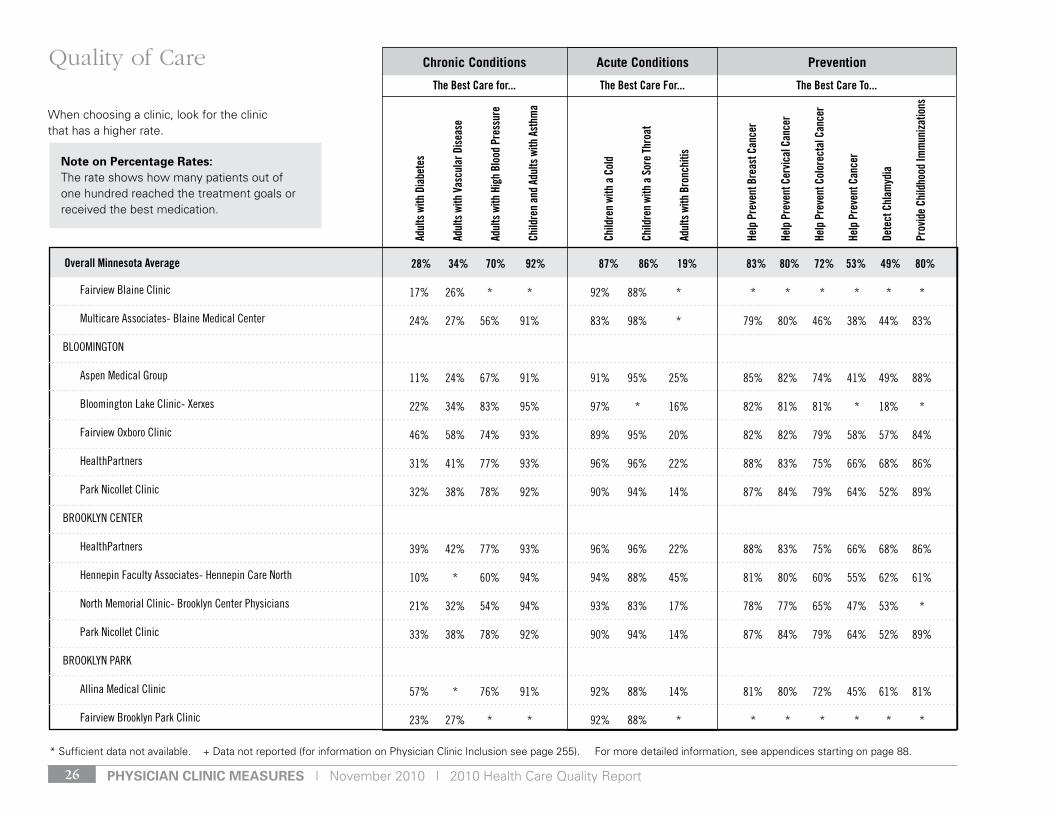
Overall Minnesota Average 28% 34% 70% 92% 87% 86% 19% 83% 80% 72% 53% 49% 80%
Fairview Blaine Clinic
Multicare Associates- Blaine Medical Center
BlooMIngton
Aspen Medical group
Bloomington lake Clinic- Xerxes
Fairview oxboro Clinic
HealthPartners
Park nicollet Clinic
Brooklyn Center
HealthPartners
Hennepin Faculty Associates- Hennepin Care north
north Memorial Clinic- Brooklyn Center Physicians
Park nicollet Clinic
Brooklyn PArk
Allina Medical Clinic
Fairview Brooklyn Park Clinic
* Sufficient data not available. + Data not reported (for information on Physician Clinic Inclusion see page 255). For more detailed information, see appendices starting on page 88.
Chronic Conditions PreventionAcute Conditions
The Best Care for... The Best Care For... The Best Care To...
When choosing a clinic, look for the clinic that has a higher rate.
17% 26% * * 92% 88% * * * * * * *
24% 27% 56% 91% 83% 98% * 79% 80% 46% 38% 44% 83%
11% 24% 67% 91% 91% 95% 25% 85% 82% 74% 41% 49% 88%
22% 34% 83% 95% 97% * 16% 82% 81% 81% * 18% *
46% 58% 74% 93% 89% 95% 20% 82% 82% 79% 58% 57% 84%
31% 41% 77% 93% 96% 96% 22% 88% 83% 75% 66% 68% 86%
32% 38% 78% 92% 90% 94% 14% 87% 84% 79% 64% 52% 89%
39% 42% 77% 93% 96% 96% 22% 88% 83% 75% 66% 68% 86%
10% * 60% 94% 94% 88% 45% 81% 80% 60% 55% 62% 61%
21% 32% 54% 94% 93% 83% 17% 78% 77% 65% 47% 53% *
33% 38% 78% 92% 90% 94% 14% 87% 84% 79% 64% 52% 89%
57% * 76% 91% 92% 88% 14% 81% 80% 72% 45% 61% 81%
23% 27% * * 92% 88% * * * * * * *
Adul
ts w
ith D
iabe
tes
Adul
ts w
ith V
ascu
lar D
iseas
e
Adul
ts w
ith H
igh
Bloo
d Pr
essu
re
Child
ren
and
Adul
ts w
ith A
sthm
a
Child
ren
with
a C
old
Child
ren
with
a S
ore
Thro
at
Adul
ts w
ith B
ronc
hitis
Help
Pre
vent
Bre
ast C
ance
r
Help
Pre
vent
Cer
vical
Can
cer
Help
Pre
vent
Col
orec
tal C
ance
r
Help
Pre
vent
Can
cer
Dete
ct C
hlam
ydia
Prov
ide
Child
hood
Imm
uniza
tions
Quality of Care
note on percentage rates:The rate shows how many patients out of one hundred reached the treatment goals or received the best medication.
November 2010 | 2010 Health Care Quality Report | pHysiCian CliniC Measures 27
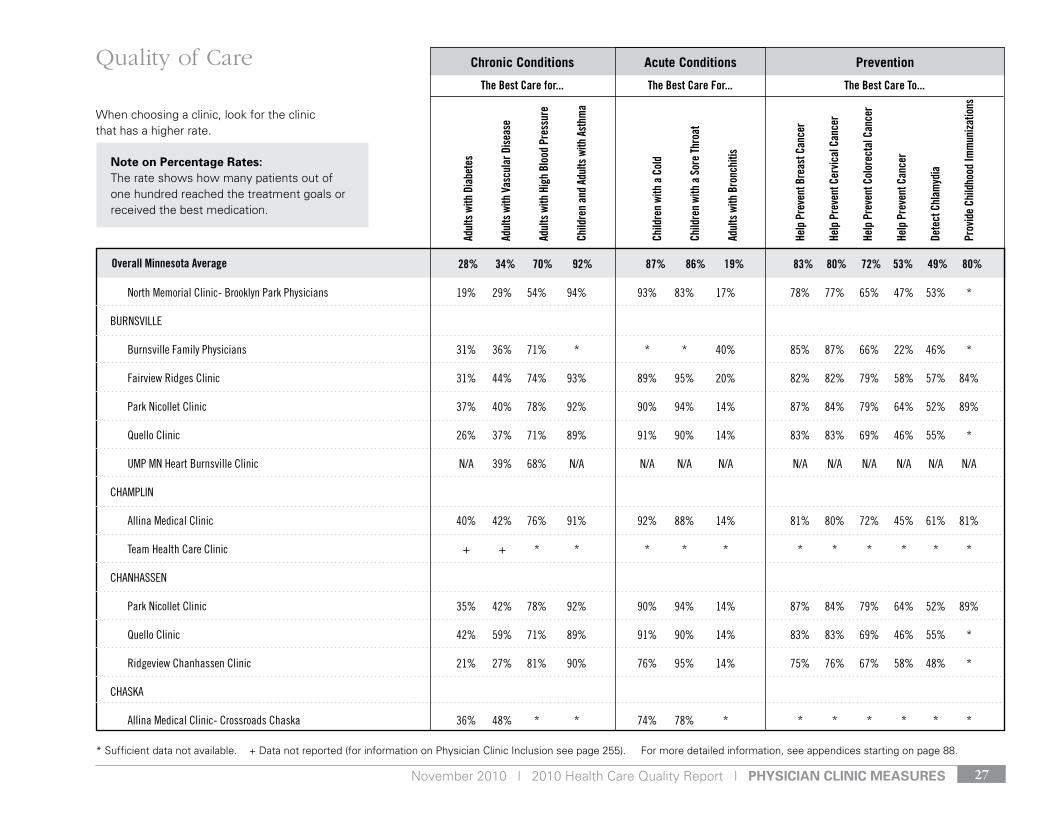
Overall Minnesota Average 28% 34% 70% 92% 87% 86% 19% 83% 80% 72% 53% 49% 80%
north Memorial Clinic- Brooklyn Park Physicians
BurnsvIlle
Burnsville Family Physicians
Fairview ridges Clinic
Park nicollet Clinic
Quello Clinic
uMP Mn Heart Burnsville Clinic
CHAMPlIn
Allina Medical Clinic
team Health Care Clinic
CHAnHAssen
Park nicollet Clinic
Quello Clinic
ridgeview Chanhassen Clinic
CHAskA
Allina Medical Clinic- Crossroads Chaska
* Sufficient data not available. + Data not reported (for information on Physician Clinic Inclusion see page 255). For more detailed information, see appendices starting on page 88.
Chronic Conditions PreventionAcute Conditions
The Best Care for... The Best Care For... The Best Care To...
When choosing a clinic, look for the clinic that has a higher rate.
19% 29% 54% 94% 93% 83% 17% 78% 77% 65% 47% 53% *
31% 36% 71% * * * 40% 85% 87% 66% 22% 46% *
31% 44% 74% 93% 89% 95% 20% 82% 82% 79% 58% 57% 84%
37% 40% 78% 92% 90% 94% 14% 87% 84% 79% 64% 52% 89%
26% 37% 71% 89% 91% 90% 14% 83% 83% 69% 46% 55% *
n/A 39% 68% n/A n/A n/A n/A n/A n/A n/A n/A n/A n/A
40% 42% 76% 91% 92% 88% 14% 81% 80% 72% 45% 61% 81%
+ + * * * * * * * * * * *
35% 42% 78% 92% 90% 94% 14% 87% 84% 79% 64% 52% 89%
42% 59% 71% 89% 91% 90% 14% 83% 83% 69% 46% 55% *
21% 27% 81% 90% 76% 95% 14% 75% 76% 67% 58% 48% *
36% 48% * * 74% 78% * * * * * * *
Adul
ts w
ith D
iabe
tes
Adul
ts w
ith V
ascu
lar D
iseas
e
Adul
ts w
ith H
igh
Bloo
d Pr
essu
re
Child
ren
and
Adul
ts w
ith A
sthm
a
Child
ren
with
a C
old
Child
ren
with
a S
ore
Thro
at
Adul
ts w
ith B
ronc
hitis
Help
Pre
vent
Bre
ast C
ance
r
Help
Pre
vent
Cer
vical
Can
cer
Help
Pre
vent
Col
orec
tal C
ance
r
Help
Pre
vent
Can
cer
Dete
ct C
hlam
ydia
Prov
ide
Child
hood
Imm
uniza
tions
Quality of Care
note on percentage rates:The rate shows how many patients out of one hundred reached the treatment goals or received the best medication.
pHysiCian CliniC Measures | November 2010 | 2010 Health Care Quality Report28
Overall Minnesota Average 28% 34% 70% 92% 87% 86% 19% 83% 80% 72% 53% 49% 80%
Fairview Jonathan Clinic
lakeview Clinic
valley Family Practice
ColuMBIA HeIgHts
Fairview Columbia Heights Clinic
Coon rAPIds
Allina Health system- Metropolitan Heart & vascular Institute
Allina Health system- Midwest Internal Medicine
Allina Medical Clinic
Anoka Area Family Medicine Clinic
dr. Jerrol noller
HealthPartners
twin Cities Heart and lung
CottAge grove
Allina Medical Clinic
Healtheast
* Sufficient data not available. + Data not reported (for information on Physician Clinic Inclusion see page 255). For more detailed information, see appendices starting on page 88.
Chronic Conditions PreventionAcute Conditions
The Best Care for... The Best Care For... The Best Care To...
When choosing a clinic, look for the clinic that has a higher rate.
22% 24% 74% 93% 89% 95% 20% 82% 82% 79% 58% 57% 84%
15% 29% 49% 95% 87% 89% 16% 83% 83% 94% * 54% 85%
20% 8% * * * * * * * * * * *
19% 24% * * 92% 88% * * * * * * *
* 30% 75% n/A n/A n/A n/A n/A n/A n/A n/A n/A n/A
* * 75% 91% 90% 89% 21% 83% 81% 43% 36% 48% 75%
44% 49% 76% 91% 92% 88% 14% 81% 80% 72% 45% 61% 81%
+ + * * * * * * * * * * *
+ + * * * * * * * * * * *
41% 46% 77% 93% 96% 96% 22% 88% 83% 75% 66% 68% 86%
n/A + * n/A n/A n/A n/A n/A n/A n/A n/A n/A n/A
41% 44% 76% 91% 92% 88% 14% 81% 80% 72% 45% 61% 81%
33% 38% 81% 90% 93% 94% 21% 82% 79% 85% 55% 52% 90%
Adul
ts w
ith D
iabe
tes
Adul
ts w
ith V
ascu
lar D
iseas
e
Adul
ts w
ith H
igh
Bloo
d Pr
essu
re
Child
ren
and
Adul
ts w
ith A
sthm
a
Child
ren
with
a C
old
Child
ren
with
a S
ore
Thro
at
Adul
ts w
ith B
ronc
hitis
Help
Pre
vent
Bre
ast C
ance
r
Help
Pre
vent
Cer
vical
Can
cer
Help
Pre
vent
Col
orec
tal C
ance
r
Help
Pre
vent
Can
cer
Dete
ct C
hlam
ydia
Prov
ide
Child
hood
Imm
uniza
tions
Quality of Care
note on percentage rates:The rate shows how many patients out of one hundred reached the treatment goals or received the best medication.
November 2010 | 2010 Health Care Quality Report | pHysiCian CliniC Measures 29
CrystAl
new Hope-Crystal Medical Clinic
northwest Family Physicians
one stop Medical Center
eAgAn
Allina Medical Clinic
eagan Child and Family Care
Fairview eagan Clinic
Healtheast
Minnesota Center for obesity, Metabolism, and endocrinology (MnCoMe)
Park nicollet Clinic
yankee square Family Practice
eden PrAIrIe
Fairview edenCenter Clinic
Park nicollet Clinic
Overall Minnesota Average 28% 34% 70% 92% 87% 86% 19% 83% 80% 72% 53% 49% 80%
* Sufficient data not available. + Data not reported (for information on Physician Clinic Inclusion see page 255). For more detailed information, see appendices starting on page 88.
Chronic Conditions PreventionAcute Conditions
The Best Care for... The Best Care For... The Best Care To...
When choosing a clinic, look for the clinic that has a higher rate.
+ + * * * * * * * * * * *
23% 34% 63% 96% 90% 93% 22% 79% 78% 59% 41% 57% *
+ + * * * * * * * * * * *
45% 54% 76% 91% 92% 88% 14% 81% 80% 72% 45% 61% 81%
+ + * * * * * * * * * * *
44% 60% 74% 93% 89% 95% 20% 82% 82% 79% 58% 57% 84%
* * 81% 90% 93% 94% 21% 82% 79% 85% 55% 52% 90%
19% * * n/A n/A n/A n/A n/A n/A n/A n/A n/A n/A
40% 44% 78% 92% 90% 94% 14% 87% 84% 79% 64% 52% 89%
+ + * * * * * * * * * * *
32% 46% 74% 93% 89% 95% 20% 82% 82% 79% 58% 57% 84%
38% 43% 78% 92% 90% 94% 14% 87% 84% 79% 64% 52% 89%
Adul
ts w
ith D
iabe
tes
Adul
ts w
ith V
ascu
lar D
iseas
e
Adul
ts w
ith H
igh
Bloo
d Pr
essu
re
Child
ren
and
Adul
ts w
ith A
sthm
a
Child
ren
with
a C
old
Child
ren
with
a S
ore
Thro
at
Adul
ts w
ith B
ronc
hitis
Help
Pre
vent
Bre
ast C
ance
r
Help
Pre
vent
Cer
vical
Can
cer
Help
Pre
vent
Col
orec
tal C
ance
r
Help
Pre
vent
Can
cer
Dete
ct C
hlam
ydia
Prov
ide
Child
hood
Imm
uniza
tions
Quality of Care
note on percentage rates:The rate shows how many patients out of one hundred reached the treatment goals or received the best medication.
pHysiCian CliniC Measures | November 2010 | 2010 Health Care Quality Report30
edInA
Allina Health system- Abbott northwestern general Medicine Associates
Allina Medical Clinic
Consultants Internal Medicine
edina Family Physicians
edina sports Health & Wellness
endocrinology Clinic of Minneapolis
Fairview Crosstown Clinic
France Avenue Family Physicians
one stop Medical Center
Quello Clinic
sharpe dillon Cockson & Associates PA
southdale Internal Medicine, PA
the schuster Clinic
uMP Mn Heart edina Clinic
Overall Minnesota Average 28% 34% 70% 92% 87% 86% 19% 83% 80% 72% 53% 49% 80%
* Sufficient data not available. + Data not reported (for information on Physician Clinic Inclusion see page 255). For more detailed information, see appendices starting on page 88.
Chronic Conditions PreventionAcute Conditions
The Best Care for... The Best Care For... The Best Care To...
When choosing a clinic, look for the clinic that has a higher rate.
31% 35% 75% 91% 90% 89% 21% 83% 81% 43% 36% 48% 75%
41% 43% 76% 91% 92% 88% 14% 81% 80% 72% 45% 61% 81%
8% 18% * * * * * 80% 78% * * * *
12% 20% 50% 90% 71% * 14% 89% 89% 64% 50% 41% *
10% 19% * * * * 13% 82% 85% * * 45% *
25% n/A * n/A n/A n/A n/A n/A n/A n/A n/A n/A n/A
39% 58% 74% 93% 89% 95% 20% 82% 82% 79% 58% 57% 84%
41% 56% * * * * 16% 73% 81% 77% 68% 58% *
+ + * * * * * * * * * * *
38% 45% 71% 89% 91% 90% 14% 83% 83% 69% 46% 55% *
+ + * * * * * * * * * * *
47% 48% * * * * * 87% 77% * * * *
+ n/A * n/A n/A n/A n/A n/A n/A n/A n/A n/A n/A
n/A 33% 68% n/A n/A n/A n/A n/A n/A n/A n/A n/A n/A
Adul
ts w
ith D
iabe
tes
Adul
ts w
ith V
ascu
lar D
iseas
e
Adul
ts w
ith H
igh
Bloo
d Pr
essu
re
Child
ren
and
Adul
ts w
ith A
sthm
a
Child
ren
with
a C
old
Child
ren
with
a S
ore
Thro
at
Adul
ts w
ith B
ronc
hitis
Help
Pre
vent
Bre
ast C
ance
r
Help
Pre
vent
Cer
vical
Can
cer
Help
Pre
vent
Col
orec
tal C
ance
r
Help
Pre
vent
Can
cer
Dete
ct C
hlam
ydia
Prov
ide
Child
hood
Imm
uniza
tions
Quality of Care
note on percentage rates:The rate shows how many patients out of one hundred reached the treatment goals or received the best medication.
November 2010 | 2010 Health Care Quality Report | pHysiCian CliniC Measures 31
eXCelsIor
ridgeview excelsior Clinic
FArMIngton
Allina Medical Clinic
Fairview Farmington Clinic
FamilyHealth Medical Clinic
Farmington Clinic
Forest lAke
Allina Medical Clinic
FrIdley
Fairview Fridley Clinic
Multicare Associates- Fridley Medical Center
golden vAlley
north Memorial Clinic- golden valley Physicians
Park nicollet Clinic
Overall Minnesota Average 28% 34% 70% 92% 87% 86% 19% 83% 80% 72% 53% 49% 80%
* Sufficient data not available. + Data not reported (for information on Physician Clinic Inclusion see page 255). For more detailed information, see appendices starting on page 88.
Chronic Conditions PreventionAcute Conditions
The Best Care for... The Best Care For... The Best Care To...
When choosing a clinic, look for the clinic that has a higher rate.
5% * 81% 90% 76% 95% 14% 75% 76% 67% 58% 48% *
43% 53% 76% 91% 92% 88% 14% 81% 80% 72% 45% 61% 81%
* * 74% 93% 89% 95% 20% 82% 82% 79% 58% 57% 84%
2% * * * 90% 89% 25% 82% 75% * * 15% *
* * * * * * * * * * * * *
38% 44% 76% 91% 92% 88% 14% 81% 80% 72% 45% 61% 81%
17% 21% * * 92% 88% * * * * * * *
21% 24% 56% 91% 83% 98% * 79% 80% 46% 38% 44% 83%
23% 26% 54% 94% 93% 83% 17% 78% 77% 65% 47% 53% *
45% 51% 78% 92% 90% 94% 14% 87% 84% 79% 64% 52% 89%
Adul
ts w
ith D
iabe
tes
Adul
ts w
ith V
ascu
lar D
iseas
e
Adul
ts w
ith H
igh
Bloo
d Pr
essu
re
Child
ren
and
Adul
ts w
ith A
sthm
a
Child
ren
with
a C
old
Child
ren
with
a S
ore
Thro
at
Adul
ts w
ith B
ronc
hitis
Help
Pre
vent
Bre
ast C
ance
r
Help
Pre
vent
Cer
vical
Can
cer
Help
Pre
vent
Col
orec
tal C
ance
r
Help
Pre
vent
Can
cer
Dete
ct C
hlam
ydia
Prov
ide
Child
hood
Imm
uniza
tions
Quality of Care
note on percentage rates:The rate shows how many patients out of one hundred reached the treatment goals or received the best medication.
pHysiCian CliniC Measures | November 2010 | 2010 Health Care Quality Report32
HAstIngs
Allina Medical Clinic - W First st
Allina Medical Clinic- nininger
HoPkIns
Aspen Medical group
Hugo
Fairview Hugo Clinic
Healtheast
Inver grove HeIgHts
Aspen Medical group
Family Healthservices Minnesota
HealthPartners
Inver grove Heights Family Medical Center
Jordon
Jordon Medical Clinic
Overall Minnesota Average 28% 34% 70% 92% 87% 86% 19% 83% 80% 72% 53% 49% 80%
* Sufficient data not available. + Data not reported (for information on Physician Clinic Inclusion see page 255). For more detailed information, see appendices starting on page 88.
Chronic Conditions PreventionAcute Conditions
The Best Care for... The Best Care For... The Best Care To...
When choosing a clinic, look for the clinic that has a higher rate.
39% 52% * * * 96% * * * * * * *
38% 50% * * * 96% * * * * * * *
7% * 67% 91% 91% 95% 25% 85% 82% 74% 41% 49% 88%
29% 52% 74% 93% 89% 95% 20% 82% 82% 79% 58% 57% 84%
33% * 81% 90% 93% 94% 21% 82% 79% 85% 55% 52% 90%
11% 24% 67% 91% 91% 95% 25% 85% 82% 74% 41% 49% 88%
32% 41% 85% 91% 88% 84% 25% 79% 75% 81% 59% * 87%
51% 52% 77% 93% 96% 96% 22% 88% 83% 75% 66% 68% 86%
+ + * * * * * * * * * * *
+ + * * * * * * * * * * *
Adul
ts w
ith D
iabe
tes
Adul
ts w
ith V
ascu
lar D
iseas
e
Adul
ts w
ith H
igh
Bloo
d Pr
essu
re
Child
ren
and
Adul
ts w
ith A
sthm
a
Child
ren
with
a C
old
Child
ren
with
a S
ore
Thro
at
Adul
ts w
ith B
ronc
hitis
Help
Pre
vent
Bre
ast C
ance
r
Help
Pre
vent
Cer
vical
Can
cer
Help
Pre
vent
Col
orec
tal C
ance
r
Help
Pre
vent
Can
cer
Dete
ct C
hlam
ydia
Prov
ide
Child
hood
Imm
uniza
tions
Quality of Care
note on percentage rates:The rate shows how many patients out of one hundred reached the treatment goals or received the best medication.
November 2010 | 2010 Health Care Quality Report | pHysiCian CliniC Measures 33
Overall Minnesota Average 28% 34% 70% 92% 87% 86% 19% 83% 80% 72% 53% 49% 80%
lAkevIlle
Fairview lakeville Clinic
FamilyHealth Medical Clinic
lakeville Family Practice
Quello Clinic
lIno lAkes
Fairview lino lakes Clinic
HealthPartners
lIttle CAnAdA
little Canada Medical Clinic
MAPle grove
Allina Medical Clinic
Fairview Bass lake Clinic
Fairview Maple grove Medical Center
Maple Medical Center, PA
north Clinic
* Sufficient data not available. + Data not reported (for information on Physician Clinic Inclusion see page 255). For more detailed information, see appendices starting on page 88.
Chronic Conditions PreventionAcute Conditions
The Best Care for... The Best Care For... The Best Care To...
When choosing a clinic, look for the clinic that has a higher rate.
43% 37% 74% 93% 89% 95% 20% 82% 82% 79% 58% 57% 84%
9% * * * 90% 89% 25% 82% 75% * * 15% *
+ + * * * * * * * * * * *
31% 45% 71% 89% 91% 90% 14% 83% 83% 69% 46% 55% *
32% 33% 74% 93% 89% 95% 20% 82% 82% 79% 58% 57% 84%
33% 42% 77% 93% 96% 96% 22% 88% 83% 75% 66% 68% 86%
+ + * * * * * * * * * * *
41% 52% 76% 91% 92% 88% 14% 81% 80% 72% 45% 61% 81%
45% 31% 74% 93% 89% 95% 20% 82% 82% 79% 58% 57% 84%
37% 42% 74% 93% 89% 95% 20% 82% 82% 79% 58% 57% 84%
+ + * * * * * * * * * * *
11% 25% 73% 87% 90% 91% 17% 85% 82% 94% 66% 45% *
Adul
ts w
ith D
iabe
tes
Adul
ts w
ith V
ascu
lar D
iseas
e
Adul
ts w
ith H
igh
Bloo
d Pr
essu
re
Child
ren
and
Adul
ts w
ith A
sthm
a
Child
ren
with
a C
old
Child
ren
with
a S
ore
Thro
at
Adul
ts w
ith B
ronc
hitis
Help
Pre
vent
Bre
ast C
ance
r
Help
Pre
vent
Cer
vical
Can
cer
Help
Pre
vent
Col
orec
tal C
ance
r
Help
Pre
vent
Can
cer
Dete
ct C
hlam
ydia
Prov
ide
Child
hood
Imm
uniza
tions
Quality of Care
note on percentage rates:The rate shows how many patients out of one hundred reached the treatment goals or received the best medication.

pHysiCian CliniC Measures | November 2010 | 2010 Health Care Quality Report34
Overall Minnesota Average 28% 34% 70% 92% 87% 86% 19% 83% 80% 72% 53% 49% 80%
north Memorial Clinic- Camden Physicians Maple grove
Park nicollet Clinic
MAPleWood
Aspen Medical group
Attending Physicians
Family Healthservices Minnesota- Afton road
Healtheast
HealthPartners
st. Paul Cardiology
st. Paul Heart Clinic
MInneAPolIs
Allina Health system- Abbott northwestern general Medicine Associates
Allina Health system- Minneapolis Heart Institute
Allina Medical Clinic- Isles
Allina Medical Clinic- nicollet Mall
Allina Medical Clinic- the doctors uptown
* Sufficient data not available. + Data not reported (for information on Physician Clinic Inclusion see page 255). For more detailed information, see appendices starting on page 88.
Chronic Conditions PreventionAcute Conditions
The Best Care for... The Best Care For... The Best Care To...
When choosing a clinic, look for the clinic that has a higher rate.
15% 39% 75% 92% 94% 93% 28% 84% 80% 79% 69% 52% *
34% 43% 78% 92% 90% 94% 14% 87% 84% 79% 64% 52% 89%
16% 44% 67% 91% 91% 95% 25% 85% 82% 74% 41% 49% 88%
6% 17% * * * * * * * * * * *
32% 49% 85% 91% 88% 84% 25% 79% 75% 81% 59% * 87%
29% 40% 81% 90% 93% 94% 21% 82% 79% 85% 55% 52% 90%
38% 47% 77% 93% 96% 96% 22% 88% 83% 75% 66% 68% 86%
n/A + * n/A n/A n/A n/A n/A n/A n/A n/A n/A n/A
n/A 35% * n/A n/A n/A n/A n/A n/A n/A n/A n/A n/A
4% * 75% 91% 90% 89% 21% 83% 81% 43% 36% 48% 75%
* 25% 64% n/A n/A n/A n/A n/A n/A n/A n/A n/A n/A
39% 47% 76% 91% 92% 88% 14% 81% 80% 72% 45% 61% 81%
36% 45% 76% 91% 92% 88% 14% 81% 80% 72% 45% 61% 81%
43% 54% 76% 91% 92% 88% 14% 81% 80% 72% 45% 61% 81%
Adul
ts w
ith D
iabe
tes
Adul
ts w
ith V
ascu
lar D
iseas
e
Adul
ts w
ith H
igh
Bloo
d Pr
essu
re
Child
ren
and
Adul
ts w
ith A
sthm
a
Child
ren
with
a C
old
Child
ren
with
a S
ore
Thro
at
Adul
ts w
ith B
ronc
hitis
Help
Pre
vent
Bre
ast C
ance
r
Help
Pre
vent
Cer
vical
Can
cer
Help
Pre
vent
Col
orec
tal C
ance
r
Help
Pre
vent
Can
cer
Dete
ct C
hlam
ydia
Prov
ide
Child
hood
Imm
uniza
tions
Quality of Care
note on percentage rates:The rate shows how many patients out of one hundred reached the treatment goals or received the best medication.
November 2010 | 2010 Health Care Quality Report | pHysiCian CliniC Measures 35
Overall Minnesota Average 28% 34% 70% 92% 87% 86% 19% 83% 80% 72% 53% 49% 80%
Aspen Medical group- east lake street
AXIs Medical Center
Bloomington lake Clinic
Boynton Health service
Bruley Center
Cedar riverside People’s Center- People’s Center Medical Clinic
Community university Health Care Center
Crown Medical Center
Fairview Hiawatha Clinic
Fairview northeast Clinic
Fairview uptown Clinic
Fremont Community Health services- Central Avenue Clinic
Fremont Community Health services- Fremont Clinic
Fremont Community Health services- sheridan
green Central Medical Clinic
HealthPartners- riverside
* Sufficient data not available. + Data not reported (for information on Physician Clinic Inclusion see page 255). For more detailed information, see appendices starting on page 88.
Chronic Conditions PreventionAcute Conditions
The Best Care for... The Best Care For... The Best Care To...
When choosing a clinic, look for the clinic that has a higher rate.
3% 12% 67% 91% 91% 95% 25% 85% 82% 74% 41% 49% 88%
+ + * * * * * * * * * * *
23% 35% 83% 95% 97% * 16% 82% 81% 81% * 18% *
10% * * * * * * * * * * * *
+ + * * * * * * * * * * *
13% * 64% * * * * 89% 74% 70% * 55% *
13% 10% 67% 89% 94% 89% 47% 68% 79% 44% 34% 54% 79%
+ + * * * * * * * * * * *
34% 43% 74% 93% 89% 95% 20% 82% 82% 79% 58% 57% 84%
37% 39% 74% 93% 89% 95% 20% 82% 82% 79% 58% 57% 84%
29% 31% 74% 93% 89% 95% 20% 82% 82% 79% 58% 57% 84%
10% * 67% 89% 94% 89% 47% 68% 79% 44% 34% 54% 79%
1% 14% 67% 89% 94% 89% 47% 68% 79% 44% 34% 54% 79%
* * 67% 89% 94% 89% 47% 68% 79% 44% 34% 54% 79%
18% * 67% 89% 94% 89% 47% 68% 79% 44% 34% 54% 79%
40% 46% 77% 93% 96% 96% 22% 88% 83% 75% 66% 68% 86%
Adul
ts w
ith D
iabe
tes
Adul
ts w
ith V
ascu
lar D
iseas
e
Adul
ts w
ith H
igh
Bloo
d Pr
essu
re
Child
ren
and
Adul
ts w
ith A
sthm
a
Child
ren
with
a C
old
Child
ren
with
a S
ore
Thro
at
Adul
ts w
ith B
ronc
hitis
Help
Pre
vent
Bre
ast C
ance
r
Help
Pre
vent
Cer
vical
Can
cer
Help
Pre
vent
Col
orec
tal C
ance
r
Help
Pre
vent
Can
cer
Dete
ct C
hlam
ydia
Prov
ide
Child
hood
Imm
uniza
tions
Quality of Care
note on percentage rates:The rate shows how many patients out of one hundred reached the treatment goals or received the best medication.
pHysiCian CliniC Measures | November 2010 | 2010 Health Care Quality Report36
Overall Minnesota Average 28% 34% 70% 92% 87% 86% 19% 83% 80% 72% 53% 49% 80%
Hennepin Faculty Associates- HCMC Family Medical Center
Hennepin Faculty Associates- HCMC Hennepin Heart Center
Hennepin Faculty Associates- HCMC Medicine Clinic
Hennepin Faculty Associates- HCMC Positive Care Clinic
Hennepin Faculty Associates- Hennepin Care south
Hennepin Faculty Associates- Hennepin Center for diabetes & endocrinology
Hennepin Faculty Associates- Hennepin Center for senior Care
Hennepin Faculty Associates- Hennepin Family Care east lake Clinic
Hennepin Faculty Associates- HFA Internal Medicine Clinic
Hennepin Faculty Associates- HFA senior Care Clinic at Augustana
Johnson street Medical Clinic
Medical Care services, PA
Metropolitan Internists PA
native American Community Clinic
north Memorial Clinic- Camden Physicians
north Memorial Clinic- northeast Family Physicians
* Sufficient data not available. + Data not reported (for information on Physician Clinic Inclusion see page 255). For more detailed information, see appendices starting on page 88.
Chronic Conditions PreventionAcute Conditions
The Best Care for... The Best Care For... The Best Care To...
When choosing a clinic, look for the clinic that has a higher rate.
12% 9% 60% 94% 94% 88% 45% 81% 80% 60% 55% 62% 61%
* 12% 60% 94% 94% 88% 45% 81% 80% 60% 55% 62% 61%
8% 7% 60% 94% 94% 88% 45% 81% 80% 60% 55% 62% 61%
10% * 60% 94% 94% 88% 45% 81% 80% 60% 55% 62% 61%
14% * 60% 94% 94% 88% 45% 81% 80% 60% 55% 62% 61%
12% * 60% n/A n/A n/A n/A n/A n/A n/A n/A n/A n/A
18% * 60% n/A n/A n/A n/A 81% n/A 60% 55% n/A n/A
11% * 60% 94% 94% 88% 45% 81% 80% 60% 55% 62% 61%
16% 18% 60% 94% 94% 88% 45% 81% 80% 60% 55% 62% 61%
* * 60% n/A n/A n/A n/A 81% n/A 60% 55% n/A n/A
3% * * * * * * * 50% * * * *
+ + * * * * * * * * * * *
+ + * * * * * * * * * * *
0% 10% * * * * * * * * * * *
14% 25% 75% 92% 94% 93% 28% 84% 80% 79% 69% 52% *
13% 21% 54% 94% 93% 83% 17% 78% 77% 65% 47% 53% *
Adul
ts w
ith D
iabe
tes
Adul
ts w
ith V
ascu
lar D
iseas
e
Adul
ts w
ith H
igh
Bloo
d Pr
essu
re
Child
ren
and
Adul
ts w
ith A
sthm
a
Child
ren
with
a C
old
Child
ren
with
a S
ore
Thro
at
Adul
ts w
ith B
ronc
hitis
Help
Pre
vent
Bre
ast C
ance
r
Help
Pre
vent
Cer
vical
Can
cer
Help
Pre
vent
Col
orec
tal C
ance
r
Help
Pre
vent
Can
cer
Dete
ct C
hlam
ydia
Prov
ide
Child
hood
Imm
uniza
tions
Quality of Care
note on percentage rates:The rate shows how many patients out of one hundred reached the treatment goals or received the best medication.
November 2010 | 2010 Health Care Quality Report | pHysiCian CliniC Measures 37
Overall Minnesota Average 28% 34% 70% 92% 87% 86% 19% 83% 80% 72% 53% 49% 80%
north Memorial Heart & vascular Institute
northPoint Health & Wellness Center
Park Avenue Family Practice
Park nicollet Clinic
riverside Family Physicians
ronald r vessey Md Internal Medicine services, PA
southside Medical Clinic
uMP Mn Heart university Clinic
university of Minnesota Physicians - Broadway Family Medicine
university of Minnesota Physicians - Medicine specialties Clinic 6A
university of Minnesota Physicians - Mill City Clinic
university of Minnesota Physicians - Primary Care Center
university of Minnesota Physicians - smiley’s Clinic
MInnetonkA
north Memorial Clinic- Minnetonka Physicians
Park nicollet Clinic- Carlson
* Sufficient data not available. + Data not reported (for information on Physician Clinic Inclusion see page 255). For more detailed information, see appendices starting on page 88.
Chronic Conditions PreventionAcute Conditions
The Best Care for... The Best Care For... The Best Care To...
When choosing a clinic, look for the clinic that has a higher rate.
* 55% 54% n/A n/A n/A n/A n/A n/A n/A n/A n/A n/A
9% 20% 70% 88% 95% * * 72% 77% * * 81% *
+ + * * * * * * * * * * *
21% 30% 78% 92% 90% 94% 14% 87% 84% 79% 64% 52% 89%
11% * * * * * * 71% 76% * * * *
* * * * * * * * * * * * *
19% * 67% 89% 94% 89% 47% 68% 79% 44% 34% 54% 79%
n/A 32% 68% n/A n/A n/A n/A n/A n/A n/A n/A n/A n/A
7% 13% 55% 92% 94% 98% 19% 80% 81% 53% 49% * 62%
24% * 55% 92% 94% 98% 19% 80% 81% 53% 49% * 62%
39% * 55% 92% 94% 98% 19% 80% 81% 53% 49% * 62%
24% 34% 55% 92% 94% 98% 19% 80% 81% 53% 49% * 62%
27% * 55% 92% 94% 98% 19% 80% 81% 53% 49% * 62%
15% 30% 54% 94% 93% 83% 17% 78% 77% 65% 47% 53% *
37% 46% 78% 92% 90% 94% 14% 87% 84% 79% 64% 52% 89%
Adul
ts w
ith D
iabe
tes
Adul
ts w
ith V
ascu
lar D
iseas
e
Adul
ts w
ith H
igh
Bloo
d Pr
essu
re
Child
ren
and
Adul
ts w
ith A
sthm
a
Child
ren
with
a C
old
Child
ren
with
a S
ore
Thro
at
Adul
ts w
ith B
ronc
hitis
Help
Pre
vent
Bre
ast C
ance
r
Help
Pre
vent
Cer
vical
Can
cer
Help
Pre
vent
Col
orec
tal C
ance
r
Help
Pre
vent
Can
cer
Dete
ct C
hlam
ydia
Prov
ide
Child
hood
Imm
uniza
tions
Quality of Care
note on percentage rates:The rate shows how many patients out of one hundred reached the treatment goals or received the best medication.
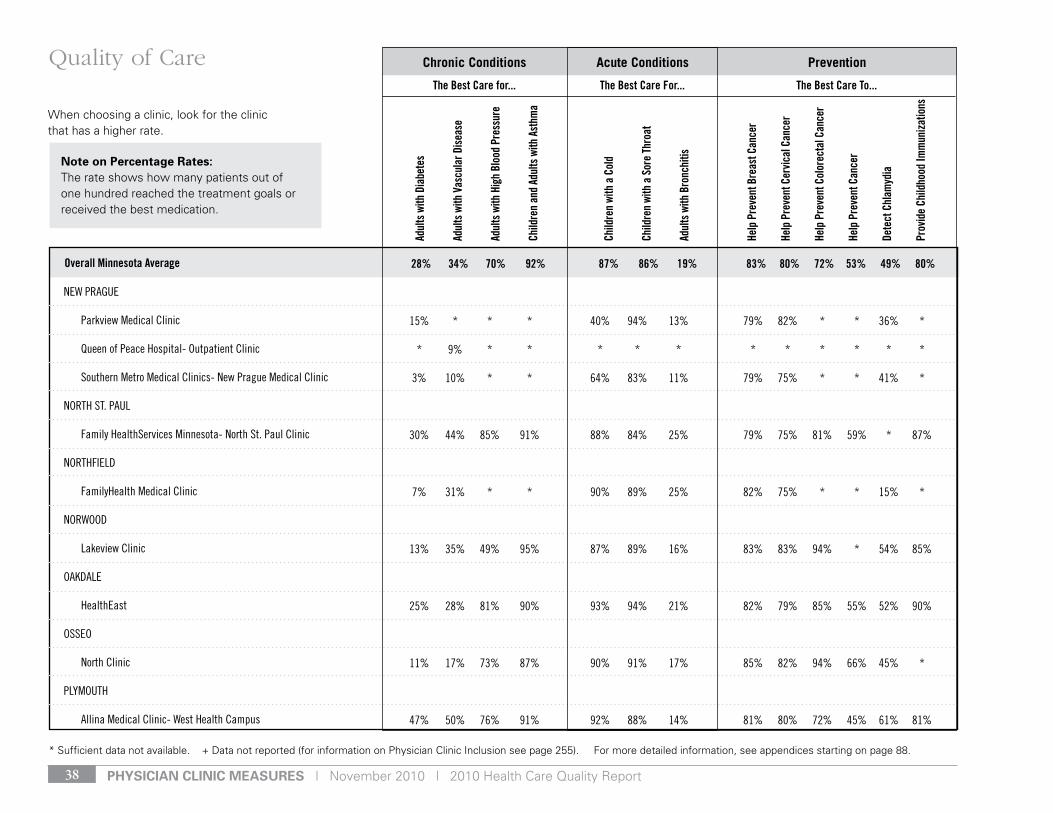
pHysiCian CliniC Measures | November 2010 | 2010 Health Care Quality Report38
Overall Minnesota Average 28% 34% 70% 92% 87% 86% 19% 83% 80% 72% 53% 49% 80%
neW PrAgue
Parkview Medical Clinic
Queen of Peace Hospital- outpatient Clinic
southern Metro Medical Clinics- new Prague Medical Clinic
nortH st. PAul
Family Healthservices Minnesota- north st. Paul Clinic
nortHFIeld
FamilyHealth Medical Clinic
norWood
lakeview Clinic
oAkdAle
Healtheast
osseo
north Clinic
PlyMoutH
Allina Medical Clinic- West Health Campus
* Sufficient data not available. + Data not reported (for information on Physician Clinic Inclusion see page 255). For more detailed information, see appendices starting on page 88.
Chronic Conditions PreventionAcute Conditions
The Best Care for... The Best Care For... The Best Care To...
When choosing a clinic, look for the clinic that has a higher rate.
15% * * * 40% 94% 13% 79% 82% * * 36% *
* 9% * * * * * * * * * * *
3% 10% * * 64% 83% 11% 79% 75% * * 41% *
30% 44% 85% 91% 88% 84% 25% 79% 75% 81% 59% * 87%
7% 31% * * 90% 89% 25% 82% 75% * * 15% *
13% 35% 49% 95% 87% 89% 16% 83% 83% 94% * 54% 85%
25% 28% 81% 90% 93% 94% 21% 82% 79% 85% 55% 52% 90%
11% 17% 73% 87% 90% 91% 17% 85% 82% 94% 66% 45% *
47% 50% 76% 91% 92% 88% 14% 81% 80% 72% 45% 61% 81%
Adul
ts w
ith D
iabe
tes
Adul
ts w
ith V
ascu
lar D
iseas
e
Adul
ts w
ith H
igh
Bloo
d Pr
essu
re
Child
ren
and
Adul
ts w
ith A
sthm
a
Child
ren
with
a C
old
Child
ren
with
a S
ore
Thro
at
Adul
ts w
ith B
ronc
hitis
Help
Pre
vent
Bre
ast C
ance
r
Help
Pre
vent
Cer
vical
Can
cer
Help
Pre
vent
Col
orec
tal C
ance
r
Help
Pre
vent
Can
cer
Dete
ct C
hlam
ydia
Prov
ide
Child
hood
Imm
uniza
tions
Quality of Care
note on percentage rates:The rate shows how many patients out of one hundred reached the treatment goals or received the best medication.
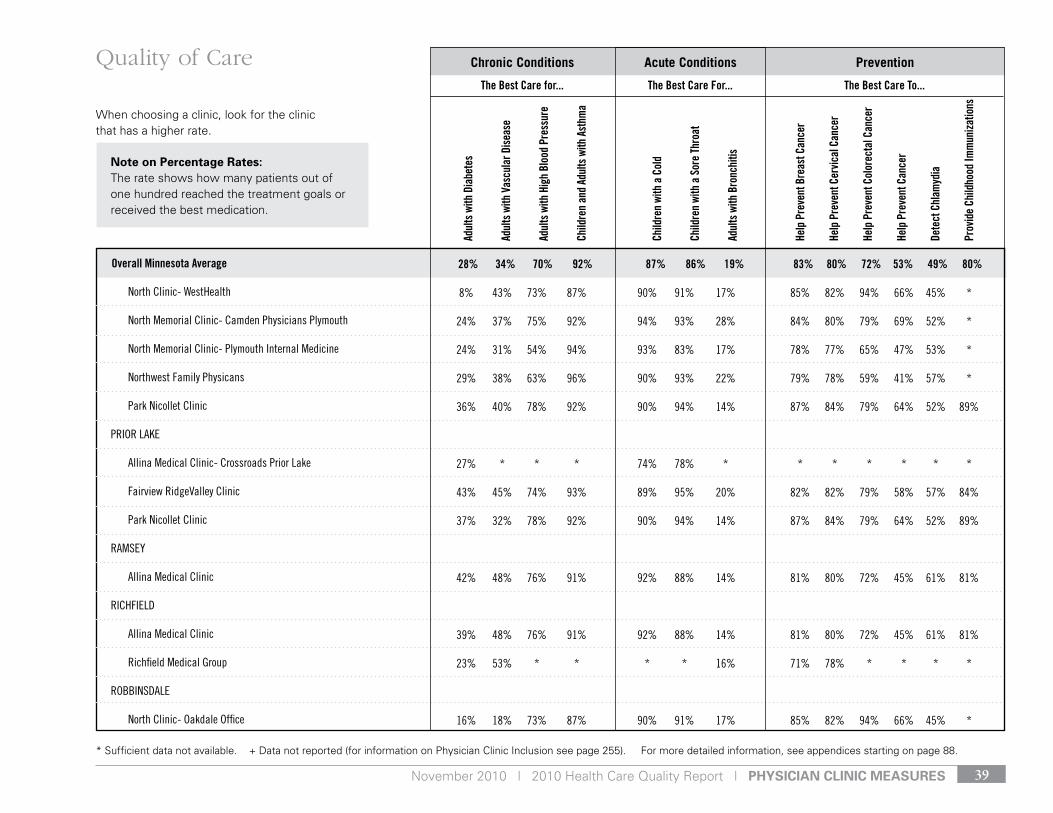
November 2010 | 2010 Health Care Quality Report | pHysiCian CliniC Measures 39
Overall Minnesota Average 28% 34% 70% 92% 87% 86% 19% 83% 80% 72% 53% 49% 80%
north Clinic- WestHealth
north Memorial Clinic- Camden Physicians Plymouth
north Memorial Clinic- Plymouth Internal Medicine
northwest Family Physicans
Park nicollet Clinic
PrIor lAke
Allina Medical Clinic- Crossroads Prior lake
Fairview ridgevalley Clinic
Park nicollet Clinic
rAMsey
Allina Medical Clinic
rICHFIeld
Allina Medical Clinic
richfield Medical group
roBBInsdAle
north Clinic- oakdale office
* Sufficient data not available. + Data not reported (for information on Physician Clinic Inclusion see page 255). For more detailed information, see appendices starting on page 88.
Chronic Conditions PreventionAcute Conditions
The Best Care for... The Best Care For... The Best Care To...
When choosing a clinic, look for the clinic that has a higher rate.
8% 43% 73% 87% 90% 91% 17% 85% 82% 94% 66% 45% *
24% 37% 75% 92% 94% 93% 28% 84% 80% 79% 69% 52% *
24% 31% 54% 94% 93% 83% 17% 78% 77% 65% 47% 53% *
29% 38% 63% 96% 90% 93% 22% 79% 78% 59% 41% 57% *
36% 40% 78% 92% 90% 94% 14% 87% 84% 79% 64% 52% 89%
27% * * * 74% 78% * * * * * * *
43% 45% 74% 93% 89% 95% 20% 82% 82% 79% 58% 57% 84%
37% 32% 78% 92% 90% 94% 14% 87% 84% 79% 64% 52% 89%
42% 48% 76% 91% 92% 88% 14% 81% 80% 72% 45% 61% 81%
39% 48% 76% 91% 92% 88% 14% 81% 80% 72% 45% 61% 81%
23% 53% * * * * 16% 71% 78% * * * *
16% 18% 73% 87% 90% 91% 17% 85% 82% 94% 66% 45% *
Adul
ts w
ith D
iabe
tes
Adul
ts w
ith V
ascu
lar D
iseas
e
Adul
ts w
ith H
igh
Bloo
d Pr
essu
re
Child
ren
and
Adul
ts w
ith A
sthm
a
Child
ren
with
a C
old
Child
ren
with
a S
ore
Thro
at
Adul
ts w
ith B
ronc
hitis
Help
Pre
vent
Bre
ast C
ance
r
Help
Pre
vent
Cer
vical
Can
cer
Help
Pre
vent
Col
orec
tal C
ance
r
Help
Pre
vent
Can
cer
Dete
ct C
hlam
ydia
Prov
ide
Child
hood
Imm
uniza
tions
Quality of Care
note on percentage rates:The rate shows how many patients out of one hundred reached the treatment goals or received the best medication.
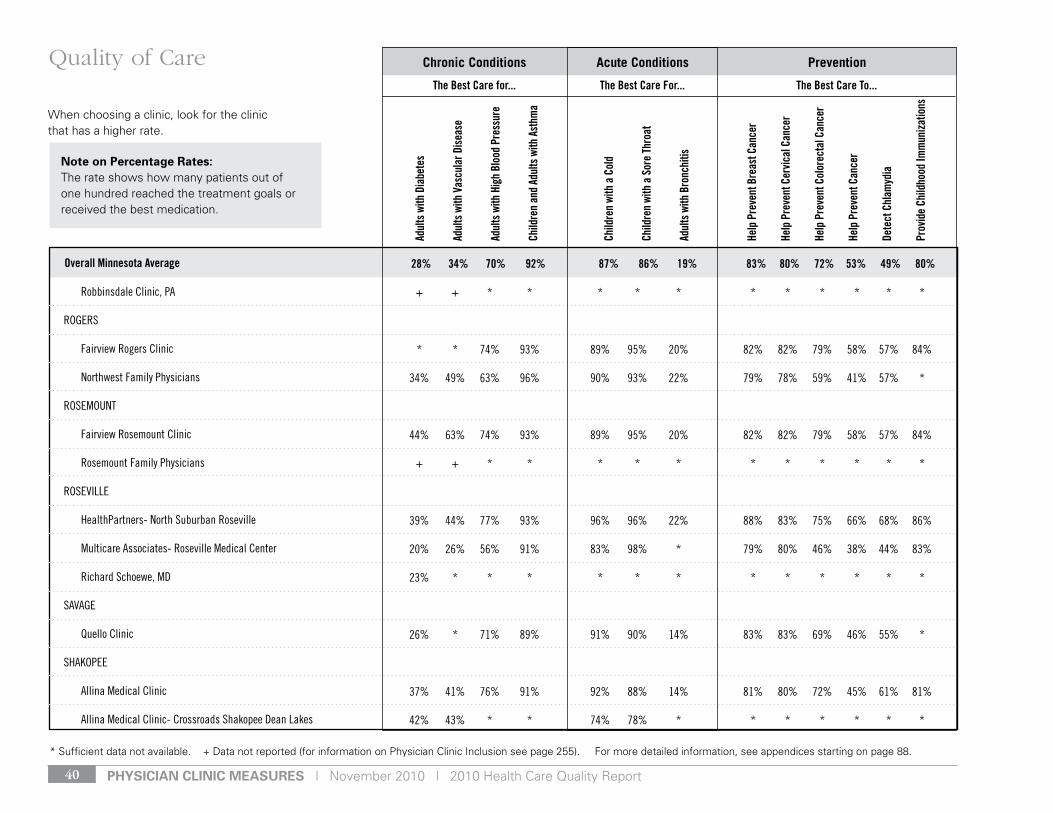
pHysiCian CliniC Measures | November 2010 | 2010 Health Care Quality Report40
Overall Minnesota Average 28% 34% 70% 92% 87% 86% 19% 83% 80% 72% 53% 49% 80%
robbinsdale Clinic, PA
rogers
Fairview rogers Clinic
northwest Family Physicians
roseMount
Fairview rosemount Clinic
rosemount Family Physicians
rosevIlle
HealthPartners- north suburban roseville
Multicare Associates- roseville Medical Center
richard schoewe, Md
sAvAge
Quello Clinic
sHAkoPee
Allina Medical Clinic
Allina Medical Clinic- Crossroads shakopee dean lakes
* Sufficient data not available. + Data not reported (for information on Physician Clinic Inclusion see page 255). For more detailed information, see appendices starting on page 88.
Chronic Conditions PreventionAcute Conditions
The Best Care for... The Best Care For... The Best Care To...
When choosing a clinic, look for the clinic that has a higher rate.
+ + * * * * * * * * * * *
* * 74% 93% 89% 95% 20% 82% 82% 79% 58% 57% 84%
34% 49% 63% 96% 90% 93% 22% 79% 78% 59% 41% 57% *
44% 63% 74% 93% 89% 95% 20% 82% 82% 79% 58% 57% 84%
+ + * * * * * * * * * * *
39% 44% 77% 93% 96% 96% 22% 88% 83% 75% 66% 68% 86%
20% 26% 56% 91% 83% 98% * 79% 80% 46% 38% 44% 83%
23% * * * * * * * * * * * *
26% * 71% 89% 91% 90% 14% 83% 83% 69% 46% 55% *
37% 41% 76% 91% 92% 88% 14% 81% 80% 72% 45% 61% 81%
42% 43% * * 74% 78% * * * * * * *
Adul
ts w
ith D
iabe
tes
Adul
ts w
ith V
ascu
lar D
iseas
e
Adul
ts w
ith H
igh
Bloo
d Pr
essu
re
Child
ren
and
Adul
ts w
ith A
sthm
a
Child
ren
with
a C
old
Child
ren
with
a S
ore
Thro
at
Adul
ts w
ith B
ronc
hitis
Help
Pre
vent
Bre
ast C
ance
r
Help
Pre
vent
Cer
vical
Can
cer
Help
Pre
vent
Col
orec
tal C
ance
r
Help
Pre
vent
Can
cer
Dete
ct C
hlam
ydia
Prov
ide
Child
hood
Imm
uniza
tions
Quality of Care
note on percentage rates:The rate shows how many patients out of one hundred reached the treatment goals or received the best medication.

November 2010 | 2010 Health Care Quality Report | pHysiCian CliniC Measures 41
Overall Minnesota Average 28% 34% 70% 92% 87% 86% 19% 83% 80% 72% 53% 49% 80%
Park nicollet Clinic
sHorevIeW
Allina Medical Clinic
Family Healthservices Minnesota
one stop Medical Center
silver lake Clinic
sHoreWood
Park nicollet Clinic
sPrIng PArk
ridgeview Westonka Clinic
st. AntHony
silver lake Clinic
st. FrAnCIs
st. Francis Medical Clinic
st. louIs PArk
HealthPartners- West
* Sufficient data not available. + Data not reported (for information on Physician Clinic Inclusion see page 255). For more detailed information, see appendices starting on page 88.
Chronic Conditions PreventionAcute Conditions
The Best Care for... The Best Care For... The Best Care To...
When choosing a clinic, look for the clinic that has a higher rate.
32% 46% 78% 92% 90% 94% 14% 87% 84% 79% 64% 52% 89%
40% 47% 76% 91% 92% 88% 14% 81% 80% 72% 45% 61% 81%
36% 50% 85% 91% 88% 84% 25% 79% 75% 81% 59% * 87%
+ + * * * * * * * * * * *
13% 23% 56% 90% 91% 97% * 78% 85% 84% 62% 40% *
41% 57% 78% 92% 90% 94% 14% 87% 84% 79% 64% 52% 89%
12% 28% 81% 90% 76% 95% 14% 75% 76% 67% 58% 48% *
11% 26% 56% 90% 91% 97% * 78% 85% 84% 62% 40% *
+ + * * * * * * * * * * *
38% 41% 77% 93% 96% 96% 22% 88% 83% 75% 66% 68% 86%
Adul
ts w
ith D
iabe
tes
Adul
ts w
ith V
ascu
lar D
iseas
e
Adul
ts w
ith H
igh
Bloo
d Pr
essu
re
Child
ren
and
Adul
ts w
ith A
sthm
a
Child
ren
with
a C
old
Child
ren
with
a S
ore
Thro
at
Adul
ts w
ith B
ronc
hitis
Help
Pre
vent
Bre
ast C
ance
r
Help
Pre
vent
Cer
vical
Can
cer
Help
Pre
vent
Col
orec
tal C
ance
r
Help
Pre
vent
Can
cer
Dete
ct C
hlam
ydia
Prov
ide
Child
hood
Imm
uniza
tions
Quality of Care
note on percentage rates:The rate shows how many patients out of one hundred reached the treatment goals or received the best medication.

pHysiCian CliniC Measures | November 2010 | 2010 Health Care Quality Report42
Overall Minnesota Average 28% 34% 70% 92% 87% 86% 19% 83% 80% 72% 53% 49% 80%
Integrative options
life Medical
Park nicollet Clinic- Creekside
Park nicollet Clinic- Heart and vascular
Park nicollet Clinic- st. louis Park endocrinology
Park nicollet Clinic- st. louis Park Family Medicine
Park nicollet Clinic- st. louis Park Internal Medicine
steven saliterman, Md
st. PAul
Adult Medicine, PA
Advanced Medical Clinic, Inc
Allina Medical Clinic- united Medical specialties
Arcade Medical Clinic
Aspen Medical group- Bandana square
Aspen Medical group- Highland
Boynton Health service
* Sufficient data not available. + Data not reported (for information on Physician Clinic Inclusion see page 255). For more detailed information, see appendices starting on page 88.
Chronic Conditions PreventionAcute Conditions
The Best Care for... The Best Care For... The Best Care To...
When choosing a clinic, look for the clinic that has a higher rate.
+ + * * * * * * * * * * *
5% 9% * * * * * * * * * * *
26% 39% 78% 92% 90% 94% 14% 87% 84% 79% 64% 52% 89%
* 24% 78% n/A n/A n/A n/A n/A n/A n/A n/A n/A n/A
26% n/A 78% n/A n/A n/A n/A n/A n/A n/A n/A n/A n/A
31% 45% 78% 92% 90% 94% 14% 87% 84% 79% 64% 52% 89%
38% 46% 78% 92% 90% 94% 14% 87% 84% 79% 64% 52% 89%
24% 32% * * * * * * * * * * *
51% * * * * * * * * * * * *
+ + * * * * * * * * * * *
40% 43% 76% 91% 92% 88% 14% 81% 80% 72% 45% 61% 81%
+ + * * * * * * * * * * *
17% 37% 67% 91% 91% 95% 25% 85% 82% 74% 41% 49% 88%
18% 56% 67% 91% 91% 95% 25% 85% 82% 74% 41% 49% 88%
* * * * * * * * * * * * *
Adul
ts w
ith D
iabe
tes
Adul
ts w
ith V
ascu
lar D
iseas
e
Adul
ts w
ith H
igh
Bloo
d Pr
essu
re
Child
ren
and
Adul
ts w
ith A
sthm
a
Child
ren
with
a C
old
Child
ren
with
a S
ore
Thro
at
Adul
ts w
ith B
ronc
hitis
Help
Pre
vent
Bre
ast C
ance
r
Help
Pre
vent
Cer
vical
Can
cer
Help
Pre
vent
Col
orec
tal C
ance
r
Help
Pre
vent
Can
cer
Dete
ct C
hlam
ydia
Prov
ide
Child
hood
Imm
uniza
tions
Quality of Care
note on percentage rates:The rate shows how many patients out of one hundred reached the treatment goals or received the best medication.
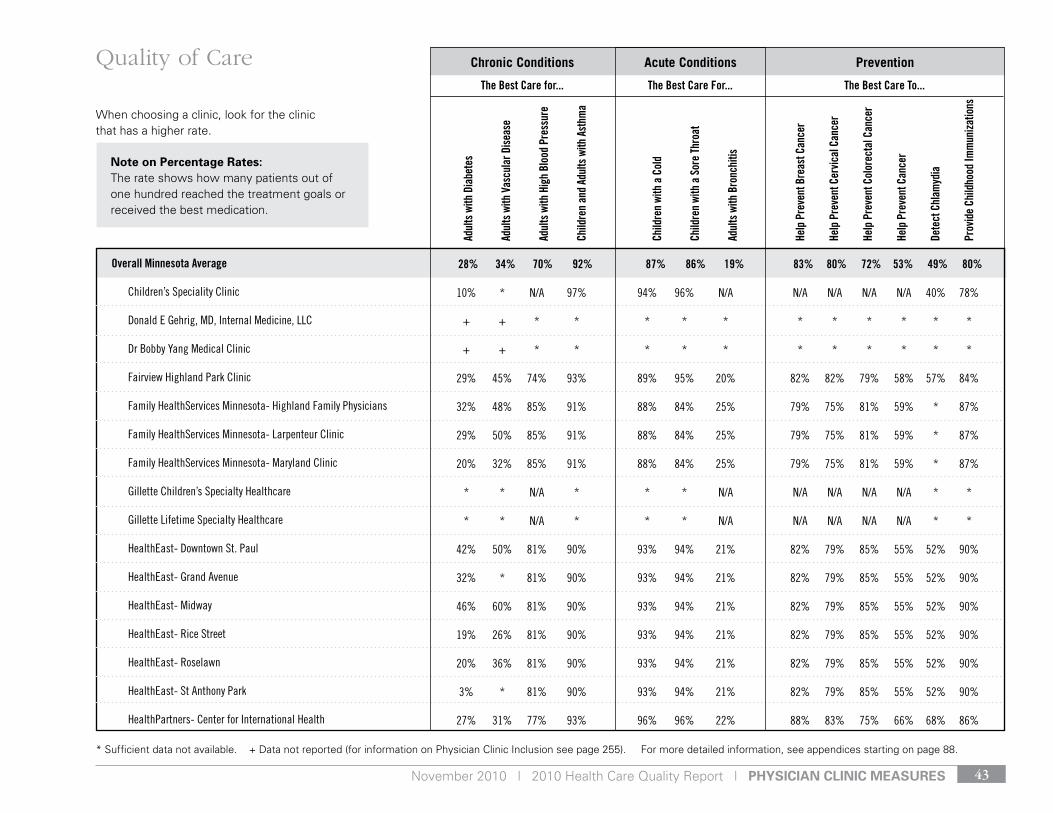
November 2010 | 2010 Health Care Quality Report | pHysiCian CliniC Measures 43
Overall Minnesota Average 28% 34% 70% 92% 87% 86% 19% 83% 80% 72% 53% 49% 80%
Children’s speciality Clinic
donald e gehrig, Md, Internal Medicine, llC
dr Bobby yang Medical Clinic
Fairview Highland Park Clinic
Family Healthservices Minnesota- Highland Family Physicians
Family Healthservices Minnesota- larpenteur Clinic
Family Healthservices Minnesota- Maryland Clinic
gillette Children’s specialty Healthcare
gillette lifetime specialty Healthcare
Healtheast- downtown st. Paul
Healtheast- grand Avenue
Healtheast- Midway
Healtheast- rice street
Healtheast- roselawn
Healtheast- st Anthony Park
HealthPartners- Center for International Health
* Sufficient data not available. + Data not reported (for information on Physician Clinic Inclusion see page 255). For more detailed information, see appendices starting on page 88.
Chronic Conditions PreventionAcute Conditions
The Best Care for... The Best Care For... The Best Care To...
When choosing a clinic, look for the clinic that has a higher rate.
10% * n/A 97% 94% 96% n/A n/A n/A n/A n/A 40% 78%
+ + * * * * * * * * * * *
+ + * * * * * * * * * * *
29% 45% 74% 93% 89% 95% 20% 82% 82% 79% 58% 57% 84%
32% 48% 85% 91% 88% 84% 25% 79% 75% 81% 59% * 87%
29% 50% 85% 91% 88% 84% 25% 79% 75% 81% 59% * 87%
20% 32% 85% 91% 88% 84% 25% 79% 75% 81% 59% * 87%
* * n/A * * * n/A n/A n/A n/A n/A * *
* * n/A * * * n/A n/A n/A n/A n/A * *
42% 50% 81% 90% 93% 94% 21% 82% 79% 85% 55% 52% 90%
32% * 81% 90% 93% 94% 21% 82% 79% 85% 55% 52% 90%
46% 60% 81% 90% 93% 94% 21% 82% 79% 85% 55% 52% 90%
19% 26% 81% 90% 93% 94% 21% 82% 79% 85% 55% 52% 90%
20% 36% 81% 90% 93% 94% 21% 82% 79% 85% 55% 52% 90%
3% * 81% 90% 93% 94% 21% 82% 79% 85% 55% 52% 90%
27% 31% 77% 93% 96% 96% 22% 88% 83% 75% 66% 68% 86%
Adul
ts w
ith D
iabe
tes
Adul
ts w
ith V
ascu
lar D
iseas
e
Adul
ts w
ith H
igh
Bloo
d Pr
essu
re
Child
ren
and
Adul
ts w
ith A
sthm
a
Child
ren
with
a C
old
Child
ren
with
a S
ore
Thro
at
Adul
ts w
ith B
ronc
hitis
Help
Pre
vent
Bre
ast C
ance
r
Help
Pre
vent
Cer
vical
Can
cer
Help
Pre
vent
Col
orec
tal C
ance
r
Help
Pre
vent
Can
cer
Dete
ct C
hlam
ydia
Prov
ide
Child
hood
Imm
uniza
tions
Quality of Care
note on percentage rates:The rate shows how many patients out of one hundred reached the treatment goals or received the best medication.
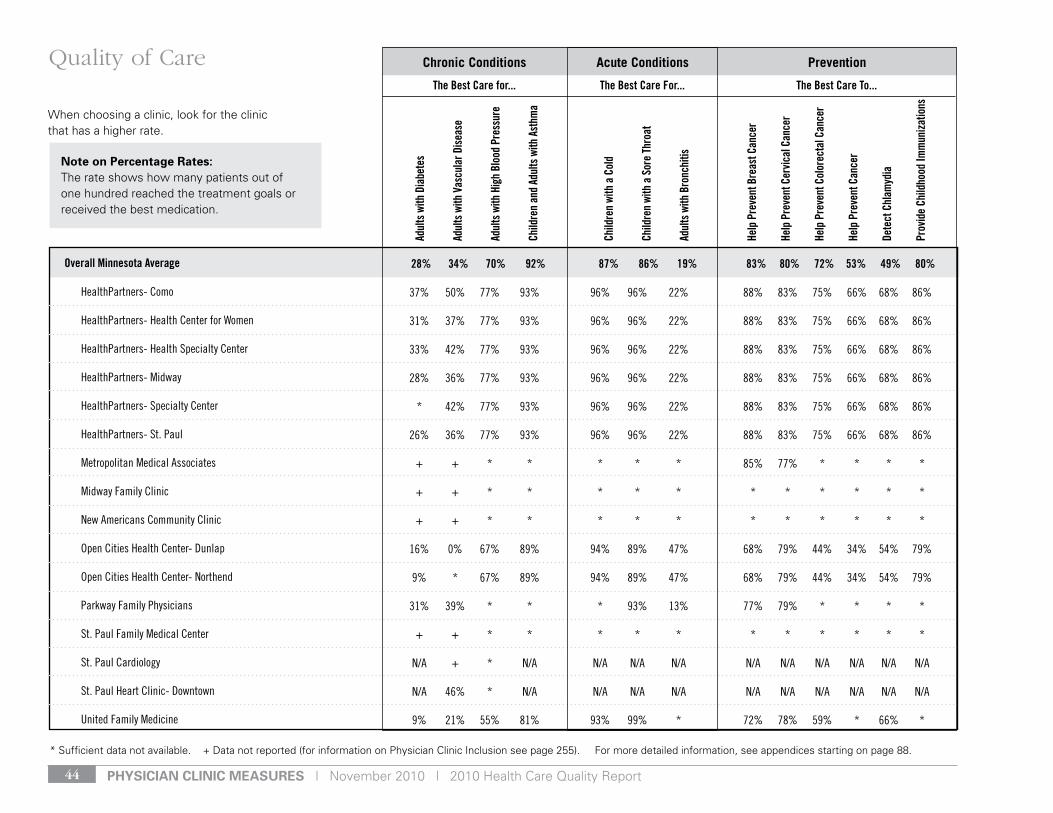
pHysiCian CliniC Measures | November 2010 | 2010 Health Care Quality Report44
Overall Minnesota Average 28% 34% 70% 92% 87% 86% 19% 83% 80% 72% 53% 49% 80%
HealthPartners- Como
HealthPartners- Health Center for Women
HealthPartners- Health specialty Center
HealthPartners- Midway
HealthPartners- specialty Center
HealthPartners- st. Paul
Metropolitan Medical Associates
Midway Family Clinic
new Americans Community Clinic
open Cities Health Center- dunlap
open Cities Health Center- northend
Parkway Family Physicians
st. Paul Family Medical Center
st. Paul Cardiology
st. Paul Heart Clinic- downtown
united Family Medicine
* Sufficient data not available. + Data not reported (for information on Physician Clinic Inclusion see page 255). For more detailed information, see appendices starting on page 88.
Chronic Conditions PreventionAcute Conditions
The Best Care for... The Best Care For... The Best Care To...
When choosing a clinic, look for the clinic that has a higher rate.
37% 50% 77% 93% 96% 96% 22% 88% 83% 75% 66% 68% 86%
31% 37% 77% 93% 96% 96% 22% 88% 83% 75% 66% 68% 86%
33% 42% 77% 93% 96% 96% 22% 88% 83% 75% 66% 68% 86%
28% 36% 77% 93% 96% 96% 22% 88% 83% 75% 66% 68% 86%
* 42% 77% 93% 96% 96% 22% 88% 83% 75% 66% 68% 86%
26% 36% 77% 93% 96% 96% 22% 88% 83% 75% 66% 68% 86%
+ + * * * * * 85% 77% * * * *
+ + * * * * * * * * * * *
+ + * * * * * * * * * * *
16% 0% 67% 89% 94% 89% 47% 68% 79% 44% 34% 54% 79%
9% * 67% 89% 94% 89% 47% 68% 79% 44% 34% 54% 79%
31% 39% * * * 93% 13% 77% 79% * * * *
+ + * * * * * * * * * * *
n/A + * n/A n/A n/A n/A n/A n/A n/A n/A n/A n/A
n/A 46% * n/A n/A n/A n/A n/A n/A n/A n/A n/A n/A
9% 21% 55% 81% 93% 99% * 72% 78% 59% * 66% *
Adul
ts w
ith D
iabe
tes
Adul
ts w
ith V
ascu
lar D
iseas
e
Adul
ts w
ith H
igh
Bloo
d Pr
essu
re
Child
ren
and
Adul
ts w
ith A
sthm
a
Child
ren
with
a C
old
Child
ren
with
a S
ore
Thro
at
Adul
ts w
ith B
ronc
hitis
Help
Pre
vent
Bre
ast C
ance
r
Help
Pre
vent
Cer
vical
Can
cer
Help
Pre
vent
Col
orec
tal C
ance
r
Help
Pre
vent
Can
cer
Dete
ct C
hlam
ydia
Prov
ide
Child
hood
Imm
uniza
tions
Quality of Care
note on percentage rates:The rate shows how many patients out of one hundred reached the treatment goals or received the best medication.
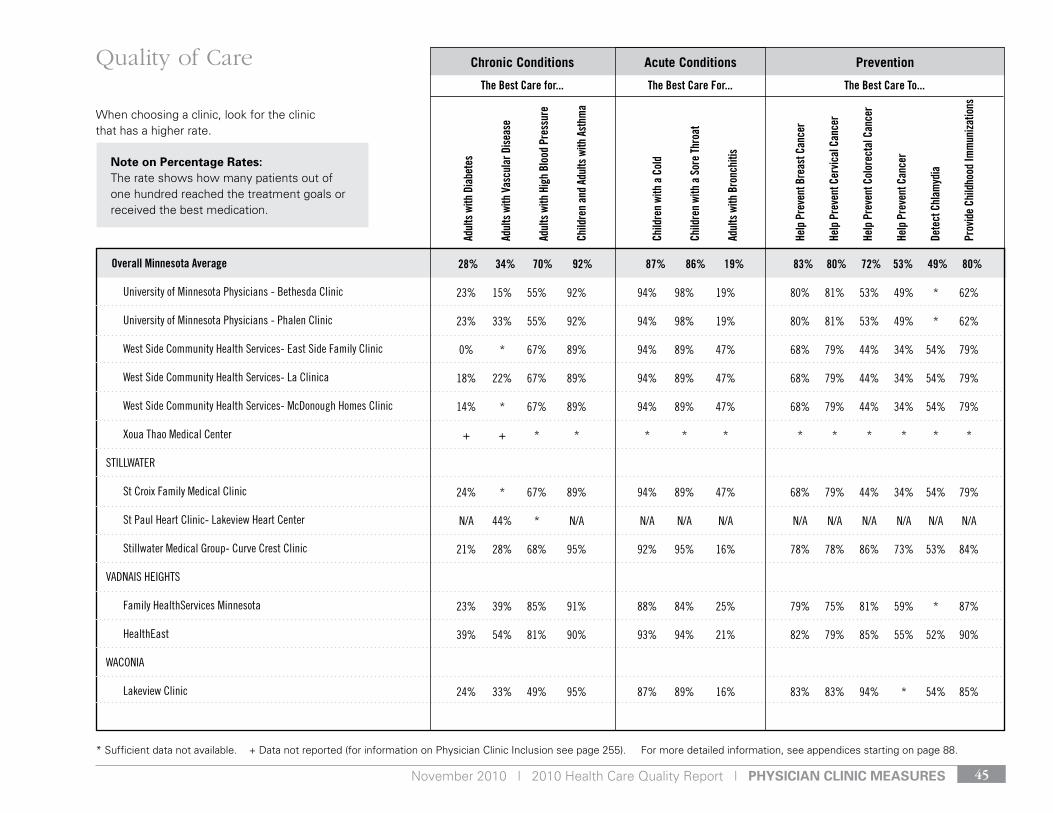
November 2010 | 2010 Health Care Quality Report | pHysiCian CliniC Measures 45
Overall Minnesota Average 28% 34% 70% 92% 87% 86% 19% 83% 80% 72% 53% 49% 80%
university of Minnesota Physicians - Bethesda Clinic
university of Minnesota Physicians - Phalen Clinic
West side Community Health services- east side Family Clinic
West side Community Health services- la Clinica
West side Community Health services- Mcdonough Homes Clinic
Xoua thao Medical Center
stIllWAter
st Croix Family Medical Clinic
st Paul Heart Clinic- lakeview Heart Center
stillwater Medical group- Curve Crest Clinic
vAdnAIs HeIgHts
Family Healthservices Minnesota
Healtheast
WAConIA
lakeview Clinic
* Sufficient data not available. + Data not reported (for information on Physician Clinic Inclusion see page 255). For more detailed information, see appendices starting on page 88.
Chronic Conditions PreventionAcute Conditions
The Best Care for... The Best Care For... The Best Care To...
When choosing a clinic, look for the clinic that has a higher rate.
23% 15% 55% 92% 94% 98% 19% 80% 81% 53% 49% * 62%
23% 33% 55% 92% 94% 98% 19% 80% 81% 53% 49% * 62%
0% * 67% 89% 94% 89% 47% 68% 79% 44% 34% 54% 79%
18% 22% 67% 89% 94% 89% 47% 68% 79% 44% 34% 54% 79%
14% * 67% 89% 94% 89% 47% 68% 79% 44% 34% 54% 79%
+ + * * * * * * * * * * *
24% * 67% 89% 94% 89% 47% 68% 79% 44% 34% 54% 79%
n/A 44% * n/A n/A n/A n/A n/A n/A n/A n/A n/A n/A
21% 28% 68% 95% 92% 95% 16% 78% 78% 86% 73% 53% 84%
23% 39% 85% 91% 88% 84% 25% 79% 75% 81% 59% * 87%
39% 54% 81% 90% 93% 94% 21% 82% 79% 85% 55% 52% 90%
24% 33% 49% 95% 87% 89% 16% 83% 83% 94% * 54% 85%
Adul
ts w
ith D
iabe
tes
Adul
ts w
ith V
ascu
lar D
iseas
e
Adul
ts w
ith H
igh
Bloo
d Pr
essu
re
Child
ren
and
Adul
ts w
ith A
sthm
a
Child
ren
with
a C
old
Child
ren
with
a S
ore
Thro
at
Adul
ts w
ith B
ronc
hitis
Help
Pre
vent
Bre
ast C
ance
r
Help
Pre
vent
Cer
vical
Can
cer
Help
Pre
vent
Col
orec
tal C
ance
r
Help
Pre
vent
Can
cer
Dete
ct C
hlam
ydia
Prov
ide
Child
hood
Imm
uniza
tions
Quality of Care
note on percentage rates:The rate shows how many patients out of one hundred reached the treatment goals or received the best medication.
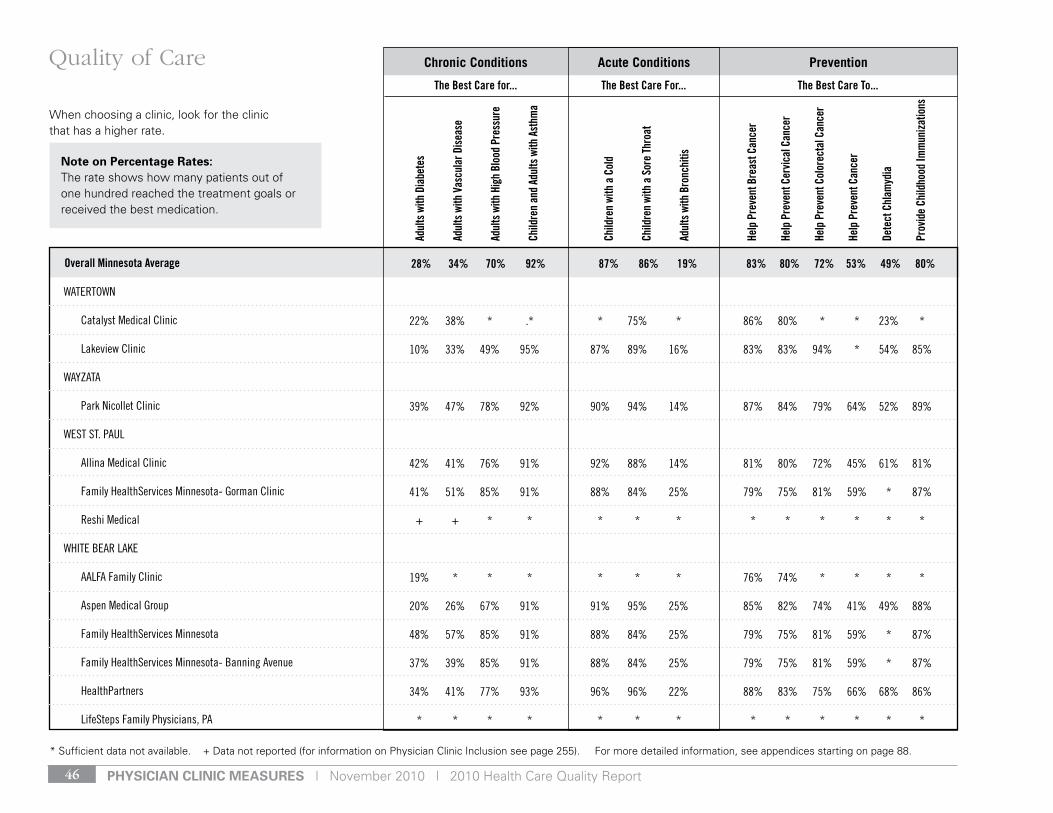
pHysiCian CliniC Measures | November 2010 | 2010 Health Care Quality Report46
Overall Minnesota Average 28% 34% 70% 92% 87% 86% 19% 83% 80% 72% 53% 49% 80%
WAtertoWn
Catalyst Medical Clinic
lakeview Clinic
WAyzAtA
Park nicollet Clinic
West st. PAul
Allina Medical Clinic
Family Healthservices Minnesota- gorman Clinic
reshi Medical
WHIte BeAr lAke
AAlFA Family Clinic
Aspen Medical group
Family Healthservices Minnesota
Family Healthservices Minnesota- Banning Avenue
HealthPartners
lifesteps Family Physicians, PA
* Sufficient data not available. + Data not reported (for information on Physician Clinic Inclusion see page 255). For more detailed information, see appendices starting on page 88.
Chronic Conditions PreventionAcute Conditions
The Best Care for... The Best Care For... The Best Care To...
When choosing a clinic, look for the clinic that has a higher rate.
22% 38% * .* * 75% * 86% 80% * * 23% *
10% 33% 49% 95% 87% 89% 16% 83% 83% 94% * 54% 85%
39% 47% 78% 92% 90% 94% 14% 87% 84% 79% 64% 52% 89%
42% 41% 76% 91% 92% 88% 14% 81% 80% 72% 45% 61% 81%
41% 51% 85% 91% 88% 84% 25% 79% 75% 81% 59% * 87%
+ + * * * * * * * * * * *
19% * * * * * * 76% 74% * * * *
20% 26% 67% 91% 91% 95% 25% 85% 82% 74% 41% 49% 88%
48% 57% 85% 91% 88% 84% 25% 79% 75% 81% 59% * 87%
37% 39% 85% 91% 88% 84% 25% 79% 75% 81% 59% * 87%
34% 41% 77% 93% 96% 96% 22% 88% 83% 75% 66% 68% 86%
* * * * * * * * * * * * *
Adul
ts w
ith D
iabe
tes
Adul
ts w
ith V
ascu
lar D
iseas
e
Adul
ts w
ith H
igh
Bloo
d Pr
essu
re
Child
ren
and
Adul
ts w
ith A
sthm
a
Child
ren
with
a C
old
Child
ren
with
a S
ore
Thro
at
Adul
ts w
ith B
ronc
hitis
Help
Pre
vent
Bre
ast C
ance
r
Help
Pre
vent
Cer
vical
Can
cer
Help
Pre
vent
Col
orec
tal C
ance
r
Help
Pre
vent
Can
cer
Dete
ct C
hlam
ydia
Prov
ide
Child
hood
Imm
uniza
tions
Quality of Care
note on percentage rates:The rate shows how many patients out of one hundred reached the treatment goals or received the best medication.
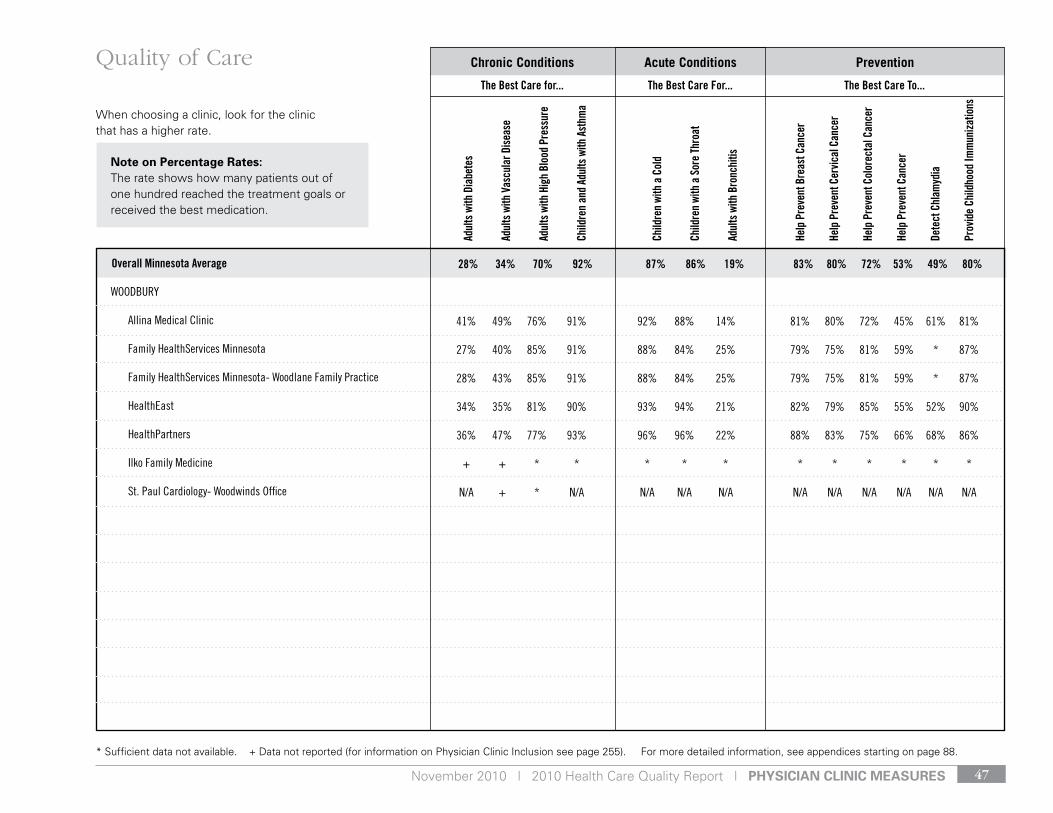
November 2010 | 2010 Health Care Quality Report | pHysiCian CliniC Measures 47
Overall Minnesota Average 28% 34% 70% 92% 87% 86% 19% 83% 80% 72% 53% 49% 80%
WoodBury
Allina Medical Clinic
Family Healthservices Minnesota
Family Healthservices Minnesota- Woodlane Family Practice
Healtheast
HealthPartners
Ilko Family Medicine
st. Paul Cardiology- Woodwinds office
* Sufficient data not available. + Data not reported (for information on Physician Clinic Inclusion see page 255). For more detailed information, see appendices starting on page 88.
Chronic Conditions PreventionAcute Conditions
The Best Care for... The Best Care For... The Best Care To...
When choosing a clinic, look for the clinic that has a higher rate.
41% 49% 76% 91% 92% 88% 14% 81% 80% 72% 45% 61% 81%
27% 40% 85% 91% 88% 84% 25% 79% 75% 81% 59% * 87%
28% 43% 85% 91% 88% 84% 25% 79% 75% 81% 59% * 87%
34% 35% 81% 90% 93% 94% 21% 82% 79% 85% 55% 52% 90%
36% 47% 77% 93% 96% 96% 22% 88% 83% 75% 66% 68% 86%
+ + * * * * * * * * * * *
n/A + * n/A n/A n/A n/A n/A n/A n/A n/A n/A n/A
Adul
ts w
ith D
iabe
tes
Adul
ts w
ith V
ascu
lar D
iseas
e
Adul
ts w
ith H
igh
Bloo
d Pr
essu
re
Child
ren
and
Adul
ts w
ith A
sthm
a
Child
ren
with
a C
old
Child
ren
with
a S
ore
Thro
at
Adul
ts w
ith B
ronc
hitis
Help
Pre
vent
Bre
ast C
ance
r
Help
Pre
vent
Cer
vical
Can
cer
Help
Pre
vent
Col
orec
tal C
ance
r
Help
Pre
vent
Can
cer
Dete
ct C
hlam
ydia
Prov
ide
Child
hood
Imm
uniza
tions
Quality of Care
note on percentage rates:The rate shows how many patients out of one hundred reached the treatment goals or received the best medication.

Hospital Measures | November 2010 | 2010 Health Care Quality Report48
Hospital Measures region 3
twin Cities Metro: Anoka, Carver, Dakota, Hennepin, Ramsey, Scott, Washington
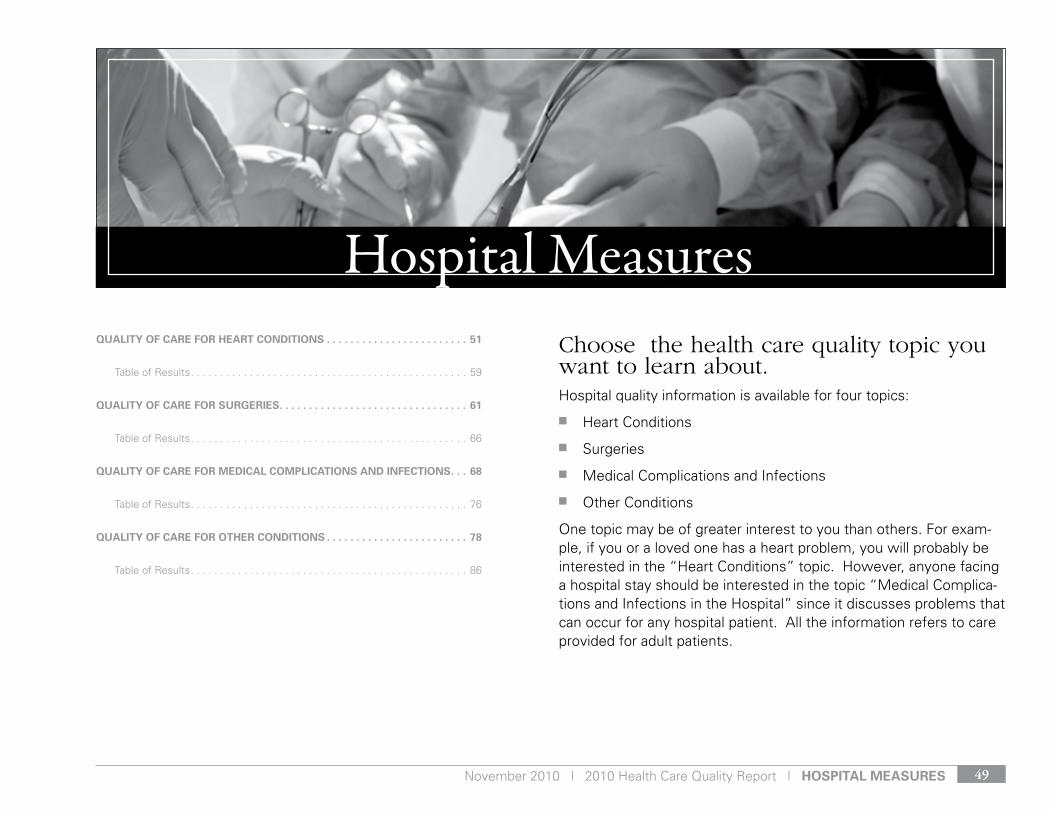
November 2010 | 2010 Health Care Quality Report | Hospital Measures 49
Quality of Care for Heart ConDitions . . . . . . . . . . . . . . . . . . . . . . . . 51
Table of Results . . . . . . . . . . . . . . . . . . . . . . . . . . . . . . . . . . . . . . . . . . . . . . . 59
Quality of Care for surgeries . . . . . . . . . . . . . . . . . . . . . . . . . . . . . . . . 61
Table of Results . . . . . . . . . . . . . . . . . . . . . . . . . . . . . . . . . . . . . . . . . . . . . . . 66
Quality of Care for MeDiCal CoMpliCations anD infeCtions . . . 68
Table of Results . . . . . . . . . . . . . . . . . . . . . . . . . . . . . . . . . . . . . . . . . . . . . . . 76
Quality of Care for otHer ConDitions . . . . . . . . . . . . . . . . . . . . . . . . 78
Table of Results . . . . . . . . . . . . . . . . . . . . . . . . . . . . . . . . . . . . . . . . . . . . . . . 86
Choose the health care quality topic you want to learn about. Hospital quality information is available for four topics:
n Heart Conditions
n Surgeries
n Medical Complications and Infections
n Other Conditions
One topic may be of greater interest to you than others. For exam-ple, if you or a loved one has a heart problem, you will probably be interested in the “Heart Conditions” topic. However, anyone facing a hospital stay should be interested in the topic “Medical Complica-tions and Infections in the Hospital” since it discusses problems that can occur for any hospital patient. All the information refers to care provided for adult patients.
Hospital Measures
Quality HealtH Care Measures | November 2010 | 2010 Health Care Quality Report50
Each topic includes information on several different quality indica-tors. A quality indicator is a piece of information, usually a percent-age rate, that shows how often patients had a particular experience when they received medical care. These experiences reflect a particular aspect of health care quality. Each health topic is briefly described below, with examples of quality indicators for that topic. To learn about all the indicators presented for each topic, please turn to the appropriate page noted in the index at the start of this section.
Heart Conditions: This section includes measures related to whether patients received the best type of care for heart attacks and heart failure.
surgeries: This section includes information associated with heart surgeries and surgery to repair an abnormally enlarged artery sup-plying blood to the lower half of the body. There is also information regarding surgery-related complications and treatments.
Medical Complications and infections in the Hospital for adult patients: This section includes problems or complications that can be experienced by any hospital patient, as well as infection preven-tion measures.
other Conditions: This section includes information about the best types of treatment for pneumonia patients, and problems related to hip fracture surgeries, and childbirth, specifically how often a birth-related injury occurs to the mother.
More Information about the ResultsBe sure to note whether a higher or lower percentage rate is better for the measure you are interested in. This will vary across the different measures for hospitals. Keep in mind the percentage rate is related to how many patients out of one hundred met the criteria outlined in the measure. For example, if the hospital rate for the “Heart Attack: Aspirin Given When Patients Arrived at the Hospi-tal” measure is 88%, this means 88 out of 100 heart attack patients received aspirin when they arrived at the hospital.
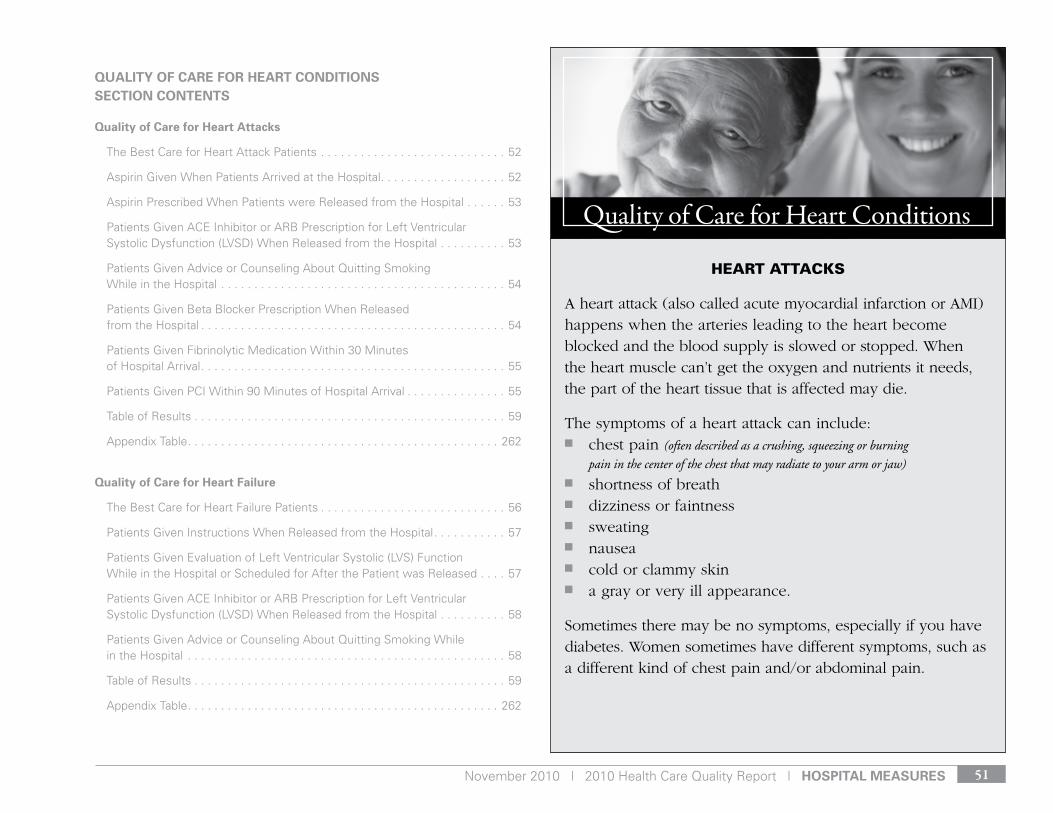
November 2010 | 2010 Health Care Quality Report | Hospital Measures 51
Quality of Care for Heart ConDitions seCtion Contents
Quality of Care for Heart attacks
The Best Care for Heart Attack Patients . . . . . . . . . . . . . . . . . . . . . . . . . . . . 52
Aspirin Given When Patients Arrived at the Hospital . . . . . . . . . . . . . . . . . . . 52
Aspirin Prescribed When Patients were Released from the Hospital . . . . . . 53
Patients Given ACE Inhibitor or ARB Prescription for Left Ventricular Systolic Dysfunction (LVSD) When Released from the Hospital . . . . . . . . . . 53
Patients Given Advice or Counseling About Quitting Smoking While in the Hospital . . . . . . . . . . . . . . . . . . . . . . . . . . . . . . . . . . . . . . . . . . . 54
Patients Given Beta Blocker Prescription When Released from the Hospital . . . . . . . . . . . . . . . . . . . . . . . . . . . . . . . . . . . . . . . . . . . . . . 54
Patients Given Fibrinolytic Medication Within 30 Minutes of Hospital Arrival . . . . . . . . . . . . . . . . . . . . . . . . . . . . . . . . . . . . . . . . . . . . . . 55
Patients Given PCI Within 90 Minutes of Hospital Arrival . . . . . . . . . . . . . . . 55
Table of Results . . . . . . . . . . . . . . . . . . . . . . . . . . . . . . . . . . . . . . . . . . . . . . . 59
Appendix Table . . . . . . . . . . . . . . . . . . . . . . . . . . . . . . . . . . . . . . . . . . . . . . . 262
Quality of Care for Heart failure
The Best Care for Heart Failure Patients . . . . . . . . . . . . . . . . . . . . . . . . . . . . 56
Patients Given Instructions When Released from the Hospital . . . . . . . . . . . 57
Patients Given Evaluation of Left Ventricular Systolic (LVS) Function While in the Hospital or Scheduled for After the Patient was Released . . . . 57
Patients Given ACE Inhibitor or ARB Prescription for Left Ventricular Systolic Dysfunction (LVSD) When Released from the Hospital . . . . . . . . . . 58
Patients Given Advice or Counseling About Quitting Smoking While in the Hospital . . . . . . . . . . . . . . . . . . . . . . . . . . . . . . . . . . . . . . . . . . . . . . . . 58
Table of Results . . . . . . . . . . . . . . . . . . . . . . . . . . . . . . . . . . . . . . . . . . . . . . . 59
Appendix Table . . . . . . . . . . . . . . . . . . . . . . . . . . . . . . . . . . . . . . . . . . . . . . . 262
Heart attacks
A heart attack (also called acute myocardial infarction or AMI) happens when the arteries leading to the heart become blocked and the blood supply is slowed or stopped. When the heart muscle can’t get the oxygen and nutrients it needs, the part of the heart tissue that is affected may die.
The symptoms of a heart attack can include:n chest pain (often described as a crushing, squeezing or burning
pain in the center of the chest that may radiate to your arm or jaw)n shortness of breathn dizziness or faintnessn sweatingn nausean cold or clammy skinn a gray or very ill appearance.
Sometimes there may be no symptoms, especially if you have diabetes. Women sometimes have different symptoms, such as a different kind of chest pain and/or abdominal pain.
Quality of Care for Heart Conditions
Hospital Measures | November 2010 | 2010 Health Care Quality Report52
The Best Care for Heart Attack Patients
What is the measure?This measure shows the percent of patients receiving ALL of the appropriate care that they should have received based on their clini-cal condition. For heart attack patients this includes the remaining measures in this section:
n Aspirin Given When Patients Arrive at the Hospitaln Aspirin Given When Patients were Released from the Hospitaln Patients Given ACE Inhibitor or ARB Prescription for left ventricular
systolic dysfunction (LVSD) When Released from the Hospitaln Patients Given Advice or Counseling About Quitting Smoking While in the Hospitaln Patients Given Beta Blocker Prescription When Released
from the Hospitaln Patients Given Fibrinolytic Medication Within 30 Minutes
of Hospital Arrivaln Patients Given PCI Within 90 Minutes of Hospital Arrival
The measure takes patient individuality into consideration, looking at one patient and his/her episode of care at a time, related to heart at-tacks (also known as acute myocardial infarction or AMI).
Why is this important?This measure is a composite, or all-or-none, quality of care measure called an appropri-ate care measure (ACM). These types of measures are patient-focused measures that provide a way of looking at whether a patient received ALL of the “appropriate” or “right care” (recommended treatments) that he or she should have received, based on his or her clinical condition.
performance on this measure ranged from 88 percent to 100 percent.
Measure sourCe: acute Myorcardial infarction appropriate Care
Measure (aMi-aCM)
Heart Attack: Aspirin Given When Patients Arrived at the Hospital
What is the measure?This measure shows the percent of heart attack patients who were given (or took) aspirin within 24 hours of arrival at the hospital.
Why is this important? The heart is a muscle that gets oxygen through blood vessels. Sometimes blood clots can block these blood vessels, and the heart can’t get enough oxygen. This can cause a heart attack (also known as an acute myocardial infarction or AMI). Chewing an aspirin as soon as symptoms of a heart attack begin may help reduce the sever-ity of the attack. This chart shows the percent of heart attack pa-tients who were given (or took) aspirin within 24 hours of arrival at the hospital.
performance on this measure ranged from 93 percent to 100 percent.
Measure sourCe: Hospital Compare Measure
(aMi-1: aspirin at arrival)When choosing a hospital, look for the hospital that has a
higher rate.
When choosing a hospital, look for the hospital that has a
higher rate.
November 2010 | 2010 Health Care Quality Report | Hospital Measures 53
Heart Attack: Aspirin Prescribed When Patients were Released from the Hospital
What is the measure?This measure shows the percent of heart attack patients who were pre-scribed aspirin when they were dis-charged from the hospital.
Why is this important? Blood clots can block blood vessels. Aspirin can help prevent blood clots from forming or help dissolve blood clots that have formed. Following a heart attack, continued use of aspirin may help reduce the risk of another heart attack. Aspirin can have side effects like stom-ach inflammation, bleeding, or allergic reactions. Talk to your health care provider before using aspirin on a regular basis to make sure it’s safe for you.
performance on this measure ranged from 95 percent to 100 percent.
Measure sourCe: Hospital Compare Measure
(aMi-2: aspirin prescribed at discharge)
Heart Attack: Patients Given ACE Inhibitor or ARB Prescription for Left Ventricular Systolic Dysfunction (LVSD) When Released from the Hospital
What is the measure?This measure is used to assess the percent of heart attack patients with left ventricular systolic dysfunction (LVSD) who were pre-scribed an ACE Inhibitor or ARB when they were discharged from the hospital. For purposes of this measure, LVSD is defined as chart documentation of a left ventricular ejection fraction (LVEF) less than 40% or a narrative description of left ventricular systolic (LVS) func-tion consistent with moderate or severe systolic dysfunction.
Why is this important? ACE (angiotensin converting enzyme) inhibitors and ARBs (angiotensin receptor blockers) are medicines used to treat patients with heart failure and are particularly beneficial in those patients with heart failure and decreased function of the left side of the heart. Early treatment with ACE inhibitors and ARBs in patients who have heart failure symptoms or decreased heart function after a heart attack can also reduce their risk of death from future heart attacks. ACE inhibi-tors and ARBs work by limiting the effects of a hormone that narrows blood vessels, and may thus lower blood pressure and reduce the work the heart has to perform. Since the ways in which these two kinds of drugs work are different, your doctor will decide which drug is most appropriate for you. If you have a heart attack and/or heart failure, you should get a prescription for ACE inhibitors or ARBs if you have decreased heart function before you leave the hospital.
performance on this measure ranged from 96 percent to 100 percent.
Measure sourCe: Hospital Compare Measure
(aMi-3: aCei or arB for left ventricular systolic Dysfunction (lvsD))
When choosing a hospital, look for the hospital that has a
higher rate.
When choosing a hospital, look for the hospital that has a
higher rate.

Hospital Measures | November 2010 | 2010 Health Care Quality Report54
Heart Attack: Patients Given Advice or Counseling About Quitting Smoking While in the Hospital
What is the measure?This measure shows the percent of heart attack patients with a history of smoking cigarettes, who were given advice/counsel-ing about stopping smoking while they were in the hospital. For the purposes of this measure, a smoker is defined as someone who has smoked cigarettes anytime during the year prior to hospital arrival.
Why is this important? Smoking increases your risk for devel-oping blood clots and heart disease that can result in a heart attack, heart failure or stroke. Smoking causes your arteries to thicken and your blood vessels to narrow. Fat and plaque stick to the walls of your arteries, which makes it harder for blood to flow. Reduced blood flow to your heart may result in chest pain, high blood pressure, and an increased heart rate. Smoking is also linked to lung disease and cancer, and can cause premature death. It is important that you get information to help you quit smoking before you leave the hospital. Quitting may help pre-vent another heart attack.
performance on this measure ranged from 99 percent to 100 percent.
Measure sourCe: Hospital Compare Measure
(aMi-4: adult smoking cessation advice/counseling)
Heart Attack: Patients Given Beta Blocker Prescription When Released from the Hospital
What is the measure?This measure shows the percent of heart attack patients who were prescribed a beta-blocker when they were discharged from the hospital.
Why is this important? Beta blockers are a type of medicine that is used to lower blood pressure, treat chest pain (angina) and heart failure, and to help prevent a heart attack. Beta blockers relieve the stress on your heart by slowing the heart rate and reducing the force with which your heart muscles contract to pump blood. They also help keep blood vessels from constricting in your heart, brain, and body. If you have a heart attack, you should get a prescrip-tion for a beta blocker before you leave the hospital.
performance on this measure ranged from 93 percent to 100 percent.
Measure sourCe: Hospital Compare Measure
(aMi-5: Beta-blocker prescribed at discharge)
When choosing a hospital, look for the hospital that has a
higher rate.
When choosing a hospital, look for the hospital that has a
higher rate.
November 2010 | 2010 Health Care Quality Report | Hospital Measures 55
Heart Attack: Patients Given Fibrinolytic Medication Within 30 Minutes of Hospital Arrival
What is the measure?This measure shows the percent of heart attack patients receiving fibrinolytic therapy during the hospital stay and having a time from hospital arrival to fibrinolysis of 30 minutes or less.
Why is this important? The heart is a muscle that gets oxygen through blood vessels. Sometimes blood clots can block these blood vessels and the heart can’t get enough oxygen. This can cause a heart attack. Fibrinolytic drugs are medicines that can help dissolve blood clots in blood vessels and improve blood flow to your heart. You should get them within 30 minutes of arrival at the hospital.
Measure sourCe: Hospital Compare Measure (aMi-7a: fibrinolytic
therapy received within 30 minutes of hospital arrival)
Heart Attack: Patients Given PCI Within 90 Minutes of Hospital Arrival
What is the measure?This measure shows the percentage of heart attack patients receiving primary Percutaneous Coronary Intervention (PCI) during the hospital stay. For the purposes of this measure, the PCI was received within 90 minutes or less from the time the patient arrived at the hospital.
Why is this important?The heart is a muscle that gets oxygen through blood vessels. Sometimes blood clots can block these blood vessels, and the heart can’t get enough oxygen. This can cause a heart attack. Percutaneous Coronary Interventions (PCI) are procedures that are among the most effective ways to open blocked blood vessels and help prevent further heart muscle damage. A PCI is performed by a doctor to open the blockage and increase blood flow in blocked blood vessels. Improving blood flow to your heart as quickly as possible lessens the damage to your heart muscle. It also can increase your chances of surviving a heart attack. There are three procedures com-monly described by the term PCI. These procedures all involve a cath-eter (a flexible tube) that is inserted, often through your leg, and guided through the blood vessels to the blockage. The three procedures are:
n Angioplasty - a balloon is inflated to open the blood vessel. n Stenting - a small wire tube called a stent is placed in the blood vessel
to hold it open. n Atherectomy - a blade or laser cuts through and removes the blockage.
performance on this measure ranged from 87 percent to 100 percent.
Measure sourCe: Hospital Compare Measure (aMi-8a: primary percutane-
ous coronary intervention (pCi) received within 90 minutes of hospital arrival)
When choosing a hospital, look for the hospital that has a
higher rate.
When choosing a hospital, look for the hospital that has a
higher rate.
Hospital Measures | November 2010 | 2010 Health Care Quality Report56
Heart failure
Heart Failure is a weakening of the heart’s pumping power. With heart failure, your body doesn’t get enough oxygen and nutrients to meet its needs. Your heart tries to pump more blood, but the muscle walls become weaker over time.
Symptoms of heart failure may include:n shortness of breath from fluid in the lungsn swelling (such as in legs, ankles or abdomen)n dizzinessn fatiguen weaknessn cold or clammy skinn a rapid or irregular heartbeat.
Heart failure can be a result of heart condition due ton hardening of the arteries, also known as coronary
artery disease,n a heart attack,n cardiomyopathy (heart muscle damage from infection
or alcohol or drug abuse), orn an overworked heart (caused over time by conditions
like high blood pressure, kidney disease, diabetes, or a defect from birth).
The Best Care for Heart Failure Patients
What is the measure?This measure shows the percent of patients receiving ALL of the appropriate care that they should have received based on their clinical condition. For heart failure patients this includes the remaining measures in this section:
n Patients Given Instructions When Released from the Hospitaln Patients Given Evaluation of Left Ventricular Systolic (LVS)
Function While in the Hospital or Scheduled for After the Patient was Released
n Patients Given ACE Inhibitor or ARB Prescription for Left Ventricular Systolic Dysfunction (LVSD) When Released from the Hospital
n Patients Given Advice or Counseling About Quitting Smoking While in the Hospital
The measure takes patient individuality into consideration, look-ing at one patient and their episode of care at a time, related to heart failure.
Why is this important? This measure is a composite, or all-or-none, quality of care measure called an appropriate care measure (ACM). These types of measures are patient-focused measures that provide a way of looking at whether a patient received ALL of the “appropriate” or “right care” (recommended treatments) that he or she should have received, based on his or her clini-cal condition. Each patient is unique and may not be eligible for every type of care for a condition. The measure takes this into consideration.
performance on this measure ranged from 26 percent to 98 percent.
Measure sourCe: Heart failure appropriate Care Measure (Hf-aCM)
When choosing a hospital, look for the hospital that has a
higher rate.
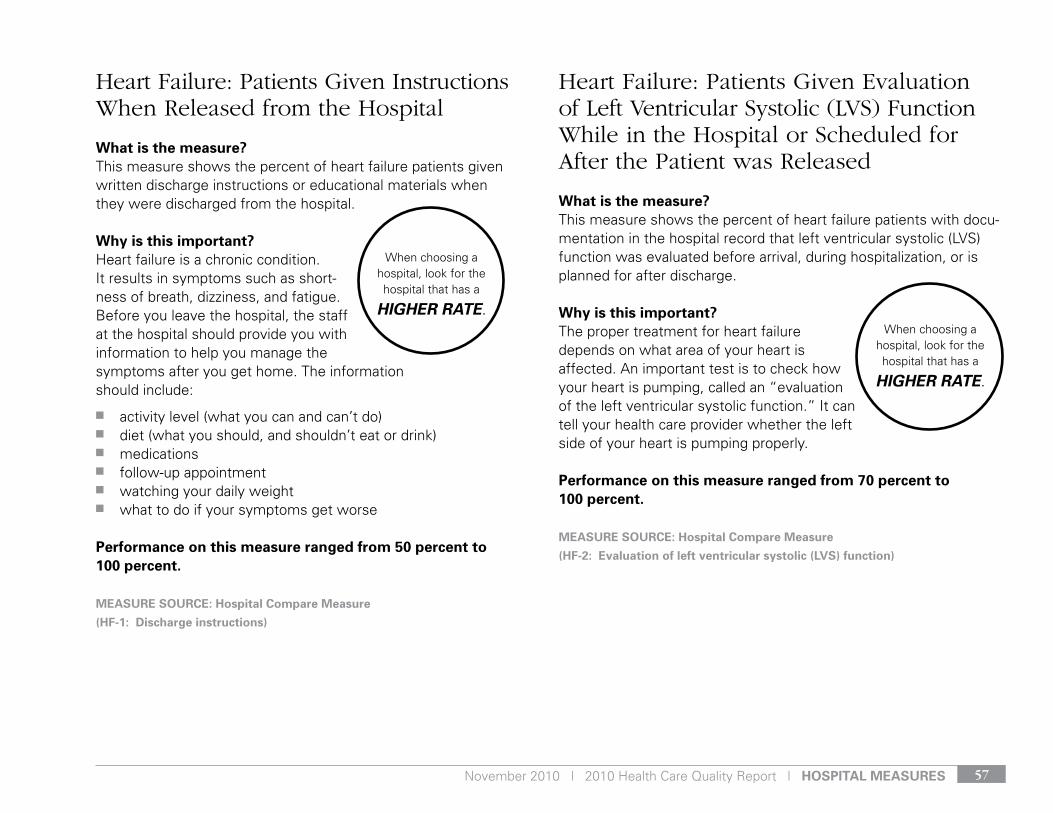
November 2010 | 2010 Health Care Quality Report | Hospital Measures 57
Heart Failure: Patients Given Instructions When Released from the Hospital
What is the measure?This measure shows the percent of heart failure patients given written discharge instructions or educational materials when they were discharged from the hospital.
Why is this important?Heart failure is a chronic condition. It results in symptoms such as short-ness of breath, dizziness, and fatigue. Before you leave the hospital, the staff at the hospital should provide you with information to help you manage the symptoms after you get home. The information should include:
n activity level (what you can and can’t do) n diet (what you should, and shouldn’t eat or drink) n medications n follow-up appointment n watching your daily weight n what to do if your symptoms get worse
performance on this measure ranged from 50 percent to 100 percent.
Measure sourCe: Hospital Compare Measure
(Hf-1: Discharge instructions)
Heart Failure: Patients Given Evaluation of Left Ventricular Systolic (LVS) Function While in the Hospital or Scheduled for After the Patient was Released
What is the measure?This measure shows the percent of heart failure patients with docu-mentation in the hospital record that left ventricular systolic (LVS) function was evaluated before arrival, during hospitalization, or is planned for after discharge.
Why is this important?The proper treatment for heart failure depends on what area of your heart is affected. An important test is to check how your heart is pumping, called an “evaluation of the left ventricular systolic function.” It can tell your health care provider whether the left side of your heart is pumping properly.
performance on this measure ranged from 70 percent to 100 percent.
Measure sourCe: Hospital Compare Measure
(Hf-2: evaluation of left ventricular systolic (lvs) function)
When choosing a hospital, look for the hospital that has a
higher rate.When choosing a
hospital, look for the hospital that has a
higher rate.
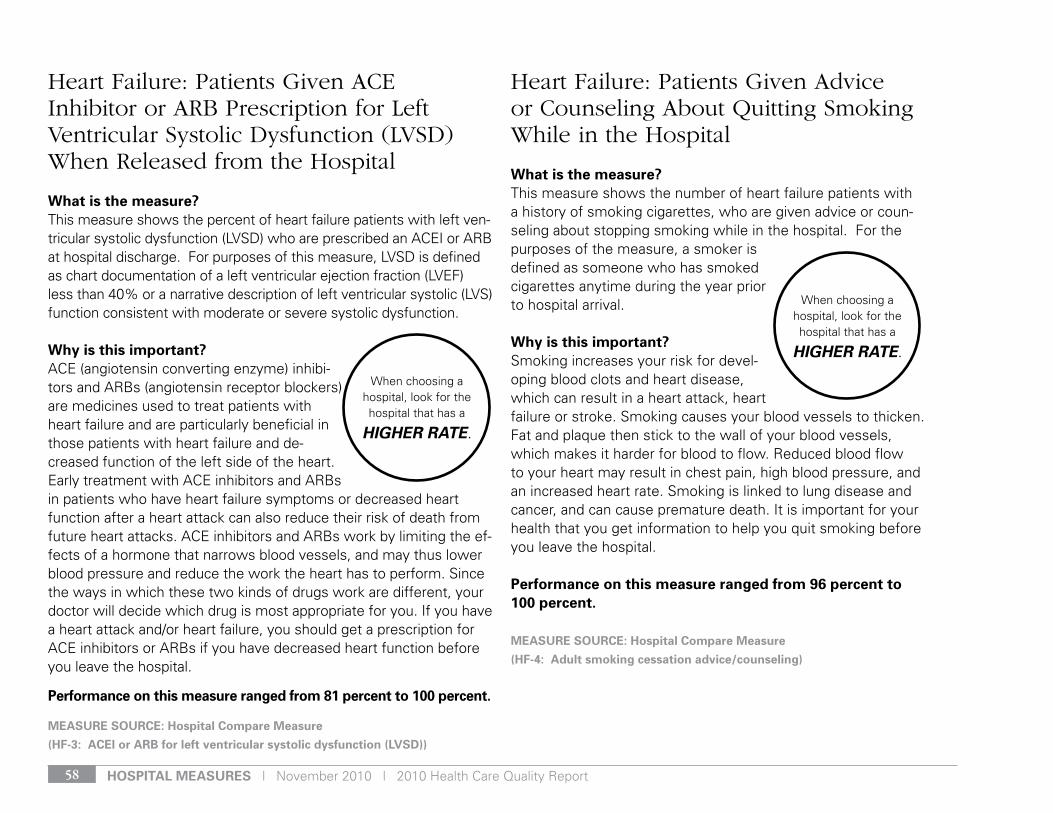
Hospital Measures | November 2010 | 2010 Health Care Quality Report58
Heart Failure: Patients Given ACE Inhibitor or ARB Prescription for Left Ventricular Systolic Dysfunction (LVSD) When Released from the Hospital
What is the measure?This measure shows the percent of heart failure patients with left ven-tricular systolic dysfunction (LVSD) who are prescribed an ACEI or ARB at hospital discharge. For purposes of this measure, LVSD is defined as chart documentation of a left ventricular ejection fraction (LVEF) less than 40% or a narrative description of left ventricular systolic (LVS) function consistent with moderate or severe systolic dysfunction.
Why is this important? ACE (angiotensin converting enzyme) inhibi-tors and ARBs (angiotensin receptor blockers) are medicines used to treat patients with heart failure and are particularly beneficial in those patients with heart failure and de-creased function of the left side of the heart. Early treatment with ACE inhibitors and ARBs in patients who have heart failure symptoms or decreased heart function after a heart attack can also reduce their risk of death from future heart attacks. ACE inhibitors and ARBs work by limiting the ef-fects of a hormone that narrows blood vessels, and may thus lower blood pressure and reduce the work the heart has to perform. Since the ways in which these two kinds of drugs work are different, your doctor will decide which drug is most appropriate for you. If you have a heart attack and/or heart failure, you should get a prescription for ACE inhibitors or ARBs if you have decreased heart function before you leave the hospital.
performance on this measure ranged from 81 percent to 100 percent.
Measure sourCe: Hospital Compare Measure
(Hf-3: aCei or arB for left ventricular systolic dysfunction (lvsD))
Heart Failure: Patients Given Advice or Counseling About Quitting Smoking While in the Hospital
What is the measure?This measure shows the number of heart failure patients with a history of smoking cigarettes, who are given advice or coun-seling about stopping smoking while in the hospital. For the purposes of the measure, a smoker is defined as someone who has smoked cigarettes anytime during the year prior to hospital arrival.
Why is this important? Smoking increases your risk for devel-oping blood clots and heart disease, which can result in a heart attack, heart failure or stroke. Smoking causes your blood vessels to thicken. Fat and plaque then stick to the wall of your blood vessels, which makes it harder for blood to flow. Reduced blood flow to your heart may result in chest pain, high blood pressure, and an increased heart rate. Smoking is linked to lung disease and cancer, and can cause premature death. It is important for your health that you get information to help you quit smoking before you leave the hospital.
performance on this measure ranged from 96 percent to 100 percent.
Measure sourCe: Hospital Compare Measure
(Hf-4: adult smoking cessation advice/counseling)
When choosing a hospital, look for the hospital that has a
higher rate.
When choosing a hospital, look for the hospital that has a
higher rate.
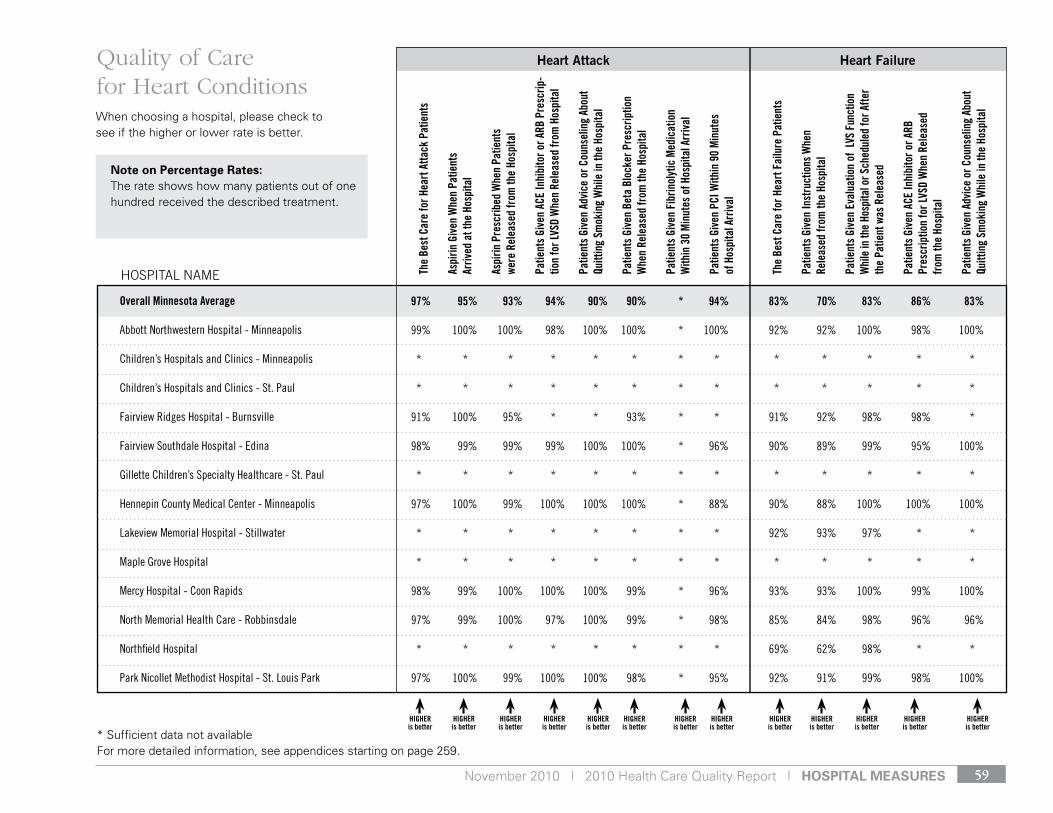
November 2010 | 2010 Health Care Quality Report | Hospital Measures 59
Heart Attack Heart Failure
The
Best
Car
e fo
r Hea
rt A
ttack
Pat
ient
s
Aspi
rin G
iven
Whe
n Pa
tient
s
Arriv
ed a
t the
Hos
pita
l
Aspi
rin P
resc
ribed
Whe
n Pa
tient
s we
re R
elea
sed
from
the
Hosp
ital
Patie
nts
Give
n AC
E In
hibi
tor o
r ARB
Pre
scrip
-tio
n fo
r LVS
D W
hen
Rele
ased
from
Hos
pita
l
Patie
nts
Give
n Ad
vice
or C
ouns
elin
g Ab
out
Quitt
ing
Smok
ing
Whi
le in
the
Hosp
ital
Patie
nts
Give
n Be
ta B
lock
er P
resc
riptio
n
Whe
n Re
leas
ed fr
om th
e Ho
spita
l
Patie
nts
Give
n Fi
brin
olyt
ic M
edic
atio
n
With
in 3
0 M
inut
es o
f Hos
pita
l Arr
ival
Patie
nts
Give
n PC
I With
in 9
0 M
inut
es
of H
ospi
tal A
rriv
al
The
Best
Car
e fo
r Hea
rt F
ailu
re P
atie
nts
Patie
nts
Give
n In
stru
ctio
ns W
hen
Re
leas
ed fr
om th
e Ho
spita
l
Patie
nts
Give
n Ev
alua
tion
of L
VS F
unct
ion
Whi
le in
the
Hosp
ital o
r Sch
edul
ed fo
r Afte
r th
e Pa
tient
was
Rel
ease
d
Patie
nts
Give
n AC
E In
hibi
tor o
r ARB
Pr
escr
iptio
n fo
r LVS
D W
hen
Rele
ased
fr
om th
e Ho
spita
l
Patie
nts
Give
n Ad
vice
or C
ouns
elin
g Ab
out
Quitt
ing
Smok
ing
Whi
le in
the
Hosp
ital
Quality of Care for Heart Conditions
HOSPITAL NAME
HIGHER is better
HIGHER is better
HIGHER is better
HIGHER is better
HIGHER is better
HIGHER is better
HIGHER is better
HIGHER is better
HIGHER is better
HIGHER is better
HIGHER is better
HIGHER is better
HIGHER is better
* Sufficient data not availableFor more detailed information, see appendices starting on page 259.
When choosing a hospital, please check to see if the higher or lower rate is better.
Overall Minnesota Average
Abbott northwestern Hospital - Minneapolis
Children’s Hospitals and Clinics - Minneapolis
Children’s Hospitals and Clinics - st. Paul
Fairview ridges Hospital - Burnsville
Fairview southdale Hospital - edina
gillette Children’s specialty Healthcare - st. Paul
Hennepin County Medical Center - Minneapolis
lakeview Memorial Hospital - stillwater
Maple grove Hospital
Mercy Hospital - Coon rapids
north Memorial Health Care - robbinsdale
northfield Hospital
Park nicollet Methodist Hospital - st. louis Park
97% 95% 93% 94% 90% 90% * 94% 83% 70% 83% 86% 83%
99% 100% 100% 98% 100% 100% * 100% 92% 92% 100% 98% 100%
* * * * * * * * * * * * *
* * * * * * * * * * * * *
91% 100% 95% * * 93% * * 91% 92% 98% 98% *
98% 99% 99% 99% 100% 100% * 96% 90% 89% 99% 95% 100%
* * * * * * * * * * * * *
97% 100% 99% 100% 100% 100% * 88% 90% 88% 100% 100% 100%
* * * * * * * * 92% 93% 97% * *
* * * * * * * * * * * * *
98% 99% 100% 100% 100% 99% * 96% 93% 93% 100% 99% 100%
97% 99% 100% 97% 100% 99% * 98% 85% 84% 98% 96% 96%
* * * * * * * * 69% 62% 98% * *
97% 100% 99% 100% 100% 98% * 95% 92% 91% 99% 98% 100%
note on percentage rates:The rate shows how many patients out of one hundred received the described treatment.
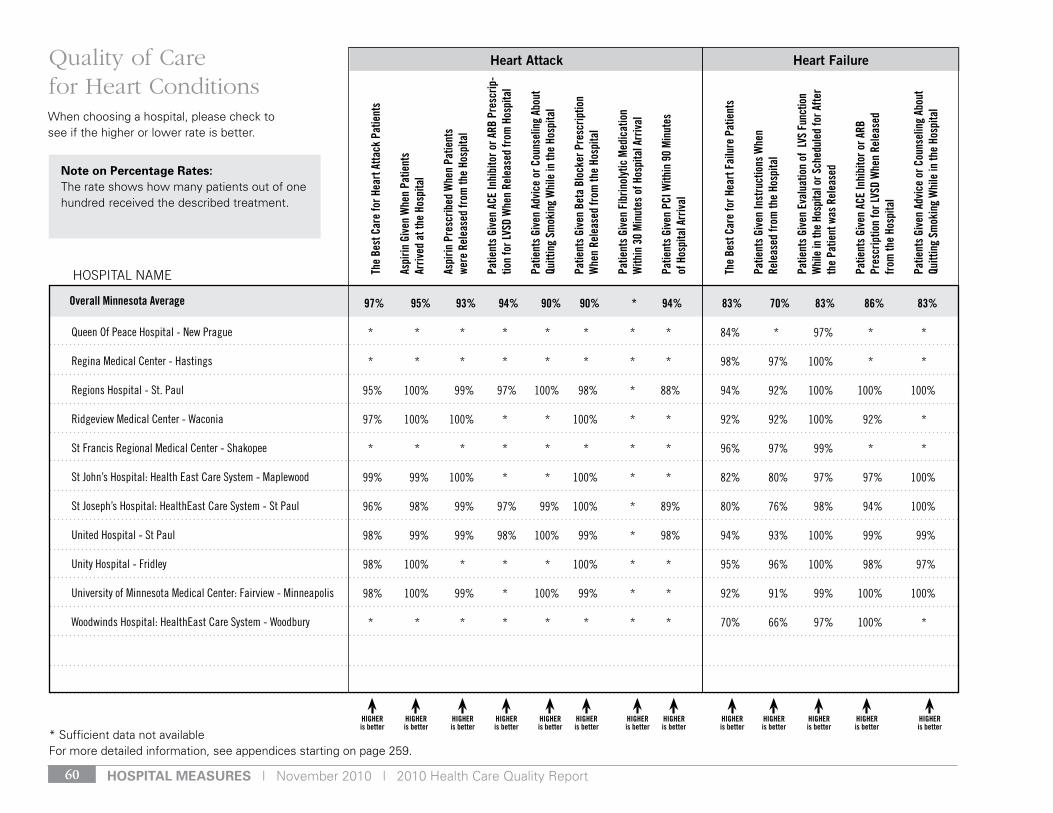
Hospital Measures | November 2010 | 2010 Health Care Quality Report60
Heart Attack Heart Failure
Queen of Peace Hospital - new Prague
regina Medical Center - Hastings
regions Hospital - st. Paul
ridgeview Medical Center - Waconia
st Francis regional Medical Center - shakopee
st John’s Hospital: Health east Care system - Maplewood
st Joseph’s Hospital: Healtheast Care system - st Paul
united Hospital - st Paul
unity Hospital - Fridley
university of Minnesota Medical Center: Fairview - Minneapolis
Woodwinds Hospital: Healtheast Care system - Woodbury
* * * * * * * * 84% * 97% * *
* * * * * * * * 98% 97% 100% * *
95% 100% 99% 97% 100% 98% * 88% 94% 92% 100% 100% 100%
97% 100% 100% * * 100% * * 92% 92% 100% 92% *
* * * * * * * * 96% 97% 99% * *
99% 99% 100% * * 100% * * 82% 80% 97% 97% 100%
96% 98% 99% 97% 99% 100% * 89% 80% 76% 98% 94% 100%
98% 99% 99% 98% 100% 99% * 98% 94% 93% 100% 99% 99%
98% 100% * * * 100% * * 95% 96% 100% 98% 97%
98% 100% 99% * 100% 99% * * 92% 91% 99% 100% 100%
* * * * * * * * 70% 66% 97% 100% *
The
Best
Car
e fo
r Hea
rt A
ttack
Pat
ient
s
Aspi
rin G
iven
Whe
n Pa
tient
s
Arriv
ed a
t the
Hos
pita
l
Aspi
rin P
resc
ribed
Whe
n Pa
tient
s we
re R
elea
sed
from
the
Hosp
ital
Patie
nts
Give
n AC
E In
hibi
tor o
r ARB
Pre
scrip
-tio
n fo
r LVS
D W
hen
Rele
ased
from
Hos
pita
l
Patie
nts
Give
n Ad
vice
or C
ouns
elin
g Ab
out
Quitt
ing
Smok
ing
Whi
le in
the
Hosp
ital
Patie
nts
Give
n Be
ta B
lock
er P
resc
riptio
n
Whe
n Re
leas
ed fr
om th
e Ho
spita
l
Patie
nts
Give
n Fi
brin
olyt
ic M
edic
atio
n
With
in 3
0 M
inut
es o
f Hos
pita
l Arr
ival
Patie
nts
Give
n PC
I With
in 9
0 M
inut
es
of H
ospi
tal A
rriv
al
The
Best
Car
e fo
r Hea
rt F
ailu
re P
atie
nts
Patie
nts
Give
n In
stru
ctio
ns W
hen
Re
leas
ed fr
om th
e Ho
spita
l
Patie
nts
Give
n Ev
alua
tion
of L
VS F
unct
ion
Whi
le in
the
Hosp
ital o
r Sch
edul
ed fo
r Afte
r th
e Pa
tient
was
Rel
ease
d
Patie
nts
Give
n AC
E In
hibi
tor o
r ARB
Pr
escr
iptio
n fo
r LVS
D W
hen
Rele
ased
fr
om th
e Ho
spita
l
Patie
nts
Give
n Ad
vice
or C
ouns
elin
g Ab
out
Quitt
ing
Smok
ing
Whi
le in
the
Hosp
ital
Quality of Care for Heart Conditions
HOSPITAL NAME
HIGHER is better
HIGHER is better
HIGHER is better
HIGHER is better
HIGHER is better
HIGHER is better
HIGHER is better
HIGHER is better
HIGHER is better
HIGHER is better
HIGHER is better
HIGHER is better
HIGHER is better
* Sufficient data not availableFor more detailed information, see appendices starting on page 259.
When choosing a hospital, please check to see if the higher or lower rate is better.
Overall Minnesota Average 97% 95% 93% 94% 90% 90% * 94% 83% 70% 83% 86% 83%
note on percentage rates:The rate shows how many patients out of one hundred received the described treatment.
November 2010 | 2010 Health Care Quality Report | Hospital Measures 61
Quality of Care for surgeries seCtion Contents
Quality of Heart surgeries
Heart Bypass Surgery: Number of Operations and Death Rate . . . . . . . . . . . 62
Angioplasty Heart Surgery: Number of Operations and Death Rate . . . . . . . 62
Table of Results . . . . . . . . . . . . . . . . . . . . . . . . . . . . . . . . . . . . . . . . . . . . . . . 66
Appendix Table . . . . . . . . . . . . . . . . . . . . . . . . . . . . . . . . . . . . . . . . . . . . . . . 264
Quality of other surgeries
Surgical Repair of an Abdominal Aortic Aneurysm: Number of Operations and Death Rate . . . . . . . . . . . . . . . . . . . . . . . . . . . . . 63
Vaginal Hysterectomy Surgical Site Infection Rate . . . . . . . . . . . . . . . . . . . . 64
Surgery Patients Whose Doctors Ordered Treatment to Prevent Blood Clots After Certain Types of Surgeries . . . . . . . . . . . . . . . . 64
Surgery Patients Who Received Treatment at the Right Time to Prevent Blood Clots After Certain Types of Surgery . . . . . . . . . . . . . . . . . 65
Table of Results . . . . . . . . . . . . . . . . . . . . . . . . . . . . . . . . . . . . . . . . . . . . . . . 66
Appendix Table . . . . . . . . . . . . . . . . . . . . . . . . . . . . . . . . . . . . . . . . . . . . . . . 266
Heart surgeries
When arteries carrying blood to the heart get blocked, this can lead to a heart attack. There are a number of surgical interventions which can unblock these blood vessels and restore blood flow. Since these surgeries are so technically difficult, outcomes will generally be better at hospitals that perform more of these procedures. The measures in this sec-tion report the number of surgeries performed and the death rate for heart bypass surgery and angioplasty heart surgery.
Use the information in this section to see how hospitals compare in their quality of care related to heart surgeries.
Quality of Care for Surgeries

Hospital Measures | November 2010 | 2010 Health Care Quality Report62
Heart Bypass Surgery: Number of Operations and Death Rate
What is the measure? Heart bypass surgery can restore good blood flow to the heart. The coronary artery bypass graft (CABG) surgery reroutes, or “bypasses,” blood around clogged arteries to improve blood flow and oxygen to the heart. These mea-sures show the number of times a hos-pital performed a CABG and the rate of patient deaths related to the surgery. Research shows that, in general, when hospitals do these procedures frequently, they are more likely to have good results. Often, but not always, a hospital that has a higher number of operations will have lower death rates. Why is this important?The arteries that bring blood to the heart muscle can become clogged by fat and other substances. This can slow or stop blood flow through the heart’s blood vessels, leading to chest pain or a heart attack. A bypass surgery may be recommended to implant tissue from another part of the body to act as a tube that allows blood to flow around one or more blocked or narrowed arteries.
Although CABG is a fairly common form of open heart surgery, it is a technically difficult procedure. Errors during the surgery may lead to other health problems, such as heart attack, stroke, and death. About 3-4% of patients die from CABG surgery. Your surgi-cal risks are related to your age, other medical conditions and the number of procedures you have during one operation. Hospitals that perform more of these surgeries have been associated with better outcomes, including a lower number of deaths.
Measure sourCe: aHrQ inpatient Quality indicators (iQi 5: CaBg vol-ume and iQi 12: CaBg Mortality rate)
Angioplasty Heart Surgery: Number of Operations and Death Rate
What is the measure?Percutaneous transluminal coronary angioplasty (PTCA) can restore good blood flow to the heart. PTCA surgery involves inserting a tube through the leg or arm, into the heart, to open blocked arteries and keep them open. These measures show the number of times a hospital performed this procedure and the rate of patient deaths related to the surgery. Research shows that, in general, when hospitals do these procedures frequently, they are more likely to have good results. Often, but not always, a hospital that has a higher number of procedures will have lower death rates.
Why is this important?The arteries that bring blood to the heart muscle can become clogged by fat and other substances. This can slow or stop blood flow through the heart’s blood vessels, leading to chest pain or a heart attack. A PTCA may be recommended to open blocked arteries and improve blood to flow to the heart. A catheter (long hollow tube) is inserted through the leg or arm, into the heart, to open blocked arteries.
Although PTCA is a fairly common form of heart surgery, it is a technically difficult procedure. Errors during surgery may lead to other health problems. About 1.31% of U.S. patients die from PTCA surgery. Your surgical risks are related to your age and other medical conditions.
Measure sourCe: aHrQ inpatient Quality indicators (iQi 6: ptCa vol-ume and iQi 30: ptCa Mortality rate)
When choosing a hospital, look for the hospital that has a
higher number of operations and
lower death rate.
When choosing a hospital, look for the hospital that has a
higher number of operations and
lower death rate.
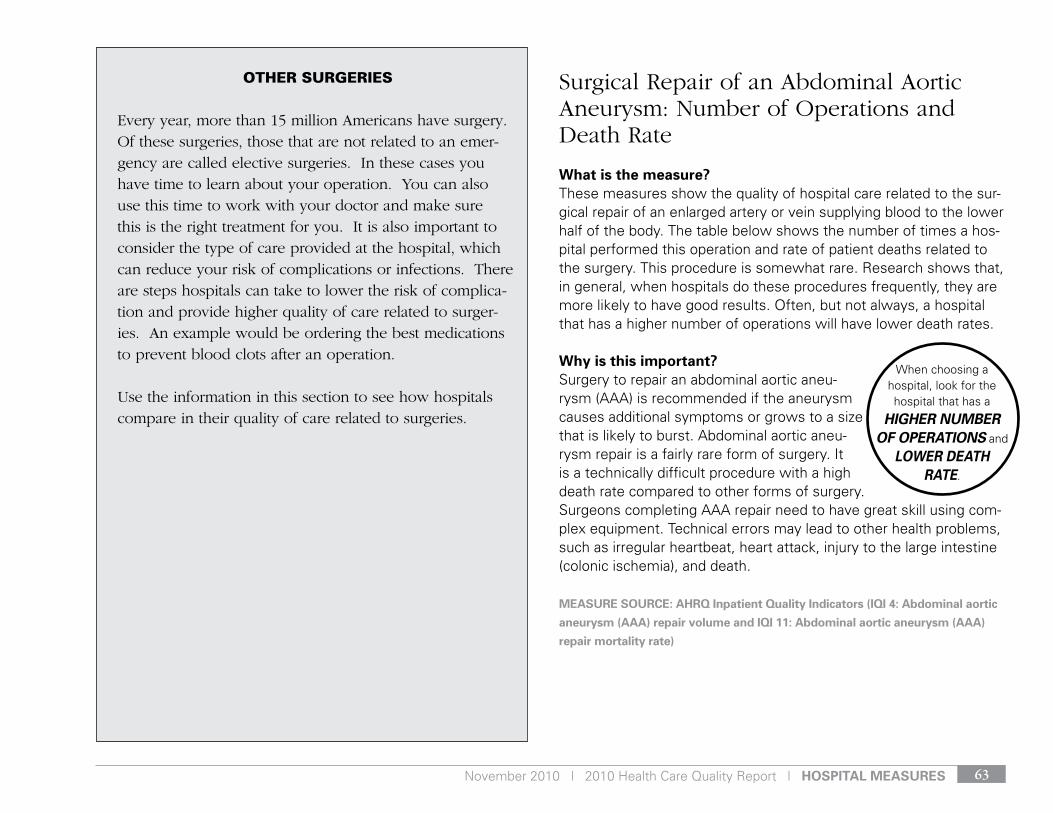
November 2010 | 2010 Health Care Quality Report | Hospital Measures 63
OtHer surgeries
Every year, more than 15 million Americans have surgery. Of these surgeries, those that are not related to an emer-gency are called elective surgeries. In these cases you have time to learn about your operation. You can also use this time to work with your doctor and make sure this is the right treatment for you. It is also important to consider the type of care provided at the hospital, which can reduce your risk of complications or infections. There are steps hospitals can take to lower the risk of complica-tion and provide higher quality of care related to surger-ies. An example would be ordering the best medications to prevent blood clots after an operation.
Use the information in this section to see how hospitals compare in their quality of care related to surgeries.
Surgical Repair of an Abdominal Aortic Aneurysm: Number of Operations and Death Rate
What is the measure?These measures show the quality of hospital care related to the sur-gical repair of an enlarged artery or vein supplying blood to the lower half of the body. The table below shows the number of times a hos-pital performed this operation and rate of patient deaths related to the surgery. This procedure is somewhat rare. Research shows that, in general, when hospitals do these procedures frequently, they are more likely to have good results. Often, but not always, a hospital that has a higher number of operations will have lower death rates.
Why is this important? Surgery to repair an abdominal aortic aneu-rysm (AAA) is recommended if the aneurysm causes additional symptoms or grows to a size that is likely to burst. Abdominal aortic aneu-rysm repair is a fairly rare form of surgery. It is a technically difficult procedure with a high death rate compared to other forms of surgery. Surgeons completing AAA repair need to have great skill using com-plex equipment. Technical errors may lead to other health problems, such as irregular heartbeat, heart attack, injury to the large intestine (colonic ischemia), and death.
Measure sourCe: aHrQ inpatient Quality indicators (iQi 4: abdominal aortic
aneurysm (aaa) repair volume and iQi 11: abdominal aortic aneurysm (aaa)
repair mortality rate)
When choosing a hospital, look for the hospital that has a
higher number of operations and
lower death rate.

Hospital Measures | November 2010 | 2010 Health Care Quality Report64
Vaginal Hysterectomy Surgical Site Infection Rate
What is the measure?This measure shows the percent of vaginal hysterectomy patients with a surgical site infection.
Why is this important? Surgical site infections are a common complication of care. They can in-crease the length and cost of a hospital stay. About 2.6 percent of operations are complicated by surgical site infec-tions every year. By following proven strategies for infection prevention, these rates can be reduced. This would save the patient from this potentially serious complication and the hospital the addi-tional resources associated with that care.
Measure sourCe: Healthcare-associated infection Measure
(vaginal hysterectomy surgical site infection rate)
Surgery Patients Whose Doctors Ordered Treatment to Prevent Blood Clots After Certain Types of Surgeries
What is the measure?This measure shows the percent of surgery patients whose doctors ordered treatments to prevent blood clots after certain types of surgeries. In this case, the recommended venous thromboembolism (VTE) prophylaxis, or treatment to prevent blood clots, was ordered anytime from hospital arrival to 24 hours after surgery end time.
Why is this important?Certain surgeries increase the risk that the patient will develop a blood clot (venous thromboembolism). When patients stay still for a long time after some types of surgery, they are more likely to develop a blood clot in the veins of the legs, thighs, or pelvis. A blood clot slows down the flow of blood, causing swelling, redness, and pain. A blood clot can also break off and travel to other parts of the body. If the blood clot gets into the lung, it is a serious problem that can cause death.
To help prevent blood clots from forming after surgery, doctors can order treatments to be used just before or after the surgery. These include blood-thinning medications, elastic support stock-ings, or mechanical air stockings that help with blood flow in the legs.
performance on this measure ranged from 75 percent to 100 percent.
Measure sourCe: Hospital Compare Measure (sCip-vte-1: surgery pa-
tients with recommended venous thromboembolism prophylaxis ordered)
When choosing a hospital, look for the hospital that has a
higher rate.
When choosing a hospital, look for the hospital
that has a lower infection
rate.
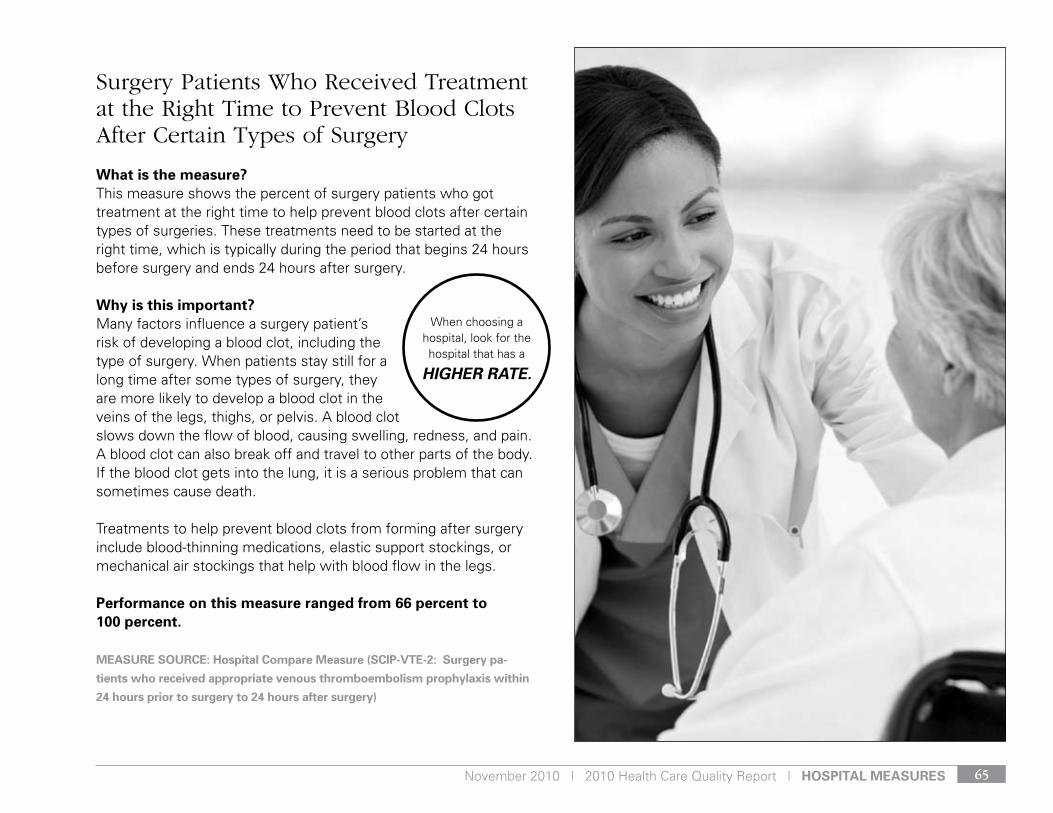
November 2010 | 2010 Health Care Quality Report | Hospital Measures 65
Surgery Patients Who Received Treatment at the Right Time to Prevent Blood Clots After Certain Types of Surgery
What is the measure?This measure shows the percent of surgery patients who got treatment at the right time to help prevent blood clots after certain types of surgeries. These treatments need to be started at the right time, which is typically during the period that begins 24 hours before surgery and ends 24 hours after surgery.
Why is this important? Many factors influence a surgery patient’s risk of developing a blood clot, including the type of surgery. When patients stay still for a long time after some types of surgery, they are more likely to develop a blood clot in the veins of the legs, thighs, or pelvis. A blood clot slows down the flow of blood, causing swelling, redness, and pain. A blood clot can also break off and travel to other parts of the body. If the blood clot gets into the lung, it is a serious problem that can sometimes cause death.
Treatments to help prevent blood clots from forming after surgery include blood-thinning medications, elastic support stockings, or mechanical air stockings that help with blood flow in the legs.
performance on this measure ranged from 66 percent to 100 percent.
Measure sourCe: Hospital Compare Measure (sCip-vte-2: surgery pa-
tients who received appropriate venous thromboembolism prophylaxis within
24 hours prior to surgery to 24 hours after surgery)
When choosing a hospital, look for the hospital that has a
higher rate.

Hospital Measures | November 2010 | 2010 Health Care Quality Report66
HOSPITAL NAME
HIGHER is better
HIGHER is better
* Sufficient data not available or procedure is not performed at hospital.For more detailed information, see appendices starting on page 259.
Overall Minnesota Average
Abbott northwestern Hospital - Minneapolis
Children’s Hospitals and Clinics - Minneapolis
Children’s Hospitals and Clinics - st. Paul
Fairview ridges Hospital - Burnsville
Fairview southdale Hospital - edina
gillette Children’s specialty Healthcare - st. Paul
Hennepin County Medical Center - Minneapolis
lakeview Memorial Hospital - stillwater
Maple grove Hospital
Mercy Hospital - Coon rapids
north Memorial Health Care - robbinsdale
northfield Hospital
Park nicollet Methodist Hospital - st. louis Park
87% 86%
367 1% Better 1824 1% Better 122 2% Better sAMe 1% 99% 98%
* * * * * * * * * * * * *
* * * * * * * * * * * * *
* * * * * * * * * sAMe 0% 87% 82%
189 1% sAMe 480 2% sAMe 36 7% sAMe sAMe 0% 97% 93%
* * * * * * * * * * * * *
50 0% sAMe 175 2% sAMe * * * * * 98% 96%
* * * * * * * * * sAMe 4% 82% 82%
* * * * * * * * * * * * *
207 0% Better 954 1% sAMe 41 0% sAMe sAMe 0% 99% 97%
108 2% sAMe 540 2% sAMe 47 8% sAMe sAMe 0% 97% 97%
* * * * * * * * * * * 86% 82%
221 3% sAMe 473 2% sAMe 50 3% Better sAMe 2% 93% 93%
Num
ber o
f Ope
ratio
ns
Risk
Adj
uste
d De
ath
Rate
Whe
n Co
mpa
red
to
Exp
ecte
d Ra
te
Num
ber o
f Ope
ratio
ns
Risk
Adj
uste
d De
ath
Rate
Whe
n Co
mpa
red
to
Exp
ecte
d Ra
te
Num
ber o
f Ope
ratio
ns
Risk
Adj
uste
d De
ath
Rate
Whe
n Co
mpa
red
to
Exp
ecte
d Ra
te
Whe
n Co
mpa
red
to
Othe
r Hos
pita
ls
Infe
ctio
n Ra
te
Surg
ery
Patie
nts
Who
se D
octo
rs
Orde
red
Trea
tmen
t to
Prev
ent
Bloo
d Cl
ots
Afte
r Cer
tain
Type
s
of S
urge
ries
Surg
ery
Patie
nts
Who
Rec
eive
d
Trea
tmen
t at t
he R
ight
Tim
e to
Pr
even
t Blo
od C
lots
Afte
r Cer
tain
Ty
pes
of S
urge
ry
Heart Surgeries Other SurgeriesQuality of Care for Surgeries
Heart Bypass SurgeryAngioplasty
Heart Surgery
Surgical Repair of an Abdominal Aortic Aneurysm
Vaginal Hysterectomy Surgical Site InfectionWhen choosing a hospital, please check to
see if the higher or lower rate is better.
Number of Operations: the number of these surgeries performed.Risk Adjusted Rate: this takes the severity of each patient’s illness into account. When Compared to Expected: this comparison is based on how the hospital’s risk adjusted rate measures up to the expected rate of other similar hospitals, identifying it as performing the SAME, BETTER, or WORSE. When selecting a hospital, look for one with at least a SAME rating and ideally a BETTER rating.
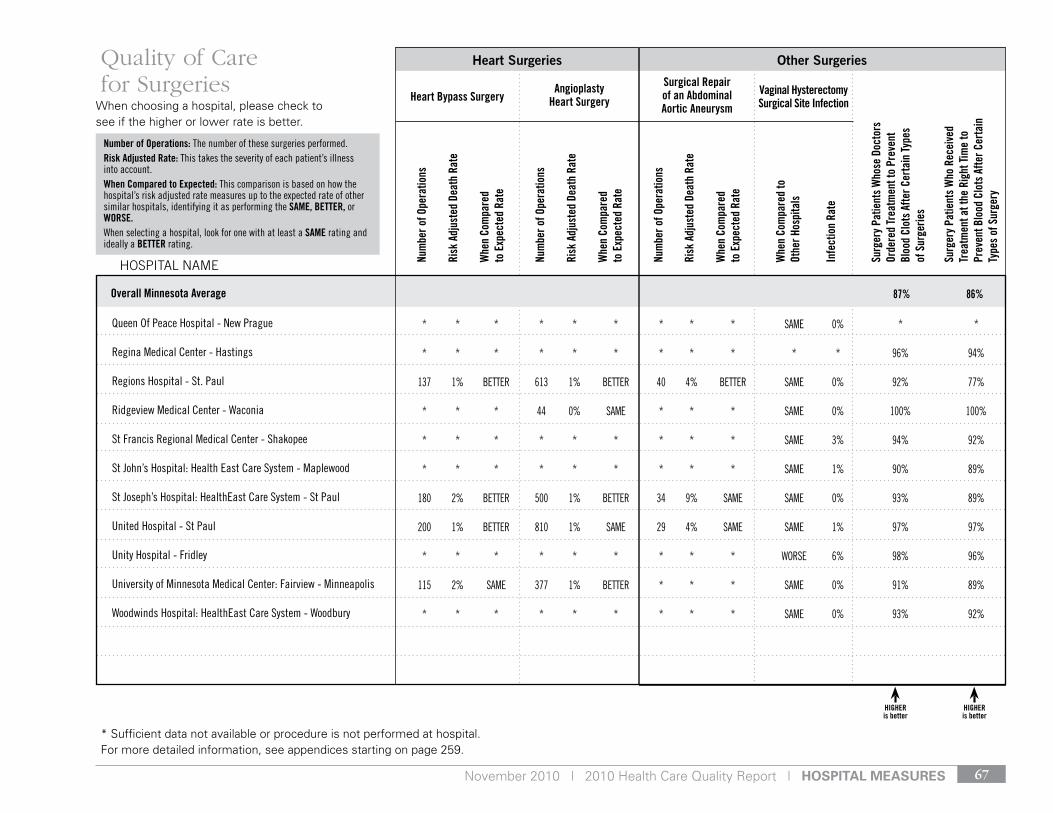
November 2010 | 2010 Health Care Quality Report | Hospital Measures 67
HOSPITAL NAME
HIGHER is better
HIGHER is better
* Sufficient data not available or procedure is not performed at hospital.For more detailed information, see appendices starting on page 259.
Queen of Peace Hospital - new Prague
regina Medical Center - Hastings
regions Hospital - st. Paul
ridgeview Medical Center - Waconia
st Francis regional Medical Center - shakopee
st John’s Hospital: Health east Care system - Maplewood
st Joseph’s Hospital: Healtheast Care system - st Paul
united Hospital - st Paul
unity Hospital - Fridley
university of Minnesota Medical Center: Fairview - Minneapolis
Woodwinds Hospital: Healtheast Care system - Woodbury
* * * * * * * * * sAMe 0% * *
* * * * * * * * * * * 96% 94%
137 1% Better 613 1% Better 40 4% Better sAMe 0% 92% 77%
* * * 44 0% sAMe * * * sAMe 0% 100% 100%
* * * * * * * * * sAMe 3% 94% 92%
* * * * * * * * * sAMe 1% 90% 89%
180 2% Better 500 1% Better 34 9% sAMe sAMe 0% 93% 89%
200 1% Better 810 1% sAMe 29 4% sAMe sAMe 1% 97% 97%
* * * * * * * * * Worse 6% 98% 96%
115 2% sAMe 377 1% Better * * * sAMe 0% 91% 89%
* * * * * * * * * sAMe 0% 93% 92%
Overall Minnesota Average 87% 86%
Num
ber o
f Ope
ratio
ns
Risk
Adj
uste
d De
ath
Rate
Whe
n Co
mpa
red
to
Exp
ecte
d Ra
te
Num
ber o
f Ope
ratio
ns
Risk
Adj
uste
d De
ath
Rate
Whe
n Co
mpa
red
to
Exp
ecte
d Ra
te
Num
ber o
f Ope
ratio
ns
Risk
Adj
uste
d De
ath
Rate
Whe
n Co
mpa
red
to
Exp
ecte
d Ra
te
Whe
n Co
mpa
red
to
Othe
r Hos
pita
ls
Infe
ctio
n Ra
te
Surg
ery
Patie
nts
Who
se D
octo
rs
Orde
red
Trea
tmen
t to
Prev
ent
Bloo
d Cl
ots
Afte
r Cer
tain
Type
s
of S
urge
ries
Surg
ery
Patie
nts
Who
Rec
eive
d
Trea
tmen
t at t
he R
ight
Tim
e to
Pr
even
t Blo
od C
lots
Afte
r Cer
tain
Ty
pes
of S
urge
ry
Heart Surgeries Other SurgeriesQuality of Care for Surgeries
Heart Bypass SurgeryAngioplasty
Heart Surgery
Surgical Repair of an Abdominal Aortic Aneurysm
Vaginal Hysterectomy Surgical Site InfectionWhen choosing a hospital, please check to
see if the higher or lower rate is better.
Number of Operations: the number of these surgeries performed.Risk Adjusted Rate: this takes the severity of each patient’s illness into account. When Compared to Expected: this comparison is based on how the hospital’s risk adjusted rate measures up to the expected rate of other similar hospitals, identifying it as performing the SAME, BETTER, or WORSE. When selecting a hospital, look for one with at least a SAME rating and ideally a BETTER rating.
Hospital Measures | November 2010 | 2010 Health Care Quality Report68
Medical cOMplicatiOns in tHe HOspital fOr adult patients
Certain complications can arise after surgery. These may be life threatening, ultimately resulting in death if not caught in time. These complications include conditions like acute renal fail-ure, which is when the kidneys stop working properly. Other complications might be pneumonia or cardiac arrest. However, there are steps that hospitals can take to limit the number of complications.
The measures in this section show the rates of several compli-cations. Use this information to see how well hospitals are do-ing to prevent various problems. Those hospitals with a lower rate on the three measures are doing a better job in their qual-ity of care for medical complications.
Quality of Care for Medical Complications and infections
Quality of Care for MeDiCal CoMpliCations anD infeCtions seCtion Contents
Quality of Care for Medical Complications in the Hospital for adult patients
Death Rate From Failure to Identify and Treat a Serious Complication . . . . . . . . . . . . . . . . . . . . . . . . . . . . . . . . . . . . . . . . . . . 69
Rate of Patients with Bed Sores . . . . . . . . . . . . . . . . . . . . . . . . . . . . . . . . . . 69
Rate of Blood Clots in the Lung or Large Vein After an Operation . . . . . . . . 70
Table of Results . . . . . . . . . . . . . . . . . . . . . . . . . . . . . . . . . . . . . . . . . . . . . . . 76
Appendix Table . . . . . . . . . . . . . . . . . . . . . . . . . . . . . . . . . . . . . . . . . . . . . . . 270
Quality of infection prevention
Central Line Infection (CLI) Prevention . . . . . . . . . . . . . . . . . . . . . . . . . . . . . 71
Ventilator Associated Pneumonia (VAP) Prevention . . . . . . . . . . . . . . . . . . . . 72
Surgery Patients Given an Antibiotic Within an Hour Before Surgery to Help Prevent Infection . . . . . . . . . . . . . . . . . . . . . . . . . . . . . . . . . 72
Surgery Patients Given the Best Antibiotic to Help Prevent Infection . . . . . . 73
Surgery Patients Whose Preventive Antibiotics Were Stopped at the Right Time . . . . . . . . . . . . . . . . . . . . . . . . . . . . . . . . . . . . . . . . . . . . . . 73
All Heart Surgery Patients Whose Blood Sugar (Blood Glucose) is Kept Under Good Control in the Days Right After Surgery . . . . . . . . . . . . 74
Surgery Patients Needing Hair Removed Before Surgery Using a Safer Method . . . . . . . . . . . . . . . . . . . . . . . . . . . . . . . . . . . . . . . . . . 74
Surgery Patients on Beta-Blocker Therapy Prior to Arrival Who Received a Beta-Blocker During the Perioperative Period . . . . . . . . . . . . . . . 75
Table of Results . . . . . . . . . . . . . . . . . . . . . . . . . . . . . . . . . . . . . . . . . . . . . . . 76
Appendix Table . . . . . . . . . . . . . . . . . . . . . . . . . . . . . . . . . . . . . . . . . . . . . . . 272
November 2010 | 2010 Health Care Quality Report | Hospital Measures 69
Medical Complications: Death Rate From Failure to Identify and Treat a Serious Complication
What is the measure?Patients may develop serious health conditions while they are in the hospital after surgery. These conditions can result in permanent disabil-ity and even death, if not treated quickly. This patient safety measure shows the rate of deaths from these surgery complications.
Why is this important?When a patient dies this way, the death is called a failure to rescue. The serious health conditions after surgery included in the failure to rescue measure include:
n Acute renal failure (sudden kidney failure) n Deep venous thrombosis (blood clot that
forms in a vein deep in the body) n Pneumonia n Sepsis (blood infection) n Shock and/or cardiac arrest
(severe heart attack) n Upper gastrointestinal bleeding (in the esoph-
agus, stomach, and first part of the intestine)
In 2003, about 128 patients died for every 1,000 patients at risk of developing these additional health problems in the hospital. Early detection of serious health conditions after surgery and their quick treatment may prevent a patient from dying.
Many hospitals have developed systems to detect patients in crisis and to respond immediately. Nursing staff need to be able to notice problems and accurately understand what they mean and respond with appropriate care.
Measure sourCe: aHrQ patient safety indicator (psi 4: Death among surgi-cal inpatients with serious treatable complications)
Medical Complications: Rate of Patients with Bed Sores
What is the measure?A pressure ulcer is a skin wound that forms when patients stay in one position for too long without shifting their weight. This pa-tient safety measure shows the percent of patients that develop pressure ulcers, also known as decubitus ulcers or bed sores, during their stay in the hospital.
Why is this important?Constant pressure against the skin reduces the blood supply to that area and that skin dies. People with limited ability to move are at risk of developing bed sores while in the hospital. This often happens if you use a wheelchair or you are unable to get out of bed, even for a short period of time after surgery or an injury. People with thin skin, like skin that has lost muscle and fat under the skin, also can develop pressure ulcers if they repeatedly rub against something, such as a bed sheet, cast, or brace. The most common places for pressure ulcers are over boney areas like the elbow, heels, hips, ankles, shoul-ders, back, and the back of the head.
Pressure ulcers often cause infections that can lead to longer hospital stays, higher costs, and even death. In the U.S., 7 to 10% of patients will develop a pressure ulcer during their hospital stay. Those most at risk include older people, stroke victims, and people with dementia or head injuries. Seniors are at higher risk as they typically have thin skin. Health conditions that affect blood flow, such as diabetes, and poor diet increase the chance of pressure ulcers.
Care processes in hospitals can help prevent pressure ulcers. These include making sure that patients change position every 2 hours or more. Hospitals also use protection and padding to prevent rubbing against the skin, and maintain hydration, nutrition and hygiene.
Measure sourCe: aHrQ patient safety indicator (psi 3: pressure ulcer)
When choosing a hospital, look for
the hospital that has a
lower rate.
When choosing a hospital, look for
the hospital that has a
lower rate.
Hospital Measures | November 2010 | 2010 Health Care Quality Report70
Medical Complications: Rate of Blood Clots in the Lung or Large Vein After an Operation
What is the measure?This patient safety measure shows the percent of patients that develop two problems with blood clots after surgery: postoper-ative pulmonary embolism (PE) or deep vein thrombosis (DVT).
Why is this important?Deep vein thrombosis (DVT) is a blood clot that forms in a vein deep in the body. Blood clots occur when blood thickens and clumps together. Most deep vein blood clots occur in the lower leg or thigh. A pulmonary embolism (PE) is a sudden plug in a lung artery, usually due to a blood clot that traveled to the lung from a vein in the leg. PE is a serious condition. It can damage the lungs and other organs in the body and cause death.
Both DVT and PE can happen after surgery, especially if patients are unable to leave their beds. People having hip or knee replace-ment surgeries are at greater risk of having problem blood clots. Remaining still during any type of surgery can lead to clots devel-oping. The longer you are under general anesthesia, the greater your risk of serious clots. An estimated 8.96 out of 1000 patients developed PEs after surgeries in the U.S. in 2000.
Hospitals can help prevent problems with blood clots by pro-viding blood thinning medications to people at risk of clots, by using methods to squeeze the legs to improve blood flow and by having patients move as soon as possible after surgery.
Measure sourCe: aHrQ patient safety indicator (psi 12: postopera-
tive pulmonary embolism (pe) or deep vein thrombosis (Dvt))
When choosing a hospital, look for
the hospital that has a
lower rate.
November 2010 | 2010 Health Care Quality Report | Hospital Measures 71
infectiOn preventiOn
Hospitals can improve surgical care and reduce the risk of wound infection after surgery by providing the right medicines at the right time on the day of surgery.
There are also steps that you, as a patient, can take to make sure the surgery is as safe as possible. For example, your doctor or nurse can tell you how to wash with an antibiotic soap the day before surgery. You can also give your doctor or nurse a list of all your medications, includ-ing vitamins, herbal medicines, and over-the-counter medi-cations. You should also tell your doctor or nurse about any allergies and bad reactions to anesthesia.
Sometimes patients get an infection after surgery, even if the hospital took steps to prevent it. Here are signs to look out for:n The surgical wound is red, hot, and swollen.n You have a fever of over 100 degrees after you go
home.n A smelly or yellow/green fluid is coming out of the
wound.n Your pain is increasing even though you are taking
pain medication.
Call your doctor or local hospital immediately if you have
any of these signs.
Infection Prevention: Central Line Infection (CLI) Prevention
What is the measure?A Central Line Infection Prevention Bundle is a package of proven in-terventions that produce dramatic reductions in the incidence of blood-stream infections. These types of infections are common in Intensive Care Units where intravenous catheters are used.
This measure shows the percent of patients who were given all of the following evidence-based interventions:
n Use of hand hygiene by the person performing the procedure. n Documentation that the person performing the procedure is using pre-
cautions, such as wearing a sterile gown and gloves and covering the patient’s head and body with a large sterile drape.
n Documentation of the use of an antiseptic wipe(s). n Documentation from the caregiver about why they
chose the site or documentation about the clinical evidence supporting the caregiver’s choice of the site.
n Daily assessment is performed regarding the continued necessity of catheter use.
Why is this important?Infections are a common complication of care. They can increase the length and cost of a hospital stay. By following proven strategies for infection prevention, infection rates can be reduced. This would save the patient from this potentially serious complication and the hospital the additional resources associated with that care. In this case, following the Central Line Infection Prevention Bundle would significantly reduce infections in this area.
performance on this measure ranged from zero percent to 100 percent.
Measure sourCe: Healthcare-associated infection Measure (Central line
infection (Cli) prevention Bundle Compliance)
When choosing a hospital, look for the hospital that has a
higher rate.

Hospital Measures | November 2010 | 2010 Health Care Quality Report72
Infection Prevention: Ventilator Associated Pneumonia (VAP) Prevention
What is the measure?A Ventilator Associated Pneumonia Bundle is a package of evidence-based interventions that produce dramatic reductions in the incidence of ventilator-associated pneumonia. These types of infections are common in Intensive Care Units where mechanical ventilators are used.
This measure shows the percent of patients who are given every step in the package of evidence-based interventions. The steps are:
n Documentation that the head of the bed is elevated more than 30 degrees or greater.
n Documentation that appropriate medication is given to prevent ulcers (sores).
n Documentation of the use of appropriate mechanical equipment to prevent ulcers (sores). Documentation of reduced sedation or an assessment of why sedation is not reduced.
n Documentation that there is a daily assessment of whether the patient can be weaned of the need for the ventilator.
Why is this important? Infections are a common complication of care. They can increase the length and cost of a hospital stay. By following proven strategies for infection prevention, infection rates can be reduced. This would save the patient from this potentially serious complication and the hospital the additional resources associated with that care. In this case, follow-ing the Ventilator Associated Pneumonia Prevention measure would significantly reduce infections in this area.
performance on this measure ranged from 79 percent to 100 percent.
Measure sourCe: Healthcare-associated infection Measure (ventilator associ-
ated pneumonia (vap) prevention Bundle Compliance)
Infection Prevention: Surgery Patients Given an Antibiotic Within an Hour Before Surgery to Help Prevent Infection
What is the measure?This measure shows the percent of surgical patients with prophy-lactic antibiotics, also known as preventative antibiotics, started within one hour before the surgical incision.
nOTe: Patients who got vancomycin or a fluoroquinolone for prophylactic antibiot-ics should have the antibiotics initiated within two hours prior to surgical incision. Due to the longer infusion time required for vancomycin or a fluoroquinolone, it is acceptable to start these antibiotics within two hours prior to incision time.
Why is this important? Surgical wound infections can be prevented. Medical research shows that surgery patients who get antibiotics within the hour before their surgery are less likely to get wound infections. Getting an antibiotic earlier, or after surgery begins, is not as effective. Hospital staff should make sure surgery patients get antibiotics at the right time.
performance on this measure ranged from 53 percent to 100 percent.
Measure sourCe: Hospital Compare Measure (sCip-inf-1: prophylactic
antibiotic received within one hour prior to surgical incision)
When choosing a hospital, look for the hospital that has a
higher rate.
When choosing a hospital, look for the hospital that has a
higher rate.
November 2010 | 2010 Health Care Quality Report | Hospital Measures 73
Infection Prevention:Surgery Patients Given the Best Antibiotic to Help Prevent Infection
What is the measure?This measure shows the percent of surgical patients who received the best prophylactic antibiotics, also known as pre-ventive antibiotics, consistent with current guidelines for their surgical procedure. These guidelines are specific to each type of surgical procedure.
Why is this important? Surgical wound infections can be pre-vented. Medical research has shown that certain antibiotics work better to prevent wound infections for certain types of surgery. Hospital staff should make sure patients get the antibiotic that works best for their type of surgery.
performance on this measure ranged from 91 percent to 100 percent.
Measure sourCe: Hospital Compare Measure (sCip-inf-2: prophylactic
antibiotic selection for surgical patients)
Infection Prevention:Surgery Patients Whose Preventive Antibiotics Were Stopped at the Right Time
What is the measure?This measure shows the percent of surgical patients whose prophylactic antibiotics were discontinued within 24 hours after surgery end time (within 48 hours for coronary artery bypass graft (CABG) or other cardiac surgery).
nOTe: The Society of Thoracic Surgeons (STS) Practice Guideline for Antibiotic Prophylaxis in Cardiac Surgery (2006) indicates that there is no reason to ex-tend antibiotics beyond 48 hours for cardiac surgery and very explicitly states that antibiotics should not be extended beyond 48 hours even with tubes and drains in place for cardiac surgery.
Why is this important?Antibiotics are often given to patients before surgery to prevent infection. Taking these antibiotics for more than 24 hours after routine surgery is usually not necessary. Continuing the medication longer than necessary can increase the risk of side effects such as stomach aches and serious types of diarrhea. Also, when antibiotics are used for too long, patients can develop resistance to them and the antibiotics won’t work as well.
performance on this measure ranged from 59 percent to 100 percent.
Measure sourCe: Hospital Compare Measure (sCip-inf-3: prophylactic
antibiotics discontinued within 24 hours after surgery end time)
When choosing a hospital, look for the hospital that has a
higher rate.
When choosing a hospital, look for the hospital that has a
higher rate.
Hospital Measures | November 2010 | 2010 Health Care Quality Report74
Infection Prevention:All Heart Surgery Patients Whose Blood Sugar (Blood Glucose) is Kept Under Good Control in the Days Right After Surgery
What is the measure?This measure shows the percent of cardiac surgery patients with controlled 6 A.M. blood glucose (≤ 200 mg/dL) on postoper-ative day one and postoperative day two with Surgery End Date being postoperative day zero.
Why is this important?Even if heart surgery patients do not have diabetes, keeping their blood sugar under good control after surgery lowers the risk of infection and other problems. “Under good control” means their blood sugar should be 200 mg/dL or less when checked first thing in the morning.
performance on this measure ranged from 50 percent to 97 percent.
Measure sourCe: Hospital Compare Measure (sCip-inf-4: Cardiac sur-
gery patients with controlled 6 a.m. postoperative blood glucose)
Infection Prevention:Surgery Patients Needing Hair Removed Before Surgery Using a Safer Method
What is the measure?This measure shows the percent of surgery patients with appro-priate surgical site hair removal. No hair removal, or hair remov-al with clippers or hair removal cream is considered appropriate. Shaving is considered inappropriate.
Why is this important? Preparing a patient for surgery may include removing body hair from skin in the area where the surgery will be done. Medical research has shown that shaving with a razor can increase the risk of infection. It is safer to use electric clippers or hair removal cream.
performance on this measure ranged from 77 percent to 100 percent.
Measure sourCe: Hospital Compare Measure
(sCip-inf-6: surgery patients with appropriate hair removal)
When choosing a hospital, look for the hospital that has a
higher rate. When choosing a hospital, look for the hospital that has a
higher rate.
November 2010 | 2010 Health Care Quality Report | Hospital Measures 75
Infection Prevention:Surgery Patients on Beta-Blocker Therapy Prior to Arrival Who Received a Beta-Blocker During the Perioperative Period
What is the measure?This measure is used to assess the percent of surgery pa-tients on beta-blocker therapy prior to arrival who received a beta-blocker during the perioperative period. The perioperative period is defined as 24 hours prior to surgical incision through discharge from the post-anesthesia care/recovery area.
Why is this important? It is often standard procedure to stop patients’ usual medications for awhile before and after their surgery. But if patients who have been taking beta blockers suddenly stop taking them, they can have heart problems such as a fast heart beat. For these patients, staying on beta blockers before and after surgery makes it less likely that they will have heart problems.
performance on this measure ranged from 52 percent to 100 percent.
Measure sourCe: Hospital Compare Measure (sCip-Card-2: surgery
patients on beta-blocker therapy prior to arrival who received a beta-
blocker during the perioperative period)
When choosing a hospital, look for the hospital that has a
higher rate.
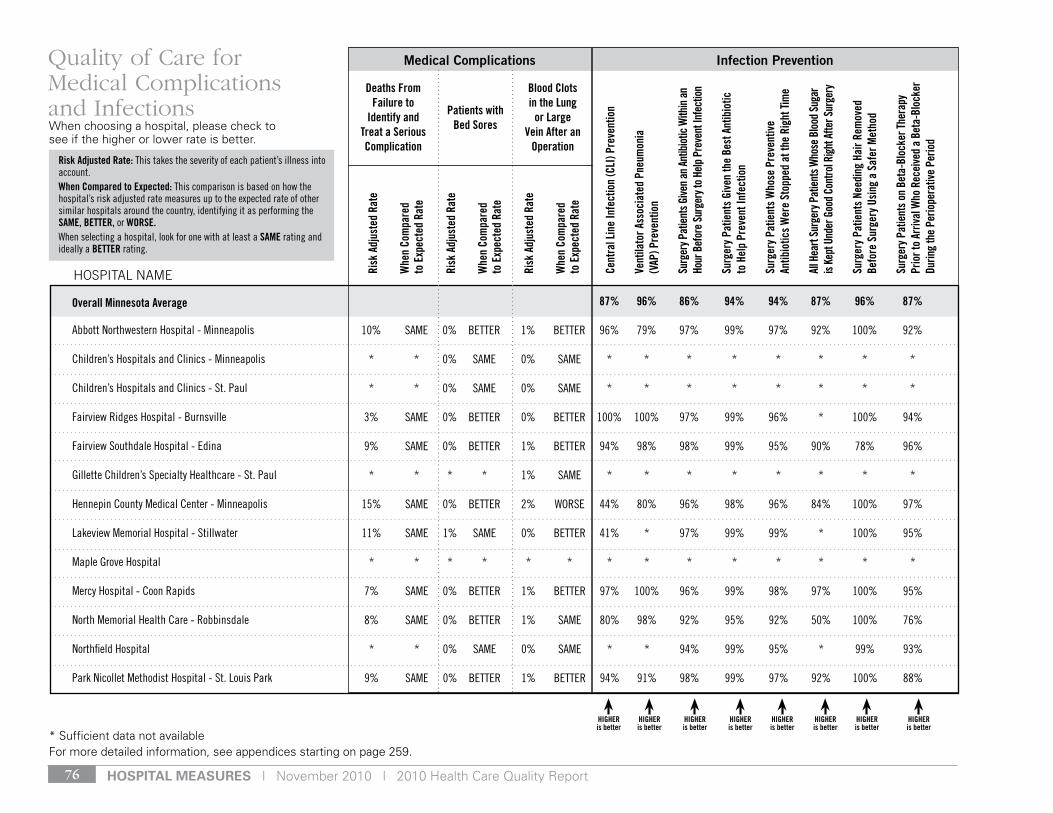
Hospital Measures | November 2010 | 2010 Health Care Quality Report76
87% 96% 86% 94% 94% 87% 96% 87%
10% sAMe 0% Better 1% Better 96% 79% 97% 99% 97% 92% 100% 92%
* * 0% sAMe 0% sAMe * * * * * * * *
* * 0% sAMe 0% sAMe * * * * * * * *
3% sAMe 0% Better 0% Better 100% 100% 97% 99% 96% * 100% 94%
9% sAMe 0% Better 1% Better 94% 98% 98% 99% 95% 90% 78% 96%
* * * * 1% sAMe * * * * * * * *
15% sAMe 0% Better 2% Worse 44% 80% 96% 98% 96% 84% 100% 97%
11% sAMe 1% sAMe 0% Better 41% * 97% 99% 99% * 100% 95%
* * * * * * * * * * * * * *
7% sAMe 0% Better 1% Better 97% 100% 96% 99% 98% 97% 100% 95%
8% sAMe 0% Better 1% sAMe 80% 98% 92% 95% 92% 50% 100% 76%
* * 0% sAMe 0% sAMe * * 94% 99% 95% * 99% 93%
9% sAMe 0% Better 1% Better 94% 91% 98% 99% 97% 92% 100% 88%
HOSPITAL NAME
HIGHER is better
HIGHER is better
HIGHER is better
HIGHER is better
HIGHER is better
HIGHER is better
HIGHER is better
HIGHER is better
* Sufficient data not availableFor more detailed information, see appendices starting on page 259.
Abbott northwestern Hospital - Minneapolis
Children’s Hospitals and Clinics - Minneapolis
Children’s Hospitals and Clinics - st. Paul
Fairview ridges Hospital - Burnsville
Fairview southdale Hospital - edina
gillette Children’s specialty Healthcare - st. Paul
Hennepin County Medical Center - Minneapolis
lakeview Memorial Hospital - stillwater
Maple grove Hospital
Mercy Hospital - Coon rapids
north Memorial Health Care - robbinsdale
northfield Hospital
Park nicollet Methodist Hospital - st. louis Park
Overall Minnesota Average
Quality of Care for Medical Complications and Infections
Medical Complications Infection Prevention
Deaths From Failure to
Identify and Treat a Serious Complication
Patients with Bed Sores
Blood Clots in the Lung
or Large Vein After an
Operation
Risk
Adj
uste
d Ra
te
Whe
n Co
mpa
red
to
Exp
ecte
d Ra
te
Risk
Adj
uste
d Ra
te
Whe
n Co
mpa
red
to
Exp
ecte
d Ra
te
Risk
Adj
uste
d Ra
te
Whe
n Co
mpa
red
to
Exp
ecte
d Ra
te
Cent
ral L
ine
Infe
ctio
n (C
LI) P
reve
ntio
n
Vent
ilato
r Ass
ocia
ted
Pneu
mon
ia
(VAP
) Pre
vent
ion
Surg
ery P
atie
nts G
iven
an A
ntib
iotic
With
in a
n Ho
ur B
efor
e Su
rger
y to
Help
Pre
vent
Infe
ctio
n
Surg
ery
Patie
nts
Give
n th
e Be
st A
ntib
iotic
to
Hel
p Pr
even
t Inf
ectio
n
Surg
ery
Patie
nts
Who
se P
reve
ntiv
e
Antib
iotic
s W
ere
Stop
ped
at th
e Ri
ght T
ime
All H
eart
Surg
ery P
atie
nts W
hose
Blo
od S
ugar
is
Kept
Und
er G
ood
Cont
rol R
ight
Afte
r Sur
gery
Surg
ery
Patie
nts
Need
ing
Hair
Rem
oved
Be
fore
Sur
gery
Usi
ng a
Saf
er M
etho
d
Surg
ery P
atie
nts o
n Be
ta-B
lock
er Th
erap
y Pr
ior t
o Ar
rival
Who
Rec
eive
d a
Beta
-Blo
cker
Du
ring
the
Perio
pera
tive
Perio
d
When choosing a hospital, please check to see if the higher or lower rate is better.
Risk Adjusted Rate: this takes the severity of each patient’s illness into account. When Compared to Expected: this comparison is based on how the hospital’s risk adjusted rate measures up to the expected rate of other similar hospitals around the country, identifying it as performing the SAME, BETTER, or WORSE. When selecting a hospital, look for one with at least a SAME rating and ideally a BETTER rating.
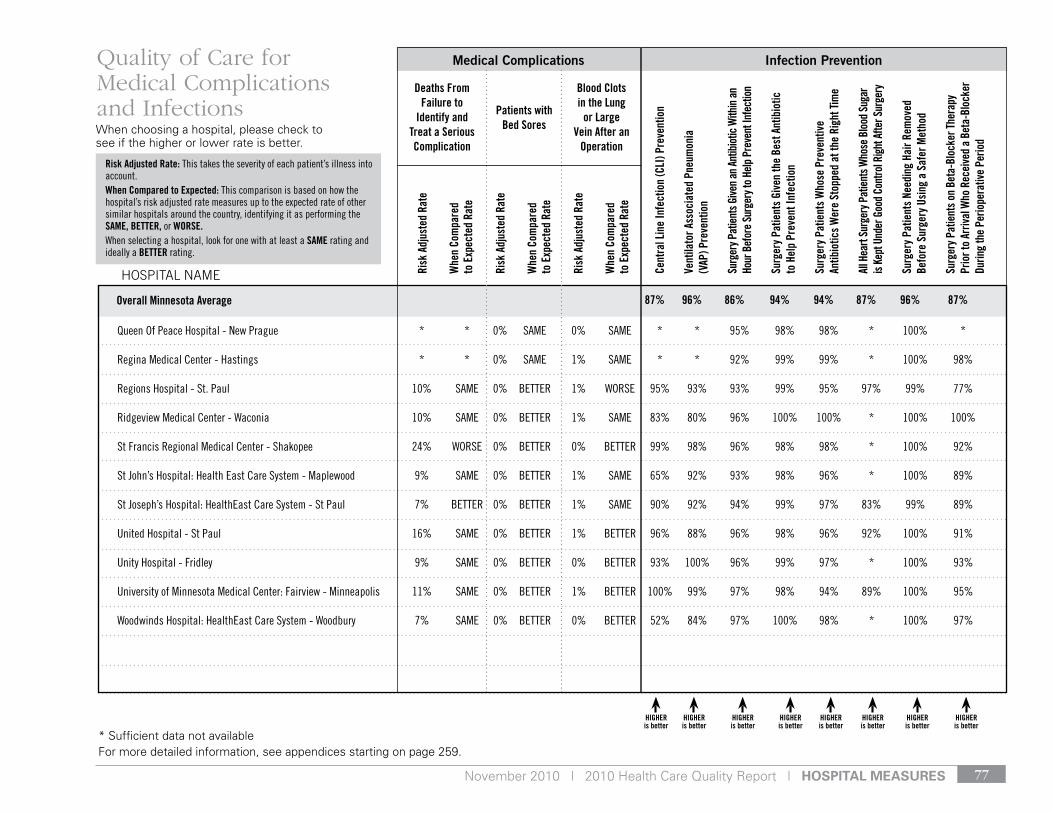
November 2010 | 2010 Health Care Quality Report | Hospital Measures 77
* * 0% sAMe 0% sAMe * * 95% 98% 98% * 100% *
* * 0% sAMe 1% sAMe * * 92% 99% 99% * 100% 98%
10% sAMe 0% Better 1% Worse 95% 93% 93% 99% 95% 97% 99% 77%
10% sAMe 0% Better 1% sAMe 83% 80% 96% 100% 100% * 100% 100%
24% Worse 0% Better 0% Better 99% 98% 96% 98% 98% * 100% 92%
9% sAMe 0% Better 1% sAMe 65% 92% 93% 98% 96% * 100% 89%
7% Better 0% Better 1% sAMe 90% 92% 94% 99% 97% 83% 99% 89%
16% sAMe 0% Better 1% Better 96% 88% 96% 98% 96% 92% 100% 91%
9% sAMe 0% Better 0% Better 93% 100% 96% 99% 97% * 100% 93%
11% sAMe 0% Better 1% Better 100% 99% 97% 98% 94% 89% 100% 95%
7% sAMe 0% Better 0% Better 52% 84% 97% 100% 98% * 100% 97%
HOSPITAL NAME
HIGHER is better
HIGHER is better
HIGHER is better
HIGHER is better
HIGHER is better
HIGHER is better
HIGHER is better
HIGHER is better
* Sufficient data not availableFor more detailed information, see appendices starting on page 259.
Queen of Peace Hospital - new Prague
regina Medical Center - Hastings
regions Hospital - st. Paul
ridgeview Medical Center - Waconia
st Francis regional Medical Center - shakopee
st John’s Hospital: Health east Care system - Maplewood
st Joseph’s Hospital: Healtheast Care system - st Paul
united Hospital - st Paul
unity Hospital - Fridley
university of Minnesota Medical Center: Fairview - Minneapolis
Woodwinds Hospital: Healtheast Care system - Woodbury
Overall Minnesota Average 87% 96% 86% 94% 94% 87% 96% 87%
Quality of Care for Medical Complications and Infections
Medical Complications Infection Prevention
Deaths From Failure to
Identify and Treat a Serious Complication
Patients with Bed Sores
Blood Clots in the Lung
or Large Vein After an
OperationWhen choosing a hospital, please check to see if the higher or lower rate is better.
Risk
Adj
uste
d Ra
te
Whe
n Co
mpa
red
to
Exp
ecte
d Ra
te
Risk
Adj
uste
d Ra
te
Whe
n Co
mpa
red
to
Exp
ecte
d Ra
te
Risk
Adj
uste
d Ra
te
Whe
n Co
mpa
red
to
Exp
ecte
d Ra
te
Cent
ral L
ine
Infe
ctio
n (C
LI) P
reve
ntio
n
Vent
ilato
r Ass
ocia
ted
Pneu
mon
ia
(VAP
) Pre
vent
ion
Surg
ery P
atie
nts G
iven
an A
ntib
iotic
With
in a
n Ho
ur B
efor
e Su
rger
y to
Help
Pre
vent
Infe
ctio
n
Surg
ery
Patie
nts
Give
n th
e Be
st A
ntib
iotic
to
Hel
p Pr
even
t Inf
ectio
n
Surg
ery
Patie
nts
Who
se P
reve
ntiv
e
Antib
iotic
s W
ere
Stop
ped
at th
e Ri
ght T
ime
All H
eart
Surg
ery P
atie
nts W
hose
Blo
od S
ugar
is
Kept
Und
er G
ood
Cont
rol R
ight
Afte
r Sur
gery
Surg
ery
Patie
nts
Need
ing
Hair
Rem
oved
Be
fore
Sur
gery
Usi
ng a
Saf
er M
etho
d
Surg
ery P
atie
nts o
n Be
ta-B
lock
er Th
erap
y Pr
ior t
o Ar
rival
Who
Rec
eive
d a
Beta
-Blo
cker
Du
ring
the
Perio
pera
tive
Perio
d
Risk Adjusted Rate: this takes the severity of each patient’s illness into account. When Compared to Expected: this comparison is based on how the hospital’s risk adjusted rate measures up to the expected rate of other similar hospitals around the country, identifying it as performing the SAME, BETTER, or WORSE. When selecting a hospital, look for one with at least a SAME rating and ideally a BETTER rating.
Hospital Measures | November 2010 | 2010 Health Care Quality Report78
pneuMOnia care
Pneumonia is a serious lung infection that causes difficulty breathing, fever, cough and fatigue. Pneumonia is caused by a viral or bacterial infection that fills your lungs with mucus. This lowers the oxygen level in your blood. Symptoms of pneumonia can include the following:n Difficulty breathingn “Wet” cough. Your mucus may look green or bloody.n Chest painn Fever and chillsn Fatigue
These measures show some of the recommended treatments for pneumonia.
Quality of Care for other Conditions
Quality of Care for otHer ConDitionsseCtion Contents
Quality of pneumonia Care
The Best Care for Pneumonia Patients . . . . . . . . . . . . . . . . . . . . . . . . . . . . . 79
Patients Assessed and Given Pneumonia Vaccination . . . . . . . . . . . . . . . . . 79
Blood Test Given to Patient Prior to Receiving Antibiotics. . . . . . . . . . . . . . . 80
Patients Given Advice or Counseling About Quitting Smoking While in the Hospital . . . . . . . . . . . . . . . . . . . . . . . . . . . . . . . . . . . . . . . . . . . 80
Patients Given Initial Antibiotic(s) Within Six Hours After Getting to the Hospital . . . . . . . . . . . . . . . . . . . . . . . . . . . . . . . . . . . . . . . . . . . . . . . . 81
Patients Given the Most Appropriate Initial Antibiotic(s) . . . . . . . . . . . . . . . . 81
Patients Assessed and Given Influenza Vaccination . . . . . . . . . . . . . . . . . . . 82
Table of Results . . . . . . . . . . . . . . . . . . . . . . . . . . . . . . . . . . . . . . . . . . . . . . . 86
Appendix Table . . . . . . . . . . . . . . . . . . . . . . . . . . . . . . . . . . . . . . . . . . . . . . . 274
Quality of Hip fracture treatment
Hip Fracture Surgery: Death Rate for Patients with a Broken Hip . . . . . . . . . 83
Table of Results . . . . . . . . . . . . . . . . . . . . . . . . . . . . . . . . . . . . . . . . . . . . . . . 86
Appendix Table . . . . . . . . . . . . . . . . . . . . . . . . . . . . . . . . . . . . . . . . . . . . . . . 276
Quality of Childbirth
Rate of Obstetric Tearing – Vaginal Delivery WITH Medical Instruments . . . . . . . . . . . . . . . . . . . . . . . . . . . . . . . . . . . . . . . . . . . 84
Rate of Obstetric Tearing – Vaginal Delivery WITHOUT Medical Instruments . . . . . . . . . . . . . . . . . . . . . . . . . . . . . . . . . . . . . . . . . . . 85
Table of Results . . . . . . . . . . . . . . . . . . . . . . . . . . . . . . . . . . . . . . . . . . . . . . . 86
Appendix Table . . . . . . . . . . . . . . . . . . . . . . . . . . . . . . . . . . . . . . . . . . . . . . . 276
November 2010 | 2010 Health Care Quality Report | Hospital Measures 79
The Best Care for Pneumonia Patients
What is the measure?This measure shows the percent of patients receiving ALL of the appropriate care that they should have received based on their clinical condition. For pneumonia patients this includes the remaining measures in this section:
n Patients Assessed and Given Pneumonia Vaccinationn Blood Test Given to Patient Prior to Receiving Antibioticsn Patients Given Advice or Counseling About Quitting Smoking
While in the Hospitaln Patients Given Initial Antibiotic(s) Within Six Hours After Getting
to the Hospitaln Patients Given the Most Appropriate Initial Antibiotic(s)n Patients Assessed and Given Influenza Vaccination
The measure takes patient individuality into consideration, looking at one patient and his/her episode of care at a time, as it relates to pneumonia.
Why is this important?This measure is a composite, or all-or-none, quality of care measure called an appropri-ate care measure (ACM). These types of measures are patient-focused measures that provide a way of looking at whether a patient received ALL of the “appropriate” or “right care” (recommend-ed treatments) that he or she should have received, based on his or her clinical condition. Each patient is unique and may not be eligible for every type of care for a condition. The measure will take this into consideration.
performance on this measure ranged from 33 percent to 100 percent.
Measure sourCe: pneumonia (pn) appropriate Care Measure (pn-aCM)
Pneumonia: Patients Assessed and Given Pneumonia Vaccination
What is the measure?This measure shows the percent of pneumonia patients who were assessed and given the pneumonia (also known as pneumococcal) vaccination. This includes patients age 65 and older who were screened and given the pneumococcal vaccination prior to being released from the hospital, if indicated.
Why is this important?The pneumococcal vaccine may help you prevent, or lower the risk of complications of pneumonia caused by bacteria. It may also help you prevent future infections. Patients with pneumonia should be asked if they have been vaccinated recently for pneu-monia and, if not, should be given the vaccine.
performance on this measure ranged from nine percent to 100 percent.
Measure sourCe: Hospital Compare Measure
(pn-2: pneumococcal vaccination)
When choosing a hospital, look for the hospital that has a
higher rate.
When choosing a hospital, look for the hospital that has a
higher rate.
Hospital Measures | November 2010 | 2010 Health Care Quality Report80
Pneumonia: Blood Test Given to Patient Prior to Receiving Antibiotics
What is the measure?This measure shows the percent of pneumonia patients that had a blood culture or blood test done in the Emergency Depart-ment before getting their first dose of hospital antibiotics. This measure focuses on treatment provided to Emergency Department patients prior to being admitted to the hospital.
Why is this important? Different types of bacteria can cause pneumonia. A blood culture is a test that can help your health care provider identify which bacteria may have caused your pneumonia, and which antibiotic should be prescribed. A blood culture is not always needed, but for patients who are first seen in the hospital emergency department, it is important for the accuracy of the test that blood culture be conducted before any antibiotics are started. It is also important to start antibiotics as soon as possible.
performance on this measure ranged from 73 percent to 100 percent.
Measure sourCe: Hospital Compare Measure (pn-3b: Blood cultures
performed in the emergency department prior to initial antibiotic received
in hospital)
Pneumonia: Patients Given Advice or Counseling About Quitting Smoking While in the Hospital
What is the measure?This measure shows the percent of pneumonia patients with a history of smoking cigarettes who were given advice or counsel-ing about stopping smoking while in the hospital. For purposes of this measure, a smoker is someone who has smoked ciga-rettes anytime during the year before being in the hospital.
Why is this important? Smoking damages your lungs and can make it hard to breathe. Smoking increases your chances of getting pneumonia or other chronic lung diseases like emphysema and bronchitis. Smoking is also linked to lung cancer, heart dis-ease, and stroke, and can cause prema-ture death. It is important for you to get information to help you quit smoking before you leave the hospital. Quitting may reduce your chance of getting pneu-monia again.
performance on this measure ranged from 67 percent to 100 percent.
Measure sourCe: Hospital Compare Measure (pn-4: adult smoking
cessation advice/counseling)
When choosing a hospital, look for the hospital that has a
higher rate.
When choosing a hospital, look for the hospital that has a
higher rate.
November 2010 | 2010 Health Care Quality Report | Hospital Measures 81
Pneumonia: Patients Given Initial Antibiotic(s) Within Six Hours After Getting to the Hospital
What is the measure?This measure shows the percent of pneumonia patients who received their first dose of antibiotics within six hours of arrival at the hospital. Patients who get pneumonia during their stay at the hospital are not counted in this measure. Why is this important?Antibiotics are used to treat adults with pneumonia caused by bacteria. Early treatment with antibiotics can cure bacterial pneumonia and reduce the possibility of complications.
performance on this measure ranged from 85 percent to 100 percent.
Measure sourCe: Hospital Compare Measure (pn-5c: initial antibiotic
received within 6 hours of hospital arrival)
Pneumonia: Patients Given the Most Appropriate Initial Antibiotic(s)
What is the measure?This measure shows the percent of immunocompetent patients with Community-Acquired Pneumonia who got an initial antibiotic regimen during the first 24 hours that was consistent with current guidelines.
Why is this important?Pneumonia is a lung infection that is usually caused by bacteria or a virus. If pneumonia is caused by bacteria, hospitals will treat the infection with antibiotics. Different bacteria are treated with different antibiotics. To learn about how hospitals use a blood test to choose the most effective treatment for pneumonia pa-tients, refer to the Process of Care measure named ‘Blood Test Given to Patient Prior to Receiving Antibiotics’.
performance on this measure ranged from 73 percent to 100 percent.
Measure sourCe: Hospital Compare Measure
(pn-6: initial antibiotic selection for community-acquired pneumonia
(Cap) in immunocompetent patients)
When choosing a hospital, look for the hospital that has a
higher rate.
When choosing a hospital, look for the hospital that has a
higher rate.
Hospital Measures | November 2010 | 2010 Health Care Quality Report82
Pneumonia: Patients Assessed and Given Influenza Vaccination
What is the measure?This measure shows the percent of pneumonia patients age 50 years and older, hospitalized during October, November, Decem-ber, January, February, or March who were screened for influ-enza vaccine status and were vaccinated prior to being released from the hospital, if this is the right treatment for the patient. The influenza vaccine is commonly known as the flu shot.
Why is this important? Influenza vaccinations, or flu shots, reduce the risk of influenza, a serious and some-times deadly lung infection that can spread quickly in a community or facility. Hospitals should check to make sure that pneumonia patients, particularly those who are age 50 or older, get a flu shot during flu season to protect them from another lung infection and to help prevent the spread of influenza.
Since a flu shot is effective for just one flu season, the period of time used to calculate this rate is the flu season (from approxi-mately November through March).
performance on this measure ranged from 12 percent to 100 percent.
Measure sourCe: Hospital Compare Measure (pn-7: influenza vac-
cination)
When choosing a hospital, look for the hospital that has a
higher rate.
November 2010 | 2010 Health Care Quality Report | Hospital Measures 83
Hip fracture treatMent
A hip fracture, also known as a broken hip, more com-monly occurs in older adults. Usually hip fractures are caused by a fall or some type of blow to the side of the hip. Other medical conditions, like osteoporosis, can make bones weaker and more likely to break. In fact, more than 300,000 hip fractures annually are due to os-teoporosis.
Treatments for hip fractures, like surgery, have certain risks associated with them. Health problems from hip fracture surgery may include risk for pneumonia or a blood clot in the leg that may travel to a lung and cause damage. If not recognized and effectively treated, these can lead to life-threatening problems. Some surgery complications, including death, can be prevented through better care processes at the hospital.
Use this measure to see how well a hospital is doing at preventing deaths after hip fracture surgery.
Hip Fracture Surgery: Death Rate for Patients with a Broken Hip
What is the measure?This measure shows the percent of patients who died in the hospital, who came in with a broken hip (hip fracture).
Why is this important?Among older people, hip fractures are a common serious injury. If you already have other health problems, you are more likely to have compli-cations after surgery to repair a cracked or broken hip bone. To decrease the risks, surgery may be delayed a couple of days to treat other medical problems, such as heart or lung conditions.
Health problems from hip fracture surgery may include risk for pneumonia or a blood clot in the leg that may travel to a lung and cause damage. If not recognized and effectively treated, these can lead to life-threatening problems. In the U.S., 3.1% of patients having hip fracture surgery will die in the hospital as a result of the surgery. Some surgery complications, including death, can be prevented through better care processes at the hospital.
Measure sourCe: aHrQ Quality indicator (iQi 19: Hip fracture mortal-
ity rate)
When choosing a hospital, look for the hospital that has a
lower rate.
Hospital Measures | November 2010 | 2010 Health Care Quality Report84
cHildbirtH
Childbirth can sometimes lead to tears in the perineum. This is the area between a woman’s vagina and anus. A more serious tear is referred to as obstetric trauma. However, these tears are often preventable. This is true for births where medical instruments, like forceps, are used. These tears can also occur when no medical in-struments are used to deliver the baby. Better quality of care for childbirth is associated with a lower number of obstetric tears.
When planning for the delivery of your baby, discuss this quality measurement data with your doctor to see how to get the best care during the birth of your child. You can use the measures in this section to see how well a hospital is doing with its quality of care during childbirth.
Childbirth: Rate of Obstetric Tearing – Vaginal Delivery WITH Medical Instruments
What is the measure?This measure shows the percent of women who suffer serious vaginal tears while giving birth, when a health care provider was helping to deliver the baby using a forceps or other medical instrument.
Why is this important? During vaginal childbirth, women can tear the skin and muscles between the vagina and anus, the “perineum.” Small tears can heal well on their own or may require stitches. Serious tears require surgery to repair and may take several months to heal. These serious tears are referred to as obstetric traumas. At least 4 percent of women who deliver vaginally experience a serious tear in their perineum. Tears are more common in women having their first vaginal birth.
Serious tears can happen even when medical instruments are not used or when an attempted vaginal delivery ends with cesarean-section. However, mothers who have their babies de-livered vaginally with the assistance of instruments usually have higher rates of serious tears. These tears are often preventable, and the percentage of deliveries involving serious tears is con-sidered an indicator of quality of care during childbirth.
Measure sourCe: aHrQ Quality indicators (psi 18: obstetric trauma –
vaginal delivery with instrument)
When choosing a hospital, look for the hospital that has a
lower rate.
November 2010 | 2010 Health Care Quality Report | Hospital Measures 85
Childbirth: Rate of Obstetric Tearing – Vaginal Delivery WITHOUT Medical Instruments
What is the measure?This measure shows the percent of women who suffer serious vaginal tears while giving birth where no forceps or other medical instruments were used to assist with delivering a baby.
Why is this important? During vaginal childbirth, women can tear the skin and muscles between the vagina and anus, the “perineum.” Small tears can heal well on their own or may require stitches. Serious tears require surgery to repair and may take several months to heal. These serious tears are referred to as obstetric traumas. At least 4 percent of women who deliver vaginally experience a serious tear in their perineum. Tears are more common in women hav-ing their first vaginal birth.
Serious tears can happen even when medical instruments are not used or when an attempted vaginal delivery ends with cesarean-section. These tears are often preventable, and the percentage of deliveries involving serious tears is considered an indicator of quality of care during childbirth.
Measure sourCe: aHrQ Quality indicators (psi 19: obstetric trauma –
vaginal delivery without instrument)
When choosing a hospital, look for the hospital that has a
lower rate.
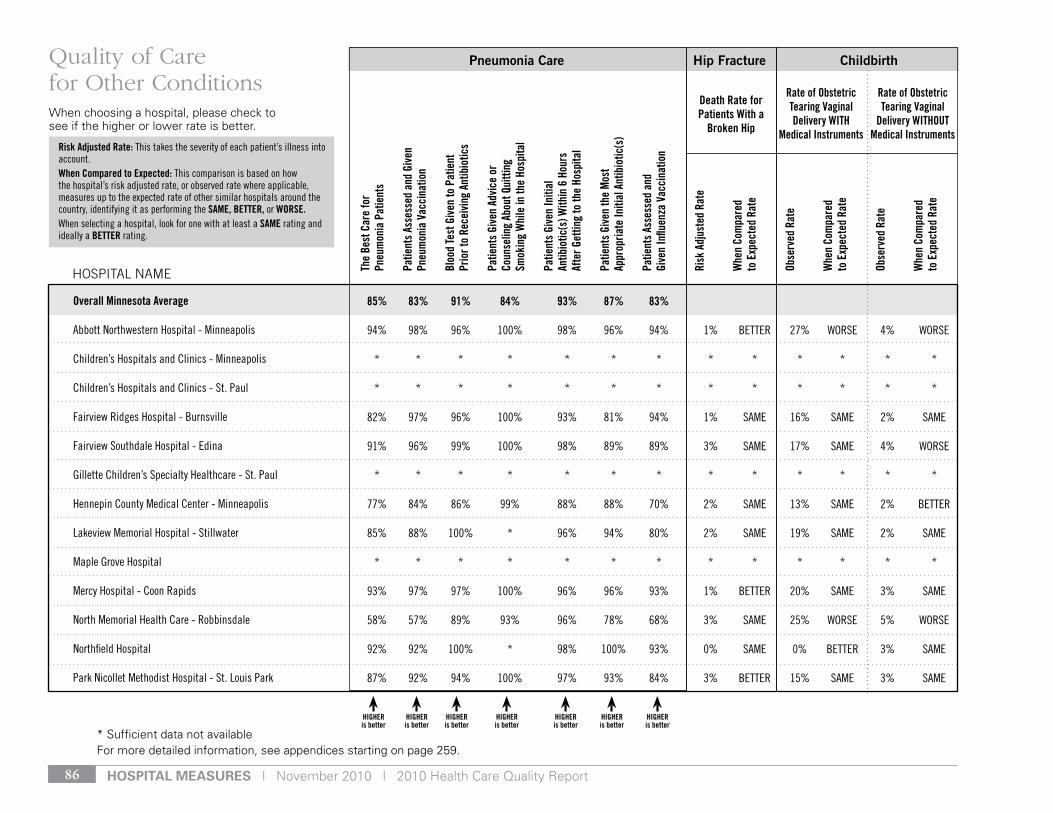
Hospital Measures | November 2010 | 2010 Health Care Quality Report86
85% 83% 91% 84% 93% 87% 83%
94% 98% 96% 100% 98% 96% 94% 1% Better 27% Worse 4% Worse
* * * * * * * * * * * * *
* * * * * * * * * * * * *
82% 97% 96% 100% 93% 81% 94% 1% sAMe 16% sAMe 2% sAMe
91% 96% 99% 100% 98% 89% 89% 3% sAMe 17% sAMe 4% Worse
* * * * * * * * * * * * *
77% 84% 86% 99% 88% 88% 70% 2% sAMe 13% sAMe 2% Better
85% 88% 100% * 96% 94% 80% 2% sAMe 19% sAMe 2% sAMe
* * * * * * * * * * * * *
93% 97% 97% 100% 96% 96% 93% 1% Better 20% sAMe 3% sAMe
58% 57% 89% 93% 96% 78% 68% 3% sAMe 25% Worse 5% Worse
92% 92% 100% * 98% 100% 93% 0% sAMe 0% Better 3% sAMe
87% 92% 94% 100% 97% 93% 84% 3% Better 15% sAMe 3% sAMe
HOSPITAL NAME
HIGHER is better
HIGHER is better
HIGHER is better
HIGHER is better
HIGHER is better
HIGHER is better
HIGHER is better
* Sufficient data not availableFor more detailed information, see appendices starting on page 259.
Overall Minnesota Average
Abbott northwestern Hospital - Minneapolis
Children’s Hospitals and Clinics - Minneapolis
Children’s Hospitals and Clinics - st. Paul
Fairview ridges Hospital - Burnsville
Fairview southdale Hospital - edina
gillette Children’s specialty Healthcare - st. Paul
Hennepin County Medical Center - Minneapolis
lakeview Memorial Hospital - stillwater
Maple grove Hospital
Mercy Hospital - Coon rapids
north Memorial Health Care - robbinsdale
northfield Hospital
Park nicollet Methodist Hospital - st. louis Park
Quality of Care for Other Conditions
Pneumonia Care Hip Fracture Childbirth
Rate of Obstetric Tearing Vaginal Delivery WITH
Medical Instruments
Death Rate for Patients With a
Broken Hip
Rate of Obstetric Tearing Vaginal
Delivery WITHOUT Medical Instruments
The
Best
Car
e fo
r Pn
eum
onia
Pat
ient
s
Patie
nts
Asse
ssed
and
Giv
en
Pneu
mon
ia V
acci
natio
n
Bloo
d Te
st G
iven
to P
atie
nt
Prio
r to
Rece
ivin
g An
tibio
tics
Patie
nts
Give
n Ad
vice
or
Coun
selin
g Ab
out Q
uitti
ng
Smok
ing
Whi
le in
the
Hosp
ital
Patie
nts
Give
n In
itial
An
tibio
tic(s
) With
in 6
Hou
rs
Afte
r Get
ting
to th
e Ho
spita
l
Patie
nts
Give
n th
e M
ost
Appr
opria
te In
itial
Ant
ibio
tic(s
)
Patie
nts
Asse
ssed
and
Gi
ven
Influ
enza
Vac
cina
tion
Risk
Adj
uste
d Ra
te
Whe
n Co
mpa
red
to
Exp
ecte
d Ra
te
Obse
rved
Rat
e
Whe
n Co
mpa
red
to
Exp
ecte
d Ra
te
Obse
rved
Rat
e
Whe
n Co
mpa
red
to
Exp
ecte
d Ra
te
When choosing a hospital, please check to see if the higher or lower rate is better.
Risk Adjusted Rate: this takes the severity of each patient’s illness into account. When Compared to Expected: this comparison is based on how the hospital’s risk adjusted rate, or observed rate where applicable, measures up to the expected rate of other similar hospitals around the country, identifying it as performing the SAME, BETTER, or WORSE. When selecting a hospital, look for one with at least a SAME rating and ideally a BETTER rating.
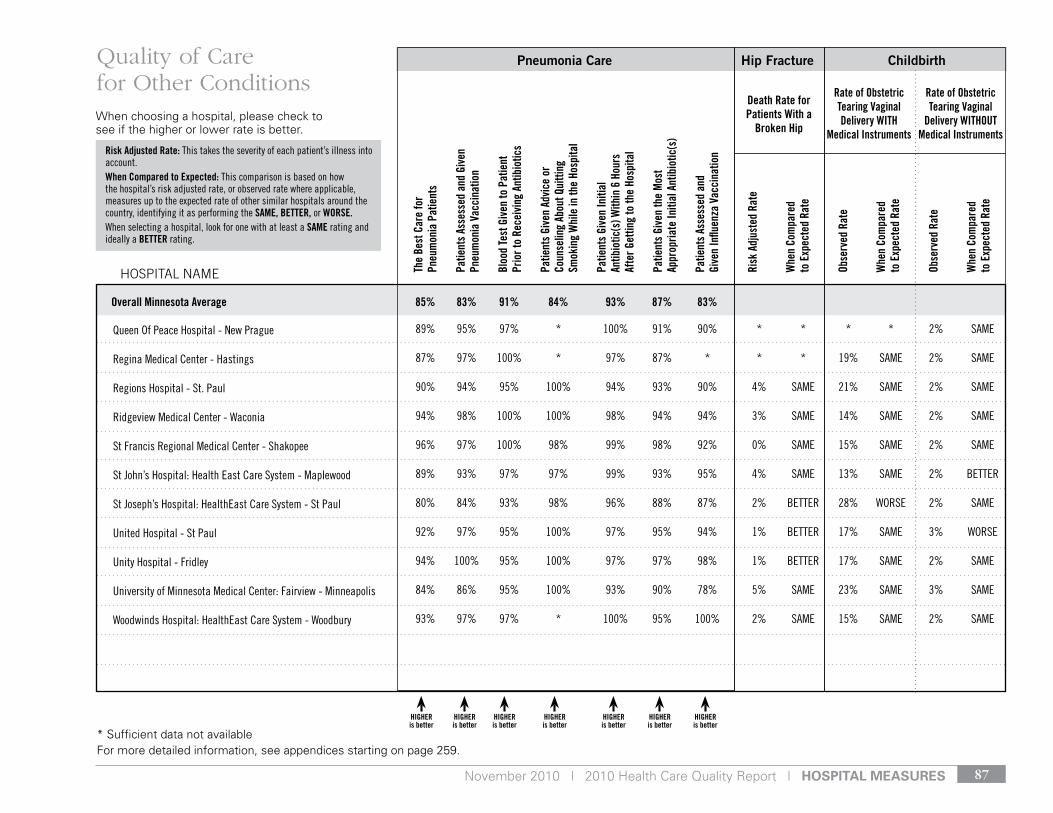
November 2010 | 2010 Health Care Quality Report | Hospital Measures 87
HOSPITAL NAME
HIGHER is better
HIGHER is better
HIGHER is better
HIGHER is better
HIGHER is better
HIGHER is better
HIGHER is better
* Sufficient data not availableFor more detailed information, see appendices starting on page 259.
89% 95% 97% * 100% 91% 90% * * * * 2% sAMe
87% 97% 100% * 97% 87% * * * 19% sAMe 2% sAMe
90% 94% 95% 100% 94% 93% 90% 4% sAMe 21% sAMe 2% sAMe
94% 98% 100% 100% 98% 94% 94% 3% sAMe 14% sAMe 2% sAMe
96% 97% 100% 98% 99% 98% 92% 0% sAMe 15% sAMe 2% sAMe
89% 93% 97% 97% 99% 93% 95% 4% sAMe 13% sAMe 2% Better
80% 84% 93% 98% 96% 88% 87% 2% Better 28% Worse 2% sAMe
92% 97% 95% 100% 97% 95% 94% 1% Better 17% sAMe 3% Worse
94% 100% 95% 100% 97% 97% 98% 1% Better 17% sAMe 2% sAMe
84% 86% 95% 100% 93% 90% 78% 5% sAMe 23% sAMe 3% sAMe
93% 97% 97% * 100% 95% 100% 2% sAMe 15% sAMe 2% sAMe
Queen of Peace Hospital - new Prague
regina Medical Center - Hastings
regions Hospital - st. Paul
ridgeview Medical Center - Waconia
st Francis regional Medical Center - shakopee
st John’s Hospital: Health east Care system - Maplewood
st Joseph’s Hospital: Healtheast Care system - st Paul
united Hospital - st Paul
unity Hospital - Fridley
university of Minnesota Medical Center: Fairview - Minneapolis
Woodwinds Hospital: Healtheast Care system - Woodbury
85% 83% 91% 84% 93% 87% 83%Overall Minnesota Average
Quality of Care for Other Conditions
Pneumonia Care Hip Fracture Childbirth
Rate of Obstetric Tearing Vaginal Delivery WITH
Medical Instruments
Death Rate for Patients With a
Broken Hip
Rate of Obstetric Tearing Vaginal
Delivery WITHOUT Medical Instruments
The
Best
Car
e fo
r Pn
eum
onia
Pat
ient
s
Patie
nts
Asse
ssed
and
Giv
en
Pneu
mon
ia V
acci
natio
n
Bloo
d Te
st G
iven
to P
atie
nt
Prio
r to
Rece
ivin
g An
tibio
tics
Patie
nts
Give
n Ad
vice
or
Coun
selin
g Ab
out Q
uitti
ng
Smok
ing
Whi
le in
the
Hosp
ital
Patie
nts
Give
n In
itial
An
tibio
tic(s
) With
in 6
Hou
rs
Afte
r Get
ting
to th
e Ho
spita
l
Patie
nts
Give
n th
e M
ost
Appr
opria
te In
itial
Ant
ibio
tic(s
)
Patie
nts
Asse
ssed
and
Gi
ven
Influ
enza
Vac
cina
tion
Risk
Adj
uste
d Ra
te
Whe
n Co
mpa
red
to
Exp
ecte
d Ra
te
Obse
rved
Rat
e
Whe
n Co
mpa
red
to
Exp
ecte
d Ra
te
Obse
rved
Rat
e
Whe
n Co
mpa
red
to
Exp
ecte
d Ra
te
When choosing a hospital, please check to see if the higher or lower rate is better.
Risk Adjusted Rate: this takes the severity of each patient’s illness into account. When Compared to Expected: this comparison is based on how the hospital’s risk adjusted rate, or observed rate where applicable, measures up to the expected rate of other similar hospitals around the country, identifying it as performing the SAME, BETTER, or WORSE. When selecting a hospital, look for one with at least a SAME rating and ideally a BETTER rating.
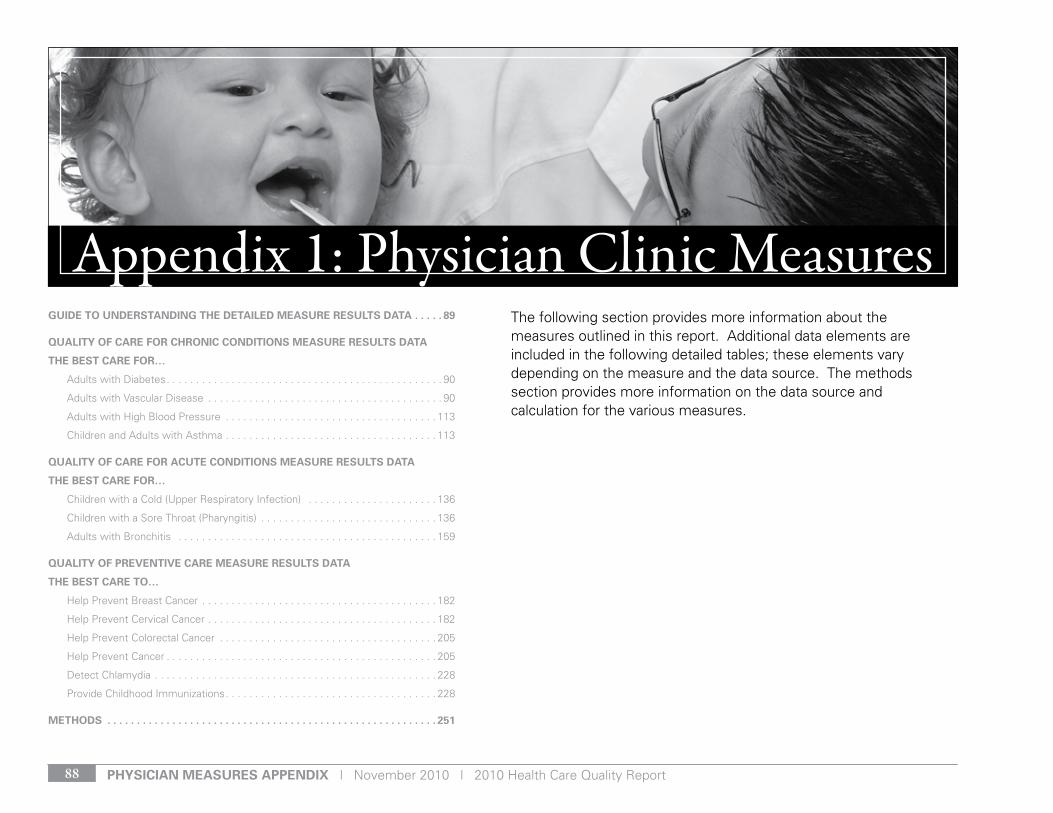
pHysiCian Measures appenDiX | November 2010 | 2010 Health Care Quality Report88
* sufficient data not available.
guiDe to unDerstanDing tHe DetaileD Measure results Data
* sufficient data not available.
guiDe to unDerstanDing tHe DetaileD Measure results Data . . . . . 89
Quality of Care for CHroniC ConDitions Measure results Data
tHe Best Care for…
Adults with Diabetes . . . . . . . . . . . . . . . . . . . . . . . . . . . . . . . . . . . . . . . . . . . . . . . 90
Adults with Vascular Disease . . . . . . . . . . . . . . . . . . . . . . . . . . . . . . . . . . . . . . . . 90
Adults with High Blood Pressure . . . . . . . . . . . . . . . . . . . . . . . . . . . . . . . . . . . . 113
Children and Adults with Asthma . . . . . . . . . . . . . . . . . . . . . . . . . . . . . . . . . . . . 113
Quality of Care for aCute ConDitions Measure results Data
tHe Best Care for…
Children with a Cold (Upper Respiratory Infection) . . . . . . . . . . . . . . . . . . . . . . 136
Children with a Sore Throat (Pharyngitis) . . . . . . . . . . . . . . . . . . . . . . . . . . . . . . 136
Adults with Bronchitis . . . . . . . . . . . . . . . . . . . . . . . . . . . . . . . . . . . . . . . . . . . . 159
Quality of preventive Care Measure results Data
tHe Best Care to…
Help Prevent Breast Cancer . . . . . . . . . . . . . . . . . . . . . . . . . . . . . . . . . . . . . . . . 182
Help Prevent Cervical Cancer . . . . . . . . . . . . . . . . . . . . . . . . . . . . . . . . . . . . . . . 182
Help Prevent Colorectal Cancer . . . . . . . . . . . . . . . . . . . . . . . . . . . . . . . . . . . . . 205
Help Prevent Cancer . . . . . . . . . . . . . . . . . . . . . . . . . . . . . . . . . . . . . . . . . . . . . . 205
Detect Chlamydia . . . . . . . . . . . . . . . . . . . . . . . . . . . . . . . . . . . . . . . . . . . . . . . . 228
Provide Childhood Immunizations . . . . . . . . . . . . . . . . . . . . . . . . . . . . . . . . . . . . 228
MetHoDs . . . . . . . . . . . . . . . . . . . . . . . . . . . . . . . . . . . . . . . . . . . . . . . . . . . . . . . . 251
The following section provides more information about the measures outlined in this report. Additional data elements are included in the following detailed tables; these elements vary depending on the measure and the data source. The methods section provides more information on the data source and calculation for the various measures.
Appendix 1: Physician Clinic Measures
November 2010 | 2010 Health Care Quality Report | pHysiCian Measures appenDiX 89
physician Clinic name: Reports the physician clinic name alphabetically under the city in which it is located.
Medical group name: Reports the medical group of which the clinic is a part. A medical group may have one or more clinics.
risk adjusted rate: Reports the physician clinic rate adjusted to the average state-wide payer mix. The risk adjusted rate accounts for differences in the physician clinic’s patient population beyond the provider’s control. This adjustment is based on insurance payer type. The three payer categories include Medicare, commercial, and MN health care programs/uninsured.
Confidence interval of risk adjusted rate: Reports the margin of error for the risk adjusted rate. Confidence intervals are a range of values which demonstrate the degree of certainty associated with the reported rate. This range takes into account potential variance in the rate if different patients were included in the sample. 95-percent-asymmetrical confidence intervals are calculated for each measure for each medical group. Asymmetrical confidence intervals are used to avoid confidence interval lower-bound values less than zero and upper bound val-ues greater than one hundred. For the calculation of risk adjusted confidence intervals, a weighted average of the variance for the payer categories was used.* Large differences between individu-al physician clinics’ rates may be significant and small differences are usually not significant.
Distribution of patient population or Medical group Distribu-tion of patient population: Medicare/Commercial/MN Health Care Programs and uninsured for Optimal Diabetes and Optimal Vascular Care.
Reports the patient distribution for each physician clinic or medi-cal group between these three insurance categories. These col-umns show the patient distribution prior to any risk adjustment.
total population or sample: Reports whether the results are based on the physician clinic or medical group’s total population or a sample of the total popula-tion for that measure.
sample size: Reports the number of patients meeting the criteria for inclusion in the measure and for whom data was submitted. This column is the denominator number used to calculate the rate.
non-risk adjusted rate: Reports the value when the numerator is divided by the denomi-nator prior to any risk-adjustment. The denominator is the sum of all the eligible cases submitted. The numerator is the sum of all eligible cases submitted where recommended care was provided or treatment goals were reached.
Confidence interval of non-risk adjusted rate: Reports the margin of error for the non-risk adjusted rate. Con-fidence intervals are a range of values which demonstrate the degree of certainty associated with the estimated rate. This range takes into account potential variance in the rate if different patients were included in the sample. 95-percent-asymmetrical confidence intervals are calculated for each measure for each medical group. Asymmetrical confidence intervals are used to avoid confidence interval lower-bound values less than zero and upper bound values greater than one hundred. Large differences between individual physician clinics’ rates may be significant and small differences are usually not significant.
guiDe to unDerstanDing tHe DetaileD Measure results Data
* Curtin, lr and rJ klein. “direct standardization (Age-Adjusted death rates).” Centers for disease Control and Prevention and national Center for Health statistics. Healthy People 2000 statistical notes no. 6. 1995.
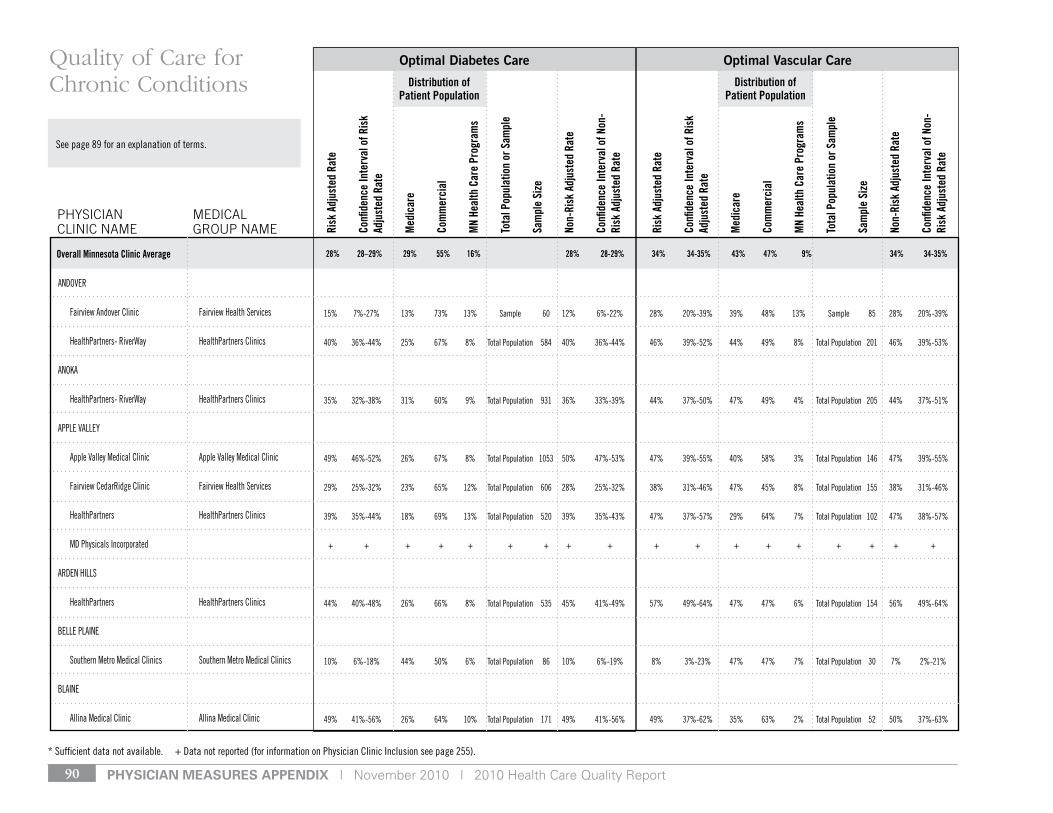
pHysiCian Measures appenDiX | November 2010 | 2010 Health Care Quality Report90
* sufficient data not available. + data not reported (for information on Physician Clinic Inclusion see page 255).
see page 89 for an explanation of terms.
Risk
Adj
uste
d Ra
te
Confi
denc
e In
terv
al o
f Ris
k Ad
just
ed R
ate
Med
icar
e
Com
mer
cial
MN
Heal
th C
are
Prog
ram
s
Tota
l Pop
ulat
ion
or S
ampl
e
Sam
ple
Size
Non-
Risk
Adj
uste
d Ra
te
Confi
denc
e In
terv
al o
f Non
-Ri
sk A
djus
ted
Rate
Risk
Adj
uste
d Ra
te
Confi
denc
e In
terv
al o
f Ris
k Ad
just
ed R
ate
Med
icar
e
Com
mer
cial
MN
Heal
th C
are
Prog
ram
s
Tota
l Pop
ulat
ion
or S
ampl
e
Sam
ple
Size
Non-
Risk
Adj
uste
d Ra
te
Confi
denc
e In
terv
al o
f Non
-Ri
sk A
djus
ted
Rate
Optimal Diabetes Care Optimal Vascular Care
PHySIcIAN cLINIc NAME
MEdIcAL GrOuP NAME
Quality of Care for Chronic Conditions Distribution of
Patient Population
28% 28–29% 29% 55% 16% 28% 28-29% 34% 34-35% 43% 47% 9% 34% 34-35%
Distribution of Patient Population
Overall Minnesota Clinic Average
Andover
Fairview Andover Clinic Fairview Health services
HealthPartners- riverWay HealthPartners Clinics
AnokA
HealthPartners- riverWay HealthPartners Clinics
APPle vAlley
Apple valley Medical Clinic Apple valley Medical Clinic
Fairview Cedarridge Clinic Fairview Health services
HealthPartners HealthPartners Clinics
Md Physicals Incorporated
Arden HIlls
HealthPartners HealthPartners Clinics
Belle PlAIne
southern Metro Medical Clinics southern Metro Medical Clinics
BlAIne
Allina Medical Clinic Allina Medical Clinic
15% 7%-27% 13% 73% 13% sample 60 12% 6%-22% 28% 20%-39% 39% 48% 13% sample 85 28% 20%-39%
40% 36%-44% 25% 67% 8% total Population 584 40% 36%-44% 46% 39%-52% 44% 49% 8% total Population 201 46% 39%-53%
35% 32%-38% 31% 60% 9% total Population 931 36% 33%-39% 44% 37%-50% 47% 49% 4% total Population 205 44% 37%-51%
49% 46%-52% 26% 67% 8% total Population 1053 50% 47%-53% 47% 39%-55% 40% 58% 3% total Population 146 47% 39%-55%
29% 25%-32% 23% 65% 12% total Population 606 28% 25%-32% 38% 31%-46% 47% 45% 8% total Population 155 38% 31%-46%
39% 35%-44% 18% 69% 13% total Population 520 39% 35%-43% 47% 37%-57% 29% 64% 7% total Population 102 47% 38%-57%
+ + + + + + + + + + + + + + + + + +
44% 40%-48% 26% 66% 8% total Population 535 45% 41%-49% 57% 49%-64% 47% 47% 6% total Population 154 56% 49%-64%
10% 6%-18% 44% 50% 6% total Population 86 10% 6%-19% 8% 3%-23% 47% 47% 7% total Population 30 7% 2%-21%
49% 41%-56% 26% 64% 10% total Population 171 49% 41%-56% 49% 37%-62% 35% 63% 2% total Population 52 50% 37%-63%
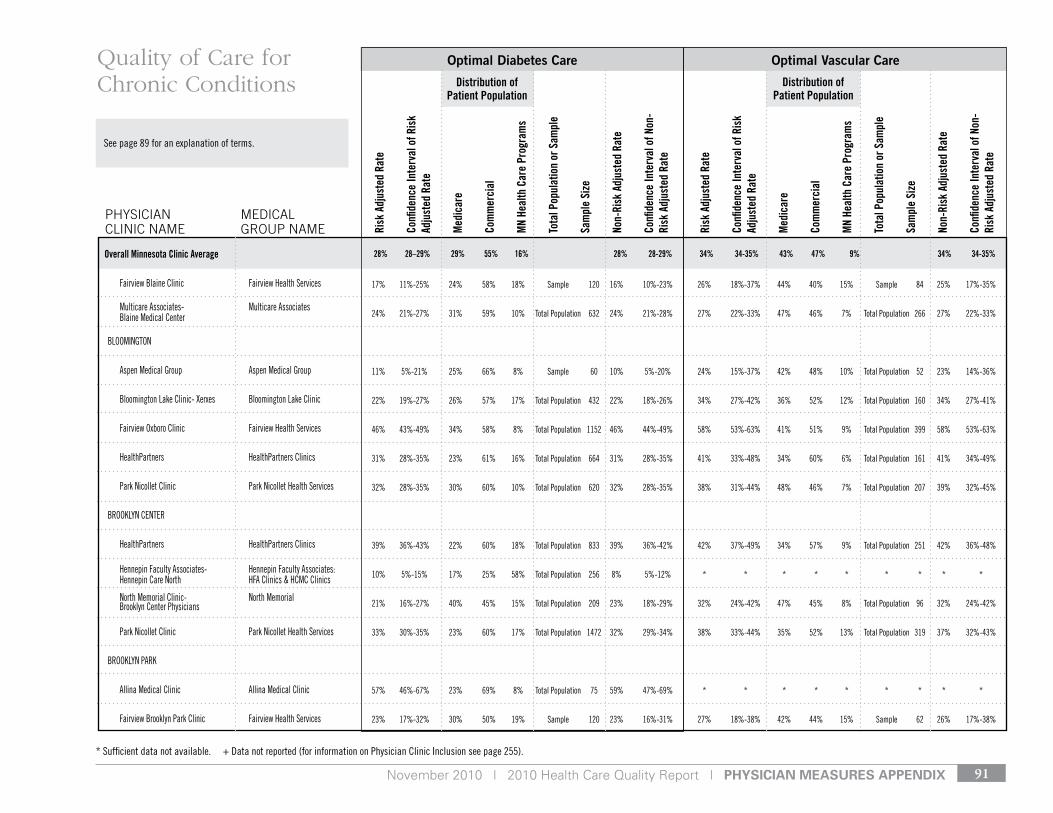
November 2010 | 2010 Health Care Quality Report | pHysiCian Measures appenDiX 91
see page 89 for an explanation of terms.
Fairview Blaine Clinic Fairview Health services
Multicare Associates- Multicare Associates Blaine Medical Center
BlooMIngton
Aspen Medical group Aspen Medical group
Bloomington lake Clinic- Xerxes Bloomington lake Clinic
Fairview oxboro Clinic Fairview Health services
HealthPartners HealthPartners Clinics
Park nicollet Clinic Park nicollet Health services
Brooklyn Center
HealthPartners HealthPartners Clinics
Hennepin Faculty Associates- Hennepin Faculty Associates: Hennepin Care north HFA Clinics & HCMC Clinics
north Memorial Clinic- north Memorial Brooklyn Center Physicians
Park nicollet Clinic Park nicollet Health services
Brooklyn PArk
Allina Medical Clinic Allina Medical Clinic
Fairview Brooklyn Park Clinic Fairview Health services
Risk
Adj
uste
d Ra
te
Confi
denc
e In
terv
al o
f Ris
k Ad
just
ed R
ate
Med
icar
e
Com
mer
cial
MN
Heal
th C
are
Prog
ram
s
Tota
l Pop
ulat
ion
or S
ampl
e
Sam
ple
Size
Non-
Risk
Adj
uste
d Ra
te
Confi
denc
e In
terv
al o
f Non
-Ri
sk A
djus
ted
Rate
Risk
Adj
uste
d Ra
te
Confi
denc
e In
terv
al o
f Ris
k Ad
just
ed R
ate
Med
icar
e
Com
mer
cial
MN
Heal
th C
are
Prog
ram
s
Tota
l Pop
ulat
ion
or S
ampl
e
Sam
ple
Size
Non-
Risk
Adj
uste
d Ra
te
Confi
denc
e In
terv
al o
f Non
-Ri
sk A
djus
ted
Rate
Optimal Diabetes Care Optimal Vascular Care
PHySIcIAN cLINIc NAME
MEdIcAL GrOuP NAME
Quality of Care for Chronic Conditions Distribution of
Patient Population
28% 28–29% 29% 55% 16% 28% 28-29% 34% 34-35% 43% 47% 9% 34% 34-35%
Distribution of Patient Population
Overall Minnesota Clinic Average
* sufficient data not available. + data not reported (for information on Physician Clinic Inclusion see page 255).
17% 11%-25% 24% 58% 18% sample 120 16% 10%-23% 26% 18%-37% 44% 40% 15% sample 84 25% 17%-35%
24% 21%-27% 31% 59% 10% total Population 632 24% 21%-28% 27% 22%-33% 47% 46% 7% total Population 266 27% 22%-33%
11% 5%-21% 25% 66% 8% sample 60 10% 5%-20% 24% 15%-37% 42% 48% 10% total Population 52 23% 14%-36%
22% 19%-27% 26% 57% 17% total Population 432 22% 18%-26% 34% 27%-42% 36% 52% 12% total Population 160 34% 27%-41%
46% 43%-49% 34% 58% 8% total Population 1152 46% 44%-49% 58% 53%-63% 41% 51% 9% total Population 399 58% 53%-63%
31% 28%-35% 23% 61% 16% total Population 664 31% 28%-35% 41% 33%-48% 34% 60% 6% total Population 161 41% 34%-49%
32% 28%-35% 30% 60% 10% total Population 620 32% 28%-35% 38% 31%-44% 48% 46% 7% total Population 207 39% 32%-45%
39% 36%-43% 22% 60% 18% total Population 833 39% 36%-42% 42% 37%-49% 34% 57% 9% total Population 251 42% 36%-48%
10% 5%-15% 17% 25% 58% total Population 256 8% 5%-12% * * * * * * * * *
21% 16%-27% 40% 45% 15% total Population 209 23% 18%-29% 32% 24%-42% 47% 45% 8% total Population 96 32% 24%-42%
33% 30%-35% 23% 60% 17% total Population 1472 32% 29%-34% 38% 33%-44% 35% 52% 13% total Population 319 37% 32%-43%
57% 46%-67% 23% 69% 8% total Population 75 59% 47%-69% * * * * * * * * *
23% 17%-32% 30% 50% 19% sample 120 23% 16%-31% 27% 18%-38% 42% 44% 15% sample 62 26% 17%-38%
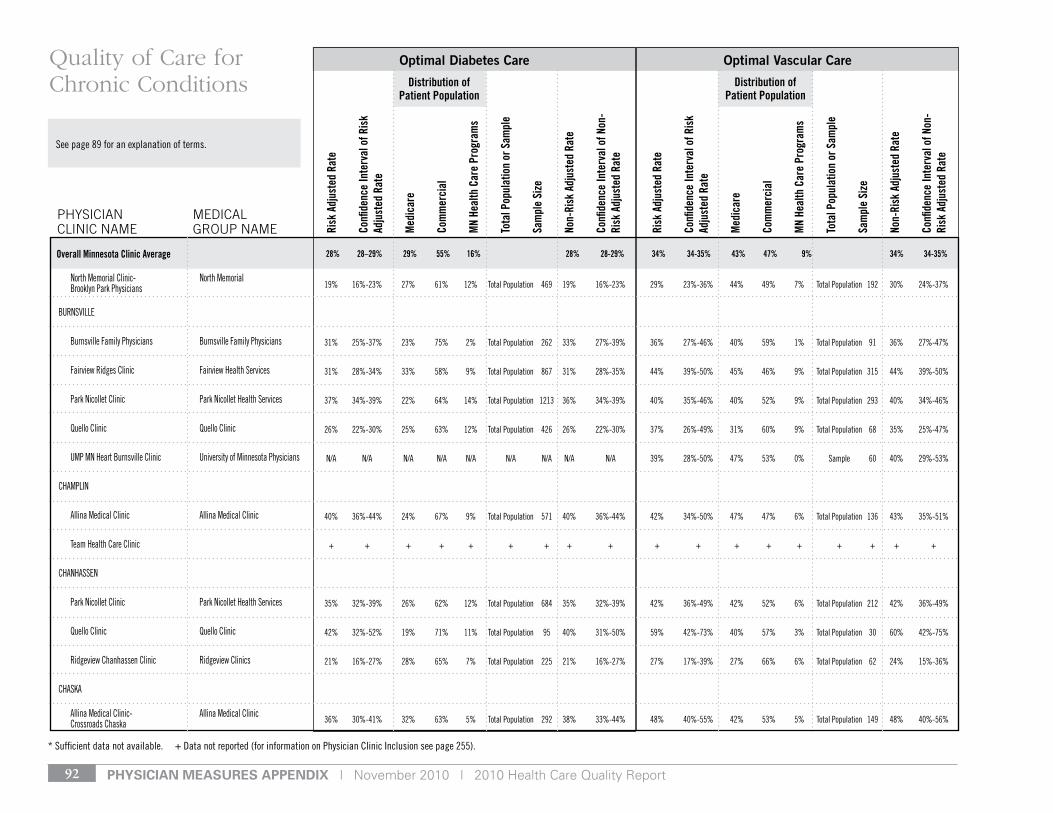
pHysiCian Measures appenDiX | November 2010 | 2010 Health Care Quality Report92
see page 89 for an explanation of terms.
Risk
Adj
uste
d Ra
te
Confi
denc
e In
terv
al o
f Ris
k Ad
just
ed R
ate
Med
icar
e
Com
mer
cial
MN
Heal
th C
are
Prog
ram
s
Tota
l Pop
ulat
ion
or S
ampl
e
Sam
ple
Size
Non-
Risk
Adj
uste
d Ra
te
Confi
denc
e In
terv
al o
f Non
-Ri
sk A
djus
ted
Rate
Risk
Adj
uste
d Ra
te
Confi
denc
e In
terv
al o
f Ris
k Ad
just
ed R
ate
Med
icar
e
Com
mer
cial
MN
Heal
th C
are
Prog
ram
s
Tota
l Pop
ulat
ion
or S
ampl
e
Sam
ple
Size
Non-
Risk
Adj
uste
d Ra
te
Confi
denc
e In
terv
al o
f Non
-Ri
sk A
djus
ted
Rate
Optimal Diabetes Care Optimal Vascular Care
PHySIcIAN cLINIc NAME
MEdIcAL GrOuP NAME
Quality of Care for Chronic Conditions Distribution of
Patient Population
28% 28–29% 29% 55% 16% 28% 28-29% 34% 34-35% 43% 47% 9% 34% 34-35%
Distribution of Patient Population
Overall Minnesota Clinic Average
north Memorial Clinic- north Memorial Brooklyn Park Physicians
BurnsvIlle
Burnsville Family Physicians Burnsville Family Physicians
Fairview ridges Clinic Fairview Health services
Park nicollet Clinic Park nicollet Health services
Quello Clinic Quello Clinic
uMP Mn Heart Burnsville Clinic university of Minnesota Physicians
CHAMPlIn
Allina Medical Clinic Allina Medical Clinic
team Health Care Clinic
CHAnHAssen
Park nicollet Clinic Park nicollet Health services
Quello Clinic Quello Clinic
ridgeview Chanhassen Clinic ridgeview Clinics
CHAskA
Allina Medical Clinic- Allina Medical Clinic Crossroads Chaska
19% 16%-23% 27% 61% 12% total Population 469 19% 16%-23% 29% 23%-36% 44% 49% 7% total Population 192 30% 24%-37%
31% 25%-37% 23% 75% 2% total Population 262 33% 27%-39% 36% 27%-46% 40% 59% 1% total Population 91 36% 27%-47%
31% 28%-34% 33% 58% 9% total Population 867 31% 28%-35% 44% 39%-50% 45% 46% 9% total Population 315 44% 39%-50%
37% 34%-39% 22% 64% 14% total Population 1213 36% 34%-39% 40% 35%-46% 40% 52% 9% total Population 293 40% 34%-46%
26% 22%-30% 25% 63% 12% total Population 426 26% 22%-30% 37% 26%-49% 31% 60% 9% total Population 68 35% 25%-47%
n/A n/A n/A n/A n/A n/A n/A n/A n/A 39% 28%-50% 47% 53% 0% sample 60 40% 29%-53%
40% 36%-44% 24% 67% 9% total Population 571 40% 36%-44% 42% 34%-50% 47% 47% 6% total Population 136 43% 35%-51%
+ + + + + + + + + + + + + + + + + +
35% 32%-39% 26% 62% 12% total Population 684 35% 32%-39% 42% 36%-49% 42% 52% 6% total Population 212 42% 36%-49%
42% 32%-52% 19% 71% 11% total Population 95 40% 31%-50% 59% 42%-73% 40% 57% 3% total Population 30 60% 42%-75%
21% 16%-27% 28% 65% 7% total Population 225 21% 16%-27% 27% 17%-39% 27% 66% 6% total Population 62 24% 15%-36%
36% 30%-41% 32% 63% 5% total Population 292 38% 33%-44% 48% 40%-55% 42% 53% 5% total Population 149 48% 40%-56%
* sufficient data not available. + data not reported (for information on Physician Clinic Inclusion see page 255).
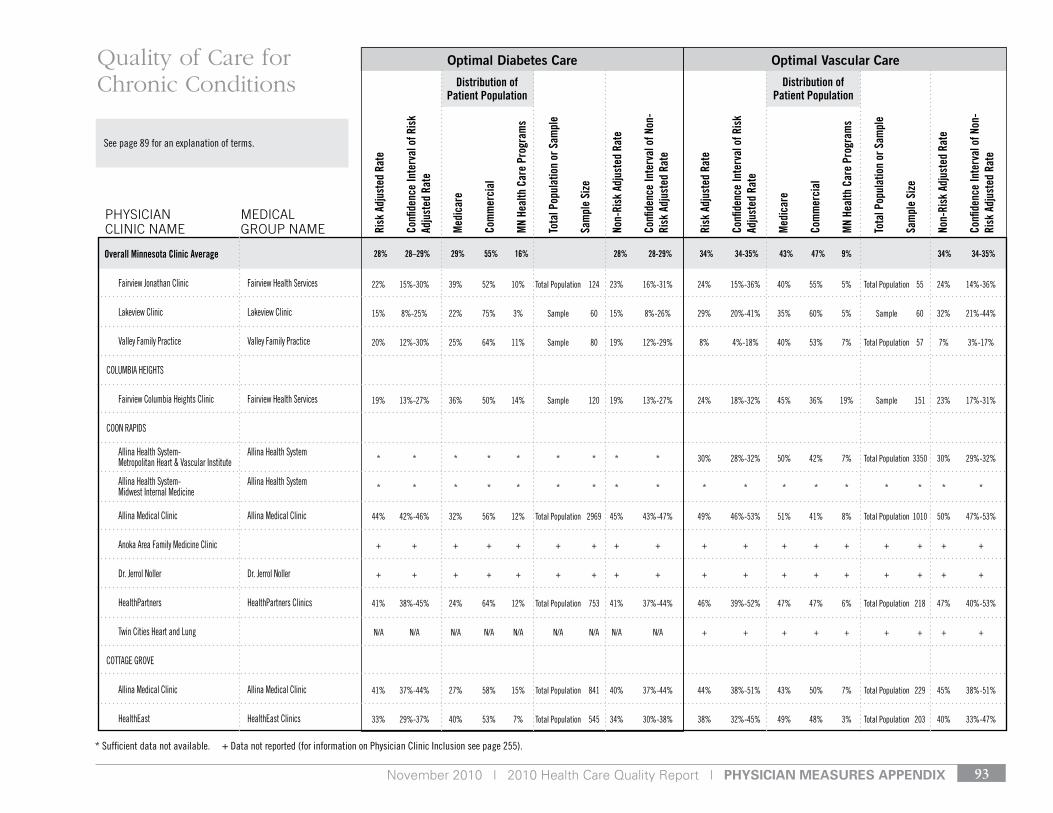
November 2010 | 2010 Health Care Quality Report | pHysiCian Measures appenDiX 93
see page 89 for an explanation of terms.
Risk
Adj
uste
d Ra
te
Confi
denc
e In
terv
al o
f Ris
k Ad
just
ed R
ate
Med
icar
e
Com
mer
cial
MN
Heal
th C
are
Prog
ram
s
Tota
l Pop
ulat
ion
or S
ampl
e
Sam
ple
Size
Non-
Risk
Adj
uste
d Ra
te
Confi
denc
e In
terv
al o
f Non
-Ri
sk A
djus
ted
Rate
Risk
Adj
uste
d Ra
te
Confi
denc
e In
terv
al o
f Ris
k Ad
just
ed R
ate
Med
icar
e
Com
mer
cial
MN
Heal
th C
are
Prog
ram
s
Tota
l Pop
ulat
ion
or S
ampl
e
Sam
ple
Size
Non-
Risk
Adj
uste
d Ra
te
Confi
denc
e In
terv
al o
f Non
-Ri
sk A
djus
ted
Rate
Optimal Diabetes Care Optimal Vascular Care
PHySIcIAN cLINIc NAME
MEdIcAL GrOuP NAME
Quality of Care for Chronic Conditions Distribution of
Patient Population
28% 28–29% 29% 55% 16% 28% 28-29% 34% 34-35% 43% 47% 9% 34% 34-35%
Distribution of Patient Population
Overall Minnesota Clinic Average
Fairview Jonathan Clinic Fairview Health services
lakeview Clinic lakeview Clinic
valley Family Practice valley Family Practice
ColuMBIA HeIgHts
Fairview Columbia Heights Clinic Fairview Health services
Coon rAPIds
Allina Health system- Allina Health system Metropolitan Heart & vascular Institute
Allina Health system- Allina Health system Midwest Internal Medicine
Allina Medical Clinic Allina Medical Clinic
Anoka Area Family Medicine Clinic
dr. Jerrol noller dr. Jerrol noller
HealthPartners HealthPartners Clinics
twin Cities Heart and lung
CottAge grove
Allina Medical Clinic Allina Medical Clinic
Healtheast Healtheast Clinics
22% 15%-30% 39% 52% 10% total Population 124 23% 16%-31% 24% 15%-36% 40% 55% 5% total Population 55 24% 14%-36%
15% 8%-25% 22% 75% 3% sample 60 15% 8%-26% 29% 20%-41% 35% 60% 5% sample 60 32% 21%-44%
20% 12%-30% 25% 64% 11% sample 80 19% 12%-29% 8% 4%-18% 40% 53% 7% total Population 57 7% 3%-17%
19% 13%-27% 36% 50% 14% sample 120 19% 13%-27% 24% 18%-32% 45% 36% 19% sample 151 23% 17%-31%
* * * * * * * * * 30% 28%-32% 50% 42% 7% total Population 3350 30% 29%-32%
* * * * * * * * * * * * * * * * * *
44% 42%-46% 32% 56% 12% total Population 2969 45% 43%-47% 49% 46%-53% 51% 41% 8% total Population 1010 50% 47%-53%
+ + + + + + + + + + + + + + + + + +
+ + + + + + + + + + + + + + + + + +
41% 38%-45% 24% 64% 12% total Population 753 41% 37%-44% 46% 39%-52% 47% 47% 6% total Population 218 47% 40%-53%
n/A n/A n/A n/A n/A n/A n/A n/A n/A + + + + + + + + +
41% 37%-44% 27% 58% 15% total Population 841 40% 37%-44% 44% 38%-51% 43% 50% 7% total Population 229 45% 38%-51%
33% 29%-37% 40% 53% 7% total Population 545 34% 30%-38% 38% 32%-45% 49% 48% 3% total Population 203 40% 33%-47%
* sufficient data not available. + data not reported (for information on Physician Clinic Inclusion see page 255).
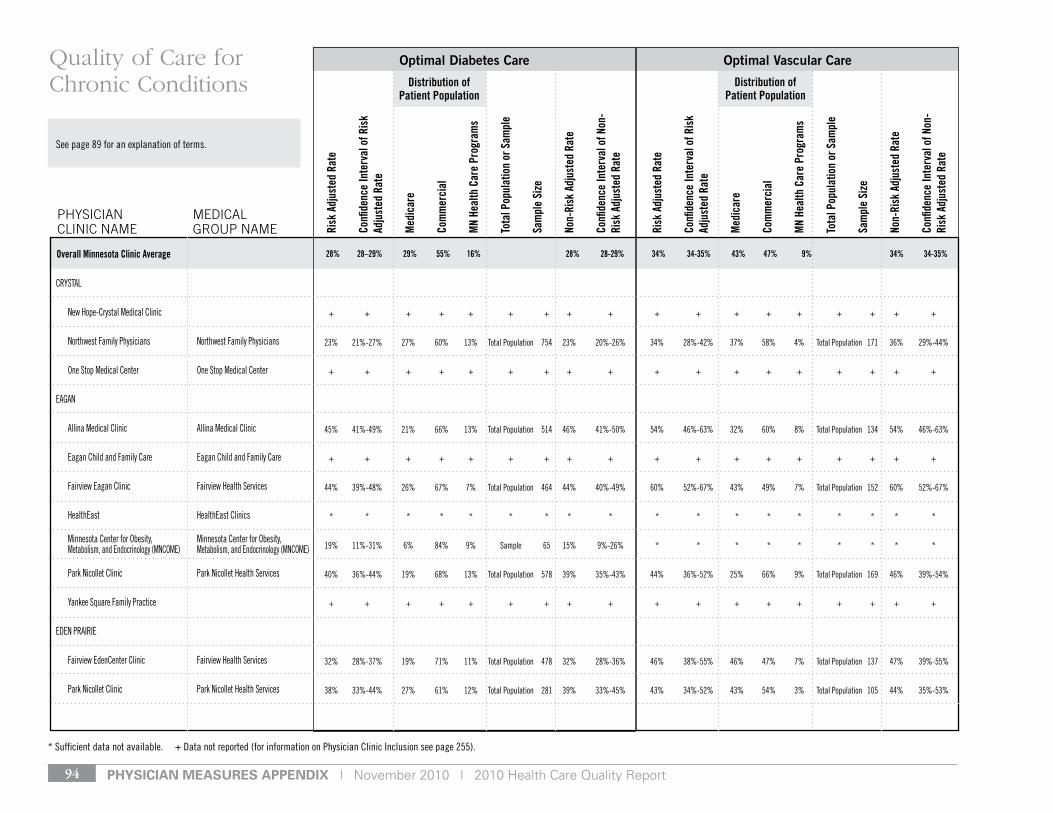
pHysiCian Measures appenDiX | November 2010 | 2010 Health Care Quality Report94
see page 89 for an explanation of terms.
Risk
Adj
uste
d Ra
te
Confi
denc
e In
terv
al o
f Ris
k Ad
just
ed R
ate
Med
icar
e
Com
mer
cial
MN
Heal
th C
are
Prog
ram
s
Tota
l Pop
ulat
ion
or S
ampl
e
Sam
ple
Size
Non-
Risk
Adj
uste
d Ra
te
Confi
denc
e In
terv
al o
f Non
-Ri
sk A
djus
ted
Rate
Risk
Adj
uste
d Ra
te
Confi
denc
e In
terv
al o
f Ris
k Ad
just
ed R
ate
Med
icar
e
Com
mer
cial
MN
Heal
th C
are
Prog
ram
s
Tota
l Pop
ulat
ion
or S
ampl
e
Sam
ple
Size
Non-
Risk
Adj
uste
d Ra
te
Confi
denc
e In
terv
al o
f Non
-Ri
sk A
djus
ted
Rate
Optimal Diabetes Care Optimal Vascular Care
PHySIcIAN cLINIc NAME
MEdIcAL GrOuP NAME
Quality of Care for Chronic Conditions Distribution of
Patient Population
28% 28–29% 29% 55% 16% 28% 28-29% 34% 34-35% 43% 47% 9% 34% 34-35%
Distribution of Patient Population
Overall Minnesota Clinic Average
CrystAl
new Hope-Crystal Medical Clinic
northwest Family Physicians northwest Family Physicians
one stop Medical Center one stop Medical Center
eAgAn
Allina Medical Clinic Allina Medical Clinic
eagan Child and Family Care eagan Child and Family Care
Fairview eagan Clinic Fairview Health services
Healtheast Healtheast Clinics
Minnesota Center for obesity, Minnesota Center for obesity, Metabolism, and endocrinology (MnCoMe) Metabolism, and endocrinology (MnCoMe)
Park nicollet Clinic Park nicollet Health services
yankee square Family Practice
eden PrAIrIe
Fairview edenCenter Clinic Fairview Health services
Park nicollet Clinic Park nicollet Health services
+ + + + + + + + + + + + + + + + + +
23% 21%-27% 27% 60% 13% total Population 754 23% 20%-26% 34% 28%-42% 37% 58% 4% total Population 171 36% 29%-44%
+ + + + + + + + + + + + + + + + + +
45% 41%-49% 21% 66% 13% total Population 514 46% 41%-50% 54% 46%-63% 32% 60% 8% total Population 134 54% 46%-63%
+ + + + + + + + + + + + + + + + + +
44% 39%-48% 26% 67% 7% total Population 464 44% 40%-49% 60% 52%-67% 43% 49% 7% total Population 152 60% 52%-67%
* * * * * * * * * * * * * * * * * *
19% 11%-31% 6% 84% 9% sample 65 15% 9%-26% * * * * * * * * *
40% 36%-44% 19% 68% 13% total Population 578 39% 35%-43% 44% 36%-52% 25% 66% 9% total Population 169 46% 39%-54%
+ + + + + + + + + + + + + + + + + +
32% 28%-37% 19% 71% 11% total Population 478 32% 28%-36% 46% 38%-55% 46% 47% 7% total Population 137 47% 39%-55%
38% 33%-44% 27% 61% 12% total Population 281 39% 33%-45% 43% 34%-52% 43% 54% 3% total Population 105 44% 35%-53%
* sufficient data not available. + data not reported (for information on Physician Clinic Inclusion see page 255).
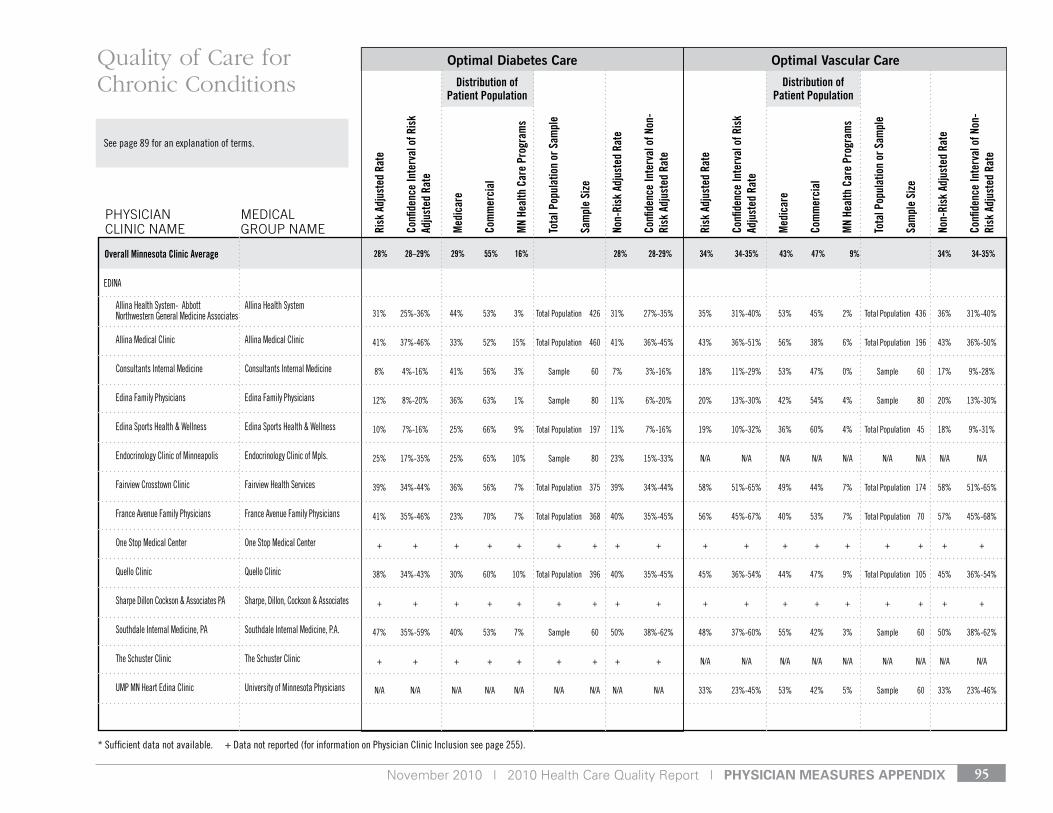
November 2010 | 2010 Health Care Quality Report | pHysiCian Measures appenDiX 95
see page 89 for an explanation of terms.
Risk
Adj
uste
d Ra
te
Confi
denc
e In
terv
al o
f Ris
k Ad
just
ed R
ate
Med
icar
e
Com
mer
cial
MN
Heal
th C
are
Prog
ram
s
Tota
l Pop
ulat
ion
or S
ampl
e
Sam
ple
Size
Non-
Risk
Adj
uste
d Ra
te
Confi
denc
e In
terv
al o
f Non
-Ri
sk A
djus
ted
Rate
Risk
Adj
uste
d Ra
te
Confi
denc
e In
terv
al o
f Ris
k Ad
just
ed R
ate
Med
icar
e
Com
mer
cial
MN
Heal
th C
are
Prog
ram
s
Tota
l Pop
ulat
ion
or S
ampl
e
Sam
ple
Size
Non-
Risk
Adj
uste
d Ra
te
Confi
denc
e In
terv
al o
f Non
-Ri
sk A
djus
ted
Rate
Optimal Diabetes Care Optimal Vascular Care
PHySIcIAN cLINIc NAME
MEdIcAL GrOuP NAME
Quality of Care for Chronic Conditions Distribution of
Patient Population
28% 28–29% 29% 55% 16% 28% 28-29% 34% 34-35% 43% 47% 9% 34% 34-35%
Distribution of Patient Population
Overall Minnesota Clinic Average
edInA
Allina Health system- Abbott Allina Health system northwestern general Medicine Associates
Allina Medical Clinic Allina Medical Clinic
Consultants Internal Medicine Consultants Internal Medicine
edina Family Physicians edina Family Physicians
edina sports Health & Wellness edina sports Health & Wellness
endocrinology Clinic of Minneapolis endocrinology Clinic of Mpls.
Fairview Crosstown Clinic Fairview Health services
France Avenue Family Physicians France Avenue Family Physicians
one stop Medical Center one stop Medical Center
Quello Clinic Quello Clinic
sharpe dillon Cockson & Associates PA sharpe, dillon, Cockson & Associates
southdale Internal Medicine, PA southdale Internal Medicine, P.A.
the schuster Clinic the schuster Clinic
uMP Mn Heart edina Clinic university of Minnesota Physicians
31% 25%-36% 44% 53% 3% total Population 426 31% 27%-35% 35% 31%-40% 53% 45% 2% total Population 436 36% 31%-40%
41% 37%-46% 33% 52% 15% total Population 460 41% 36%-45% 43% 36%-51% 56% 38% 6% total Population 196 43% 36%-50%
8% 4%-16% 41% 56% 3% sample 60 7% 3%-16% 18% 11%-29% 53% 47% 0% sample 60 17% 9%-28%
12% 8%-20% 36% 63% 1% sample 80 11% 6%-20% 20% 13%-30% 42% 54% 4% sample 80 20% 13%-30%
10% 7%-16% 25% 66% 9% total Population 197 11% 7%-16% 19% 10%-32% 36% 60% 4% total Population 45 18% 9%-31%
25% 17%-35% 25% 65% 10% sample 80 23% 15%-33% n/A n/A n/A n/A n/A n/A n/A n/A n/A
39% 34%-44% 36% 56% 7% total Population 375 39% 34%-44% 58% 51%-65% 49% 44% 7% total Population 174 58% 51%-65%
41% 35%-46% 23% 70% 7% total Population 368 40% 35%-45% 56% 45%-67% 40% 53% 7% total Population 70 57% 45%-68%
+ + + + + + + + + + + + + + + + + +
38% 34%-43% 30% 60% 10% total Population 396 40% 35%-45% 45% 36%-54% 44% 47% 9% total Population 105 45% 36%-54%
+ + + + + + + + + + + + + + + + + +
47% 35%-59% 40% 53% 7% sample 60 50% 38%-62% 48% 37%-60% 55% 42% 3% sample 60 50% 38%-62%
+ + + + + + + + + n/A n/A n/A n/A n/A n/A n/A n/A n/A
n/A n/A n/A n/A n/A n/A n/A n/A n/A 33% 23%-45% 53% 42% 5% sample 60 33% 23%-46%
* sufficient data not available. + data not reported (for information on Physician Clinic Inclusion see page 255).
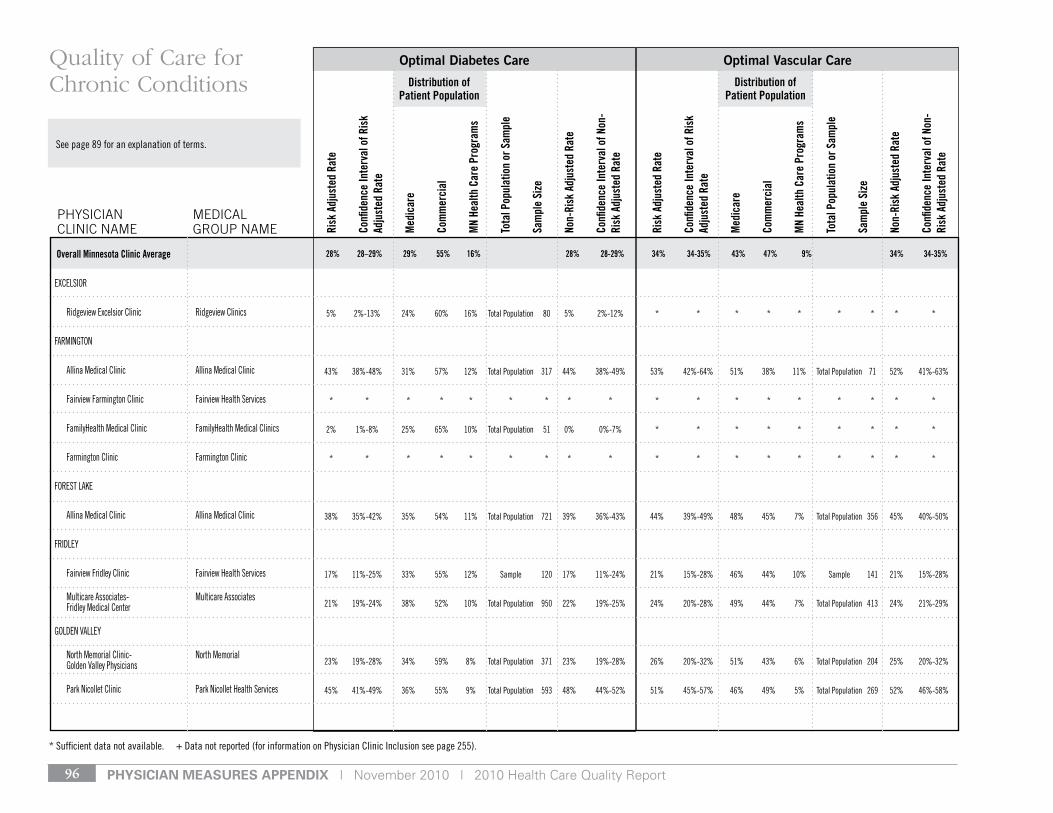
pHysiCian Measures appenDiX | November 2010 | 2010 Health Care Quality Report96
see page 89 for an explanation of terms.
Risk
Adj
uste
d Ra
te
Confi
denc
e In
terv
al o
f Ris
k Ad
just
ed R
ate
Med
icar
e
Com
mer
cial
MN
Heal
th C
are
Prog
ram
s
Tota
l Pop
ulat
ion
or S
ampl
e
Sam
ple
Size
Non-
Risk
Adj
uste
d Ra
te
Confi
denc
e In
terv
al o
f Non
-Ri
sk A
djus
ted
Rate
Risk
Adj
uste
d Ra
te
Confi
denc
e In
terv
al o
f Ris
k Ad
just
ed R
ate
Med
icar
e
Com
mer
cial
MN
Heal
th C
are
Prog
ram
s
Tota
l Pop
ulat
ion
or S
ampl
e
Sam
ple
Size
Non-
Risk
Adj
uste
d Ra
te
Confi
denc
e In
terv
al o
f Non
-Ri
sk A
djus
ted
Rate
Optimal Diabetes Care Optimal Vascular Care
PHySIcIAN cLINIc NAME
MEdIcAL GrOuP NAME
Quality of Care for Chronic Conditions Distribution of
Patient Population
28% 28–29% 29% 55% 16% 28% 28-29% 34% 34-35% 43% 47% 9% 34% 34-35%
Distribution of Patient Population
Overall Minnesota Clinic Average
eXCelsIor
ridgeview excelsior Clinic ridgeview Clinics
FArMIngton
Allina Medical Clinic Allina Medical Clinic
Fairview Farmington Clinic Fairview Health services
FamilyHealth Medical Clinic FamilyHealth Medical Clinics
Farmington Clinic Farmington Clinic
Forest lAke
Allina Medical Clinic Allina Medical Clinic
FrIdley
Fairview Fridley Clinic Fairview Health services
Multicare Associates- Multicare Associates Fridley Medical Center
golden vAlley
north Memorial Clinic- north Memorial golden valley Physicians
Park nicollet Clinic Park nicollet Health services
5% 2%-13% 24% 60% 16% total Population 80 5% 2%-12% * * * * * * * * *
43% 38%-48% 31% 57% 12% total Population 317 44% 38%-49% 53% 42%-64% 51% 38% 11% total Population 71 52% 41%-63%
* * * * * * * * * * * * * * * * * *
2% 1%-8% 25% 65% 10% total Population 51 0% 0%-7% * * * * * * * * *
* * * * * * * * * * * * * * * * * *
38% 35%-42% 35% 54% 11% total Population 721 39% 36%-43% 44% 39%-49% 48% 45% 7% total Population 356 45% 40%-50%
17% 11%-25% 33% 55% 12% sample 120 17% 11%-24% 21% 15%-28% 46% 44% 10% sample 141 21% 15%-28%
21% 19%-24% 38% 52% 10% total Population 950 22% 19%-25% 24% 20%-28% 49% 44% 7% total Population 413 24% 21%-29%
23% 19%-28% 34% 59% 8% total Population 371 23% 19%-28% 26% 20%-32% 51% 43% 6% total Population 204 25% 20%-32%
45% 41%-49% 36% 55% 9% total Population 593 48% 44%-52% 51% 45%-57% 46% 49% 5% total Population 269 52% 46%-58%
* sufficient data not available. + data not reported (for information on Physician Clinic Inclusion see page 255).
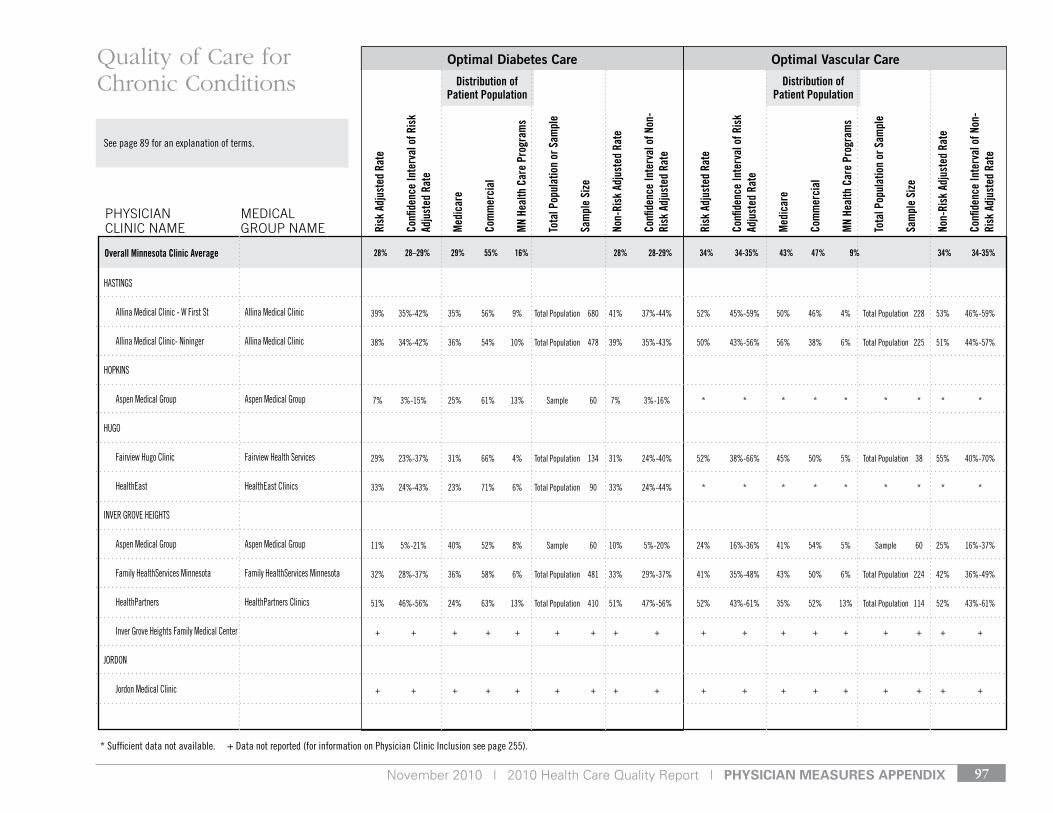
November 2010 | 2010 Health Care Quality Report | pHysiCian Measures appenDiX 97
see page 89 for an explanation of terms.
Risk
Adj
uste
d Ra
te
Confi
denc
e In
terv
al o
f Ris
k Ad
just
ed R
ate
Med
icar
e
Com
mer
cial
MN
Heal
th C
are
Prog
ram
s
Tota
l Pop
ulat
ion
or S
ampl
e
Sam
ple
Size
Non-
Risk
Adj
uste
d Ra
te
Confi
denc
e In
terv
al o
f Non
-Ri
sk A
djus
ted
Rate
Risk
Adj
uste
d Ra
te
Confi
denc
e In
terv
al o
f Ris
k Ad
just
ed R
ate
Med
icar
e
Com
mer
cial
MN
Heal
th C
are
Prog
ram
s
Tota
l Pop
ulat
ion
or S
ampl
e
Sam
ple
Size
Non-
Risk
Adj
uste
d Ra
te
Confi
denc
e In
terv
al o
f Non
-Ri
sk A
djus
ted
Rate
Optimal Diabetes Care Optimal Vascular Care
PHySIcIAN cLINIc NAME
MEdIcAL GrOuP NAME
Quality of Care for Chronic Conditions Distribution of
Patient Population
28% 28–29% 29% 55% 16% 28% 28-29% 34% 34-35% 43% 47% 9% 34% 34-35%
Distribution of Patient Population
Overall Minnesota Clinic Average
HAstIngs
Allina Medical Clinic - W First st Allina Medical Clinic
Allina Medical Clinic- nininger Allina Medical Clinic
HoPkIns
Aspen Medical group Aspen Medical group
Hugo
Fairview Hugo Clinic Fairview Health services
Healtheast Healtheast Clinics
Inver grove HeIgHts
Aspen Medical group Aspen Medical group
Family Healthservices Minnesota Family Healthservices Minnesota
HealthPartners HealthPartners Clinics
Inver grove Heights Family Medical Center
Jordon
Jordon Medical Clinic
39% 35%-42% 35% 56% 9% total Population 680 41% 37%-44% 52% 45%-59% 50% 46% 4% total Population 228 53% 46%-59%
38% 34%-42% 36% 54% 10% total Population 478 39% 35%-43% 50% 43%-56% 56% 38% 6% total Population 225 51% 44%-57%
7% 3%-15% 25% 61% 13% sample 60 7% 3%-16% * * * * * * * * *
29% 23%-37% 31% 66% 4% total Population 134 31% 24%-40% 52% 38%-66% 45% 50% 5% total Population 38 55% 40%-70%
33% 24%-43% 23% 71% 6% total Population 90 33% 24%-44% * * * * * * * * *
11% 5%-21% 40% 52% 8% sample 60 10% 5%-20% 24% 16%-36% 41% 54% 5% sample 60 25% 16%-37%
32% 28%-37% 36% 58% 6% total Population 481 33% 29%-37% 41% 35%-48% 43% 50% 6% total Population 224 42% 36%-49%
51% 46%-56% 24% 63% 13% total Population 410 51% 47%-56% 52% 43%-61% 35% 52% 13% total Population 114 52% 43%-61%
+ + + + + + + + + + + + + + + + + +
+ + + + + + + + + + + + + + + + + +
* sufficient data not available. + data not reported (for information on Physician Clinic Inclusion see page 255).
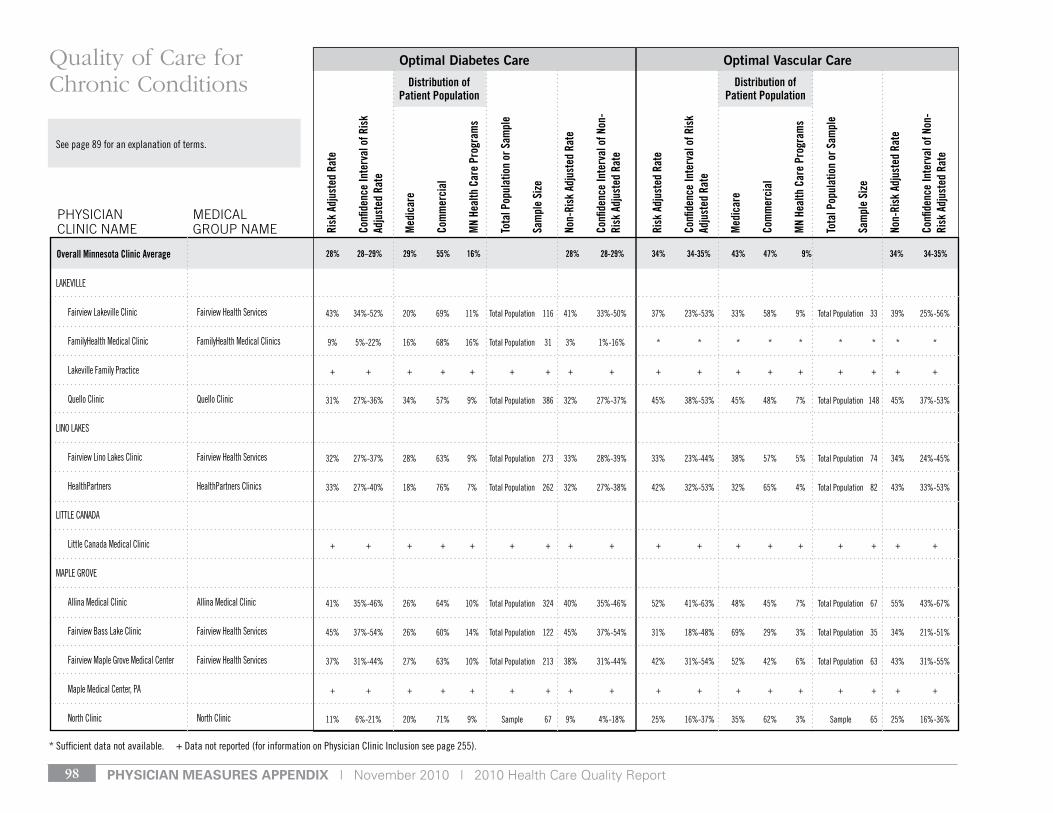
pHysiCian Measures appenDiX | November 2010 | 2010 Health Care Quality Report98
see page 89 for an explanation of terms.
Risk
Adj
uste
d Ra
te
Confi
denc
e In
terv
al o
f Ris
k Ad
just
ed R
ate
Med
icar
e
Com
mer
cial
MN
Heal
th C
are
Prog
ram
s
Tota
l Pop
ulat
ion
or S
ampl
e
Sam
ple
Size
Non-
Risk
Adj
uste
d Ra
te
Confi
denc
e In
terv
al o
f Non
-Ri
sk A
djus
ted
Rate
Risk
Adj
uste
d Ra
te
Confi
denc
e In
terv
al o
f Ris
k Ad
just
ed R
ate
Med
icar
e
Com
mer
cial
MN
Heal
th C
are
Prog
ram
s
Tota
l Pop
ulat
ion
or S
ampl
e
Sam
ple
Size
Non-
Risk
Adj
uste
d Ra
te
Confi
denc
e In
terv
al o
f Non
-Ri
sk A
djus
ted
Rate
Optimal Diabetes Care Optimal Vascular Care
PHySIcIAN cLINIc NAME
MEdIcAL GrOuP NAME
Quality of Care for Chronic Conditions Distribution of
Patient Population
28% 28–29% 29% 55% 16% 28% 28-29% 34% 34-35% 43% 47% 9% 34% 34-35%
Distribution of Patient Population
Overall Minnesota Clinic Average
lAkevIlle
Fairview lakeville Clinic Fairview Health services
FamilyHealth Medical Clinic FamilyHealth Medical Clinics
lakeville Family Practice
Quello Clinic Quello Clinic
lIno lAkes
Fairview lino lakes Clinic Fairview Health services
HealthPartners HealthPartners Clinics
lIttle CAnAdA
little Canada Medical Clinic
MAPle grove
Allina Medical Clinic Allina Medical Clinic
Fairview Bass lake Clinic Fairview Health services
Fairview Maple grove Medical Center Fairview Health services
Maple Medical Center, PA
north Clinic north Clinic
43% 34%-52% 20% 69% 11% total Population 116 41% 33%-50% 37% 23%-53% 33% 58% 9% total Population 33 39% 25%-56%
9% 5%-22% 16% 68% 16% total Population 31 3% 1%-16% * * * * * * * * *
+ + + + + + + + + + + + + + + + + +
31% 27%-36% 34% 57% 9% total Population 386 32% 27%-37% 45% 38%-53% 45% 48% 7% total Population 148 45% 37%-53%
32% 27%-37% 28% 63% 9% total Population 273 33% 28%-39% 33% 23%-44% 38% 57% 5% total Population 74 34% 24%-45%
33% 27%-40% 18% 76% 7% total Population 262 32% 27%-38% 42% 32%-53% 32% 65% 4% total Population 82 43% 33%-53%
+ + + + + + + + + + + + + + + + + +
41% 35%-46% 26% 64% 10% total Population 324 40% 35%-46% 52% 41%-63% 48% 45% 7% total Population 67 55% 43%-67%
45% 37%-54% 26% 60% 14% total Population 122 45% 37%-54% 31% 18%-48% 69% 29% 3% total Population 35 34% 21%-51%
37% 31%-44% 27% 63% 10% total Population 213 38% 31%-44% 42% 31%-54% 52% 42% 6% total Population 63 43% 31%-55%
+ + + + + + + + + + + + + + + + + +
11% 6%-21% 20% 71% 9% sample 67 9% 4%-18% 25% 16%-37% 35% 62% 3% sample 65 25% 16%-36%
* sufficient data not available. + data not reported (for information on Physician Clinic Inclusion see page 255).

November 2010 | 2010 Health Care Quality Report | pHysiCian Measures appenDiX 99
see page 89 for an explanation of terms.
Risk
Adj
uste
d Ra
te
Confi
denc
e In
terv
al o
f Ris
k Ad
just
ed R
ate
Med
icar
e
Com
mer
cial
MN
Heal
th C
are
Prog
ram
s
Tota
l Pop
ulat
ion
or S
ampl
e
Sam
ple
Size
Non-
Risk
Adj
uste
d Ra
te
Confi
denc
e In
terv
al o
f Non
-Ri
sk A
djus
ted
Rate
Risk
Adj
uste
d Ra
te
Confi
denc
e In
terv
al o
f Ris
k Ad
just
ed R
ate
Med
icar
e
Com
mer
cial
MN
Heal
th C
are
Prog
ram
s
Tota
l Pop
ulat
ion
or S
ampl
e
Sam
ple
Size
Non-
Risk
Adj
uste
d Ra
te
Confi
denc
e In
terv
al o
f Non
-Ri
sk A
djus
ted
Rate
Optimal Diabetes Care Optimal Vascular Care
PHySIcIAN cLINIc NAME
MEdIcAL GrOuP NAME
Quality of Care for Chronic Conditions Distribution of
Patient Population
28% 28–29% 29% 55% 16% 28% 28-29% 34% 34-35% 43% 47% 9% 34% 34-35%
Distribution of Patient Population
Overall Minnesota Clinic Average
north Memorial Clinic- north Memorial Camden Physicians Maple grove
Park nicollet Clinic Park nicollet Health services
MAPleWood
Aspen Medical group Aspen Medical group
Attending Physicians Attending Physicians
Family Healthservices Minnesota- Family Healthservices Minnesota Afton road
Healtheast Healtheast Clinics
HealthPartners HealthPartners Clinics
st. Paul Cardiology st. Paul Cardiology
st. Paul Heart Clinic st. Paul Heart
MInneAPolIs
Allina Health system- Abbott Allina Health system northwestern general Medicine Associates
Allina Health system- Allina Health system Minneapolis Heart Institute
Allina Medical Clinic- Isles Allina Medical Clinic
Allina Medical Clinic- nicollet Mall Allina Medical Clinic
Allina Medical Clinic- the doctors uptown Allina Medical Clinic
15% 12%-20% 28% 68% 4% total Population 358 16% 13%-20% 39% 30%-48% 48% 49% 3% total Population 100 40% 31%-50%
34% 26%-43% 29% 58% 13% total Population 110 35% 26%-44% 43% 35%-52% 39% 52% 9% total Population 119 43% 34%-52%
16% 9%-27% 45% 47% 8% sample 60 15% 8%-26% 44% 32%-57% 47% 39% 14% sample 60 45% 33%-58%
6% 3%-13% 44% 44% 12% sample 91 7% 3%-14% 17% 9%-28% 58% 34% 8% sample 66 17% 10%-27%
32% 28%-37% 28% 62% 9% total Population 453 33% 29%-38% 49% 42%-56% 40% 56% 4% total Population 177 49% 42%-56%
29% 24%-34% 35% 52% 13% total Population 307 29% 25%-35% 40% 31%-50% 53% 39% 8% total Population 104 42% 33%-52%
38% 35%-42% 24% 60% 16% total Population 662 38% 34%-42% 47% 40%-54% 39% 50% 12% total Population 174 46% 39%-53%
n/A n/A n/A n/A n/A n/A n/A n/A n/A + + + + + + + + +
n/A n/A n/A n/A n/A n/A n/A n/A n/A 35% 26%-47% 50% 47% 3% sample 60 38% 27%-51%
4% 2%-12% 36% 31% 33% total Population 55 5% 2%-15% * * * * * * * * *
* * * * * * * * * 25% 24%-26% 50% 44% 6% total Population 3710 25% 24%-27%
39% 33%-45% 34% 53% 13% total Population 257 39% 34%-45% 47% 37%-58% 52% 38% 10% total Population 73 51% 39%-62%
36% 32%-40% 33% 54% 13% total Population 597 36% 32%-40% 45% 38%-53% 50% 38% 12% total Population 181 45% 38%-52%
43% 37%-49% 27% 57% 16% total Population 245 43% 37%-49% 54% 43%-64% 29% 61% 11% total Population 84 54% 43%-64%
* sufficient data not available. + data not reported (for information on Physician Clinic Inclusion see page 255).
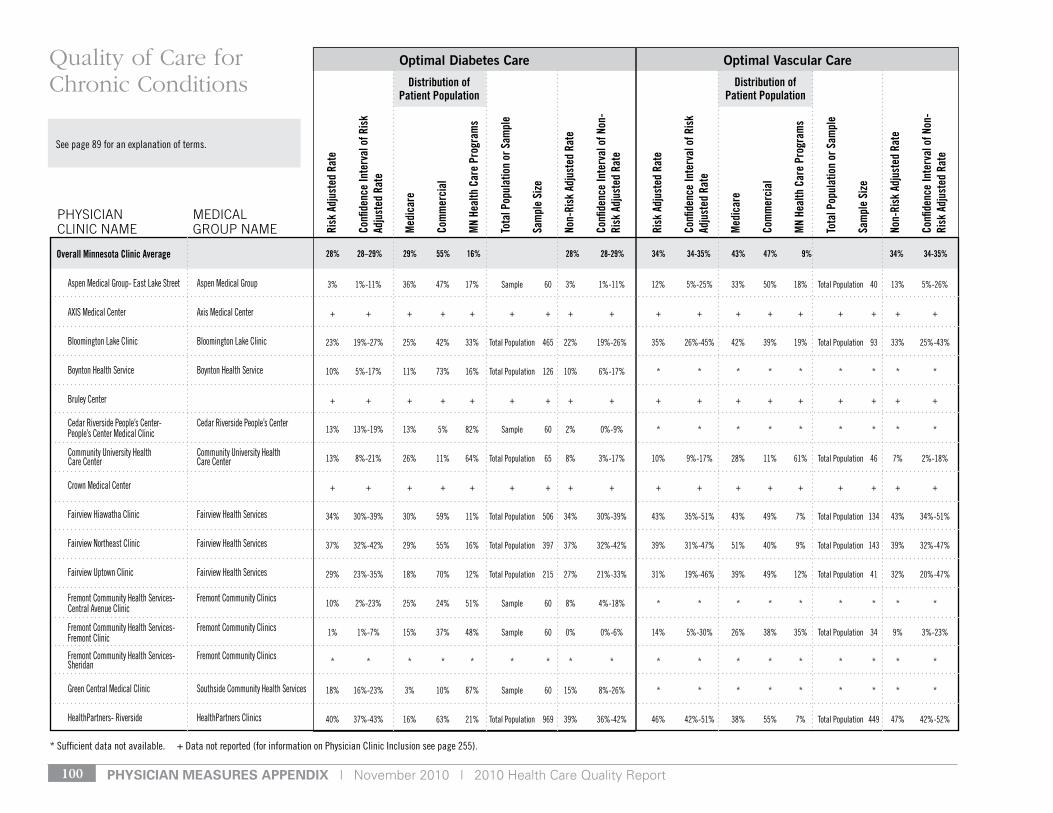
pHysiCian Measures appenDiX | November 2010 | 2010 Health Care Quality Report100
see page 89 for an explanation of terms.
Risk
Adj
uste
d Ra
te
Confi
denc
e In
terv
al o
f Ris
k Ad
just
ed R
ate
Med
icar
e
Com
mer
cial
MN
Heal
th C
are
Prog
ram
s
Tota
l Pop
ulat
ion
or S
ampl
e
Sam
ple
Size
Non-
Risk
Adj
uste
d Ra
te
Confi
denc
e In
terv
al o
f Non
-Ri
sk A
djus
ted
Rate
Risk
Adj
uste
d Ra
te
Confi
denc
e In
terv
al o
f Ris
k Ad
just
ed R
ate
Med
icar
e
Com
mer
cial
MN
Heal
th C
are
Prog
ram
s
Tota
l Pop
ulat
ion
or S
ampl
e
Sam
ple
Size
Non-
Risk
Adj
uste
d Ra
te
Confi
denc
e In
terv
al o
f Non
-Ri
sk A
djus
ted
Rate
Optimal Diabetes Care Optimal Vascular Care
PHySIcIAN cLINIc NAME
MEdIcAL GrOuP NAME
Quality of Care for Chronic Conditions Distribution of
Patient Population
28% 28–29% 29% 55% 16% 28% 28-29% 34% 34-35% 43% 47% 9% 34% 34-35%
Distribution of Patient Population
Overall Minnesota Clinic Average
Aspen Medical group- east lake street Aspen Medical group
AXIs Medical Center Axis Medical Center
Bloomington lake Clinic Bloomington lake Clinic
Boynton Health service Boynton Health service
Bruley Center
Cedar riverside People’s Center- Cedar riverside People’s Center People’s Center Medical Clinic
Community university Health Community university Health Care Center Care Center
Crown Medical Center
Fairview Hiawatha Clinic Fairview Health services
Fairview northeast Clinic Fairview Health services
Fairview uptown Clinic Fairview Health services
Fremont Community Health services- Fremont Community Clinics Central Avenue Clinic
Fremont Community Health services- Fremont Community Clinics Fremont Clinic
Fremont Community Health services- Fremont Community Clinics sheridan
green Central Medical Clinic southside Community Health services
HealthPartners- riverside HealthPartners Clinics
3% 1%-11% 36% 47% 17% sample 60 3% 1%-11% 12% 5%-25% 33% 50% 18% total Population 40 13% 5%-26%
+ + + + + + + + + + + + + + + + + +
23% 19%-27% 25% 42% 33% total Population 465 22% 19%-26% 35% 26%-45% 42% 39% 19% total Population 93 33% 25%-43%
10% 5%-17% 11% 73% 16% total Population 126 10% 6%-17% * * * * * * * * *
+ + + + + + + + + + + + + + + + + +
13% 13%-19% 13% 5% 82% sample 60 2% 0%-9% * * * * * * * * *
13% 8%-21% 26% 11% 64% total Population 65 8% 3%-17% 10% 9%-17% 28% 11% 61% total Population 46 7% 2%-18%
+ + + + + + + + + + + + + + + + + +
34% 30%-39% 30% 59% 11% total Population 506 34% 30%-39% 43% 35%-51% 43% 49% 7% total Population 134 43% 34%-51%
37% 32%-42% 29% 55% 16% total Population 397 37% 32%-42% 39% 31%-47% 51% 40% 9% total Population 143 39% 32%-47%
29% 23%-35% 18% 70% 12% total Population 215 27% 21%-33% 31% 19%-46% 39% 49% 12% total Population 41 32% 20%-47%
10% 2%-23% 25% 24% 51% sample 60 8% 4%-18% * * * * * * * * *
1% 1%-7% 15% 37% 48% sample 60 0% 0%-6% 14% 5%-30% 26% 38% 35% total Population 34 9% 3%-23%
* * * * * * * * * * * * * * * * * *
18% 16%-23% 3% 10% 87% sample 60 15% 8%-26% * * * * * * * * *
40% 37%-43% 16% 63% 21% total Population 969 39% 36%-42% 46% 42%-51% 38% 55% 7% total Population 449 47% 42%-52%
* sufficient data not available. + data not reported (for information on Physician Clinic Inclusion see page 255).
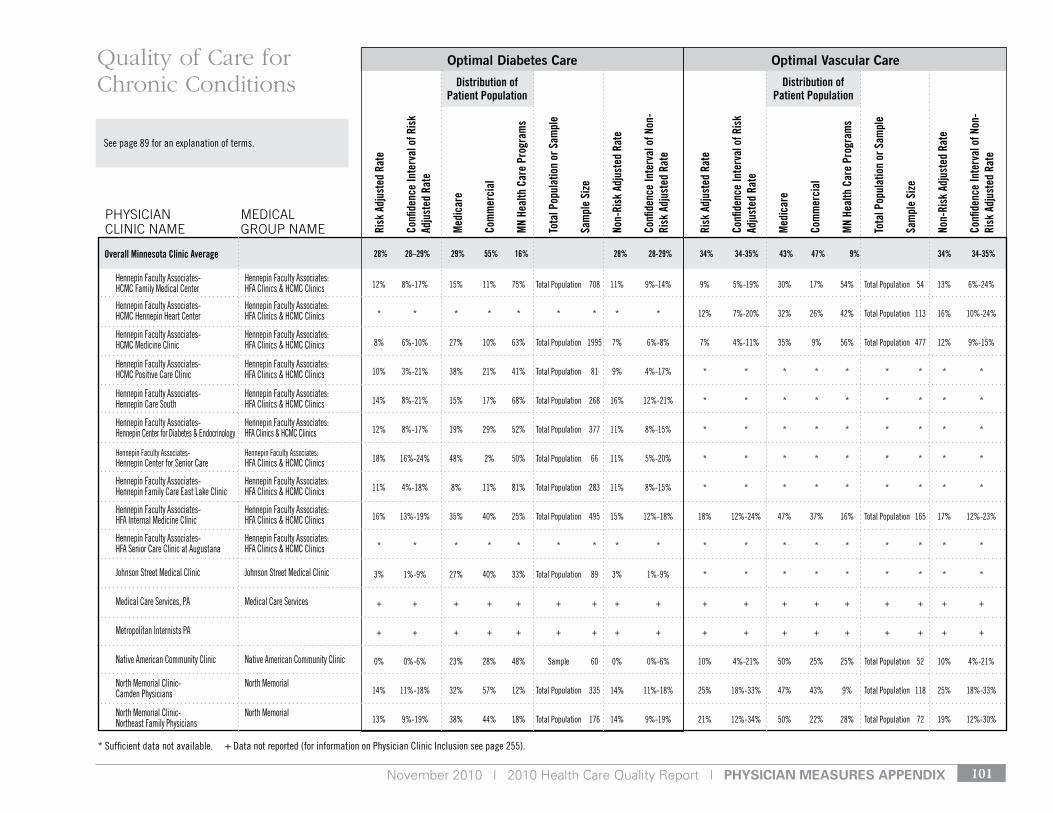
November 2010 | 2010 Health Care Quality Report | pHysiCian Measures appenDiX 101
see page 89 for an explanation of terms.
Risk
Adj
uste
d Ra
te
Confi
denc
e In
terv
al o
f Ris
k Ad
just
ed R
ate
Med
icar
e
Com
mer
cial
MN
Heal
th C
are
Prog
ram
s
Tota
l Pop
ulat
ion
or S
ampl
e
Sam
ple
Size
Non-
Risk
Adj
uste
d Ra
te
Confi
denc
e In
terv
al o
f Non
-Ri
sk A
djus
ted
Rate
Risk
Adj
uste
d Ra
te
Confi
denc
e In
terv
al o
f Ris
k Ad
just
ed R
ate
Med
icar
e
Com
mer
cial
MN
Heal
th C
are
Prog
ram
s
Tota
l Pop
ulat
ion
or S
ampl
e
Sam
ple
Size
Non-
Risk
Adj
uste
d Ra
te
Confi
denc
e In
terv
al o
f Non
-Ri
sk A
djus
ted
Rate
Optimal Diabetes Care Optimal Vascular Care
PHySIcIAN cLINIc NAME
MEdIcAL GrOuP NAME
Quality of Care for Chronic Conditions Distribution of
Patient Population
28% 28–29% 29% 55% 16% 28% 28-29% 34% 34-35% 43% 47% 9% 34% 34-35%
Distribution of Patient Population
Overall Minnesota Clinic Average
Hennepin Faculty Associates- Hennepin Faculty Associates: HCMC Family Medical Center HFA Clinics & HCMC Clinics
Hennepin Faculty Associates- Hennepin Faculty Associates: HCMC Hennepin Heart Center HFA Clinics & HCMC Clinics
Hennepin Faculty Associates- Hennepin Faculty Associates: HCMC Medicine Clinic HFA Clinics & HCMC Clinics
Hennepin Faculty Associates- Hennepin Faculty Associates: HCMC Positive Care Clinic HFA Clinics & HCMC Clinics
Hennepin Faculty Associates- Hennepin Faculty Associates: Hennepin Care south HFA Clinics & HCMC Clinics
Hennepin Faculty Associates- Hennepin Faculty Associates: Hennepin Center for diabetes & endocrinology HFA Clinics & HCMC Clinics
Hennepin Faculty Associates- Hennepin Faculty Associates: Hennepin Center for senior Care HFA Clinics & HCMC Clinics
Hennepin Faculty Associates- Hennepin Faculty Associates: Hennepin Family Care east lake Clinic HFA Clinics & HCMC Clinics
Hennepin Faculty Associates- Hennepin Faculty Associates: HFA Internal Medicine Clinic HFA Clinics & HCMC Clinics
Hennepin Faculty Associates- Hennepin Faculty Associates: HFA senior Care Clinic at Augustana HFA Clinics & HCMC Clinics
Johnson street Medical Clinic Johnson street Medical Clinic
Medical Care services, PA Medical Care services
Metropolitan Internists PA
native American Community Clinic native American Community Clinic
north Memorial Clinic- north Memorial Camden Physicians
north Memorial Clinic- north Memorial northeast Family Physicians
12% 8%-17% 15% 11% 75% total Population 708 11% 9%-14% 9% 5%-19% 30% 17% 54% total Population 54 13% 6%-24%
* * * * * * * * * 12% 7%-20% 32% 26% 42% total Population 113 16% 10%-24%
8% 6%-10% 27% 10% 63% total Population 1995 7% 6%-8% 7% 4%-11% 35% 9% 56% total Population 477 12% 9%-15%
10% 3%-21% 38% 21% 41% total Population 81 9% 4%-17% * * * * * * * * *
14% 8%-21% 15% 17% 68% total Population 268 16% 12%-21% * * * * * * * * *
12% 8%-17% 19% 29% 52% total Population 377 11% 8%-15% * * * * * * * * *
18% 16%-24% 48% 2% 50% total Population 66 11% 5%-20% * * * * * * * * *
11% 4%-18% 8% 11% 81% total Population 283 11% 8%-15% * * * * * * * * *
16% 13%-19% 35% 40% 25% total Population 495 15% 12%-18% 18% 12%-24% 47% 37% 16% total Population 165 17% 12%-23%
* * * * * * * * * * * * * * * * * *
3% 1%-9% 27% 40% 33% total Population 89 3% 1%-9% * * * * * * * * *
+ + + + + + + + + + + + + + + + + +
+ + + + + + + + + + + + + + + + + +
0% 0%-6% 23% 28% 48% sample 60 0% 0%-6% 10% 4%-21% 50% 25% 25% total Population 52 10% 4%-21%
14% 11%-18% 32% 57% 12% total Population 335 14% 11%-18% 25% 18%-33% 47% 43% 9% total Population 118 25% 18%-33%
13% 9%-19% 38% 44% 18% total Population 176 14% 9%-19% 21% 12%-34% 50% 22% 28% total Population 72 19% 12%-30%
* sufficient data not available. + data not reported (for information on Physician Clinic Inclusion see page 255).
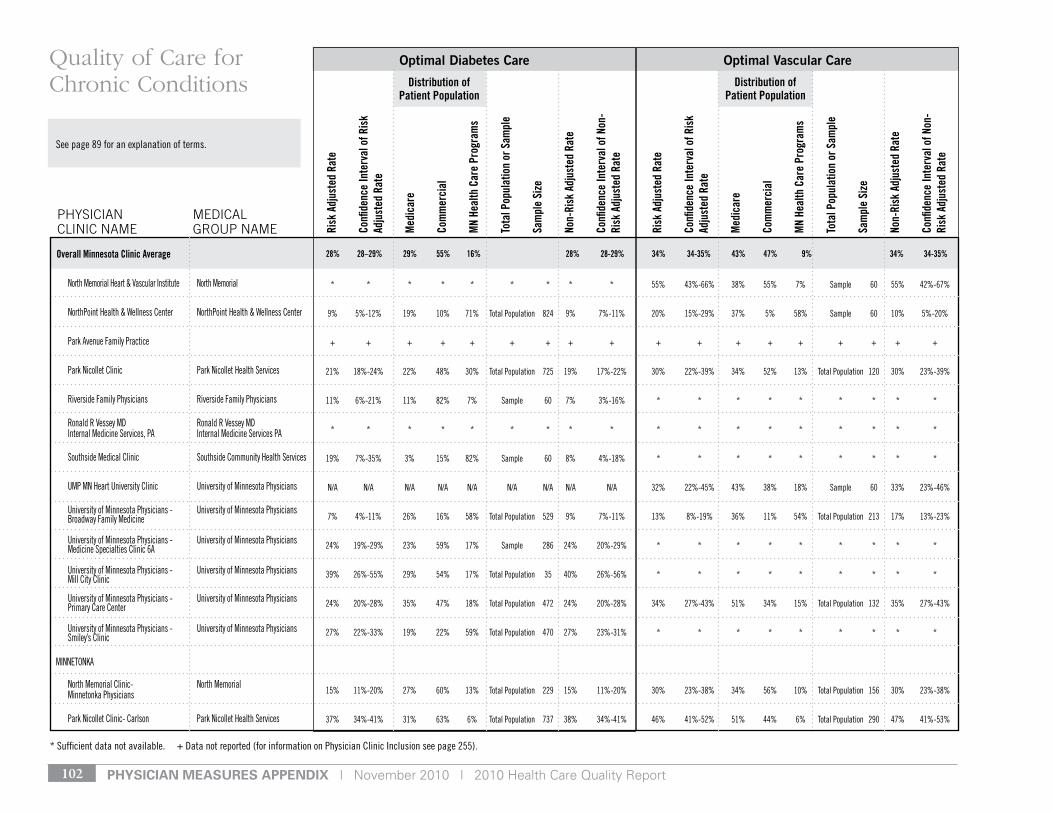
pHysiCian Measures appenDiX | November 2010 | 2010 Health Care Quality Report102
see page 89 for an explanation of terms.
Risk
Adj
uste
d Ra
te
Confi
denc
e In
terv
al o
f Ris
k Ad
just
ed R
ate
Med
icar
e
Com
mer
cial
MN
Heal
th C
are
Prog
ram
s
Tota
l Pop
ulat
ion
or S
ampl
e
Sam
ple
Size
Non-
Risk
Adj
uste
d Ra
te
Confi
denc
e In
terv
al o
f Non
-Ri
sk A
djus
ted
Rate
Risk
Adj
uste
d Ra
te
Confi
denc
e In
terv
al o
f Ris
k Ad
just
ed R
ate
Med
icar
e
Com
mer
cial
MN
Heal
th C
are
Prog
ram
s
Tota
l Pop
ulat
ion
or S
ampl
e
Sam
ple
Size
Non-
Risk
Adj
uste
d Ra
te
Confi
denc
e In
terv
al o
f Non
-Ri
sk A
djus
ted
Rate
Optimal Diabetes Care Optimal Vascular Care
PHySIcIAN cLINIc NAME
MEdIcAL GrOuP NAME
Quality of Care for Chronic Conditions Distribution of
Patient Population
28% 28–29% 29% 55% 16% 28% 28-29% 34% 34-35% 43% 47% 9% 34% 34-35%
Distribution of Patient Population
Overall Minnesota Clinic Average
north Memorial Heart & vascular Institute north Memorial
northPoint Health & Wellness Center northPoint Health & Wellness Center
Park Avenue Family Practice
Park nicollet Clinic Park nicollet Health services
riverside Family Physicians riverside Family Physicians
ronald r vessey Md ronald r vessey Md Internal Medicine services, PA Internal Medicine services PA
southside Medical Clinic southside Community Health services
uMP Mn Heart university Clinic university of Minnesota Physicians
university of Minnesota Physicians - university of Minnesota Physicians Broadway Family Medicine
university of Minnesota Physicians - university of Minnesota Physicians Medicine specialties Clinic 6A
university of Minnesota Physicians - university of Minnesota Physicians Mill City Clinic
university of Minnesota Physicians - university of Minnesota Physicians Primary Care Center
university of Minnesota Physicians - university of Minnesota Physicians smiley’s Clinic
MInnetonkA
north Memorial Clinic- north Memorial Minnetonka Physicians
Park nicollet Clinic- Carlson Park nicollet Health services
* * * * * * * * * 55% 43%-66% 38% 55% 7% sample 60 55% 42%-67%
9% 5%-12% 19% 10% 71% total Population 824 9% 7%-11% 20% 15%-29% 37% 5% 58% sample 60 10% 5%-20%
+ + + + + + + + + + + + + + + + + +
21% 18%-24% 22% 48% 30% total Population 725 19% 17%-22% 30% 22%-39% 34% 52% 13% total Population 120 30% 23%-39%
11% 6%-21% 11% 82% 7% sample 60 7% 3%-16% * * * * * * * * *
* * * * * * * * * * * * * * * * * *
19% 7%-35% 3% 15% 82% sample 60 8% 4%-18% * * * * * * * * *
n/A n/A n/A n/A n/A n/A n/A n/A n/A 32% 22%-45% 43% 38% 18% sample 60 33% 23%-46%
7% 4%-11% 26% 16% 58% total Population 529 9% 7%-11% 13% 8%-19% 36% 11% 54% total Population 213 17% 13%-23%
24% 19%-29% 23% 59% 17% sample 286 24% 20%-29% * * * * * * * * *
39% 26%-55% 29% 54% 17% total Population 35 40% 26%-56% * * * * * * * * *
24% 20%-28% 35% 47% 18% total Population 472 24% 20%-28% 34% 27%-43% 51% 34% 15% total Population 132 35% 27%-43%
27% 22%-33% 19% 22% 59% total Population 470 27% 23%-31% * * * * * * * * *
15% 11%-20% 27% 60% 13% total Population 229 15% 11%-20% 30% 23%-38% 34% 56% 10% total Population 156 30% 23%-38%
37% 34%-41% 31% 63% 6% total Population 737 38% 34%-41% 46% 41%-52% 51% 44% 6% total Population 290 47% 41%-53%
* sufficient data not available. + data not reported (for information on Physician Clinic Inclusion see page 255).
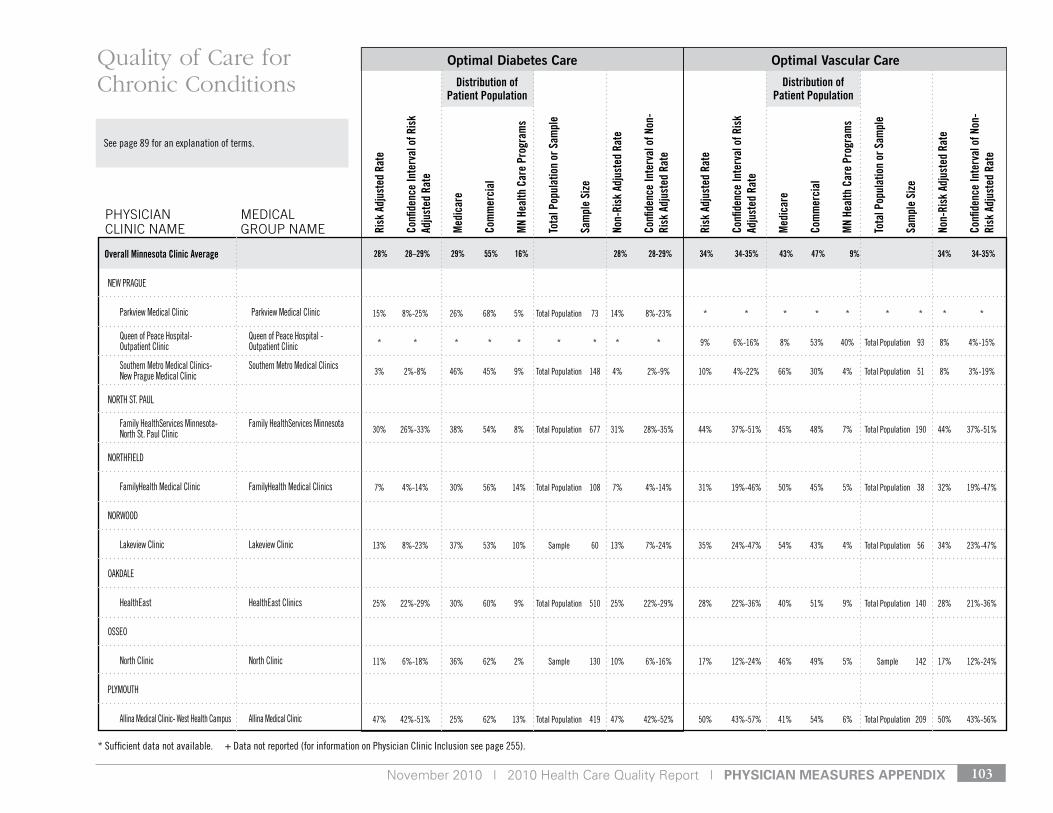
November 2010 | 2010 Health Care Quality Report | pHysiCian Measures appenDiX 103
see page 89 for an explanation of terms.
Risk
Adj
uste
d Ra
te
Confi
denc
e In
terv
al o
f Ris
k Ad
just
ed R
ate
Med
icar
e
Com
mer
cial
MN
Heal
th C
are
Prog
ram
s
Tota
l Pop
ulat
ion
or S
ampl
e
Sam
ple
Size
Non-
Risk
Adj
uste
d Ra
te
Confi
denc
e In
terv
al o
f Non
-Ri
sk A
djus
ted
Rate
Risk
Adj
uste
d Ra
te
Confi
denc
e In
terv
al o
f Ris
k Ad
just
ed R
ate
Med
icar
e
Com
mer
cial
MN
Heal
th C
are
Prog
ram
s
Tota
l Pop
ulat
ion
or S
ampl
e
Sam
ple
Size
Non-
Risk
Adj
uste
d Ra
te
Confi
denc
e In
terv
al o
f Non
-Ri
sk A
djus
ted
Rate
Optimal Diabetes Care Optimal Vascular Care
PHySIcIAN cLINIc NAME
MEdIcAL GrOuP NAME
Quality of Care for Chronic Conditions Distribution of
Patient Population
28% 28–29% 29% 55% 16% 28% 28-29% 34% 34-35% 43% 47% 9% 34% 34-35%
Distribution of Patient Population
Overall Minnesota Clinic Average
neW PrAgue
Parkview Medical Clinic Parkview Medical Clinic
Queen of Peace Hospital- Queen of Peace Hospital - outpatient Clinic outpatient Clinic
southern Metro Medical Clinics- southern Metro Medical Clinics new Prague Medical Clinic
nortH st. PAul
Family Healthservices Minnesota- Family Healthservices Minnesota north st. Paul Clinic
nortHFIeld
FamilyHealth Medical Clinic FamilyHealth Medical Clinics
norWood
lakeview Clinic lakeview Clinic
oAkdAle
Healtheast Healtheast Clinics
osseo
north Clinic north Clinic
PlyMoutH
Allina Medical Clinic- West Health Campus Allina Medical Clinic
15% 8%-25% 26% 68% 5% total Population 73 14% 8%-23% * * * * * * * * *
* * * * * * * * * 9% 6%-16% 8% 53% 40% total Population 93 8% 4%-15%
3% 2%-8% 46% 45% 9% total Population 148 4% 2%-9% 10% 4%-22% 66% 30% 4% total Population 51 8% 3%-19%
30% 26%-33% 38% 54% 8% total Population 677 31% 28%-35% 44% 37%-51% 45% 48% 7% total Population 190 44% 37%-51%
7% 4%-14% 30% 56% 14% total Population 108 7% 4%-14% 31% 19%-46% 50% 45% 5% total Population 38 32% 19%-47%
13% 8%-23% 37% 53% 10% sample 60 13% 7%-24% 35% 24%-47% 54% 43% 4% total Population 56 34% 23%-47%
25% 22%-29% 30% 60% 9% total Population 510 25% 22%-29% 28% 22%-36% 40% 51% 9% total Population 140 28% 21%-36%
11% 6%-18% 36% 62% 2% sample 130 10% 6%-16% 17% 12%-24% 46% 49% 5% sample 142 17% 12%-24%
47% 42%-51% 25% 62% 13% total Population 419 47% 42%-52% 50% 43%-57% 41% 54% 6% total Population 209 50% 43%-56%
* sufficient data not available. + data not reported (for information on Physician Clinic Inclusion see page 255).
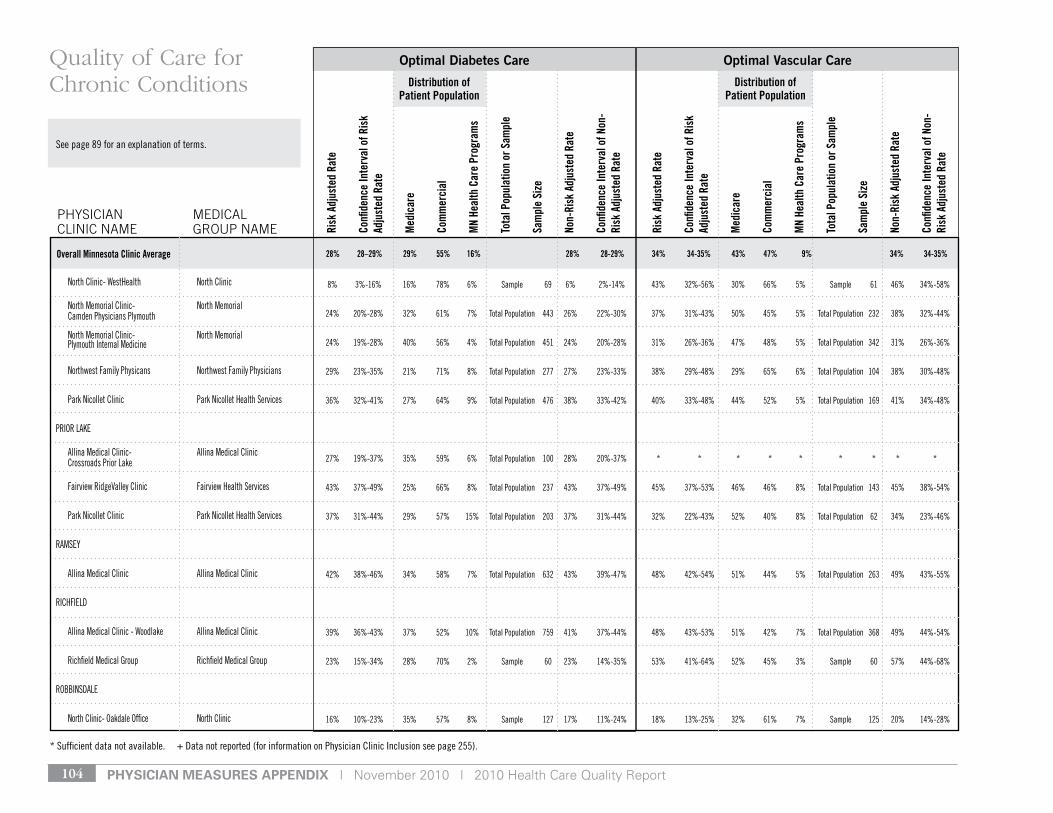
pHysiCian Measures appenDiX | November 2010 | 2010 Health Care Quality Report104
see page 89 for an explanation of terms.
Risk
Adj
uste
d Ra
te
Confi
denc
e In
terv
al o
f Ris
k Ad
just
ed R
ate
Med
icar
e
Com
mer
cial
MN
Heal
th C
are
Prog
ram
s
Tota
l Pop
ulat
ion
or S
ampl
e
Sam
ple
Size
Non-
Risk
Adj
uste
d Ra
te
Confi
denc
e In
terv
al o
f Non
-Ri
sk A
djus
ted
Rate
Risk
Adj
uste
d Ra
te
Confi
denc
e In
terv
al o
f Ris
k Ad
just
ed R
ate
Med
icar
e
Com
mer
cial
MN
Heal
th C
are
Prog
ram
s
Tota
l Pop
ulat
ion
or S
ampl
e
Sam
ple
Size
Non-
Risk
Adj
uste
d Ra
te
Confi
denc
e In
terv
al o
f Non
-Ri
sk A
djus
ted
Rate
Optimal Diabetes Care Optimal Vascular Care
PHySIcIAN cLINIc NAME
MEdIcAL GrOuP NAME
Quality of Care for Chronic Conditions Distribution of
Patient Population
28% 28–29% 29% 55% 16% 28% 28-29% 34% 34-35% 43% 47% 9% 34% 34-35%
Distribution of Patient Population
Overall Minnesota Clinic Average
north Clinic- WestHealth north Clinic
north Memorial Clinic- north Memorial Camden Physicians Plymouth
north Memorial Clinic- north Memorial Plymouth Internal Medicine
northwest Family Physicans northwest Family Physicians
Park nicollet Clinic Park nicollet Health services
PrIor lAke
Allina Medical Clinic- Allina Medical Clinic Crossroads Prior lake
Fairview ridgevalley Clinic Fairview Health services
Park nicollet Clinic Park nicollet Health services
rAMsey
Allina Medical Clinic Allina Medical Clinic
rICHFIeld
Allina Medical Clinic - Woodlake Allina Medical Clinic
richfield Medical group richfield Medical group
roBBInsdAle
north Clinic- oakdale office north Clinic
8% 3%-16% 16% 78% 6% sample 69 6% 2%-14% 43% 32%-56% 30% 66% 5% sample 61 46% 34%-58%
24% 20%-28% 32% 61% 7% total Population 443 26% 22%-30% 37% 31%-43% 50% 45% 5% total Population 232 38% 32%-44%
24% 19%-28% 40% 56% 4% total Population 451 24% 20%-28% 31% 26%-36% 47% 48% 5% total Population 342 31% 26%-36%
29% 23%-35% 21% 71% 8% total Population 277 27% 23%-33% 38% 29%-48% 29% 65% 6% total Population 104 38% 30%-48%
36% 32%-41% 27% 64% 9% total Population 476 38% 33%-42% 40% 33%-48% 44% 52% 5% total Population 169 41% 34%-48%
27% 19%-37% 35% 59% 6% total Population 100 28% 20%-37% * * * * * * * * *
43% 37%-49% 25% 66% 8% total Population 237 43% 37%-49% 45% 37%-53% 46% 46% 8% total Population 143 45% 38%-54%
37% 31%-44% 29% 57% 15% total Population 203 37% 31%-44% 32% 22%-43% 52% 40% 8% total Population 62 34% 23%-46%
42% 38%-46% 34% 58% 7% total Population 632 43% 39%-47% 48% 42%-54% 51% 44% 5% total Population 263 49% 43%-55%
39% 36%-43% 37% 52% 10% total Population 759 41% 37%-44% 48% 43%-53% 51% 42% 7% total Population 368 49% 44%-54%
23% 15%-34% 28% 70% 2% sample 60 23% 14%-35% 53% 41%-64% 52% 45% 3% sample 60 57% 44%-68%
16% 10%-23% 35% 57% 8% sample 127 17% 11%-24% 18% 13%-25% 32% 61% 7% sample 125 20% 14%-28%
* sufficient data not available. + data not reported (for information on Physician Clinic Inclusion see page 255).
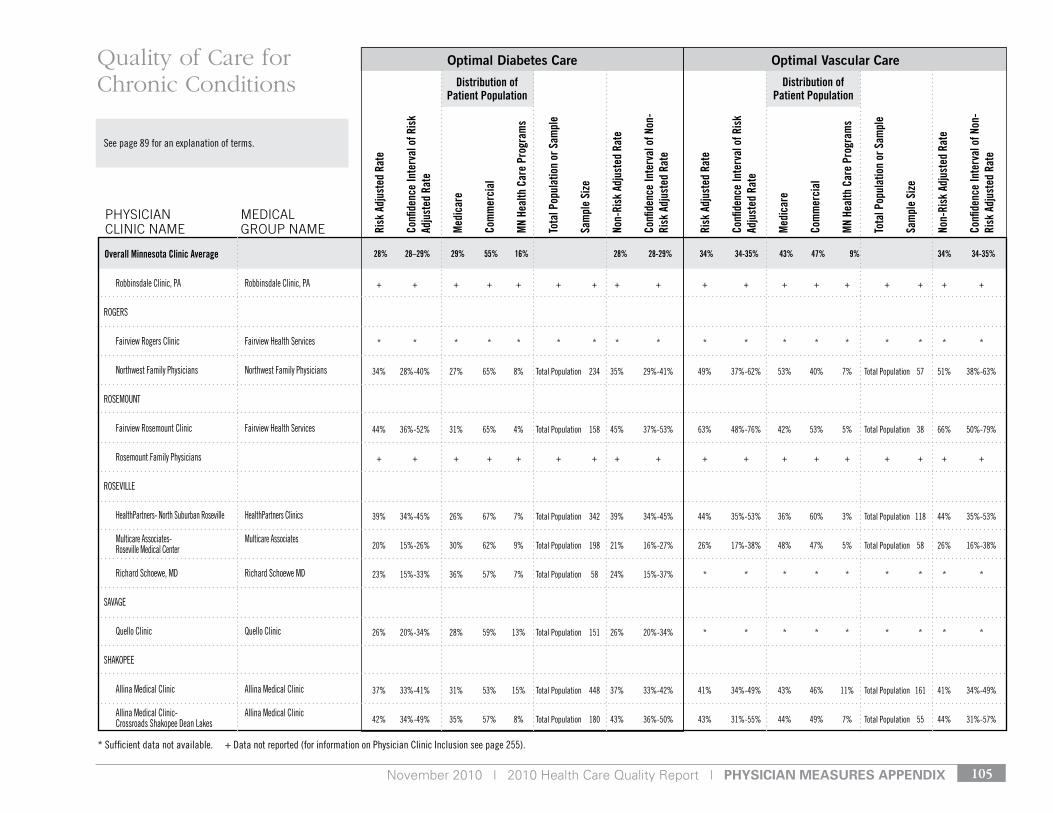
November 2010 | 2010 Health Care Quality Report | pHysiCian Measures appenDiX 105
see page 89 for an explanation of terms.
Risk
Adj
uste
d Ra
te
Confi
denc
e In
terv
al o
f Ris
k Ad
just
ed R
ate
Med
icar
e
Com
mer
cial
MN
Heal
th C
are
Prog
ram
s
Tota
l Pop
ulat
ion
or S
ampl
e
Sam
ple
Size
Non-
Risk
Adj
uste
d Ra
te
Confi
denc
e In
terv
al o
f Non
-Ri
sk A
djus
ted
Rate
Risk
Adj
uste
d Ra
te
Confi
denc
e In
terv
al o
f Ris
k Ad
just
ed R
ate
Med
icar
e
Com
mer
cial
MN
Heal
th C
are
Prog
ram
s
Tota
l Pop
ulat
ion
or S
ampl
e
Sam
ple
Size
Non-
Risk
Adj
uste
d Ra
te
Confi
denc
e In
terv
al o
f Non
-Ri
sk A
djus
ted
Rate
Optimal Diabetes Care Optimal Vascular Care
PHySIcIAN cLINIc NAME
MEdIcAL GrOuP NAME
Quality of Care for Chronic Conditions Distribution of
Patient Population
28% 28–29% 29% 55% 16% 28% 28-29% 34% 34-35% 43% 47% 9% 34% 34-35%
Distribution of Patient Population
Overall Minnesota Clinic Average
robbinsdale Clinic, PA robbinsdale Clinic, PA
rogers
Fairview rogers Clinic Fairview Health services
northwest Family Physicians northwest Family Physicians
roseMount
Fairview rosemount Clinic Fairview Health services
rosemount Family Physicians
rosevIlle
HealthPartners- north suburban roseville HealthPartners Clinics
Multicare Associates- Multicare Associates roseville Medical Center
richard schoewe, Md richard schoewe Md
sAvAge
Quello Clinic Quello Clinic
sHAkoPee
Allina Medical Clinic Allina Medical Clinic
Allina Medical Clinic- Allina Medical Clinic Crossroads shakopee dean lakes
+ + + + + + + + + + + + + + + + + +
* * * * * * * * * * * * * * * * * *
34% 28%-40% 27% 65% 8% total Population 234 35% 29%-41% 49% 37%-62% 53% 40% 7% total Population 57 51% 38%-63%
44% 36%-52% 31% 65% 4% total Population 158 45% 37%-53% 63% 48%-76% 42% 53% 5% total Population 38 66% 50%-79%
+ + + + + + + + + + + + + + + + + +
39% 34%-45% 26% 67% 7% total Population 342 39% 34%-45% 44% 35%-53% 36% 60% 3% total Population 118 44% 35%-53%
20% 15%-26% 30% 62% 9% total Population 198 21% 16%-27% 26% 17%-38% 48% 47% 5% total Population 58 26% 16%-38%
23% 15%-33% 36% 57% 7% total Population 58 24% 15%-37% * * * * * * * * *
26% 20%-34% 28% 59% 13% total Population 151 26% 20%-34% * * * * * * * * *
37% 33%-41% 31% 53% 15% total Population 448 37% 33%-42% 41% 34%-49% 43% 46% 11% total Population 161 41% 34%-49%
42% 34%-49% 35% 57% 8% total Population 180 43% 36%-50% 43% 31%-55% 44% 49% 7% total Population 55 44% 31%-57%
* sufficient data not available. + data not reported (for information on Physician Clinic Inclusion see page 255).
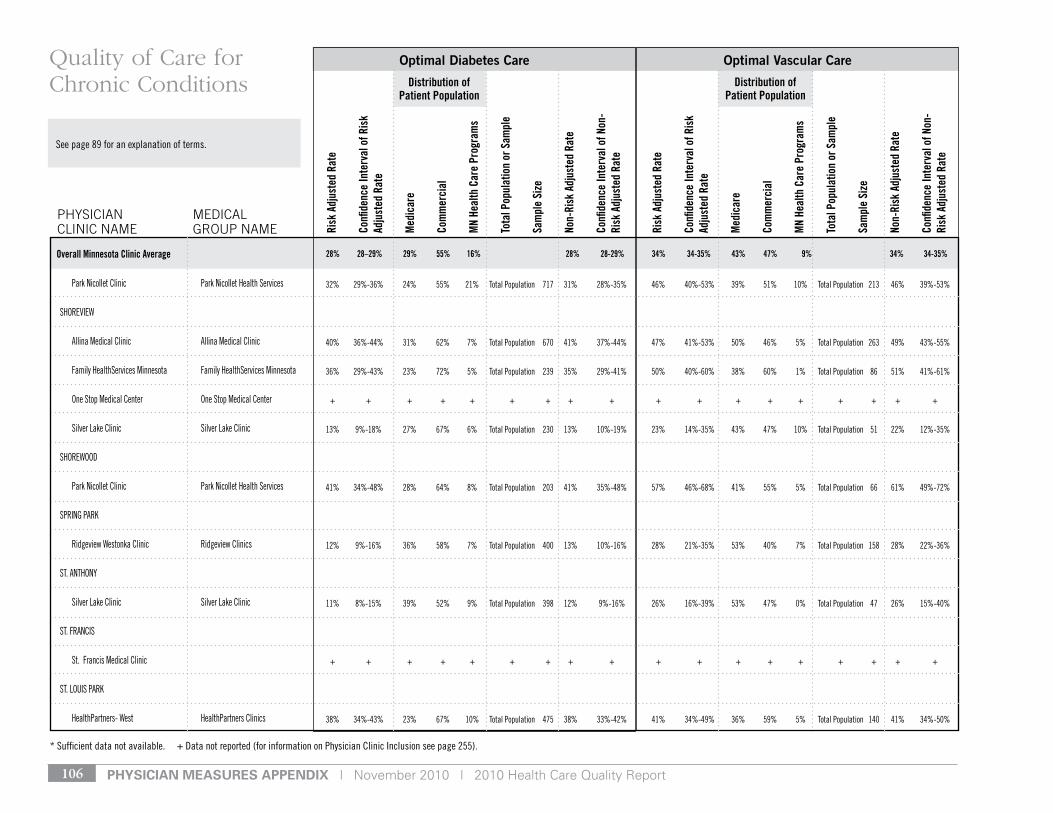
pHysiCian Measures appenDiX | November 2010 | 2010 Health Care Quality Report106
see page 89 for an explanation of terms.
Risk
Adj
uste
d Ra
te
Confi
denc
e In
terv
al o
f Ris
k Ad
just
ed R
ate
Med
icar
e
Com
mer
cial
MN
Heal
th C
are
Prog
ram
s
Tota
l Pop
ulat
ion
or S
ampl
e
Sam
ple
Size
Non-
Risk
Adj
uste
d Ra
te
Confi
denc
e In
terv
al o
f Non
-Ri
sk A
djus
ted
Rate
Risk
Adj
uste
d Ra
te
Confi
denc
e In
terv
al o
f Ris
k Ad
just
ed R
ate
Med
icar
e
Com
mer
cial
MN
Heal
th C
are
Prog
ram
s
Tota
l Pop
ulat
ion
or S
ampl
e
Sam
ple
Size
Non-
Risk
Adj
uste
d Ra
te
Confi
denc
e In
terv
al o
f Non
-Ri
sk A
djus
ted
Rate
Optimal Diabetes Care Optimal Vascular Care
PHySIcIAN cLINIc NAME
MEdIcAL GrOuP NAME
Quality of Care for Chronic Conditions Distribution of
Patient Population
28% 28–29% 29% 55% 16% 28% 28-29% 34% 34-35% 43% 47% 9% 34% 34-35%
Distribution of Patient Population
Overall Minnesota Clinic Average
Park nicollet Clinic Park nicollet Health services
sHorevIeW
Allina Medical Clinic Allina Medical Clinic
Family Healthservices Minnesota Family Healthservices Minnesota
one stop Medical Center one stop Medical Center
silver lake Clinic silver lake Clinic
sHoreWood
Park nicollet Clinic Park nicollet Health services
sPrIng PArk
ridgeview Westonka Clinic ridgeview Clinics
st. AntHony
silver lake Clinic silver lake Clinic
st. FrAnCIs
st. Francis Medical Clinic
st. louIs PArk
HealthPartners- West HealthPartners Clinics
32% 29%-36% 24% 55% 21% total Population 717 31% 28%-35% 46% 40%-53% 39% 51% 10% total Population 213 46% 39%-53%
40% 36%-44% 31% 62% 7% total Population 670 41% 37%-44% 47% 41%-53% 50% 46% 5% total Population 263 49% 43%-55%
36% 29%-43% 23% 72% 5% total Population 239 35% 29%-41% 50% 40%-60% 38% 60% 1% total Population 86 51% 41%-61%
+ + + + + + + + + + + + + + + + + +
13% 9%-18% 27% 67% 6% total Population 230 13% 10%-19% 23% 14%-35% 43% 47% 10% total Population 51 22% 12%-35%
41% 34%-48% 28% 64% 8% total Population 203 41% 35%-48% 57% 46%-68% 41% 55% 5% total Population 66 61% 49%-72%
12% 9%-16% 36% 58% 7% total Population 400 13% 10%-16% 28% 21%-35% 53% 40% 7% total Population 158 28% 22%-36%
11% 8%-15% 39% 52% 9% total Population 398 12% 9%-16% 26% 16%-39% 53% 47% 0% total Population 47 26% 15%-40%
+ + + + + + + + + + + + + + + + + +
38% 34%-43% 23% 67% 10% total Population 475 38% 33%-42% 41% 34%-49% 36% 59% 5% total Population 140 41% 34%-50%
* sufficient data not available. + data not reported (for information on Physician Clinic Inclusion see page 255).
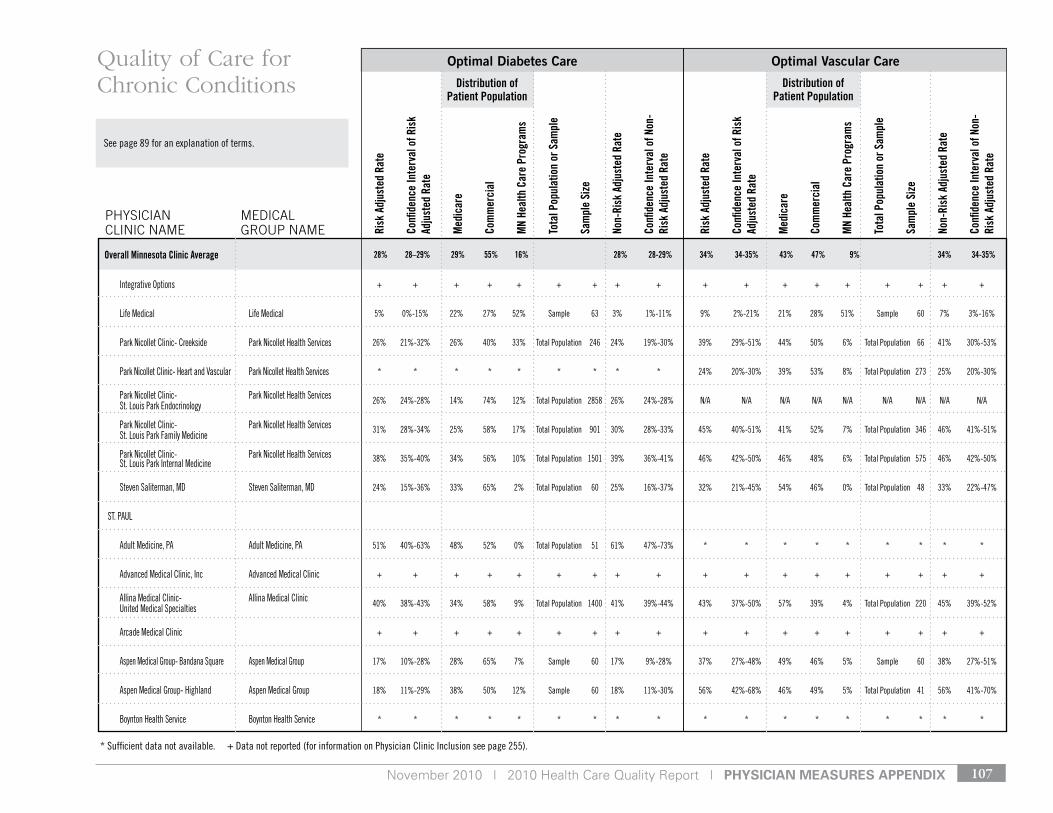
November 2010 | 2010 Health Care Quality Report | pHysiCian Measures appenDiX 107
see page 89 for an explanation of terms.
Risk
Adj
uste
d Ra
te
Confi
denc
e In
terv
al o
f Ris
k Ad
just
ed R
ate
Med
icar
e
Com
mer
cial
MN
Heal
th C
are
Prog
ram
s
Tota
l Pop
ulat
ion
or S
ampl
e
Sam
ple
Size
Non-
Risk
Adj
uste
d Ra
te
Confi
denc
e In
terv
al o
f Non
-Ri
sk A
djus
ted
Rate
Risk
Adj
uste
d Ra
te
Confi
denc
e In
terv
al o
f Ris
k Ad
just
ed R
ate
Med
icar
e
Com
mer
cial
MN
Heal
th C
are
Prog
ram
s
Tota
l Pop
ulat
ion
or S
ampl
e
Sam
ple
Size
Non-
Risk
Adj
uste
d Ra
te
Confi
denc
e In
terv
al o
f Non
-Ri
sk A
djus
ted
Rate
Optimal Diabetes Care Optimal Vascular Care
PHySIcIAN cLINIc NAME
MEdIcAL GrOuP NAME
Quality of Care for Chronic Conditions Distribution of
Patient Population
28% 28–29% 29% 55% 16% 28% 28-29% 34% 34-35% 43% 47% 9% 34% 34-35%
Distribution of Patient Population
Overall Minnesota Clinic Average
Integrative options
life Medical life Medical
Park nicollet Clinic- Creekside Park nicollet Health services
Park nicollet Clinic- Heart and vascular Park nicollet Health services
Park nicollet Clinic- Park nicollet Health services st. louis Park endocrinology
Park nicollet Clinic- Park nicollet Health services st. louis Park Family Medicine
Park nicollet Clinic- Park nicollet Health services st. louis Park Internal Medicine
steven saliterman, Md steven saliterman, Md
st. PAul
Adult Medicine, PA Adult Medicine, PA
Advanced Medical Clinic, Inc Advanced Medical Clinic
Allina Medical Clinic- Allina Medical Clinic united Medical specialties
Arcade Medical Clinic
Aspen Medical group- Bandana square Aspen Medical group
Aspen Medical group- Highland Aspen Medical group
Boynton Health service Boynton Health service
+ + + + + + + + + + + + + + + + + +
5% 0%-15% 22% 27% 52% sample 63 3% 1%-11% 9% 2%-21% 21% 28% 51% sample 60 7% 3%-16%
26% 21%-32% 26% 40% 33% total Population 246 24% 19%-30% 39% 29%-51% 44% 50% 6% total Population 66 41% 30%-53%
* * * * * * * * * 24% 20%-30% 39% 53% 8% total Population 273 25% 20%-30%
26% 24%-28% 14% 74% 12% total Population 2858 26% 24%-28% n/A n/A n/A n/A n/A n/A n/A n/A n/A
31% 28%-34% 25% 58% 17% total Population 901 30% 28%-33% 45% 40%-51% 41% 52% 7% total Population 346 46% 41%-51%
38% 35%-40% 34% 56% 10% total Population 1501 39% 36%-41% 46% 42%-50% 46% 48% 6% total Population 575 46% 42%-50%
24% 15%-36% 33% 65% 2% total Population 60 25% 16%-37% 32% 21%-45% 54% 46% 0% total Population 48 33% 22%-47%
51% 40%-63% 48% 52% 0% total Population 51 61% 47%-73% * * * * * * * * *
+ + + + + + + + + + + + + + + + + +
40% 38%-43% 34% 58% 9% total Population 1400 41% 39%-44% 43% 37%-50% 57% 39% 4% total Population 220 45% 39%-52%
+ + + + + + + + + + + + + + + + + +
17% 10%-28% 28% 65% 7% sample 60 17% 9%-28% 37% 27%-48% 49% 46% 5% sample 60 38% 27%-51%
18% 11%-29% 38% 50% 12% sample 60 18% 11%-30% 56% 42%-68% 46% 49% 5% total Population 41 56% 41%-70%
* * * * * * * * * * * * * * * * * *
* sufficient data not available. + data not reported (for information on Physician Clinic Inclusion see page 255).
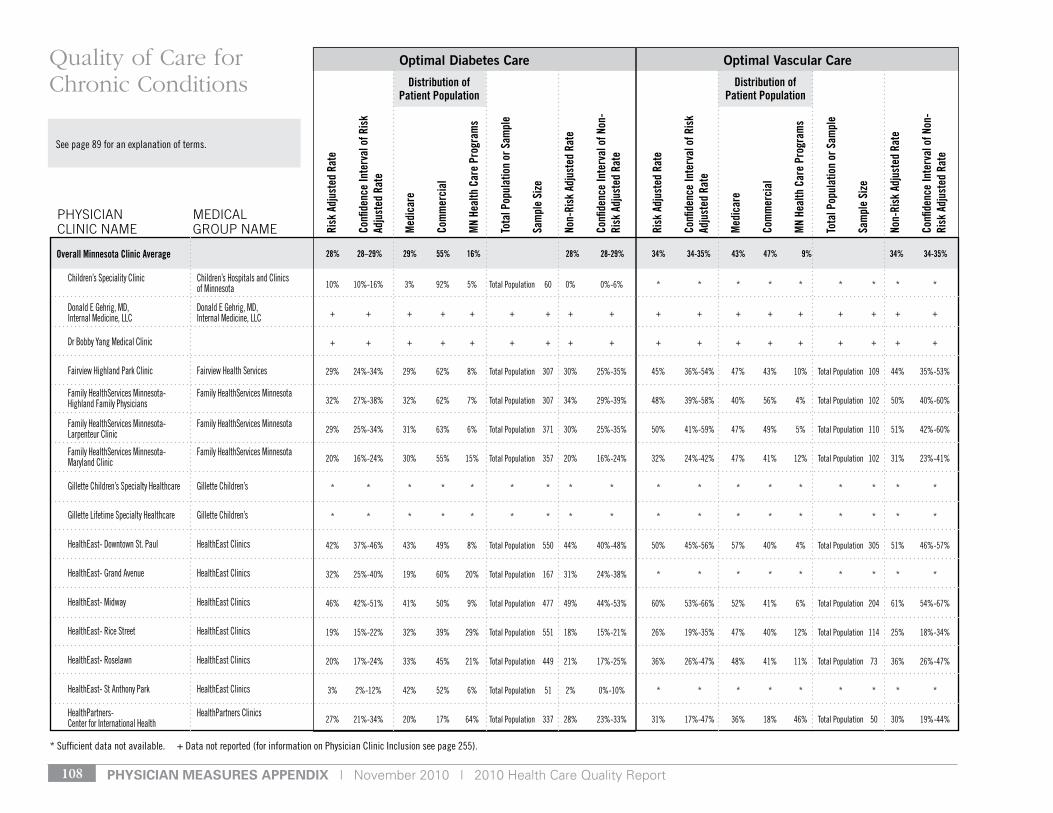
pHysiCian Measures appenDiX | November 2010 | 2010 Health Care Quality Report108
see page 89 for an explanation of terms.
Risk
Adj
uste
d Ra
te
Confi
denc
e In
terv
al o
f Ris
k Ad
just
ed R
ate
Med
icar
e
Com
mer
cial
MN
Heal
th C
are
Prog
ram
s
Tota
l Pop
ulat
ion
or S
ampl
e
Sam
ple
Size
Non-
Risk
Adj
uste
d Ra
te
Confi
denc
e In
terv
al o
f Non
-Ri
sk A
djus
ted
Rate
Risk
Adj
uste
d Ra
te
Confi
denc
e In
terv
al o
f Ris
k Ad
just
ed R
ate
Med
icar
e
Com
mer
cial
MN
Heal
th C
are
Prog
ram
s
Tota
l Pop
ulat
ion
or S
ampl
e
Sam
ple
Size
Non-
Risk
Adj
uste
d Ra
te
Confi
denc
e In
terv
al o
f Non
-Ri
sk A
djus
ted
Rate
Optimal Diabetes Care Optimal Vascular Care
PHySIcIAN cLINIc NAME
MEdIcAL GrOuP NAME
Quality of Care for Chronic Conditions Distribution of
Patient Population
28% 28–29% 29% 55% 16% 28% 28-29% 34% 34-35% 43% 47% 9% 34% 34-35%
Distribution of Patient Population
Overall Minnesota Clinic Average
Children’s speciality Clinic Children’s Hospitals and Clinics of Minnesota
donald e gehrig, Md, donald e gehrig, Md, Internal Medicine, llC Internal Medicine, llC
dr Bobby yang Medical Clinic
Fairview Highland Park Clinic Fairview Health services
Family Healthservices Minnesota- Family Healthservices Minnesota Highland Family Physicians
Family Healthservices Minnesota- Family Healthservices Minnesota larpenteur Clinic
Family Healthservices Minnesota- Family Healthservices Minnesota Maryland Clinic
gillette Children’s specialty Healthcare gillette Children’s
gillette lifetime specialty Healthcare gillette Children’s
Healtheast- downtown st. Paul Healtheast Clinics
Healtheast- grand Avenue Healtheast Clinics
Healtheast- Midway Healtheast Clinics
Healtheast- rice street Healtheast Clinics
Healtheast- roselawn Healtheast Clinics
Healtheast- st Anthony Park Healtheast Clinics
HealthPartners- HealthPartners Clinics Center for International Health
10% 10%-16% 3% 92% 5% total Population 60 0% 0%-6% * * * * * * * * *
+ + + + + + + + + + + + + + + + + +
+ + + + + + + + + + + + + + + + + +
29% 24%-34% 29% 62% 8% total Population 307 30% 25%-35% 45% 36%-54% 47% 43% 10% total Population 109 44% 35%-53%
32% 27%-38% 32% 62% 7% total Population 307 34% 29%-39% 48% 39%-58% 40% 56% 4% total Population 102 50% 40%-60%
29% 25%-34% 31% 63% 6% total Population 371 30% 25%-35% 50% 41%-59% 47% 49% 5% total Population 110 51% 42%-60%
20% 16%-24% 30% 55% 15% total Population 357 20% 16%-24% 32% 24%-42% 47% 41% 12% total Population 102 31% 23%-41%
* * * * * * * * * * * * * * * * * *
* * * * * * * * * * * * * * * * * *
42% 37%-46% 43% 49% 8% total Population 550 44% 40%-48% 50% 45%-56% 57% 40% 4% total Population 305 51% 46%-57%
32% 25%-40% 19% 60% 20% total Population 167 31% 24%-38% * * * * * * * * *
46% 42%-51% 41% 50% 9% total Population 477 49% 44%-53% 60% 53%-66% 52% 41% 6% total Population 204 61% 54%-67%
19% 15%-22% 32% 39% 29% total Population 551 18% 15%-21% 26% 19%-35% 47% 40% 12% total Population 114 25% 18%-34%
20% 17%-24% 33% 45% 21% total Population 449 21% 17%-25% 36% 26%-47% 48% 41% 11% total Population 73 36% 26%-47%
3% 2%-12% 42% 52% 6% total Population 51 2% 0%-10% * * * * * * * * *
27% 21%-34% 20% 17% 64% total Population 337 28% 23%-33% 31% 17%-47% 36% 18% 46% total Population 50 30% 19%-44%
* sufficient data not available. + data not reported (for information on Physician Clinic Inclusion see page 255).
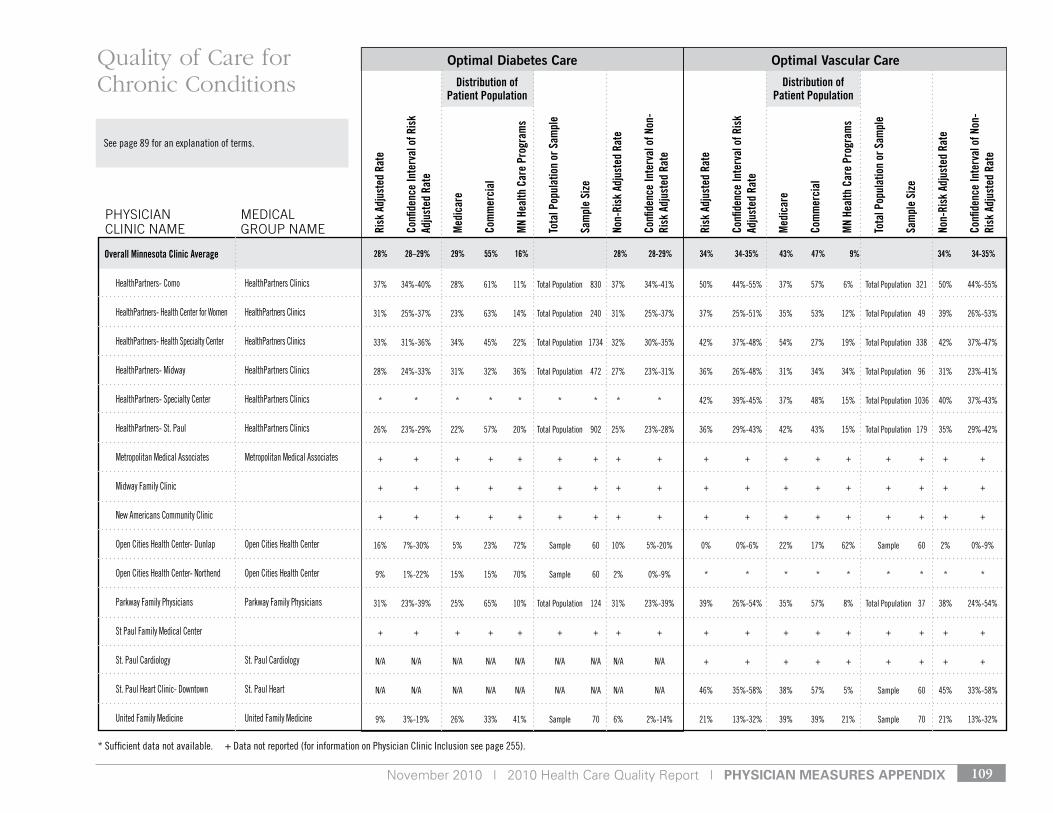
November 2010 | 2010 Health Care Quality Report | pHysiCian Measures appenDiX 109
see page 89 for an explanation of terms.
Risk
Adj
uste
d Ra
te
Confi
denc
e In
terv
al o
f Ris
k Ad
just
ed R
ate
Med
icar
e
Com
mer
cial
MN
Heal
th C
are
Prog
ram
s
Tota
l Pop
ulat
ion
or S
ampl
e
Sam
ple
Size
Non-
Risk
Adj
uste
d Ra
te
Confi
denc
e In
terv
al o
f Non
-Ri
sk A
djus
ted
Rate
Risk
Adj
uste
d Ra
te
Confi
denc
e In
terv
al o
f Ris
k Ad
just
ed R
ate
Med
icar
e
Com
mer
cial
MN
Heal
th C
are
Prog
ram
s
Tota
l Pop
ulat
ion
or S
ampl
e
Sam
ple
Size
Non-
Risk
Adj
uste
d Ra
te
Confi
denc
e In
terv
al o
f Non
-Ri
sk A
djus
ted
Rate
Optimal Diabetes Care Optimal Vascular Care
PHySIcIAN cLINIc NAME
MEdIcAL GrOuP NAME
Quality of Care for Chronic Conditions Distribution of
Patient Population
28% 28–29% 29% 55% 16% 28% 28-29% 34% 34-35% 43% 47% 9% 34% 34-35%
Distribution of Patient Population
Overall Minnesota Clinic Average
HealthPartners- Como HealthPartners Clinics
HealthPartners- Health Center for Women HealthPartners Clinics
HealthPartners- Health specialty Center HealthPartners Clinics
HealthPartners- Midway HealthPartners Clinics
HealthPartners- specialty Center HealthPartners Clinics
HealthPartners- st. Paul HealthPartners Clinics
Metropolitan Medical Associates Metropolitan Medical Associates
Midway Family Clinic
new Americans Community Clinic
open Cities Health Center- dunlap open Cities Health Center
open Cities Health Center- northend open Cities Health Center
Parkway Family Physicians Parkway Family Physicians
st Paul Family Medical Center
st. Paul Cardiology st. Paul Cardiology
st. Paul Heart Clinic- downtown st. Paul Heart
united Family Medicine united Family Medicine
37% 34%-40% 28% 61% 11% total Population 830 37% 34%-41% 50% 44%-55% 37% 57% 6% total Population 321 50% 44%-55%
31% 25%-37% 23% 63% 14% total Population 240 31% 25%-37% 37% 25%-51% 35% 53% 12% total Population 49 39% 26%-53%
33% 31%-36% 34% 45% 22% total Population 1734 32% 30%-35% 42% 37%-48% 54% 27% 19% total Population 338 42% 37%-47%
28% 24%-33% 31% 32% 36% total Population 472 27% 23%-31% 36% 26%-48% 31% 34% 34% total Population 96 31% 23%-41%
* * * * * * * * * 42% 39%-45% 37% 48% 15% total Population 1036 40% 37%-43%
26% 23%-29% 22% 57% 20% total Population 902 25% 23%-28% 36% 29%-43% 42% 43% 15% total Population 179 35% 29%-42%
+ + + + + + + + + + + + + + + + + +
+ + + + + + + + + + + + + + + + + +
+ + + + + + + + + + + + + + + + + +
16% 7%-30% 5% 23% 72% sample 60 10% 5%-20% 0% 0%-6% 22% 17% 62% sample 60 2% 0%-9%
9% 1%-22% 15% 15% 70% sample 60 2% 0%-9% * * * * * * * * *
31% 23%-39% 25% 65% 10% total Population 124 31% 23%-39% 39% 26%-54% 35% 57% 8% total Population 37 38% 24%-54%
+ + + + + + + + + + + + + + + + + +
n/A n/A n/A n/A n/A n/A n/A n/A n/A + + + + + + + + +
n/A n/A n/A n/A n/A n/A n/A n/A n/A 46% 35%-58% 38% 57% 5% sample 60 45% 33%-58%
9% 3%-19% 26% 33% 41% sample 70 6% 2%-14% 21% 13%-32% 39% 39% 21% sample 70 21% 13%-32%
* sufficient data not available. + data not reported (for information on Physician Clinic Inclusion see page 255).
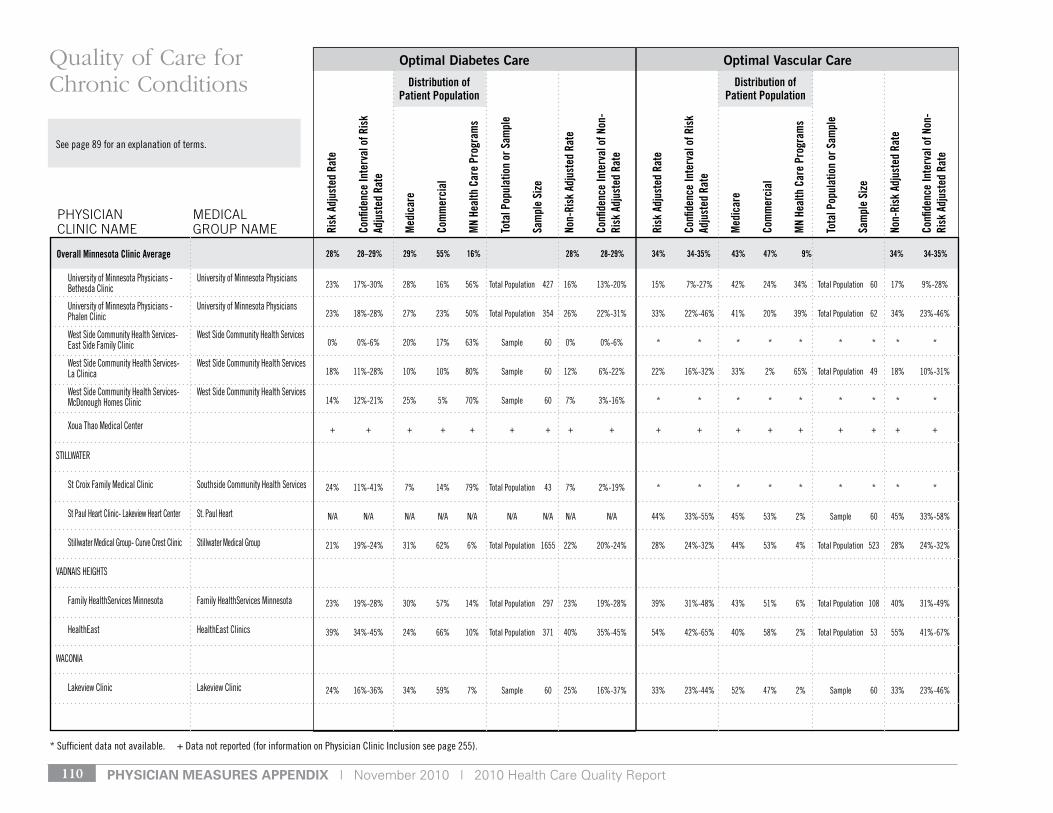
pHysiCian Measures appenDiX | November 2010 | 2010 Health Care Quality Report110
see page 89 for an explanation of terms.
Risk
Adj
uste
d Ra
te
Confi
denc
e In
terv
al o
f Ris
k Ad
just
ed R
ate
Med
icar
e
Com
mer
cial
MN
Heal
th C
are
Prog
ram
s
Tota
l Pop
ulat
ion
or S
ampl
e
Sam
ple
Size
Non-
Risk
Adj
uste
d Ra
te
Confi
denc
e In
terv
al o
f Non
-Ri
sk A
djus
ted
Rate
Risk
Adj
uste
d Ra
te
Confi
denc
e In
terv
al o
f Ris
k Ad
just
ed R
ate
Med
icar
e
Com
mer
cial
MN
Heal
th C
are
Prog
ram
s
Tota
l Pop
ulat
ion
or S
ampl
e
Sam
ple
Size
Non-
Risk
Adj
uste
d Ra
te
Confi
denc
e In
terv
al o
f Non
-Ri
sk A
djus
ted
Rate
Optimal Diabetes Care Optimal Vascular Care
PHySIcIAN cLINIc NAME
MEdIcAL GrOuP NAME
Quality of Care for Chronic Conditions Distribution of
Patient Population
28% 28–29% 29% 55% 16% 28% 28-29% 34% 34-35% 43% 47% 9% 34% 34-35%
Distribution of Patient Population
Overall Minnesota Clinic Average
university of Minnesota Physicians - university of Minnesota Physicians Bethesda Clinic
university of Minnesota Physicians - university of Minnesota Physicians Phalen Clinic
West side Community Health services- West side Community Health services east side Family Clinic
West side Community Health services- West side Community Health services la Clinica
West side Community Health services- West side Community Health services Mcdonough Homes Clinic
Xoua thao Medical Center
stIllWAter
st Croix Family Medical Clinic southside Community Health services
st Paul Heart Clinic- lakeview Heart Center st. Paul Heart
stillwater Medical group- Curve Crest Clinic stillwater Medical group
vAdnAIs HeIgHts
Family Healthservices Minnesota Family Healthservices Minnesota
Healtheast Healtheast Clinics
WAConIA
lakeview Clinic lakeview Clinic
23% 17%-30% 28% 16% 56% total Population 427 16% 13%-20% 15% 7%-27% 42% 24% 34% total Population 60 17% 9%-28%
23% 18%-28% 27% 23% 50% total Population 354 26% 22%-31% 33% 22%-46% 41% 20% 39% total Population 62 34% 23%-46%
0% 0%-6% 20% 17% 63% sample 60 0% 0%-6% * * * * * * * * *
18% 11%-28% 10% 10% 80% sample 60 12% 6%-22% 22% 16%-32% 33% 2% 65% total Population 49 18% 10%-31%
14% 12%-21% 25% 5% 70% sample 60 7% 3%-16% * * * * * * * * *
+ + + + + + + + + + + + + + + + + +
24% 11%-41% 7% 14% 79% total Population 43 7% 2%-19% * * * * * * * * *
n/A n/A n/A n/A n/A n/A n/A n/A n/A 44% 33%-55% 45% 53% 2% sample 60 45% 33%-58%
21% 19%-24% 31% 62% 6% total Population 1655 22% 20%-24% 28% 24%-32% 44% 53% 4% total Population 523 28% 24%-32%
23% 19%-28% 30% 57% 14% total Population 297 23% 19%-28% 39% 31%-48% 43% 51% 6% total Population 108 40% 31%-49%
39% 34%-45% 24% 66% 10% total Population 371 40% 35%-45% 54% 42%-65% 40% 58% 2% total Population 53 55% 41%-67%
24% 16%-36% 34% 59% 7% sample 60 25% 16%-37% 33% 23%-44% 52% 47% 2% sample 60 33% 23%-46%
* sufficient data not available. + data not reported (for information on Physician Clinic Inclusion see page 255).
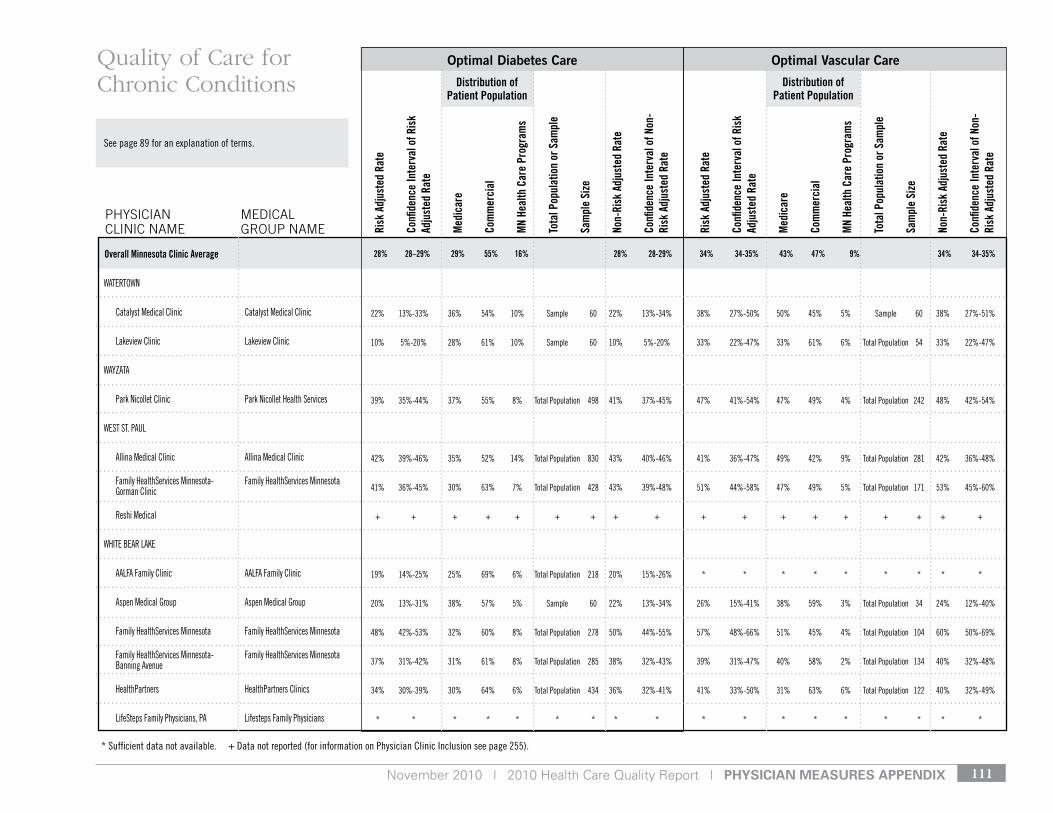
November 2010 | 2010 Health Care Quality Report | pHysiCian Measures appenDiX 111
see page 89 for an explanation of terms.
Risk
Adj
uste
d Ra
te
Confi
denc
e In
terv
al o
f Ris
k Ad
just
ed R
ate
Med
icar
e
Com
mer
cial
MN
Heal
th C
are
Prog
ram
s
Tota
l Pop
ulat
ion
or S
ampl
e
Sam
ple
Size
Non-
Risk
Adj
uste
d Ra
te
Confi
denc
e In
terv
al o
f Non
-Ri
sk A
djus
ted
Rate
Risk
Adj
uste
d Ra
te
Confi
denc
e In
terv
al o
f Ris
k Ad
just
ed R
ate
Med
icar
e
Com
mer
cial
MN
Heal
th C
are
Prog
ram
s
Tota
l Pop
ulat
ion
or S
ampl
e
Sam
ple
Size
Non-
Risk
Adj
uste
d Ra
te
Confi
denc
e In
terv
al o
f Non
-Ri
sk A
djus
ted
Rate
Optimal Diabetes Care Optimal Vascular Care
PHySIcIAN cLINIc NAME
MEdIcAL GrOuP NAME
Quality of Care for Chronic Conditions Distribution of
Patient Population
28% 28–29% 29% 55% 16% 28% 28-29% 34% 34-35% 43% 47% 9% 34% 34-35%
Distribution of Patient Population
Overall Minnesota Clinic Average
WAtertoWn
Catalyst Medical Clinic Catalyst Medical Clinic
lakeview Clinic lakeview Clinic
WAyzAtA
Park nicollet Clinic Park nicollet Health services
West st. PAul
Allina Medical Clinic Allina Medical Clinic
Family Healthservices Minnesota- Family Healthservices Minnesota gorman Clinic
reshi Medical
WHIte BeAr lAke
AAlFA Family Clinic AAlFA Family Clinic
Aspen Medical group Aspen Medical group
Family Healthservices Minnesota Family Healthservices Minnesota
Family Healthservices Minnesota- Family Healthservices Minnesota Banning Avenue
HealthPartners HealthPartners Clinics
lifesteps Family Physicians, PA lifesteps Family Physicians
22% 13%-33% 36% 54% 10% sample 60 22% 13%-34% 38% 27%-50% 50% 45% 5% sample 60 38% 27%-51%
10% 5%-20% 28% 61% 10% sample 60 10% 5%-20% 33% 22%-47% 33% 61% 6% total Population 54 33% 22%-47%
39% 35%-44% 37% 55% 8% total Population 498 41% 37%-45% 47% 41%-54% 47% 49% 4% total Population 242 48% 42%-54%
42% 39%-46% 35% 52% 14% total Population 830 43% 40%-46% 41% 36%-47% 49% 42% 9% total Population 281 42% 36%-48%
41% 36%-45% 30% 63% 7% total Population 428 43% 39%-48% 51% 44%-58% 47% 49% 5% total Population 171 53% 45%-60%
+ + + + + + + + + + + + + + + + + +
19% 14%-25% 25% 69% 6% total Population 218 20% 15%-26% * * * * * * * * *
20% 13%-31% 38% 57% 5% sample 60 22% 13%-34% 26% 15%-41% 38% 59% 3% total Population 34 24% 12%-40%
48% 42%-53% 32% 60% 8% total Population 278 50% 44%-55% 57% 48%-66% 51% 45% 4% total Population 104 60% 50%-69%
37% 31%-42% 31% 61% 8% total Population 285 38% 32%-43% 39% 31%-47% 40% 58% 2% total Population 134 40% 32%-48%
34% 30%-39% 30% 64% 6% total Population 434 36% 32%-41% 41% 33%-50% 31% 63% 6% total Population 122 40% 32%-49%
* * * * * * * * * * * * * * * * * *
* sufficient data not available. + data not reported (for information on Physician Clinic Inclusion see page 255).
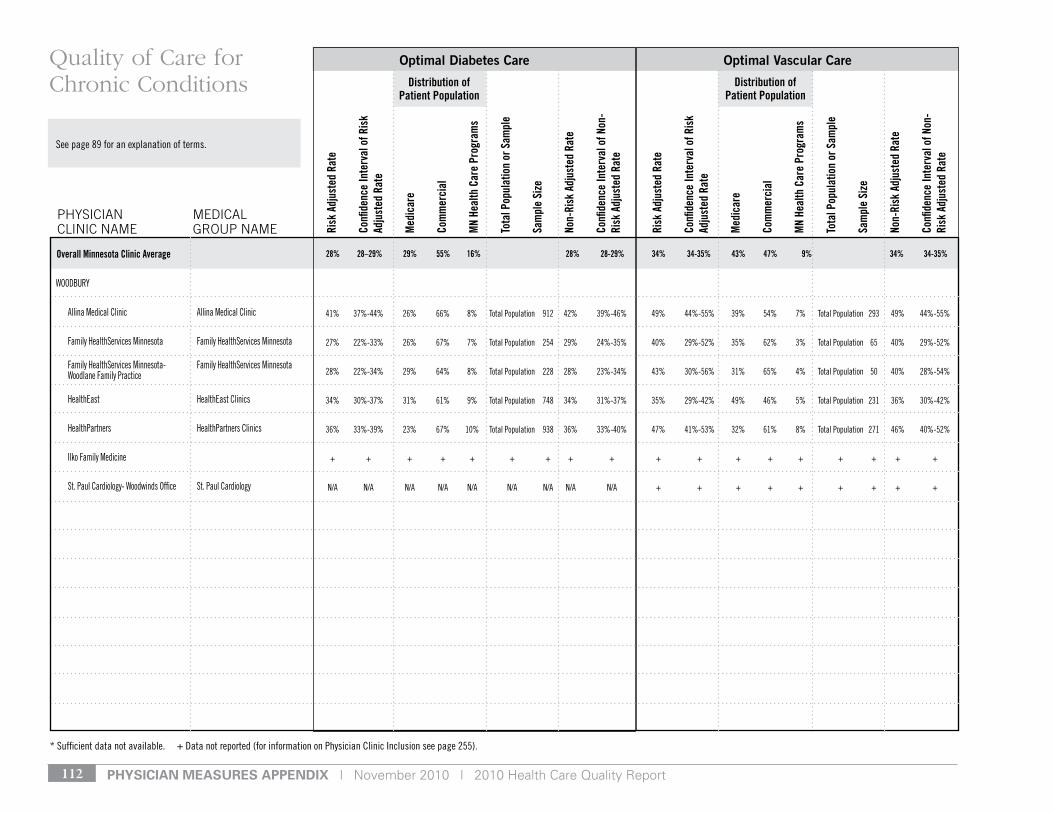
pHysiCian Measures appenDiX | November 2010 | 2010 Health Care Quality Report112
see page 89 for an explanation of terms.
Risk
Adj
uste
d Ra
te
Confi
denc
e In
terv
al o
f Ris
k Ad
just
ed R
ate
Med
icar
e
Com
mer
cial
MN
Heal
th C
are
Prog
ram
s
Tota
l Pop
ulat
ion
or S
ampl
e
Sam
ple
Size
Non-
Risk
Adj
uste
d Ra
te
Confi
denc
e In
terv
al o
f Non
-Ri
sk A
djus
ted
Rate
Risk
Adj
uste
d Ra
te
Confi
denc
e In
terv
al o
f Ris
k Ad
just
ed R
ate
Med
icar
e
Com
mer
cial
MN
Heal
th C
are
Prog
ram
s
Tota
l Pop
ulat
ion
or S
ampl
e
Sam
ple
Size
Non-
Risk
Adj
uste
d Ra
te
Confi
denc
e In
terv
al o
f Non
-Ri
sk A
djus
ted
Rate
Optimal Diabetes Care Optimal Vascular Care
PHySIcIAN cLINIc NAME
MEdIcAL GrOuP NAME
Quality of Care for Chronic Conditions Distribution of
Patient Population
28% 28–29% 29% 55% 16% 28% 28-29% 34% 34-35% 43% 47% 9% 34% 34-35%
Distribution of Patient Population
Overall Minnesota Clinic Average
WoodBury
Allina Medical Clinic Allina Medical Clinic
Family Healthservices Minnesota Family Healthservices Minnesota
Family Healthservices Minnesota- Family Healthservices Minnesota Woodlane Family Practice
Healtheast Healtheast Clinics
HealthPartners HealthPartners Clinics
Ilko Family Medicine
st. Paul Cardiology- Woodwinds office st. Paul Cardiology
41% 37%-44% 26% 66% 8% total Population 912 42% 39%-46% 49% 44%-55% 39% 54% 7% total Population 293 49% 44%-55%
27% 22%-33% 26% 67% 7% total Population 254 29% 24%-35% 40% 29%-52% 35% 62% 3% total Population 65 40% 29%-52%
28% 22%-34% 29% 64% 8% total Population 228 28% 23%-34% 43% 30%-56% 31% 65% 4% total Population 50 40% 28%-54%
34% 30%-37% 31% 61% 9% total Population 748 34% 31%-37% 35% 29%-42% 49% 46% 5% total Population 231 36% 30%-42%
36% 33%-39% 23% 67% 10% total Population 938 36% 33%-40% 47% 41%-53% 32% 61% 8% total Population 271 46% 40%-52%
+ + + + + + + + + + + + + + + + + +
n/A n/A n/A n/A n/A n/A n/A n/A n/A + + + + + + + + +
* sufficient data not available. + data not reported (for information on Physician Clinic Inclusion see page 255).
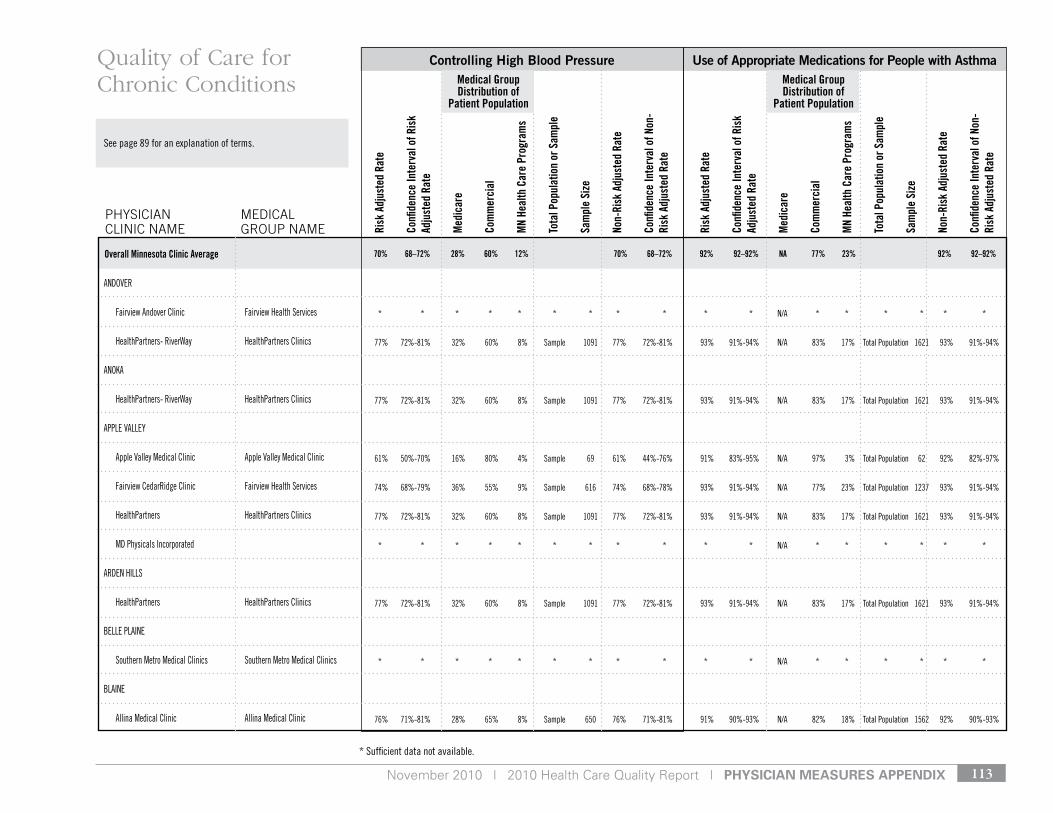
November 2010 | 2010 Health Care Quality Report | pHysiCian Measures appenDiX 113
* sufficient data not available.
see page 89 for an explanation of terms.
Risk
Adj
uste
d Ra
te
Confi
denc
e In
terv
al o
f Ris
k Ad
just
ed R
ate
Med
icar
e
Com
mer
cial
MN
Heal
th C
are
Prog
ram
s
Tota
l Pop
ulat
ion
or S
ampl
e
Sam
ple
Size
Non-
Risk
Adj
uste
d Ra
te
Confi
denc
e In
terv
al o
f Non
-Ri
sk A
djus
ted
Rate
Risk
Adj
uste
d Ra
te
Confi
denc
e In
terv
al o
f Ris
k Ad
just
ed R
ate
Med
icar
e
Com
mer
cial
MN
Heal
th C
are
Prog
ram
s
Tota
l Pop
ulat
ion
or S
ampl
e
Sam
ple
Size
Non-
Risk
Adj
uste
d Ra
te
Confi
denc
e In
terv
al o
f Non
-Ri
sk A
djus
ted
Rate
Controlling High Blood Pressure Use of Appropriate Medications for People with Asthma
PHySIcIAN cLINIc NAME
MEdIcAL GrOuP NAME
Quality of Care for Chronic Conditions
70% 68–72% 28% 60% 12% 70% 68–72% 92% 92–92% NA 77% 23% 92% 92–92%Overall Minnesota Clinic Average
Medical Group Distribution of
Patient Population
Medical Group Distribution of
Patient Population
Andover
Fairview Andover Clinic Fairview Health services
HealthPartners- riverWay HealthPartners Clinics
AnokA
HealthPartners- riverWay HealthPartners Clinics
APPle vAlley
Apple valley Medical Clinic Apple valley Medical Clinic
Fairview Cedarridge Clinic Fairview Health services
HealthPartners HealthPartners Clinics
Md Physicals Incorporated
Arden HIlls
HealthPartners HealthPartners Clinics
Belle PlAIne
southern Metro Medical Clinics southern Metro Medical Clinics
BlAIne
Allina Medical Clinic Allina Medical Clinic
* * * * * * * * * * * n/A * * * * * *
77% 72%-81% 32% 60% 8% sample 1091 77% 72%-81% 93% 91%-94% n/A 83% 17% total Population 1621 93% 91%-94%
77% 72%-81% 32% 60% 8% sample 1091 77% 72%-81% 93% 91%-94% n/A 83% 17% total Population 1621 93% 91%-94%
61% 50%-70% 16% 80% 4% sample 69 61% 44%-76% 91% 83%-95% n/A 97% 3% total Population 62 92% 82%-97%
74% 68%-79% 36% 55% 9% sample 616 74% 68%-78% 93% 91%-94% n/A 77% 23% total Population 1237 93% 91%-94%
77% 72%-81% 32% 60% 8% sample 1091 77% 72%-81% 93% 91%-94% n/A 83% 17% total Population 1621 93% 91%-94%
* * * * * * * * * * * n/A * * * * * *
77% 72%-81% 32% 60% 8% sample 1091 77% 72%-81% 93% 91%-94% n/A 83% 17% total Population 1621 93% 91%-94%
* * * * * * * * * * * n/A * * * * * *
76% 71%-81% 28% 65% 8% sample 650 76% 71%-81% 91% 90%-93% n/A 82% 18% total Population 1562 92% 90%-93%
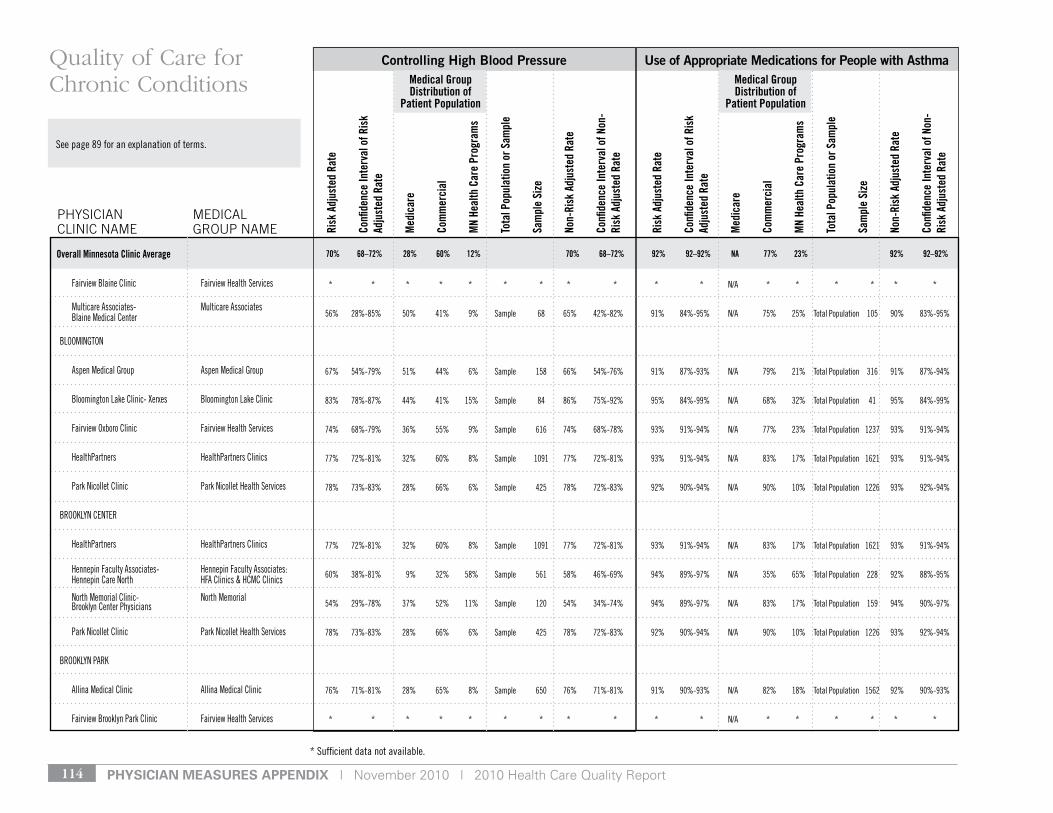
pHysiCian Measures appenDiX | November 2010 | 2010 Health Care Quality Report114
* sufficient data not available.
see page 89 for an explanation of terms.
Risk
Adj
uste
d Ra
te
Confi
denc
e In
terv
al o
f Ris
k Ad
just
ed R
ate
Med
icar
e
Com
mer
cial
MN
Heal
th C
are
Prog
ram
s
Tota
l Pop
ulat
ion
or S
ampl
e
Sam
ple
Size
Non-
Risk
Adj
uste
d Ra
te
Confi
denc
e In
terv
al o
f Non
-Ri
sk A
djus
ted
Rate
Risk
Adj
uste
d Ra
te
Confi
denc
e In
terv
al o
f Ris
k Ad
just
ed R
ate
Med
icar
e
Com
mer
cial
MN
Heal
th C
are
Prog
ram
s
Tota
l Pop
ulat
ion
or S
ampl
e
Sam
ple
Size
Non-
Risk
Adj
uste
d Ra
te
Confi
denc
e In
terv
al o
f Non
-Ri
sk A
djus
ted
Rate
Controlling High Blood Pressure Use of Appropriate Medications for People with Asthma
PHySIcIAN cLINIc NAME
MEdIcAL GrOuP NAME
Quality of Care for Chronic Conditions
70% 68–72% 28% 60% 12% 70% 68–72% 92% 92–92% NA 77% 23% 92% 92–92%Overall Minnesota Clinic Average
Medical Group Distribution of
Patient Population
Medical Group Distribution of
Patient Population
Fairview Blaine Clinic Fairview Health services
Multicare Associates- Multicare Associates Blaine Medical Center
BlooMIngton
Aspen Medical group Aspen Medical group
Bloomington lake Clinic- Xerxes Bloomington lake Clinic
Fairview oxboro Clinic Fairview Health services
HealthPartners HealthPartners Clinics
Park nicollet Clinic Park nicollet Health services
Brooklyn Center
HealthPartners HealthPartners Clinics
Hennepin Faculty Associates- Hennepin Faculty Associates: Hennepin Care north HFA Clinics & HCMC Clinics
north Memorial Clinic- north Memorial Brooklyn Center Physicians
Park nicollet Clinic Park nicollet Health services
Brooklyn PArk
Allina Medical Clinic Allina Medical Clinic
Fairview Brooklyn Park Clinic Fairview Health services
* * * * * * * * * * * n/A * * * * * *
56% 28%-85% 50% 41% 9% sample 68 65% 42%-82% 91% 84%-95% n/A 75% 25% total Population 105 90% 83%-95%
67% 54%-79% 51% 44% 6% sample 158 66% 54%-76% 91% 87%-93% n/A 79% 21% total Population 316 91% 87%-94%
83% 78%-87% 44% 41% 15% sample 84 86% 75%-92% 95% 84%-99% n/A 68% 32% total Population 41 95% 84%-99%
74% 68%-79% 36% 55% 9% sample 616 74% 68%-78% 93% 91%-94% n/A 77% 23% total Population 1237 93% 91%-94%
77% 72%-81% 32% 60% 8% sample 1091 77% 72%-81% 93% 91%-94% n/A 83% 17% total Population 1621 93% 91%-94%
78% 73%-83% 28% 66% 6% sample 425 78% 72%-83% 92% 90%-94% n/A 90% 10% total Population 1226 93% 92%-94%
77% 72%-81% 32% 60% 8% sample 1091 77% 72%-81% 93% 91%-94% n/A 83% 17% total Population 1621 93% 91%-94%
60% 38%-81% 9% 32% 58% sample 561 58% 46%-69% 94% 89%-97% n/A 35% 65% total Population 228 92% 88%-95%
54% 29%-78% 37% 52% 11% sample 120 54% 34%-74% 94% 89%-97% n/A 83% 17% total Population 159 94% 90%-97%
78% 73%-83% 28% 66% 6% sample 425 78% 72%-83% 92% 90%-94% n/A 90% 10% total Population 1226 93% 92%-94%
76% 71%-81% 28% 65% 8% sample 650 76% 71%-81% 91% 90%-93% n/A 82% 18% total Population 1562 92% 90%-93%
* * * * * * * * * * * n/A * * * * * *
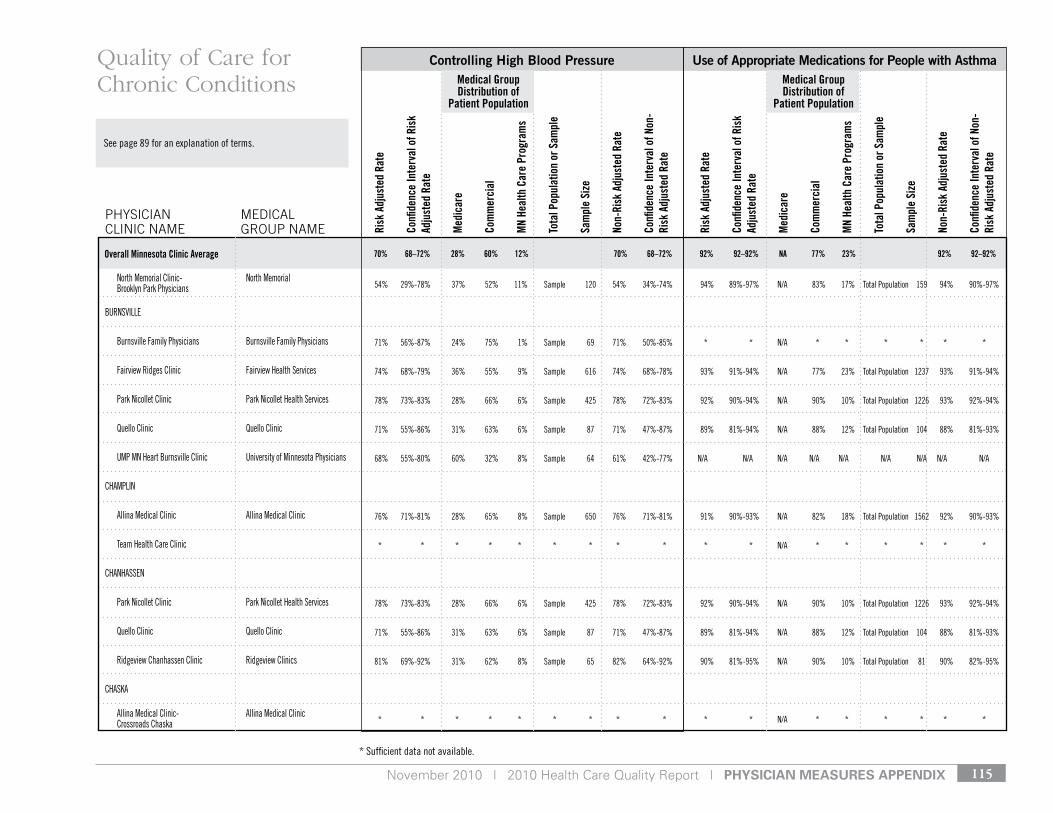
November 2010 | 2010 Health Care Quality Report | pHysiCian Measures appenDiX 115
* sufficient data not available.
see page 89 for an explanation of terms.
Risk
Adj
uste
d Ra
te
Confi
denc
e In
terv
al o
f Ris
k Ad
just
ed R
ate
Med
icar
e
Com
mer
cial
MN
Heal
th C
are
Prog
ram
s
Tota
l Pop
ulat
ion
or S
ampl
e
Sam
ple
Size
Non-
Risk
Adj
uste
d Ra
te
Confi
denc
e In
terv
al o
f Non
-Ri
sk A
djus
ted
Rate
Risk
Adj
uste
d Ra
te
Confi
denc
e In
terv
al o
f Ris
k Ad
just
ed R
ate
Med
icar
e
Com
mer
cial
MN
Heal
th C
are
Prog
ram
s
Tota
l Pop
ulat
ion
or S
ampl
e
Sam
ple
Size
Non-
Risk
Adj
uste
d Ra
te
Confi
denc
e In
terv
al o
f Non
-Ri
sk A
djus
ted
Rate
Controlling High Blood Pressure Use of Appropriate Medications for People with Asthma
PHySIcIAN cLINIc NAME
MEdIcAL GrOuP NAME
Quality of Care for Chronic Conditions
70% 68–72% 28% 60% 12% 70% 68–72% 92% 92–92% NA 77% 23% 92% 92–92%Overall Minnesota Clinic Average
Medical Group Distribution of
Patient Population
Medical Group Distribution of
Patient Population
north Memorial Clinic- north Memorial Brooklyn Park Physicians
BurnsvIlle
Burnsville Family Physicians Burnsville Family Physicians
Fairview ridges Clinic Fairview Health services
Park nicollet Clinic Park nicollet Health services
Quello Clinic Quello Clinic
uMP Mn Heart Burnsville Clinic university of Minnesota Physicians
CHAMPlIn
Allina Medical Clinic Allina Medical Clinic
team Health Care Clinic
CHAnHAssen
Park nicollet Clinic Park nicollet Health services
Quello Clinic Quello Clinic
ridgeview Chanhassen Clinic ridgeview Clinics
CHAskA
Allina Medical Clinic- Allina Medical Clinic Crossroads Chaska
54% 29%-78% 37% 52% 11% sample 120 54% 34%-74% 94% 89%-97% n/A 83% 17% total Population 159 94% 90%-97%
71% 56%-87% 24% 75% 1% sample 69 71% 50%-85% * * n/A * * * * * *
74% 68%-79% 36% 55% 9% sample 616 74% 68%-78% 93% 91%-94% n/A 77% 23% total Population 1237 93% 91%-94%
78% 73%-83% 28% 66% 6% sample 425 78% 72%-83% 92% 90%-94% n/A 90% 10% total Population 1226 93% 92%-94%
71% 55%-86% 31% 63% 6% sample 87 71% 47%-87% 89% 81%-94% n/A 88% 12% total Population 104 88% 81%-93%
68% 55%-80% 60% 32% 8% sample 64 61% 42%-77% n/A n/A n/A n/A n/A n/A n/A n/A n/A
76% 71%-81% 28% 65% 8% sample 650 76% 71%-81% 91% 90%-93% n/A 82% 18% total Population 1562 92% 90%-93%
* * * * * * * * * * * n/A * * * * * *
78% 73%-83% 28% 66% 6% sample 425 78% 72%-83% 92% 90%-94% n/A 90% 10% total Population 1226 93% 92%-94%
71% 55%-86% 31% 63% 6% sample 87 71% 47%-87% 89% 81%-94% n/A 88% 12% total Population 104 88% 81%-93%
81% 69%-92% 31% 62% 8% sample 65 82% 64%-92% 90% 81%-95% n/A 90% 10% total Population 81 90% 82%-95%
* * * * * * * * * * * n/A * * * * * *

pHysiCian Measures appenDiX | November 2010 | 2010 Health Care Quality Report116
* sufficient data not available.
see page 89 for an explanation of terms.
Risk
Adj
uste
d Ra
te
Confi
denc
e In
terv
al o
f Ris
k Ad
just
ed R
ate
Med
icar
e
Com
mer
cial
MN
Heal
th C
are
Prog
ram
s
Tota
l Pop
ulat
ion
or S
ampl
e
Sam
ple
Size
Non-
Risk
Adj
uste
d Ra
te
Confi
denc
e In
terv
al o
f Non
-Ri
sk A
djus
ted
Rate
Risk
Adj
uste
d Ra
te
Confi
denc
e In
terv
al o
f Ris
k Ad
just
ed R
ate
Med
icar
e
Com
mer
cial
MN
Heal
th C
are
Prog
ram
s
Tota
l Pop
ulat
ion
or S
ampl
e
Sam
ple
Size
Non-
Risk
Adj
uste
d Ra
te
Confi
denc
e In
terv
al o
f Non
-Ri
sk A
djus
ted
Rate
Controlling High Blood Pressure Use of Appropriate Medications for People with Asthma
PHySIcIAN cLINIc NAME
MEdIcAL GrOuP NAME
Quality of Care for Chronic Conditions
70% 68–72% 28% 60% 12% 70% 68–72% 92% 92–92% NA 77% 23% 92% 92–92%Overall Minnesota Clinic Average
Medical Group Distribution of
Patient Population
Medical Group Distribution of
Patient Population
Fairview Jonathan Clinic Fairview Health services
lakeview Clinic lakeview Clinic
valley Family Practice valley Family Practice
ColuMBIA HeIgHts
Fairview Columbia Heights Clinic Fairview Health services
Coon rAPIds
Allina Health system- Allina Health system Metropolitan Heart & vascular Institute
Allina Health system- Allina Health system Midwest Internal Medicine
Allina Medical Clinic Allina Medical Clinic
Anoka Area Family Medicine Clinic
dr. Jerrol noller dr. Jerrol noller
HealthPartners HealthPartners Clinics
twin Cities Heart and lung
CottAge grove
Allina Medical Clinic Allina Medical Clinic
Healtheast Healtheast Clinics
74% 68%-79% 36% 55% 9% sample 616 74% 68%-78% 93% 91%-94% n/A 77% 23% total Population 1237 93% 91%-94%
49% 17%-81% 33% 61% 5% sample 65 48% 25%-73% 95% 90%-98% n/A 92% 8% total Population 178 96% 91%-98%
* * * * * * * * * * * n/A * * * * * *
* * * * * * * * * * * n/A * * * * * *
75% 66%-84% 32% 58% 10% sample 139 75% 64%-84% n/A n/A n/A n/A n/A n/A n/A n/A n/A
75% 66%-84% 32% 58% 10% sample 139 75% 64%-84% 91% 86%-94% n/A 75% 25% total Population 202 91% 86%-94%
76% 71%-81% 28% 65% 8% sample 650 76% 71%-81% 91% 90%-93% n/A 82% 18% total Population 1562 92% 90%-93%
* * * * * * * * * * * n/A * * * * * *
* * * * * * * * * * * n/A * * * * * *
77% 72%-81% 32% 60% 8% sample 1091 77% 72%-81% 93% 91%-94% n/A 83% 17% total Population 1621 93% 91%-94%
* * * * * * * * * n/A n/A n/A n/A n/A n/A n/A n/A n/A
76% 71%-81% 28% 65% 8% sample 650 76% 71%-81% 91% 90%-93% n/A 82% 18% total Population 1562 92% 90%-93%
81% 71%-91% 44% 50% 6% sample 189 79% 69%-87% 90% 86%-93% n/A 80% 20% total Population 302 90% 86%-93%

November 2010 | 2010 Health Care Quality Report | pHysiCian Measures appenDiX 117
* sufficient data not available.
see page 89 for an explanation of terms.
Risk
Adj
uste
d Ra
te
Confi
denc
e In
terv
al o
f Ris
k Ad
just
ed R
ate
Med
icar
e
Com
mer
cial
MN
Heal
th C
are
Prog
ram
s
Tota
l Pop
ulat
ion
or S
ampl
e
Sam
ple
Size
Non-
Risk
Adj
uste
d Ra
te
Confi
denc
e In
terv
al o
f Non
-Ri
sk A
djus
ted
Rate
Risk
Adj
uste
d Ra
te
Confi
denc
e In
terv
al o
f Ris
k Ad
just
ed R
ate
Med
icar
e
Com
mer
cial
MN
Heal
th C
are
Prog
ram
s
Tota
l Pop
ulat
ion
or S
ampl
e
Sam
ple
Size
Non-
Risk
Adj
uste
d Ra
te
Confi
denc
e In
terv
al o
f Non
-Ri
sk A
djus
ted
Rate
Controlling High Blood Pressure Use of Appropriate Medications for People with Asthma
PHySIcIAN cLINIc NAME
MEdIcAL GrOuP NAME
Quality of Care for Chronic Conditions
70% 68–72% 28% 60% 12% 70% 68–72% 92% 92–92% NA 77% 23% 92% 92–92%Overall Minnesota Clinic Average
Medical Group Distribution of
Patient Population
Medical Group Distribution of
Patient Population
CrystAl
new Hope-Crystal Medical Clinic
northwest Family Physicians northwest Family Physicians
one stop Medical Center one stop Medical Center
eAgAn
Allina Medical Clinic Allina Medical Clinic
eagan Child and Family Care eagan Child and Family Care
Fairview eagan Clinic Fairview Health services
Healtheast Healtheast Clinics
Minnesota Center for obesity, Minnesota Center for obesity, Metabolism, and endocrinology (MnCoMe) Metabolism, and endocrinology (MnCoMe)
Park nicollet Clinic Park nicollet Health services
yankee square Family Practice
eden PrAIrIe
Fairview edenCenter Clinic Fairview Health services
Park nicollet Clinic Park nicollet Health services
* * * * * * * * * * * n/A * * * * * *
63% 20%-100% 46% 45% 9% sample 68 64% 36%-85% 96% 91%-98% n/A 92% 8% total Population 87 97% 90%-99%
* * * * * * * * * * * n/A * * * * * *
76% 71%-81% 28% 65% 8% sample 650 76% 71%-81% 91% 90%-93% n/A 82% 18% total Population 1562 92% 90%-93%
* * * * * * * * * * * n/A * * * * * *
74% 68%-79% 36% 55% 9% sample 616 74% 68%-78% 93% 91%-94% n/A 77% 23% total Population 1237 93% 91%-94%
81% 71%-91% 44% 50% 6% sample 189 79% 69%-87% 90% 86%-93% n/A 80% 20% total Population 302 90% 86%-93%
* * * * * * * * * n/A n/A n/A n/A n/A n/A n/A n/A n/A
78% 73%-83% 28% 66% 6% sample 425 78% 72%-83% 92% 90%-94% n/A 90% 10% total Population 1226 93% 92%-94%
* * * * * * * * * * * n/A * * * * * *
74% 68%-79% 36% 55% 9% sample 616 74% 68%-78% 93% 91%-94% n/A 77% 23% total Population 1237 93% 91%-94%
78% 73%-83% 28% 66% 6% sample 425 78% 72%-83% 92% 90%-94% n/A 90% 10% total Population 1226 93% 92%-94%
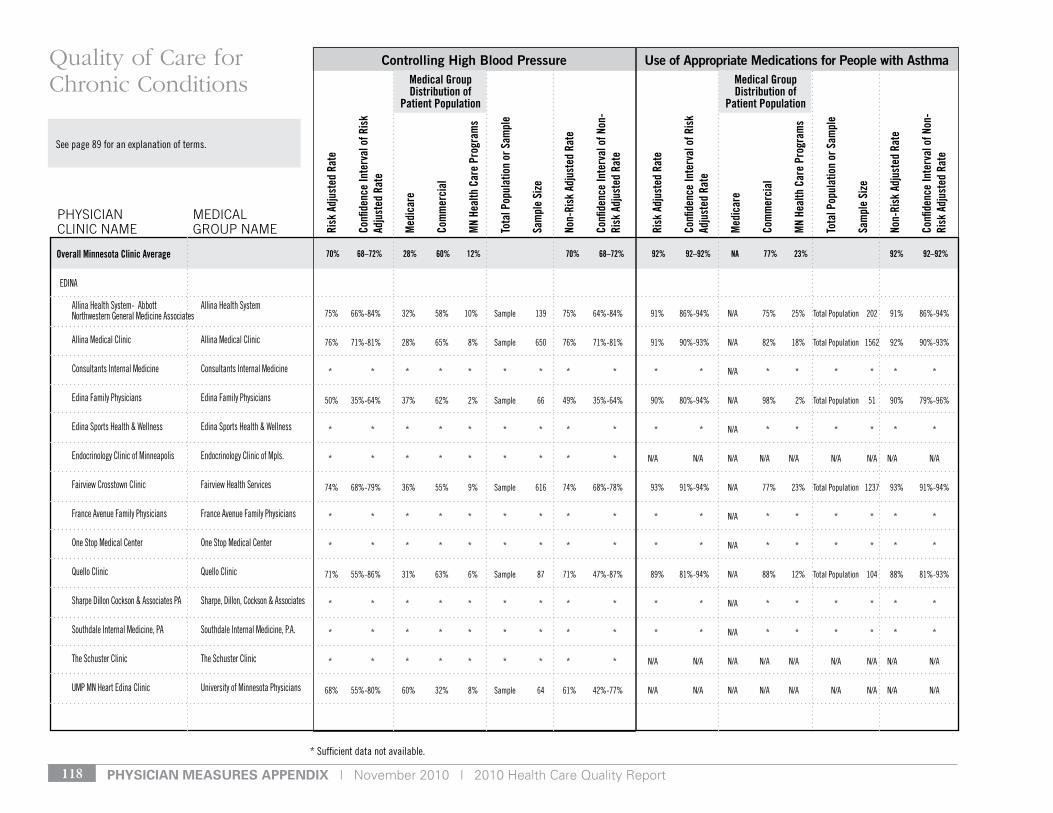
pHysiCian Measures appenDiX | November 2010 | 2010 Health Care Quality Report118
* sufficient data not available.
see page 89 for an explanation of terms.
Risk
Adj
uste
d Ra
te
Confi
denc
e In
terv
al o
f Ris
k Ad
just
ed R
ate
Med
icar
e
Com
mer
cial
MN
Heal
th C
are
Prog
ram
s
Tota
l Pop
ulat
ion
or S
ampl
e
Sam
ple
Size
Non-
Risk
Adj
uste
d Ra
te
Confi
denc
e In
terv
al o
f Non
-Ri
sk A
djus
ted
Rate
Risk
Adj
uste
d Ra
te
Confi
denc
e In
terv
al o
f Ris
k Ad
just
ed R
ate
Med
icar
e
Com
mer
cial
MN
Heal
th C
are
Prog
ram
s
Tota
l Pop
ulat
ion
or S
ampl
e
Sam
ple
Size
Non-
Risk
Adj
uste
d Ra
te
Confi
denc
e In
terv
al o
f Non
-Ri
sk A
djus
ted
Rate
Controlling High Blood Pressure Use of Appropriate Medications for People with Asthma
PHySIcIAN cLINIc NAME
MEdIcAL GrOuP NAME
Quality of Care for Chronic Conditions
70% 68–72% 28% 60% 12% 70% 68–72% 92% 92–92% NA 77% 23% 92% 92–92%Overall Minnesota Clinic Average
Medical Group Distribution of
Patient Population
Medical Group Distribution of
Patient Population
edInA
Allina Health system- Abbott Allina Health system northwestern general Medicine Associates
Allina Medical Clinic Allina Medical Clinic
Consultants Internal Medicine Consultants Internal Medicine
edina Family Physicians edina Family Physicians
edina sports Health & Wellness edina sports Health & Wellness
endocrinology Clinic of Minneapolis endocrinology Clinic of Mpls.
Fairview Crosstown Clinic Fairview Health services
France Avenue Family Physicians France Avenue Family Physicians
one stop Medical Center one stop Medical Center
Quello Clinic Quello Clinic
sharpe dillon Cockson & Associates PA sharpe, dillon, Cockson & Associates
southdale Internal Medicine, PA southdale Internal Medicine, P.A.
the schuster Clinic the schuster Clinic
uMP Mn Heart edina Clinic university of Minnesota Physicians
75% 66%-84% 32% 58% 10% sample 139 75% 64%-84% 91% 86%-94% n/A 75% 25% total Population 202 91% 86%-94%
76% 71%-81% 28% 65% 8% sample 650 76% 71%-81% 91% 90%-93% n/A 82% 18% total Population 1562 92% 90%-93%
* * * * * * * * * * * n/A * * * * * *
50% 35%-64% 37% 62% 2% sample 66 49% 35%-64% 90% 80%-94% n/A 98% 2% total Population 51 90% 79%-96%
* * * * * * * * * * * n/A * * * * * *
* * * * * * * * * n/A n/A n/A n/A n/A n/A n/A n/A n/A
74% 68%-79% 36% 55% 9% sample 616 74% 68%-78% 93% 91%-94% n/A 77% 23% total Population 1237 93% 91%-94%
* * * * * * * * * * * n/A * * * * * *
* * * * * * * * * * * n/A * * * * * *
71% 55%-86% 31% 63% 6% sample 87 71% 47%-87% 89% 81%-94% n/A 88% 12% total Population 104 88% 81%-93%
* * * * * * * * * * * n/A * * * * * *
* * * * * * * * * * * n/A * * * * * *
* * * * * * * * * n/A n/A n/A n/A n/A n/A n/A n/A n/A
68% 55%-80% 60% 32% 8% sample 64 61% 42%-77% n/A n/A n/A n/A n/A n/A n/A n/A n/A
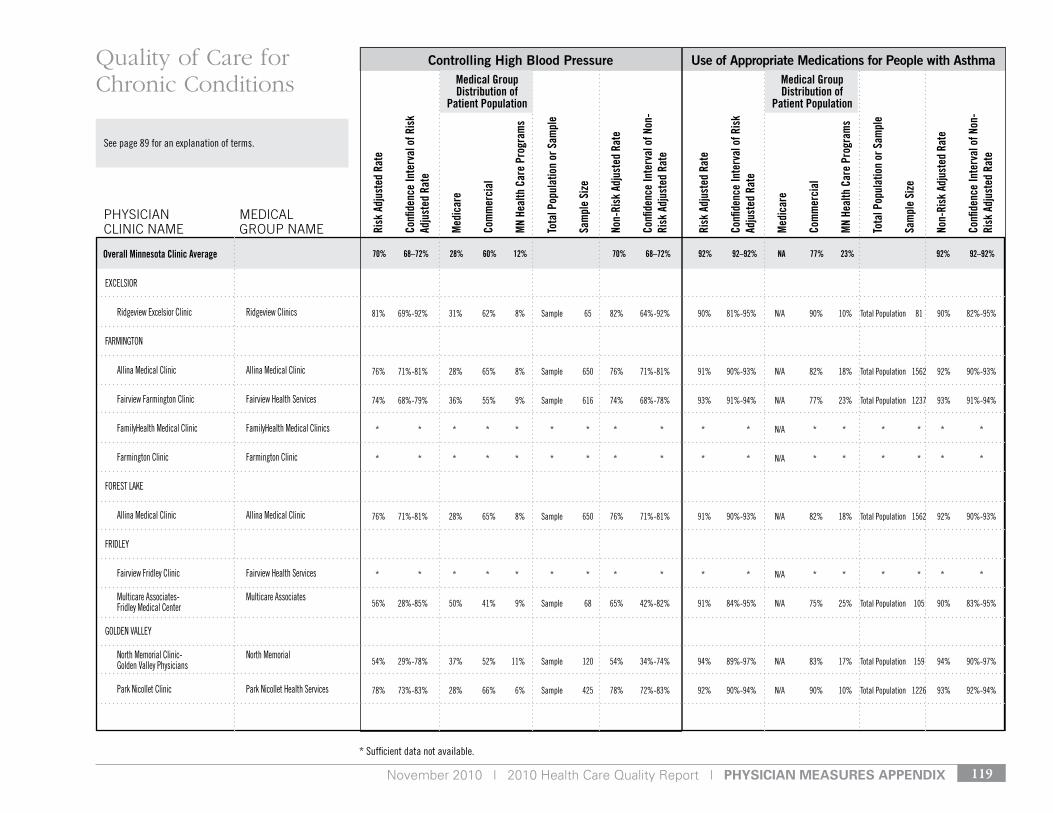
November 2010 | 2010 Health Care Quality Report | pHysiCian Measures appenDiX 119
* sufficient data not available.
see page 89 for an explanation of terms.
Risk
Adj
uste
d Ra
te
Confi
denc
e In
terv
al o
f Ris
k Ad
just
ed R
ate
Med
icar
e
Com
mer
cial
MN
Heal
th C
are
Prog
ram
s
Tota
l Pop
ulat
ion
or S
ampl
e
Sam
ple
Size
Non-
Risk
Adj
uste
d Ra
te
Confi
denc
e In
terv
al o
f Non
-Ri
sk A
djus
ted
Rate
Risk
Adj
uste
d Ra
te
Confi
denc
e In
terv
al o
f Ris
k Ad
just
ed R
ate
Med
icar
e
Com
mer
cial
MN
Heal
th C
are
Prog
ram
s
Tota
l Pop
ulat
ion
or S
ampl
e
Sam
ple
Size
Non-
Risk
Adj
uste
d Ra
te
Confi
denc
e In
terv
al o
f Non
-Ri
sk A
djus
ted
Rate
Controlling High Blood Pressure Use of Appropriate Medications for People with Asthma
PHySIcIAN cLINIc NAME
MEdIcAL GrOuP NAME
Quality of Care for Chronic Conditions
70% 68–72% 28% 60% 12% 70% 68–72% 92% 92–92% NA 77% 23% 92% 92–92%Overall Minnesota Clinic Average
Medical Group Distribution of
Patient Population
Medical Group Distribution of
Patient Population
eXCelsIor
ridgeview excelsior Clinic ridgeview Clinics
FArMIngton
Allina Medical Clinic Allina Medical Clinic
Fairview Farmington Clinic Fairview Health services
FamilyHealth Medical Clinic FamilyHealth Medical Clinics
Farmington Clinic Farmington Clinic
Forest lAke
Allina Medical Clinic Allina Medical Clinic
FrIdley
Fairview Fridley Clinic Fairview Health services
Multicare Associates- Multicare Associates Fridley Medical Center
golden vAlley
north Memorial Clinic- north Memorial golden valley Physicians
Park nicollet Clinic Park nicollet Health services
81% 69%-92% 31% 62% 8% sample 65 82% 64%-92% 90% 81%-95% n/A 90% 10% total Population 81 90% 82%-95%
76% 71%-81% 28% 65% 8% sample 650 76% 71%-81% 91% 90%-93% n/A 82% 18% total Population 1562 92% 90%-93%
74% 68%-79% 36% 55% 9% sample 616 74% 68%-78% 93% 91%-94% n/A 77% 23% total Population 1237 93% 91%-94%
* * * * * * * * * * * n/A * * * * * *
* * * * * * * * * * * n/A * * * * * *
76% 71%-81% 28% 65% 8% sample 650 76% 71%-81% 91% 90%-93% n/A 82% 18% total Population 1562 92% 90%-93%
* * * * * * * * * * * n/A * * * * * *
56% 28%-85% 50% 41% 9% sample 68 65% 42%-82% 91% 84%-95% n/A 75% 25% total Population 105 90% 83%-95%
54% 29%-78% 37% 52% 11% sample 120 54% 34%-74% 94% 89%-97% n/A 83% 17% total Population 159 94% 90%-97%
78% 73%-83% 28% 66% 6% sample 425 78% 72%-83% 92% 90%-94% n/A 90% 10% total Population 1226 93% 92%-94%
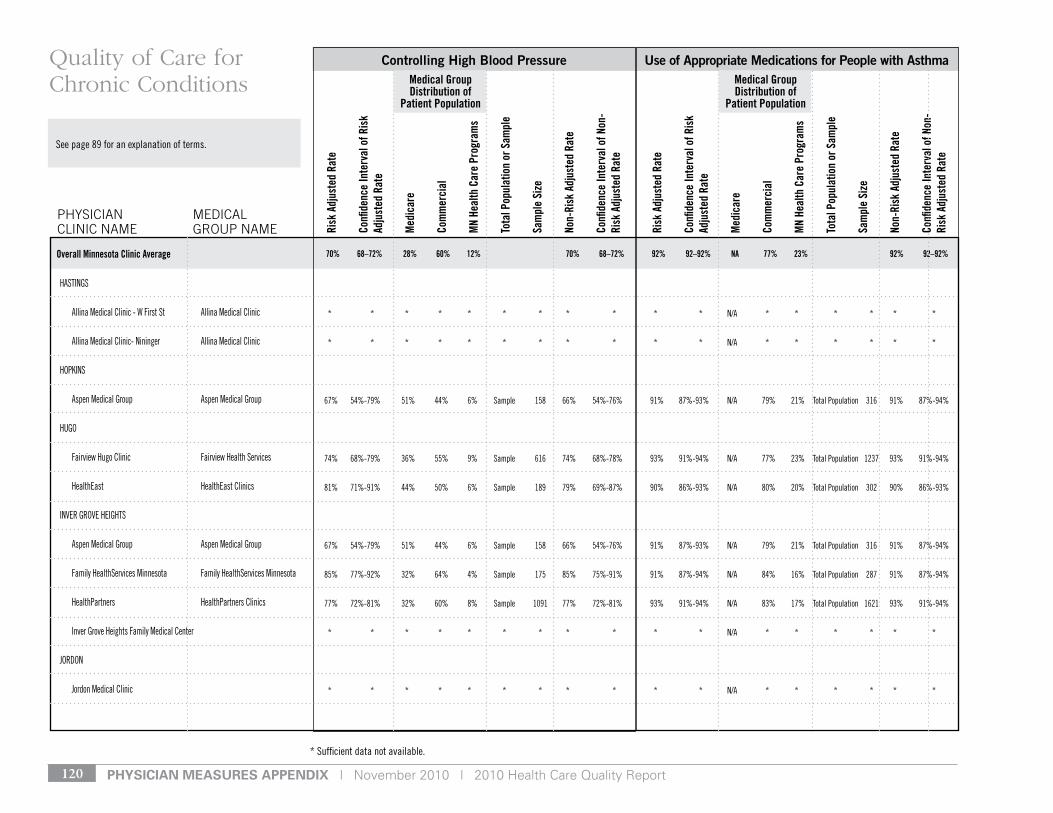
pHysiCian Measures appenDiX | November 2010 | 2010 Health Care Quality Report120
* sufficient data not available.
see page 89 for an explanation of terms.
Risk
Adj
uste
d Ra
te
Confi
denc
e In
terv
al o
f Ris
k Ad
just
ed R
ate
Med
icar
e
Com
mer
cial
MN
Heal
th C
are
Prog
ram
s
Tota
l Pop
ulat
ion
or S
ampl
e
Sam
ple
Size
Non-
Risk
Adj
uste
d Ra
te
Confi
denc
e In
terv
al o
f Non
-Ri
sk A
djus
ted
Rate
Risk
Adj
uste
d Ra
te
Confi
denc
e In
terv
al o
f Ris
k Ad
just
ed R
ate
Med
icar
e
Com
mer
cial
MN
Heal
th C
are
Prog
ram
s
Tota
l Pop
ulat
ion
or S
ampl
e
Sam
ple
Size
Non-
Risk
Adj
uste
d Ra
te
Confi
denc
e In
terv
al o
f Non
-Ri
sk A
djus
ted
Rate
Controlling High Blood Pressure Use of Appropriate Medications for People with Asthma
PHySIcIAN cLINIc NAME
MEdIcAL GrOuP NAME
Quality of Care for Chronic Conditions
70% 68–72% 28% 60% 12% 70% 68–72% 92% 92–92% NA 77% 23% 92% 92–92%Overall Minnesota Clinic Average
Medical Group Distribution of
Patient Population
Medical Group Distribution of
Patient Population
HAstIngs
Allina Medical Clinic - W First st Allina Medical Clinic
Allina Medical Clinic- nininger Allina Medical Clinic
HoPkIns
Aspen Medical group Aspen Medical group
Hugo
Fairview Hugo Clinic Fairview Health services
Healtheast Healtheast Clinics
Inver grove HeIgHts
Aspen Medical group Aspen Medical group
Family Healthservices Minnesota Family Healthservices Minnesota
HealthPartners HealthPartners Clinics
Inver grove Heights Family Medical Center
Jordon
Jordon Medical Clinic
* * * * * * * * * * * n/A * * * * * *
* * * * * * * * * * * n/A * * * * * *
67% 54%-79% 51% 44% 6% sample 158 66% 54%-76% 91% 87%-93% n/A 79% 21% total Population 316 91% 87%-94%
74% 68%-79% 36% 55% 9% sample 616 74% 68%-78% 93% 91%-94% n/A 77% 23% total Population 1237 93% 91%-94%
81% 71%-91% 44% 50% 6% sample 189 79% 69%-87% 90% 86%-93% n/A 80% 20% total Population 302 90% 86%-93%
67% 54%-79% 51% 44% 6% sample 158 66% 54%-76% 91% 87%-93% n/A 79% 21% total Population 316 91% 87%-94%
85% 77%-92% 32% 64% 4% sample 175 85% 75%-91% 91% 87%-94% n/A 84% 16% total Population 287 91% 87%-94%
77% 72%-81% 32% 60% 8% sample 1091 77% 72%-81% 93% 91%-94% n/A 83% 17% total Population 1621 93% 91%-94%
* * * * * * * * * * * n/A * * * * * *
* * * * * * * * * * * n/A * * * * * *
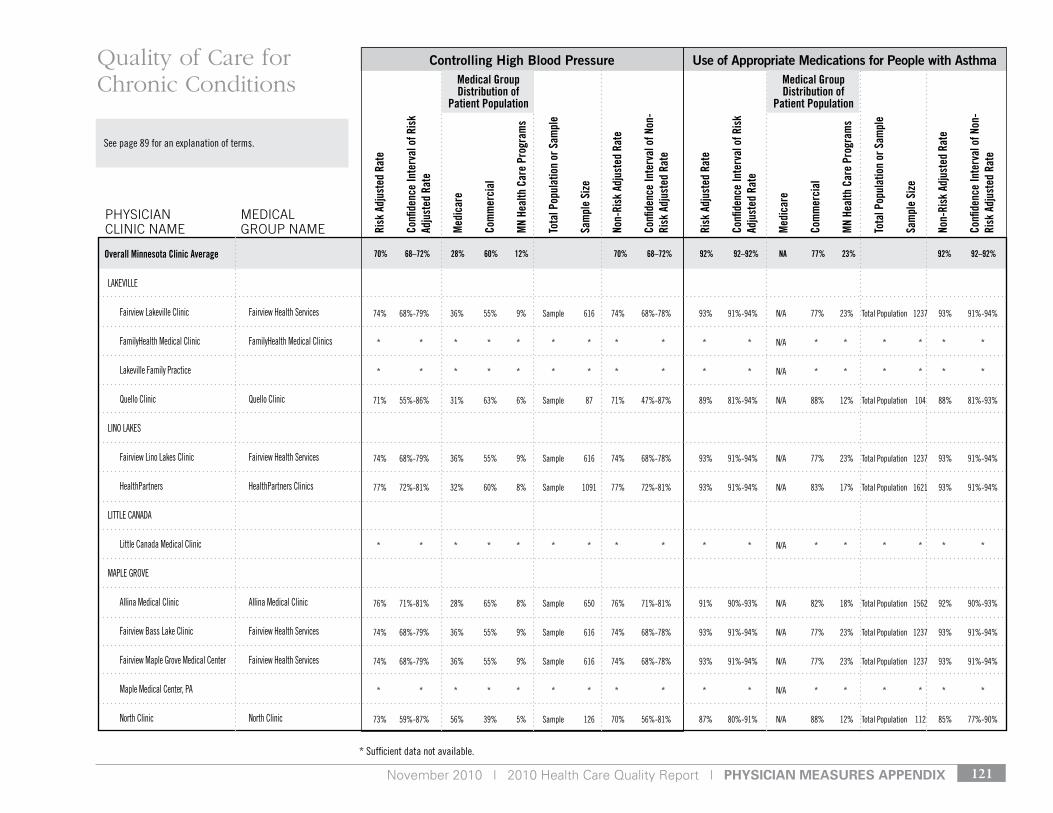
November 2010 | 2010 Health Care Quality Report | pHysiCian Measures appenDiX 121
* sufficient data not available.
see page 89 for an explanation of terms.
Risk
Adj
uste
d Ra
te
Confi
denc
e In
terv
al o
f Ris
k Ad
just
ed R
ate
Med
icar
e
Com
mer
cial
MN
Heal
th C
are
Prog
ram
s
Tota
l Pop
ulat
ion
or S
ampl
e
Sam
ple
Size
Non-
Risk
Adj
uste
d Ra
te
Confi
denc
e In
terv
al o
f Non
-Ri
sk A
djus
ted
Rate
Risk
Adj
uste
d Ra
te
Confi
denc
e In
terv
al o
f Ris
k Ad
just
ed R
ate
Med
icar
e
Com
mer
cial
MN
Heal
th C
are
Prog
ram
s
Tota
l Pop
ulat
ion
or S
ampl
e
Sam
ple
Size
Non-
Risk
Adj
uste
d Ra
te
Confi
denc
e In
terv
al o
f Non
-Ri
sk A
djus
ted
Rate
Controlling High Blood Pressure Use of Appropriate Medications for People with Asthma
PHySIcIAN cLINIc NAME
MEdIcAL GrOuP NAME
Quality of Care for Chronic Conditions
70% 68–72% 28% 60% 12% 70% 68–72% 92% 92–92% NA 77% 23% 92% 92–92%Overall Minnesota Clinic Average
Medical Group Distribution of
Patient Population
Medical Group Distribution of
Patient Population
lAkevIlle
Fairview lakeville Clinic Fairview Health services
FamilyHealth Medical Clinic FamilyHealth Medical Clinics
lakeville Family Practice
Quello Clinic Quello Clinic
lIno lAkes
Fairview lino lakes Clinic Fairview Health services
HealthPartners HealthPartners Clinics
lIttle CAnAdA
little Canada Medical Clinic
MAPle grove
Allina Medical Clinic Allina Medical Clinic
Fairview Bass lake Clinic Fairview Health services
Fairview Maple grove Medical Center Fairview Health services
Maple Medical Center, PA
north Clinic north Clinic
74% 68%-79% 36% 55% 9% sample 616 74% 68%-78% 93% 91%-94% n/A 77% 23% total Population 1237 93% 91%-94%
* * * * * * * * * * * n/A * * * * * *
* * * * * * * * * * * n/A * * * * * *
71% 55%-86% 31% 63% 6% sample 87 71% 47%-87% 89% 81%-94% n/A 88% 12% total Population 104 88% 81%-93%
74% 68%-79% 36% 55% 9% sample 616 74% 68%-78% 93% 91%-94% n/A 77% 23% total Population 1237 93% 91%-94%
77% 72%-81% 32% 60% 8% sample 1091 77% 72%-81% 93% 91%-94% n/A 83% 17% total Population 1621 93% 91%-94%
* * * * * * * * * * * n/A * * * * * *
76% 71%-81% 28% 65% 8% sample 650 76% 71%-81% 91% 90%-93% n/A 82% 18% total Population 1562 92% 90%-93%
74% 68%-79% 36% 55% 9% sample 616 74% 68%-78% 93% 91%-94% n/A 77% 23% total Population 1237 93% 91%-94%
74% 68%-79% 36% 55% 9% sample 616 74% 68%-78% 93% 91%-94% n/A 77% 23% total Population 1237 93% 91%-94%
* * * * * * * * * * * n/A * * * * * *
73% 59%-87% 56% 39% 5% sample 126 70% 56%-81% 87% 80%-91% n/A 88% 12% total Population 112 85% 77%-90%
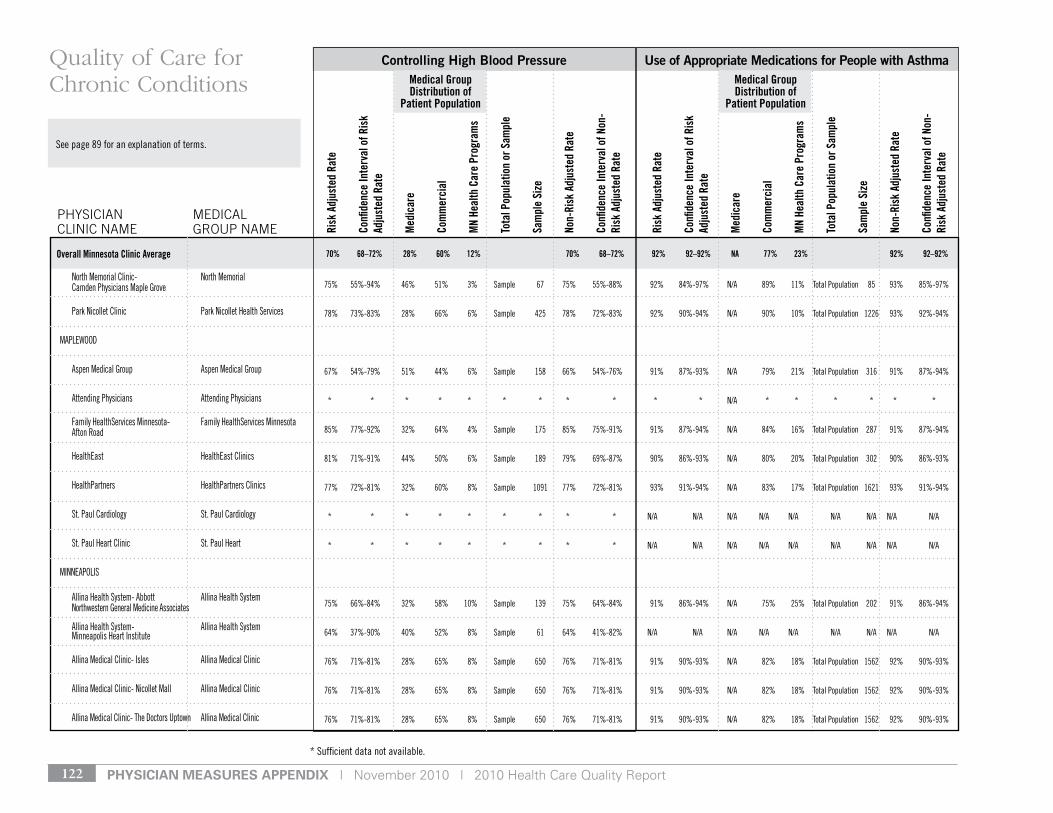
pHysiCian Measures appenDiX | November 2010 | 2010 Health Care Quality Report122
* sufficient data not available.
see page 89 for an explanation of terms.
Risk
Adj
uste
d Ra
te
Confi
denc
e In
terv
al o
f Ris
k Ad
just
ed R
ate
Med
icar
e
Com
mer
cial
MN
Heal
th C
are
Prog
ram
s
Tota
l Pop
ulat
ion
or S
ampl
e
Sam
ple
Size
Non-
Risk
Adj
uste
d Ra
te
Confi
denc
e In
terv
al o
f Non
-Ri
sk A
djus
ted
Rate
Risk
Adj
uste
d Ra
te
Confi
denc
e In
terv
al o
f Ris
k Ad
just
ed R
ate
Med
icar
e
Com
mer
cial
MN
Heal
th C
are
Prog
ram
s
Tota
l Pop
ulat
ion
or S
ampl
e
Sam
ple
Size
Non-
Risk
Adj
uste
d Ra
te
Confi
denc
e In
terv
al o
f Non
-Ri
sk A
djus
ted
Rate
Controlling High Blood Pressure Use of Appropriate Medications for People with Asthma
PHySIcIAN cLINIc NAME
MEdIcAL GrOuP NAME
Quality of Care for Chronic Conditions
70% 68–72% 28% 60% 12% 70% 68–72% 92% 92–92% NA 77% 23% 92% 92–92%Overall Minnesota Clinic Average
Medical Group Distribution of
Patient Population
Medical Group Distribution of
Patient Population
north Memorial Clinic- north Memorial Camden Physicians Maple grove
Park nicollet Clinic Park nicollet Health services
MAPleWood
Aspen Medical group Aspen Medical group
Attending Physicians Attending Physicians
Family Healthservices Minnesota- Family Healthservices Minnesota Afton road
Healtheast Healtheast Clinics
HealthPartners HealthPartners Clinics
st. Paul Cardiology st. Paul Cardiology
st. Paul Heart Clinic st. Paul Heart
MInneAPolIs
Allina Health system- Abbott Allina Health system northwestern general Medicine Associates
Allina Health system- Allina Health system Minneapolis Heart Institute
Allina Medical Clinic- Isles Allina Medical Clinic
Allina Medical Clinic- nicollet Mall Allina Medical Clinic
Allina Medical Clinic- the doctors uptown Allina Medical Clinic
75% 55%-94% 46% 51% 3% sample 67 75% 55%-88% 92% 84%-97% n/A 89% 11% total Population 85 93% 85%-97%
78% 73%-83% 28% 66% 6% sample 425 78% 72%-83% 92% 90%-94% n/A 90% 10% total Population 1226 93% 92%-94%
67% 54%-79% 51% 44% 6% sample 158 66% 54%-76% 91% 87%-93% n/A 79% 21% total Population 316 91% 87%-94%
* * * * * * * * * * * n/A * * * * * *
85% 77%-92% 32% 64% 4% sample 175 85% 75%-91% 91% 87%-94% n/A 84% 16% total Population 287 91% 87%-94%
81% 71%-91% 44% 50% 6% sample 189 79% 69%-87% 90% 86%-93% n/A 80% 20% total Population 302 90% 86%-93%
77% 72%-81% 32% 60% 8% sample 1091 77% 72%-81% 93% 91%-94% n/A 83% 17% total Population 1621 93% 91%-94%
* * * * * * * * * n/A n/A n/A n/A n/A n/A n/A n/A n/A
* * * * * * * * * n/A n/A n/A n/A n/A n/A n/A n/A n/A
75% 66%-84% 32% 58% 10% sample 139 75% 64%-84% 91% 86%-94% n/A 75% 25% total Population 202 91% 86%-94%
64% 37%-90% 40% 52% 8% sample 61 64% 41%-82% n/A n/A n/A n/A n/A n/A n/A n/A n/A
76% 71%-81% 28% 65% 8% sample 650 76% 71%-81% 91% 90%-93% n/A 82% 18% total Population 1562 92% 90%-93%
76% 71%-81% 28% 65% 8% sample 650 76% 71%-81% 91% 90%-93% n/A 82% 18% total Population 1562 92% 90%-93%
76% 71%-81% 28% 65% 8% sample 650 76% 71%-81% 91% 90%-93% n/A 82% 18% total Population 1562 92% 90%-93%
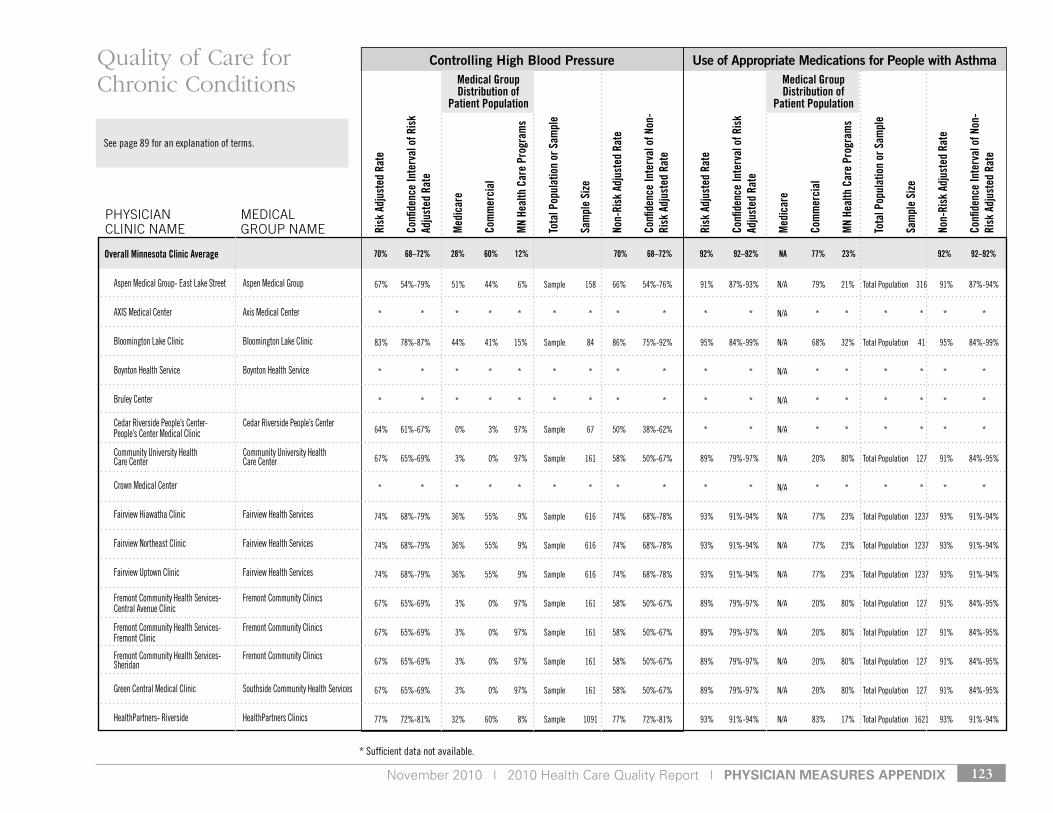
November 2010 | 2010 Health Care Quality Report | pHysiCian Measures appenDiX 123
* sufficient data not available.
see page 89 for an explanation of terms.
Risk
Adj
uste
d Ra
te
Confi
denc
e In
terv
al o
f Ris
k Ad
just
ed R
ate
Med
icar
e
Com
mer
cial
MN
Heal
th C
are
Prog
ram
s
Tota
l Pop
ulat
ion
or S
ampl
e
Sam
ple
Size
Non-
Risk
Adj
uste
d Ra
te
Confi
denc
e In
terv
al o
f Non
-Ri
sk A
djus
ted
Rate
Risk
Adj
uste
d Ra
te
Confi
denc
e In
terv
al o
f Ris
k Ad
just
ed R
ate
Med
icar
e
Com
mer
cial
MN
Heal
th C
are
Prog
ram
s
Tota
l Pop
ulat
ion
or S
ampl
e
Sam
ple
Size
Non-
Risk
Adj
uste
d Ra
te
Confi
denc
e In
terv
al o
f Non
-Ri
sk A
djus
ted
Rate
Controlling High Blood Pressure Use of Appropriate Medications for People with Asthma
PHySIcIAN cLINIc NAME
MEdIcAL GrOuP NAME
Quality of Care for Chronic Conditions
70% 68–72% 28% 60% 12% 70% 68–72% 92% 92–92% NA 77% 23% 92% 92–92%Overall Minnesota Clinic Average
Medical Group Distribution of
Patient Population
Medical Group Distribution of
Patient Population
Aspen Medical group- east lake street Aspen Medical group
AXIs Medical Center Axis Medical Center
Bloomington lake Clinic Bloomington lake Clinic
Boynton Health service Boynton Health service
Bruley Center
Cedar riverside People’s Center- Cedar riverside People’s Center People’s Center Medical Clinic
Community university Health Community university Health Care Center Care Center
Crown Medical Center
Fairview Hiawatha Clinic Fairview Health services
Fairview northeast Clinic Fairview Health services
Fairview uptown Clinic Fairview Health services
Fremont Community Health services- Fremont Community Clinics Central Avenue Clinic
Fremont Community Health services- Fremont Community Clinics Fremont Clinic
Fremont Community Health services- Fremont Community Clinics sheridan
green Central Medical Clinic southside Community Health services
HealthPartners- riverside HealthPartners Clinics
67% 54%-79% 51% 44% 6% sample 158 66% 54%-76% 91% 87%-93% n/A 79% 21% total Population 316 91% 87%-94%
* * * * * * * * * * * n/A * * * * * *
83% 78%-87% 44% 41% 15% sample 84 86% 75%-92% 95% 84%-99% n/A 68% 32% total Population 41 95% 84%-99%
* * * * * * * * * * * n/A * * * * * *
* * * * * * * * * * * n/A * * * * * *
64% 61%-67% 0% 3% 97% sample 67 50% 38%-62% * * n/A * * * * * *
67% 65%-69% 3% 0% 97% sample 161 58% 50%-67% 89% 79%-97% n/A 20% 80% total Population 127 91% 84%-95%
* * * * * * * * * * * n/A * * * * * *
74% 68%-79% 36% 55% 9% sample 616 74% 68%-78% 93% 91%-94% n/A 77% 23% total Population 1237 93% 91%-94%
74% 68%-79% 36% 55% 9% sample 616 74% 68%-78% 93% 91%-94% n/A 77% 23% total Population 1237 93% 91%-94%
74% 68%-79% 36% 55% 9% sample 616 74% 68%-78% 93% 91%-94% n/A 77% 23% total Population 1237 93% 91%-94%
67% 65%-69% 3% 0% 97% sample 161 58% 50%-67% 89% 79%-97% n/A 20% 80% total Population 127 91% 84%-95%
67% 65%-69% 3% 0% 97% sample 161 58% 50%-67% 89% 79%-97% n/A 20% 80% total Population 127 91% 84%-95%
67% 65%-69% 3% 0% 97% sample 161 58% 50%-67% 89% 79%-97% n/A 20% 80% total Population 127 91% 84%-95%
67% 65%-69% 3% 0% 97% sample 161 58% 50%-67% 89% 79%-97% n/A 20% 80% total Population 127 91% 84%-95%
77% 72%-81% 32% 60% 8% sample 1091 77% 72%-81% 93% 91%-94% n/A 83% 17% total Population 1621 93% 91%-94%
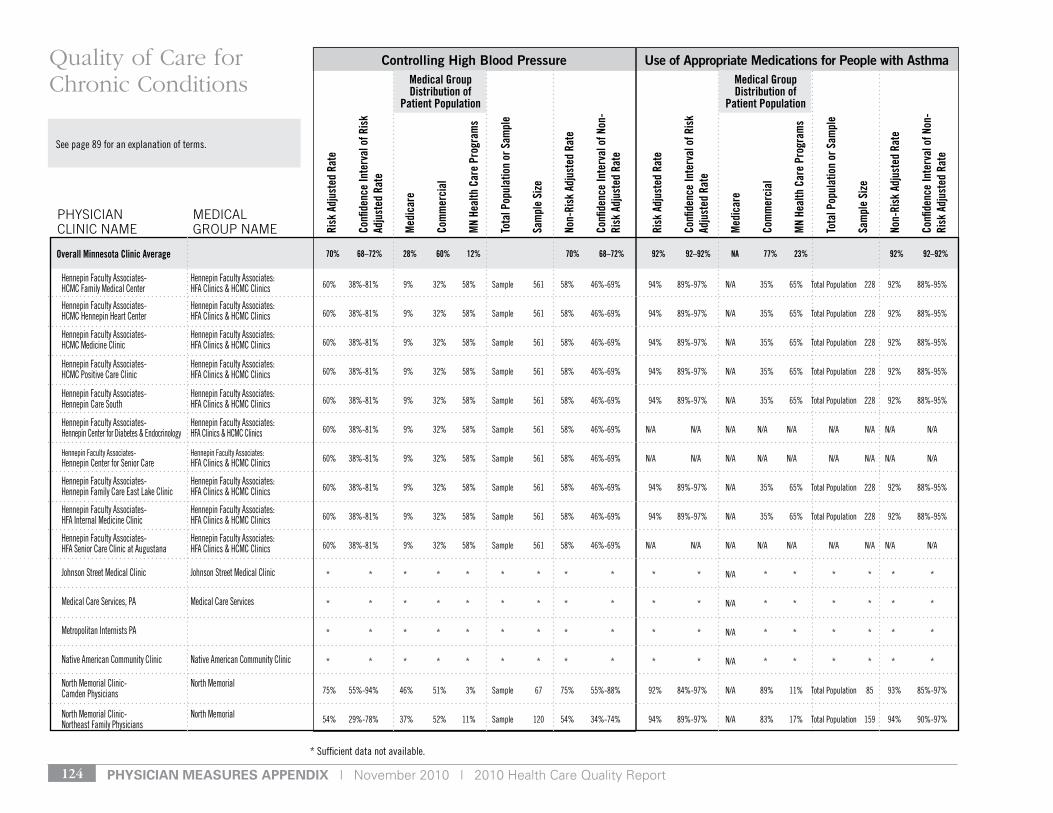
pHysiCian Measures appenDiX | November 2010 | 2010 Health Care Quality Report124
* sufficient data not available.
see page 89 for an explanation of terms.
Risk
Adj
uste
d Ra
te
Confi
denc
e In
terv
al o
f Ris
k Ad
just
ed R
ate
Med
icar
e
Com
mer
cial
MN
Heal
th C
are
Prog
ram
s
Tota
l Pop
ulat
ion
or S
ampl
e
Sam
ple
Size
Non-
Risk
Adj
uste
d Ra
te
Confi
denc
e In
terv
al o
f Non
-Ri
sk A
djus
ted
Rate
Risk
Adj
uste
d Ra
te
Confi
denc
e In
terv
al o
f Ris
k Ad
just
ed R
ate
Med
icar
e
Com
mer
cial
MN
Heal
th C
are
Prog
ram
s
Tota
l Pop
ulat
ion
or S
ampl
e
Sam
ple
Size
Non-
Risk
Adj
uste
d Ra
te
Confi
denc
e In
terv
al o
f Non
-Ri
sk A
djus
ted
Rate
Controlling High Blood Pressure Use of Appropriate Medications for People with Asthma
PHySIcIAN cLINIc NAME
MEdIcAL GrOuP NAME
Quality of Care for Chronic Conditions
70% 68–72% 28% 60% 12% 70% 68–72% 92% 92–92% NA 77% 23% 92% 92–92%Overall Minnesota Clinic Average
Medical Group Distribution of
Patient Population
Medical Group Distribution of
Patient Population
Hennepin Faculty Associates- Hennepin Faculty Associates: HCMC Family Medical Center HFA Clinics & HCMC Clinics
Hennepin Faculty Associates- Hennepin Faculty Associates: HCMC Hennepin Heart Center HFA Clinics & HCMC Clinics
Hennepin Faculty Associates- Hennepin Faculty Associates: HCMC Medicine Clinic HFA Clinics & HCMC Clinics
Hennepin Faculty Associates- Hennepin Faculty Associates: HCMC Positive Care Clinic HFA Clinics & HCMC Clinics
Hennepin Faculty Associates- Hennepin Faculty Associates: Hennepin Care south HFA Clinics & HCMC Clinics
Hennepin Faculty Associates- Hennepin Faculty Associates: Hennepin Center for diabetes & endocrinology HFA Clinics & HCMC Clinics
Hennepin Faculty Associates- Hennepin Faculty Associates: Hennepin Center for senior Care HFA Clinics & HCMC Clinics
Hennepin Faculty Associates- Hennepin Faculty Associates: Hennepin Family Care east lake Clinic HFA Clinics & HCMC Clinics
Hennepin Faculty Associates- Hennepin Faculty Associates: HFA Internal Medicine Clinic HFA Clinics & HCMC Clinics
Hennepin Faculty Associates- Hennepin Faculty Associates: HFA senior Care Clinic at Augustana HFA Clinics & HCMC Clinics
Johnson street Medical Clinic Johnson street Medical Clinic
Medical Care services, PA Medical Care services
Metropolitan Internists PA
native American Community Clinic native American Community Clinic
north Memorial Clinic- north Memorial Camden Physicians
north Memorial Clinic- north Memorial northeast Family Physicians
60% 38%-81% 9% 32% 58% sample 561 58% 46%-69% 94% 89%-97% n/A 35% 65% total Population 228 92% 88%-95%
60% 38%-81% 9% 32% 58% sample 561 58% 46%-69% 94% 89%-97% n/A 35% 65% total Population 228 92% 88%-95%
60% 38%-81% 9% 32% 58% sample 561 58% 46%-69% 94% 89%-97% n/A 35% 65% total Population 228 92% 88%-95%
60% 38%-81% 9% 32% 58% sample 561 58% 46%-69% 94% 89%-97% n/A 35% 65% total Population 228 92% 88%-95%
60% 38%-81% 9% 32% 58% sample 561 58% 46%-69% 94% 89%-97% n/A 35% 65% total Population 228 92% 88%-95%
60% 38%-81% 9% 32% 58% sample 561 58% 46%-69% n/A n/A n/A n/A n/A n/A n/A n/A n/A
60% 38%-81% 9% 32% 58% sample 561 58% 46%-69% n/A n/A n/A n/A n/A n/A n/A n/A n/A
60% 38%-81% 9% 32% 58% sample 561 58% 46%-69% 94% 89%-97% n/A 35% 65% total Population 228 92% 88%-95%
60% 38%-81% 9% 32% 58% sample 561 58% 46%-69% 94% 89%-97% n/A 35% 65% total Population 228 92% 88%-95%
60% 38%-81% 9% 32% 58% sample 561 58% 46%-69% n/A n/A n/A n/A n/A n/A n/A n/A n/A
* * * * * * * * * * * n/A * * * * * *
* * * * * * * * * * * n/A * * * * * *
* * * * * * * * * * * n/A * * * * * *
* * * * * * * * * * * n/A * * * * * *
75% 55%-94% 46% 51% 3% sample 67 75% 55%-88% 92% 84%-97% n/A 89% 11% total Population 85 93% 85%-97%
54% 29%-78% 37% 52% 11% sample 120 54% 34%-74% 94% 89%-97% n/A 83% 17% total Population 159 94% 90%-97%
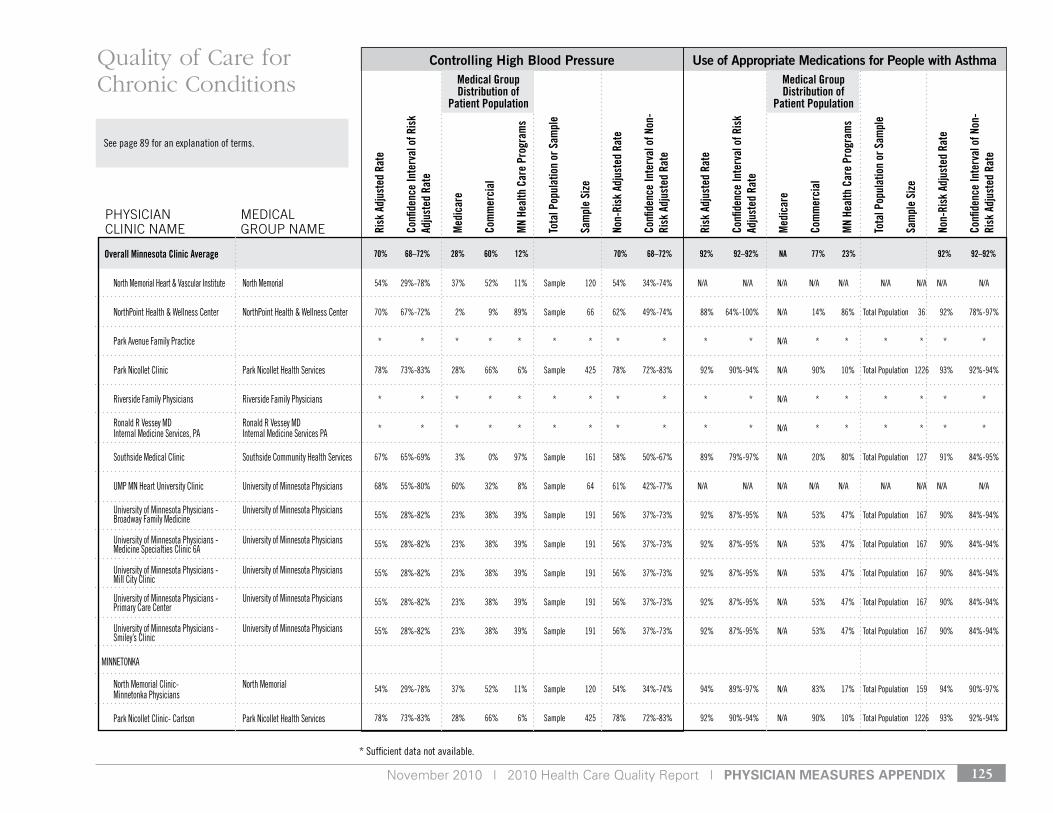
November 2010 | 2010 Health Care Quality Report | pHysiCian Measures appenDiX 125
* sufficient data not available.
see page 89 for an explanation of terms.
Risk
Adj
uste
d Ra
te
Confi
denc
e In
terv
al o
f Ris
k Ad
just
ed R
ate
Med
icar
e
Com
mer
cial
MN
Heal
th C
are
Prog
ram
s
Tota
l Pop
ulat
ion
or S
ampl
e
Sam
ple
Size
Non-
Risk
Adj
uste
d Ra
te
Confi
denc
e In
terv
al o
f Non
-Ri
sk A
djus
ted
Rate
Risk
Adj
uste
d Ra
te
Confi
denc
e In
terv
al o
f Ris
k Ad
just
ed R
ate
Med
icar
e
Com
mer
cial
MN
Heal
th C
are
Prog
ram
s
Tota
l Pop
ulat
ion
or S
ampl
e
Sam
ple
Size
Non-
Risk
Adj
uste
d Ra
te
Confi
denc
e In
terv
al o
f Non
-Ri
sk A
djus
ted
Rate
Controlling High Blood Pressure Use of Appropriate Medications for People with Asthma
PHySIcIAN cLINIc NAME
MEdIcAL GrOuP NAME
Quality of Care for Chronic Conditions
70% 68–72% 28% 60% 12% 70% 68–72% 92% 92–92% NA 77% 23% 92% 92–92%Overall Minnesota Clinic Average
Medical Group Distribution of
Patient Population
Medical Group Distribution of
Patient Population
north Memorial Heart & vascular Institute north Memorial
northPoint Health & Wellness Center northPoint Health & Wellness Center
Park Avenue Family Practice
Park nicollet Clinic Park nicollet Health services
riverside Family Physicians riverside Family Physicians
ronald r vessey Md ronald r vessey Md Internal Medicine services, PA Internal Medicine services PA
southside Medical Clinic southside Community Health services
uMP Mn Heart university Clinic university of Minnesota Physicians
university of Minnesota Physicians - university of Minnesota Physicians Broadway Family Medicine
university of Minnesota Physicians - university of Minnesota Physicians Medicine specialties Clinic 6A
university of Minnesota Physicians - university of Minnesota Physicians Mill City Clinic
university of Minnesota Physicians - university of Minnesota Physicians Primary Care Center
university of Minnesota Physicians - university of Minnesota Physicians smiley’s Clinic
MInnetonkA
north Memorial Clinic- north Memorial Minnetonka Physicians
Park nicollet Clinic- Carlson Park nicollet Health services
54% 29%-78% 37% 52% 11% sample 120 54% 34%-74% n/A n/A n/A n/A n/A n/A n/A n/A n/A
70% 67%-72% 2% 9% 89% sample 66 62% 49%-74% 88% 64%-100% n/A 14% 86% total Population 36 92% 78%-97%
* * * * * * * * * * * n/A * * * * * *
78% 73%-83% 28% 66% 6% sample 425 78% 72%-83% 92% 90%-94% n/A 90% 10% total Population 1226 93% 92%-94%
* * * * * * * * * * * n/A * * * * * *
* * * * * * * * * * * n/A * * * * * *
67% 65%-69% 3% 0% 97% sample 161 58% 50%-67% 89% 79%-97% n/A 20% 80% total Population 127 91% 84%-95%
68% 55%-80% 60% 32% 8% sample 64 61% 42%-77% n/A n/A n/A n/A n/A n/A n/A n/A n/A
55% 28%-82% 23% 38% 39% sample 191 56% 37%-73% 92% 87%-95% n/A 53% 47% total Population 167 90% 84%-94%
55% 28%-82% 23% 38% 39% sample 191 56% 37%-73% 92% 87%-95% n/A 53% 47% total Population 167 90% 84%-94%
55% 28%-82% 23% 38% 39% sample 191 56% 37%-73% 92% 87%-95% n/A 53% 47% total Population 167 90% 84%-94%
55% 28%-82% 23% 38% 39% sample 191 56% 37%-73% 92% 87%-95% n/A 53% 47% total Population 167 90% 84%-94%
55% 28%-82% 23% 38% 39% sample 191 56% 37%-73% 92% 87%-95% n/A 53% 47% total Population 167 90% 84%-94%
54% 29%-78% 37% 52% 11% sample 120 54% 34%-74% 94% 89%-97% n/A 83% 17% total Population 159 94% 90%-97%
78% 73%-83% 28% 66% 6% sample 425 78% 72%-83% 92% 90%-94% n/A 90% 10% total Population 1226 93% 92%-94%
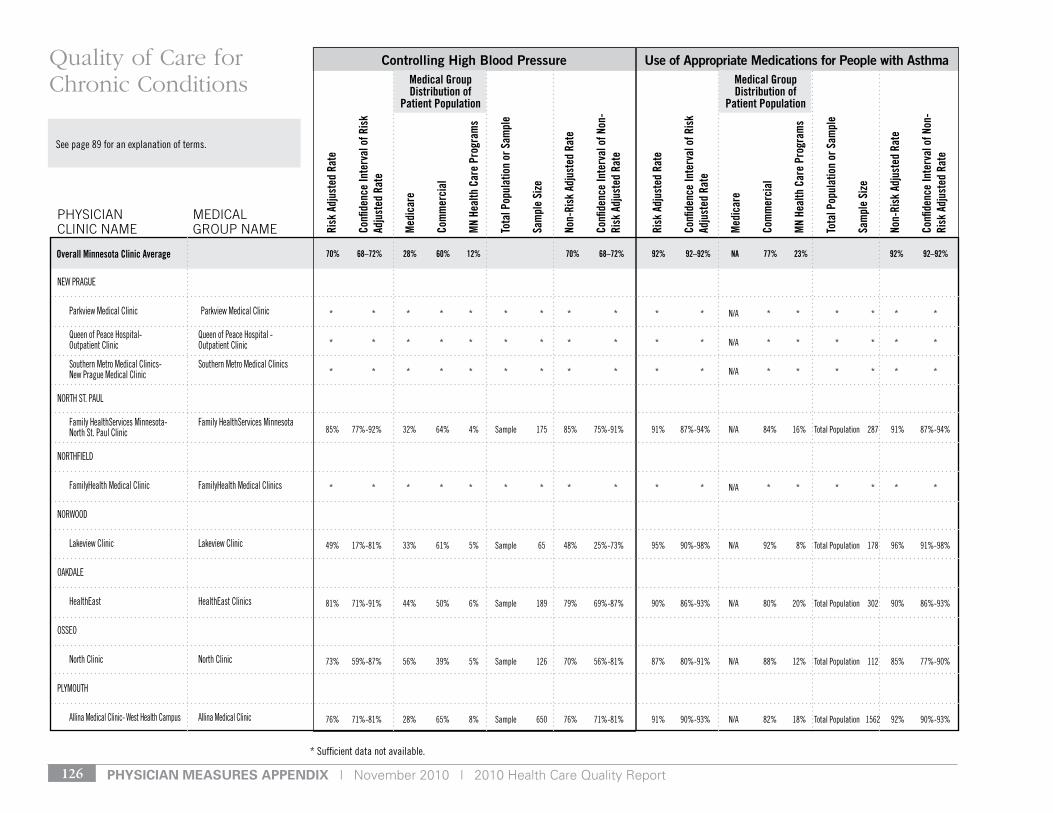
pHysiCian Measures appenDiX | November 2010 | 2010 Health Care Quality Report126
* sufficient data not available.
see page 89 for an explanation of terms.
Risk
Adj
uste
d Ra
te
Confi
denc
e In
terv
al o
f Ris
k Ad
just
ed R
ate
Med
icar
e
Com
mer
cial
MN
Heal
th C
are
Prog
ram
s
Tota
l Pop
ulat
ion
or S
ampl
e
Sam
ple
Size
Non-
Risk
Adj
uste
d Ra
te
Confi
denc
e In
terv
al o
f Non
-Ri
sk A
djus
ted
Rate
Risk
Adj
uste
d Ra
te
Confi
denc
e In
terv
al o
f Ris
k Ad
just
ed R
ate
Med
icar
e
Com
mer
cial
MN
Heal
th C
are
Prog
ram
s
Tota
l Pop
ulat
ion
or S
ampl
e
Sam
ple
Size
Non-
Risk
Adj
uste
d Ra
te
Confi
denc
e In
terv
al o
f Non
-Ri
sk A
djus
ted
Rate
Controlling High Blood Pressure Use of Appropriate Medications for People with Asthma
PHySIcIAN cLINIc NAME
MEdIcAL GrOuP NAME
Quality of Care for Chronic Conditions
70% 68–72% 28% 60% 12% 70% 68–72% 92% 92–92% NA 77% 23% 92% 92–92%Overall Minnesota Clinic Average
Medical Group Distribution of
Patient Population
Medical Group Distribution of
Patient Population
neW PrAgue
Parkview Medical Clinic Parkview Medical Clinic
Queen of Peace Hospital- Queen of Peace Hospital - outpatient Clinic outpatient Clinic
southern Metro Medical Clinics- southern Metro Medical Clinics new Prague Medical Clinic
nortH st. PAul
Family Healthservices Minnesota- Family Healthservices Minnesota north st. Paul Clinic
nortHFIeld
FamilyHealth Medical Clinic FamilyHealth Medical Clinics
norWood
lakeview Clinic lakeview Clinic
oAkdAle
Healtheast Healtheast Clinics
osseo
north Clinic north Clinic
PlyMoutH
Allina Medical Clinic- West Health Campus Allina Medical Clinic
* * * * * * * * * * * n/A * * * * * *
* * * * * * * * * * * n/A * * * * * *
* * * * * * * * * * * n/A * * * * * *
85% 77%-92% 32% 64% 4% sample 175 85% 75%-91% 91% 87%-94% n/A 84% 16% total Population 287 91% 87%-94%
* * * * * * * * * * * n/A * * * * * *
49% 17%-81% 33% 61% 5% sample 65 48% 25%-73% 95% 90%-98% n/A 92% 8% total Population 178 96% 91%-98%
81% 71%-91% 44% 50% 6% sample 189 79% 69%-87% 90% 86%-93% n/A 80% 20% total Population 302 90% 86%-93%
73% 59%-87% 56% 39% 5% sample 126 70% 56%-81% 87% 80%-91% n/A 88% 12% total Population 112 85% 77%-90%
76% 71%-81% 28% 65% 8% sample 650 76% 71%-81% 91% 90%-93% n/A 82% 18% total Population 1562 92% 90%-93%
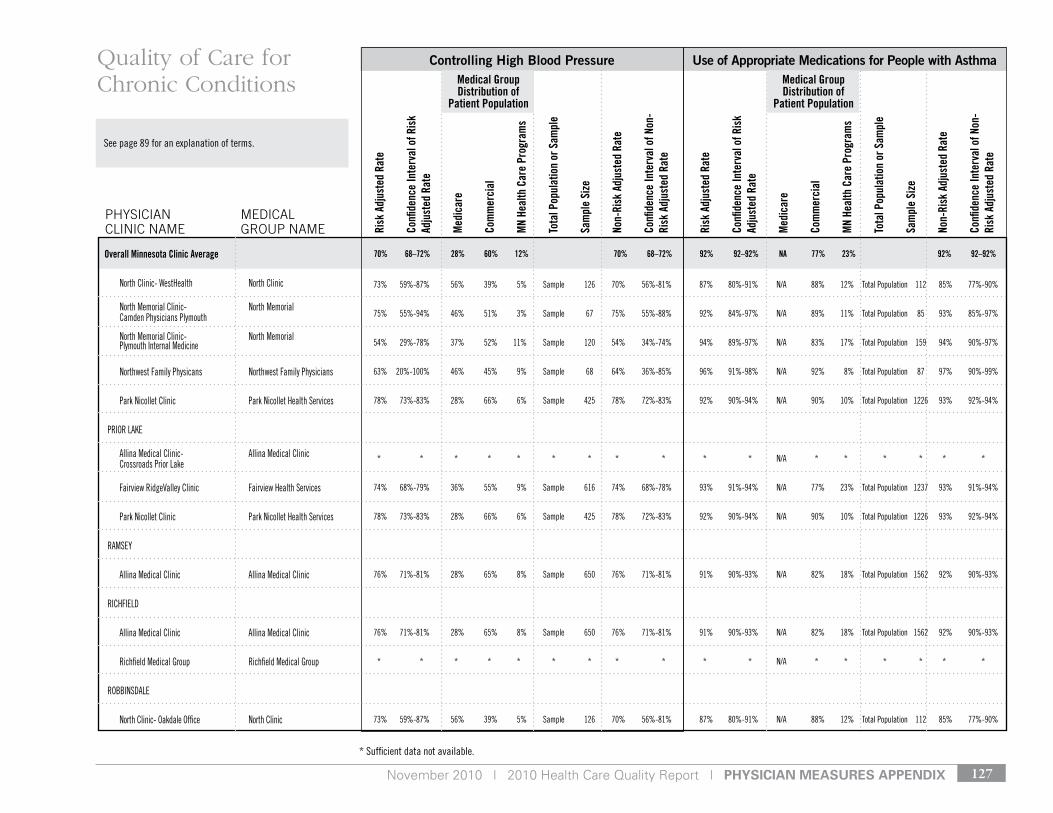
November 2010 | 2010 Health Care Quality Report | pHysiCian Measures appenDiX 127
* sufficient data not available.
see page 89 for an explanation of terms.
Risk
Adj
uste
d Ra
te
Confi
denc
e In
terv
al o
f Ris
k Ad
just
ed R
ate
Med
icar
e
Com
mer
cial
MN
Heal
th C
are
Prog
ram
s
Tota
l Pop
ulat
ion
or S
ampl
e
Sam
ple
Size
Non-
Risk
Adj
uste
d Ra
te
Confi
denc
e In
terv
al o
f Non
-Ri
sk A
djus
ted
Rate
Risk
Adj
uste
d Ra
te
Confi
denc
e In
terv
al o
f Ris
k Ad
just
ed R
ate
Med
icar
e
Com
mer
cial
MN
Heal
th C
are
Prog
ram
s
Tota
l Pop
ulat
ion
or S
ampl
e
Sam
ple
Size
Non-
Risk
Adj
uste
d Ra
te
Confi
denc
e In
terv
al o
f Non
-Ri
sk A
djus
ted
Rate
Controlling High Blood Pressure Use of Appropriate Medications for People with Asthma
PHySIcIAN cLINIc NAME
MEdIcAL GrOuP NAME
Quality of Care for Chronic Conditions
70% 68–72% 28% 60% 12% 70% 68–72% 92% 92–92% NA 77% 23% 92% 92–92%Overall Minnesota Clinic Average
Medical Group Distribution of
Patient Population
Medical Group Distribution of
Patient Population
north Clinic- WestHealth north Clinic
north Memorial Clinic- north Memorial Camden Physicians Plymouth
north Memorial Clinic- north Memorial Plymouth Internal Medicine
northwest Family Physicans northwest Family Physicians
Park nicollet Clinic Park nicollet Health services
PrIor lAke
Allina Medical Clinic- Allina Medical Clinic Crossroads Prior lake
Fairview ridgevalley Clinic Fairview Health services
Park nicollet Clinic Park nicollet Health services
rAMsey
Allina Medical Clinic Allina Medical Clinic
rICHFIeld
Allina Medical Clinic Allina Medical Clinic
richfield Medical group richfield Medical group
roBBInsdAle
north Clinic- oakdale office north Clinic
73% 59%-87% 56% 39% 5% sample 126 70% 56%-81% 87% 80%-91% n/A 88% 12% total Population 112 85% 77%-90%
75% 55%-94% 46% 51% 3% sample 67 75% 55%-88% 92% 84%-97% n/A 89% 11% total Population 85 93% 85%-97%
54% 29%-78% 37% 52% 11% sample 120 54% 34%-74% 94% 89%-97% n/A 83% 17% total Population 159 94% 90%-97%
63% 20%-100% 46% 45% 9% sample 68 64% 36%-85% 96% 91%-98% n/A 92% 8% total Population 87 97% 90%-99%
78% 73%-83% 28% 66% 6% sample 425 78% 72%-83% 92% 90%-94% n/A 90% 10% total Population 1226 93% 92%-94%
* * * * * * * * * * * n/A * * * * * *
74% 68%-79% 36% 55% 9% sample 616 74% 68%-78% 93% 91%-94% n/A 77% 23% total Population 1237 93% 91%-94%
78% 73%-83% 28% 66% 6% sample 425 78% 72%-83% 92% 90%-94% n/A 90% 10% total Population 1226 93% 92%-94%
76% 71%-81% 28% 65% 8% sample 650 76% 71%-81% 91% 90%-93% n/A 82% 18% total Population 1562 92% 90%-93%
76% 71%-81% 28% 65% 8% sample 650 76% 71%-81% 91% 90%-93% n/A 82% 18% total Population 1562 92% 90%-93%
* * * * * * * * * * * n/A * * * * * *
73% 59%-87% 56% 39% 5% sample 126 70% 56%-81% 87% 80%-91% n/A 88% 12% total Population 112 85% 77%-90%

pHysiCian Measures appenDiX | November 2010 | 2010 Health Care Quality Report128
* sufficient data not available.
see page 89 for an explanation of terms.
Risk
Adj
uste
d Ra
te
Confi
denc
e In
terv
al o
f Ris
k Ad
just
ed R
ate
Med
icar
e
Com
mer
cial
MN
Heal
th C
are
Prog
ram
s
Tota
l Pop
ulat
ion
or S
ampl
e
Sam
ple
Size
Non-
Risk
Adj
uste
d Ra
te
Confi
denc
e In
terv
al o
f Non
-Ri
sk A
djus
ted
Rate
Risk
Adj
uste
d Ra
te
Confi
denc
e In
terv
al o
f Ris
k Ad
just
ed R
ate
Med
icar
e
Com
mer
cial
MN
Heal
th C
are
Prog
ram
s
Tota
l Pop
ulat
ion
or S
ampl
e
Sam
ple
Size
Non-
Risk
Adj
uste
d Ra
te
Confi
denc
e In
terv
al o
f Non
-Ri
sk A
djus
ted
Rate
Controlling High Blood Pressure Use of Appropriate Medications for People with Asthma
PHySIcIAN cLINIc NAME
MEdIcAL GrOuP NAME
Quality of Care for Chronic Conditions
70% 68–72% 28% 60% 12% 70% 68–72% 92% 92–92% NA 77% 23% 92% 92–92%Overall Minnesota Clinic Average
Medical Group Distribution of
Patient Population
Medical Group Distribution of
Patient Population
robbinsdale Clinic, PA robbinsdale Clinic, PA
rogers
Fairview rogers Clinic Fairview Health services
northwest Family Physicians northwest Family Physicians
roseMount
Fairview rosemount Clinic Fairview Health services
rosemount Family Physicians
rosevIlle
HealthPartners- north suburban roseville HealthPartners Clinics
Multicare Associates- Multicare Associates roseville Medical Center
richard schoewe, Md richard schoewe Md
sAvAge
Quello Clinic Quello Clinic
sHAkoPee
Allina Medical Clinic Allina Medical Clinic
Allina Medical Clinic- Allina Medical Clinic Crossroads shakopee dean lakes
* * * * * * * * * * * n/A * * * * * *
74% 68%-79% 36% 55% 9% sample 616 74% 68%-78% 93% 91%-94% n/A 77% 23% total Population 1237 93% 91%-94%
63% 20%-100% 46% 45% 9% sample 68 64% 36%-85% 96% 91%-98% n/A 92% 8% total Population 87 97% 90%-99%
74% 68%-79% 36% 55% 9% sample 616 74% 68%-78% 93% 91%-94% n/A 77% 23% total Population 1237 93% 91%-94%
* * * * * * * * * * * n/A * * * * * *
77% 72%-81% 32% 60% 8% sample 1091 77% 72%-81% 93% 91%-94% n/A 83% 17% total Population 1621 93% 91%-94%
56% 28%-85% 50% 41% 9% sample 68 65% 42%-82% 91% 84%-95% n/A 75% 25% total Population 105 90% 83%-95%
* * * * * * * * * * * n/A * * * * * *
71% 55%-86% 31% 63% 6% sample 87 71% 47%-87% 89% 81%-94% n/A 88% 12% total Population 104 88% 81%-93%
76% 71%-81% 28% 65% 8% sample 650 76% 71%-81% 91% 90%-93% n/A 82% 18% total Population 1562 92% 90%-93%
* * * * * * * * * * * n/A * * * * * *
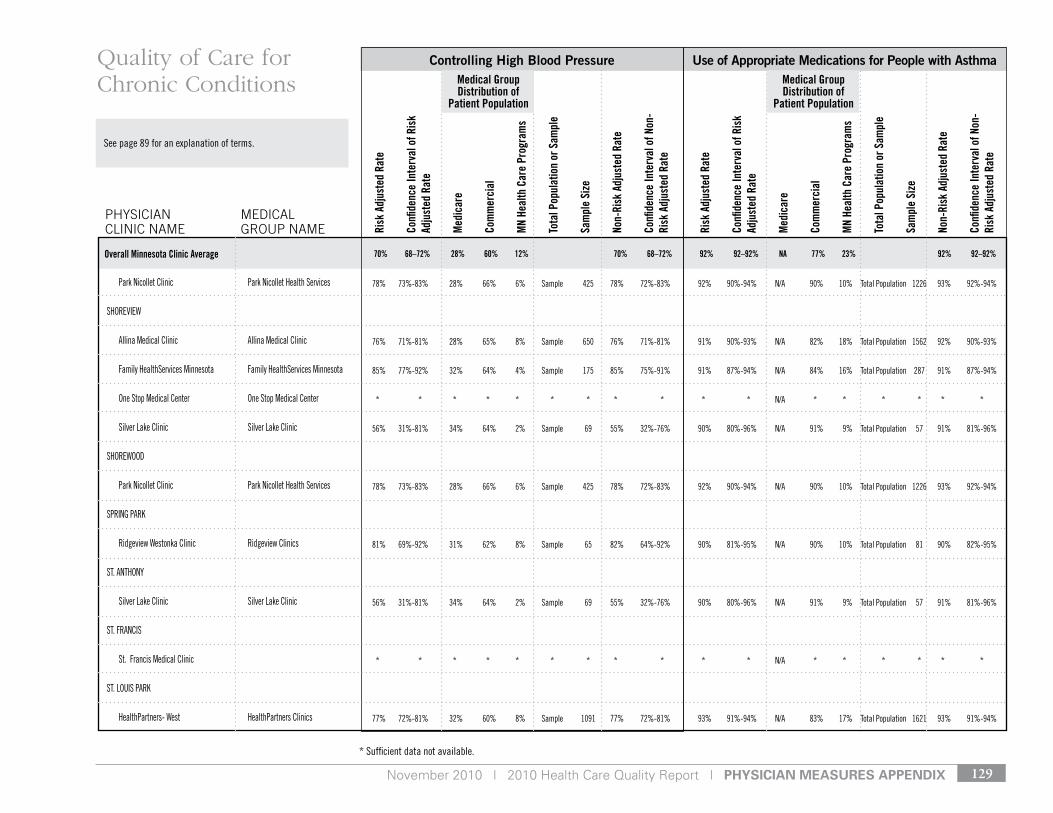
November 2010 | 2010 Health Care Quality Report | pHysiCian Measures appenDiX 129
* sufficient data not available.
see page 89 for an explanation of terms.
Risk
Adj
uste
d Ra
te
Confi
denc
e In
terv
al o
f Ris
k Ad
just
ed R
ate
Med
icar
e
Com
mer
cial
MN
Heal
th C
are
Prog
ram
s
Tota
l Pop
ulat
ion
or S
ampl
e
Sam
ple
Size
Non-
Risk
Adj
uste
d Ra
te
Confi
denc
e In
terv
al o
f Non
-Ri
sk A
djus
ted
Rate
Risk
Adj
uste
d Ra
te
Confi
denc
e In
terv
al o
f Ris
k Ad
just
ed R
ate
Med
icar
e
Com
mer
cial
MN
Heal
th C
are
Prog
ram
s
Tota
l Pop
ulat
ion
or S
ampl
e
Sam
ple
Size
Non-
Risk
Adj
uste
d Ra
te
Confi
denc
e In
terv
al o
f Non
-Ri
sk A
djus
ted
Rate
Controlling High Blood Pressure Use of Appropriate Medications for People with Asthma
PHySIcIAN cLINIc NAME
MEdIcAL GrOuP NAME
Quality of Care for Chronic Conditions
70% 68–72% 28% 60% 12% 70% 68–72% 92% 92–92% NA 77% 23% 92% 92–92%Overall Minnesota Clinic Average
Medical Group Distribution of
Patient Population
Medical Group Distribution of
Patient Population
Park nicollet Clinic Park nicollet Health services
sHorevIeW
Allina Medical Clinic Allina Medical Clinic
Family Healthservices Minnesota Family Healthservices Minnesota
one stop Medical Center one stop Medical Center
silver lake Clinic silver lake Clinic
sHoreWood
Park nicollet Clinic Park nicollet Health services
sPrIng PArk
ridgeview Westonka Clinic ridgeview Clinics
st. AntHony
silver lake Clinic silver lake Clinic
st. FrAnCIs
st. Francis Medical Clinic
st. louIs PArk
HealthPartners- West HealthPartners Clinics
78% 73%-83% 28% 66% 6% sample 425 78% 72%-83% 92% 90%-94% n/A 90% 10% total Population 1226 93% 92%-94%
76% 71%-81% 28% 65% 8% sample 650 76% 71%-81% 91% 90%-93% n/A 82% 18% total Population 1562 92% 90%-93%
85% 77%-92% 32% 64% 4% sample 175 85% 75%-91% 91% 87%-94% n/A 84% 16% total Population 287 91% 87%-94%
* * * * * * * * * * * n/A * * * * * *
56% 31%-81% 34% 64% 2% sample 69 55% 32%-76% 90% 80%-96% n/A 91% 9% total Population 57 91% 81%-96%
78% 73%-83% 28% 66% 6% sample 425 78% 72%-83% 92% 90%-94% n/A 90% 10% total Population 1226 93% 92%-94%
81% 69%-92% 31% 62% 8% sample 65 82% 64%-92% 90% 81%-95% n/A 90% 10% total Population 81 90% 82%-95%
56% 31%-81% 34% 64% 2% sample 69 55% 32%-76% 90% 80%-96% n/A 91% 9% total Population 57 91% 81%-96%
* * * * * * * * * * * n/A * * * * * *
77% 72%-81% 32% 60% 8% sample 1091 77% 72%-81% 93% 91%-94% n/A 83% 17% total Population 1621 93% 91%-94%
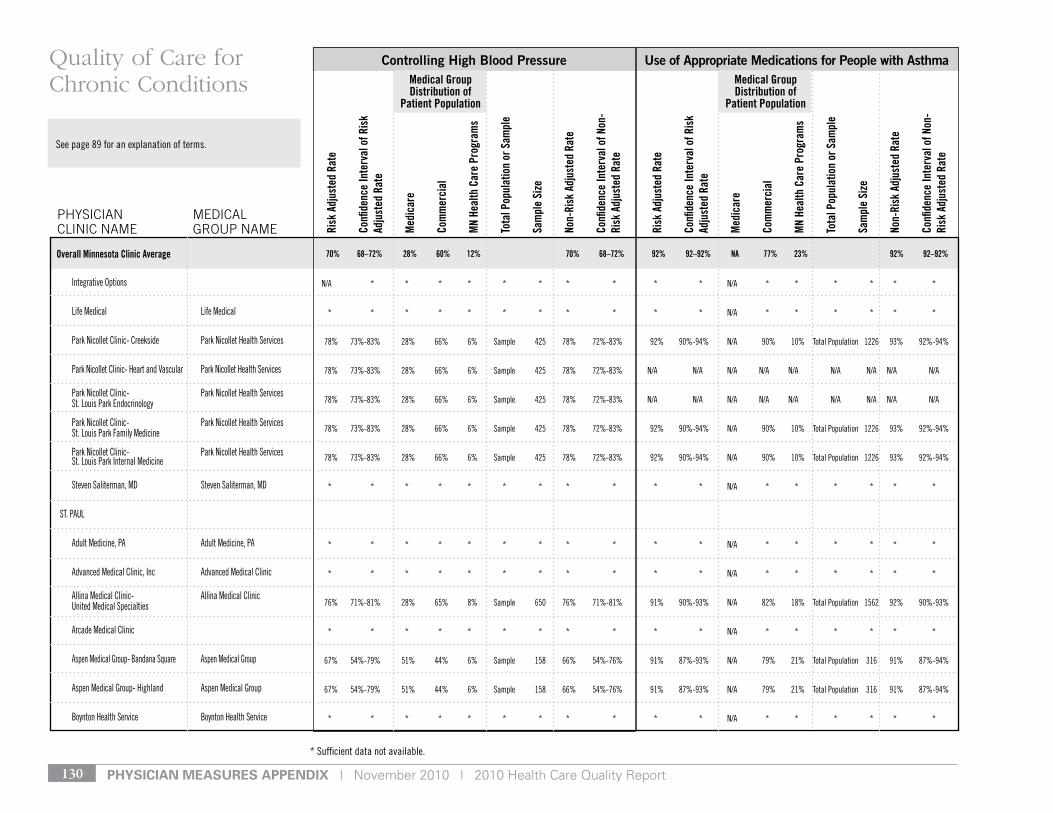
pHysiCian Measures appenDiX | November 2010 | 2010 Health Care Quality Report130
* sufficient data not available.
see page 89 for an explanation of terms.
Risk
Adj
uste
d Ra
te
Confi
denc
e In
terv
al o
f Ris
k Ad
just
ed R
ate
Med
icar
e
Com
mer
cial
MN
Heal
th C
are
Prog
ram
s
Tota
l Pop
ulat
ion
or S
ampl
e
Sam
ple
Size
Non-
Risk
Adj
uste
d Ra
te
Confi
denc
e In
terv
al o
f Non
-Ri
sk A
djus
ted
Rate
Risk
Adj
uste
d Ra
te
Confi
denc
e In
terv
al o
f Ris
k Ad
just
ed R
ate
Med
icar
e
Com
mer
cial
MN
Heal
th C
are
Prog
ram
s
Tota
l Pop
ulat
ion
or S
ampl
e
Sam
ple
Size
Non-
Risk
Adj
uste
d Ra
te
Confi
denc
e In
terv
al o
f Non
-Ri
sk A
djus
ted
Rate
Controlling High Blood Pressure Use of Appropriate Medications for People with Asthma
PHySIcIAN cLINIc NAME
MEdIcAL GrOuP NAME
Quality of Care for Chronic Conditions
70% 68–72% 28% 60% 12% 70% 68–72% 92% 92–92% NA 77% 23% 92% 92–92%Overall Minnesota Clinic Average
Medical Group Distribution of
Patient Population
Medical Group Distribution of
Patient Population
Integrative options
life Medical life Medical
Park nicollet Clinic- Creekside Park nicollet Health services
Park nicollet Clinic- Heart and vascular Park nicollet Health services
Park nicollet Clinic- Park nicollet Health services st. louis Park endocrinology
Park nicollet Clinic- Park nicollet Health services st. louis Park Family Medicine
Park nicollet Clinic- Park nicollet Health services st. louis Park Internal Medicine
steven saliterman, Md steven saliterman, Md
st. PAul
Adult Medicine, PA Adult Medicine, PA
Advanced Medical Clinic, Inc Advanced Medical Clinic
Allina Medical Clinic- Allina Medical Clinic united Medical specialties
Arcade Medical Clinic
Aspen Medical group- Bandana square Aspen Medical group
Aspen Medical group- Highland Aspen Medical group
Boynton Health service Boynton Health service
n/A * * * * * * * * * * n/A * * * * * *
* * * * * * * * * * * n/A * * * * * *
78% 73%-83% 28% 66% 6% sample 425 78% 72%-83% 92% 90%-94% n/A 90% 10% total Population 1226 93% 92%-94%
78% 73%-83% 28% 66% 6% sample 425 78% 72%-83% n/A n/A n/A n/A n/A n/A n/A n/A n/A
78% 73%-83% 28% 66% 6% sample 425 78% 72%-83% n/A n/A n/A n/A n/A n/A n/A n/A n/A
78% 73%-83% 28% 66% 6% sample 425 78% 72%-83% 92% 90%-94% n/A 90% 10% total Population 1226 93% 92%-94%
78% 73%-83% 28% 66% 6% sample 425 78% 72%-83% 92% 90%-94% n/A 90% 10% total Population 1226 93% 92%-94%
* * * * * * * * * * * n/A * * * * * *
* * * * * * * * * * * n/A * * * * * *
* * * * * * * * * * * n/A * * * * * *
76% 71%-81% 28% 65% 8% sample 650 76% 71%-81% 91% 90%-93% n/A 82% 18% total Population 1562 92% 90%-93%
* * * * * * * * * * * n/A * * * * * *
67% 54%-79% 51% 44% 6% sample 158 66% 54%-76% 91% 87%-93% n/A 79% 21% total Population 316 91% 87%-94%
67% 54%-79% 51% 44% 6% sample 158 66% 54%-76% 91% 87%-93% n/A 79% 21% total Population 316 91% 87%-94%
* * * * * * * * * * * n/A * * * * * *
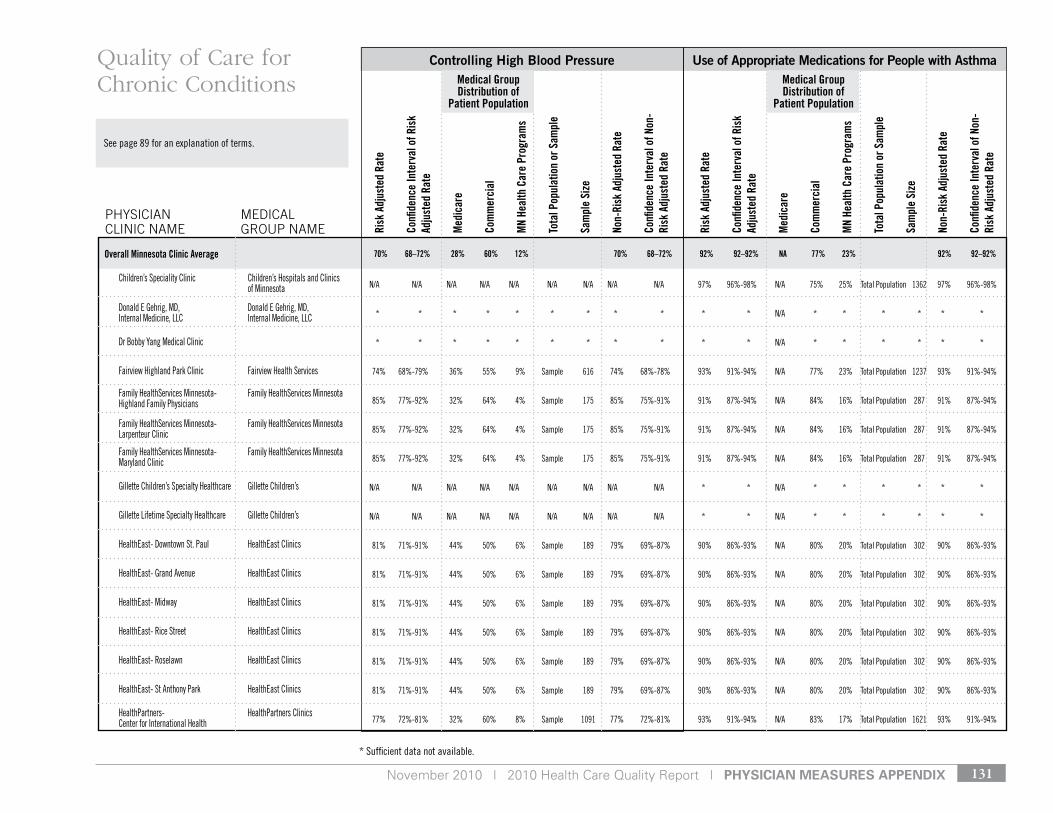
November 2010 | 2010 Health Care Quality Report | pHysiCian Measures appenDiX 131
* sufficient data not available.
see page 89 for an explanation of terms.
Risk
Adj
uste
d Ra
te
Confi
denc
e In
terv
al o
f Ris
k Ad
just
ed R
ate
Med
icar
e
Com
mer
cial
MN
Heal
th C
are
Prog
ram
s
Tota
l Pop
ulat
ion
or S
ampl
e
Sam
ple
Size
Non-
Risk
Adj
uste
d Ra
te
Confi
denc
e In
terv
al o
f Non
-Ri
sk A
djus
ted
Rate
Risk
Adj
uste
d Ra
te
Confi
denc
e In
terv
al o
f Ris
k Ad
just
ed R
ate
Med
icar
e
Com
mer
cial
MN
Heal
th C
are
Prog
ram
s
Tota
l Pop
ulat
ion
or S
ampl
e
Sam
ple
Size
Non-
Risk
Adj
uste
d Ra
te
Confi
denc
e In
terv
al o
f Non
-Ri
sk A
djus
ted
Rate
Controlling High Blood Pressure Use of Appropriate Medications for People with Asthma
PHySIcIAN cLINIc NAME
MEdIcAL GrOuP NAME
Quality of Care for Chronic Conditions
70% 68–72% 28% 60% 12% 70% 68–72% 92% 92–92% NA 77% 23% 92% 92–92%Overall Minnesota Clinic Average
Medical Group Distribution of
Patient Population
Medical Group Distribution of
Patient Population
Children’s speciality Clinic Children’s Hospitals and Clinics of Minnesota
donald e gehrig, Md, donald e gehrig, Md, Internal Medicine, llC Internal Medicine, llC
dr Bobby yang Medical Clinic
Fairview Highland Park Clinic Fairview Health services
Family Healthservices Minnesota- Family Healthservices Minnesota Highland Family Physicians
Family Healthservices Minnesota- Family Healthservices Minnesota larpenteur Clinic
Family Healthservices Minnesota- Family Healthservices Minnesota Maryland Clinic
gillette Children’s specialty Healthcare gillette Children’s
gillette lifetime specialty Healthcare gillette Children’s
Healtheast- downtown st. Paul Healtheast Clinics
Healtheast- grand Avenue Healtheast Clinics
Healtheast- Midway Healtheast Clinics
Healtheast- rice street Healtheast Clinics
Healtheast- roselawn Healtheast Clinics
Healtheast- st Anthony Park Healtheast Clinics
HealthPartners- HealthPartners Clinics Center for International Health
n/A n/A n/A n/A n/A n/A n/A n/A n/A 97% 96%-98% n/A 75% 25% total Population 1362 97% 96%-98%
* * * * * * * * * * * n/A * * * * * *
* * * * * * * * * * * n/A * * * * * *
74% 68%-79% 36% 55% 9% sample 616 74% 68%-78% 93% 91%-94% n/A 77% 23% total Population 1237 93% 91%-94%
85% 77%-92% 32% 64% 4% sample 175 85% 75%-91% 91% 87%-94% n/A 84% 16% total Population 287 91% 87%-94%
85% 77%-92% 32% 64% 4% sample 175 85% 75%-91% 91% 87%-94% n/A 84% 16% total Population 287 91% 87%-94%
85% 77%-92% 32% 64% 4% sample 175 85% 75%-91% 91% 87%-94% n/A 84% 16% total Population 287 91% 87%-94%
n/A n/A n/A n/A n/A n/A n/A n/A n/A * * n/A * * * * * *
n/A n/A n/A n/A n/A n/A n/A n/A n/A * * n/A * * * * * *
81% 71%-91% 44% 50% 6% sample 189 79% 69%-87% 90% 86%-93% n/A 80% 20% total Population 302 90% 86%-93%
81% 71%-91% 44% 50% 6% sample 189 79% 69%-87% 90% 86%-93% n/A 80% 20% total Population 302 90% 86%-93%
81% 71%-91% 44% 50% 6% sample 189 79% 69%-87% 90% 86%-93% n/A 80% 20% total Population 302 90% 86%-93%
81% 71%-91% 44% 50% 6% sample 189 79% 69%-87% 90% 86%-93% n/A 80% 20% total Population 302 90% 86%-93%
81% 71%-91% 44% 50% 6% sample 189 79% 69%-87% 90% 86%-93% n/A 80% 20% total Population 302 90% 86%-93%
81% 71%-91% 44% 50% 6% sample 189 79% 69%-87% 90% 86%-93% n/A 80% 20% total Population 302 90% 86%-93%
77% 72%-81% 32% 60% 8% sample 1091 77% 72%-81% 93% 91%-94% n/A 83% 17% total Population 1621 93% 91%-94%
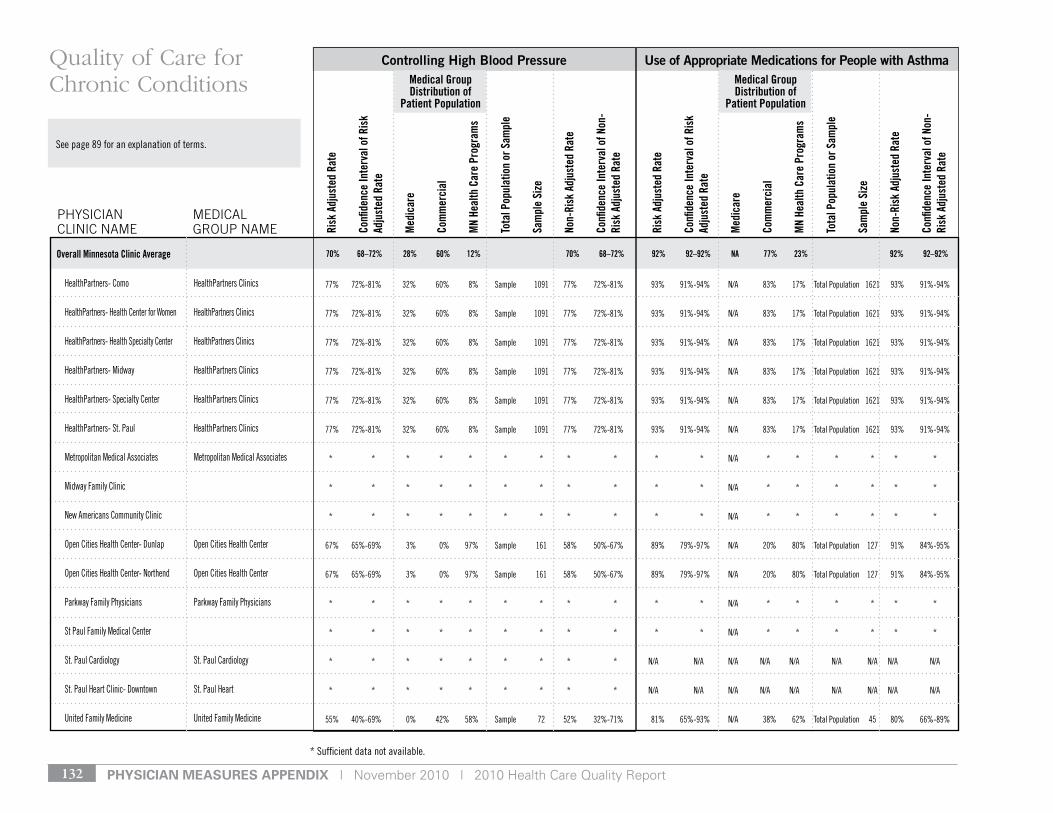
pHysiCian Measures appenDiX | November 2010 | 2010 Health Care Quality Report132
* sufficient data not available.
see page 89 for an explanation of terms.
Risk
Adj
uste
d Ra
te
Confi
denc
e In
terv
al o
f Ris
k Ad
just
ed R
ate
Med
icar
e
Com
mer
cial
MN
Heal
th C
are
Prog
ram
s
Tota
l Pop
ulat
ion
or S
ampl
e
Sam
ple
Size
Non-
Risk
Adj
uste
d Ra
te
Confi
denc
e In
terv
al o
f Non
-Ri
sk A
djus
ted
Rate
Risk
Adj
uste
d Ra
te
Confi
denc
e In
terv
al o
f Ris
k Ad
just
ed R
ate
Med
icar
e
Com
mer
cial
MN
Heal
th C
are
Prog
ram
s
Tota
l Pop
ulat
ion
or S
ampl
e
Sam
ple
Size
Non-
Risk
Adj
uste
d Ra
te
Confi
denc
e In
terv
al o
f Non
-Ri
sk A
djus
ted
Rate
Controlling High Blood Pressure Use of Appropriate Medications for People with Asthma
PHySIcIAN cLINIc NAME
MEdIcAL GrOuP NAME
Quality of Care for Chronic Conditions
70% 68–72% 28% 60% 12% 70% 68–72% 92% 92–92% NA 77% 23% 92% 92–92%Overall Minnesota Clinic Average
Medical Group Distribution of
Patient Population
Medical Group Distribution of
Patient Population
HealthPartners- Como HealthPartners Clinics
HealthPartners- Health Center for Women HealthPartners Clinics
HealthPartners- Health specialty Center HealthPartners Clinics
HealthPartners- Midway HealthPartners Clinics
HealthPartners- specialty Center HealthPartners Clinics
HealthPartners- st. Paul HealthPartners Clinics
Metropolitan Medical Associates Metropolitan Medical Associates
Midway Family Clinic
new Americans Community Clinic
open Cities Health Center- dunlap open Cities Health Center
open Cities Health Center- northend open Cities Health Center
Parkway Family Physicians Parkway Family Physicians
st Paul Family Medical Center
st. Paul Cardiology st. Paul Cardiology
st. Paul Heart Clinic- downtown st. Paul Heart
united Family Medicine united Family Medicine
77% 72%-81% 32% 60% 8% sample 1091 77% 72%-81% 93% 91%-94% n/A 83% 17% total Population 1621 93% 91%-94%
77% 72%-81% 32% 60% 8% sample 1091 77% 72%-81% 93% 91%-94% n/A 83% 17% total Population 1621 93% 91%-94%
77% 72%-81% 32% 60% 8% sample 1091 77% 72%-81% 93% 91%-94% n/A 83% 17% total Population 1621 93% 91%-94%
77% 72%-81% 32% 60% 8% sample 1091 77% 72%-81% 93% 91%-94% n/A 83% 17% total Population 1621 93% 91%-94%
77% 72%-81% 32% 60% 8% sample 1091 77% 72%-81% 93% 91%-94% n/A 83% 17% total Population 1621 93% 91%-94%
77% 72%-81% 32% 60% 8% sample 1091 77% 72%-81% 93% 91%-94% n/A 83% 17% total Population 1621 93% 91%-94%
* * * * * * * * * * * n/A * * * * * *
* * * * * * * * * * * n/A * * * * * *
* * * * * * * * * * * n/A * * * * * *
67% 65%-69% 3% 0% 97% sample 161 58% 50%-67% 89% 79%-97% n/A 20% 80% total Population 127 91% 84%-95%
67% 65%-69% 3% 0% 97% sample 161 58% 50%-67% 89% 79%-97% n/A 20% 80% total Population 127 91% 84%-95%
* * * * * * * * * * * n/A * * * * * *
* * * * * * * * * * * n/A * * * * * *
* * * * * * * * * n/A n/A n/A n/A n/A n/A n/A n/A n/A
* * * * * * * * * n/A n/A n/A n/A n/A n/A n/A n/A n/A
55% 40%-69% 0% 42% 58% sample 72 52% 32%-71% 81% 65%-93% n/A 38% 62% total Population 45 80% 66%-89%
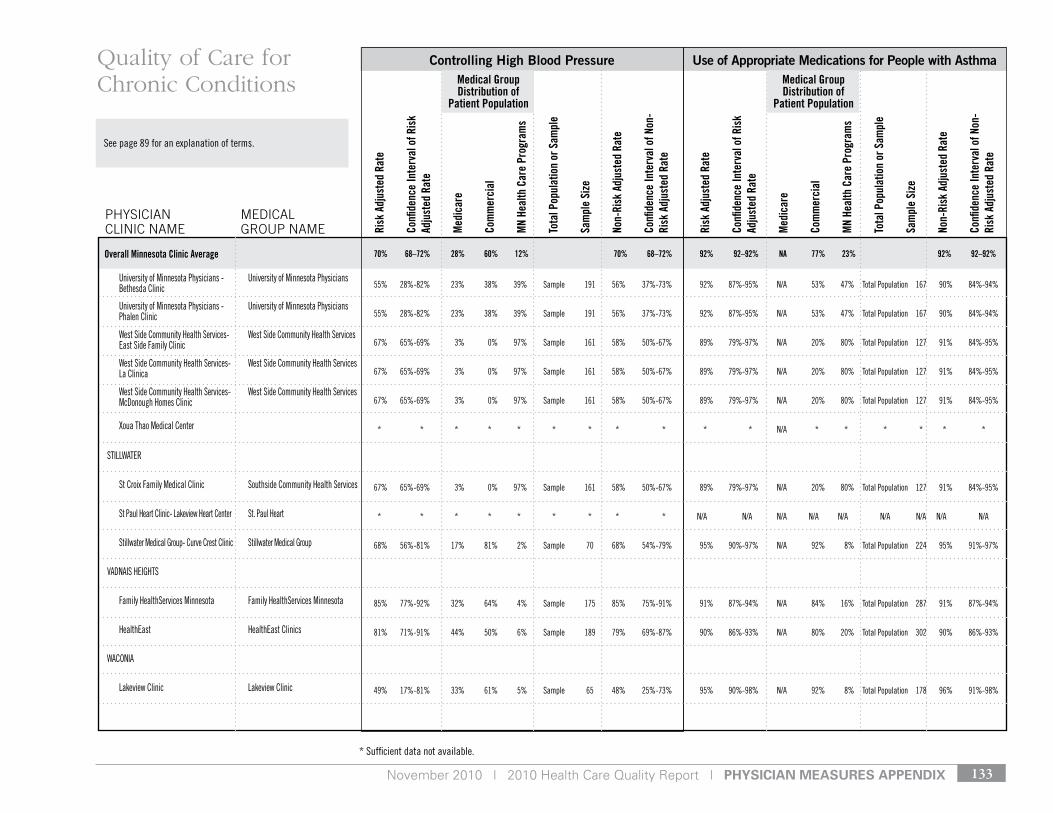
November 2010 | 2010 Health Care Quality Report | pHysiCian Measures appenDiX 133
* sufficient data not available.
see page 89 for an explanation of terms.
Risk
Adj
uste
d Ra
te
Confi
denc
e In
terv
al o
f Ris
k Ad
just
ed R
ate
Med
icar
e
Com
mer
cial
MN
Heal
th C
are
Prog
ram
s
Tota
l Pop
ulat
ion
or S
ampl
e
Sam
ple
Size
Non-
Risk
Adj
uste
d Ra
te
Confi
denc
e In
terv
al o
f Non
-Ri
sk A
djus
ted
Rate
Risk
Adj
uste
d Ra
te
Confi
denc
e In
terv
al o
f Ris
k Ad
just
ed R
ate
Med
icar
e
Com
mer
cial
MN
Heal
th C
are
Prog
ram
s
Tota
l Pop
ulat
ion
or S
ampl
e
Sam
ple
Size
Non-
Risk
Adj
uste
d Ra
te
Confi
denc
e In
terv
al o
f Non
-Ri
sk A
djus
ted
Rate
Controlling High Blood Pressure Use of Appropriate Medications for People with Asthma
PHySIcIAN cLINIc NAME
MEdIcAL GrOuP NAME
Quality of Care for Chronic Conditions
70% 68–72% 28% 60% 12% 70% 68–72% 92% 92–92% NA 77% 23% 92% 92–92%Overall Minnesota Clinic Average
Medical Group Distribution of
Patient Population
Medical Group Distribution of
Patient Population
university of Minnesota Physicians - university of Minnesota Physicians Bethesda Clinic
university of Minnesota Physicians - university of Minnesota Physicians Phalen Clinic
West side Community Health services- West side Community Health services east side Family Clinic
West side Community Health services- West side Community Health services la Clinica
West side Community Health services- West side Community Health services Mcdonough Homes Clinic
Xoua thao Medical Center
stIllWAter
st Croix Family Medical Clinic southside Community Health services
st Paul Heart Clinic- lakeview Heart Center st. Paul Heart
stillwater Medical group- Curve Crest Clinic stillwater Medical group
vAdnAIs HeIgHts
Family Healthservices Minnesota Family Healthservices Minnesota
Healtheast Healtheast Clinics
WAConIA
lakeview Clinic lakeview Clinic
55% 28%-82% 23% 38% 39% sample 191 56% 37%-73% 92% 87%-95% n/A 53% 47% total Population 167 90% 84%-94%
55% 28%-82% 23% 38% 39% sample 191 56% 37%-73% 92% 87%-95% n/A 53% 47% total Population 167 90% 84%-94%
67% 65%-69% 3% 0% 97% sample 161 58% 50%-67% 89% 79%-97% n/A 20% 80% total Population 127 91% 84%-95%
67% 65%-69% 3% 0% 97% sample 161 58% 50%-67% 89% 79%-97% n/A 20% 80% total Population 127 91% 84%-95%
67% 65%-69% 3% 0% 97% sample 161 58% 50%-67% 89% 79%-97% n/A 20% 80% total Population 127 91% 84%-95%
* * * * * * * * * * * n/A * * * * * *
67% 65%-69% 3% 0% 97% sample 161 58% 50%-67% 89% 79%-97% n/A 20% 80% total Population 127 91% 84%-95%
* * * * * * * * * n/A n/A n/A n/A n/A n/A n/A n/A n/A
68% 56%-81% 17% 81% 2% sample 70 68% 54%-79% 95% 90%-97% n/A 92% 8% total Population 224 95% 91%-97%
85% 77%-92% 32% 64% 4% sample 175 85% 75%-91% 91% 87%-94% n/A 84% 16% total Population 287 91% 87%-94%
81% 71%-91% 44% 50% 6% sample 189 79% 69%-87% 90% 86%-93% n/A 80% 20% total Population 302 90% 86%-93%
49% 17%-81% 33% 61% 5% sample 65 48% 25%-73% 95% 90%-98% n/A 92% 8% total Population 178 96% 91%-98%
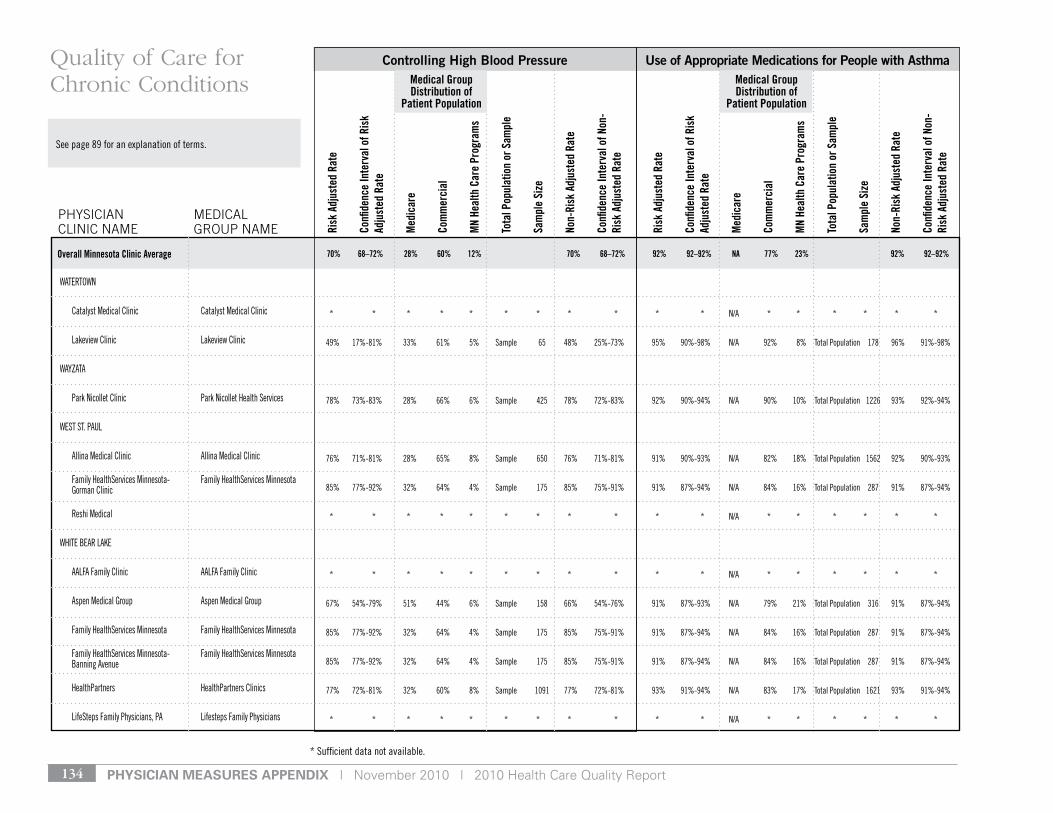
pHysiCian Measures appenDiX | November 2010 | 2010 Health Care Quality Report134
* sufficient data not available.
see page 89 for an explanation of terms.
Risk
Adj
uste
d Ra
te
Confi
denc
e In
terv
al o
f Ris
k Ad
just
ed R
ate
Med
icar
e
Com
mer
cial
MN
Heal
th C
are
Prog
ram
s
Tota
l Pop
ulat
ion
or S
ampl
e
Sam
ple
Size
Non-
Risk
Adj
uste
d Ra
te
Confi
denc
e In
terv
al o
f Non
-Ri
sk A
djus
ted
Rate
Risk
Adj
uste
d Ra
te
Confi
denc
e In
terv
al o
f Ris
k Ad
just
ed R
ate
Med
icar
e
Com
mer
cial
MN
Heal
th C
are
Prog
ram
s
Tota
l Pop
ulat
ion
or S
ampl
e
Sam
ple
Size
Non-
Risk
Adj
uste
d Ra
te
Confi
denc
e In
terv
al o
f Non
-Ri
sk A
djus
ted
Rate
Controlling High Blood Pressure Use of Appropriate Medications for People with Asthma
PHySIcIAN cLINIc NAME
MEdIcAL GrOuP NAME
Quality of Care for Chronic Conditions
70% 68–72% 28% 60% 12% 70% 68–72% 92% 92–92% NA 77% 23% 92% 92–92%Overall Minnesota Clinic Average
Medical Group Distribution of
Patient Population
Medical Group Distribution of
Patient Population
WAtertoWn
Catalyst Medical Clinic Catalyst Medical Clinic
lakeview Clinic lakeview Clinic
WAyzAtA
Park nicollet Clinic Park nicollet Health services
West st. PAul
Allina Medical Clinic Allina Medical Clinic
Family Healthservices Minnesota- Family Healthservices Minnesota gorman Clinic
reshi Medical
WHIte BeAr lAke
AAlFA Family Clinic AAlFA Family Clinic
Aspen Medical group Aspen Medical group
Family Healthservices Minnesota Family Healthservices Minnesota
Family Healthservices Minnesota- Family Healthservices Minnesota Banning Avenue
HealthPartners HealthPartners Clinics
lifesteps Family Physicians, PA lifesteps Family Physicians
* * * * * * * * * * * n/A * * * * * *
49% 17%-81% 33% 61% 5% sample 65 48% 25%-73% 95% 90%-98% n/A 92% 8% total Population 178 96% 91%-98%
78% 73%-83% 28% 66% 6% sample 425 78% 72%-83% 92% 90%-94% n/A 90% 10% total Population 1226 93% 92%-94%
76% 71%-81% 28% 65% 8% sample 650 76% 71%-81% 91% 90%-93% n/A 82% 18% total Population 1562 92% 90%-93%
85% 77%-92% 32% 64% 4% sample 175 85% 75%-91% 91% 87%-94% n/A 84% 16% total Population 287 91% 87%-94%
* * * * * * * * * * * n/A * * * * * *
* * * * * * * * * * * n/A * * * * * *
67% 54%-79% 51% 44% 6% sample 158 66% 54%-76% 91% 87%-93% n/A 79% 21% total Population 316 91% 87%-94%
85% 77%-92% 32% 64% 4% sample 175 85% 75%-91% 91% 87%-94% n/A 84% 16% total Population 287 91% 87%-94%
85% 77%-92% 32% 64% 4% sample 175 85% 75%-91% 91% 87%-94% n/A 84% 16% total Population 287 91% 87%-94%
77% 72%-81% 32% 60% 8% sample 1091 77% 72%-81% 93% 91%-94% n/A 83% 17% total Population 1621 93% 91%-94%
* * * * * * * * * * * n/A * * * * * *
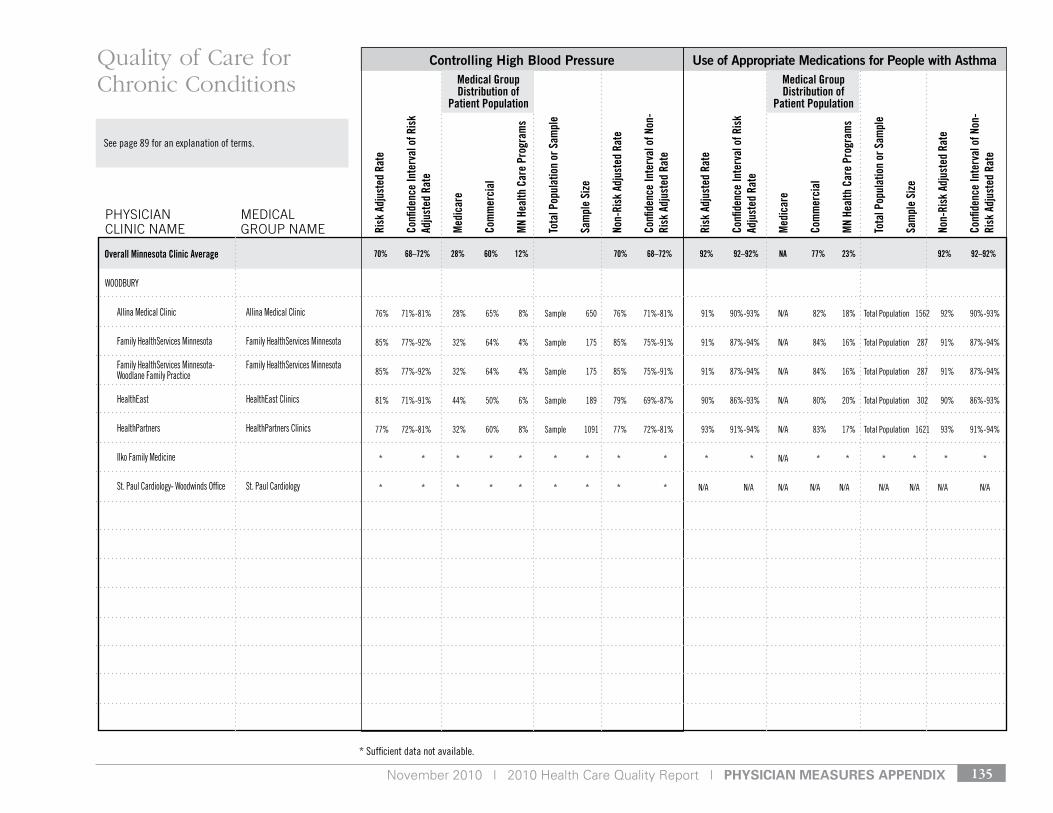
November 2010 | 2010 Health Care Quality Report | pHysiCian Measures appenDiX 135
* sufficient data not available.
see page 89 for an explanation of terms.
Risk
Adj
uste
d Ra
te
Confi
denc
e In
terv
al o
f Ris
k Ad
just
ed R
ate
Med
icar
e
Com
mer
cial
MN
Heal
th C
are
Prog
ram
s
Tota
l Pop
ulat
ion
or S
ampl
e
Sam
ple
Size
Non-
Risk
Adj
uste
d Ra
te
Confi
denc
e In
terv
al o
f Non
-Ri
sk A
djus
ted
Rate
Risk
Adj
uste
d Ra
te
Confi
denc
e In
terv
al o
f Ris
k Ad
just
ed R
ate
Med
icar
e
Com
mer
cial
MN
Heal
th C
are
Prog
ram
s
Tota
l Pop
ulat
ion
or S
ampl
e
Sam
ple
Size
Non-
Risk
Adj
uste
d Ra
te
Confi
denc
e In
terv
al o
f Non
-Ri
sk A
djus
ted
Rate
Controlling High Blood Pressure Use of Appropriate Medications for People with Asthma
PHySIcIAN cLINIc NAME
MEdIcAL GrOuP NAME
Quality of Care for Chronic Conditions
70% 68–72% 28% 60% 12% 70% 68–72% 92% 92–92% NA 77% 23% 92% 92–92%Overall Minnesota Clinic Average
Medical Group Distribution of
Patient Population
Medical Group Distribution of
Patient Population
WoodBury
Allina Medical Clinic Allina Medical Clinic
Family Healthservices Minnesota Family Healthservices Minnesota
Family Healthservices Minnesota- Family Healthservices Minnesota Woodlane Family Practice
Healtheast Healtheast Clinics
HealthPartners HealthPartners Clinics
Ilko Family Medicine
st. Paul Cardiology- Woodwinds office st. Paul Cardiology
76% 71%-81% 28% 65% 8% sample 650 76% 71%-81% 91% 90%-93% n/A 82% 18% total Population 1562 92% 90%-93%
85% 77%-92% 32% 64% 4% sample 175 85% 75%-91% 91% 87%-94% n/A 84% 16% total Population 287 91% 87%-94%
85% 77%-92% 32% 64% 4% sample 175 85% 75%-91% 91% 87%-94% n/A 84% 16% total Population 287 91% 87%-94%
81% 71%-91% 44% 50% 6% sample 189 79% 69%-87% 90% 86%-93% n/A 80% 20% total Population 302 90% 86%-93%
77% 72%-81% 32% 60% 8% sample 1091 77% 72%-81% 93% 91%-94% n/A 83% 17% total Population 1621 93% 91%-94%
* * * * * * * * * * * n/A * * * * * *
* * * * * * * * * n/A n/A n/A n/A n/A n/A n/A n/A n/A
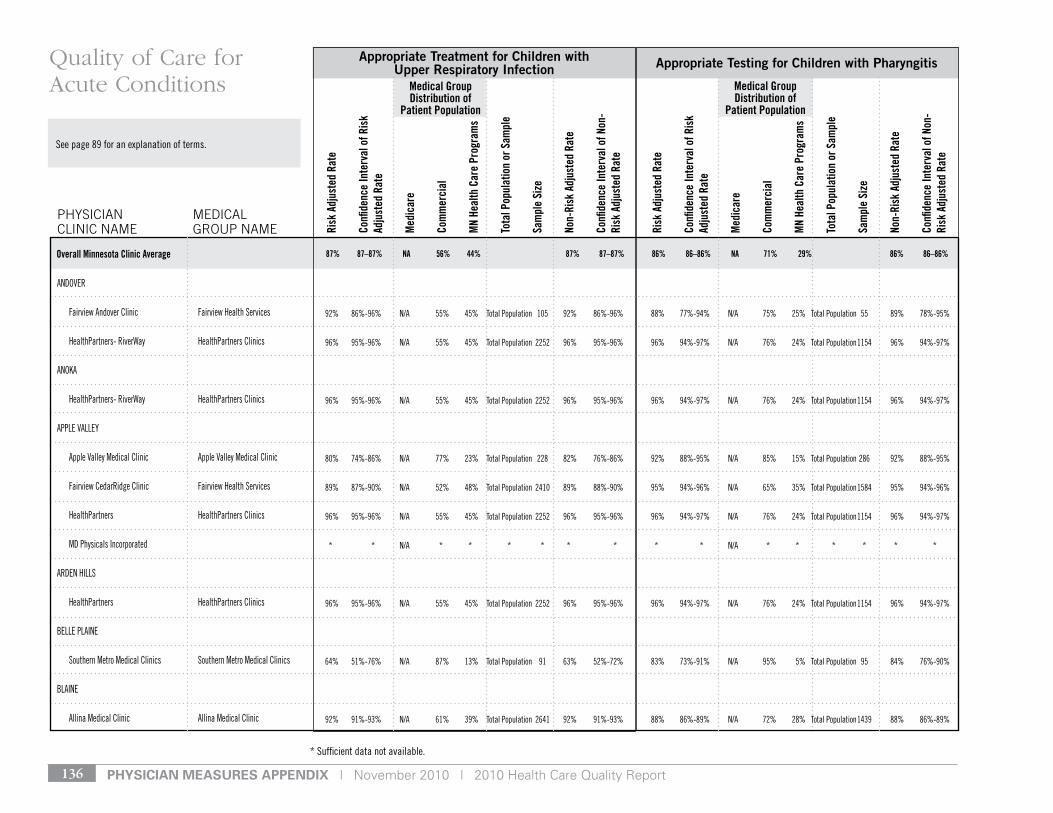
pHysiCian Measures appenDiX | November 2010 | 2010 Health Care Quality Report136
* sufficient data not available.
see page 89 for an explanation of terms.
Risk
Adj
uste
d Ra
te
Confi
denc
e In
terv
al o
f Ris
k Ad
just
ed R
ate
Med
icar
e
Com
mer
cial
MN
Heal
th C
are
Prog
ram
s
Tota
l Pop
ulat
ion
or S
ampl
e
Sam
ple
Size
Non-
Risk
Adj
uste
d Ra
te
Confi
denc
e In
terv
al o
f Non
-Ri
sk A
djus
ted
Rate
Risk
Adj
uste
d Ra
te
Confi
denc
e In
terv
al o
f Ris
k Ad
just
ed R
ate
Med
icar
e
Com
mer
cial
MN
Heal
th C
are
Prog
ram
s
Tota
l Pop
ulat
ion
or S
ampl
e
Sam
ple
Size
Non-
Risk
Adj
uste
d Ra
te
Confi
denc
e In
terv
al o
f Non
-Ri
sk A
djus
ted
Rate
Appropriate Treatment for Children with Upper Respiratory Infection Appropriate Testing for Children with Pharyngitis
PHySIcIAN cLINIc NAME
MEdIcAL GrOuP NAME
Quality of Care for Acute Conditions Medical Group
Distribution of Patient Population
87% 87–87% NA 56% 44% 87% 87–87% 86% 86–86% NA 71% 29% 86% 86–86%
Medical Group Distribution of
Patient Population
Overall Minnesota Clinic Average
Andover
Fairview Andover Clinic Fairview Health services
HealthPartners- riverWay HealthPartners Clinics
AnokA
HealthPartners- riverWay HealthPartners Clinics
APPle vAlley
Apple valley Medical Clinic Apple valley Medical Clinic
Fairview Cedarridge Clinic Fairview Health services
HealthPartners HealthPartners Clinics
Md Physicals Incorporated
Arden HIlls
HealthPartners HealthPartners Clinics
Belle PlAIne
southern Metro Medical Clinics southern Metro Medical Clinics
BlAIne
Allina Medical Clinic Allina Medical Clinic
92% 86%-96% n/A 55% 45% total Population 105 92% 86%-96% 88% 77%-94% n/A 75% 25% total Population 55 89% 78%-95%
96% 95%-96% n/A 55% 45% total Population 2252 96% 95%-96% 96% 94%-97% n/A 76% 24% total Population 1154 96% 94%-97%
96% 95%-96% n/A 55% 45% total Population 2252 96% 95%-96% 96% 94%-97% n/A 76% 24% total Population 1154 96% 94%-97%
80% 74%-86% n/A 77% 23% total Population 228 82% 76%-86% 92% 88%-95% n/A 85% 15% total Population 286 92% 88%-95%
89% 87%-90% n/A 52% 48% total Population 2410 89% 88%-90% 95% 94%-96% n/A 65% 35% total Population 1584 95% 94%-96%
96% 95%-96% n/A 55% 45% total Population 2252 96% 95%-96% 96% 94%-97% n/A 76% 24% total Population 1154 96% 94%-97%
* * n/A * * * * * * * * n/A * * * * * *
96% 95%-96% n/A 55% 45% total Population 2252 96% 95%-96% 96% 94%-97% n/A 76% 24% total Population 1154 96% 94%-97%
64% 51%-76% n/A 87% 13% total Population 91 63% 52%-72% 83% 73%-91% n/A 95% 5% total Population 95 84% 76%-90%
92% 91%-93% n/A 61% 39% total Population 2641 92% 91%-93% 88% 86%-89% n/A 72% 28% total Population 1439 88% 86%-89%
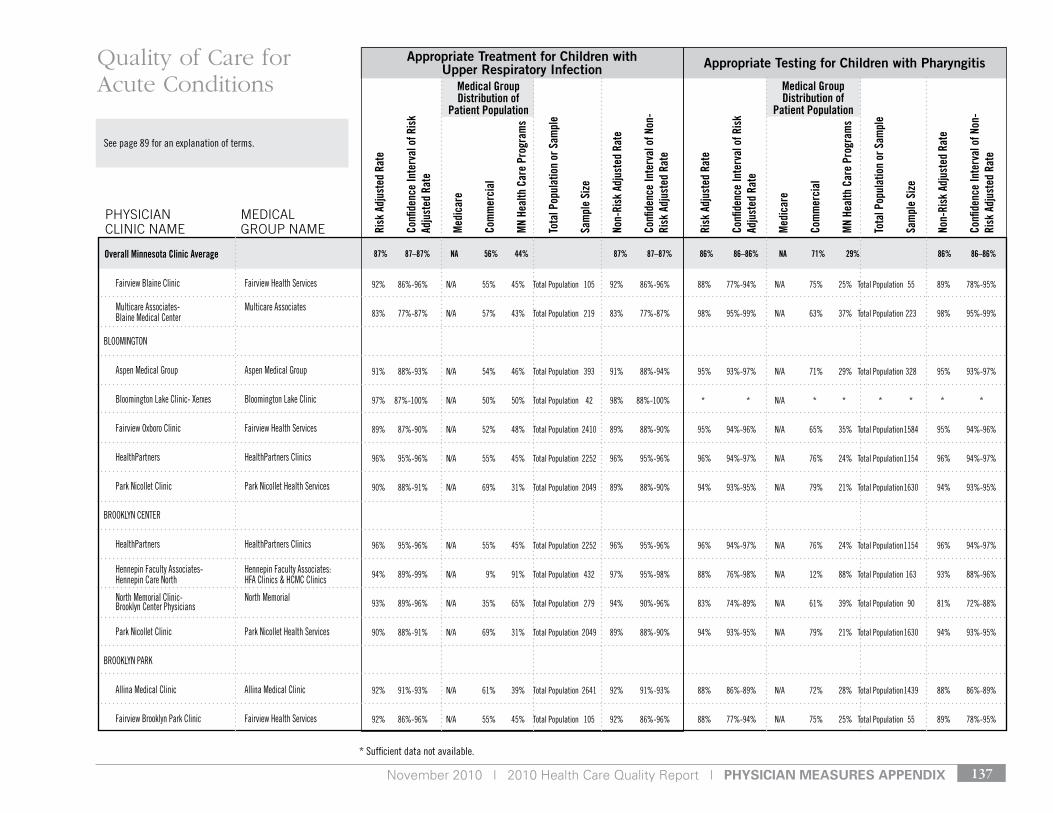
November 2010 | 2010 Health Care Quality Report | pHysiCian Measures appenDiX 137
* sufficient data not available.
see page 89 for an explanation of terms.
Risk
Adj
uste
d Ra
te
Confi
denc
e In
terv
al o
f Ris
k Ad
just
ed R
ate
Med
icar
e
Com
mer
cial
MN
Heal
th C
are
Prog
ram
s
Tota
l Pop
ulat
ion
or S
ampl
e
Sam
ple
Size
Non-
Risk
Adj
uste
d Ra
te
Confi
denc
e In
terv
al o
f Non
-Ri
sk A
djus
ted
Rate
Risk
Adj
uste
d Ra
te
Confi
denc
e In
terv
al o
f Ris
k Ad
just
ed R
ate
Med
icar
e
Com
mer
cial
MN
Heal
th C
are
Prog
ram
s
Tota
l Pop
ulat
ion
or S
ampl
e
Sam
ple
Size
Non-
Risk
Adj
uste
d Ra
te
Confi
denc
e In
terv
al o
f Non
-Ri
sk A
djus
ted
Rate
Appropriate Treatment for Children with Upper Respiratory Infection Appropriate Testing for Children with Pharyngitis
PHySIcIAN cLINIc NAME
MEdIcAL GrOuP NAME
Quality of Care for Acute Conditions Medical Group
Distribution of Patient Population
87% 87–87% NA 56% 44% 87% 87–87% 86% 86–86% NA 71% 29% 86% 86–86%
Medical Group Distribution of
Patient Population
Overall Minnesota Clinic Average
Fairview Blaine Clinic Fairview Health services
Multicare Associates- Multicare Associates Blaine Medical Center
BlooMIngton
Aspen Medical group Aspen Medical group
Bloomington lake Clinic- Xerxes Bloomington lake Clinic
Fairview oxboro Clinic Fairview Health services
HealthPartners HealthPartners Clinics
Park nicollet Clinic Park nicollet Health services
Brooklyn Center
HealthPartners HealthPartners Clinics
Hennepin Faculty Associates- Hennepin Faculty Associates: Hennepin Care north HFA Clinics & HCMC Clinics
north Memorial Clinic- north Memorial Brooklyn Center Physicians
Park nicollet Clinic Park nicollet Health services
Brooklyn PArk
Allina Medical Clinic Allina Medical Clinic
Fairview Brooklyn Park Clinic Fairview Health services
92% 86%-96% n/A 55% 45% total Population 105 92% 86%-96% 88% 77%-94% n/A 75% 25% total Population 55 89% 78%-95%
83% 77%-87% n/A 57% 43% total Population 219 83% 77%-87% 98% 95%-99% n/A 63% 37% total Population 223 98% 95%-99%
91% 88%-93% n/A 54% 46% total Population 393 91% 88%-94% 95% 93%-97% n/A 71% 29% total Population 328 95% 93%-97%
97% 87%-100% n/A 50% 50% total Population 42 98% 88%-100% * * n/A * * * * * *
89% 87%-90% n/A 52% 48% total Population 2410 89% 88%-90% 95% 94%-96% n/A 65% 35% total Population 1584 95% 94%-96%
96% 95%-96% n/A 55% 45% total Population 2252 96% 95%-96% 96% 94%-97% n/A 76% 24% total Population 1154 96% 94%-97%
90% 88%-91% n/A 69% 31% total Population 2049 89% 88%-90% 94% 93%-95% n/A 79% 21% total Population 1630 94% 93%-95%
96% 95%-96% n/A 55% 45% total Population 2252 96% 95%-96% 96% 94%-97% n/A 76% 24% total Population 1154 96% 94%-97%
94% 89%-99% n/A 9% 91% total Population 432 97% 95%-98% 88% 76%-98% n/A 12% 88% total Population 163 93% 88%-96%
93% 89%-96% n/A 35% 65% total Population 279 94% 90%-96% 83% 74%-89% n/A 61% 39% total Population 90 81% 72%-88%
90% 88%-91% n/A 69% 31% total Population 2049 89% 88%-90% 94% 93%-95% n/A 79% 21% total Population 1630 94% 93%-95%
92% 91%-93% n/A 61% 39% total Population 2641 92% 91%-93% 88% 86%-89% n/A 72% 28% total Population 1439 88% 86%-89%
92% 86%-96% n/A 55% 45% total Population 105 92% 86%-96% 88% 77%-94% n/A 75% 25% total Population 55 89% 78%-95%
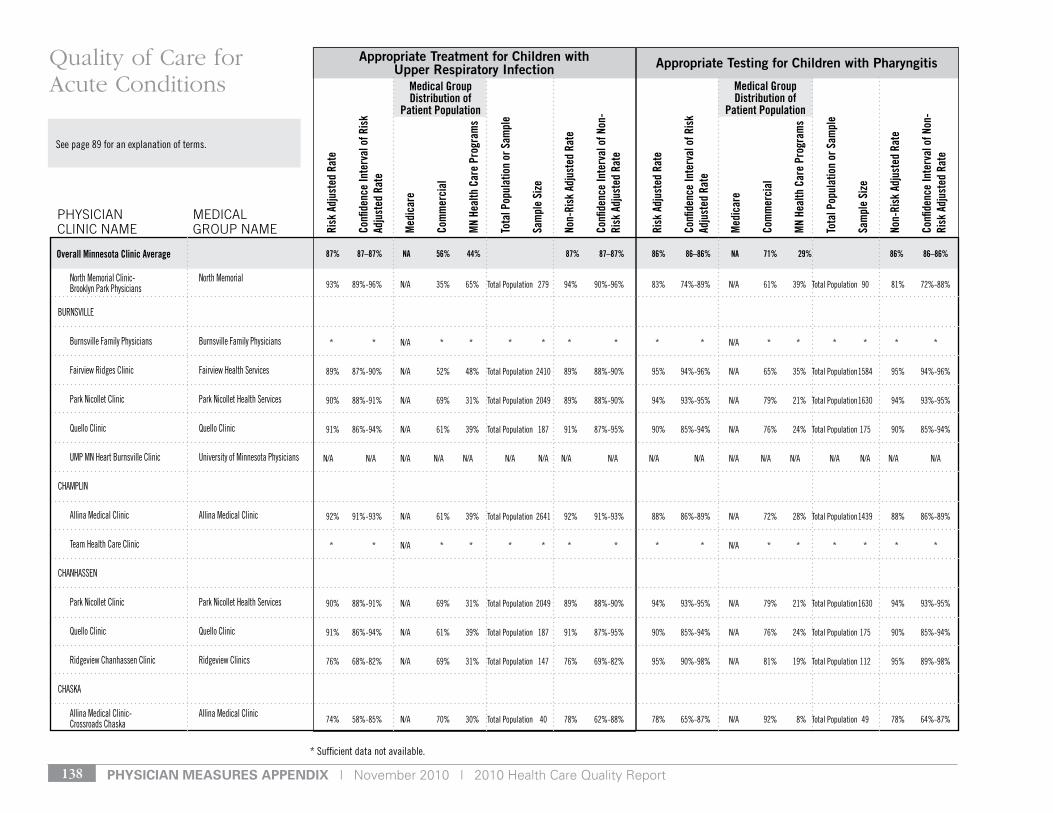
pHysiCian Measures appenDiX | November 2010 | 2010 Health Care Quality Report138
* sufficient data not available.
see page 89 for an explanation of terms.
Risk
Adj
uste
d Ra
te
Confi
denc
e In
terv
al o
f Ris
k Ad
just
ed R
ate
Med
icar
e
Com
mer
cial
MN
Heal
th C
are
Prog
ram
s
Tota
l Pop
ulat
ion
or S
ampl
e
Sam
ple
Size
Non-
Risk
Adj
uste
d Ra
te
Confi
denc
e In
terv
al o
f Non
-Ri
sk A
djus
ted
Rate
Risk
Adj
uste
d Ra
te
Confi
denc
e In
terv
al o
f Ris
k Ad
just
ed R
ate
Med
icar
e
Com
mer
cial
MN
Heal
th C
are
Prog
ram
s
Tota
l Pop
ulat
ion
or S
ampl
e
Sam
ple
Size
Non-
Risk
Adj
uste
d Ra
te
Confi
denc
e In
terv
al o
f Non
-Ri
sk A
djus
ted
Rate
Appropriate Treatment for Children with Upper Respiratory Infection Appropriate Testing for Children with Pharyngitis
PHySIcIAN cLINIc NAME
MEdIcAL GrOuP NAME
Quality of Care for Acute Conditions Medical Group
Distribution of Patient Population
87% 87–87% NA 56% 44% 87% 87–87% 86% 86–86% NA 71% 29% 86% 86–86%
Medical Group Distribution of
Patient Population
Overall Minnesota Clinic Average
north Memorial Clinic- north Memorial Brooklyn Park Physicians
BurnsvIlle
Burnsville Family Physicians Burnsville Family Physicians
Fairview ridges Clinic Fairview Health services
Park nicollet Clinic Park nicollet Health services
Quello Clinic Quello Clinic
uMP Mn Heart Burnsville Clinic university of Minnesota Physicians
CHAMPlIn
Allina Medical Clinic Allina Medical Clinic
team Health Care Clinic
CHAnHAssen
Park nicollet Clinic Park nicollet Health services
Quello Clinic Quello Clinic
ridgeview Chanhassen Clinic ridgeview Clinics
CHAskA
Allina Medical Clinic- Allina Medical Clinic Crossroads Chaska
93% 89%-96% n/A 35% 65% total Population 279 94% 90%-96% 83% 74%-89% n/A 61% 39% total Population 90 81% 72%-88%
* * n/A * * * * * * * * n/A * * * * * *
89% 87%-90% n/A 52% 48% total Population 2410 89% 88%-90% 95% 94%-96% n/A 65% 35% total Population 1584 95% 94%-96%
90% 88%-91% n/A 69% 31% total Population 2049 89% 88%-90% 94% 93%-95% n/A 79% 21% total Population 1630 94% 93%-95%
91% 86%-94% n/A 61% 39% total Population 187 91% 87%-95% 90% 85%-94% n/A 76% 24% total Population 175 90% 85%-94%
n/A n/A n/A n/A n/A n/A n/A n/A n/A n/A n/A n/A n/A n/A n/A n/A n/A n/A
92% 91%-93% n/A 61% 39% total Population 2641 92% 91%-93% 88% 86%-89% n/A 72% 28% total Population 1439 88% 86%-89%
* * n/A * * * * * * * * n/A * * * * * *
90% 88%-91% n/A 69% 31% total Population 2049 89% 88%-90% 94% 93%-95% n/A 79% 21% total Population 1630 94% 93%-95%
91% 86%-94% n/A 61% 39% total Population 187 91% 87%-95% 90% 85%-94% n/A 76% 24% total Population 175 90% 85%-94%
76% 68%-82% n/A 69% 31% total Population 147 76% 69%-82% 95% 90%-98% n/A 81% 19% total Population 112 95% 89%-98%
74% 58%-85% n/A 70% 30% total Population 40 78% 62%-88% 78% 65%-87% n/A 92% 8% total Population 49 78% 64%-87%

November 2010 | 2010 Health Care Quality Report | pHysiCian Measures appenDiX 139
* sufficient data not available.
see page 89 for an explanation of terms.
Risk
Adj
uste
d Ra
te
Confi
denc
e In
terv
al o
f Ris
k Ad
just
ed R
ate
Med
icar
e
Com
mer
cial
MN
Heal
th C
are
Prog
ram
s
Tota
l Pop
ulat
ion
or S
ampl
e
Sam
ple
Size
Non-
Risk
Adj
uste
d Ra
te
Confi
denc
e In
terv
al o
f Non
-Ri
sk A
djus
ted
Rate
Risk
Adj
uste
d Ra
te
Confi
denc
e In
terv
al o
f Ris
k Ad
just
ed R
ate
Med
icar
e
Com
mer
cial
MN
Heal
th C
are
Prog
ram
s
Tota
l Pop
ulat
ion
or S
ampl
e
Sam
ple
Size
Non-
Risk
Adj
uste
d Ra
te
Confi
denc
e In
terv
al o
f Non
-Ri
sk A
djus
ted
Rate
Appropriate Treatment for Children with Upper Respiratory Infection Appropriate Testing for Children with Pharyngitis
PHySIcIAN cLINIc NAME
MEdIcAL GrOuP NAME
Quality of Care for Acute Conditions Medical Group
Distribution of Patient Population
87% 87–87% NA 56% 44% 87% 87–87% 86% 86–86% NA 71% 29% 86% 86–86%
Medical Group Distribution of
Patient Population
Overall Minnesota Clinic Average
Fairview Jonathan Clinic Fairview Health services
lakeview Clinic lakeview Clinic
valley Family Practice valley Family Practice
ColuMBIA HeIgHts
Fairview Columbia Heights Clinic Fairview Health services
Coon rAPIds
Allina Health system- Allina Health system Metropolitan Heart & vascular Institute
Allina Health system- Allina Health system Midwest Internal Medicine
Allina Medical Clinic Allina Medical Clinic
Anoka Area Family Medicine Clinic
dr. Jerrol noller dr. Jerrol noller
HealthPartners HealthPartners Clinics
twin Cities Heart and lung
CottAge grove
Allina Medical Clinic Allina Medical Clinic
Healtheast Healtheast Clinics
89% 87%-90% n/A 52% 48% total Population 2410 89% 88%-90% 95% 94%-96% n/A 65% 35% total Population 1584 95% 94%-96%
87% 82%-90% n/A 77% 23% total Population 351 86% 82%-89% 89% 85%-93% n/A 84% 16% total Population 268 90% 85%-93%
* * n/A * * * * * * * * n/A * * * * * *
92% 86%-96% n/A 55% 45% total Population 105 92% 86%-96% 88% 77%-94% n/A 75% 25% total Population 55 89% 78%-95%
n/A n/A n/A n/A n/A n/A n/A n/A n/A n/A n/A n/A n/A n/A n/A n/A n/A n/A
90% 85%-94% n/A 44% 56% total Population 217 91% 86%-94% 89% 84%-93% n/A 67% 33% total Population 206 89% 84%-92%
92% 91%-93% n/A 61% 39% total Population 2641 92% 91%-93% 88% 86%-89% n/A 72% 28% total Population 1439 88% 86%-89%
* * n/A * * * * * * * * n/A * * * * * *
* * n/A * * * * * * * * n/A * * * * * *
96% 95%-96% n/A 55% 45% total Population 2252 96% 95%-96% 96% 94%-97% n/A 76% 24% total Population 1154 96% 94%-97%
n/A n/A n/A n/A n/A n/A n/A n/A n/A n/A n/A n/A n/A n/A n/A n/A n/A n/A
92% 91%-93% n/A 61% 39% total Population 2641 92% 91%-93% 88% 86%-89% n/A 72% 28% total Population 1439 88% 86%-89%
93% 90%-95% n/A 62% 38% total Population 414 93% 90%-95% 94% 92%-96% n/A 69% 31% total Population 401 94% 92%-96%
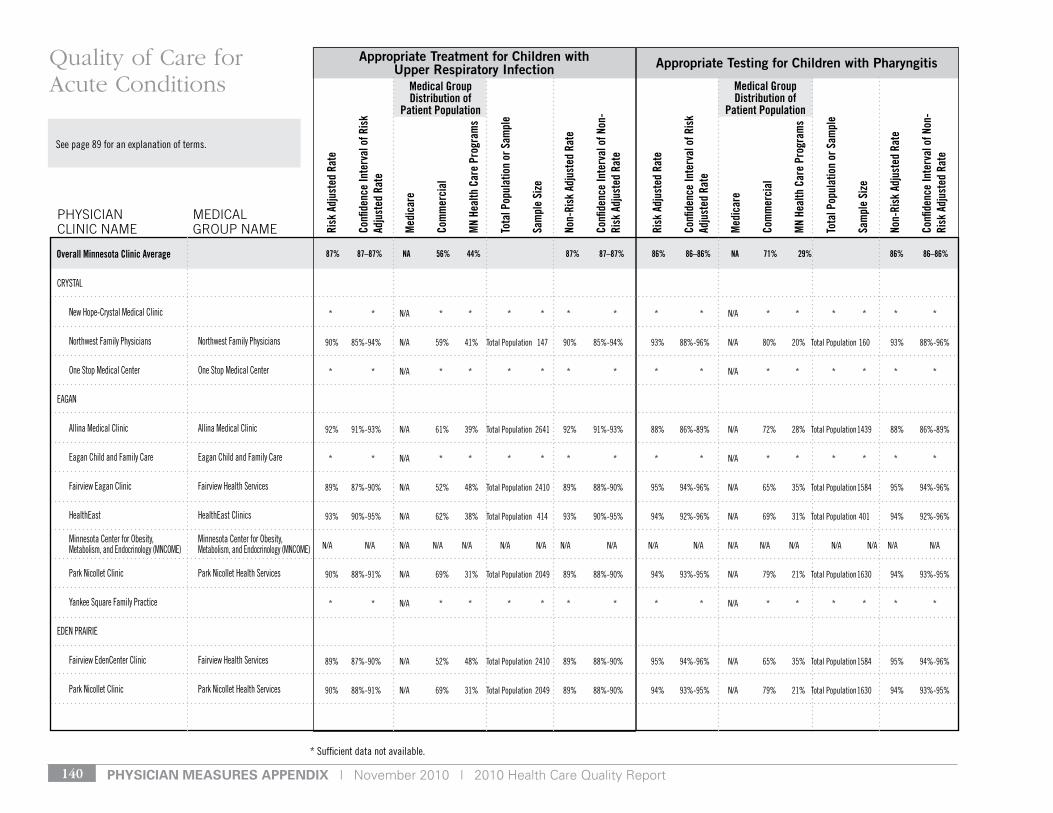
pHysiCian Measures appenDiX | November 2010 | 2010 Health Care Quality Report140
* sufficient data not available.
see page 89 for an explanation of terms.
Risk
Adj
uste
d Ra
te
Confi
denc
e In
terv
al o
f Ris
k Ad
just
ed R
ate
Med
icar
e
Com
mer
cial
MN
Heal
th C
are
Prog
ram
s
Tota
l Pop
ulat
ion
or S
ampl
e
Sam
ple
Size
Non-
Risk
Adj
uste
d Ra
te
Confi
denc
e In
terv
al o
f Non
-Ri
sk A
djus
ted
Rate
Risk
Adj
uste
d Ra
te
Confi
denc
e In
terv
al o
f Ris
k Ad
just
ed R
ate
Med
icar
e
Com
mer
cial
MN
Heal
th C
are
Prog
ram
s
Tota
l Pop
ulat
ion
or S
ampl
e
Sam
ple
Size
Non-
Risk
Adj
uste
d Ra
te
Confi
denc
e In
terv
al o
f Non
-Ri
sk A
djus
ted
Rate
Appropriate Treatment for Children with Upper Respiratory Infection Appropriate Testing for Children with Pharyngitis
PHySIcIAN cLINIc NAME
MEdIcAL GrOuP NAME
Quality of Care for Acute Conditions Medical Group
Distribution of Patient Population
87% 87–87% NA 56% 44% 87% 87–87% 86% 86–86% NA 71% 29% 86% 86–86%
Medical Group Distribution of
Patient Population
Overall Minnesota Clinic Average
CrystAl
new Hope-Crystal Medical Clinic
northwest Family Physicians northwest Family Physicians
one stop Medical Center one stop Medical Center
eAgAn
Allina Medical Clinic Allina Medical Clinic
eagan Child and Family Care eagan Child and Family Care
Fairview eagan Clinic Fairview Health services
Healtheast Healtheast Clinics
Minnesota Center for obesity, Minnesota Center for obesity, Metabolism, and endocrinology (MnCoMe) Metabolism, and endocrinology (MnCoMe)
Park nicollet Clinic Park nicollet Health services
yankee square Family Practice
eden PrAIrIe
Fairview edenCenter Clinic Fairview Health services
Park nicollet Clinic Park nicollet Health services
* * n/A * * * * * * * * n/A * * * * * *
90% 85%-94% n/A 59% 41% total Population 147 90% 85%-94% 93% 88%-96% n/A 80% 20% total Population 160 93% 88%-96%
* * n/A * * * * * * * * n/A * * * * * *
92% 91%-93% n/A 61% 39% total Population 2641 92% 91%-93% 88% 86%-89% n/A 72% 28% total Population 1439 88% 86%-89%
* * n/A * * * * * * * * n/A * * * * * *
89% 87%-90% n/A 52% 48% total Population 2410 89% 88%-90% 95% 94%-96% n/A 65% 35% total Population 1584 95% 94%-96%
93% 90%-95% n/A 62% 38% total Population 414 93% 90%-95% 94% 92%-96% n/A 69% 31% total Population 401 94% 92%-96%
n/A n/A n/A n/A n/A n/A n/A n/A n/A n/A n/A n/A n/A n/A n/A n/A n/A n/A
90% 88%-91% n/A 69% 31% total Population 2049 89% 88%-90% 94% 93%-95% n/A 79% 21% total Population 1630 94% 93%-95%
* * n/A * * * * * * * * n/A * * * * * *
89% 87%-90% n/A 52% 48% total Population 2410 89% 88%-90% 95% 94%-96% n/A 65% 35% total Population 1584 95% 94%-96%
90% 88%-91% n/A 69% 31% total Population 2049 89% 88%-90% 94% 93%-95% n/A 79% 21% total Population 1630 94% 93%-95%

November 2010 | 2010 Health Care Quality Report | pHysiCian Measures appenDiX 141
* sufficient data not available.
see page 89 for an explanation of terms.
Risk
Adj
uste
d Ra
te
Confi
denc
e In
terv
al o
f Ris
k Ad
just
ed R
ate
Med
icar
e
Com
mer
cial
MN
Heal
th C
are
Prog
ram
s
Tota
l Pop
ulat
ion
or S
ampl
e
Sam
ple
Size
Non-
Risk
Adj
uste
d Ra
te
Confi
denc
e In
terv
al o
f Non
-Ri
sk A
djus
ted
Rate
Risk
Adj
uste
d Ra
te
Confi
denc
e In
terv
al o
f Ris
k Ad
just
ed R
ate
Med
icar
e
Com
mer
cial
MN
Heal
th C
are
Prog
ram
s
Tota
l Pop
ulat
ion
or S
ampl
e
Sam
ple
Size
Non-
Risk
Adj
uste
d Ra
te
Confi
denc
e In
terv
al o
f Non
-Ri
sk A
djus
ted
Rate
Appropriate Treatment for Children with Upper Respiratory Infection Appropriate Testing for Children with Pharyngitis
PHySIcIAN cLINIc NAME
MEdIcAL GrOuP NAME
Quality of Care for Acute Conditions Medical Group
Distribution of Patient Population
87% 87–87% NA 56% 44% 87% 87–87% 86% 86–86% NA 71% 29% 86% 86–86%
Medical Group Distribution of
Patient Population
Overall Minnesota Clinic Average
edInA
Allina Health system- Abbott Allina Health system northwestern general Medicine Associates
Allina Medical Clinic Allina Medical Clinic
Consultants Internal Medicine Consultants Internal Medicine
edina Family Physicians edina Family Physicians
edina sports Health & Wellness edina sports Health & Wellness
endocrinology Clinic of Minneapolis endocrinology Clinic of Mpls.
Fairview Crosstown Clinic Fairview Health services
France Avenue Family Physicians France Avenue Family Physicians
one stop Medical Center one stop Medical Center
Quello Clinic Quello Clinic
sharpe dillon Cockson & Associates PA sharpe, dillon, Cockson & Associates
southdale Internal Medicine, PA southdale Internal Medicine, P.A.
the schuster Clinic the schuster Clinic
uMP Mn Heart edina Clinic university of Minnesota Physicians
90% 85%-94% n/A 44% 56% total Population 217 91% 86%-94% 89% 84%-93% n/A 67% 33% total Population 206 89% 84%-92%
92% 91%-93% n/A 61% 39% total Population 2641 92% 91%-93% 88% 86%-89% n/A 72% 28% total Population 1439 88% 86%-89%
* * n/A * * * * * * * * n/A * * * * * *
71% 54%-83% n/A 93% 7% total Population 30 63% 46%-78% * * n/A * * * * * *
* * n/A * * * * * * * * n/A * * * * * *
n/A n/A n/A n/A n/A n/A n/A n/A n/A n/A n/A n/A n/A n/A n/A n/A n/A n/A
89% 87%-90% n/A 52% 48% total Population 2410 89% 88%-90% 95% 94%-96% n/A 65% 35% total Population 1584 95% 94%-96%
* * n/A * * * * * * * * n/A * * * * * *
* * n/A * * * * * * * * n/A * * * * * *
91% 86%-94% n/A 61% 39% total Population 187 91% 87%-95% 90% 85%-94% n/A 76% 24% total Population 175 90% 85%-94%
* * n/A * * * * * * * * n/A * * * * * *
* * n/A * * * * * * * * n/A * * * * * *
n/A n/A n/A n/A n/A n/A n/A n/A n/A n/A n/A n/A n/A n/A n/A n/A n/A n/A
n/A n/A n/A n/A n/A n/A n/A n/A n/A n/A n/A n/A n/A n/A n/A n/A n/A n/A
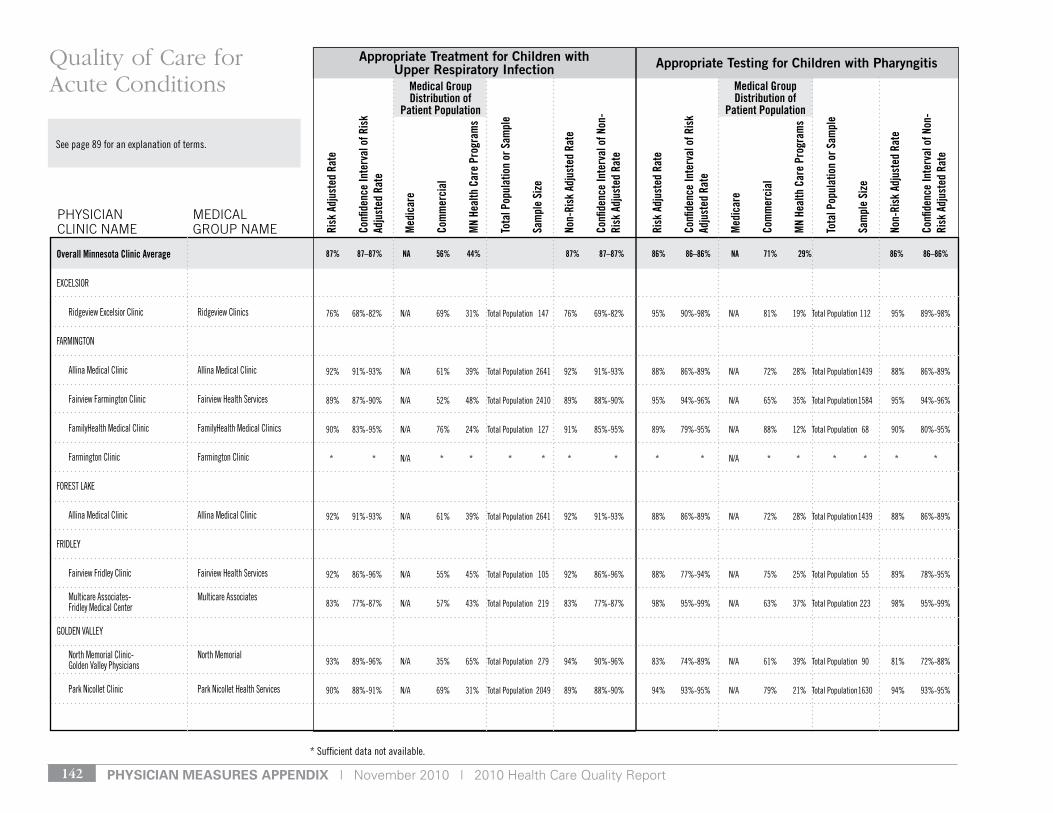
pHysiCian Measures appenDiX | November 2010 | 2010 Health Care Quality Report142
* sufficient data not available.
see page 89 for an explanation of terms.
Risk
Adj
uste
d Ra
te
Confi
denc
e In
terv
al o
f Ris
k Ad
just
ed R
ate
Med
icar
e
Com
mer
cial
MN
Heal
th C
are
Prog
ram
s
Tota
l Pop
ulat
ion
or S
ampl
e
Sam
ple
Size
Non-
Risk
Adj
uste
d Ra
te
Confi
denc
e In
terv
al o
f Non
-Ri
sk A
djus
ted
Rate
Risk
Adj
uste
d Ra
te
Confi
denc
e In
terv
al o
f Ris
k Ad
just
ed R
ate
Med
icar
e
Com
mer
cial
MN
Heal
th C
are
Prog
ram
s
Tota
l Pop
ulat
ion
or S
ampl
e
Sam
ple
Size
Non-
Risk
Adj
uste
d Ra
te
Confi
denc
e In
terv
al o
f Non
-Ri
sk A
djus
ted
Rate
Appropriate Treatment for Children with Upper Respiratory Infection Appropriate Testing for Children with Pharyngitis
PHySIcIAN cLINIc NAME
MEdIcAL GrOuP NAME
Quality of Care for Acute Conditions Medical Group
Distribution of Patient Population
87% 87–87% NA 56% 44% 87% 87–87% 86% 86–86% NA 71% 29% 86% 86–86%
Medical Group Distribution of
Patient Population
Overall Minnesota Clinic Average
eXCelsIor
ridgeview excelsior Clinic ridgeview Clinics
FArMIngton
Allina Medical Clinic Allina Medical Clinic
Fairview Farmington Clinic Fairview Health services
FamilyHealth Medical Clinic FamilyHealth Medical Clinics
Farmington Clinic Farmington Clinic
Forest lAke
Allina Medical Clinic Allina Medical Clinic
FrIdley
Fairview Fridley Clinic Fairview Health services
Multicare Associates- Multicare Associates Fridley Medical Center
golden vAlley
north Memorial Clinic- north Memorial golden valley Physicians
Park nicollet Clinic Park nicollet Health services
76% 68%-82% n/A 69% 31% total Population 147 76% 69%-82% 95% 90%-98% n/A 81% 19% total Population 112 95% 89%-98%
92% 91%-93% n/A 61% 39% total Population 2641 92% 91%-93% 88% 86%-89% n/A 72% 28% total Population 1439 88% 86%-89%
89% 87%-90% n/A 52% 48% total Population 2410 89% 88%-90% 95% 94%-96% n/A 65% 35% total Population 1584 95% 94%-96%
90% 83%-95% n/A 76% 24% total Population 127 91% 85%-95% 89% 79%-95% n/A 88% 12% total Population 68 90% 80%-95%
* * n/A * * * * * * * * n/A * * * * * *
92% 91%-93% n/A 61% 39% total Population 2641 92% 91%-93% 88% 86%-89% n/A 72% 28% total Population 1439 88% 86%-89%
92% 86%-96% n/A 55% 45% total Population 105 92% 86%-96% 88% 77%-94% n/A 75% 25% total Population 55 89% 78%-95%
83% 77%-87% n/A 57% 43% total Population 219 83% 77%-87% 98% 95%-99% n/A 63% 37% total Population 223 98% 95%-99%
93% 89%-96% n/A 35% 65% total Population 279 94% 90%-96% 83% 74%-89% n/A 61% 39% total Population 90 81% 72%-88%
90% 88%-91% n/A 69% 31% total Population 2049 89% 88%-90% 94% 93%-95% n/A 79% 21% total Population 1630 94% 93%-95%
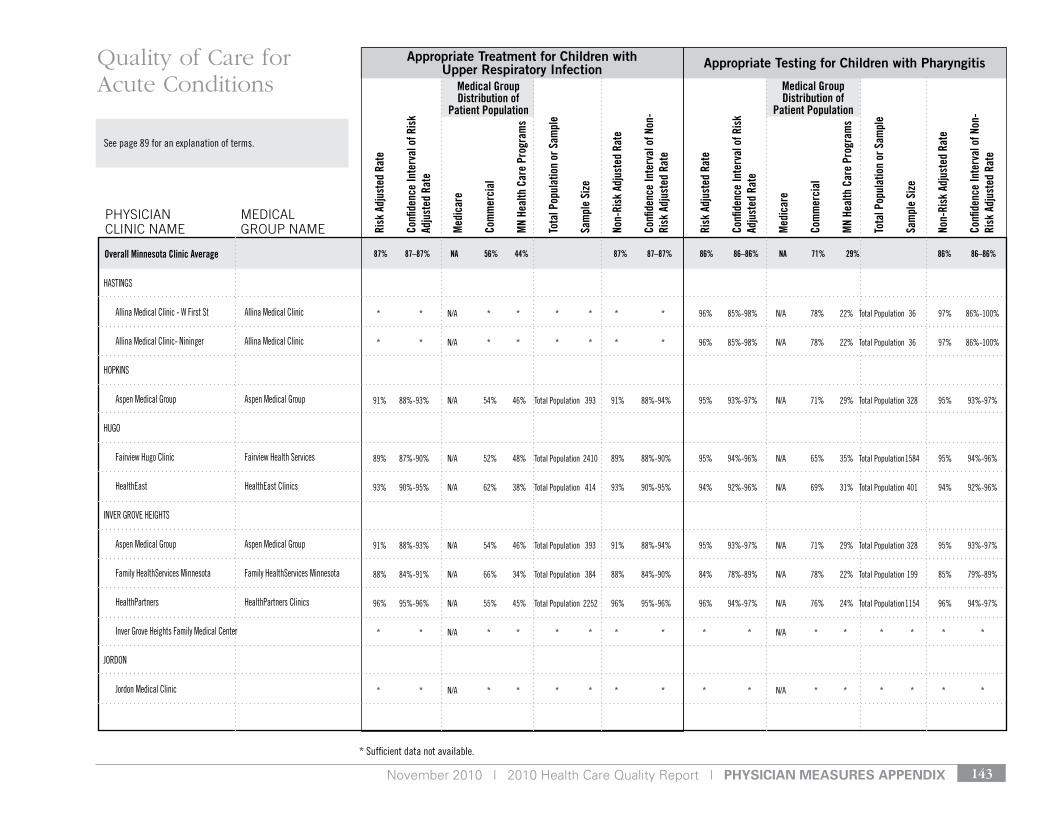
November 2010 | 2010 Health Care Quality Report | pHysiCian Measures appenDiX 143
* sufficient data not available.
see page 89 for an explanation of terms.
Risk
Adj
uste
d Ra
te
Confi
denc
e In
terv
al o
f Ris
k Ad
just
ed R
ate
Med
icar
e
Com
mer
cial
MN
Heal
th C
are
Prog
ram
s
Tota
l Pop
ulat
ion
or S
ampl
e
Sam
ple
Size
Non-
Risk
Adj
uste
d Ra
te
Confi
denc
e In
terv
al o
f Non
-Ri
sk A
djus
ted
Rate
Risk
Adj
uste
d Ra
te
Confi
denc
e In
terv
al o
f Ris
k Ad
just
ed R
ate
Med
icar
e
Com
mer
cial
MN
Heal
th C
are
Prog
ram
s
Tota
l Pop
ulat
ion
or S
ampl
e
Sam
ple
Size
Non-
Risk
Adj
uste
d Ra
te
Confi
denc
e In
terv
al o
f Non
-Ri
sk A
djus
ted
Rate
Appropriate Treatment for Children with Upper Respiratory Infection Appropriate Testing for Children with Pharyngitis
PHySIcIAN cLINIc NAME
MEdIcAL GrOuP NAME
Quality of Care for Acute Conditions Medical Group
Distribution of Patient Population
87% 87–87% NA 56% 44% 87% 87–87% 86% 86–86% NA 71% 29% 86% 86–86%
Medical Group Distribution of
Patient Population
Overall Minnesota Clinic Average
HAstIngs
Allina Medical Clinic - W First st Allina Medical Clinic
Allina Medical Clinic- nininger Allina Medical Clinic
HoPkIns
Aspen Medical group Aspen Medical group
Hugo
Fairview Hugo Clinic Fairview Health services
Healtheast Healtheast Clinics
Inver grove HeIgHts
Aspen Medical group Aspen Medical group
Family Healthservices Minnesota Family Healthservices Minnesota
HealthPartners HealthPartners Clinics
Inver grove Heights Family Medical Center
Jordon
Jordon Medical Clinic
* * n/A * * * * * * 96% 85%-98% n/A 78% 22% total Population 36 97% 86%-100%
* * n/A * * * * * * 96% 85%-98% n/A 78% 22% total Population 36 97% 86%-100%
91% 88%-93% n/A 54% 46% total Population 393 91% 88%-94% 95% 93%-97% n/A 71% 29% total Population 328 95% 93%-97%
89% 87%-90% n/A 52% 48% total Population 2410 89% 88%-90% 95% 94%-96% n/A 65% 35% total Population 1584 95% 94%-96%
93% 90%-95% n/A 62% 38% total Population 414 93% 90%-95% 94% 92%-96% n/A 69% 31% total Population 401 94% 92%-96%
91% 88%-93% n/A 54% 46% total Population 393 91% 88%-94% 95% 93%-97% n/A 71% 29% total Population 328 95% 93%-97%
88% 84%-91% n/A 66% 34% total Population 384 88% 84%-90% 84% 78%-89% n/A 78% 22% total Population 199 85% 79%-89%
96% 95%-96% n/A 55% 45% total Population 2252 96% 95%-96% 96% 94%-97% n/A 76% 24% total Population 1154 96% 94%-97%
* * n/A * * * * * * * * n/A * * * * * *
* * n/A * * * * * * * * n/A * * * * * *
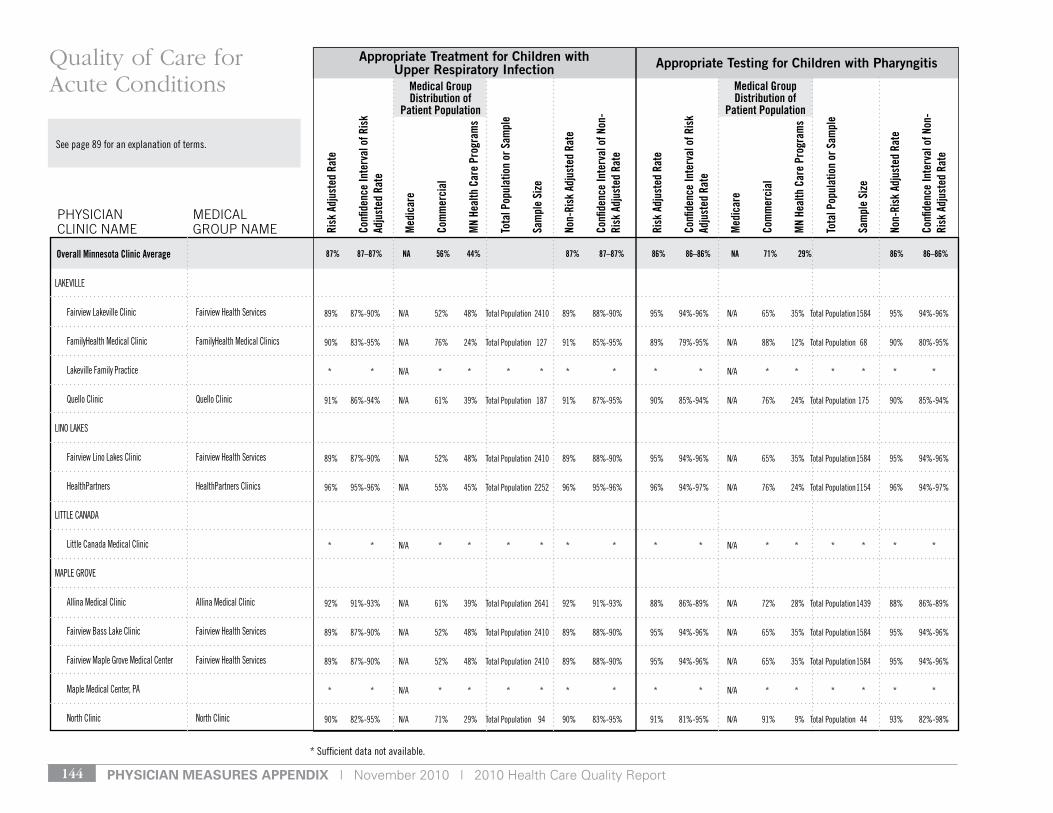
pHysiCian Measures appenDiX | November 2010 | 2010 Health Care Quality Report144
* sufficient data not available.
see page 89 for an explanation of terms.
Risk
Adj
uste
d Ra
te
Confi
denc
e In
terv
al o
f Ris
k Ad
just
ed R
ate
Med
icar
e
Com
mer
cial
MN
Heal
th C
are
Prog
ram
s
Tota
l Pop
ulat
ion
or S
ampl
e
Sam
ple
Size
Non-
Risk
Adj
uste
d Ra
te
Confi
denc
e In
terv
al o
f Non
-Ri
sk A
djus
ted
Rate
Risk
Adj
uste
d Ra
te
Confi
denc
e In
terv
al o
f Ris
k Ad
just
ed R
ate
Med
icar
e
Com
mer
cial
MN
Heal
th C
are
Prog
ram
s
Tota
l Pop
ulat
ion
or S
ampl
e
Sam
ple
Size
Non-
Risk
Adj
uste
d Ra
te
Confi
denc
e In
terv
al o
f Non
-Ri
sk A
djus
ted
Rate
Appropriate Treatment for Children with Upper Respiratory Infection Appropriate Testing for Children with Pharyngitis
PHySIcIAN cLINIc NAME
MEdIcAL GrOuP NAME
Quality of Care for Acute Conditions Medical Group
Distribution of Patient Population
87% 87–87% NA 56% 44% 87% 87–87% 86% 86–86% NA 71% 29% 86% 86–86%
Medical Group Distribution of
Patient Population
Overall Minnesota Clinic Average
lAkevIlle
Fairview lakeville Clinic Fairview Health services
FamilyHealth Medical Clinic FamilyHealth Medical Clinics
lakeville Family Practice
Quello Clinic Quello Clinic
lIno lAkes
Fairview lino lakes Clinic Fairview Health services
HealthPartners HealthPartners Clinics
lIttle CAnAdA
little Canada Medical Clinic
MAPle grove
Allina Medical Clinic Allina Medical Clinic
Fairview Bass lake Clinic Fairview Health services
Fairview Maple grove Medical Center Fairview Health services
Maple Medical Center, PA
north Clinic north Clinic
89% 87%-90% n/A 52% 48% total Population 2410 89% 88%-90% 95% 94%-96% n/A 65% 35% total Population 1584 95% 94%-96%
90% 83%-95% n/A 76% 24% total Population 127 91% 85%-95% 89% 79%-95% n/A 88% 12% total Population 68 90% 80%-95%
* * n/A * * * * * * * * n/A * * * * * *
91% 86%-94% n/A 61% 39% total Population 187 91% 87%-95% 90% 85%-94% n/A 76% 24% total Population 175 90% 85%-94%
89% 87%-90% n/A 52% 48% total Population 2410 89% 88%-90% 95% 94%-96% n/A 65% 35% total Population 1584 95% 94%-96%
96% 95%-96% n/A 55% 45% total Population 2252 96% 95%-96% 96% 94%-97% n/A 76% 24% total Population 1154 96% 94%-97%
* * n/A * * * * * * * * n/A * * * * * *
92% 91%-93% n/A 61% 39% total Population 2641 92% 91%-93% 88% 86%-89% n/A 72% 28% total Population 1439 88% 86%-89%
89% 87%-90% n/A 52% 48% total Population 2410 89% 88%-90% 95% 94%-96% n/A 65% 35% total Population 1584 95% 94%-96%
89% 87%-90% n/A 52% 48% total Population 2410 89% 88%-90% 95% 94%-96% n/A 65% 35% total Population 1584 95% 94%-96%
* * n/A * * * * * * * * n/A * * * * * *
90% 82%-95% n/A 71% 29% total Population 94 90% 83%-95% 91% 81%-95% n/A 91% 9% total Population 44 93% 82%-98%

November 2010 | 2010 Health Care Quality Report | pHysiCian Measures appenDiX 145
* sufficient data not available.
see page 89 for an explanation of terms.
Risk
Adj
uste
d Ra
te
Confi
denc
e In
terv
al o
f Ris
k Ad
just
ed R
ate
Med
icar
e
Com
mer
cial
MN
Heal
th C
are
Prog
ram
s
Tota
l Pop
ulat
ion
or S
ampl
e
Sam
ple
Size
Non-
Risk
Adj
uste
d Ra
te
Confi
denc
e In
terv
al o
f Non
-Ri
sk A
djus
ted
Rate
Risk
Adj
uste
d Ra
te
Confi
denc
e In
terv
al o
f Ris
k Ad
just
ed R
ate
Med
icar
e
Com
mer
cial
MN
Heal
th C
are
Prog
ram
s
Tota
l Pop
ulat
ion
or S
ampl
e
Sam
ple
Size
Non-
Risk
Adj
uste
d Ra
te
Confi
denc
e In
terv
al o
f Non
-Ri
sk A
djus
ted
Rate
Appropriate Treatment for Children with Upper Respiratory Infection Appropriate Testing for Children with Pharyngitis
PHySIcIAN cLINIc NAME
MEdIcAL GrOuP NAME
Quality of Care for Acute Conditions Medical Group
Distribution of Patient Population
87% 87–87% NA 56% 44% 87% 87–87% 86% 86–86% NA 71% 29% 86% 86–86%
Medical Group Distribution of
Patient Population
Overall Minnesota Clinic Average
north Memorial Clinic- north Memorial Camden Physicians Maple grove
Park nicollet Clinic Park nicollet Health services
MAPleWood
Aspen Medical group Aspen Medical group
Attending Physicians Attending Physicians
Family Healthservices Minnesota- Family Healthservices Minnesota Afton road
Healtheast Healtheast Clinics
HealthPartners HealthPartners Clinics
st. Paul Cardiology st. Paul Cardiology
st. Paul Heart Clinic st. Paul Heart
MInneAPolIs
Allina Health system- Abbott Allina Health system northwestern general Medicine Associates
Allina Health system- Allina Health system Minneapolis Heart Institute
Allina Medical Clinic- Isles Allina Medical Clinic
Allina Medical Clinic- nicollet Mall Allina Medical Clinic
Allina Medical Clinic- the doctors uptown Allina Medical Clinic
94% 88%-97% n/A 64% 36% total Population 104 93% 87%-97% 93% 80%-97% n/A 70% 30% total Population 40 93% 80%-97%
90% 88%-91% n/A 69% 31% total Population 2049 89% 88%-90% 94% 93%-95% n/A 79% 21% total Population 1630 94% 93%-95%
91% 88%-93% n/A 54% 46% total Population 393 91% 88%-94% 95% 93%-97% n/A 71% 29% total Population 328 95% 93%-97%
* * n/A * * * * * * * * n/A * * * * * *
88% 84%-91% n/A 66% 34% total Population 384 88% 84%-90% 84% 78%-89% n/A 78% 22% total Population 199 85% 79%-89%
93% 90%-95% n/A 62% 38% total Population 414 93% 90%-95% 94% 92%-96% n/A 69% 31% total Population 401 94% 92%-96%
96% 95%-96% n/A 55% 45% total Population 2252 96% 95%-96% 96% 94%-97% n/A 76% 24% total Population 1154 96% 94%-97%
n/A n/A n/A n/A n/A n/A n/A n/A n/A n/A n/A n/A n/A n/A n/A n/A n/A n/A
n/A n/A n/A n/A n/A n/A n/A n/A n/A n/A n/A n/A n/A n/A n/A n/A n/A n/A
90% 85%-94% n/A 44% 56% total Population 217 91% 86%-94% 89% 84%-93% n/A 67% 33% total Population 206 89% 84%-92%
n/A n/A n/A n/A n/A n/A n/A n/A n/A n/A n/A n/A n/A n/A n/A n/A n/A n/A
92% 91%-93% n/A 61% 39% total Population 2641 92% 91%-93% 88% 86%-89% n/A 72% 28% total Population 1439 88% 86%-89%
92% 91%-93% n/A 61% 39% total Population 2641 92% 91%-93% 88% 86%-89% n/A 72% 28% total Population 1439 88% 86%-89%
92% 91%-93% n/A 61% 39% total Population 2641 92% 91%-93% 88% 86%-89% n/A 72% 28% total Population 1439 88% 86%-89%
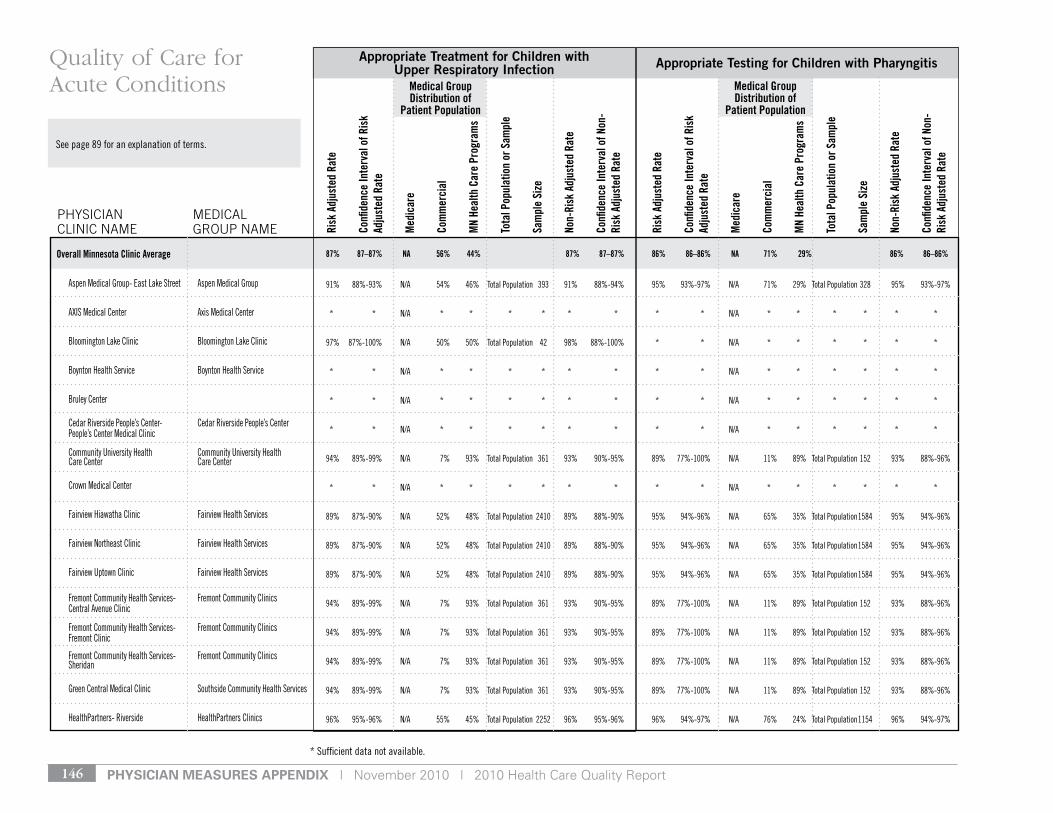
pHysiCian Measures appenDiX | November 2010 | 2010 Health Care Quality Report146
* sufficient data not available.
see page 89 for an explanation of terms.
Risk
Adj
uste
d Ra
te
Confi
denc
e In
terv
al o
f Ris
k Ad
just
ed R
ate
Med
icar
e
Com
mer
cial
MN
Heal
th C
are
Prog
ram
s
Tota
l Pop
ulat
ion
or S
ampl
e
Sam
ple
Size
Non-
Risk
Adj
uste
d Ra
te
Confi
denc
e In
terv
al o
f Non
-Ri
sk A
djus
ted
Rate
Risk
Adj
uste
d Ra
te
Confi
denc
e In
terv
al o
f Ris
k Ad
just
ed R
ate
Med
icar
e
Com
mer
cial
MN
Heal
th C
are
Prog
ram
s
Tota
l Pop
ulat
ion
or S
ampl
e
Sam
ple
Size
Non-
Risk
Adj
uste
d Ra
te
Confi
denc
e In
terv
al o
f Non
-Ri
sk A
djus
ted
Rate
Appropriate Treatment for Children with Upper Respiratory Infection Appropriate Testing for Children with Pharyngitis
PHySIcIAN cLINIc NAME
MEdIcAL GrOuP NAME
Quality of Care for Acute Conditions Medical Group
Distribution of Patient Population
87% 87–87% NA 56% 44% 87% 87–87% 86% 86–86% NA 71% 29% 86% 86–86%
Medical Group Distribution of
Patient Population
Overall Minnesota Clinic Average
Aspen Medical group- east lake street Aspen Medical group
AXIs Medical Center Axis Medical Center
Bloomington lake Clinic Bloomington lake Clinic
Boynton Health service Boynton Health service
Bruley Center
Cedar riverside People’s Center- Cedar riverside People’s Center People’s Center Medical Clinic
Community university Health Community university Health Care Center Care Center
Crown Medical Center
Fairview Hiawatha Clinic Fairview Health services
Fairview northeast Clinic Fairview Health services
Fairview uptown Clinic Fairview Health services
Fremont Community Health services- Fremont Community Clinics Central Avenue Clinic
Fremont Community Health services- Fremont Community Clinics Fremont Clinic
Fremont Community Health services- Fremont Community Clinics sheridan
green Central Medical Clinic southside Community Health services
HealthPartners- riverside HealthPartners Clinics
91% 88%-93% n/A 54% 46% total Population 393 91% 88%-94% 95% 93%-97% n/A 71% 29% total Population 328 95% 93%-97%
* * n/A * * * * * * * * n/A * * * * * *
97% 87%-100% n/A 50% 50% total Population 42 98% 88%-100% * * n/A * * * * * *
* * n/A * * * * * * * * n/A * * * * * *
* * n/A * * * * * * * * n/A * * * * * *
* * n/A * * * * * * * * n/A * * * * * *
94% 89%-99% n/A 7% 93% total Population 361 93% 90%-95% 89% 77%-100% n/A 11% 89% total Population 152 93% 88%-96%
* * n/A * * * * * * * * n/A * * * * * *
89% 87%-90% n/A 52% 48% total Population 2410 89% 88%-90% 95% 94%-96% n/A 65% 35% total Population 1584 95% 94%-96%
89% 87%-90% n/A 52% 48% total Population 2410 89% 88%-90% 95% 94%-96% n/A 65% 35% total Population 1584 95% 94%-96%
89% 87%-90% n/A 52% 48% total Population 2410 89% 88%-90% 95% 94%-96% n/A 65% 35% total Population 1584 95% 94%-96%
94% 89%-99% n/A 7% 93% total Population 361 93% 90%-95% 89% 77%-100% n/A 11% 89% total Population 152 93% 88%-96%
94% 89%-99% n/A 7% 93% total Population 361 93% 90%-95% 89% 77%-100% n/A 11% 89% total Population 152 93% 88%-96%
94% 89%-99% n/A 7% 93% total Population 361 93% 90%-95% 89% 77%-100% n/A 11% 89% total Population 152 93% 88%-96%
94% 89%-99% n/A 7% 93% total Population 361 93% 90%-95% 89% 77%-100% n/A 11% 89% total Population 152 93% 88%-96%
96% 95%-96% n/A 55% 45% total Population 2252 96% 95%-96% 96% 94%-97% n/A 76% 24% total Population 1154 96% 94%-97%
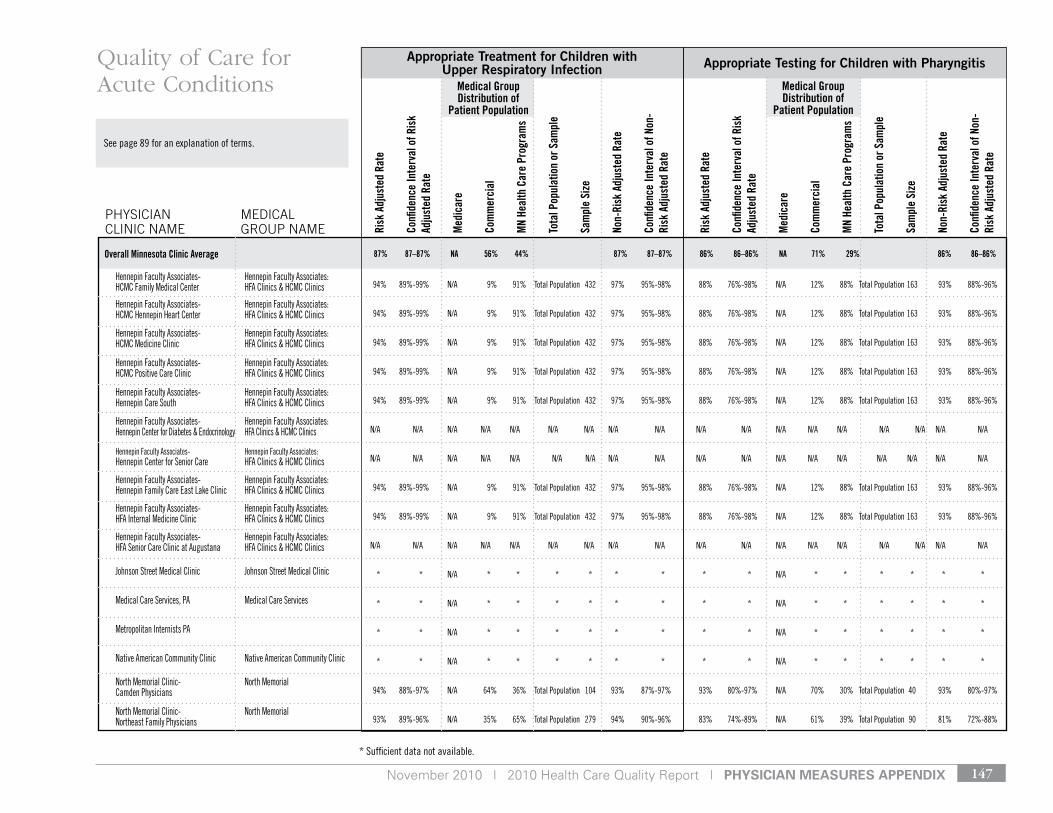
November 2010 | 2010 Health Care Quality Report | pHysiCian Measures appenDiX 147
* sufficient data not available.
see page 89 for an explanation of terms.
Risk
Adj
uste
d Ra
te
Confi
denc
e In
terv
al o
f Ris
k Ad
just
ed R
ate
Med
icar
e
Com
mer
cial
MN
Heal
th C
are
Prog
ram
s
Tota
l Pop
ulat
ion
or S
ampl
e
Sam
ple
Size
Non-
Risk
Adj
uste
d Ra
te
Confi
denc
e In
terv
al o
f Non
-Ri
sk A
djus
ted
Rate
Risk
Adj
uste
d Ra
te
Confi
denc
e In
terv
al o
f Ris
k Ad
just
ed R
ate
Med
icar
e
Com
mer
cial
MN
Heal
th C
are
Prog
ram
s
Tota
l Pop
ulat
ion
or S
ampl
e
Sam
ple
Size
Non-
Risk
Adj
uste
d Ra
te
Confi
denc
e In
terv
al o
f Non
-Ri
sk A
djus
ted
Rate
Appropriate Treatment for Children with Upper Respiratory Infection Appropriate Testing for Children with Pharyngitis
PHySIcIAN cLINIc NAME
MEdIcAL GrOuP NAME
Quality of Care for Acute Conditions Medical Group
Distribution of Patient Population
87% 87–87% NA 56% 44% 87% 87–87% 86% 86–86% NA 71% 29% 86% 86–86%
Medical Group Distribution of
Patient Population
Overall Minnesota Clinic Average
Hennepin Faculty Associates- Hennepin Faculty Associates: HCMC Family Medical Center HFA Clinics & HCMC Clinics
Hennepin Faculty Associates- Hennepin Faculty Associates: HCMC Hennepin Heart Center HFA Clinics & HCMC Clinics
Hennepin Faculty Associates- Hennepin Faculty Associates: HCMC Medicine Clinic HFA Clinics & HCMC Clinics
Hennepin Faculty Associates- Hennepin Faculty Associates: HCMC Positive Care Clinic HFA Clinics & HCMC Clinics
Hennepin Faculty Associates- Hennepin Faculty Associates: Hennepin Care south HFA Clinics & HCMC Clinics
Hennepin Faculty Associates- Hennepin Faculty Associates: Hennepin Center for diabetes & endocrinology HFA Clinics & HCMC Clinics
Hennepin Faculty Associates- Hennepin Faculty Associates: Hennepin Center for senior Care HFA Clinics & HCMC Clinics
Hennepin Faculty Associates- Hennepin Faculty Associates: Hennepin Family Care east lake Clinic HFA Clinics & HCMC Clinics
Hennepin Faculty Associates- Hennepin Faculty Associates: HFA Internal Medicine Clinic HFA Clinics & HCMC Clinics
Hennepin Faculty Associates- Hennepin Faculty Associates: HFA senior Care Clinic at Augustana HFA Clinics & HCMC Clinics
Johnson street Medical Clinic Johnson street Medical Clinic
Medical Care services, PA Medical Care services
Metropolitan Internists PA
native American Community Clinic native American Community Clinic
north Memorial Clinic- north Memorial Camden Physicians
north Memorial Clinic- north Memorial northeast Family Physicians
94% 89%-99% n/A 9% 91% total Population 432 97% 95%-98% 88% 76%-98% n/A 12% 88% total Population 163 93% 88%-96%
94% 89%-99% n/A 9% 91% total Population 432 97% 95%-98% 88% 76%-98% n/A 12% 88% total Population 163 93% 88%-96%
94% 89%-99% n/A 9% 91% total Population 432 97% 95%-98% 88% 76%-98% n/A 12% 88% total Population 163 93% 88%-96%
94% 89%-99% n/A 9% 91% total Population 432 97% 95%-98% 88% 76%-98% n/A 12% 88% total Population 163 93% 88%-96%
94% 89%-99% n/A 9% 91% total Population 432 97% 95%-98% 88% 76%-98% n/A 12% 88% total Population 163 93% 88%-96%
n/A n/A n/A n/A n/A n/A n/A n/A n/A n/A n/A n/A n/A n/A n/A n/A n/A n/A
n/A n/A n/A n/A n/A n/A n/A n/A n/A n/A n/A n/A n/A n/A n/A n/A n/A n/A
94% 89%-99% n/A 9% 91% total Population 432 97% 95%-98% 88% 76%-98% n/A 12% 88% total Population 163 93% 88%-96%
94% 89%-99% n/A 9% 91% total Population 432 97% 95%-98% 88% 76%-98% n/A 12% 88% total Population 163 93% 88%-96%
n/A n/A n/A n/A n/A n/A n/A n/A n/A n/A n/A n/A n/A n/A n/A n/A n/A n/A
* * n/A * * * * * * * * n/A * * * * * *
* * n/A * * * * * * * * n/A * * * * * *
* * n/A * * * * * * * * n/A * * * * * *
* * n/A * * * * * * * * n/A * * * * * *
94% 88%-97% n/A 64% 36% total Population 104 93% 87%-97% 93% 80%-97% n/A 70% 30% total Population 40 93% 80%-97%
93% 89%-96% n/A 35% 65% total Population 279 94% 90%-96% 83% 74%-89% n/A 61% 39% total Population 90 81% 72%-88%
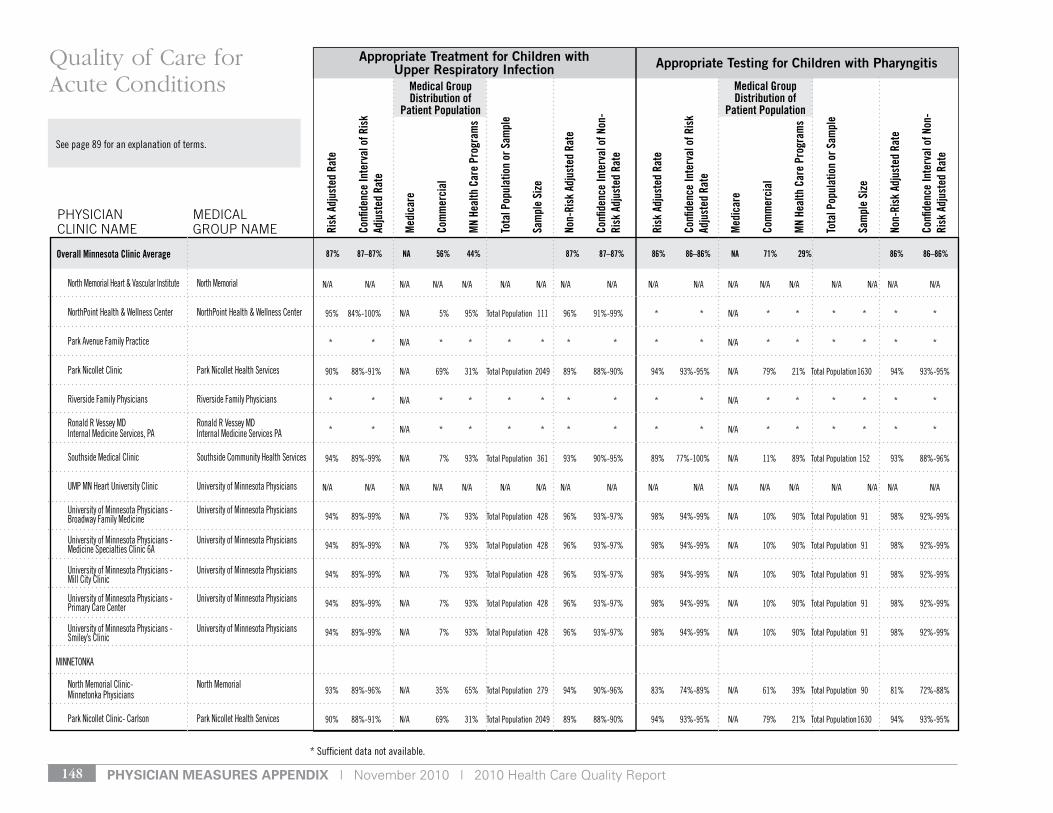
pHysiCian Measures appenDiX | November 2010 | 2010 Health Care Quality Report148
* sufficient data not available.
see page 89 for an explanation of terms.
Risk
Adj
uste
d Ra
te
Confi
denc
e In
terv
al o
f Ris
k Ad
just
ed R
ate
Med
icar
e
Com
mer
cial
MN
Heal
th C
are
Prog
ram
s
Tota
l Pop
ulat
ion
or S
ampl
e
Sam
ple
Size
Non-
Risk
Adj
uste
d Ra
te
Confi
denc
e In
terv
al o
f Non
-Ri
sk A
djus
ted
Rate
Risk
Adj
uste
d Ra
te
Confi
denc
e In
terv
al o
f Ris
k Ad
just
ed R
ate
Med
icar
e
Com
mer
cial
MN
Heal
th C
are
Prog
ram
s
Tota
l Pop
ulat
ion
or S
ampl
e
Sam
ple
Size
Non-
Risk
Adj
uste
d Ra
te
Confi
denc
e In
terv
al o
f Non
-Ri
sk A
djus
ted
Rate
Appropriate Treatment for Children with Upper Respiratory Infection Appropriate Testing for Children with Pharyngitis
PHySIcIAN cLINIc NAME
MEdIcAL GrOuP NAME
Quality of Care for Acute Conditions Medical Group
Distribution of Patient Population
87% 87–87% NA 56% 44% 87% 87–87% 86% 86–86% NA 71% 29% 86% 86–86%
Medical Group Distribution of
Patient Population
Overall Minnesota Clinic Average
north Memorial Heart & vascular Institute north Memorial
northPoint Health & Wellness Center northPoint Health & Wellness Center
Park Avenue Family Practice
Park nicollet Clinic Park nicollet Health services
riverside Family Physicians riverside Family Physicians
ronald r vessey Md ronald r vessey Md Internal Medicine services, PA Internal Medicine services PA
southside Medical Clinic southside Community Health services
uMP Mn Heart university Clinic university of Minnesota Physicians
university of Minnesota Physicians - university of Minnesota Physicians Broadway Family Medicine
university of Minnesota Physicians - university of Minnesota Physicians Medicine specialties Clinic 6A
university of Minnesota Physicians - university of Minnesota Physicians Mill City Clinic
university of Minnesota Physicians - university of Minnesota Physicians Primary Care Center
university of Minnesota Physicians - university of Minnesota Physicians smiley’s Clinic
MInnetonkA
north Memorial Clinic- north Memorial Minnetonka Physicians
Park nicollet Clinic- Carlson Park nicollet Health services
n/A n/A n/A n/A n/A n/A n/A n/A n/A n/A n/A n/A n/A n/A n/A n/A n/A n/A
95% 84%-100% n/A 5% 95% total Population 111 96% 91%-99% * * n/A * * * * * *
* * n/A * * * * * * * * n/A * * * * * *
90% 88%-91% n/A 69% 31% total Population 2049 89% 88%-90% 94% 93%-95% n/A 79% 21% total Population 1630 94% 93%-95%
* * n/A * * * * * * * * n/A * * * * * *
* * n/A * * * * * * * * n/A * * * * * *
94% 89%-99% n/A 7% 93% total Population 361 93% 90%-95% 89% 77%-100% n/A 11% 89% total Population 152 93% 88%-96%
n/A n/A n/A n/A n/A n/A n/A n/A n/A n/A n/A n/A n/A n/A n/A n/A n/A n/A
94% 89%-99% n/A 7% 93% total Population 428 96% 93%-97% 98% 94%-99% n/A 10% 90% total Population 91 98% 92%-99%
94% 89%-99% n/A 7% 93% total Population 428 96% 93%-97% 98% 94%-99% n/A 10% 90% total Population 91 98% 92%-99%
94% 89%-99% n/A 7% 93% total Population 428 96% 93%-97% 98% 94%-99% n/A 10% 90% total Population 91 98% 92%-99%
94% 89%-99% n/A 7% 93% total Population 428 96% 93%-97% 98% 94%-99% n/A 10% 90% total Population 91 98% 92%-99%
94% 89%-99% n/A 7% 93% total Population 428 96% 93%-97% 98% 94%-99% n/A 10% 90% total Population 91 98% 92%-99%
93% 89%-96% n/A 35% 65% total Population 279 94% 90%-96% 83% 74%-89% n/A 61% 39% total Population 90 81% 72%-88%
90% 88%-91% n/A 69% 31% total Population 2049 89% 88%-90% 94% 93%-95% n/A 79% 21% total Population 1630 94% 93%-95%

November 2010 | 2010 Health Care Quality Report | pHysiCian Measures appenDiX 149
* sufficient data not available.
see page 89 for an explanation of terms.
Risk
Adj
uste
d Ra
te
Confi
denc
e In
terv
al o
f Ris
k Ad
just
ed R
ate
Med
icar
e
Com
mer
cial
MN
Heal
th C
are
Prog
ram
s
Tota
l Pop
ulat
ion
or S
ampl
e
Sam
ple
Size
Non-
Risk
Adj
uste
d Ra
te
Confi
denc
e In
terv
al o
f Non
-Ri
sk A
djus
ted
Rate
Risk
Adj
uste
d Ra
te
Confi
denc
e In
terv
al o
f Ris
k Ad
just
ed R
ate
Med
icar
e
Com
mer
cial
MN
Heal
th C
are
Prog
ram
s
Tota
l Pop
ulat
ion
or S
ampl
e
Sam
ple
Size
Non-
Risk
Adj
uste
d Ra
te
Confi
denc
e In
terv
al o
f Non
-Ri
sk A
djus
ted
Rate
Appropriate Treatment for Children with Upper Respiratory Infection Appropriate Testing for Children with Pharyngitis
PHySIcIAN cLINIc NAME
MEdIcAL GrOuP NAME
Quality of Care for Acute Conditions Medical Group
Distribution of Patient Population
87% 87–87% NA 56% 44% 87% 87–87% 86% 86–86% NA 71% 29% 86% 86–86%
Medical Group Distribution of
Patient Population
Overall Minnesota Clinic Average
neW PrAgue
Parkview Medical Clinic Parkview Medical Clinic
Queen of Peace Hospital- Queen of Peace Hospital - outpatient Clinic outpatient Clinic
southern Metro Medical Clinics- southern Metro Medical Clinics new Prague Medical Clinic
nortH st. PAul
Family Healthservices Minnesota- Family Healthservices Minnesota north st. Paul Clinic
nortHFIeld
FamilyHealth Medical Clinic FamilyHealth Medical Clinics
norWood
lakeview Clinic lakeview Clinic
oAkdAle
Healtheast Healtheast Clinics
osseo
north Clinic north Clinic
PlyMoutH
Allina Medical Clinic- West Health Campus Allina Medical Clinic
40% 25%-57% n/A 79% 21% total Population 33 36% 22%-53% 94% 88%-98% n/A 85% 15% total Population 114 96% 90%-98%
* * n/A * * * * * * * * n/A * * * * * *
64% 51%-76% n/A 87% 13% total Population 91 63% 52%-72% 83% 73%-91% n/A 95% 5% total Population 95 84% 76%-90%
88% 84%-91% n/A 66% 34% total Population 384 88% 84%-90% 84% 78%-89% n/A 78% 22% total Population 199 85% 79%-89%
90% 83%-95% n/A 76% 24% total Population 127 91% 85%-95% 89% 79%-95% n/A 88% 12% total Population 68 90% 80%-95%
87% 82%-90% n/A 77% 23% total Population 351 86% 82%-89% 89% 85%-93% n/A 84% 16% total Population 268 90% 85%-93%
93% 90%-95% n/A 62% 38% total Population 414 93% 90%-95% 94% 92%-96% n/A 69% 31% total Population 401 94% 92%-96%
90% 82%-95% n/A 71% 29% total Population 94 90% 83%-95% 91% 81%-95% n/A 91% 9% total Population 44 93% 82%-98%
92% 91%-93% n/A 61% 39% total Population 2641 92% 91%-93% 88% 86%-89% n/A 72% 28% total Population 1439 88% 86%-89%
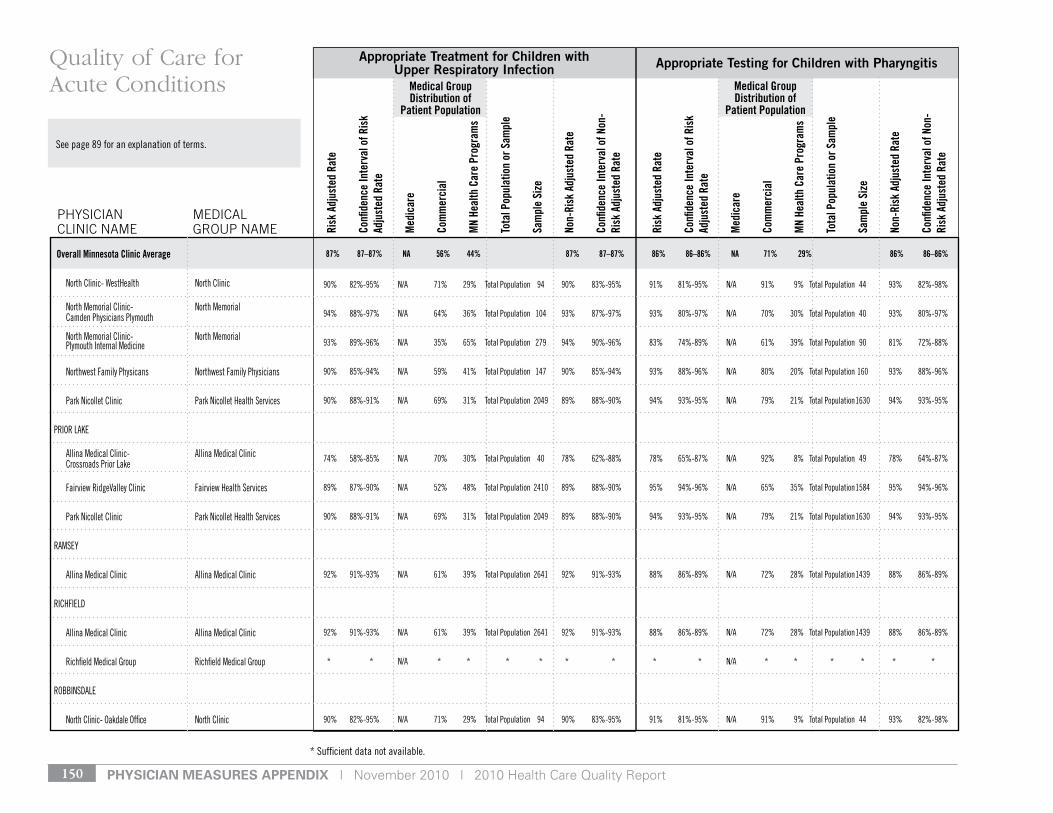
pHysiCian Measures appenDiX | November 2010 | 2010 Health Care Quality Report150
* sufficient data not available.
see page 89 for an explanation of terms.
Risk
Adj
uste
d Ra
te
Confi
denc
e In
terv
al o
f Ris
k Ad
just
ed R
ate
Med
icar
e
Com
mer
cial
MN
Heal
th C
are
Prog
ram
s
Tota
l Pop
ulat
ion
or S
ampl
e
Sam
ple
Size
Non-
Risk
Adj
uste
d Ra
te
Confi
denc
e In
terv
al o
f Non
-Ri
sk A
djus
ted
Rate
Risk
Adj
uste
d Ra
te
Confi
denc
e In
terv
al o
f Ris
k Ad
just
ed R
ate
Med
icar
e
Com
mer
cial
MN
Heal
th C
are
Prog
ram
s
Tota
l Pop
ulat
ion
or S
ampl
e
Sam
ple
Size
Non-
Risk
Adj
uste
d Ra
te
Confi
denc
e In
terv
al o
f Non
-Ri
sk A
djus
ted
Rate
Appropriate Treatment for Children with Upper Respiratory Infection Appropriate Testing for Children with Pharyngitis
PHySIcIAN cLINIc NAME
MEdIcAL GrOuP NAME
Quality of Care for Acute Conditions Medical Group
Distribution of Patient Population
Medical Group Distribution of
Patient Population
Overall Minnesota Clinic Average
north Clinic- WestHealth north Clinic
north Memorial Clinic- north Memorial Camden Physicians Plymouth
north Memorial Clinic- north Memorial Plymouth Internal Medicine
northwest Family Physicans northwest Family Physicians
Park nicollet Clinic Park nicollet Health services
PrIor lAke
Allina Medical Clinic- Allina Medical Clinic Crossroads Prior lake
Fairview ridgevalley Clinic Fairview Health services
Park nicollet Clinic Park nicollet Health services
rAMsey
Allina Medical Clinic Allina Medical Clinic
rICHFIeld
Allina Medical Clinic Allina Medical Clinic
richfield Medical group richfield Medical group
roBBInsdAle
north Clinic- oakdale office north Clinic
90% 82%-95% n/A 71% 29% total Population 94 90% 83%-95% 91% 81%-95% n/A 91% 9% total Population 44 93% 82%-98%
94% 88%-97% n/A 64% 36% total Population 104 93% 87%-97% 93% 80%-97% n/A 70% 30% total Population 40 93% 80%-97%
93% 89%-96% n/A 35% 65% total Population 279 94% 90%-96% 83% 74%-89% n/A 61% 39% total Population 90 81% 72%-88%
90% 85%-94% n/A 59% 41% total Population 147 90% 85%-94% 93% 88%-96% n/A 80% 20% total Population 160 93% 88%-96%
90% 88%-91% n/A 69% 31% total Population 2049 89% 88%-90% 94% 93%-95% n/A 79% 21% total Population 1630 94% 93%-95%
74% 58%-85% n/A 70% 30% total Population 40 78% 62%-88% 78% 65%-87% n/A 92% 8% total Population 49 78% 64%-87%
89% 87%-90% n/A 52% 48% total Population 2410 89% 88%-90% 95% 94%-96% n/A 65% 35% total Population 1584 95% 94%-96%
90% 88%-91% n/A 69% 31% total Population 2049 89% 88%-90% 94% 93%-95% n/A 79% 21% total Population 1630 94% 93%-95%
92% 91%-93% n/A 61% 39% total Population 2641 92% 91%-93% 88% 86%-89% n/A 72% 28% total Population 1439 88% 86%-89%
92% 91%-93% n/A 61% 39% total Population 2641 92% 91%-93% 88% 86%-89% n/A 72% 28% total Population 1439 88% 86%-89%
* * n/A * * * * * * * * n/A * * * * * *
90% 82%-95% n/A 71% 29% total Population 94 90% 83%-95% 91% 81%-95% n/A 91% 9% total Population 44 93% 82%-98%
87% 87–87% NA 56% 44% 87% 87–87% 86% 86–86% NA 71% 29% 86% 86–86%
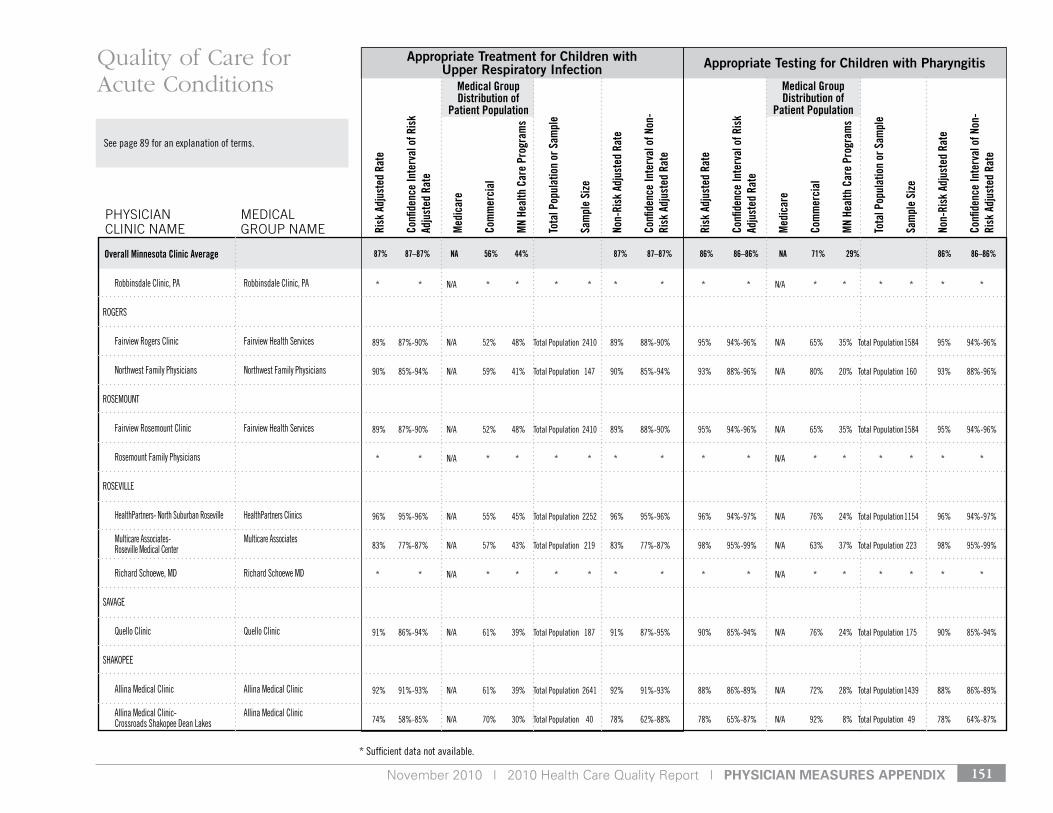
November 2010 | 2010 Health Care Quality Report | pHysiCian Measures appenDiX 151
* sufficient data not available.
see page 89 for an explanation of terms.
Risk
Adj
uste
d Ra
te
Confi
denc
e In
terv
al o
f Ris
k Ad
just
ed R
ate
Med
icar
e
Com
mer
cial
MN
Heal
th C
are
Prog
ram
s
Tota
l Pop
ulat
ion
or S
ampl
e
Sam
ple
Size
Non-
Risk
Adj
uste
d Ra
te
Confi
denc
e In
terv
al o
f Non
-Ri
sk A
djus
ted
Rate
Risk
Adj
uste
d Ra
te
Confi
denc
e In
terv
al o
f Ris
k Ad
just
ed R
ate
Med
icar
e
Com
mer
cial
MN
Heal
th C
are
Prog
ram
s
Tota
l Pop
ulat
ion
or S
ampl
e
Sam
ple
Size
Non-
Risk
Adj
uste
d Ra
te
Confi
denc
e In
terv
al o
f Non
-Ri
sk A
djus
ted
Rate
Appropriate Treatment for Children with Upper Respiratory Infection Appropriate Testing for Children with Pharyngitis
PHySIcIAN cLINIc NAME
MEdIcAL GrOuP NAME
Quality of Care for Acute Conditions Medical Group
Distribution of Patient Population
87% 87–87% NA 56% 44% 87% 87–87% 86% 86–86% NA 71% 29% 86% 86–86%
Medical Group Distribution of
Patient Population
Overall Minnesota Clinic Average
robbinsdale Clinic, PA robbinsdale Clinic, PA
rogers
Fairview rogers Clinic Fairview Health services
northwest Family Physicians northwest Family Physicians
roseMount
Fairview rosemount Clinic Fairview Health services
rosemount Family Physicians
rosevIlle
HealthPartners- north suburban roseville HealthPartners Clinics
Multicare Associates- Multicare Associates roseville Medical Center
richard schoewe, Md richard schoewe Md
sAvAge
Quello Clinic Quello Clinic
sHAkoPee
Allina Medical Clinic Allina Medical Clinic
Allina Medical Clinic- Allina Medical Clinic Crossroads shakopee dean lakes
* * n/A * * * * * * * * n/A * * * * * *
89% 87%-90% n/A 52% 48% total Population 2410 89% 88%-90% 95% 94%-96% n/A 65% 35% total Population 1584 95% 94%-96%
90% 85%-94% n/A 59% 41% total Population 147 90% 85%-94% 93% 88%-96% n/A 80% 20% total Population 160 93% 88%-96%
89% 87%-90% n/A 52% 48% total Population 2410 89% 88%-90% 95% 94%-96% n/A 65% 35% total Population 1584 95% 94%-96%
* * n/A * * * * * * * * n/A * * * * * *
96% 95%-96% n/A 55% 45% total Population 2252 96% 95%-96% 96% 94%-97% n/A 76% 24% total Population 1154 96% 94%-97%
83% 77%-87% n/A 57% 43% total Population 219 83% 77%-87% 98% 95%-99% n/A 63% 37% total Population 223 98% 95%-99%
* * n/A * * * * * * * * n/A * * * * * *
91% 86%-94% n/A 61% 39% total Population 187 91% 87%-95% 90% 85%-94% n/A 76% 24% total Population 175 90% 85%-94%
92% 91%-93% n/A 61% 39% total Population 2641 92% 91%-93% 88% 86%-89% n/A 72% 28% total Population 1439 88% 86%-89%
74% 58%-85% n/A 70% 30% total Population 40 78% 62%-88% 78% 65%-87% n/A 92% 8% total Population 49 78% 64%-87%
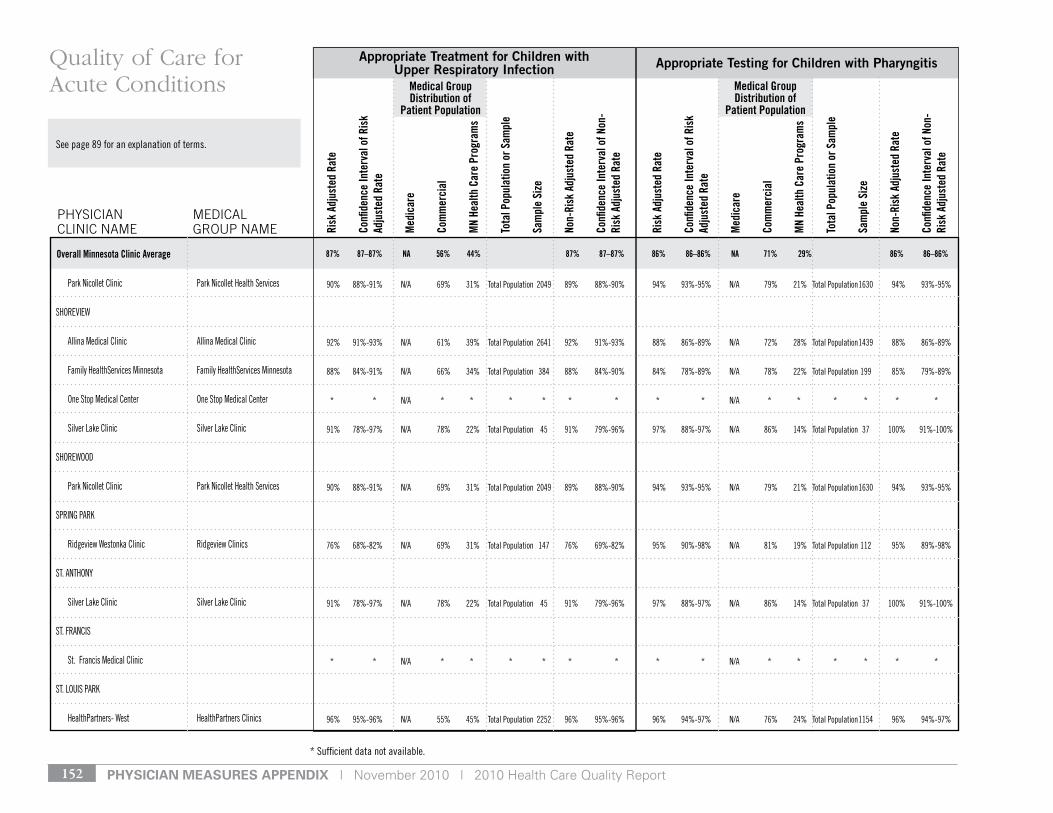
pHysiCian Measures appenDiX | November 2010 | 2010 Health Care Quality Report152
* sufficient data not available.
see page 89 for an explanation of terms.
Risk
Adj
uste
d Ra
te
Confi
denc
e In
terv
al o
f Ris
k Ad
just
ed R
ate
Med
icar
e
Com
mer
cial
MN
Heal
th C
are
Prog
ram
s
Tota
l Pop
ulat
ion
or S
ampl
e
Sam
ple
Size
Non-
Risk
Adj
uste
d Ra
te
Confi
denc
e In
terv
al o
f Non
-Ri
sk A
djus
ted
Rate
Risk
Adj
uste
d Ra
te
Confi
denc
e In
terv
al o
f Ris
k Ad
just
ed R
ate
Med
icar
e
Com
mer
cial
MN
Heal
th C
are
Prog
ram
s
Tota
l Pop
ulat
ion
or S
ampl
e
Sam
ple
Size
Non-
Risk
Adj
uste
d Ra
te
Confi
denc
e In
terv
al o
f Non
-Ri
sk A
djus
ted
Rate
Appropriate Treatment for Children with Upper Respiratory Infection Appropriate Testing for Children with Pharyngitis
PHySIcIAN cLINIc NAME
MEdIcAL GrOuP NAME
Quality of Care for Acute Conditions Medical Group
Distribution of Patient Population
87% 87–87% NA 56% 44% 87% 87–87% 86% 86–86% NA 71% 29% 86% 86–86%
Medical Group Distribution of
Patient Population
Overall Minnesota Clinic Average
Park nicollet Clinic Park nicollet Health services
sHorevIeW
Allina Medical Clinic Allina Medical Clinic
Family Healthservices Minnesota Family Healthservices Minnesota
one stop Medical Center one stop Medical Center
silver lake Clinic silver lake Clinic
sHoreWood
Park nicollet Clinic Park nicollet Health services
sPrIng PArk
ridgeview Westonka Clinic ridgeview Clinics
st. AntHony
silver lake Clinic silver lake Clinic
st. FrAnCIs
st. Francis Medical Clinic
st. louIs PArk
HealthPartners- West HealthPartners Clinics
90% 88%-91% n/A 69% 31% total Population 2049 89% 88%-90% 94% 93%-95% n/A 79% 21% total Population 1630 94% 93%-95%
92% 91%-93% n/A 61% 39% total Population 2641 92% 91%-93% 88% 86%-89% n/A 72% 28% total Population 1439 88% 86%-89%
88% 84%-91% n/A 66% 34% total Population 384 88% 84%-90% 84% 78%-89% n/A 78% 22% total Population 199 85% 79%-89%
* * n/A * * * * * * * * n/A * * * * * *
91% 78%-97% n/A 78% 22% total Population 45 91% 79%-96% 97% 88%-97% n/A 86% 14% total Population 37 100% 91%-100%
90% 88%-91% n/A 69% 31% total Population 2049 89% 88%-90% 94% 93%-95% n/A 79% 21% total Population 1630 94% 93%-95%
76% 68%-82% n/A 69% 31% total Population 147 76% 69%-82% 95% 90%-98% n/A 81% 19% total Population 112 95% 89%-98%
91% 78%-97% n/A 78% 22% total Population 45 91% 79%-96% 97% 88%-97% n/A 86% 14% total Population 37 100% 91%-100%
* * n/A * * * * * * * * n/A * * * * * *
96% 95%-96% n/A 55% 45% total Population 2252 96% 95%-96% 96% 94%-97% n/A 76% 24% total Population 1154 96% 94%-97%
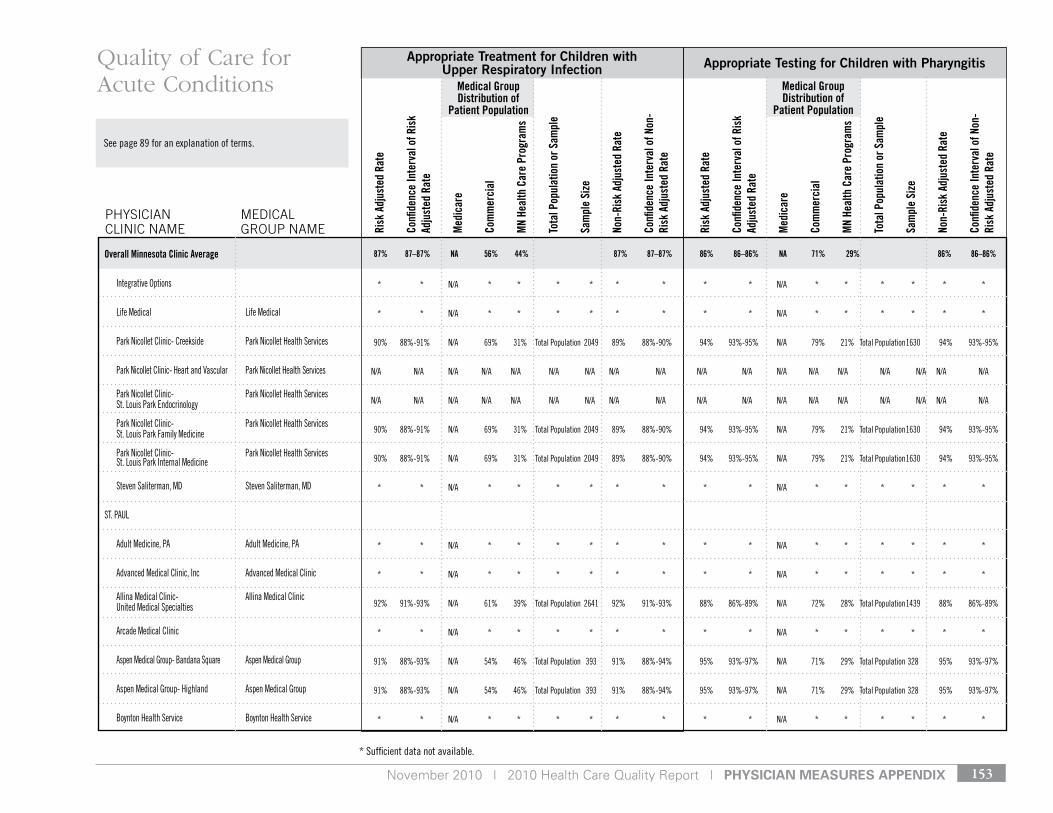
November 2010 | 2010 Health Care Quality Report | pHysiCian Measures appenDiX 153
* sufficient data not available.
see page 89 for an explanation of terms.
Risk
Adj
uste
d Ra
te
Confi
denc
e In
terv
al o
f Ris
k Ad
just
ed R
ate
Med
icar
e
Com
mer
cial
MN
Heal
th C
are
Prog
ram
s
Tota
l Pop
ulat
ion
or S
ampl
e
Sam
ple
Size
Non-
Risk
Adj
uste
d Ra
te
Confi
denc
e In
terv
al o
f Non
-Ri
sk A
djus
ted
Rate
Risk
Adj
uste
d Ra
te
Confi
denc
e In
terv
al o
f Ris
k Ad
just
ed R
ate
Med
icar
e
Com
mer
cial
MN
Heal
th C
are
Prog
ram
s
Tota
l Pop
ulat
ion
or S
ampl
e
Sam
ple
Size
Non-
Risk
Adj
uste
d Ra
te
Confi
denc
e In
terv
al o
f Non
-Ri
sk A
djus
ted
Rate
Appropriate Treatment for Children with Upper Respiratory Infection Appropriate Testing for Children with Pharyngitis
PHySIcIAN cLINIc NAME
MEdIcAL GrOuP NAME
Quality of Care for Acute Conditions Medical Group
Distribution of Patient Population
87% 87–87% NA 56% 44% 87% 87–87% 86% 86–86% NA 71% 29% 86% 86–86%
Medical Group Distribution of
Patient Population
Overall Minnesota Clinic Average
Integrative options
life Medical life Medical
Park nicollet Clinic- Creekside Park nicollet Health services
Park nicollet Clinic- Heart and vascular Park nicollet Health services
Park nicollet Clinic- Park nicollet Health services st. louis Park endocrinology
Park nicollet Clinic- Park nicollet Health services st. louis Park Family Medicine
Park nicollet Clinic- Park nicollet Health services st. louis Park Internal Medicine
steven saliterman, Md steven saliterman, Md
st. PAul
Adult Medicine, PA Adult Medicine, PA
Advanced Medical Clinic, Inc Advanced Medical Clinic
Allina Medical Clinic- Allina Medical Clinic united Medical specialties
Arcade Medical Clinic
Aspen Medical group- Bandana square Aspen Medical group
Aspen Medical group- Highland Aspen Medical group
Boynton Health service Boynton Health service
* * n/A * * * * * * * * n/A * * * * * *
* * n/A * * * * * * * * n/A * * * * * *
90% 88%-91% n/A 69% 31% total Population 2049 89% 88%-90% 94% 93%-95% n/A 79% 21% total Population 1630 94% 93%-95%
n/A n/A n/A n/A n/A n/A n/A n/A n/A n/A n/A n/A n/A n/A n/A n/A n/A n/A
n/A n/A n/A n/A n/A n/A n/A n/A n/A n/A n/A n/A n/A n/A n/A n/A n/A n/A
90% 88%-91% n/A 69% 31% total Population 2049 89% 88%-90% 94% 93%-95% n/A 79% 21% total Population 1630 94% 93%-95%
90% 88%-91% n/A 69% 31% total Population 2049 89% 88%-90% 94% 93%-95% n/A 79% 21% total Population 1630 94% 93%-95%
* * n/A * * * * * * * * n/A * * * * * *
* * n/A * * * * * * * * n/A * * * * * *
* * n/A * * * * * * * * n/A * * * * * *
92% 91%-93% n/A 61% 39% total Population 2641 92% 91%-93% 88% 86%-89% n/A 72% 28% total Population 1439 88% 86%-89%
* * n/A * * * * * * * * n/A * * * * * *
91% 88%-93% n/A 54% 46% total Population 393 91% 88%-94% 95% 93%-97% n/A 71% 29% total Population 328 95% 93%-97%
91% 88%-93% n/A 54% 46% total Population 393 91% 88%-94% 95% 93%-97% n/A 71% 29% total Population 328 95% 93%-97%
* * n/A * * * * * * * * n/A * * * * * *
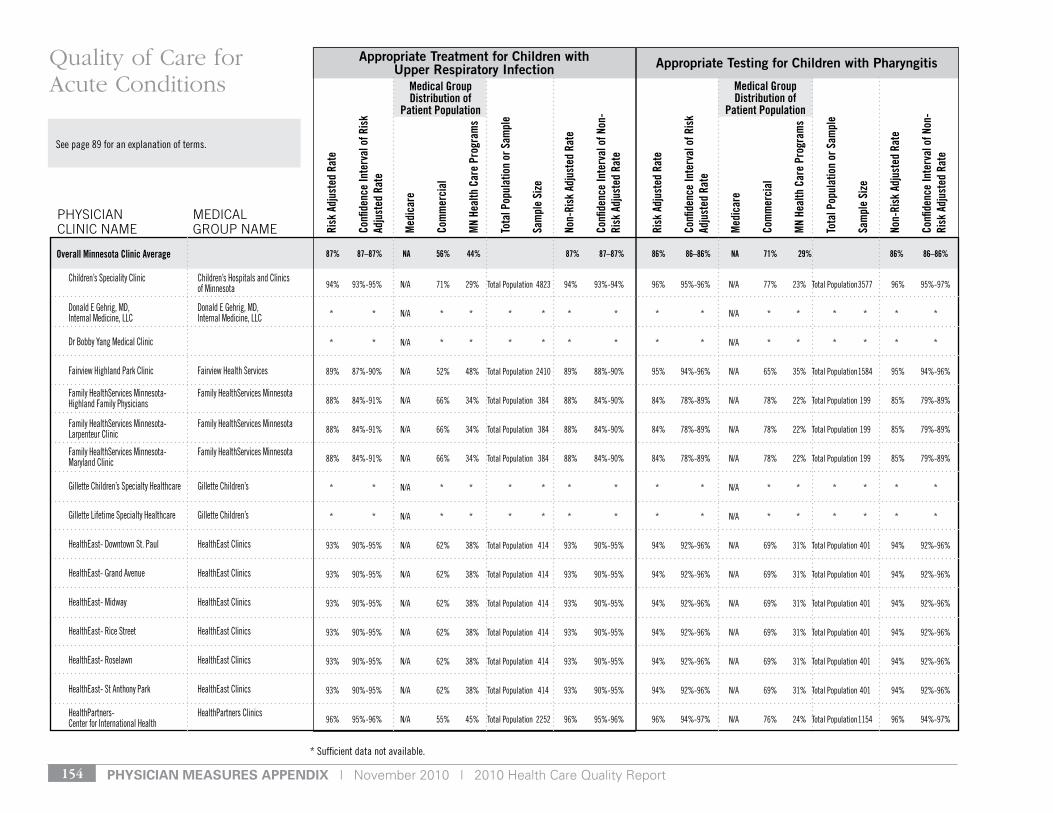
pHysiCian Measures appenDiX | November 2010 | 2010 Health Care Quality Report154
* sufficient data not available.
see page 89 for an explanation of terms.
Risk
Adj
uste
d Ra
te
Confi
denc
e In
terv
al o
f Ris
k Ad
just
ed R
ate
Med
icar
e
Com
mer
cial
MN
Heal
th C
are
Prog
ram
s
Tota
l Pop
ulat
ion
or S
ampl
e
Sam
ple
Size
Non-
Risk
Adj
uste
d Ra
te
Confi
denc
e In
terv
al o
f Non
-Ri
sk A
djus
ted
Rate
Risk
Adj
uste
d Ra
te
Confi
denc
e In
terv
al o
f Ris
k Ad
just
ed R
ate
Med
icar
e
Com
mer
cial
MN
Heal
th C
are
Prog
ram
s
Tota
l Pop
ulat
ion
or S
ampl
e
Sam
ple
Size
Non-
Risk
Adj
uste
d Ra
te
Confi
denc
e In
terv
al o
f Non
-Ri
sk A
djus
ted
Rate
Appropriate Treatment for Children with Upper Respiratory Infection Appropriate Testing for Children with Pharyngitis
PHySIcIAN cLINIc NAME
MEdIcAL GrOuP NAME
Quality of Care for Acute Conditions Medical Group
Distribution of Patient Population
87% 87–87% NA 56% 44% 87% 87–87% 86% 86–86% NA 71% 29% 86% 86–86%
Medical Group Distribution of
Patient Population
Overall Minnesota Clinic Average
Children’s speciality Clinic Children’s Hospitals and Clinics of Minnesota
donald e gehrig, Md, donald e gehrig, Md, Internal Medicine, llC Internal Medicine, llC
dr Bobby yang Medical Clinic
Fairview Highland Park Clinic Fairview Health services
Family Healthservices Minnesota- Family Healthservices Minnesota Highland Family Physicians
Family Healthservices Minnesota- Family Healthservices Minnesota larpenteur Clinic
Family Healthservices Minnesota- Family Healthservices Minnesota Maryland Clinic
gillette Children’s specialty Healthcare gillette Children’s
gillette lifetime specialty Healthcare gillette Children’s
Healtheast- downtown st. Paul Healtheast Clinics
Healtheast- grand Avenue Healtheast Clinics
Healtheast- Midway Healtheast Clinics
Healtheast- rice street Healtheast Clinics
Healtheast- roselawn Healtheast Clinics
Healtheast- st Anthony Park Healtheast Clinics
HealthPartners- HealthPartners Clinics Center for International Health
94% 93%-95% n/A 71% 29% total Population 4823 94% 93%-94% 96% 95%-96% n/A 77% 23% total Population 3577 96% 95%-97%
* * n/A * * * * * * * * n/A * * * * * *
* * n/A * * * * * * * * n/A * * * * * *
89% 87%-90% n/A 52% 48% total Population 2410 89% 88%-90% 95% 94%-96% n/A 65% 35% total Population 1584 95% 94%-96%
88% 84%-91% n/A 66% 34% total Population 384 88% 84%-90% 84% 78%-89% n/A 78% 22% total Population 199 85% 79%-89%
88% 84%-91% n/A 66% 34% total Population 384 88% 84%-90% 84% 78%-89% n/A 78% 22% total Population 199 85% 79%-89%
88% 84%-91% n/A 66% 34% total Population 384 88% 84%-90% 84% 78%-89% n/A 78% 22% total Population 199 85% 79%-89%
* * n/A * * * * * * * * n/A * * * * * *
* * n/A * * * * * * * * n/A * * * * * *
93% 90%-95% n/A 62% 38% total Population 414 93% 90%-95% 94% 92%-96% n/A 69% 31% total Population 401 94% 92%-96%
93% 90%-95% n/A 62% 38% total Population 414 93% 90%-95% 94% 92%-96% n/A 69% 31% total Population 401 94% 92%-96%
93% 90%-95% n/A 62% 38% total Population 414 93% 90%-95% 94% 92%-96% n/A 69% 31% total Population 401 94% 92%-96%
93% 90%-95% n/A 62% 38% total Population 414 93% 90%-95% 94% 92%-96% n/A 69% 31% total Population 401 94% 92%-96%
93% 90%-95% n/A 62% 38% total Population 414 93% 90%-95% 94% 92%-96% n/A 69% 31% total Population 401 94% 92%-96%
93% 90%-95% n/A 62% 38% total Population 414 93% 90%-95% 94% 92%-96% n/A 69% 31% total Population 401 94% 92%-96%
96% 95%-96% n/A 55% 45% total Population 2252 96% 95%-96% 96% 94%-97% n/A 76% 24% total Population 1154 96% 94%-97%
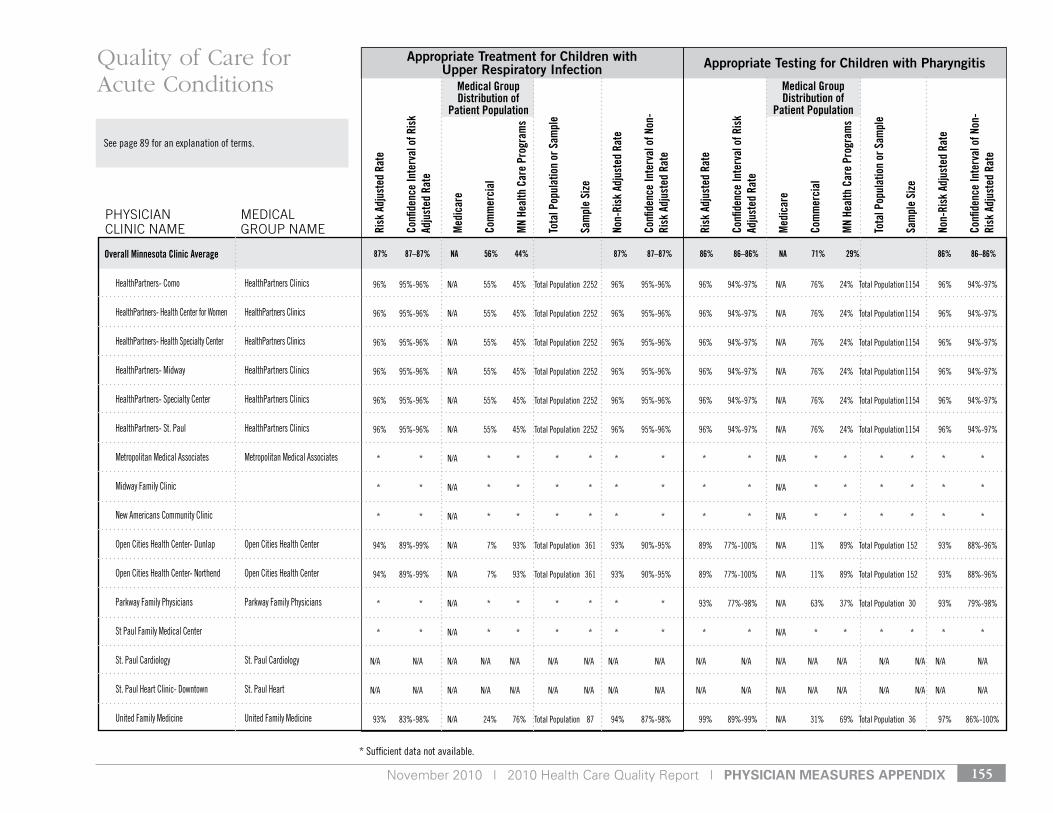
November 2010 | 2010 Health Care Quality Report | pHysiCian Measures appenDiX 155
* sufficient data not available.
see page 89 for an explanation of terms.
Risk
Adj
uste
d Ra
te
Confi
denc
e In
terv
al o
f Ris
k Ad
just
ed R
ate
Med
icar
e
Com
mer
cial
MN
Heal
th C
are
Prog
ram
s
Tota
l Pop
ulat
ion
or S
ampl
e
Sam
ple
Size
Non-
Risk
Adj
uste
d Ra
te
Confi
denc
e In
terv
al o
f Non
-Ri
sk A
djus
ted
Rate
Risk
Adj
uste
d Ra
te
Confi
denc
e In
terv
al o
f Ris
k Ad
just
ed R
ate
Med
icar
e
Com
mer
cial
MN
Heal
th C
are
Prog
ram
s
Tota
l Pop
ulat
ion
or S
ampl
e
Sam
ple
Size
Non-
Risk
Adj
uste
d Ra
te
Confi
denc
e In
terv
al o
f Non
-Ri
sk A
djus
ted
Rate
Appropriate Treatment for Children with Upper Respiratory Infection Appropriate Testing for Children with Pharyngitis
PHySIcIAN cLINIc NAME
MEdIcAL GrOuP NAME
Quality of Care for Acute Conditions Medical Group
Distribution of Patient Population
87% 87–87% NA 56% 44% 87% 87–87% 86% 86–86% NA 71% 29% 86% 86–86%
Medical Group Distribution of
Patient Population
Overall Minnesota Clinic Average
HealthPartners- Como HealthPartners Clinics
HealthPartners- Health Center for Women HealthPartners Clinics
HealthPartners- Health specialty Center HealthPartners Clinics
HealthPartners- Midway HealthPartners Clinics
HealthPartners- specialty Center HealthPartners Clinics
HealthPartners- st. Paul HealthPartners Clinics
Metropolitan Medical Associates Metropolitan Medical Associates
Midway Family Clinic
new Americans Community Clinic
open Cities Health Center- dunlap open Cities Health Center
open Cities Health Center- northend open Cities Health Center
Parkway Family Physicians Parkway Family Physicians
st Paul Family Medical Center
st. Paul Cardiology st. Paul Cardiology
st. Paul Heart Clinic- downtown st. Paul Heart
united Family Medicine united Family Medicine
96% 95%-96% n/A 55% 45% total Population 2252 96% 95%-96% 96% 94%-97% n/A 76% 24% total Population 1154 96% 94%-97%
96% 95%-96% n/A 55% 45% total Population 2252 96% 95%-96% 96% 94%-97% n/A 76% 24% total Population 1154 96% 94%-97%
96% 95%-96% n/A 55% 45% total Population 2252 96% 95%-96% 96% 94%-97% n/A 76% 24% total Population 1154 96% 94%-97%
96% 95%-96% n/A 55% 45% total Population 2252 96% 95%-96% 96% 94%-97% n/A 76% 24% total Population 1154 96% 94%-97%
96% 95%-96% n/A 55% 45% total Population 2252 96% 95%-96% 96% 94%-97% n/A 76% 24% total Population 1154 96% 94%-97%
96% 95%-96% n/A 55% 45% total Population 2252 96% 95%-96% 96% 94%-97% n/A 76% 24% total Population 1154 96% 94%-97%
* * n/A * * * * * * * * n/A * * * * * *
* * n/A * * * * * * * * n/A * * * * * *
* * n/A * * * * * * * * n/A * * * * * *
94% 89%-99% n/A 7% 93% total Population 361 93% 90%-95% 89% 77%-100% n/A 11% 89% total Population 152 93% 88%-96%
94% 89%-99% n/A 7% 93% total Population 361 93% 90%-95% 89% 77%-100% n/A 11% 89% total Population 152 93% 88%-96%
* * n/A * * * * * * 93% 77%-98% n/A 63% 37% total Population 30 93% 79%-98%
* * n/A * * * * * * * * n/A * * * * * *
n/A n/A n/A n/A n/A n/A n/A n/A n/A n/A n/A n/A n/A n/A n/A n/A n/A n/A
n/A n/A n/A n/A n/A n/A n/A n/A n/A n/A n/A n/A n/A n/A n/A n/A n/A n/A
93% 83%-98% n/A 24% 76% total Population 87 94% 87%-98% 99% 89%-99% n/A 31% 69% total Population 36 97% 86%-100%
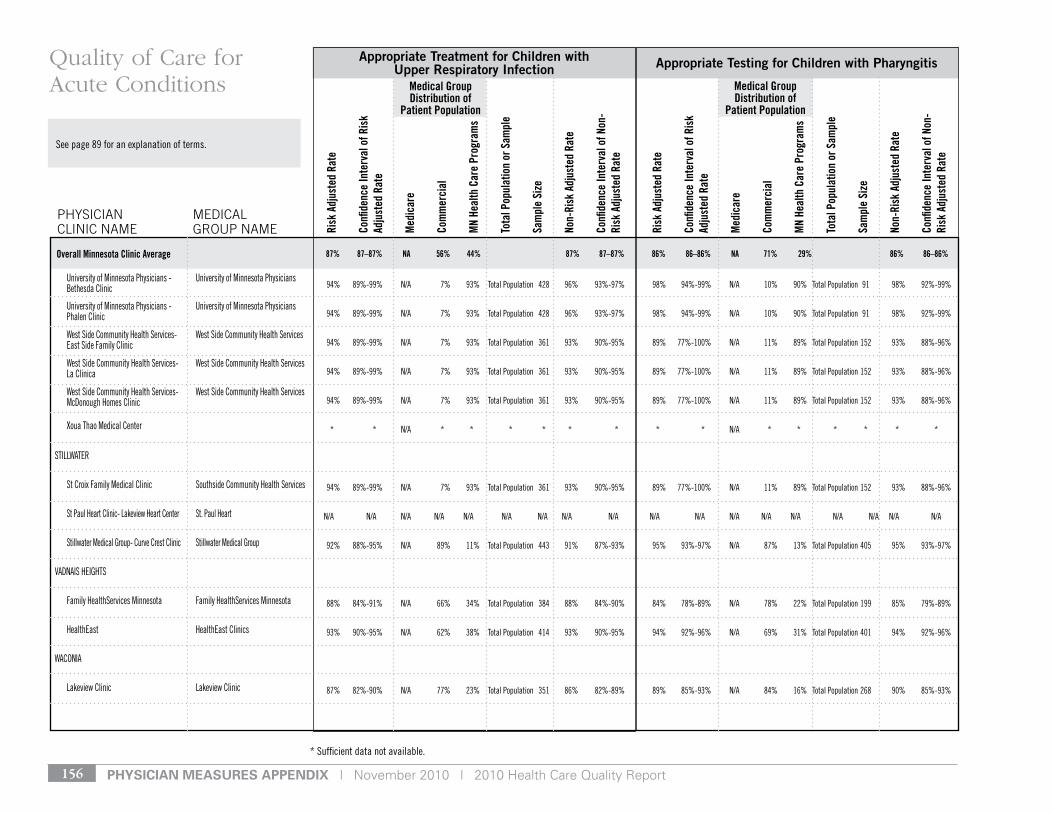
pHysiCian Measures appenDiX | November 2010 | 2010 Health Care Quality Report156
* sufficient data not available.
see page 89 for an explanation of terms.
Risk
Adj
uste
d Ra
te
Confi
denc
e In
terv
al o
f Ris
k Ad
just
ed R
ate
Med
icar
e
Com
mer
cial
MN
Heal
th C
are
Prog
ram
s
Tota
l Pop
ulat
ion
or S
ampl
e
Sam
ple
Size
Non-
Risk
Adj
uste
d Ra
te
Confi
denc
e In
terv
al o
f Non
-Ri
sk A
djus
ted
Rate
Risk
Adj
uste
d Ra
te
Confi
denc
e In
terv
al o
f Ris
k Ad
just
ed R
ate
Med
icar
e
Com
mer
cial
MN
Heal
th C
are
Prog
ram
s
Tota
l Pop
ulat
ion
or S
ampl
e
Sam
ple
Size
Non-
Risk
Adj
uste
d Ra
te
Confi
denc
e In
terv
al o
f Non
-Ri
sk A
djus
ted
Rate
Appropriate Treatment for Children with Upper Respiratory Infection Appropriate Testing for Children with Pharyngitis
PHySIcIAN cLINIc NAME
MEdIcAL GrOuP NAME
Quality of Care for Acute Conditions Medical Group
Distribution of Patient Population
87% 87–87% NA 56% 44% 87% 87–87% 86% 86–86% NA 71% 29% 86% 86–86%
Medical Group Distribution of
Patient Population
Overall Minnesota Clinic Average
university of Minnesota Physicians - university of Minnesota Physicians Bethesda Clinic
university of Minnesota Physicians - university of Minnesota Physicians Phalen Clinic
West side Community Health services- West side Community Health services east side Family Clinic
West side Community Health services- West side Community Health services la Clinica
West side Community Health services- West side Community Health services Mcdonough Homes Clinic
Xoua thao Medical Center
stIllWAter
st Croix Family Medical Clinic southside Community Health services
st Paul Heart Clinic- lakeview Heart Center st. Paul Heart
stillwater Medical group- Curve Crest Clinic stillwater Medical group
vAdnAIs HeIgHts
Family Healthservices Minnesota Family Healthservices Minnesota
Healtheast Healtheast Clinics
WAConIA
lakeview Clinic lakeview Clinic
94% 89%-99% n/A 7% 93% total Population 428 96% 93%-97% 98% 94%-99% n/A 10% 90% total Population 91 98% 92%-99%
94% 89%-99% n/A 7% 93% total Population 428 96% 93%-97% 98% 94%-99% n/A 10% 90% total Population 91 98% 92%-99%
94% 89%-99% n/A 7% 93% total Population 361 93% 90%-95% 89% 77%-100% n/A 11% 89% total Population 152 93% 88%-96%
94% 89%-99% n/A 7% 93% total Population 361 93% 90%-95% 89% 77%-100% n/A 11% 89% total Population 152 93% 88%-96%
94% 89%-99% n/A 7% 93% total Population 361 93% 90%-95% 89% 77%-100% n/A 11% 89% total Population 152 93% 88%-96%
* * n/A * * * * * * * * n/A * * * * * *
94% 89%-99% n/A 7% 93% total Population 361 93% 90%-95% 89% 77%-100% n/A 11% 89% total Population 152 93% 88%-96%
n/A n/A n/A n/A n/A n/A n/A n/A n/A n/A n/A n/A n/A n/A n/A n/A n/A n/A
92% 88%-95% n/A 89% 11% total Population 443 91% 87%-93% 95% 93%-97% n/A 87% 13% total Population 405 95% 93%-97%
88% 84%-91% n/A 66% 34% total Population 384 88% 84%-90% 84% 78%-89% n/A 78% 22% total Population 199 85% 79%-89%
93% 90%-95% n/A 62% 38% total Population 414 93% 90%-95% 94% 92%-96% n/A 69% 31% total Population 401 94% 92%-96%
87% 82%-90% n/A 77% 23% total Population 351 86% 82%-89% 89% 85%-93% n/A 84% 16% total Population 268 90% 85%-93%
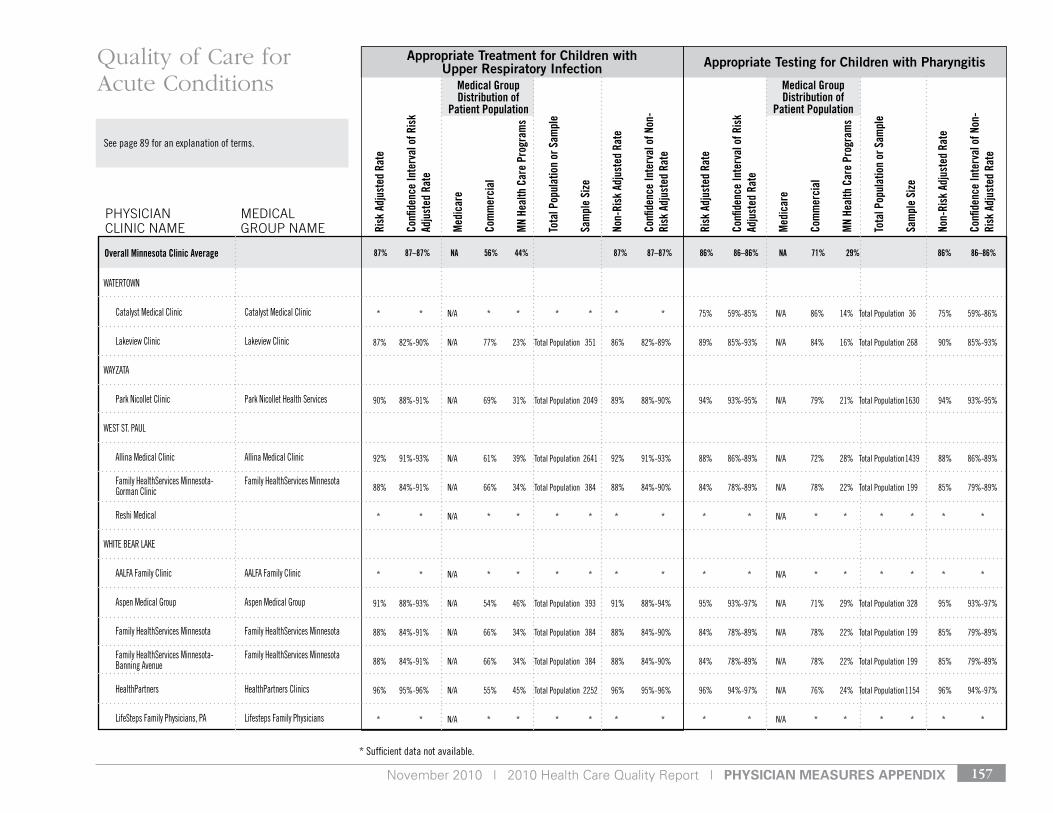
November 2010 | 2010 Health Care Quality Report | pHysiCian Measures appenDiX 157
* sufficient data not available.
see page 89 for an explanation of terms.
Risk
Adj
uste
d Ra
te
Confi
denc
e In
terv
al o
f Ris
k Ad
just
ed R
ate
Med
icar
e
Com
mer
cial
MN
Heal
th C
are
Prog
ram
s
Tota
l Pop
ulat
ion
or S
ampl
e
Sam
ple
Size
Non-
Risk
Adj
uste
d Ra
te
Confi
denc
e In
terv
al o
f Non
-Ri
sk A
djus
ted
Rate
Risk
Adj
uste
d Ra
te
Confi
denc
e In
terv
al o
f Ris
k Ad
just
ed R
ate
Med
icar
e
Com
mer
cial
MN
Heal
th C
are
Prog
ram
s
Tota
l Pop
ulat
ion
or S
ampl
e
Sam
ple
Size
Non-
Risk
Adj
uste
d Ra
te
Confi
denc
e In
terv
al o
f Non
-Ri
sk A
djus
ted
Rate
Appropriate Treatment for Children with Upper Respiratory Infection Appropriate Testing for Children with Pharyngitis
PHySIcIAN cLINIc NAME
MEdIcAL GrOuP NAME
Quality of Care for Acute Conditions Medical Group
Distribution of Patient Population
87% 87–87% NA 56% 44% 87% 87–87% 86% 86–86% NA 71% 29% 86% 86–86%
Medical Group Distribution of
Patient Population
Overall Minnesota Clinic Average
WAtertoWn
Catalyst Medical Clinic Catalyst Medical Clinic
lakeview Clinic lakeview Clinic
WAyzAtA
Park nicollet Clinic Park nicollet Health services
West st. PAul
Allina Medical Clinic Allina Medical Clinic
Family Healthservices Minnesota- Family Healthservices Minnesota gorman Clinic
reshi Medical
WHIte BeAr lAke
AAlFA Family Clinic AAlFA Family Clinic
Aspen Medical group Aspen Medical group
Family Healthservices Minnesota Family Healthservices Minnesota
Family Healthservices Minnesota- Family Healthservices Minnesota Banning Avenue
HealthPartners HealthPartners Clinics
lifesteps Family Physicians, PA lifesteps Family Physicians
* * n/A * * * * * * 75% 59%-85% n/A 86% 14% total Population 36 75% 59%-86%
87% 82%-90% n/A 77% 23% total Population 351 86% 82%-89% 89% 85%-93% n/A 84% 16% total Population 268 90% 85%-93%
90% 88%-91% n/A 69% 31% total Population 2049 89% 88%-90% 94% 93%-95% n/A 79% 21% total Population 1630 94% 93%-95%
92% 91%-93% n/A 61% 39% total Population 2641 92% 91%-93% 88% 86%-89% n/A 72% 28% total Population 1439 88% 86%-89%
88% 84%-91% n/A 66% 34% total Population 384 88% 84%-90% 84% 78%-89% n/A 78% 22% total Population 199 85% 79%-89%
* * n/A * * * * * * * * n/A * * * * * *
* * n/A * * * * * * * * n/A * * * * * *
91% 88%-93% n/A 54% 46% total Population 393 91% 88%-94% 95% 93%-97% n/A 71% 29% total Population 328 95% 93%-97%
88% 84%-91% n/A 66% 34% total Population 384 88% 84%-90% 84% 78%-89% n/A 78% 22% total Population 199 85% 79%-89%
88% 84%-91% n/A 66% 34% total Population 384 88% 84%-90% 84% 78%-89% n/A 78% 22% total Population 199 85% 79%-89%
96% 95%-96% n/A 55% 45% total Population 2252 96% 95%-96% 96% 94%-97% n/A 76% 24% total Population 1154 96% 94%-97%
* * n/A * * * * * * * * n/A * * * * * *
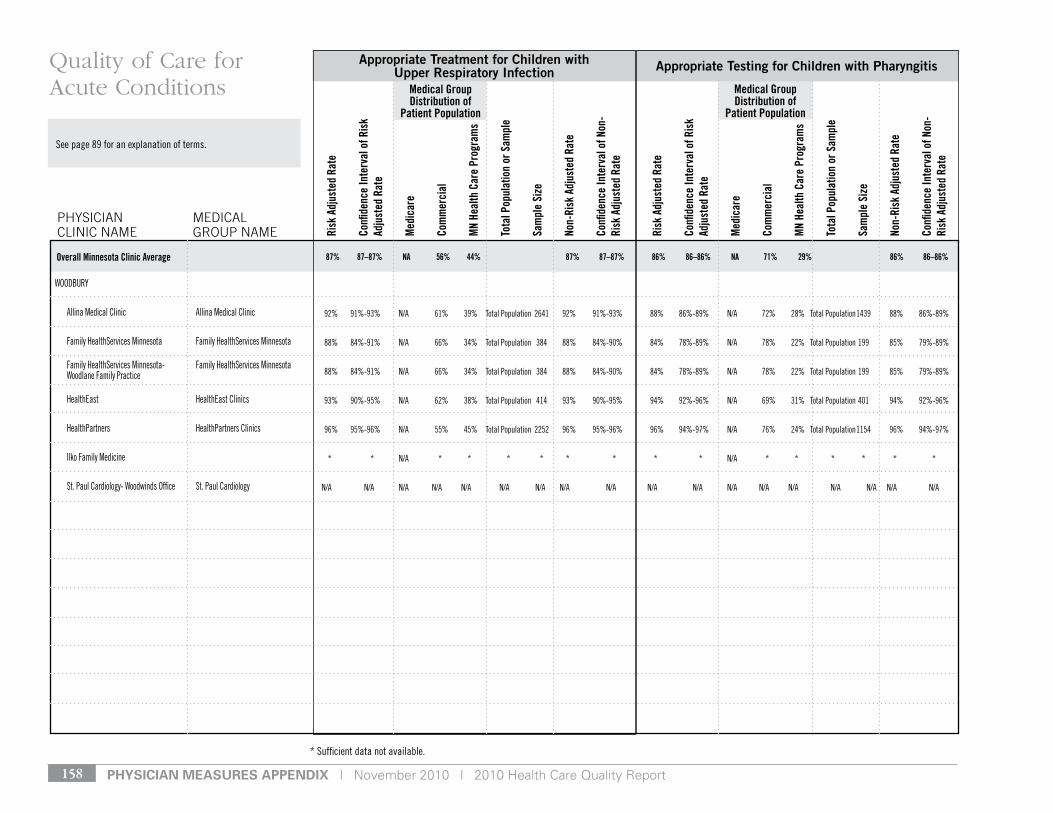
pHysiCian Measures appenDiX | November 2010 | 2010 Health Care Quality Report158
* sufficient data not available.
see page 89 for an explanation of terms.
Risk
Adj
uste
d Ra
te
Confi
denc
e In
terv
al o
f Ris
k Ad
just
ed R
ate
Med
icar
e
Com
mer
cial
MN
Heal
th C
are
Prog
ram
s
Tota
l Pop
ulat
ion
or S
ampl
e
Sam
ple
Size
Non-
Risk
Adj
uste
d Ra
te
Confi
denc
e In
terv
al o
f Non
-Ri
sk A
djus
ted
Rate
Risk
Adj
uste
d Ra
te
Confi
denc
e In
terv
al o
f Ris
k Ad
just
ed R
ate
Med
icar
e
Com
mer
cial
MN
Heal
th C
are
Prog
ram
s
Tota
l Pop
ulat
ion
or S
ampl
e
Sam
ple
Size
Non-
Risk
Adj
uste
d Ra
te
Confi
denc
e In
terv
al o
f Non
-Ri
sk A
djus
ted
Rate
Appropriate Treatment for Children with Upper Respiratory Infection Appropriate Testing for Children with Pharyngitis
PHySIcIAN cLINIc NAME
MEdIcAL GrOuP NAME
Quality of Care for Acute Conditions Medical Group
Distribution of Patient Population
87% 87–87% NA 56% 44% 87% 87–87% 86% 86–86% NA 71% 29% 86% 86–86%
Medical Group Distribution of
Patient Population
Overall Minnesota Clinic Average
WoodBury
Allina Medical Clinic Allina Medical Clinic
Family Healthservices Minnesota Family Healthservices Minnesota
Family Healthservices Minnesota- Family Healthservices Minnesota Woodlane Family Practice
Healtheast Healtheast Clinics
HealthPartners HealthPartners Clinics
Ilko Family Medicine
st. Paul Cardiology- Woodwinds office st. Paul Cardiology
92% 91%-93% n/A 61% 39% total Population 2641 92% 91%-93% 88% 86%-89% n/A 72% 28% total Population 1439 88% 86%-89%
88% 84%-91% n/A 66% 34% total Population 384 88% 84%-90% 84% 78%-89% n/A 78% 22% total Population 199 85% 79%-89%
88% 84%-91% n/A 66% 34% total Population 384 88% 84%-90% 84% 78%-89% n/A 78% 22% total Population 199 85% 79%-89%
93% 90%-95% n/A 62% 38% total Population 414 93% 90%-95% 94% 92%-96% n/A 69% 31% total Population 401 94% 92%-96%
96% 95%-96% n/A 55% 45% total Population 2252 96% 95%-96% 96% 94%-97% n/A 76% 24% total Population 1154 96% 94%-97%
* * n/A * * * * * * * * n/A * * * * * *
n/A n/A n/A n/A n/A n/A n/A n/A n/A n/A n/A n/A n/A n/A n/A n/A n/A n/A
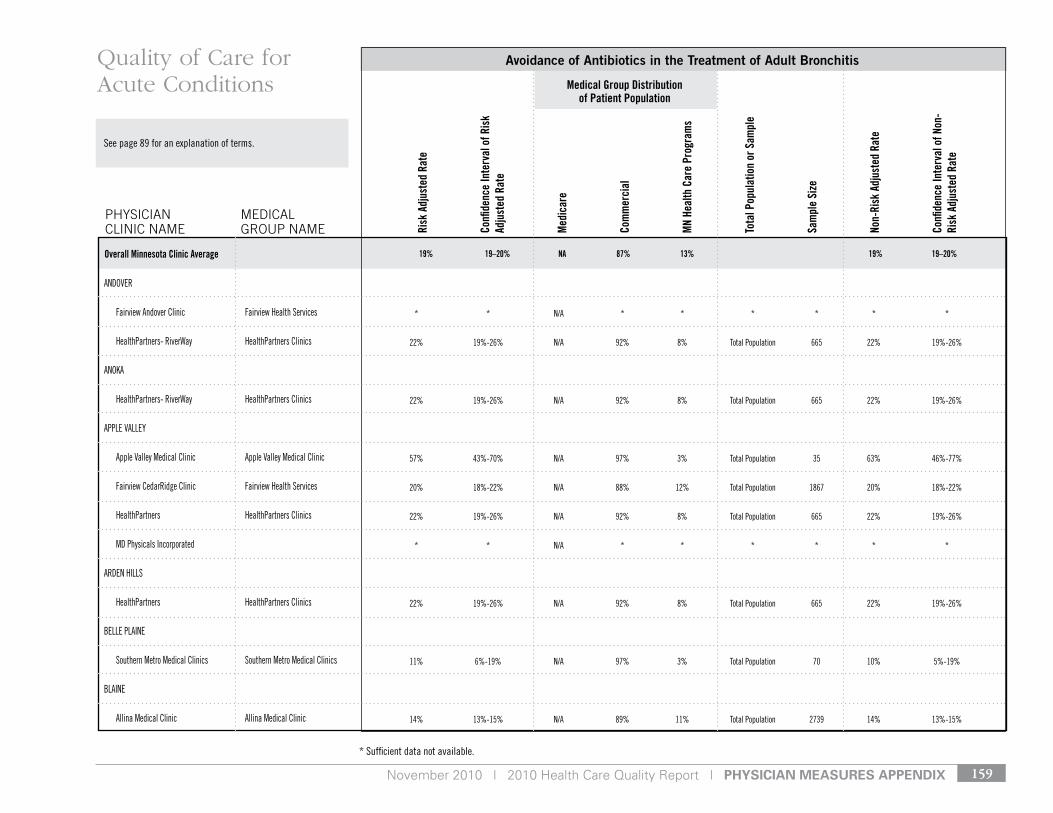
November 2010 | 2010 Health Care Quality Report | pHysiCian Measures appenDiX 159
* sufficient data not available.
see page 89 for an explanation of terms.
Risk
Adj
uste
d Ra
te
Confi
denc
e In
terv
al o
f Ris
k Ad
just
ed R
ate
Med
icar
e
Com
mer
cial
MN
Heal
th C
are
Prog
ram
s
Tota
l Pop
ulat
ion
or S
ampl
e
Sam
ple
Size
Non-
Risk
Adj
uste
d Ra
te
Confi
denc
e In
terv
al o
f Non
-Ri
sk A
djus
ted
Rate
Avoidance of Antibiotics in the Treatment of Adult Bronchitis
PHySIcIAN cLINIc NAME
MEdIcAL GrOuP NAME
Quality of Care for Acute Conditions
19% 19–20% NA 87% 13% 19% 19–20%
Medical Group Distribution of Patient Population
Overall Minnesota Clinic Average
Andover
Fairview Andover Clinic Fairview Health services
HealthPartners- riverWay HealthPartners Clinics
AnokA
HealthPartners- riverWay HealthPartners Clinics
APPle vAlley
Apple valley Medical Clinic Apple valley Medical Clinic
Fairview Cedarridge Clinic Fairview Health services
HealthPartners HealthPartners Clinics
Md Physicals Incorporated
Arden HIlls
HealthPartners HealthPartners Clinics
Belle PlAIne
southern Metro Medical Clinics southern Metro Medical Clinics
BlAIne
Allina Medical Clinic Allina Medical Clinic
* * n/A * * * * * *
22% 19%-26% n/A 92% 8% total Population 665 22% 19%-26%
22% 19%-26% n/A 92% 8% total Population 665 22% 19%-26%
57% 43%-70% n/A 97% 3% total Population 35 63% 46%-77%
20% 18%-22% n/A 88% 12% total Population 1867 20% 18%-22%
22% 19%-26% n/A 92% 8% total Population 665 22% 19%-26%
* * n/A * * * * * *
22% 19%-26% n/A 92% 8% total Population 665 22% 19%-26%
11% 6%-19% n/A 97% 3% total Population 70 10% 5%-19%
14% 13%-15% n/A 89% 11% total Population 2739 14% 13%-15%
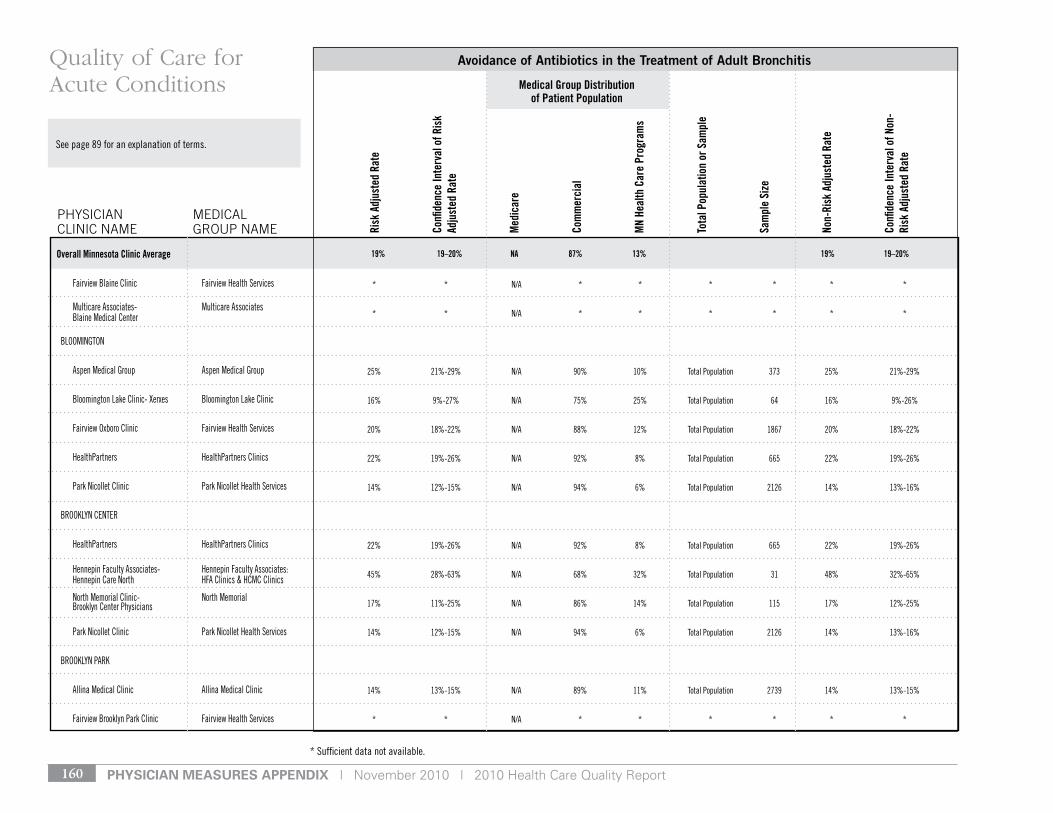
pHysiCian Measures appenDiX | November 2010 | 2010 Health Care Quality Report160
* sufficient data not available.
see page 89 for an explanation of terms.
Risk
Adj
uste
d Ra
te
Confi
denc
e In
terv
al o
f Ris
k Ad
just
ed R
ate
Med
icar
e
Com
mer
cial
MN
Heal
th C
are
Prog
ram
s
Tota
l Pop
ulat
ion
or S
ampl
e
Sam
ple
Size
Non-
Risk
Adj
uste
d Ra
te
Confi
denc
e In
terv
al o
f Non
-Ri
sk A
djus
ted
Rate
Avoidance of Antibiotics in the Treatment of Adult Bronchitis
PHySIcIAN cLINIc NAME
MEdIcAL GrOuP NAME
Quality of Care for Acute Conditions Medical Group Distribution
of Patient Population
Overall Minnesota Clinic Average 19% 19–20% NA 87% 13% 19% 19–20%
Fairview Blaine Clinic Fairview Health services
Multicare Associates- Multicare Associates Blaine Medical Center
BlooMIngton
Aspen Medical group Aspen Medical group
Bloomington lake Clinic- Xerxes Bloomington lake Clinic
Fairview oxboro Clinic Fairview Health services
HealthPartners HealthPartners Clinics
Park nicollet Clinic Park nicollet Health services
Brooklyn Center
HealthPartners HealthPartners Clinics
Hennepin Faculty Associates- Hennepin Faculty Associates: Hennepin Care north HFA Clinics & HCMC Clinics
north Memorial Clinic- north Memorial Brooklyn Center Physicians
Park nicollet Clinic Park nicollet Health services
Brooklyn PArk
Allina Medical Clinic Allina Medical Clinic
Fairview Brooklyn Park Clinic Fairview Health services
* * n/A * * * * * *
* * n/A * * * * * *
25% 21%-29% n/A 90% 10% total Population 373 25% 21%-29%
16% 9%-27% n/A 75% 25% total Population 64 16% 9%-26%
20% 18%-22% n/A 88% 12% total Population 1867 20% 18%-22%
22% 19%-26% n/A 92% 8% total Population 665 22% 19%-26%
14% 12%-15% n/A 94% 6% total Population 2126 14% 13%-16%
22% 19%-26% n/A 92% 8% total Population 665 22% 19%-26%
45% 28%-63% n/A 68% 32% total Population 31 48% 32%-65%
17% 11%-25% n/A 86% 14% total Population 115 17% 12%-25%
14% 12%-15% n/A 94% 6% total Population 2126 14% 13%-16%
14% 13%-15% n/A 89% 11% total Population 2739 14% 13%-15%
* * n/A * * * * * *
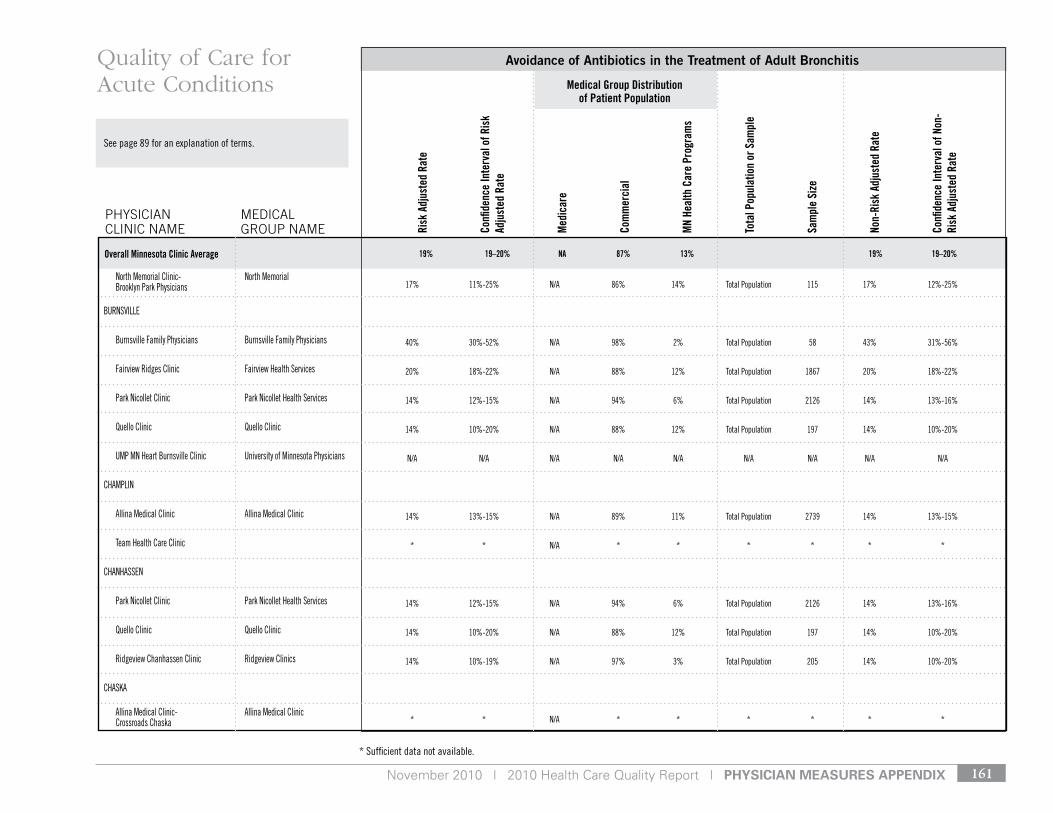
November 2010 | 2010 Health Care Quality Report | pHysiCian Measures appenDiX 161
* sufficient data not available.
see page 89 for an explanation of terms.
Risk
Adj
uste
d Ra
te
Confi
denc
e In
terv
al o
f Ris
k Ad
just
ed R
ate
Med
icar
e
Com
mer
cial
MN
Heal
th C
are
Prog
ram
s
Tota
l Pop
ulat
ion
or S
ampl
e
Sam
ple
Size
Non-
Risk
Adj
uste
d Ra
te
Confi
denc
e In
terv
al o
f Non
-Ri
sk A
djus
ted
Rate
Avoidance of Antibiotics in the Treatment of Adult Bronchitis
PHySIcIAN cLINIc NAME
MEdIcAL GrOuP NAME
Quality of Care for Acute Conditions
19% 19–20% NA 87% 13% 19% 19–20%
Medical Group Distribution of Patient Population
Overall Minnesota Clinic Average
north Memorial Clinic- north Memorial Brooklyn Park Physicians
BurnsvIlle
Burnsville Family Physicians Burnsville Family Physicians
Fairview ridges Clinic Fairview Health services
Park nicollet Clinic Park nicollet Health services
Quello Clinic Quello Clinic
uMP Mn Heart Burnsville Clinic university of Minnesota Physicians
CHAMPlIn
Allina Medical Clinic Allina Medical Clinic
team Health Care Clinic
CHAnHAssen
Park nicollet Clinic Park nicollet Health services
Quello Clinic Quello Clinic
ridgeview Chanhassen Clinic ridgeview Clinics
CHAskA
Allina Medical Clinic- Allina Medical Clinic Crossroads Chaska
17% 11%-25% n/A 86% 14% total Population 115 17% 12%-25%
40% 30%-52% n/A 98% 2% total Population 58 43% 31%-56%
20% 18%-22% n/A 88% 12% total Population 1867 20% 18%-22%
14% 12%-15% n/A 94% 6% total Population 2126 14% 13%-16%
14% 10%-20% n/A 88% 12% total Population 197 14% 10%-20%
n/A n/A n/A n/A n/A n/A n/A n/A n/A
14% 13%-15% n/A 89% 11% total Population 2739 14% 13%-15%
* * n/A * * * * * *
14% 12%-15% n/A 94% 6% total Population 2126 14% 13%-16%
14% 10%-20% n/A 88% 12% total Population 197 14% 10%-20%
14% 10%-19% n/A 97% 3% total Population 205 14% 10%-20%
* * n/A * * * * * *
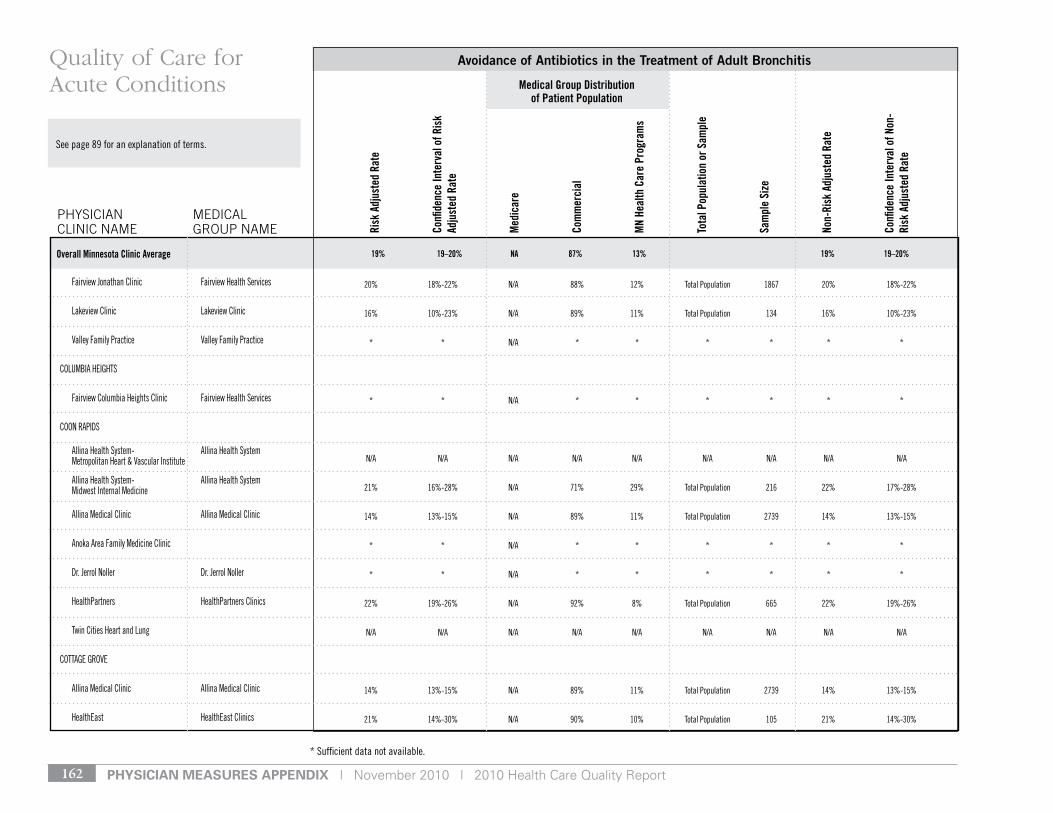
pHysiCian Measures appenDiX | November 2010 | 2010 Health Care Quality Report162
* sufficient data not available.
see page 89 for an explanation of terms.
Risk
Adj
uste
d Ra
te
Confi
denc
e In
terv
al o
f Ris
k Ad
just
ed R
ate
Med
icar
e
Com
mer
cial
MN
Heal
th C
are
Prog
ram
s
Tota
l Pop
ulat
ion
or S
ampl
e
Sam
ple
Size
Non-
Risk
Adj
uste
d Ra
te
Confi
denc
e In
terv
al o
f Non
-Ri
sk A
djus
ted
Rate
Avoidance of Antibiotics in the Treatment of Adult Bronchitis
PHySIcIAN cLINIc NAME
MEdIcAL GrOuP NAME
Quality of Care for Acute Conditions Medical Group Distribution
of Patient Population
Overall Minnesota Clinic Average 19% 19–20% NA 87% 13% 19% 19–20%
Fairview Jonathan Clinic Fairview Health services
lakeview Clinic lakeview Clinic
valley Family Practice valley Family Practice
ColuMBIA HeIgHts
Fairview Columbia Heights Clinic Fairview Health services
Coon rAPIds
Allina Health system- Allina Health system Metropolitan Heart & vascular Institute
Allina Health system- Allina Health system Midwest Internal Medicine
Allina Medical Clinic Allina Medical Clinic
Anoka Area Family Medicine Clinic
dr. Jerrol noller dr. Jerrol noller
HealthPartners HealthPartners Clinics
twin Cities Heart and lung
CottAge grove
Allina Medical Clinic Allina Medical Clinic
Healtheast Healtheast Clinics
20% 18%-22% n/A 88% 12% total Population 1867 20% 18%-22%
16% 10%-23% n/A 89% 11% total Population 134 16% 10%-23%
* * n/A * * * * * *
* * n/A * * * * * *
n/A n/A n/A n/A n/A n/A n/A n/A n/A
21% 16%-28% n/A 71% 29% total Population 216 22% 17%-28%
14% 13%-15% n/A 89% 11% total Population 2739 14% 13%-15%
* * n/A * * * * * *
* * n/A * * * * * *
22% 19%-26% n/A 92% 8% total Population 665 22% 19%-26%
n/A n/A n/A n/A n/A n/A n/A n/A n/A
14% 13%-15% n/A 89% 11% total Population 2739 14% 13%-15%
21% 14%-30% n/A 90% 10% total Population 105 21% 14%-30%
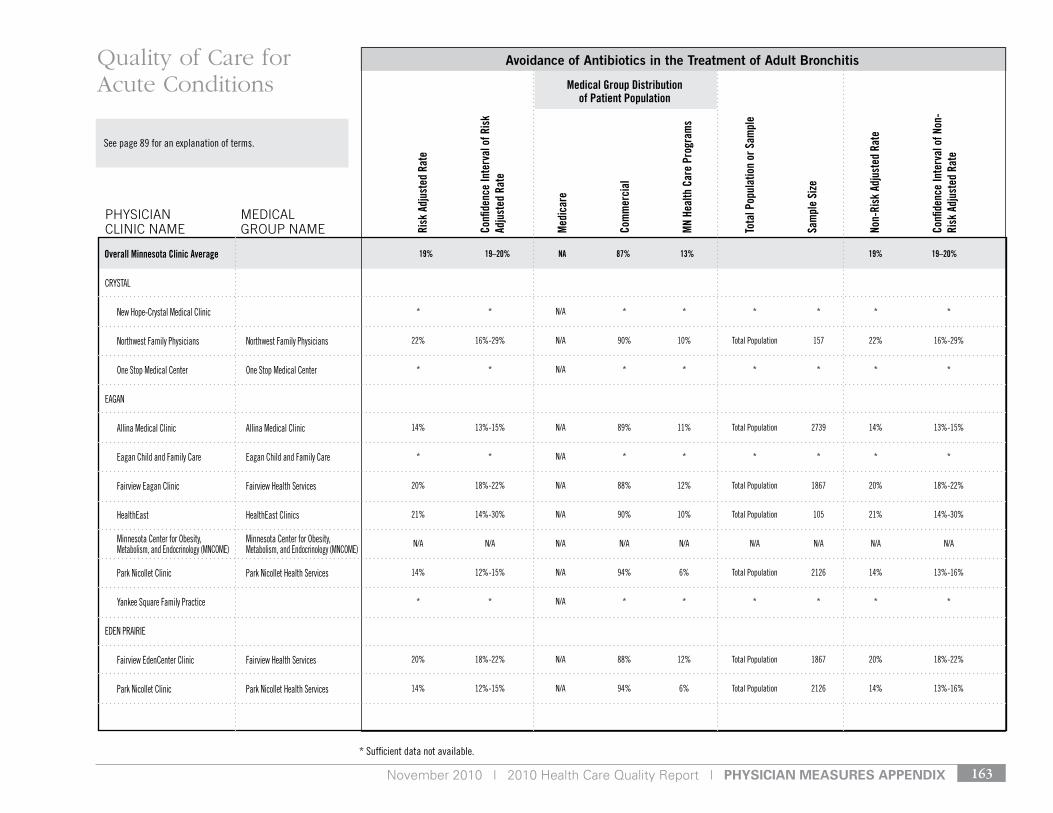
November 2010 | 2010 Health Care Quality Report | pHysiCian Measures appenDiX 163
* sufficient data not available.
see page 89 for an explanation of terms.
Risk
Adj
uste
d Ra
te
Confi
denc
e In
terv
al o
f Ris
k Ad
just
ed R
ate
Med
icar
e
Com
mer
cial
MN
Heal
th C
are
Prog
ram
s
Tota
l Pop
ulat
ion
or S
ampl
e
Sam
ple
Size
Non-
Risk
Adj
uste
d Ra
te
Confi
denc
e In
terv
al o
f Non
-Ri
sk A
djus
ted
Rate
Avoidance of Antibiotics in the Treatment of Adult Bronchitis
PHySIcIAN cLINIc NAME
MEdIcAL GrOuP NAME
Quality of Care for Acute Conditions
19% 19–20% NA 87% 13% 19% 19–20%
Medical Group Distribution of Patient Population
Overall Minnesota Clinic Average
CrystAl
new Hope-Crystal Medical Clinic
northwest Family Physicians northwest Family Physicians
one stop Medical Center one stop Medical Center
eAgAn
Allina Medical Clinic Allina Medical Clinic
eagan Child and Family Care eagan Child and Family Care
Fairview eagan Clinic Fairview Health services
Healtheast Healtheast Clinics
Minnesota Center for obesity, Minnesota Center for obesity, Metabolism, and endocrinology (MnCoMe) Metabolism, and endocrinology (MnCoMe)
Park nicollet Clinic Park nicollet Health services
yankee square Family Practice
eden PrAIrIe
Fairview edenCenter Clinic Fairview Health services
Park nicollet Clinic Park nicollet Health services
* * n/A * * * * * *
22% 16%-29% n/A 90% 10% total Population 157 22% 16%-29%
* * n/A * * * * * *
14% 13%-15% n/A 89% 11% total Population 2739 14% 13%-15%
* * n/A * * * * * *
20% 18%-22% n/A 88% 12% total Population 1867 20% 18%-22%
21% 14%-30% n/A 90% 10% total Population 105 21% 14%-30%
n/A n/A n/A n/A n/A n/A n/A n/A n/A
14% 12%-15% n/A 94% 6% total Population 2126 14% 13%-16%
* * n/A * * * * * *
20% 18%-22% n/A 88% 12% total Population 1867 20% 18%-22%
14% 12%-15% n/A 94% 6% total Population 2126 14% 13%-16%
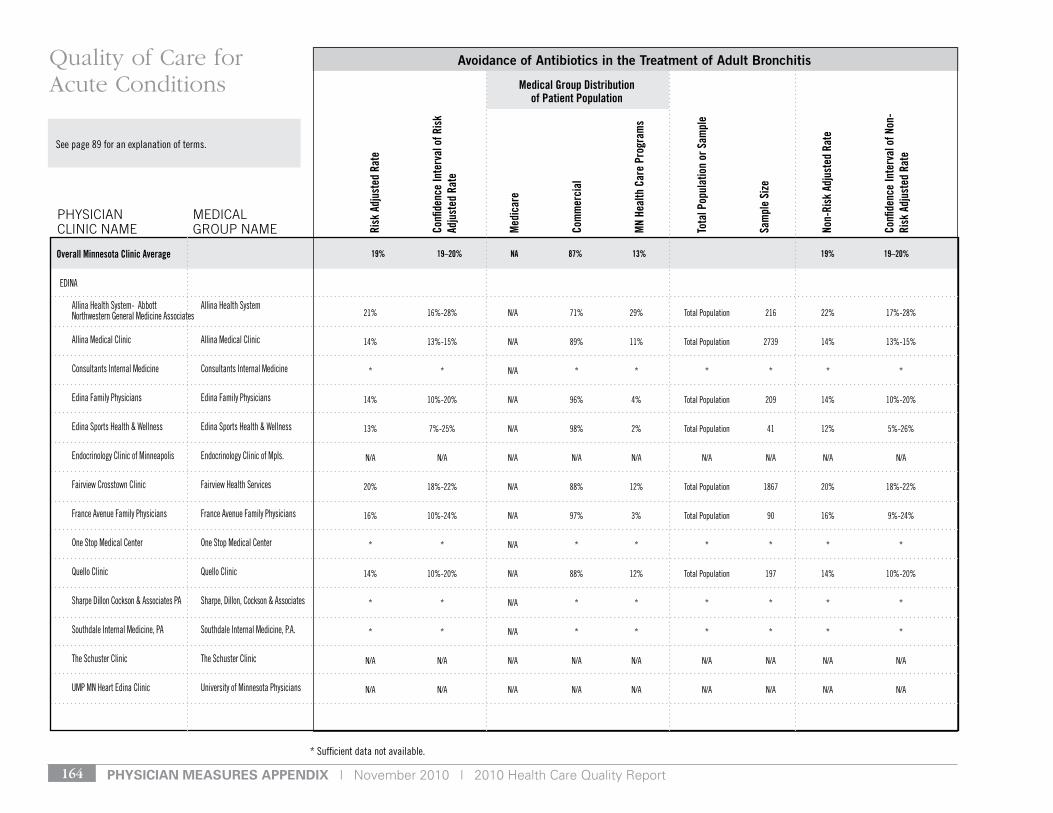
pHysiCian Measures appenDiX | November 2010 | 2010 Health Care Quality Report164
* sufficient data not available.
see page 89 for an explanation of terms.
Risk
Adj
uste
d Ra
te
Confi
denc
e In
terv
al o
f Ris
k Ad
just
ed R
ate
Med
icar
e
Com
mer
cial
MN
Heal
th C
are
Prog
ram
s
Tota
l Pop
ulat
ion
or S
ampl
e
Sam
ple
Size
Non-
Risk
Adj
uste
d Ra
te
Confi
denc
e In
terv
al o
f Non
-Ri
sk A
djus
ted
Rate
Avoidance of Antibiotics in the Treatment of Adult Bronchitis
PHySIcIAN cLINIc NAME
MEdIcAL GrOuP NAME
Quality of Care for Acute Conditions Medical Group Distribution
of Patient Population
Overall Minnesota Clinic Average 19% 19–20% NA 87% 13% 19% 19–20%
edInA
Allina Health system- Abbott Allina Health system northwestern general Medicine Associates
Allina Medical Clinic Allina Medical Clinic
Consultants Internal Medicine Consultants Internal Medicine
edina Family Physicians edina Family Physicians
edina sports Health & Wellness edina sports Health & Wellness
endocrinology Clinic of Minneapolis endocrinology Clinic of Mpls.
Fairview Crosstown Clinic Fairview Health services
France Avenue Family Physicians France Avenue Family Physicians
one stop Medical Center one stop Medical Center
Quello Clinic Quello Clinic
sharpe dillon Cockson & Associates PA sharpe, dillon, Cockson & Associates
southdale Internal Medicine, PA southdale Internal Medicine, P.A.
the schuster Clinic the schuster Clinic
uMP Mn Heart edina Clinic university of Minnesota Physicians
21% 16%-28% n/A 71% 29% total Population 216 22% 17%-28%
14% 13%-15% n/A 89% 11% total Population 2739 14% 13%-15%
* * n/A * * * * * *
14% 10%-20% n/A 96% 4% total Population 209 14% 10%-20%
13% 7%-25% n/A 98% 2% total Population 41 12% 5%-26%
n/A n/A n/A n/A n/A n/A n/A n/A n/A
20% 18%-22% n/A 88% 12% total Population 1867 20% 18%-22%
16% 10%-24% n/A 97% 3% total Population 90 16% 9%-24%
* * n/A * * * * * *
14% 10%-20% n/A 88% 12% total Population 197 14% 10%-20%
* * n/A * * * * * *
* * n/A * * * * * *
n/A n/A n/A n/A n/A n/A n/A n/A n/A
n/A n/A n/A n/A n/A n/A n/A n/A n/A

November 2010 | 2010 Health Care Quality Report | pHysiCian Measures appenDiX 165
* sufficient data not available.
see page 89 for an explanation of terms.
Risk
Adj
uste
d Ra
te
Confi
denc
e In
terv
al o
f Ris
k Ad
just
ed R
ate
Med
icar
e
Com
mer
cial
MN
Heal
th C
are
Prog
ram
s
Tota
l Pop
ulat
ion
or S
ampl
e
Sam
ple
Size
Non-
Risk
Adj
uste
d Ra
te
Confi
denc
e In
terv
al o
f Non
-Ri
sk A
djus
ted
Rate
Avoidance of Antibiotics in the Treatment of Adult Bronchitis
PHySIcIAN cLINIc NAME
MEdIcAL GrOuP NAME
Quality of Care for Acute Conditions
19% 19–20% NA 87% 13% 19% 19–20%
Medical Group Distribution of Patient Population
Overall Minnesota Clinic Average
eXCelsIor
ridgeview excelsior Clinic ridgeview Clinics
FArMIngton
Allina Medical Clinic Allina Medical Clinic
Fairview Farmington Clinic Fairview Health services
FamilyHealth Medical Clinic FamilyHealth Medical Clinics
Farmington Clinic Farmington Clinic
Forest lAke
Allina Medical Clinic Allina Medical Clinic
FrIdley
Fairview Fridley Clinic Fairview Health services
Multicare Associates- Multicare Associates Fridley Medical Center
golden vAlley
north Memorial Clinic- north Memorial golden valley Physicians
Park nicollet Clinic Park nicollet Health services
14% 10%-19% n/A 97% 3% total Population 205 14% 10%-20%
14% 13%-15% n/A 89% 11% total Population 2739 14% 13%-15%
20% 18%-22% n/A 88% 12% total Population 1867 20% 18%-22%
25% 15%-39% n/A 89% 11% total Population 45 24% 14%-39%
* * n/A * * * * * *
14% 13%-15% n/A 89% 11% total Population 2739 14% 13%-15%
* * n/A * * * * * *
* * n/A * * * * * *
17% 11%-25% n/A 86% 14% total Population 115 17% 12%-25%
14% 12%-15% n/A 94% 6% total Population 2126 14% 13%-16%
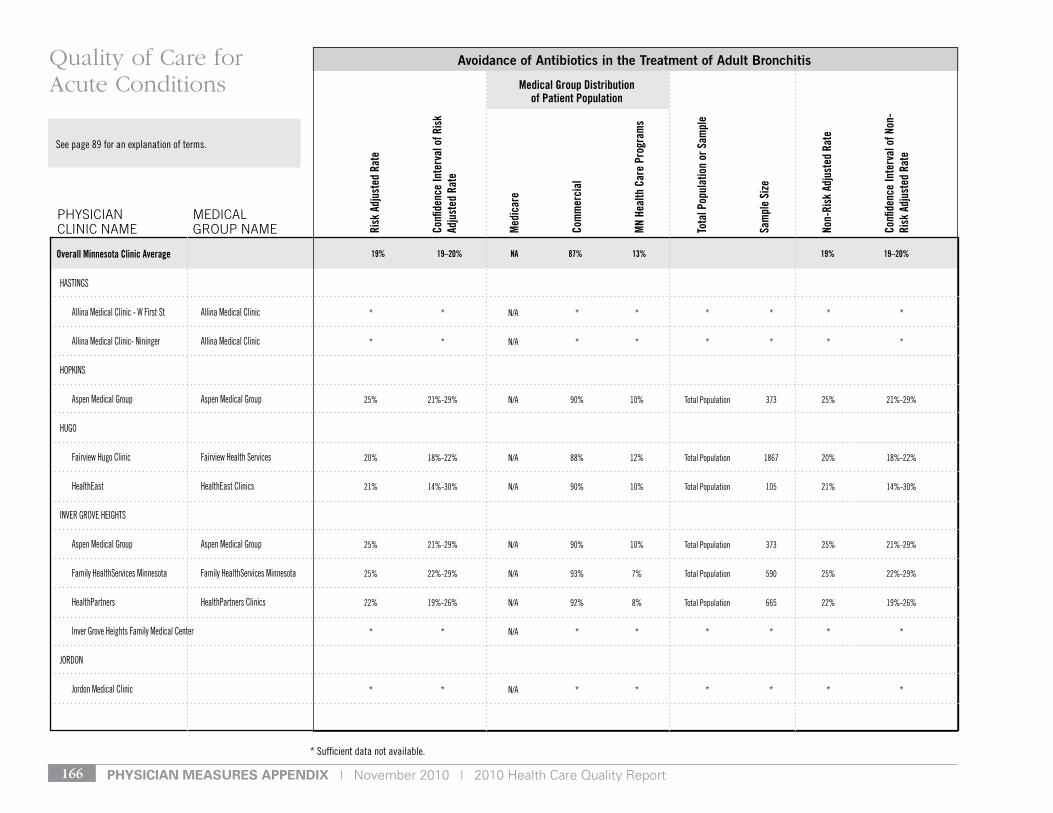
pHysiCian Measures appenDiX | November 2010 | 2010 Health Care Quality Report166
* sufficient data not available.
see page 89 for an explanation of terms.
Risk
Adj
uste
d Ra
te
Confi
denc
e In
terv
al o
f Ris
k Ad
just
ed R
ate
Med
icar
e
Com
mer
cial
MN
Heal
th C
are
Prog
ram
s
Tota
l Pop
ulat
ion
or S
ampl
e
Sam
ple
Size
Non-
Risk
Adj
uste
d Ra
te
Confi
denc
e In
terv
al o
f Non
-Ri
sk A
djus
ted
Rate
Avoidance of Antibiotics in the Treatment of Adult Bronchitis
PHySIcIAN cLINIc NAME
MEdIcAL GrOuP NAME
Quality of Care for Acute Conditions Medical Group Distribution
of Patient Population
Overall Minnesota Clinic Average 19% 19–20% NA 87% 13% 19% 19–20%
HAstIngs
Allina Medical Clinic - W First st Allina Medical Clinic
Allina Medical Clinic- nininger Allina Medical Clinic
HoPkIns
Aspen Medical group Aspen Medical group
Hugo
Fairview Hugo Clinic Fairview Health services
Healtheast Healtheast Clinics
Inver grove HeIgHts
Aspen Medical group Aspen Medical group
Family Healthservices Minnesota Family Healthservices Minnesota
HealthPartners HealthPartners Clinics
Inver grove Heights Family Medical Center
Jordon
Jordon Medical Clinic
* * n/A * * * * * *
* * n/A * * * * * *
25% 21%-29% n/A 90% 10% total Population 373 25% 21%-29%
20% 18%-22% n/A 88% 12% total Population 1867 20% 18%-22%
21% 14%-30% n/A 90% 10% total Population 105 21% 14%-30%
25% 21%-29% n/A 90% 10% total Population 373 25% 21%-29%
25% 22%-29% n/A 93% 7% total Population 590 25% 22%-29%
22% 19%-26% n/A 92% 8% total Population 665 22% 19%-26%
* * n/A * * * * * *
* * n/A * * * * * *
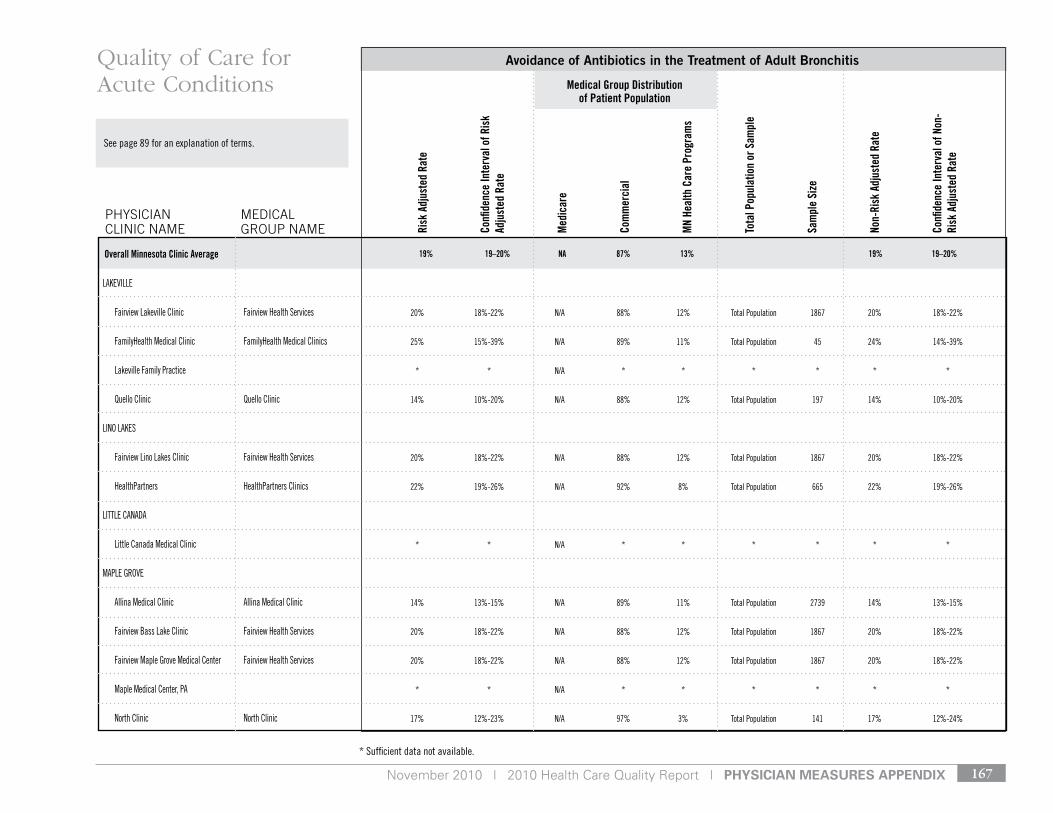
November 2010 | 2010 Health Care Quality Report | pHysiCian Measures appenDiX 167
* sufficient data not available.
see page 89 for an explanation of terms.
Risk
Adj
uste
d Ra
te
Confi
denc
e In
terv
al o
f Ris
k Ad
just
ed R
ate
Med
icar
e
Com
mer
cial
MN
Heal
th C
are
Prog
ram
s
Tota
l Pop
ulat
ion
or S
ampl
e
Sam
ple
Size
Non-
Risk
Adj
uste
d Ra
te
Confi
denc
e In
terv
al o
f Non
-Ri
sk A
djus
ted
Rate
Avoidance of Antibiotics in the Treatment of Adult Bronchitis
PHySIcIAN cLINIc NAME
MEdIcAL GrOuP NAME
Quality of Care for Acute Conditions
19% 19–20% NA 87% 13% 19% 19–20%
Medical Group Distribution of Patient Population
Overall Minnesota Clinic Average
20% 18%-22% n/A 88% 12% total Population 1867 20% 18%-22%
25% 15%-39% n/A 89% 11% total Population 45 24% 14%-39%
* * n/A * * * * * *
14% 10%-20% n/A 88% 12% total Population 197 14% 10%-20%
20% 18%-22% n/A 88% 12% total Population 1867 20% 18%-22%
22% 19%-26% n/A 92% 8% total Population 665 22% 19%-26%
* * n/A * * * * * *
14% 13%-15% n/A 89% 11% total Population 2739 14% 13%-15%
20% 18%-22% n/A 88% 12% total Population 1867 20% 18%-22%
20% 18%-22% n/A 88% 12% total Population 1867 20% 18%-22%
* * n/A * * * * * *
17% 12%-23% n/A 97% 3% total Population 141 17% 12%-24%
lAkevIlle
Fairview lakeville Clinic Fairview Health services
FamilyHealth Medical Clinic FamilyHealth Medical Clinics
lakeville Family Practice
Quello Clinic Quello Clinic
lIno lAkes
Fairview lino lakes Clinic Fairview Health services
HealthPartners HealthPartners Clinics
lIttle CAnAdA
little Canada Medical Clinic
MAPle grove
Allina Medical Clinic Allina Medical Clinic
Fairview Bass lake Clinic Fairview Health services
Fairview Maple grove Medical Center Fairview Health services
Maple Medical Center, PA
north Clinic north Clinic
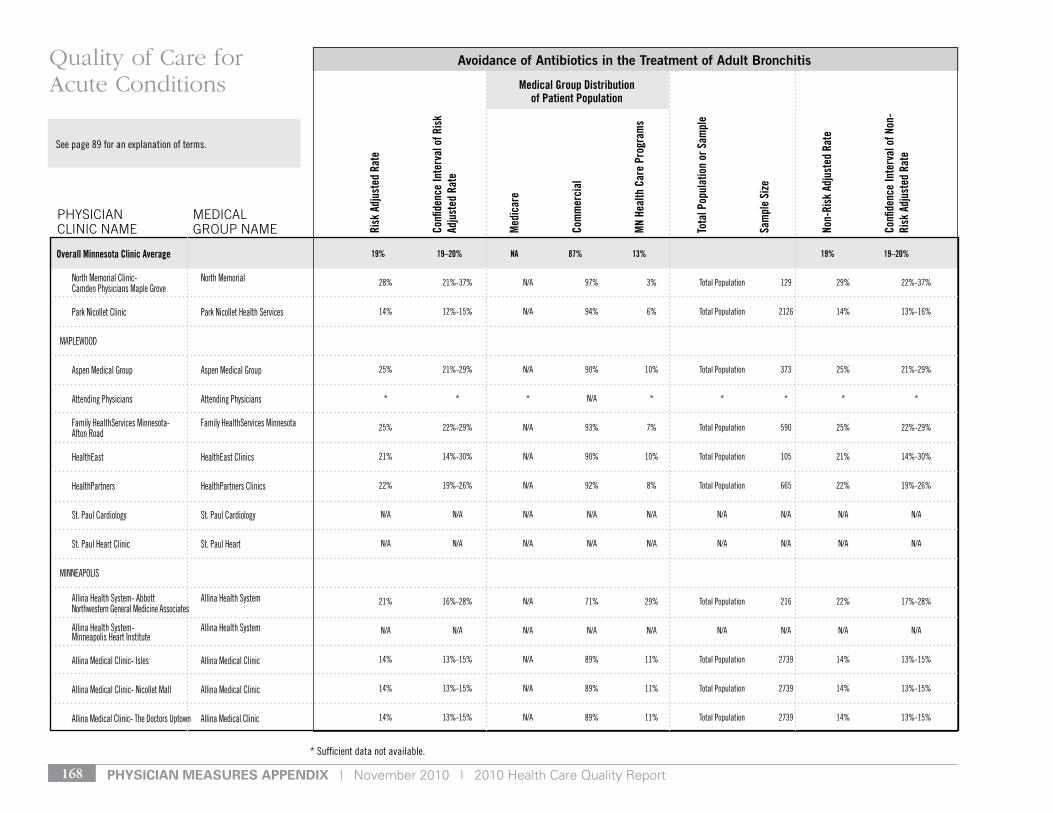
pHysiCian Measures appenDiX | November 2010 | 2010 Health Care Quality Report168
* sufficient data not available.
see page 89 for an explanation of terms.
Risk
Adj
uste
d Ra
te
Confi
denc
e In
terv
al o
f Ris
k Ad
just
ed R
ate
Med
icar
e
Com
mer
cial
MN
Heal
th C
are
Prog
ram
s
Tota
l Pop
ulat
ion
or S
ampl
e
Sam
ple
Size
Non-
Risk
Adj
uste
d Ra
te
Confi
denc
e In
terv
al o
f Non
-Ri
sk A
djus
ted
Rate
Avoidance of Antibiotics in the Treatment of Adult Bronchitis
PHySIcIAN cLINIc NAME
MEdIcAL GrOuP NAME
Quality of Care for Acute Conditions Medical Group Distribution
of Patient Population
Overall Minnesota Clinic Average 19% 19–20% NA 87% 13% 19% 19–20%
north Memorial Clinic- north Memorial Camden Physicians Maple grove
Park nicollet Clinic Park nicollet Health services
MAPleWood
Aspen Medical group Aspen Medical group
Attending Physicians Attending Physicians
Family Healthservices Minnesota- Family Healthservices Minnesota Afton road
Healtheast Healtheast Clinics
HealthPartners HealthPartners Clinics
st. Paul Cardiology st. Paul Cardiology
st. Paul Heart Clinic st. Paul Heart
MInneAPolIs
Allina Health system- Abbott Allina Health system northwestern general Medicine Associates
Allina Health system- Allina Health system Minneapolis Heart Institute
Allina Medical Clinic- Isles Allina Medical Clinic
Allina Medical Clinic- nicollet Mall Allina Medical Clinic
Allina Medical Clinic- the doctors uptown Allina Medical Clinic
28% 21%-37% n/A 97% 3% total Population 129 29% 22%-37%
14% 12%-15% n/A 94% 6% total Population 2126 14% 13%-16%
25% 21%-29% n/A 90% 10% total Population 373 25% 21%-29%
* * * n/A * * * * *
25% 22%-29% n/A 93% 7% total Population 590 25% 22%-29%
21% 14%-30% n/A 90% 10% total Population 105 21% 14%-30%
22% 19%-26% n/A 92% 8% total Population 665 22% 19%-26%
n/A n/A n/A n/A n/A n/A n/A n/A n/A
n/A n/A n/A n/A n/A n/A n/A n/A n/A
21% 16%-28% n/A 71% 29% total Population 216 22% 17%-28%
n/A n/A n/A n/A n/A n/A n/A n/A n/A
14% 13%-15% n/A 89% 11% total Population 2739 14% 13%-15%
14% 13%-15% n/A 89% 11% total Population 2739 14% 13%-15%
14% 13%-15% n/A 89% 11% total Population 2739 14% 13%-15%
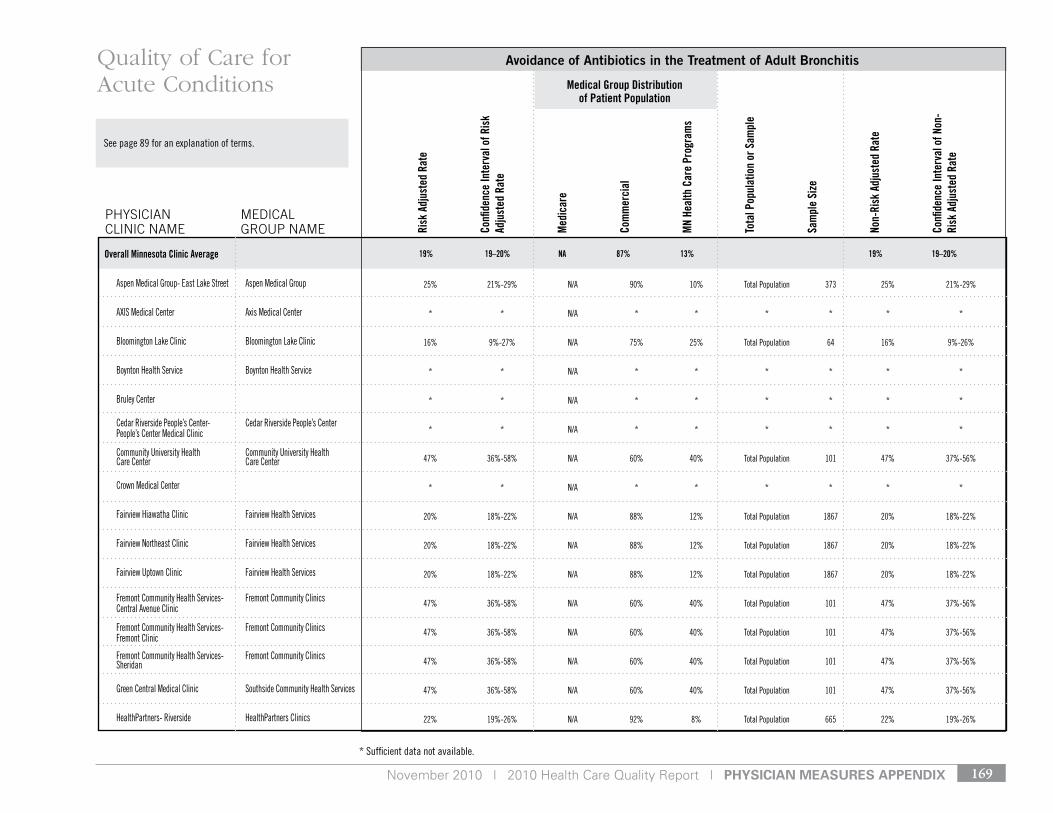
November 2010 | 2010 Health Care Quality Report | pHysiCian Measures appenDiX 169
* sufficient data not available.
see page 89 for an explanation of terms.
Risk
Adj
uste
d Ra
te
Confi
denc
e In
terv
al o
f Ris
k Ad
just
ed R
ate
Med
icar
e
Com
mer
cial
MN
Heal
th C
are
Prog
ram
s
Tota
l Pop
ulat
ion
or S
ampl
e
Sam
ple
Size
Non-
Risk
Adj
uste
d Ra
te
Confi
denc
e In
terv
al o
f Non
-Ri
sk A
djus
ted
Rate
Avoidance of Antibiotics in the Treatment of Adult Bronchitis
PHySIcIAN cLINIc NAME
MEdIcAL GrOuP NAME
Quality of Care for Acute Conditions
19% 19–20% NA 87% 13% 19% 19–20%
Medical Group Distribution of Patient Population
Overall Minnesota Clinic Average
Aspen Medical group- east lake street Aspen Medical group
AXIs Medical Center Axis Medical Center
Bloomington lake Clinic Bloomington lake Clinic
Boynton Health service Boynton Health service
Bruley Center
Cedar riverside People’s Center- Cedar riverside People’s Center People’s Center Medical Clinic
Community university Health Community university Health Care Center Care Center
Crown Medical Center
Fairview Hiawatha Clinic Fairview Health services
Fairview northeast Clinic Fairview Health services
Fairview uptown Clinic Fairview Health services
Fremont Community Health services- Fremont Community Clinics Central Avenue Clinic
Fremont Community Health services- Fremont Community Clinics Fremont Clinic
Fremont Community Health services- Fremont Community Clinics sheridan
green Central Medical Clinic southside Community Health services
HealthPartners- riverside HealthPartners Clinics
25% 21%-29% n/A 90% 10% total Population 373 25% 21%-29%
* * n/A * * * * * *
16% 9%-27% n/A 75% 25% total Population 64 16% 9%-26%
* * n/A * * * * * *
* * n/A * * * * * *
* * n/A * * * * * *
47% 36%-58% n/A 60% 40% total Population 101 47% 37%-56%
* * n/A * * * * * *
20% 18%-22% n/A 88% 12% total Population 1867 20% 18%-22%
20% 18%-22% n/A 88% 12% total Population 1867 20% 18%-22%
20% 18%-22% n/A 88% 12% total Population 1867 20% 18%-22%
47% 36%-58% n/A 60% 40% total Population 101 47% 37%-56%
47% 36%-58% n/A 60% 40% total Population 101 47% 37%-56%
47% 36%-58% n/A 60% 40% total Population 101 47% 37%-56%
47% 36%-58% n/A 60% 40% total Population 101 47% 37%-56%
22% 19%-26% n/A 92% 8% total Population 665 22% 19%-26%
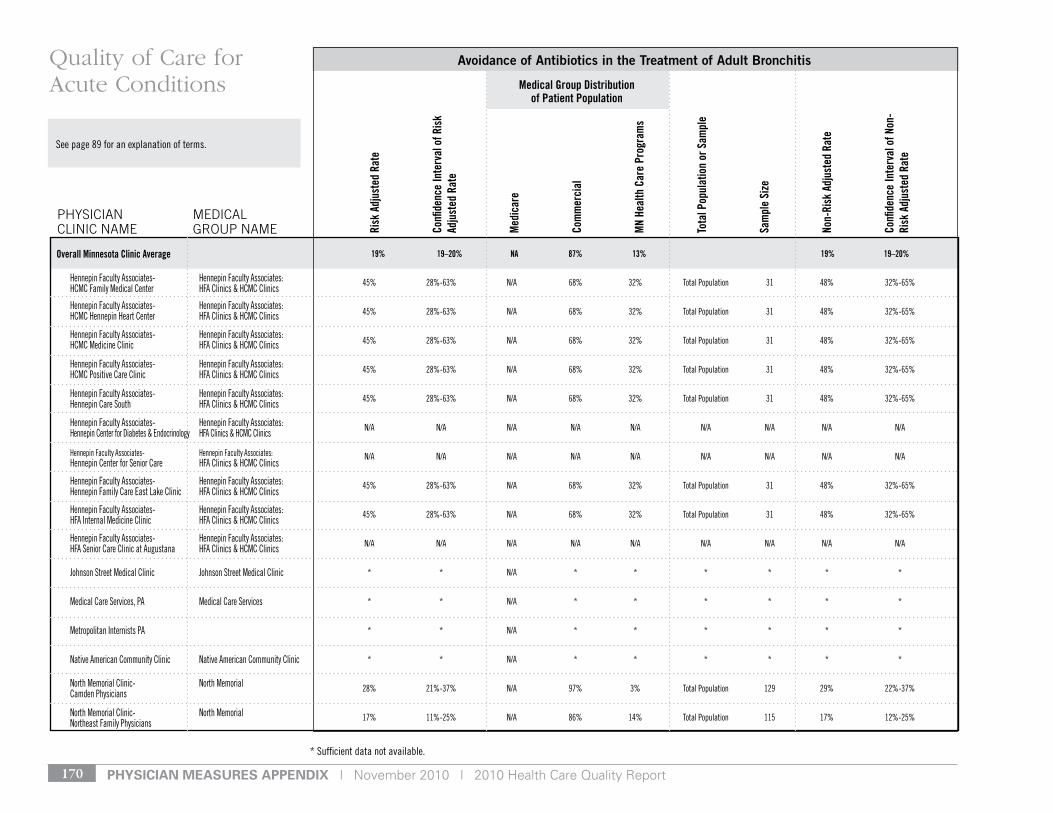
pHysiCian Measures appenDiX | November 2010 | 2010 Health Care Quality Report170
* sufficient data not available.
see page 89 for an explanation of terms.
Risk
Adj
uste
d Ra
te
Confi
denc
e In
terv
al o
f Ris
k Ad
just
ed R
ate
Med
icar
e
Com
mer
cial
MN
Heal
th C
are
Prog
ram
s
Tota
l Pop
ulat
ion
or S
ampl
e
Sam
ple
Size
Non-
Risk
Adj
uste
d Ra
te
Confi
denc
e In
terv
al o
f Non
-Ri
sk A
djus
ted
Rate
Avoidance of Antibiotics in the Treatment of Adult Bronchitis
PHySIcIAN cLINIc NAME
MEdIcAL GrOuP NAME
Quality of Care for Acute Conditions Medical Group Distribution
of Patient Population
Overall Minnesota Clinic Average 19% 19–20% NA 87% 13% 19% 19–20%
Hennepin Faculty Associates- Hennepin Faculty Associates: HCMC Family Medical Center HFA Clinics & HCMC Clinics
Hennepin Faculty Associates- Hennepin Faculty Associates: HCMC Hennepin Heart Center HFA Clinics & HCMC Clinics
Hennepin Faculty Associates- Hennepin Faculty Associates: HCMC Medicine Clinic HFA Clinics & HCMC Clinics
Hennepin Faculty Associates- Hennepin Faculty Associates: HCMC Positive Care Clinic HFA Clinics & HCMC Clinics
Hennepin Faculty Associates- Hennepin Faculty Associates: Hennepin Care south HFA Clinics & HCMC Clinics
Hennepin Faculty Associates- Hennepin Faculty Associates: Hennepin Center for diabetes & endocrinology HFA Clinics & HCMC Clinics
Hennepin Faculty Associates- Hennepin Faculty Associates: Hennepin Center for senior Care HFA Clinics & HCMC Clinics
Hennepin Faculty Associates- Hennepin Faculty Associates: Hennepin Family Care east lake Clinic HFA Clinics & HCMC Clinics
Hennepin Faculty Associates- Hennepin Faculty Associates: HFA Internal Medicine Clinic HFA Clinics & HCMC Clinics
Hennepin Faculty Associates- Hennepin Faculty Associates: HFA senior Care Clinic at Augustana HFA Clinics & HCMC Clinics
Johnson street Medical Clinic Johnson street Medical Clinic
Medical Care services, PA Medical Care services
Metropolitan Internists PA
native American Community Clinic native American Community Clinic
north Memorial Clinic- north Memorial Camden Physicians
north Memorial Clinic- north Memorial northeast Family Physicians
45% 28%-63% n/A 68% 32% total Population 31 48% 32%-65%
45% 28%-63% n/A 68% 32% total Population 31 48% 32%-65%
45% 28%-63% n/A 68% 32% total Population 31 48% 32%-65%
45% 28%-63% n/A 68% 32% total Population 31 48% 32%-65%
45% 28%-63% n/A 68% 32% total Population 31 48% 32%-65%
n/A n/A n/A n/A n/A n/A n/A n/A n/A
n/A n/A n/A n/A n/A n/A n/A n/A n/A
45% 28%-63% n/A 68% 32% total Population 31 48% 32%-65%
45% 28%-63% n/A 68% 32% total Population 31 48% 32%-65%
n/A n/A n/A n/A n/A n/A n/A n/A n/A
* * n/A * * * * * *
* * n/A * * * * * *
* * n/A * * * * * *
* * n/A * * * * * *
28% 21%-37% n/A 97% 3% total Population 129 29% 22%-37%
17% 11%-25% n/A 86% 14% total Population 115 17% 12%-25%
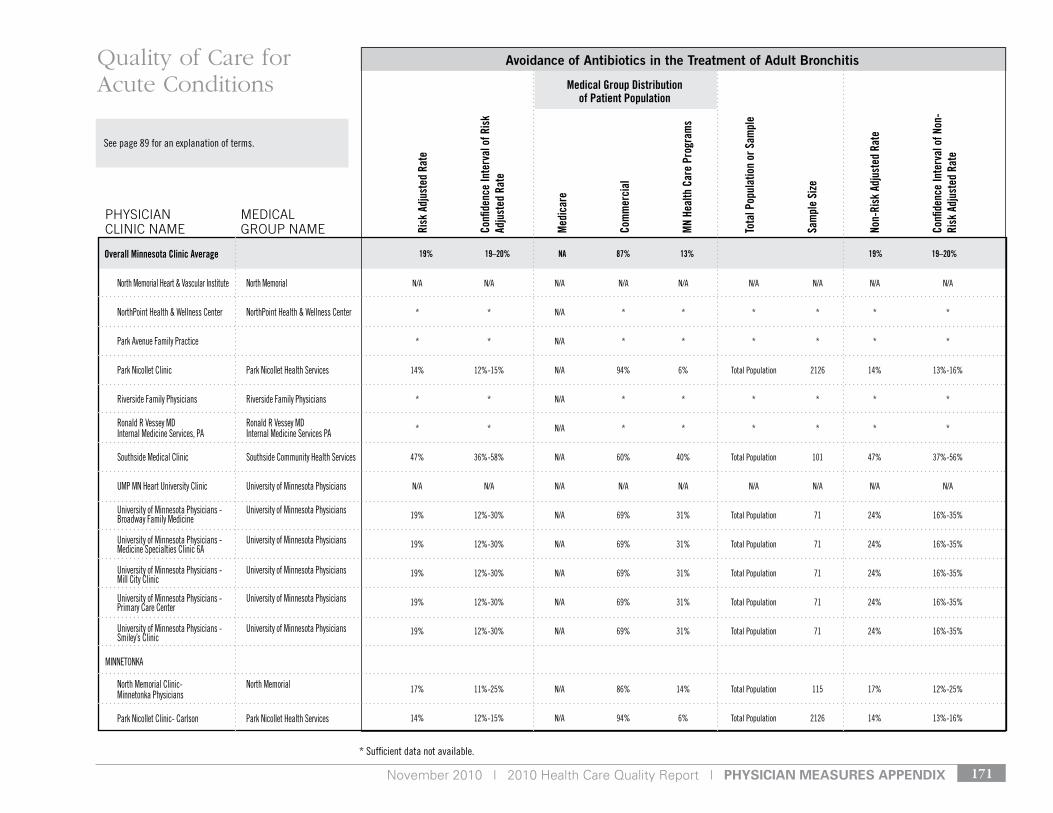
November 2010 | 2010 Health Care Quality Report | pHysiCian Measures appenDiX 171
* sufficient data not available.
see page 89 for an explanation of terms.
Risk
Adj
uste
d Ra
te
Confi
denc
e In
terv
al o
f Ris
k Ad
just
ed R
ate
Med
icar
e
Com
mer
cial
MN
Heal
th C
are
Prog
ram
s
Tota
l Pop
ulat
ion
or S
ampl
e
Sam
ple
Size
Non-
Risk
Adj
uste
d Ra
te
Confi
denc
e In
terv
al o
f Non
-Ri
sk A
djus
ted
Rate
Avoidance of Antibiotics in the Treatment of Adult Bronchitis
PHySIcIAN cLINIc NAME
MEdIcAL GrOuP NAME
Quality of Care for Acute Conditions
19% 19–20% NA 87% 13% 19% 19–20%
Medical Group Distribution of Patient Population
Overall Minnesota Clinic Average
north Memorial Heart & vascular Institute north Memorial
northPoint Health & Wellness Center northPoint Health & Wellness Center
Park Avenue Family Practice
Park nicollet Clinic Park nicollet Health services
riverside Family Physicians riverside Family Physicians
ronald r vessey Md ronald r vessey Md Internal Medicine services, PA Internal Medicine services PA
southside Medical Clinic southside Community Health services
uMP Mn Heart university Clinic university of Minnesota Physicians
university of Minnesota Physicians - university of Minnesota Physicians Broadway Family Medicine
university of Minnesota Physicians - university of Minnesota Physicians Medicine specialties Clinic 6A
university of Minnesota Physicians - university of Minnesota Physicians Mill City Clinic
university of Minnesota Physicians - university of Minnesota Physicians Primary Care Center
university of Minnesota Physicians - university of Minnesota Physicians smiley’s Clinic
MInnetonkA
north Memorial Clinic- north Memorial Minnetonka Physicians
Park nicollet Clinic- Carlson Park nicollet Health services
n/A n/A n/A n/A n/A n/A n/A n/A n/A
* * n/A * * * * * *
* * n/A * * * * * *
14% 12%-15% n/A 94% 6% total Population 2126 14% 13%-16%
* * n/A * * * * * *
* * n/A * * * * * *
47% 36%-58% n/A 60% 40% total Population 101 47% 37%-56%
n/A n/A n/A n/A n/A n/A n/A n/A n/A
19% 12%-30% n/A 69% 31% total Population 71 24% 16%-35%
19% 12%-30% n/A 69% 31% total Population 71 24% 16%-35%
19% 12%-30% n/A 69% 31% total Population 71 24% 16%-35%
19% 12%-30% n/A 69% 31% total Population 71 24% 16%-35%
19% 12%-30% n/A 69% 31% total Population 71 24% 16%-35%
17% 11%-25% n/A 86% 14% total Population 115 17% 12%-25%
14% 12%-15% n/A 94% 6% total Population 2126 14% 13%-16%
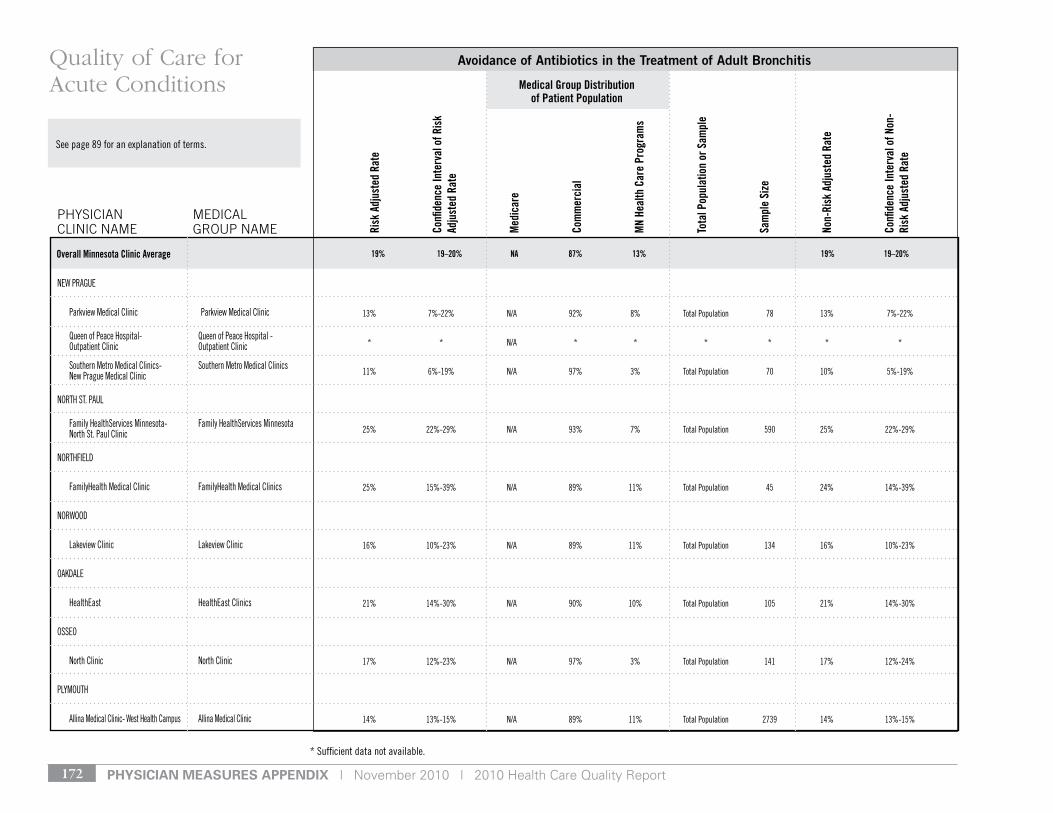
pHysiCian Measures appenDiX | November 2010 | 2010 Health Care Quality Report172
* sufficient data not available.
see page 89 for an explanation of terms.
Risk
Adj
uste
d Ra
te
Confi
denc
e In
terv
al o
f Ris
k Ad
just
ed R
ate
Med
icar
e
Com
mer
cial
MN
Heal
th C
are
Prog
ram
s
Tota
l Pop
ulat
ion
or S
ampl
e
Sam
ple
Size
Non-
Risk
Adj
uste
d Ra
te
Confi
denc
e In
terv
al o
f Non
-Ri
sk A
djus
ted
Rate
Avoidance of Antibiotics in the Treatment of Adult Bronchitis
PHySIcIAN cLINIc NAME
MEdIcAL GrOuP NAME
Quality of Care for Acute Conditions Medical Group Distribution
of Patient Population
Overall Minnesota Clinic Average 19% 19–20% NA 87% 13% 19% 19–20%
neW PrAgue
Parkview Medical Clinic Parkview Medical Clinic
Queen of Peace Hospital- Queen of Peace Hospital - outpatient Clinic outpatient Clinic
southern Metro Medical Clinics- southern Metro Medical Clinics new Prague Medical Clinic
nortH st. PAul
Family Healthservices Minnesota- Family Healthservices Minnesota north st. Paul Clinic
nortHFIeld
FamilyHealth Medical Clinic FamilyHealth Medical Clinics
norWood
lakeview Clinic lakeview Clinic
oAkdAle
Healtheast Healtheast Clinics
osseo
north Clinic north Clinic
PlyMoutH
Allina Medical Clinic- West Health Campus Allina Medical Clinic
13% 7%-22% n/A 92% 8% total Population 78 13% 7%-22%
* * n/A * * * * * *
11% 6%-19% n/A 97% 3% total Population 70 10% 5%-19%
25% 22%-29% n/A 93% 7% total Population 590 25% 22%-29%
25% 15%-39% n/A 89% 11% total Population 45 24% 14%-39%
16% 10%-23% n/A 89% 11% total Population 134 16% 10%-23%
21% 14%-30% n/A 90% 10% total Population 105 21% 14%-30%
17% 12%-23% n/A 97% 3% total Population 141 17% 12%-24%
14% 13%-15% n/A 89% 11% total Population 2739 14% 13%-15%
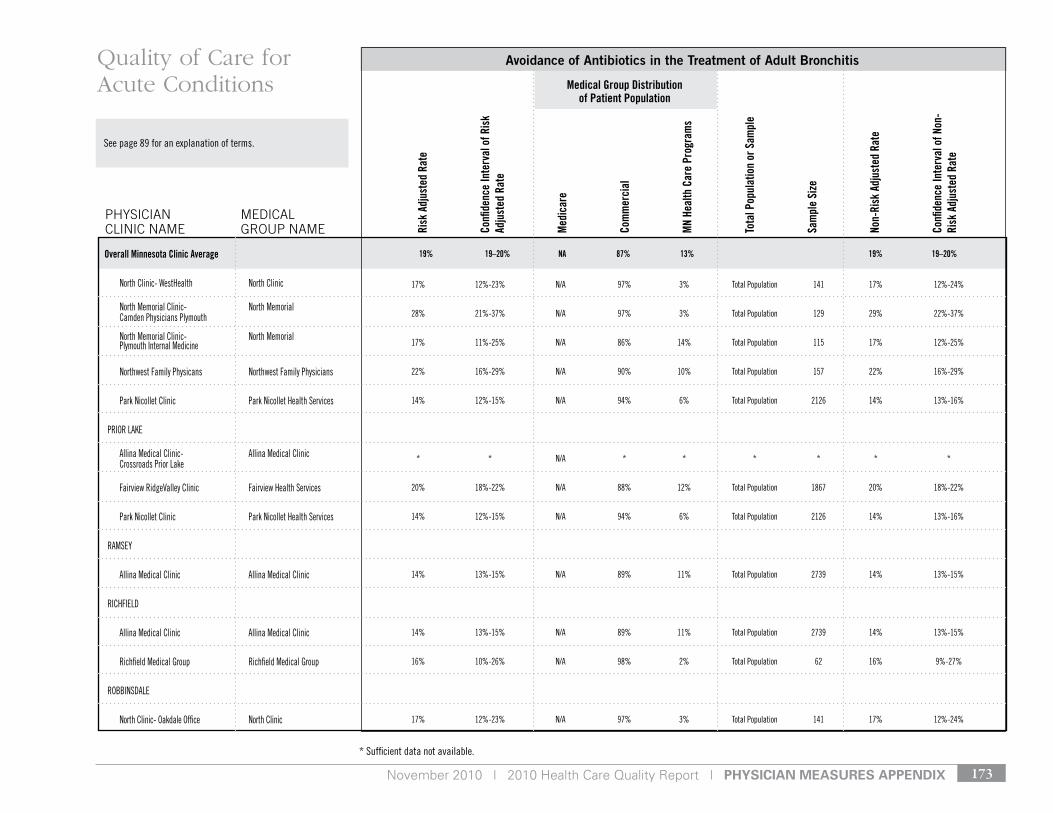
November 2010 | 2010 Health Care Quality Report | pHysiCian Measures appenDiX 173
* sufficient data not available.
see page 89 for an explanation of terms.
Risk
Adj
uste
d Ra
te
Confi
denc
e In
terv
al o
f Ris
k Ad
just
ed R
ate
Med
icar
e
Com
mer
cial
MN
Heal
th C
are
Prog
ram
s
Tota
l Pop
ulat
ion
or S
ampl
e
Sam
ple
Size
Non-
Risk
Adj
uste
d Ra
te
Confi
denc
e In
terv
al o
f Non
-Ri
sk A
djus
ted
Rate
Avoidance of Antibiotics in the Treatment of Adult Bronchitis
PHySIcIAN cLINIc NAME
MEdIcAL GrOuP NAME
Quality of Care for Acute Conditions
19% 19–20% NA 87% 13% 19% 19–20%
Medical Group Distribution of Patient Population
Overall Minnesota Clinic Average
north Clinic- WestHealth north Clinic
north Memorial Clinic- north Memorial Camden Physicians Plymouth
north Memorial Clinic- north Memorial Plymouth Internal Medicine
northwest Family Physicans northwest Family Physicians
Park nicollet Clinic Park nicollet Health services
PrIor lAke
Allina Medical Clinic- Allina Medical Clinic Crossroads Prior lake
Fairview ridgevalley Clinic Fairview Health services
Park nicollet Clinic Park nicollet Health services
rAMsey
Allina Medical Clinic Allina Medical Clinic
rICHFIeld
Allina Medical Clinic Allina Medical Clinic
richfield Medical group richfield Medical group
roBBInsdAle
north Clinic- oakdale office north Clinic
17% 12%-23% n/A 97% 3% total Population 141 17% 12%-24%
28% 21%-37% n/A 97% 3% total Population 129 29% 22%-37%
17% 11%-25% n/A 86% 14% total Population 115 17% 12%-25%
22% 16%-29% n/A 90% 10% total Population 157 22% 16%-29%
14% 12%-15% n/A 94% 6% total Population 2126 14% 13%-16%
* * n/A * * * * * *
20% 18%-22% n/A 88% 12% total Population 1867 20% 18%-22%
14% 12%-15% n/A 94% 6% total Population 2126 14% 13%-16%
14% 13%-15% n/A 89% 11% total Population 2739 14% 13%-15%
14% 13%-15% n/A 89% 11% total Population 2739 14% 13%-15%
16% 10%-26% n/A 98% 2% total Population 62 16% 9%-27%
17% 12%-23% n/A 97% 3% total Population 141 17% 12%-24%
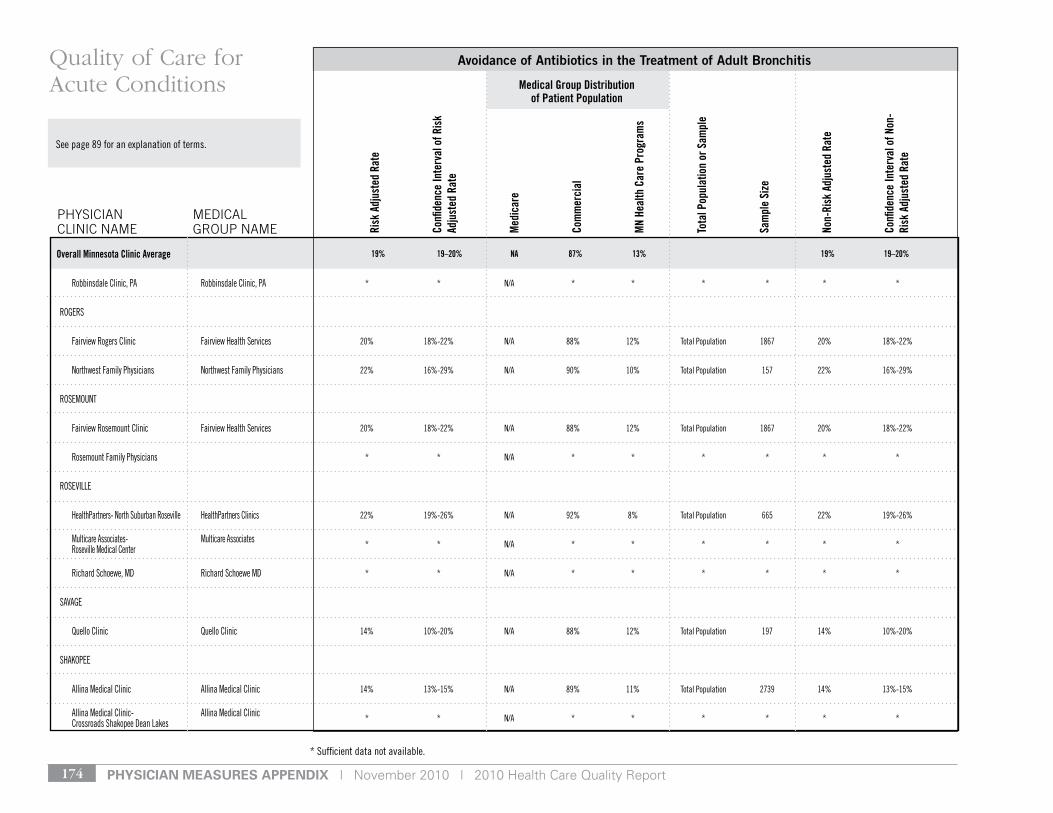
pHysiCian Measures appenDiX | November 2010 | 2010 Health Care Quality Report174
* sufficient data not available.
see page 89 for an explanation of terms.
Risk
Adj
uste
d Ra
te
Confi
denc
e In
terv
al o
f Ris
k Ad
just
ed R
ate
Med
icar
e
Com
mer
cial
MN
Heal
th C
are
Prog
ram
s
Tota
l Pop
ulat
ion
or S
ampl
e
Sam
ple
Size
Non-
Risk
Adj
uste
d Ra
te
Confi
denc
e In
terv
al o
f Non
-Ri
sk A
djus
ted
Rate
Avoidance of Antibiotics in the Treatment of Adult Bronchitis
PHySIcIAN cLINIc NAME
MEdIcAL GrOuP NAME
Quality of Care for Acute Conditions Medical Group Distribution
of Patient Population
Overall Minnesota Clinic Average 19% 19–20% NA 87% 13% 19% 19–20%
robbinsdale Clinic, PA robbinsdale Clinic, PA
rogers
Fairview rogers Clinic Fairview Health services
northwest Family Physicians northwest Family Physicians
roseMount
Fairview rosemount Clinic Fairview Health services
rosemount Family Physicians
rosevIlle
HealthPartners- north suburban roseville HealthPartners Clinics
Multicare Associates- Multicare Associates roseville Medical Center
richard schoewe, Md richard schoewe Md
sAvAge
Quello Clinic Quello Clinic
sHAkoPee
Allina Medical Clinic Allina Medical Clinic
Allina Medical Clinic- Allina Medical Clinic Crossroads shakopee dean lakes
* * n/A * * * * * *
20% 18%-22% n/A 88% 12% total Population 1867 20% 18%-22%
22% 16%-29% n/A 90% 10% total Population 157 22% 16%-29%
20% 18%-22% n/A 88% 12% total Population 1867 20% 18%-22%
* * n/A * * * * * *
22% 19%-26% n/A 92% 8% total Population 665 22% 19%-26%
* * n/A * * * * * *
* * n/A * * * * * *
14% 10%-20% n/A 88% 12% total Population 197 14% 10%-20%
14% 13%-15% n/A 89% 11% total Population 2739 14% 13%-15%
* * n/A * * * * * *
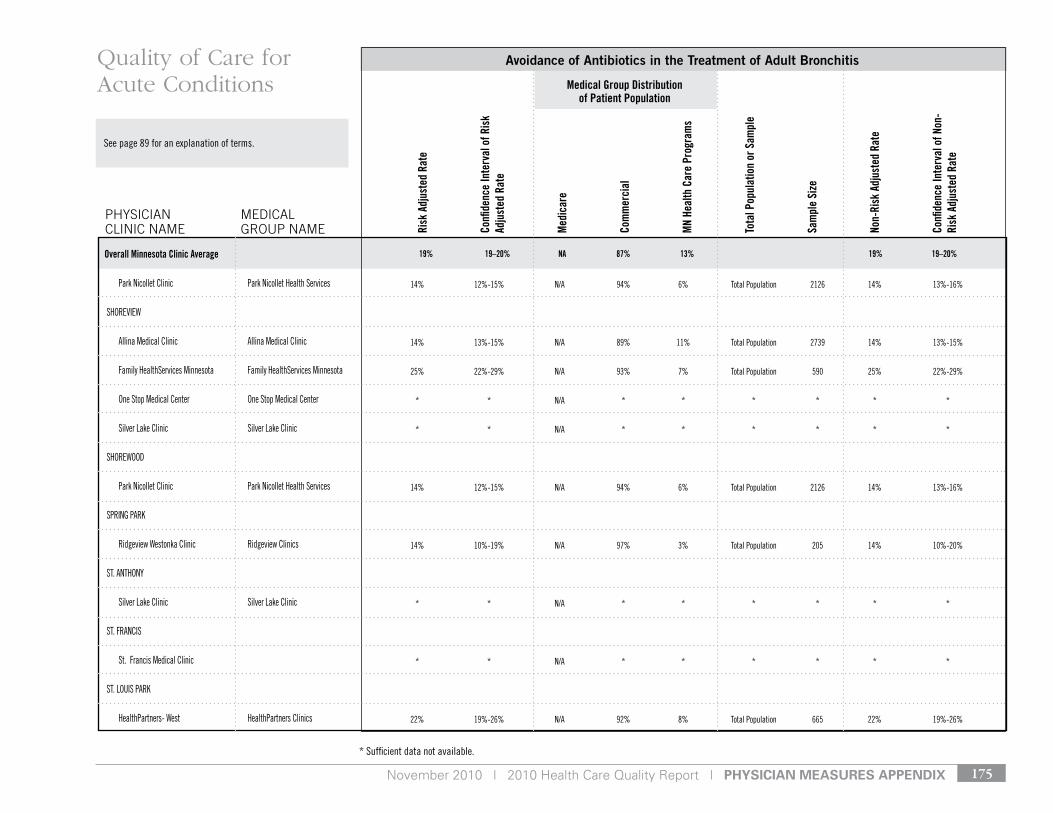
November 2010 | 2010 Health Care Quality Report | pHysiCian Measures appenDiX 175
* sufficient data not available.
see page 89 for an explanation of terms.
Risk
Adj
uste
d Ra
te
Confi
denc
e In
terv
al o
f Ris
k Ad
just
ed R
ate
Med
icar
e
Com
mer
cial
MN
Heal
th C
are
Prog
ram
s
Tota
l Pop
ulat
ion
or S
ampl
e
Sam
ple
Size
Non-
Risk
Adj
uste
d Ra
te
Confi
denc
e In
terv
al o
f Non
-Ri
sk A
djus
ted
Rate
Avoidance of Antibiotics in the Treatment of Adult Bronchitis
PHySIcIAN cLINIc NAME
MEdIcAL GrOuP NAME
Quality of Care for Acute Conditions
19% 19–20% NA 87% 13% 19% 19–20%
Medical Group Distribution of Patient Population
Overall Minnesota Clinic Average
Park nicollet Clinic Park nicollet Health services
sHorevIeW
Allina Medical Clinic Allina Medical Clinic
Family Healthservices Minnesota Family Healthservices Minnesota
one stop Medical Center one stop Medical Center
silver lake Clinic silver lake Clinic
sHoreWood
Park nicollet Clinic Park nicollet Health services
sPrIng PArk
ridgeview Westonka Clinic ridgeview Clinics
st. AntHony
silver lake Clinic silver lake Clinic
st. FrAnCIs
st. Francis Medical Clinic
st. louIs PArk
HealthPartners- West HealthPartners Clinics
14% 12%-15% n/A 94% 6% total Population 2126 14% 13%-16%
14% 13%-15% n/A 89% 11% total Population 2739 14% 13%-15%
25% 22%-29% n/A 93% 7% total Population 590 25% 22%-29%
* * n/A * * * * * *
* * n/A * * * * * *
14% 12%-15% n/A 94% 6% total Population 2126 14% 13%-16%
14% 10%-19% n/A 97% 3% total Population 205 14% 10%-20%
* * n/A * * * * * *
* * n/A * * * * * *
22% 19%-26% n/A 92% 8% total Population 665 22% 19%-26%
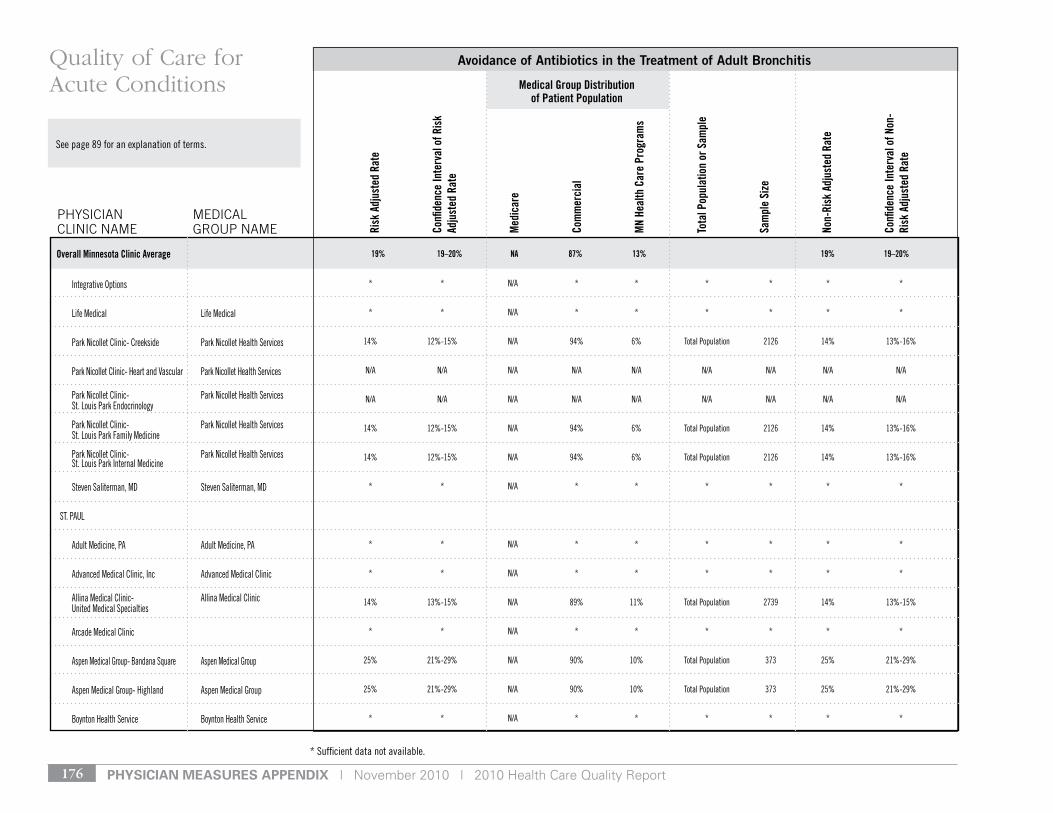
pHysiCian Measures appenDiX | November 2010 | 2010 Health Care Quality Report176
* sufficient data not available.
see page 89 for an explanation of terms.
Risk
Adj
uste
d Ra
te
Confi
denc
e In
terv
al o
f Ris
k Ad
just
ed R
ate
Med
icar
e
Com
mer
cial
MN
Heal
th C
are
Prog
ram
s
Tota
l Pop
ulat
ion
or S
ampl
e
Sam
ple
Size
Non-
Risk
Adj
uste
d Ra
te
Confi
denc
e In
terv
al o
f Non
-Ri
sk A
djus
ted
Rate
Avoidance of Antibiotics in the Treatment of Adult Bronchitis
PHySIcIAN cLINIc NAME
MEdIcAL GrOuP NAME
Quality of Care for Acute Conditions Medical Group Distribution
of Patient Population
Overall Minnesota Clinic Average 19% 19–20% NA 87% 13% 19% 19–20%
Integrative options
life Medical life Medical
Park nicollet Clinic- Creekside Park nicollet Health services
Park nicollet Clinic- Heart and vascular Park nicollet Health services
Park nicollet Clinic- Park nicollet Health services st. louis Park endocrinology
Park nicollet Clinic- Park nicollet Health services st. louis Park Family Medicine
Park nicollet Clinic- Park nicollet Health services st. louis Park Internal Medicine
steven saliterman, Md steven saliterman, Md
st. PAul
Adult Medicine, PA Adult Medicine, PA
Advanced Medical Clinic, Inc Advanced Medical Clinic
Allina Medical Clinic- Allina Medical Clinic united Medical specialties
Arcade Medical Clinic
Aspen Medical group- Bandana square Aspen Medical group
Aspen Medical group- Highland Aspen Medical group
Boynton Health service Boynton Health service
* * n/A * * * * * *
* * n/A * * * * * *
14% 12%-15% n/A 94% 6% total Population 2126 14% 13%-16%
n/A n/A n/A n/A n/A n/A n/A n/A n/A
n/A n/A n/A n/A n/A n/A n/A n/A n/A
14% 12%-15% n/A 94% 6% total Population 2126 14% 13%-16%
14% 12%-15% n/A 94% 6% total Population 2126 14% 13%-16%
* * n/A * * * * * *
* * n/A * * * * * *
* * n/A * * * * * *
14% 13%-15% n/A 89% 11% total Population 2739 14% 13%-15%
* * n/A * * * * * *
25% 21%-29% n/A 90% 10% total Population 373 25% 21%-29%
25% 21%-29% n/A 90% 10% total Population 373 25% 21%-29%
* * n/A * * * * * *
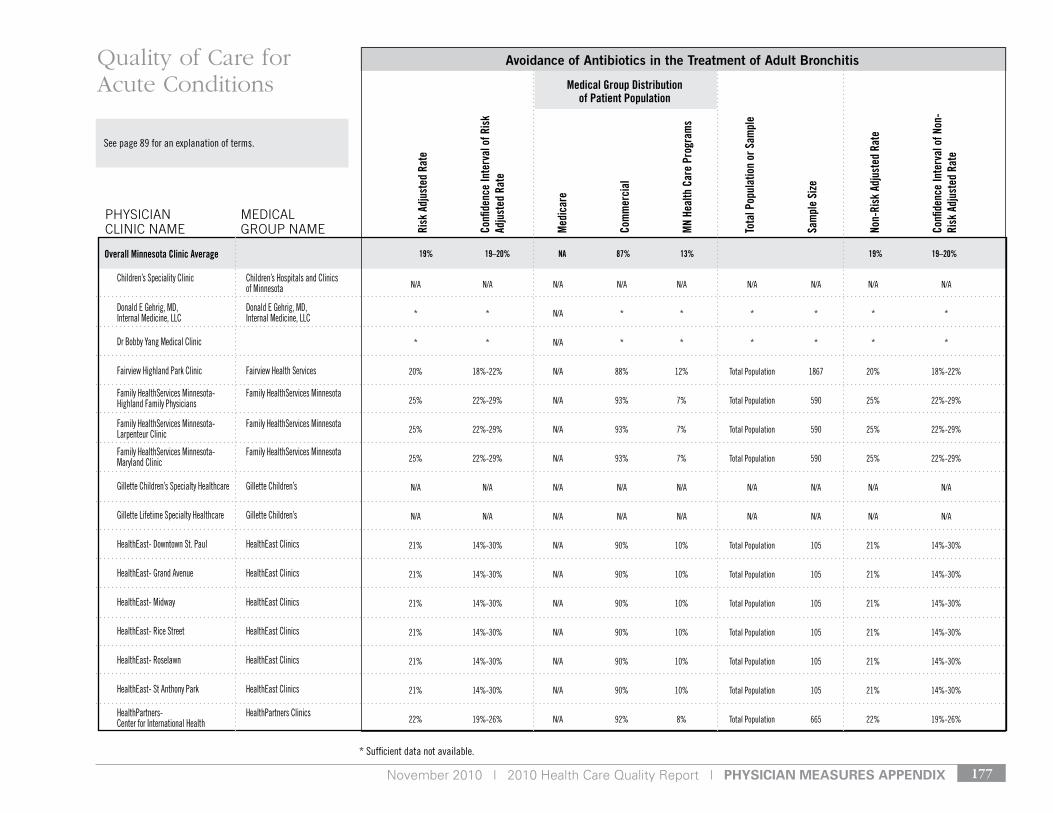
November 2010 | 2010 Health Care Quality Report | pHysiCian Measures appenDiX 177
* sufficient data not available.
see page 89 for an explanation of terms.
Risk
Adj
uste
d Ra
te
Confi
denc
e In
terv
al o
f Ris
k Ad
just
ed R
ate
Med
icar
e
Com
mer
cial
MN
Heal
th C
are
Prog
ram
s
Tota
l Pop
ulat
ion
or S
ampl
e
Sam
ple
Size
Non-
Risk
Adj
uste
d Ra
te
Confi
denc
e In
terv
al o
f Non
-Ri
sk A
djus
ted
Rate
Avoidance of Antibiotics in the Treatment of Adult Bronchitis
PHySIcIAN cLINIc NAME
MEdIcAL GrOuP NAME
Quality of Care for Acute Conditions
19% 19–20% NA 87% 13% 19% 19–20%
Medical Group Distribution of Patient Population
Overall Minnesota Clinic Average
Children’s speciality Clinic Children’s Hospitals and Clinics of Minnesota
donald e gehrig, Md, donald e gehrig, Md, Internal Medicine, llC Internal Medicine, llC
dr Bobby yang Medical Clinic
Fairview Highland Park Clinic Fairview Health services
Family Healthservices Minnesota- Family Healthservices Minnesota Highland Family Physicians
Family Healthservices Minnesota- Family Healthservices Minnesota larpenteur Clinic
Family Healthservices Minnesota- Family Healthservices Minnesota Maryland Clinic
gillette Children’s specialty Healthcare gillette Children’s
gillette lifetime specialty Healthcare gillette Children’s
Healtheast- downtown st. Paul Healtheast Clinics
Healtheast- grand Avenue Healtheast Clinics
Healtheast- Midway Healtheast Clinics
Healtheast- rice street Healtheast Clinics
Healtheast- roselawn Healtheast Clinics
Healtheast- st Anthony Park Healtheast Clinics
HealthPartners- HealthPartners Clinics Center for International Health
n/A n/A n/A n/A n/A n/A n/A n/A n/A
* * n/A * * * * * *
* * n/A * * * * * *
20% 18%-22% n/A 88% 12% total Population 1867 20% 18%-22%
25% 22%-29% n/A 93% 7% total Population 590 25% 22%-29%
25% 22%-29% n/A 93% 7% total Population 590 25% 22%-29%
25% 22%-29% n/A 93% 7% total Population 590 25% 22%-29%
n/A n/A n/A n/A n/A n/A n/A n/A n/A
n/A n/A n/A n/A n/A n/A n/A n/A n/A
21% 14%-30% n/A 90% 10% total Population 105 21% 14%-30%
21% 14%-30% n/A 90% 10% total Population 105 21% 14%-30%
21% 14%-30% n/A 90% 10% total Population 105 21% 14%-30%
21% 14%-30% n/A 90% 10% total Population 105 21% 14%-30%
21% 14%-30% n/A 90% 10% total Population 105 21% 14%-30%
21% 14%-30% n/A 90% 10% total Population 105 21% 14%-30%
22% 19%-26% n/A 92% 8% total Population 665 22% 19%-26%
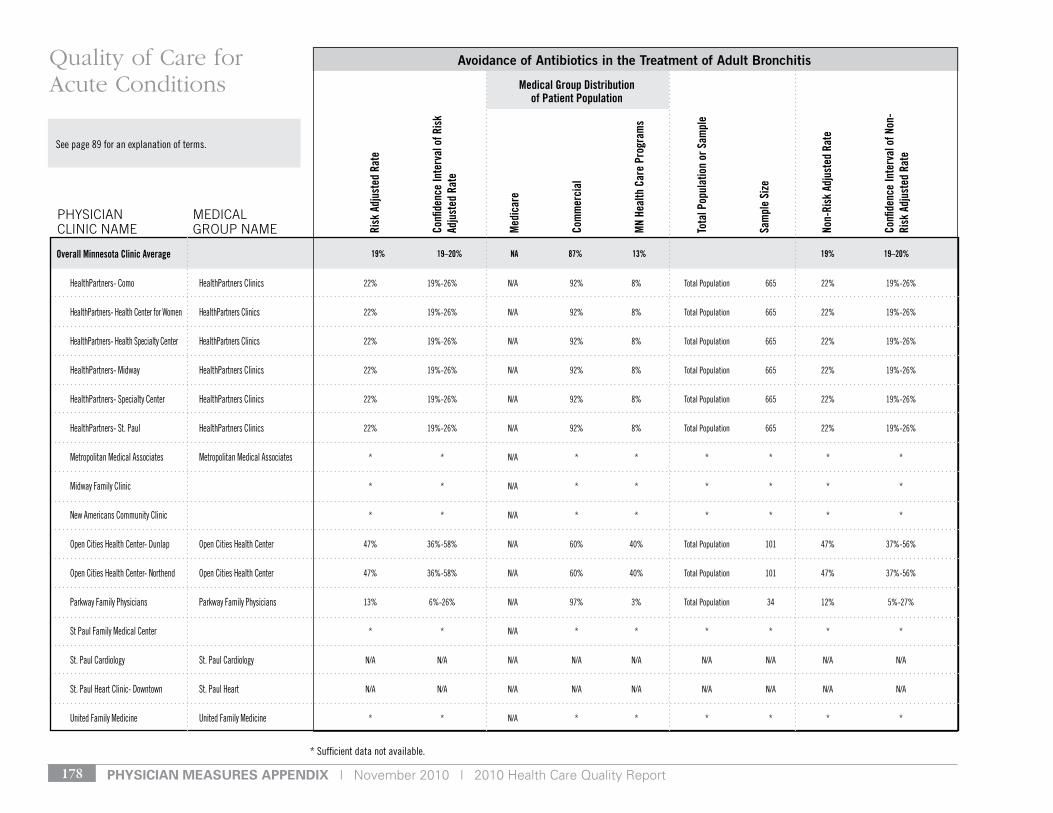
pHysiCian Measures appenDiX | November 2010 | 2010 Health Care Quality Report178
* sufficient data not available.
see page 89 for an explanation of terms.
Risk
Adj
uste
d Ra
te
Confi
denc
e In
terv
al o
f Ris
k Ad
just
ed R
ate
Med
icar
e
Com
mer
cial
MN
Heal
th C
are
Prog
ram
s
Tota
l Pop
ulat
ion
or S
ampl
e
Sam
ple
Size
Non-
Risk
Adj
uste
d Ra
te
Confi
denc
e In
terv
al o
f Non
-Ri
sk A
djus
ted
Rate
Avoidance of Antibiotics in the Treatment of Adult Bronchitis
PHySIcIAN cLINIc NAME
MEdIcAL GrOuP NAME
Quality of Care for Acute Conditions Medical Group Distribution
of Patient Population
Overall Minnesota Clinic Average 19% 19–20% NA 87% 13% 19% 19–20%
HealthPartners- Como HealthPartners Clinics
HealthPartners- Health Center for Women HealthPartners Clinics
HealthPartners- Health specialty Center HealthPartners Clinics
HealthPartners- Midway HealthPartners Clinics
HealthPartners- specialty Center HealthPartners Clinics
HealthPartners- st. Paul HealthPartners Clinics
Metropolitan Medical Associates Metropolitan Medical Associates
Midway Family Clinic
new Americans Community Clinic
open Cities Health Center- dunlap open Cities Health Center
open Cities Health Center- northend open Cities Health Center
Parkway Family Physicians Parkway Family Physicians
st Paul Family Medical Center
st. Paul Cardiology st. Paul Cardiology
st. Paul Heart Clinic- downtown st. Paul Heart
united Family Medicine united Family Medicine
22% 19%-26% n/A 92% 8% total Population 665 22% 19%-26%
22% 19%-26% n/A 92% 8% total Population 665 22% 19%-26%
22% 19%-26% n/A 92% 8% total Population 665 22% 19%-26%
22% 19%-26% n/A 92% 8% total Population 665 22% 19%-26%
22% 19%-26% n/A 92% 8% total Population 665 22% 19%-26%
22% 19%-26% n/A 92% 8% total Population 665 22% 19%-26%
* * n/A * * * * * *
* * n/A * * * * * *
* * n/A * * * * * *
47% 36%-58% n/A 60% 40% total Population 101 47% 37%-56%
47% 36%-58% n/A 60% 40% total Population 101 47% 37%-56%
13% 6%-26% n/A 97% 3% total Population 34 12% 5%-27%
* * n/A * * * * * *
n/A n/A n/A n/A n/A n/A n/A n/A n/A
n/A n/A n/A n/A n/A n/A n/A n/A n/A
* * n/A * * * * * *
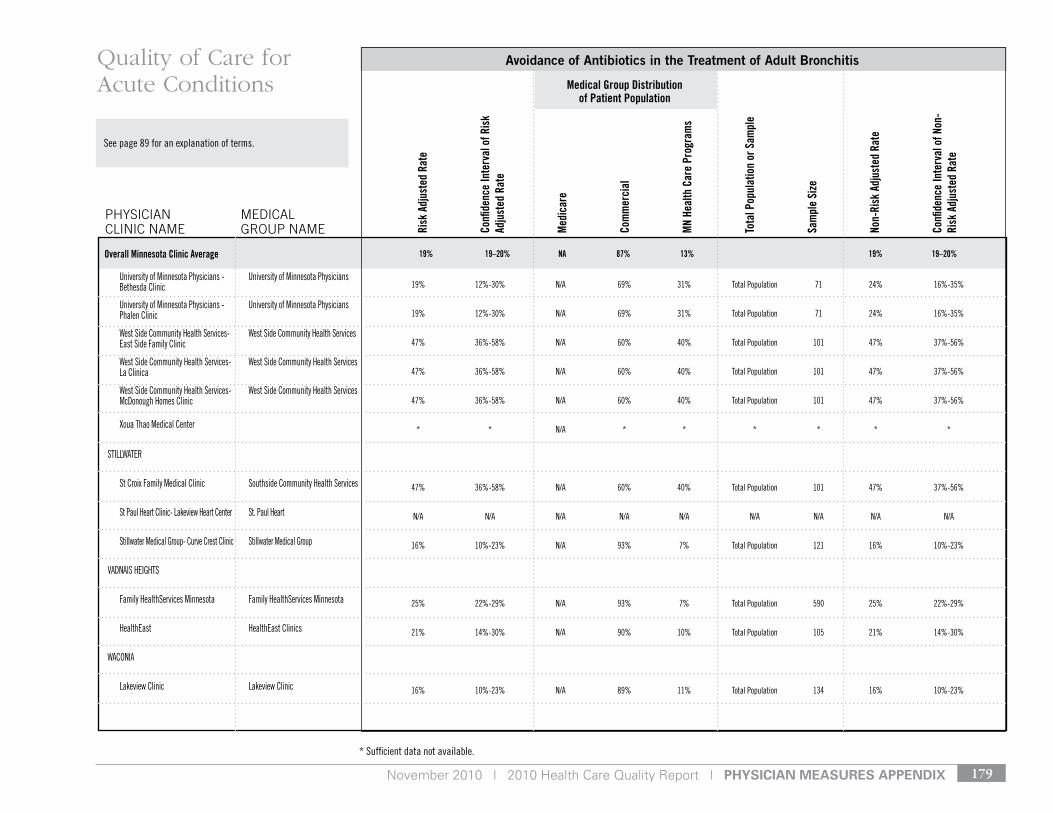
November 2010 | 2010 Health Care Quality Report | pHysiCian Measures appenDiX 179
* sufficient data not available.
see page 89 for an explanation of terms.
Risk
Adj
uste
d Ra
te
Confi
denc
e In
terv
al o
f Ris
k Ad
just
ed R
ate
Med
icar
e
Com
mer
cial
MN
Heal
th C
are
Prog
ram
s
Tota
l Pop
ulat
ion
or S
ampl
e
Sam
ple
Size
Non-
Risk
Adj
uste
d Ra
te
Confi
denc
e In
terv
al o
f Non
-Ri
sk A
djus
ted
Rate
Avoidance of Antibiotics in the Treatment of Adult Bronchitis
PHySIcIAN cLINIc NAME
MEdIcAL GrOuP NAME
Quality of Care for Acute Conditions
19% 19–20% NA 87% 13% 19% 19–20%
Medical Group Distribution of Patient Population
Overall Minnesota Clinic Average
university of Minnesota Physicians - university of Minnesota Physicians Bethesda Clinic
university of Minnesota Physicians - university of Minnesota Physicians Phalen Clinic
West side Community Health services- West side Community Health services east side Family Clinic
West side Community Health services- West side Community Health services la Clinica
West side Community Health services- West side Community Health services Mcdonough Homes Clinic
Xoua thao Medical Center
stIllWAter
st Croix Family Medical Clinic southside Community Health services
st Paul Heart Clinic- lakeview Heart Center st. Paul Heart
stillwater Medical group- Curve Crest Clinic stillwater Medical group
vAdnAIs HeIgHts
Family Healthservices Minnesota Family Healthservices Minnesota
Healtheast Healtheast Clinics
WAConIA
lakeview Clinic lakeview Clinic
19% 12%-30% n/A 69% 31% total Population 71 24% 16%-35%
19% 12%-30% n/A 69% 31% total Population 71 24% 16%-35%
47% 36%-58% n/A 60% 40% total Population 101 47% 37%-56%
47% 36%-58% n/A 60% 40% total Population 101 47% 37%-56%
47% 36%-58% n/A 60% 40% total Population 101 47% 37%-56%
* * n/A * * * * * *
47% 36%-58% n/A 60% 40% total Population 101 47% 37%-56%
n/A n/A n/A n/A n/A n/A n/A n/A n/A
16% 10%-23% n/A 93% 7% total Population 121 16% 10%-23%
25% 22%-29% n/A 93% 7% total Population 590 25% 22%-29%
21% 14%-30% n/A 90% 10% total Population 105 21% 14%-30%
16% 10%-23% n/A 89% 11% total Population 134 16% 10%-23%
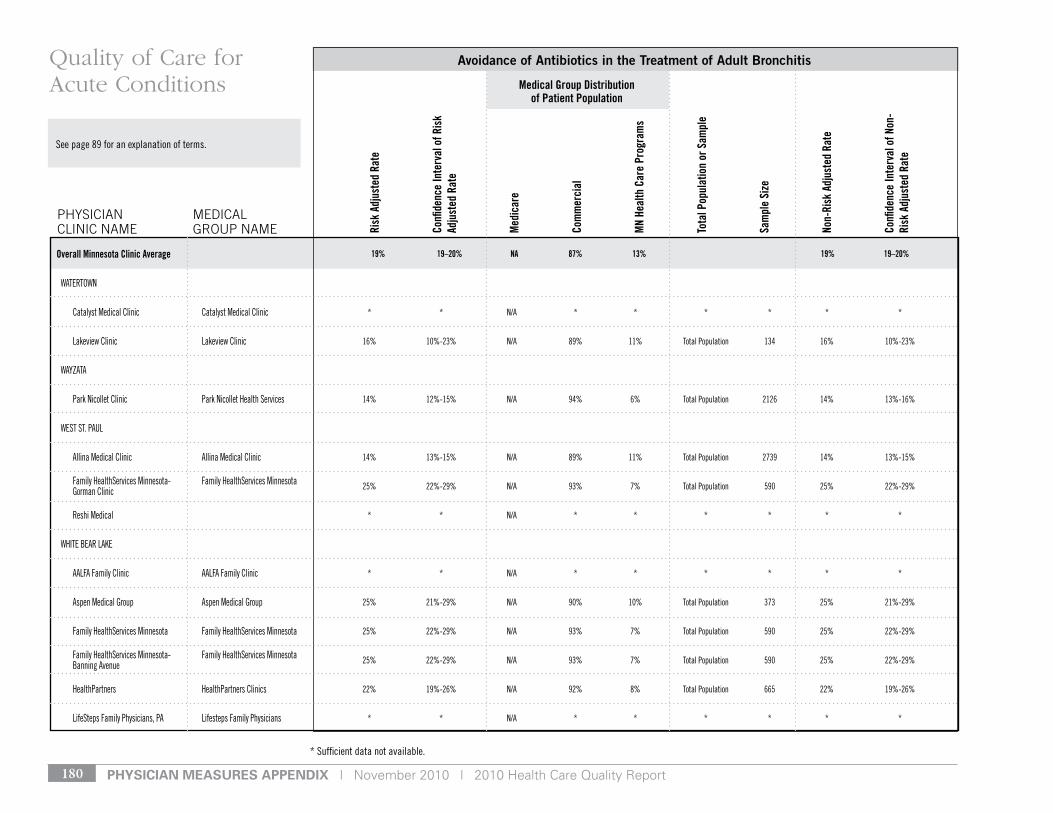
pHysiCian Measures appenDiX | November 2010 | 2010 Health Care Quality Report180
* sufficient data not available.
see page 89 for an explanation of terms.
Risk
Adj
uste
d Ra
te
Confi
denc
e In
terv
al o
f Ris
k Ad
just
ed R
ate
Med
icar
e
Com
mer
cial
MN
Heal
th C
are
Prog
ram
s
Tota
l Pop
ulat
ion
or S
ampl
e
Sam
ple
Size
Non-
Risk
Adj
uste
d Ra
te
Confi
denc
e In
terv
al o
f Non
-Ri
sk A
djus
ted
Rate
Avoidance of Antibiotics in the Treatment of Adult Bronchitis
PHySIcIAN cLINIc NAME
MEdIcAL GrOuP NAME
Quality of Care for Acute Conditions Medical Group Distribution
of Patient Population
Overall Minnesota Clinic Average 19% 19–20% NA 87% 13% 19% 19–20%
WAtertoWn
Catalyst Medical Clinic Catalyst Medical Clinic
lakeview Clinic lakeview Clinic
WAyzAtA
Park nicollet Clinic Park nicollet Health services
West st. PAul
Allina Medical Clinic Allina Medical Clinic
Family Healthservices Minnesota- Family Healthservices Minnesota gorman Clinic
reshi Medical
WHIte BeAr lAke
AAlFA Family Clinic AAlFA Family Clinic
Aspen Medical group Aspen Medical group
Family Healthservices Minnesota Family Healthservices Minnesota
Family Healthservices Minnesota- Family Healthservices Minnesota Banning Avenue
HealthPartners HealthPartners Clinics
lifesteps Family Physicians, PA lifesteps Family Physicians
* * n/A * * * * * *
16% 10%-23% n/A 89% 11% total Population 134 16% 10%-23%
14% 12%-15% n/A 94% 6% total Population 2126 14% 13%-16%
14% 13%-15% n/A 89% 11% total Population 2739 14% 13%-15%
25% 22%-29% n/A 93% 7% total Population 590 25% 22%-29%
* * n/A * * * * * *
* * n/A * * * * * *
25% 21%-29% n/A 90% 10% total Population 373 25% 21%-29%
25% 22%-29% n/A 93% 7% total Population 590 25% 22%-29%
25% 22%-29% n/A 93% 7% total Population 590 25% 22%-29%
22% 19%-26% n/A 92% 8% total Population 665 22% 19%-26%
* * n/A * * * * * *
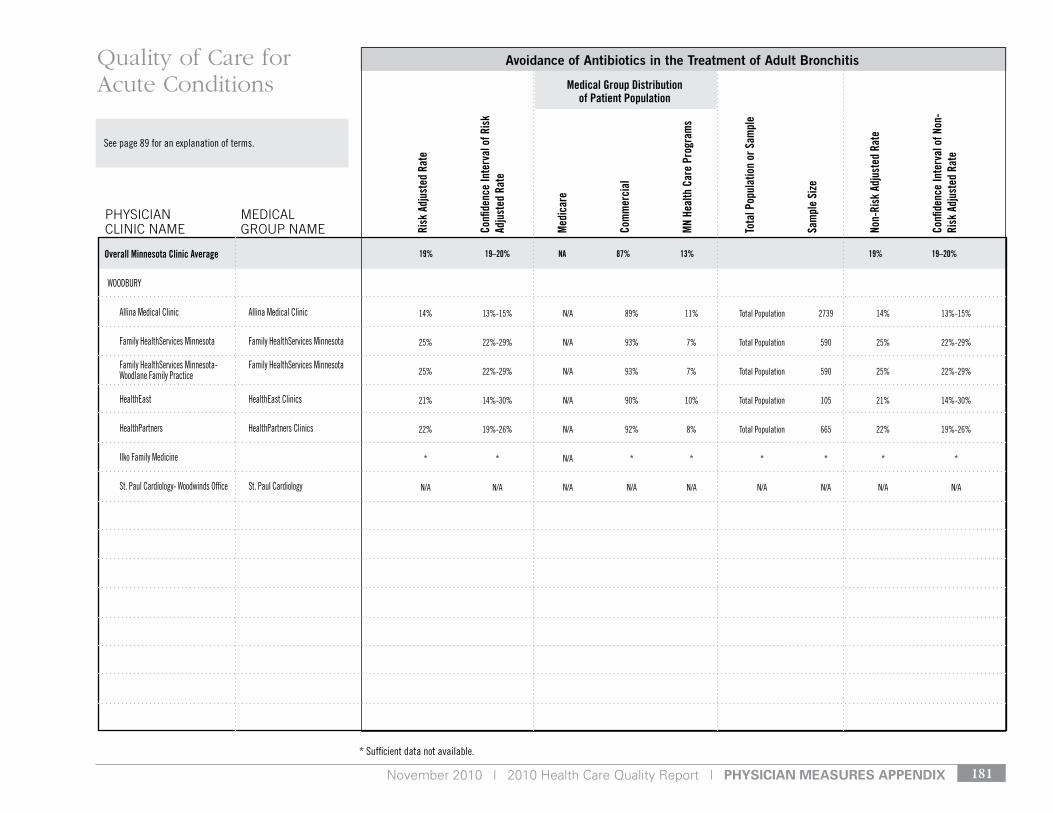
November 2010 | 2010 Health Care Quality Report | pHysiCian Measures appenDiX 181
* sufficient data not available.
see page 89 for an explanation of terms.
Risk
Adj
uste
d Ra
te
Confi
denc
e In
terv
al o
f Ris
k Ad
just
ed R
ate
Med
icar
e
Com
mer
cial
MN
Heal
th C
are
Prog
ram
s
Tota
l Pop
ulat
ion
or S
ampl
e
Sam
ple
Size
Non-
Risk
Adj
uste
d Ra
te
Confi
denc
e In
terv
al o
f Non
-Ri
sk A
djus
ted
Rate
Avoidance of Antibiotics in the Treatment of Adult Bronchitis
PHySIcIAN cLINIc NAME
MEdIcAL GrOuP NAME
Quality of Care for Acute Conditions
19% 19–20% NA 87% 13% 19% 19–20%
Medical Group Distribution of Patient Population
Overall Minnesota Clinic Average
WoodBury
Allina Medical Clinic Allina Medical Clinic
Family Healthservices Minnesota Family Healthservices Minnesota
Family Healthservices Minnesota- Family Healthservices Minnesota Woodlane Family Practice
Healtheast Healtheast Clinics
HealthPartners HealthPartners Clinics
Ilko Family Medicine
st. Paul Cardiology- Woodwinds office st. Paul Cardiology
14% 13%-15% n/A 89% 11% total Population 2739 14% 13%-15%
25% 22%-29% n/A 93% 7% total Population 590 25% 22%-29%
25% 22%-29% n/A 93% 7% total Population 590 25% 22%-29%
21% 14%-30% n/A 90% 10% total Population 105 21% 14%-30%
22% 19%-26% n/A 92% 8% total Population 665 22% 19%-26%
* * n/A * * * * * *
n/A n/A n/A n/A n/A n/A n/A n/A n/A
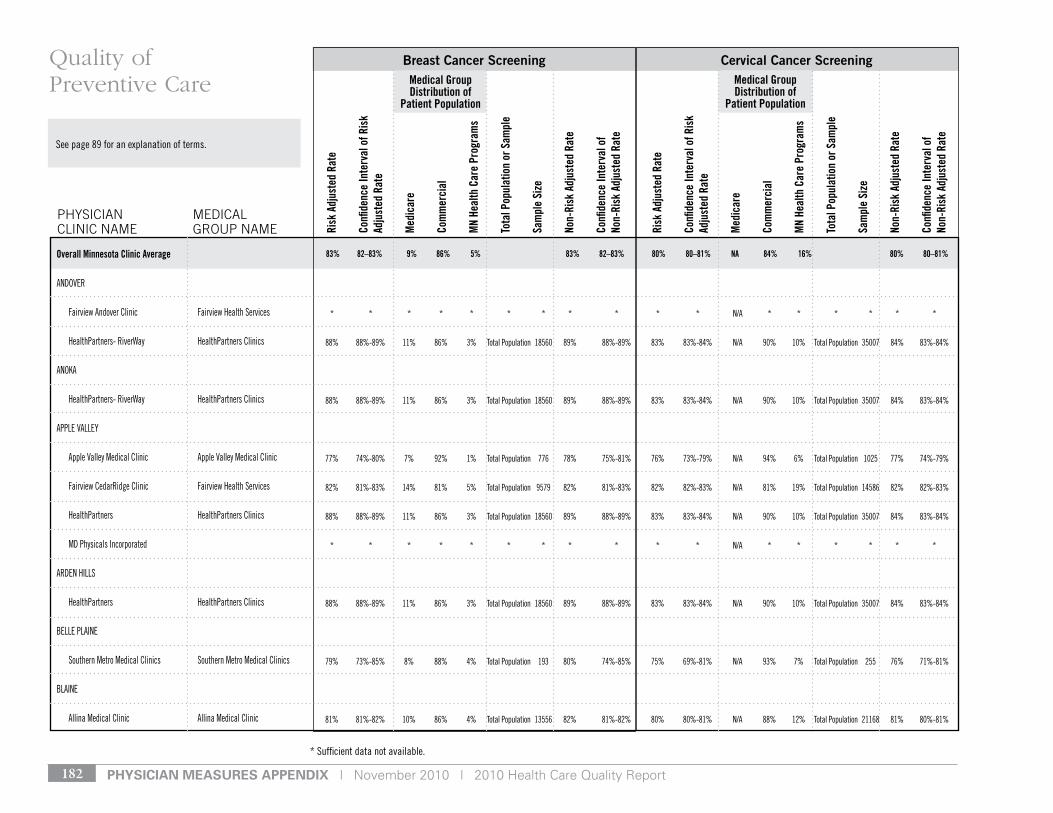
pHysiCian Measures appenDiX | November 2010 | 2010 Health Care Quality Report182
* sufficient data not available.
see page 89 for an explanation of terms.
Medical Group Distribution of
Patient Population
Medical Group Distribution of
Patient Population
Risk
Adj
uste
d Ra
te
Confi
denc
e In
terv
al o
f Ris
k Ad
just
ed R
ate
Med
icar
e
Com
mer
cial
MN
Heal
th C
are
Prog
ram
s
Tota
l Pop
ulat
ion
or S
ampl
e
Sam
ple
Size
Non-
Risk
Adj
uste
d Ra
te
Confi
denc
e In
terv
al o
f No
n-Ri
sk A
djus
ted
Rate
Risk
Adj
uste
d Ra
te
Confi
denc
e In
terv
al o
f Ris
k Ad
just
ed R
ate
Med
icar
e
Com
mer
cial
MN
Heal
th C
are
Prog
ram
s
Tota
l Pop
ulat
ion
or S
ampl
e
Sam
ple
Size
Non-
Risk
Adj
uste
d Ra
te
Confi
denc
e In
terv
al o
f No
n-Ri
sk A
djus
ted
Rate
Breast Cancer Screening Cervical Cancer Screening
PHySIcIAN cLINIc NAME
MEdIcAL GrOuP NAME
Quality of Preventive Care
83% 82–83% 9% 86% 5% 83% 82–83% 80% 80–81% NA 84% 16% 80% 80–81%Overall Minnesota Clinic Average
Andover
Fairview Andover Clinic Fairview Health services
HealthPartners- riverWay HealthPartners Clinics
AnokA
HealthPartners- riverWay HealthPartners Clinics
APPle vAlley
Apple valley Medical Clinic Apple valley Medical Clinic
Fairview Cedarridge Clinic Fairview Health services
HealthPartners HealthPartners Clinics
Md Physicals Incorporated
Arden HIlls
HealthPartners HealthPartners Clinics
Belle PlAIne
southern Metro Medical Clinics southern Metro Medical Clinics
BlAIne
Allina Medical Clinic Allina Medical Clinic
* * * * * * * * * * * n/A * * * * * *
88% 88%-89% 11% 86% 3% total Population 18560 89% 88%-89% 83% 83%-84% n/A 90% 10% total Population 35007 84% 83%-84%
88% 88%-89% 11% 86% 3% total Population 18560 89% 88%-89% 83% 83%-84% n/A 90% 10% total Population 35007 84% 83%-84%
77% 74%-80% 7% 92% 1% total Population 776 78% 75%-81% 76% 73%-79% n/A 94% 6% total Population 1025 77% 74%-79%
82% 81%-83% 14% 81% 5% total Population 9579 82% 81%-83% 82% 82%-83% n/A 81% 19% total Population 14586 82% 82%-83%
88% 88%-89% 11% 86% 3% total Population 18560 89% 88%-89% 83% 83%-84% n/A 90% 10% total Population 35007 84% 83%-84%
* * * * * * * * * * * n/A * * * * * *
88% 88%-89% 11% 86% 3% total Population 18560 89% 88%-89% 83% 83%-84% n/A 90% 10% total Population 35007 84% 83%-84%
79% 73%-85% 8% 88% 4% total Population 193 80% 74%-85% 75% 69%-81% n/A 93% 7% total Population 255 76% 71%-81%
81% 81%-82% 10% 86% 4% total Population 13556 82% 81%-82% 80% 80%-81% n/A 88% 12% total Population 21168 81% 80%-81%
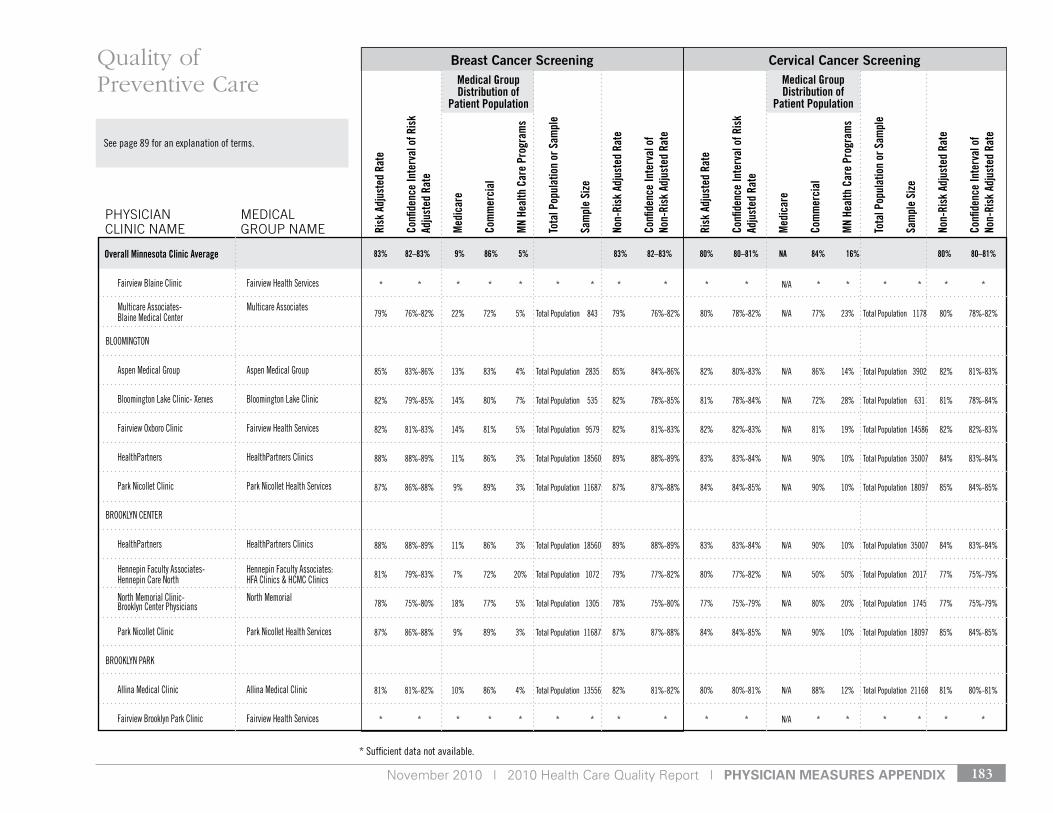
November 2010 | 2010 Health Care Quality Report | pHysiCian Measures appenDiX 183
* sufficient data not available.
see page 89 for an explanation of terms.
Medical Group Distribution of
Patient Population
Medical Group Distribution of
Patient Population
Risk
Adj
uste
d Ra
te
Confi
denc
e In
terv
al o
f Ris
k Ad
just
ed R
ate
Med
icar
e
Com
mer
cial
MN
Heal
th C
are
Prog
ram
s
Tota
l Pop
ulat
ion
or S
ampl
e
Sam
ple
Size
Non-
Risk
Adj
uste
d Ra
te
Confi
denc
e In
terv
al o
f No
n-Ri
sk A
djus
ted
Rate
Risk
Adj
uste
d Ra
te
Confi
denc
e In
terv
al o
f Ris
k Ad
just
ed R
ate
Med
icar
e
Com
mer
cial
MN
Heal
th C
are
Prog
ram
s
Tota
l Pop
ulat
ion
or S
ampl
e
Sam
ple
Size
Non-
Risk
Adj
uste
d Ra
te
Confi
denc
e In
terv
al o
f No
n-Ri
sk A
djus
ted
Rate
Breast Cancer Screening Cervical Cancer Screening
PHySIcIAN cLINIc NAME
MEdIcAL GrOuP NAME
Quality of Preventive Care
83% 82–83% 9% 86% 5% 83% 82–83% 80% 80–81% NA 84% 16% 80% 80–81%Overall Minnesota Clinic Average
Fairview Blaine Clinic Fairview Health services
Multicare Associates- Multicare Associates Blaine Medical Center
BlooMIngton
Aspen Medical group Aspen Medical group
Bloomington lake Clinic- Xerxes Bloomington lake Clinic
Fairview oxboro Clinic Fairview Health services
HealthPartners HealthPartners Clinics
Park nicollet Clinic Park nicollet Health services
Brooklyn Center
HealthPartners HealthPartners Clinics
Hennepin Faculty Associates- Hennepin Faculty Associates: Hennepin Care north HFA Clinics & HCMC Clinics
north Memorial Clinic- north Memorial Brooklyn Center Physicians
Park nicollet Clinic Park nicollet Health services
Brooklyn PArk
Allina Medical Clinic Allina Medical Clinic
Fairview Brooklyn Park Clinic Fairview Health services
* * * * * * * * * * * n/A * * * * * *
79% 76%-82% 22% 72% 5% total Population 843 79% 76%-82% 80% 78%-82% n/A 77% 23% total Population 1178 80% 78%-82%
85% 83%-86% 13% 83% 4% total Population 2835 85% 84%-86% 82% 80%-83% n/A 86% 14% total Population 3902 82% 81%-83%
82% 79%-85% 14% 80% 7% total Population 535 82% 78%-85% 81% 78%-84% n/A 72% 28% total Population 631 81% 78%-84%
82% 81%-83% 14% 81% 5% total Population 9579 82% 81%-83% 82% 82%-83% n/A 81% 19% total Population 14586 82% 82%-83%
88% 88%-89% 11% 86% 3% total Population 18560 89% 88%-89% 83% 83%-84% n/A 90% 10% total Population 35007 84% 83%-84%
87% 86%-88% 9% 89% 3% total Population 11687 87% 87%-88% 84% 84%-85% n/A 90% 10% total Population 18097 85% 84%-85%
88% 88%-89% 11% 86% 3% total Population 18560 89% 88%-89% 83% 83%-84% n/A 90% 10% total Population 35007 84% 83%-84%
81% 79%-83% 7% 72% 20% total Population 1072 79% 77%-82% 80% 77%-82% n/A 50% 50% total Population 2017 77% 75%-79%
78% 75%-80% 18% 77% 5% total Population 1305 78% 75%-80% 77% 75%-79% n/A 80% 20% total Population 1745 77% 75%-79%
87% 86%-88% 9% 89% 3% total Population 11687 87% 87%-88% 84% 84%-85% n/A 90% 10% total Population 18097 85% 84%-85%
81% 81%-82% 10% 86% 4% total Population 13556 82% 81%-82% 80% 80%-81% n/A 88% 12% total Population 21168 81% 80%-81%
* * * * * * * * * * * n/A * * * * * *

pHysiCian Measures appenDiX | November 2010 | 2010 Health Care Quality Report184
* sufficient data not available.
see page 89 for an explanation of terms.
Medical Group Distribution of
Patient Population
Medical Group Distribution of
Patient Population
Risk
Adj
uste
d Ra
te
Confi
denc
e In
terv
al o
f Ris
k Ad
just
ed R
ate
Med
icar
e
Com
mer
cial
MN
Heal
th C
are
Prog
ram
s
Tota
l Pop
ulat
ion
or S
ampl
e
Sam
ple
Size
Non-
Risk
Adj
uste
d Ra
te
Confi
denc
e In
terv
al o
f No
n-Ri
sk A
djus
ted
Rate
Risk
Adj
uste
d Ra
te
Confi
denc
e In
terv
al o
f Ris
k Ad
just
ed R
ate
Med
icar
e
Com
mer
cial
MN
Heal
th C
are
Prog
ram
s
Tota
l Pop
ulat
ion
or S
ampl
e
Sam
ple
Size
Non-
Risk
Adj
uste
d Ra
te
Confi
denc
e In
terv
al o
f No
n-Ri
sk A
djus
ted
Rate
Breast Cancer Screening Cervical Cancer Screening
PHySIcIAN cLINIc NAME
MEdIcAL GrOuP NAME
Quality of Preventive Care
83% 82–83% 9% 86% 5% 83% 82–83% 80% 80–81% NA 84% 16% 80% 80–81%Overall Minnesota Clinic Average
north Memorial Clinic- north Memorial Brooklyn Park Physicians
BurnsvIlle
Burnsville Family Physicians Burnsville Family Physicians
Fairview ridges Clinic Fairview Health services
Park nicollet Clinic Park nicollet Health services
Quello Clinic Quello Clinic
uMP Mn Heart Burnsville Clinic university of Minnesota Physicians
CHAMPlIn
Allina Medical Clinic Allina Medical Clinic
team Health Care Clinic
CHAnHAssen
Park nicollet Clinic Park nicollet Health services
Quello Clinic Quello Clinic
ridgeview Chanhassen Clinic ridgeview Clinics
CHAskA
Allina Medical Clinic- Allina Medical Clinic Crossroads Chaska
78% 75%-80% 18% 77% 5% total Population 1305 78% 75%-80% 77% 75%-79% n/A 80% 20% total Population 1745 77% 75%-79%
85% 81%-88% 8% 92% 1% total Population 382 86% 82%-89% 87% 82%-91% n/A 97% 3% total Population 420 89% 85%-91%
82% 81%-83% 14% 81% 5% total Population 9579 82% 81%-83% 82% 82%-83% n/A 81% 19% total Population 14586 82% 82%-83%
87% 86%-88% 9% 89% 3% total Population 11687 87% 87%-88% 84% 84%-85% n/A 90% 10% total Population 18097 85% 84%-85%
83% 80%-85% 11% 86% 3% total Population 1043 83% 81%-85% 83% 81%-85% n/A 89% 11% total Population 1510 84% 82%-85%
n/A n/A n/A n/A n/A n/A n/A n/A n/A n/A n/A n/A n/A n/A n/A n/A n/A n/A
81% 81%-82% 10% 86% 4% total Population 13556 82% 81%-82% 80% 80%-81% n/A 88% 12% total Population 21168 81% 80%-81%
* * * * * * * * * * * n/A * * * * * *
87% 86%-88% 9% 89% 3% total Population 11687 87% 87%-88% 84% 84%-85% n/A 90% 10% total Population 18097 85% 84%-85%
83% 80%-85% 11% 86% 3% total Population 1043 83% 81%-85% 83% 81%-85% n/A 89% 11% total Population 1510 84% 82%-85%
75% 72%-78% 8% 88% 4% total Population 809 75% 72%-78% 76% 73%-78% n/A 89% 11% total Population 1157 76% 74%-79%
* * * * * * * * * * * n/A * * * * * *
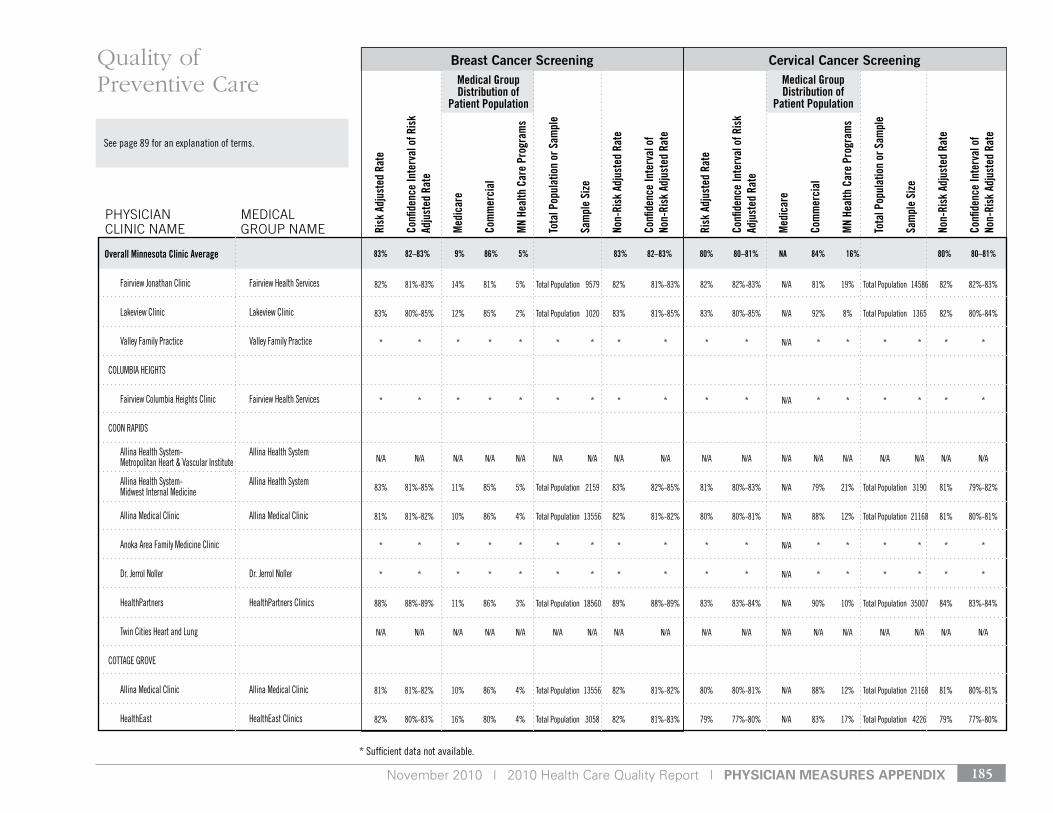
November 2010 | 2010 Health Care Quality Report | pHysiCian Measures appenDiX 185
* sufficient data not available.
see page 89 for an explanation of terms.
Medical Group Distribution of
Patient Population
Medical Group Distribution of
Patient Population
Risk
Adj
uste
d Ra
te
Confi
denc
e In
terv
al o
f Ris
k Ad
just
ed R
ate
Med
icar
e
Com
mer
cial
MN
Heal
th C
are
Prog
ram
s
Tota
l Pop
ulat
ion
or S
ampl
e
Sam
ple
Size
Non-
Risk
Adj
uste
d Ra
te
Confi
denc
e In
terv
al o
f No
n-Ri
sk A
djus
ted
Rate
Risk
Adj
uste
d Ra
te
Confi
denc
e In
terv
al o
f Ris
k Ad
just
ed R
ate
Med
icar
e
Com
mer
cial
MN
Heal
th C
are
Prog
ram
s
Tota
l Pop
ulat
ion
or S
ampl
e
Sam
ple
Size
Non-
Risk
Adj
uste
d Ra
te
Confi
denc
e In
terv
al o
f No
n-Ri
sk A
djus
ted
Rate
Breast Cancer Screening Cervical Cancer Screening
PHySIcIAN cLINIc NAME
MEdIcAL GrOuP NAME
Quality of Preventive Care
83% 82–83% 9% 86% 5% 83% 82–83% 80% 80–81% NA 84% 16% 80% 80–81%Overall Minnesota Clinic Average
Fairview Jonathan Clinic Fairview Health services
lakeview Clinic lakeview Clinic
valley Family Practice valley Family Practice
ColuMBIA HeIgHts
Fairview Columbia Heights Clinic Fairview Health services
Coon rAPIds
Allina Health system- Allina Health system Metropolitan Heart & vascular Institute
Allina Health system- Allina Health system Midwest Internal Medicine
Allina Medical Clinic Allina Medical Clinic
Anoka Area Family Medicine Clinic
dr. Jerrol noller dr. Jerrol noller
HealthPartners HealthPartners Clinics
twin Cities Heart and lung
CottAge grove
Allina Medical Clinic Allina Medical Clinic
Healtheast Healtheast Clinics
82% 81%-83% 14% 81% 5% total Population 9579 82% 81%-83% 82% 82%-83% n/A 81% 19% total Population 14586 82% 82%-83%
83% 80%-85% 12% 85% 2% total Population 1020 83% 81%-85% 83% 80%-85% n/A 92% 8% total Population 1365 82% 80%-84%
* * * * * * * * * * * n/A * * * * * *
* * * * * * * * * * * n/A * * * * * *
n/A n/A n/A n/A n/A n/A n/A n/A n/A n/A n/A n/A n/A n/A n/A n/A n/A n/A
83% 81%-85% 11% 85% 5% total Population 2159 83% 82%-85% 81% 80%-83% n/A 79% 21% total Population 3190 81% 79%-82%
81% 81%-82% 10% 86% 4% total Population 13556 82% 81%-82% 80% 80%-81% n/A 88% 12% total Population 21168 81% 80%-81%
* * * * * * * * * * * n/A * * * * * *
* * * * * * * * * * * n/A * * * * * *
88% 88%-89% 11% 86% 3% total Population 18560 89% 88%-89% 83% 83%-84% n/A 90% 10% total Population 35007 84% 83%-84%
n/A n/A n/A n/A n/A n/A n/A n/A n/A n/A n/A n/A n/A n/A n/A n/A n/A n/A
81% 81%-82% 10% 86% 4% total Population 13556 82% 81%-82% 80% 80%-81% n/A 88% 12% total Population 21168 81% 80%-81%
82% 80%-83% 16% 80% 4% total Population 3058 82% 81%-83% 79% 77%-80% n/A 83% 17% total Population 4226 79% 77%-80%
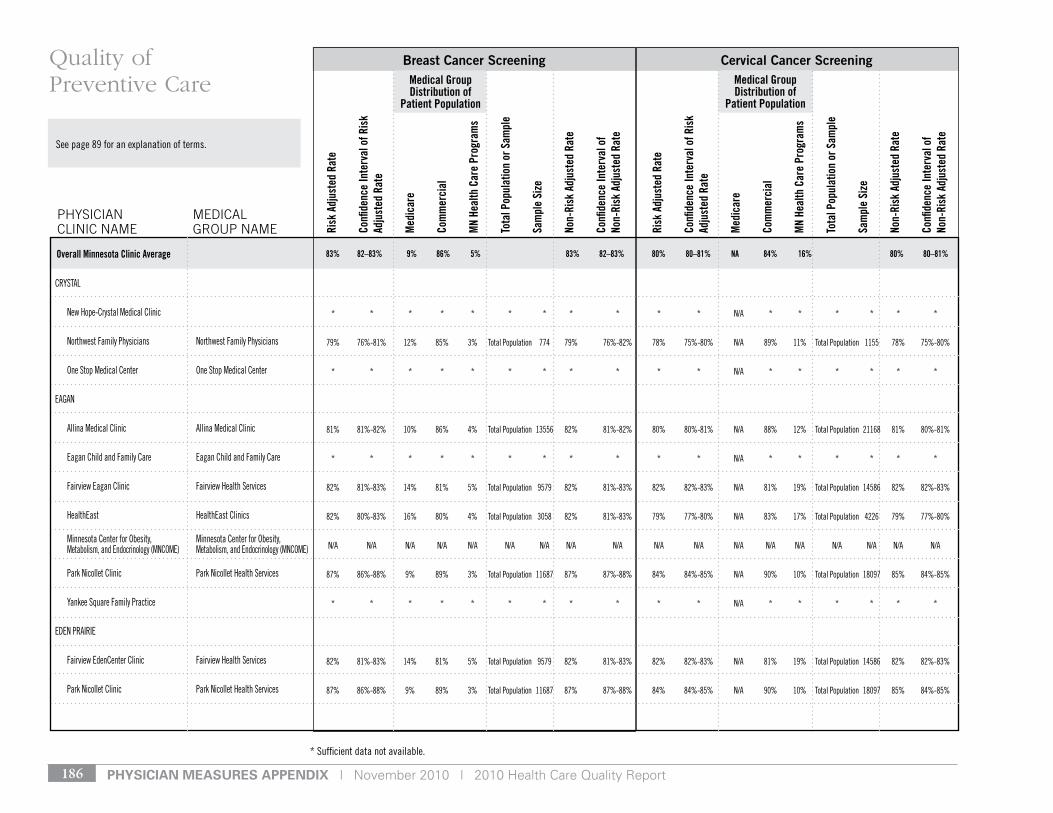
pHysiCian Measures appenDiX | November 2010 | 2010 Health Care Quality Report186
* sufficient data not available.
see page 89 for an explanation of terms.
Medical Group Distribution of
Patient Population
Medical Group Distribution of
Patient Population
Risk
Adj
uste
d Ra
te
Confi
denc
e In
terv
al o
f Ris
k Ad
just
ed R
ate
Med
icar
e
Com
mer
cial
MN
Heal
th C
are
Prog
ram
s
Tota
l Pop
ulat
ion
or S
ampl
e
Sam
ple
Size
Non-
Risk
Adj
uste
d Ra
te
Confi
denc
e In
terv
al o
f No
n-Ri
sk A
djus
ted
Rate
Risk
Adj
uste
d Ra
te
Confi
denc
e In
terv
al o
f Ris
k Ad
just
ed R
ate
Med
icar
e
Com
mer
cial
MN
Heal
th C
are
Prog
ram
s
Tota
l Pop
ulat
ion
or S
ampl
e
Sam
ple
Size
Non-
Risk
Adj
uste
d Ra
te
Confi
denc
e In
terv
al o
f No
n-Ri
sk A
djus
ted
Rate
Breast Cancer Screening Cervical Cancer Screening
PHySIcIAN cLINIc NAME
MEdIcAL GrOuP NAME
Quality of Preventive Care
83% 82–83% 9% 86% 5% 83% 82–83% 80% 80–81% NA 84% 16% 80% 80–81%Overall Minnesota Clinic Average
CrystAl
new Hope-Crystal Medical Clinic
northwest Family Physicians northwest Family Physicians
one stop Medical Center one stop Medical Center
eAgAn
Allina Medical Clinic Allina Medical Clinic
eagan Child and Family Care eagan Child and Family Care
Fairview eagan Clinic Fairview Health services
Healtheast Healtheast Clinics
Minnesota Center for obesity, Minnesota Center for obesity, Metabolism, and endocrinology (MnCoMe) Metabolism, and endocrinology (MnCoMe)
Park nicollet Clinic Park nicollet Health services
yankee square Family Practice
eden PrAIrIe
Fairview edenCenter Clinic Fairview Health services
Park nicollet Clinic Park nicollet Health services
* * * * * * * * * * * n/A * * * * * *
79% 76%-81% 12% 85% 3% total Population 774 79% 76%-82% 78% 75%-80% n/A 89% 11% total Population 1155 78% 75%-80%
* * * * * * * * * * * n/A * * * * * *
81% 81%-82% 10% 86% 4% total Population 13556 82% 81%-82% 80% 80%-81% n/A 88% 12% total Population 21168 81% 80%-81%
* * * * * * * * * * * n/A * * * * * *
82% 81%-83% 14% 81% 5% total Population 9579 82% 81%-83% 82% 82%-83% n/A 81% 19% total Population 14586 82% 82%-83%
82% 80%-83% 16% 80% 4% total Population 3058 82% 81%-83% 79% 77%-80% n/A 83% 17% total Population 4226 79% 77%-80%
n/A n/A n/A n/A n/A n/A n/A n/A n/A n/A n/A n/A n/A n/A n/A n/A n/A n/A
87% 86%-88% 9% 89% 3% total Population 11687 87% 87%-88% 84% 84%-85% n/A 90% 10% total Population 18097 85% 84%-85%
* * * * * * * * * * * n/A * * * * * *
82% 81%-83% 14% 81% 5% total Population 9579 82% 81%-83% 82% 82%-83% n/A 81% 19% total Population 14586 82% 82%-83%
87% 86%-88% 9% 89% 3% total Population 11687 87% 87%-88% 84% 84%-85% n/A 90% 10% total Population 18097 85% 84%-85%

November 2010 | 2010 Health Care Quality Report | pHysiCian Measures appenDiX 187
* sufficient data not available.
see page 89 for an explanation of terms.
Medical Group Distribution of
Patient Population
Medical Group Distribution of
Patient Population
Risk
Adj
uste
d Ra
te
Confi
denc
e In
terv
al o
f Ris
k Ad
just
ed R
ate
Med
icar
e
Com
mer
cial
MN
Heal
th C
are
Prog
ram
s
Tota
l Pop
ulat
ion
or S
ampl
e
Sam
ple
Size
Non-
Risk
Adj
uste
d Ra
te
Confi
denc
e In
terv
al o
f No
n-Ri
sk A
djus
ted
Rate
Risk
Adj
uste
d Ra
te
Confi
denc
e In
terv
al o
f Ris
k Ad
just
ed R
ate
Med
icar
e
Com
mer
cial
MN
Heal
th C
are
Prog
ram
s
Tota
l Pop
ulat
ion
or S
ampl
e
Sam
ple
Size
Non-
Risk
Adj
uste
d Ra
te
Confi
denc
e In
terv
al o
f No
n-Ri
sk A
djus
ted
Rate
Breast Cancer Screening Cervical Cancer Screening
PHySIcIAN cLINIc NAME
MEdIcAL GrOuP NAME
Quality of Preventive Care
83% 82–83% 9% 86% 5% 83% 82–83% 80% 80–81% NA 84% 16% 80% 80–81%Overall Minnesota Clinic Average
edInA
Allina Health system- Abbott Allina Health system northwestern general Medicine Associates
Allina Medical Clinic Allina Medical Clinic
Consultants Internal Medicine Consultants Internal Medicine
edina Family Physicians edina Family Physicians
edina sports Health & Wellness edina sports Health & Wellness
endocrinology Clinic of Minneapolis endocrinology Clinic of Mpls.
Fairview Crosstown Clinic Fairview Health services
France Avenue Family Physicians France Avenue Family Physicians
one stop Medical Center one stop Medical Center
Quello Clinic Quello Clinic
sharpe dillon Cockson & Associates PA sharpe, dillon, Cockson & Associates
southdale Internal Medicine, PA southdale Internal Medicine, P.A.
the schuster Clinic the schuster Clinic
uMP Mn Heart edina Clinic university of Minnesota Physicians
83% 81%-85% 11% 85% 5% total Population 2159 83% 82%-85% 81% 80%-83% n/A 79% 21% total Population 3190 81% 79%-82%
81% 81%-82% 10% 86% 4% total Population 13556 82% 81%-82% 80% 80%-81% n/A 88% 12% total Population 21168 81% 80%-81%
80% 75%-85% 11% 84% 5% total Population 275 80% 75%-85% 78% 72%-84% n/A 94% 6% total Population 231 78% 73%-83%
89% 86%-91% 11% 88% 1% total Population 812 89% 87%-91% 89% 87%-92% n/A 96% 4% total Population 936 90% 88%-92%
82% 77%-86% 6% 94% 1% total Population 298 83% 78%-86% 85% 81%-89% n/A 97% 3% total Population 396 84% 80%-87%
n/A n/A n/A n/A n/A n/A n/A n/A n/A n/A n/A n/A n/A n/A n/A n/A n/A n/A
82% 81%-83% 14% 81% 5% total Population 9579 82% 81%-83% 82% 82%-83% n/A 81% 19% total Population 14586 82% 82%-83%
73% 67%-78% 12% 87% 1% total Population 257 74% 68%-79% 81% 76%-85% n/A 94% 6% total Population 350 84% 79%-87%
* * * * * * * * * * * n/A * * * * * *
83% 80%-85% 11% 86% 3% total Population 1043 83% 81%-85% 83% 81%-85% n/A 89% 11% total Population 1510 84% 82%-85%
* * * * * * * * * * * n/A * * * * * *
87% 81%-90% 16% 83% 1% total Population 189 87% 82%-91% 77% 69%-83% n/A 98% 2% total Population 175 78% 71%-83%
n/A n/A n/A n/A n/A n/A n/A n/A n/A n/A n/A n/A n/A n/A n/A n/A n/A n/A
n/A n/A n/A n/A n/A n/A n/A n/A n/A n/A n/A n/A n/A n/A n/A n/A n/A n/A

pHysiCian Measures appenDiX | November 2010 | 2010 Health Care Quality Report188
* sufficient data not available.
see page 89 for an explanation of terms.
Medical Group Distribution of
Patient Population
Medical Group Distribution of
Patient Population
Risk
Adj
uste
d Ra
te
Confi
denc
e In
terv
al o
f Ris
k Ad
just
ed R
ate
Med
icar
e
Com
mer
cial
MN
Heal
th C
are
Prog
ram
s
Tota
l Pop
ulat
ion
or S
ampl
e
Sam
ple
Size
Non-
Risk
Adj
uste
d Ra
te
Confi
denc
e In
terv
al o
f No
n-Ri
sk A
djus
ted
Rate
Risk
Adj
uste
d Ra
te
Confi
denc
e In
terv
al o
f Ris
k Ad
just
ed R
ate
Med
icar
e
Com
mer
cial
MN
Heal
th C
are
Prog
ram
s
Tota
l Pop
ulat
ion
or S
ampl
e
Sam
ple
Size
Non-
Risk
Adj
uste
d Ra
te
Confi
denc
e In
terv
al o
f No
n-Ri
sk A
djus
ted
Rate
Breast Cancer Screening Cervical Cancer Screening
PHySIcIAN cLINIc NAME
MEdIcAL GrOuP NAME
Quality of Preventive Care
83% 82–83% 9% 86% 5% 83% 82–83% 80% 80–81% NA 84% 16% 80% 80–81%Overall Minnesota Clinic Average
eXCelsIor
ridgeview excelsior Clinic ridgeview Clinics
FArMIngton
Allina Medical Clinic Allina Medical Clinic
Fairview Farmington Clinic Fairview Health services
FamilyHealth Medical Clinic FamilyHealth Medical Clinics
Farmington Clinic Farmington Clinic
Forest lAke
Allina Medical Clinic Allina Medical Clinic
FrIdley
Fairview Fridley Clinic Fairview Health services
Multicare Associates- Multicare Associates Fridley Medical Center
golden vAlley
north Memorial Clinic- north Memorial golden valley Physicians
Park nicollet Clinic Park nicollet Health services
75% 72%-78% 8% 88% 4% total Population 809 75% 72%-78% 76% 73%-78% n/A 89% 11% total Population 1157 76% 74%-79%
81% 81%-82% 10% 86% 4% total Population 13556 82% 81%-82% 80% 80%-81% n/A 88% 12% total Population 21168 81% 80%-81%
82% 81%-83% 14% 81% 5% total Population 9579 82% 81%-83% 82% 82%-83% n/A 81% 19% total Population 14586 82% 82%-83%
82% 75%-87% 8% 89% 3% total Population 146 82% 75%-88% 75% 69%-80% n/A 92% 8% total Population 247 76% 70%-81%
* * * * * * * * * * * n/A * * * * * *
81% 81%-82% 10% 86% 4% total Population 13556 82% 81%-82% 80% 80%-81% n/A 88% 12% total Population 21168 81% 80%-81%
* * * * * * * * * * * n/A * * * * * *
79% 76%-82% 22% 72% 5% total Population 843 79% 76%-82% 80% 78%-82% n/A 77% 23% total Population 1178 80% 78%-82%
78% 75%-80% 18% 77% 5% total Population 1305 78% 75%-80% 77% 75%-79% n/A 80% 20% total Population 1745 77% 75%-79%
87% 86%-88% 9% 89% 3% total Population 11687 87% 87%-88% 84% 84%-85% n/A 90% 10% total Population 18097 85% 84%-85%
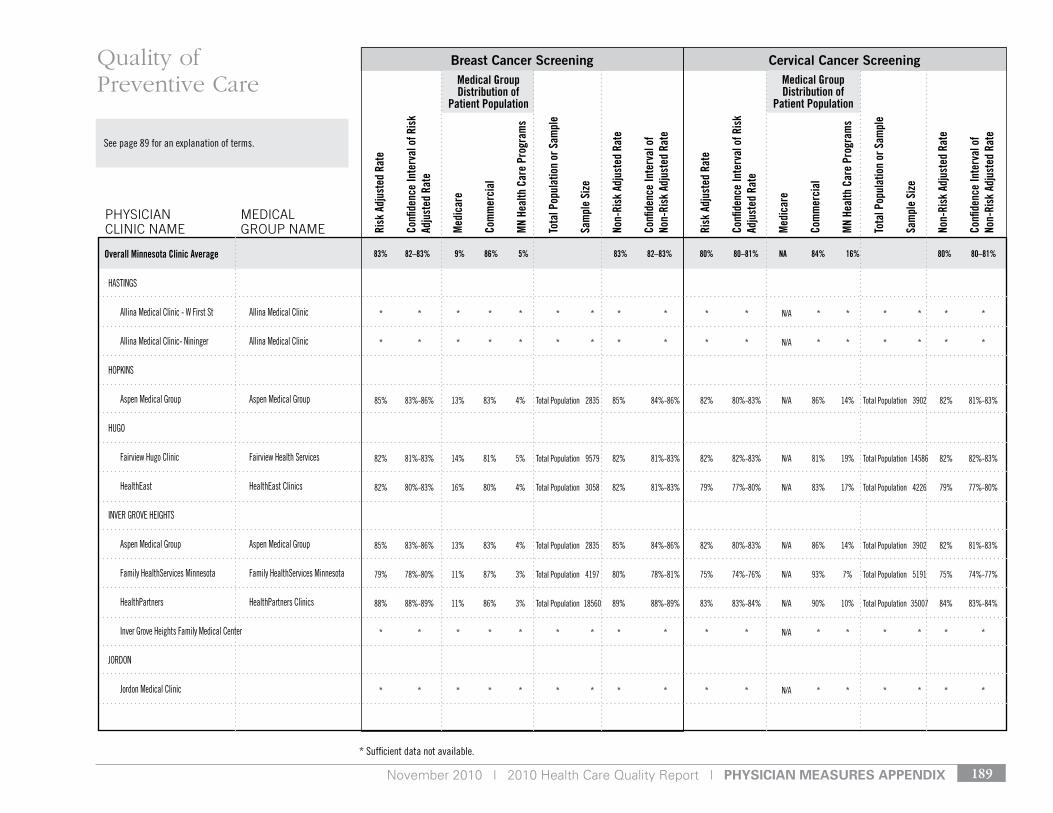
November 2010 | 2010 Health Care Quality Report | pHysiCian Measures appenDiX 189
* sufficient data not available.
see page 89 for an explanation of terms.
Medical Group Distribution of
Patient Population
Medical Group Distribution of
Patient Population
Risk
Adj
uste
d Ra
te
Confi
denc
e In
terv
al o
f Ris
k Ad
just
ed R
ate
Med
icar
e
Com
mer
cial
MN
Heal
th C
are
Prog
ram
s
Tota
l Pop
ulat
ion
or S
ampl
e
Sam
ple
Size
Non-
Risk
Adj
uste
d Ra
te
Confi
denc
e In
terv
al o
f No
n-Ri
sk A
djus
ted
Rate
Risk
Adj
uste
d Ra
te
Confi
denc
e In
terv
al o
f Ris
k Ad
just
ed R
ate
Med
icar
e
Com
mer
cial
MN
Heal
th C
are
Prog
ram
s
Tota
l Pop
ulat
ion
or S
ampl
e
Sam
ple
Size
Non-
Risk
Adj
uste
d Ra
te
Confi
denc
e In
terv
al o
f No
n-Ri
sk A
djus
ted
Rate
Breast Cancer Screening Cervical Cancer Screening
PHySIcIAN cLINIc NAME
MEdIcAL GrOuP NAME
Quality of Preventive Care
83% 82–83% 9% 86% 5% 83% 82–83% 80% 80–81% NA 84% 16% 80% 80–81%Overall Minnesota Clinic Average
HAstIngs
Allina Medical Clinic - W First st Allina Medical Clinic
Allina Medical Clinic- nininger Allina Medical Clinic
HoPkIns
Aspen Medical group Aspen Medical group
Hugo
Fairview Hugo Clinic Fairview Health services
Healtheast Healtheast Clinics
Inver grove HeIgHts
Aspen Medical group Aspen Medical group
Family Healthservices Minnesota Family Healthservices Minnesota
HealthPartners HealthPartners Clinics
Inver grove Heights Family Medical Center
Jordon
Jordon Medical Clinic
* * * * * * * * * * * n/A * * * * * *
* * * * * * * * * * * n/A * * * * * *
85% 83%-86% 13% 83% 4% total Population 2835 85% 84%-86% 82% 80%-83% n/A 86% 14% total Population 3902 82% 81%-83%
82% 81%-83% 14% 81% 5% total Population 9579 82% 81%-83% 82% 82%-83% n/A 81% 19% total Population 14586 82% 82%-83%
82% 80%-83% 16% 80% 4% total Population 3058 82% 81%-83% 79% 77%-80% n/A 83% 17% total Population 4226 79% 77%-80%
85% 83%-86% 13% 83% 4% total Population 2835 85% 84%-86% 82% 80%-83% n/A 86% 14% total Population 3902 82% 81%-83%
79% 78%-80% 11% 87% 3% total Population 4197 80% 78%-81% 75% 74%-76% n/A 93% 7% total Population 5191 75% 74%-77%
88% 88%-89% 11% 86% 3% total Population 18560 89% 88%-89% 83% 83%-84% n/A 90% 10% total Population 35007 84% 83%-84%
* * * * * * * * * * * n/A * * * * * *
* * * * * * * * * * * n/A * * * * * *
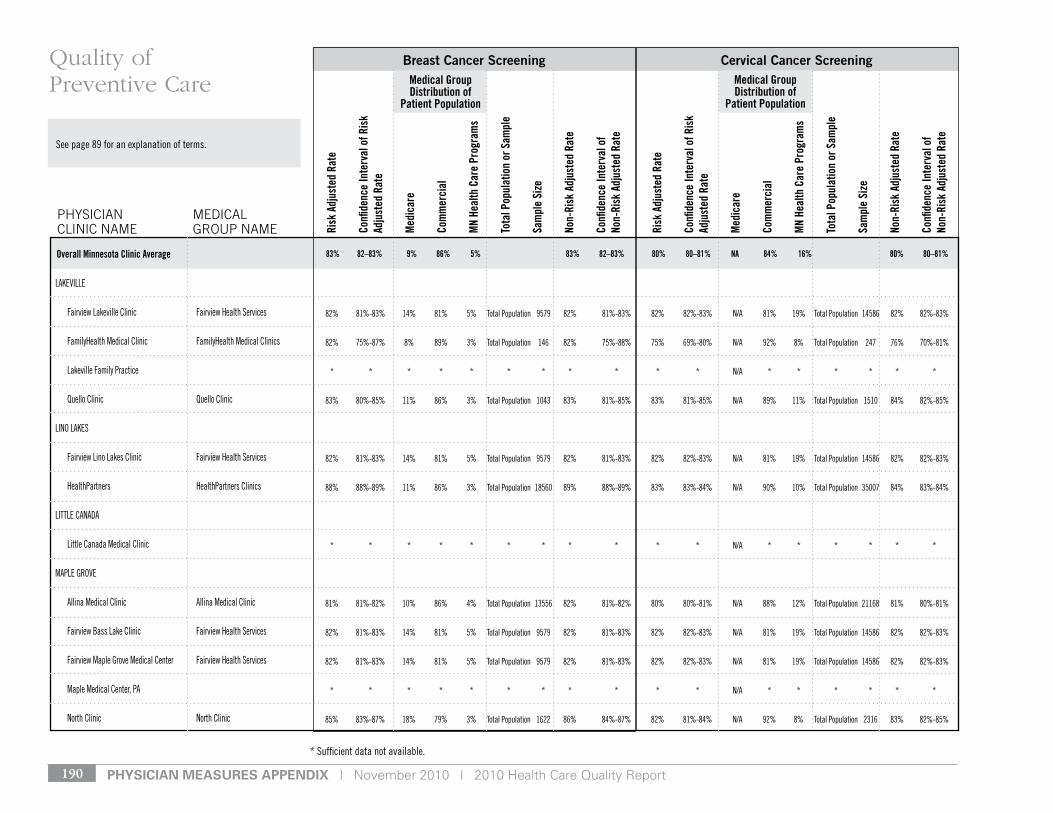
pHysiCian Measures appenDiX | November 2010 | 2010 Health Care Quality Report190
* sufficient data not available.
see page 89 for an explanation of terms.
Medical Group Distribution of
Patient Population
Medical Group Distribution of
Patient Population
Risk
Adj
uste
d Ra
te
Confi
denc
e In
terv
al o
f Ris
k Ad
just
ed R
ate
Med
icar
e
Com
mer
cial
MN
Heal
th C
are
Prog
ram
s
Tota
l Pop
ulat
ion
or S
ampl
e
Sam
ple
Size
Non-
Risk
Adj
uste
d Ra
te
Confi
denc
e In
terv
al o
f No
n-Ri
sk A
djus
ted
Rate
Risk
Adj
uste
d Ra
te
Confi
denc
e In
terv
al o
f Ris
k Ad
just
ed R
ate
Med
icar
e
Com
mer
cial
MN
Heal
th C
are
Prog
ram
s
Tota
l Pop
ulat
ion
or S
ampl
e
Sam
ple
Size
Non-
Risk
Adj
uste
d Ra
te
Confi
denc
e In
terv
al o
f No
n-Ri
sk A
djus
ted
Rate
Breast Cancer Screening Cervical Cancer Screening
PHySIcIAN cLINIc NAME
MEdIcAL GrOuP NAME
Quality of Preventive Care
83% 82–83% 9% 86% 5% 83% 82–83% 80% 80–81% NA 84% 16% 80% 80–81%Overall Minnesota Clinic Average
lAkevIlle
Fairview lakeville Clinic Fairview Health services
FamilyHealth Medical Clinic FamilyHealth Medical Clinics
lakeville Family Practice
Quello Clinic Quello Clinic
lIno lAkes
Fairview lino lakes Clinic Fairview Health services
HealthPartners HealthPartners Clinics
lIttle CAnAdA
little Canada Medical Clinic
MAPle grove
Allina Medical Clinic Allina Medical Clinic
Fairview Bass lake Clinic Fairview Health services
Fairview Maple grove Medical Center Fairview Health services
Maple Medical Center, PA
north Clinic north Clinic
82% 81%-83% 14% 81% 5% total Population 9579 82% 81%-83% 82% 82%-83% n/A 81% 19% total Population 14586 82% 82%-83%
82% 75%-87% 8% 89% 3% total Population 146 82% 75%-88% 75% 69%-80% n/A 92% 8% total Population 247 76% 70%-81%
* * * * * * * * * * * n/A * * * * * *
83% 80%-85% 11% 86% 3% total Population 1043 83% 81%-85% 83% 81%-85% n/A 89% 11% total Population 1510 84% 82%-85%
82% 81%-83% 14% 81% 5% total Population 9579 82% 81%-83% 82% 82%-83% n/A 81% 19% total Population 14586 82% 82%-83%
88% 88%-89% 11% 86% 3% total Population 18560 89% 88%-89% 83% 83%-84% n/A 90% 10% total Population 35007 84% 83%-84%
* * * * * * * * * * * n/A * * * * * *
81% 81%-82% 10% 86% 4% total Population 13556 82% 81%-82% 80% 80%-81% n/A 88% 12% total Population 21168 81% 80%-81%
82% 81%-83% 14% 81% 5% total Population 9579 82% 81%-83% 82% 82%-83% n/A 81% 19% total Population 14586 82% 82%-83%
82% 81%-83% 14% 81% 5% total Population 9579 82% 81%-83% 82% 82%-83% n/A 81% 19% total Population 14586 82% 82%-83%
* * * * * * * * * * * n/A * * * * * *
85% 83%-87% 18% 79% 3% total Population 1622 86% 84%-87% 82% 81%-84% n/A 92% 8% total Population 2316 83% 82%-85%
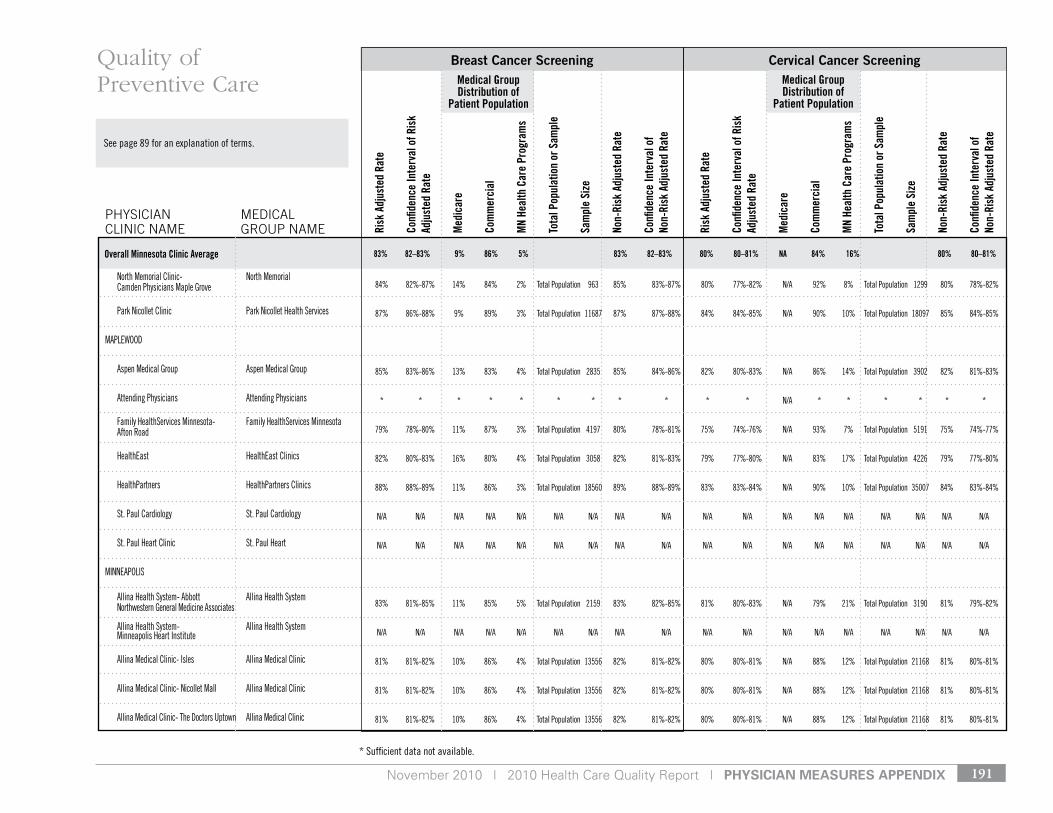
November 2010 | 2010 Health Care Quality Report | pHysiCian Measures appenDiX 191
* sufficient data not available.
see page 89 for an explanation of terms.
Medical Group Distribution of
Patient Population
Medical Group Distribution of
Patient Population
Risk
Adj
uste
d Ra
te
Confi
denc
e In
terv
al o
f Ris
k Ad
just
ed R
ate
Med
icar
e
Com
mer
cial
MN
Heal
th C
are
Prog
ram
s
Tota
l Pop
ulat
ion
or S
ampl
e
Sam
ple
Size
Non-
Risk
Adj
uste
d Ra
te
Confi
denc
e In
terv
al o
f No
n-Ri
sk A
djus
ted
Rate
Risk
Adj
uste
d Ra
te
Confi
denc
e In
terv
al o
f Ris
k Ad
just
ed R
ate
Med
icar
e
Com
mer
cial
MN
Heal
th C
are
Prog
ram
s
Tota
l Pop
ulat
ion
or S
ampl
e
Sam
ple
Size
Non-
Risk
Adj
uste
d Ra
te
Confi
denc
e In
terv
al o
f No
n-Ri
sk A
djus
ted
Rate
Breast Cancer Screening Cervical Cancer Screening
PHySIcIAN cLINIc NAME
MEdIcAL GrOuP NAME
Quality of Preventive Care
83% 82–83% 9% 86% 5% 83% 82–83% 80% 80–81% NA 84% 16% 80% 80–81%Overall Minnesota Clinic Average
north Memorial Clinic- north Memorial Camden Physicians Maple grove
Park nicollet Clinic Park nicollet Health services
MAPleWood
Aspen Medical group Aspen Medical group
Attending Physicians Attending Physicians
Family Healthservices Minnesota- Family Healthservices Minnesota Afton road
Healtheast Healtheast Clinics
HealthPartners HealthPartners Clinics
st. Paul Cardiology st. Paul Cardiology
st. Paul Heart Clinic st. Paul Heart
MInneAPolIs
Allina Health system- Abbott Allina Health system northwestern general Medicine Associates
Allina Health system- Allina Health system Minneapolis Heart Institute
Allina Medical Clinic- Isles Allina Medical Clinic
Allina Medical Clinic- nicollet Mall Allina Medical Clinic
Allina Medical Clinic- the doctors uptown Allina Medical Clinic
84% 82%-87% 14% 84% 2% total Population 963 85% 83%-87% 80% 77%-82% n/A 92% 8% total Population 1299 80% 78%-82%
87% 86%-88% 9% 89% 3% total Population 11687 87% 87%-88% 84% 84%-85% n/A 90% 10% total Population 18097 85% 84%-85%
85% 83%-86% 13% 83% 4% total Population 2835 85% 84%-86% 82% 80%-83% n/A 86% 14% total Population 3902 82% 81%-83%
* * * * * * * * * * * n/A * * * * * *
79% 78%-80% 11% 87% 3% total Population 4197 80% 78%-81% 75% 74%-76% n/A 93% 7% total Population 5191 75% 74%-77%
82% 80%-83% 16% 80% 4% total Population 3058 82% 81%-83% 79% 77%-80% n/A 83% 17% total Population 4226 79% 77%-80%
88% 88%-89% 11% 86% 3% total Population 18560 89% 88%-89% 83% 83%-84% n/A 90% 10% total Population 35007 84% 83%-84%
n/A n/A n/A n/A n/A n/A n/A n/A n/A n/A n/A n/A n/A n/A n/A n/A n/A n/A
n/A n/A n/A n/A n/A n/A n/A n/A n/A n/A n/A n/A n/A n/A n/A n/A n/A n/A
83% 81%-85% 11% 85% 5% total Population 2159 83% 82%-85% 81% 80%-83% n/A 79% 21% total Population 3190 81% 79%-82%
n/A n/A n/A n/A n/A n/A n/A n/A n/A n/A n/A n/A n/A n/A n/A n/A n/A n/A
81% 81%-82% 10% 86% 4% total Population 13556 82% 81%-82% 80% 80%-81% n/A 88% 12% total Population 21168 81% 80%-81%
81% 81%-82% 10% 86% 4% total Population 13556 82% 81%-82% 80% 80%-81% n/A 88% 12% total Population 21168 81% 80%-81%
81% 81%-82% 10% 86% 4% total Population 13556 82% 81%-82% 80% 80%-81% n/A 88% 12% total Population 21168 81% 80%-81%
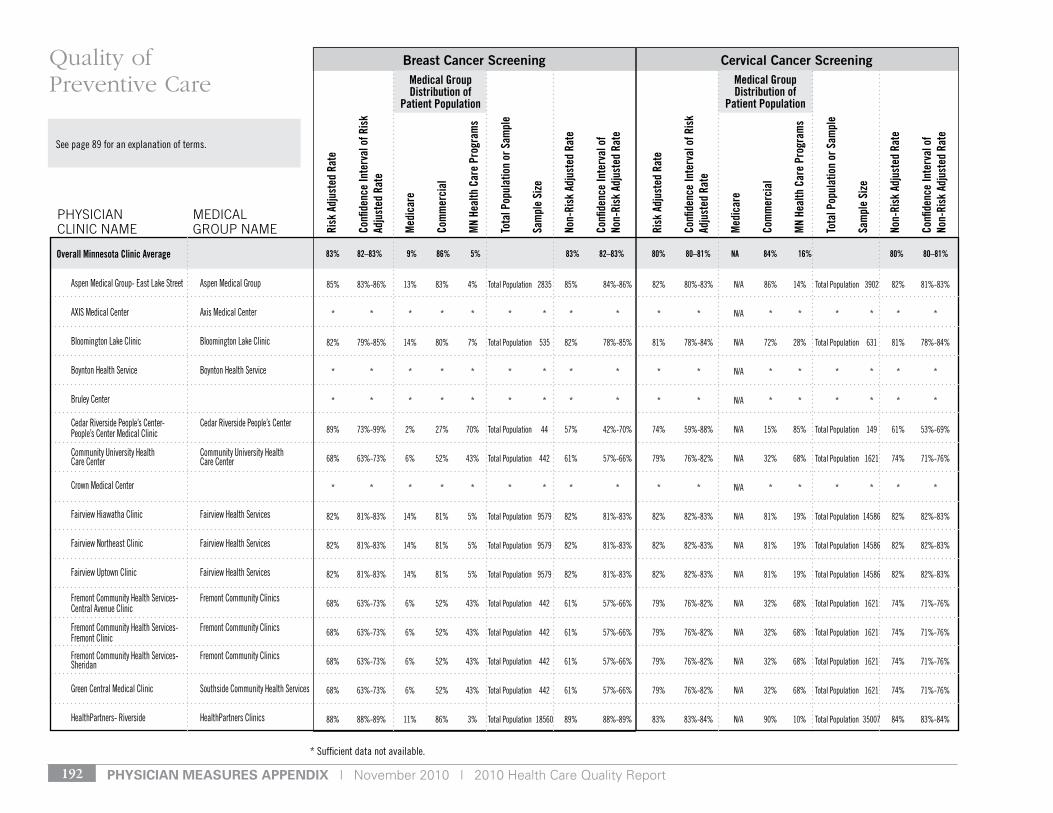
pHysiCian Measures appenDiX | November 2010 | 2010 Health Care Quality Report192
* sufficient data not available.
see page 89 for an explanation of terms.
Medical Group Distribution of
Patient Population
Medical Group Distribution of
Patient Population
Risk
Adj
uste
d Ra
te
Confi
denc
e In
terv
al o
f Ris
k Ad
just
ed R
ate
Med
icar
e
Com
mer
cial
MN
Heal
th C
are
Prog
ram
s
Tota
l Pop
ulat
ion
or S
ampl
e
Sam
ple
Size
Non-
Risk
Adj
uste
d Ra
te
Confi
denc
e In
terv
al o
f No
n-Ri
sk A
djus
ted
Rate
Risk
Adj
uste
d Ra
te
Confi
denc
e In
terv
al o
f Ris
k Ad
just
ed R
ate
Med
icar
e
Com
mer
cial
MN
Heal
th C
are
Prog
ram
s
Tota
l Pop
ulat
ion
or S
ampl
e
Sam
ple
Size
Non-
Risk
Adj
uste
d Ra
te
Confi
denc
e In
terv
al o
f No
n-Ri
sk A
djus
ted
Rate
Breast Cancer Screening Cervical Cancer Screening
PHySIcIAN cLINIc NAME
MEdIcAL GrOuP NAME
Quality of Preventive Care
83% 82–83% 9% 86% 5% 83% 82–83% 80% 80–81% NA 84% 16% 80% 80–81%Overall Minnesota Clinic Average
Aspen Medical group- east lake street Aspen Medical group
AXIs Medical Center Axis Medical Center
Bloomington lake Clinic Bloomington lake Clinic
Boynton Health service Boynton Health service
Bruley Center
Cedar riverside People’s Center- Cedar riverside People’s Center People’s Center Medical Clinic
Community university Health Community university Health Care Center Care Center
Crown Medical Center
Fairview Hiawatha Clinic Fairview Health services
Fairview northeast Clinic Fairview Health services
Fairview uptown Clinic Fairview Health services
Fremont Community Health services- Fremont Community Clinics Central Avenue Clinic
Fremont Community Health services- Fremont Community Clinics Fremont Clinic
Fremont Community Health services- Fremont Community Clinics sheridan
green Central Medical Clinic southside Community Health services
HealthPartners- riverside HealthPartners Clinics
85% 83%-86% 13% 83% 4% total Population 2835 85% 84%-86% 82% 80%-83% n/A 86% 14% total Population 3902 82% 81%-83%
* * * * * * * * * * * n/A * * * * * *
82% 79%-85% 14% 80% 7% total Population 535 82% 78%-85% 81% 78%-84% n/A 72% 28% total Population 631 81% 78%-84%
* * * * * * * * * * * n/A * * * * * *
* * * * * * * * * * * n/A * * * * * *
89% 73%-99% 2% 27% 70% total Population 44 57% 42%-70% 74% 59%-88% n/A 15% 85% total Population 149 61% 53%-69%
68% 63%-73% 6% 52% 43% total Population 442 61% 57%-66% 79% 76%-82% n/A 32% 68% total Population 1621 74% 71%-76%
* * * * * * * * * * * n/A * * * * * *
82% 81%-83% 14% 81% 5% total Population 9579 82% 81%-83% 82% 82%-83% n/A 81% 19% total Population 14586 82% 82%-83%
82% 81%-83% 14% 81% 5% total Population 9579 82% 81%-83% 82% 82%-83% n/A 81% 19% total Population 14586 82% 82%-83%
82% 81%-83% 14% 81% 5% total Population 9579 82% 81%-83% 82% 82%-83% n/A 81% 19% total Population 14586 82% 82%-83%
68% 63%-73% 6% 52% 43% total Population 442 61% 57%-66% 79% 76%-82% n/A 32% 68% total Population 1621 74% 71%-76%
68% 63%-73% 6% 52% 43% total Population 442 61% 57%-66% 79% 76%-82% n/A 32% 68% total Population 1621 74% 71%-76%
68% 63%-73% 6% 52% 43% total Population 442 61% 57%-66% 79% 76%-82% n/A 32% 68% total Population 1621 74% 71%-76%
68% 63%-73% 6% 52% 43% total Population 442 61% 57%-66% 79% 76%-82% n/A 32% 68% total Population 1621 74% 71%-76%
88% 88%-89% 11% 86% 3% total Population 18560 89% 88%-89% 83% 83%-84% n/A 90% 10% total Population 35007 84% 83%-84%
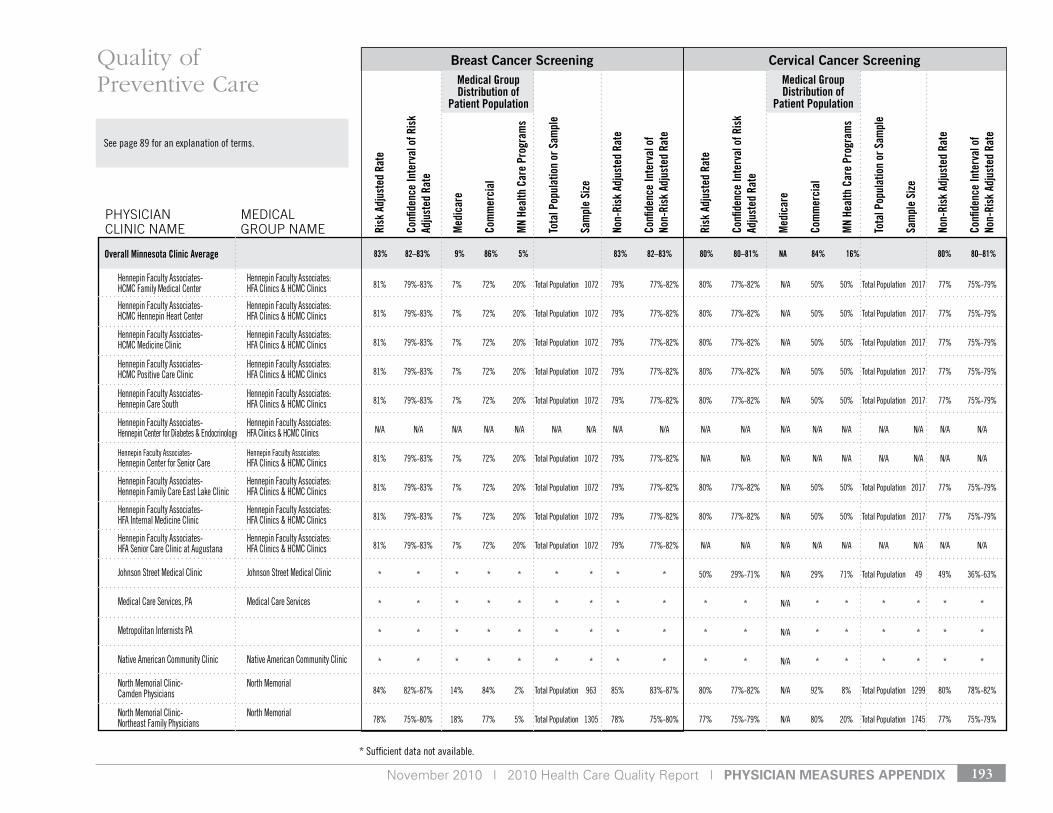
November 2010 | 2010 Health Care Quality Report | pHysiCian Measures appenDiX 193
* sufficient data not available.
see page 89 for an explanation of terms.
Medical Group Distribution of
Patient Population
Medical Group Distribution of
Patient Population
Risk
Adj
uste
d Ra
te
Confi
denc
e In
terv
al o
f Ris
k Ad
just
ed R
ate
Med
icar
e
Com
mer
cial
MN
Heal
th C
are
Prog
ram
s
Tota
l Pop
ulat
ion
or S
ampl
e
Sam
ple
Size
Non-
Risk
Adj
uste
d Ra
te
Confi
denc
e In
terv
al o
f No
n-Ri
sk A
djus
ted
Rate
Risk
Adj
uste
d Ra
te
Confi
denc
e In
terv
al o
f Ris
k Ad
just
ed R
ate
Med
icar
e
Com
mer
cial
MN
Heal
th C
are
Prog
ram
s
Tota
l Pop
ulat
ion
or S
ampl
e
Sam
ple
Size
Non-
Risk
Adj
uste
d Ra
te
Confi
denc
e In
terv
al o
f No
n-Ri
sk A
djus
ted
Rate
Breast Cancer Screening Cervical Cancer Screening
PHySIcIAN cLINIc NAME
MEdIcAL GrOuP NAME
Quality of Preventive Care
83% 82–83% 9% 86% 5% 83% 82–83% 80% 80–81% NA 84% 16% 80% 80–81%Overall Minnesota Clinic Average
Hennepin Faculty Associates- Hennepin Faculty Associates: HCMC Family Medical Center HFA Clinics & HCMC Clinics
Hennepin Faculty Associates- Hennepin Faculty Associates: HCMC Hennepin Heart Center HFA Clinics & HCMC Clinics
Hennepin Faculty Associates- Hennepin Faculty Associates: HCMC Medicine Clinic HFA Clinics & HCMC Clinics
Hennepin Faculty Associates- Hennepin Faculty Associates: HCMC Positive Care Clinic HFA Clinics & HCMC Clinics
Hennepin Faculty Associates- Hennepin Faculty Associates: Hennepin Care south HFA Clinics & HCMC Clinics
Hennepin Faculty Associates- Hennepin Faculty Associates: Hennepin Center for diabetes & endocrinology HFA Clinics & HCMC Clinics
Hennepin Faculty Associates- Hennepin Faculty Associates: Hennepin Center for senior Care HFA Clinics & HCMC Clinics
Hennepin Faculty Associates- Hennepin Faculty Associates: Hennepin Family Care east lake Clinic HFA Clinics & HCMC Clinics
Hennepin Faculty Associates- Hennepin Faculty Associates: HFA Internal Medicine Clinic HFA Clinics & HCMC Clinics
Hennepin Faculty Associates- Hennepin Faculty Associates: HFA senior Care Clinic at Augustana HFA Clinics & HCMC Clinics
Johnson street Medical Clinic Johnson street Medical Clinic
Medical Care services, PA Medical Care services
Metropolitan Internists PA
native American Community Clinic native American Community Clinic
north Memorial Clinic- north Memorial Camden Physicians
north Memorial Clinic- north Memorial northeast Family Physicians
81% 79%-83% 7% 72% 20% total Population 1072 79% 77%-82% 80% 77%-82% n/A 50% 50% total Population 2017 77% 75%-79%
81% 79%-83% 7% 72% 20% total Population 1072 79% 77%-82% 80% 77%-82% n/A 50% 50% total Population 2017 77% 75%-79%
81% 79%-83% 7% 72% 20% total Population 1072 79% 77%-82% 80% 77%-82% n/A 50% 50% total Population 2017 77% 75%-79%
81% 79%-83% 7% 72% 20% total Population 1072 79% 77%-82% 80% 77%-82% n/A 50% 50% total Population 2017 77% 75%-79%
81% 79%-83% 7% 72% 20% total Population 1072 79% 77%-82% 80% 77%-82% n/A 50% 50% total Population 2017 77% 75%-79%
n/A n/A n/A n/A n/A n/A n/A n/A n/A n/A n/A n/A n/A n/A n/A n/A n/A n/A
81% 79%-83% 7% 72% 20% total Population 1072 79% 77%-82% n/A n/A n/A n/A n/A n/A n/A n/A n/A
81% 79%-83% 7% 72% 20% total Population 1072 79% 77%-82% 80% 77%-82% n/A 50% 50% total Population 2017 77% 75%-79%
81% 79%-83% 7% 72% 20% total Population 1072 79% 77%-82% 80% 77%-82% n/A 50% 50% total Population 2017 77% 75%-79%
81% 79%-83% 7% 72% 20% total Population 1072 79% 77%-82% n/A n/A n/A n/A n/A n/A n/A n/A n/A
* * * * * * * * * 50% 29%-71% n/A 29% 71% total Population 49 49% 36%-63%
* * * * * * * * * * * n/A * * * * * *
* * * * * * * * * * * n/A * * * * * *
* * * * * * * * * * * n/A * * * * * *
84% 82%-87% 14% 84% 2% total Population 963 85% 83%-87% 80% 77%-82% n/A 92% 8% total Population 1299 80% 78%-82%
78% 75%-80% 18% 77% 5% total Population 1305 78% 75%-80% 77% 75%-79% n/A 80% 20% total Population 1745 77% 75%-79%

pHysiCian Measures appenDiX | November 2010 | 2010 Health Care Quality Report194
* sufficient data not available.
see page 89 for an explanation of terms.
Medical Group Distribution of
Patient Population
Medical Group Distribution of
Patient Population
Risk
Adj
uste
d Ra
te
Confi
denc
e In
terv
al o
f Ris
k Ad
just
ed R
ate
Med
icar
e
Com
mer
cial
MN
Heal
th C
are
Prog
ram
s
Tota
l Pop
ulat
ion
or S
ampl
e
Sam
ple
Size
Non-
Risk
Adj
uste
d Ra
te
Confi
denc
e In
terv
al o
f No
n-Ri
sk A
djus
ted
Rate
Risk
Adj
uste
d Ra
te
Confi
denc
e In
terv
al o
f Ris
k Ad
just
ed R
ate
Med
icar
e
Com
mer
cial
MN
Heal
th C
are
Prog
ram
s
Tota
l Pop
ulat
ion
or S
ampl
e
Sam
ple
Size
Non-
Risk
Adj
uste
d Ra
te
Confi
denc
e In
terv
al o
f No
n-Ri
sk A
djus
ted
Rate
Breast Cancer Screening Cervical Cancer Screening
PHySIcIAN cLINIc NAME
MEdIcAL GrOuP NAME
Quality of Preventive Care
83% 82–83% 9% 86% 5% 83% 82–83% 80% 80–81% NA 84% 16% 80% 80–81%Overall Minnesota Clinic Average
north Memorial Heart & vascular Institute north Memorial
northPoint Health & Wellness Center northPoint Health & Wellness Center
Park Avenue Family Practice
Park nicollet Clinic Park nicollet Health services
riverside Family Physicians riverside Family Physicians
ronald r vessey Md ronald r vessey Md Internal Medicine services, PA Internal Medicine services PA
southside Medical Clinic southside Community Health services
uMP Mn Heart university Clinic university of Minnesota Physicians
university of Minnesota Physicians - university of Minnesota Physicians Broadway Family Medicine
university of Minnesota Physicians - university of Minnesota Physicians Medicine specialties Clinic 6A
university of Minnesota Physicians - university of Minnesota Physicians Mill City Clinic
university of Minnesota Physicians - university of Minnesota Physicians Primary Care Center
university of Minnesota Physicians - university of Minnesota Physicians smiley’s Clinic
MInnetonkA
north Memorial Clinic- north Memorial Minnetonka Physicians
Park nicollet Clinic- Carlson Park nicollet Health services
78% 75%-80% 18% 77% 5% total Population 1305 78% 75%-80% 77% 75%-79% n/A 80% 20% total Population 1745 77% 75%-79%
72% 53%-89% 12% 25% 63% total Population 67 73% 61%-82% 77% 64%-89% n/A 9% 91% total Population 338 78% 73%-82%
* * * * * * * * * * * n/A * * * * * *
87% 86%-88% 9% 89% 3% total Population 11687 87% 87%-88% 84% 84%-85% n/A 90% 10% total Population 18097 85% 84%-85%
71% 62%-78% 7% 90% 3% total Population 110 70% 61%-78% 76% 68%-83% n/A 89% 11% total Population 126 78% 70%-84%
* * * * * * * * * * * n/A * * * * * *
68% 63%-73% 6% 52% 43% total Population 442 61% 57%-66% 79% 76%-82% n/A 32% 68% total Population 1621 74% 71%-76%
55% 42%-68% 13% 80% 7% total Population 54 56% 42%-68% 66% 54%-76% n/A 98% 2% total Population 51 65% 51%-76%
80% 77%-82% 13% 70% 17% total Population 1031 76% 73%-79% 81% 79%-83% n/A 48% 52% total Population 2285 78% 76%-79%
80% 77%-82% 13% 70% 17% total Population 1031 76% 73%-79% 81% 79%-83% n/A 48% 52% total Population 2285 78% 76%-79%
80% 77%-82% 13% 70% 17% total Population 1031 76% 73%-79% 81% 79%-83% n/A 48% 52% total Population 2285 78% 76%-79%
80% 77%-82% 13% 70% 17% total Population 1031 76% 73%-79% 81% 79%-83% n/A 48% 52% total Population 2285 78% 76%-79%
80% 77%-82% 13% 70% 17% total Population 1031 76% 73%-79% 81% 79%-83% n/A 48% 52% total Population 2285 78% 76%-79%
78% 75%-80% 18% 77% 5% total Population 1305 78% 75%-80% 77% 75%-79% n/A 80% 20% total Population 1745 77% 75%-79%
87% 86%-88% 9% 89% 3% total Population 11687 87% 87%-88% 84% 84%-85% n/A 90% 10% total Population 18097 85% 84%-85%
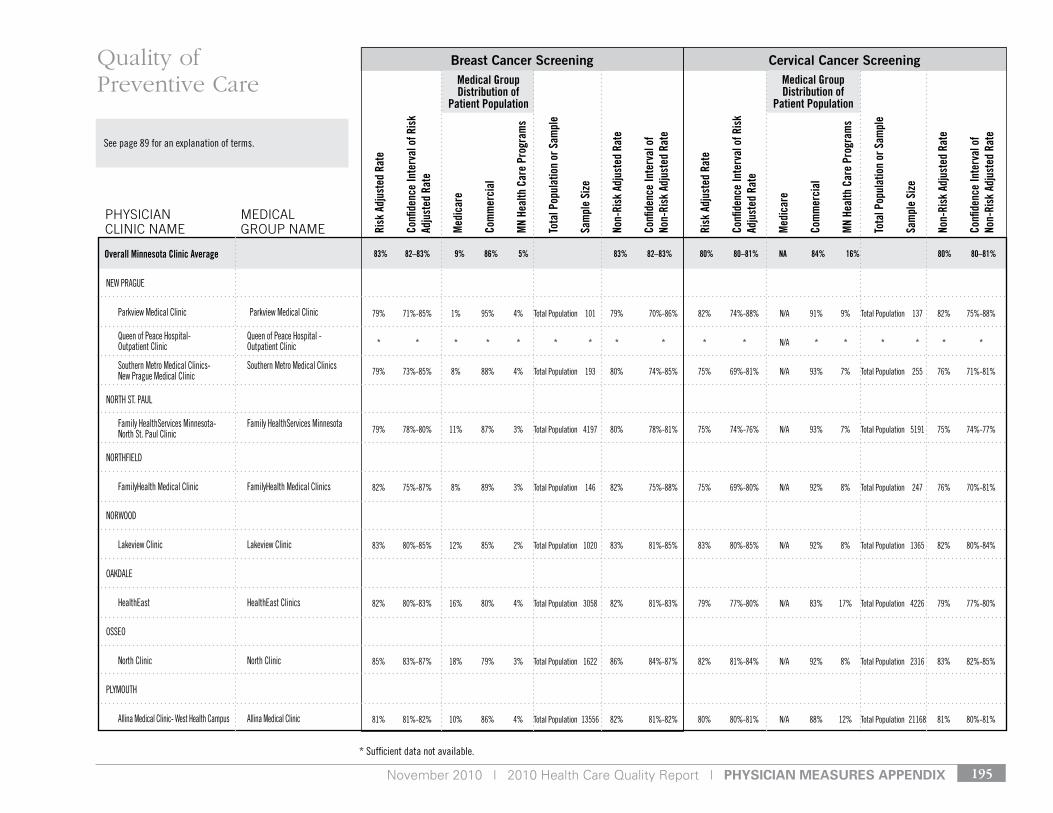
November 2010 | 2010 Health Care Quality Report | pHysiCian Measures appenDiX 195
* sufficient data not available.
see page 89 for an explanation of terms.
Medical Group Distribution of
Patient Population
Medical Group Distribution of
Patient Population
Risk
Adj
uste
d Ra
te
Confi
denc
e In
terv
al o
f Ris
k Ad
just
ed R
ate
Med
icar
e
Com
mer
cial
MN
Heal
th C
are
Prog
ram
s
Tota
l Pop
ulat
ion
or S
ampl
e
Sam
ple
Size
Non-
Risk
Adj
uste
d Ra
te
Confi
denc
e In
terv
al o
f No
n-Ri
sk A
djus
ted
Rate
Risk
Adj
uste
d Ra
te
Confi
denc
e In
terv
al o
f Ris
k Ad
just
ed R
ate
Med
icar
e
Com
mer
cial
MN
Heal
th C
are
Prog
ram
s
Tota
l Pop
ulat
ion
or S
ampl
e
Sam
ple
Size
Non-
Risk
Adj
uste
d Ra
te
Confi
denc
e In
terv
al o
f No
n-Ri
sk A
djus
ted
Rate
Breast Cancer Screening Cervical Cancer Screening
PHySIcIAN cLINIc NAME
MEdIcAL GrOuP NAME
Quality of Preventive Care
83% 82–83% 9% 86% 5% 83% 82–83% 80% 80–81% NA 84% 16% 80% 80–81%Overall Minnesota Clinic Average
neW PrAgue
Parkview Medical Clinic Parkview Medical Clinic
Queen of Peace Hospital- Queen of Peace Hospital - outpatient Clinic outpatient Clinic
southern Metro Medical Clinics- southern Metro Medical Clinics new Prague Medical Clinic
nortH st. PAul
Family Healthservices Minnesota- Family Healthservices Minnesota north st. Paul Clinic
nortHFIeld
FamilyHealth Medical Clinic FamilyHealth Medical Clinics
norWood
lakeview Clinic lakeview Clinic
oAkdAle
Healtheast Healtheast Clinics
osseo
north Clinic north Clinic
PlyMoutH
Allina Medical Clinic- West Health Campus Allina Medical Clinic
79% 71%-85% 1% 95% 4% total Population 101 79% 70%-86% 82% 74%-88% n/A 91% 9% total Population 137 82% 75%-88%
* * * * * * * * * * * n/A * * * * * *
79% 73%-85% 8% 88% 4% total Population 193 80% 74%-85% 75% 69%-81% n/A 93% 7% total Population 255 76% 71%-81%
79% 78%-80% 11% 87% 3% total Population 4197 80% 78%-81% 75% 74%-76% n/A 93% 7% total Population 5191 75% 74%-77%
82% 75%-87% 8% 89% 3% total Population 146 82% 75%-88% 75% 69%-80% n/A 92% 8% total Population 247 76% 70%-81%
83% 80%-85% 12% 85% 2% total Population 1020 83% 81%-85% 83% 80%-85% n/A 92% 8% total Population 1365 82% 80%-84%
82% 80%-83% 16% 80% 4% total Population 3058 82% 81%-83% 79% 77%-80% n/A 83% 17% total Population 4226 79% 77%-80%
85% 83%-87% 18% 79% 3% total Population 1622 86% 84%-87% 82% 81%-84% n/A 92% 8% total Population 2316 83% 82%-85%
81% 81%-82% 10% 86% 4% total Population 13556 82% 81%-82% 80% 80%-81% n/A 88% 12% total Population 21168 81% 80%-81%
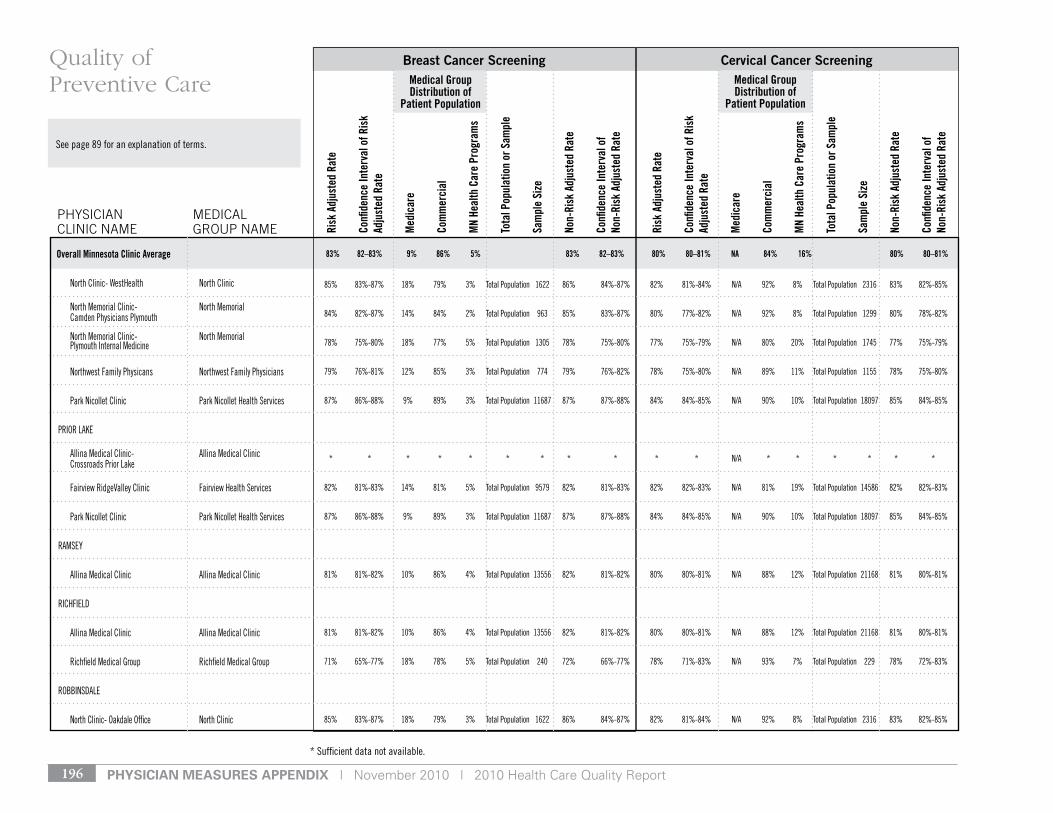
pHysiCian Measures appenDiX | November 2010 | 2010 Health Care Quality Report196
* sufficient data not available.
see page 89 for an explanation of terms.
Medical Group Distribution of
Patient Population
Medical Group Distribution of
Patient Population
Risk
Adj
uste
d Ra
te
Confi
denc
e In
terv
al o
f Ris
k Ad
just
ed R
ate
Med
icar
e
Com
mer
cial
MN
Heal
th C
are
Prog
ram
s
Tota
l Pop
ulat
ion
or S
ampl
e
Sam
ple
Size
Non-
Risk
Adj
uste
d Ra
te
Confi
denc
e In
terv
al o
f No
n-Ri
sk A
djus
ted
Rate
Risk
Adj
uste
d Ra
te
Confi
denc
e In
terv
al o
f Ris
k Ad
just
ed R
ate
Med
icar
e
Com
mer
cial
MN
Heal
th C
are
Prog
ram
s
Tota
l Pop
ulat
ion
or S
ampl
e
Sam
ple
Size
Non-
Risk
Adj
uste
d Ra
te
Confi
denc
e In
terv
al o
f No
n-Ri
sk A
djus
ted
Rate
Breast Cancer Screening Cervical Cancer Screening
PHySIcIAN cLINIc NAME
MEdIcAL GrOuP NAME
Quality of Preventive Care
83% 82–83% 9% 86% 5% 83% 82–83% 80% 80–81% NA 84% 16% 80% 80–81%Overall Minnesota Clinic Average
north Clinic- WestHealth north Clinic
north Memorial Clinic- north Memorial Camden Physicians Plymouth
north Memorial Clinic- north Memorial Plymouth Internal Medicine
northwest Family Physicans northwest Family Physicians
Park nicollet Clinic Park nicollet Health services
PrIor lAke
Allina Medical Clinic- Allina Medical Clinic Crossroads Prior lake
Fairview ridgevalley Clinic Fairview Health services
Park nicollet Clinic Park nicollet Health services
rAMsey
Allina Medical Clinic Allina Medical Clinic
rICHFIeld
Allina Medical Clinic Allina Medical Clinic
richfield Medical group richfield Medical group
roBBInsdAle
north Clinic- oakdale office north Clinic
85% 83%-87% 18% 79% 3% total Population 1622 86% 84%-87% 82% 81%-84% n/A 92% 8% total Population 2316 83% 82%-85%
84% 82%-87% 14% 84% 2% total Population 963 85% 83%-87% 80% 77%-82% n/A 92% 8% total Population 1299 80% 78%-82%
78% 75%-80% 18% 77% 5% total Population 1305 78% 75%-80% 77% 75%-79% n/A 80% 20% total Population 1745 77% 75%-79%
79% 76%-81% 12% 85% 3% total Population 774 79% 76%-82% 78% 75%-80% n/A 89% 11% total Population 1155 78% 75%-80%
87% 86%-88% 9% 89% 3% total Population 11687 87% 87%-88% 84% 84%-85% n/A 90% 10% total Population 18097 85% 84%-85%
* * * * * * * * * * * n/A * * * * * *
82% 81%-83% 14% 81% 5% total Population 9579 82% 81%-83% 82% 82%-83% n/A 81% 19% total Population 14586 82% 82%-83%
87% 86%-88% 9% 89% 3% total Population 11687 87% 87%-88% 84% 84%-85% n/A 90% 10% total Population 18097 85% 84%-85%
81% 81%-82% 10% 86% 4% total Population 13556 82% 81%-82% 80% 80%-81% n/A 88% 12% total Population 21168 81% 80%-81%
81% 81%-82% 10% 86% 4% total Population 13556 82% 81%-82% 80% 80%-81% n/A 88% 12% total Population 21168 81% 80%-81%
71% 65%-77% 18% 78% 5% total Population 240 72% 66%-77% 78% 71%-83% n/A 93% 7% total Population 229 78% 72%-83%
85% 83%-87% 18% 79% 3% total Population 1622 86% 84%-87% 82% 81%-84% n/A 92% 8% total Population 2316 83% 82%-85%
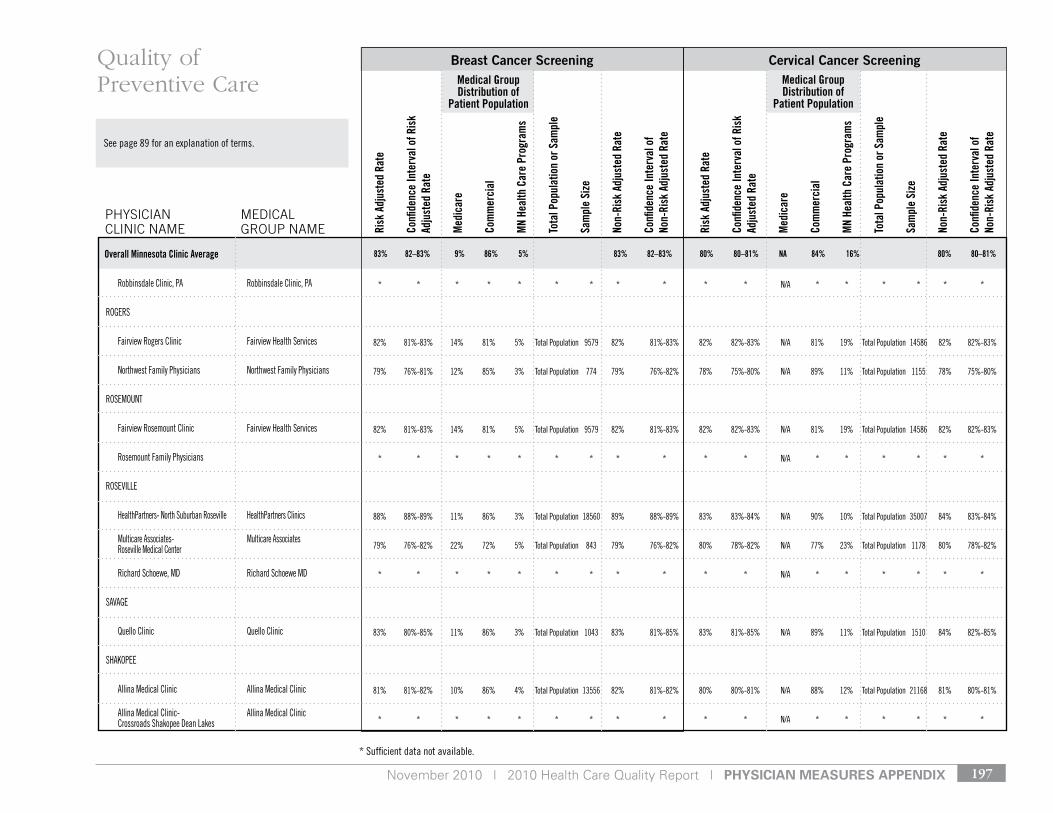
November 2010 | 2010 Health Care Quality Report | pHysiCian Measures appenDiX 197
* sufficient data not available.
see page 89 for an explanation of terms.
Medical Group Distribution of
Patient Population
Medical Group Distribution of
Patient Population
Risk
Adj
uste
d Ra
te
Confi
denc
e In
terv
al o
f Ris
k Ad
just
ed R
ate
Med
icar
e
Com
mer
cial
MN
Heal
th C
are
Prog
ram
s
Tota
l Pop
ulat
ion
or S
ampl
e
Sam
ple
Size
Non-
Risk
Adj
uste
d Ra
te
Confi
denc
e In
terv
al o
f No
n-Ri
sk A
djus
ted
Rate
Risk
Adj
uste
d Ra
te
Confi
denc
e In
terv
al o
f Ris
k Ad
just
ed R
ate
Med
icar
e
Com
mer
cial
MN
Heal
th C
are
Prog
ram
s
Tota
l Pop
ulat
ion
or S
ampl
e
Sam
ple
Size
Non-
Risk
Adj
uste
d Ra
te
Confi
denc
e In
terv
al o
f No
n-Ri
sk A
djus
ted
Rate
Breast Cancer Screening Cervical Cancer Screening
PHySIcIAN cLINIc NAME
MEdIcAL GrOuP NAME
Quality of Preventive Care
83% 82–83% 9% 86% 5% 83% 82–83% 80% 80–81% NA 84% 16% 80% 80–81%Overall Minnesota Clinic Average
robbinsdale Clinic, PA robbinsdale Clinic, PA
rogers
Fairview rogers Clinic Fairview Health services
northwest Family Physicians northwest Family Physicians
roseMount
Fairview rosemount Clinic Fairview Health services
rosemount Family Physicians
rosevIlle
HealthPartners- north suburban roseville HealthPartners Clinics
Multicare Associates- Multicare Associates roseville Medical Center
richard schoewe, Md richard schoewe Md
sAvAge
Quello Clinic Quello Clinic
sHAkoPee
Allina Medical Clinic Allina Medical Clinic
Allina Medical Clinic- Allina Medical Clinic Crossroads shakopee dean lakes
* * * * * * * * * * * n/A * * * * * *
82% 81%-83% 14% 81% 5% total Population 9579 82% 81%-83% 82% 82%-83% n/A 81% 19% total Population 14586 82% 82%-83%
79% 76%-81% 12% 85% 3% total Population 774 79% 76%-82% 78% 75%-80% n/A 89% 11% total Population 1155 78% 75%-80%
82% 81%-83% 14% 81% 5% total Population 9579 82% 81%-83% 82% 82%-83% n/A 81% 19% total Population 14586 82% 82%-83%
* * * * * * * * * * * n/A * * * * * *
88% 88%-89% 11% 86% 3% total Population 18560 89% 88%-89% 83% 83%-84% n/A 90% 10% total Population 35007 84% 83%-84%
79% 76%-82% 22% 72% 5% total Population 843 79% 76%-82% 80% 78%-82% n/A 77% 23% total Population 1178 80% 78%-82%
* * * * * * * * * * * n/A * * * * * *
83% 80%-85% 11% 86% 3% total Population 1043 83% 81%-85% 83% 81%-85% n/A 89% 11% total Population 1510 84% 82%-85%
81% 81%-82% 10% 86% 4% total Population 13556 82% 81%-82% 80% 80%-81% n/A 88% 12% total Population 21168 81% 80%-81%
* * * * * * * * * * * n/A * * * * * *
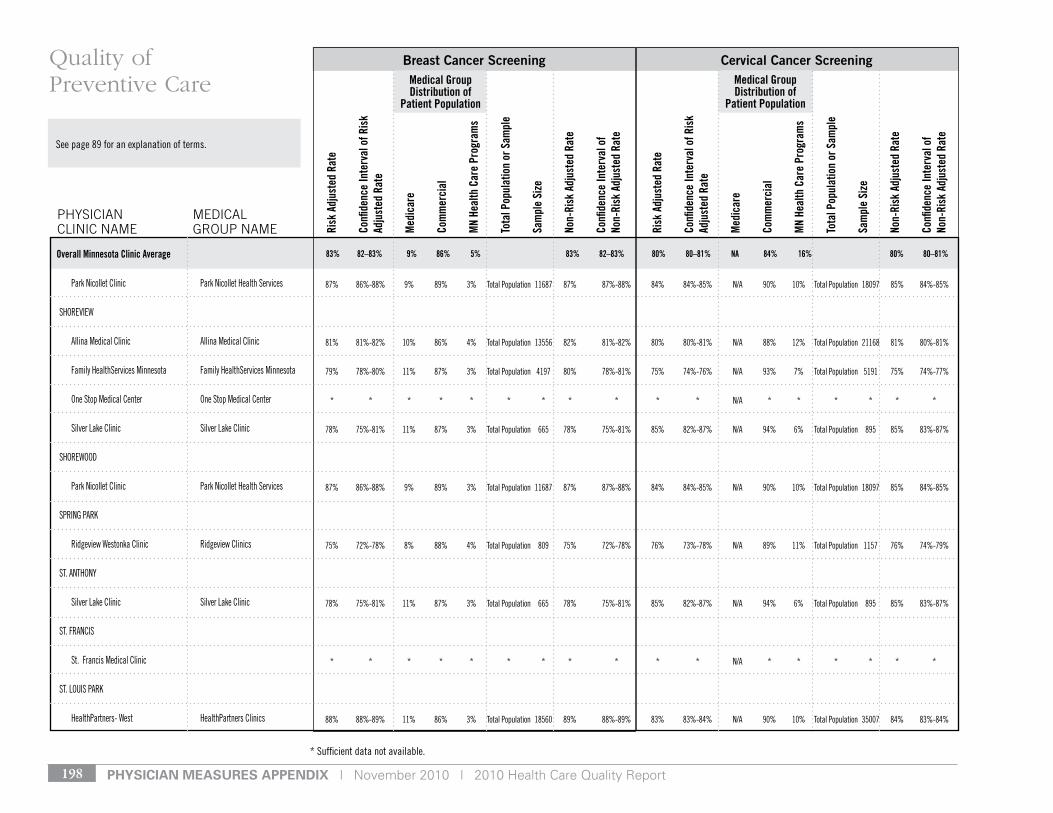
pHysiCian Measures appenDiX | November 2010 | 2010 Health Care Quality Report198
* sufficient data not available.
see page 89 for an explanation of terms.
Medical Group Distribution of
Patient Population
Medical Group Distribution of
Patient Population
Risk
Adj
uste
d Ra
te
Confi
denc
e In
terv
al o
f Ris
k Ad
just
ed R
ate
Med
icar
e
Com
mer
cial
MN
Heal
th C
are
Prog
ram
s
Tota
l Pop
ulat
ion
or S
ampl
e
Sam
ple
Size
Non-
Risk
Adj
uste
d Ra
te
Confi
denc
e In
terv
al o
f No
n-Ri
sk A
djus
ted
Rate
Risk
Adj
uste
d Ra
te
Confi
denc
e In
terv
al o
f Ris
k Ad
just
ed R
ate
Med
icar
e
Com
mer
cial
MN
Heal
th C
are
Prog
ram
s
Tota
l Pop
ulat
ion
or S
ampl
e
Sam
ple
Size
Non-
Risk
Adj
uste
d Ra
te
Confi
denc
e In
terv
al o
f No
n-Ri
sk A
djus
ted
Rate
Breast Cancer Screening Cervical Cancer Screening
PHySIcIAN cLINIc NAME
MEdIcAL GrOuP NAME
Quality of Preventive Care
83% 82–83% 9% 86% 5% 83% 82–83% 80% 80–81% NA 84% 16% 80% 80–81%Overall Minnesota Clinic Average
Park nicollet Clinic Park nicollet Health services
sHorevIeW
Allina Medical Clinic Allina Medical Clinic
Family Healthservices Minnesota Family Healthservices Minnesota
one stop Medical Center one stop Medical Center
silver lake Clinic silver lake Clinic
sHoreWood
Park nicollet Clinic Park nicollet Health services
sPrIng PArk
ridgeview Westonka Clinic ridgeview Clinics
st. AntHony
silver lake Clinic silver lake Clinic
st. FrAnCIs
st. Francis Medical Clinic
st. louIs PArk
HealthPartners- West HealthPartners Clinics
87% 86%-88% 9% 89% 3% total Population 11687 87% 87%-88% 84% 84%-85% n/A 90% 10% total Population 18097 85% 84%-85%
81% 81%-82% 10% 86% 4% total Population 13556 82% 81%-82% 80% 80%-81% n/A 88% 12% total Population 21168 81% 80%-81%
79% 78%-80% 11% 87% 3% total Population 4197 80% 78%-81% 75% 74%-76% n/A 93% 7% total Population 5191 75% 74%-77%
* * * * * * * * * * * n/A * * * * * *
78% 75%-81% 11% 87% 3% total Population 665 78% 75%-81% 85% 82%-87% n/A 94% 6% total Population 895 85% 83%-87%
87% 86%-88% 9% 89% 3% total Population 11687 87% 87%-88% 84% 84%-85% n/A 90% 10% total Population 18097 85% 84%-85%
75% 72%-78% 8% 88% 4% total Population 809 75% 72%-78% 76% 73%-78% n/A 89% 11% total Population 1157 76% 74%-79%
78% 75%-81% 11% 87% 3% total Population 665 78% 75%-81% 85% 82%-87% n/A 94% 6% total Population 895 85% 83%-87%
* * * * * * * * * * * n/A * * * * * *
88% 88%-89% 11% 86% 3% total Population 18560 89% 88%-89% 83% 83%-84% n/A 90% 10% total Population 35007 84% 83%-84%
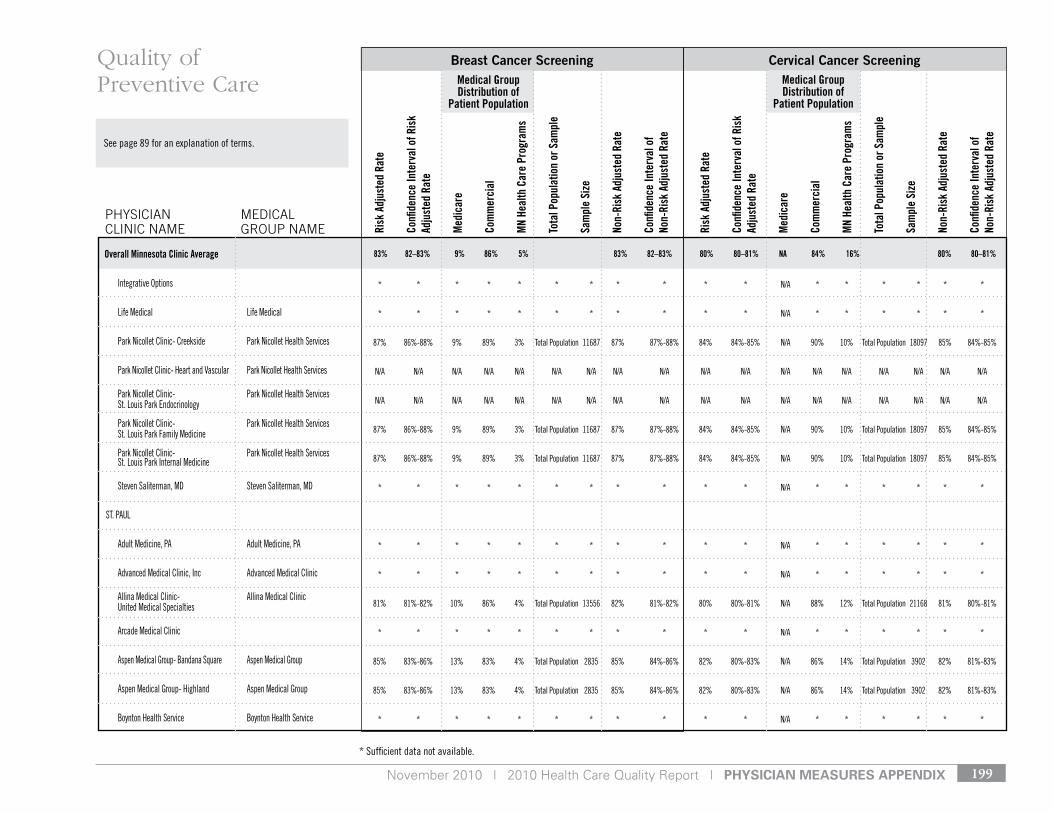
November 2010 | 2010 Health Care Quality Report | pHysiCian Measures appenDiX 199
* sufficient data not available.
see page 89 for an explanation of terms.
Medical Group Distribution of
Patient Population
Medical Group Distribution of
Patient Population
Risk
Adj
uste
d Ra
te
Confi
denc
e In
terv
al o
f Ris
k Ad
just
ed R
ate
Med
icar
e
Com
mer
cial
MN
Heal
th C
are
Prog
ram
s
Tota
l Pop
ulat
ion
or S
ampl
e
Sam
ple
Size
Non-
Risk
Adj
uste
d Ra
te
Confi
denc
e In
terv
al o
f No
n-Ri
sk A
djus
ted
Rate
Risk
Adj
uste
d Ra
te
Confi
denc
e In
terv
al o
f Ris
k Ad
just
ed R
ate
Med
icar
e
Com
mer
cial
MN
Heal
th C
are
Prog
ram
s
Tota
l Pop
ulat
ion
or S
ampl
e
Sam
ple
Size
Non-
Risk
Adj
uste
d Ra
te
Confi
denc
e In
terv
al o
f No
n-Ri
sk A
djus
ted
Rate
Breast Cancer Screening Cervical Cancer Screening
PHySIcIAN cLINIc NAME
MEdIcAL GrOuP NAME
Quality of Preventive Care
83% 82–83% 9% 86% 5% 83% 82–83% 80% 80–81% NA 84% 16% 80% 80–81%Overall Minnesota Clinic Average
Integrative options
life Medical life Medical
Park nicollet Clinic- Creekside Park nicollet Health services
Park nicollet Clinic- Heart and vascular Park nicollet Health services
Park nicollet Clinic- Park nicollet Health services st. louis Park endocrinology
Park nicollet Clinic- Park nicollet Health services st. louis Park Family Medicine
Park nicollet Clinic- Park nicollet Health services st. louis Park Internal Medicine
steven saliterman, Md steven saliterman, Md
st. PAul
Adult Medicine, PA Adult Medicine, PA
Advanced Medical Clinic, Inc Advanced Medical Clinic
Allina Medical Clinic- Allina Medical Clinic united Medical specialties
Arcade Medical Clinic
Aspen Medical group- Bandana square Aspen Medical group
Aspen Medical group- Highland Aspen Medical group
Boynton Health service Boynton Health service
* * * * * * * * * * * n/A * * * * * *
* * * * * * * * * * * n/A * * * * * *
87% 86%-88% 9% 89% 3% total Population 11687 87% 87%-88% 84% 84%-85% n/A 90% 10% total Population 18097 85% 84%-85%
n/A n/A n/A n/A n/A n/A n/A n/A n/A n/A n/A n/A n/A n/A n/A n/A n/A n/A
n/A n/A n/A n/A n/A n/A n/A n/A n/A n/A n/A n/A n/A n/A n/A n/A n/A n/A
87% 86%-88% 9% 89% 3% total Population 11687 87% 87%-88% 84% 84%-85% n/A 90% 10% total Population 18097 85% 84%-85%
87% 86%-88% 9% 89% 3% total Population 11687 87% 87%-88% 84% 84%-85% n/A 90% 10% total Population 18097 85% 84%-85%
* * * * * * * * * * * n/A * * * * * *
* * * * * * * * * * * n/A * * * * * *
* * * * * * * * * * * n/A * * * * * *
81% 81%-82% 10% 86% 4% total Population 13556 82% 81%-82% 80% 80%-81% n/A 88% 12% total Population 21168 81% 80%-81%
* * * * * * * * * * * n/A * * * * * *
85% 83%-86% 13% 83% 4% total Population 2835 85% 84%-86% 82% 80%-83% n/A 86% 14% total Population 3902 82% 81%-83%
85% 83%-86% 13% 83% 4% total Population 2835 85% 84%-86% 82% 80%-83% n/A 86% 14% total Population 3902 82% 81%-83%
* * * * * * * * * * * n/A * * * * * *
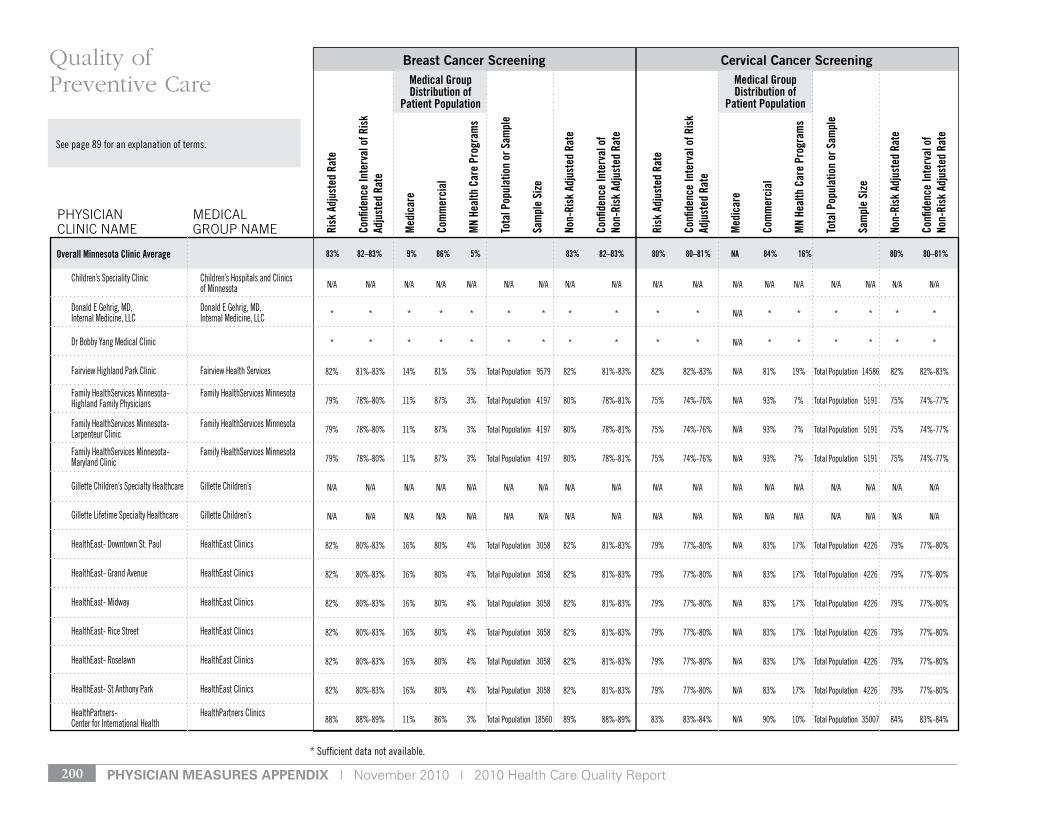
pHysiCian Measures appenDiX | November 2010 | 2010 Health Care Quality Report200
* sufficient data not available.
see page 89 for an explanation of terms.
Medical Group Distribution of
Patient Population
Medical Group Distribution of
Patient Population
Risk
Adj
uste
d Ra
te
Confi
denc
e In
terv
al o
f Ris
k Ad
just
ed R
ate
Med
icar
e
Com
mer
cial
MN
Heal
th C
are
Prog
ram
s
Tota
l Pop
ulat
ion
or S
ampl
e
Sam
ple
Size
Non-
Risk
Adj
uste
d Ra
te
Confi
denc
e In
terv
al o
f No
n-Ri
sk A
djus
ted
Rate
Risk
Adj
uste
d Ra
te
Confi
denc
e In
terv
al o
f Ris
k Ad
just
ed R
ate
Med
icar
e
Com
mer
cial
MN
Heal
th C
are
Prog
ram
s
Tota
l Pop
ulat
ion
or S
ampl
e
Sam
ple
Size
Non-
Risk
Adj
uste
d Ra
te
Confi
denc
e In
terv
al o
f No
n-Ri
sk A
djus
ted
Rate
Breast Cancer Screening Cervical Cancer Screening
PHySIcIAN cLINIc NAME
MEdIcAL GrOuP NAME
Quality of Preventive Care
83% 82–83% 9% 86% 5% 83% 82–83% 80% 80–81% NA 84% 16% 80% 80–81%Overall Minnesota Clinic Average
Children’s speciality Clinic Children’s Hospitals and Clinics of Minnesota
donald e gehrig, Md, donald e gehrig, Md, Internal Medicine, llC Internal Medicine, llC
dr Bobby yang Medical Clinic
Fairview Highland Park Clinic Fairview Health services
Family Healthservices Minnesota- Family Healthservices Minnesota Highland Family Physicians
Family Healthservices Minnesota- Family Healthservices Minnesota larpenteur Clinic
Family Healthservices Minnesota- Family Healthservices Minnesota Maryland Clinic
gillette Children’s specialty Healthcare gillette Children’s
gillette lifetime specialty Healthcare gillette Children’s
Healtheast- downtown st. Paul Healtheast Clinics
Healtheast- grand Avenue Healtheast Clinics
Healtheast- Midway Healtheast Clinics
Healtheast- rice street Healtheast Clinics
Healtheast- roselawn Healtheast Clinics
Healtheast- st Anthony Park Healtheast Clinics
HealthPartners- HealthPartners Clinics Center for International Health
n/A n/A n/A n/A n/A n/A n/A n/A n/A n/A n/A n/A n/A n/A n/A n/A n/A n/A
* * * * * * * * * * * n/A * * * * * *
* * * * * * * * * * * n/A * * * * * *
82% 81%-83% 14% 81% 5% total Population 9579 82% 81%-83% 82% 82%-83% n/A 81% 19% total Population 14586 82% 82%-83%
79% 78%-80% 11% 87% 3% total Population 4197 80% 78%-81% 75% 74%-76% n/A 93% 7% total Population 5191 75% 74%-77%
79% 78%-80% 11% 87% 3% total Population 4197 80% 78%-81% 75% 74%-76% n/A 93% 7% total Population 5191 75% 74%-77%
79% 78%-80% 11% 87% 3% total Population 4197 80% 78%-81% 75% 74%-76% n/A 93% 7% total Population 5191 75% 74%-77%
n/A n/A n/A n/A n/A n/A n/A n/A n/A n/A n/A n/A n/A n/A n/A n/A n/A n/A
n/A n/A n/A n/A n/A n/A n/A n/A n/A n/A n/A n/A n/A n/A n/A n/A n/A n/A
82% 80%-83% 16% 80% 4% total Population 3058 82% 81%-83% 79% 77%-80% n/A 83% 17% total Population 4226 79% 77%-80%
82% 80%-83% 16% 80% 4% total Population 3058 82% 81%-83% 79% 77%-80% n/A 83% 17% total Population 4226 79% 77%-80%
82% 80%-83% 16% 80% 4% total Population 3058 82% 81%-83% 79% 77%-80% n/A 83% 17% total Population 4226 79% 77%-80%
82% 80%-83% 16% 80% 4% total Population 3058 82% 81%-83% 79% 77%-80% n/A 83% 17% total Population 4226 79% 77%-80%
82% 80%-83% 16% 80% 4% total Population 3058 82% 81%-83% 79% 77%-80% n/A 83% 17% total Population 4226 79% 77%-80%
82% 80%-83% 16% 80% 4% total Population 3058 82% 81%-83% 79% 77%-80% n/A 83% 17% total Population 4226 79% 77%-80%
88% 88%-89% 11% 86% 3% total Population 18560 89% 88%-89% 83% 83%-84% n/A 90% 10% total Population 35007 84% 83%-84%
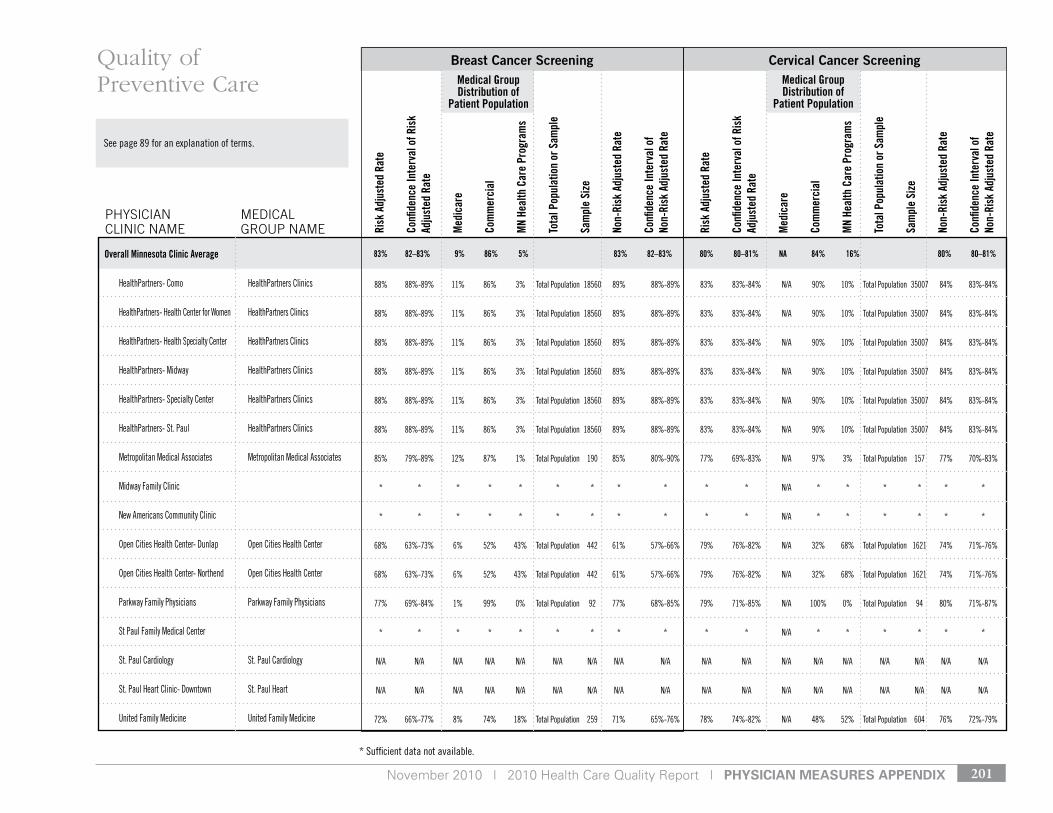
November 2010 | 2010 Health Care Quality Report | pHysiCian Measures appenDiX 201
* sufficient data not available.
see page 89 for an explanation of terms.
Medical Group Distribution of
Patient Population
Medical Group Distribution of
Patient Population
Risk
Adj
uste
d Ra
te
Confi
denc
e In
terv
al o
f Ris
k Ad
just
ed R
ate
Med
icar
e
Com
mer
cial
MN
Heal
th C
are
Prog
ram
s
Tota
l Pop
ulat
ion
or S
ampl
e
Sam
ple
Size
Non-
Risk
Adj
uste
d Ra
te
Confi
denc
e In
terv
al o
f No
n-Ri
sk A
djus
ted
Rate
Risk
Adj
uste
d Ra
te
Confi
denc
e In
terv
al o
f Ris
k Ad
just
ed R
ate
Med
icar
e
Com
mer
cial
MN
Heal
th C
are
Prog
ram
s
Tota
l Pop
ulat
ion
or S
ampl
e
Sam
ple
Size
Non-
Risk
Adj
uste
d Ra
te
Confi
denc
e In
terv
al o
f No
n-Ri
sk A
djus
ted
Rate
Breast Cancer Screening Cervical Cancer Screening
PHySIcIAN cLINIc NAME
MEdIcAL GrOuP NAME
Quality of Preventive Care
83% 82–83% 9% 86% 5% 83% 82–83% 80% 80–81% NA 84% 16% 80% 80–81%Overall Minnesota Clinic Average
HealthPartners- Como HealthPartners Clinics
HealthPartners- Health Center for Women HealthPartners Clinics
HealthPartners- Health specialty Center HealthPartners Clinics
HealthPartners- Midway HealthPartners Clinics
HealthPartners- specialty Center HealthPartners Clinics
HealthPartners- st. Paul HealthPartners Clinics
Metropolitan Medical Associates Metropolitan Medical Associates
Midway Family Clinic
new Americans Community Clinic
open Cities Health Center- dunlap open Cities Health Center
open Cities Health Center- northend open Cities Health Center
Parkway Family Physicians Parkway Family Physicians
st Paul Family Medical Center
st. Paul Cardiology st. Paul Cardiology
st. Paul Heart Clinic- downtown st. Paul Heart
united Family Medicine united Family Medicine
88% 88%-89% 11% 86% 3% total Population 18560 89% 88%-89% 83% 83%-84% n/A 90% 10% total Population 35007 84% 83%-84%
88% 88%-89% 11% 86% 3% total Population 18560 89% 88%-89% 83% 83%-84% n/A 90% 10% total Population 35007 84% 83%-84%
88% 88%-89% 11% 86% 3% total Population 18560 89% 88%-89% 83% 83%-84% n/A 90% 10% total Population 35007 84% 83%-84%
88% 88%-89% 11% 86% 3% total Population 18560 89% 88%-89% 83% 83%-84% n/A 90% 10% total Population 35007 84% 83%-84%
88% 88%-89% 11% 86% 3% total Population 18560 89% 88%-89% 83% 83%-84% n/A 90% 10% total Population 35007 84% 83%-84%
88% 88%-89% 11% 86% 3% total Population 18560 89% 88%-89% 83% 83%-84% n/A 90% 10% total Population 35007 84% 83%-84%
85% 79%-89% 12% 87% 1% total Population 190 85% 80%-90% 77% 69%-83% n/A 97% 3% total Population 157 77% 70%-83%
* * * * * * * * * * * n/A * * * * * *
* * * * * * * * * * * n/A * * * * * *
68% 63%-73% 6% 52% 43% total Population 442 61% 57%-66% 79% 76%-82% n/A 32% 68% total Population 1621 74% 71%-76%
68% 63%-73% 6% 52% 43% total Population 442 61% 57%-66% 79% 76%-82% n/A 32% 68% total Population 1621 74% 71%-76%
77% 69%-84% 1% 99% 0% total Population 92 77% 68%-85% 79% 71%-85% n/A 100% 0% total Population 94 80% 71%-87%
* * * * * * * * * * * n/A * * * * * *
n/A n/A n/A n/A n/A n/A n/A n/A n/A n/A n/A n/A n/A n/A n/A n/A n/A n/A
n/A n/A n/A n/A n/A n/A n/A n/A n/A n/A n/A n/A n/A n/A n/A n/A n/A n/A
72% 66%-77% 8% 74% 18% total Population 259 71% 65%-76% 78% 74%-82% n/A 48% 52% total Population 604 76% 72%-79%
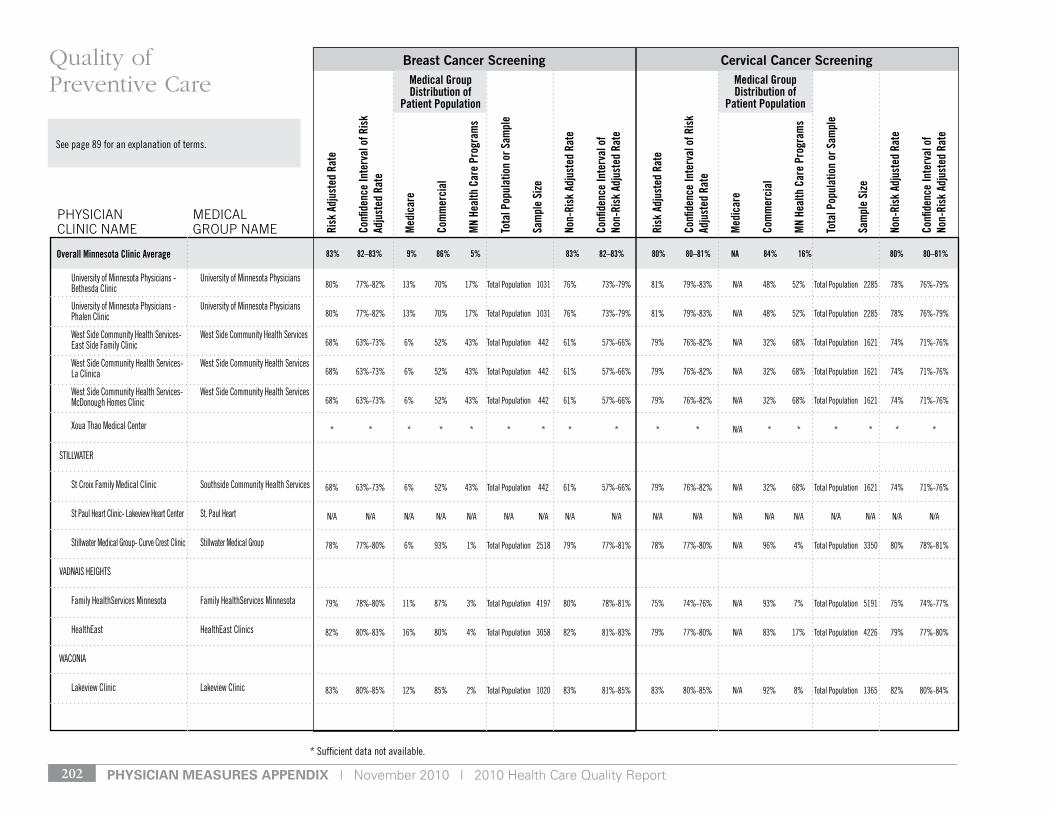
pHysiCian Measures appenDiX | November 2010 | 2010 Health Care Quality Report202
* sufficient data not available.
see page 89 for an explanation of terms.
Medical Group Distribution of
Patient Population
Medical Group Distribution of
Patient Population
Risk
Adj
uste
d Ra
te
Confi
denc
e In
terv
al o
f Ris
k Ad
just
ed R
ate
Med
icar
e
Com
mer
cial
MN
Heal
th C
are
Prog
ram
s
Tota
l Pop
ulat
ion
or S
ampl
e
Sam
ple
Size
Non-
Risk
Adj
uste
d Ra
te
Confi
denc
e In
terv
al o
f No
n-Ri
sk A
djus
ted
Rate
Risk
Adj
uste
d Ra
te
Confi
denc
e In
terv
al o
f Ris
k Ad
just
ed R
ate
Med
icar
e
Com
mer
cial
MN
Heal
th C
are
Prog
ram
s
Tota
l Pop
ulat
ion
or S
ampl
e
Sam
ple
Size
Non-
Risk
Adj
uste
d Ra
te
Confi
denc
e In
terv
al o
f No
n-Ri
sk A
djus
ted
Rate
Breast Cancer Screening Cervical Cancer Screening
PHySIcIAN cLINIc NAME
MEdIcAL GrOuP NAME
Quality of Preventive Care
83% 82–83% 9% 86% 5% 83% 82–83% 80% 80–81% NA 84% 16% 80% 80–81%Overall Minnesota Clinic Average
university of Minnesota Physicians - university of Minnesota Physicians Bethesda Clinic
university of Minnesota Physicians - university of Minnesota Physicians Phalen Clinic
West side Community Health services- West side Community Health services east side Family Clinic
West side Community Health services- West side Community Health services la Clinica
West side Community Health services- West side Community Health services Mcdonough Homes Clinic
Xoua thao Medical Center
stIllWAter
st Croix Family Medical Clinic southside Community Health services
st Paul Heart Clinic- lakeview Heart Center st. Paul Heart
stillwater Medical group- Curve Crest Clinic stillwater Medical group
vAdnAIs HeIgHts
Family Healthservices Minnesota Family Healthservices Minnesota
Healtheast Healtheast Clinics
WAConIA
lakeview Clinic lakeview Clinic
80% 77%-82% 13% 70% 17% total Population 1031 76% 73%-79% 81% 79%-83% n/A 48% 52% total Population 2285 78% 76%-79%
80% 77%-82% 13% 70% 17% total Population 1031 76% 73%-79% 81% 79%-83% n/A 48% 52% total Population 2285 78% 76%-79%
68% 63%-73% 6% 52% 43% total Population 442 61% 57%-66% 79% 76%-82% n/A 32% 68% total Population 1621 74% 71%-76%
68% 63%-73% 6% 52% 43% total Population 442 61% 57%-66% 79% 76%-82% n/A 32% 68% total Population 1621 74% 71%-76%
68% 63%-73% 6% 52% 43% total Population 442 61% 57%-66% 79% 76%-82% n/A 32% 68% total Population 1621 74% 71%-76%
* * * * * * * * * * * n/A * * * * * *
68% 63%-73% 6% 52% 43% total Population 442 61% 57%-66% 79% 76%-82% n/A 32% 68% total Population 1621 74% 71%-76%
n/A n/A n/A n/A n/A n/A n/A n/A n/A n/A n/A n/A n/A n/A n/A n/A n/A n/A
78% 77%-80% 6% 93% 1% total Population 2518 79% 77%-81% 78% 77%-80% n/A 96% 4% total Population 3350 80% 78%-81%
79% 78%-80% 11% 87% 3% total Population 4197 80% 78%-81% 75% 74%-76% n/A 93% 7% total Population 5191 75% 74%-77%
82% 80%-83% 16% 80% 4% total Population 3058 82% 81%-83% 79% 77%-80% n/A 83% 17% total Population 4226 79% 77%-80%
83% 80%-85% 12% 85% 2% total Population 1020 83% 81%-85% 83% 80%-85% n/A 92% 8% total Population 1365 82% 80%-84%
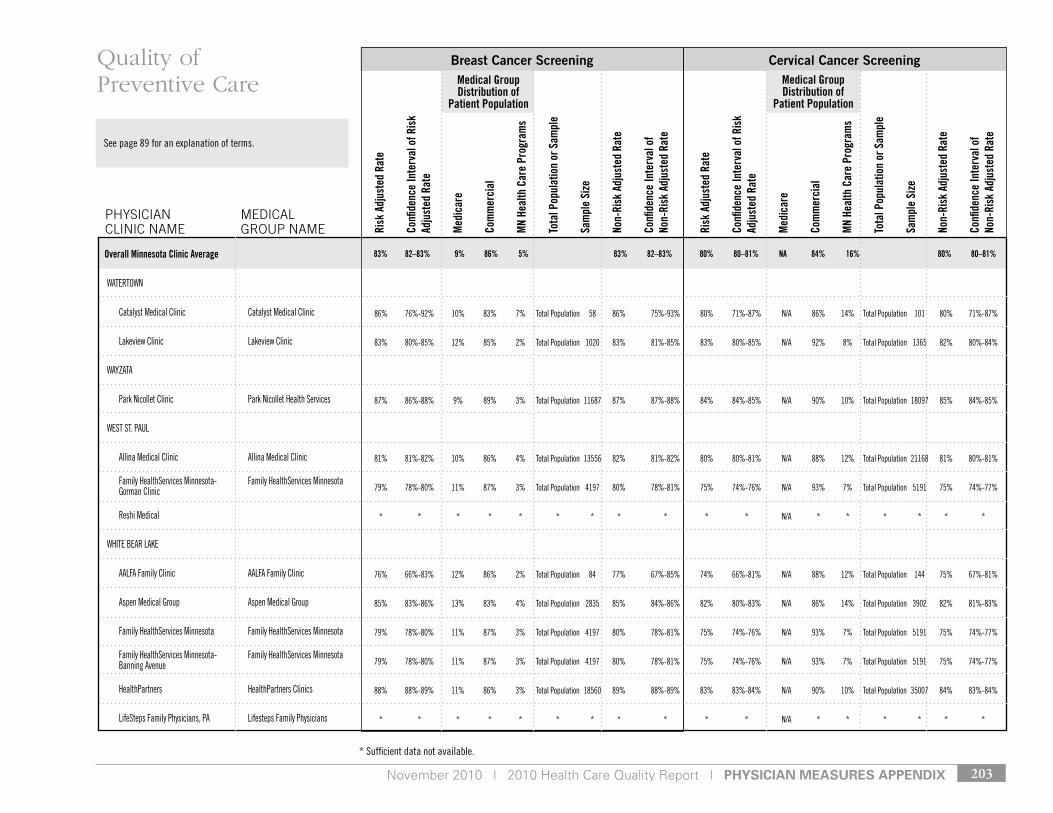
November 2010 | 2010 Health Care Quality Report | pHysiCian Measures appenDiX 203
* sufficient data not available.
see page 89 for an explanation of terms.
Medical Group Distribution of
Patient Population
Medical Group Distribution of
Patient Population
Risk
Adj
uste
d Ra
te
Confi
denc
e In
terv
al o
f Ris
k Ad
just
ed R
ate
Med
icar
e
Com
mer
cial
MN
Heal
th C
are
Prog
ram
s
Tota
l Pop
ulat
ion
or S
ampl
e
Sam
ple
Size
Non-
Risk
Adj
uste
d Ra
te
Confi
denc
e In
terv
al o
f No
n-Ri
sk A
djus
ted
Rate
Risk
Adj
uste
d Ra
te
Confi
denc
e In
terv
al o
f Ris
k Ad
just
ed R
ate
Med
icar
e
Com
mer
cial
MN
Heal
th C
are
Prog
ram
s
Tota
l Pop
ulat
ion
or S
ampl
e
Sam
ple
Size
Non-
Risk
Adj
uste
d Ra
te
Confi
denc
e In
terv
al o
f No
n-Ri
sk A
djus
ted
Rate
Breast Cancer Screening Cervical Cancer Screening
PHySIcIAN cLINIc NAME
MEdIcAL GrOuP NAME
Quality of Preventive Care
83% 82–83% 9% 86% 5% 83% 82–83% 80% 80–81% NA 84% 16% 80% 80–81%Overall Minnesota Clinic Average
WAtertoWn
Catalyst Medical Clinic Catalyst Medical Clinic
lakeview Clinic lakeview Clinic
WAyzAtA
Park nicollet Clinic Park nicollet Health services
West st. PAul
Allina Medical Clinic Allina Medical Clinic
Family Healthservices Minnesota- Family Healthservices Minnesota gorman Clinic
reshi Medical
WHIte BeAr lAke
AAlFA Family Clinic AAlFA Family Clinic
Aspen Medical group Aspen Medical group
Family Healthservices Minnesota Family Healthservices Minnesota
Family Healthservices Minnesota- Family Healthservices Minnesota Banning Avenue
HealthPartners HealthPartners Clinics
lifesteps Family Physicians, PA lifesteps Family Physicians
86% 76%-92% 10% 83% 7% total Population 58 86% 75%-93% 80% 71%-87% n/A 86% 14% total Population 101 80% 71%-87%
83% 80%-85% 12% 85% 2% total Population 1020 83% 81%-85% 83% 80%-85% n/A 92% 8% total Population 1365 82% 80%-84%
87% 86%-88% 9% 89% 3% total Population 11687 87% 87%-88% 84% 84%-85% n/A 90% 10% total Population 18097 85% 84%-85%
81% 81%-82% 10% 86% 4% total Population 13556 82% 81%-82% 80% 80%-81% n/A 88% 12% total Population 21168 81% 80%-81%
79% 78%-80% 11% 87% 3% total Population 4197 80% 78%-81% 75% 74%-76% n/A 93% 7% total Population 5191 75% 74%-77%
* * * * * * * * * * * n/A * * * * * *
76% 66%-83% 12% 86% 2% total Population 84 77% 67%-85% 74% 66%-81% n/A 88% 12% total Population 144 75% 67%-81%
85% 83%-86% 13% 83% 4% total Population 2835 85% 84%-86% 82% 80%-83% n/A 86% 14% total Population 3902 82% 81%-83%
79% 78%-80% 11% 87% 3% total Population 4197 80% 78%-81% 75% 74%-76% n/A 93% 7% total Population 5191 75% 74%-77%
79% 78%-80% 11% 87% 3% total Population 4197 80% 78%-81% 75% 74%-76% n/A 93% 7% total Population 5191 75% 74%-77%
88% 88%-89% 11% 86% 3% total Population 18560 89% 88%-89% 83% 83%-84% n/A 90% 10% total Population 35007 84% 83%-84%
* * * * * * * * * * * n/A * * * * * *
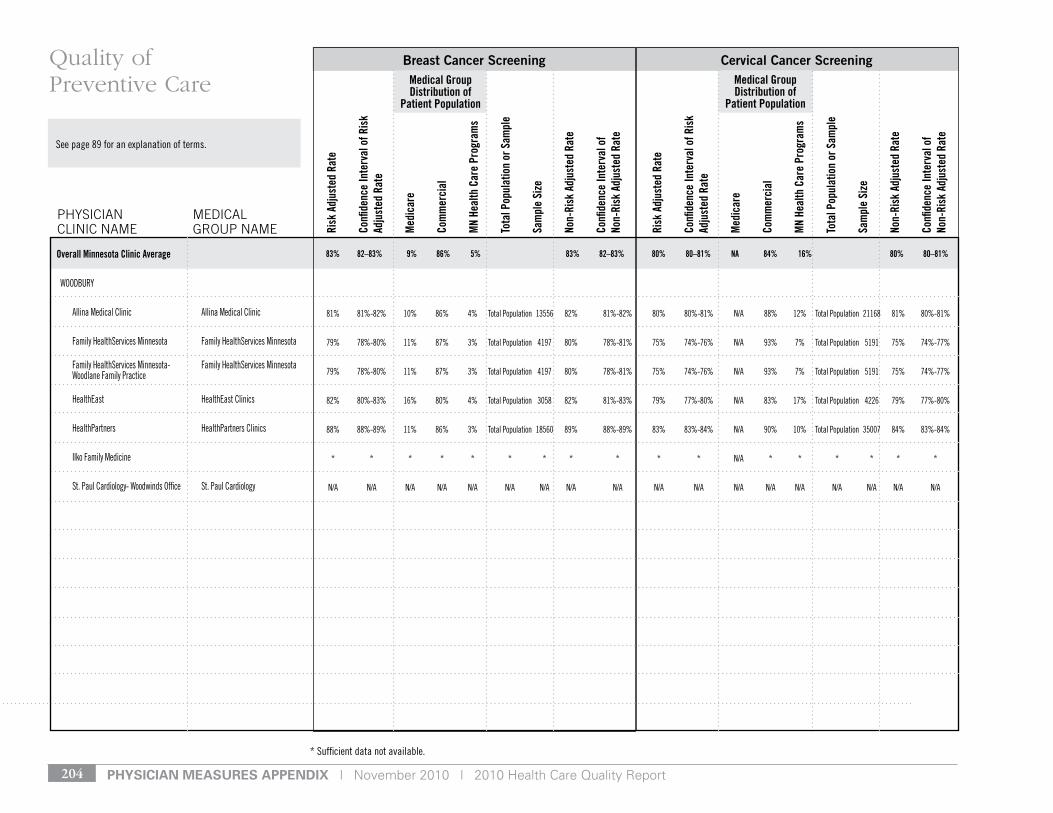
pHysiCian Measures appenDiX | November 2010 | 2010 Health Care Quality Report204
* sufficient data not available.
see page 89 for an explanation of terms.
Medical Group Distribution of
Patient Population
Medical Group Distribution of
Patient Population
Risk
Adj
uste
d Ra
te
Confi
denc
e In
terv
al o
f Ris
k Ad
just
ed R
ate
Med
icar
e
Com
mer
cial
MN
Heal
th C
are
Prog
ram
s
Tota
l Pop
ulat
ion
or S
ampl
e
Sam
ple
Size
Non-
Risk
Adj
uste
d Ra
te
Confi
denc
e In
terv
al o
f No
n-Ri
sk A
djus
ted
Rate
Risk
Adj
uste
d Ra
te
Confi
denc
e In
terv
al o
f Ris
k Ad
just
ed R
ate
Med
icar
e
Com
mer
cial
MN
Heal
th C
are
Prog
ram
s
Tota
l Pop
ulat
ion
or S
ampl
e
Sam
ple
Size
Non-
Risk
Adj
uste
d Ra
te
Confi
denc
e In
terv
al o
f No
n-Ri
sk A
djus
ted
Rate
Breast Cancer Screening Cervical Cancer Screening
PHySIcIAN cLINIc NAME
MEdIcAL GrOuP NAME
Quality of Preventive Care
83% 82–83% 9% 86% 5% 83% 82–83% 80% 80–81% NA 84% 16% 80% 80–81%Overall Minnesota Clinic Average
WoodBury
Allina Medical Clinic Allina Medical Clinic
Family Healthservices Minnesota Family Healthservices Minnesota
Family Healthservices Minnesota- Family Healthservices Minnesota Woodlane Family Practice
Healtheast Healtheast Clinics
HealthPartners HealthPartners Clinics
Ilko Family Medicine
st. Paul Cardiology- Woodwinds office st. Paul Cardiology
81% 81%-82% 10% 86% 4% total Population 13556 82% 81%-82% 80% 80%-81% n/A 88% 12% total Population 21168 81% 80%-81%
79% 78%-80% 11% 87% 3% total Population 4197 80% 78%-81% 75% 74%-76% n/A 93% 7% total Population 5191 75% 74%-77%
79% 78%-80% 11% 87% 3% total Population 4197 80% 78%-81% 75% 74%-76% n/A 93% 7% total Population 5191 75% 74%-77%
82% 80%-83% 16% 80% 4% total Population 3058 82% 81%-83% 79% 77%-80% n/A 83% 17% total Population 4226 79% 77%-80%
88% 88%-89% 11% 86% 3% total Population 18560 89% 88%-89% 83% 83%-84% n/A 90% 10% total Population 35007 84% 83%-84%
* * * * * * * * * * * n/A * * * * * *
n/A n/A n/A n/A n/A n/A n/A n/A n/A n/A n/A n/A n/A n/A n/A n/A n/A n/A
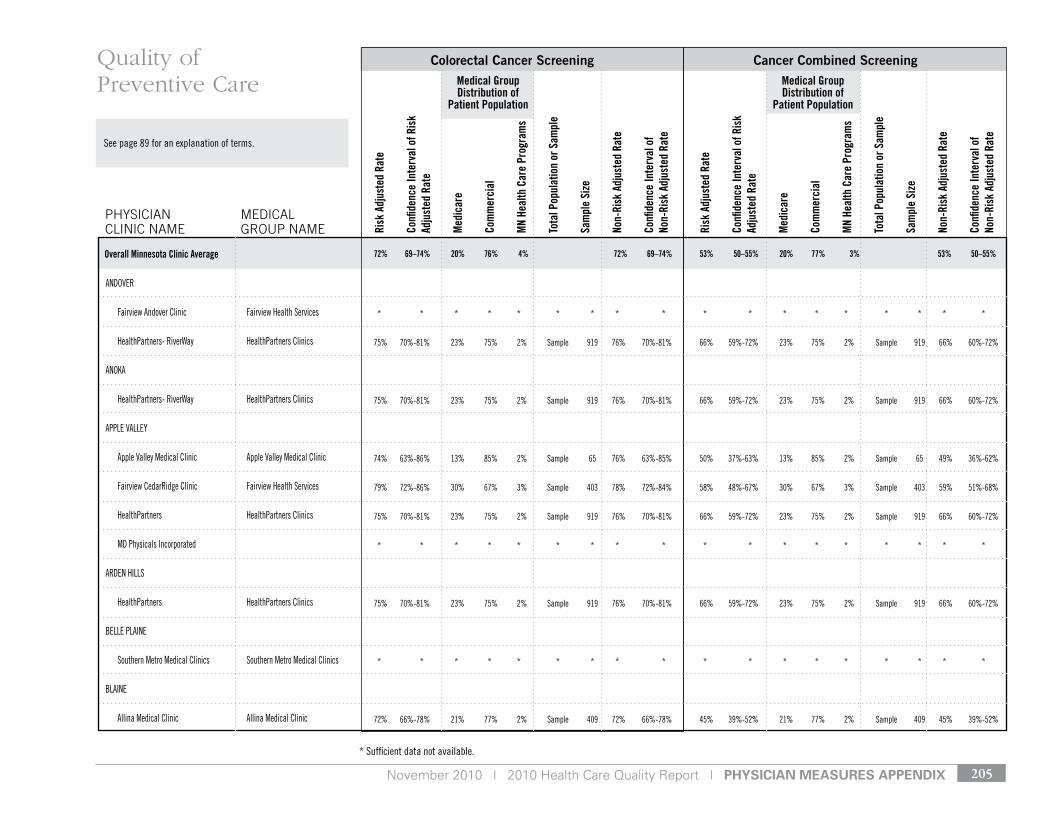
November 2010 | 2010 Health Care Quality Report | pHysiCian Measures appenDiX 205
* sufficient data not available.
see page 89 for an explanation of terms.
Medical Group Distribution of
Patient Population
Medical Group Distribution of
Patient Population
Risk
Adj
uste
d Ra
te
Confi
denc
e In
terv
al o
f Ris
k Ad
just
ed R
ate
Med
icar
e
Com
mer
cial
MN
Heal
th C
are
Prog
ram
s
Tota
l Pop
ulat
ion
or S
ampl
e
Sam
ple
Size
Non-
Risk
Adj
uste
d Ra
te
Confi
denc
e In
terv
al o
f No
n-Ri
sk A
djus
ted
Rate
Risk
Adj
uste
d Ra
te
Confi
denc
e In
terv
al o
f Ris
k Ad
just
ed R
ate
Med
icar
e
Com
mer
cial
MN
Heal
th C
are
Prog
ram
s
Tota
l Pop
ulat
ion
or S
ampl
e
Sam
ple
Size
Non-
Risk
Adj
uste
d Ra
te
Confi
denc
e In
terv
al o
f No
n-Ri
sk A
djus
ted
Rate
Colorectal Cancer Screening Cancer Combined Screening
PHySIcIAN cLINIc NAME
MEdIcAL GrOuP NAME
Quality of Preventive Care
72% 69–74% 20% 76% 4% 72% 69–74% 53% 50–55% 20% 77% 3% 53% 50–55%Overall Minnesota Clinic Average
Andover
Fairview Andover Clinic Fairview Health services
HealthPartners- riverWay HealthPartners Clinics
AnokA
HealthPartners- riverWay HealthPartners Clinics
APPle vAlley
Apple valley Medical Clinic Apple valley Medical Clinic
Fairview Cedarridge Clinic Fairview Health services
HealthPartners HealthPartners Clinics
Md Physicals Incorporated
Arden HIlls
HealthPartners HealthPartners Clinics
Belle PlAIne
southern Metro Medical Clinics southern Metro Medical Clinics
BlAIne
Allina Medical Clinic Allina Medical Clinic
* * * * * * * * * * * * * * * * * *
75% 70%-81% 23% 75% 2% sample 919 76% 70%-81% 66% 59%-72% 23% 75% 2% sample 919 66% 60%-72%
75% 70%-81% 23% 75% 2% sample 919 76% 70%-81% 66% 59%-72% 23% 75% 2% sample 919 66% 60%-72%
74% 63%-86% 13% 85% 2% sample 65 76% 63%-85% 50% 37%-63% 13% 85% 2% sample 65 49% 36%-62%
79% 72%-86% 30% 67% 3% sample 403 78% 72%-84% 58% 48%-67% 30% 67% 3% sample 403 59% 51%-68%
75% 70%-81% 23% 75% 2% sample 919 76% 70%-81% 66% 59%-72% 23% 75% 2% sample 919 66% 60%-72%
* * * * * * * * * * * * * * * * * *
75% 70%-81% 23% 75% 2% sample 919 76% 70%-81% 66% 59%-72% 23% 75% 2% sample 919 66% 60%-72%
* * * * * * * * * * * * * * * * * *
72% 66%-78% 21% 77% 2% sample 409 72% 66%-78% 45% 39%-52% 21% 77% 2% sample 409 45% 39%-52%
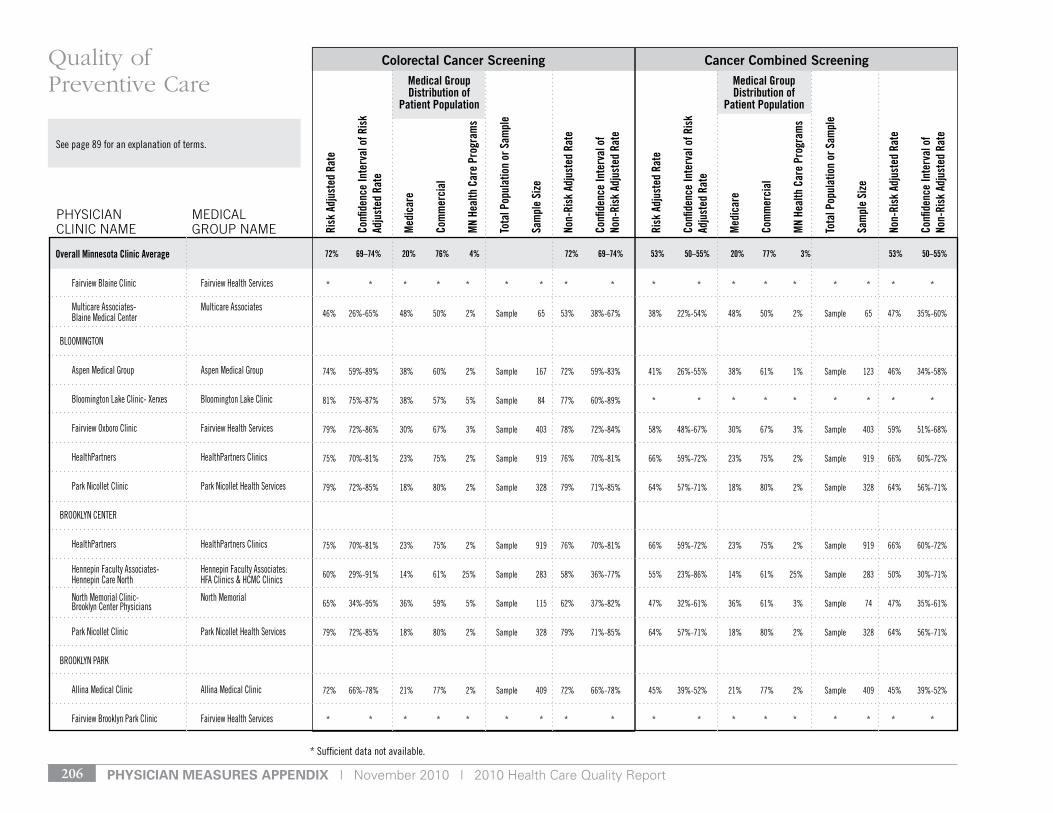
pHysiCian Measures appenDiX | November 2010 | 2010 Health Care Quality Report206
* sufficient data not available.
see page 89 for an explanation of terms.
Medical Group Distribution of
Patient Population
Medical Group Distribution of
Patient Population
Risk
Adj
uste
d Ra
te
Confi
denc
e In
terv
al o
f Ris
k Ad
just
ed R
ate
Med
icar
e
Com
mer
cial
MN
Heal
th C
are
Prog
ram
s
Tota
l Pop
ulat
ion
or S
ampl
e
Sam
ple
Size
Non-
Risk
Adj
uste
d Ra
te
Confi
denc
e In
terv
al o
f No
n-Ri
sk A
djus
ted
Rate
Risk
Adj
uste
d Ra
te
Confi
denc
e In
terv
al o
f Ris
k Ad
just
ed R
ate
Med
icar
e
Com
mer
cial
MN
Heal
th C
are
Prog
ram
s
Tota
l Pop
ulat
ion
or S
ampl
e
Sam
ple
Size
Non-
Risk
Adj
uste
d Ra
te
Confi
denc
e In
terv
al o
f No
n-Ri
sk A
djus
ted
Rate
Colorectal Cancer Screening Cancer Combined Screening
PHySIcIAN cLINIc NAME
MEdIcAL GrOuP NAME
Quality of Preventive Care
72% 69–74% 20% 76% 4% 72% 69–74% 53% 50–55% 20% 77% 3% 53% 50–55%Overall Minnesota Clinic Average
Fairview Blaine Clinic Fairview Health services
Multicare Associates- Multicare Associates Blaine Medical Center
BlooMIngton
Aspen Medical group Aspen Medical group
Bloomington lake Clinic- Xerxes Bloomington lake Clinic
Fairview oxboro Clinic Fairview Health services
HealthPartners HealthPartners Clinics
Park nicollet Clinic Park nicollet Health services
Brooklyn Center
HealthPartners HealthPartners Clinics
Hennepin Faculty Associates- Hennepin Faculty Associates: Hennepin Care north HFA Clinics & HCMC Clinics
north Memorial Clinic- north Memorial Brooklyn Center Physicians
Park nicollet Clinic Park nicollet Health services
Brooklyn PArk
Allina Medical Clinic Allina Medical Clinic
Fairview Brooklyn Park Clinic Fairview Health services
* * * * * * * * * * * * * * * * * *
46% 26%-65% 48% 50% 2% sample 65 53% 38%-67% 38% 22%-54% 48% 50% 2% sample 65 47% 35%-60%
74% 59%-89% 38% 60% 2% sample 167 72% 59%-83% 41% 26%-55% 38% 61% 1% sample 123 46% 34%-58%
81% 75%-87% 38% 57% 5% sample 84 77% 60%-89% * * * * * * * * *
79% 72%-86% 30% 67% 3% sample 403 78% 72%-84% 58% 48%-67% 30% 67% 3% sample 403 59% 51%-68%
75% 70%-81% 23% 75% 2% sample 919 76% 70%-81% 66% 59%-72% 23% 75% 2% sample 919 66% 60%-72%
79% 72%-85% 18% 80% 2% sample 328 79% 71%-85% 64% 57%-71% 18% 80% 2% sample 328 64% 56%-71%
75% 70%-81% 23% 75% 2% sample 919 76% 70%-81% 66% 59%-72% 23% 75% 2% sample 919 66% 60%-72%
60% 29%-91% 14% 61% 25% sample 283 58% 36%-77% 55% 23%-86% 14% 61% 25% sample 283 50% 30%-71%
65% 34%-95% 36% 59% 5% sample 115 62% 37%-82% 47% 32%-61% 36% 61% 3% sample 74 47% 35%-61%
79% 72%-85% 18% 80% 2% sample 328 79% 71%-85% 64% 57%-71% 18% 80% 2% sample 328 64% 56%-71%
72% 66%-78% 21% 77% 2% sample 409 72% 66%-78% 45% 39%-52% 21% 77% 2% sample 409 45% 39%-52%
* * * * * * * * * * * * * * * * * *
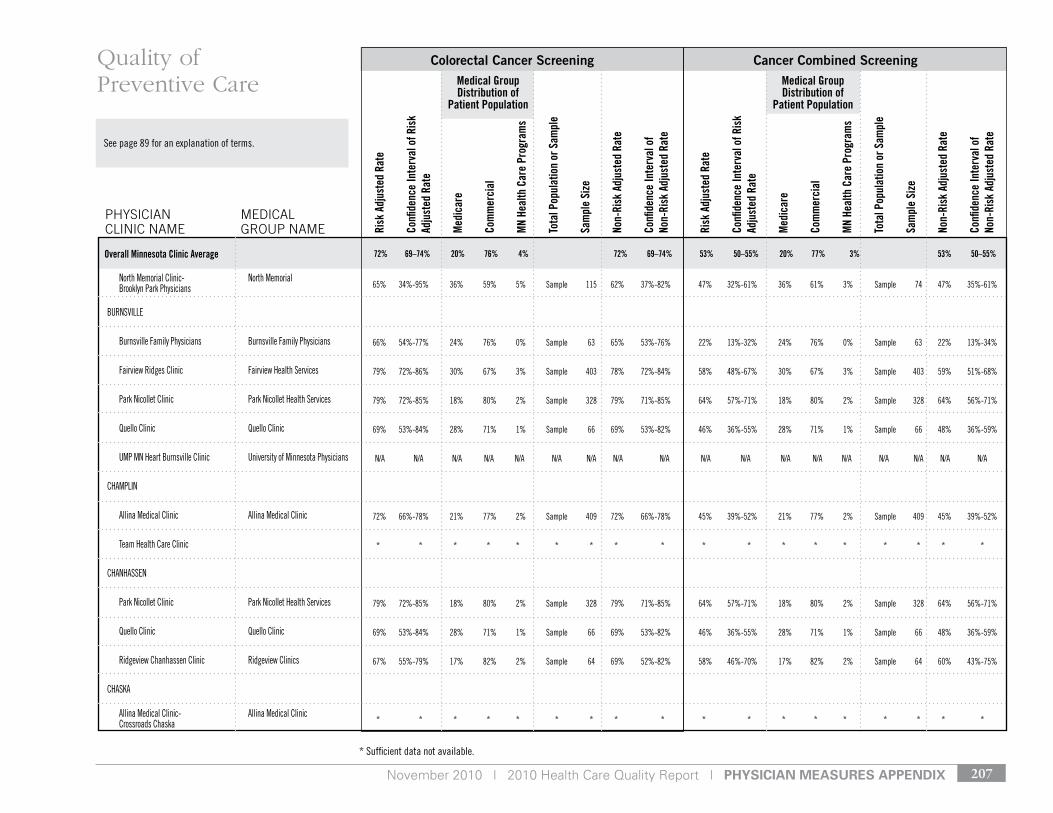
November 2010 | 2010 Health Care Quality Report | pHysiCian Measures appenDiX 207
* sufficient data not available.
see page 89 for an explanation of terms.
Medical Group Distribution of
Patient Population
Medical Group Distribution of
Patient Population
Risk
Adj
uste
d Ra
te
Confi
denc
e In
terv
al o
f Ris
k Ad
just
ed R
ate
Med
icar
e
Com
mer
cial
MN
Heal
th C
are
Prog
ram
s
Tota
l Pop
ulat
ion
or S
ampl
e
Sam
ple
Size
Non-
Risk
Adj
uste
d Ra
te
Confi
denc
e In
terv
al o
f No
n-Ri
sk A
djus
ted
Rate
Risk
Adj
uste
d Ra
te
Confi
denc
e In
terv
al o
f Ris
k Ad
just
ed R
ate
Med
icar
e
Com
mer
cial
MN
Heal
th C
are
Prog
ram
s
Tota
l Pop
ulat
ion
or S
ampl
e
Sam
ple
Size
Non-
Risk
Adj
uste
d Ra
te
Confi
denc
e In
terv
al o
f No
n-Ri
sk A
djus
ted
Rate
Colorectal Cancer Screening Cancer Combined Screening
PHySIcIAN cLINIc NAME
MEdIcAL GrOuP NAME
Quality of Preventive Care
72% 69–74% 20% 76% 4% 72% 69–74% 53% 50–55% 20% 77% 3% 53% 50–55%Overall Minnesota Clinic Average
north Memorial Clinic- north Memorial Brooklyn Park Physicians
BurnsvIlle
Burnsville Family Physicians Burnsville Family Physicians
Fairview ridges Clinic Fairview Health services
Park nicollet Clinic Park nicollet Health services
Quello Clinic Quello Clinic
uMP Mn Heart Burnsville Clinic university of Minnesota Physicians
CHAMPlIn
Allina Medical Clinic Allina Medical Clinic
team Health Care Clinic
CHAnHAssen
Park nicollet Clinic Park nicollet Health services
Quello Clinic Quello Clinic
ridgeview Chanhassen Clinic ridgeview Clinics
CHAskA
Allina Medical Clinic- Allina Medical Clinic Crossroads Chaska
65% 34%-95% 36% 59% 5% sample 115 62% 37%-82% 47% 32%-61% 36% 61% 3% sample 74 47% 35%-61%
66% 54%-77% 24% 76% 0% sample 63 65% 53%-76% 22% 13%-32% 24% 76% 0% sample 63 22% 13%-34%
79% 72%-86% 30% 67% 3% sample 403 78% 72%-84% 58% 48%-67% 30% 67% 3% sample 403 59% 51%-68%
79% 72%-85% 18% 80% 2% sample 328 79% 71%-85% 64% 57%-71% 18% 80% 2% sample 328 64% 56%-71%
69% 53%-84% 28% 71% 1% sample 66 69% 53%-82% 46% 36%-55% 28% 71% 1% sample 66 48% 36%-59%
n/A n/A n/A n/A n/A n/A n/A n/A n/A n/A n/A n/A n/A n/A n/A n/A n/A n/A
72% 66%-78% 21% 77% 2% sample 409 72% 66%-78% 45% 39%-52% 21% 77% 2% sample 409 45% 39%-52%
* * * * * * * * * * * * * * * * * *
79% 72%-85% 18% 80% 2% sample 328 79% 71%-85% 64% 57%-71% 18% 80% 2% sample 328 64% 56%-71%
69% 53%-84% 28% 71% 1% sample 66 69% 53%-82% 46% 36%-55% 28% 71% 1% sample 66 48% 36%-59%
67% 55%-79% 17% 82% 2% sample 64 69% 52%-82% 58% 46%-70% 17% 82% 2% sample 64 60% 43%-75%
* * * * * * * * * * * * * * * * * *

pHysiCian Measures appenDiX | November 2010 | 2010 Health Care Quality Report208
* sufficient data not available.
see page 89 for an explanation of terms.
Medical Group Distribution of
Patient Population
Medical Group Distribution of
Patient Population
Risk
Adj
uste
d Ra
te
Confi
denc
e In
terv
al o
f Ris
k Ad
just
ed R
ate
Med
icar
e
Com
mer
cial
MN
Heal
th C
are
Prog
ram
s
Tota
l Pop
ulat
ion
or S
ampl
e
Sam
ple
Size
Non-
Risk
Adj
uste
d Ra
te
Confi
denc
e In
terv
al o
f No
n-Ri
sk A
djus
ted
Rate
Risk
Adj
uste
d Ra
te
Confi
denc
e In
terv
al o
f Ris
k Ad
just
ed R
ate
Med
icar
e
Com
mer
cial
MN
Heal
th C
are
Prog
ram
s
Tota
l Pop
ulat
ion
or S
ampl
e
Sam
ple
Size
Non-
Risk
Adj
uste
d Ra
te
Confi
denc
e In
terv
al o
f No
n-Ri
sk A
djus
ted
Rate
Colorectal Cancer Screening Cancer Combined Screening
PHySIcIAN cLINIc NAME
MEdIcAL GrOuP NAME
Quality of Preventive Care
72% 69–74% 20% 76% 4% 72% 69–74% 53% 50–55% 20% 77% 3% 53% 50–55%Overall Minnesota Clinic Average
Fairview Jonathan Clinic Fairview Health services
lakeview Clinic lakeview Clinic
valley Family Practice valley Family Practice
ColuMBIA HeIgHts
Fairview Columbia Heights Clinic Fairview Health services
Coon rAPIds
Allina Health system- Allina Health system Metropolitan Heart & vascular Institute
Allina Health system- Allina Health system Midwest Internal Medicine
Allina Medical Clinic Allina Medical Clinic
Anoka Area Family Medicine Clinic
dr. Jerrol noller dr. Jerrol noller
HealthPartners HealthPartners Clinics
twin Cities Heart and lung
CottAge grove
Allina Medical Clinic Allina Medical Clinic
Healtheast Healtheast Clinics
79% 72%-86% 30% 67% 3% sample 403 78% 72%-84% 58% 48%-67% 30% 67% 3% sample 403 59% 51%-68%
94% 90%-98% 27% 71% 3% sample 64 94% 84%-98% * * * * * * * * *
* * * * * * * * * * * * * * * * * *
* * * * * * * * * * * * * * * * * *
n/A n/A n/A n/A n/A n/A n/A n/A n/A n/A n/A n/A n/A n/A n/A n/A n/A n/A
43% 33%-53% 21% 75% 4% sample 117 43% 32%-56% 36% 26%-46% 21% 76% 3% sample 105 36% 26%-48%
72% 66%-78% 21% 77% 2% sample 409 72% 66%-78% 45% 39%-52% 21% 77% 2% sample 409 45% 39%-52%
* * * * * * * * * * * * * * * * * *
* * * * * * * * * * * * * * * * * *
75% 70%-81% 23% 75% 2% sample 919 76% 70%-81% 66% 59%-72% 23% 75% 2% sample 919 66% 60%-72%
n/A n/A n/A n/A n/A n/A n/A n/A n/A n/A n/A n/A n/A n/A n/A n/A n/A n/A
72% 66%-78% 21% 77% 2% sample 409 72% 66%-78% 45% 39%-52% 21% 77% 2% sample 409 45% 39%-52%
85% 77%-94% 33% 65% 2% sample 136 84% 75%-91% 55% 37%-73% 33% 65% 1% sample 88 58% 43%-72%
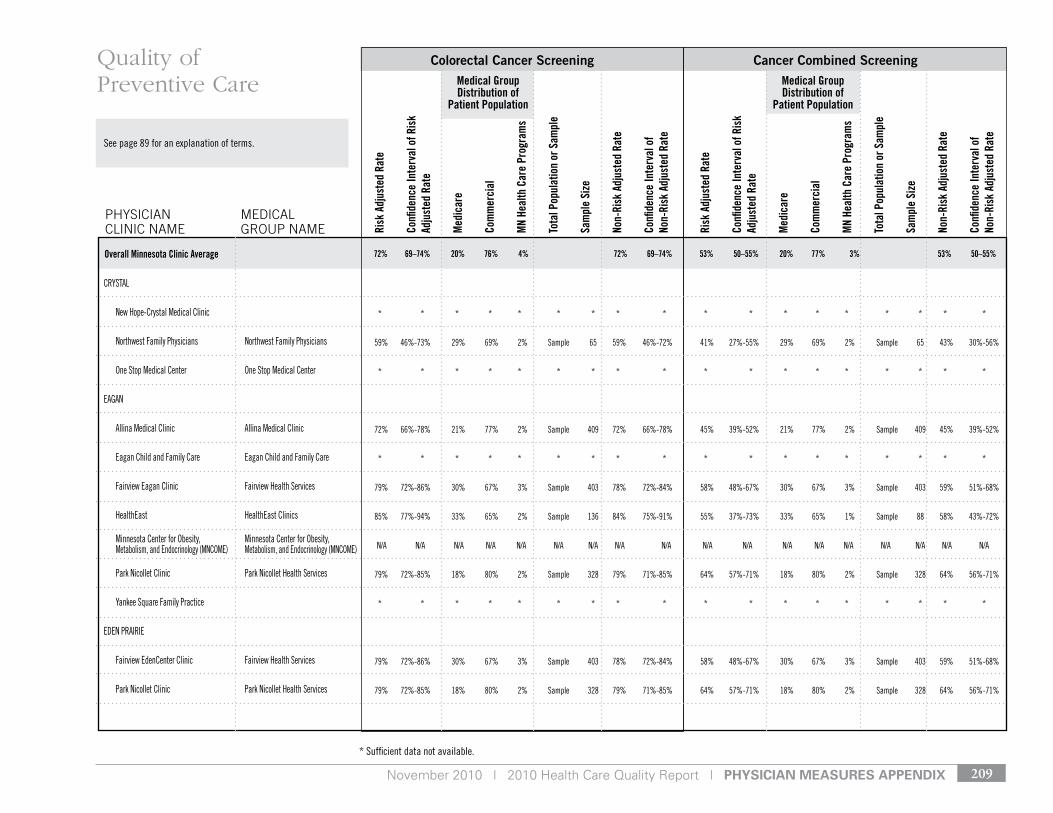
November 2010 | 2010 Health Care Quality Report | pHysiCian Measures appenDiX 209
* sufficient data not available.
see page 89 for an explanation of terms.
Medical Group Distribution of
Patient Population
Medical Group Distribution of
Patient Population
Risk
Adj
uste
d Ra
te
Confi
denc
e In
terv
al o
f Ris
k Ad
just
ed R
ate
Med
icar
e
Com
mer
cial
MN
Heal
th C
are
Prog
ram
s
Tota
l Pop
ulat
ion
or S
ampl
e
Sam
ple
Size
Non-
Risk
Adj
uste
d Ra
te
Confi
denc
e In
terv
al o
f No
n-Ri
sk A
djus
ted
Rate
Risk
Adj
uste
d Ra
te
Confi
denc
e In
terv
al o
f Ris
k Ad
just
ed R
ate
Med
icar
e
Com
mer
cial
MN
Heal
th C
are
Prog
ram
s
Tota
l Pop
ulat
ion
or S
ampl
e
Sam
ple
Size
Non-
Risk
Adj
uste
d Ra
te
Confi
denc
e In
terv
al o
f No
n-Ri
sk A
djus
ted
Rate
Colorectal Cancer Screening Cancer Combined Screening
PHySIcIAN cLINIc NAME
MEdIcAL GrOuP NAME
Quality of Preventive Care
72% 69–74% 20% 76% 4% 72% 69–74% 53% 50–55% 20% 77% 3% 53% 50–55%Overall Minnesota Clinic Average
CrystAl
new Hope-Crystal Medical Clinic
northwest Family Physicians northwest Family Physicians
one stop Medical Center one stop Medical Center
eAgAn
Allina Medical Clinic Allina Medical Clinic
eagan Child and Family Care eagan Child and Family Care
Fairview eagan Clinic Fairview Health services
Healtheast Healtheast Clinics
Minnesota Center for obesity, Minnesota Center for obesity, Metabolism, and endocrinology (MnCoMe) Metabolism, and endocrinology (MnCoMe)
Park nicollet Clinic Park nicollet Health services
yankee square Family Practice
eden PrAIrIe
Fairview edenCenter Clinic Fairview Health services
Park nicollet Clinic Park nicollet Health services
* * * * * * * * * * * * * * * * * *
59% 46%-73% 29% 69% 2% sample 65 59% 46%-72% 41% 27%-55% 29% 69% 2% sample 65 43% 30%-56%
* * * * * * * * * * * * * * * * * *
72% 66%-78% 21% 77% 2% sample 409 72% 66%-78% 45% 39%-52% 21% 77% 2% sample 409 45% 39%-52%
* * * * * * * * * * * * * * * * * *
79% 72%-86% 30% 67% 3% sample 403 78% 72%-84% 58% 48%-67% 30% 67% 3% sample 403 59% 51%-68%
85% 77%-94% 33% 65% 2% sample 136 84% 75%-91% 55% 37%-73% 33% 65% 1% sample 88 58% 43%-72%
n/A n/A n/A n/A n/A n/A n/A n/A n/A n/A n/A n/A n/A n/A n/A n/A n/A n/A
79% 72%-85% 18% 80% 2% sample 328 79% 71%-85% 64% 57%-71% 18% 80% 2% sample 328 64% 56%-71%
* * * * * * * * * * * * * * * * * *
79% 72%-86% 30% 67% 3% sample 403 78% 72%-84% 58% 48%-67% 30% 67% 3% sample 403 59% 51%-68%
79% 72%-85% 18% 80% 2% sample 328 79% 71%-85% 64% 57%-71% 18% 80% 2% sample 328 64% 56%-71%
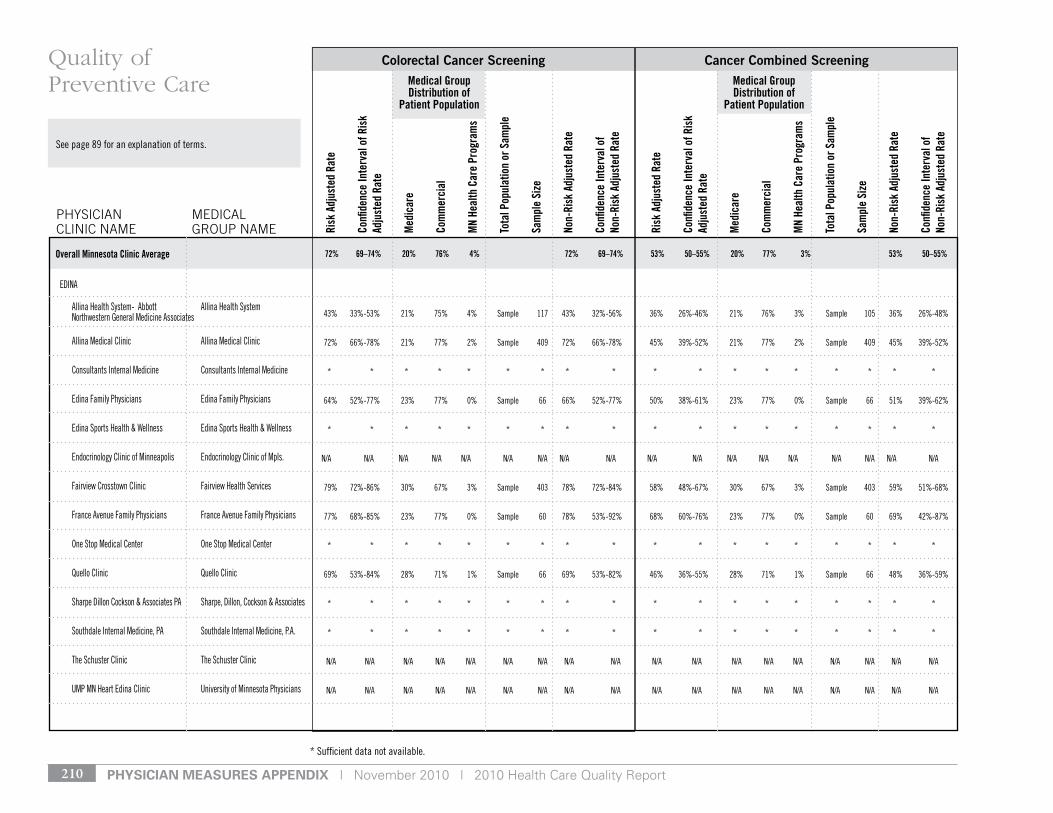
pHysiCian Measures appenDiX | November 2010 | 2010 Health Care Quality Report210
* sufficient data not available.
see page 89 for an explanation of terms.
Medical Group Distribution of
Patient Population
Medical Group Distribution of
Patient Population
Risk
Adj
uste
d Ra
te
Confi
denc
e In
terv
al o
f Ris
k Ad
just
ed R
ate
Med
icar
e
Com
mer
cial
MN
Heal
th C
are
Prog
ram
s
Tota
l Pop
ulat
ion
or S
ampl
e
Sam
ple
Size
Non-
Risk
Adj
uste
d Ra
te
Confi
denc
e In
terv
al o
f No
n-Ri
sk A
djus
ted
Rate
Risk
Adj
uste
d Ra
te
Confi
denc
e In
terv
al o
f Ris
k Ad
just
ed R
ate
Med
icar
e
Com
mer
cial
MN
Heal
th C
are
Prog
ram
s
Tota
l Pop
ulat
ion
or S
ampl
e
Sam
ple
Size
Non-
Risk
Adj
uste
d Ra
te
Confi
denc
e In
terv
al o
f No
n-Ri
sk A
djus
ted
Rate
Colorectal Cancer Screening Cancer Combined Screening
PHySIcIAN cLINIc NAME
MEdIcAL GrOuP NAME
Quality of Preventive Care
72% 69–74% 20% 76% 4% 72% 69–74% 53% 50–55% 20% 77% 3% 53% 50–55%Overall Minnesota Clinic Average
edInA
Allina Health system- Abbott Allina Health system northwestern general Medicine Associates
Allina Medical Clinic Allina Medical Clinic
Consultants Internal Medicine Consultants Internal Medicine
edina Family Physicians edina Family Physicians
edina sports Health & Wellness edina sports Health & Wellness
endocrinology Clinic of Minneapolis endocrinology Clinic of Mpls.
Fairview Crosstown Clinic Fairview Health services
France Avenue Family Physicians France Avenue Family Physicians
one stop Medical Center one stop Medical Center
Quello Clinic Quello Clinic
sharpe dillon Cockson & Associates PA sharpe, dillon, Cockson & Associates
southdale Internal Medicine, PA southdale Internal Medicine, P.A.
the schuster Clinic the schuster Clinic
uMP Mn Heart edina Clinic university of Minnesota Physicians
43% 33%-53% 21% 75% 4% sample 117 43% 32%-56% 36% 26%-46% 21% 76% 3% sample 105 36% 26%-48%
72% 66%-78% 21% 77% 2% sample 409 72% 66%-78% 45% 39%-52% 21% 77% 2% sample 409 45% 39%-52%
* * * * * * * * * * * * * * * * * *
64% 52%-77% 23% 77% 0% sample 66 66% 52%-77% 50% 38%-61% 23% 77% 0% sample 66 51% 39%-62%
* * * * * * * * * * * * * * * * * *
n/A n/A n/A n/A n/A n/A n/A n/A n/A n/A n/A n/A n/A n/A n/A n/A n/A n/A
79% 72%-86% 30% 67% 3% sample 403 78% 72%-84% 58% 48%-67% 30% 67% 3% sample 403 59% 51%-68%
77% 68%-85% 23% 77% 0% sample 60 78% 53%-92% 68% 60%-76% 23% 77% 0% sample 60 69% 42%-87%
* * * * * * * * * * * * * * * * * *
69% 53%-84% 28% 71% 1% sample 66 69% 53%-82% 46% 36%-55% 28% 71% 1% sample 66 48% 36%-59%
* * * * * * * * * * * * * * * * * *
* * * * * * * * * * * * * * * * * *
n/A n/A n/A n/A n/A n/A n/A n/A n/A n/A n/A n/A n/A n/A n/A n/A n/A n/A
n/A n/A n/A n/A n/A n/A n/A n/A n/A n/A n/A n/A n/A n/A n/A n/A n/A n/A

November 2010 | 2010 Health Care Quality Report | pHysiCian Measures appenDiX 211
* sufficient data not available.
see page 89 for an explanation of terms.
Medical Group Distribution of
Patient Population
Medical Group Distribution of
Patient Population
Risk
Adj
uste
d Ra
te
Confi
denc
e In
terv
al o
f Ris
k Ad
just
ed R
ate
Med
icar
e
Com
mer
cial
MN
Heal
th C
are
Prog
ram
s
Tota
l Pop
ulat
ion
or S
ampl
e
Sam
ple
Size
Non-
Risk
Adj
uste
d Ra
te
Confi
denc
e In
terv
al o
f No
n-Ri
sk A
djus
ted
Rate
Risk
Adj
uste
d Ra
te
Confi
denc
e In
terv
al o
f Ris
k Ad
just
ed R
ate
Med
icar
e
Com
mer
cial
MN
Heal
th C
are
Prog
ram
s
Tota
l Pop
ulat
ion
or S
ampl
e
Sam
ple
Size
Non-
Risk
Adj
uste
d Ra
te
Confi
denc
e In
terv
al o
f No
n-Ri
sk A
djus
ted
Rate
Colorectal Cancer Screening Cancer Combined Screening
PHySIcIAN cLINIc NAME
MEdIcAL GrOuP NAME
Quality of Preventive Care
72% 69–74% 20% 76% 4% 72% 69–74% 53% 50–55% 20% 77% 3% 53% 50–55%Overall Minnesota Clinic Average
eXCelsIor
ridgeview excelsior Clinic ridgeview Clinics
FArMIngton
Allina Medical Clinic Allina Medical Clinic
Fairview Farmington Clinic Fairview Health services
FamilyHealth Medical Clinic FamilyHealth Medical Clinics
Farmington Clinic Farmington Clinic
Forest lAke
Allina Medical Clinic Allina Medical Clinic
FrIdley
Fairview Fridley Clinic Fairview Health services
Multicare Associates- Multicare Associates Fridley Medical Center
golden vAlley
north Memorial Clinic- north Memorial golden valley Physicians
Park nicollet Clinic Park nicollet Health services
67% 55%-79% 17% 82% 2% sample 64 69% 52%-82% 58% 46%-70% 17% 82% 2% sample 64 60% 43%-75%
72% 66%-78% 21% 77% 2% sample 409 72% 66%-78% 45% 39%-52% 21% 77% 2% sample 409 45% 39%-52%
79% 72%-86% 30% 67% 3% sample 403 78% 72%-84% 58% 48%-67% 30% 67% 3% sample 403 59% 51%-68%
* * * * * * * * * * * * * * * * * *
* * * * * * * * * * * * * * * * * *
72% 66%-78% 21% 77% 2% sample 409 72% 66%-78% 45% 39%-52% 21% 77% 2% sample 409 45% 39%-52%
* * * * * * * * * * * * * * * * * *
46% 26%-65% 48% 50% 2% sample 65 53% 38%-67% 38% 22%-54% 48% 50% 2% sample 65 47% 35%-60%
65% 34%-95% 36% 59% 5% sample 115 62% 37%-82% 47% 32%-61% 36% 61% 3% sample 74 47% 35%-61%
79% 72%-85% 18% 80% 2% sample 328 79% 71%-85% 64% 57%-71% 18% 80% 2% sample 328 64% 56%-71%
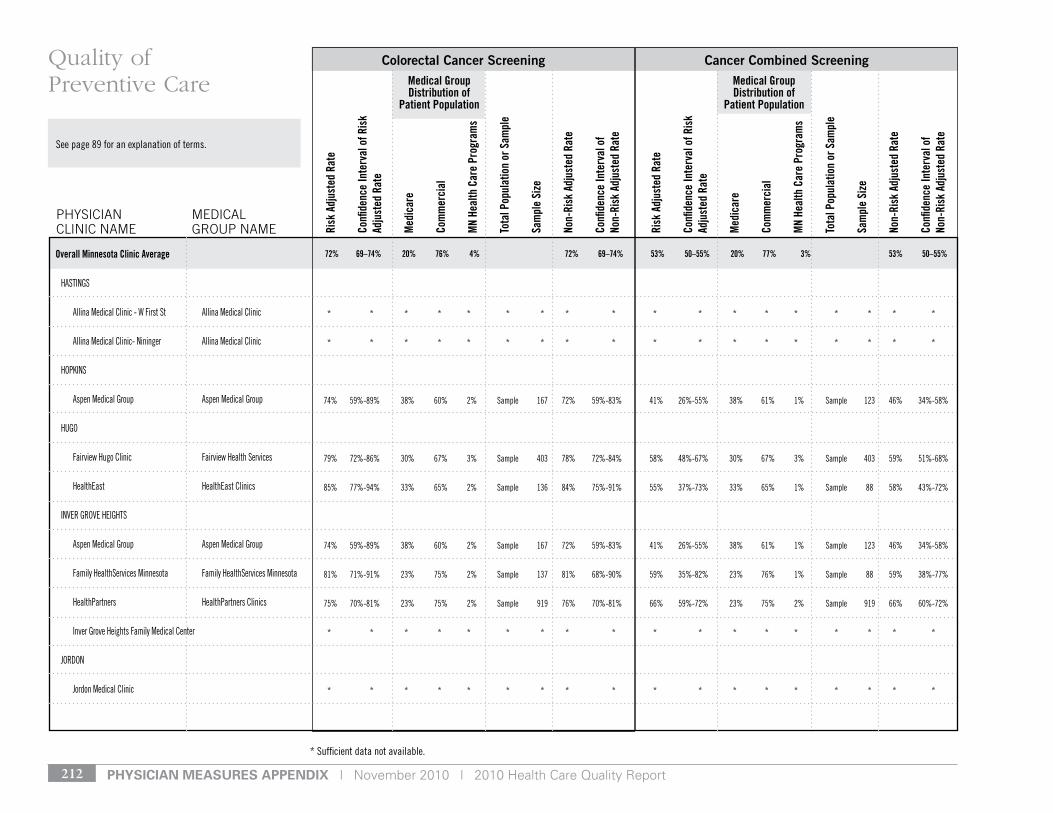
pHysiCian Measures appenDiX | November 2010 | 2010 Health Care Quality Report212
* sufficient data not available.
see page 89 for an explanation of terms.
Medical Group Distribution of
Patient Population
Medical Group Distribution of
Patient Population
Risk
Adj
uste
d Ra
te
Confi
denc
e In
terv
al o
f Ris
k Ad
just
ed R
ate
Med
icar
e
Com
mer
cial
MN
Heal
th C
are
Prog
ram
s
Tota
l Pop
ulat
ion
or S
ampl
e
Sam
ple
Size
Non-
Risk
Adj
uste
d Ra
te
Confi
denc
e In
terv
al o
f No
n-Ri
sk A
djus
ted
Rate
Risk
Adj
uste
d Ra
te
Confi
denc
e In
terv
al o
f Ris
k Ad
just
ed R
ate
Med
icar
e
Com
mer
cial
MN
Heal
th C
are
Prog
ram
s
Tota
l Pop
ulat
ion
or S
ampl
e
Sam
ple
Size
Non-
Risk
Adj
uste
d Ra
te
Confi
denc
e In
terv
al o
f No
n-Ri
sk A
djus
ted
Rate
Colorectal Cancer Screening Cancer Combined Screening
PHySIcIAN cLINIc NAME
MEdIcAL GrOuP NAME
Quality of Preventive Care
72% 69–74% 20% 76% 4% 72% 69–74% 53% 50–55% 20% 77% 3% 53% 50–55%Overall Minnesota Clinic Average
HAstIngs
Allina Medical Clinic - W First st Allina Medical Clinic
Allina Medical Clinic- nininger Allina Medical Clinic
HoPkIns
Aspen Medical group Aspen Medical group
Hugo
Fairview Hugo Clinic Fairview Health services
Healtheast Healtheast Clinics
Inver grove HeIgHts
Aspen Medical group Aspen Medical group
Family Healthservices Minnesota Family Healthservices Minnesota
HealthPartners HealthPartners Clinics
Inver grove Heights Family Medical Center
Jordon
Jordon Medical Clinic
* * * * * * * * * * * * * * * * * *
* * * * * * * * * * * * * * * * * *
74% 59%-89% 38% 60% 2% sample 167 72% 59%-83% 41% 26%-55% 38% 61% 1% sample 123 46% 34%-58%
79% 72%-86% 30% 67% 3% sample 403 78% 72%-84% 58% 48%-67% 30% 67% 3% sample 403 59% 51%-68%
85% 77%-94% 33% 65% 2% sample 136 84% 75%-91% 55% 37%-73% 33% 65% 1% sample 88 58% 43%-72%
74% 59%-89% 38% 60% 2% sample 167 72% 59%-83% 41% 26%-55% 38% 61% 1% sample 123 46% 34%-58%
81% 71%-91% 23% 75% 2% sample 137 81% 68%-90% 59% 35%-82% 23% 76% 1% sample 88 59% 38%-77%
75% 70%-81% 23% 75% 2% sample 919 76% 70%-81% 66% 59%-72% 23% 75% 2% sample 919 66% 60%-72%
* * * * * * * * * * * * * * * * * *
* * * * * * * * * * * * * * * * * *
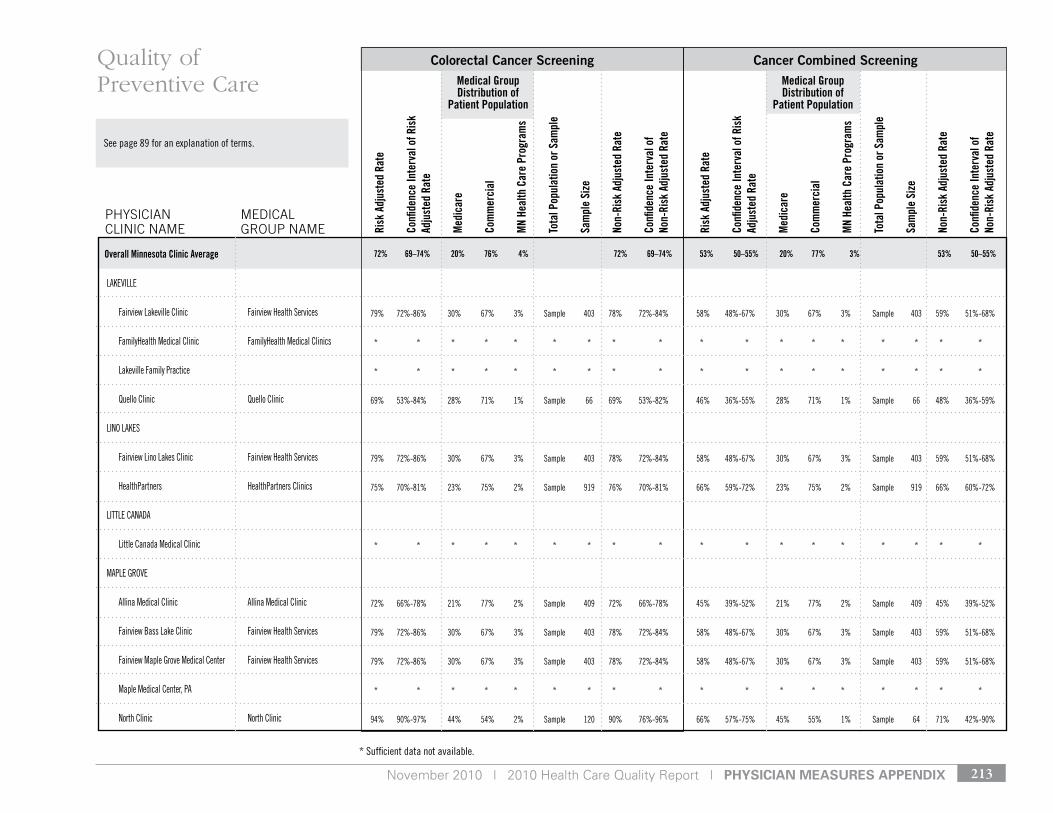
November 2010 | 2010 Health Care Quality Report | pHysiCian Measures appenDiX 213
* sufficient data not available.
see page 89 for an explanation of terms.
Medical Group Distribution of
Patient Population
Medical Group Distribution of
Patient Population
Risk
Adj
uste
d Ra
te
Confi
denc
e In
terv
al o
f Ris
k Ad
just
ed R
ate
Med
icar
e
Com
mer
cial
MN
Heal
th C
are
Prog
ram
s
Tota
l Pop
ulat
ion
or S
ampl
e
Sam
ple
Size
Non-
Risk
Adj
uste
d Ra
te
Confi
denc
e In
terv
al o
f No
n-Ri
sk A
djus
ted
Rate
Risk
Adj
uste
d Ra
te
Confi
denc
e In
terv
al o
f Ris
k Ad
just
ed R
ate
Med
icar
e
Com
mer
cial
MN
Heal
th C
are
Prog
ram
s
Tota
l Pop
ulat
ion
or S
ampl
e
Sam
ple
Size
Non-
Risk
Adj
uste
d Ra
te
Confi
denc
e In
terv
al o
f No
n-Ri
sk A
djus
ted
Rate
Colorectal Cancer Screening Cancer Combined Screening
PHySIcIAN cLINIc NAME
MEdIcAL GrOuP NAME
Quality of Preventive Care
72% 69–74% 20% 76% 4% 72% 69–74% 53% 50–55% 20% 77% 3% 53% 50–55%Overall Minnesota Clinic Average
lAkevIlle
Fairview lakeville Clinic Fairview Health services
FamilyHealth Medical Clinic FamilyHealth Medical Clinics
lakeville Family Practice
Quello Clinic Quello Clinic
lIno lAkes
Fairview lino lakes Clinic Fairview Health services
HealthPartners HealthPartners Clinics
lIttle CAnAdA
little Canada Medical Clinic
MAPle grove
Allina Medical Clinic Allina Medical Clinic
Fairview Bass lake Clinic Fairview Health services
Fairview Maple grove Medical Center Fairview Health services
Maple Medical Center, PA
north Clinic north Clinic
79% 72%-86% 30% 67% 3% sample 403 78% 72%-84% 58% 48%-67% 30% 67% 3% sample 403 59% 51%-68%
* * * * * * * * * * * * * * * * * *
* * * * * * * * * * * * * * * * * *
69% 53%-84% 28% 71% 1% sample 66 69% 53%-82% 46% 36%-55% 28% 71% 1% sample 66 48% 36%-59%
79% 72%-86% 30% 67% 3% sample 403 78% 72%-84% 58% 48%-67% 30% 67% 3% sample 403 59% 51%-68%
75% 70%-81% 23% 75% 2% sample 919 76% 70%-81% 66% 59%-72% 23% 75% 2% sample 919 66% 60%-72%
* * * * * * * * * * * * * * * * * *
72% 66%-78% 21% 77% 2% sample 409 72% 66%-78% 45% 39%-52% 21% 77% 2% sample 409 45% 39%-52%
79% 72%-86% 30% 67% 3% sample 403 78% 72%-84% 58% 48%-67% 30% 67% 3% sample 403 59% 51%-68%
79% 72%-86% 30% 67% 3% sample 403 78% 72%-84% 58% 48%-67% 30% 67% 3% sample 403 59% 51%-68%
* * * * * * * * * * * * * * * * * *
94% 90%-97% 44% 54% 2% sample 120 90% 76%-96% 66% 57%-75% 45% 55% 1% sample 64 71% 42%-90%
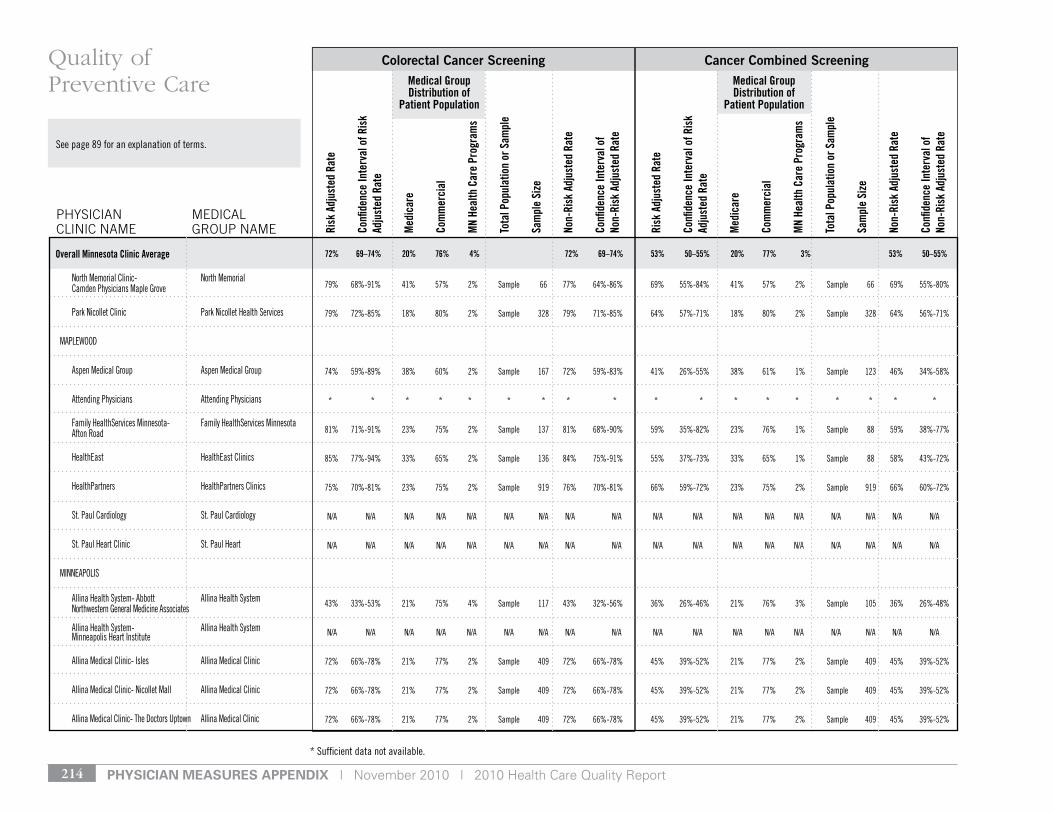
pHysiCian Measures appenDiX | November 2010 | 2010 Health Care Quality Report214
* sufficient data not available.
see page 89 for an explanation of terms.
Medical Group Distribution of
Patient Population
Medical Group Distribution of
Patient Population
Risk
Adj
uste
d Ra
te
Confi
denc
e In
terv
al o
f Ris
k Ad
just
ed R
ate
Med
icar
e
Com
mer
cial
MN
Heal
th C
are
Prog
ram
s
Tota
l Pop
ulat
ion
or S
ampl
e
Sam
ple
Size
Non-
Risk
Adj
uste
d Ra
te
Confi
denc
e In
terv
al o
f No
n-Ri
sk A
djus
ted
Rate
Risk
Adj
uste
d Ra
te
Confi
denc
e In
terv
al o
f Ris
k Ad
just
ed R
ate
Med
icar
e
Com
mer
cial
MN
Heal
th C
are
Prog
ram
s
Tota
l Pop
ulat
ion
or S
ampl
e
Sam
ple
Size
Non-
Risk
Adj
uste
d Ra
te
Confi
denc
e In
terv
al o
f No
n-Ri
sk A
djus
ted
Rate
Colorectal Cancer Screening Cancer Combined Screening
PHySIcIAN cLINIc NAME
MEdIcAL GrOuP NAME
Quality of Preventive Care
72% 69–74% 20% 76% 4% 72% 69–74% 53% 50–55% 20% 77% 3% 53% 50–55%Overall Minnesota Clinic Average
north Memorial Clinic- north Memorial Camden Physicians Maple grove
Park nicollet Clinic Park nicollet Health services
MAPleWood
Aspen Medical group Aspen Medical group
Attending Physicians Attending Physicians
Family Healthservices Minnesota- Family Healthservices Minnesota Afton road
Healtheast Healtheast Clinics
HealthPartners HealthPartners Clinics
st. Paul Cardiology st. Paul Cardiology
st. Paul Heart Clinic st. Paul Heart
MInneAPolIs
Allina Health system- Abbott Allina Health system northwestern general Medicine Associates
Allina Health system- Allina Health system Minneapolis Heart Institute
Allina Medical Clinic- Isles Allina Medical Clinic
Allina Medical Clinic- nicollet Mall Allina Medical Clinic
Allina Medical Clinic- the doctors uptown Allina Medical Clinic
79% 68%-91% 41% 57% 2% sample 66 77% 64%-86% 69% 55%-84% 41% 57% 2% sample 66 69% 55%-80%
79% 72%-85% 18% 80% 2% sample 328 79% 71%-85% 64% 57%-71% 18% 80% 2% sample 328 64% 56%-71%
74% 59%-89% 38% 60% 2% sample 167 72% 59%-83% 41% 26%-55% 38% 61% 1% sample 123 46% 34%-58%
* * * * * * * * * * * * * * * * * *
81% 71%-91% 23% 75% 2% sample 137 81% 68%-90% 59% 35%-82% 23% 76% 1% sample 88 59% 38%-77%
85% 77%-94% 33% 65% 2% sample 136 84% 75%-91% 55% 37%-73% 33% 65% 1% sample 88 58% 43%-72%
75% 70%-81% 23% 75% 2% sample 919 76% 70%-81% 66% 59%-72% 23% 75% 2% sample 919 66% 60%-72%
n/A n/A n/A n/A n/A n/A n/A n/A n/A n/A n/A n/A n/A n/A n/A n/A n/A n/A
n/A n/A n/A n/A n/A n/A n/A n/A n/A n/A n/A n/A n/A n/A n/A n/A n/A n/A
43% 33%-53% 21% 75% 4% sample 117 43% 32%-56% 36% 26%-46% 21% 76% 3% sample 105 36% 26%-48%
n/A n/A n/A n/A n/A n/A n/A n/A n/A n/A n/A n/A n/A n/A n/A n/A n/A n/A
72% 66%-78% 21% 77% 2% sample 409 72% 66%-78% 45% 39%-52% 21% 77% 2% sample 409 45% 39%-52%
72% 66%-78% 21% 77% 2% sample 409 72% 66%-78% 45% 39%-52% 21% 77% 2% sample 409 45% 39%-52%
72% 66%-78% 21% 77% 2% sample 409 72% 66%-78% 45% 39%-52% 21% 77% 2% sample 409 45% 39%-52%

November 2010 | 2010 Health Care Quality Report | pHysiCian Measures appenDiX 215
* sufficient data not available.
see page 89 for an explanation of terms.
Medical Group Distribution of
Patient Population
Medical Group Distribution of
Patient Population
Risk
Adj
uste
d Ra
te
Confi
denc
e In
terv
al o
f Ris
k Ad
just
ed R
ate
Med
icar
e
Com
mer
cial
MN
Heal
th C
are
Prog
ram
s
Tota
l Pop
ulat
ion
or S
ampl
e
Sam
ple
Size
Non-
Risk
Adj
uste
d Ra
te
Confi
denc
e In
terv
al o
f No
n-Ri
sk A
djus
ted
Rate
Risk
Adj
uste
d Ra
te
Confi
denc
e In
terv
al o
f Ris
k Ad
just
ed R
ate
Med
icar
e
Com
mer
cial
MN
Heal
th C
are
Prog
ram
s
Tota
l Pop
ulat
ion
or S
ampl
e
Sam
ple
Size
Non-
Risk
Adj
uste
d Ra
te
Confi
denc
e In
terv
al o
f No
n-Ri
sk A
djus
ted
Rate
Colorectal Cancer Screening Cancer Combined Screening
PHySIcIAN cLINIc NAME
MEdIcAL GrOuP NAME
Quality of Preventive Care
72% 69–74% 20% 76% 4% 72% 69–74% 53% 50–55% 20% 77% 3% 53% 50–55%Overall Minnesota Clinic Average
Aspen Medical group- east lake street Aspen Medical group
AXIs Medical Center Axis Medical Center
Bloomington lake Clinic Bloomington lake Clinic
Boynton Health service Boynton Health service
Bruley Center
Cedar riverside People’s Center- Cedar riverside People’s Center People’s Center Medical Clinic
Community university Health Community university Health Care Center Care Center
Crown Medical Center
Fairview Hiawatha Clinic Fairview Health services
Fairview northeast Clinic Fairview Health services
Fairview uptown Clinic Fairview Health services
Fremont Community Health services- Fremont Community Clinics Central Avenue Clinic
Fremont Community Health services- Fremont Community Clinics Fremont Clinic
Fremont Community Health services- Fremont Community Clinics sheridan
green Central Medical Clinic southside Community Health services
HealthPartners- riverside HealthPartners Clinics
74% 59%-89% 38% 60% 2% sample 167 72% 59%-83% 41% 26%-55% 38% 61% 1% sample 123 46% 34%-58%
* * * * * * * * * * * * * * * * * *
81% 75%-87% 38% 57% 5% sample 84 77% 60%-89% * * * * * * * * *
* * * * * * * * * * * * * * * * * *
* * * * * * * * * * * * * * * * * *
70% 66%-72% 3% 9% 88% sample 67 26% 13%-44% * * * * * * * * *
44% 42%-45% 0% 56% 44% sample 70 18% 8%-35% 34% 32%-36% 0% 56% 44% sample 69 16% 7%-33%
* * * * * * * * * * * * * * * * * *
79% 72%-86% 30% 67% 3% sample 403 78% 72%-84% 58% 48%-67% 30% 67% 3% sample 403 59% 51%-68%
79% 72%-86% 30% 67% 3% sample 403 78% 72%-84% 58% 48%-67% 30% 67% 3% sample 403 59% 51%-68%
79% 72%-86% 30% 67% 3% sample 403 78% 72%-84% 58% 48%-67% 30% 67% 3% sample 403 59% 51%-68%
44% 42%-45% 0% 56% 44% sample 70 18% 8%-35% 34% 32%-36% 0% 56% 44% sample 69 16% 7%-33%
44% 42%-45% 0% 56% 44% sample 70 18% 8%-35% 34% 32%-36% 0% 56% 44% sample 69 16% 7%-33%
44% 42%-45% 0% 56% 44% sample 70 18% 8%-35% 34% 32%-36% 0% 56% 44% sample 69 16% 7%-33%
44% 42%-45% 0% 56% 44% sample 70 18% 8%-35% 34% 32%-36% 0% 56% 44% sample 69 16% 7%-33%
75% 70%-81% 23% 75% 2% sample 919 76% 70%-81% 66% 59%-72% 23% 75% 2% sample 919 66% 60%-72%
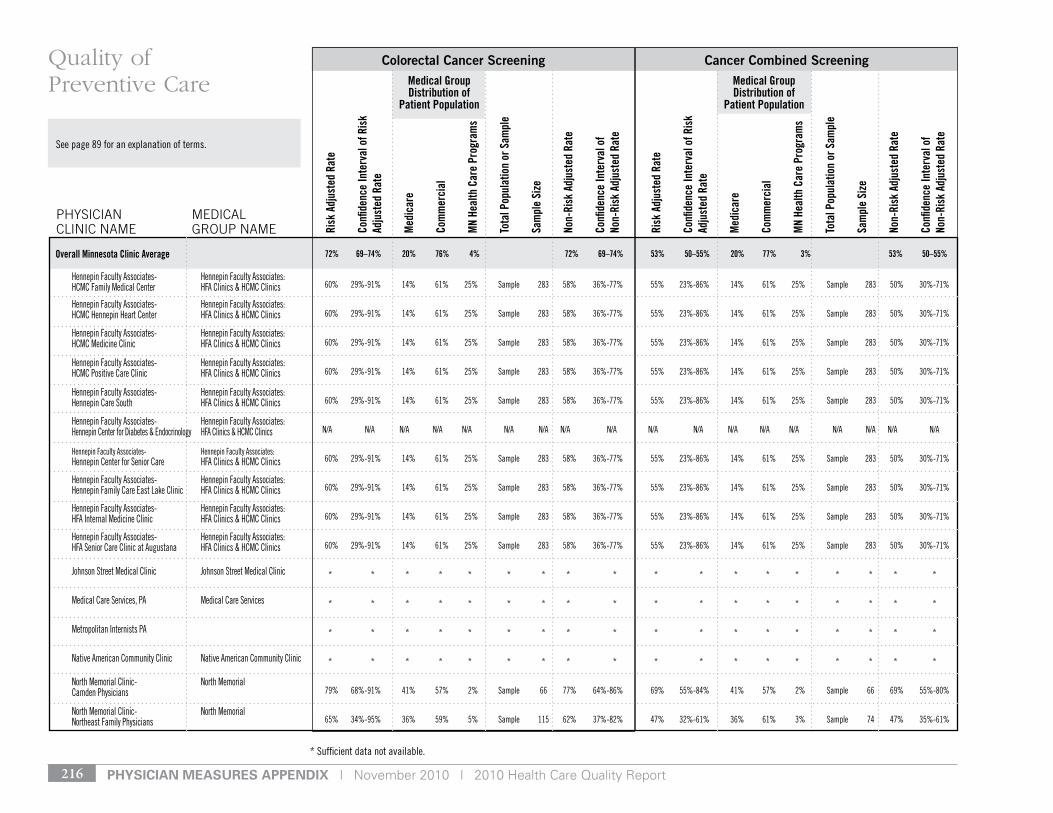
pHysiCian Measures appenDiX | November 2010 | 2010 Health Care Quality Report216
* sufficient data not available.
see page 89 for an explanation of terms.
Medical Group Distribution of
Patient Population
Medical Group Distribution of
Patient Population
Risk
Adj
uste
d Ra
te
Confi
denc
e In
terv
al o
f Ris
k Ad
just
ed R
ate
Med
icar
e
Com
mer
cial
MN
Heal
th C
are
Prog
ram
s
Tota
l Pop
ulat
ion
or S
ampl
e
Sam
ple
Size
Non-
Risk
Adj
uste
d Ra
te
Confi
denc
e In
terv
al o
f No
n-Ri
sk A
djus
ted
Rate
Risk
Adj
uste
d Ra
te
Confi
denc
e In
terv
al o
f Ris
k Ad
just
ed R
ate
Med
icar
e
Com
mer
cial
MN
Heal
th C
are
Prog
ram
s
Tota
l Pop
ulat
ion
or S
ampl
e
Sam
ple
Size
Non-
Risk
Adj
uste
d Ra
te
Confi
denc
e In
terv
al o
f No
n-Ri
sk A
djus
ted
Rate
Colorectal Cancer Screening Cancer Combined Screening
PHySIcIAN cLINIc NAME
MEdIcAL GrOuP NAME
Quality of Preventive Care
72% 69–74% 20% 76% 4% 72% 69–74% 53% 50–55% 20% 77% 3% 53% 50–55%Overall Minnesota Clinic Average
Hennepin Faculty Associates- Hennepin Faculty Associates: HCMC Family Medical Center HFA Clinics & HCMC Clinics
Hennepin Faculty Associates- Hennepin Faculty Associates: HCMC Hennepin Heart Center HFA Clinics & HCMC Clinics
Hennepin Faculty Associates- Hennepin Faculty Associates: HCMC Medicine Clinic HFA Clinics & HCMC Clinics
Hennepin Faculty Associates- Hennepin Faculty Associates: HCMC Positive Care Clinic HFA Clinics & HCMC Clinics
Hennepin Faculty Associates- Hennepin Faculty Associates: Hennepin Care south HFA Clinics & HCMC Clinics
Hennepin Faculty Associates- Hennepin Faculty Associates: Hennepin Center for diabetes & endocrinology HFA Clinics & HCMC Clinics
Hennepin Faculty Associates- Hennepin Faculty Associates: Hennepin Center for senior Care HFA Clinics & HCMC Clinics
Hennepin Faculty Associates- Hennepin Faculty Associates: Hennepin Family Care east lake Clinic HFA Clinics & HCMC Clinics
Hennepin Faculty Associates- Hennepin Faculty Associates: HFA Internal Medicine Clinic HFA Clinics & HCMC Clinics
Hennepin Faculty Associates- Hennepin Faculty Associates: HFA senior Care Clinic at Augustana HFA Clinics & HCMC Clinics
Johnson street Medical Clinic Johnson street Medical Clinic
Medical Care services, PA Medical Care services
Metropolitan Internists PA
native American Community Clinic native American Community Clinic
north Memorial Clinic- north Memorial Camden Physicians
north Memorial Clinic- north Memorial northeast Family Physicians
60% 29%-91% 14% 61% 25% sample 283 58% 36%-77% 55% 23%-86% 14% 61% 25% sample 283 50% 30%-71%
60% 29%-91% 14% 61% 25% sample 283 58% 36%-77% 55% 23%-86% 14% 61% 25% sample 283 50% 30%-71%
60% 29%-91% 14% 61% 25% sample 283 58% 36%-77% 55% 23%-86% 14% 61% 25% sample 283 50% 30%-71%
60% 29%-91% 14% 61% 25% sample 283 58% 36%-77% 55% 23%-86% 14% 61% 25% sample 283 50% 30%-71%
60% 29%-91% 14% 61% 25% sample 283 58% 36%-77% 55% 23%-86% 14% 61% 25% sample 283 50% 30%-71%
n/A n/A n/A n/A n/A n/A n/A n/A n/A n/A n/A n/A n/A n/A n/A n/A n/A n/A
60% 29%-91% 14% 61% 25% sample 283 58% 36%-77% 55% 23%-86% 14% 61% 25% sample 283 50% 30%-71%
60% 29%-91% 14% 61% 25% sample 283 58% 36%-77% 55% 23%-86% 14% 61% 25% sample 283 50% 30%-71%
60% 29%-91% 14% 61% 25% sample 283 58% 36%-77% 55% 23%-86% 14% 61% 25% sample 283 50% 30%-71%
60% 29%-91% 14% 61% 25% sample 283 58% 36%-77% 55% 23%-86% 14% 61% 25% sample 283 50% 30%-71%
* * * * * * * * * * * * * * * * * *
* * * * * * * * * * * * * * * * * *
* * * * * * * * * * * * * * * * * *
* * * * * * * * * * * * * * * * * *
79% 68%-91% 41% 57% 2% sample 66 77% 64%-86% 69% 55%-84% 41% 57% 2% sample 66 69% 55%-80%
65% 34%-95% 36% 59% 5% sample 115 62% 37%-82% 47% 32%-61% 36% 61% 3% sample 74 47% 35%-61%
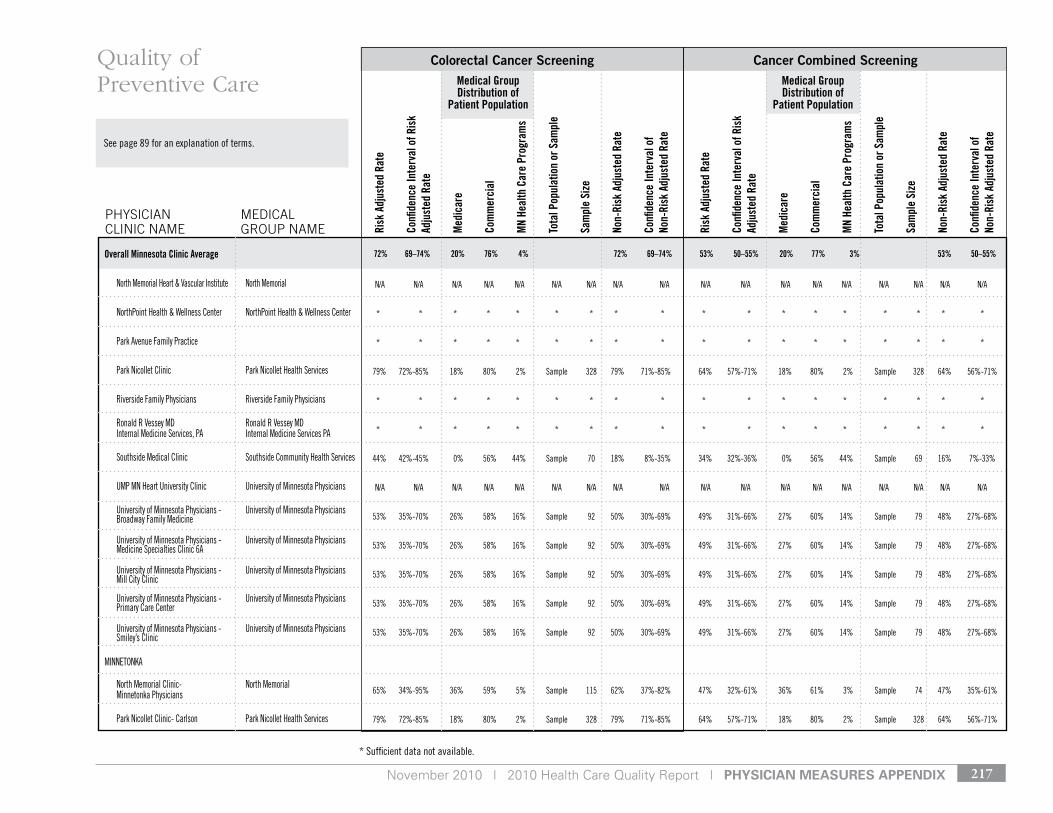
November 2010 | 2010 Health Care Quality Report | pHysiCian Measures appenDiX 217
* sufficient data not available.
see page 89 for an explanation of terms.
Medical Group Distribution of
Patient Population
Medical Group Distribution of
Patient Population
Risk
Adj
uste
d Ra
te
Confi
denc
e In
terv
al o
f Ris
k Ad
just
ed R
ate
Med
icar
e
Com
mer
cial
MN
Heal
th C
are
Prog
ram
s
Tota
l Pop
ulat
ion
or S
ampl
e
Sam
ple
Size
Non-
Risk
Adj
uste
d Ra
te
Confi
denc
e In
terv
al o
f No
n-Ri
sk A
djus
ted
Rate
Risk
Adj
uste
d Ra
te
Confi
denc
e In
terv
al o
f Ris
k Ad
just
ed R
ate
Med
icar
e
Com
mer
cial
MN
Heal
th C
are
Prog
ram
s
Tota
l Pop
ulat
ion
or S
ampl
e
Sam
ple
Size
Non-
Risk
Adj
uste
d Ra
te
Confi
denc
e In
terv
al o
f No
n-Ri
sk A
djus
ted
Rate
Colorectal Cancer Screening Cancer Combined Screening
PHySIcIAN cLINIc NAME
MEdIcAL GrOuP NAME
Quality of Preventive Care
72% 69–74% 20% 76% 4% 72% 69–74% 53% 50–55% 20% 77% 3% 53% 50–55%Overall Minnesota Clinic Average
north Memorial Heart & vascular Institute north Memorial
northPoint Health & Wellness Center northPoint Health & Wellness Center
Park Avenue Family Practice
Park nicollet Clinic Park nicollet Health services
riverside Family Physicians riverside Family Physicians
ronald r vessey Md ronald r vessey Md Internal Medicine services, PA Internal Medicine services PA
southside Medical Clinic southside Community Health services
uMP Mn Heart university Clinic university of Minnesota Physicians
university of Minnesota Physicians - university of Minnesota Physicians Broadway Family Medicine
university of Minnesota Physicians - university of Minnesota Physicians Medicine specialties Clinic 6A
university of Minnesota Physicians - university of Minnesota Physicians Mill City Clinic
university of Minnesota Physicians - university of Minnesota Physicians Primary Care Center
university of Minnesota Physicians - university of Minnesota Physicians smiley’s Clinic
MInnetonkA
north Memorial Clinic- north Memorial Minnetonka Physicians
Park nicollet Clinic- Carlson Park nicollet Health services
n/A n/A n/A n/A n/A n/A n/A n/A n/A n/A n/A n/A n/A n/A n/A n/A n/A n/A
* * * * * * * * * * * * * * * * * *
* * * * * * * * * * * * * * * * * *
79% 72%-85% 18% 80% 2% sample 328 79% 71%-85% 64% 57%-71% 18% 80% 2% sample 328 64% 56%-71%
* * * * * * * * * * * * * * * * * *
* * * * * * * * * * * * * * * * * *
44% 42%-45% 0% 56% 44% sample 70 18% 8%-35% 34% 32%-36% 0% 56% 44% sample 69 16% 7%-33%
n/A n/A n/A n/A n/A n/A n/A n/A n/A n/A n/A n/A n/A n/A n/A n/A n/A n/A
53% 35%-70% 26% 58% 16% sample 92 50% 30%-69% 49% 31%-66% 27% 60% 14% sample 79 48% 27%-68%
53% 35%-70% 26% 58% 16% sample 92 50% 30%-69% 49% 31%-66% 27% 60% 14% sample 79 48% 27%-68%
53% 35%-70% 26% 58% 16% sample 92 50% 30%-69% 49% 31%-66% 27% 60% 14% sample 79 48% 27%-68%
53% 35%-70% 26% 58% 16% sample 92 50% 30%-69% 49% 31%-66% 27% 60% 14% sample 79 48% 27%-68%
53% 35%-70% 26% 58% 16% sample 92 50% 30%-69% 49% 31%-66% 27% 60% 14% sample 79 48% 27%-68%
65% 34%-95% 36% 59% 5% sample 115 62% 37%-82% 47% 32%-61% 36% 61% 3% sample 74 47% 35%-61%
79% 72%-85% 18% 80% 2% sample 328 79% 71%-85% 64% 57%-71% 18% 80% 2% sample 328 64% 56%-71%
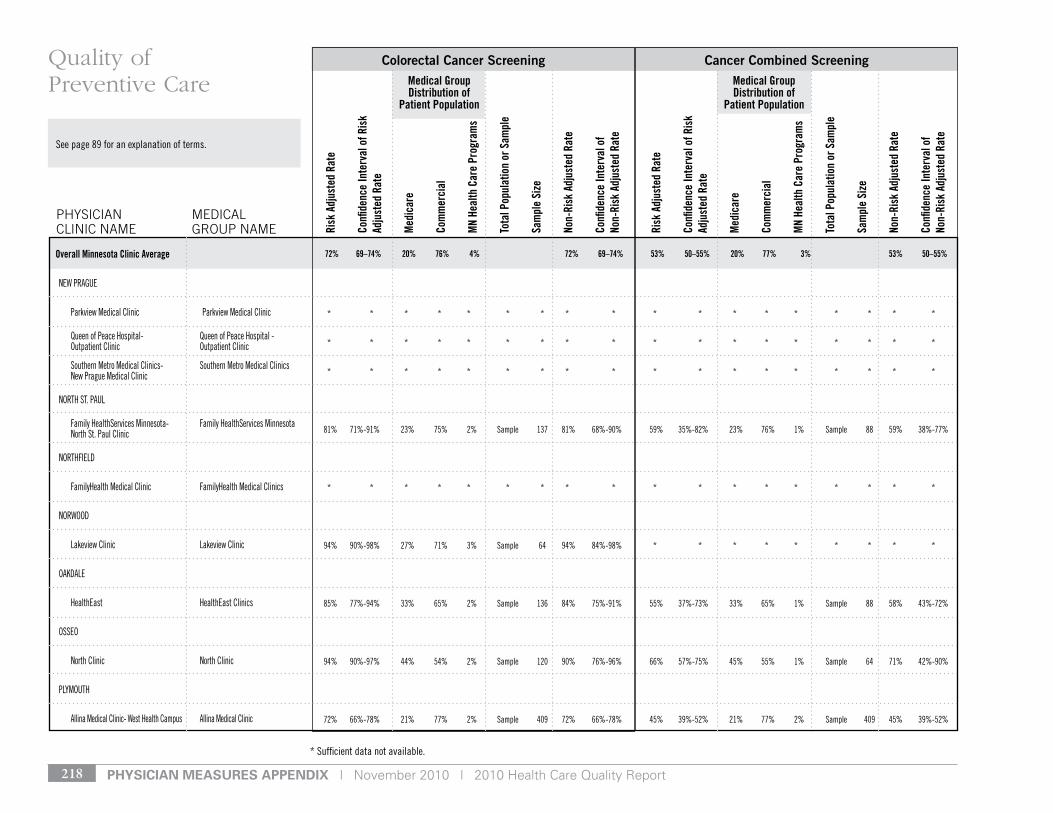
pHysiCian Measures appenDiX | November 2010 | 2010 Health Care Quality Report218
* sufficient data not available.
see page 89 for an explanation of terms.
Medical Group Distribution of
Patient Population
Medical Group Distribution of
Patient Population
Risk
Adj
uste
d Ra
te
Confi
denc
e In
terv
al o
f Ris
k Ad
just
ed R
ate
Med
icar
e
Com
mer
cial
MN
Heal
th C
are
Prog
ram
s
Tota
l Pop
ulat
ion
or S
ampl
e
Sam
ple
Size
Non-
Risk
Adj
uste
d Ra
te
Confi
denc
e In
terv
al o
f No
n-Ri
sk A
djus
ted
Rate
Risk
Adj
uste
d Ra
te
Confi
denc
e In
terv
al o
f Ris
k Ad
just
ed R
ate
Med
icar
e
Com
mer
cial
MN
Heal
th C
are
Prog
ram
s
Tota
l Pop
ulat
ion
or S
ampl
e
Sam
ple
Size
Non-
Risk
Adj
uste
d Ra
te
Confi
denc
e In
terv
al o
f No
n-Ri
sk A
djus
ted
Rate
Colorectal Cancer Screening Cancer Combined Screening
PHySIcIAN cLINIc NAME
MEdIcAL GrOuP NAME
Quality of Preventive Care
72% 69–74% 20% 76% 4% 72% 69–74% 53% 50–55% 20% 77% 3% 53% 50–55%Overall Minnesota Clinic Average
neW PrAgue
Parkview Medical Clinic Parkview Medical Clinic
Queen of Peace Hospital- Queen of Peace Hospital - outpatient Clinic outpatient Clinic
southern Metro Medical Clinics- southern Metro Medical Clinics new Prague Medical Clinic
nortH st. PAul
Family Healthservices Minnesota- Family Healthservices Minnesota north st. Paul Clinic
nortHFIeld
FamilyHealth Medical Clinic FamilyHealth Medical Clinics
norWood
lakeview Clinic lakeview Clinic
oAkdAle
Healtheast Healtheast Clinics
osseo
north Clinic north Clinic
PlyMoutH
Allina Medical Clinic- West Health Campus Allina Medical Clinic
* * * * * * * * * * * * * * * * * *
* * * * * * * * * * * * * * * * * *
* * * * * * * * * * * * * * * * * *
81% 71%-91% 23% 75% 2% sample 137 81% 68%-90% 59% 35%-82% 23% 76% 1% sample 88 59% 38%-77%
* * * * * * * * * * * * * * * * * *
94% 90%-98% 27% 71% 3% sample 64 94% 84%-98% * * * * * * * * *
85% 77%-94% 33% 65% 2% sample 136 84% 75%-91% 55% 37%-73% 33% 65% 1% sample 88 58% 43%-72%
94% 90%-97% 44% 54% 2% sample 120 90% 76%-96% 66% 57%-75% 45% 55% 1% sample 64 71% 42%-90%
72% 66%-78% 21% 77% 2% sample 409 72% 66%-78% 45% 39%-52% 21% 77% 2% sample 409 45% 39%-52%

November 2010 | 2010 Health Care Quality Report | pHysiCian Measures appenDiX 219
* sufficient data not available.
see page 89 for an explanation of terms.
Medical Group Distribution of
Patient Population
Medical Group Distribution of
Patient Population
Risk
Adj
uste
d Ra
te
Confi
denc
e In
terv
al o
f Ris
k Ad
just
ed R
ate
Med
icar
e
Com
mer
cial
MN
Heal
th C
are
Prog
ram
s
Tota
l Pop
ulat
ion
or S
ampl
e
Sam
ple
Size
Non-
Risk
Adj
uste
d Ra
te
Confi
denc
e In
terv
al o
f No
n-Ri
sk A
djus
ted
Rate
Risk
Adj
uste
d Ra
te
Confi
denc
e In
terv
al o
f Ris
k Ad
just
ed R
ate
Med
icar
e
Com
mer
cial
MN
Heal
th C
are
Prog
ram
s
Tota
l Pop
ulat
ion
or S
ampl
e
Sam
ple
Size
Non-
Risk
Adj
uste
d Ra
te
Confi
denc
e In
terv
al o
f No
n-Ri
sk A
djus
ted
Rate
Colorectal Cancer Screening Cancer Combined Screening
PHySIcIAN cLINIc NAME
MEdIcAL GrOuP NAME
Quality of Preventive Care
72% 69–74% 20% 76% 4% 72% 69–74% 53% 50–55% 20% 77% 3% 53% 50–55%Overall Minnesota Clinic Average
north Clinic- WestHealth north Clinic
north Memorial Clinic- north Memorial Camden Physicians Plymouth
north Memorial Clinic- north Memorial Plymouth Internal Medicine
northwest Family Physicans northwest Family Physicians
Park nicollet Clinic Park nicollet Health services
PrIor lAke
Allina Medical Clinic- Allina Medical Clinic Crossroads Prior lake
Fairview ridgevalley Clinic Fairview Health services
Park nicollet Clinic Park nicollet Health services
rAMsey
Allina Medical Clinic Allina Medical Clinic
rICHFIeld
Allina Medical Clinic Allina Medical Clinic
richfield Medical group richfield Medical group
roBBInsdAle
north Clinic- oakdale office north Clinic
94% 90%-97% 44% 54% 2% sample 120 90% 76%-96% 66% 57%-75% 45% 55% 1% sample 64 71% 42%-90%
79% 68%-91% 41% 57% 2% sample 66 77% 64%-86% 69% 55%-84% 41% 57% 2% sample 66 69% 55%-80%
65% 34%-95% 36% 59% 5% sample 115 62% 37%-82% 47% 32%-61% 36% 61% 3% sample 74 47% 35%-61%
59% 46%-73% 29% 69% 2% sample 65 59% 46%-72% 41% 27%-55% 29% 69% 2% sample 65 43% 30%-56%
79% 72%-85% 18% 80% 2% sample 328 79% 71%-85% 64% 57%-71% 18% 80% 2% sample 328 64% 56%-71%
* * * * * * * * * * * * * * * * * *
79% 72%-86% 30% 67% 3% sample 403 78% 72%-84% 58% 48%-67% 30% 67% 3% sample 403 59% 51%-68%
79% 72%-85% 18% 80% 2% sample 328 79% 71%-85% 64% 57%-71% 18% 80% 2% sample 328 64% 56%-71%
72% 66%-78% 21% 77% 2% sample 409 72% 66%-78% 45% 39%-52% 21% 77% 2% sample 409 45% 39%-52%
72% 66%-78% 21% 77% 2% sample 409 72% 66%-78% 45% 39%-52% 21% 77% 2% sample 409 45% 39%-52%
* * * * * * * * * * * * * * * * * *
94% 90%-97% 44% 54% 2% sample 120 90% 76%-96% 66% 57%-75% 45% 55% 1% sample 64 71% 42%-90%

pHysiCian Measures appenDiX | November 2010 | 2010 Health Care Quality Report220
* sufficient data not available.
see page 89 for an explanation of terms.
Medical Group Distribution of
Patient Population
Medical Group Distribution of
Patient Population
Risk
Adj
uste
d Ra
te
Confi
denc
e In
terv
al o
f Ris
k Ad
just
ed R
ate
Med
icar
e
Com
mer
cial
MN
Heal
th C
are
Prog
ram
s
Tota
l Pop
ulat
ion
or S
ampl
e
Sam
ple
Size
Non-
Risk
Adj
uste
d Ra
te
Confi
denc
e In
terv
al o
f No
n-Ri
sk A
djus
ted
Rate
Risk
Adj
uste
d Ra
te
Confi
denc
e In
terv
al o
f Ris
k Ad
just
ed R
ate
Med
icar
e
Com
mer
cial
MN
Heal
th C
are
Prog
ram
s
Tota
l Pop
ulat
ion
or S
ampl
e
Sam
ple
Size
Non-
Risk
Adj
uste
d Ra
te
Confi
denc
e In
terv
al o
f No
n-Ri
sk A
djus
ted
Rate
Colorectal Cancer Screening Cancer Combined Screening
PHySIcIAN cLINIc NAME
MEdIcAL GrOuP NAME
Quality of Preventive Care
72% 69–74% 20% 76% 4% 72% 69–74% 53% 50–55% 20% 77% 3% 53% 50–55%Overall Minnesota Clinic Average
robbinsdale Clinic, PA robbinsdale Clinic, PA
rogers
Fairview rogers Clinic Fairview Health services
northwest Family Physicians northwest Family Physicians
roseMount
Fairview rosemount Clinic Fairview Health services
rosemount Family Physicians
rosevIlle
HealthPartners- north suburban roseville HealthPartners Clinics
Multicare Associates- Multicare Associates roseville Medical Center
richard schoewe, Md richard schoewe Md
sAvAge
Quello Clinic Quello Clinic
sHAkoPee
Allina Medical Clinic Allina Medical Clinic
Allina Medical Clinic- Allina Medical Clinic Crossroads shakopee dean lakes
* * * * * * * * * * * * * * * * * *
79% 72%-86% 30% 67% 3% sample 403 78% 72%-84% 58% 48%-67% 30% 67% 3% sample 403 59% 51%-68%
59% 46%-73% 29% 69% 2% sample 65 59% 46%-72% 41% 27%-55% 29% 69% 2% sample 65 43% 30%-56%
79% 72%-86% 30% 67% 3% sample 403 78% 72%-84% 58% 48%-67% 30% 67% 3% sample 403 59% 51%-68%
* * * * * * * * * * * * * * * * * *
75% 70%-81% 23% 75% 2% sample 919 76% 70%-81% 66% 59%-72% 23% 75% 2% sample 919 66% 60%-72%
46% 26%-65% 48% 50% 2% sample 65 53% 38%-67% 38% 22%-54% 48% 50% 2% sample 65 47% 35%-60%
* * * * * * * * * * * * * * * * * *
69% 53%-84% 28% 71% 1% sample 66 69% 53%-82% 46% 36%-55% 28% 71% 1% sample 66 48% 36%-59%
72% 66%-78% 21% 77% 2% sample 409 72% 66%-78% 45% 39%-52% 21% 77% 2% sample 409 45% 39%-52%
* * * * * * * * * * * * * * * * * *

November 2010 | 2010 Health Care Quality Report | pHysiCian Measures appenDiX 221
* sufficient data not available.
see page 89 for an explanation of terms.
Medical Group Distribution of
Patient Population
Medical Group Distribution of
Patient Population
Risk
Adj
uste
d Ra
te
Confi
denc
e In
terv
al o
f Ris
k Ad
just
ed R
ate
Med
icar
e
Com
mer
cial
MN
Heal
th C
are
Prog
ram
s
Tota
l Pop
ulat
ion
or S
ampl
e
Sam
ple
Size
Non-
Risk
Adj
uste
d Ra
te
Confi
denc
e In
terv
al o
f No
n-Ri
sk A
djus
ted
Rate
Risk
Adj
uste
d Ra
te
Confi
denc
e In
terv
al o
f Ris
k Ad
just
ed R
ate
Med
icar
e
Com
mer
cial
MN
Heal
th C
are
Prog
ram
s
Tota
l Pop
ulat
ion
or S
ampl
e
Sam
ple
Size
Non-
Risk
Adj
uste
d Ra
te
Confi
denc
e In
terv
al o
f No
n-Ri
sk A
djus
ted
Rate
Colorectal Cancer Screening Cancer Combined Screening
PHySIcIAN cLINIc NAME
MEdIcAL GrOuP NAME
Quality of Preventive Care
72% 69–74% 20% 76% 4% 72% 69–74% 53% 50–55% 20% 77% 3% 53% 50–55%Overall Minnesota Clinic Average
Park nicollet Clinic Park nicollet Health services
sHorevIeW
Allina Medical Clinic Allina Medical Clinic
Family Healthservices Minnesota Family Healthservices Minnesota
one stop Medical Center one stop Medical Center
silver lake Clinic silver lake Clinic
sHoreWood
Park nicollet Clinic Park nicollet Health services
sPrIng PArk
ridgeview Westonka Clinic ridgeview Clinics
st. AntHony
silver lake Clinic silver lake Clinic
st. FrAnCIs
st. Francis Medical Clinic
st. louIs PArk
HealthPartners- West HealthPartners Clinics
79% 72%-85% 18% 80% 2% sample 328 79% 71%-85% 64% 57%-71% 18% 80% 2% sample 328 64% 56%-71%
72% 66%-78% 21% 77% 2% sample 409 72% 66%-78% 45% 39%-52% 21% 77% 2% sample 409 45% 39%-52%
81% 71%-91% 23% 75% 2% sample 137 81% 68%-90% 59% 35%-82% 23% 76% 1% sample 88 59% 38%-77%
* * * * * * * * * * * * * * * * * *
84% 75%-92% 33% 66% 0% sample 60 83% 66%-92% 62% 52%-71% 33% 66% 0% sample 60 64% 44%-80%
79% 72%-85% 18% 80% 2% sample 328 79% 71%-85% 64% 57%-71% 18% 80% 2% sample 328 64% 56%-71%
67% 55%-79% 17% 82% 2% sample 64 69% 52%-82% 58% 46%-70% 17% 82% 2% sample 64 60% 43%-75%
84% 75%-92% 33% 66% 0% sample 60 83% 66%-92% 62% 52%-71% 33% 66% 0% sample 60 64% 44%-80%
* * * * * * * * * * * * * * * * * *
75% 70%-81% 23% 75% 2% sample 919 76% 70%-81% 66% 59%-72% 23% 75% 2% sample 919 66% 60%-72%

pHysiCian Measures appenDiX | November 2010 | 2010 Health Care Quality Report222
* sufficient data not available.
see page 89 for an explanation of terms.
Medical Group Distribution of
Patient Population
Medical Group Distribution of
Patient Population
Risk
Adj
uste
d Ra
te
Confi
denc
e In
terv
al o
f Ris
k Ad
just
ed R
ate
Med
icar
e
Com
mer
cial
MN
Heal
th C
are
Prog
ram
s
Tota
l Pop
ulat
ion
or S
ampl
e
Sam
ple
Size
Non-
Risk
Adj
uste
d Ra
te
Confi
denc
e In
terv
al o
f No
n-Ri
sk A
djus
ted
Rate
Risk
Adj
uste
d Ra
te
Confi
denc
e In
terv
al o
f Ris
k Ad
just
ed R
ate
Med
icar
e
Com
mer
cial
MN
Heal
th C
are
Prog
ram
s
Tota
l Pop
ulat
ion
or S
ampl
e
Sam
ple
Size
Non-
Risk
Adj
uste
d Ra
te
Confi
denc
e In
terv
al o
f No
n-Ri
sk A
djus
ted
Rate
Colorectal Cancer Screening Cancer Combined Screening
PHySIcIAN cLINIc NAME
MEdIcAL GrOuP NAME
Quality of Preventive Care
72% 69–74% 20% 76% 4% 72% 69–74% 53% 50–55% 20% 77% 3% 53% 50–55%Overall Minnesota Clinic Average
Integrative options
life Medical life Medical
Park nicollet Clinic- Creekside Park nicollet Health services
Park nicollet Clinic- Heart and vascular Park nicollet Health services
Park nicollet Clinic- Park nicollet Health services st. louis Park endocrinology
Park nicollet Clinic- Park nicollet Health services st. louis Park Family Medicine
Park nicollet Clinic- Park nicollet Health services st. louis Park Internal Medicine
steven saliterman, Md steven saliterman, Md
st. PAul
Adult Medicine, PA Adult Medicine, PA
Advanced Medical Clinic, Inc Advanced Medical Clinic
Allina Medical Clinic- Allina Medical Clinic united Medical specialties
Arcade Medical Clinic
Aspen Medical group- Bandana square Aspen Medical group
Aspen Medical group- Highland Aspen Medical group
Boynton Health service Boynton Health service
* * * * * * * * * * * * * * * * * *
* * * * * * * * * * * * * * * * * *
79% 72%-85% 18% 80% 2% sample 328 79% 71%-85% 64% 57%-71% 18% 80% 2% sample 328 64% 56%-71%
n/A n/A n/A n/A n/A n/A n/A n/A n/A n/A n/A n/A n/A n/A n/A n/A n/A n/A
n/A n/A n/A n/A n/A n/A n/A n/A n/A n/A n/A n/A n/A n/A n/A n/A n/A n/A
79% 72%-85% 18% 80% 2% sample 328 79% 71%-85% 64% 57%-71% 18% 80% 2% sample 328 64% 56%-71%
79% 72%-85% 18% 80% 2% sample 328 79% 71%-85% 64% 57%-71% 18% 80% 2% sample 328 64% 56%-71%
* * * * * * * * * * * * * * * * * *
* * * * * * * * * * * * * * * * * *
* * * * * * * * * * * * * * * * * *
72% 66%-78% 21% 77% 2% sample 409 72% 66%-78% 45% 39%-52% 21% 77% 2% sample 409 45% 39%-52%
* * * * * * * * * * * * * * * * * *
74% 59%-89% 38% 60% 2% sample 167 72% 59%-83% 41% 26%-55% 38% 61% 1% sample 123 46% 34%-58%
74% 59%-89% 38% 60% 2% sample 167 72% 59%-83% 41% 26%-55% 38% 61% 1% sample 123 46% 34%-58%
* * * * * * * * * * * * * * * * * *
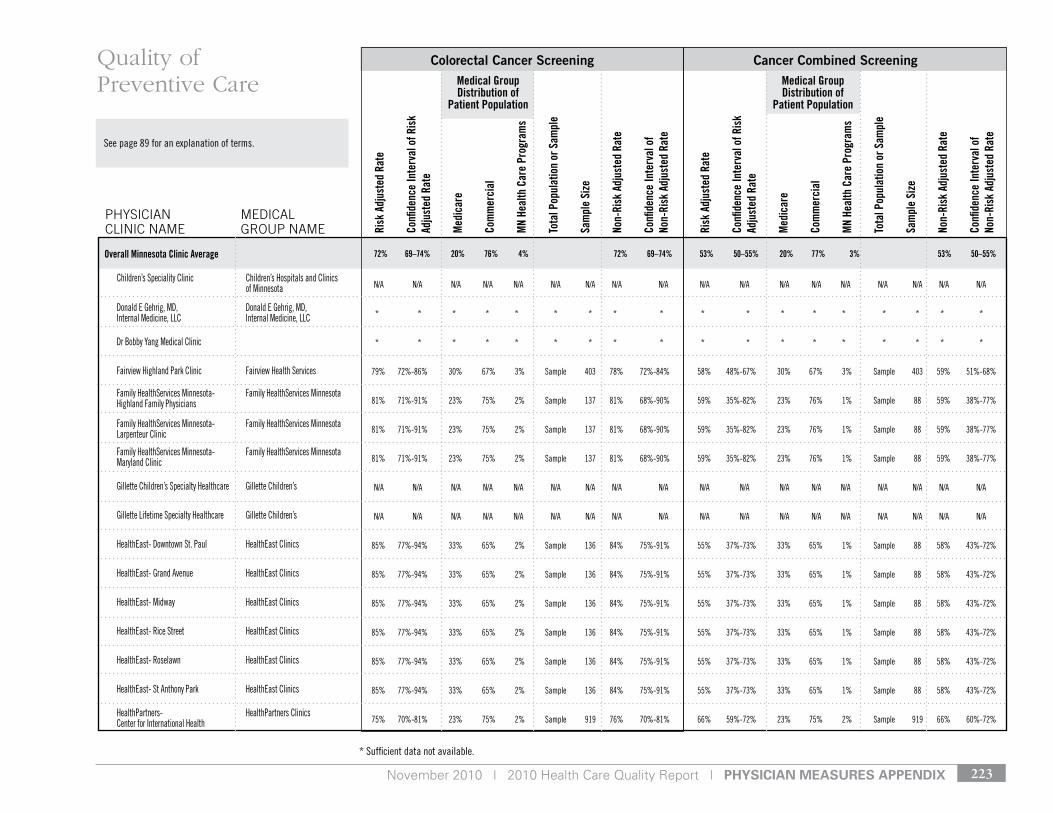
November 2010 | 2010 Health Care Quality Report | pHysiCian Measures appenDiX 223
* sufficient data not available.
see page 89 for an explanation of terms.
Medical Group Distribution of
Patient Population
Medical Group Distribution of
Patient Population
Risk
Adj
uste
d Ra
te
Confi
denc
e In
terv
al o
f Ris
k Ad
just
ed R
ate
Med
icar
e
Com
mer
cial
MN
Heal
th C
are
Prog
ram
s
Tota
l Pop
ulat
ion
or S
ampl
e
Sam
ple
Size
Non-
Risk
Adj
uste
d Ra
te
Confi
denc
e In
terv
al o
f No
n-Ri
sk A
djus
ted
Rate
Risk
Adj
uste
d Ra
te
Confi
denc
e In
terv
al o
f Ris
k Ad
just
ed R
ate
Med
icar
e
Com
mer
cial
MN
Heal
th C
are
Prog
ram
s
Tota
l Pop
ulat
ion
or S
ampl
e
Sam
ple
Size
Non-
Risk
Adj
uste
d Ra
te
Confi
denc
e In
terv
al o
f No
n-Ri
sk A
djus
ted
Rate
Colorectal Cancer Screening Cancer Combined Screening
PHySIcIAN cLINIc NAME
MEdIcAL GrOuP NAME
Quality of Preventive Care
72% 69–74% 20% 76% 4% 72% 69–74% 53% 50–55% 20% 77% 3% 53% 50–55%Overall Minnesota Clinic Average
Children’s speciality Clinic Children’s Hospitals and Clinics of Minnesota
donald e gehrig, Md, donald e gehrig, Md, Internal Medicine, llC Internal Medicine, llC
dr Bobby yang Medical Clinic
Fairview Highland Park Clinic Fairview Health services
Family Healthservices Minnesota- Family Healthservices Minnesota Highland Family Physicians
Family Healthservices Minnesota- Family Healthservices Minnesota larpenteur Clinic
Family Healthservices Minnesota- Family Healthservices Minnesota Maryland Clinic
gillette Children’s specialty Healthcare gillette Children’s
gillette lifetime specialty Healthcare gillette Children’s
Healtheast- downtown st. Paul Healtheast Clinics
Healtheast- grand Avenue Healtheast Clinics
Healtheast- Midway Healtheast Clinics
Healtheast- rice street Healtheast Clinics
Healtheast- roselawn Healtheast Clinics
Healtheast- st Anthony Park Healtheast Clinics
HealthPartners- HealthPartners Clinics Center for International Health
n/A n/A n/A n/A n/A n/A n/A n/A n/A n/A n/A n/A n/A n/A n/A n/A n/A n/A
* * * * * * * * * * * * * * * * * *
* * * * * * * * * * * * * * * * * *
79% 72%-86% 30% 67% 3% sample 403 78% 72%-84% 58% 48%-67% 30% 67% 3% sample 403 59% 51%-68%
81% 71%-91% 23% 75% 2% sample 137 81% 68%-90% 59% 35%-82% 23% 76% 1% sample 88 59% 38%-77%
81% 71%-91% 23% 75% 2% sample 137 81% 68%-90% 59% 35%-82% 23% 76% 1% sample 88 59% 38%-77%
81% 71%-91% 23% 75% 2% sample 137 81% 68%-90% 59% 35%-82% 23% 76% 1% sample 88 59% 38%-77%
n/A n/A n/A n/A n/A n/A n/A n/A n/A n/A n/A n/A n/A n/A n/A n/A n/A n/A
n/A n/A n/A n/A n/A n/A n/A n/A n/A n/A n/A n/A n/A n/A n/A n/A n/A n/A
85% 77%-94% 33% 65% 2% sample 136 84% 75%-91% 55% 37%-73% 33% 65% 1% sample 88 58% 43%-72%
85% 77%-94% 33% 65% 2% sample 136 84% 75%-91% 55% 37%-73% 33% 65% 1% sample 88 58% 43%-72%
85% 77%-94% 33% 65% 2% sample 136 84% 75%-91% 55% 37%-73% 33% 65% 1% sample 88 58% 43%-72%
85% 77%-94% 33% 65% 2% sample 136 84% 75%-91% 55% 37%-73% 33% 65% 1% sample 88 58% 43%-72%
85% 77%-94% 33% 65% 2% sample 136 84% 75%-91% 55% 37%-73% 33% 65% 1% sample 88 58% 43%-72%
85% 77%-94% 33% 65% 2% sample 136 84% 75%-91% 55% 37%-73% 33% 65% 1% sample 88 58% 43%-72%
75% 70%-81% 23% 75% 2% sample 919 76% 70%-81% 66% 59%-72% 23% 75% 2% sample 919 66% 60%-72%
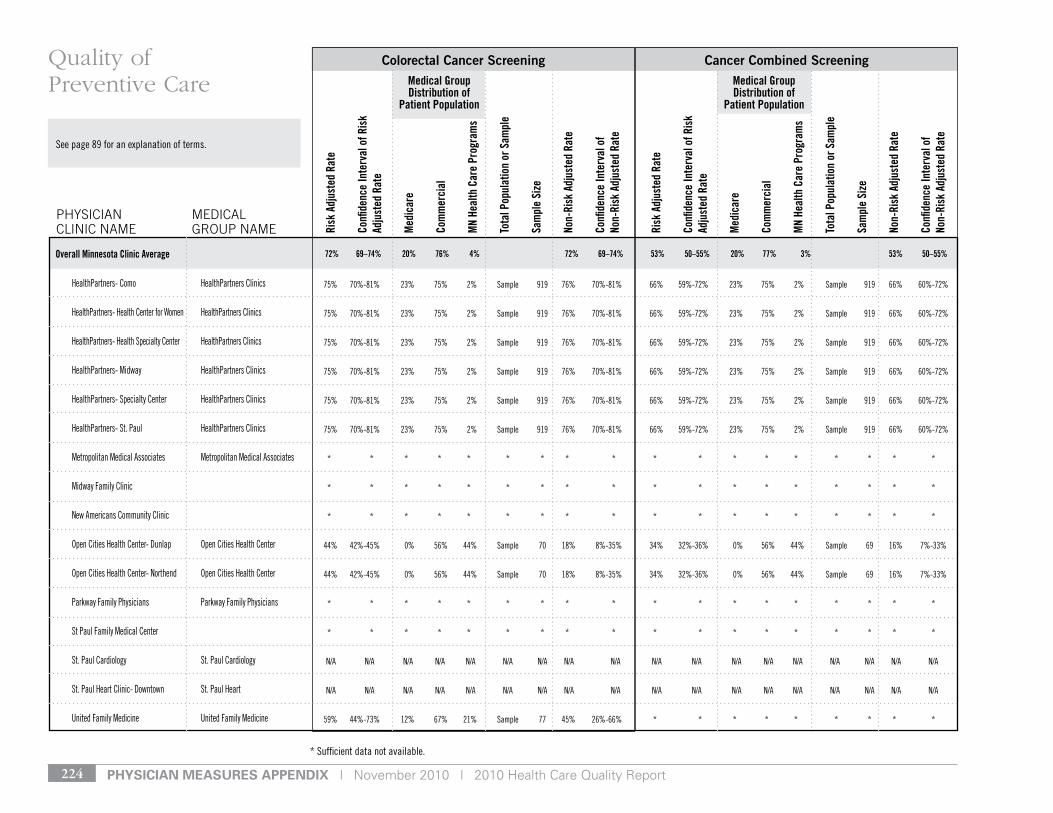
pHysiCian Measures appenDiX | November 2010 | 2010 Health Care Quality Report224
* sufficient data not available.
see page 89 for an explanation of terms.
Medical Group Distribution of
Patient Population
Medical Group Distribution of
Patient Population
Risk
Adj
uste
d Ra
te
Confi
denc
e In
terv
al o
f Ris
k Ad
just
ed R
ate
Med
icar
e
Com
mer
cial
MN
Heal
th C
are
Prog
ram
s
Tota
l Pop
ulat
ion
or S
ampl
e
Sam
ple
Size
Non-
Risk
Adj
uste
d Ra
te
Confi
denc
e In
terv
al o
f No
n-Ri
sk A
djus
ted
Rate
Risk
Adj
uste
d Ra
te
Confi
denc
e In
terv
al o
f Ris
k Ad
just
ed R
ate
Med
icar
e
Com
mer
cial
MN
Heal
th C
are
Prog
ram
s
Tota
l Pop
ulat
ion
or S
ampl
e
Sam
ple
Size
Non-
Risk
Adj
uste
d Ra
te
Confi
denc
e In
terv
al o
f No
n-Ri
sk A
djus
ted
Rate
Colorectal Cancer Screening Cancer Combined Screening
PHySIcIAN cLINIc NAME
MEdIcAL GrOuP NAME
Quality of Preventive Care
72% 69–74% 20% 76% 4% 72% 69–74% 53% 50–55% 20% 77% 3% 53% 50–55%Overall Minnesota Clinic Average
HealthPartners- Como HealthPartners Clinics
HealthPartners- Health Center for Women HealthPartners Clinics
HealthPartners- Health specialty Center HealthPartners Clinics
HealthPartners- Midway HealthPartners Clinics
HealthPartners- specialty Center HealthPartners Clinics
HealthPartners- st. Paul HealthPartners Clinics
Metropolitan Medical Associates Metropolitan Medical Associates
Midway Family Clinic
new Americans Community Clinic
open Cities Health Center- dunlap open Cities Health Center
open Cities Health Center- northend open Cities Health Center
Parkway Family Physicians Parkway Family Physicians
st Paul Family Medical Center
st. Paul Cardiology st. Paul Cardiology
st. Paul Heart Clinic- downtown st. Paul Heart
united Family Medicine united Family Medicine
75% 70%-81% 23% 75% 2% sample 919 76% 70%-81% 66% 59%-72% 23% 75% 2% sample 919 66% 60%-72%
75% 70%-81% 23% 75% 2% sample 919 76% 70%-81% 66% 59%-72% 23% 75% 2% sample 919 66% 60%-72%
75% 70%-81% 23% 75% 2% sample 919 76% 70%-81% 66% 59%-72% 23% 75% 2% sample 919 66% 60%-72%
75% 70%-81% 23% 75% 2% sample 919 76% 70%-81% 66% 59%-72% 23% 75% 2% sample 919 66% 60%-72%
75% 70%-81% 23% 75% 2% sample 919 76% 70%-81% 66% 59%-72% 23% 75% 2% sample 919 66% 60%-72%
75% 70%-81% 23% 75% 2% sample 919 76% 70%-81% 66% 59%-72% 23% 75% 2% sample 919 66% 60%-72%
* * * * * * * * * * * * * * * * * *
* * * * * * * * * * * * * * * * * *
* * * * * * * * * * * * * * * * * *
44% 42%-45% 0% 56% 44% sample 70 18% 8%-35% 34% 32%-36% 0% 56% 44% sample 69 16% 7%-33%
44% 42%-45% 0% 56% 44% sample 70 18% 8%-35% 34% 32%-36% 0% 56% 44% sample 69 16% 7%-33%
* * * * * * * * * * * * * * * * * *
* * * * * * * * * * * * * * * * * *
n/A n/A n/A n/A n/A n/A n/A n/A n/A n/A n/A n/A n/A n/A n/A n/A n/A n/A
n/A n/A n/A n/A n/A n/A n/A n/A n/A n/A n/A n/A n/A n/A n/A n/A n/A n/A
59% 44%-73% 12% 67% 21% sample 77 45% 26%-66% * * * * * * * * *
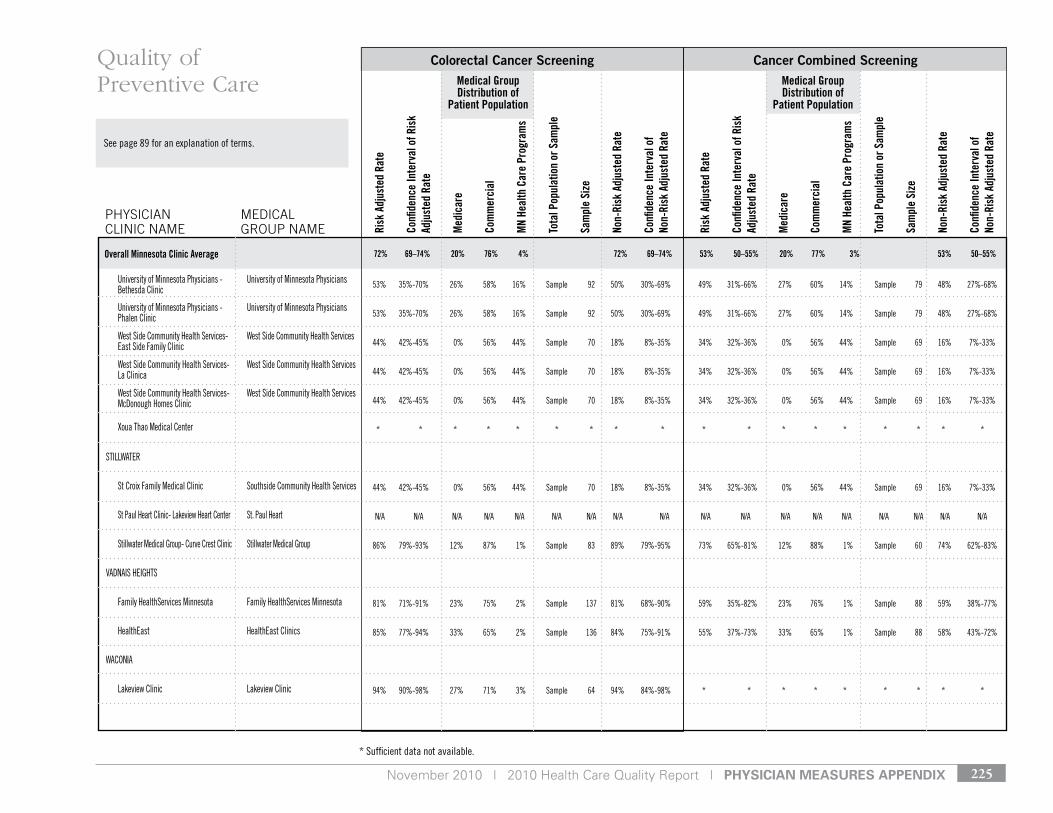
November 2010 | 2010 Health Care Quality Report | pHysiCian Measures appenDiX 225
* sufficient data not available.
see page 89 for an explanation of terms.
Medical Group Distribution of
Patient Population
Medical Group Distribution of
Patient Population
Risk
Adj
uste
d Ra
te
Confi
denc
e In
terv
al o
f Ris
k Ad
just
ed R
ate
Med
icar
e
Com
mer
cial
MN
Heal
th C
are
Prog
ram
s
Tota
l Pop
ulat
ion
or S
ampl
e
Sam
ple
Size
Non-
Risk
Adj
uste
d Ra
te
Confi
denc
e In
terv
al o
f No
n-Ri
sk A
djus
ted
Rate
Risk
Adj
uste
d Ra
te
Confi
denc
e In
terv
al o
f Ris
k Ad
just
ed R
ate
Med
icar
e
Com
mer
cial
MN
Heal
th C
are
Prog
ram
s
Tota
l Pop
ulat
ion
or S
ampl
e
Sam
ple
Size
Non-
Risk
Adj
uste
d Ra
te
Confi
denc
e In
terv
al o
f No
n-Ri
sk A
djus
ted
Rate
Colorectal Cancer Screening Cancer Combined Screening
PHySIcIAN cLINIc NAME
MEdIcAL GrOuP NAME
Quality of Preventive Care
72% 69–74% 20% 76% 4% 72% 69–74% 53% 50–55% 20% 77% 3% 53% 50–55%Overall Minnesota Clinic Average
university of Minnesota Physicians - university of Minnesota Physicians Bethesda Clinic
university of Minnesota Physicians - university of Minnesota Physicians Phalen Clinic
West side Community Health services- West side Community Health services east side Family Clinic
West side Community Health services- West side Community Health services la Clinica
West side Community Health services- West side Community Health services Mcdonough Homes Clinic
Xoua thao Medical Center
stIllWAter
st Croix Family Medical Clinic southside Community Health services
st Paul Heart Clinic- lakeview Heart Center st. Paul Heart
stillwater Medical group- Curve Crest Clinic stillwater Medical group
vAdnAIs HeIgHts
Family Healthservices Minnesota Family Healthservices Minnesota
Healtheast Healtheast Clinics
WAConIA
lakeview Clinic lakeview Clinic
53% 35%-70% 26% 58% 16% sample 92 50% 30%-69% 49% 31%-66% 27% 60% 14% sample 79 48% 27%-68%
53% 35%-70% 26% 58% 16% sample 92 50% 30%-69% 49% 31%-66% 27% 60% 14% sample 79 48% 27%-68%
44% 42%-45% 0% 56% 44% sample 70 18% 8%-35% 34% 32%-36% 0% 56% 44% sample 69 16% 7%-33%
44% 42%-45% 0% 56% 44% sample 70 18% 8%-35% 34% 32%-36% 0% 56% 44% sample 69 16% 7%-33%
44% 42%-45% 0% 56% 44% sample 70 18% 8%-35% 34% 32%-36% 0% 56% 44% sample 69 16% 7%-33%
* * * * * * * * * * * * * * * * * *
44% 42%-45% 0% 56% 44% sample 70 18% 8%-35% 34% 32%-36% 0% 56% 44% sample 69 16% 7%-33%
n/A n/A n/A n/A n/A n/A n/A n/A n/A n/A n/A n/A n/A n/A n/A n/A n/A n/A
86% 79%-93% 12% 87% 1% sample 83 89% 79%-95% 73% 65%-81% 12% 88% 1% sample 60 74% 62%-83%
81% 71%-91% 23% 75% 2% sample 137 81% 68%-90% 59% 35%-82% 23% 76% 1% sample 88 59% 38%-77%
85% 77%-94% 33% 65% 2% sample 136 84% 75%-91% 55% 37%-73% 33% 65% 1% sample 88 58% 43%-72%
94% 90%-98% 27% 71% 3% sample 64 94% 84%-98% * * * * * * * * *
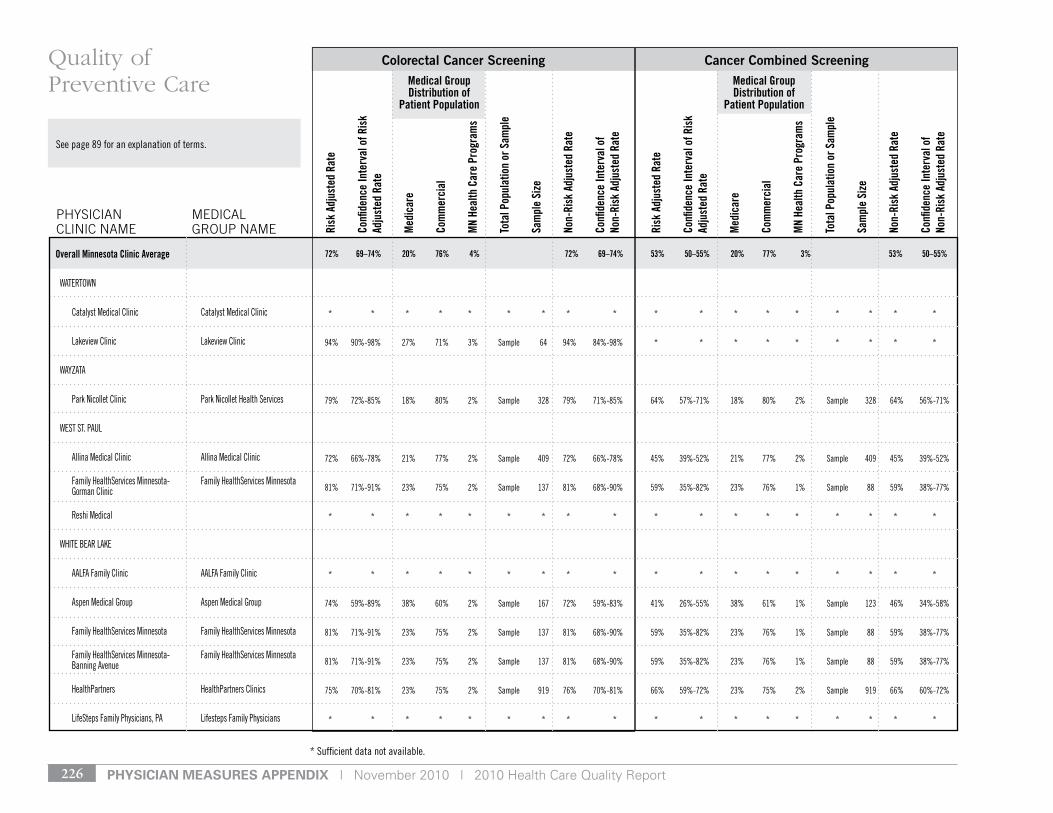
pHysiCian Measures appenDiX | November 2010 | 2010 Health Care Quality Report226
* sufficient data not available.
see page 89 for an explanation of terms.
Medical Group Distribution of
Patient Population
Medical Group Distribution of
Patient Population
Risk
Adj
uste
d Ra
te
Confi
denc
e In
terv
al o
f Ris
k Ad
just
ed R
ate
Med
icar
e
Com
mer
cial
MN
Heal
th C
are
Prog
ram
s
Tota
l Pop
ulat
ion
or S
ampl
e
Sam
ple
Size
Non-
Risk
Adj
uste
d Ra
te
Confi
denc
e In
terv
al o
f No
n-Ri
sk A
djus
ted
Rate
Risk
Adj
uste
d Ra
te
Confi
denc
e In
terv
al o
f Ris
k Ad
just
ed R
ate
Med
icar
e
Com
mer
cial
MN
Heal
th C
are
Prog
ram
s
Tota
l Pop
ulat
ion
or S
ampl
e
Sam
ple
Size
Non-
Risk
Adj
uste
d Ra
te
Confi
denc
e In
terv
al o
f No
n-Ri
sk A
djus
ted
Rate
Colorectal Cancer Screening Cancer Combined Screening
PHySIcIAN cLINIc NAME
MEdIcAL GrOuP NAME
Quality of Preventive Care
72% 69–74% 20% 76% 4% 72% 69–74% 53% 50–55% 20% 77% 3% 53% 50–55%Overall Minnesota Clinic Average
WAtertoWn
Catalyst Medical Clinic Catalyst Medical Clinic
lakeview Clinic lakeview Clinic
WAyzAtA
Park nicollet Clinic Park nicollet Health services
West st. PAul
Allina Medical Clinic Allina Medical Clinic
Family Healthservices Minnesota- Family Healthservices Minnesota gorman Clinic
reshi Medical
WHIte BeAr lAke
AAlFA Family Clinic AAlFA Family Clinic
Aspen Medical group Aspen Medical group
Family Healthservices Minnesota Family Healthservices Minnesota
Family Healthservices Minnesota- Family Healthservices Minnesota Banning Avenue
HealthPartners HealthPartners Clinics
lifesteps Family Physicians, PA lifesteps Family Physicians
* * * * * * * * * * * * * * * * * *
94% 90%-98% 27% 71% 3% sample 64 94% 84%-98% * * * * * * * * *
79% 72%-85% 18% 80% 2% sample 328 79% 71%-85% 64% 57%-71% 18% 80% 2% sample 328 64% 56%-71%
72% 66%-78% 21% 77% 2% sample 409 72% 66%-78% 45% 39%-52% 21% 77% 2% sample 409 45% 39%-52%
81% 71%-91% 23% 75% 2% sample 137 81% 68%-90% 59% 35%-82% 23% 76% 1% sample 88 59% 38%-77%
* * * * * * * * * * * * * * * * * *
* * * * * * * * * * * * * * * * * *
74% 59%-89% 38% 60% 2% sample 167 72% 59%-83% 41% 26%-55% 38% 61% 1% sample 123 46% 34%-58%
81% 71%-91% 23% 75% 2% sample 137 81% 68%-90% 59% 35%-82% 23% 76% 1% sample 88 59% 38%-77%
81% 71%-91% 23% 75% 2% sample 137 81% 68%-90% 59% 35%-82% 23% 76% 1% sample 88 59% 38%-77%
75% 70%-81% 23% 75% 2% sample 919 76% 70%-81% 66% 59%-72% 23% 75% 2% sample 919 66% 60%-72%
* * * * * * * * * * * * * * * * * *
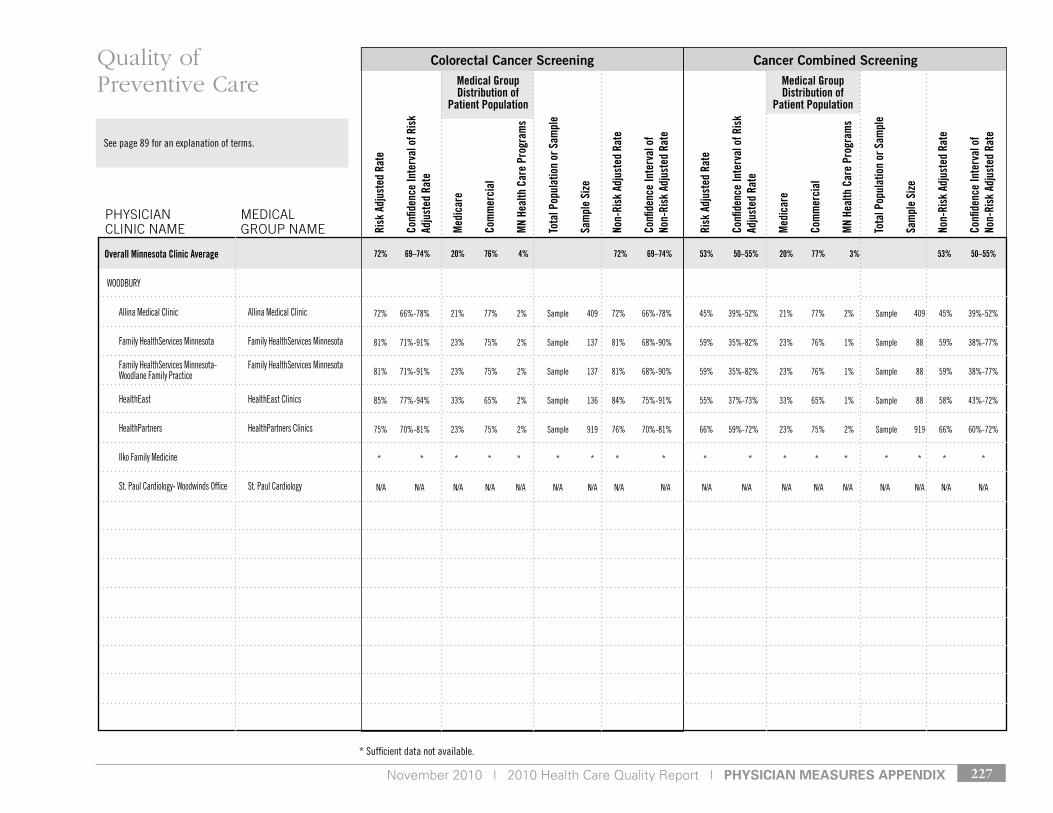
November 2010 | 2010 Health Care Quality Report | pHysiCian Measures appenDiX 227
* sufficient data not available.
see page 89 for an explanation of terms.
Medical Group Distribution of
Patient Population
Medical Group Distribution of
Patient Population
Risk
Adj
uste
d Ra
te
Confi
denc
e In
terv
al o
f Ris
k Ad
just
ed R
ate
Med
icar
e
Com
mer
cial
MN
Heal
th C
are
Prog
ram
s
Tota
l Pop
ulat
ion
or S
ampl
e
Sam
ple
Size
Non-
Risk
Adj
uste
d Ra
te
Confi
denc
e In
terv
al o
f No
n-Ri
sk A
djus
ted
Rate
Risk
Adj
uste
d Ra
te
Confi
denc
e In
terv
al o
f Ris
k Ad
just
ed R
ate
Med
icar
e
Com
mer
cial
MN
Heal
th C
are
Prog
ram
s
Tota
l Pop
ulat
ion
or S
ampl
e
Sam
ple
Size
Non-
Risk
Adj
uste
d Ra
te
Confi
denc
e In
terv
al o
f No
n-Ri
sk A
djus
ted
Rate
Colorectal Cancer Screening Cancer Combined Screening
PHySIcIAN cLINIc NAME
MEdIcAL GrOuP NAME
Quality of Preventive Care
72% 69–74% 20% 76% 4% 72% 69–74% 53% 50–55% 20% 77% 3% 53% 50–55%Overall Minnesota Clinic Average
WoodBury
Allina Medical Clinic Allina Medical Clinic
Family Healthservices Minnesota Family Healthservices Minnesota
Family Healthservices Minnesota- Family Healthservices Minnesota Woodlane Family Practice
Healtheast Healtheast Clinics
HealthPartners HealthPartners Clinics
Ilko Family Medicine
st. Paul Cardiology- Woodwinds office st. Paul Cardiology
72% 66%-78% 21% 77% 2% sample 409 72% 66%-78% 45% 39%-52% 21% 77% 2% sample 409 45% 39%-52%
81% 71%-91% 23% 75% 2% sample 137 81% 68%-90% 59% 35%-82% 23% 76% 1% sample 88 59% 38%-77%
81% 71%-91% 23% 75% 2% sample 137 81% 68%-90% 59% 35%-82% 23% 76% 1% sample 88 59% 38%-77%
85% 77%-94% 33% 65% 2% sample 136 84% 75%-91% 55% 37%-73% 33% 65% 1% sample 88 58% 43%-72%
75% 70%-81% 23% 75% 2% sample 919 76% 70%-81% 66% 59%-72% 23% 75% 2% sample 919 66% 60%-72%
* * * * * * * * * * * * * * * * * *
n/A n/A n/A n/A n/A n/A n/A n/A n/A n/A n/A n/A n/A n/A n/A n/A n/A n/A

pHysiCian Measures appenDiX | November 2010 | 2010 Health Care Quality Report228
* sufficient data not available.
see page 89 for an explanation of terms.
Medical Group Distribution of
Patient Population
Medical Group Distribution of
Patient Population
Risk
Adj
uste
d Ra
te
Confi
denc
e In
terv
al o
f Ris
k Ad
just
ed R
ate
Med
icar
e
Com
mer
cial
MN
Heal
th C
are
Prog
ram
s
Tota
l Pop
ulat
ion
or S
ampl
e
Sam
ple
Size
Non-
Risk
Adj
uste
d Ra
te
Confi
denc
e In
terv
al o
f No
n-Ri
sk A
djus
ted
Rate
Risk
Adj
uste
d Ra
te
Confi
denc
e In
terv
al o
f Ris
k Ad
just
ed R
ate
Med
icar
e
Com
mer
cial
MN
Heal
th C
are
Prog
ram
s
Tota
l Pop
ulat
ion
or S
ampl
e
Sam
ple
Size
Non-
Risk
Adj
uste
d Ra
te
Confi
denc
e In
terv
al o
f No
n-Ri
sk A
djus
ted
Rate
Chlamydia Screening Childhood Immunization Status
PHySIcIAN cLINIc NAME
MEdIcAL GrOuP NAME
Quality of Preventive Care
49% 49–50% NA 77% 23% 49% 49–50% 80% 78–81% NA 63% 37% 80% 78–81%Overall Minnesota Clinic Average
Andover
Fairview Andover Clinic Fairview Health services
HealthPartners- riverWay HealthPartners Clinics
AnokA
HealthPartners- riverWay HealthPartners Clinics
APPle vAlley
Apple valley Medical Clinic Apple valley Medical Clinic
Fairview Cedarridge Clinic Fairview Health services
HealthPartners HealthPartners Clinics
Md Physicals Incorporated
Arden HIlls
HealthPartners HealthPartners Clinics
Belle PlAIne
southern Metro Medical Clinics southern Metro Medical Clinics
BlAIne
Allina Medical Clinic Allina Medical Clinic
* * n/A * * * * * * * * n/A * * * * * *
68% 67%-70% n/A 82% 18% total Population 5902 68% 67%-69% 86% 80%-91% n/A 68% 32% sample 283 86% 79%-91%
68% 67%-70% n/A 82% 18% total Population 5902 68% 67%-69% 86% 80%-91% n/A 68% 32% sample 283 86% 79%-91%
61% 55%-67% n/A 93% 7% total Population 301 59% 53%-64% * * n/A * * * * * *
57% 56%-59% n/A 77% 23% total Population 3293 57% 55%-59% 84% 78%-89% n/A 64% 36% sample 254 84% 78%-89%
68% 67%-70% n/A 82% 18% total Population 5902 68% 67%-69% 86% 80%-91% n/A 68% 32% sample 283 86% 79%-91%
* * n/A * * * * * * * * n/A * * * * * *
68% 67%-70% n/A 82% 18% total Population 5902 68% 67%-69% 86% 80%-91% n/A 68% 32% sample 283 86% 79%-91%
41% 32%-52% n/A 93% 7% total Population 107 41% 32%-51% * * n/A * * * * * *
61% 59%-62% n/A 81% 19% total Population 4876 60% 59%-62% 81% 74%-87% n/A 68% 32% sample 244 81% 73%-86%
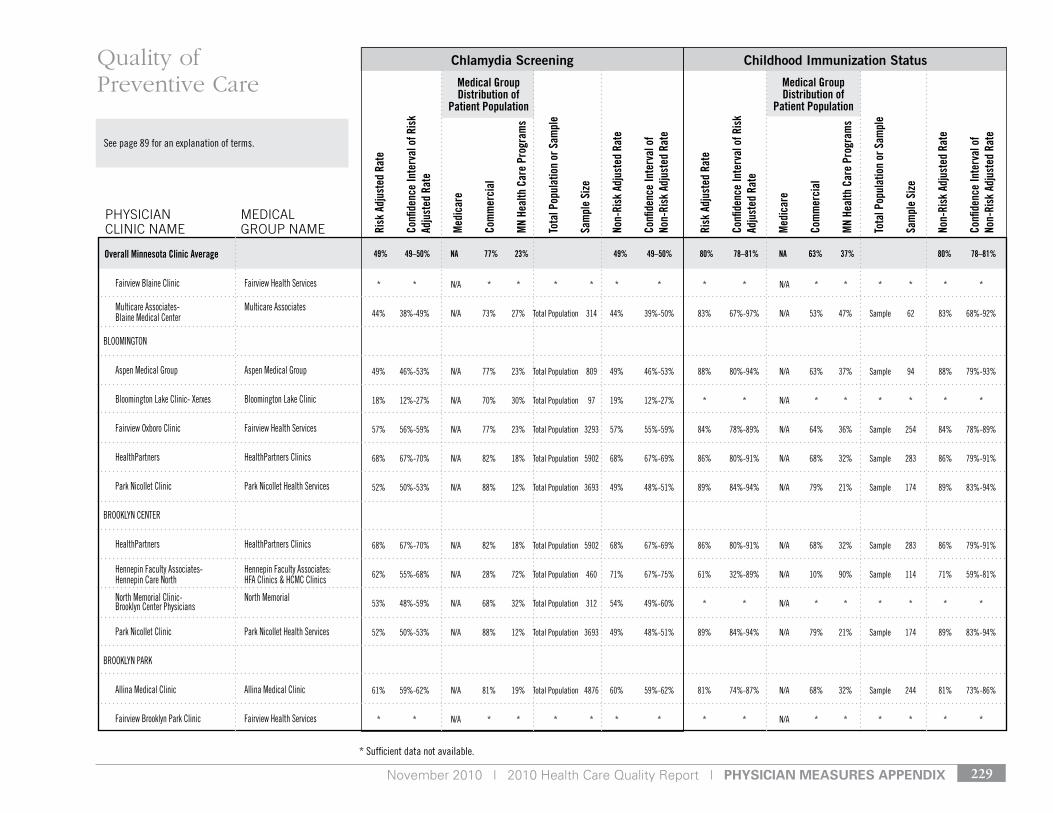
November 2010 | 2010 Health Care Quality Report | pHysiCian Measures appenDiX 229
* sufficient data not available.
see page 89 for an explanation of terms.
Medical Group Distribution of
Patient Population
Medical Group Distribution of
Patient Population
Risk
Adj
uste
d Ra
te
Confi
denc
e In
terv
al o
f Ris
k Ad
just
ed R
ate
Med
icar
e
Com
mer
cial
MN
Heal
th C
are
Prog
ram
s
Tota
l Pop
ulat
ion
or S
ampl
e
Sam
ple
Size
Non-
Risk
Adj
uste
d Ra
te
Confi
denc
e In
terv
al o
f No
n-Ri
sk A
djus
ted
Rate
Risk
Adj
uste
d Ra
te
Confi
denc
e In
terv
al o
f Ris
k Ad
just
ed R
ate
Med
icar
e
Com
mer
cial
MN
Heal
th C
are
Prog
ram
s
Tota
l Pop
ulat
ion
or S
ampl
e
Sam
ple
Size
Non-
Risk
Adj
uste
d Ra
te
Confi
denc
e In
terv
al o
f No
n-Ri
sk A
djus
ted
Rate
Chlamydia Screening Childhood Immunization Status
PHySIcIAN cLINIc NAME
MEdIcAL GrOuP NAME
Quality of Preventive Care
49% 49–50% NA 77% 23% 49% 49–50% 80% 78–81% NA 63% 37% 80% 78–81%Overall Minnesota Clinic Average
Fairview Blaine Clinic Fairview Health services
Multicare Associates- Multicare Associates Blaine Medical Center
BlooMIngton
Aspen Medical group Aspen Medical group
Bloomington lake Clinic- Xerxes Bloomington lake Clinic
Fairview oxboro Clinic Fairview Health services
HealthPartners HealthPartners Clinics
Park nicollet Clinic Park nicollet Health services
Brooklyn Center
HealthPartners HealthPartners Clinics
Hennepin Faculty Associates- Hennepin Faculty Associates: Hennepin Care north HFA Clinics & HCMC Clinics
north Memorial Clinic- north Memorial Brooklyn Center Physicians
Park nicollet Clinic Park nicollet Health services
Brooklyn PArk
Allina Medical Clinic Allina Medical Clinic
Fairview Brooklyn Park Clinic Fairview Health services
* * n/A * * * * * * * * n/A * * * * * *
44% 38%-49% n/A 73% 27% total Population 314 44% 39%-50% 83% 67%-97% n/A 53% 47% sample 62 83% 68%-92%
49% 46%-53% n/A 77% 23% total Population 809 49% 46%-53% 88% 80%-94% n/A 63% 37% sample 94 88% 79%-93%
18% 12%-27% n/A 70% 30% total Population 97 19% 12%-27% * * n/A * * * * * *
57% 56%-59% n/A 77% 23% total Population 3293 57% 55%-59% 84% 78%-89% n/A 64% 36% sample 254 84% 78%-89%
68% 67%-70% n/A 82% 18% total Population 5902 68% 67%-69% 86% 80%-91% n/A 68% 32% sample 283 86% 79%-91%
52% 50%-53% n/A 88% 12% total Population 3693 49% 48%-51% 89% 84%-94% n/A 79% 21% sample 174 89% 83%-94%
68% 67%-70% n/A 82% 18% total Population 5902 68% 67%-69% 86% 80%-91% n/A 68% 32% sample 283 86% 79%-91%
62% 55%-68% n/A 28% 72% total Population 460 71% 67%-75% 61% 32%-89% n/A 10% 90% sample 114 71% 59%-81%
53% 48%-59% n/A 68% 32% total Population 312 54% 49%-60% * * n/A * * * * * *
52% 50%-53% n/A 88% 12% total Population 3693 49% 48%-51% 89% 84%-94% n/A 79% 21% sample 174 89% 83%-94%
61% 59%-62% n/A 81% 19% total Population 4876 60% 59%-62% 81% 74%-87% n/A 68% 32% sample 244 81% 73%-86%
* * n/A * * * * * * * * n/A * * * * * *
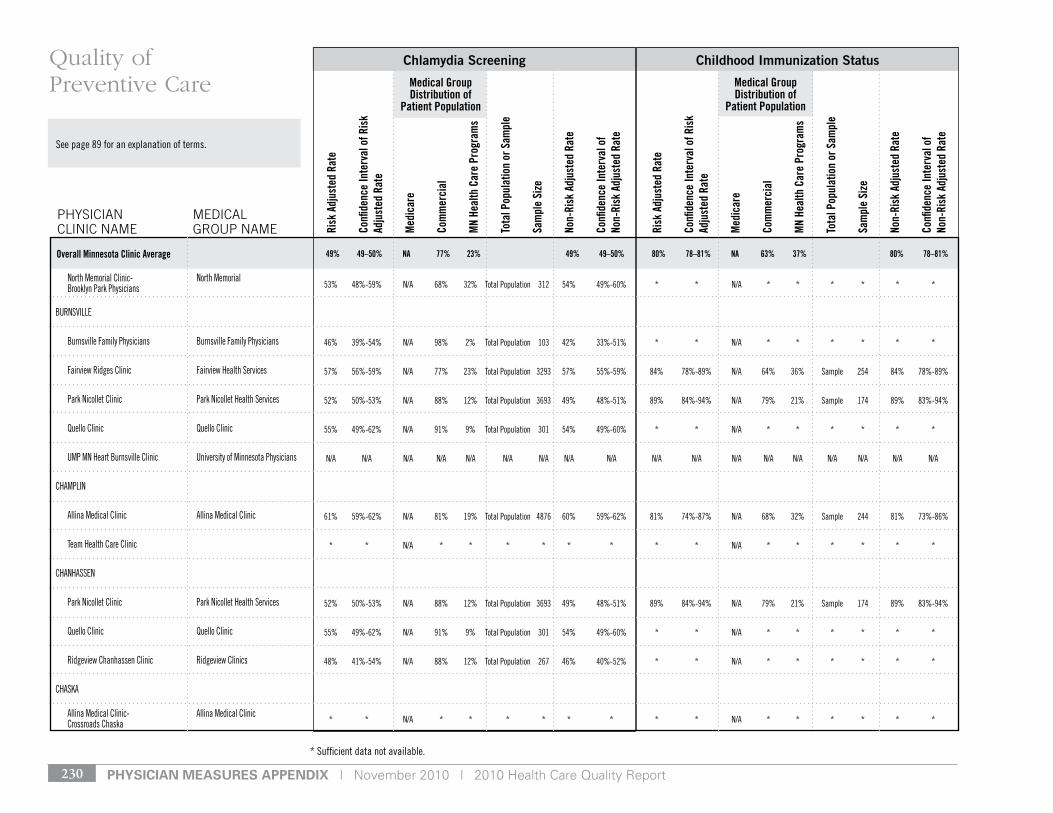
pHysiCian Measures appenDiX | November 2010 | 2010 Health Care Quality Report230
* sufficient data not available.
see page 89 for an explanation of terms.
Medical Group Distribution of
Patient Population
Medical Group Distribution of
Patient Population
Risk
Adj
uste
d Ra
te
Confi
denc
e In
terv
al o
f Ris
k Ad
just
ed R
ate
Med
icar
e
Com
mer
cial
MN
Heal
th C
are
Prog
ram
s
Tota
l Pop
ulat
ion
or S
ampl
e
Sam
ple
Size
Non-
Risk
Adj
uste
d Ra
te
Confi
denc
e In
terv
al o
f No
n-Ri
sk A
djus
ted
Rate
Risk
Adj
uste
d Ra
te
Confi
denc
e In
terv
al o
f Ris
k Ad
just
ed R
ate
Med
icar
e
Com
mer
cial
MN
Heal
th C
are
Prog
ram
s
Tota
l Pop
ulat
ion
or S
ampl
e
Sam
ple
Size
Non-
Risk
Adj
uste
d Ra
te
Confi
denc
e In
terv
al o
f No
n-Ri
sk A
djus
ted
Rate
Chlamydia Screening Childhood Immunization Status
PHySIcIAN cLINIc NAME
MEdIcAL GrOuP NAME
Quality of Preventive Care
49% 49–50% NA 77% 23% 49% 49–50% 80% 78–81% NA 63% 37% 80% 78–81%Overall Minnesota Clinic Average
north Memorial Clinic- north Memorial Brooklyn Park Physicians
BurnsvIlle
Burnsville Family Physicians Burnsville Family Physicians
Fairview ridges Clinic Fairview Health services
Park nicollet Clinic Park nicollet Health services
Quello Clinic Quello Clinic
uMP Mn Heart Burnsville Clinic university of Minnesota Physicians
CHAMPlIn
Allina Medical Clinic Allina Medical Clinic
team Health Care Clinic
CHAnHAssen
Park nicollet Clinic Park nicollet Health services
Quello Clinic Quello Clinic
ridgeview Chanhassen Clinic ridgeview Clinics
CHAskA
Allina Medical Clinic- Allina Medical Clinic Crossroads Chaska
53% 48%-59% n/A 68% 32% total Population 312 54% 49%-60% * * n/A * * * * * *
46% 39%-54% n/A 98% 2% total Population 103 42% 33%-51% * * n/A * * * * * *
57% 56%-59% n/A 77% 23% total Population 3293 57% 55%-59% 84% 78%-89% n/A 64% 36% sample 254 84% 78%-89%
52% 50%-53% n/A 88% 12% total Population 3693 49% 48%-51% 89% 84%-94% n/A 79% 21% sample 174 89% 83%-94%
55% 49%-62% n/A 91% 9% total Population 301 54% 49%-60% * * n/A * * * * * *
n/A n/A n/A n/A n/A n/A n/A n/A n/A n/A n/A n/A n/A n/A n/A n/A n/A n/A
61% 59%-62% n/A 81% 19% total Population 4876 60% 59%-62% 81% 74%-87% n/A 68% 32% sample 244 81% 73%-86%
* * n/A * * * * * * * * n/A * * * * * *
52% 50%-53% n/A 88% 12% total Population 3693 49% 48%-51% 89% 84%-94% n/A 79% 21% sample 174 89% 83%-94%
55% 49%-62% n/A 91% 9% total Population 301 54% 49%-60% * * n/A * * * * * *
48% 41%-54% n/A 88% 12% total Population 267 46% 40%-52% * * n/A * * * * * *
* * n/A * * * * * * * * n/A * * * * * *
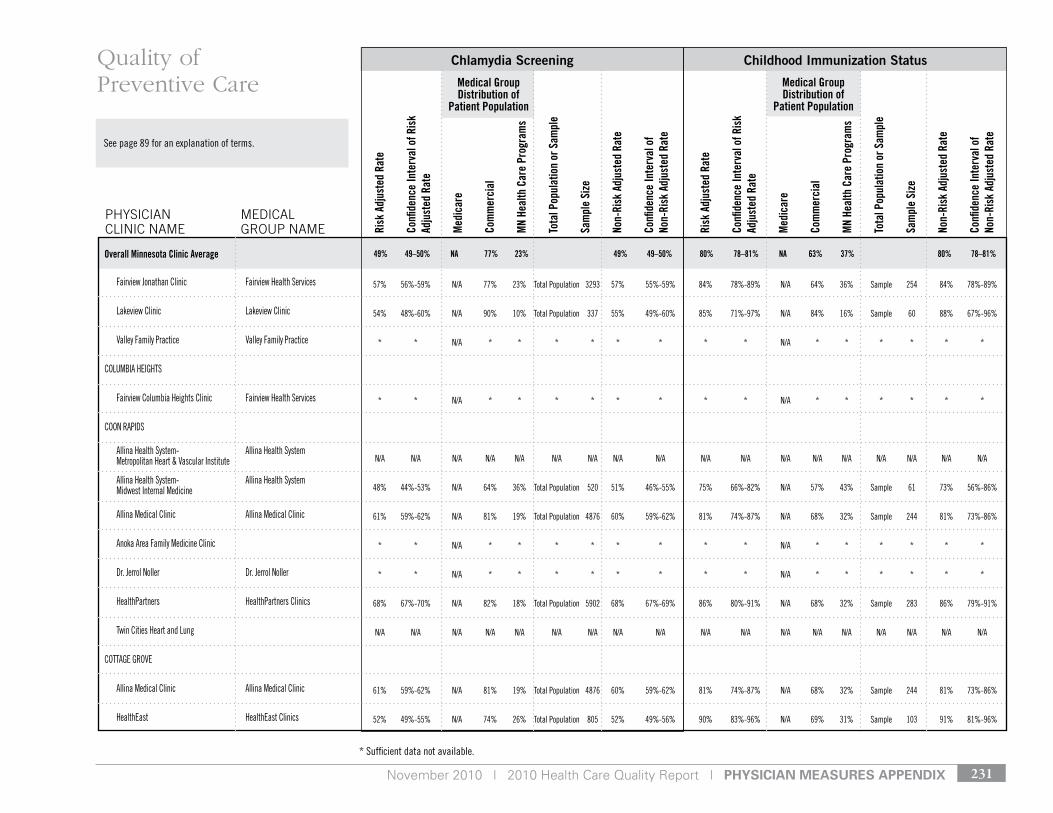
November 2010 | 2010 Health Care Quality Report | pHysiCian Measures appenDiX 231
* sufficient data not available.
see page 89 for an explanation of terms.
Medical Group Distribution of
Patient Population
Medical Group Distribution of
Patient Population
Risk
Adj
uste
d Ra
te
Confi
denc
e In
terv
al o
f Ris
k Ad
just
ed R
ate
Med
icar
e
Com
mer
cial
MN
Heal
th C
are
Prog
ram
s
Tota
l Pop
ulat
ion
or S
ampl
e
Sam
ple
Size
Non-
Risk
Adj
uste
d Ra
te
Confi
denc
e In
terv
al o
f No
n-Ri
sk A
djus
ted
Rate
Risk
Adj
uste
d Ra
te
Confi
denc
e In
terv
al o
f Ris
k Ad
just
ed R
ate
Med
icar
e
Com
mer
cial
MN
Heal
th C
are
Prog
ram
s
Tota
l Pop
ulat
ion
or S
ampl
e
Sam
ple
Size
Non-
Risk
Adj
uste
d Ra
te
Confi
denc
e In
terv
al o
f No
n-Ri
sk A
djus
ted
Rate
Chlamydia Screening Childhood Immunization Status
PHySIcIAN cLINIc NAME
MEdIcAL GrOuP NAME
Quality of Preventive Care
49% 49–50% NA 77% 23% 49% 49–50% 80% 78–81% NA 63% 37% 80% 78–81%Overall Minnesota Clinic Average
Fairview Jonathan Clinic Fairview Health services
lakeview Clinic lakeview Clinic
valley Family Practice valley Family Practice
ColuMBIA HeIgHts
Fairview Columbia Heights Clinic Fairview Health services
Coon rAPIds
Allina Health system- Allina Health system Metropolitan Heart & vascular Institute
Allina Health system- Allina Health system Midwest Internal Medicine
Allina Medical Clinic Allina Medical Clinic
Anoka Area Family Medicine Clinic
dr. Jerrol noller dr. Jerrol noller
HealthPartners HealthPartners Clinics
twin Cities Heart and lung
CottAge grove
Allina Medical Clinic Allina Medical Clinic
Healtheast Healtheast Clinics
57% 56%-59% n/A 77% 23% total Population 3293 57% 55%-59% 84% 78%-89% n/A 64% 36% sample 254 84% 78%-89%
54% 48%-60% n/A 90% 10% total Population 337 55% 49%-60% 85% 71%-97% n/A 84% 16% sample 60 88% 67%-96%
* * n/A * * * * * * * * n/A * * * * * *
* * n/A * * * * * * * * n/A * * * * * *
n/A n/A n/A n/A n/A n/A n/A n/A n/A n/A n/A n/A n/A n/A n/A n/A n/A n/A
48% 44%-53% n/A 64% 36% total Population 520 51% 46%-55% 75% 66%-82% n/A 57% 43% sample 61 73% 56%-86%
61% 59%-62% n/A 81% 19% total Population 4876 60% 59%-62% 81% 74%-87% n/A 68% 32% sample 244 81% 73%-86%
* * n/A * * * * * * * * n/A * * * * * *
* * n/A * * * * * * * * n/A * * * * * *
68% 67%-70% n/A 82% 18% total Population 5902 68% 67%-69% 86% 80%-91% n/A 68% 32% sample 283 86% 79%-91%
n/A n/A n/A n/A n/A n/A n/A n/A n/A n/A n/A n/A n/A n/A n/A n/A n/A n/A
61% 59%-62% n/A 81% 19% total Population 4876 60% 59%-62% 81% 74%-87% n/A 68% 32% sample 244 81% 73%-86%
52% 49%-55% n/A 74% 26% total Population 805 52% 49%-56% 90% 83%-96% n/A 69% 31% sample 103 91% 81%-96%
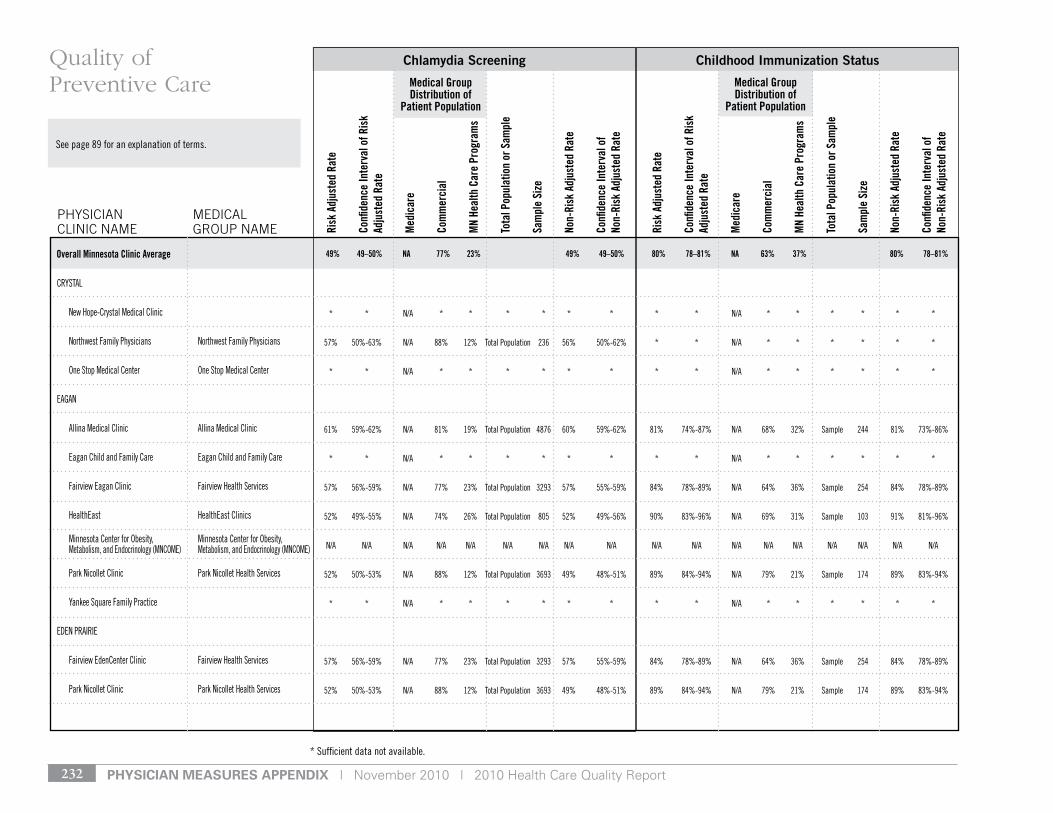
pHysiCian Measures appenDiX | November 2010 | 2010 Health Care Quality Report232
* sufficient data not available.
see page 89 for an explanation of terms.
Medical Group Distribution of
Patient Population
Medical Group Distribution of
Patient Population
Risk
Adj
uste
d Ra
te
Confi
denc
e In
terv
al o
f Ris
k Ad
just
ed R
ate
Med
icar
e
Com
mer
cial
MN
Heal
th C
are
Prog
ram
s
Tota
l Pop
ulat
ion
or S
ampl
e
Sam
ple
Size
Non-
Risk
Adj
uste
d Ra
te
Confi
denc
e In
terv
al o
f No
n-Ri
sk A
djus
ted
Rate
Risk
Adj
uste
d Ra
te
Confi
denc
e In
terv
al o
f Ris
k Ad
just
ed R
ate
Med
icar
e
Com
mer
cial
MN
Heal
th C
are
Prog
ram
s
Tota
l Pop
ulat
ion
or S
ampl
e
Sam
ple
Size
Non-
Risk
Adj
uste
d Ra
te
Confi
denc
e In
terv
al o
f No
n-Ri
sk A
djus
ted
Rate
Chlamydia Screening Childhood Immunization Status
PHySIcIAN cLINIc NAME
MEdIcAL GrOuP NAME
Quality of Preventive Care
49% 49–50% NA 77% 23% 49% 49–50% 80% 78–81% NA 63% 37% 80% 78–81%Overall Minnesota Clinic Average
CrystAl
new Hope-Crystal Medical Clinic
northwest Family Physicians northwest Family Physicians
one stop Medical Center one stop Medical Center
eAgAn
Allina Medical Clinic Allina Medical Clinic
eagan Child and Family Care eagan Child and Family Care
Fairview eagan Clinic Fairview Health services
Healtheast Healtheast Clinics
Minnesota Center for obesity, Minnesota Center for obesity, Metabolism, and endocrinology (MnCoMe) Metabolism, and endocrinology (MnCoMe)
Park nicollet Clinic Park nicollet Health services
yankee square Family Practice
eden PrAIrIe
Fairview edenCenter Clinic Fairview Health services
Park nicollet Clinic Park nicollet Health services
* * n/A * * * * * * * * n/A * * * * * *
57% 50%-63% n/A 88% 12% total Population 236 56% 50%-62% * * n/A * * * * * *
* * n/A * * * * * * * * n/A * * * * * *
61% 59%-62% n/A 81% 19% total Population 4876 60% 59%-62% 81% 74%-87% n/A 68% 32% sample 244 81% 73%-86%
* * n/A * * * * * * * * n/A * * * * * *
57% 56%-59% n/A 77% 23% total Population 3293 57% 55%-59% 84% 78%-89% n/A 64% 36% sample 254 84% 78%-89%
52% 49%-55% n/A 74% 26% total Population 805 52% 49%-56% 90% 83%-96% n/A 69% 31% sample 103 91% 81%-96%
n/A n/A n/A n/A n/A n/A n/A n/A n/A n/A n/A n/A n/A n/A n/A n/A n/A n/A
52% 50%-53% n/A 88% 12% total Population 3693 49% 48%-51% 89% 84%-94% n/A 79% 21% sample 174 89% 83%-94%
* * n/A * * * * * * * * n/A * * * * * *
57% 56%-59% n/A 77% 23% total Population 3293 57% 55%-59% 84% 78%-89% n/A 64% 36% sample 254 84% 78%-89%
52% 50%-53% n/A 88% 12% total Population 3693 49% 48%-51% 89% 84%-94% n/A 79% 21% sample 174 89% 83%-94%
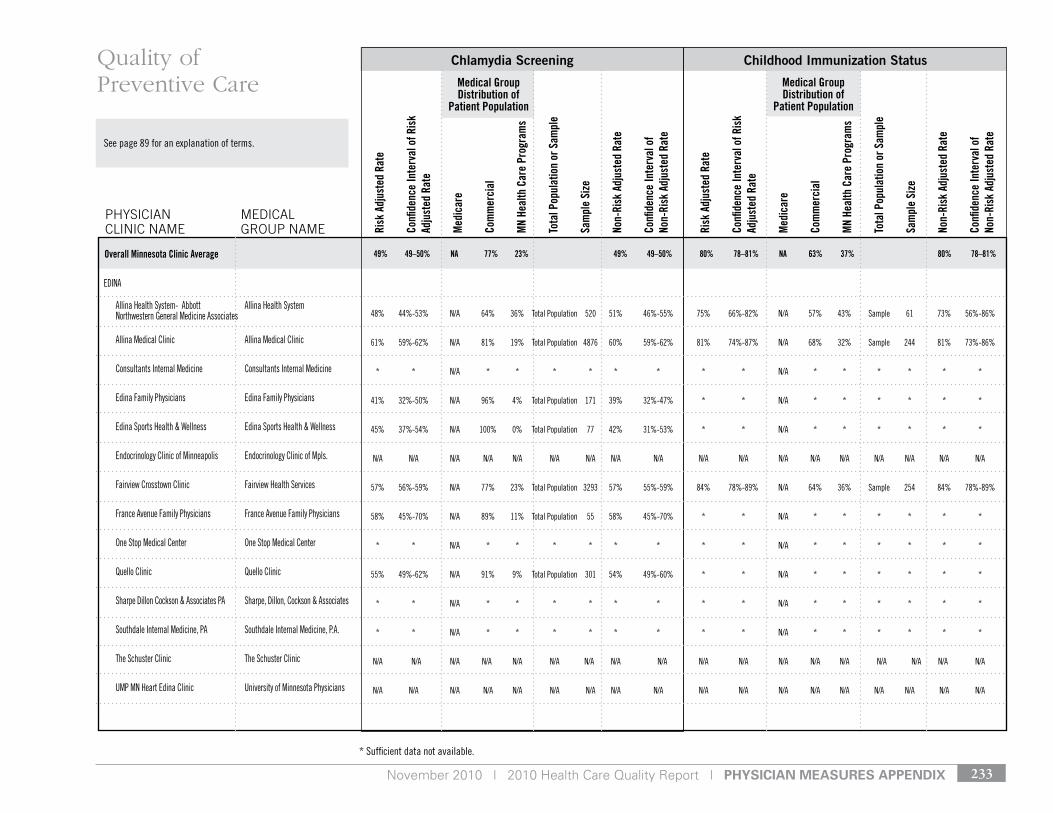
November 2010 | 2010 Health Care Quality Report | pHysiCian Measures appenDiX 233
* sufficient data not available.
see page 89 for an explanation of terms.
Medical Group Distribution of
Patient Population
Medical Group Distribution of
Patient Population
Risk
Adj
uste
d Ra
te
Confi
denc
e In
terv
al o
f Ris
k Ad
just
ed R
ate
Med
icar
e
Com
mer
cial
MN
Heal
th C
are
Prog
ram
s
Tota
l Pop
ulat
ion
or S
ampl
e
Sam
ple
Size
Non-
Risk
Adj
uste
d Ra
te
Confi
denc
e In
terv
al o
f No
n-Ri
sk A
djus
ted
Rate
Risk
Adj
uste
d Ra
te
Confi
denc
e In
terv
al o
f Ris
k Ad
just
ed R
ate
Med
icar
e
Com
mer
cial
MN
Heal
th C
are
Prog
ram
s
Tota
l Pop
ulat
ion
or S
ampl
e
Sam
ple
Size
Non-
Risk
Adj
uste
d Ra
te
Confi
denc
e In
terv
al o
f No
n-Ri
sk A
djus
ted
Rate
Chlamydia Screening Childhood Immunization Status
PHySIcIAN cLINIc NAME
MEdIcAL GrOuP NAME
Quality of Preventive Care
49% 49–50% NA 77% 23% 49% 49–50% 80% 78–81% NA 63% 37% 80% 78–81%Overall Minnesota Clinic Average
edInA
Allina Health system- Abbott Allina Health system northwestern general Medicine Associates
Allina Medical Clinic Allina Medical Clinic
Consultants Internal Medicine Consultants Internal Medicine
edina Family Physicians edina Family Physicians
edina sports Health & Wellness edina sports Health & Wellness
endocrinology Clinic of Minneapolis endocrinology Clinic of Mpls.
Fairview Crosstown Clinic Fairview Health services
France Avenue Family Physicians France Avenue Family Physicians
one stop Medical Center one stop Medical Center
Quello Clinic Quello Clinic
sharpe dillon Cockson & Associates PA sharpe, dillon, Cockson & Associates
southdale Internal Medicine, PA southdale Internal Medicine, P.A.
the schuster Clinic the schuster Clinic
uMP Mn Heart edina Clinic university of Minnesota Physicians
48% 44%-53% n/A 64% 36% total Population 520 51% 46%-55% 75% 66%-82% n/A 57% 43% sample 61 73% 56%-86%
61% 59%-62% n/A 81% 19% total Population 4876 60% 59%-62% 81% 74%-87% n/A 68% 32% sample 244 81% 73%-86%
* * n/A * * * * * * * * n/A * * * * * *
41% 32%-50% n/A 96% 4% total Population 171 39% 32%-47% * * n/A * * * * * *
45% 37%-54% n/A 100% 0% total Population 77 42% 31%-53% * * n/A * * * * * *
n/A n/A n/A n/A n/A n/A n/A n/A n/A n/A n/A n/A n/A n/A n/A n/A n/A n/A
57% 56%-59% n/A 77% 23% total Population 3293 57% 55%-59% 84% 78%-89% n/A 64% 36% sample 254 84% 78%-89%
58% 45%-70% n/A 89% 11% total Population 55 58% 45%-70% * * n/A * * * * * *
* * n/A * * * * * * * * n/A * * * * * *
55% 49%-62% n/A 91% 9% total Population 301 54% 49%-60% * * n/A * * * * * *
* * n/A * * * * * * * * n/A * * * * * *
* * n/A * * * * * * * * n/A * * * * * *
n/A n/A n/A n/A n/A n/A n/A n/A n/A n/A n/A n/A n/A n/A n/A n/A n/A n/A
n/A n/A n/A n/A n/A n/A n/A n/A n/A n/A n/A n/A n/A n/A n/A n/A n/A n/A
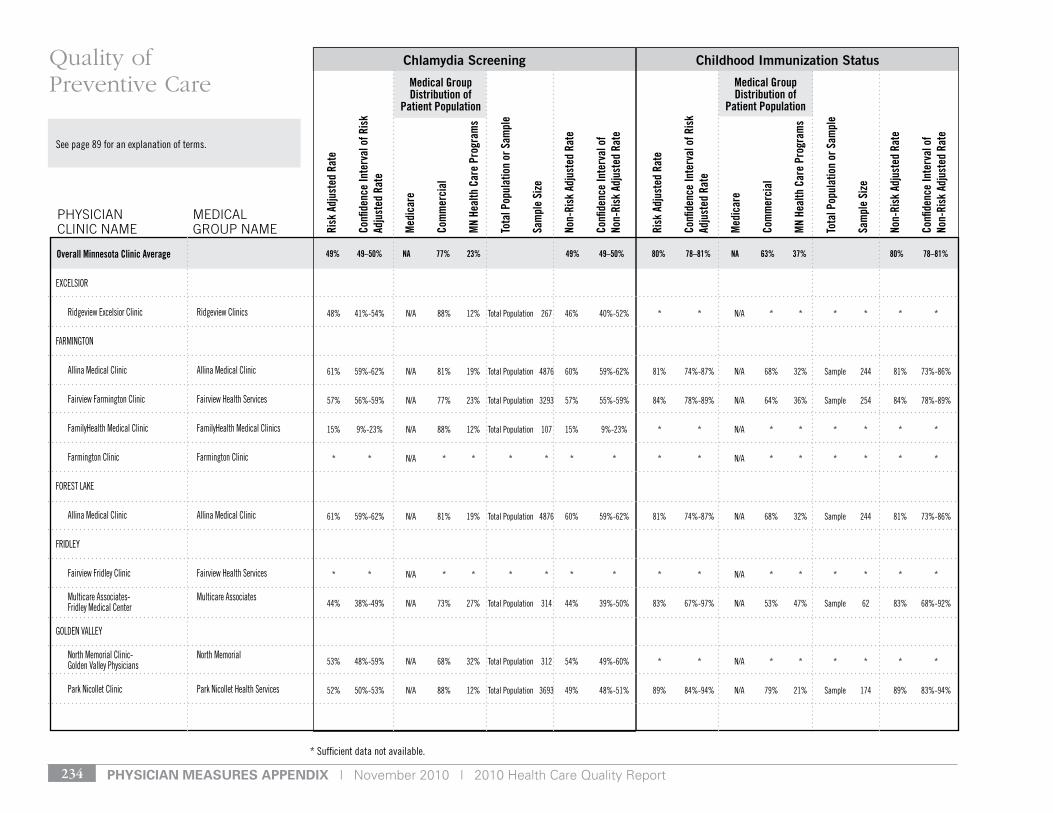
pHysiCian Measures appenDiX | November 2010 | 2010 Health Care Quality Report234
* sufficient data not available.
see page 89 for an explanation of terms.
Medical Group Distribution of
Patient Population
Medical Group Distribution of
Patient Population
Risk
Adj
uste
d Ra
te
Confi
denc
e In
terv
al o
f Ris
k Ad
just
ed R
ate
Med
icar
e
Com
mer
cial
MN
Heal
th C
are
Prog
ram
s
Tota
l Pop
ulat
ion
or S
ampl
e
Sam
ple
Size
Non-
Risk
Adj
uste
d Ra
te
Confi
denc
e In
terv
al o
f No
n-Ri
sk A
djus
ted
Rate
Risk
Adj
uste
d Ra
te
Confi
denc
e In
terv
al o
f Ris
k Ad
just
ed R
ate
Med
icar
e
Com
mer
cial
MN
Heal
th C
are
Prog
ram
s
Tota
l Pop
ulat
ion
or S
ampl
e
Sam
ple
Size
Non-
Risk
Adj
uste
d Ra
te
Confi
denc
e In
terv
al o
f No
n-Ri
sk A
djus
ted
Rate
Chlamydia Screening Childhood Immunization Status
PHySIcIAN cLINIc NAME
MEdIcAL GrOuP NAME
Quality of Preventive Care
49% 49–50% NA 77% 23% 49% 49–50% 80% 78–81% NA 63% 37% 80% 78–81%Overall Minnesota Clinic Average
eXCelsIor
ridgeview excelsior Clinic ridgeview Clinics
FArMIngton
Allina Medical Clinic Allina Medical Clinic
Fairview Farmington Clinic Fairview Health services
FamilyHealth Medical Clinic FamilyHealth Medical Clinics
Farmington Clinic Farmington Clinic
Forest lAke
Allina Medical Clinic Allina Medical Clinic
FrIdley
Fairview Fridley Clinic Fairview Health services
Multicare Associates- Multicare Associates Fridley Medical Center
golden vAlley
north Memorial Clinic- north Memorial golden valley Physicians
Park nicollet Clinic Park nicollet Health services
48% 41%-54% n/A 88% 12% total Population 267 46% 40%-52% * * n/A * * * * * *
61% 59%-62% n/A 81% 19% total Population 4876 60% 59%-62% 81% 74%-87% n/A 68% 32% sample 244 81% 73%-86%
57% 56%-59% n/A 77% 23% total Population 3293 57% 55%-59% 84% 78%-89% n/A 64% 36% sample 254 84% 78%-89%
15% 9%-23% n/A 88% 12% total Population 107 15% 9%-23% * * n/A * * * * * *
* * n/A * * * * * * * * n/A * * * * * *
61% 59%-62% n/A 81% 19% total Population 4876 60% 59%-62% 81% 74%-87% n/A 68% 32% sample 244 81% 73%-86%
* * n/A * * * * * * * * n/A * * * * * *
44% 38%-49% n/A 73% 27% total Population 314 44% 39%-50% 83% 67%-97% n/A 53% 47% sample 62 83% 68%-92%
53% 48%-59% n/A 68% 32% total Population 312 54% 49%-60% * * n/A * * * * * *
52% 50%-53% n/A 88% 12% total Population 3693 49% 48%-51% 89% 84%-94% n/A 79% 21% sample 174 89% 83%-94%
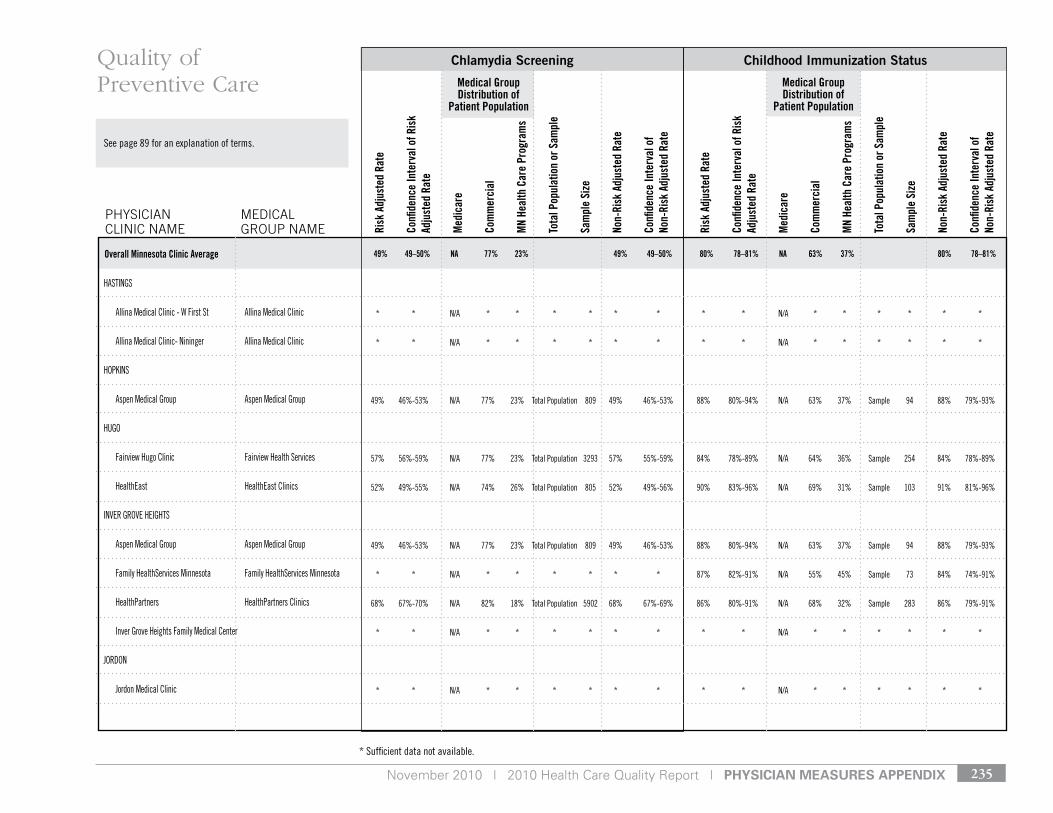
November 2010 | 2010 Health Care Quality Report | pHysiCian Measures appenDiX 235
* sufficient data not available.
see page 89 for an explanation of terms.
Medical Group Distribution of
Patient Population
Medical Group Distribution of
Patient Population
Risk
Adj
uste
d Ra
te
Confi
denc
e In
terv
al o
f Ris
k Ad
just
ed R
ate
Med
icar
e
Com
mer
cial
MN
Heal
th C
are
Prog
ram
s
Tota
l Pop
ulat
ion
or S
ampl
e
Sam
ple
Size
Non-
Risk
Adj
uste
d Ra
te
Confi
denc
e In
terv
al o
f No
n-Ri
sk A
djus
ted
Rate
Risk
Adj
uste
d Ra
te
Confi
denc
e In
terv
al o
f Ris
k Ad
just
ed R
ate
Med
icar
e
Com
mer
cial
MN
Heal
th C
are
Prog
ram
s
Tota
l Pop
ulat
ion
or S
ampl
e
Sam
ple
Size
Non-
Risk
Adj
uste
d Ra
te
Confi
denc
e In
terv
al o
f No
n-Ri
sk A
djus
ted
Rate
Chlamydia Screening Childhood Immunization Status
PHySIcIAN cLINIc NAME
MEdIcAL GrOuP NAME
Quality of Preventive Care
49% 49–50% NA 77% 23% 49% 49–50% 80% 78–81% NA 63% 37% 80% 78–81%Overall Minnesota Clinic Average
HAstIngs
Allina Medical Clinic - W First st Allina Medical Clinic
Allina Medical Clinic- nininger Allina Medical Clinic
HoPkIns
Aspen Medical group Aspen Medical group
Hugo
Fairview Hugo Clinic Fairview Health services
Healtheast Healtheast Clinics
Inver grove HeIgHts
Aspen Medical group Aspen Medical group
Family Healthservices Minnesota Family Healthservices Minnesota
HealthPartners HealthPartners Clinics
Inver grove Heights Family Medical Center
Jordon
Jordon Medical Clinic
* * n/A * * * * * * * * n/A * * * * * *
* * n/A * * * * * * * * n/A * * * * * *
49% 46%-53% n/A 77% 23% total Population 809 49% 46%-53% 88% 80%-94% n/A 63% 37% sample 94 88% 79%-93%
57% 56%-59% n/A 77% 23% total Population 3293 57% 55%-59% 84% 78%-89% n/A 64% 36% sample 254 84% 78%-89%
52% 49%-55% n/A 74% 26% total Population 805 52% 49%-56% 90% 83%-96% n/A 69% 31% sample 103 91% 81%-96%
49% 46%-53% n/A 77% 23% total Population 809 49% 46%-53% 88% 80%-94% n/A 63% 37% sample 94 88% 79%-93%
* * n/A * * * * * * 87% 82%-91% n/A 55% 45% sample 73 84% 74%-91%
68% 67%-70% n/A 82% 18% total Population 5902 68% 67%-69% 86% 80%-91% n/A 68% 32% sample 283 86% 79%-91%
* * n/A * * * * * * * * n/A * * * * * *
* * n/A * * * * * * * * n/A * * * * * *
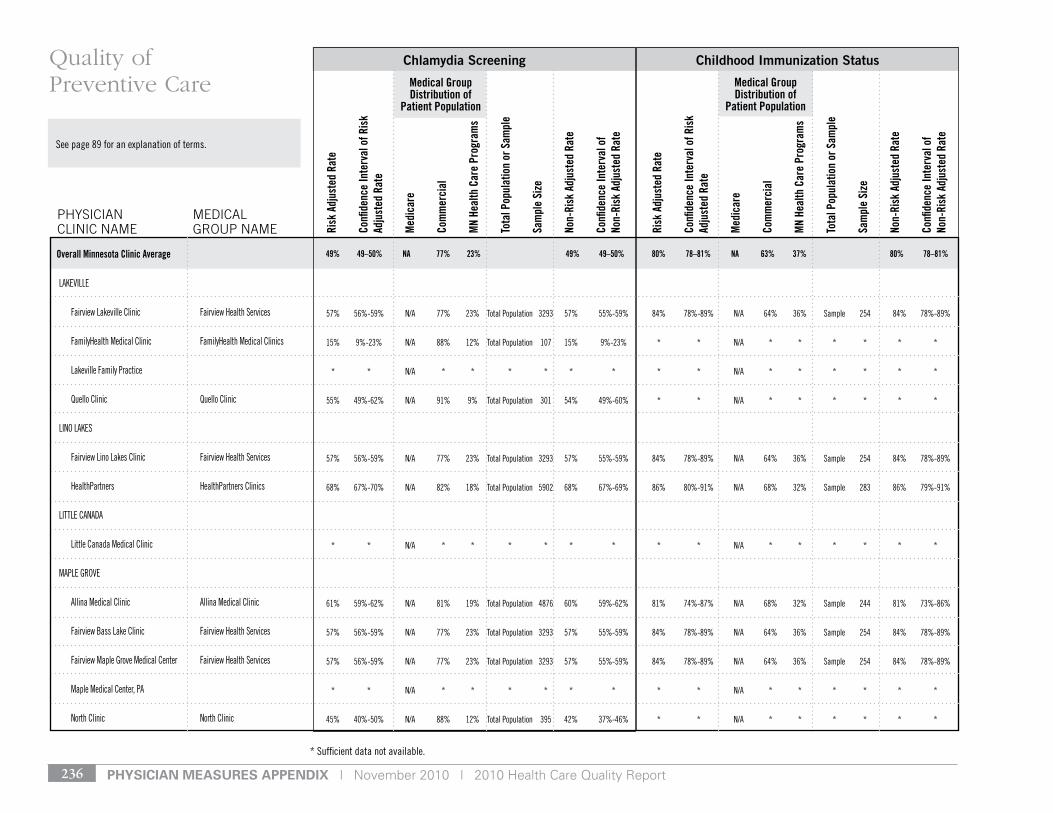
pHysiCian Measures appenDiX | November 2010 | 2010 Health Care Quality Report236
* sufficient data not available.
see page 89 for an explanation of terms.
Medical Group Distribution of
Patient Population
Medical Group Distribution of
Patient Population
Risk
Adj
uste
d Ra
te
Confi
denc
e In
terv
al o
f Ris
k Ad
just
ed R
ate
Med
icar
e
Com
mer
cial
MN
Heal
th C
are
Prog
ram
s
Tota
l Pop
ulat
ion
or S
ampl
e
Sam
ple
Size
Non-
Risk
Adj
uste
d Ra
te
Confi
denc
e In
terv
al o
f No
n-Ri
sk A
djus
ted
Rate
Risk
Adj
uste
d Ra
te
Confi
denc
e In
terv
al o
f Ris
k Ad
just
ed R
ate
Med
icar
e
Com
mer
cial
MN
Heal
th C
are
Prog
ram
s
Tota
l Pop
ulat
ion
or S
ampl
e
Sam
ple
Size
Non-
Risk
Adj
uste
d Ra
te
Confi
denc
e In
terv
al o
f No
n-Ri
sk A
djus
ted
Rate
Chlamydia Screening Childhood Immunization Status
PHySIcIAN cLINIc NAME
MEdIcAL GrOuP NAME
Quality of Preventive Care
49% 49–50% NA 77% 23% 49% 49–50% 80% 78–81% NA 63% 37% 80% 78–81%Overall Minnesota Clinic Average
lAkevIlle
Fairview lakeville Clinic Fairview Health services
FamilyHealth Medical Clinic FamilyHealth Medical Clinics
lakeville Family Practice
Quello Clinic Quello Clinic
lIno lAkes
Fairview lino lakes Clinic Fairview Health services
HealthPartners HealthPartners Clinics
lIttle CAnAdA
little Canada Medical Clinic
MAPle grove
Allina Medical Clinic Allina Medical Clinic
Fairview Bass lake Clinic Fairview Health services
Fairview Maple grove Medical Center Fairview Health services
Maple Medical Center, PA
north Clinic north Clinic
57% 56%-59% n/A 77% 23% total Population 3293 57% 55%-59% 84% 78%-89% n/A 64% 36% sample 254 84% 78%-89%
15% 9%-23% n/A 88% 12% total Population 107 15% 9%-23% * * n/A * * * * * *
* * n/A * * * * * * * * n/A * * * * * *
55% 49%-62% n/A 91% 9% total Population 301 54% 49%-60% * * n/A * * * * * *
57% 56%-59% n/A 77% 23% total Population 3293 57% 55%-59% 84% 78%-89% n/A 64% 36% sample 254 84% 78%-89%
68% 67%-70% n/A 82% 18% total Population 5902 68% 67%-69% 86% 80%-91% n/A 68% 32% sample 283 86% 79%-91%
* * n/A * * * * * * * * n/A * * * * * *
61% 59%-62% n/A 81% 19% total Population 4876 60% 59%-62% 81% 74%-87% n/A 68% 32% sample 244 81% 73%-86%
57% 56%-59% n/A 77% 23% total Population 3293 57% 55%-59% 84% 78%-89% n/A 64% 36% sample 254 84% 78%-89%
57% 56%-59% n/A 77% 23% total Population 3293 57% 55%-59% 84% 78%-89% n/A 64% 36% sample 254 84% 78%-89%
* * n/A * * * * * * * * n/A * * * * * *
45% 40%-50% n/A 88% 12% total Population 395 42% 37%-46% * * n/A * * * * * *
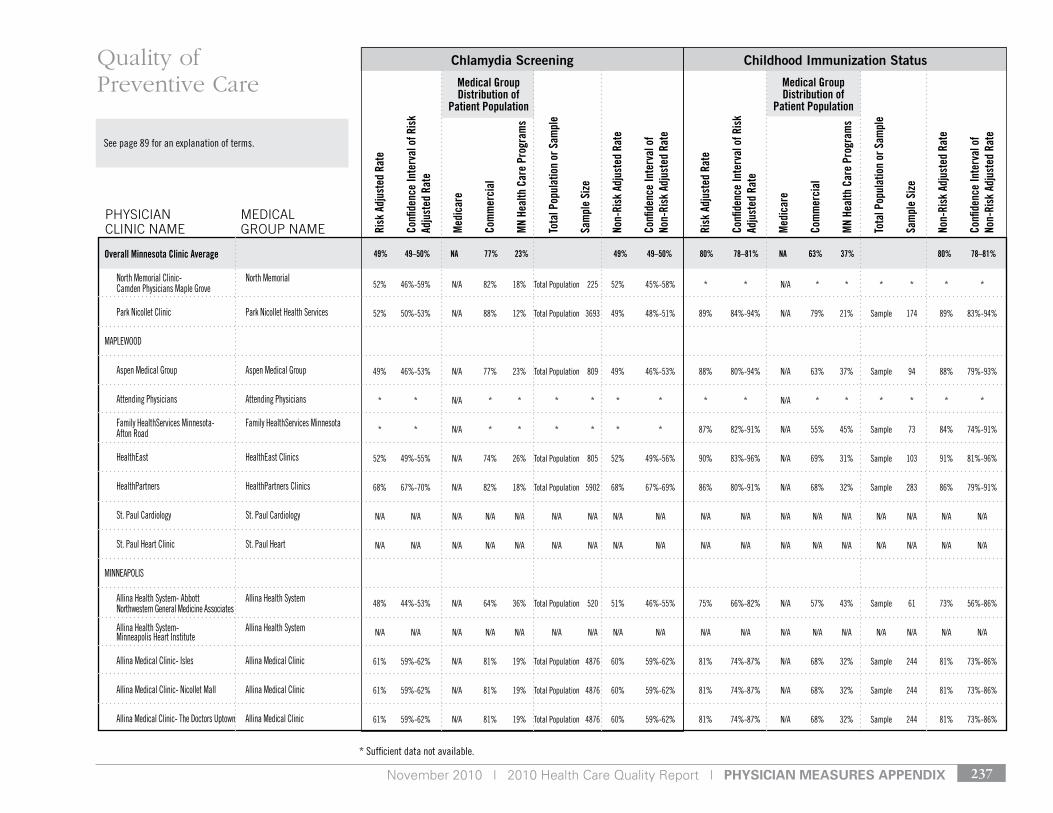
November 2010 | 2010 Health Care Quality Report | pHysiCian Measures appenDiX 237
* sufficient data not available.
see page 89 for an explanation of terms.
Medical Group Distribution of
Patient Population
Medical Group Distribution of
Patient Population
Risk
Adj
uste
d Ra
te
Confi
denc
e In
terv
al o
f Ris
k Ad
just
ed R
ate
Med
icar
e
Com
mer
cial
MN
Heal
th C
are
Prog
ram
s
Tota
l Pop
ulat
ion
or S
ampl
e
Sam
ple
Size
Non-
Risk
Adj
uste
d Ra
te
Confi
denc
e In
terv
al o
f No
n-Ri
sk A
djus
ted
Rate
Risk
Adj
uste
d Ra
te
Confi
denc
e In
terv
al o
f Ris
k Ad
just
ed R
ate
Med
icar
e
Com
mer
cial
MN
Heal
th C
are
Prog
ram
s
Tota
l Pop
ulat
ion
or S
ampl
e
Sam
ple
Size
Non-
Risk
Adj
uste
d Ra
te
Confi
denc
e In
terv
al o
f No
n-Ri
sk A
djus
ted
Rate
Chlamydia Screening Childhood Immunization Status
PHySIcIAN cLINIc NAME
MEdIcAL GrOuP NAME
Quality of Preventive Care
49% 49–50% NA 77% 23% 49% 49–50% 80% 78–81% NA 63% 37% 80% 78–81%Overall Minnesota Clinic Average
north Memorial Clinic- north Memorial Camden Physicians Maple grove
Park nicollet Clinic Park nicollet Health services
MAPleWood
Aspen Medical group Aspen Medical group
Attending Physicians Attending Physicians
Family Healthservices Minnesota- Family Healthservices Minnesota Afton road
Healtheast Healtheast Clinics
HealthPartners HealthPartners Clinics
st. Paul Cardiology st. Paul Cardiology
st. Paul Heart Clinic st. Paul Heart
MInneAPolIs
Allina Health system- Abbott Allina Health system northwestern general Medicine Associates
Allina Health system- Allina Health system Minneapolis Heart Institute
Allina Medical Clinic- Isles Allina Medical Clinic
Allina Medical Clinic- nicollet Mall Allina Medical Clinic
Allina Medical Clinic- the doctors uptown Allina Medical Clinic
52% 46%-59% n/A 82% 18% total Population 225 52% 45%-58% * * n/A * * * * * *
52% 50%-53% n/A 88% 12% total Population 3693 49% 48%-51% 89% 84%-94% n/A 79% 21% sample 174 89% 83%-94%
49% 46%-53% n/A 77% 23% total Population 809 49% 46%-53% 88% 80%-94% n/A 63% 37% sample 94 88% 79%-93%
* * n/A * * * * * * * * n/A * * * * * *
* * n/A * * * * * * 87% 82%-91% n/A 55% 45% sample 73 84% 74%-91%
52% 49%-55% n/A 74% 26% total Population 805 52% 49%-56% 90% 83%-96% n/A 69% 31% sample 103 91% 81%-96%
68% 67%-70% n/A 82% 18% total Population 5902 68% 67%-69% 86% 80%-91% n/A 68% 32% sample 283 86% 79%-91%
n/A n/A n/A n/A n/A n/A n/A n/A n/A n/A n/A n/A n/A n/A n/A n/A n/A n/A
n/A n/A n/A n/A n/A n/A n/A n/A n/A n/A n/A n/A n/A n/A n/A n/A n/A n/A
48% 44%-53% n/A 64% 36% total Population 520 51% 46%-55% 75% 66%-82% n/A 57% 43% sample 61 73% 56%-86%
n/A n/A n/A n/A n/A n/A n/A n/A n/A n/A n/A n/A n/A n/A n/A n/A n/A n/A
61% 59%-62% n/A 81% 19% total Population 4876 60% 59%-62% 81% 74%-87% n/A 68% 32% sample 244 81% 73%-86%
61% 59%-62% n/A 81% 19% total Population 4876 60% 59%-62% 81% 74%-87% n/A 68% 32% sample 244 81% 73%-86%
61% 59%-62% n/A 81% 19% total Population 4876 60% 59%-62% 81% 74%-87% n/A 68% 32% sample 244 81% 73%-86%
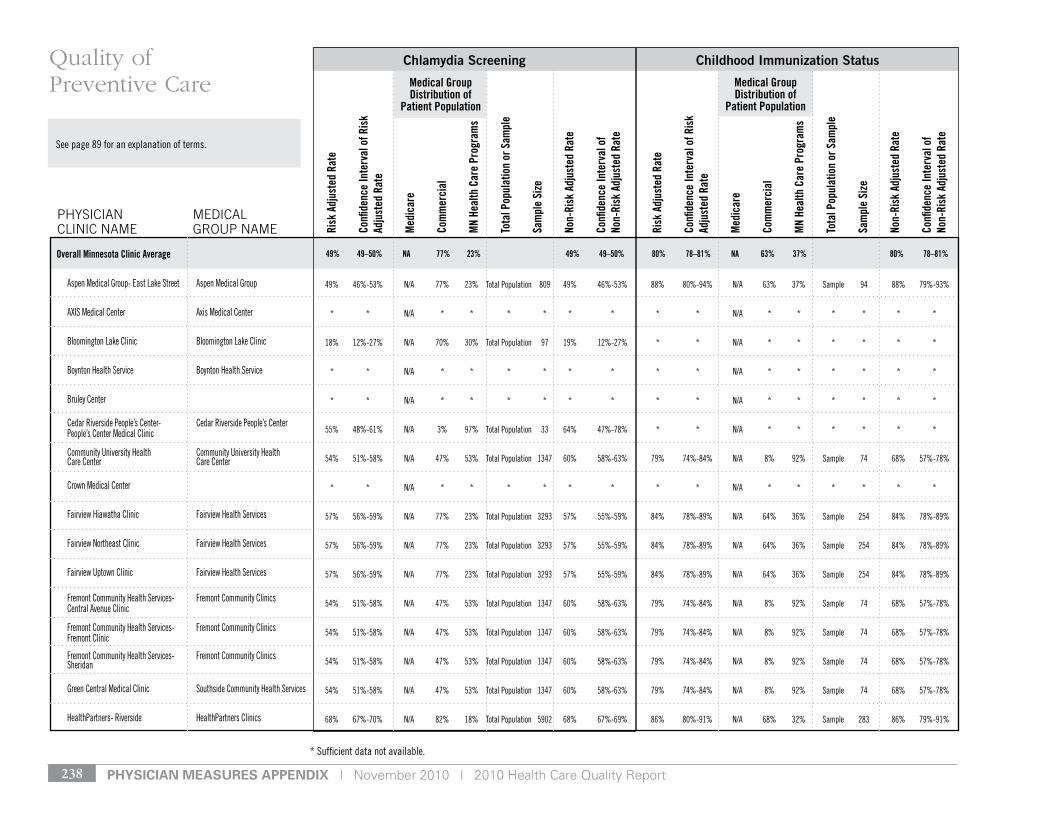
pHysiCian Measures appenDiX | November 2010 | 2010 Health Care Quality Report238
* sufficient data not available.
see page 89 for an explanation of terms.
Medical Group Distribution of
Patient Population
Medical Group Distribution of
Patient Population
Risk
Adj
uste
d Ra
te
Confi
denc
e In
terv
al o
f Ris
k Ad
just
ed R
ate
Med
icar
e
Com
mer
cial
MN
Heal
th C
are
Prog
ram
s
Tota
l Pop
ulat
ion
or S
ampl
e
Sam
ple
Size
Non-
Risk
Adj
uste
d Ra
te
Confi
denc
e In
terv
al o
f No
n-Ri
sk A
djus
ted
Rate
Risk
Adj
uste
d Ra
te
Confi
denc
e In
terv
al o
f Ris
k Ad
just
ed R
ate
Med
icar
e
Com
mer
cial
MN
Heal
th C
are
Prog
ram
s
Tota
l Pop
ulat
ion
or S
ampl
e
Sam
ple
Size
Non-
Risk
Adj
uste
d Ra
te
Confi
denc
e In
terv
al o
f No
n-Ri
sk A
djus
ted
Rate
Chlamydia Screening Childhood Immunization Status
PHySIcIAN cLINIc NAME
MEdIcAL GrOuP NAME
Quality of Preventive Care
49% 49–50% NA 77% 23% 49% 49–50% 80% 78–81% NA 63% 37% 80% 78–81%Overall Minnesota Clinic Average
Aspen Medical group- east lake street Aspen Medical group
AXIs Medical Center Axis Medical Center
Bloomington lake Clinic Bloomington lake Clinic
Boynton Health service Boynton Health service
Bruley Center
Cedar riverside People’s Center- Cedar riverside People’s Center People’s Center Medical Clinic
Community university Health Community university Health Care Center Care Center
Crown Medical Center
Fairview Hiawatha Clinic Fairview Health services
Fairview northeast Clinic Fairview Health services
Fairview uptown Clinic Fairview Health services
Fremont Community Health services- Fremont Community Clinics Central Avenue Clinic
Fremont Community Health services- Fremont Community Clinics Fremont Clinic
Fremont Community Health services- Fremont Community Clinics sheridan
green Central Medical Clinic southside Community Health services
HealthPartners- riverside HealthPartners Clinics
49% 46%-53% n/A 77% 23% total Population 809 49% 46%-53% 88% 80%-94% n/A 63% 37% sample 94 88% 79%-93%
* * n/A * * * * * * * * n/A * * * * * *
18% 12%-27% n/A 70% 30% total Population 97 19% 12%-27% * * n/A * * * * * *
* * n/A * * * * * * * * n/A * * * * * *
* * n/A * * * * * * * * n/A * * * * * *
55% 48%-61% n/A 3% 97% total Population 33 64% 47%-78% * * n/A * * * * * *
54% 51%-58% n/A 47% 53% total Population 1347 60% 58%-63% 79% 74%-84% n/A 8% 92% sample 74 68% 57%-78%
* * n/A * * * * * * * * n/A * * * * * *
57% 56%-59% n/A 77% 23% total Population 3293 57% 55%-59% 84% 78%-89% n/A 64% 36% sample 254 84% 78%-89%
57% 56%-59% n/A 77% 23% total Population 3293 57% 55%-59% 84% 78%-89% n/A 64% 36% sample 254 84% 78%-89%
57% 56%-59% n/A 77% 23% total Population 3293 57% 55%-59% 84% 78%-89% n/A 64% 36% sample 254 84% 78%-89%
54% 51%-58% n/A 47% 53% total Population 1347 60% 58%-63% 79% 74%-84% n/A 8% 92% sample 74 68% 57%-78%
54% 51%-58% n/A 47% 53% total Population 1347 60% 58%-63% 79% 74%-84% n/A 8% 92% sample 74 68% 57%-78%
54% 51%-58% n/A 47% 53% total Population 1347 60% 58%-63% 79% 74%-84% n/A 8% 92% sample 74 68% 57%-78%
54% 51%-58% n/A 47% 53% total Population 1347 60% 58%-63% 79% 74%-84% n/A 8% 92% sample 74 68% 57%-78%
68% 67%-70% n/A 82% 18% total Population 5902 68% 67%-69% 86% 80%-91% n/A 68% 32% sample 283 86% 79%-91%
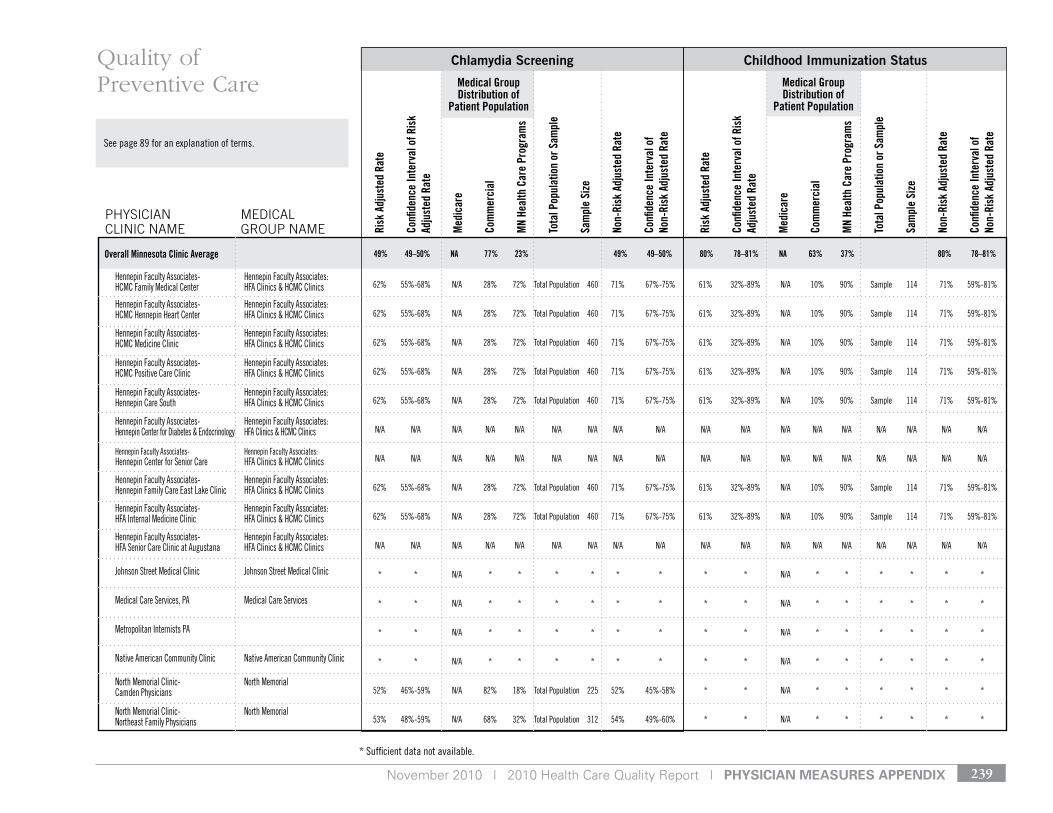
November 2010 | 2010 Health Care Quality Report | pHysiCian Measures appenDiX 239
* sufficient data not available.
see page 89 for an explanation of terms.
Medical Group Distribution of
Patient Population
Medical Group Distribution of
Patient Population
Risk
Adj
uste
d Ra
te
Confi
denc
e In
terv
al o
f Ris
k Ad
just
ed R
ate
Med
icar
e
Com
mer
cial
MN
Heal
th C
are
Prog
ram
s
Tota
l Pop
ulat
ion
or S
ampl
e
Sam
ple
Size
Non-
Risk
Adj
uste
d Ra
te
Confi
denc
e In
terv
al o
f No
n-Ri
sk A
djus
ted
Rate
Risk
Adj
uste
d Ra
te
Confi
denc
e In
terv
al o
f Ris
k Ad
just
ed R
ate
Med
icar
e
Com
mer
cial
MN
Heal
th C
are
Prog
ram
s
Tota
l Pop
ulat
ion
or S
ampl
e
Sam
ple
Size
Non-
Risk
Adj
uste
d Ra
te
Confi
denc
e In
terv
al o
f No
n-Ri
sk A
djus
ted
Rate
Chlamydia Screening Childhood Immunization Status
PHySIcIAN cLINIc NAME
MEdIcAL GrOuP NAME
Quality of Preventive Care
49% 49–50% NA 77% 23% 49% 49–50% 80% 78–81% NA 63% 37% 80% 78–81%Overall Minnesota Clinic Average
Hennepin Faculty Associates- Hennepin Faculty Associates: HCMC Family Medical Center HFA Clinics & HCMC Clinics
Hennepin Faculty Associates- Hennepin Faculty Associates: HCMC Hennepin Heart Center HFA Clinics & HCMC Clinics
Hennepin Faculty Associates- Hennepin Faculty Associates: HCMC Medicine Clinic HFA Clinics & HCMC Clinics
Hennepin Faculty Associates- Hennepin Faculty Associates: HCMC Positive Care Clinic HFA Clinics & HCMC Clinics
Hennepin Faculty Associates- Hennepin Faculty Associates: Hennepin Care south HFA Clinics & HCMC Clinics
Hennepin Faculty Associates- Hennepin Faculty Associates: Hennepin Center for diabetes & endocrinology HFA Clinics & HCMC Clinics
Hennepin Faculty Associates- Hennepin Faculty Associates: Hennepin Center for senior Care HFA Clinics & HCMC Clinics
Hennepin Faculty Associates- Hennepin Faculty Associates: Hennepin Family Care east lake Clinic HFA Clinics & HCMC Clinics
Hennepin Faculty Associates- Hennepin Faculty Associates: HFA Internal Medicine Clinic HFA Clinics & HCMC Clinics
Hennepin Faculty Associates- Hennepin Faculty Associates: HFA senior Care Clinic at Augustana HFA Clinics & HCMC Clinics
Johnson street Medical Clinic Johnson street Medical Clinic
Medical Care services, PA Medical Care services
Metropolitan Internists PA
native American Community Clinic native American Community Clinic
north Memorial Clinic- north Memorial Camden Physicians
north Memorial Clinic- north Memorial northeast Family Physicians
62% 55%-68% n/A 28% 72% total Population 460 71% 67%-75% 61% 32%-89% n/A 10% 90% sample 114 71% 59%-81%
62% 55%-68% n/A 28% 72% total Population 460 71% 67%-75% 61% 32%-89% n/A 10% 90% sample 114 71% 59%-81%
62% 55%-68% n/A 28% 72% total Population 460 71% 67%-75% 61% 32%-89% n/A 10% 90% sample 114 71% 59%-81%
62% 55%-68% n/A 28% 72% total Population 460 71% 67%-75% 61% 32%-89% n/A 10% 90% sample 114 71% 59%-81%
62% 55%-68% n/A 28% 72% total Population 460 71% 67%-75% 61% 32%-89% n/A 10% 90% sample 114 71% 59%-81%
n/A n/A n/A n/A n/A n/A n/A n/A n/A n/A n/A n/A n/A n/A n/A n/A n/A n/A
n/A n/A n/A n/A n/A n/A n/A n/A n/A n/A n/A n/A n/A n/A n/A n/A n/A n/A
62% 55%-68% n/A 28% 72% total Population 460 71% 67%-75% 61% 32%-89% n/A 10% 90% sample 114 71% 59%-81%
62% 55%-68% n/A 28% 72% total Population 460 71% 67%-75% 61% 32%-89% n/A 10% 90% sample 114 71% 59%-81%
n/A n/A n/A n/A n/A n/A n/A n/A n/A n/A n/A n/A n/A n/A n/A n/A n/A n/A
* * n/A * * * * * * * * n/A * * * * * *
* * n/A * * * * * * * * n/A * * * * * *
* * n/A * * * * * * * * n/A * * * * * *
* * n/A * * * * * * * * n/A * * * * * *
52% 46%-59% n/A 82% 18% total Population 225 52% 45%-58% * * n/A * * * * * *
53% 48%-59% n/A 68% 32% total Population 312 54% 49%-60% * * n/A * * * * * *
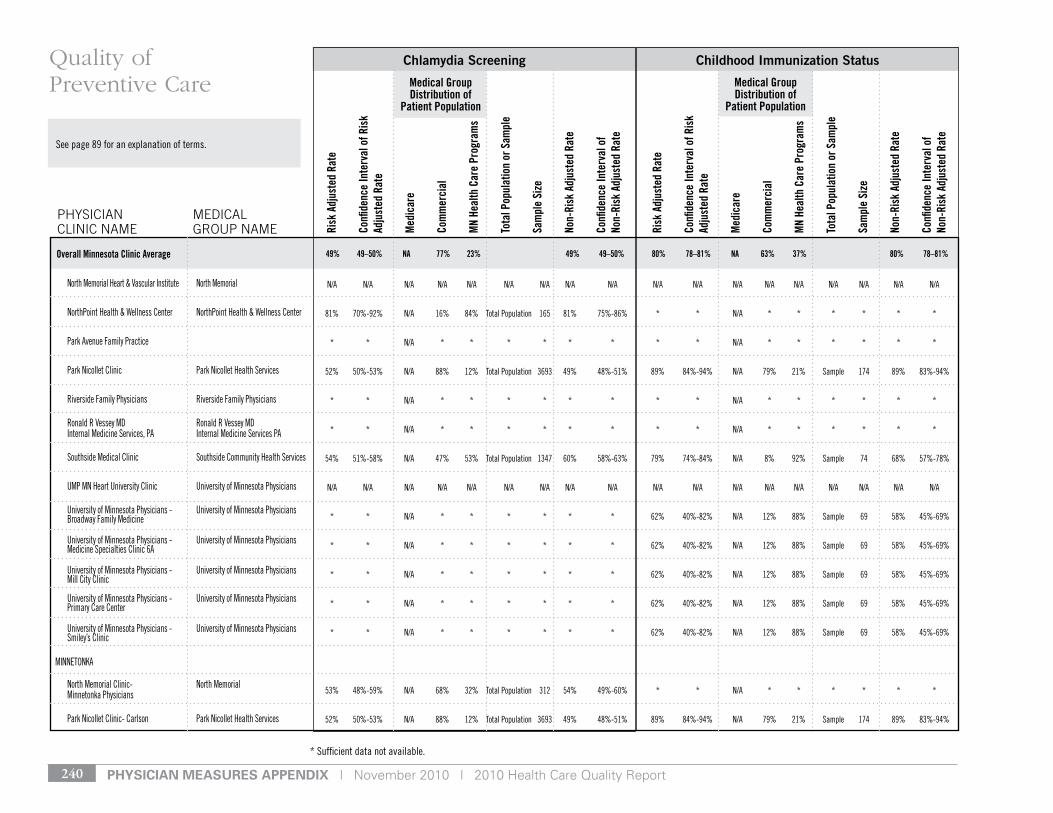
pHysiCian Measures appenDiX | November 2010 | 2010 Health Care Quality Report240
* sufficient data not available.
see page 89 for an explanation of terms.
Medical Group Distribution of
Patient Population
Medical Group Distribution of
Patient Population
Risk
Adj
uste
d Ra
te
Confi
denc
e In
terv
al o
f Ris
k Ad
just
ed R
ate
Med
icar
e
Com
mer
cial
MN
Heal
th C
are
Prog
ram
s
Tota
l Pop
ulat
ion
or S
ampl
e
Sam
ple
Size
Non-
Risk
Adj
uste
d Ra
te
Confi
denc
e In
terv
al o
f No
n-Ri
sk A
djus
ted
Rate
Risk
Adj
uste
d Ra
te
Confi
denc
e In
terv
al o
f Ris
k Ad
just
ed R
ate
Med
icar
e
Com
mer
cial
MN
Heal
th C
are
Prog
ram
s
Tota
l Pop
ulat
ion
or S
ampl
e
Sam
ple
Size
Non-
Risk
Adj
uste
d Ra
te
Confi
denc
e In
terv
al o
f No
n-Ri
sk A
djus
ted
Rate
Chlamydia Screening Childhood Immunization Status
PHySIcIAN cLINIc NAME
MEdIcAL GrOuP NAME
Quality of Preventive Care
49% 49–50% NA 77% 23% 49% 49–50% 80% 78–81% NA 63% 37% 80% 78–81%Overall Minnesota Clinic Average
north Memorial Heart & vascular Institute north Memorial
northPoint Health & Wellness Center northPoint Health & Wellness Center
Park Avenue Family Practice
Park nicollet Clinic Park nicollet Health services
riverside Family Physicians riverside Family Physicians
ronald r vessey Md ronald r vessey Md Internal Medicine services, PA Internal Medicine services PA
southside Medical Clinic southside Community Health services
uMP Mn Heart university Clinic university of Minnesota Physicians
university of Minnesota Physicians - university of Minnesota Physicians Broadway Family Medicine
university of Minnesota Physicians - university of Minnesota Physicians Medicine specialties Clinic 6A
university of Minnesota Physicians - university of Minnesota Physicians Mill City Clinic
university of Minnesota Physicians - university of Minnesota Physicians Primary Care Center
university of Minnesota Physicians - university of Minnesota Physicians smiley’s Clinic
MInnetonkA
north Memorial Clinic- north Memorial Minnetonka Physicians
Park nicollet Clinic- Carlson Park nicollet Health services
n/A n/A n/A n/A n/A n/A n/A n/A n/A n/A n/A n/A n/A n/A n/A n/A n/A n/A
81% 70%-92% n/A 16% 84% total Population 165 81% 75%-86% * * n/A * * * * * *
* * n/A * * * * * * * * n/A * * * * * *
52% 50%-53% n/A 88% 12% total Population 3693 49% 48%-51% 89% 84%-94% n/A 79% 21% sample 174 89% 83%-94%
* * n/A * * * * * * * * n/A * * * * * *
* * n/A * * * * * * * * n/A * * * * * *
54% 51%-58% n/A 47% 53% total Population 1347 60% 58%-63% 79% 74%-84% n/A 8% 92% sample 74 68% 57%-78%
n/A n/A n/A n/A n/A n/A n/A n/A n/A n/A n/A n/A n/A n/A n/A n/A n/A n/A
* * n/A * * * * * * 62% 40%-82% n/A 12% 88% sample 69 58% 45%-69%
* * n/A * * * * * * 62% 40%-82% n/A 12% 88% sample 69 58% 45%-69%
* * n/A * * * * * * 62% 40%-82% n/A 12% 88% sample 69 58% 45%-69%
* * n/A * * * * * * 62% 40%-82% n/A 12% 88% sample 69 58% 45%-69%
* * n/A * * * * * * 62% 40%-82% n/A 12% 88% sample 69 58% 45%-69%
53% 48%-59% n/A 68% 32% total Population 312 54% 49%-60% * * n/A * * * * * *
52% 50%-53% n/A 88% 12% total Population 3693 49% 48%-51% 89% 84%-94% n/A 79% 21% sample 174 89% 83%-94%
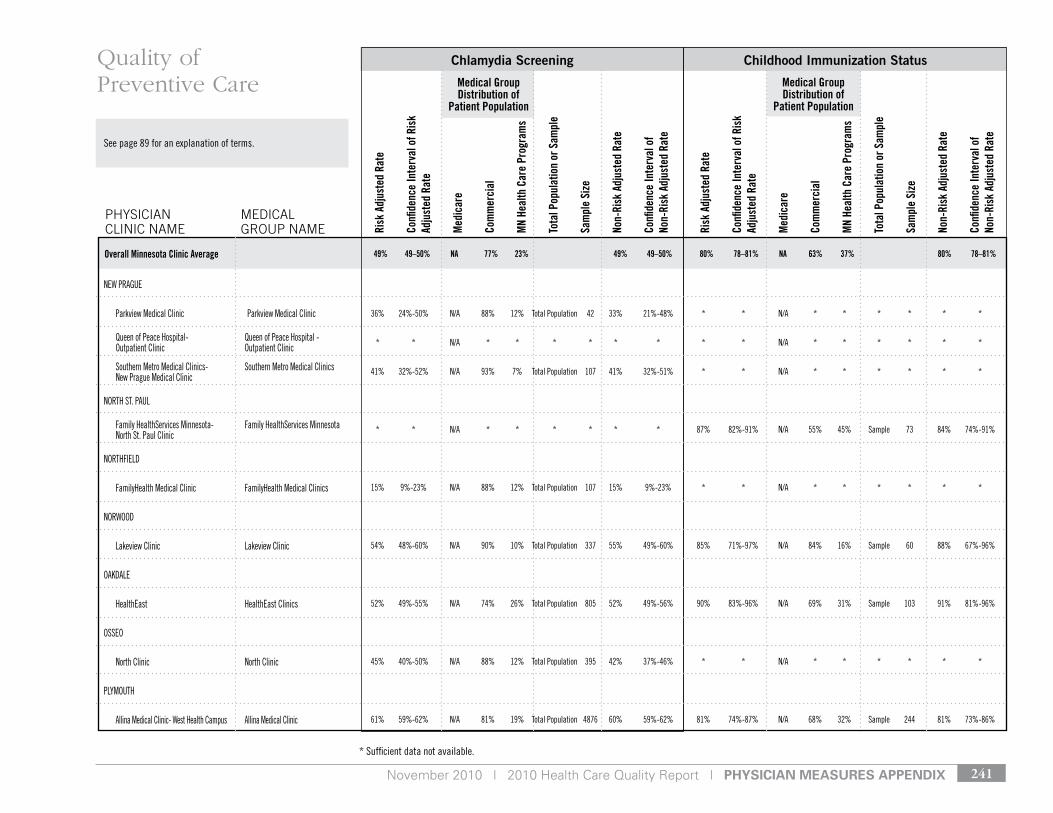
November 2010 | 2010 Health Care Quality Report | pHysiCian Measures appenDiX 241
* sufficient data not available.
see page 89 for an explanation of terms.
Medical Group Distribution of
Patient Population
Medical Group Distribution of
Patient Population
Risk
Adj
uste
d Ra
te
Confi
denc
e In
terv
al o
f Ris
k Ad
just
ed R
ate
Med
icar
e
Com
mer
cial
MN
Heal
th C
are
Prog
ram
s
Tota
l Pop
ulat
ion
or S
ampl
e
Sam
ple
Size
Non-
Risk
Adj
uste
d Ra
te
Confi
denc
e In
terv
al o
f No
n-Ri
sk A
djus
ted
Rate
Risk
Adj
uste
d Ra
te
Confi
denc
e In
terv
al o
f Ris
k Ad
just
ed R
ate
Med
icar
e
Com
mer
cial
MN
Heal
th C
are
Prog
ram
s
Tota
l Pop
ulat
ion
or S
ampl
e
Sam
ple
Size
Non-
Risk
Adj
uste
d Ra
te
Confi
denc
e In
terv
al o
f No
n-Ri
sk A
djus
ted
Rate
Chlamydia Screening Childhood Immunization Status
PHySIcIAN cLINIc NAME
MEdIcAL GrOuP NAME
Quality of Preventive Care
49% 49–50% NA 77% 23% 49% 49–50% 80% 78–81% NA 63% 37% 80% 78–81%Overall Minnesota Clinic Average
neW PrAgue
Parkview Medical Clinic Parkview Medical Clinic
Queen of Peace Hospital- Queen of Peace Hospital - outpatient Clinic outpatient Clinic
southern Metro Medical Clinics- southern Metro Medical Clinics new Prague Medical Clinic
nortH st. PAul
Family Healthservices Minnesota- Family Healthservices Minnesota north st. Paul Clinic
nortHFIeld
FamilyHealth Medical Clinic FamilyHealth Medical Clinics
norWood
lakeview Clinic lakeview Clinic
oAkdAle
Healtheast Healtheast Clinics
osseo
north Clinic north Clinic
PlyMoutH
Allina Medical Clinic- West Health Campus Allina Medical Clinic
36% 24%-50% n/A 88% 12% total Population 42 33% 21%-48% * * n/A * * * * * *
* * n/A * * * * * * * * n/A * * * * * *
41% 32%-52% n/A 93% 7% total Population 107 41% 32%-51% * * n/A * * * * * *
* * n/A * * * * * * 87% 82%-91% n/A 55% 45% sample 73 84% 74%-91%
15% 9%-23% n/A 88% 12% total Population 107 15% 9%-23% * * n/A * * * * * *
54% 48%-60% n/A 90% 10% total Population 337 55% 49%-60% 85% 71%-97% n/A 84% 16% sample 60 88% 67%-96%
52% 49%-55% n/A 74% 26% total Population 805 52% 49%-56% 90% 83%-96% n/A 69% 31% sample 103 91% 81%-96%
45% 40%-50% n/A 88% 12% total Population 395 42% 37%-46% * * n/A * * * * * *
61% 59%-62% n/A 81% 19% total Population 4876 60% 59%-62% 81% 74%-87% n/A 68% 32% sample 244 81% 73%-86%
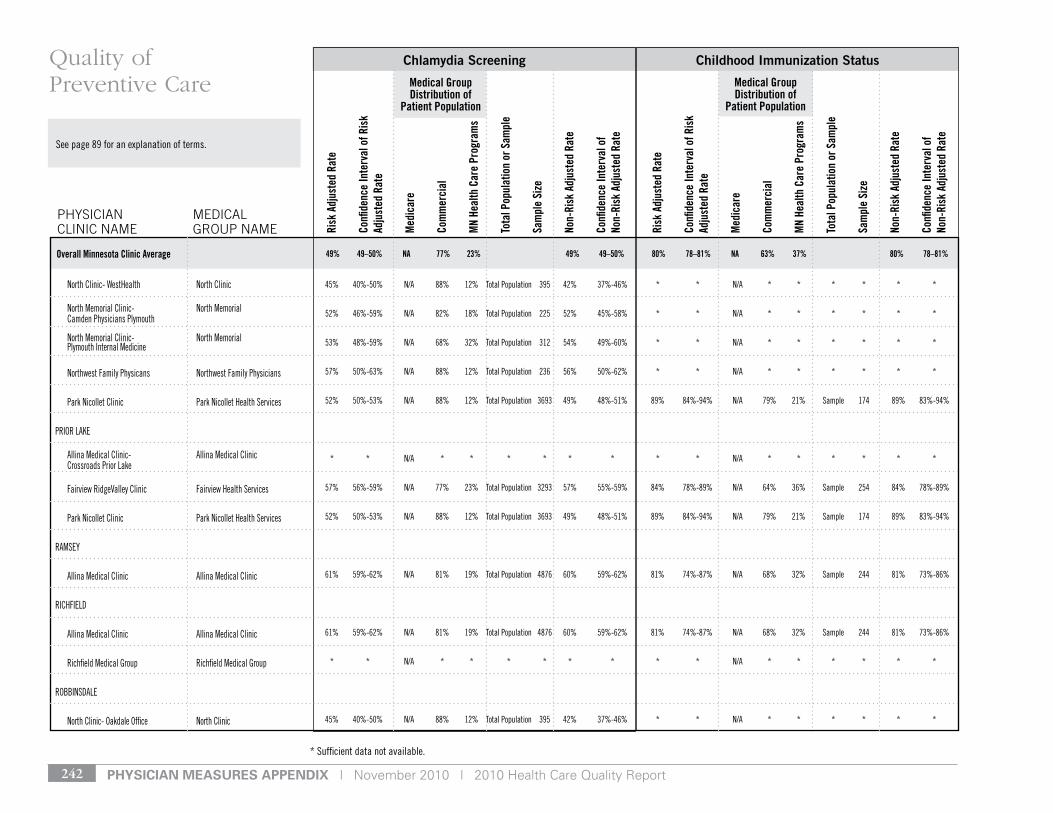
pHysiCian Measures appenDiX | November 2010 | 2010 Health Care Quality Report242
* sufficient data not available.
see page 89 for an explanation of terms.
Medical Group Distribution of
Patient Population
Medical Group Distribution of
Patient Population
Risk
Adj
uste
d Ra
te
Confi
denc
e In
terv
al o
f Ris
k Ad
just
ed R
ate
Med
icar
e
Com
mer
cial
MN
Heal
th C
are
Prog
ram
s
Tota
l Pop
ulat
ion
or S
ampl
e
Sam
ple
Size
Non-
Risk
Adj
uste
d Ra
te
Confi
denc
e In
terv
al o
f No
n-Ri
sk A
djus
ted
Rate
Risk
Adj
uste
d Ra
te
Confi
denc
e In
terv
al o
f Ris
k Ad
just
ed R
ate
Med
icar
e
Com
mer
cial
MN
Heal
th C
are
Prog
ram
s
Tota
l Pop
ulat
ion
or S
ampl
e
Sam
ple
Size
Non-
Risk
Adj
uste
d Ra
te
Confi
denc
e In
terv
al o
f No
n-Ri
sk A
djus
ted
Rate
Chlamydia Screening Childhood Immunization Status
PHySIcIAN cLINIc NAME
MEdIcAL GrOuP NAME
Quality of Preventive Care
49% 49–50% NA 77% 23% 49% 49–50% 80% 78–81% NA 63% 37% 80% 78–81%Overall Minnesota Clinic Average
north Clinic- WestHealth north Clinic
north Memorial Clinic- north Memorial Camden Physicians Plymouth
north Memorial Clinic- north Memorial Plymouth Internal Medicine
northwest Family Physicans northwest Family Physicians
Park nicollet Clinic Park nicollet Health services
PrIor lAke
Allina Medical Clinic- Allina Medical Clinic Crossroads Prior lake
Fairview ridgevalley Clinic Fairview Health services
Park nicollet Clinic Park nicollet Health services
rAMsey
Allina Medical Clinic Allina Medical Clinic
rICHFIeld
Allina Medical Clinic Allina Medical Clinic
richfield Medical group richfield Medical group
roBBInsdAle
north Clinic- oakdale office north Clinic
45% 40%-50% n/A 88% 12% total Population 395 42% 37%-46% * * n/A * * * * * *
52% 46%-59% n/A 82% 18% total Population 225 52% 45%-58% * * n/A * * * * * *
53% 48%-59% n/A 68% 32% total Population 312 54% 49%-60% * * n/A * * * * * *
57% 50%-63% n/A 88% 12% total Population 236 56% 50%-62% * * n/A * * * * * *
52% 50%-53% n/A 88% 12% total Population 3693 49% 48%-51% 89% 84%-94% n/A 79% 21% sample 174 89% 83%-94%
* * n/A * * * * * * * * n/A * * * * * *
57% 56%-59% n/A 77% 23% total Population 3293 57% 55%-59% 84% 78%-89% n/A 64% 36% sample 254 84% 78%-89%
52% 50%-53% n/A 88% 12% total Population 3693 49% 48%-51% 89% 84%-94% n/A 79% 21% sample 174 89% 83%-94%
61% 59%-62% n/A 81% 19% total Population 4876 60% 59%-62% 81% 74%-87% n/A 68% 32% sample 244 81% 73%-86%
61% 59%-62% n/A 81% 19% total Population 4876 60% 59%-62% 81% 74%-87% n/A 68% 32% sample 244 81% 73%-86%
* * n/A * * * * * * * * n/A * * * * * *
45% 40%-50% n/A 88% 12% total Population 395 42% 37%-46% * * n/A * * * * * *
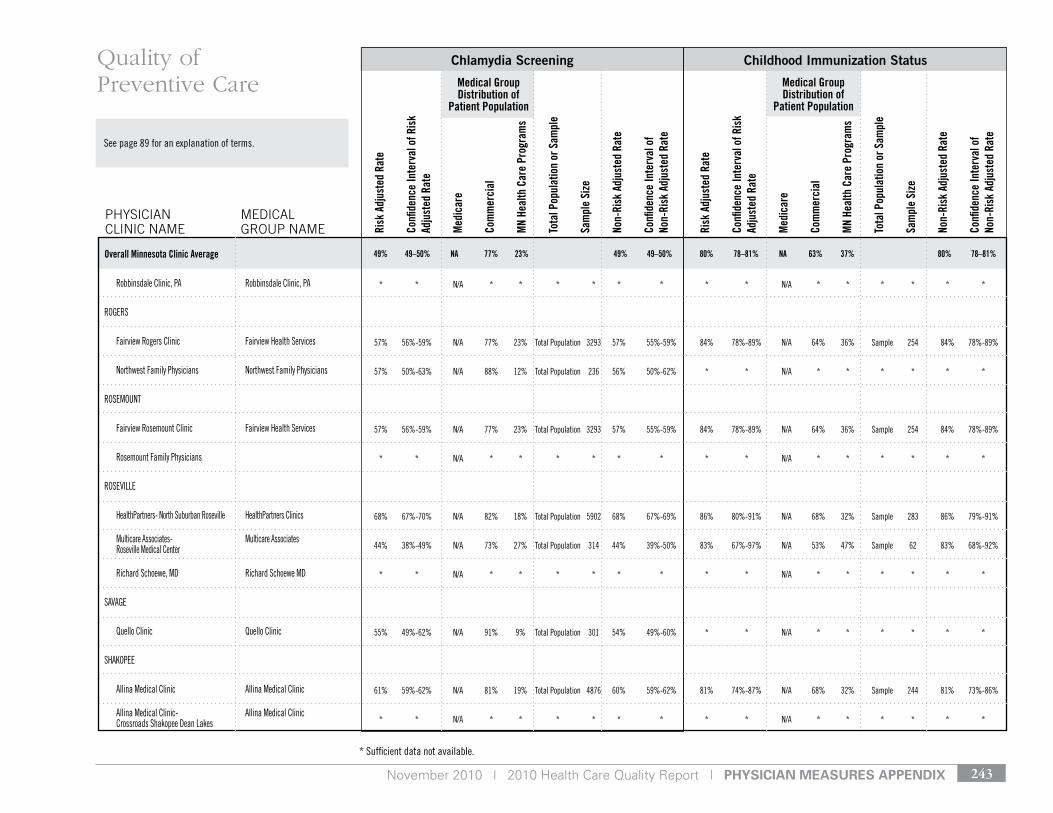
November 2010 | 2010 Health Care Quality Report | pHysiCian Measures appenDiX 243
* sufficient data not available.
see page 89 for an explanation of terms.
Medical Group Distribution of
Patient Population
Medical Group Distribution of
Patient Population
Risk
Adj
uste
d Ra
te
Confi
denc
e In
terv
al o
f Ris
k Ad
just
ed R
ate
Med
icar
e
Com
mer
cial
MN
Heal
th C
are
Prog
ram
s
Tota
l Pop
ulat
ion
or S
ampl
e
Sam
ple
Size
Non-
Risk
Adj
uste
d Ra
te
Confi
denc
e In
terv
al o
f No
n-Ri
sk A
djus
ted
Rate
Risk
Adj
uste
d Ra
te
Confi
denc
e In
terv
al o
f Ris
k Ad
just
ed R
ate
Med
icar
e
Com
mer
cial
MN
Heal
th C
are
Prog
ram
s
Tota
l Pop
ulat
ion
or S
ampl
e
Sam
ple
Size
Non-
Risk
Adj
uste
d Ra
te
Confi
denc
e In
terv
al o
f No
n-Ri
sk A
djus
ted
Rate
Chlamydia Screening Childhood Immunization Status
PHySIcIAN cLINIc NAME
MEdIcAL GrOuP NAME
Quality of Preventive Care
49% 49–50% NA 77% 23% 49% 49–50% 80% 78–81% NA 63% 37% 80% 78–81%Overall Minnesota Clinic Average
robbinsdale Clinic, PA robbinsdale Clinic, PA
rogers
Fairview rogers Clinic Fairview Health services
northwest Family Physicians northwest Family Physicians
roseMount
Fairview rosemount Clinic Fairview Health services
rosemount Family Physicians
rosevIlle
HealthPartners- north suburban roseville HealthPartners Clinics
Multicare Associates- Multicare Associates roseville Medical Center
richard schoewe, Md richard schoewe Md
sAvAge
Quello Clinic Quello Clinic
sHAkoPee
Allina Medical Clinic Allina Medical Clinic
Allina Medical Clinic- Allina Medical Clinic Crossroads shakopee dean lakes
* * n/A * * * * * * * * n/A * * * * * *
57% 56%-59% n/A 77% 23% total Population 3293 57% 55%-59% 84% 78%-89% n/A 64% 36% sample 254 84% 78%-89%
57% 50%-63% n/A 88% 12% total Population 236 56% 50%-62% * * n/A * * * * * *
57% 56%-59% n/A 77% 23% total Population 3293 57% 55%-59% 84% 78%-89% n/A 64% 36% sample 254 84% 78%-89%
* * n/A * * * * * * * * n/A * * * * * *
68% 67%-70% n/A 82% 18% total Population 5902 68% 67%-69% 86% 80%-91% n/A 68% 32% sample 283 86% 79%-91%
44% 38%-49% n/A 73% 27% total Population 314 44% 39%-50% 83% 67%-97% n/A 53% 47% sample 62 83% 68%-92%
* * n/A * * * * * * * * n/A * * * * * *
55% 49%-62% n/A 91% 9% total Population 301 54% 49%-60% * * n/A * * * * * *
61% 59%-62% n/A 81% 19% total Population 4876 60% 59%-62% 81% 74%-87% n/A 68% 32% sample 244 81% 73%-86%
* * n/A * * * * * * * * n/A * * * * * *
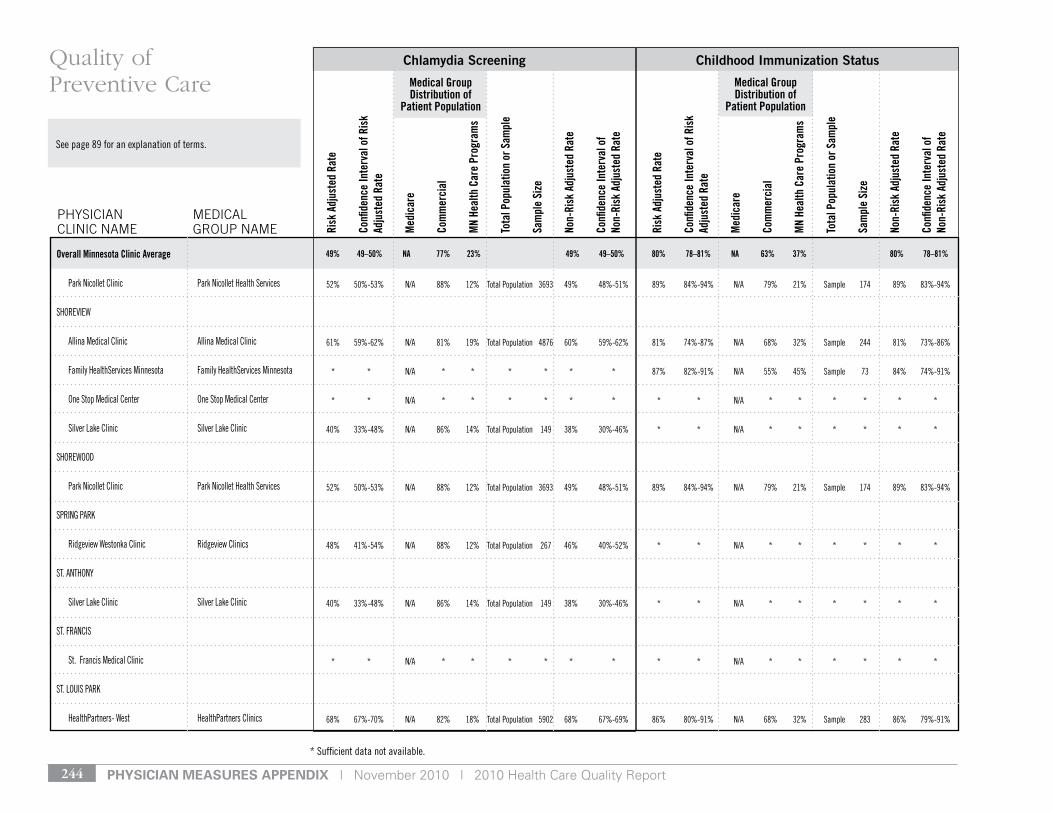
pHysiCian Measures appenDiX | November 2010 | 2010 Health Care Quality Report244
* sufficient data not available.
see page 89 for an explanation of terms.
Medical Group Distribution of
Patient Population
Medical Group Distribution of
Patient Population
Risk
Adj
uste
d Ra
te
Confi
denc
e In
terv
al o
f Ris
k Ad
just
ed R
ate
Med
icar
e
Com
mer
cial
MN
Heal
th C
are
Prog
ram
s
Tota
l Pop
ulat
ion
or S
ampl
e
Sam
ple
Size
Non-
Risk
Adj
uste
d Ra
te
Confi
denc
e In
terv
al o
f No
n-Ri
sk A
djus
ted
Rate
Risk
Adj
uste
d Ra
te
Confi
denc
e In
terv
al o
f Ris
k Ad
just
ed R
ate
Med
icar
e
Com
mer
cial
MN
Heal
th C
are
Prog
ram
s
Tota
l Pop
ulat
ion
or S
ampl
e
Sam
ple
Size
Non-
Risk
Adj
uste
d Ra
te
Confi
denc
e In
terv
al o
f No
n-Ri
sk A
djus
ted
Rate
Chlamydia Screening Childhood Immunization Status
PHySIcIAN cLINIc NAME
MEdIcAL GrOuP NAME
Quality of Preventive Care
49% 49–50% NA 77% 23% 49% 49–50% 80% 78–81% NA 63% 37% 80% 78–81%Overall Minnesota Clinic Average
Park nicollet Clinic Park nicollet Health services
sHorevIeW
Allina Medical Clinic Allina Medical Clinic
Family Healthservices Minnesota Family Healthservices Minnesota
one stop Medical Center one stop Medical Center
silver lake Clinic silver lake Clinic
sHoreWood
Park nicollet Clinic Park nicollet Health services
sPrIng PArk
ridgeview Westonka Clinic ridgeview Clinics
st. AntHony
silver lake Clinic silver lake Clinic
st. FrAnCIs
st. Francis Medical Clinic
st. louIs PArk
HealthPartners- West HealthPartners Clinics
52% 50%-53% n/A 88% 12% total Population 3693 49% 48%-51% 89% 84%-94% n/A 79% 21% sample 174 89% 83%-94%
61% 59%-62% n/A 81% 19% total Population 4876 60% 59%-62% 81% 74%-87% n/A 68% 32% sample 244 81% 73%-86%
* * n/A * * * * * * 87% 82%-91% n/A 55% 45% sample 73 84% 74%-91%
* * n/A * * * * * * * * n/A * * * * * *
40% 33%-48% n/A 86% 14% total Population 149 38% 30%-46% * * n/A * * * * * *
52% 50%-53% n/A 88% 12% total Population 3693 49% 48%-51% 89% 84%-94% n/A 79% 21% sample 174 89% 83%-94%
48% 41%-54% n/A 88% 12% total Population 267 46% 40%-52% * * n/A * * * * * *
40% 33%-48% n/A 86% 14% total Population 149 38% 30%-46% * * n/A * * * * * *
* * n/A * * * * * * * * n/A * * * * * *
68% 67%-70% n/A 82% 18% total Population 5902 68% 67%-69% 86% 80%-91% n/A 68% 32% sample 283 86% 79%-91%
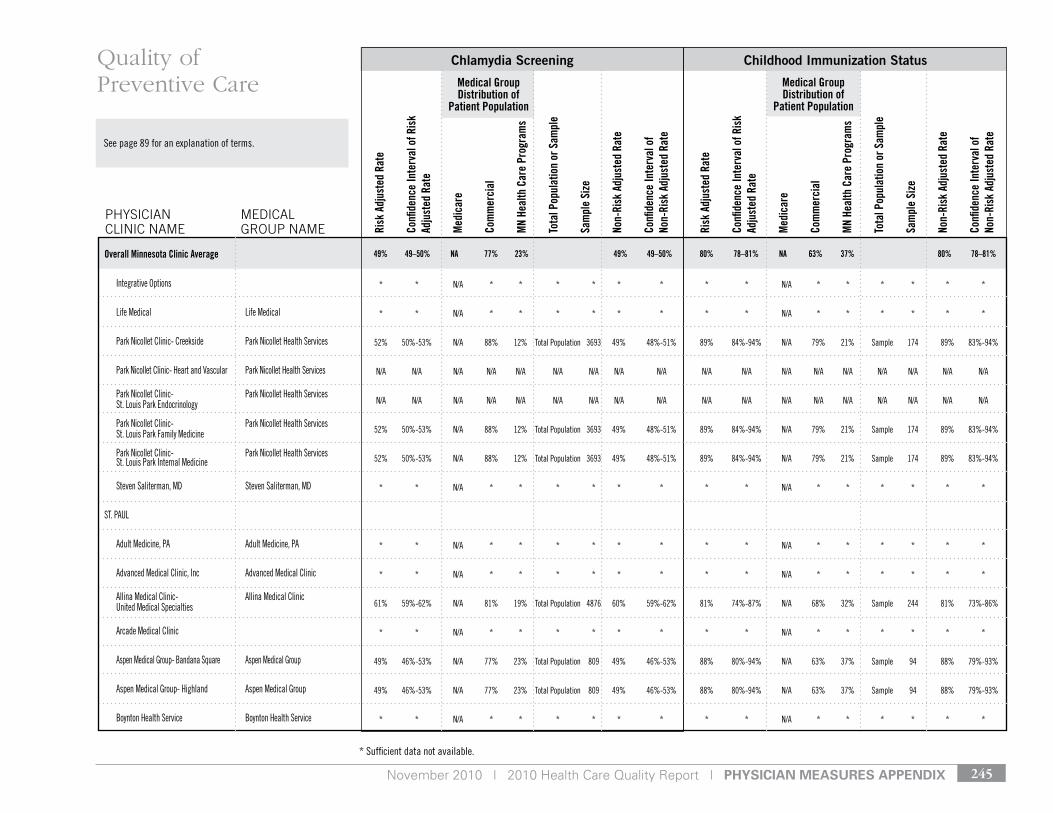
November 2010 | 2010 Health Care Quality Report | pHysiCian Measures appenDiX 245
* sufficient data not available.
see page 89 for an explanation of terms.
Medical Group Distribution of
Patient Population
Medical Group Distribution of
Patient Population
Risk
Adj
uste
d Ra
te
Confi
denc
e In
terv
al o
f Ris
k Ad
just
ed R
ate
Med
icar
e
Com
mer
cial
MN
Heal
th C
are
Prog
ram
s
Tota
l Pop
ulat
ion
or S
ampl
e
Sam
ple
Size
Non-
Risk
Adj
uste
d Ra
te
Confi
denc
e In
terv
al o
f No
n-Ri
sk A
djus
ted
Rate
Risk
Adj
uste
d Ra
te
Confi
denc
e In
terv
al o
f Ris
k Ad
just
ed R
ate
Med
icar
e
Com
mer
cial
MN
Heal
th C
are
Prog
ram
s
Tota
l Pop
ulat
ion
or S
ampl
e
Sam
ple
Size
Non-
Risk
Adj
uste
d Ra
te
Confi
denc
e In
terv
al o
f No
n-Ri
sk A
djus
ted
Rate
Chlamydia Screening Childhood Immunization Status
PHySIcIAN cLINIc NAME
MEdIcAL GrOuP NAME
Quality of Preventive Care
49% 49–50% NA 77% 23% 49% 49–50% 80% 78–81% NA 63% 37% 80% 78–81%Overall Minnesota Clinic Average
Integrative options
life Medical life Medical
Park nicollet Clinic- Creekside Park nicollet Health services
Park nicollet Clinic- Heart and vascular Park nicollet Health services
Park nicollet Clinic- Park nicollet Health services st. louis Park endocrinology
Park nicollet Clinic- Park nicollet Health services st. louis Park Family Medicine
Park nicollet Clinic- Park nicollet Health services st. louis Park Internal Medicine
steven saliterman, Md steven saliterman, Md
st. PAul
Adult Medicine, PA Adult Medicine, PA
Advanced Medical Clinic, Inc Advanced Medical Clinic
Allina Medical Clinic- Allina Medical Clinic united Medical specialties
Arcade Medical Clinic
Aspen Medical group- Bandana square Aspen Medical group
Aspen Medical group- Highland Aspen Medical group
Boynton Health service Boynton Health service
* * n/A * * * * * * * * n/A * * * * * *
* * n/A * * * * * * * * n/A * * * * * *
52% 50%-53% n/A 88% 12% total Population 3693 49% 48%-51% 89% 84%-94% n/A 79% 21% sample 174 89% 83%-94%
n/A n/A n/A n/A n/A n/A n/A n/A n/A n/A n/A n/A n/A n/A n/A n/A n/A n/A
n/A n/A n/A n/A n/A n/A n/A n/A n/A n/A n/A n/A n/A n/A n/A n/A n/A n/A
52% 50%-53% n/A 88% 12% total Population 3693 49% 48%-51% 89% 84%-94% n/A 79% 21% sample 174 89% 83%-94%
52% 50%-53% n/A 88% 12% total Population 3693 49% 48%-51% 89% 84%-94% n/A 79% 21% sample 174 89% 83%-94%
* * n/A * * * * * * * * n/A * * * * * *
* * n/A * * * * * * * * n/A * * * * * *
* * n/A * * * * * * * * n/A * * * * * *
61% 59%-62% n/A 81% 19% total Population 4876 60% 59%-62% 81% 74%-87% n/A 68% 32% sample 244 81% 73%-86%
* * n/A * * * * * * * * n/A * * * * * *
49% 46%-53% n/A 77% 23% total Population 809 49% 46%-53% 88% 80%-94% n/A 63% 37% sample 94 88% 79%-93%
49% 46%-53% n/A 77% 23% total Population 809 49% 46%-53% 88% 80%-94% n/A 63% 37% sample 94 88% 79%-93%
* * n/A * * * * * * * * n/A * * * * * *
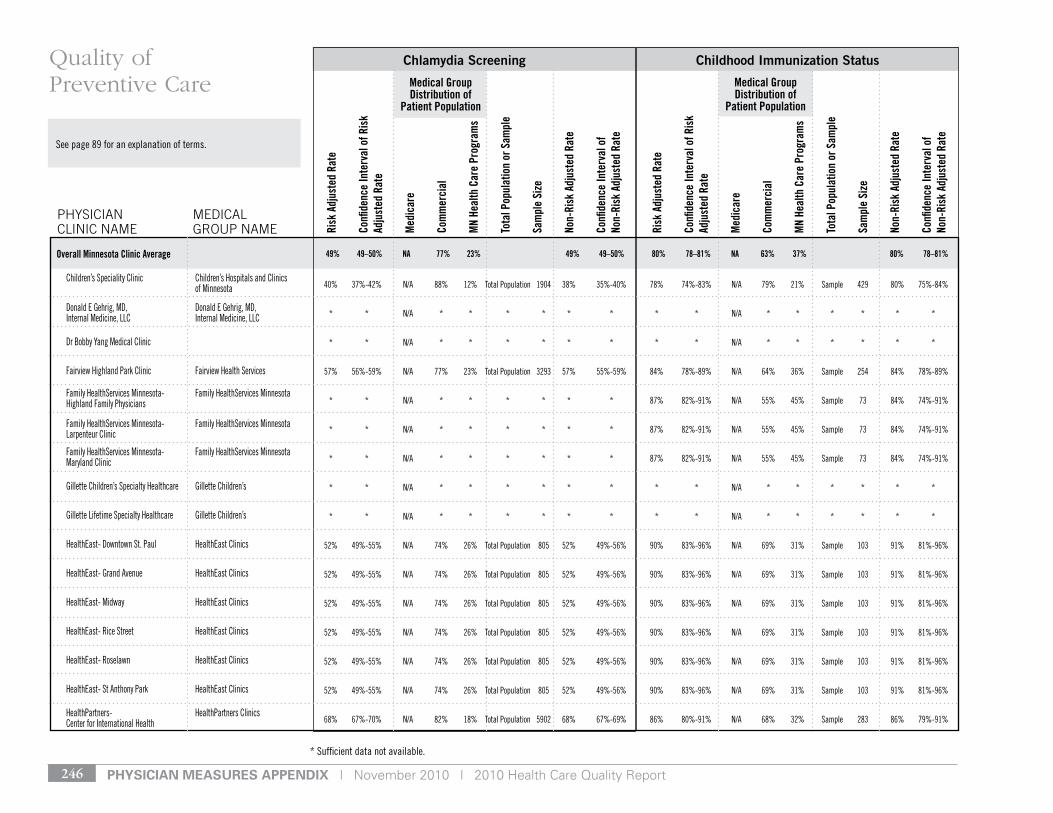
pHysiCian Measures appenDiX | November 2010 | 2010 Health Care Quality Report246
* sufficient data not available.
see page 89 for an explanation of terms.
Medical Group Distribution of
Patient Population
Medical Group Distribution of
Patient Population
Risk
Adj
uste
d Ra
te
Confi
denc
e In
terv
al o
f Ris
k Ad
just
ed R
ate
Med
icar
e
Com
mer
cial
MN
Heal
th C
are
Prog
ram
s
Tota
l Pop
ulat
ion
or S
ampl
e
Sam
ple
Size
Non-
Risk
Adj
uste
d Ra
te
Confi
denc
e In
terv
al o
f No
n-Ri
sk A
djus
ted
Rate
Risk
Adj
uste
d Ra
te
Confi
denc
e In
terv
al o
f Ris
k Ad
just
ed R
ate
Med
icar
e
Com
mer
cial
MN
Heal
th C
are
Prog
ram
s
Tota
l Pop
ulat
ion
or S
ampl
e
Sam
ple
Size
Non-
Risk
Adj
uste
d Ra
te
Confi
denc
e In
terv
al o
f No
n-Ri
sk A
djus
ted
Rate
Chlamydia Screening Childhood Immunization Status
PHySIcIAN cLINIc NAME
MEdIcAL GrOuP NAME
Quality of Preventive Care
49% 49–50% NA 77% 23% 49% 49–50% 80% 78–81% NA 63% 37% 80% 78–81%Overall Minnesota Clinic Average
Children’s speciality Clinic Children’s Hospitals and Clinics of Minnesota
donald e gehrig, Md, donald e gehrig, Md, Internal Medicine, llC Internal Medicine, llC
dr Bobby yang Medical Clinic
Fairview Highland Park Clinic Fairview Health services
Family Healthservices Minnesota- Family Healthservices Minnesota Highland Family Physicians
Family Healthservices Minnesota- Family Healthservices Minnesota larpenteur Clinic
Family Healthservices Minnesota- Family Healthservices Minnesota Maryland Clinic
gillette Children’s specialty Healthcare gillette Children’s
gillette lifetime specialty Healthcare gillette Children’s
Healtheast- downtown st. Paul Healtheast Clinics
Healtheast- grand Avenue Healtheast Clinics
Healtheast- Midway Healtheast Clinics
Healtheast- rice street Healtheast Clinics
Healtheast- roselawn Healtheast Clinics
Healtheast- st Anthony Park Healtheast Clinics
HealthPartners- HealthPartners Clinics Center for International Health
40% 37%-42% n/A 88% 12% total Population 1904 38% 35%-40% 78% 74%-83% n/A 79% 21% sample 429 80% 75%-84%
* * n/A * * * * * * * * n/A * * * * * *
* * n/A * * * * * * * * n/A * * * * * *
57% 56%-59% n/A 77% 23% total Population 3293 57% 55%-59% 84% 78%-89% n/A 64% 36% sample 254 84% 78%-89%
* * n/A * * * * * * 87% 82%-91% n/A 55% 45% sample 73 84% 74%-91%
* * n/A * * * * * * 87% 82%-91% n/A 55% 45% sample 73 84% 74%-91%
* * n/A * * * * * * 87% 82%-91% n/A 55% 45% sample 73 84% 74%-91%
* * n/A * * * * * * * * n/A * * * * * *
* * n/A * * * * * * * * n/A * * * * * *
52% 49%-55% n/A 74% 26% total Population 805 52% 49%-56% 90% 83%-96% n/A 69% 31% sample 103 91% 81%-96%
52% 49%-55% n/A 74% 26% total Population 805 52% 49%-56% 90% 83%-96% n/A 69% 31% sample 103 91% 81%-96%
52% 49%-55% n/A 74% 26% total Population 805 52% 49%-56% 90% 83%-96% n/A 69% 31% sample 103 91% 81%-96%
52% 49%-55% n/A 74% 26% total Population 805 52% 49%-56% 90% 83%-96% n/A 69% 31% sample 103 91% 81%-96%
52% 49%-55% n/A 74% 26% total Population 805 52% 49%-56% 90% 83%-96% n/A 69% 31% sample 103 91% 81%-96%
52% 49%-55% n/A 74% 26% total Population 805 52% 49%-56% 90% 83%-96% n/A 69% 31% sample 103 91% 81%-96%
68% 67%-70% n/A 82% 18% total Population 5902 68% 67%-69% 86% 80%-91% n/A 68% 32% sample 283 86% 79%-91%
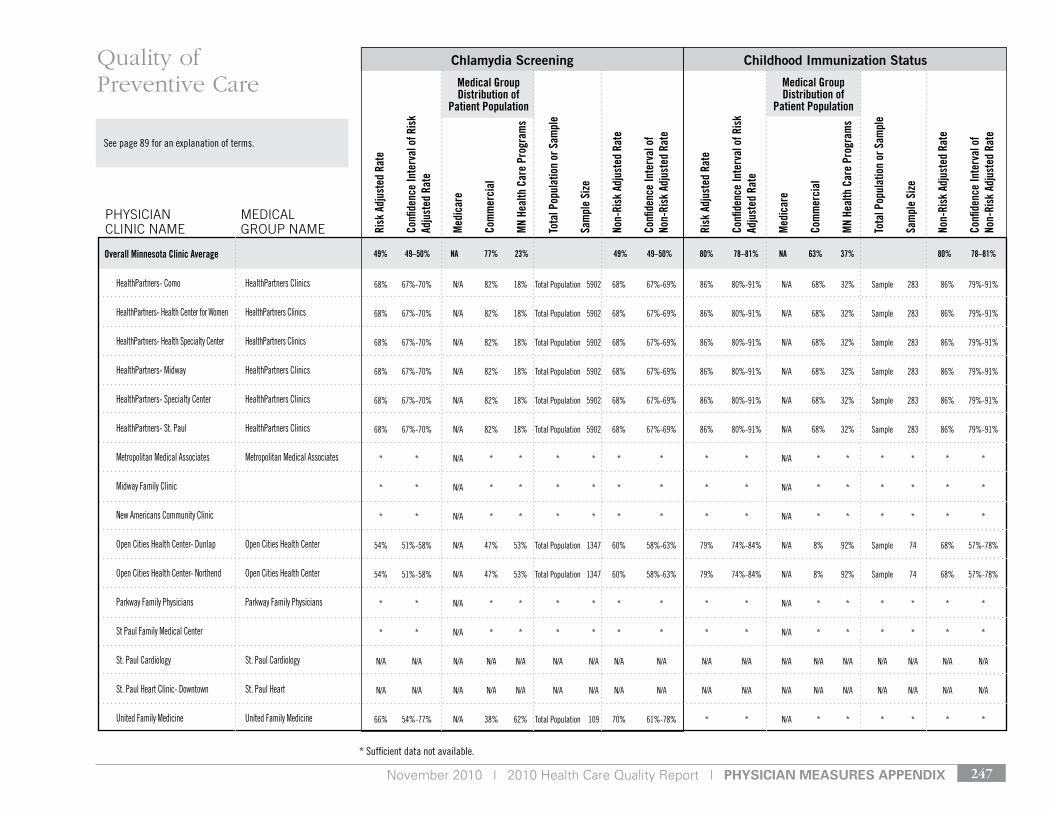
November 2010 | 2010 Health Care Quality Report | pHysiCian Measures appenDiX 247
* sufficient data not available.
see page 89 for an explanation of terms.
Medical Group Distribution of
Patient Population
Medical Group Distribution of
Patient Population
Risk
Adj
uste
d Ra
te
Confi
denc
e In
terv
al o
f Ris
k Ad
just
ed R
ate
Med
icar
e
Com
mer
cial
MN
Heal
th C
are
Prog
ram
s
Tota
l Pop
ulat
ion
or S
ampl
e
Sam
ple
Size
Non-
Risk
Adj
uste
d Ra
te
Confi
denc
e In
terv
al o
f No
n-Ri
sk A
djus
ted
Rate
Risk
Adj
uste
d Ra
te
Confi
denc
e In
terv
al o
f Ris
k Ad
just
ed R
ate
Med
icar
e
Com
mer
cial
MN
Heal
th C
are
Prog
ram
s
Tota
l Pop
ulat
ion
or S
ampl
e
Sam
ple
Size
Non-
Risk
Adj
uste
d Ra
te
Confi
denc
e In
terv
al o
f No
n-Ri
sk A
djus
ted
Rate
Chlamydia Screening Childhood Immunization Status
PHySIcIAN cLINIc NAME
MEdIcAL GrOuP NAME
Quality of Preventive Care
49% 49–50% NA 77% 23% 49% 49–50% 80% 78–81% NA 63% 37% 80% 78–81%Overall Minnesota Clinic Average
HealthPartners- Como HealthPartners Clinics
HealthPartners- Health Center for Women HealthPartners Clinics
HealthPartners- Health specialty Center HealthPartners Clinics
HealthPartners- Midway HealthPartners Clinics
HealthPartners- specialty Center HealthPartners Clinics
HealthPartners- st. Paul HealthPartners Clinics
Metropolitan Medical Associates Metropolitan Medical Associates
Midway Family Clinic
new Americans Community Clinic
open Cities Health Center- dunlap open Cities Health Center
open Cities Health Center- northend open Cities Health Center
Parkway Family Physicians Parkway Family Physicians
st Paul Family Medical Center
st. Paul Cardiology st. Paul Cardiology
st. Paul Heart Clinic- downtown st. Paul Heart
united Family Medicine united Family Medicine
68% 67%-70% n/A 82% 18% total Population 5902 68% 67%-69% 86% 80%-91% n/A 68% 32% sample 283 86% 79%-91%
68% 67%-70% n/A 82% 18% total Population 5902 68% 67%-69% 86% 80%-91% n/A 68% 32% sample 283 86% 79%-91%
68% 67%-70% n/A 82% 18% total Population 5902 68% 67%-69% 86% 80%-91% n/A 68% 32% sample 283 86% 79%-91%
68% 67%-70% n/A 82% 18% total Population 5902 68% 67%-69% 86% 80%-91% n/A 68% 32% sample 283 86% 79%-91%
68% 67%-70% n/A 82% 18% total Population 5902 68% 67%-69% 86% 80%-91% n/A 68% 32% sample 283 86% 79%-91%
68% 67%-70% n/A 82% 18% total Population 5902 68% 67%-69% 86% 80%-91% n/A 68% 32% sample 283 86% 79%-91%
* * n/A * * * * * * * * n/A * * * * * *
* * n/A * * * * * * * * n/A * * * * * *
* * n/A * * * * * * * * n/A * * * * * *
54% 51%-58% n/A 47% 53% total Population 1347 60% 58%-63% 79% 74%-84% n/A 8% 92% sample 74 68% 57%-78%
54% 51%-58% n/A 47% 53% total Population 1347 60% 58%-63% 79% 74%-84% n/A 8% 92% sample 74 68% 57%-78%
* * n/A * * * * * * * * n/A * * * * * *
* * n/A * * * * * * * * n/A * * * * * *
n/A n/A n/A n/A n/A n/A n/A n/A n/A n/A n/A n/A n/A n/A n/A n/A n/A n/A
n/A n/A n/A n/A n/A n/A n/A n/A n/A n/A n/A n/A n/A n/A n/A n/A n/A n/A
66% 54%-77% n/A 38% 62% total Population 109 70% 61%-78% * * n/A * * * * * *
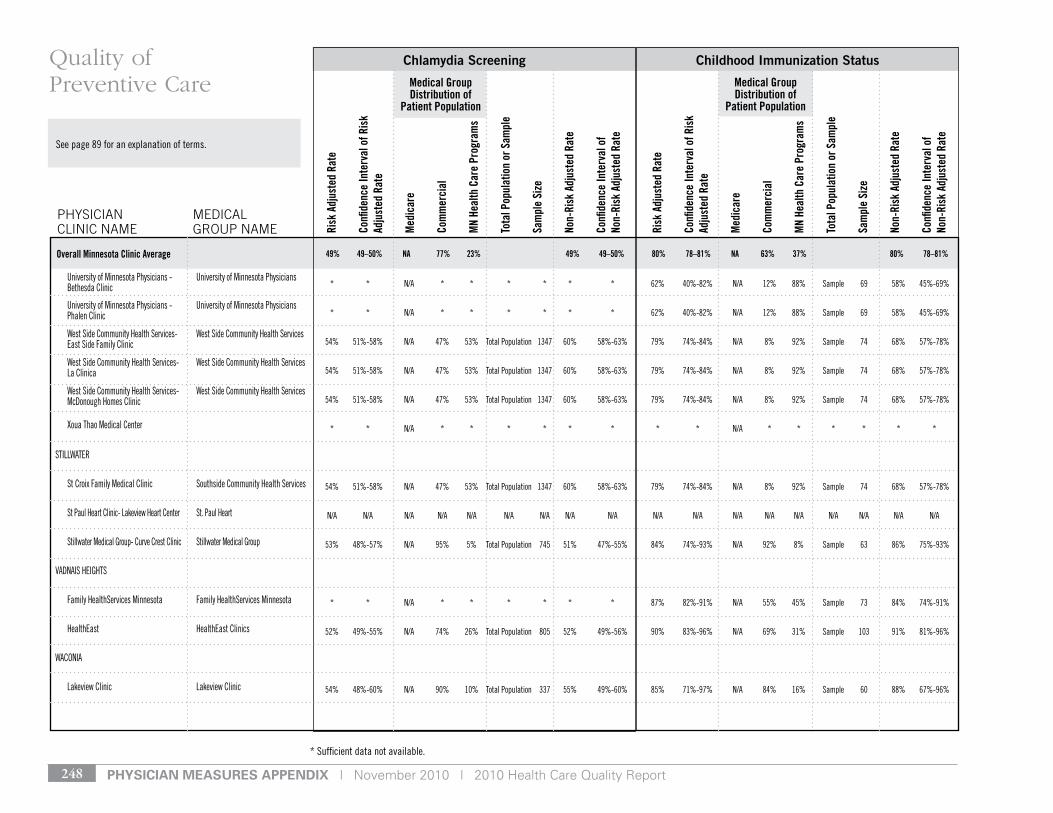
pHysiCian Measures appenDiX | November 2010 | 2010 Health Care Quality Report248
* sufficient data not available.
see page 89 for an explanation of terms.
Medical Group Distribution of
Patient Population
Medical Group Distribution of
Patient Population
Risk
Adj
uste
d Ra
te
Confi
denc
e In
terv
al o
f Ris
k Ad
just
ed R
ate
Med
icar
e
Com
mer
cial
MN
Heal
th C
are
Prog
ram
s
Tota
l Pop
ulat
ion
or S
ampl
e
Sam
ple
Size
Non-
Risk
Adj
uste
d Ra
te
Confi
denc
e In
terv
al o
f No
n-Ri
sk A
djus
ted
Rate
Risk
Adj
uste
d Ra
te
Confi
denc
e In
terv
al o
f Ris
k Ad
just
ed R
ate
Med
icar
e
Com
mer
cial
MN
Heal
th C
are
Prog
ram
s
Tota
l Pop
ulat
ion
or S
ampl
e
Sam
ple
Size
Non-
Risk
Adj
uste
d Ra
te
Confi
denc
e In
terv
al o
f No
n-Ri
sk A
djus
ted
Rate
Chlamydia Screening Childhood Immunization Status
PHySIcIAN cLINIc NAME
MEdIcAL GrOuP NAME
Quality of Preventive Care
49% 49–50% NA 77% 23% 49% 49–50% 80% 78–81% NA 63% 37% 80% 78–81%Overall Minnesota Clinic Average
university of Minnesota Physicians - university of Minnesota Physicians Bethesda Clinic
university of Minnesota Physicians - university of Minnesota Physicians Phalen Clinic
West side Community Health services- West side Community Health services east side Family Clinic
West side Community Health services- West side Community Health services la Clinica
West side Community Health services- West side Community Health services Mcdonough Homes Clinic
Xoua thao Medical Center
stIllWAter
st Croix Family Medical Clinic southside Community Health services
st Paul Heart Clinic- lakeview Heart Center st. Paul Heart
stillwater Medical group- Curve Crest Clinic stillwater Medical group
vAdnAIs HeIgHts
Family Healthservices Minnesota Family Healthservices Minnesota
Healtheast Healtheast Clinics
WAConIA
lakeview Clinic lakeview Clinic
* * n/A * * * * * * 62% 40%-82% n/A 12% 88% sample 69 58% 45%-69%
* * n/A * * * * * * 62% 40%-82% n/A 12% 88% sample 69 58% 45%-69%
54% 51%-58% n/A 47% 53% total Population 1347 60% 58%-63% 79% 74%-84% n/A 8% 92% sample 74 68% 57%-78%
54% 51%-58% n/A 47% 53% total Population 1347 60% 58%-63% 79% 74%-84% n/A 8% 92% sample 74 68% 57%-78%
54% 51%-58% n/A 47% 53% total Population 1347 60% 58%-63% 79% 74%-84% n/A 8% 92% sample 74 68% 57%-78%
* * n/A * * * * * * * * n/A * * * * * *
54% 51%-58% n/A 47% 53% total Population 1347 60% 58%-63% 79% 74%-84% n/A 8% 92% sample 74 68% 57%-78%
n/A n/A n/A n/A n/A n/A n/A n/A n/A n/A n/A n/A n/A n/A n/A n/A n/A n/A
53% 48%-57% n/A 95% 5% total Population 745 51% 47%-55% 84% 74%-93% n/A 92% 8% sample 63 86% 75%-93%
* * n/A * * * * * * 87% 82%-91% n/A 55% 45% sample 73 84% 74%-91%
52% 49%-55% n/A 74% 26% total Population 805 52% 49%-56% 90% 83%-96% n/A 69% 31% sample 103 91% 81%-96%
54% 48%-60% n/A 90% 10% total Population 337 55% 49%-60% 85% 71%-97% n/A 84% 16% sample 60 88% 67%-96%
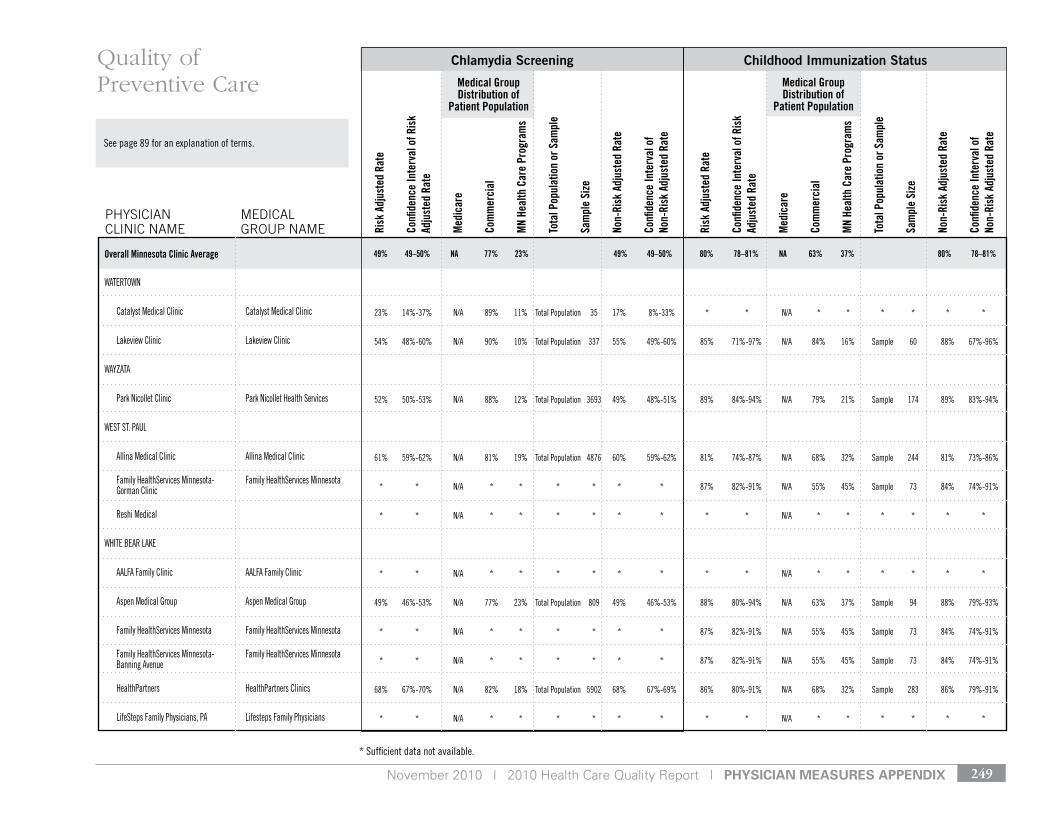
November 2010 | 2010 Health Care Quality Report | pHysiCian Measures appenDiX 249
* sufficient data not available.
see page 89 for an explanation of terms.
Medical Group Distribution of
Patient Population
Medical Group Distribution of
Patient Population
Risk
Adj
uste
d Ra
te
Confi
denc
e In
terv
al o
f Ris
k Ad
just
ed R
ate
Med
icar
e
Com
mer
cial
MN
Heal
th C
are
Prog
ram
s
Tota
l Pop
ulat
ion
or S
ampl
e
Sam
ple
Size
Non-
Risk
Adj
uste
d Ra
te
Confi
denc
e In
terv
al o
f No
n-Ri
sk A
djus
ted
Rate
Risk
Adj
uste
d Ra
te
Confi
denc
e In
terv
al o
f Ris
k Ad
just
ed R
ate
Med
icar
e
Com
mer
cial
MN
Heal
th C
are
Prog
ram
s
Tota
l Pop
ulat
ion
or S
ampl
e
Sam
ple
Size
Non-
Risk
Adj
uste
d Ra
te
Confi
denc
e In
terv
al o
f No
n-Ri
sk A
djus
ted
Rate
Chlamydia Screening Childhood Immunization Status
PHySIcIAN cLINIc NAME
MEdIcAL GrOuP NAME
Quality of Preventive Care
49% 49–50% NA 77% 23% 49% 49–50% 80% 78–81% NA 63% 37% 80% 78–81%Overall Minnesota Clinic Average
WAtertoWn
Catalyst Medical Clinic Catalyst Medical Clinic
lakeview Clinic lakeview Clinic
WAyzAtA
Park nicollet Clinic Park nicollet Health services
West st. PAul
Allina Medical Clinic Allina Medical Clinic
Family Healthservices Minnesota- Family Healthservices Minnesota gorman Clinic
reshi Medical
WHIte BeAr lAke
AAlFA Family Clinic AAlFA Family Clinic
Aspen Medical group Aspen Medical group
Family Healthservices Minnesota Family Healthservices Minnesota
Family Healthservices Minnesota- Family Healthservices Minnesota Banning Avenue
HealthPartners HealthPartners Clinics
lifesteps Family Physicians, PA lifesteps Family Physicians
23% 14%-37% n/A 89% 11% total Population 35 17% 8%-33% * * n/A * * * * * *
54% 48%-60% n/A 90% 10% total Population 337 55% 49%-60% 85% 71%-97% n/A 84% 16% sample 60 88% 67%-96%
52% 50%-53% n/A 88% 12% total Population 3693 49% 48%-51% 89% 84%-94% n/A 79% 21% sample 174 89% 83%-94%
61% 59%-62% n/A 81% 19% total Population 4876 60% 59%-62% 81% 74%-87% n/A 68% 32% sample 244 81% 73%-86%
* * n/A * * * * * * 87% 82%-91% n/A 55% 45% sample 73 84% 74%-91%
* * n/A * * * * * * * * n/A * * * * * *
* * n/A * * * * * * * * n/A * * * * * *
49% 46%-53% n/A 77% 23% total Population 809 49% 46%-53% 88% 80%-94% n/A 63% 37% sample 94 88% 79%-93%
* * n/A * * * * * * 87% 82%-91% n/A 55% 45% sample 73 84% 74%-91%
* * n/A * * * * * * 87% 82%-91% n/A 55% 45% sample 73 84% 74%-91%
68% 67%-70% n/A 82% 18% total Population 5902 68% 67%-69% 86% 80%-91% n/A 68% 32% sample 283 86% 79%-91%
* * n/A * * * * * * * * n/A * * * * * *
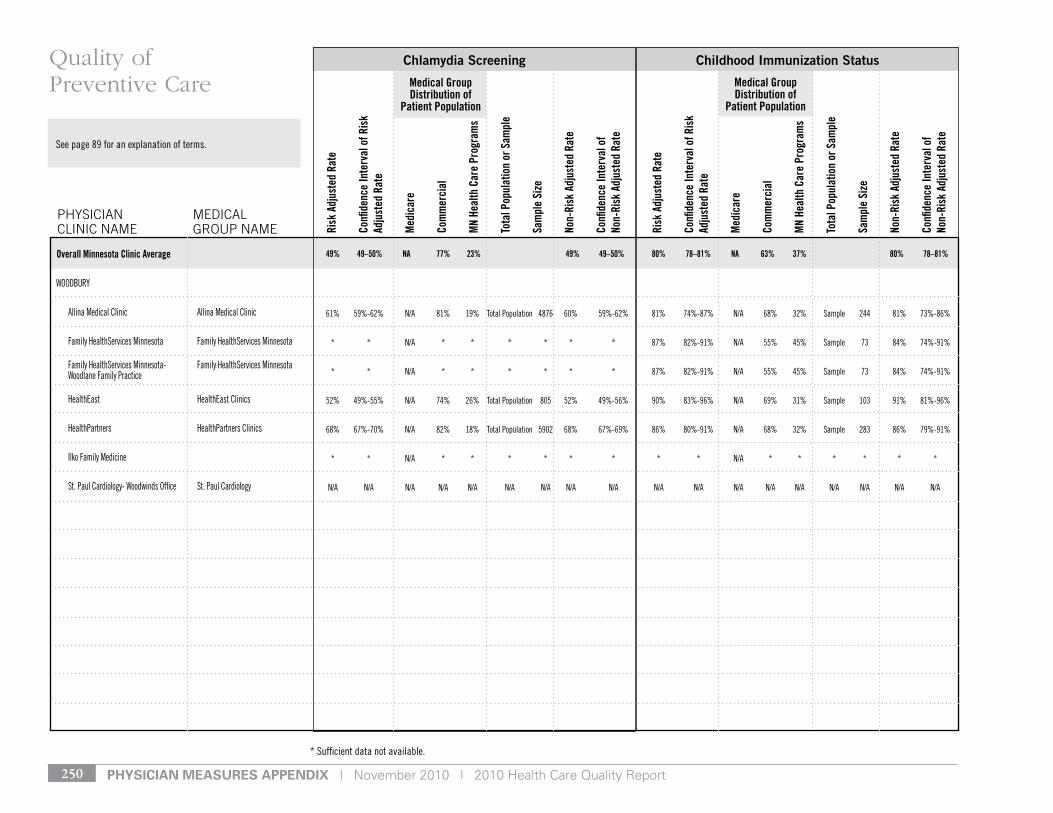
pHysiCian Measures appenDiX | November 2010 | 2010 Health Care Quality Report250
* sufficient data not available.
see page 89 for an explanation of terms.
Medical Group Distribution of
Patient Population
Medical Group Distribution of
Patient Population
Risk
Adj
uste
d Ra
te
Confi
denc
e In
terv
al o
f Ris
k Ad
just
ed R
ate
Med
icar
e
Com
mer
cial
MN
Heal
th C
are
Prog
ram
s
Tota
l Pop
ulat
ion
or S
ampl
e
Sam
ple
Size
Non-
Risk
Adj
uste
d Ra
te
Confi
denc
e In
terv
al o
f No
n-Ri
sk A
djus
ted
Rate
Risk
Adj
uste
d Ra
te
Confi
denc
e In
terv
al o
f Ris
k Ad
just
ed R
ate
Med
icar
e
Com
mer
cial
MN
Heal
th C
are
Prog
ram
s
Tota
l Pop
ulat
ion
or S
ampl
e
Sam
ple
Size
Non-
Risk
Adj
uste
d Ra
te
Confi
denc
e In
terv
al o
f No
n-Ri
sk A
djus
ted
Rate
Chlamydia Screening Childhood Immunization Status
PHySIcIAN cLINIc NAME
MEdIcAL GrOuP NAME
Quality of Preventive Care
49% 49–50% NA 77% 23% 49% 49–50% 80% 78–81% NA 63% 37% 80% 78–81%Overall Minnesota Clinic Average
WoodBury
Allina Medical Clinic Allina Medical Clinic
Family Healthservices Minnesota Family Healthservices Minnesota
Family Healthservices Minnesota- Family Healthservices Minnesota Woodlane Family Practice
Healtheast Healtheast Clinics
HealthPartners HealthPartners Clinics
Ilko Family Medicine
st. Paul Cardiology- Woodwinds office st. Paul Cardiology
61% 59%-62% n/A 81% 19% total Population 4876 60% 59%-62% 81% 74%-87% n/A 68% 32% sample 244 81% 73%-86%
* * n/A * * * * * * 87% 82%-91% n/A 55% 45% sample 73 84% 74%-91%
* * n/A * * * * * * 87% 82%-91% n/A 55% 45% sample 73 84% 74%-91%
52% 49%-55% n/A 74% 26% total Population 805 52% 49%-56% 90% 83%-96% n/A 69% 31% sample 103 91% 81%-96%
68% 67%-70% n/A 82% 18% total Population 5902 68% 67%-69% 86% 80%-91% n/A 68% 32% sample 283 86% 79%-91%
* * n/A * * * * * * * * n/A * * * * * *
n/A n/A n/A n/A n/A n/A n/A n/A n/A n/A n/A n/A n/A n/A n/A n/A n/A n/A
November 2010 | 2010 Health Care Quality Report | pHysiCian Measures appenDiX 251
Data sourCes anD Data ColleCtion proCeDures
Measures reporteD DireCtly By pHysiCian CliniCsPhysician clinics directly report data on the optimal diabetes and optimal vascular care measures. All data elements are speci-fied by the Minnesota Department of Health in Minnesota Rules Chapter 4654 and its technical appendices. These data elements are described at a more detailed level in MN Community Mea-surement’s 2010 Direct Data Submission (DDS) Guide and Sum-mary Data Submission (SDS) Guide (both relating to 2009 dates of service). These guides provide detailed steps and instructions to ensure submitted data meets rigorous standards.
Under Minnesota Rules Chapter 4654, physician clinics are re-quired to submit data at a summary level. Physician clinics may meet these data submission requirements in one of two ways: 1) they may choose to submit data through the Direct Data Sub-mission process as part of an agreement with MN Community Measurement (MNCM) and authorize MNCM to submit sum-mary data results to MDH on their behalf; or 2) they may submit summary levels of information directly to MNCM’s portal through the Summary Data Submission process. Data submitted through the DDS process are audited by MNCM. Virtually all clinics (519 out of 523 on the optimal diabetes measure and 518 out of 520 on the optimal vascular care measure) used the DDS process in reporting data on 2009 dates of service.
Regardless of which data submission method they use, physician clinics must first register through the MNCM Data Portal. Once registered, they indicate which data submission process they intend to use. In this reporting cycle, physician clinics could opt to report data on a clinic’s total patient population or to submit data for a random sample of the clinic’s entire patient population.
Detailed instructions for sampling are also provided in the DDS Guide and SDS Guide. Data is collected from medical records by clinic abstractors either extracting the data from an electronic medical record through a data query or by abstracting the data from a paper-based medical record. Physician clinics complete numerous quality checks of the data before it is submitted to MNCM. All appropriate HIPAA requirements are followed for data submitted through the DDS process. These requirements do not apply to summary data submission because no patient-identifi-able information is reported.
The required data elements are submitted directly through the portal by physician clinics. If the data is submitted through the DDS process, an extensive validation process is followed. MNCM uses the National Committee for Quality Assurance’s (NCQA) “8 and 30” File Sampling Procedure, developed in 1996 in consulta-tion with Johns Hopkins University. For a detailed description of this procedure, see www.ncqa.org.
ClaiMs-BaseD Measures CalCulateD at tHe MeDiCal group level The data source of claims-based measures calculated at the medical group level is the health plan administrative claims data-base which is supplemented by medical record review for some measures. Most data elements are specified by the Healthcare Effectiveness Data and Information Set (HEDIS) 2009 Technical Specifications (2008 dates of service). HEDIS is produced and maintained by the National Committee for Quality Assurance (NCQA). The technical specifications provide detailed steps and instructions to ensure that the submitted data meets rigorous standards. Some data elements are specified by MNCM and pro-vided to the health plans.
pHysiCian Measures appenDiX | November 2010 | 2010 Health Care Quality Report252
The data elements are collected by the health plans using data collection and reporting standards that follow the annual HEDIS calendar. In addition, each health plan follows an extensive valida-tion process to ensure quality measures follow the standards described in Volume 5, HEDIS Compliance Audit ®: Standards, Policies and Procedures. All health plan data are audited by an NCQA-certified HEDIS auditor.
MNCM develops a Data Structure document with detailed steps and instructions to ensure that the submitted data meets rigor-ous standards. In 2009, ten data sources – Blue Cross and Blue Shield of Minnesota, FirstPlan of Minnesota, HealthPartners, Medica, Metropolitan Health Plan, PreferredOne, PrimeWest Health System (county-based purchaser), Sanford Health Plan, South Country Health Alliance (county-based purchaser), UCare – submitted data to MNCM for purposes of public reporting. The submitted health plan data reflects patients/members enrolled in the following products: commercial HMO/POS/PPO, Medicare Cost, Medicare Risk, and Minnesota Health Care Programs (Pre-paid Medical Assistance including dual eligibles, MinnesotaCare, General Assistance Medical Care). These data do not include pa-tients who are uninsured, patients who self pay, or patients who are served by Medicaid/Medicare fee-for-service.
All data files are submitted to MNCM for aggregation and valida-tion. These processes are performed by an independent vendor under contract with MNCM. Files are carefully reviewed to en-sure conformance with the data structure and to identify unusual or unanticipated patterns. The files are also checked for proper formatting, missing and invalid values, and to confirm accurate record counts. Preliminary health plan rates are calculated and returned to each health plan for additional validation.
Once these checks are finalized, the data files from all ten health plans are aggregated to create a comprehensive data file of re-sults by medical group. The aggregated data file is then checked for accurate record counts, and preliminary MNCM rates are cal-culated. The preliminary rates are carefully reviewed by MNCM staff and the data aggregation vendor. Particular attention is paid to notable changes from previous years at the statewide and medical group levels.
In this report, MDH is assigning the medical group score to each physician clinic that is part of that medical group. Approximately 40 physician clinics report they are now part of another medical group; these physician clinics received the medical group’s score of which they were a part during the measurement period.
MetHoDology
Measures reporteD DireCtly By pHysiCian CliniCsTwo measures are reported directly by physician clinics– Optimal Diabetes Care and Optimal Vascular Care. These measures are “all-or-none” composite measures, meaning that each compo-nent of the measure must be achieved for a clinic to receive credit for providing optimal care for a particular patient. Each year, these measure specifications are reviewed against current evidence-based guidelines and input is sought from community experts. The measure specifications are incorporated into Minne-sota Rules Chapter 4654 and its technical appendices.
Physician clinics without specialties related to a given measure have a “not applicable” designation in the table of results.
November 2010 | 2010 Health Care Quality Report | pHysiCian Measures appenDiX 253
eligible population specificationsThe eligible populations for these measures are identified by physician clinics. Standard definitions for the eligible population for each measure include elements such as age, appropriate di-agnosis codes, and number of visits needed in the measurement timeframe. Each required element is outlined in Minnesota Rules Chapter 4654 and further specified in the 2010 DDS and SDS Guide.
patient attribution to physician ClinicsMedical groups must attribute each patient to a single physician clinic. Each medical group’s patient attribution method must be identified by the medical group using one of three possible meth-ods and is then reviewed by MNCM as part of the denominator certification process.
sampling from total populationFor this reporting cycle, physician clinics could either submit data on their full population or a random sample of at least 60 patients. The 2010 DDS and SDS Guides describe accepted methods to select a random sample. This step is reviewed by MNCM as part of the denominator certification process.
numerator specificationsThe numerator is the number of patients identified from either the eligible population or the random sample who meet the numera-tor targets. These targets are specified by the Minnesota Depart-ment of Health in Minnesota Rules Chapter 4654 and its technical appendices. MNCM audits results of physician clinics using the DDS submission process.
Calculating non-risk adjusted ratesPhysician clinic rates are calculated as 100 times the number who meet the numerator specifications divided by the number in the
denominator for the measure. Rates from measures using the to-tal eligible population are straightforward calculations whereby the total eligible population serves as the denominator. For clinics that sampled their populations, the rates calculated for the measures require weighting to account for the total eligible population. Due to the dynamic nature of clinic patient populations, rates and 95 percent asymmetrical confidence intervals are calculated for each measure for each clinic regardless of whether clinics report on a full population or a sample. Asymmetrical confidence intervals are used to avoid confidence interval lower-bound values less than zero and upper-bound values greater than one hundred. Physi-cian clinic rates are reported as percentages. Physician clinic rates are first calculated for each clinic and then a statewide clinic rate average is calculated. The statewide average rate is used when comparing a single physician clinic to the performance of all physi-cian clinics.
risk adjustmentMinnesota Statutes 62U.02 requires the Commissioner of Health to establish a system of risk-adjusting quality measures and to issue annual public reports on provider quality. The results in this report are published on a risk-adjusted basis in the main part of the document, while the technical appendices show both risk-adjusted and unadjusted results. Physician clinic results are adjusted by primary product type (commercial, Medicare, and MN health care programs/uninsured). Essentially, the risk-adjusted results assume that all physician clinics have the same distribution of patients between these three different categories and multi-plies their actual result for each product type by the statewide distribution of patients by product type. The calculation of confi-dence intervals for risk adjusted rates uses a similar methodology as described above for the calculation of non-risk adjusted rates. However, a weighted average of the variance for the different payer categories is used in the confidence interval calculation.*
* Curtin, lr and rJ klein. “direct standardization (Age-Adjusted death rates).” Centers for disease Control and Prevention and national Center for Health statistics. Healthy People 2000 statistical notes no. 6. 1995.
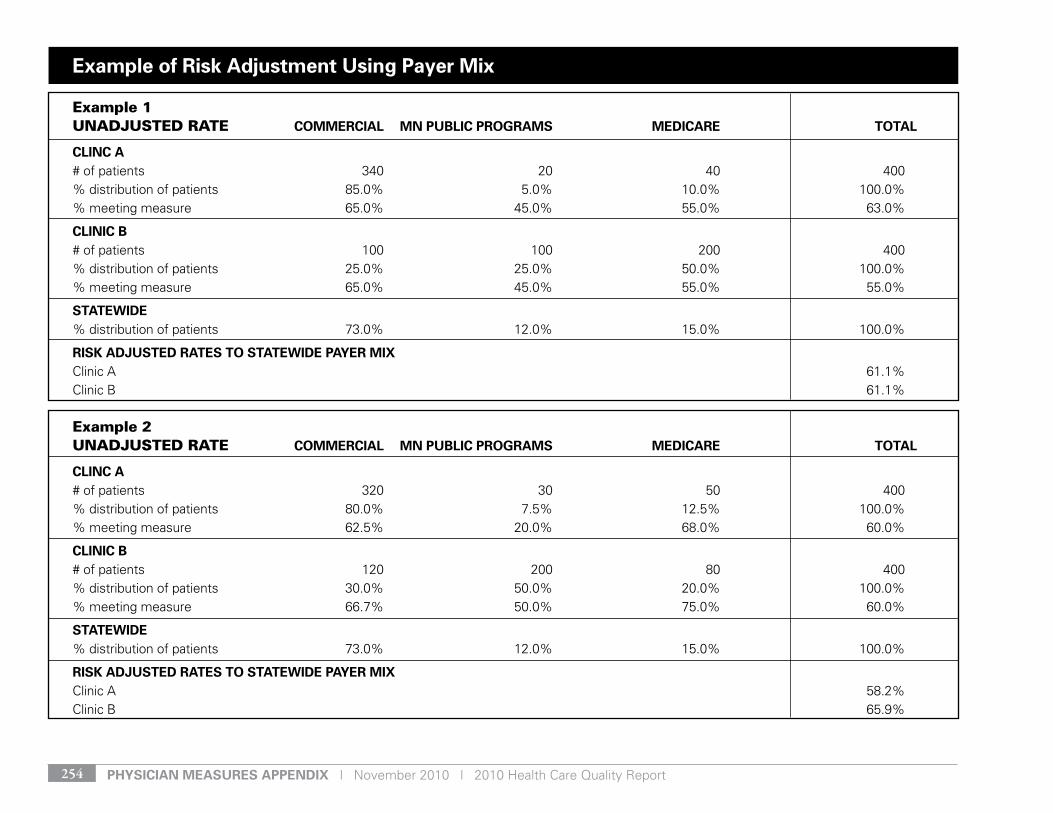
pHysiCian Measures appenDiX | November 2010 | 2010 Health Care Quality Report254
example of risk adjustment using payer Mix
example 1 unadjusted rate CoMMerCial Mn puBliC prograMs MeDiCare total
ClinC a# of patients 340 20 40 400% distribution of patients 85.0% 5.0% 10.0% 100.0%% meeting measure 65.0% 45.0% 55.0% 63.0%
CliniC B# of patients 100 100 200 400% distribution of patients 25.0% 25.0% 50.0% 100.0%% meeting measure 65.0% 45.0% 55.0% 55.0%
stateWiDe% distribution of patients 73.0% 12.0% 15.0% 100.0%
risk aDjusteD rates to stateWiDe payer MiXClinic A 61.1%Clinic B 61.1%
example 2unadjusted rate CoMMerCial Mn puBliC prograMs MeDiCare total
ClinC a# of patients 320 30 50 400% distribution of patients 80.0% 7.5% 12.5% 100.0%% meeting measure 62.5% 20.0% 68.0% 60.0%
CliniC B# of patients 120 200 80 400% distribution of patients 30.0% 50.0% 20.0% 100.0%% meeting measure 66.7% 50.0% 75.0% 60.0%
stateWiDe% distribution of patients 73.0% 12.0% 15.0% 100.0%
risk aDjusteD rates to stateWiDe payer MiXClinic A 58.2%Clinic B 65.9%
November 2010 | 2010 Health Care Quality Report | pHysiCian Measures appenDiX 255
When a physician clinic has less than 10 patients in a payer category, the statewide rate is incorporated into the payer category rate in pro-portion to the number of patients under 10 in a payer category. For example, if a clinic has 6 Medicare patients, 60% of the Medicare rate for the clinic would be based on the clinic’s data and 40% would be based on the statewide average for Medicare payers. This adjust-ment is made to address issues with small sample sizes.
Page 254 provides two examples of the risk adjustment methodol-ogy. In example one, Clinics A and B have a different patient payer mix, but their performance by product type is the same. Under risk adjustment, the overall performance for both clinics is the same as they had the same performance by product type. Without risk ad-justment, Clinic A appears to perform better than Clinic B, but this is generally due to the fact that Clinic A has more commercial patients with higher performance and Clinic B has more Medicare and public program patients with lower performance. In the second example, Clinics A and B have the same unadjusted overall rate of perfor-mance, but their patient payer mix and performance by product type is different. When results for Clinics A and B are adjusted to reflect a statewide average distribution of patients by product type, the overall performance for Clinic A decreases and the overall performance for Clinic B increases. The unadjusted performance of individual clinics is adjusted to account for potential differences in patient populations which may be outside of the influence of a clinic. This product mix adjustment is done to make clinic results more comparable, regard-less of patient characteristics.
limitationsAlthough participation in the Minnesota Statewide Quality Report-ing and Measurement System was required beginning in 2010, not all physician clinics submitted their results. Therefore, the results collected do not represent all physician clinics that serve patients in Minnesota. In addition, a physician clinic’s results are publicly re-ported only if a minimum threshold of 30 patients is met. For this reason, MDH is not including results for 140 (or 24 percent) physician clinics reporting data on the optimal vascular measure or 47 (or eight
percent) physician clinics submitting data on the optimal diabetes care measure.
physician Clinic inclusion A multistep approach was used to determine which physician clinics would be included in this report. The clinics listed in this document were required to submit data on the Optimal Diabetes Care and/or Optimal Vascular Care measures under Minnesota Rules Chapter 4654. Medical groups with HEDIS data who were not required to report on the diabetes or vascular measures are not included in this report. The following considerations were used to determine which physician clinics are included.
n In this first year of mandatory reporting, it was not uniformly un-derstood among physician clinics that reporting is required at a site level. Physician clinics may only combine reporting across clinics when they meet certain criteria, including that various sites are commonly owned and share common clinical staff across their various sites. MDH recognizes that was a change from how some physician clinics previously reported on a vol-untary basis and that new physician clinics may not have un-derstood that results for a satellite clinic may not be combined with results from a main clinic. Recognizing this is a transition year for physician clinic reporting, MDH is publishing the results as they were reported at an aggregated level rather than noting that results were not submitted specifically for a satellite clinic location. In future years, MDH will call greater attention to this issue in the report.
n In May 2010, MDH mailed letters to known physician clinics in the state who had not registered with MNCM. Those clinics which did not register and submit data and were determined to have relevant specialists are included in the report. The same assumption regarding satellite clinics was used when reviewing these clinics. Those clinics that were part of a medical group which did submit data are not included separately from their medical group in this report.
pHysiCian Measures appenDiX | November 2010 | 2010 Health Care Quality Report256
n Physician clinics which registered with MNCM, but did not sub-mit measure data for diabetes and vascular care were compared with the specialty information submitted by the clinic during the registration process. If the specialties onsite were appropriate for measure reporting, the clinic is included in this report. If the specialties onsite were not appropriate for measure reporting, the clinic is not included in this report.
ClaiMs-BaseD Measures CalCulateD at tHe MeDiCal
group levelTwo types of measures are calculated at the medical group level and reported for each affiliated physician clinic – measures that use an administrative data only method and measures that use a hybrid method. The following measures use the administrative method:n Appropriate Testing for Children with Pharyngitisn Appropriate Treatment for Children with
Upper Respiratory Infectionn Breast Cancer Screeningn Cervical Cancer Screeningn Chlamydia Screeningn Use of Appropriate Medications for People with Asthman Avoidance of Antibiotic Treatment of Adults with Bronchitis
The following measures used the hybrid method:n Cancer Screening Combinedn Childhood Immunization Status (Combo 3)n Controlling High Blood Pressuren Colorectal Cancer Screening
Each year, these measure specifications are reviewed against current evidence-based guidelines and input is sought from com-munity experts at the national level. Measurement specifications for medical group results were calculated using NCQA’s 2009 HE-DIS Technical Specifications along with MNCM-specific numera-tor specifications for some measures.
Physician clinics without specialties related to a given measure have a “not applicable” designation in the table of results.
eligible population specificationsThe eligible populations for the administrative and hybrid mea-sures are identified by each participating health plan utilizing its respective administrative databases. NCQA’s 2009 HEDIS Techni-cal Specifications provide the standard definitions for the eligible population for each measure, which include data elements such as age, continuous enrollment, and anchor date requirements.
Rates for measures using the administrative method are wholly derived from health plan claims data, while rates for measures using the hybrid method are derived from a combination of health plan claims data and medical record review data. For administra-tive measures, the entire eligible population is the denominator. For hybrid measures, the eligible population serves as the sam-pling frame from which to draw the denominator.
patient attribution to Medical groupsHealth plans assign patients to a medical group using a frequen-cy-based attribution logic and a standard medical group definition using Tax Identification Numbers. Administrative billing codes identify the frequency of patient visits to medical groups. For most measures, patients are assigned to the medical group they visited most frequently during the measurement year. Patients who visit two or more medical groups with the same frequency are attributed to the medical group visited most recently. For three measures – Appropriate Testing for Children with Pharyn-gitis, Appropriate Treatment for Children with Upper Respiratory Infection and Avoidance of Antibiotic Treatment of Adults with Bronchitis – patients are assigned to the clinic they visited for the specific service.
November 2010 | 2010 Health Care Quality Report | pHysiCian Measures appenDiX 257
sampling for Hybrid MeasuresAs noted previously, the hybrid method requires each participat-ing health plan to first identify the eligible population meeting measurement specifications using its administrative databases. This population of eligibles serves as the sampling frame from which to draw the denominator (the patients for whom medi-cal record review would be completed). The resource-intensive nature of medical record review necessitates a random sample of the eligible population. Medical record review is conducted for all enrollees drawn for the sample.
MNCM uses a two-stage, random sampling process. This strat-egy has been designed with statisticians to ensure reporting for the maximum number of medical groups while minimizing the impact of weighting on the results for any one medical group. The sampling procedure starts with the health plans providing a data file containing a record for each eligible patient for each hybrid measure. This file also identifies eligible patients that have also been selected for the annual HEDIS sample. Additional pa-tients are then selected from the remaining eligible population to meet MNCM minimum reporting requirements.
numerator specificationsFor administrative measures, the numerator is the number of pa-tients from the eligible population who meet numerator targets. For hybrid measures, the numerator is the number of patients from the sample who meet numerator targets.
WeightingBecause data for hybrid measures are taken from a sample, results are weighted to obtain accurate rates. This allows for ag-gregation and unbiased reporting by medical group. Weighting is a cost-saving measure that enables MNCM to draw a sample on which to estimate medical group and statewide rates. Weighting is applied to efficiently utilize health plan resources for data col-lection on a randomly sampled population.
Weights are calculated for each sampling stratum (i.e. health plan/health plan product/medical group). A weight is equal to the total eligible population for that stratum divided by the total sample size. In calculating rates for a population – medical group or state-wide – the denominator is the sum of the weights for all patients in that population, and the numerator is the sum of the weights for patients in the population who meet the numerator targets.
Calculating non-risk adjusted ratesRates are expressed as percentages. They are calculated as 100 times the number who meet the numerator targets divided by the number who are eligible for the measure. Rates calculated for measures using the administrative method are straightforward. However, rates calculated for measures using the hybrid method require weighting because of the sampling procedures. Rates and 95-percent-asymmetrical confidence intervals are calculated for each measure for each medical group. Asymmetrical confi-dence intervals are used to avoid confidence interval lower-bound values less than zero and upper bound values greater than one hundred. Confidence intervals for the hybrid measures have also been calculated to take account of the complex sampling design and weighting using SAS survey.
ratesRates are calculated at both a statewide level and at a medical group level. Statewide rates include those patients attributed to a medical group AND those who could not be attributed to a medi-cal group (i.e., all patients regardless of medical group affiliation). Medical group average rates include ONLY those patients who are attributed to medical groups. This rate is used when com-paring a single medical group to the performance of all medical groups. The medical group average may be slightly higher than the statewide average, because it includes patients who access care more frequently.
pHysiCian Measures appenDiX | November 2010 | 2010 Health Care Quality Report258
risk adjustmentResults for measures calculated at the medical group level are also risk adjusted by primary payer type. Similar to results for the optimal diabetes care and optimal vascular care measures, the risk-adjusted results assume that all medical groups have the same distribution of patients by primary payer type (commercial, Medicare, and MN health care programs/uninsured) and multi-plies their actual result for each product type by the statewide distribution of patients by product type. The calculation of confi-dence intervals for risk adjusted rates uses a similar methodology as described above for the calculation of non-risk adjusted rates. However, a weighted average of the variance for the different payer categories is used in the confidence interval calculation.*
Similar to optimal diabetes and optimal vascular care, when a medical group has less than 10 patients in a payer category, the statewide rate is incorporated into the payer category rate in proportion to the number of patients under 10 in a payer cat-egory. For example, if a medical group has 6 Medicare patients, 60% of the Medicare rate for the medical group would be based on the medical group’s data and 40% would be based on the statewide average for Medicare payers. This adjustment is made to address issues with small sample sizes. Not all mea-sures in these categories apply to each primary product type; the risk adjustment methodology accounts for these variations across measures.
limitationsThe physician clinics identified in this report do not represent all medical groups in Minnesota. MDH is aligning with MNCM’s es-tablished minimum thresholds for public reporting. Only medical groups that meet these thresholds are reported. For the hybrid measures, a minimum threshold of 60 patients per medical group
is required. For the administrative measures, a minimum thresh-old of 30 patients per medical group is required. It should also be noted that medical groups reported for some measures may not be reported for all measures.
Also, data used to calculate rates for these measures reflect patients insured through ten health plans. Medical groups with patients who are insured through other health plans, who are uninsured, who self pay, or who are served by a fee-for-service program are not reflected in these results. Therefore, the data for these measures don’t necessarily represent a medical group’s entire patient population.
Finally, while MDH is reporting these medical group level results at the clinic level, readers should be aware that these results re-flect the performance of the entire medical group with which the clinic is affiliated rather than only that clinic’s performance. MDH chose to report these results at the clinic level in order to present information in a more consumer-friendly manner.
Caution is recommended when making comparisons from year to year. Annual rate differences can occur due to natural variation, changes in measurement specifications, changes in data sources and other factors.
* Curtin, lr and rJ klein. “direct standardization (Age-Adjusted death rates).” Centers for disease Control and Prevention and national Center for Health statistics. Healthy People 2000 statistical notes no. 6. 1995.

Hospital Measures appenDiX | November 2010 | 2010 Health Care Quality Report259
guiDe to unDerstanDing tHe DetaileD Measure result Data . . . . . 260
Quality of Care for Heart ConDitions Measure result Data . . . . . 262
Quality of Care for Heart surgeries Measure result Data . . . . . . 264
Quality of Care for otHer surgeries Measure result Data . . . . . . 266
Quality of Care for MeDiCal CoMpliCations Measure
result Data . . . . . . . . . . . . . . . . . . . . . . . . . . . . . . . . . . . . . . . . . . . . . . . . . . . . . 270
Quality of infeCtion prevention Measure result Data . . . . . . . . . . 272
Quality of Care for otHer ConDitions Measure result Data . . . . . 274
MetHoDs . . . . . . . . . . . . . . . . . . . . . . . . . . . . . . . . . . . . . . . . . . . . . . . . . . . . . . . . 278
The following section provides more information about the measures outlined in this report. Additional data elements are included in the following detailed tables. These elements vary depending on the measure and the data source. The methods section provides more information on the data source and calculation for the various measures.
Appendix 2: Hospital Measures
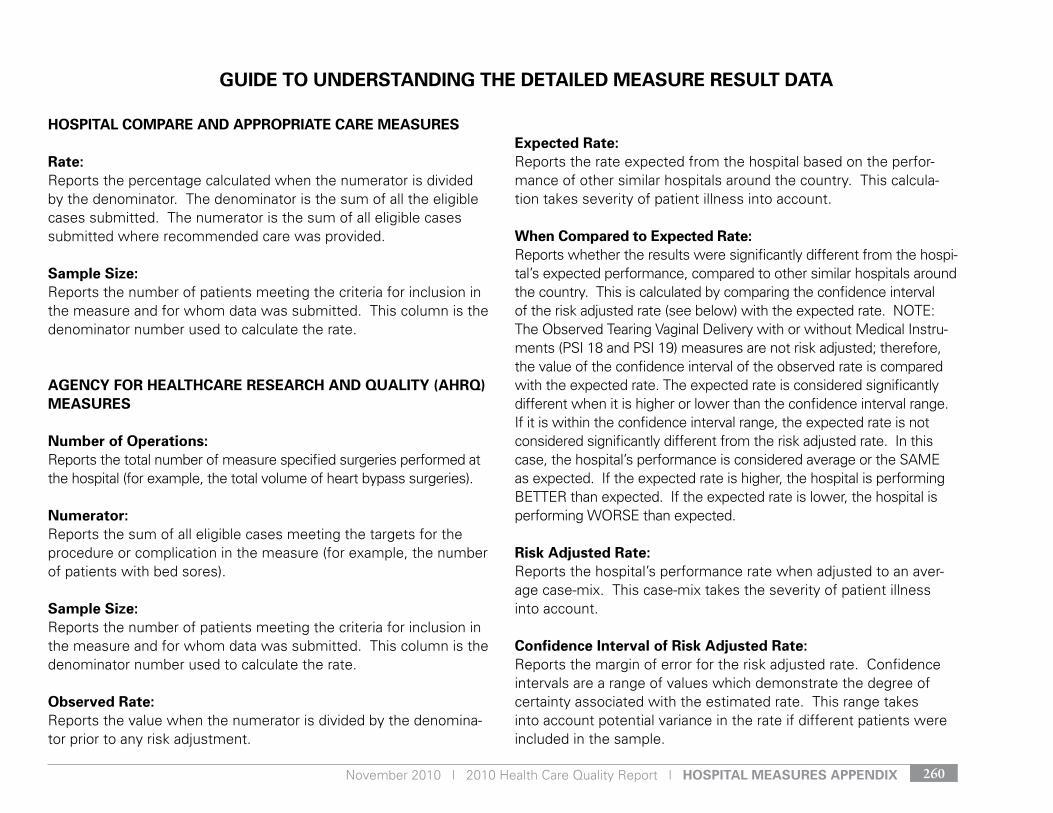
November 2010 | 2010 Health Care Quality Report | Hospital Measures appenDiX 260
Hospital CoMpare anD appropriate Care Measures
rate: Reports the percentage calculated when the numerator is divided by the denominator. The denominator is the sum of all the eligible cases submitted. The numerator is the sum of all eligible cases submitted where recommended care was provided.
sample size:Reports the number of patients meeting the criteria for inclusion in the measure and for whom data was submitted. This column is the denominator number used to calculate the rate.
agenCy for HealtHCare researCH anD Quality (aHrQ) Measures
number of operations:Reports the total number of measure specified surgeries performed at the hospital (for example, the total volume of heart bypass surgeries).
numerator:Reports the sum of all eligible cases meeting the targets for the procedure or complication in the measure (for example, the number of patients with bed sores).
sample size:Reports the number of patients meeting the criteria for inclusion in the measure and for whom data was submitted. This column is the denominator number used to calculate the rate.
observed rate:Reports the value when the numerator is divided by the denomina-tor prior to any risk adjustment.
expected rate:Reports the rate expected from the hospital based on the perfor-mance of other similar hospitals around the country. This calcula-tion takes severity of patient illness into account.
When Compared to expected rate:Reports whether the results were significantly different from the hospi-tal’s expected performance, compared to other similar hospitals around the country. This is calculated by comparing the confidence interval of the risk adjusted rate (see below) with the expected rate. NOTE: The Observed Tearing Vaginal Delivery with or without Medical Instru-ments (PSI 18 and PSI 19) measures are not risk adjusted; therefore, the value of the confidence interval of the observed rate is compared with the expected rate. The expected rate is considered significantly different when it is higher or lower than the confidence interval range. If it is within the confidence interval range, the expected rate is not considered significantly different from the risk adjusted rate. In this case, the hospital’s performance is considered average or the SAME as expected. If the expected rate is higher, the hospital is performing BETTER than expected. If the expected rate is lower, the hospital is performing WORSE than expected.
risk adjusted rate:Reports the hospital’s performance rate when adjusted to an aver-age case-mix. This case-mix takes the severity of patient illness into account.
Confidence interval of risk adjusted rate:Reports the margin of error for the risk adjusted rate. Confidence intervals are a range of values which demonstrate the degree of certainty associated with the estimated rate. This range takes into account potential variance in the rate if different patients were included in the sample.
guiDe to unDerstanDing tHe DetaileD Measure result Data
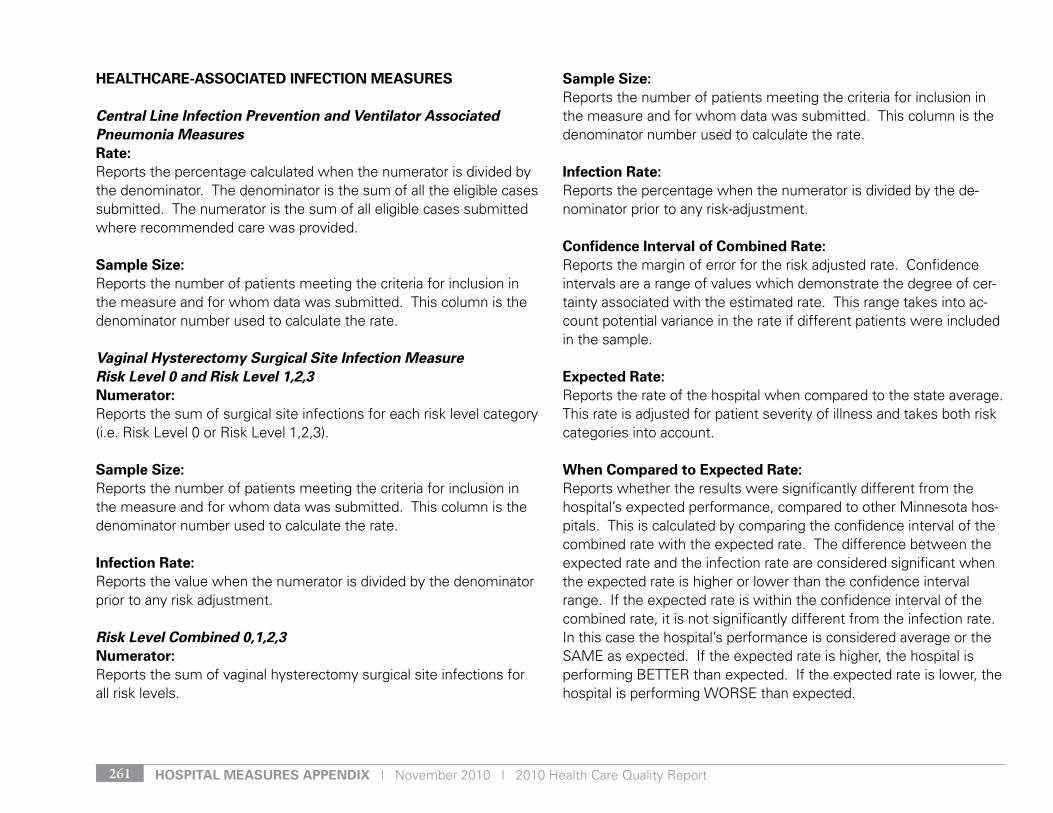
guiDe to unDerstanDing tHe DetaileD Measure result Data
Hospital Measures appenDiX | November 2010 | 2010 Health Care Quality Report261
HealtHCare-assoCiateD infeCtion Measures
central line infection prevention and Ventilator associated pneumonia measuresrate: Reports the percentage calculated when the numerator is divided by the denominator. The denominator is the sum of all the eligible cases submitted. The numerator is the sum of all eligible cases submitted where recommended care was provided.
sample size:Reports the number of patients meeting the criteria for inclusion in the measure and for whom data was submitted. This column is the denominator number used to calculate the rate.
Vaginal hysterectomy surgical site infection measurerisk level 0 and risk level 1,2,3numerator:Reports the sum of surgical site infections for each risk level category (i.e. Risk Level 0 or Risk Level 1,2,3).
sample size:Reports the number of patients meeting the criteria for inclusion in the measure and for whom data was submitted. This column is the denominator number used to calculate the rate.
infection rate:Reports the value when the numerator is divided by the denominator prior to any risk adjustment.
risk level combined 0,1,2,3numerator:Reports the sum of vaginal hysterectomy surgical site infections for all risk levels.
sample size:Reports the number of patients meeting the criteria for inclusion in the measure and for whom data was submitted. This column is the denominator number used to calculate the rate.
infection rate:Reports the percentage when the numerator is divided by the de-nominator prior to any risk-adjustment.
Confidence interval of Combined rate:Reports the margin of error for the risk adjusted rate. Confidence intervals are a range of values which demonstrate the degree of cer-tainty associated with the estimated rate. This range takes into ac-count potential variance in the rate if different patients were included in the sample.
expected rate:Reports the rate of the hospital when compared to the state average. This rate is adjusted for patient severity of illness and takes both risk categories into account.
When Compared to expected rate:Reports whether the results were significantly different from the hospital’s expected performance, compared to other Minnesota hos-pitals. This is calculated by comparing the confidence interval of the combined rate with the expected rate. The difference between the expected rate and the infection rate are considered significant when the expected rate is higher or lower than the confidence interval range. If the expected rate is within the confidence interval of the combined rate, it is not significantly different from the infection rate. In this case the hospital’s performance is considered average or the SAME as expected. If the expected rate is higher, the hospital is performing BETTER than expected. If the expected rate is lower, the hospital is performing WORSE than expected.
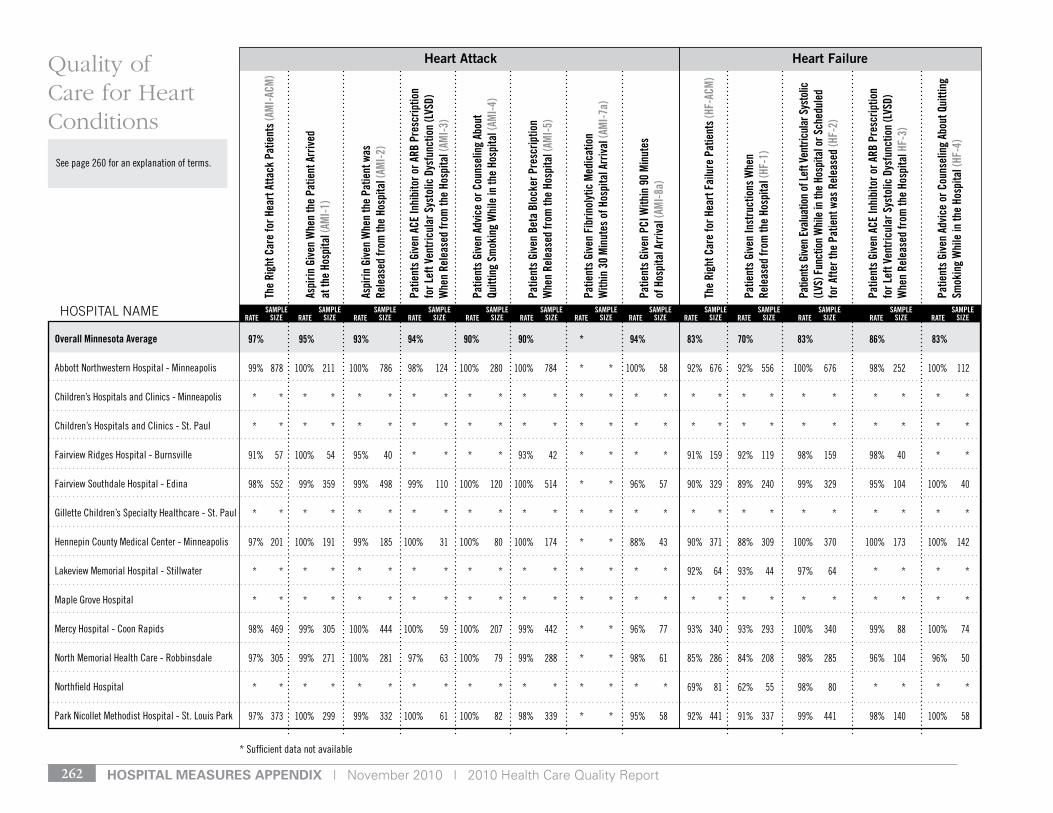
Hospital Measures appenDiX | November 2010 | 2010 Health Care Quality Report262
see page 260 for an explanation of terms.
The
Righ
t Car
e fo
r Hea
rt A
ttack
Pat
ient
s (A
MI-
ACM
)
Aspi
rin G
iven
Whe
n th
e Pa
tient
Arr
ived
at
the
Hosp
ital (
AMI-
1)
Aspi
rin G
iven
Whe
n th
e Pa
tient
was
Re
leas
ed fr
om th
e Ho
spita
l (AM
I-2)
Patie
nts
Give
n AC
E In
hibi
tor o
r ARB
Pre
scrip
tion
fo
r Lef
t Ven
tric
ular
Sys
tolic
Dys
func
tion
(LVS
D)
Whe
n Re
leas
ed fr
om th
e Ho
spita
l (AM
I-3)
Patie
nts
Give
n Ad
vice
or C
ouns
elin
g Ab
out
Quitt
ing
Smok
ing
Whi
le in
the
Hosp
ital (
AMI-
4)
Patie
nts
Give
n Be
ta B
lock
er P
resc
riptio
n
Whe
n Re
leas
ed fr
om th
e Ho
spita
l (AM
I-5)
Patie
nts
Give
n Fi
brin
olyt
ic M
edic
atio
n
With
in 3
0 M
inut
es o
f Hos
pita
l Arr
ival
(AM
I-7a
)
Patie
nts
Give
n PC
I With
in 9
0 M
inut
es
of H
ospi
tal A
rriv
al (A
MI-
8a)
The
Righ
t Car
e fo
r Hea
rt F
ailu
re P
atie
nts
(HF-
ACM
)
Patie
nts
Give
n In
stru
ctio
ns W
hen
Re
leas
ed fr
om th
e Ho
spita
l (HF
-1)
Patie
nts G
iven
Eval
uatio
n of
Left
Vent
ricul
ar S
ysto
lic
(LVS
) Fun
ctio
n W
hile
in th
e Ho
spita
l or S
ched
uled
fo
r Afte
r the
Pat
ient
was
Rel
ease
d (H
F-2)
Patie
nts
Give
n AC
E In
hibi
tor o
r ARB
Pre
scrip
tion
fo
r Lef
t Ven
tric
ular
Sys
tolic
Dys
func
tion
(LVS
D)
Whe
n Re
leas
ed fr
om th
e Ho
spita
l HF-
3)
Patie
nts
Give
n Ad
vice
or C
ouns
elin
g Ab
out Q
uitti
ng
Smok
ing
Whi
le in
the
Hosp
ital (
HF-4
)
Overall Minnesota Average
Abbott northwestern Hospital - Minneapolis
Children’s Hospitals and Clinics - Minneapolis
Children’s Hospitals and Clinics - st. Paul
Fairview ridges Hospital - Burnsville
Fairview southdale Hospital - edina
gillette Children’s specialty Healthcare - st. Paul
Hennepin County Medical Center - Minneapolis
lakeview Memorial Hospital - stillwater
Maple grove Hospital
Mercy Hospital - Coon rapids
north Memorial Health Care - robbinsdale
northfield Hospital
Park nicollet Methodist Hospital - st. louis Park
Heart Attack Heart Failure
97% 95% 93% 94% 90% 90% * 94% 83% 70% 83% 86% 83%
99% 878 100% 211 100% 786 98% 124 100% 280 100% 784 * * 100% 58 92% 676 92% 556 100% 676 98% 252 100% 112
* * * * * * * * * * * * * * * * * * * * * * * * * *
* * * * * * * * * * * * * * * * * * * * * * * * * *
91% 57 100% 54 95% 40 * * * * 93% 42 * * * * 91% 159 92% 119 98% 159 98% 40 * *
98% 552 99% 359 99% 498 99% 110 100% 120 100% 514 * * 96% 57 90% 329 89% 240 99% 329 95% 104 100% 40
* * * * * * * * * * * * * * * * * * * * * * * * * *
97% 201 100% 191 99% 185 100% 31 100% 80 100% 174 * * 88% 43 90% 371 88% 309 100% 370 100% 173 100% 142
* * * * * * * * * * * * * * * * 92% 64 93% 44 97% 64 * * * *
* * * * * * * * * * * * * * * * * * * * * * * * * *
98% 469 99% 305 100% 444 100% 59 100% 207 99% 442 * * 96% 77 93% 340 93% 293 100% 340 99% 88 100% 74
97% 305 99% 271 100% 281 97% 63 100% 79 99% 288 * * 98% 61 85% 286 84% 208 98% 285 96% 104 96% 50
* * * * * * * * * * * * * * * * 69% 81 62% 55 98% 80 * * * *
97% 373 100% 299 99% 332 100% 61 100% 82 98% 339 * * 95% 58 92% 441 91% 337 99% 441 98% 140 100% 58
HOSPITAL NAME
* sufficient data not available
SAMPLE SIzE
SAMPLE SIzE
SAMPLE SIzE
SAMPLE SIzE
SAMPLE SIzE
SAMPLE SIzE
SAMPLE SIzE
SAMPLE SIzE
SAMPLE SIzE
SAMPLE SIzE
SAMPLE SIzE
SAMPLE SIzE
SAMPLE SIzERATE RATE RATE RATE RATE RATE RATE RATE RATE RATE RATE RATE RATE
Quality of Care for Heart Conditions
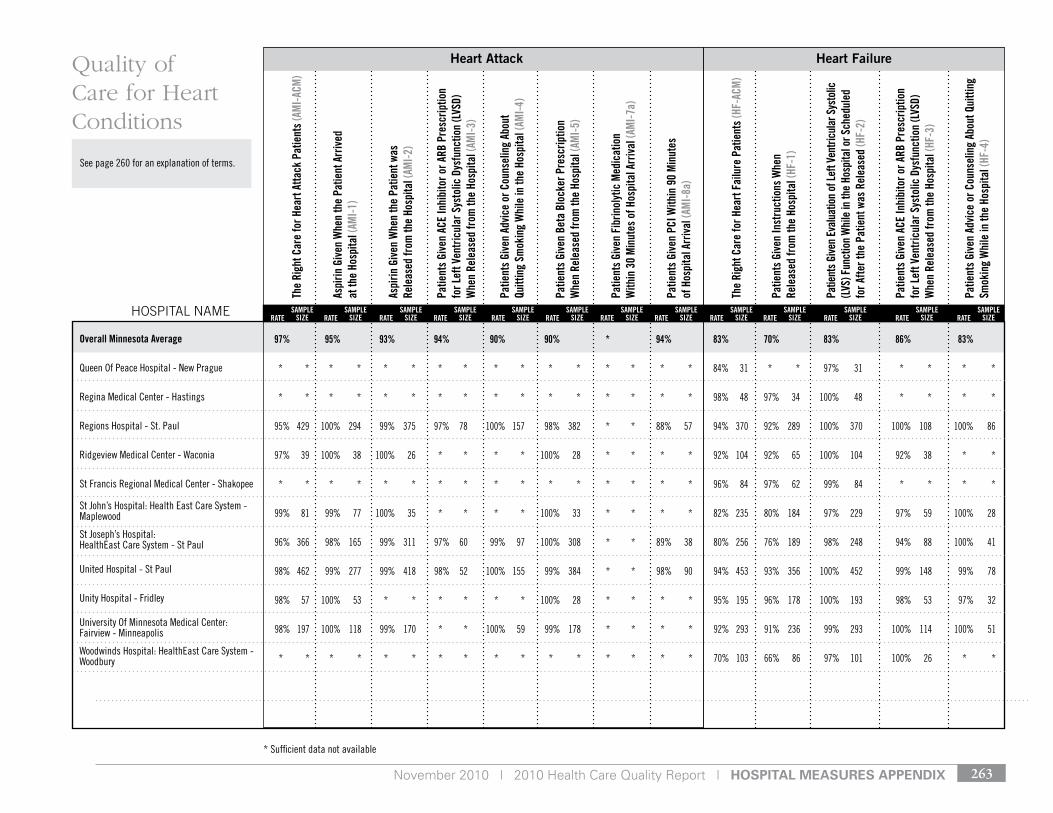
November 2010 | 2010 Health Care Quality Report | Hospital Measures appenDiX 263
see page 260 for an explanation of terms.
The
Righ
t Car
e fo
r Hea
rt A
ttack
Pat
ient
s (A
MI-
ACM
)
Aspi
rin G
iven
Whe
n th
e Pa
tient
Arr
ived
at
the
Hosp
ital (
AMI-
1)
Aspi
rin G
iven
Whe
n th
e Pa
tient
was
Re
leas
ed fr
om th
e Ho
spita
l (AM
I-2)
Patie
nts
Give
n AC
E In
hibi
tor o
r ARB
Pre
scrip
tion
fo
r Lef
t Ven
tric
ular
Sys
tolic
Dys
func
tion
(LVS
D)
Whe
n Re
leas
ed fr
om th
e Ho
spita
l (AM
I-3)
Patie
nts
Give
n Ad
vice
or C
ouns
elin
g Ab
out
Quitt
ing
Smok
ing
Whi
le in
the
Hosp
ital (
AMI-
4)
Patie
nts
Give
n Be
ta B
lock
er P
resc
riptio
n
Whe
n Re
leas
ed fr
om th
e Ho
spita
l (AM
I-5)
Patie
nts
Give
n Fi
brin
olyt
ic M
edic
atio
n
With
in 3
0 M
inut
es o
f Hos
pita
l Arr
ival
(AM
I-7a
)
Patie
nts
Give
n PC
I With
in 9
0 M
inut
es
of H
ospi
tal A
rriv
al (A
MI-
8a)
The
Righ
t Car
e fo
r Hea
rt F
ailu
re P
atie
nts
(HF-
ACM
)
Patie
nts
Give
n In
stru
ctio
ns W
hen
Re
leas
ed fr
om th
e Ho
spita
l (HF
-1)
Patie
nts G
iven
Eval
uatio
n of
Left
Vent
ricul
ar S
ysto
lic
(LVS
) Fun
ctio
n W
hile
in th
e Ho
spita
l or S
ched
uled
fo
r Afte
r the
Pat
ient
was
Rel
ease
d (H
F-2)
Patie
nts
Give
n AC
E In
hibi
tor o
r ARB
Pre
scrip
tion
fo
r Lef
t Ven
tric
ular
Sys
tolic
Dys
func
tion
(LVS
D)
Whe
n Re
leas
ed fr
om th
e Ho
spita
l (HF
-3)
Patie
nts
Give
n Ad
vice
or C
ouns
elin
g Ab
out Q
uitti
ng
Smok
ing
Whi
le in
the
Hosp
ital (
HF-4
)
Overall Minnesota Average
Queen of Peace Hospital - new Prague
regina Medical Center - Hastings
regions Hospital - st. Paul
ridgeview Medical Center - Waconia
st Francis regional Medical Center - shakopee
st John’s Hospital: Health east Care system - Maplewood
st Joseph’s Hospital: Healtheast Care system - st Paul
united Hospital - st Paul
unity Hospital - Fridley
university of Minnesota Medical Center: Fairview - Minneapolis
Woodwinds Hospital: Healtheast Care system - Woodbury
Heart Attack Heart Failure
97% 95% 93% 94% 90% 90% * 94% 83% 70% 83% 86% 83%
* * * * * * * * * * * * * * * * 84% 31 * * 97% 31 * * * *
* * * * * * * * * * * * * * * * 98% 48 97% 34 100% 48 * * * *
95% 429 100% 294 99% 375 97% 78 100% 157 98% 382 * * 88% 57 94% 370 92% 289 100% 370 100% 108 100% 86
97% 39 100% 38 100% 26 * * * * 100% 28 * * * * 92% 104 92% 65 100% 104 92% 38 * *
* * * * * * * * * * * * * * * * 96% 84 97% 62 99% 84 * * * *
99% 81 99% 77 100% 35 * * * * 100% 33 * * * * 82% 235 80% 184 97% 229 97% 59 100% 28
96% 366 98% 165 99% 311 97% 60 99% 97 100% 308 * * 89% 38 80% 256 76% 189 98% 248 94% 88 100% 41
98% 462 99% 277 99% 418 98% 52 100% 155 99% 384 * * 98% 90 94% 453 93% 356 100% 452 99% 148 99% 78
98% 57 100% 53 * * * * * * 100% 28 * * * * 95% 195 96% 178 100% 193 98% 53 97% 32
98% 197 100% 118 99% 170 * * 100% 59 99% 178 * * * * 92% 293 91% 236 99% 293 100% 114 100% 51
* * * * * * * * * * * * * * * * 70% 103 66% 86 97% 101 100% 26 * *
HOSPITAL NAME
* sufficient data not available
Quality of Care for Heart Conditions
SAMPLE SIzE
SAMPLE SIzE
SAMPLE SIzE
SAMPLE SIzE
SAMPLE SIzE
SAMPLE SIzE
SAMPLE SIzE
SAMPLE SIzE
SAMPLE SIzE
SAMPLE SIzE
SAMPLE SIzE
SAMPLE SIzE
SAMPLE SIzERATE RATE RATE RATE RATE RATE RATE RATE RATE RATE RATE RATE RATE
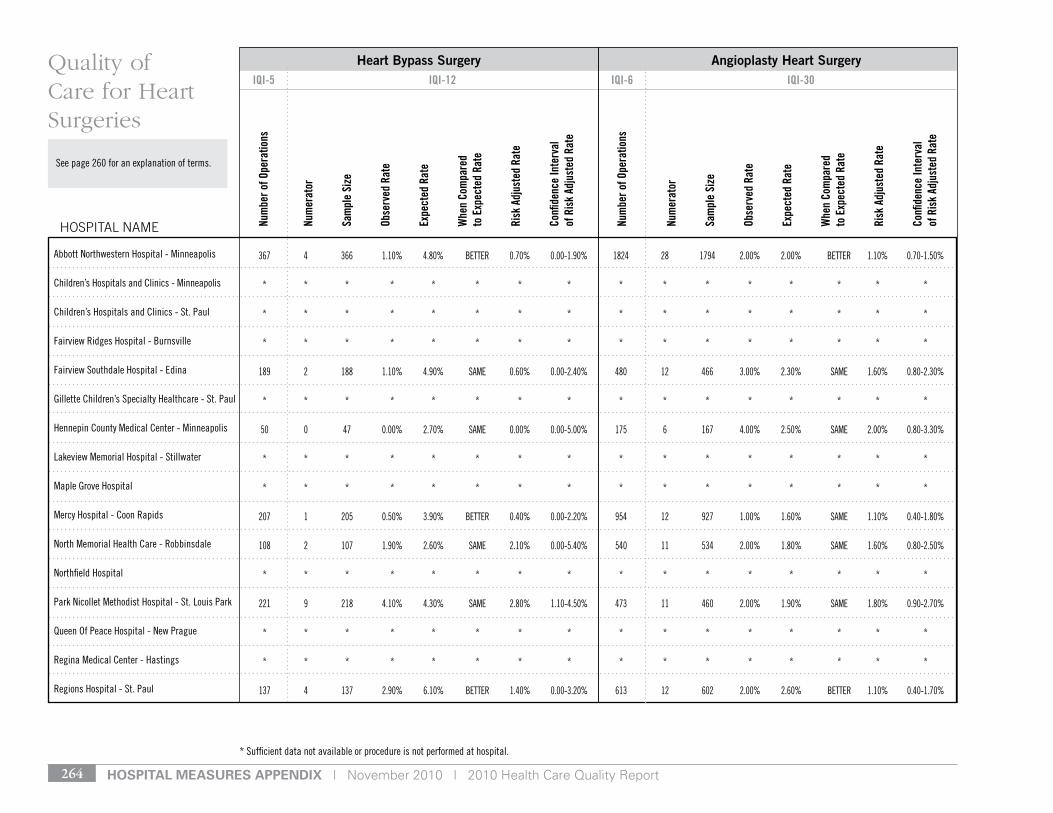
Hospital Measures appenDiX | November 2010 | 2010 Health Care Quality Report264
see page 260 for an explanation of terms.
Num
ber o
f Ope
ratio
ns
Num
erat
or
Sam
ple
Size
Obse
rved
Rat
e
Expe
cted
Rat
e
Whe
n Co
mpa
red
to
Exp
ecte
d Ra
te
Risk
Adj
uste
d Ra
te
Confi
denc
e In
terv
al
of R
isk
Adju
sted
Rat
e
Num
ber o
f Ope
ratio
ns
Num
erat
or
Sam
ple
Size
Obse
rved
Rat
e
Expe
cted
Rat
e
Whe
n Co
mpa
red
to
Exp
ecte
d Ra
te
Risk
Adj
uste
d Ra
te
Confi
denc
e In
terv
al
of R
isk
Adju
sted
Rat
e
Abbott northwestern Hospital - Minneapolis
Children’s Hospitals and Clinics - Minneapolis
Children’s Hospitals and Clinics - st. Paul
Fairview ridges Hospital - Burnsville
Fairview southdale Hospital - edina
gillette Children’s specialty Healthcare - st. Paul
Hennepin County Medical Center - Minneapolis
lakeview Memorial Hospital - stillwater
Maple grove Hospital
Mercy Hospital - Coon rapids
north Memorial Health Care - robbinsdale
northfield Hospital
Park nicollet Methodist Hospital - st. louis Park
Queen of Peace Hospital - new Prague
regina Medical Center - Hastings
regions Hospital - st. Paul
Heart Bypass SurgeryIQI-5 IQI-6IQI-12 IQI-30
Angioplasty Heart Surgery
367 4 366 1.10% 4.80% Better 0.70% 0.00-1.90% 1824 28 1794 2.00% 2.00% Better 1.10% 0.70-1.50%
* * * * * * * * * * * * * * * *
* * * * * * * * * * * * * * * *
* * * * * * * * * * * * * * * *
189 2 188 1.10% 4.90% sAMe 0.60% 0.00-2.40% 480 12 466 3.00% 2.30% sAMe 1.60% 0.80-2.30%
* * * * * * * * * * * * * * * *
50 0 47 0.00% 2.70% sAMe 0.00% 0.00-5.00% 175 6 167 4.00% 2.50% sAMe 2.00% 0.80-3.30%
* * * * * * * * * * * * * * * *
* * * * * * * * * * * * * * * *
207 1 205 0.50% 3.90% Better 0.40% 0.00-2.20% 954 12 927 1.00% 1.60% sAMe 1.10% 0.40-1.80%
108 2 107 1.90% 2.60% sAMe 2.10% 0.00-5.40% 540 11 534 2.00% 1.80% sAMe 1.60% 0.80-2.50%
* * * * * * * * * * * * * * * *
221 9 218 4.10% 4.30% sAMe 2.80% 1.10-4.50% 473 11 460 2.00% 1.90% sAMe 1.80% 0.90-2.70%
* * * * * * * * * * * * * * * *
* * * * * * * * * * * * * * * *
137 4 137 2.90% 6.10% Better 1.40% 0.00-3.20% 613 12 602 2.00% 2.60% Better 1.10% 0.40-1.70%
HOSPITAL NAME
Quality of Care for Heart Surgeries
* sufficient data not available or procedure is not performed at hospital.
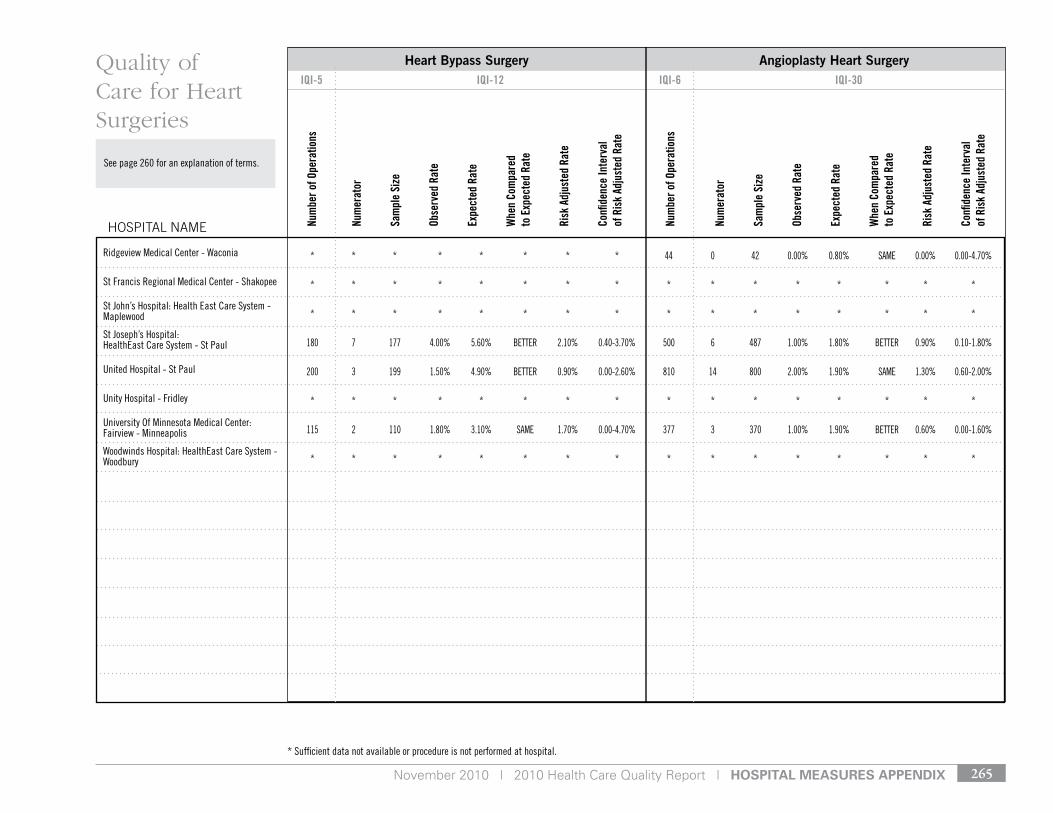
November 2010 | 2010 Health Care Quality Report | Hospital Measures appenDiX 265
see page 260 for an explanation of terms.
Num
ber o
f Ope
ratio
ns
Num
erat
or
Sam
ple
Size
Obse
rved
Rat
e
Expe
cted
Rat
e
Whe
n Co
mpa
red
to
Exp
ecte
d Ra
te
Risk
Adj
uste
d Ra
te
Confi
denc
e In
terv
al
of R
isk
Adju
sted
Rat
e
Num
ber o
f Ope
ratio
ns
Num
erat
or
Sam
ple
Size
Obse
rved
Rat
e
Expe
cted
Rat
e
Whe
n Co
mpa
red
to
Exp
ecte
d Ra
te
Risk
Adj
uste
d Ra
te
Confi
denc
e In
terv
al
of R
isk
Adju
sted
Rat
e
ridgeview Medical Center - Waconia
st Francis regional Medical Center - shakopee
st John’s Hospital: Health east Care system - Maplewood
st Joseph’s Hospital: Healtheast Care system - st Paul
united Hospital - st Paul
unity Hospital - Fridley
university of Minnesota Medical Center: Fairview - Minneapolis
Woodwinds Hospital: Healtheast Care system - Woodbury
Heart Bypass SurgeryIQI-5 IQI-6IQI-12 IQI-30
Angioplasty Heart Surgery
* * * * * * * * 44 0 42 0.00% 0.80% sAMe 0.00% 0.00-4.70%
* * * * * * * * * * * * * * * *
* * * * * * * * * * * * * * * *
180 7 177 4.00% 5.60% Better 2.10% 0.40-3.70% 500 6 487 1.00% 1.80% Better 0.90% 0.10-1.80%
200 3 199 1.50% 4.90% Better 0.90% 0.00-2.60% 810 14 800 2.00% 1.90% sAMe 1.30% 0.60-2.00%
* * * * * * * * * * * * * * * *
115 2 110 1.80% 3.10% sAMe 1.70% 0.00-4.70% 377 3 370 1.00% 1.90% Better 0.60% 0.00-1.60%
* * * * * * * * * * * * * * * *
HOSPITAL NAME
Quality of Care for Heart Surgeries
* sufficient data not available or procedure is not performed at hospital.
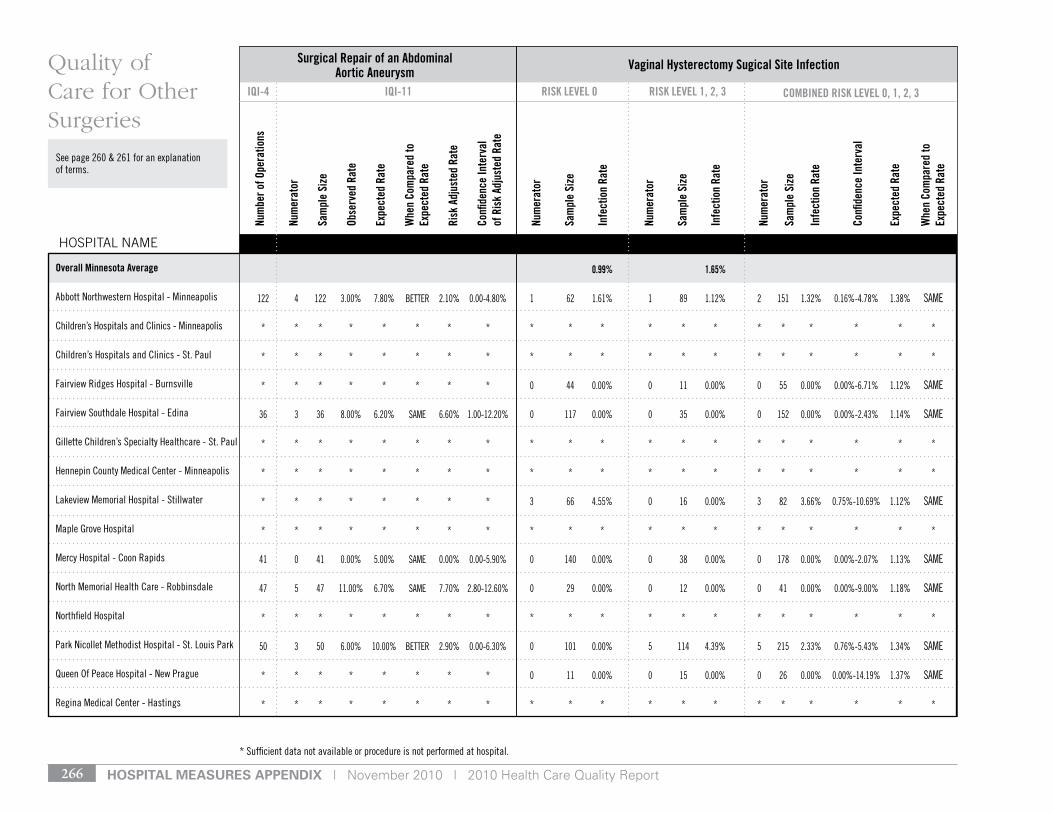
Hospital Measures appenDiX | November 2010 | 2010 Health Care Quality Report266
see page 260 & 261 for an explanation of terms.
Overall Minnesota Average
Abbott northwestern Hospital - Minneapolis
Children’s Hospitals and Clinics - Minneapolis
Children’s Hospitals and Clinics - st. Paul
Fairview ridges Hospital - Burnsville
Fairview southdale Hospital - edina
gillette Children’s specialty Healthcare - st. Paul
Hennepin County Medical Center - Minneapolis
lakeview Memorial Hospital - stillwater
Maple grove Hospital
Mercy Hospital - Coon rapids
north Memorial Health Care - robbinsdale
northfield Hospital
Park nicollet Methodist Hospital - st. louis Park
Queen of Peace Hospital - new Prague
regina Medical Center - Hastings
HOSPITAL NAME
Quality of Care for Other Surgeries
* sufficient data not available or procedure is not performed at hospital.
Surgical Repair of an Abdominal Aortic Aneurysm Vaginal Hysterectomy Sugical Site Infection
IQI-4 RISK LEVEL 0IQI-11 RISK LEVEL 1, 2, 3 COMBINED RISK LEVEL 0, 1, 2, 3
Num
ber o
f Ope
ratio
ns
Num
erat
or
Sam
ple
Size
Obse
rved
Rat
e
Expe
cted
Rat
e
Whe
n Co
mpa
red
to
Expe
cted
Rat
e
Risk
Adj
uste
d Ra
te
Confi
denc
e In
terv
al
of R
isk
Adju
sted
Rat
e
Num
erat
or
Sam
ple
Size
Infe
ctio
n Ra
te
Num
erat
or
Sam
ple
Size
Infe
ctio
n Ra
te
Num
erat
or
Sam
ple
Size
Infe
ctio
n Ra
te
Confi
denc
e In
terv
al
Expe
cted
Rat
e
Whe
n Co
mpa
red
to
Expe
cted
Rat
e
0.99% 1.65%
122 4 122 3.00% 7.80% Better 2.10% 0.00-4.80% 1 62 1.61% 1 89 1.12% 2 151 1.32% 0.16%-4.78% 1.38% sAMe
* * * * * * * * * * * * * * * * * * * *
* * * * * * * * * * * * * * * * * * * *
* * * * * * * * 0 44 0.00% 0 11 0.00% 0 55 0.00% 0.00%-6.71% 1.12% sAMe
36 3 36 8.00% 6.20% sAMe 6.60% 1.00-12.20% 0 117 0.00% 0 35 0.00% 0 152 0.00% 0.00%-2.43% 1.14% sAMe
* * * * * * * * * * * * * * * * * * * *
* * * * * * * * * * * * * * * * * * * *
* * * * * * * * 3 66 4.55% 0 16 0.00% 3 82 3.66% 0.75%-10.69% 1.12% sAMe
* * * * * * * * * * * * * * * * * * * *
41 0 41 0.00% 5.00% sAMe 0.00% 0.00-5.90% 0 140 0.00% 0 38 0.00% 0 178 0.00% 0.00%-2.07% 1.13% sAMe
47 5 47 11.00% 6.70% sAMe 7.70% 2.80-12.60% 0 29 0.00% 0 12 0.00% 0 41 0.00% 0.00%-9.00% 1.18% sAMe
* * * * * * * * * * * * * * * * * * * *
50 3 50 6.00% 10.00% Better 2.90% 0.00-6.30% 0 101 0.00% 5 114 4.39% 5 215 2.33% 0.76%-5.43% 1.34% sAMe
* * * * * * * * 0 11 0.00% 0 15 0.00% 0 26 0.00% 0.00%-14.19% 1.37% sAMe
* * * * * * * * * * * * * * * * * * * *
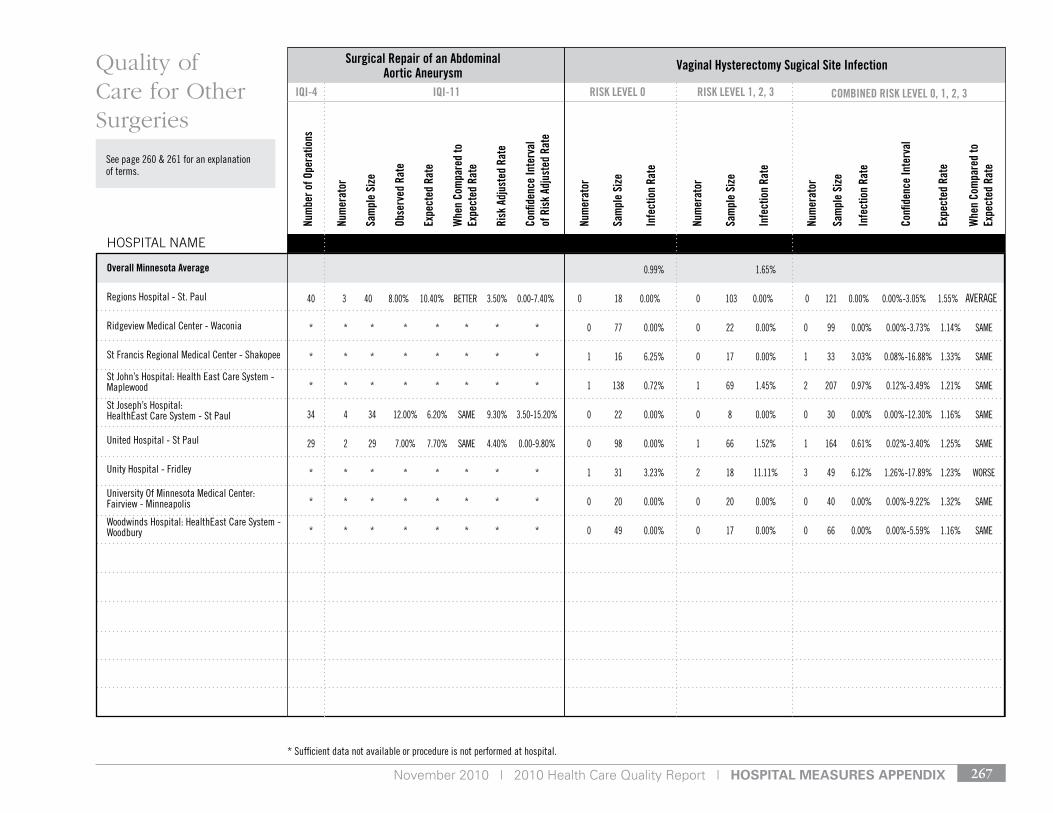
November 2010 | 2010 Health Care Quality Report | Hospital Measures appenDiX 267
Overall Minnesota Average
regions Hospital - st. Paul
ridgeview Medical Center - Waconia
st Francis regional Medical Center - shakopee
st John’s Hospital: Health east Care system - Maplewood
st Joseph’s Hospital: Healtheast Care system - st Paul
united Hospital - st Paul
unity Hospital - Fridley
university of Minnesota Medical Center: Fairview - Minneapolis
Woodwinds Hospital: Healtheast Care system - Woodbury
0.99% 1.65%
40 3 40 8.00% 10.40% Better 3.50% 0.00-7.40% 0 18 0.00% 0 103 0.00% 0 121 0.00% 0.00%-3.05% 1.55% AverAge
* * * * * * * * 0 77 0.00% 0 22 0.00% 0 99 0.00% 0.00%-3.73% 1.14% sAMe
* * * * * * * * 1 16 6.25% 0 17 0.00% 1 33 3.03% 0.08%-16.88% 1.33% sAMe
* * * * * * * * 1 138 0.72% 1 69 1.45% 2 207 0.97% 0.12%-3.49% 1.21% sAMe
34 4 34 12.00% 6.20% sAMe 9.30% 3.50-15.20% 0 22 0.00% 0 8 0.00% 0 30 0.00% 0.00%-12.30% 1.16% sAMe
29 2 29 7.00% 7.70% sAMe 4.40% 0.00-9.80% 0 98 0.00% 1 66 1.52% 1 164 0.61% 0.02%-3.40% 1.25% sAMe
* * * * * * * * 1 31 3.23% 2 18 11.11% 3 49 6.12% 1.26%-17.89% 1.23% Worse
* * * * * * * * 0 20 0.00% 0 20 0.00% 0 40 0.00% 0.00%-9.22% 1.32% sAMe
* * * * * * * * 0 49 0.00% 0 17 0.00% 0 66 0.00% 0.00%-5.59% 1.16% sAMe
HOSPITAL NAME
Quality of Care for Other Surgeries
* sufficient data not available or procedure is not performed at hospital.
Surgical Repair of an Abdominal Aortic Aneurysm Vaginal Hysterectomy Sugical Site Infection
IQI-4 RISK LEVEL 0IQI-11 RISK LEVEL 1, 2, 3 COMBINED RISK LEVEL 0, 1, 2, 3
Num
ber o
f Ope
ratio
ns
Num
erat
or
Sam
ple
Size
Obse
rved
Rat
e
Expe
cted
Rat
e
Whe
n Co
mpa
red
to
Expe
cted
Rat
e
Risk
Adj
uste
d Ra
te
Confi
denc
e In
terv
al
of R
isk
Adju
sted
Rat
e
Num
erat
or
Sam
ple
Size
Infe
ctio
n Ra
te
Num
erat
or
Sam
ple
Size
Infe
ctio
n Ra
te
Num
erat
or
Sam
ple
Size
Infe
ctio
n Ra
te
Confi
denc
e In
terv
al
Expe
cted
Rat
e
Whe
n Co
mpa
red
to
Expe
cted
Rat
e see page 260 & 261 for an explanation of terms.
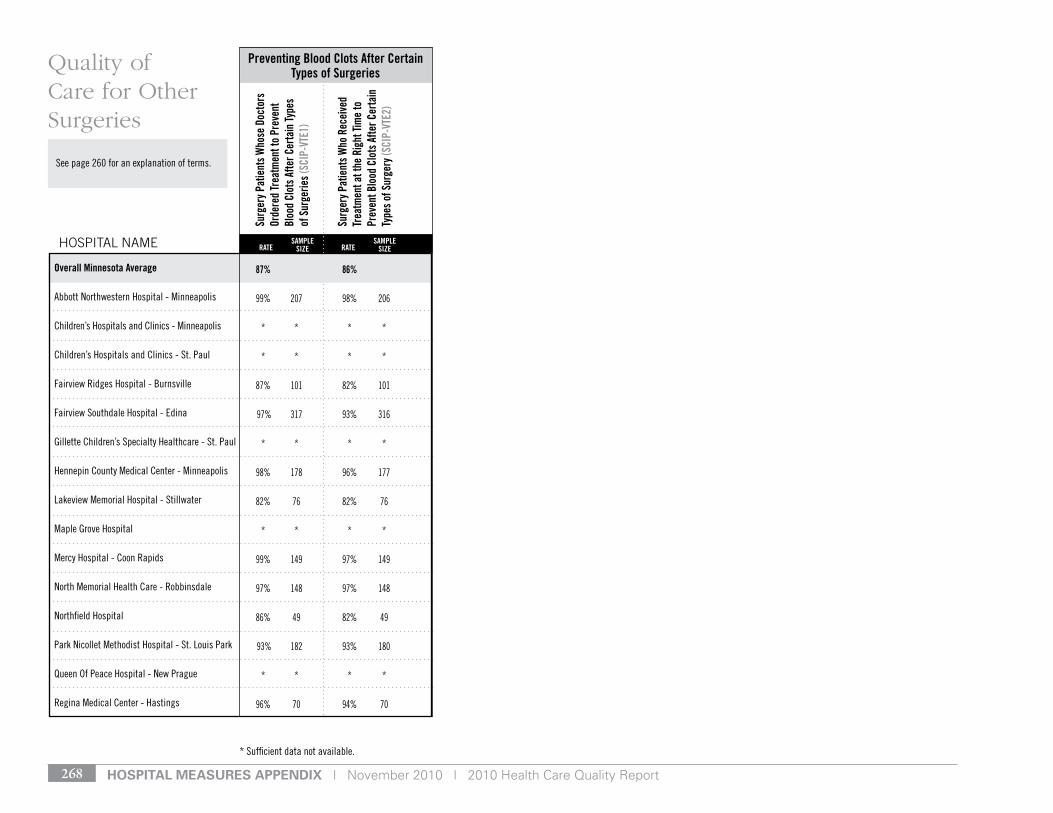
Hospital Measures appenDiX | November 2010 | 2010 Health Care Quality Report268
see page 260 for an explanation of terms.
Surg
ery P
atie
nts W
hose
Doc
tors
Or
dere
d Tr
eatm
ent t
o Pr
even
t Bl
ood
Clot
s Afte
r Cer
tain
Type
s of
Sur
gerie
s (SC
IP-V
TE1)
Surg
ery P
atie
nts W
ho R
ecei
ved
Tr
eatm
ent a
t the
Rig
ht Ti
me
to
Prev
ent B
lood
Clo
ts A
fter C
erta
in
Type
s of S
urge
ry (S
CIP-
VTE2
)
Preventing Blood Clots After Certain Types of Surgeries
Overall Minnesota Average
Abbott northwestern Hospital - Minneapolis
Children’s Hospitals and Clinics - Minneapolis
Children’s Hospitals and Clinics - st. Paul
Fairview ridges Hospital - Burnsville
Fairview southdale Hospital - edina
gillette Children’s specialty Healthcare - st. Paul
Hennepin County Medical Center - Minneapolis
lakeview Memorial Hospital - stillwater
Maple grove Hospital
Mercy Hospital - Coon rapids
north Memorial Health Care - robbinsdale
northfield Hospital
Park nicollet Methodist Hospital - st. louis Park
Queen of Peace Hospital - new Prague
regina Medical Center - Hastings
87% 86%
99% 207 98% 206
* * * *
* * * *
87% 101 82% 101
97% 317 93% 316
* * * *
98% 178 96% 177
82% 76 82% 76
* * * *
99% 149 97% 149
97% 148 97% 148
86% 49 82% 49
93% 182 93% 180
* * * *
96% 70 94% 70
HOSPITAL NAME
Quality of Care for Other Surgeries
* sufficient data not available.
SAMPLE SIzE
SAMPLE SIzERATE RATE
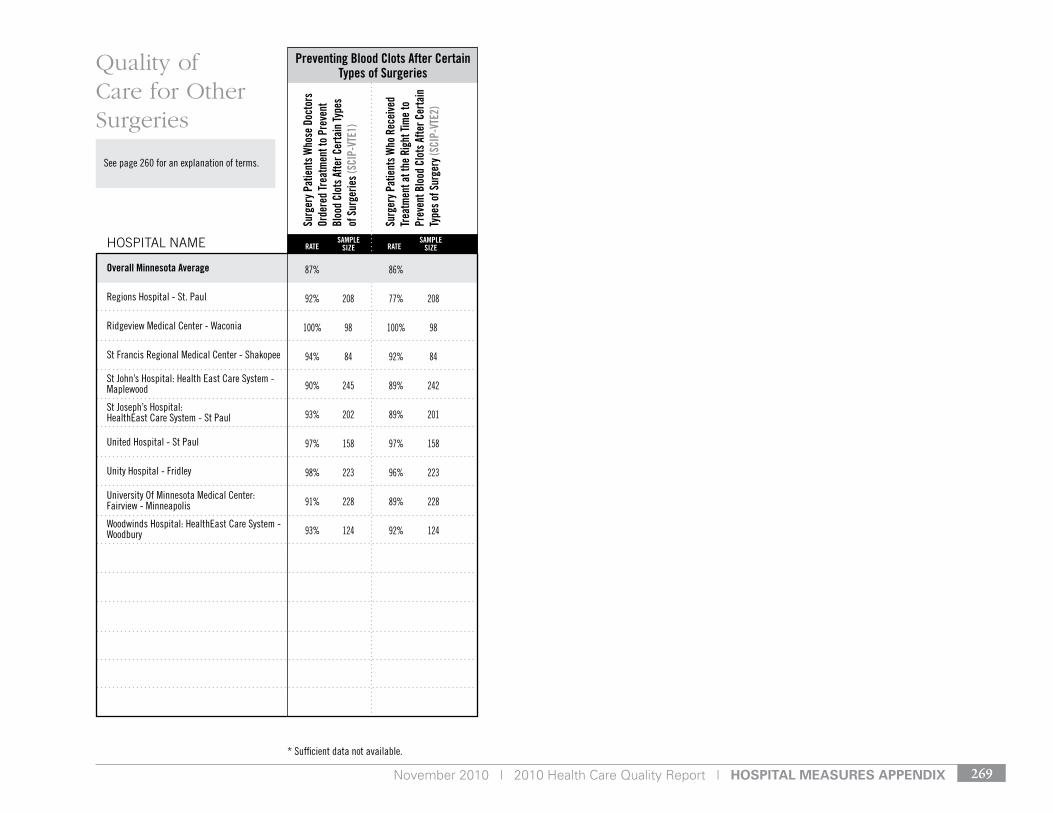
November 2010 | 2010 Health Care Quality Report | Hospital Measures appenDiX 269
see page 260 for an explanation of terms.
Surg
ery P
atie
nts W
hose
Doc
tors
Or
dere
d Tr
eatm
ent t
o Pr
even
t Bl
ood
Clot
s Afte
r Cer
tain
Type
s of
Sur
gerie
s (SC
IP-V
TE1)
Surg
ery P
atie
nts W
ho R
ecei
ved
Tr
eatm
ent a
t the
Rig
ht Ti
me
to
Prev
ent B
lood
Clo
ts A
fter C
erta
in
Type
s of S
urge
ry (S
CIP-
VTE2
)
Preventing Blood Clots After Certain Types of Surgeries
Overall Minnesota Average
regions Hospital - st. Paul
ridgeview Medical Center - Waconia
st Francis regional Medical Center - shakopee
st John’s Hospital: Health east Care system - Maplewood
st Joseph’s Hospital: Healtheast Care system - st Paul
united Hospital - st Paul
unity Hospital - Fridley
university of Minnesota Medical Center: Fairview - Minneapolis
Woodwinds Hospital: Healtheast Care system - Woodbury
87% 86%
92% 208 77% 208
100% 98 100% 98
94% 84 92% 84
90% 245 89% 242
93% 202 89% 201
97% 158 97% 158
98% 223 96% 223
91% 228 89% 228
93% 124 92% 124
HOSPITAL NAME
Quality of Care for Other Surgeries
* sufficient data not available.
SAMPLE SIzE
SAMPLE SIzERATE RATE
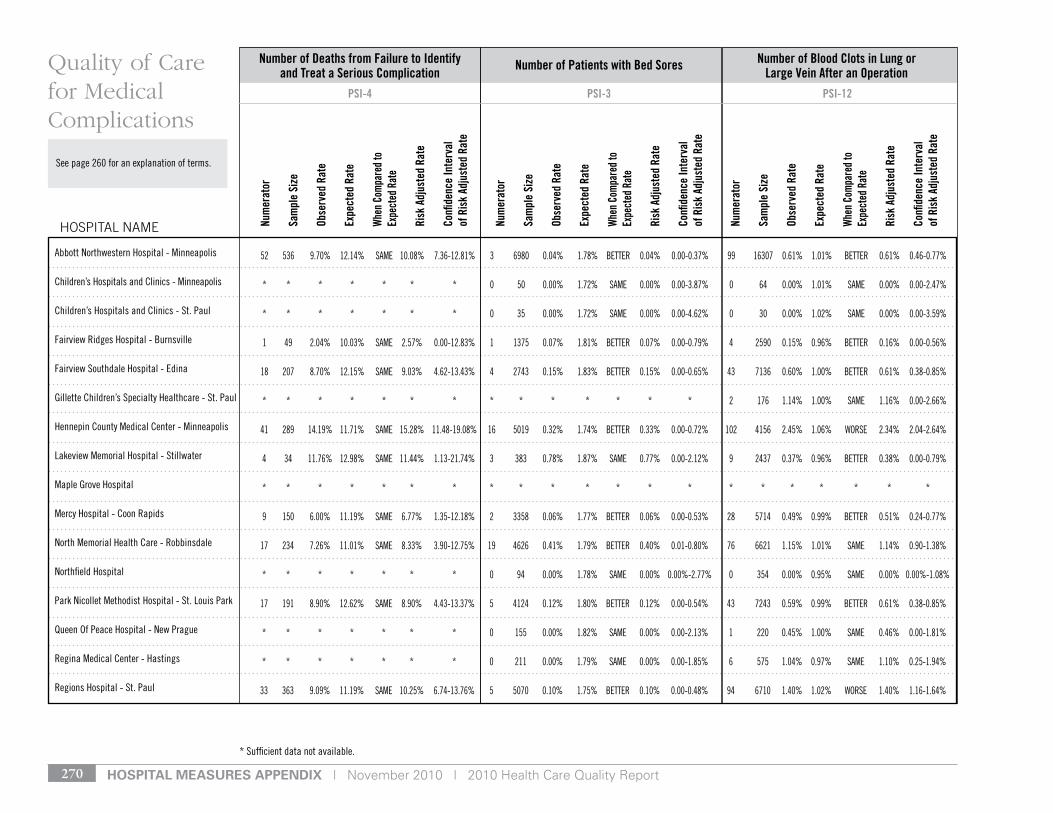
Hospital Measures appenDiX | November 2010 | 2010 Health Care Quality Report270
see page 260 for an explanation of terms.
Num
erat
or
Sam
ple
Size
Obse
rved
Rat
e
Expe
cted
Rat
e
Whe
n Com
pare
d to
Expe
cted
Rat
e
Risk
Adj
uste
d Ra
te
Confi
denc
e In
terv
al
of R
isk
Adju
sted
Rat
e
Num
erat
or
Sam
ple
Size
Obse
rved
Rat
e
Expe
cted
Rat
e
Whe
n Com
pare
d to
Expe
cted
Rat
e
Risk
Adj
uste
d Ra
te
Confi
denc
e In
terv
al
of R
isk
Adju
sted
Rat
e
Num
erat
or
Sam
ple
Size
Obse
rved
Rat
e
Expe
cted
Rat
e
Whe
n Com
pare
d to
Expe
cted
Rat
e
Risk
Adj
uste
d Ra
te
Confi
denc
e In
terv
al
of R
isk
Adju
sted
Rat
e
Abbott northwestern Hospital - Minneapolis
Children’s Hospitals and Clinics - Minneapolis
Children’s Hospitals and Clinics - st. Paul
Fairview ridges Hospital - Burnsville
Fairview southdale Hospital - edina
gillette Children’s specialty Healthcare - st. Paul
Hennepin County Medical Center - Minneapolis
lakeview Memorial Hospital - stillwater
Maple grove Hospital
Mercy Hospital - Coon rapids
north Memorial Health Care - robbinsdale
northfield Hospital
Park nicollet Methodist Hospital - st. louis Park
Queen of Peace Hospital - new Prague
regina Medical Center - Hastings
regions Hospital - st. Paul
Number of Deaths from Failure to Identify and Treat a Serious Complication Number of Patients with Bed Sores Number of Blood Clots in Lung or
Large Vein After an Operation
52 536 9.70% 12.14% sAMe 10.08% 7.36-12.81% 3 6980 0.04% 1.78% Better 0.04% 0.00-0.37% 99 16307 0.61% 1.01% Better 0.61% 0.46-0.77%
* * * * * * * 0 50 0.00% 1.72% sAMe 0.00% 0.00-3.87% 0 64 0.00% 1.01% sAMe 0.00% 0.00-2.47%
* * * * * * * 0 35 0.00% 1.72% sAMe 0.00% 0.00-4.62% 0 30 0.00% 1.02% sAMe 0.00% 0.00-3.59%
1 49 2.04% 10.03% sAMe 2.57% 0.00-12.83% 1 1375 0.07% 1.81% Better 0.07% 0.00-0.79% 4 2590 0.15% 0.96% Better 0.16% 0.00-0.56%
18 207 8.70% 12.15% sAMe 9.03% 4.62-13.43% 4 2743 0.15% 1.83% Better 0.15% 0.00-0.65% 43 7136 0.60% 1.00% Better 0.61% 0.38-0.85%
* * * * * * * * * * * * * * 2 176 1.14% 1.00% sAMe 1.16% 0.00-2.66%
41 289 14.19% 11.71% sAMe 15.28% 11.48-19.08% 16 5019 0.32% 1.74% Better 0.33% 0.00-0.72% 102 4156 2.45% 1.06% Worse 2.34% 2.04-2.64%
4 34 11.76% 12.98% sAMe 11.44% 1.13-21.74% 3 383 0.78% 1.87% sAMe 0.77% 0.00-2.12% 9 2437 0.37% 0.96% Better 0.38% 0.00-0.79%
* * * * * * * * * * * * * * * * * * * * *
9 150 6.00% 11.19% sAMe 6.77% 1.35-12.18% 2 3358 0.06% 1.77% Better 0.06% 0.00-0.53% 28 5714 0.49% 0.99% Better 0.51% 0.24-0.77%
17 234 7.26% 11.01% sAMe 8.33% 3.90-12.75% 19 4626 0.41% 1.79% Better 0.40% 0.01-0.80% 76 6621 1.15% 1.01% sAMe 1.14% 0.90-1.38%
* * * * * * * 0 94 0.00% 1.78% sAMe 0.00% 0.00%-2.77% 0 354 0.00% 0.95% sAMe 0.00% 0.00%-1.08%
17 191 8.90% 12.62% sAMe 8.90% 4.43-13.37% 5 4124 0.12% 1.80% Better 0.12% 0.00-0.54% 43 7243 0.59% 0.99% Better 0.61% 0.38-0.85%
* * * * * * * 0 155 0.00% 1.82% sAMe 0.00% 0.00-2.13% 1 220 0.45% 1.00% sAMe 0.46% 0.00-1.81%
* * * * * * * 0 211 0.00% 1.79% sAMe 0.00% 0.00-1.85% 6 575 1.04% 0.97% sAMe 1.10% 0.25-1.94%
33 363 9.09% 11.19% sAMe 10.25% 6.74-13.76% 5 5070 0.10% 1.75% Better 0.10% 0.00-0.48% 94 6710 1.40% 1.02% Worse 1.40% 1.16-1.64%
HOSPITAL NAME
Quality of Care for Medical Complications
* sufficient data not available.
PSI-4 PSI-3 PSI-12
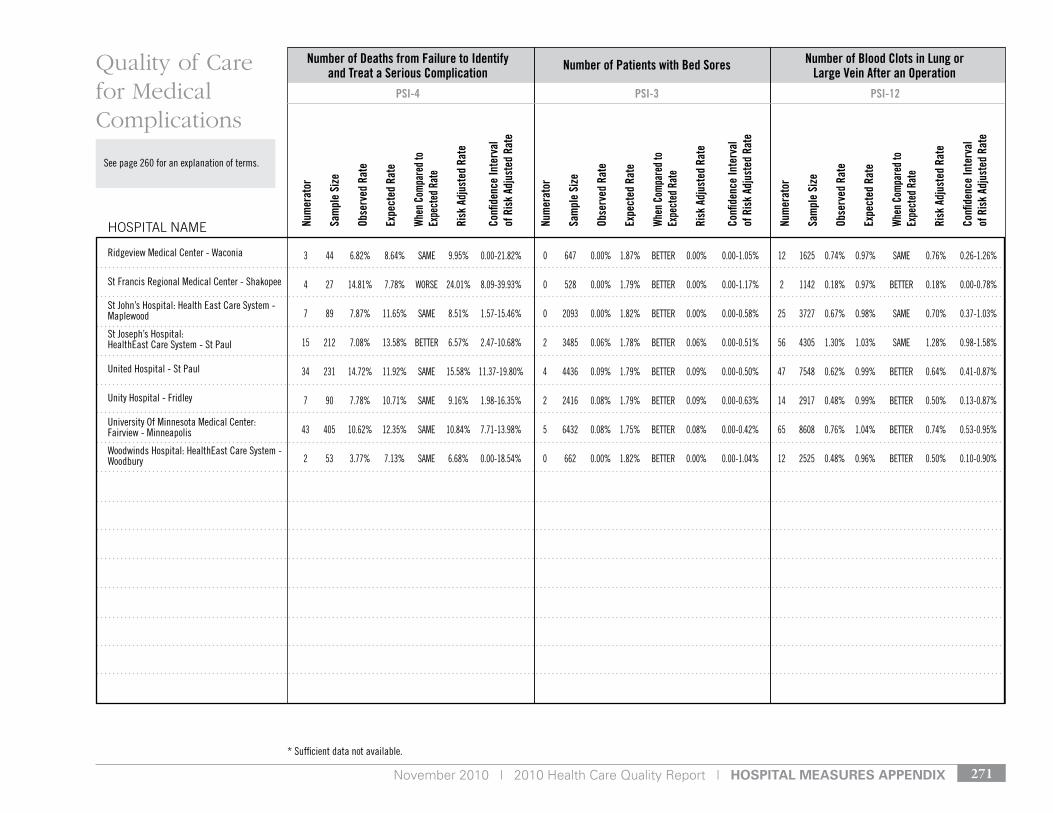
November 2010 | 2010 Health Care Quality Report | Hospital Measures appenDiX 271
see page 260 for an explanation of terms.
Num
erat
or
Sam
ple
Size
Obse
rved
Rat
e
Expe
cted
Rat
e
Whe
n Com
pare
d to
Expe
cted
Rat
e
Risk
Adj
uste
d Ra
te
Confi
denc
e In
terv
al
of R
isk
Adju
sted
Rat
e
Num
erat
or
Sam
ple
Size
Obse
rved
Rat
e
Expe
cted
Rat
e
Whe
n Com
pare
d to
Expe
cted
Rat
e
Risk
Adj
uste
d Ra
te
Confi
denc
e In
terv
al
of R
isk
Adju
sted
Rat
e
Num
erat
or
Sam
ple
Size
Obse
rved
Rat
e
Expe
cted
Rat
e
Whe
n Com
pare
d to
Expe
cted
Rat
e
Risk
Adj
uste
d Ra
te
Confi
denc
e In
terv
al
of R
isk
Adju
sted
Rat
e
ridgeview Medical Center - Waconia
st Francis regional Medical Center - shakopee
st John’s Hospital: Health east Care system - Maplewood
st Joseph’s Hospital: Healtheast Care system - st Paul
united Hospital - st Paul
unity Hospital - Fridley
university of Minnesota Medical Center: Fairview - Minneapolis
Woodwinds Hospital: Healtheast Care system - Woodbury
Number of Deaths from Failure to Identify and Treat a Serious Complication Number of Patients with Bed Sores Number of Blood Clots in Lung or
Large Vein After an Operation
3 44 6.82% 8.64% sAMe 9.95% 0.00-21.82% 0 647 0.00% 1.87% Better 0.00% 0.00-1.05% 12 1625 0.74% 0.97% sAMe 0.76% 0.26-1.26%
4 27 14.81% 7.78% Worse 24.01% 8.09-39.93% 0 528 0.00% 1.79% Better 0.00% 0.00-1.17% 2 1142 0.18% 0.97% Better 0.18% 0.00-0.78%
7 89 7.87% 11.65% sAMe 8.51% 1.57-15.46% 0 2093 0.00% 1.82% Better 0.00% 0.00-0.58% 25 3727 0.67% 0.98% sAMe 0.70% 0.37-1.03%
15 212 7.08% 13.58% Better 6.57% 2.47-10.68% 2 3485 0.06% 1.78% Better 0.06% 0.00-0.51% 56 4305 1.30% 1.03% sAMe 1.28% 0.98-1.58%
34 231 14.72% 11.92% sAMe 15.58% 11.37-19.80% 4 4436 0.09% 1.79% Better 0.09% 0.00-0.50% 47 7548 0.62% 0.99% Better 0.64% 0.41-0.87%
7 90 7.78% 10.71% sAMe 9.16% 1.98-16.35% 2 2416 0.08% 1.79% Better 0.09% 0.00-0.63% 14 2917 0.48% 0.99% Better 0.50% 0.13-0.87%
43 405 10.62% 12.35% sAMe 10.84% 7.71-13.98% 5 6432 0.08% 1.75% Better 0.08% 0.00-0.42% 65 8608 0.76% 1.04% Better 0.74% 0.53-0.95%
2 53 3.77% 7.13% sAMe 6.68% 0.00-18.54% 0 662 0.00% 1.82% Better 0.00% 0.00-1.04% 12 2525 0.48% 0.96% Better 0.50% 0.10-0.90%
HOSPITAL NAME
Quality of Care for Medical Complications
PSI-4 PSI-3 PSI-12
* sufficient data not available.

Hospital Measures appenDiX | November 2010 | 2010 Health Care Quality Report272
Cent
ral L
ine
Infe
ctio
n (C
LI)
Prev
entio
n
Vent
ilato
r Ass
ocia
ted
Pneu
mon
ia
(VAP
) Pre
vent
ion
Surg
ery
Patie
nts
Give
n an
An
tibio
tic W
ithin
an
Hour
Be
fore
Sur
gery
to H
elp
Prev
ent
Infe
ctio
n (S
CIP-
INF-
1)
Surg
ery
Patie
nts
Give
n th
e
Best
Ant
ibio
tic to
Hel
p Pr
even
t In
fect
ion
(SCI
P-IN
F-2)
Surg
ery
Patie
nts
Who
se P
reve
n-tiv
e An
tibio
tics
Wer
e St
oppe
d
at th
e Ri
ght T
ime
(SCI
P-IN
F-3)
All H
eart
Sur
gery
Pat
ient
s
Who
se B
lood
Sug
ar is
Kep
t Un
der G
ood
Cont
rol R
ight
Af
ter S
urge
ry (S
CIP-
INF-
4)
Surg
ery
Patie
nts
Need
ing
Hair
Rem
oved
Bef
ore
Surg
ery
Usin
g
a Sa
fer M
etho
d (S
CIP-
INF-
6)
Surg
ery
Patie
nts
on B
eta-
Bloc
ker
Ther
apy
Prio
r to
Arriv
al W
ho
Rece
ived
a B
eta-
Bloc
ker D
urin
g th
e Pe
riope
rativ
e Pe
riod
(S
CIP-
CARD
-2)
Overall Minnesota Average
Abbott northwestern Hospital - Minneapolis
Children’s Hospitals and Clinics - Minneapolis
Children’s Hospitals and Clinics - st. Paul
Fairview ridges Hospital - Burnsville
Fairview southdale Hospital - edina
gillette Children’s specialty Healthcare - st. Paul
Hennepin County Medical Center - Minneapolis
lakeview Memorial Hospital - stillwater
Maple grove Hospital
Mercy Hospital - Coon rapids
north Memorial Health Care - robbinsdale
northfield Hospital
Park nicollet Methodist Hospital - st. louis Park
Queen of Peace Hospital - new Prague
regina Medical Center - Hastings
Infection Prevention
87% 96% 86% 94% 94% 87% 96% 87%
96% 228 79% 212 97% 566 99% 580 97% 536 92% 158 100% 827 92% 197
* * * * * * * * * * * * * * * *
* * * * * * * * * * * * * * * *
100% 409 100% 362 97% 258 99% 257 96% 255 * * 100% 380 94% 69
94% 164 98% 180 98% 1856 99% 1881 95% 1795 90% 219 78% 2165 96% 583
* * * * * * * * * * * * * * * *
44% 126 80% 135 96% 295 98% 298 96% 277 84% 49 100% 413 97% 98
41% 29 * * 97% 292 99% 292 99% 283 * * 100% 461 95% 81
* * * * * * * * * * * * * * * *
97% 184 100% 227 96% 503 99% 518 98% 483 97% 173 100% 718 95% 193
80% 269 98% 673 92% 556 95% 571 92% 545 50% 163 100% 722 76% 189
* * * * 94% 130 99% 129 95% 126 * * 99% 165 93% 42
94% 123 91% 181 98% 634 99% 645 97% 596 92% 191 100% 847 88% 225
* * * * 95% 104 98% 106 98% 103 * * 100% 127 * *
* * * * 92% 180 99% 180 99% 178 * * 100% 239 98% 42
HOSPITAL NAME
Quality of Infection Prevention
* sufficient data not available.
SAMPLE SIzE
SAMPLE SIzE
SAMPLE SIzE
SAMPLE SIzE
SAMPLE SIzE
SAMPLE SIzE
SAMPLE SIzE
SAMPLE SIzERATERATERATE RATERATERATERATERATE
see page 260 & 261 for an explanation of terms.
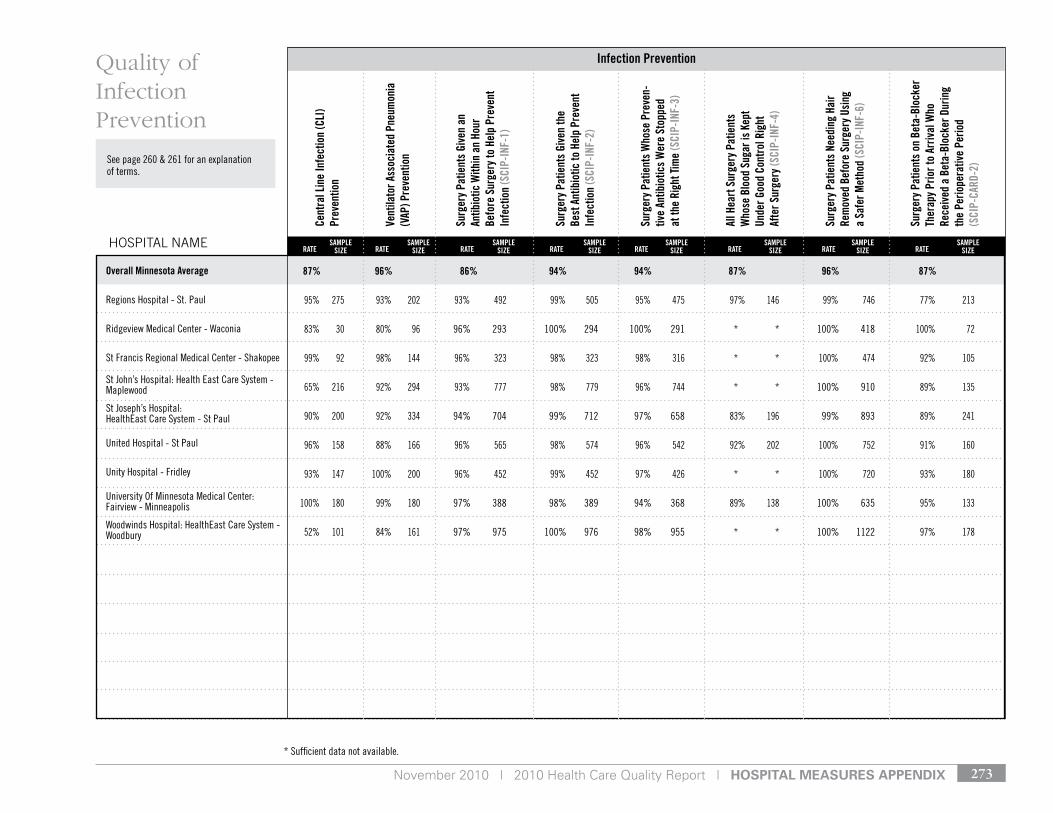
November 2010 | 2010 Health Care Quality Report | Hospital Measures appenDiX 273
SAMPLE SIzE
Cent
ral L
ine
Infe
ctio
n (C
LI)
Prev
entio
n
Vent
ilato
r Ass
ocia
ted
Pneu
mon
ia
(VAP
) Pre
vent
ion
Surg
ery
Patie
nts
Give
n an
An
tibio
tic W
ithin
an
Hour
Be
fore
Sur
gery
to H
elp
Prev
ent
Infe
ctio
n (S
CIP-
INF-
1)
Surg
ery
Patie
nts
Give
n th
e
Best
Ant
ibio
tic to
Hel
p Pr
even
t In
fect
ion
(SCI
P-IN
F-2)
Surg
ery
Patie
nts
Who
se P
reve
n-tiv
e An
tibio
tics
Wer
e St
oppe
d
at th
e Ri
ght T
ime
(SCI
P-IN
F-3)
All H
eart
Sur
gery
Pat
ient
s
Who
se B
lood
Sug
ar is
Kep
t Un
der G
ood
Cont
rol R
ight
Af
ter S
urge
ry (S
CIP-
INF-
4)
Surg
ery
Patie
nts
Need
ing
Hair
Rem
oved
Bef
ore
Surg
ery
Usin
g
a Sa
fer M
etho
d (S
CIP-
INF-
6)
Surg
ery
Patie
nts
on B
eta-
Bloc
ker
Ther
apy
Prio
r to
Arriv
al W
ho
Rece
ived
a B
eta-
Bloc
ker D
urin
g th
e Pe
riope
rativ
e Pe
riod
(S
CIP-
CARD
-2)
Overall Minnesota Average
regions Hospital - st. Paul
ridgeview Medical Center - Waconia
st Francis regional Medical Center - shakopee
st John’s Hospital: Health east Care system - Maplewood
st Joseph’s Hospital: Healtheast Care system - st Paul
united Hospital - st Paul
unity Hospital - Fridley
university of Minnesota Medical Center: Fairview - Minneapolis
Woodwinds Hospital: Healtheast Care system - Woodbury
Infection Prevention
87% 96% 86% 94% 94% 87% 96% 87%
95% 275 93% 202 93% 492 99% 505 95% 475 97% 146 99% 746 77% 213
83% 30 80% 96 96% 293 100% 294 100% 291 * * 100% 418 100% 72
99% 92 98% 144 96% 323 98% 323 98% 316 * * 100% 474 92% 105
65% 216 92% 294 93% 777 98% 779 96% 744 * * 100% 910 89% 135
90% 200 92% 334 94% 704 99% 712 97% 658 83% 196 99% 893 89% 241
96% 158 88% 166 96% 565 98% 574 96% 542 92% 202 100% 752 91% 160
93% 147 100% 200 96% 452 99% 452 97% 426 * * 100% 720 93% 180
100% 180 99% 180 97% 388 98% 389 94% 368 89% 138 100% 635 95% 133
52% 101 84% 161 97% 975 100% 976 98% 955 * * 100% 1122 97% 178
HOSPITAL NAME
Quality of Infection Prevention
* sufficient data not available.
SAMPLE SIzE
SAMPLE SIzE
SAMPLE SIzE
SAMPLE SIzE
SAMPLE SIzE
SAMPLE SIzE
SAMPLE SIzE RATERATERATE RATERATERATERATERATE
see page 260 & 261 for an explanation of terms.
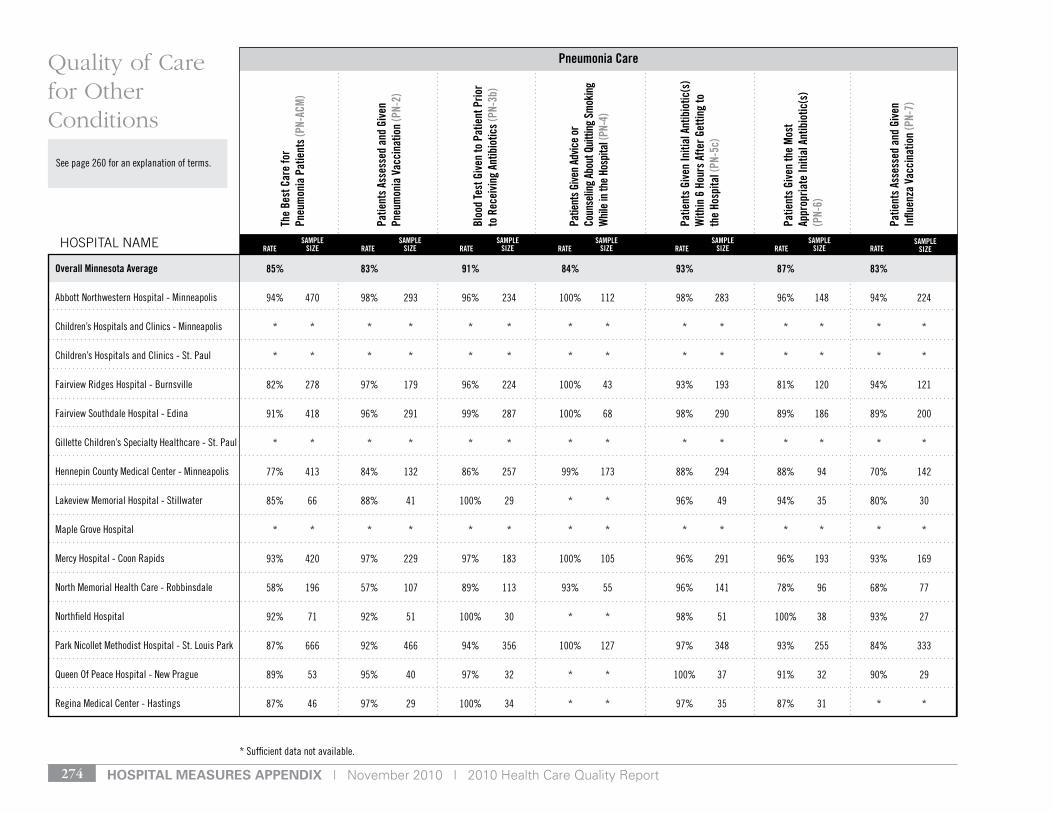
Hospital Measures appenDiX | November 2010 | 2010 Health Care Quality Report274
see page 260 for an explanation of terms.
The
Best
Car
e fo
r Pn
eum
onia
Pat
ient
s (P
N-AC
M)
Patie
nts
Asse
ssed
and
Giv
en
Pneu
mon
ia V
acci
natio
n (P
N-2)
Bloo
d Te
st G
iven
to P
atie
nt P
rior
to R
ecei
ving
Ant
ibio
tics
(PN-
3b)
Patie
nts G
iven
Advic
e or
Co
unse
ling
Abou
t Qui
tting
Sm
okin
g W
hile
in th
e Ho
spita
l (PN
-4)
Patie
nts
Give
n In
itial
Ant
ibio
tic(s
) W
ithin
6 H
ours
Afte
r Get
ting
to
the
Hosp
ital (
PN-5
c)
Patie
nts
Give
n th
e M
ost
Appr
opria
te In
itial
Ant
ibio
tic(s
) (P
N-6)
Patie
nts
Asse
ssed
and
Giv
en
Influ
enza
Vac
cina
tion
(PN-
7)
Overall Minnesota Average
Abbott northwestern Hospital - Minneapolis
Children’s Hospitals and Clinics - Minneapolis
Children’s Hospitals and Clinics - st. Paul
Fairview ridges Hospital - Burnsville
Fairview southdale Hospital - edina
gillette Children’s specialty Healthcare - st. Paul
Hennepin County Medical Center - Minneapolis
lakeview Memorial Hospital - stillwater
Maple grove Hospital
Mercy Hospital - Coon rapids
north Memorial Health Care - robbinsdale
northfield Hospital
Park nicollet Methodist Hospital - st. louis Park
Queen of Peace Hospital - new Prague
regina Medical Center - Hastings
Pneumonia Care
85% 83% 91% 84% 93% 87% 83%
94% 470 98% 293 96% 234 100% 112 98% 283 96% 148 94% 224
* * * * * * * * * * * * * *
* * * * * * * * * * * * * *
82% 278 97% 179 96% 224 100% 43 93% 193 81% 120 94% 121
91% 418 96% 291 99% 287 100% 68 98% 290 89% 186 89% 200
* * * * * * * * * * * * * *
77% 413 84% 132 86% 257 99% 173 88% 294 88% 94 70% 142
85% 66 88% 41 100% 29 * * 96% 49 94% 35 80% 30
* * * * * * * * * * * * * *
93% 420 97% 229 97% 183 100% 105 96% 291 96% 193 93% 169
58% 196 57% 107 89% 113 93% 55 96% 141 78% 96 68% 77
92% 71 92% 51 100% 30 * * 98% 51 100% 38 93% 27
87% 666 92% 466 94% 356 100% 127 97% 348 93% 255 84% 333
89% 53 95% 40 97% 32 * * 100% 37 91% 32 90% 29
87% 46 97% 29 100% 34 * * 97% 35 87% 31 * *
HOSPITAL NAME
Quality of Care for Other Conditions
* sufficient data not available.
SAMPLE SIzE
SAMPLE SIzE
SAMPLE SIzE
SAMPLE SIzE
SAMPLE SIzE
SAMPLE SIzERATE RATE RATE RATE RATE RATE RATE
SAMPLE SIzE
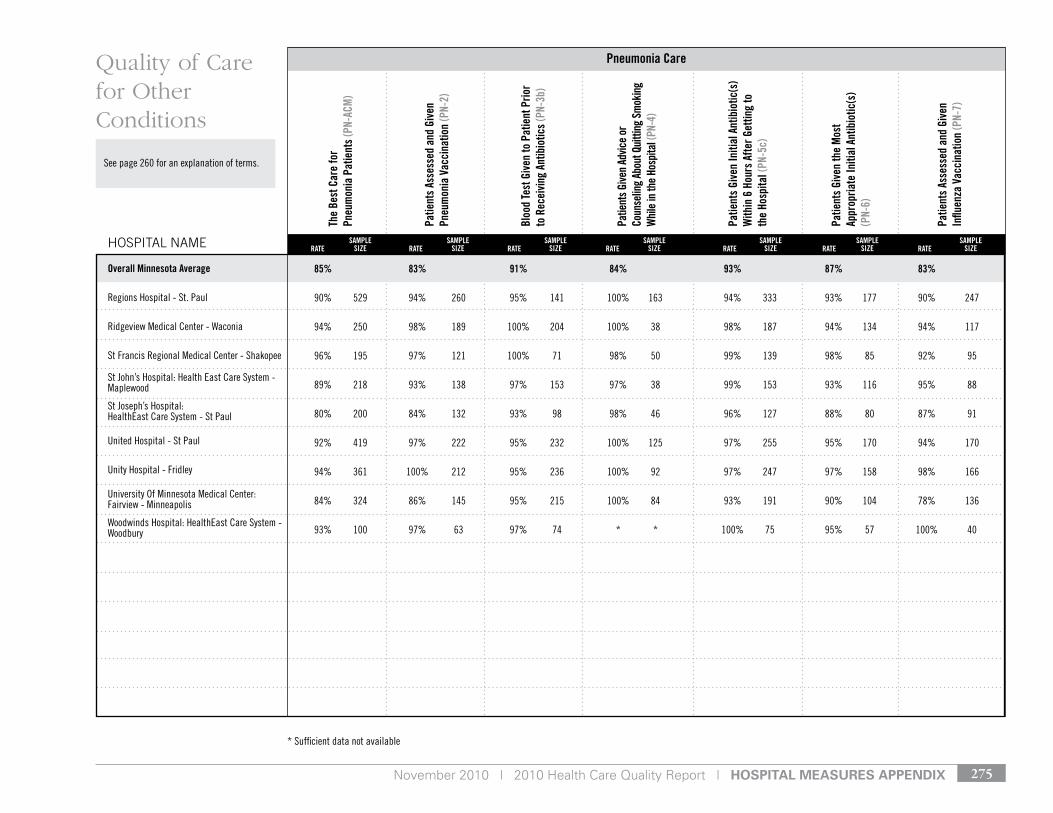
November 2010 | 2010 Health Care Quality Report | Hospital Measures appenDiX 275
see page 260 for an explanation of terms.
The
Best
Car
e fo
r Pn
eum
onia
Pat
ient
s (P
N-AC
M)
Patie
nts
Asse
ssed
and
Giv
en
Pneu
mon
ia V
acci
natio
n (P
N-2)
Bloo
d Te
st G
iven
to P
atie
nt P
rior
to R
ecei
ving
Ant
ibio
tics
(PN-
3b)
Patie
nts G
iven
Advic
e or
Co
unse
ling
Abou
t Qui
tting
Sm
okin
g W
hile
in th
e Ho
spita
l (PN
-4)
Patie
nts
Give
n In
itial
Ant
ibio
tic(s
) W
ithin
6 H
ours
Afte
r Get
ting
to
the
Hosp
ital (
PN-5
c)
Patie
nts
Give
n th
e M
ost
Appr
opria
te In
itial
Ant
ibio
tic(s
) (P
N-6)
Patie
nts
Asse
ssed
and
Giv
en
Influ
enza
Vac
cina
tion
(PN-
7)
Overall Minnesota Average
regions Hospital - st. Paul
ridgeview Medical Center - Waconia
st Francis regional Medical Center - shakopee
st John’s Hospital: Health east Care system - Maplewood
st Joseph’s Hospital: Healtheast Care system - st Paul
united Hospital - st Paul
unity Hospital - Fridley
university of Minnesota Medical Center: Fairview - Minneapolis
Woodwinds Hospital: Healtheast Care system - Woodbury
Pneumonia Care
85% 83% 91% 84% 93% 87% 83%
90% 529 94% 260 95% 141 100% 163 94% 333 93% 177 90% 247
94% 250 98% 189 100% 204 100% 38 98% 187 94% 134 94% 117
96% 195 97% 121 100% 71 98% 50 99% 139 98% 85 92% 95
89% 218 93% 138 97% 153 97% 38 99% 153 93% 116 95% 88
80% 200 84% 132 93% 98 98% 46 96% 127 88% 80 87% 91
92% 419 97% 222 95% 232 100% 125 97% 255 95% 170 94% 170
94% 361 100% 212 95% 236 100% 92 97% 247 97% 158 98% 166
84% 324 86% 145 95% 215 100% 84 93% 191 90% 104 78% 136
93% 100 97% 63 97% 74 * * 100% 75 95% 57 100% 40
HOSPITAL NAME
Quality of Care for Other Conditions
SAMPLE SIzE
SAMPLE SIzE
SAMPLE SIzE
SAMPLE SIzE
SAMPLE SIzE
SAMPLE SIzE
SAMPLE SIzERATE RATE RATE RATE RATE RATE RATE
* sufficient data not available
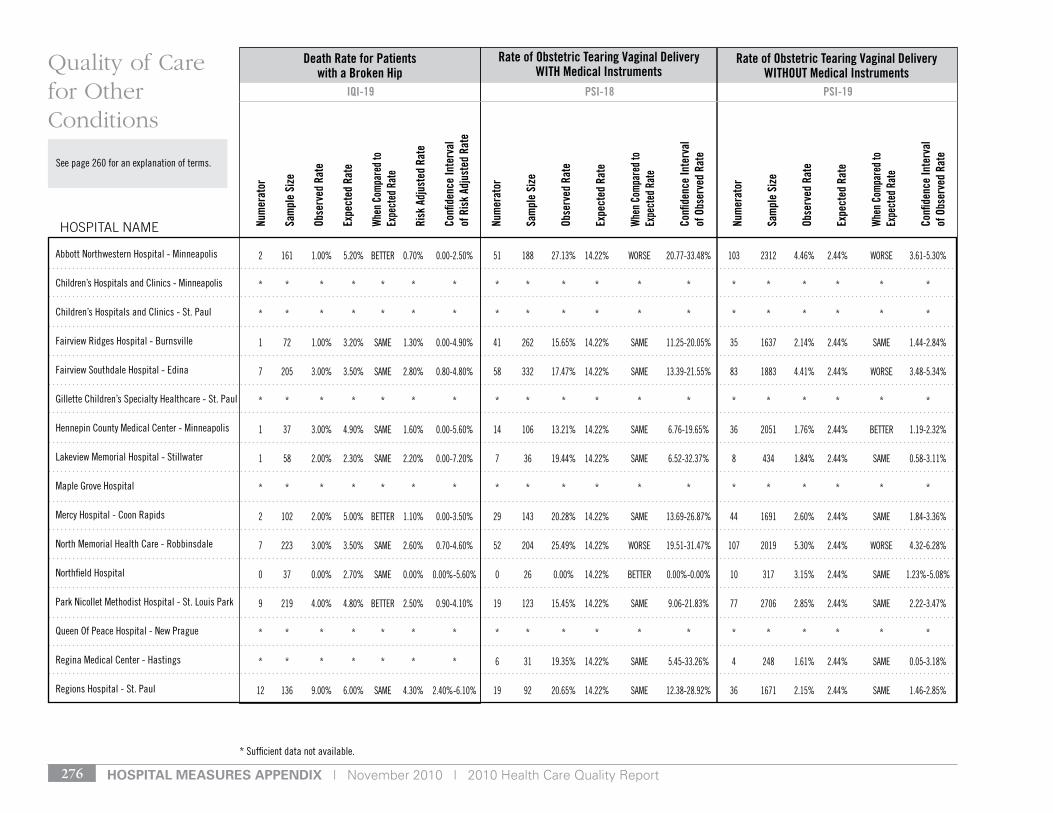
Hospital Measures appenDiX | November 2010 | 2010 Health Care Quality Report276
see page 260 for an explanation of terms.
Abbott northwestern Hospital - Minneapolis
Children’s Hospitals and Clinics - Minneapolis
Children’s Hospitals and Clinics - st. Paul
Fairview ridges Hospital - Burnsville
Fairview southdale Hospital - edina
gillette Children’s specialty Healthcare - st. Paul
Hennepin County Medical Center - Minneapolis
lakeview Memorial Hospital - stillwater
Maple grove Hospital
Mercy Hospital - Coon rapids
north Memorial Health Care - robbinsdale
northfield Hospital
Park nicollet Methodist Hospital - st. louis Park
Queen of Peace Hospital - new Prague
regina Medical Center - Hastings
regions Hospital - st. Paul
* sufficient data not available.
Num
erat
or
Sam
ple
Size
Obse
rved
Rat
e
Expe
cted
Rat
e
Whe
n Com
pare
d to
Expe
cted
Rat
e
Risk
Adj
uste
d Ra
te
Confi
denc
e In
terv
al
of R
isk
Adju
sted
Rat
e
Num
erat
or
Sam
ple
Size
Obse
rved
Rat
e
Expe
cted
Rat
e
Whe
n Com
pare
d to
Expe
cted
Rat
e
Confi
denc
e In
terv
al
of O
bser
ved
Rate
Num
erat
or
Sam
ple
Size
Obse
rved
Rat
e
Expe
cted
Rat
e
Whe
n Com
pare
d to
Expe
cted
Rat
e
Confi
denc
e In
terv
al
of O
bser
ved
Rate
Death Rate for Patients with a Broken Hip
Rate of Obstetric Tearing Vaginal Delivery WITH Medical Instruments
Rate of Obstetric Tearing Vaginal Delivery WITHOUT Medical Instruments
HOSPITAL NAME
Quality of Care for Other Conditions
IQI-19 PSI-18 PSI-19
2 161 1.00% 5.20% Better 0.70% 0.00-2.50% 51 188 27.13% 14.22% Worse 20.77-33.48% 103 2312 4.46% 2.44% Worse 3.61-5.30%
* * * * * * * * * * * * * * * * * * *
* * * * * * * * * * * * * * * * * * *
1 72 1.00% 3.20% sAMe 1.30% 0.00-4.90% 41 262 15.65% 14.22% sAMe 11.25-20.05% 35 1637 2.14% 2.44% sAMe 1.44-2.84%
7 205 3.00% 3.50% sAMe 2.80% 0.80-4.80% 58 332 17.47% 14.22% sAMe 13.39-21.55% 83 1883 4.41% 2.44% Worse 3.48-5.34%
* * * * * * * * * * * * * * * * * * *
1 37 3.00% 4.90% sAMe 1.60% 0.00-5.60% 14 106 13.21% 14.22% sAMe 6.76-19.65% 36 2051 1.76% 2.44% Better 1.19-2.32%
1 58 2.00% 2.30% sAMe 2.20% 0.00-7.20% 7 36 19.44% 14.22% sAMe 6.52-32.37% 8 434 1.84% 2.44% sAMe 0.58-3.11%
* * * * * * * * * * * * * * * * * * *
2 102 2.00% 5.00% Better 1.10% 0.00-3.50% 29 143 20.28% 14.22% sAMe 13.69-26.87% 44 1691 2.60% 2.44% sAMe 1.84-3.36%
7 223 3.00% 3.50% sAMe 2.60% 0.70-4.60% 52 204 25.49% 14.22% Worse 19.51-31.47% 107 2019 5.30% 2.44% Worse 4.32-6.28%
0 37 0.00% 2.70% sAMe 0.00% 0.00%-5.60% 0 26 0.00% 14.22% Better 0.00%-0.00% 10 317 3.15% 2.44% sAMe 1.23%-5.08%
9 219 4.00% 4.80% Better 2.50% 0.90-4.10% 19 123 15.45% 14.22% sAMe 9.06-21.83% 77 2706 2.85% 2.44% sAMe 2.22-3.47%
* * * * * * * * * * * * * * * * * * *
* * * * * * * 6 31 19.35% 14.22% sAMe 5.45-33.26% 4 248 1.61% 2.44% sAMe 0.05-3.18%
12 136 9.00% 6.00% sAMe 4.30% 2.40%-6.10% 19 92 20.65% 14.22% sAMe 12.38-28.92% 36 1671 2.15% 2.44% sAMe 1.46-2.85%
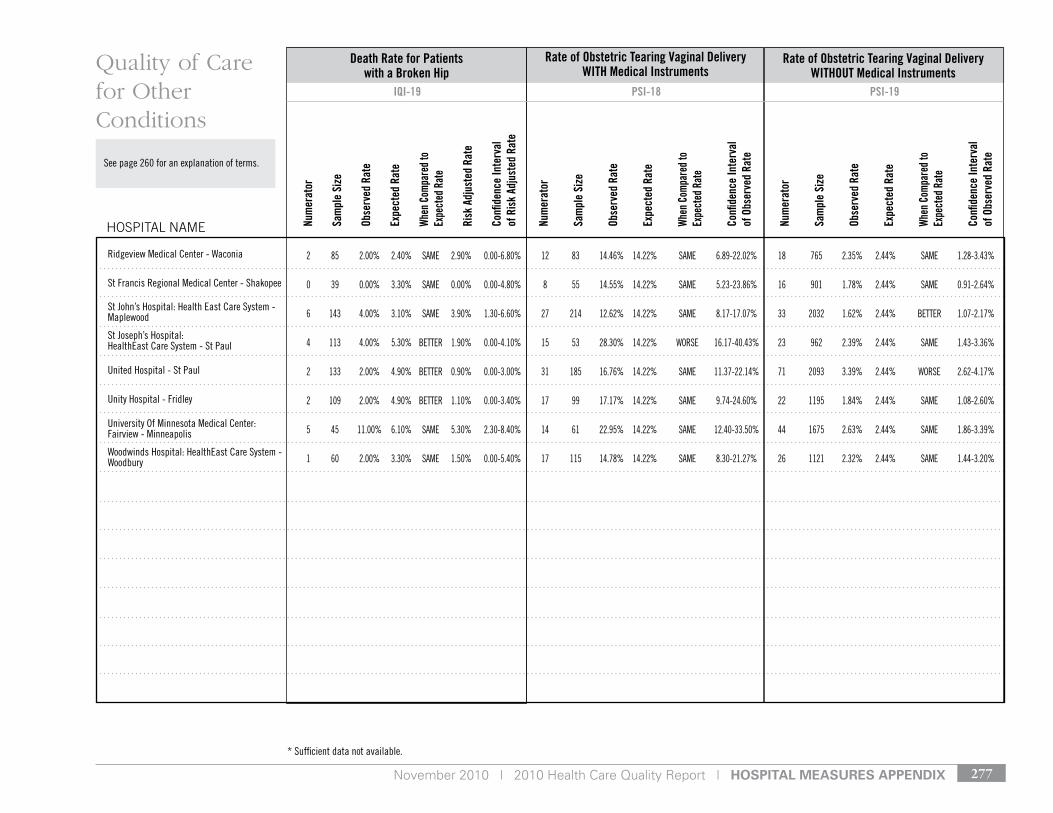
November 2010 | 2010 Health Care Quality Report | Hospital Measures appenDiX 277
see page 260 for an explanation of terms.
Num
erat
or
Sam
ple
Size
Obse
rved
Rat
e
Expe
cted
Rat
e
Whe
n Com
pare
d to
Expe
cted
Rat
e
Risk
Adj
uste
d Ra
te
Confi
denc
e In
terv
al
of R
isk
Adju
sted
Rat
e
Num
erat
or
Sam
ple
Size
Obse
rved
Rat
e
Expe
cted
Rat
e
Whe
n Com
pare
d to
Expe
cted
Rat
e
Confi
denc
e In
terv
al
of O
bser
ved
Rate
Num
erat
or
Sam
ple
Size
Obse
rved
Rat
e
Expe
cted
Rat
e
Whe
n Com
pare
d to
Expe
cted
Rat
e
Confi
denc
e In
terv
al
of O
bser
ved
Rate
Death Rate for Patients with a Broken Hip
Rate of Obstetric Tearing Vaginal Delivery WITH Medical Instruments
Rate of Obstetric Tearing Vaginal Delivery WITHOUT Medical Instruments
HOSPITAL NAME
Quality of Care for Other Conditions
IQI-19 PSI-18 PSI-19
ridgeview Medical Center - Waconia
st Francis regional Medical Center - shakopee
st John’s Hospital: Health east Care system - Maplewood
st Joseph’s Hospital: Healtheast Care system - st Paul
united Hospital - st Paul
unity Hospital - Fridley
university of Minnesota Medical Center: Fairview - Minneapolis
Woodwinds Hospital: Healtheast Care system - Woodbury
2 85 2.00% 2.40% sAMe 2.90% 0.00-6.80% 12 83 14.46% 14.22% sAMe 6.89-22.02% 18 765 2.35% 2.44% sAMe 1.28-3.43%
0 39 0.00% 3.30% sAMe 0.00% 0.00-4.80% 8 55 14.55% 14.22% sAMe 5.23-23.86% 16 901 1.78% 2.44% sAMe 0.91-2.64%
6 143 4.00% 3.10% sAMe 3.90% 1.30-6.60% 27 214 12.62% 14.22% sAMe 8.17-17.07% 33 2032 1.62% 2.44% Better 1.07-2.17%
4 113 4.00% 5.30% Better 1.90% 0.00-4.10% 15 53 28.30% 14.22% Worse 16.17-40.43% 23 962 2.39% 2.44% sAMe 1.43-3.36%
2 133 2.00% 4.90% Better 0.90% 0.00-3.00% 31 185 16.76% 14.22% sAMe 11.37-22.14% 71 2093 3.39% 2.44% Worse 2.62-4.17%
2 109 2.00% 4.90% Better 1.10% 0.00-3.40% 17 99 17.17% 14.22% sAMe 9.74-24.60% 22 1195 1.84% 2.44% sAMe 1.08-2.60%
5 45 11.00% 6.10% sAMe 5.30% 2.30-8.40% 14 61 22.95% 14.22% sAMe 12.40-33.50% 44 1675 2.63% 2.44% sAMe 1.86-3.39%
1 60 2.00% 3.30% sAMe 1.50% 0.00-5.40% 17 115 14.78% 14.22% sAMe 8.30-21.27% 26 1121 2.32% 2.44% sAMe 1.44-3.20%
* sufficient data not available.
November 2010 | 2010 Health Care Quality Report | Hospital Measures appenDiX 278
CMs Hospital CoMpare Measures
Data source and Data Collection proceduresThe Minnesota Statewide Quality Reporting and Measurement Sys-tem began requiring all Minnesota hospitals to submit data on CMS “Process of Care” measures for which they had relevant patients in January 2010. Data reported here are related to earlier reporting cycles from hospitals that submitted their data to the Centers for Medicare and Medicaid Services. Data is included in this report for the following measures: n Seven process of care measures related to heart attack care n Four process of care measures related to heart failure care n Six process of care measures related to pneumonia n Eight process of care measures related to the surgical care
improvement project
Data for all of these measures is for care provided from October 1, 2008 to September 30, 2009.
The information included in this report comes from the quality data submitted by hospitals to the Quality Improvement Organizations’ (QIO) Clinical Data Warehouse for all inpatient discharges. Except where noted, the data reflect twelve months of experience and is updated on a rolling basis. The data collection approach is primar-ily retrospective. Data sources for required data elements include administrative data and medical record documents. Some hospitals may prefer to gather data concurrently by identifying patients in the population of interest. This approach provides opportunities for improvement at the point of care/service. However, complete docu-mentation includes the principal and other ICD-9-CM diagnosis and procedure codes, which require retrospective data entry.
The CMS Abstraction and Reporting Tool (CART) is a medical record data abstraction tool. Hospitals may use the CART to transmit ab-stracted data directly into the QIO Clinical Data Warehouse through www.QualityNet.org (a HIPAA-compliant, secure data transmission
vehicle) or they may instruct a vendor to submit the data on their behalf using QNET. CART may also be used to transmit data directly to an ORYX vendor from a current Joint Commission-accredited hos-pital. The vendors transmit the data to the QIO Clinical Warehouse, if the hospital has authorized them to do so, on their behalf. Under The Joint Commission program, organizations that wish to be certified as ORYX vendors must pass certain tests that verify their capacity to correctly handle hospital data and calculate performance rates using the prescribed algorithms.
Both ORYX Vendors and CART data submissions include auditing procedures and edit checks, which assess whether data submitted is consistent with defined parameters for sample size, outliers, and missing data. The data for this publication has been audited/edited, but not validated.
samplingWhether or not a hospital uses sampling is determined by rules established by The Joint Commission and CMS. The same sampling methodology is used by hospitals for both their non-Medicare cases and Medicare cases and is based on the number of discharges per topic each quarter. More detailed information is available at www.QualityNet.org.
Calculating ratesEach rate calculation is based on the hospital’s relevant discharges. Only patients meeting certain criteria for a measure are included in the calculation of the rate for a measure. The performance rate for individual hospitals is calculated by dividing the numerator by the denominator. The denominator is the sum of all eligible cases (as defined in the measure specifications) submitted to the QIO Clinical Data Warehouse for the reporting period. The numerator is the sum of all eligible cases submitted for the same reporting period where the recommended care was provided. The same data is used for individual hospital and state rate calculations.
Hospital Measures appenDiX | November 2010 | 2010 Health Care Quality Report279
A two-step process was used to calculate the state comparison group rates. The state comparison rate for each measure was calculated using all of the data submitted to the QIO Clinical Data Warehouse for hospitals with at least one case that met the measure’s inclusion crite-ria (that is, for which the denominator was greater than zero).
First, the individual hospital performance rates were calculated using the method described above for all hospitals. Next, hospitals with “0 patients” were excluded from the calculation. For the state averages, a simple average was constructed where the numerator was the sum of all non-excluded hospitals’ scores and the denominator was the total number of hospitals, each calculated at the individual state level. The state average is calculated before excluding rates that are sup-pressed on the CMS Hospital Compare website.
limitationsIn order to align with accepted national standards for public report-ing with respect to the number of patients required for reliable public reporting, results are only included on those measures for hospitals with 25 or more cases. Because many hospitals have fewer than 25 cases in a reporting period, results are not included for a considerable number of hospitals on some measures.
risk adjustmentThe results for these measures are not risk adjusted because the measures relate to whether or not a patient received appropriate treatment rather than whether a particular outcome was achieved. Risk adjustment is performed for other measures for which patient characteristics influence a provider’s results.
appropriate Care MeasuresThe appropriate care measures utilize CMS measure data at the individual patient level for heart attack, heart failure and pneumonia care. With CMS permisson, Stratis Health calculates these measures through an agreement with the hospital. The hospital grants Stratis
Health access to utilize the hospital’s data in the QIO Clinical Data Warehouse for the calculation of these three composite measures. Stratis Health must access the following CMS process of care mea-sure data at the individual patient level: n Seven related to heart attack care n Four related to heart failure care n Six related to pneumonia care
Data for the measures is for care provided from October 1, 2008 to September 30, 2009.
These measures are pass/fail measures at the individual patient level. The measures evaluate whether the patient received all of the ap-propriate treatments (as defined by the measure specifications). A patient is included if eligible (i.e. meets denominator criteria) for at least one of the measures in a topic (heart attack, heart failure or pneumonia). To be considered as having appropriate care, a patient must meet numerator criteria for each measure in which the patient meets the denominator criteria. The measure calculation accounts for the fact that some treatments may not be appropriate for all patients. (For example, if the patient does not smoke, the “Patients given ad-vice or counseling about quitting smoking while in the hospital (AMI-4)” is not applicable and the hospital will automatically be given credit for meeting this part of the measure.)
Each rate calculation is based on the hospitals’ relevant discharges. The numerator is the sum of all eligible cases where the recom-mended care was provided. The denominator is the sum of all eligible cases (as defined in the measure specifications) submitted to the QIO Clinical Data Warehouse for the reporting period. The performance rate for individual hospitals is calculated by dividing the numerator by the denominator. The same data is used for individual hospital and state rate calculations.
November 2010 | 2010 Health Care Quality Report | Hospital Measures appenDiX 280
agenCy for HealtHCare researCH anD Quality Measures
Data source and Data Collection proceduresThe Minnesota Statewide Quality Reporting and Measurement Sys-tem began requiring all Minnesota hospitals to submit data on certain AHRQ measures for which they had relevant patients in January 2010. Virtually all Minnesota hospitals submit discharge data to the Minnesota Hospital Association. The AHRQ measures are calculated using this discharge data. Data is included in this report for care pro-vided from October 1, 2008 to September 30, 2009 for the following measures:n Seven Inpatient Quality Indicators – Abdominal aortic aneurysm repair volume (IQI 4) – Abdominal aortic aneurysm mortality rate (IQI 11) – Coronary artery bypass graft volume (IQI 5) – Coronary artery bypass graft mortality rate (IQI 12) – Percutaneous transluminal coronary angioplasty volume (IQI 6) – Percutaneous transluminal coronary angioplasty mortality rate (IQI 30) – Hip fracture mortality rate (IQI 19)n Five Patient Safety Indicators – Pressure ulcer (PSI 3) – Death among surgical inpatients with serious treatable complications (PSI 4) – Postoperative pulmonary embolism (PSI 12) – Obstetric trauma – vaginal delivery with instrument (PSI 18) – Obstetric trauma – vaginal delivery without instrument (PSI 19)
The Inpatient Quality Indicators (IQIs) and Patient Safety Indicators (PSIs) are sets of measures that provide a perspective on hospital quality of care using hospital administrative data.
n The IQIs reflect quality of care inside hospitals and include inpatient mortality for certain procedures and medical conditions; utilization of procedures for which there are questions of overuse, underuse, and misuse; and volume of procedures for which there is some evidence that a higher volume of procedures is associated with lower mortality.
n The PSIs are a set of indicators providing information on potential inhospital complications and adverse events following surgeries, procedures, and child birth. The PSIs were developed after a comprehensive litera-ture review, analysis of ICD-9-CM codes, review by a clinician panel, implementation of risk adjustment on applicable mea-sures and empirical analyses.
The IQIs and PSIs are software tools distributed free by the Agency for Healthcare Research and Quality (AHRQ). The software can be used to help hospitals identify potential problem areas that might need further study and which can provide an indirect measure of inhospital quality of care. The IQI software programs can be applied to any hospital inpatient administrative data. These data are readily avail-able and relatively inexpensive to use.
The IQIs and PSIs are respectively the second and third in the set of AHRQ Quality Indicators (QIs) developed by investigators at Stan-ford University and the University of California, under a contract with AHRQ. The software may be downloaded from www.qualityindica-tors.ahrq.gov.
risk adjustmentThe AHRQ software adjusts provider results based on each individual patient’s severity of illness. PSI 18 and PSI 19 are the only applicable AHRQ measures in this report which are not risk adjusted because there are not materially important risk factors available in the state inpatient discharge data.
Hospital Measures appenDiX | November 2010 | 2010 Health Care Quality Report281
limitationsIn order to align with accepted national standards for public report-ing with respect to the number of patients required for reliable public reporting, results are only included for those hospitals with 25 or more cases for each measure. Because many hospitals have fewer than 25 cases in a reporting period, results are not included for a considerable number of hospitals on some measures.
nQf HealtHCare assoCiateD infeCtion Measures
Data source and Data Collection proceduresMinnesota Statutes 62J.82 requires hospitals to report on selected healthcare acquired infection measures. The Minnesota Hospital Association (MHA) and Stratis Health, in collabo-ration with infection control practitioners, collect and report hospital-specific performance of the hospital-acquired infection measures published by the National Quality Forum (NQF). The selected mea-sures were first published on the MN Hospital Quality Report (www.mnhospitalquality.org) in October 2009. Data included in this report is for care provided from April 1, 2009 to March 31, 2010 for the follow-ing measures:n Central line bundle compliancen Ventilator bundlen Surgical site infection (SSI) rate for vaginal hysterectomy
The quality data included in this report comes from data submitted by each hospital directly to MHA on their data collection site. Each hospital must obtain the measure data via chart abstraction. Hospitals may take the measure information directly from the medical record, via observational audits or through a specifically designed documentation record (i.e. daily goals checklist). Hospitals must submit this data on a quarterly basis, no later than 45 days after the end of each quarter. If a hospital had no cases within a given quarter, the hospital must still
report this data to MHA. The online reporting tool requires the hospital to enter the measure numerator and denominator by month. The SSI Rate for Vaginal Hysterectomy measure numerator and denominators must be broken down and submitted by risk level 0, 1, 2 and 3.
The Central Line Bundle Compliance and Ventilator Bundle measures require concurrent data collection and observation. The SSI Rate for Vaginal Hysterectomy measure requires a retrospective review. There is a 30 day data lag associated with this measure.
More information about the reporting of these three measures can be found at http://www.mnhospitals.org/index/Infection1.
samplingn Central Line Bundle Compliance and the Ventilator Bundle: Sam-
pling is allowed for these measures if there are more than 15 cases per month at the hospital. If there are less than 15 cases, the total population must be reported.
n SSI Rate for Vaginal Hysterectomy: Sampling is not allowed for this measure. The measure includes 100% of eligible cases.
Calculating ratesEach rate calculation is based on the hospital’s relevant discharges. Only patients meeting certain criteria for a measure are included in the calculation of the rate for a measure. n Central Line Bundle Compliance and the Ventilator Bundle: The
performance rate for individual hospitals are calculated by dividing the numerator by the denominator. The denominator is the sum of all eligible cases (as defined in the measure specifications) submit-ted to MHA for the reporting period. The numerator is the sum of all eligible cases submitted for the same reporting period where the recommended care was provided. The same data is used for individual hospital and state rate calculations.
n SSI Rate for Vaginal Hysterectomy: The infection rate for indi-vidual hospitals in Risk Level 0 and Risk Level 1,2,3 are calculated by dividing the numerator by the denominator. The denomina-

November 2010 | 2010 Health Care Quality Report | Hospital Measures appenDiX 282
tor is the sum of all eligible cases (as defined in the measure specifications) submitted to MHA for the reporting period. The numerator is the sum of all eligible cases submitted for the same reporting period where the recommended care was provided. The Combined Risk Level infection rate is calculated by adding the numerators and denominators of the two risk level categories and dividing the numerator by the denominator. This combined infection rate is displayed in the Quality of Care for Surgeries table in the front of this report. The confidence intervals are ex-act poisson confidence intervals calculated by using the inverse gamma function as proposed by Leslie Daly ( 0 infections have a 95% confidence interval of 0 – 3.689.): (Daly, L. The Calculation of Exact Binomial and Poisson Confidence Limits; Comput. Biol. Med., Vol. 22, No. 5, pp 351-361, 1992). This confidence interval is compared to the expected rate to determine the significance of the results. If the expected rate falls within the confidence inter-val, the hospital’s performance is average or the same as expect-ed. If the expected rate falls above the confidence interval, the hospital’s performance is average or better than expected. If the expected rate falls below the confidence interval, the hospital’s performance is below average or worse than expected. More information on these calculations and their statistical significance is available at http://www.mnhospitalquality.org/SSI.aspx?region=ALL&ct=Infection+Prevention&mc=SSIVH.
To determine the state average for these measures, hospitals with “0 patients” in the measure denominator were excluded from the calculation. Then, the sum of all the numerators for Minnesota hos-pitals was divided by the sum of all the denominators of Minnesota hospitals.
risk adjustmentn Central Line Bundle Compliance and the Ventilator Bundle: The
results for these measures are not risk adjusted because the
measures relate to whether or not a patient received appropri-ate treatment rather than whether a particular outcome was achieved. Risk adjustment is performed for other measures for which patient characteristics influence a provider’s results.
n SSI Rate for Vaginal Hysterectomy: The performance of each facility relative to SSI has been adjusted to reflect the risk as-sociated with the reported procedure. Adjusting for these risk levels allows for comparisons of the facilities. If a facility has a high rate after the adjustment, one can have more confidence that the facility has SSI problems that are caused by factors other than the presence of many high risk patients. The risk factors that are used in adjusting a facility’s performance are the degree of contamination of the wound at the time of the operation, the duration of the procedure, and the American Society of Anesthe-siologists (ASA) score. The latter is an estimate of the patient’s physical condition. A risk score of 0 indicates that the patient has a relatively low risk of developing a surgical site infection, while a 3 indicates that a patient has a relatively high risk of developing an infection for a particular surgical procedure. Occasionally risk levels are combined, as in 1,2,3. For these surgical procedures, the Centers for Disease Control found that SSI rates were similar whether the risk was a 1, 2 or a 3.
limitationsIn order to align with accepted national standards for public report-ing with respect to the number of patients required for reliable public reporting, results are only included on those measures for hospitals with 25 or more cases. Because many hospitals have fewer than 25 cases in a reporting period, results are not included for a consider-able number of hospitals on some measures.
NOTE: For the SSI rate for vaginal hysterectomy measure, this in-cluded a combined sample size of 25 for all risk levels (i.e. 0,1,2,3)

November 2010 | 2010 Health Care Quality Report | Hospital Measures appenDiX 283

Minnesota DepartMent of HealtH, HealtH eConoMiCs prograM85 east seventh place, st. paul, Mn 55164-0882phone: 651-201-3555 | tDD: 651-201-5797 www.health.state.mn.us/healthreform/measurement