Embed Size (px)
Citation preview
Long-term apprenticeship model appraisal Final report
October 2017
Michael Lee, Ha Bui, Anthony Barker – Cambridge Econometrics
Terence Hogarth – Fondazione Giacomo Brodolini
2
Contents List of figures 4
List of tables 5
Executive summary 6
The model design 6
Additional considerations to enhance the model 7
1 Introduction 8
1.1 Background 8
1.2 Objectives 8
1.3 Approach 9
1.4 Structure of the report 9
2 The purpose of the model 11
2.1 Introduction 11
2.2 Modelling future demand for apprenticeships 11
2.3 The modelling approach 12
2.4 Suitability of the LTM model structure to the new policy system 14
2.5 Concluding remarks 17
3 Assessing the inputs of the model 19
3.1 Introduction 19
3.2 Inputs to the model 19
3.3 The baseline projections for inflows 20
3.4 Assessment of the assumptions in the model 23
3.5 Concluding remarks 29
4 Assessing the outputs of the model 30
4.1 Introduction 30
4.2 Forecasting apprenticeship volumes and costs 30
4.3 The level of detail of model outputs 31
4.4 Sensitivity analyses 35
4.5 Concluding remarks 36
5 Conclusion 38

3
5.1 Modelling the new policy system 38
5.2 Summary of the model’s strengths and weaknesses 38
5.3 Recommendations for enhancements 39
Appendix A Alternative modelling approach 48
A.1 Agent-based modelling 48
Appendix B Description of the structure of the Long-Term Apprenticeship model 50
B.1 The model structure 50

4
List of figures Figure 1: Estimating core and variable demand to reflect expected employer behaviour 21
Figure 2: The model structure 51

5
List of tables Table 1: Disaggregation of unit of measurement 34
Table 2: The use of data sources in considering areas for improvements 44
6
Executive summary • The new apprenticeship system in place since May 2017 aims to increase
employer investment and participation in training, as well as the quality of apprenticeships. In moving to a more employer-led system, it is anticipated that employer demand for apprenticeships will change, affecting apprenticeship costs to the employer and to the government.
• The Department for Education has developed a Long-term Apprenticeship Model to project apprenticeship volumes and total costs under the new apprenticeship system. A main challenge identified when developing the model is the uncertainty surrounding employer behaviour in the new system (including the cost incentive structures), as well as the costs of delivering those apprenticeships. There is a lack of quantitative evidence available on which to base assumptions of policy impact.
• To further validate the approach and methods adopted for the model, the Department for Education commissioned Cambridge Econometrics and FGB to evaluate the model design and advise on alternative or additional approaches that could enhance the model.
The model design • The modelling approach is considered suitable because of the simplicity and
transparency of the approach. The decision to model the impacts of the new policy system as exogenous inputs into the model is appropriate given the uncertainty surrounding employer behaviour. This approach also enables simple adjustments to improve the model over time (by adjusting the inputs) as new evidence becomes available.
• There is little rationale for overhauling the inputs and assumptions, given the limited data and evidence. However, there is scope to consider enhancements to the assumptions and inputs that – although would add more complexity – could make use of additional qualitative information.
• Given the core roles of the model to project apprenticeship volumes and costs, the strengths of the outputs are that they are easily interpreted, and the results are broken down into different categories of interest to policymakers. The provisions for sensitivity analyses also seem adequate.
7
Additional considerations to enhance the model • The suggestions for enhancements that can be implemented immediately are
mostly small. However, once more data and evidence are available, there is value in assessing more explicitly the impact of the policy system on employer behaviour.
• Some of the suggested enhancements are to enable the model to perform better its core roles. This involves looking at routes of entry and at progression rates of apprenticeships to derive a better understanding of the types of apprenticeships and volumes according to each level of study. Some recommendations are intended to yield interesting outputs but are regarded as non-essential, for example differentiating apprenticeships by industry. Recommendations that focus on understanding better employer behaviour in the new policy system can also be considered in the longer term, and are only likely to be feasible with new data releases, or additional data being collected.
8
1 Introduction
1.1 Background From 1st May 2017, the government introduced an Apprenticeship Levy and new funding rules designed to increase both employers’ investment in training and the quality of apprenticeships. The levy is paid by each employer with a wage bill of more than £3m a year, and will be the main source of funding for all apprenticeships undertaken with that employer, with additional payments and support paid for by the government according to new funding rules.
In preparation for the reform, the Long-term Apprenticeship Model (LTM) was developed by the Department for Education (DfE) to forecast apprenticeship starts and costs for both levy and non-levy employers. The use of the model should help inform the demand for apprenticeships and the budget requirements resulting from the policy changes.
A major challenge in this task is assessing the demand for apprenticeships from employers’ perspectives, which is one of the main considerations underpinning the new policy system. There is a high degree of uncertainty about potential impacts of the new policies because they are notably different from the policies implemented previously. In addition, there are limited quantitative data on the subject. For the model to best serve policymakers, it should capture employer behaviour and produce robust results in a logical and transparent manner.
1.2 Objectives Cambridge Econometrics (CE), in collaboration with Terence Hogarth from Fondazione Giacomo Brodolini (FGB), has been commissioned by DfE to undertake a review of the Long-term Apprenticeship Model to consider if it is fit for purpose and whether other approaches might improve its quality and capability.
This review aims to achieve the two core objectives below:
1. Evaluate the model design with respect to:
• the data sources available to the DfE with information relevant to predicting future apprenticeships starts and costs at both levy and non-levy-paying employers;
• the other modelling approaches available to forecast future starts and costs; and • the other economic and statistical modelling techniques that could be employed to
make best use of the data sources and other information available.
9
2. Advise on how any alternative or additional approaches could be implemented that would enhance the model, with an estimate/understanding of the benefits they would have on the starts and costs projections.
The primary objective is to establish if the model is fit for purpose
The review of the model aims to identify if it is fit for purpose and identify where improvements can be made – either over the short or longer-term – to estimate future participation levels and associated costs. Refinements could include drawing on alternative sources of data. There are, for instance, various surveys regularly conducted by DfE (and previously by BIS) that could be used to inform various assumptions and potentially provide some parameter estimates. Equally, possible refinements may require new data.
1.3 Approach The appraisal considers three aspects of the model:
1. Theoretical framework: appraising the underlying framework, its advantages and limitations, compared to other available approaches.
2. Data sources and assumptions: looking at each step in the model and identifying the assumptions underpinning the model’s output. A key element is to assess whether the assumptions of impact could have been estimated in a different way and whether making such a change would have much impact on the resulting estimate. The data sources used to inform the assumptions are identified and reviewed against any alternative sources available.
3. Estimation techniques: this stage identifies what economic and statistical techniques are used in the model and whether there are better techniques that could be used.
The findings from these three lines of enquiry will inform recommendations to improve the existing model.
1.4 Structure of the report It is recognised that the three stages of the study mentioned in Section 1.3 may overlap in several aspects. For example, the choice of modelling approach has implications on what assumptions would be needed, which leads onto a consideration of the appropriate calibration of the assumptions.
Chapter 2 examines the understanding of what is required to analyse and forecast apprenticeships under the new apprenticeship system, and how well the conceptual framework and logic of the model align with that. Given the model structure, Chapter 3

10
provides an assessment of the model inputs, to gauge their applicability to the policy context. Chapter 4 provides an assessment of the relevance and detail of the model outputs. Chapter 5 offers brief concluding remarks, and draws the suggestions for enhancements together to highlight where there is scope for improvement.
11
2 The purpose of the model
2.1 Introduction The two main roles for the model are:
1. estimating future levels of participation in apprenticeships, measured by the number of starts1; and
2. estimating the costs to the Exchequer accruing from the projected levels of future participation.
Considering the changes in policy that prompted the development of the current model is crucial in assessing the validity and suitability of the applied modelling approach. At the conceptual level, the model should, where possible, align with the expected mechanisms through which the policy is intended to drive apprenticeship volumes and costs.
Section 2.2 examines the main factors that models intending to cover the new policy system should address, and assesses the feasibility of doing so with the available evidence. Section 2.3 assesses the validity of the modelling approach adopted for the LTM. Section 2.4 assesses how well the model aligns with the factors of consideration from the new policy system and Section 2.5 provides concluding remarks.
2.2 Modelling future demand for apprenticeships Modelling the future demand for apprenticeships in a way that can inform policy requires an understanding of what is likely to influence that demand and an assessment of the relative importance of the different influences (which may be derived econometrically or otherwise). The move to a demand-driven VET / apprenticeship system therefore means considering the factors that influence the propensity of employers to take on apprentices. These include:
• employer behaviour (including the relationship between employer demand for apprentices and the economic cycle)
• the demand for employers’ goods and services and the skill demand within the workplace this gives rise to;
• the age profile of the workforce (e.g. looming replacement demand);
1 The model also provides results by age level and Sector Subject Area (qualification subject) but these are secondary considerations.
12
• the availability of alternative supplies of skills; • employer perceptions of apprenticeships and the VET system more widely;
• the policy context (and employers’ behaviour in relation to it)
• the impact of the Levy; • other incentives available to employers to take on apprentices (by subject, age,
etc.); • supply-side considerations
• the availability of supply to meet employer needs; • the willingness of young people to take the work-based learning route through
post-compulsory education; • demography.
Evidence on the link between economic cycles and the demand for apprenticeships is limited
On employer behaviour, there has been relatively little time-series analysis that addresses, other things being equal, the propensity of employers to take on apprentices relative to trends in output.
The policy background further complicates the understanding of employer demand. In the past, the availability of funding to training providers was such that some employers might have been persuaded to take on apprentices by providers – so long as the cost to the employer was zero – even if the employers had no underlying business demand for apprentices. Employers, in such circumstances, may have been persuaded to train existing employees so as to motivate and/or retain them rather than upskill them, or they might have trained apprentices to fulfil their corporate social responsibility with little intention of retaining them post-training. Additionally, the availability of ad-hoc funding at the local level further confounds any relationships between employer demand for apprentices and underlying business demands.
2.3 The modelling approach The model incorporates some of the above-mentioned factors, making assumptions for what their impacts may be. The model draws on evidence from various research reports to parameterise the model; important studies include the Net Costs of Training series of
13
studies2, the recent study on employer behaviour in relation to the Levy3, and the recent DfE study on employer preferences regarding the training of 16-18 year olds4. Nevertheless, there is not an extensive literature base to draw on.
Volumes are projected by a stock-flow model
The volume of apprenticeships is modelled using ‘stock-flow’ principles. The approach bears some resemblance to the Manpower Requirement framework usually employed for forecasting labour and skills demand5. This framework contains many features specific to modelling labour and educational requirements at the macroeconomic level, but its main appeal (applicable to apprenticeships) is the logical process undergone to achieve the final demand. Consistent with this framework, the LTM model moves forward a static variable (eg stock of apprentices) using dynamic measures (eg movements of apprentices in and out of the system).
There are criticisms that the Manpower Requirement framework has unsophisticated assumptions and is inaccurate, because of the difficulty in converting employment by industry to occupation and then to educational requirements6. Given the similarity in modelling approach, it is possible that similar criticisms could be applied to the LTM. However, in this instance, the unsophisticatedness of the model can be considered a strength for its ease of communication of the structure and outputs to policy-makers. The inaccuracy of mapping jobs to education requirements is less applicable in this instance, as the LTM does not contain these elements.
Another possible modelling approach: Agent Based Modelling
One alternative method for projecting apprenticeships would be to use an agent based modelling (ABM) approach. ABM is a relatively new approach in labour economics. In a conventional labour market Agent Based Model, the labour market is characterised by the interaction and decisions of its agents, individuals (employees) and firms
2 Hogarth, T., Gambin, L., Winterbotham, M., Baldauf, B., Briscoe, G., Gunstone, B., Hasluck, C., Koerbitz, C. and Taylor, C. (2012), “The Fifth Net Benefits of Training to Employers Study (BIS Research Paper Number 67)” 3 Gambin, L., Hogarth, T., Winterbotham, M., Huntley-Hewitt, J., Eastwood, L. and Vivian, D. (2016), “The apprenticeship levy: how will employers respond? Research report”. 4 Frontier Economics and CFE Research (2016), “Costs and behaviours in the 16 to 18 apprenticeship system”. 5 Hughes G., Jurajda S. and Munich D. (2000). “Forecasting Education and Training Needs in Transition Economies: Lessons from the Western European Experience”. 6 UNESCO: International Institute for Educational Planning (1985). “Forecasting Skilled Manpower Needs: The Experience of Eleven Countries”.
14
(employers). The models tend to focus on the search and matching process between firms and individuals in the labour market, and the possible outcomes of this process. More details on the approach, including the types of application in the labour market domain, is available in Appendix A.
ABM is considered less appropriate for current requirements
ABM is a powerful and effective tool for policy evaluation and has several desirable features. This approach captures the interaction between firms and individuals (which means taking into account part of the supply side), allows for individual differences in behaviour and has more flexibility for the use of policy assumptions. However, it is also technically complex and highly data intensive. In addition, the additional flexibility surrounding the supply side may be of secondary importance in the context of the new apprenticeship system. The complexity of the ABM approach could also obscure the use of the model and the interpretability of what the outputs mean. In contrast, the main advantages of a stock-flow model for the volume projections are that it is transparent and easy to follow.
Therefore, ABM is considered as a less appropriate method compared to the stock-flow approach for modelling apprenticeship volume and costs.
2.4 Suitability of the LTM model structure to the new policy system
Model overview
Given that the existing LTM modelling approach is considered suitable, it is worth considering the implementation of the approach in the model, including its suitability for projecting volumes and costs under the new apprenticeship system. The model calculates the stock of apprenticeships on a monthly basis. The number of apprenticeships at the end of a period is the number (stock) at the start of the period plus the number of people starting apprenticeships during that period, less the number leaving (either because they have completed their course or they have left the programme for other reasons eg dropped out). The scale of the inflow and outflow of apprentices are influenced in part by policy. The financial cost is calculated from the number (stock) of apprenticeships by applying an average cost7. A more detailed explanation of the LTM model structure is available in Appendix B.
7 For the purpose of the section, it is assumed that the reader has a good knowledge of the model. A more detailed explanation of the model is available in Appendix B.
15
Within the current structure of the model, there is scope to accommodate different policies to be tested and updated as understanding of them improves. For example, by testing a range of values for the co-investment rate assumption, holding other things unchanged, it is possible to assess whether levy and non-levy-payers are equally sensitive to a change in the co-investment rate.
Employer behaviour
Within the model, it is assumed that factors determining employer behaviour (under the previous apprenticeship system) are readily reflected in historical data for inflows and outflows. So, baseline projections of apprenticeship volumes are generated based on past trends and serve as exogenous inputs in the model rather than being estimated (by econometric equations or otherwise).
The policy context
The model addresses some of the main features of the policy, through accommodating in the framework key features of how employers react. The scale of impact on employer behaviour are derived from assumptions to calculate predicted levels of participation in apprenticeships. In the absence of historical quantitative data for employer behaviour under the new system, the approach adopted for the model seems a suitable alternative approach. In addition, accommodating policy impacts through this method provides the flexibility for future improvements to the parameters (which may be derived from time-series quantitative analyses once more data is available).
Supply-side considerations
However, the model has little consideration of the supply side of training. For the purposes of this review, the supply side is interpreted as the individuals who may want to enter into an apprenticeship scheme, and the training providers which enable processes for training to take place.
Limited consideration is given to supply in the current model
The number of individuals willing to take up an apprenticeship may be considered part of the labour supply, which also includes people in employment or other forms of education and training. The model does not consider how realistic it is that any potential increase in employer demand as a result of the policies would be met. In other words, it assumes all apprenticeships offered by employers will be filled. If apprentice participation is not as high as expected, the actual volume of apprenticeships and cost of delivery may be lower than currently projected.
16
Apprentice participation may also be affected by factors such as economic growth and demographic change in the forecast period. In the case that there is a shortfall in supply, there would be implications for employers’ business and costs as they are unable to find an alternative in the short term8, which may in turn lead them to reduce their demand for apprentices in the future.
Providers’ capacity to train would also impact the number of starts (probably to a lesser extent than employers’ demand), completion rates and the distribution of apprenticeships across different programme types and Sector Subject Areas (SSAs). Some aspects of this are already captured (albeit implicitly) within the model. The trajectory of transition from frameworks to standards is developed according to whether providers are able to deliver a standard with equivalent contents to an existing framework, but the general assumption is that supply meets demand. In addition, the quality of courses and trainers is a major factor influencing the participation of both employers and individuals in vocational education and training, but this is difficult to quantify9.
That said, the absence of the role played by training providers in the current model could be justified since supply in this sense is of limited relevance to the modelling objective, given that the reforms aim to move away from a provider-led apprenticeship system.
The demand-driven framework concentrates on policy impact on apprenticeship inflows
The rationale for not explicitly linking the assumption for outflow rates to policy assumptions may be that they are more driven by supply-side factors, such as the programme characteristics and apprentices’ ability to progress. It may be necessary for the model to accommodate policy impacts on outflow rates as well, but it is recognised that this largely relies on data availability. The DfE expects drop-out rates to change with the transition from frameworks to standards and that it may be a few years into the operation of the new system before reliable data become available.
Given data constraints and the existing difficulty in modelling employers’ demand for apprenticeships, on balance, adding the supply side directly into the model at this point would add considerable complexity. Nevertheless, supply-side considerations (as a lower priority enhancement) could be factored into the assumptions by using time-series analysis of the impacts of supply-side factors on inflows and outflows, which are unlikely
8 This may be more of a local issue rather than a national issue. 9 Billet S., 2000. Defining the demand side of vocational education and training: industry, enterprises, individuals and regions. Journal of Vocational Education & Training, 52(1), pp. 5-31. Available from: http://www.tandfonline.com/doi/pdf/10.1080/13636820000200104
17
to be affected by the funding reforms. This could be built from, as a starting point, data on the aggregate labour force from the Labour Force Survey (LFS) or the Annual Population Survey (APS) from the Office of National Statistics (ONS). In addition, consistency checks could also be performed to make sure the model is externally consistent, ie demand as currently projected looks sensible given the forecast of supply. By extension, it would also be interesting to consider the composition of the labour force by age group, given its importance in the model.
Detail of the model
Building up total estimates from apprenticeship stocks at a disaggregated level allows the model to capture the most detail and cross-group variations in the impact of each assumption on the output variables. However, this approach also has greater data requirements.
Anticipation of future policy developments
It is apparent over the last decade at least if not longer, that the whole vocational education and training system has been becoming more demand-led. The principal means for achieving this goal has been the use of funding. The use of funding ensures a range of actors supply – and demand – skills that have economic value. It may well be that future changes will be introduced that affect either the levels of funding or the structure of funding. The model will need to accommodate these changes. From what has been observed of the model, it has the capacity to respond to future change.
2.5 Concluding remarks This chapter identifies the purpose of the model with reference to the policy environment and establishes the approach to modelling demand for apprenticeships within the current model framework. Modelling employer behaviour and their demand for apprenticeships could potentially be understood through using alternative techniques and economic models often applied in labour market and skills forecasting. However, on balance it is considered that the current stock-flow approach is the most appropriate modelling approach to projecting apprenticeship volumes and costs, given the lack of data and evidence currently available, favouring a more transparent and simple approach.
The model provides scope to account for the mechanisms through which the new policy system is expected to affect apprenticeship volumes (such as, for example, employer top-ups and co-investments) and as such seems well-suited to the needs of its main users, ie policymakers who are interested in the impacts of policies at a disaggregated level.

18
In establishing that the current modelling approach is the most appropriate method for projecting apprenticeship volumes and costs and that the logic in the model structure is adequate, there is a need to assess whether the inputs of the model are appropriate given the available data and evidence, as well as the policy context. This is explored further in Chapter 3.
19
3 Assessing the inputs of the model
3.1 Introduction The current design of the model allows for different policies to be tested and updated as they become more developed. This is achieved through changing the inputs of the model, ie altering assumptions of the policy impacts on apprenticeship starts and costs to fund these apprenticeships. The assumptions for the scale of these impacts are based on a combination of stakeholder engagements undertaken by DfE, survey data, and qualitative studies.
The calibration of the assumptions used in the model therefore, is crucial. The assumptions underpinning the projections should capture as much as possible the intended impacts of the policy. This chapter assesses the assumptions applied in more detail.
Section 3.2 reviews briefly the data used as inputs for the model. Section 3.3 considers the suitability of the baseline projections used. Section 3.4 provides a detailed assessment of assumptions relating to starts and costs, as well as their applicability. Section 3.5 offers concluding remarks.
3.2 Inputs to the model
The model relies on a limited number of data sources, which are largely qualitative
The main source of input data to the model is the Individualised Learner Record (ILR), published quarterly. These data form the basis for developing the majority of the assumptions used in the model, including the baseline projections (ie as if under previous policies) of apprenticeship starts, outflows, SSA distribution, average costs and average duration. These assumptions are thus relatively straightforward to update and unlikely to change drastically between one year and another, although the impacts of new policies will in time begin to be reflected in the data.
Other assumptions are based on results of qualitative research and in-house expertise, which therefore are subject to value judgements, are more uncertain, and are likely to change as additional information becomes available. These include some of the assumptions critical to understanding the impact of the policies, including the impact of the levy on starts, the impact of the co-investment rate, the costs of frameworks and standards and the speed of transition from frameworks to standards.
20
3.3 The baseline projections for inflows In order to come up with a baseline10 projection of apprenticeship inflows, the model takes an average of inflows for each month over the last five years. This is considered as a reasonable starting point, given that analysis of the data indicated that inflows have remained largely stable over that period.
However, as discussed in Section 2.2, it is conceivable that employer demand in the baseline would be influenced by the wider economic cycle, and the demand for their products. An understanding of this could enrich the baseline projections of apprenticeship starts.
The impact of the economic cycle can be isolated from the policy impacts
A preferred approach would be to identify (or approximate) the underlying demand for apprenticeships, ie, the proportion of employers that recruit apprentices because the nature of their business requires them to regularly engage in initial vocational education and training. It is likely that the Apprenticeship Evaluation: Employer Survey can provide some of this information or could be developed to provide it in the future. Further research using administrative data may enable a deeper understanding of the role structural factors have in determining demand. The impact of the economic cycle is important, notably in sectors such as construction where a rapid decline in the number of apprenticeship starts was observed in the immediate period following the 2007/8 financial crisis. This approach gives an indication of the ‘core’ demand relative to the economic cycle. The implication is that the core demand would be dependent only on the economic cycle and not on the economic cycle and the difference in employer behaviour under the current and previous apprenticeship systems.
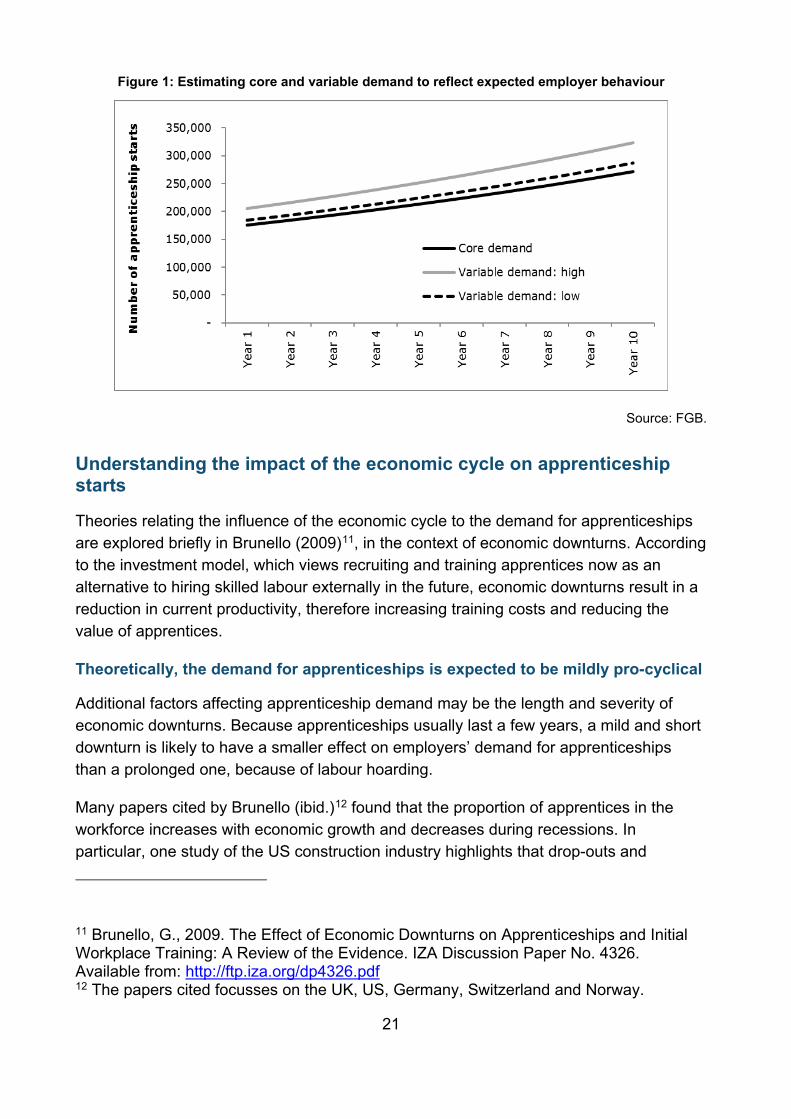
In positing that the baseline projections currently in the model are replaced by the core demand relative to the economic cycle, the policy assumptions would form a variable component in addition to that to reflect employer behaviour; it would subsequently be possible to produce estimates along the lines shown in Figure 1.
10 More concretely, the baseline forecast implicitly models the “business as usual” projection, which is the continuation of historical behaviour, and by extension the previous policy framework.
21
Figure 1: Estimating core and variable demand to reflect expected employer behaviour
Source: FGB.
Understanding the impact of the economic cycle on apprenticeship starts
Theories relating the influence of the economic cycle to the demand for apprenticeships are explored briefly in Brunello (2009)11, in the context of economic downturns. According to the investment model, which views recruiting and training apprentices now as an alternative to hiring skilled labour externally in the future, economic downturns result in a reduction in current productivity, therefore increasing training costs and reducing the value of apprentices.
Theoretically, the demand for apprenticeships is expected to be mildly pro-cyclical
Additional factors affecting apprenticeship demand may be the length and severity of economic downturns. Because apprenticeships usually last a few years, a mild and short downturn is likely to have a smaller effect on employers’ demand for apprenticeships than a prolonged one, because of labour hoarding.
Many papers cited by Brunello (ibid.)12 found that the proportion of apprentices in the workforce increases with economic growth and decreases during recessions. In particular, one study of the US construction industry highlights that drop-outs and
11 Brunello, G., 2009. The Effect of Economic Downturns on Apprenticeships and Initial Workplace Training: A Review of the Evidence. IZA Discussion Paper No. 4326. Available from: http://ftp.iza.org/dp4326.pdf 12 The papers cited focusses on the UK, US, Germany, Switzerland and Norway.
22
completions follow the same pattern, ie being lower during recessions, driven by fewer employment alternatives and a lower number of starts.
There is some empirical evidence that suggests a small impact of the economic cycle on apprenticeship demand
An empirical study by Mühlemann, Wolter and Wüest (2009)13 on the relationship between business cycles and apprenticeships in Switzerland provides some indication of the size of impact. Switzerland operates a similar dual apprenticeship system to the UK, allowing apprentices to split their time between formal training at a vocational education institution and on-the-job training with a firm. The study uses econometric techniques to estimate the level of apprenticeships, dependent on the business cycle (captured by unemployment and income growth) and the potential supply of apprentices (measured by total population and population of school leavers who have not enrolled in high school). Their findings confirm a small, pro-cyclical impact on the demand for apprenticeships; a 1 percentage point increase in the unemployment rate results in a 0.6% fall in the number of apprenticeships in a year. In addition, the authors found that the effect is more substantial when using the unemployment rate as a measure of the economic cycle compared to the growth rate of income; the authors posited that labour market conditions are more influential in firms’ decisions to offer apprenticeships than overall macroeconomic performance.
Beyond these findings, however, research on the topic has been limited. Theoretical models provide the intuition but not necessarily the quantified impacts. Mühlemann, Wolter and Wüest (2009) is the only study identified that empirically assesses the impact of the business cycle.
The model can incorporate simple relationships to incorporate the impact of unemployment on baseline starts
Nevertheless, the available literature can provide the basis to incorporate simple relationships that factor the economic cycle on employer demand into the existing LTM model. The relationships may include, for example, an assumption of the impact of future unemployment on future baseline apprenticeship starts. Implicitly, unemployment is expected to be affected by the economic cycle.
However, in acknowledging that the available studies only provide a partial understanding of the impact of the economic cycle, further resources could be focused on the issue. The focus of existing literature has been on developed countries with well-
13 Mühlemann, S., Wolter, S. and Wüest, A., 2009. Apprenticeship Training and The Business Cycle. IZA Discussion Paper No. 4460. Available from: http://ftp.iza.org/dp4460.pdf
23
established apprenticeship systems, or on specific industries with a high share of apprentices such as engineering and construction. As the data begins to reflect employer behaviour in the new system, it may be useful to undertake further econometric analysis to understand the impact of the economic cycle on overall employer demand in the UK specifically.
3.4 Assessment of the assumptions in the model
Assumptions related to apprenticeship starts
The assumptions relating to starts are used to model the impact of the new apprenticeship system on employer demand for apprenticeships. All the assumptions of policy impacts relate to percentages calculated against the apprenticeship baselines projections, by level and age.
For levy-payers, the principle assumptions governing starts (with the exact assumption) are:
• starts in levy-payers from having sufficient funds (only 80% of demand will be met); • the proportion of starts by age group (43%, 57% and 68% for age groups 16-18,
19-23 and 24+ respectively); • growth in starts at levy-paying employers (by 20%); and • impact on unmet demand from top-ups and co-investment (for every 10 percentage
point increase in top-up rate, take-up at levied employers increases by around 1 percentage point; a 10% co-investment rate results in 10% increase in starts).
It is envisaged that as take-up from top-ups and co-investment increases, the proportion of unmet demand for levy-paying employers decreases.
For non-levy employers, the principle assumptions concern:
• the proportion of starts by age group (57%, 43% and 32% for age groups 16-18, 19-23 and 24+ respectively)
• the impact of co-investment (10% co-investment translates to 10% decrease in starts).
Across these two groups of employers, assumptions regarding additional payment arrangements for specific age-groups are expected to affect employer demand as well:
• 16-18 incentive payment impacts on employer demand (no impact); and • 16-18 waivers (86% of 16-18 apprentices will get this co-investment waiver).
24
Assumptions drawn from existing data sources seem reasonable
Within the current framework, some of the adopted assumptions are drawn from existing data (mostly from DfE-HMRC matched administrative data), and can be considered as best estimates until a better understanding of the impacts is available. This may, for example, be derived from the same data source in the future, once the data begins to capture employer behaviour in the new system. Assumptions of the impact associated with the starts in levy-payers with sufficient levy funds, the proportion of starts in levy-payers, the 16-18 waiver, and the impact of top-ups all use this data source.
It is hard to justify the use of alternative sources which may not be any more robust
For the assumptions applied which rely on qualitative studies (for example, the increase in volume of starts in levy payers, the impact of co-investment on starts in non-levy payers, and 16-18 incentive payments), it is difficult to rationalise the use of alternative sources. Survey results may point to slightly different assessments of impact but in our view cannot be considered as any more or less informative than what are currently used. For example, a recent survey conducted by the Association Graduate Recruiters (AGR) found that hiring of apprentices are expected to increase by 59%14 in 2017. In this instance, the evidence is insufficient to suggest whether this is a one-off increase, or whether this behaviour is wholly driven by the introduction of the Levy. Furthermore, it is difficult to use survey data (particularly without access to the detailed datasets) as conclusive quantitative evidence, especially when the survey is conducted on an arguably small sample of around 100-130 employers.
An industry disaggregation may help refine assumptions of impact
Available qualitative studies point to potential sectoral differences in employer responses to the levy. Gambin et al. (2016) found that apprenticeship demand in many engineering and construction employers may be unlikely to change much as a result of the new system given existing apprenticeship structures within these firms. In this instance, the impact of the new levy may be smaller than that is currently inputted in the model. It is difficult to say with certainty whether the qualitative evidence is sufficient to develop industry-level assumptions (and in the short term this may introduce more uncertainty associated with the model). However, adding this level of disaggregation could enable the use of additional evidence not currently adopted and allow for additional sensitivity
14 AGR (6th June 2017) “AGR survey: Apprenticeships predicted to grow 59% this year”, http://www.agr.org.uk/News/agr-survey-apprenticeships-predicted-to-grow-59-this-year/172553#.WVoqfNTytuU.
25
testing. For example, exemptions or additional incentive payments on particular sectors could be examined within this model structure.
Age-group specific waivers could conceivably affect the distribution of apprenticeship starts across age-groups
At present, the waivers and incentives for 16-18 are assumed to only affect 16-18 apprenticeship starts. However, for a given apprenticeship opportunity, it is conceivable that taking on an apprentice aged 16-18 removes the opportunity for an apprentice of a different age. While there is no evidence at present that this is the case, providing a mechanism to at least consider a substitution effect for apprenticeship inflows may be a useful consideration. This could easily be achieved within the model structure by including an additional cell for a user to input assumption of the 16-18 incentive and waiver payments for the 19-23 and 24+ categories.
Outflow rates
Outflow rates (completion and drop-out rates) that are derived from 2015/16 ILR data are assumed to stay constant, not affected by the new funding system.
The Apprenticeship Levy is likely to affect outflow rates, given that it may have an impact on starts
The model specification identifies when funding is made available (ie in the sense that not all funding is delivered upon completion of the apprenticeships). Estimating the overall cost is dependent upon estimates of completion rates. If the Apprenticeship Levy increases the number of apprenticeship starts – as the evidence indicates it might – there may be some impact on completion rates. This might reduce completion rates if it results in an increase in individuals who are not as well prepared for an apprenticeship as in the past. However, given the fact that employers are required to invest more directly in apprenticeships, this might result in more careful support of their apprentices with the result that completion rates increase.
The current treatment can be further refined if additional information is collected
Relatively little is known about the determinants of completion rates. The former Learning and Skills Council funded a study in 2009 that predicted completion rates though it did not have funding as an influencing factor15.
15 Hogarth, T., Hasluck, C., Gambin, L., De Hoyos, M. and Owen, D., 2009. Maximising apprenticeship completion rates. Coventry, Learning and Skills Council
26
Given the uncertainty, the assumption that completion rates are the same as in the past – or that they continue to rise according to the long-term trend - and that these are not affected by the economic cycle16, seem appropriate.
Completion rates tend to be based on an either/or basis. If there is an interest in understanding how much funding is required or why drop outs occur, it may be useful to consider the number of drop-outs at each month as an output of the model.
Including drop outs as an output provides an indication of the extent to which there might be any funding loss (ie the amount of any funding expended pre-completion where the apprentices do not complete the apprenticeship). However, this is not considered a crucial enhancement, and interest in it may depend on policy priorities.
Transition from frameworks to standards
The assumed trajectory of transition from frameworks to standards is based on transition dates estimated by the Education and Skills Funding Agency (ESFA). One advantage of this approach is that the speed of transition can be adjusted as transition dates are confirmed over time. It is suggested that progress is compared with the ILR data (eg the number of standards among all starts) as a consistency check.
It is further assumed that the SSA distribution is unchanged during the transition. According to the Apprenticeship Evaluation Survey17, the distribution has changed little between 2013 and 2016, covering a period after standards were introduced. However, because few starts were on standards and given that STEM and high-level apprenticeships are not much more expensive on standards than frameworks according to the cost assumptions, these groups may experience a faster transition in the future. Substantial changes are unlikely to occur in the short term, but an analysis of future releases of ILR data may provide evidence for whether this assumption should be updated.
16 A (rather dated) study showed that during period of economic growth completion rates could fall because apprentices left their apprenticeships to take up employment in better paid employment – see Winterbotham, M., Adams, L. and Lorentzen-White, D., 2000. Modern Apprenticeships: Exploring the Reasons for Non-completion in Five Sectors. RR217, London, Department for Education and Employment 17 Based on multiple releases of the Apprenticeship Evaluation: Employer Survey between 2013 and 2016.

27
Assumptions related to costs
In the case of the cost projections, averages are often used as a proxy because the amount and timing of payment can be different for each apprentice, which reduces the value of having this level of detail substantially. For example, monthly estimates may be less reliable when costs that are only available for the entire length of the apprenticeship are distributed evenly each month over the average duration of all apprenticeships.
The average (unit) cost assumptions determine the OPP and CP costs18 and consist of:
• Course costs (separately for frameworks and standards)
• English and Maths costs; and
• Learning Support cost.
Reformed framework and standard costs are derived from current framework costs and may be highly uncertain
A STEM uplift (40% for Level 2 and 80% for Level 3+) and a providers’ uplift for 16-18 apprentices are applied to the current framework costs, consistent with details set out in the apprenticeship funding guidance document. Although the providers’ uplift for 16-18 apprentices should also apply to 19-24 formerly in care or having an Education and Health Care plan according to the guidance, this is not accounted for in the cost assumption as the proportion of eligible apprentices is likely to be very small. According to information provided by DfE, the number of 19+ apprentices eligible for the providers’ uplift is only around 900 in the latest ILR data, equivalent to less than 0.2% of all starts in 2015/16.
Because standards had only been introduced recently and insufficient data are available to be representative, the standard costs are estimated by applying a 33% uplift for employer contributions and 15% for higher quality to the current framework costs. These uplifts are based on qualitative research and the expertise of the ESFA and are highly uncertain. As more apprentices start on standards, it would be possible to also derive standard costs from ILR data or assess the relationship between reformed framework costs and standard costs to produce better estimates.
English and Maths costs are developed according to government guidance, Learning Support costs are derived from historical data
The average cost of English and Maths courses is set at a flat rate of £471, consistent with the guidance on apprenticeship funding. A Learning Support rate of £150 per month
18 IP cost is fixed.
28
is also provided in the guidance, but is not currently used in the model. From a discussion with DfE, Learning Support payments are often not continuous and can be started and ended at any point during the apprenticeship. This makes it difficult to estimate a total cost from the official monthly rate which would be appropriate for all eligible apprentices. Therefore, an average Learning Support cost is derived from ILR data for the average length of the apprenticeship. Assuming policymakers put a greater focus on the annual cost sum than the monthly costs, this would have a small impact on the reliability of final results.
The impacts of the cost assumptions on total cost are highly sensitive to the duration and timing of payments, which often vary widely. This contrasts with the IP cost which is a fixed amount (£1000) paid in a fixed month (3rd or 12th month of study) to all eligible apprentices. For simplicity, the current model assumes all OPP cost components are spread evenly over the average duration of all apprenticeships.
The number of eligible apprentices is estimated for each type of payment
Most cost components, apart from English and Maths and Learning Support costs, apply to all apprentices in the relevant age group and level or are only dependent on the length of the apprenticeships. These assumptions are used to estimate the number of apprentices for which either English and Maths costs or Learning Support cost should be paid. The proportion of those studying English or Maths or both, and the proportion of those needing learning support, are derived from ILR data and are unlikely to change considerably under the new system.
An average duration of payments is assumed for all cost components
Due to data limitations, the average duration of apprenticeships is used as a proxy for the period over which Learning Support payments are made and the length of English and Maths courses as well. This is not the case in practice because English and Maths courses are usually shorter than apprenticeships and there is no fixed payment schedule for functional skills courses or Learning Support. The effect on the projections is likely to be insignificant for Level 4 and Degree apprenticeships because the proportion of starts studying English and Maths is small, but would make some differences for lower levels, particularly in the 24+ age group.
Nevertheless, it would be highly difficult to capture this level of detail. Even if estimates are available for the duration and timing of payments, trying to align them with other cost components which are distributed over the length of the apprenticeship would add additional complexity to the model without eliminating all uncertainties.
29
Refining the model
There is value to refine the model ex-post, after allowing some time for the policies to take effect. With data on actual outturn, it is possible to compare the data to model-derived apprenticeship costs and volumes subject to assumed impacts on starts, which could help refine the assumptions and improve the quality of the outputs. Improving the performance of the model in this way is a long-term and iterative task.
3.5 Concluding remarks The input data and assumptions for the model are explored and assessed in this chapter. The model relies on a small number of data sources, some of which are qualitative studies and surveys. The remaining data and assumptions are derived from the ILR data which is a frequently-published and reliable source to draw from for not only updating future projections but also assessing the quality of past projections and assumptions against actual outturns. Of importance and interest are assumptions related to the impacts of the levy and new funding rules on apprenticeship starts. These assumptions are highly uncertain because limited evidence is available. Further developments to these assumptions, for example creating additional dimensions for industry (where data are available), could allow the model to better capture the policy effects and potentially improve the precision of results. However, the underlying issue of a weak evidence base on which to base assumptions for the scale of impact at the additional level of detail could result in additional uncertainty associated with the model in the short-term.
30
4 Assessing the outputs of the model
4.1 Introduction The purpose of the model is to provide useful information for planning the apprenticeship system and allocating the government’s budget for apprenticeship training.
While the model at a conceptual level is considered to capture many attributes of the policy system, it is important to consider whether the level of detail provided by the model is sufficient for policymakers.
Section 4.2 describes our understanding of the model outputs. Section 4.3 explores in more detail the breakdown of different groups and types observed within the model, and whether there is scope for refinement in those areas. Section 4.4 explores potential additional sensitivity analyses that could be undertaken. Section 4.5 offers concluding remarks.
4.2 Forecasting apprenticeship volumes and costs
The projections could help the government identify policy levers and gain better control of its resources...
The projections of apprenticeships by different types of disaggregation, if modelled appropriately, can reflect how employers make decisions about employing apprentices in response to a policy or reform, and help identify outcomes understood to be driven by government policy. This information can be used to tailor government incentives to encourage participation among specific groups of interest, such as young people with low or no skills, people studying STEM subjects and/or high-level qualifications, SME employers and industries of critical importance to the UK economy. Some examples of such instruments that have been implemented in the latest funding rules are the 16-18 employer and provider incentives and the SME waiver.
Projections of demand for apprenticeships also give an indication of the funding requirements for other education and skills-related schemes, in addition to the likely cost of apprenticeship delivery. For instance, in comparing knowledge of the number and cost of apprenticeships with other forms of education and training (eg higher education, further education, traineeships, etc.), the effects of changes in one system another can be assessed and factored into policy design and financial planning.
31
… but should be interpreted with caution and monitored as more evidence becomes available
Although conceptually the model structure is sound, there is still a risk in relying on the model output to design apprenticeship policies ex-ante because of the high degree of uncertainty surrounding various assumptions and the lack of reliable quantitative evidence to support them. It is possible to use the model to conduct sensitivity analyses to understand the implications of uncertainty in the model (which are being conducted to some extent already).
4.3 The level of detail of model outputs Ideally, the model should be able to forecast apprenticeships to a high level of detail, as different areas of focus would be relevant across different policymakers, where specific areas of the policies may be of interest.
Level of study
One specific example is the unit of analysis. At the moment, this is the number of apprentices disaggregated by level and sector subject area (SSA). Ideally, it would be useful to gather data on the level according to:
• Level 2;
• Level 3;
• those apprenticeships that fall between Level 3 and degree level (e.g. at a sub-degree level such as the Level 4 apprenticeship in accounting)19; and
• degree level apprenticeships.
Inclusion of the latter two categories is important as policy appears to be directed at increasing participation at these levels in particular. To understand starts by level, data are required on completion rates and progression rates. Participation in an apprenticeship at any level is likely to comprise those who progress from, eg, a Level 2 to a Level 3 apprenticeship, and new starters. By knowing the completion rates and progression rates the projection the volume of future starts by level may be improved.
Age
There is also an age dimension to consider, which may be a more important driver than the level of study when considering participation by level of training. Those studying at
19 Gambin and Hogarth (2014)
32
levels 4 and above will be older. This suggests that an age dimension is required as follows:
• 16-18 years;
• 19-23 years; and
• 24+ years.
Funding is potentially affected by the age of the apprentice and there may be a need to consider interactions with, for example, the adult education budget. This is where understanding employer behaviour in more detail is perhaps important. There also needs to be consideration given to employer preferences for apprentices by age.20
Route of entry
Related to the age dimension is whether people entering apprenticeships are new recruits or existing employees.
Knowledge about the route of entry may provide insights to employer behaviour and guide policy developments
Over recent years, growth in apprenticeships starts has been driven in large part by increases in the number of apprentices aged 25 years and older at the commencement of their training. The evidence points to many of these being existing employees rather than young people recruited as apprentices (what might be considered the “traditional” model). Whether knowing the proportion of apprentices that are new recruits versus existing employees will improve the projections of future apprenticeship demand and its relevance for policy-making very much depends on the question of interest. If the policy issue is that of increasing the number of apprenticeship starts amongst 16-18 year olds, then this will need to consider employer behaviour with respect to the age at which they prefer to take on apprentices, and how they use the Levy to train people (where relevant). For example, to what extent will employers use their levy payments to train existing employees (as a form of continuing professional development and training) or train people expressly recruited as apprentices? An important issue is raised here about the trade-off to be made between:
• tractability (i.e. keeping the modelling as realistic as possible given the limited data available in relation to many issues of interest); and
20 Fuller et al. (2014)
33
• flexibility (retaining as much disaggregation as possible so that there is a degree of future proofing regarding policy interests which might arise over the medium-term and the option for more detailed scenario analysis).
Investigating this issue in more detail will involve reviewing how apprenticeship by subject can be categorised.
Other routes of entry that might be introduced in the future should also be considered
It is likely that with the introduction of the Technical education reforms following the implementation of the recommendations contained the Report of the Independent Panel on Technical Education21, there will be an increasingly attractive post-compulsory VET option open to young people. The extent to which this (a) competes for participants with apprenticeships and/or (b) provides a further means of entry to apprenticeships (e.g. perhaps in year two of a three-year apprenticeship) needs to be factored into the model at some point. This is likely to be a longer-term development; it may be important to consider incorporating a dimension to the modelling that recognises that in the future apprentices may commence their apprenticeship at some mid-point of the notional apprenticeship training period for a given standard.
Subject of study
Knowing the subject of an apprenticeship is important from a funding perspective given that this affects funding levels, but also from a wider perspective. There is a need, from a policy perspective, to understand the likely future demand for apprentices in certain subject areas – eg STEM – where policymakers are particularly keen to stimulate growth in apprenticeship starts.
It is recognised that disaggregating by SSA is probably the most appropriate means of doing so for the time being. But consideration needs to be given to whether this is likely to be the most appropriate classification in the future given the shift from frameworks to standards which also marks a shift, arguably, from a sectoral to occupational focus. Potentially there will be a large number of standards which is likely to prove inappropriate for planning purposes at the current level of disaggregation, as:
• many will be closely linked (possibly with major overlaps); and
21 http://www.gatsby.org.uk/uploads/education/reports/pdf/report-of-the-independent-panel-on-technical-education1.pdf

34
• if there are many standards the number of participants may well be small in some cases and, consequently, is likely to reveal a somewhat variable trend in participation.
At some point in the future there will be a need to a move away from SSA to an occupation based classification. The fifteen technical pathways identified in the Report of the Independent Panel on Technical Education probably provides the best basis for doing so as it appears to be shaping the structure of post-compulsory vocational education in the future.
With these considerations in mind, the ideal level of detail is presented in Table 1 below. To date, the model uses a disaggregation very close this this to estimate the future levels of participation in apprenticeships. Using breakdown like this provides considerable flexibility for both accommodating future policy issues.
Table 1: Disaggregation of unit of measurement
Age of apprentice Level Sector subject areas (or occupational equivalent)
Agriculture etc.
16-18 2 3 Sub-degree Degree level
19-24 2 3 Sub-degree Degree level
25+ 2 3 Sub-degree Degree level
Source: FGB
Geographical region
At the moment, the model has no regional dimension. Regions tend to be heterogeneous with respect to their employment structures and demands for skills, so it is not immediately apparent what a regional dimension would offer. If demand for apprentices was growing in the North East, it is questionnaire whether this would provide much insight to local policy-makers that might be more concerned with the demand for apprentices in, say, Hexham or Newcastle, specifically, but not the North East in general.
35
Any sub-national dimension to the model, therefore needs to be based on a classification of functional economic geography.
To include a regional dimension raises the following questions:
• Should the approach be ‘top-down’ where employer behaviour is considered to be same between areas but there is a different industry structure and overall demand for labour and skill across regions?
• Or should it be a ‘bottom-up’ model where there is recognition that behaviour differs at the local area level because of, for example, the way LEPs use the adult education budget to promote apprenticeships?
The ‘top-down’ approach is less ambitious – but still ambitious – and will require a large amount of data to produce meaningful and reliable estimates at a subnational level.
4.4 Sensitivity analyses As with any economic projection, there is uncertainty associated with the volume and cost projections produced by the model. Sensitivity analyses –assessing changes to the forecasts based on adopting a range of values for the inputs – can provide an indication to policymakers of possible realistic bounds in which the model outputs can lie.
The mechanisms to undertake sensitivity analyses is sufficient within the model
Within the model there is provision to undertake sensitivity analyses through changing the input assumptions and comparing the model outputs to the ‘central estimate‘ case. Given the structure of the model, where the policy impacts are inputs to the model, undertaking sensitivity analyses to explore the uncertainty of policy impact is straightforward to implement and easy to interpret (through the provision of summary results in a sheet within the Excel file). In this sense, the provisions to undertake sensitivity analyses within the model seem sufficient.
Sensitivity analyses have already been undertaken by DfE; ‘low‘ and ’high‘ scenarios were developed to assess the implications of changing assumptions and inputs. The ‘low’ scenario provides a projection of lower apprenticeship volumes (and costs), driven by zero growth in starts in levy employers, an assumption of lower impact (compared to the central projection) of co-investment on unmet demand on levy-payers, a larger negative impact of co-investment on starts for non-levy employers, and a slower transition from frameworks to standards. The ‘high‘ scenario uses assumptions of stronger policy impacts of start increases compared to the baseline, lower start decreases, and faster transition to standards.
36
Sensitivity analyse could be useful in analysing the baseline inflow projections as well
While the focus of the model is to identify the policy impact, there is value to adjusting the baseline projection for inflows as well. As mentioned in Chapter 3, there is scope to improve the baseline projection through a consideration of the relationship between employer demand for apprenticeships and the economic cycle. Economic uncertainty and wider economic prospects are considered to affect firms’ hiring intentions, and consequently form part of the uncertainty of these apprenticeship projections.
Sense-check the results with alternative forecasts
Comparing the projections produced in this model with external forecasts provides scope to ‘sense-check’ the outputs of the model. Working Futures, published previously by UKCES22, provide employment forecasts by qualification level, which could give a rough indication of the magnitudes of possible total employer demand in qualification levels relevant to apprenticeships. Sense-checking the generated apprenticeship volume projections against these values can enable an understanding of whether the outputs seem ’reasonable’.
In the absence of modelling comprehensively the supply side of an apprenticeship system, it would be useful to also consider sense-checking whether projections of apprenticeship starts seem reasonable given the supply of individuals willing to participate in apprenticeships. This could potentially be drawn from existing data, such as the Labour Force Surveys (which outline labour force by age), or choice studies23, which contain questions relating to the number of apprentices among student cohorts.
4.5 Concluding remarks The two main outputs of the model provide important information for the government to design and review its policies, as well as to plan its resources to deliver such policies and other objectives. This is possible particularly because of the detailed breakdown in the volume projections. The current model outputs contain many levels of disaggregation (by
22 The latest version is UKCES (2016) “Working Futures 2014 to 2024”, available at https://www.gov.uk/government/publications/uk-labour-market-projections-2014-to-2024. At present, it is unknown whether the Working Futures series, which covers development to all dimensions of the labour market, will continue. 23 One example is Taggart, B., Sammons, P., Siraj, I., Sylva, K., Melhuish, E., Toth, K., Smees, R., and Hollingworth, K. with Welcomme W. (2014), “Post age 16 destinations”, available at https://www.ucl.ac.uk/ioe/research/pdf/16-Destinations-RR.pdf.

37
age, level, programme type, employer type and SSA) that are important for policy analysis.
It may be beneficial to have the results disaggregated by other factors such as by route of entry and region. However, differentiation on these factors may be more challenging to observe and incorporate, and require reconsidering parts of the current approach and developing additional classifications. Some factors may be more feasible to implement than others (when accounting for issues such as data availability).
Sensitivity analyses is important in highlighting the uncertainty associated with the projections, and the provision in the model to conduct these calculations seems adequate. However, there is scope to consider additional sensitivity analyses, as well as to sense-check the projections with other findings or forecasts developed externally.
38
5 Conclusion
5.1 Modelling the new policy system
Models based on historical data are less useful because of recent and wholesale reform of policy
Economic models attempt to make predictions on the basis of observable human behaviour. It is recognised, however, that given the major changes that have been made to the apprenticeship system over the recent past that extrapolation of past trends – even using sophisticated econometric techniques – may provide no guide to the future.
At this stage, it is not clear – because the policies are so new – how employers will behave in the new demand-driven system. It is important, therefore, to develop a deeper understanding from an empirical point of view so that the model has the data it requires to more robustly predict stocks and flows of apprentices. This is complicated further by a need to make the model future proof, to a degree, so that it can accommodate future policy priorities or changes. A review of the model suggests this will not require a major overhaul of the model architecture.
It may be that there is scope, over time, to further develop both the conceptual understanding of what drives employer demand for apprentices (of different types) and the means used to derive estimates (cf the use of time series analysis). This is envisaged to be an iterative and incremental process, as more data become available.
However, understanding the drivers would not be an easy task. The model as it currently stands already contains several assumptions and estimates which are themselves difficult to derive from available evidence and highly uncertain. Trying to achieve a greater level of detail might require a considerable amount of additional data, which may not yet be possible. However, as long as the model is set up with the capacity to deal with as many variations in inputs as possible, the data could be readily accommodated.
5.2 Summary of the model’s strengths and weaknesses
The model design
The objectives of the project are to evaluate the model design and advise on alternative or additional approaches that can enhance the model.
Based on an assessment of the modelling approach, the model inputs and outputs, the current design performs well in several aspects. Despite the constraints on available
39
techniques and data to draw from, the stock-flow framework relates reasonably closely to the policy system.
The model is clearly structured, easy to follow with appropriate detail...
The approach has been widely adopted in labour market and skills forecasting and operates based on simple mathematical relationship. This makes it well-suited to the users of the model and the intended audience of the outputs, who are often policymakers and require a strong understanding of the logic to confidently inform their decisions. The modelling approach and the resultant transparency of the outputs have been emphasised by the DfE as a key influence on the preference for this approach over sophisticated econometric models or simulations developed in the past, and to that extent the ease of communication of the model results should be retained in any further developments of the model.
One of the most valuable properties of the model is the level of detail it captures, in terms of the assumptions, calculations and final output. The model output contains most types of disaggregation identified as meaningful in Chapter 4 and the approach of estimating elements of the final outputs separately also seems mostly appropriate.
… but there is scope to enhance the quality of projections
However, there exists additional options to enhance the model, particularly in the area of policy assumptions. Assuming that the impact of the new policies is one of the most important and interesting components of the model, the addition of, for example, a sectoral or regional dimension could improve the quality of forecasts significantly as evidence suggests the impact is unlikely to be uniform.
5.3 Recommendations for enhancements A number of options can potentially enhance the model, as discussed in the preceding chapters of this report. While the model is adequate given the lack of data or evidence, refinements can be made to alleviate some weaknesses, particularly those surrounding the uncertainty of the inputs. Some of these improvements can be implemented fairly quickly, while others will only be possible in the future, because they may require, for example, additional research or additional data collection.
To summarise, the improvements identified can largely be classified into:
• Improvements that we consider can be undertaken in the immediate future (because there is data available) and that we anticipate can improve the core roles of the model.
• Improvements that are not priorities but may be of interest.
40
• Long-term improvements which look to develop a more structural understanding of the impact of the new apprenticeship system, with a view to identifying and modelling more explicitly employer behaviour under the new system.
It is likely that some areas for improvements overlap across several categories. For example, developing a mechanism in the model to consider routes of entry based on existing data would be a possible short-term enhancement. However, in the long term, it may be worthwhile considering additional survey questions to collect more data to understand better the same issue.
Immediate priorities for refining the model
The anticipated improvements that are considered to improve the core roles of the model in the short-term pertains to the use of additional information or data. The recommendations belonging to this category are:
• Introduce some endogeneity to baseline apprenticeship starts, by considering its relation to the economic cycle (Chapter 3). The employer demand for apprenticeships, while remaining relatively stable over the last five years of historical data, are likely to change as employer demand for apprenticeships change. Hence, it would be useful to consider the relationship between employer demand for apprenticeships and aggregate economic performance (even if based on simple statistical relationships or correlation analyses), to adjust the baseline starts upon which the assumptions of the new policy impacts are built.
• Implement mechanisms to use data on progression and completion rates (Chapter 4). Information on progression rates and completion rates can help enrich projections on volumes on apprenticeship starts across different levels of study. If incorporated into the model outputs, it may also be of interest to policy-makers.
• Implement mechanisms to consider whether apprenticeships are given to existing employees or new recruits (Chapter 4). Available evidence indicates that some employers may use the levy funds to upskill their existing workforce. Distinguishing the proportion of apprentices who are new recruits and who are existing staff in the model outputs are policy-relevant and could inform a better understanding of employer behaviour.
Improvements to extend the scope beyond its current core role
The underlying evidence provides indications that there are additional avenues to explore that may provide interesting conclusions for policy-makers, or could provide benchmarks against which to compare existing projections. These enhancements are considered less essential improvements, but could nevertheless lead to interesting results. In some of
41
these instances, there may be a trade-off between incorporating additional detail that could be interesting for policy analyses, and the risk of introducing additional uncertainty in the short-term (given limited data availability):
• Check whether supply will meet demand, and consider the implications of a surplus or deficit (Chapter 2). A more explicit consideration of the supply of apprenticeship participants could inform whether supply can meet employer demand for apprentices. This would lead to a more comprehensive assessment of apprenticeship volumes. However, in the short term, a consideration of supply may add complexity, without necessarily improving the quality of the projections.
• Assess the implications of using multiple averages and ignoring variations in payment schedule of different cost components for the quality of monthly cost estimates (Chapter 3). This could enable sensitivity analyses on the impact on total costs for the fiscal year.
• Develop an alternative calculation of the baseline outflow rates (Chapter 3). This could be an interesting consideration as it motivates better understanding of apprenticeship participation (which may affect apprenticeship starts), and also the occurrence of funding loss, which may be of interest from a policy perspective. There may also be merit in identifying when the drop-out occurs, as this may affect funding demand.
• Tailor policy assumptions to different industries (Chapter 3). Preliminary evidence suggests that employers in some industries may be more sensitive to the policy mechanisms than those operating in other industries. Considerations of employer demand across different industries may help better model or make use of existing data and qualitative information on employer demand. This serves as a starting point; there is also benefit in commissioning new studies to specifically examine cross-industry variations in more detail. Such studies would be most useful in the form of estimating the impacts of industry characteristics. New studies that examine cross-industry variation would be a more long-term consideration.
• Create a regional dimension in the final output (Chapter 4). This could be a useful consideration when thinking about the distribution of apprenticeships and skills demand in specific areas of the country, enabling a more sub-national focus.
• Check whether the projection is broadly in line with external forecasts (Chapter 4). External consistency could be a useful ‘sense-check’ for the model, especially given the uncertainty of the outputs. In addition, it may be useful to review where the main discrepancies between the LTM projections and external forecasts lie.
42
Enhancements to consider for the longer term
The recommendations discussed so far cover enhancements using available data, building on the existing model structure and refining the assumptions already present. However, while these are identified as methods to enhance current projections, there may be additional scope to improve the model further once new data is released, or additional data collection efforts enable a better understanding of employer responses to the new apprenticeship system. The identified long-term improvements are:
• Make use of economic or statistical techniques to estimate parameters related to employer demand (Chapter 2). As more data and evidence reflecting the behaviour of employers, it would be possible to use economic and statistical techniques to try and understand employer behaviour.
• Estimate a ‘core’ and ‘variable’ demand for apprenticeships (Chapter 2). Establishing the core demand for apprenticeships would be useful in developing a model which differentiated employers based on their sensitivity to funding rules. This could potentially provide the basis for better understanding of employer behaviour and potentially (simple) ex-ante modelling exercises.
• Update existing assumptions and inputs as employer behaviour begins to be reflected in the data (Chapter 3). As new releases of the datasets used to develop the inputs become available, it is anticipated that employer behaviour under the new system will begin to be reflected in the data. It would be useful to use the new data to:
• derive standard costs or assess the relationship between reformed framework costs and standard costs to produce better estimates of standard costs;
• consider the impacts of the levy on outflow rates; • monitor transition speed and SSA distribution; and • provide data for Level 4+ separately for each level at which apprenticeships are
available. • Consider developing an alternative SSA or occupational classification
(Chapter 4). This is to enable a better reflection the distribution of standards after the transition from frameworks.
• Consider the inter-relationship of apprenticeships with other VET (Chapter 4). It could be interesting to consider the implications of this for apprenticeship routes of entry. While it is not an immediate priority, it may be a useful enhancement in the longer-term, especially if there are adjustments to policies that relate to this in the future.
Table 2 sets out possible data that can be used (and how) to implement these recommendations.

43
It is not anticipated that all the recommendations could or would be pursued. In addition, there would need to be a consideration of the trade-off between the tractability and complexity of the model, as there is merit in not over-complicating the model, while providing adequate level of detail for policy-makers with different priorities. With these considerations in mind, the next steps of the work would be to refine and prioritise which recommendations would yield the biggest improvements over different time horizons.
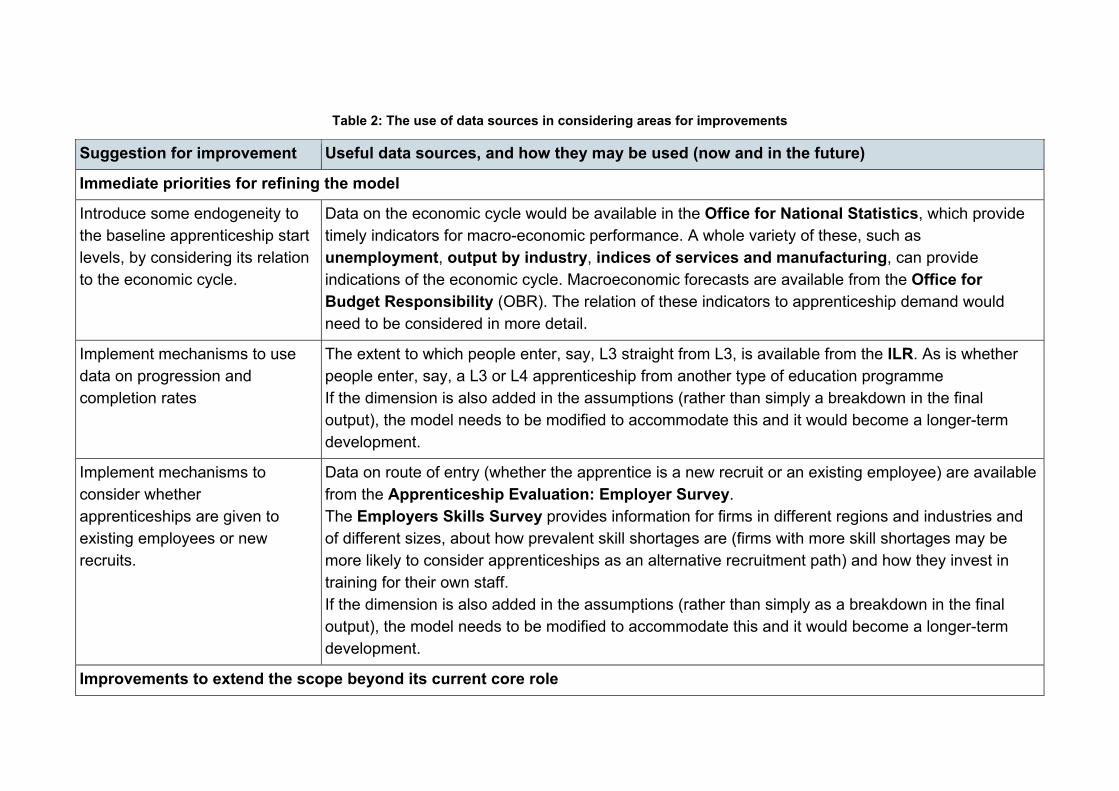
Table 2: The use of data sources in considering areas for improvements
Suggestion for improvement Useful data sources, and how they may be used (now and in the future)
Immediate priorities for refining the model
Introduce some endogeneity to the baseline apprenticeship start levels, by considering its relation to the economic cycle.
Data on the economic cycle would be available in the Office for National Statistics, which provide timely indicators for macro-economic performance. A whole variety of these, such as unemployment, output by industry, indices of services and manufacturing, can provide indications of the economic cycle. Macroeconomic forecasts are available from the Office for Budget Responsibility (OBR). The relation of these indicators to apprenticeship demand would need to be considered in more detail.
Implement mechanisms to use data on progression and completion rates
The extent to which people enter, say, L3 straight from L3, is available from the ILR. As is whether people enter, say, a L3 or L4 apprenticeship from another type of education programme If the dimension is also added in the assumptions (rather than simply a breakdown in the final output), the model needs to be modified to accommodate this and it would become a longer-term development.
Implement mechanisms to consider whether apprenticeships are given to existing employees or new recruits.
Data on route of entry (whether the apprentice is a new recruit or an existing employee) are available from the Apprenticeship Evaluation: Employer Survey. The Employers Skills Survey provides information for firms in different regions and industries and of different sizes, about how prevalent skill shortages are (firms with more skill shortages may be more likely to consider apprenticeships as an alternative recruitment path) and how they invest in training for their own staff. If the dimension is also added in the assumptions (rather than simply as a breakdown in the final output), the model needs to be modified to accommodate this and it would become a longer-term development.
Improvements to extend the scope beyond its current core role
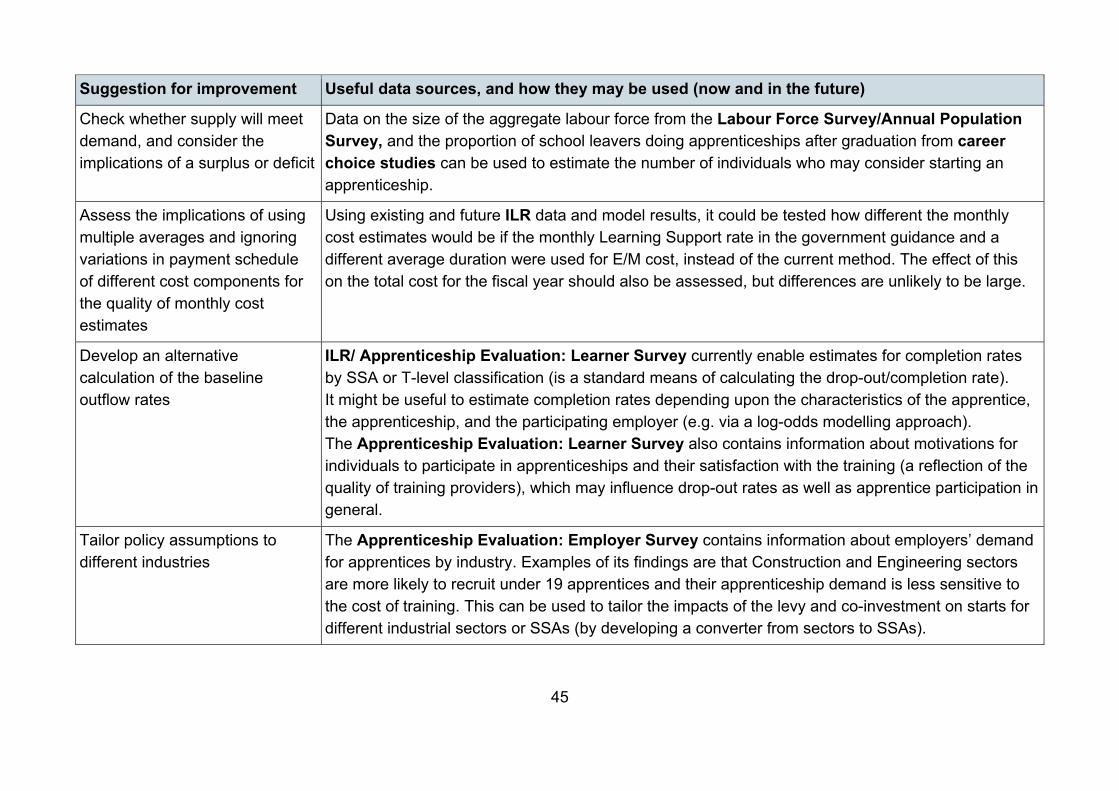
45
Suggestion for improvement Useful data sources, and how they may be used (now and in the future)
Check whether supply will meet demand, and consider the implications of a surplus or deficit
Data on the size of the aggregate labour force from the Labour Force Survey/Annual Population Survey, and the proportion of school leavers doing apprenticeships after graduation from career choice studies can be used to estimate the number of individuals who may consider starting an apprenticeship.
Assess the implications of using multiple averages and ignoring variations in payment schedule of different cost components for the quality of monthly cost estimates
Using existing and future ILR data and model results, it could be tested how different the monthly cost estimates would be if the monthly Learning Support rate in the government guidance and a different average duration were used for E/M cost, instead of the current method. The effect of this on the total cost for the fiscal year should also be assessed, but differences are unlikely to be large.
Develop an alternative calculation of the baseline outflow rates
ILR/ Apprenticeship Evaluation: Learner Survey currently enable estimates for completion rates by SSA or T-level classification (is a standard means of calculating the drop-out/completion rate). It might be useful to estimate completion rates depending upon the characteristics of the apprentice, the apprenticeship, and the participating employer (e.g. via a log-odds modelling approach). The Apprenticeship Evaluation: Learner Survey also contains information about motivations for individuals to participate in apprenticeships and their satisfaction with the training (a reflection of the quality of training providers), which may influence drop-out rates as well as apprentice participation in general.
Tailor policy assumptions to different industries
The Apprenticeship Evaluation: Employer Survey contains information about employers’ demand for apprentices by industry. Examples of its findings are that Construction and Engineering sectors are more likely to recruit under 19 apprentices and their apprenticeship demand is less sensitive to the cost of training. This can be used to tailor the impacts of the levy and co-investment on starts for different industrial sectors or SSAs (by developing a converter from sectors to SSAs).
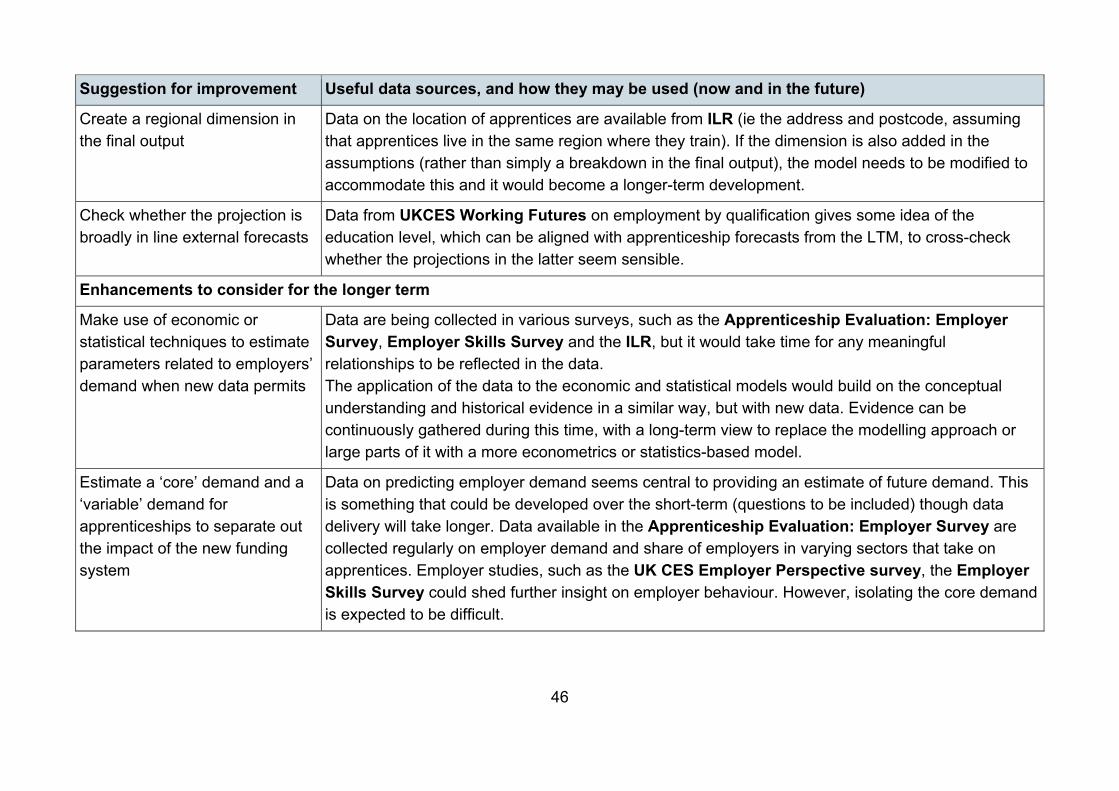
46
Suggestion for improvement Useful data sources, and how they may be used (now and in the future)
Create a regional dimension in the final output
Data on the location of apprentices are available from ILR (ie the address and postcode, assuming that apprentices live in the same region where they train). If the dimension is also added in the assumptions (rather than simply a breakdown in the final output), the model needs to be modified to accommodate this and it would become a longer-term development.
Check whether the projection is broadly in line external forecasts
Data from UKCES Working Futures on employment by qualification gives some idea of the education level, which can be aligned with apprenticeship forecasts from the LTM, to cross-check whether the projections in the latter seem sensible.
Enhancements to consider for the longer term
Make use of economic or statistical techniques to estimate parameters related to employers’ demand when new data permits
Data are being collected in various surveys, such as the Apprenticeship Evaluation: Employer Survey, Employer Skills Survey and the ILR, but it would take time for any meaningful relationships to be reflected in the data. The application of the data to the economic and statistical models would build on the conceptual understanding and historical evidence in a similar way, but with new data. Evidence can be continuously gathered during this time, with a long-term view to replace the modelling approach or large parts of it with a more econometrics or statistics-based model.
Estimate a ‘core’ demand and a ‘variable’ demand for apprenticeships to separate out the impact of the new funding system
Data on predicting employer demand seems central to providing an estimate of future demand. This is something that could be developed over the short-term (questions to be included) though data delivery will take longer. Data available in the Apprenticeship Evaluation: Employer Survey are collected regularly on employer demand and share of employers in varying sectors that take on apprentices. Employer studies, such as the UK CES Employer Perspective survey, the Employer Skills Survey could shed further insight on employer behaviour. However, isolating the core demand is expected to be difficult.
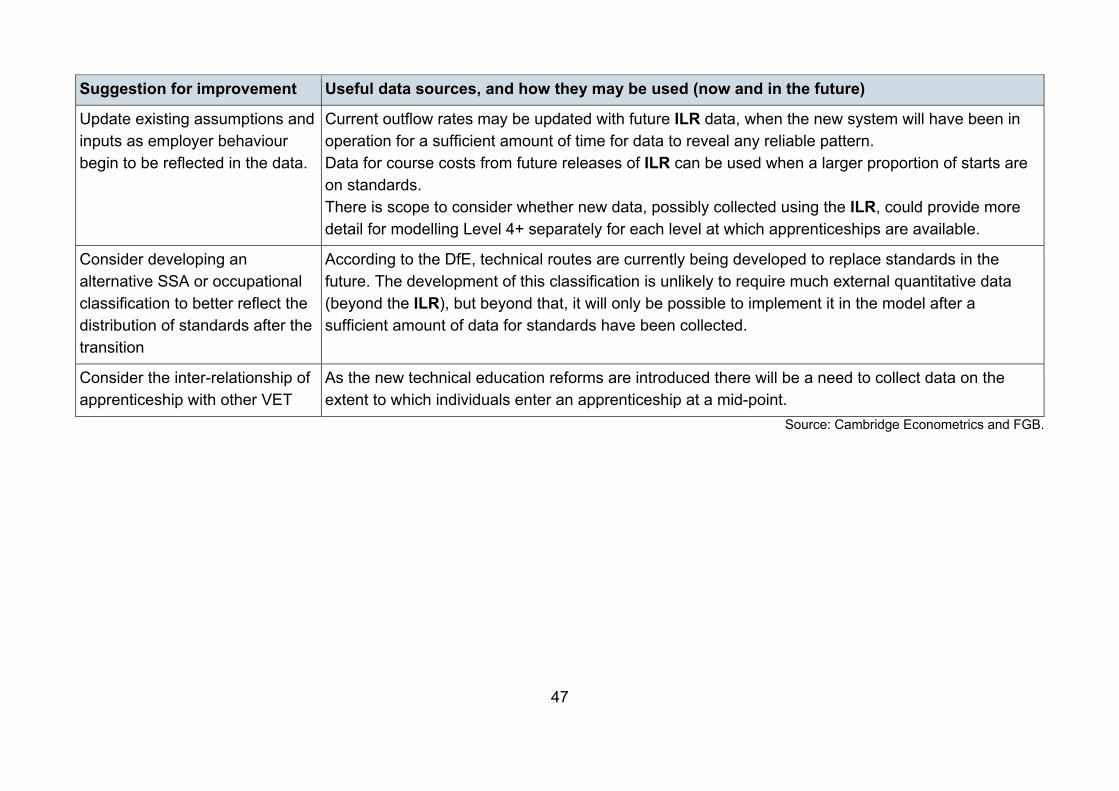
47
Suggestion for improvement Useful data sources, and how they may be used (now and in the future)
Update existing assumptions and inputs as employer behaviour begin to be reflected in the data.
Current outflow rates may be updated with future ILR data, when the new system will have been in operation for a sufficient amount of time for data to reveal any reliable pattern. Data for course costs from future releases of ILR can be used when a larger proportion of starts are on standards. There is scope to consider whether new data, possibly collected using the ILR, could provide more detail for modelling Level 4+ separately for each level at which apprenticeships are available.
Consider developing an alternative SSA or occupational classification to better reflect the distribution of standards after the transition
According to the DfE, technical routes are currently being developed to replace standards in the future. The development of this classification is unlikely to require much external quantitative data (beyond the ILR), but beyond that, it will only be possible to implement it in the model after a sufficient amount of data for standards have been collected.
Consider the inter-relationship of apprenticeship with other VET
As the new technical education reforms are introduced there will be a need to collect data on the extent to which individuals enter an apprenticeship at a mid-point.
Source: Cambridge Econometrics and FGB.
Appendix A Alternative modelling approach
A.1 Agent-based modelling
Agent-based modelling is founded on the logical behaviour of many agents generated through computer simulation
The behaviour of each agent is self-determined according to their individual characteristics and a set of decision rules, and their interaction are represented by mathematical equations, all of which are applied in a computer simulation. For policy analysis, policy assumptions are factored into the agents’ decisions as well as how such decisions affect the broad environment. In addition, a statistical distribution of the agents’ attributes is also specified.
ABM has been used repeatedly in various studies to model labour market interactions and to test specific policy impacts. Examples include Bergmann (1990)24 and Boudreau (2010)25. Of particular relevance is the work by Ballot and Taymaz (2001)26, which uses the MOSES27 model to assess the impacts of three different training policies (as ways of improving human capital) on the long-term performance of firms and the Swedish economy. One policy, which requires firms to spend a certain share of their wage bill on training, has parallels in approach to the apprenticeship levy under the new funding system.
Applicability to the new apprenticeship system
The ABM approach could theoretically be applied to understanding vocation training (and by extension the apprenticeship system). In such a version of the model, the Apprenticeship system (as well as other factors external to the policy system) would be determinants of employers’ demand for apprenticeships. For individuals who may go into apprenticeships, ABM would identify their personal circumstances and compare competing prospects of different firms and schemes before participation.
24 Bergmann, B., 1990. Micro-to-macro simulation: a primer with a labor market example. TheJournal of Economic Perspectives, 4 (1990), pp. 99-116. 25 Boudreau, J., 2010. Stratification and growth in agent-based matching markets. Journal of Economic Behavior & Organization, 75 (2010), pp. 168-179. 26 Ballot, G. and Taymaz, E., 2001. Training policies and economic growth in an evolutionary world. Structural Change and Economic Dynamics, 12 (2001), pp. 311-329. 27 “Model of the Swedish Economy”, developed by Gérard Ballot and co-authors, based on the original work in Eliasson, G., Olavi, G. and Heiman, M, 1976. A Micro-Macro Interactive Simulation Model of the Swedish Economy. Förvaltningsbolaget Sindex, 7 (1976).
49
ABM pays more consideration to supply and is a common tool for policy evaluation…
A major advantage of the ABM approach is that it can test the effects of policies. It allows for variations in policy impacts across different employers, without the need to specify exactly the magnitude of the impact (ie assuming that the impact on starts would be x%, which is a major difficulty for the current approach). It also pays more attention to supply-side factors, which could further enrich the understanding of the apprenticeship system.
…but it requires a large amount of data and functions to appropriately capture the agents’ relationships
However, ABM tends to be very data intensive as there are usually a large number of equation parameters to be specified. In this application, it would probably require more data than the current model. In addition, it requires a good understanding of the agents’ actions and interactions and reliable supporting evidence, both of which are not readily available currently.
The lack of data could be partly improvised by using repeated simulations and calibration to come up with estimates, but without more developed knowledge of what drives employers’ demand for apprentices, it remains difficult to design decision rules and select appropriate functions to characterise their behaviours.
Therefore, the current approach adopted for the stock-flow model of incorporating the impacts of employers’ behaviours and actions through explicit assumptions - seems more appropriate, given the relative simplicity to revise the assumptions of behaviour. In ABM, the impacts of policies on certain variables are measurable from assumptions of impact on different agents. In the context of the apprenticeship system, however, there is currently insufficient evidence on employers’ behaviour to develop and parameterise an equation of apprenticeship demand.
In addition, the number of interacting agents should ideally consider agents beyond just firms and individuals (such as training providers). These additional considerations further complicate what can already be considered as quite a sophisticated technique.
ABM requires technical expertise to undertake and interpret
ABM, being computation-based, also requires a certain level of technical expertise to comprehend and operate. Although the model is founded on a logical sequence of actions, the setting of functions and parameters to bring those actions together is likely to go beyond policy considerations and would not be straightforward to interpret.
50
Appendix B Description of the structure of the Long-Term Apprenticeship model
B.1 The model structure A detailed overview of the model structure with its main components is presented in Figure 2 below.
Mathematical representation of the model
For each month, the stock-flow relationship is represented by:
𝑆𝑆𝑆𝑆𝑆𝑆𝑆𝑆𝑆𝑆 𝑎𝑎𝑆𝑆 𝑆𝑆ℎ𝑒𝑒 𝑠𝑠𝑆𝑆𝑎𝑎𝑠𝑠𝑆𝑆 𝑆𝑆𝑜𝑜 𝑚𝑚𝑆𝑆𝑚𝑚𝑆𝑆ℎ 𝑆𝑆
= 𝑆𝑆𝑆𝑆𝑆𝑆𝑆𝑆𝑆𝑆 𝑎𝑎𝑆𝑆 𝑆𝑆ℎ𝑒𝑒 𝑠𝑠𝑆𝑆𝑎𝑎𝑠𝑠𝑆𝑆 𝑆𝑆𝑜𝑜 𝑚𝑚𝑆𝑆𝑚𝑚𝑆𝑆ℎ 𝑆𝑆 − 1 + 𝐼𝐼𝑚𝑚𝑜𝑜𝐼𝐼𝑆𝑆𝐼𝐼𝑠𝑠 𝑑𝑑𝑑𝑑𝑠𝑠𝑑𝑑𝑚𝑚𝑑𝑑 𝑚𝑚𝑆𝑆𝑚𝑚𝑆𝑆ℎ 𝑆𝑆 − 1
− 𝑆𝑆𝑆𝑆𝑆𝑆𝑆𝑆𝑆𝑆 𝑎𝑎𝑆𝑆 𝑆𝑆ℎ𝑒𝑒 𝑠𝑠𝑆𝑆𝑎𝑎𝑠𝑠𝑆𝑆 𝑆𝑆𝑜𝑜 𝑚𝑚𝑆𝑆𝑚𝑚𝑆𝑆ℎ 𝑆𝑆 − 1 × 𝑂𝑂𝑑𝑑𝑆𝑆𝑜𝑜𝐼𝐼𝑆𝑆𝐼𝐼 𝑠𝑠𝑎𝑎𝑆𝑆𝑒𝑒𝑠𝑠 𝑑𝑑𝑑𝑑𝑠𝑠𝑑𝑑𝑚𝑚𝑑𝑑 𝑚𝑚𝑆𝑆𝑚𝑚𝑆𝑆ℎ 𝑆𝑆 − 1
where
𝐼𝐼𝑚𝑚𝑜𝑜𝐼𝐼𝑆𝑆𝐼𝐼𝑠𝑠 = 𝑜𝑜(𝑏𝑏𝑎𝑎𝑠𝑠𝑒𝑒𝐼𝐼𝑑𝑑𝑚𝑚𝑒𝑒 𝑝𝑝𝑠𝑠𝑆𝑆𝑝𝑝𝑒𝑒𝑆𝑆𝑆𝑆𝑑𝑑𝑆𝑆𝑚𝑚 𝑆𝑆𝑜𝑜 𝑑𝑑𝑚𝑚𝑜𝑜𝐼𝐼𝑆𝑆𝐼𝐼𝑠𝑠 𝑜𝑜𝑠𝑠𝑆𝑆𝑚𝑚 ℎ𝑑𝑑𝑠𝑠𝑆𝑆𝑆𝑆𝑠𝑠𝑑𝑑𝑆𝑆𝑎𝑎𝐼𝐼 𝑑𝑑𝑎𝑎𝑆𝑆𝑎𝑎,𝑝𝑝𝑆𝑆𝐼𝐼𝑑𝑑𝑆𝑆𝑝𝑝 𝑎𝑎𝑠𝑠𝑠𝑠𝑑𝑑𝑚𝑚𝑝𝑝𝑆𝑆𝑑𝑑𝑆𝑆𝑚𝑚𝑠𝑠)
and
𝑂𝑂𝑑𝑑𝑆𝑆𝑜𝑜𝐼𝐼𝑆𝑆𝐼𝐼 𝑠𝑠𝑎𝑎𝑆𝑆𝑒𝑒 = 𝐶𝐶𝑆𝑆𝑚𝑚𝑝𝑝𝐼𝐼𝑒𝑒𝑆𝑆𝑑𝑑𝑆𝑆𝑚𝑚 𝑠𝑠𝑎𝑎𝑆𝑆𝑒𝑒 + 𝐷𝐷𝑠𝑠𝑆𝑆𝑝𝑝𝑆𝑆𝑑𝑑𝑆𝑆 𝑠𝑠𝑎𝑎𝑆𝑆𝑒𝑒
The level of inflow is assumed to be a function of historical projections and policy assumptions. The historical projections for the level of inflows are drawn from recent data, and provide an estimate of baseline apprenticeship starts.
The outputs of the model are:
• the volume of apprenticeships broken down by level, age, employer type, programme type and sector subject area, and
• the total cost of apprenticeship delivery to the government.
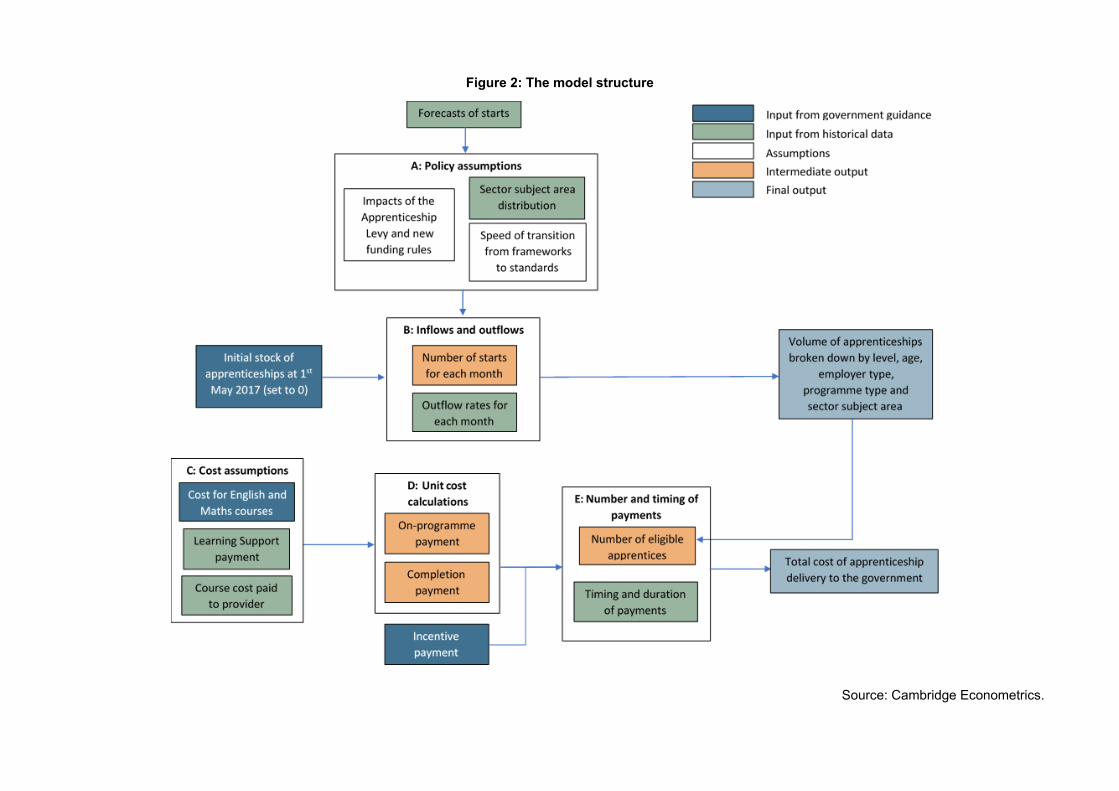
Figure 2: The model structure
Source: Cambridge Econometrics.
Policy assumptions
Policy assumptions (Box A in Figure B.1) are used in the model to capture potential impacts of recent policy changes that are not included in historical data28. They are informed by a mix of official government guidance, qualitative studies and surveys, DfE-HMRC matched administrative data and in-house expertise.
A variety of assumptions on policy impact affect apprenticeship starts at each period
Within the model, assumptions to represent policy impacts affecting apprenticeship start volumes are:
• the proportion of future apprenticeship demand that can be funded by expected levy contributions;
• the government top-up rate for funding future demand not met by levy contributions;
• the proportion of future apprenticeship starts at levy-paying employers;
• the levy introduction (as a fixed cost imposed on levy-paying employers); and
• the co-investment rate.
These assumptions are percentages applied to the baseline projection of inflows, where the percentages represent an assumption of the impact on starts in different age groups or with specific types of employers.
In addition, the following group-specific instruments are explicitly represented in the model as they are expected to influence the number of 16-18 starts (and consequently the final stock):
• the co-investment waiver for SMEs employing 16-18 apprentices;
• employer and provider incentives for 16-18 apprentices; and
• expected dates of complete transition from frameworks to standards.
Outflow rates are assumed to be the same for all employer types and programme types. In the context of the model, these could be considered exogenous (not determined within the model, and not affected by policy).
28 Of course, in time the policy effects will begin to be included in the historical outcomes so consideration will need then to be given to what the ‘above trend’ policy impact should be,
53
Finally, the total stock of apprenticeships for each month is calculated as the sum of all groups and the stock for each fiscal year is the sum of the stocks in all months.
Apprenticeship costs
Each type of cost is a multiple of the unit cost, the number of eligible apprentices (being either the total stock or an estimate using shares of the stock) and the period for which payments should be made. Apart from the total stock estimate which is an output of the stock-flow model, other components are based on assumptions developed from external sources.
The cost projections are produced based on the volume estimates and a set of cost assumptions
The total cost to government consists of on programme payments (OPP) to all current apprentices, incentive payments (IP) and completion payments (CP) to eligible apprentices and any outstanding OPP and IP (see Box D in Figure B.1). The OPP cost is made up of the course cost charged by the provider, the costs of English and Maths courses and Learning Support payments (Box C). For each of these cost components, an estimate is first calculated on a monthly basis and then aggregated to annual data.
Total OPP and CP costs are estimated in similar ways, by applying a unit cost to the number of months over which payments are made and the number of eligible apprentices (ie the total number of apprentices or the number of eligible apprentices, whichever is applicable) (Box E).

54
© Department for Education
Reference: DFE-RR733
ISBN: 978-1-78105-803-9
The views expressed in this report are the authors’ and do not necessarily reflect those of the Department for Education.
Any enquiries regarding this publication should be sent to us at: www.education.gov.uk/contactus
This document is available for download at www.gov.uk/government/publications