Embed Size (px)
Citation preview

Apprenticeship training in Spain –a cost-effective model for firms?
Prof. Dr. Stefan C. Wolter and Prof. Dr. Samuel Mühlemann
Ap
pre
nti
cesh
ip t
rain
ing
in S
pai
n –
a c
ost
-eff
ect
ive
mo
de
l fo
r fi
rms?


Apprenticeship training in Spain – a cost-effective model for firms?
A cost-benefit simulation study commissioned by the Bertelsmann Stiftung and the Fundación Bertelsmann
Prof. Dr. Stefan C. Wolter and Prof. Dr. Samuel Mühlemann

2
Preface 4
Summary 6
1 Introduction 10
2 The importance of cost and benefit in the decision to train apprentices 14
3 The cost-benefit model and its components 17
4 The simulation model, data and parameter assumptions 20 1. The simulation models 20 2. Parameters and further assumptions 23 3. Data 27
5 Simulating net training costs – a detailed analysis 29
6 Results of the cost-benefit simulations 38
I. Chemical industry 38 1. Occupation “Técnico Superior en Laboratorio de Análisis y
de Control de Calidad” 38 2. Occupation “Técnico en Planta Química” 41
II. Automobile industry 46 1. Occupation “Técnico Superior en Automoción” 46 2. Occupation “Técnico en Electromecánica de Vehículos
Automóviles” 49
III. Retail industry 54 1. Occupation “Técnico Superior en Gestión de Ventas y
Espacios Comerciales” 54
Contents
2

3
IV. Banking industry 58 1. Occupation “Técnico en Gestión Administrativa” 58
V. Food industry 62 1. Occupation “Técnico en Elaboración de Productos Alimenticios” 62
VI. Hotel industry 66 1. Occupation “Técnico Superior en Gestión de Alojamientos
Turísticos” 66 2. Occupation “Técnico en Servicios en Restauración” 69
7 Summary analyses of the results 74 1. Overall results 74 2. Company size 75
8 Conclusions and recommendations based on the analyses 77
Bibliography 80
List of Figures and Tables 81
About the authors 83
About us 84 Bertelsmann Stiftung 84 Fundación Bertelsmann 85
Workshop participants 86
Imprint 88
3
Contents

4
Vocational education is in vogue. Many countries worldwide, grappling with shortages of skilled workers and relentlessly high youth unemployment rates, are currently seeking reforms of their vocational education systems. A significant number of these countries have turned their attention to the apprenticeship training system, a form of vocational education where apprentices follow an in-company apprenticeship and a school-based education as part of the same curriculum.
For many politicians and business leaders across the globe, the appeal of this form of vocational education lies in its association with low youth unemployment rates. Learning their trade at the workplace, and not only in vocational schools, allows apprentices to gain work experience during their training which, in turn, facilitates their transition into the labor market. To date, countries as different as Brazil, China, India, Mexico, Russia and South Africa have already begun integrating features of apprenticeship training into their vocational education systems.
Despite this widespread interest in apprenticeship training, reforms often face a major obstacle: the reluctance of companies to engage in apprenticeship training. Companies often see apprenticeship training as a potentially negative investment. They fear losses. Making apprenticeship training a reality, thus, requires more than good intentions. It requires economic arguments: companies must be able to obtain net benefits from their investment in apprenticeship training.
Precisely for this reason, researchers in Switzerland and Germany – two countries with longstanding histories of apprenticeship training – have been calculating the costs and benefits of apprenticeship training for more than two decades. Their findings are conclusive: firms do benefit from apprenticeship training. But this fact doesn’t say anything about whether companies in other countries, with little or no experience in apprenticeship training, could also benefit from this system.
The Bertelsmann Stiftung in Germany and the Fundación Bertelsmann in Spain have therefore come together in an unprecedented attempt to simulate, in advance, the costs and benefits of apprenticeship training for companies in countries with no apprenticeship training tradition. The goal of such an ex ante simulation is to provide those countries interested in apprenticeship training with economic arguments, and to trigger a nuanced discussion about the introduction of apprenticeship training in multiple vocational education systems.
The present cost-benefit simulation study is the first of its kind, and it is specifically concerned with apprenticeship training in Spain. Spain has recently introduced apprenticeship training to its vocational education system, yet few
Preface

Preface
5
companies have taken it up so far. We think that this study can be a stimulus to engage companies in apprenticeship training in Spain. At the same time, this study can lead the way for other countries to produce similar cost-benefit simulations in their attempts to convince businesses to adopt apprenticeship training. After all, the success of apprenticeship training depends on the participation of companies.
We are obliged to Prof. Dr. Stefan C. Wolter and to Prof. Dr. Samuel Mühlemann for authoring the study. Their knowledge of vocational education and their experience in the cost-benefit analysis of apprenticeship training systems have made the present study a reality. We are also thankful to the participants of the workshops that were conducted during the research process and to the University Pompeu Fabra in Barcelona for providing the researchers with the necessary labor market data from Spain.
Francisco Belil Clemens WielandVice-President Senior Project Managerof the Fundación Bertelsmann Learning for Life Program Bertelsmann Stiftung

6
Summary
Apprenticeship training is a form of vocational education characteristic of German-speaking countries. The most salient feature of this form of vocational education is the combination of school-based instruction with work-based learning. This combination of in-class and in-firm learning is often credited as an antidote against youth unemployment: receiving training from a company allows apprentices to gather working experience, which in turns makes their transition into the labor market more efficient.
In recent years, therefore, the persistence of high youth unemployment rates in many industrialized countries has brought the apprenticeship training model to the attention of policymakers and business leaders. In order to introduce an apprenticeship training model, governments must convince firms to engage in vocational training by providing on-the-job training for apprentices. Providing such training, however, is an investment, and like any other investment, it entails costs for the firms that provide it – yet it could also entail benefits. Convincing firms to engage in apprenticeship training, then, depends on whether they are able to generate more benefits than costs from providing such training.
Since the outbreak of the last economic crisis in 2007-2008, the apprenticeship training model has also caught the attention of Spanish political leaders concerned with the country’s high rates of youth unemployment. The first pilot projects took place in 2011, and in 2012, apprenticeship training became part of Spain’s vocational education system. However, the involvement of Spanish firms has remained rather low, which is probably due to firms’ inability to obtain net benefits off apprenticeship training under the current training system. This study therefore seeks to determine under which circumstances Spanish firms could benefit from participating in apprenticeship training, that is, whether the introduction of modifications in Spain’s current model could result in net benefits for Spanish firms. More specifically, this study tries to answer the question whether an average Spanish firm, in Spain’s current economic environment, could expect a net benefit from implementing an apprenticeship training model similar to the one employed by Swiss firms.
In order to determine whether Spanish firms could obtain net benefits from participating in such an apprenticeship training system, it is necessary to calculate what costs firms would bear and what benefits they would gather. For this purpose, a cost-benefit model of apprenticeship training is employed that was originally developed to calculate the costs and benefits borne by firms operating in Switzerland. Over the last two decades, researchers have used this cost-benefit model to gather data on the costs and benefits of apprenticeship training at all stages of the business cycle and for hundreds of occupations. The research based on this model, however, calculates the costs and benefits borne by firms that have been involved in apprenticeship training for decades. The study at hand, on the contrary, seeks to simulate the potential costs and benefits that

Summary
7
firms could bear if an apprenticeship training model similar to the Swiss one were to be introduced in the Spanish vocational education system.
Based on the current standard model of vocational training in Spain, three simulation models are therefore developed that extend the current Spanish training model to resemble the conditions of the Swiss apprenticeship training model.
• Model 1 comes closest to the Swiss apprenticeship model, where apprentices enter training at the end of compulsory schooling as an alternative to general full-time schooling. In this model, apprentices spend 1,600 hours in class and 600 hours in formal in-firm training, in addition to the time spent working (total formal training: 2,200 hours); the whole program lasts three years.
• Model 2 comes closest to the actual situation in Spain, where students enter a two-year qualification program after having completed upper-secondary education as an alternative to studying at university. In this model, apprentices spend 1,000 hours in class and 600 hours in formal in-firm training, in addition to the time spent working (total formal training: 1,600 hours); the whole program lasts two years.
• Model 3 is an extension of Model 2 and is again based on the assumption that apprentices enter the program after having completed general upper-secondary education. In this model, however, apprentices spend the third year of training receiving more formal in-firm training than they would have under Model 2 (approx. 200 hours more; total formal training: 1,800 hours); the whole program lasts three years.
These three models are applied to a selection of 10 different occupations from the following six sectors of the Spanish economy: the chemical industry, the automobile industry, the retail industry, the banking industry, the food industry and the hotel industry. For each of the 10 chosen occupations, the authors have calculated the costs and benefits of apprenticeship training under each of the enumerated simulation models. In addition, each model has been applied to two different wage scenarios: one in which apprentices receive €300 per month and another one where they receive €530 per month. It is important to note that apprentices receive their pay every month for the duration of the program, regardless of whether they spend more time at work or at school.

Summary
8
The cost-benefit model employed in this study, furthermore, consists of three components: first, the costs that arise during the training period (e.g., training personnel, apprentice wages); second, the benefits that firms can generate during the training period by letting apprentices substitute unskilled and skilled workers (e.g., saved wages of unskilled and skilled workers); and third, the benefits that a firm can potentially generate after the training period has ended (e.g., the hiring costs of recruiting new workers from the labor market). The values of each component are calculated by using data from the most recent cost-benefit studies of apprenticeship training in Switzerland, and are complemented with Spanish labor market data.
The cost-benefit model is applied to each of the selected occupations in the following manner. First, the net training costs for the three simulation models are calculated. Second, the hiring costs are calculated. Third, a sensitivity analysis of apprentices’ relative productivity with regard to skilled employers is conducted, in order to account for changes in net training costs under different assumptions of apprentice productivity. Fourth, a break-even analysis is conducted, showing the maximum apprentice wage that firms can afford to pay in order to offer apprenticeship training at zero costs. Fifth, variations of net costs by firm size are discussed. In order to provide the reader with the rationale behind the calculation of costs and benefits of apprenticeship training, one occupation has been selected for detailed analysis, namely the store clerk. Each of the mentioned steps in the application of the cost-benefit model is elaborated for the store clerk with the purpose of facilitating the comprehension of the cost-benefit analyses of the remaining nine occupations.
The results of this simulation study suggest that participation in apprenticeship training could indeed entail net benefits for Spanish firms by the end of the training period, albeit with significant differences across sectors and occupations. A clerk apprentice in the banking sector following a three-year apprenticeship program (Model 3), for example, can yield a net benefit of over €4,000 to its training firm, while a store clerk apprentice yields well over €8,000 of net benefits. Moreover, in one same sector, the net benefit obtained from training an apprentice can differ by a ratio of 2 or even more between different occupations, depending, for example, on the share of productive tasks carried out by apprentices. In the hotel industry, for example, training an apprentice to become a hotel management specialist can result in a €13,000 net benefit, while the best case for training a cook in hotels and restaurants only results in a €6,000 benefit.
The results of this study also show that even when firms cannot break-even by the end of the training period, employing apprentices after graduation can allow them to recoup their investment in a short period of time. In many occupations, firms would incur net costs by the end of an apprentice’s training, yet these costs

Summary
9
are often below the monthly costs of a firm for a skilled worker (approx. €3,000), which makes it very feasible to balance the loss by employing the apprentice after the training has been completed. More importantly, the results also show that even when the costs exceed €3,000, €6,000 or as much as €12,000, firms could still benefit from apprenticeship training by employing apprentices. This is can be attributed to the saved hiring costs: when providing apprenticeship training is expensive, it usually means that hiring workers from the labor market or from other firms is expensive too. If apprenticeships under certain occupations result in high net costs by the end of the training, firms can still obtain benefit by directly hiring their apprentices after graduation, thus saving on significantly high recruitment and hiring costs.
In general, the study also shows that three-year programs (Models 1 and 3) yield more benefits than two-year programs (Model 2), as they allow apprentices to spend more time in formal in-firm training as well as at work, thus increasing their contribution to the firm’s productivity. Low-wage scenarios (€300/month) also tend to produce more benefits than high-wage scenarios (€530/month) as they reduce the investment made in the provision of training. It is significant, however, that most apprenticeships can be offered profitably with a high salary: it means that apprenticeship training can be shaped in such a way that it is both profitable for firms and attractive for young apprentices.
Finally, larger firms would benefit more from apprenticeship training than smaller ones. In some sectors and occupations, a linear relationship can be identified, with larger firms generating net benefits of up to €10,000, while small firms with fewer than 10 workers can even incur net costs. This pattern is not surprising and would lead to a situation in which the probability of offering training is much higher for medium-sized and large companies compared with very small companies; smaller firms would therefore have to be supported in their efforts to provide apprenticeship training.
10
1 Introduction
Persistently high youth unemployment rates in many industrialized countries have brought the apprenticeship training models that are predominantly used in the German-speaking countries (Austria, Germany and Switzerland) to the attention of policymakers, business leaders, academic scholars and the public. Apprenticeship training is now considered to be a possible and potentially powerful solution to the problem of protracted and difficult transitions for youths from school to the labor market. Involving companies early on in the design of educational programs, apprenticeship training can be an effective means of resolving the persistent mismatch between the skills provided by an educational sector and the skills needed in a labor market. However, apprenticeship training requires more than simply consulting with businesses when setting up and running such an education system. The type of apprenticeship training observed in German-speaking countries goes a step further by delegating part of the educational responsibilities to companies, thereby making them both users and providers of education. Nonetheless, providing education in addition to workplace experience comes at a cost. Companies must pay for in-firm trainers, and apprentices disrupt workers during regular work by requiring assistance in learning assigned tasks. Therefore, unlike the general education system, companies play a role in defining and operating the apprenticeship education system, but they also bear some of the costs of such a system. Thus, from a government perspective, the question is not only whether the public is willing to let firms play a decisive role in education, but also whether the government will find enough companies willing to bear the corresponding costs and offer training places.
Fortunately, apprenticeship training also generates benefits for companies. In the ideal case, apprenticeship training leads to short-term and long-term benefits that outweigh costs and the training company yields a net benefit from training apprentices. To establish a sustainable and high-performing apprenticeship training system, governments and companies must create framework conditions that allow a sufficiently large number of firms to offer training positions that generate enough benefit to cover training-associated expenditures. Realizing net benefits by cutting training expenditures (i.e., less instruction time at the workplace), however, is unsustainable because potentially qualified apprentices might prefer to pursue an alternative, general education track or enroll in full-time vocational education.
Since the outbreak of the last economic crisis in 2007-2008, political leaders in Spain have shown an increased interest in apprenticeship training and have promoted its implementation in many ways. However, the number of training positions in companies that can be considered apprenticeships has remained rather low. With some notable exceptions, most companies have remained on the sideline of the educational system, either unwilling or reticent to offer training positions. The slow expansion of the “dual” system (dual refers here to
Engaging companies in vocational education
Requirement: benefits of training
Spain: increasing interest, low participation
10

11
Introduction
the fact that training takes place in both schools and firms) leads to the following question: why have companies not shown more enthusiasm and initiative so far? There are two possible explanations. The first is that the current system does not lead to sufficiently favorable economic outcomes for those companies involved in the dual system. Non-participation is therefore perfectly rational from the purely economic point of view of a single company. A second possible explanation is that firms could train apprentices under the current conditions and generate net training benefits, but they are unaware of these opportunities and use their resources differently.
The purpose of this study, however, is not to analyze whether the first or second explanation better explains the low involvement of firms in the current apprenticeship model. Such an analysis is not possible for at least three reasons: First, there is no single training system currently in place. Instead, there are several variations of a dual system, which makes it difficult to determine which system should be analyzed. In addition to regional variations, there are also firm-specific variations of the models in use that would need to be taken into consideration. Second, companies that are currently active in training surely have unique characteristics to be considered and have particular motivations for their engagement. Thus, non-active companies differ from active ones in important ways that are relevant in deciding whether to train or not. In this case, analyzing the cost effectiveness of existing programs would not yield findings useful as an indicator of what happens to non-training companies who decide to begin offering training. Finally, although companies do not always fully understand what a new opportunity may bring, it is hard to imagine that the majority of companies decide against apprentice training out of sheer ignorance, thereby missing out on a significant business opportunity. In other words, aspects of the current system likely lead to a negative economic outcome for too many firms that would otherwise be willing to train apprentices. For these reasons, analyzing the current system(s) in Spain is less likely to provide compelling information in convincing Spanish business leaders to become active in apprenticeship training. More promising is an examination of whether the introduction and application of a proven system in Spain would generate enough benefits to convince a substantial number of firms to participate in apprenticeship training
This study provides answers to this question, that is, whether the introduction of an apprenticeship training system that resembles an existing successful system
Difficulties of explaining low participation
Introducing a foreign successful model
11
12
Introduction
elsewhere would also lead to satisfactory results in the case of Spain.1 To conduct this analysis, one needs firm-level data from successful training systems to be able to compare the outside experiences with the Spanish reality and environment. Currently, such data exist only for Germany and Switzerland, we therefore use data from the latter in our simulations for Spain.
Swiss firms have developed training strategies that allow them to recoup their training investments in the short run, as an average Swiss firm that trains apprentices realizes a net benefit by the end of the training program (see Strupler and Wolter 2012 for details). Although the benefits that occur after the training period (when apprentices remain in the training company as skilled workers) are also relevant, as we show in this study, many companies are currently inactive because of the fear that competitors in the labor market will poach their trainees and that firms will therefore lose their training investment. Thus, even if Spanish labor market regulations protect training firms from poaching to a certain extent, it will prove difficult to convince a large number of companies that are currently not training apprentices to change their strategy if one cannot provide them with evidence of training yielding net benefits in a reasonably short period.
In summary, this study analyzes whether an average Spanish company in the country’s current economic environment could expect a net benefit when training apprentices in a similar manner to Swiss firms. For this purpose, we have selected ten different occupations from six different economic sectors for which we simulate the net costs (or benefits) of apprenticeship training by using relevant parameters of comparable training programs in Swiss firms2 and combining them with Spanish labor market data. Such calculations rely on a number of assumptions, and the study therefore provides sensitivity analyses to show how the results react to changes in specific assumptions. Finally, because not all specifications of apprenticeship training models will automatically lead to the desired outcome, that is, a net benefit for the training company at the end of the training period, we also provide simulations for different combinations of parameters (different models) and break-even analyses for some of the parameters. As in other parts of the education system, there is hardly a “one-
1 The authors of this study would like to thank in particular the following people who have contributed significantly to the success of this whole undertaking: First, Clemens Wieland at the Bertelsmann Stiftung, whose enthusiasm and optimism created the opportunity for this study to be initiated and to succeed. Second, we would also like to thank the entire team at the Fundación Bertelsmann in Barcelona and in particular Francisco Belil and Guillem Salvans, who contributed in numerous ways to this study by sharing with us their immense knowledge and passion for the cause of dual education in Spain. Most particularly, we would also like to thank them for their tremendous efforts in motivating Spanish CEOs and companies to participate in the workshops and to convince them to share their experiences and data with us as well as to validate our preliminary findings. Finally, we would also like to thank Philipp Hafner (University of Munich) and Katharina Jaik (University of Zurich) for their precious research assistance before, during and after the workshops in Spain.
2 Readers wishing to know more about the Swiss apprenticeship training system may find useful information in this documentation (SERI 2015).
Return on investment
Benefits for Spanish companies?

13
Introduction
size-fits-all” model for all firms, occupations and economic sectors, and the simulations will help to identify which model specifications are best suited for which applications.
14
The willingness of firms to train apprentices can be described as the conditio sine qua non for the existence of an apprenticeship training system. No matter how much a government may want an apprenticeship training system, without firms willing to take on the apprentices, such a system cannot be established. Therefore, it is crucial to understand the motivation of firms to invest in apprenticeship training and the conditions under which more firms can be persuaded to participate.
Investment in training, from the perspective of firms, is similar to any other business investment, which means that firms invest if they expect the investment to generate a sufficiently high return (ROI), and firms forgo investments if they expect a loss. Empirical analyses3 of successful apprenticeship training models show that the sustainable engagement of firms mainly depends on training regulations, labor market regulations and institutions, and the education policy of the government. One example of the importance of the latter is policies for admission to general education (high school and university) and how it is financed. If the standards for admission into general schools are low and the financing of general education is predominantly public, then firms are confronted with a situation in which most of the talented youth will take the general education route, thus leaving only the less talented for the apprenticeship market, which would in turn lead to a situation in which the training costs for firms might simply be too high (because less talented apprentices need more mentoring) and the productivity of potential apprentices too low. Even if net costs of training were bearable, firms might decide not to train because the skill level of potential apprentices would still be lower than the expected skill level of university or high school graduates after a short period of training. In other words, policymakers have many ways of not only directly influencing the cost and benefits of training for firms but also influencing the costs of alternative methods of recruiting skilled workers that could compete with the decision to train apprentices.
One critical point, as with any other investment, is the fact that the costs of training arise early in the investment period, whereas the benefits come later, sometimes too late – or not at all. The latter may occur because other firms poach (“steal”) trained workers or that workers leave after training for further education, or for other reasons. In such cases, the net investment at the end of the training period is no longer covered by the benefits that would have been generated if the trained worker had stayed with the company. The uncertainty about the timing and scope of the benefits, or even the risk that there will be no benefits at all is therefore pivotal in a firm’s decision to take part in the
3 Wolter and Ryan (2011) provide an extensive description of the theoretical foundations for analyzing firms’ decisions to take part in apprenticeship training. Muehlemann and Wolter (2014) provide a literature overview of cost-benefit studies and empirical issues related to the question of how the costs and benefits of apprenticeship training influence firms’ training behavior.
Companies’ motivations for investment
Return on investment
Risk of losses
2 The importance of cost and benefit in the decision to train apprentices
14

15
The importance of cost and benefit in the decision to train apprentices
apprenticeship training market. A sustainable training system must therefore find ways to reduce the risk that the benefits of training fail to cover the firms’ investment. Looking at the existing models, one can see that, broadly speaking, there are two different ways of doing so.
One is the Swiss example, where the average training firm covers its training expenditure by the time the official training period ends, so that the apprentice is free to leave the company. In this situation, the threat of poaching is no longer a factor in the firm’s decision to train because even if the apprentice leaves the company the day after graduation, the firm does not incur a loss. The challenge for firms in Switzerland that offer apprenticeships is therefore finding ways for apprentices to generate sufficiently high benefits for the firm during the training period while at the same time guaranteeing the provision of high-quality training. The benefits mainly depend on training regulations that allow apprentices to spend much of the training period with the firm, working and contributing to productivity.
The other example is the German apprenticeship system, where labor market regulations at least partially protect the net investments of firms by reducing the labor market mobility of graduate apprentices (see e.g., Muehlemann et al. 2010). Rigid employment protection rules (such as regulations that make dismissals costly or almost impossible) not only secure stable employment for the employed, they also reduce the labor market mobility of workers because employment protection reduces the number of job vacancies in the labor market. In such a situation, firms which offer training can rely on the likelihood that their own graduates will remain with the training company because the probability of them receiving external job offers is low, since potential competitors have to retain their own workforce. Thus, a net investment in apprentices is at least partially protected from poaching. If labor markets are deregulated, however, firms must switch to training policies that allow them to reduce the net costs of training or even break-even to reduce the risk of losing their investment to firms which don’t offer training. The behavior of German training firms during the last decade shows that this is indeed how firms react (see Jansen et al. 2015). The fact that over the course of the last decade German firms have adopted a training strategy that increasingly resembles the strategy applied by Swiss firms provides an additional justification for using Swiss data for the simulations in this study.
In addition to systemic parameters that influence the average training pattern and overall national strategies, one can also observe differences in training strategies between firms of different sizes, sectors, occupational profiles or geographic locations that relate to differences in expected post-training benefits.
Very small firms are usually unable to offer future employment to (all of) their apprentices and must therefore break-even by the end of the training period;
Securing benefits during training (Switzerland)
Reducing workers’ mobility (Germany)
Other influential factors
Company size
15

16
The importance of cost and benefit in the decision to train apprentices
otherwise, they almost certainly lose their investment. The lower the chance that such firms break-even by the end of training, the fewer apprenticeships they offer. Because small firms are the backbone of the economy in many countries, the possibility of achieving net benefits within a short timeframe is essential for the promotion of apprenticeship training.
Firms that offer the possibility of training in sector- or occupation-specific skills are more protected against the poaching of their trained apprentices, unable to utilize their skills when moving to another sector or firm. In particular, skilled workers in technically advanced firms operating at the forefront of technological progress find themselves in this position.
The degree to which a firm can protect itself against the loss of skilled workers also depends on its geographic location. Although few firms require uniquely firm-specific skills, their geographic location might be sufficiently distant from other firms requiring similar skillsets that most employees would regard a modest salary compensation as inadequate compensation for the cost of commuting or moving to another region. However, the majority of firms operate in regions of dense economic activity or even sectorial clusters that come with a high risk of multiple employers looking for the same skillsets. In this situation, even larger firms need the possibility of breaking even before training ends as an incentive.
Finally, even where national framework conditions allow firms to earn a net benefit from apprenticeship training, this is rarely the case for all firms (see Wolter et al. 2006). Individual firms differ considerably in their potential for running apprenticeship programs profitably. The challenge at the national level is to make framework conditions favorable enough for a sufficiently large share of companies to offer training positions. There will always be companies which find recruitment of skilled workers from other firms cheaper than training their own personnel internally (see Blatter et al. 2015). However, the higher the probability that a training company finishes a training program with a net benefit, the lower the likelihood that the decision to train will be affected by other firms’ recruitment strategies.
The following chapter provides an overview of the major elements in the costs and benefits arising from apprenticeship training that firm must take into consideration when calculating the rate of return on investment.
Sector and occupation
Geographic location
Beneficial framework conditions
Cost and benefit elements

17
A cost-benefit model which simulates the net costs (or benefits) from a firm perspective has been applied several times over the last two decades in Germany and Switzerland to gather representative data on the costs and benefits of apprenticeship training. The model has been refined over time but has remained stable and most of its elements have been supported by research findings since its conception in the 1970s. The lessons which arise from applying the model – in different countries during different phases of the business cycle and in hundreds of different occupational profiles covering most economic sectors in a modern economy – help us to identify the most relevant parameters for simulating net cost scenarios for a dual apprenticeship system outside of the German-speaking countries, in this case for Spain.
The model consists of three components for which we use data from the most recent Swiss survey, complemented by Spanish data. The three components are costs arising during the training period, benefits that firms can generate during the training period by letting apprentices substitute for skilled or unskilled workers, and finally the benefits that a firm can potentially generate after the training period by filling vacancies for skilled workers with their own apprentices.
The cost component of apprenticeship training (as described in Muehlemann and Wolter 2014, p.3) comprises the following categories:
1. Apprentice wages: regular wage payments, irregular wage payments, compensation for food, travel costs or living expenses;
2. Cost of training personnel: cost of full-time, part-time and external training personnel for the period in which they are unable to work productively;
3. Recruitment and administrative costs: wage costs for administrative tasks and recruitment related to apprenticeship training;
4. Infrastructure costs: machinery/appliances for apprentices at the workplace, rent for premises required for training, cost of premises and infrastructure for company training centers;
5. Cost of supplies: cost of supplies used for non-productive activities in the workplace, books, learning software and videos, working equipment;
6. Other costs: fees (e.g., exams), capital costs for recruitment/administration related to apprenticeship training, external courses, duties and taxes to third parties.
Background of the model
Model components
Cost components
3 The cost-benefit model and its components

18
The cost-benefit model and its components
The benefit component of apprenticeship training comprises the following categories:
1. The value in having apprentices perform skilled tasks is calculated as the time that apprentices spend on such tasks multiplied by the wage that the firm would otherwise need to pay skilled workers. That value, however, is offset by the productivity of an apprentice relative to that of a skilled worker;4
2. For unskilled tasks, the value to the firm of having an apprentice perform such work is simply the wage that the firm would otherwise pay an unskilled worker.5
Ultimately, the difference between the costs and benefits of training results in net benefits (or net costs) for the firm at the end of the training period.
As the previous chapter details, there are numerous reasons that firms generally require net benefits or to at least break-even over the training period; any investment not covered by then is at risk if the trainee moves to another company or quits for other reasons.
For those firms that can expect all or at least some of their apprentices to stay with them at least for a while, an additional benefit comes into play. Firms that can fill vacancies for skilled workers with their own apprentices save on hiring costs, enough to justify even a net investment at the end of the formal training period. Although hiring an apprentice is costly, hiring skilled workers is usually much more expensive. In the cost-benefit model, we therefore also calculate the following costs that would arise from recruiting a skilled worker in the external labor market:
1) Search costs (job advertisements, job interviews, etc.);
2) Cost of initial lower productivity compared to internally trained workers, with external hires having to learn firm-specific processes and technologies;
4 So if an apprentice takes twice as long to complete a certain task than a skilled worker, the relative productivity is 50%, which means that the value to the firm of having an apprentice performing skilled work is half of the wage costs associated with employing a skilled worker.
5 Although unskilled work is not the goal of apprenticeship training, it can be an important element – at least at the beginning of the training period – for both the firm and the apprentice. For the apprentice, it matters little whether he or she learns behavioral skills which are important in the work environment, such as punctuality and precision, through skilled or unskilled work. More important is that the apprentice learns these skills effectively and efficiently as early as possible. For the firm, having apprentices doing unskilled work offers an opportunity to improve the cost-benefit balance. As apprentices usually need some learning time before they can be entrusted with skilled tasks, an absence of unskilled tasks would make apprentices unproductive, thereby increasing the net cost and risk for the firm, which may refrain from offering training positions in the first place. But while there is a benefit in apprentices performing unskilled tasks, quality assurance systems should ensure that they are not just used as cheap labor.
Benefit components
Net benefits or break-even
Hiring costs (skilled workers)
18

19
The cost-benefit model and its components
3) Costs that stem from external training of newly hired workers;
4) Disruption costs that occur when external hires interrupt the work of the other workers for instruction or assistance.
None of these costs apply if the firm fills its vacancy with an apprentice trained by the firm.
In this study, we are able to provide representative figures of the potential scope of these saved hiring costs in Spain for each occupation analyzed. However, these estimates represent the upper limit of what firms would save in reality, as it is impossible to know ex ante how successful Spanish firms are in retaining apprentices after training. The degree of loyalty to the firm is of course decisive. If, as is the case in Switzerland, two-thirds of apprentices leave their company after the end of training, firms need to train three apprentices to fill one vacancy (where apprentices leave the company voluntarily). In other words, the saved hiring costs for one vacancy have to be high enough to compensate for the net cost of training three apprentices.
Saving hiring costs in Spain?
19
20
In this chapter, we provide arguments for the scenarios in which we have simulated the costs and benefits of potential apprenticeship models from a company perspective. These scenarios are all extensions to the current standard model in Spain rather than the existing Spanish model(s). The arguments for our scenarios are based on experience in Switzerland. They address issues such as the varying duration of apprenticeships in different occupations, why salaries should be extended beyond the period that apprentices are actually working at the company, and the quality, quantity and specificity of company training as reflected in the hiring costs of skilled labor. We will also provide information on issues that do not directly relate to the cost-benefit simulations but that do relate to the actual outcomes, such as selecting apprentices and matching firms and apprentices in the apprenticeship market. These issues relate to our assumptions about the parameters in the models and so call for an explanation. We conclude this chapter with information about the sources of the data used in our study.
1. The simulation models
We calculate the costs and benefits of apprenticeship training for three different scenarios (models). Model 1 comes closest to the Swiss apprenticeship model, where apprentices enter training at the end of compulsory schooling as an alternative to further full-time education. Model 2 comes closest to the actual situation in Spain, where students tend to enter a two-year qualification program after upper-secondary education (the “bachillerato”) as an alternative to university. Finally, Model 3 is an extension of Model 2 and is again based on the assumption that apprentices enter the program after having completed general upper-secondary education. This allows more flexibility, as Model 2 might be too rigid in two respects. First, a two-year program may not suffice for apprentices to acquire the required skills, not because of a lack of time spent in formal training but rather because of a lack of time spent practicing newly learned skills in the workplace. Second, firms that provide (and pay for) a substantial amount of workplace training may fail to break-even within a two-year training period because apprentices do not spend enough time with the company.
We base all of our calculations regarding instruction times on Spanish training programs for the occupations which correspond to our simulations. Each plan is based on a two-year program totaling 2,000 hours of training and work experience, of which formal instruction in vocational schools represents around 1,600 to 1,700 hours, depending on the occupation, with the remaining time taken up by work experience in a company. With a few exceptions (e.g., learning technical English), the training plan only covers vocational skills, based on the assumption that the individuals have acquired the necessary general skills before entering the apprenticeship program.
Chapter overview
Three models
Calculations based on Spanish model
4 The simulation model, data and parameter assumptions

21
The simulation model, data and parameter assumptions
The detailed assumptions in the three models for which we calculate the costs and benefits follow (see Table 1 for an overview).
In Model 1, we propose a training duration of three years, the minimum duration of many apprenticeship programs in Switzerland for the occupations for which we calculate net costs in Spain. This model would be most appropriate for school-leavers after compulsory schooling, who, as is the case in German-speaking countries, follow an apprenticeship program rather than full-time schooling options.6 In contrast to the curricula used in Spain, the Swiss and German training programs therefore also leave room for learning general skills such as mathematics and foreign languages.
To follow the Swiss model as closely as possible, we make the following assumptions: Of the approximately 1,600 hours of vocational skills currently required by Spanish training programs, 600 hours are delegated to companies, taught by in-house trainers, which corresponds to approximately five hours of instruction time per week spent at the firm. The rationale for delegating so much of the vocational program to companies is as follows: depending on the technologies used in the occupation, the quality of in-house training should be superior to the comparable training in a vocational schools, as companies are usually at the forefront of technological developments. Moreover, public authorities experience substantial savings on expensive machinery and tools for vocational schools. This also benefits apprentices, as they get to use the most up-to-date equipment. An additional benefit of in-house training is that it is usually one-on-one, whereas schools tend to teach the same skills in classes which can exceed 20 students. Proficiency in some skills requires more practical exercises; having one trainer instruct one apprentice (or a very small group) seems much more appropriate than training a full class.7
The 600 hours of vocational education outside the school, however, is matched by an equivalent amount of time of general education, again taught in vocational
6 The four main arguments for “early” apprenticeship programs are: 1) School-leavers, faced with three or more years general schooling and thus at risk of dropping out of the educational system after compulsory schooling, are more likely to remain in the education system. Switzerland, which has one of the highest completion rates of upper secondary education in the industrialized world (OECD), shows that this strategy can be successful in reducing dropout rates. 2) As apprentices are generally young and still living with their parents, they can be paid less than older students; even low pay compares favorably to the prospect of earning nothing while attending a full-time school program. 3) Companies prefer younger apprentices because they can be more easily sensitized to the work and the company’s requirements and realities. 4) Working with adults and being tutored by older apprentices in a real-life environment stimulates the learning motivation of young adults who may have had problems with self-motivation in a school environment, leading to better learning outcomes.
7 Often, 1-to-1 teaching in companies is the standard, with many companies only training one apprentice at time. Larger companies usually train multiples apprentices in each occupation in a given year and can group apprentices, which explains why economies of scale favor larger companies when it comes to training apprentices.
Model assumptions
Model 1
More in-company training
Additional general education

22
The simulation model, data and parameter assumptions
schools.8 The amount of time spent in school therefore remains the same (approximately 1,600 hours), but it is spread over three years. Additionally, the apprentice receives 600 hours of formal vocational instruction at the company, equaling around five hours’ instruction per apprentice each week that the apprentice is not in school, totaling approximately 2,200 hours of formal instruction time. The remainder of the time in the company is used for both working and practicing and therefore acquiring additional on-the-job skills through informal learning.
Conversely, Model 2 targets individuals of around 18 years of age who already hold general upper-secondary qualifications and can therefore forgo general education during the apprenticeship. Like the current vocational training system in Spain, which is largely school-based, the duration for this model is just two years. As with Model 1, apprentices receive a total of 1,000 hours of formal (non-general) education in vocational school, the remaining 600-700 hours of formal instruction taking place in the company, totaling 1,600 hours of formal vocational instruction.9
It is important to note here that while companies offering apprenticeships in Switzerland believe that an apprentices learn while working, Swiss legal obligations require apprentices to receive a minimal amount of formal in-house teaching. Consequently, in all three models we allow for the hours of formal training transferred from schools to companies represented by the cost of in-house trainers. Companies are expected to provide their share of training at their own cost. However, they also have the opportunity to train the apprentices in their technologies and business processes and so save on expensive adaptation costs (compared with hiring someone directly from school or from the external labor market). The apprentices would, as they do in Model 1, spend the rest of their time at the company working, practicing and therefore acquiring additional vocational skills through informal learning as well as work-related social skills.
Finally, Model 3 is identical to Model 2 for the first two years of training but includes an additional year. While Model 2 has apprentices accumulating the necessary formal human capital in the first two years, there is relatively little remaining time for productive work at the company. In many occupations,
8 The 600 hours of general schooling in firms is less than students acquire in upper secondary school and therefore insufficient to qualify for higher education. However, the extensive amount of vocational training means students certainly qualify for professional tertiary education programs. The same is true of Austria, Germany and Switzerland. In Switzerland, for example, apprentices can spend an extra year on general education either during or after the apprenticeship, which can then lead to a professional baccalaureate. This certification allows students to continue their studies at a university of applied sciences. However transferring to a classic, academic university, would require another year of general education.
9 Delegating some 600 hours of training to the companies brings Model 2 close to the “dual” form of vocational education currently used in Spain with the difference that our simulations assume that apprentices are unproductive for the 600 hours because they are formally instructed by paid in-house trainers.
Model 2
Costs of in–company training
Model 3

23
The simulation model, data and parameter assumptions
therefore, companies Model 2 would be unprofitable. Moreover, while apprentices acquire substantial theoretical knowledge, companies may want to provide additional general and specific training so that their apprentices can successfully perform necessary tasks. For this and other reasons, apprenticeship programs in the German-speaking countries last at least three years in duration and, for almost all technical occupations in Switzerland, four years (3.5 years in Germany). Even if we assume that – in contrast to Swiss apprentices – Spanish apprentices start training having completed general education at the upper-secondary level, two years of vocational training is not enough to acquire the necessary vocational skills and attain the performance level of a fully trained skilled worker. In the additional year that the apprentices spend in training, they receive the equivalent amount of formal in-house training as an apprentice in an average Swiss company in a comparable occupation (approximately 200 hours on average). Moreover, an apprentice could work and continue to practice for approximately 1,500-1,600 hours in the last year of training, thereby accumulating important professional skills as well.
Table 1: Assumptions of the baseline simulation models for net training costs in Spain
Model 1 Model 2 Model 3
Three years of training Two years of training Three years of training
1,600 hours formal education in vocational schools
1,000 hours formal education in vocational school
The first two years as for Model 2
Approx. five hours per week of formal training for each apprentice (600 hours in total) + workplace experience
Approx. 600 hours of formal workplace education + workplace experience
In the third year, companies provide formal workplace training similar to a Swiss company in a comparable training occupation (approx. 200 hours on average)
Total amount of formal school and company training: approx. 2,200 hours
Total amount of formal school and company training: approx. 1,600 hours
Total amount of formal school and company training: approx. 1,800 hours
2. Parameters and further assumptions
Apprentices’ wages
In countries with apprenticeship traditions, companies pay apprentices’ wages for every month of the training period, whether the apprentice is working for the company or attending vocational school. Conversely, in countries where work experience is viewed as a complement to a predominantly school-based vocational education, apprentices are usually only paid for the time they spend as interns at the company. While being at the firm in the latter form of training mainly serves the purpose of acquiring work experience, the wage level during these months is also usually higher than the average apprentice’s salary in the classic apprenticeship model. One could see the two models of paying apprentices
Two models of apprentice pay

24
The simulation model, data and parameter assumptions
as roughly equivalent, meaning that paying less over a longer period equals paying more over a shorter period. However, even if the total value in terms of cash payments to apprentices is the same, there may be other important differences.
In particular, paying an apprentice for the duration of the training program radically changes the nature of the relationship between the company and the apprentice in many ways. This is already apparent before the apprentice starts working for the company. While a company pays an apprentice a monthly salary throughout the training period, the apprentice is considered a regular employee. Employees are recruited and hired by companies rather than schools. In addition to other benefits, this type of recruitment helps match companies and apprentices, in terms of both quality and quantity. In quantitative terms, if numerous school-leavers are looking to train in occupation A, but companies need apprentices for occupation B, allowing companies to recruit apprentices would lead to more training in occupation B. Conversely, in a school-driven system, schools would have an incentive to offer (too) many training places in occupation A, thus creating a mismatch in the labor market later on. As for quality, allowing companies to recruit their apprentices at the beginning of the training period encourages companies to focus on the individual match and select suitable candidates from the pool of applicants. In the school-driven model, even where there is no mismatch in quantitative terms, companies may select different apprentices than those emerging from school programs. As a result, when subsequently confronted with a pool of potential interns, companies are no longer willing to offer internships, even when they have vacant training places (for suitable candidates).
Moreover, the fact that the apprentice is responsible to the company from the moment he or she has signed the training (and work) contract is crucial. Even apprentices who spend the majority of their time in school at the beginning of the training period are subject to monitoring and potential intervention by the company. For the schools, the employer replaces parents as point of contact, and employers ensure that the content and quality of school instruction matches their expectations. The employee-employer relationship in this type of apprenticeship also has a positive impact on the apprentices’ motivation and loyalty to the company.
Finally, should the company pay the apprentice less than an intern, it has to recognize that the apprentice is not at the company solely to work but is also entitled to formal instruction during the entire training period.
For these and other valid reasons, we base all our calculations on the assumption that companies pay their apprentices monthly. In the two baseline scenarios, we calculate costs with monthly payments of either €300 or €530. These levels
Monthly wage = better matching
More loyalty and motivation
Right to training
Monthly wage: two levels
25
The simulation model, data and parameter assumptions
were observed in some Spanish regions (although only for the period of the internship). In the Swiss case, our proposed salaries are in the range of average salaries paid to Swiss apprentices in the relevant occupations (adjusted for the overall difference in wage levels between Switzerland and Spain). Additionally, it should be pointed out that a Spanish apprentice in our scenarios, even at a monthly rate of €300, earns substantially more over the two years than an intern in a dual vocational program in Spain. From the apprentice’s perspective, the situation would be less financially favorable when comparing the total earnings in a three-year program (Models 1 and 3) than a situation where he or she graduates from a two-year “dual” program and then enters a fully paid occupation. However, this scenario would only be possible if the current two-year programs all lead to full employment at high salary levels – which not only depends on the state of the Spanish labor market but also the perceived quality of the current two-year dual programs.
In Switzerland, individual companies set apprentices’ pay; apprentice earnings therefore depend on the company and occupation. Apprentice pay also depends on individual productivity, and many companies offer apprentices performance-based salaries. Although we calculate the base models with the two fixed salary levels (€300 and €530) to make them more easily comparable, we also calculate the break-even salary for each occupation. The break-even salary is the monthly apprentice wage that a firm must pay to break-even, that is, one which covers all training-related expenses (including apprentice pay) through the productive contribution of the apprentice.
Performance levels (relative productivity)
The advantage of our simulation model is that we do not have to assume equal productivity levels in Spain and in Switzerland – even though the occupations are very similar. Taking the relative productivity levels of Swiss apprentices and skilled workers as an indication of the learning progress of Spanish apprentices merely assumes that Spanish companies train their apprentices such that they progress in relation to Spanish expectations (i.e., the productivity level of Spanish skilled workers) just as they do in Switzerland. The relative measure also has the advantage that differences in productivity between companies and regions reflected in salary differences for skilled labor are taken into account. Firms operating at lower productivity levels can only afford to pay lower salaries; consequently, the benefit of an apprentice’s work is also lower. However, we assume – as observed in the Swiss and German data – that apprentices reach comparable levels of relative productivity regardless of the absolute levels of productivity in given companies or occupations (Dionisious et al. 2009). In other words, a company trains apprentices to reach the same productivity level as a skilled worker.
Break-even salary
Using relative productivity

26
The simulation model, data and parameter assumptions
Although the differences in absolute productivity between Swiss and Spanish firms in the same economic sector are irrelevant for our calculations, we need to address one potential source of bias. Competition can mean school systems attract more talented and motivated students, while apprenticeships are left with the rest. In this situation, companies may decide not to train at all and instead simply wait for the students to leave high school or university and then offer traineeships. For companies that wish to offer a dual program, this situation generates higher net costs because either the apprentice productivity levels are lower, or companies are forced to spend more money on internal training to reach comparable productivity levels – or both (see, e.g., Muehlemann et al. 2013). In other words, our calculations assume that Spanish and Swiss firms attract apprentices of comparable ability.
Thus, we assume for the three-year programs (Models 1 and 3) that the levels of relative productivity correspond exactly to the levels observed in similar three-year programs in Switzerland. In Model 2, we calculate a lower bound for the net costs of training and assume that the progress in relative productivity between year 1 and year 2 corresponds to the progress made by a Swiss apprentice between year 1 and year 3 of the training period. One argument in support of this assumption is that unlike Swiss apprentices, the typical Spanish apprentice in these programs has already graduated from upper-secondary school.
Given that the true level of productivity of apprentices in Spain is not only difficult to forecast but that there is also considerable natural and likely considerable heterogeneity among apprentices and training companies, we complement our simulations with sensitivity checks on different levels of relative apprentice productivity. That way we can at least simulate whether deviations from our parameters that correspond to the Swiss averages would lead to sizeable changes in the net cost of training.
Other expenditures
In addition to training expenditure, other personnel costs as well as the apprentices’ salaries, companies that train apprentices also incur other costs: tools, spare materials and machines that are either bought for training purposes or not used exclusively for production. While personnel costs and apprentices’ wages can be calculated using Spanish wage data, expenditure for tools and machinery in Switzerland are difficult to transfer to the Spanish context because of differing price levels in the two countries. Therefore, we assume that the remaining expenditures other than personnel costs and apprentices’ salaries correspond to the same share of these costs in terms of a skilled worker’s salary in Switzerland. Although there is some uncertainty attached to this assumption, its impact on our simulations is limited, with personnel costs and apprentices’
Potential bias
Same level of relative productivity
Sensitivity analysis
Similar to Switzerland

27
The simulation model, data and parameter assumptions
wages already constituting between 85% and 90% of the total gross cost of training in Switzerland.
3. Data
We use three major sources for the data in our simulations.
The first source is the most recent cost-benefit survey data from Switzerland (see Strupler & Wolter 2012), which collected data on the costs and benefits of apprenticeship training from a representative set of approximately 2,500 Swiss training firms. This study was the third to in a decade in Switzerland (see Schweri et al. 2003 and Muehlemann et al. 2007 for previous results), and the results remained remarkably stable over the business cycle.
This source is used to obtain the data regarding the following investments in training and productive contributions of apprentices: training hours per week that companies invest per apprentice, hours spent by other personnel (such as HR services) involved in hiring and training apprentices, share of unproductive time spent by apprentices in the company (largely spent in practice), hours that apprentices substitute for unskilled workers while in the company, hours apprentices substitute for skilled workers while in the company, apprentices’ productivity levels in a given year of relative to skilled workers in the same occupation, and finally, investment in spare materials, tools and machinery and other expenses related to apprenticeship training. All of the relevant data are averages for Swiss companies training apprentices in occupations comparable to the Spanish examples.
The second data source is Spanish wage data for the economic sectors and occupations for which we run our simulations.10 Due to data limitations, the salary data for some occupations and sectors was grouped to ensure a sufficiently high number of observations. To calculate the productive contribution of apprentices, we used the wages of average skilled workers working in the same occupation as well as the wages of unskilled workers in the same economic sector. In some cases, the data showed that the average unskilled worker earns the same or slightly less than the average skilled worker in the same economic sector. The most likely explanation is a difference in years of tenure between an average older unskilled worker and a younger skilled worker. As our simulations assume the productive contribution of an apprentice performing unskilled labor to be equal to what a firm would have to pay to an unskilled worker hired today on the labor market, in these cases, we used entry salaries for workers between 16 and 25 with
10 The authors would like to thank the members of Jaume García Villar’s team at the University Pompeu Fabra in Barcelona for collecting and providing the wage data for the sectors and occupations portrayed in this study.
Sources
Cost-benefit survey data (Switzerland)
Investments and returns
Spanish wage data

28
The simulation model, data and parameter assumptions
only compulsory education rather than actual salary levels. We believe that this approach reflects the current situation of companies in Spain much better than the salary structure of currently employed workers.
For training and personnel expenses, we used salary data for skilled workers in the relevant occupation as well as other categories of workers (such as HR personnel) involved in the training or management of apprentices.
We collected the third data source, hiring costs for new workers, ourselves as there is no relevant Spanish data available. Because the labor market situation differs considerably between Switzerland, Germany and Spain, we were also unable to use existing Swiss or German data. The data was collected at the end of each sectorial workshop.11 Company representatives filled in our questionnaire, which helped us calculate the approximate expenditure for recruiting new workers, the costs associated with paying them full salaries before they are fully productive, the costs (if any) for external or internal training measures and disruption costs arising from new workers interrupting their colleagues’ work. This data is by no means representative of the whole of the Spanish economy, but it nonetheless provides a good indication of the differences between sectorial labor markets with respect to the availability of adequately trained workers. The hiring costs that we were able to calculate based on the responses provided represent the upper bound of hiring costs saved per trained apprentice. In reality, the amount of money saved per trained apprentice is lower, as apprentices may leave the company, triggering more hiring costs. A company’s savings on hiring costs per trained apprentice depends on many factors, such as labor market conditions for graduate apprentices, apprentices’ loyalty to the company, and internal opportunities for apprentices. Experience in Germany and Switzerland show that larger companies with internal labor markets have higher takeover rates than small firms, and companies with high amounts of company-specific knowledge are better able to retain their apprentices than those using standard technologies and business models. The exact amount of saved hiring costs can therefore lie anywhere between zero and one hundred percent of potential savings (i.e., observed hiring costs).
11 The six sectorial workshops each lasted half a day. The participants, between half a dozen and a dozen representatives of companies from these economic sectors, were presented with the initial simulations for occupation(s) in their sectors, along with additional explanations. Participants were asked to validate the assumptions used for these simulations and were able to check the impact of alternative assumptions and parameters on the net costs of training. The research team was present in the workshop with the computer-based tool to calculate the net-costs and to make additional simulations on the spot. The end of the workshop was used to elicit information on the cost of recruiting skilled workers.
Training and personnel expenditures
Hiring costs data
29
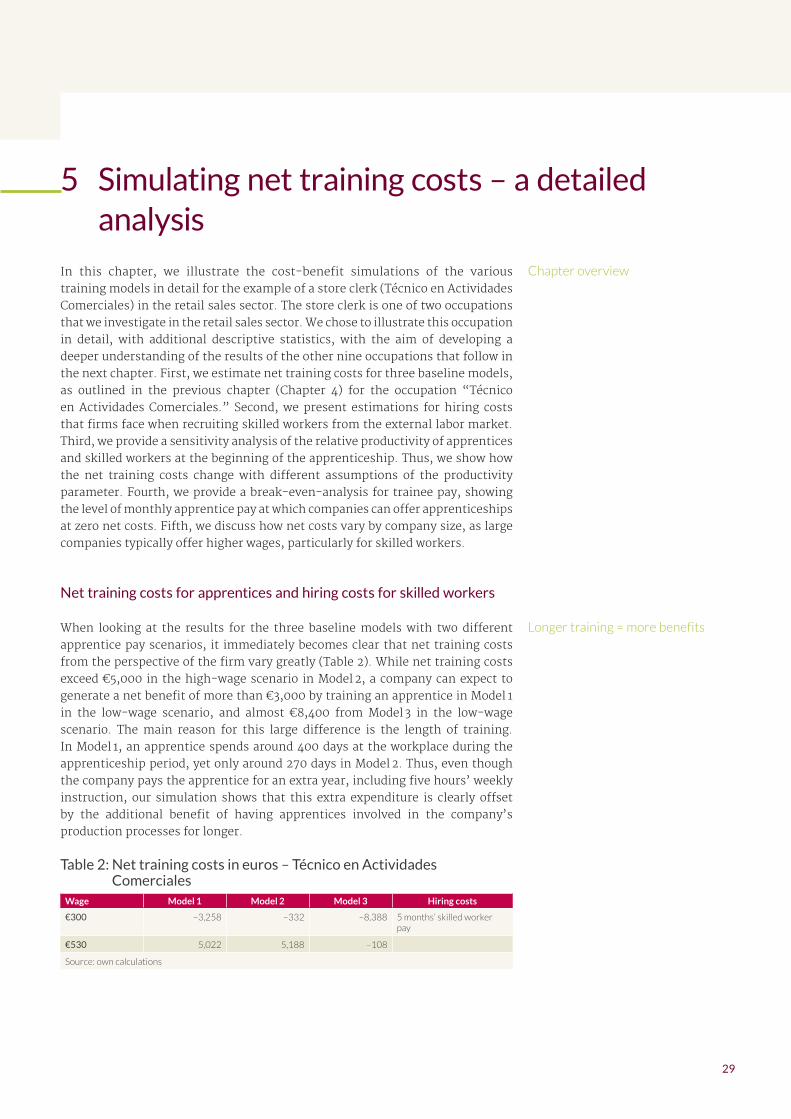
In this chapter, we illustrate the cost-benefit simulations of the various training models in detail for the example of a store clerk (Técnico en Actividades Comerciales) in the retail sales sector. The store clerk is one of two occupations that we investigate in the retail sales sector. We chose to illustrate this occupation in detail, with additional descriptive statistics, with the aim of developing a deeper understanding of the results of the other nine occupations that follow in the next chapter. First, we estimate net training costs for three baseline models, as outlined in the previous chapter (Chapter 4) for the occupation “Técnico en Actividades Comerciales.” Second, we present estimations for hiring costs that firms face when recruiting skilled workers from the external labor market. Third, we provide a sensitivity analysis of the relative productivity of apprentices and skilled workers at the beginning of the apprenticeship. Thus, we show how the net training costs change with different assumptions of the productivity parameter. Fourth, we provide a break-even-analysis for trainee pay, showing the level of monthly apprentice pay at which companies can offer apprenticeships at zero net costs. Fifth, we discuss how net costs vary by company size, as large companies typically offer higher wages, particularly for skilled workers.
Net training costs for apprentices and hiring costs for skilled workers
When looking at the results for the three baseline models with two different apprentice pay scenarios, it immediately becomes clear that net training costs from the perspective of the firm vary greatly (Table 2). While net training costs exceed €5,000 in the high-wage scenario in Model 2, a company can expect to generate a net benefit of more than €3,000 by training an apprentice in Model 1 in the low-wage scenario, and almost €8,400 from Model 3 in the low-wage scenario. The main reason for this large difference is the length of training. In Model 1, an apprentice spends around 400 days at the workplace during the apprenticeship period, yet only around 270 days in Model 2. Thus, even though the company pays the apprentice for an extra year, including five hours’ weekly instruction, our simulation shows that this extra expenditure is clearly offset by the additional benefit of having apprentices involved in the company’s production processes for longer.
Table 2: Net training costs in euros – Técnico en Actividades Comerciales
Wage Model 1 Model 2 Model 3 Hiring costs
€300 –3,258 –332 –8,388 5 months’ skilled worker pay
€530 5,022 5,188 –108
Source: own calculations
Chapter overview
Longer training = more benefits
5 Simulating net training costs – a detailed analysis

30
Simulating net training costs – a detailed analysis
Comparing Model 1 and Model 3 (in the high-wage scenario) reveals a relatively small difference in net training costs. However, as will become clear in the next chapter, we find that net training benefits are higher in Model 3 than in Model 1 for all training occupations we have analyzed. While apprentices spend less time in the workplace due to the 600 hours of formal education at vocational school in Model 1, apprentices receive more than 200 hours’ additional workplace education in Model 3. However, in Model 3, an apprentice spends the entire last year at the workplace. High relative productivity in the third year means the benefits are considerably higher than in Model 1, where trainees spend an equal amount of time at the workplace in each year of training. As a result, Model 3 allows companies to provide extensive workplace training without a net investment in apprenticeship training. As we will see in the next chapter, companies can usually offer training profitably under the conditions of Model 3.
Moreover, a firm may generate benefits from retaining a graduate apprentice as a skilled worker. The results of a (non-representative) survey among companies in the retail industry during the workshops revealed that hiring a skilled “Técnico en Actividades Comerciales” from the external labor market costs the equivalent of around 5 months’ skilled worker pay. That includes search costs for finding and interviewing suitable candidates (36%), adaptation and training costs before the worker reaches full productivity (40%) and costs associated with disruption to other workers (10%).12 In the next chapter, however, it will become clear that the cost of hiring new workers differs greatly between occupations and industries, not only regarding its magnitude, but also regarding the relative importance of the different hiring cost components.
12 For more details on the calculation of hiring costs, see Muehlemann and Strupler (2015).
Comparing benefits across models
Retention benefits (saved hiring costs)
31
Simulating net training costs – a detailed analysis
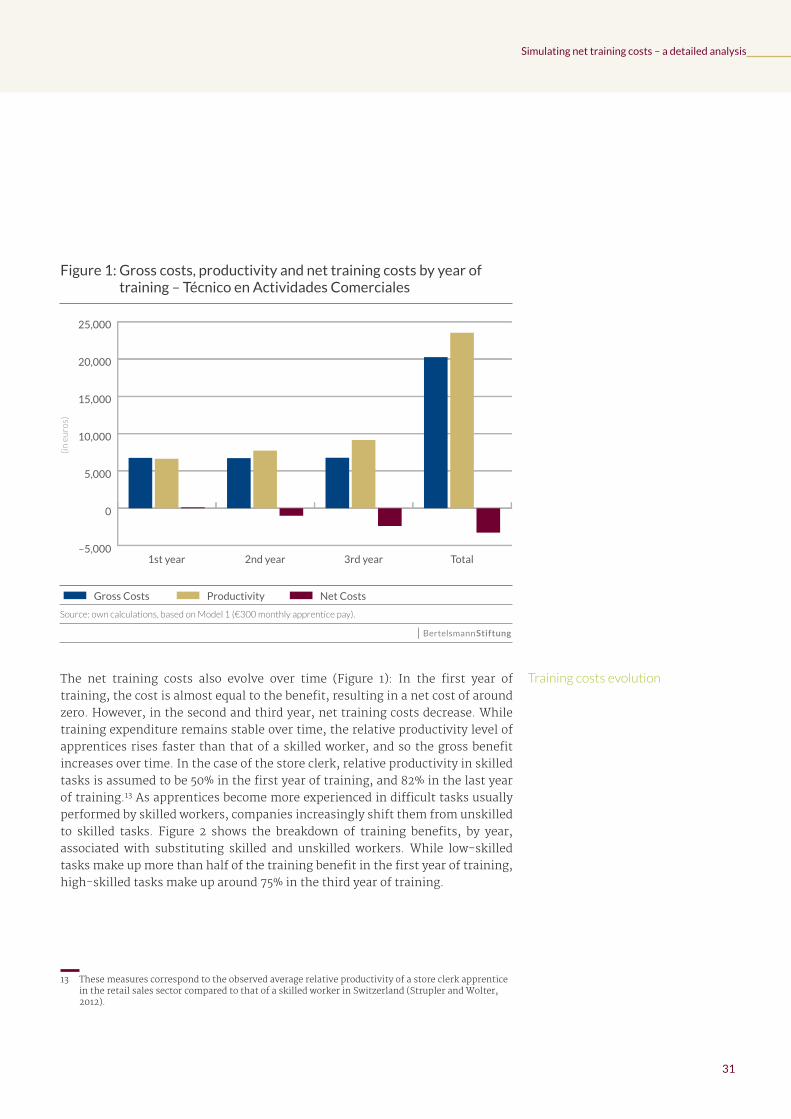
Figure 1: Gross costs, productivity and net training costs by year of training – Técnico en Actividades Comerciales
Source: own calculations, based on Model 1 (€300 monthly apprentice pay).
–5,000
0
5,000
10,000
15,000
20,000
25,000
Total3rd year2nd year1st year
(in e
uro
s)
Net CostsProductivityGross Costs
The net training costs also evolve over time (Figure 1): In the first year of training, the cost is almost equal to the benefit, resulting in a net cost of around zero. However, in the second and third year, net training costs decrease. While training expenditure remains stable over time, the relative productivity level of apprentices rises faster than that of a skilled worker, and so the gross benefit increases over time. In the case of the store clerk, relative productivity in skilled tasks is assumed to be 50% in the first year of training, and 82% in the last year of training.13 As apprentices become more experienced in difficult tasks usually performed by skilled workers, companies increasingly shift them from unskilled to skilled tasks. Figure 2 shows the breakdown of training benefits, by year, associated with substituting skilled and unskilled workers. While low-skilled tasks make up more than half of the training benefit in the first year of training, high-skilled tasks make up around 75% in the third year of training.
13 These measures correspond to the observed average relative productivity of a store clerk apprentice in the retail sales sector compared to that of a skilled worker in Switzerland (Strupler and Wolter, 2012).
Training costs evolution

32
Simulating net training costs – a detailed analysis
Figure 2: Composition of training benefits by year of training – Técnico en Actividades Comerciales
Source: own calculations, based on Model 1 (€300 monthly apprentice pay).
Other CostsPersonnel CostsApprentice's Wage
9%
54%37%
In our model, the trainee wage is held at a constant €300 per month for each year of training. However in Switzerland, for example, trainee pay generally increases over time from a low base (Strupler and Wolter 2012). Moreover, some occupations in Switzerland are combined with a degressive vocational school system, i.e., apprentices spend more time in school at the beginning of an apprenticeship, when their productivity in skilled tasks is low, and more time at the workplace towards the end of the training period (similar to Model 3 used in our simulations). Thus, increasing apprenticeship pay and workplace hours would further alter gross training costs and benefits for each year of training.
Instruction time at the workplace, another important cost component, remains constant in our model. The reason for this assumption is the observation that the instruction time in Swiss firms varies very little in the different years of an apprenticeship program.
Increasing apprentice pay & workplace time
Workplace instruction time
32

33
Simulating net training costs – a detailed analysis
Figure 3: Composition of gross training costs – Técnico en Actividades Comerciales
Source: own calculations, based on Model 1 (€300 monthly apprentice pay).
0
2,000
4,000
6,000
8,000
10,000
3rd year2nd year1st year
(in p
erce
nt)
Benefits from high skilled tasksBenefits from low skilled tasks
Figure 3 shows that most training costs are in fact wage costs for apprentices and training instructors. In the case of Model 1, based on €300 monthly apprentice pay, apprentice wage costs account for 54% of total training costs. Conversely, the costs for instruction at the workplace amount to 37% of total training costs, leaving less than 10% for other expenditures, such as infrastructure or material used for training purposes.
Sensitivity analysis of apprentice productivity
For apprentices, the motivation for training is being hired as skilled workers after their training period, either by the company which trains them or an external company. The skills required encompass not just theoretical education but practice in skilled work as well. The benefit for the company of having apprentices replace skilled workers is heavily dependent on the relative performance (productivity) of apprentices compared to skilled workers. As we cannot directly measure the productivity of Spanish apprentices, we use the levels of productivity of Swiss apprentices in our calculations. Our estimates therefore rely on the assumption that the relative productivity of apprentices and skilled workers is the same in Spain and Switzerland. While this may be a good working assumption,
Gross training costs composition
Relative productivity, sensitivity analysis
33
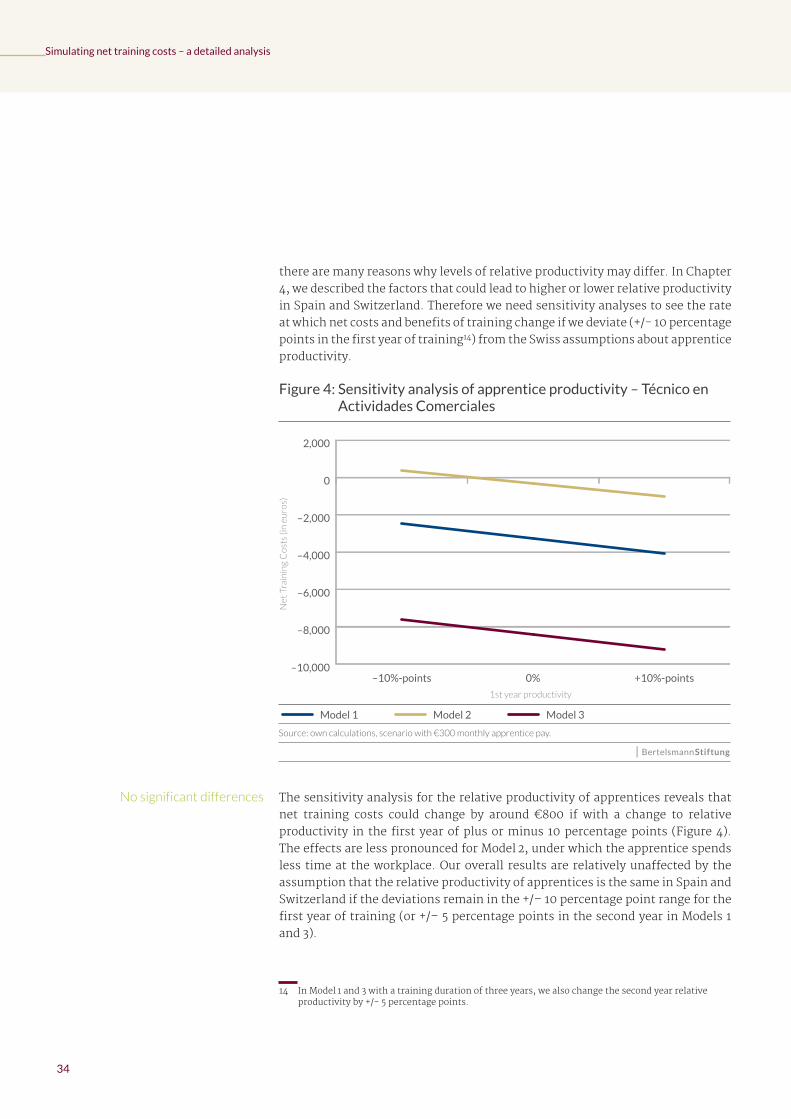
34
Simulating net training costs – a detailed analysis
there are many reasons why levels of relative productivity may differ. In Chapter 4, we described the factors that could lead to higher or lower relative productivity in Spain and Switzerland. Therefore we need sensitivity analyses to see the rate at which net costs and benefits of training change if we deviate (+/- 10 percentage points in the first year of training14) from the Swiss assumptions about apprentice productivity.
Figure 4: Sensitivity analysis of apprentice productivity – Técnico en Actividades Comerciales
Source: own calculations, scenario with €300 monthly apprentice pay.
–10,000
–8,000
–6,000
–4,000
–2,000
0
2,000Model 3
Model 2
Model 1
+10%-points0%–10%-points
Net
Tra
inin
g C
ost
s (in
eu
ros)
1st year productivity
Model 3Model 2Model 1
The sensitivity analysis for the relative productivity of apprentices reveals that net training costs could change by around €800 if with a change to relative productivity in the first year of plus or minus 10 percentage points (Figure 4). The effects are less pronounced for Model 2, under which the apprentice spends less time at the workplace. Our overall results are relatively unaffected by the assumption that the relative productivity of apprentices is the same in Spain and Switzerland if the deviations remain in the +/– 10 percentage point range for the first year of training (or +/– 5 percentage points in the second year in Models 1 and 3).
14 In Model 1 and 3 with a training duration of three years, we also change the second year relative productivity by +/- 5 percentage points.
No significant differences
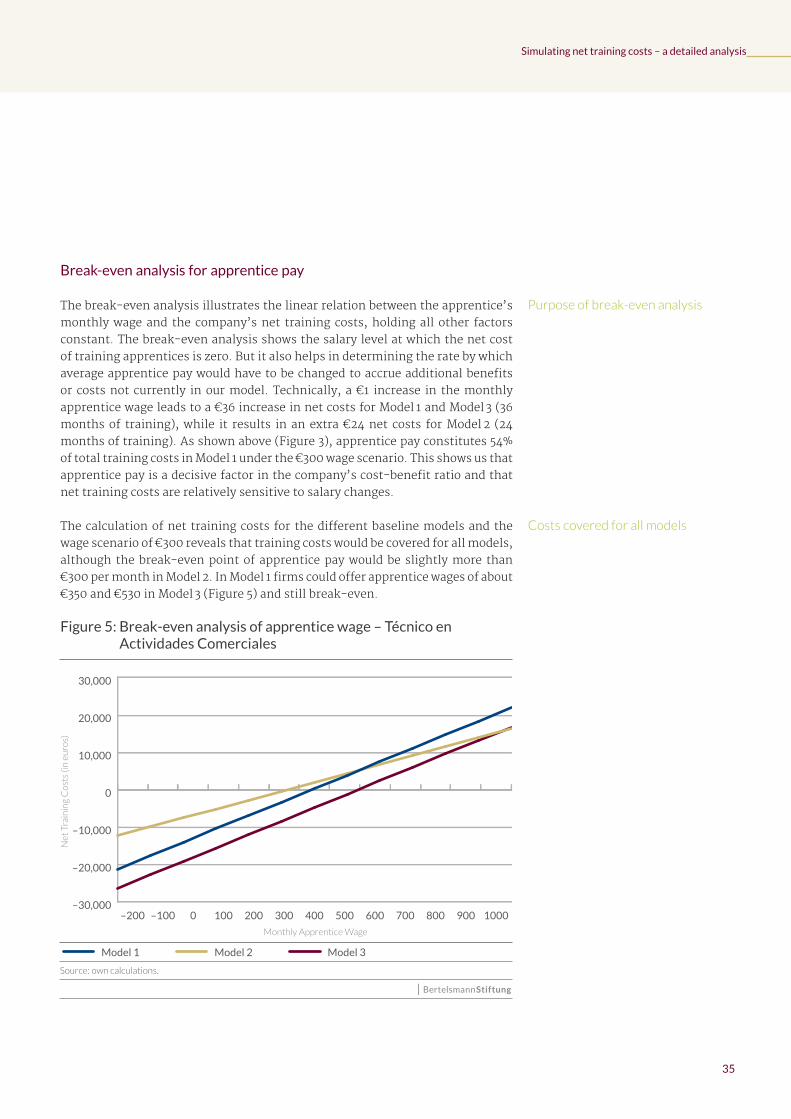
35
Simulating net training costs – a detailed analysis
Break-even analysis for apprentice pay
The break-even analysis illustrates the linear relation between the apprentice’s monthly wage and the company’s net training costs, holding all other factors constant. The break-even analysis shows the salary level at which the net cost of training apprentices is zero. But it also helps in determining the rate by which average apprentice pay would have to be changed to accrue additional benefits or costs not currently in our model. Technically, a €1 increase in the monthly apprentice wage leads to a €36 increase in net costs for Model 1 and Model 3 (36 months of training), while it results in an extra €24 net costs for Model 2 (24 months of training). As shown above (Figure 3), apprentice pay constitutes 54% of total training costs in Model 1 under the €300 wage scenario. This shows us that apprentice pay is a decisive factor in the company’s cost-benefit ratio and that net training costs are relatively sensitive to salary changes.
The calculation of net training costs for the different baseline models and the wage scenario of €300 reveals that training costs would be covered for all models, although the break-even point of apprentice pay would be slightly more than €300 per month in Model 2. In Model 1 firms could offer apprentice wages of about €350 and €530 in Model 3 (Figure 5) and still break-even.
Figure 5: Break-even analysis of apprentice wage – Técnico en Actividades Comerciales
Source: own calculations.
–30,000
–20,000
–10,000
0
10,000
20,000
30,000Model 3
Model 2
Model 1
10009008007006005004003002001000–100–200
Net
Tra
inin
g C
ost
s (in
eu
ros)
Monthly Apprentice Wage
Model 3Model 2Model 1
Purpose of break-even analysis
Costs covered for all models
36
Simulating net training costs – a detailed analysis
Wage structure within the company – how net costs differ by company size
While apprentice pay is a major cost component, the wage structure for low and highly skilled workers is another significant factor in the value of an apprentice´s productive contribution (the benefit side). The value of an apprentice working productively for one hour in a skilled or unskilled activity corresponds to the (un)skilled wage (adjusted for the relative productivity of the apprentice, as discussed in Chapter 4) for a worker of that particular company. Thus, the higher the pay for skilled and unskilled workers, the more the company benefits from using the trainee for productive work (ceteris paribus15). As companies differ not just in wage levels (which reflect differences in the company’s overall productivity) but also in the relative wages for skilled and unskilled workers, the latter also helps determine companies’ optimal allocation of tasks to apprentices.
To illustrate this more in detail, let us consider an extreme, hypothetical case where wages for skilled and unskilled work are equal. In this scenario, companies wishing to minimize net training costs have an incentive to allocate fewer skilled tasks to the apprentice, because the apprentice’s productivity is lower than a skilled worker’s, while apprentices – by definition – are just as productive in unskilled tasks as unskilled workers. However, if unskilled workers receive much less pay than skilled workers, companies have an incentive to allocate more productive tasks to apprentices early on, so that their productivity in skilled tasks increases faster. Again, let us consider an extreme case where the productivity of an apprentice in the last year of training is equal to that of a skilled worker. In this case, the company’s benefit from having apprentices carry out skilled tasks is simply the difference in hourly pay between the skilled worker and the apprentice, and assuming that the skilled workers are paid more than unskilled workers, companies have no incentive at all to use apprentices for unskilled tasks.
Looking at Spanish wage data reveals that the wages are generally lower in small companies than large companies, as is the case in most countries. Moreover, the differences between pay for skilled and unskilled work are typically greater in large firms. While unskilled workers tend to earn a little more in larger companies, the company size wage premium is typically higher for skilled workers.
For a “Técnico en Actividades Comerciales,” the change in the wage structure by company size is much less pronounced than in other occupations (see next chapter). In small companies of less than 10 employees, the ratio of wages for unskilled to skilled workers is 0.81, and 0.75 in large companies of more than 100
15 A company’s provision of workplace training may depend on company size for reasons which extend beyond wage levels. Looking at the Swiss data, we find minimal differences in training hours by company size, therefore we assume in the simulations that all other factors besides wage structure remain constant across firm sizes.
Wage ratio (skilled vs. unskilled)
Explanation
Wage levels in Spain
Small differences across company size
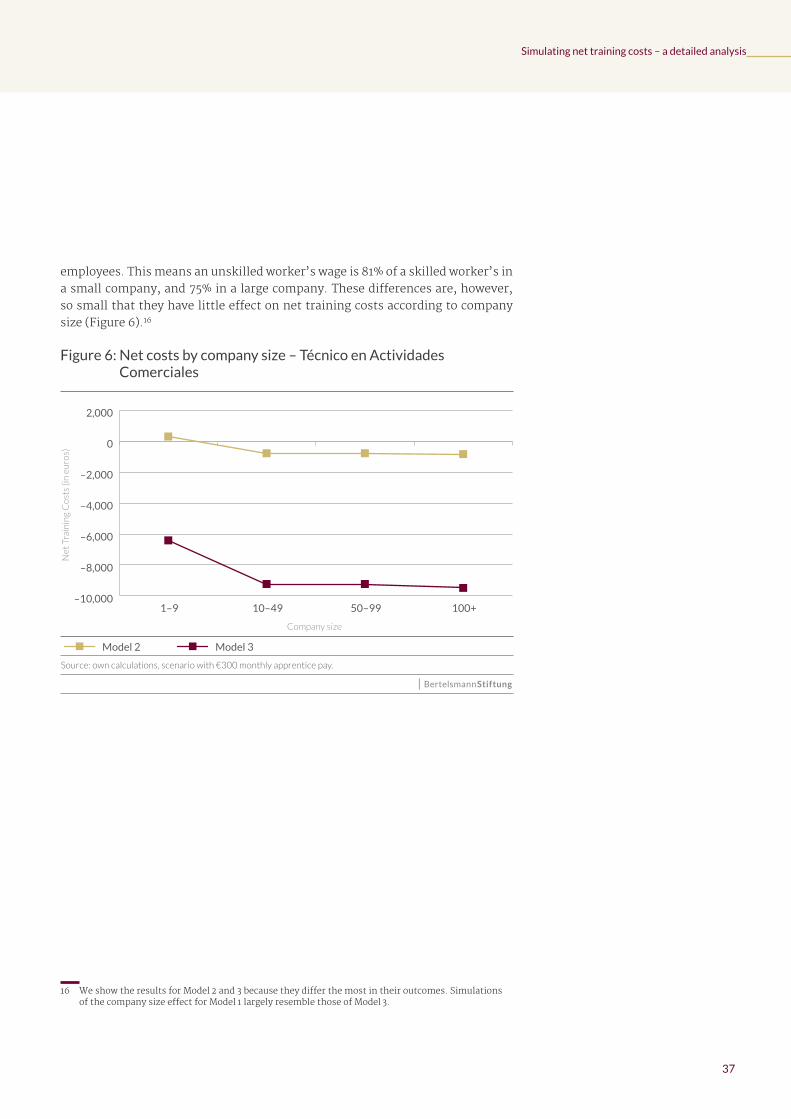
37
Simulating net training costs – a detailed analysis
employees. This means an unskilled worker’s wage is 81% of a skilled worker’s in a small company, and 75% in a large company. These differences are, however, so small that they have little effect on net training costs according to company size (Figure 6).16
Figure 6: Net costs by company size – Técnico en Actividades Comerciales
Source: own calculations, scenario with €300 monthly apprentice pay.
Net
Tra
inin
g C
ost
s (in
eu
ros)
Company size
–10,000
–8,000
–6,000
–4,000
–2,000
0
2,000
100+ 50–99 10–49 1–9
Model 3Model 2
16 We show the results for Model 2 and 3 because they differ the most in their outcomes. Simulations of the company size effect for Model 1 largely resemble those of Model 3.
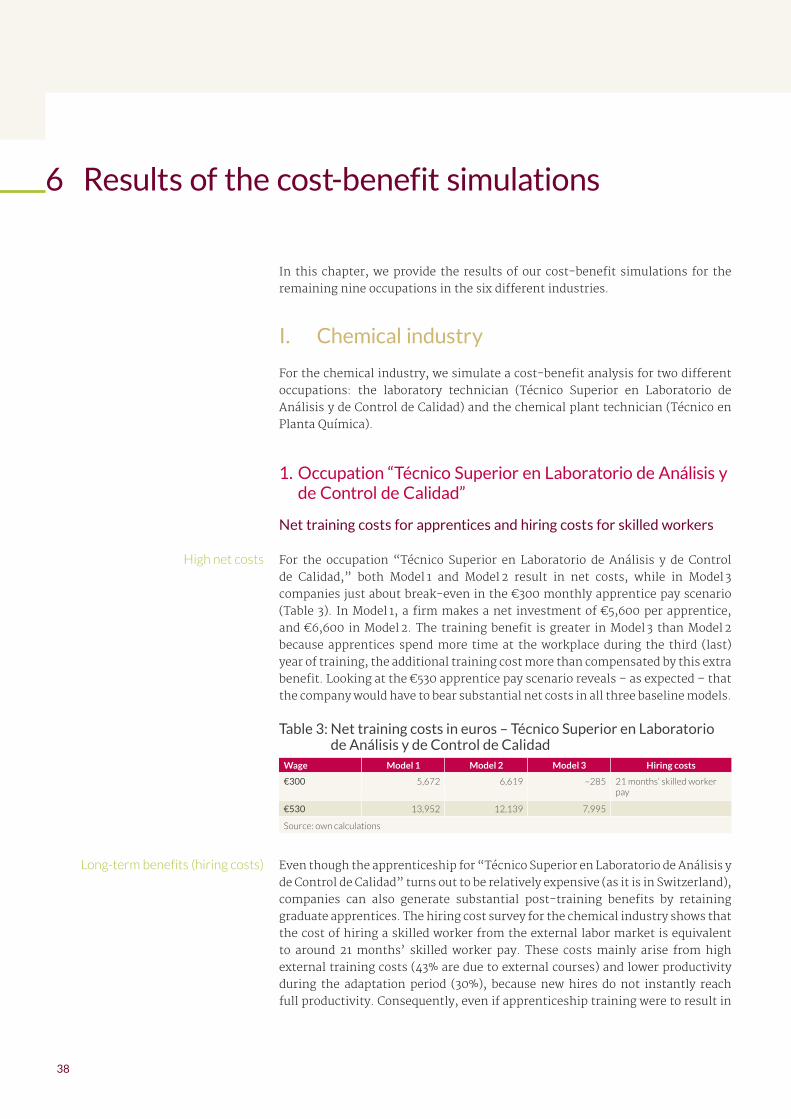
38
In this chapter, we provide the results of our cost-benefit simulations for the remaining nine occupations in the six different industries.
I. Chemical industry
For the chemical industry, we simulate a cost-benefit analysis for two different occupations: the laboratory technician (Técnico Superior en Laboratorio de Análisis y de Control de Calidad) and the chemical plant technician (Técnico en Planta Química).
1. Occupation “Técnico Superior en Laboratorio de Análisis y de Control de Calidad”
Net training costs for apprentices and hiring costs for skilled workers
For the occupation “Técnico Superior en Laboratorio de Análisis y de Control de Calidad,” both Model 1 and Model 2 result in net costs, while in Model 3 companies just about break-even in the €300 monthly apprentice pay scenario (Table 3). In Model 1, a firm makes a net investment of €5,600 per apprentice, and €6,600 in Model 2. The training benefit is greater in Model 3 than Model 2 because apprentices spend more time at the workplace during the third (last) year of training, the additional training cost more than compensated by this extra benefit. Looking at the €530 apprentice pay scenario reveals – as expected – that the company would have to bear substantial net costs in all three baseline models.
Table 3: Net training costs in euros – Técnico Superior en Laboratorio de Análisis y de Control de Calidad
Wage Model 1 Model 2 Model 3 Hiring costs
€300 5,672 6,619 –285 21 months’ skilled worker pay
€530 13,952 12,139 7,995
Source: own calculations
Even though the apprenticeship for “Técnico Superior en Laboratorio de Análisis y de Control de Calidad” turns out to be relatively expensive (as it is in Switzerland), companies can also generate substantial post-training benefits by retaining graduate apprentices. The hiring cost survey for the chemical industry shows that the cost of hiring a skilled worker from the external labor market is equivalent to around 21 months’ skilled worker pay. These costs mainly arise from high external training costs (43% are due to external courses) and lower productivity during the adaptation period (30%), because new hires do not instantly reach full productivity. Consequently, even if apprenticeship training were to result in
High net costs
Long-term benefits (hiring costs)
6 Results of the cost-benefit simulations

39
Results of the cost-benefit simulations
net training costs in the short run, companies may still profit in the long run by saving on external hiring costs, provided they retain their own trainees.
Sensitivity analysis of apprentice productivity
The sensitivity analysis on apprentice productivity in skilled tasks reveals a relatively moderate impact on net costs for different levels of apprentice productivity relative to skilled workers (Figure 7).
Figure 7: Sensitivity analysis of apprentice productivity – Técnico Superior en Laboratorio de Análisis y de Control de Calidad
Source: own calculations, scenario with €300 monthly apprentice pay.
–2,000
–1,000
0
1,000
2,000
3,000
4,000
5,000
6,000
7,000
8,000Model 3
Model 2
Model 1
+10%-points0% –10%-points
Net
Tra
inin
g C
ost
s (in
eu
ros)
1st year productivity
Model 3Model 2Model 1
The effect is similar across all models, as changing the relative productivity by +/-10 percentage points in the first year of training changes net training costs by €1,800 in Model 1, somewhat less than €1,800 in Model 2, and €1,900 in Model 3.
Break-even analysis for apprentice pay
As Table 3 shows, training under the parameters of Models 1 and 2 is not profitable for the firm at an apprentice wage of €300 per month. Break-even analysis reveals that apprentice pay would have to be close to zero for companies to offer training
Moderate effects
Low break-even points

40
Results of the cost-benefit simulations
at zero net cost in Model 2 (Figure 8). Conversely, in Model 1 a monthly apprentice wage of around €140 is enough to break-even. With companies highly unlikely to set apprentices wages close to zero (and still attract qualified applicants), the entire wage bill for apprentices has to be offset by saved hiring costs.
Figure 8: Break-even analysis of apprentice wage – Técnico Superior en Laboratorio de Análisis y de Control de Calidad
Source: own calculations.
–30,000
–20,000
–10,000
0
10,000
20,000
30,000Model 3
Model 2
Model 1
1,0009008007006005004003002001000–100–200
Net
Tra
inin
g C
ost
s (in
eu
ros)
Monthly Apprentice Wage
Model 3Model 2Model 1
Wage structure within companies – how net costs differ by company size
As the ratio of skilled to unskilled worker pay decreases with company size, so too the net costs from training – however, only in Model 3. In particular, a company in the largest size category realizes more benefit from allocating skilled tasks to apprentices than very small firms, a difference in net training costs of about €4,000 (Figure 9). Conversely, net costs remain largely unaffected when wage structures change in Model 2, with apprentices spending less time at the workplace and more in vocational school. Moreover, as the pay for skilled workers increases, so too the cost of instruction at the workplace. As a result, net costs could potentially be even greater for larger companies based on the assumptions in Model 2.
Differences across models

41
Results of the cost-benefit simulations
Figure 9: Net costs by company size – Técnico Superior en Laboratorio de Análisis y de Control de Calidad
Source: own calculations, scenario with €300 monthly apprentice pay.
Net
Tra
inin
g C
ost
s (in
eu
ros)
Company size
–3,000
–2,000
–1,000
0
1,000
2,000
3,000
4,000
5,000
6,000
7,000Model 3
Model 2
100+ 50–99 10–49 1–9
Model 3Model 2
2. Occupation “Técnico en Planta Química”
Net training costs for apprentices and hiring costs for skilled workers
The net costs simulation for the second chemical industry occupation, plant technician, shows a noticeable difference in the magnitude of net training costs compared to the first occupation discussed above. The main reasons – derived from comparable Swiss occupations – are a higher proportion of unskilled tasks (30% vs. 15%) and a lower proportion of unproductive tasks (practicing, 21% vs. 12%) in the last year of training. However, in the last year of training, apprentice productivity in skilled tasks is higher for laboratory technicians (78%) than the plant technicians (70%). Naturally, the simulations depend on the assumptions that we make about these parameters. While it remains to be seen how such an apprenticeship program would look like in Spain in reality, our results highlight the corresponding changes in net costs for an apprenticeship in the chemical industry when we simultaneously make changes in the parameters discussed above (i.e., proportion and type of productive work, and relative productivity).
Significant training costs differences

42
Results of the cost-benefit simulations
In Models 1 and 3, both scenarios generate substantial net benefits from the company’s perspective, amounting to €6,700 and €12,300 respectively, assuming a monthly apprentice wage of €300 (Table 4). Even Model 2 is profitable for the company, although only in the low pay scenario. For an apprentice wage of €300, a company’s net investments are covered under the assumptions of Model 2, resulting in a net benefit of almost €2,000.
Hiring skilled plant technicians from the external labor market is very costly, even if cheaper than laboratory technicians, averaging the equivalent of 16 months’ skilled worker pay. In particular, external training costs account for 26% of total hiring costs, with disruption costs and loss in productivity of 35% and 26%, respectively. Assuming reasonably high takeover rates, the hiring costs saved mean substantial additional benefits for an already relatively profitable occupation.
Table 4: Net training costs in euros – Técnico en Planta QuímicaWage Model 1 Model 2 Model 3 Hiring costs
€300 –6,742 –1,887 –12,319 16 months’ skilled worker pay
€530 1,538 3,633 –4,039
Source: own calculations
Sensitivity analysis of apprentice productivity
Changing productivity assumptions for the plant technician in the beginning of the apprenticeship by +/-10 percentage leads to a €2,000 change in net costs in Models 1 and 3, while the effect is less than €1,600 in Model 2 (Figure 10). However, it is readily apparent that companies generate net benefits from training apprentices in every baseline model, regardless of the changes to the productivity parameters.
Beneficial scenarios
Saved hiring costs
No effects
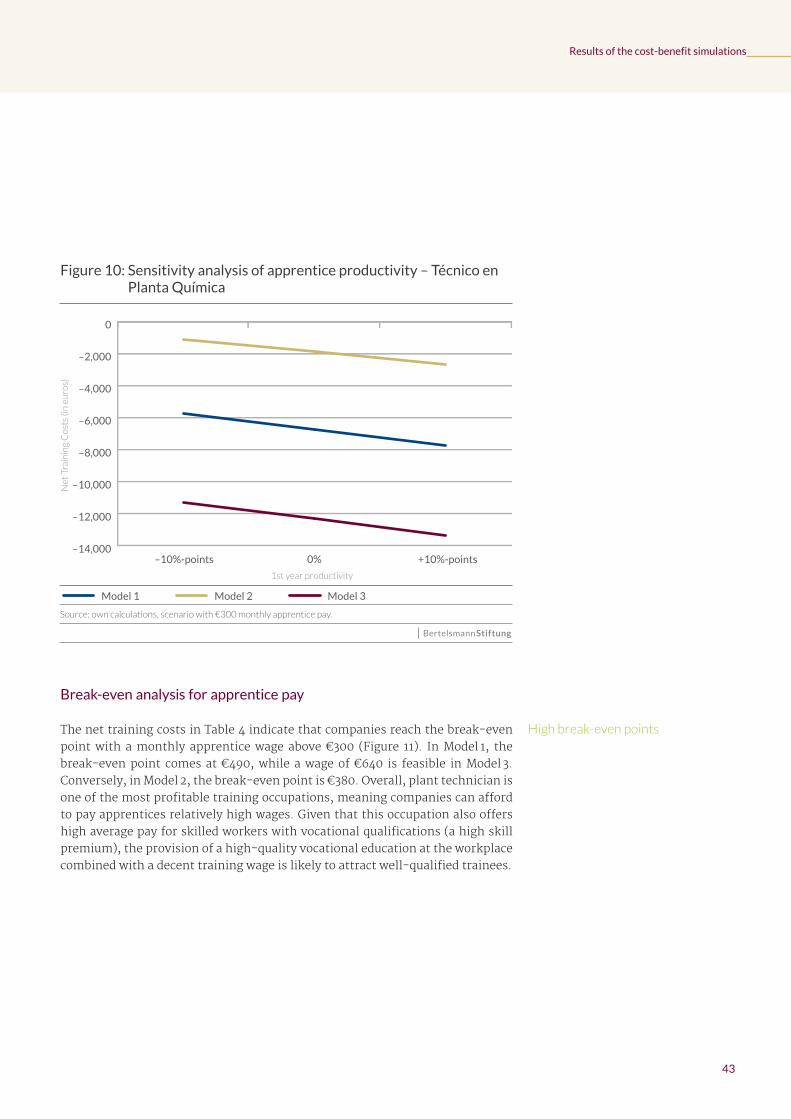
43
Results of the cost-benefit simulations
Figure 10: Sensitivity analysis of apprentice productivity – Técnico en Planta Química
Source: own calculations, scenario with €300 monthly apprentice pay.
–14,000
–12,000
–10,000
–8,000
–6,000
–4,000
–2,000
0Model 3
Model 2
Model 1
+10%-points0% –10%-points
Net
Tra
inin
g C
ost
s (in
eu
ros)
1st year productivity
Model 3Model 2Model 1
Break-even analysis for apprentice pay
The net training costs in Table 4 indicate that companies reach the break-even point with a monthly apprentice wage above €300 (Figure 11). In Model 1, the break-even point comes at €490, while a wage of €640 is feasible in Model 3. Conversely, in Model 2, the break-even point is €380. Overall, plant technician is one of the most profitable training occupations, meaning companies can afford to pay apprentices relatively high wages. Given that this occupation also offers high average pay for skilled workers with vocational qualifications (a high skill premium), the provision of a high-quality vocational education at the workplace combined with a decent training wage is likely to attract well-qualified trainees.
High break-even points
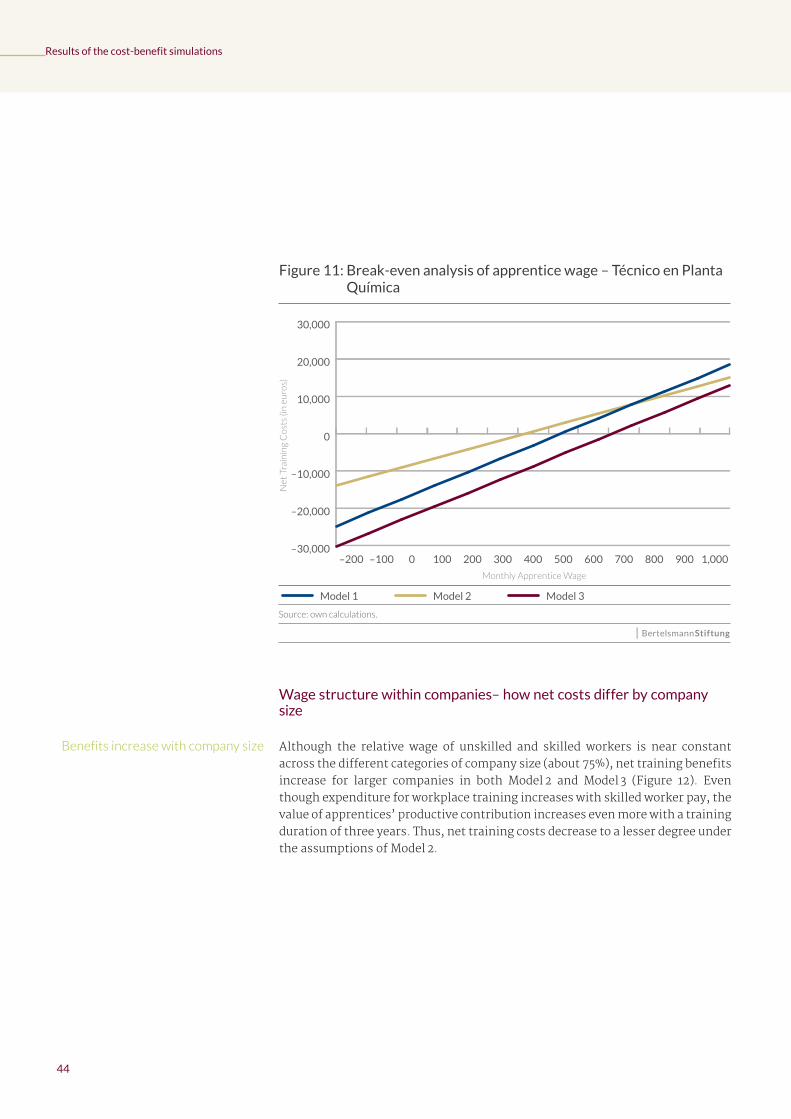
44
Results of the cost-benefit simulations
Figure 11: Break-even analysis of apprentice wage – Técnico en Planta Química
Source: own calculations.
–30,000
–20,000
–10,000
0
10,000
20,000
30,000Model 3
Model 2
Model 1
1,0009008007006005004003002001000–100–200
Net
Tra
inin
g C
ost
s (in
eu
ros)
Monthly Apprentice Wage
Model 3Model 2Model 1
Wage structure within companies– how net costs differ by company size
Although the relative wage of unskilled and skilled workers is near constant across the different categories of company size (about 75%), net training benefits increase for larger companies in both Model 2 and Model 3 (Figure 12). Even though expenditure for workplace training increases with skilled worker pay, the value of apprentices’ productive contribution increases even more with a training duration of three years. Thus, net training costs decrease to a lesser degree under the assumptions of Model 2.
Benefits increase with company size
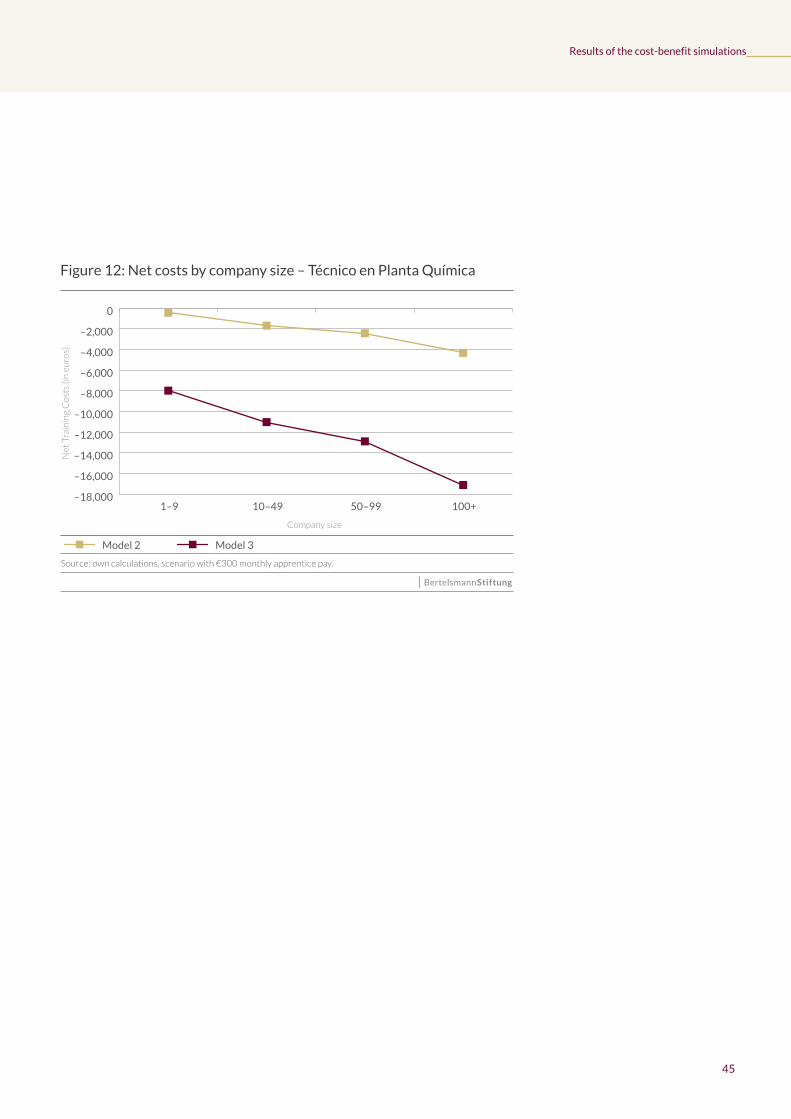
45
Results of the cost-benefit simulations
Figure 12: Net costs by company size – Técnico en Planta Química
Source: own calculations, scenario with €300 monthly apprentice pay.
Net
Tra
inin
g C
ost
s (in
eu
ros)
Company size
–18,000
–16,000
–14,000
–12,000
–10,000
–8,000
–6,000
–4,000
–2,000
0Model 3
Model 2
100+ 50–99 10–49 1–9
Model 3Model 2
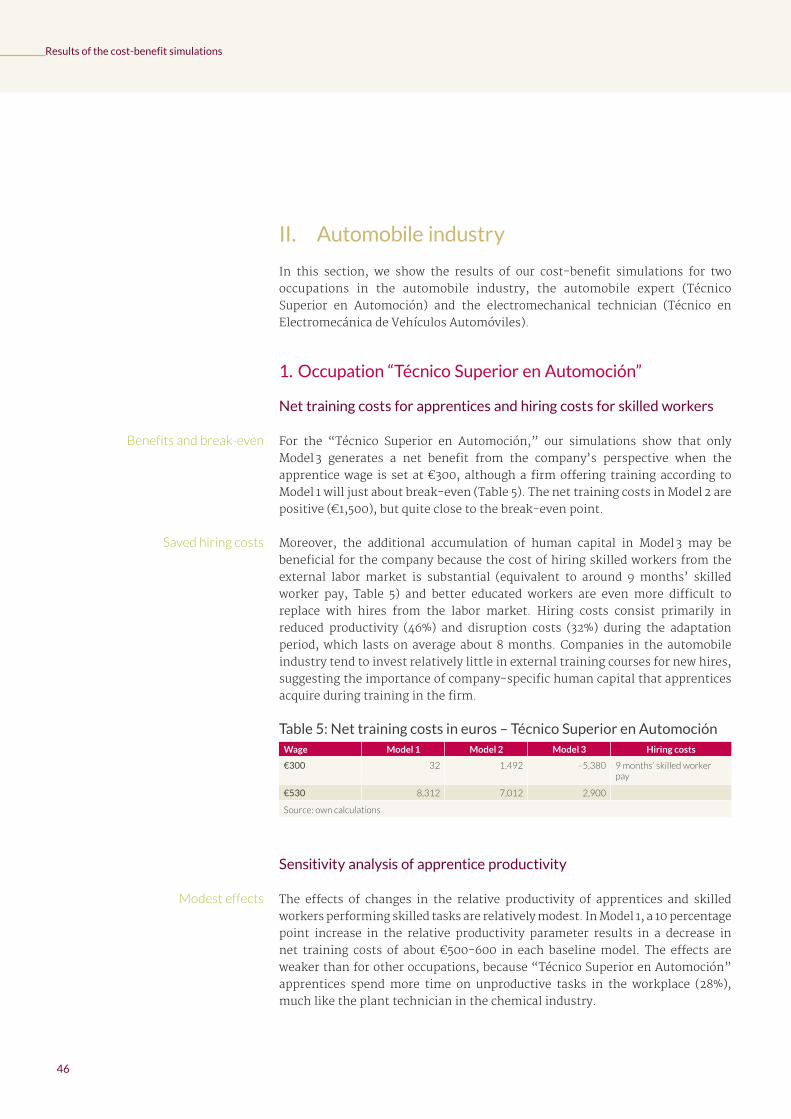
46
Results of the cost-benefit simulations
II. Automobile industry
In this section, we show the results of our cost-benefit simulations for two occupations in the automobile industry, the automobile expert (Técnico Superior en Automoción) and the electromechanical technician (Técnico en Electromecánica de Vehículos Automóviles).
1. Occupation “Técnico Superior en Automoción”
Net training costs for apprentices and hiring costs for skilled workers
For the “Técnico Superior en Automoción,” our simulations show that only Model 3 generates a net benefit from the company’s perspective when the apprentice wage is set at €300, although a firm offering training according to Model 1 will just about break-even (Table 5). The net training costs in Model 2 are positive (€1,500), but quite close to the break-even point.
Moreover, the additional accumulation of human capital in Model 3 may be beneficial for the company because the cost of hiring skilled workers from the external labor market is substantial (equivalent to around 9 months’ skilled worker pay, Table 5) and better educated workers are even more difficult to replace with hires from the labor market. Hiring costs consist primarily in reduced productivity (46%) and disruption costs (32%) during the adaptation period, which lasts on average about 8 months. Companies in the automobile industry tend to invest relatively little in external training courses for new hires, suggesting the importance of company-specific human capital that apprentices acquire during training in the firm.
Table 5: Net training costs in euros – Técnico Superior en AutomociónWage Model 1 Model 2 Model 3 Hiring costs
€300 32 1,492 –5,380 9 months’ skilled worker pay
€530 8,312 7,012 2,900
Source: own calculations
Sensitivity analysis of apprentice productivity
The effects of changes in the relative productivity of apprentices and skilled workers performing skilled tasks are relatively modest. In Model 1, a 10 percentage point increase in the relative productivity parameter results in a decrease in net training costs of about €500-600 in each baseline model. The effects are weaker than for other occupations, because “Técnico Superior en Automoción” apprentices spend more time on unproductive tasks in the workplace (28%), much like the plant technician in the chemical industry.
Benefits and break-even
Saved hiring costs
Modest effects
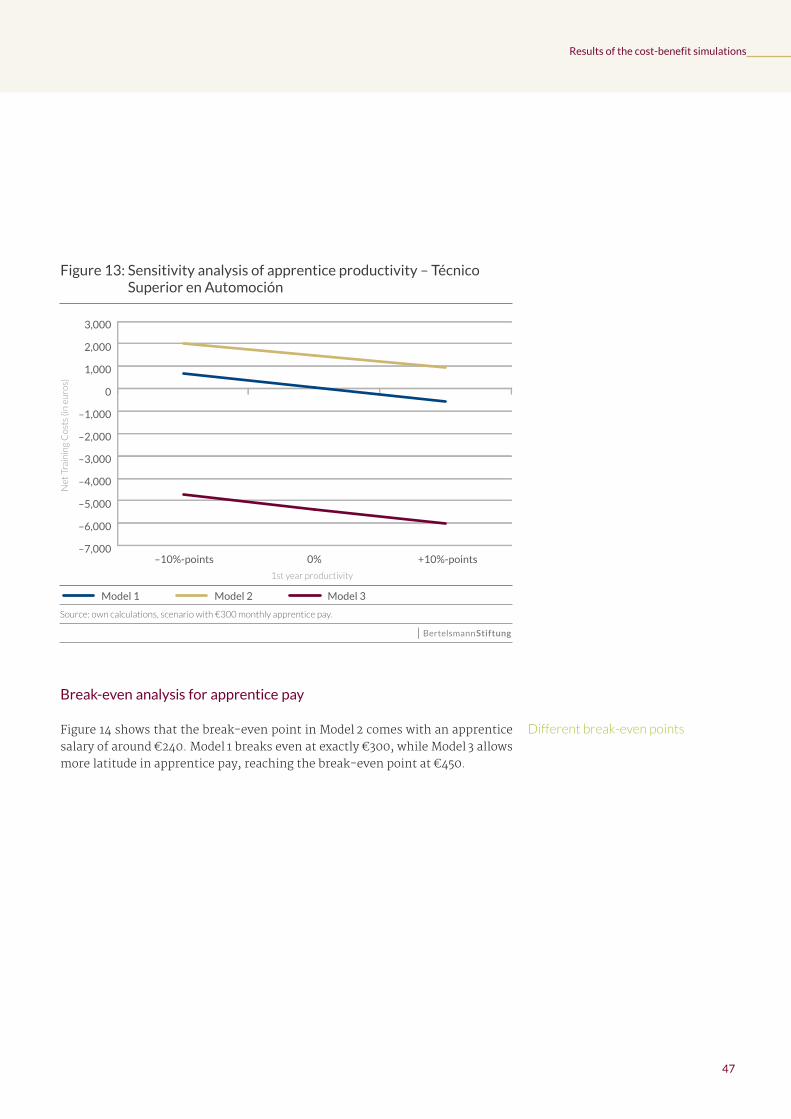
47
Results of the cost-benefit simulations
Figure 13: Sensitivity analysis of apprentice productivity – Técnico Superior en Automoción
Source: own calculations, scenario with €300 monthly apprentice pay.
–7,000
–6,000
–5,000
–4,000
–3,000
–2,000
–1,000
0
1,000
2,000
3,000Model 3
Model 2
Model 1
+10%-points0% –10%-points
Net
Tra
inin
g C
ost
s (in
eu
ros)
1st year productivity
Model 3Model 2Model 1
Break-even analysis for apprentice pay
Figure 14 shows that the break-even point in Model 2 comes with an apprentice salary of around €240. Model 1 breaks even at exactly €300, while Model 3 allows more latitude in apprentice pay, reaching the break-even point at €450.
Different break-even points
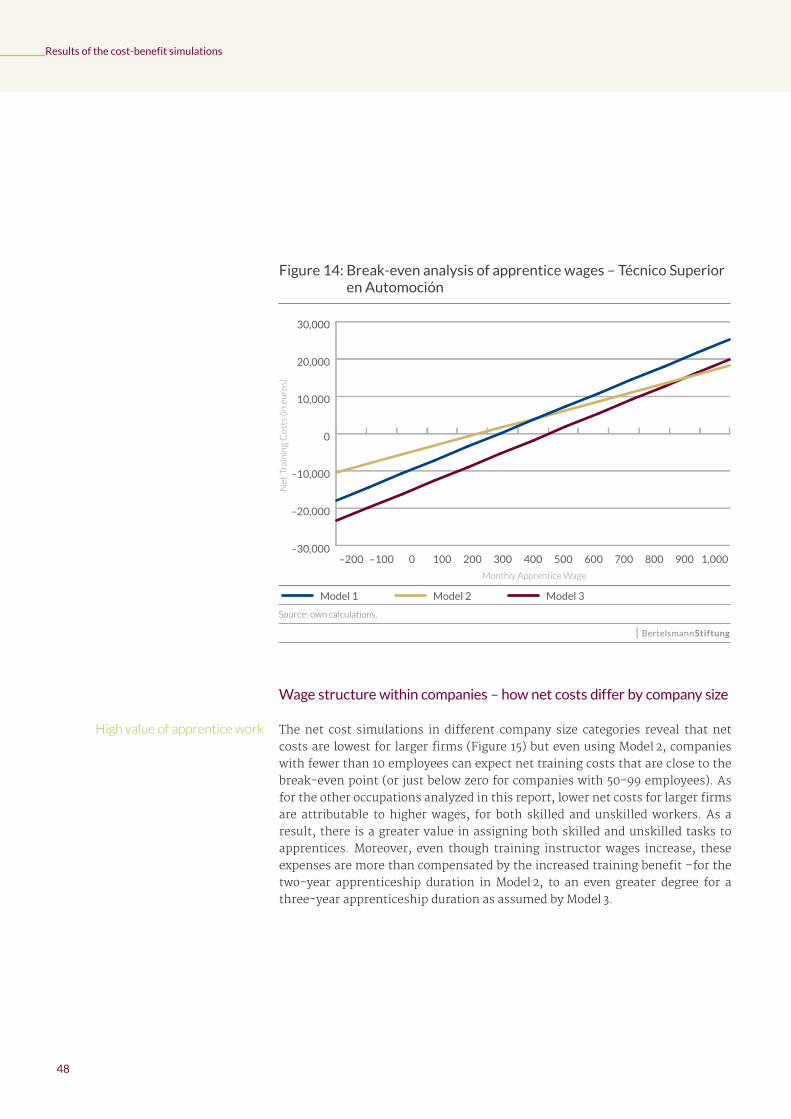
48
Results of the cost-benefit simulations
Figure 14: Break-even analysis of apprentice wages – Técnico Superior en Automoción
Source: own calculations.
–30,000
–20,000
–10,000
0
10,000
20,000
30,000Model 3
Model 2
Model 1
1,0009008007006005004003002001000–100–200
Net
Tra
inin
g C
ost
s (in
eu
ros)
Monthly Apprentice Wage
Model 3Model 2Model 1
Wage structure within companies – how net costs differ by company size
The net cost simulations in different company size categories reveal that net costs are lowest for larger firms (Figure 15) but even using Model 2, companies with fewer than 10 employees can expect net training costs that are close to the break-even point (or just below zero for companies with 50-99 employees). As for the other occupations analyzed in this report, lower net costs for larger firms are attributable to higher wages, for both skilled and unskilled workers. As a result, there is a greater value in assigning both skilled and unskilled tasks to apprentices. Moreover, even though training instructor wages increase, these expenses are more than compensated by the increased training benefit –for the two-year apprenticeship duration in Model 2, to an even greater degree for a three-year apprenticeship duration as assumed by Model 3.
High value of apprentice work
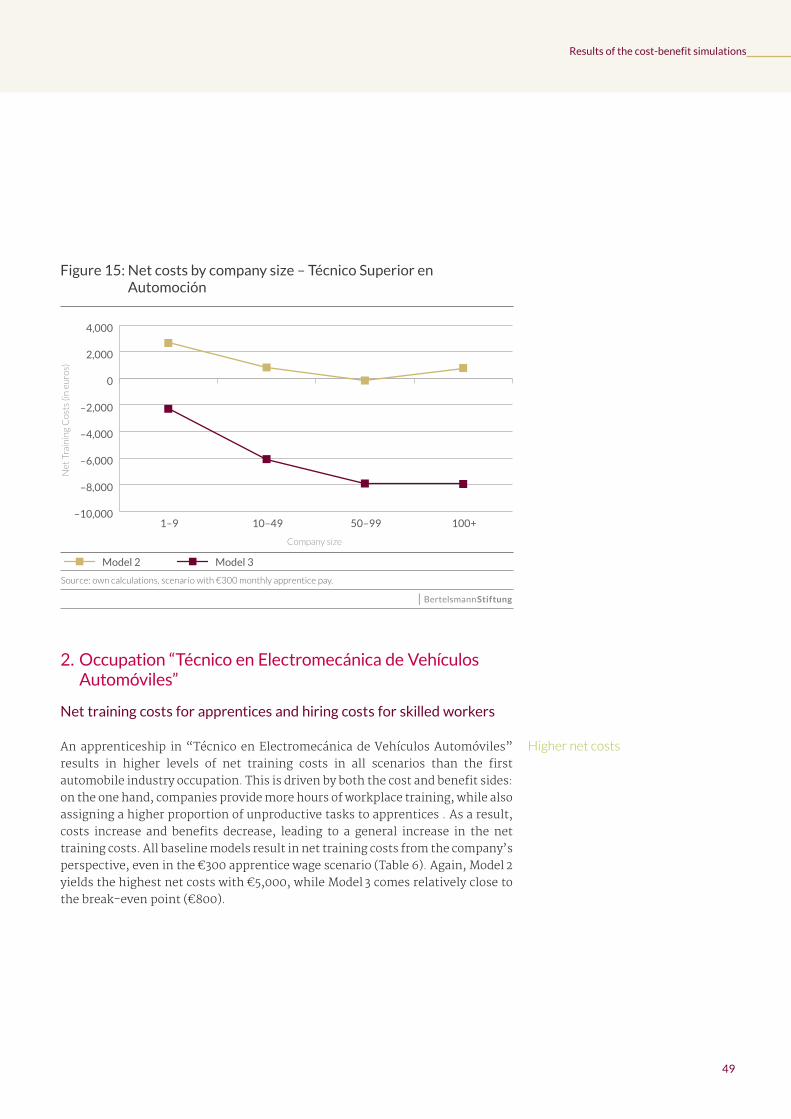
49
Results of the cost-benefit simulations
Figure 15: Net costs by company size – Técnico Superior en Automoción
Source: own calculations, scenario with €300 monthly apprentice pay.
Net
Tra
inin
g C
ost
s (in
eu
ros)
Company size
–10,000
–8,000
–6,000
–4,000
–2,000
0
2,000
4,000Model 3
Model 2
100+ 50–99 10–49 1–9
Model 3Model 2
2. Occupation “Técnico en Electromecánica de Vehículos Automóviles”
Net training costs for apprentices and hiring costs for skilled workers
An apprenticeship in “Técnico en Electromecánica de Vehículos Automóviles” results in higher levels of net training costs in all scenarios than the first automobile industry occupation. This is driven by both the cost and benefit sides: on the one hand, companies provide more hours of workplace training, while also assigning a higher proportion of unproductive tasks to apprentices . As a result, costs increase and benefits decrease, leading to a general increase in the net training costs. All baseline models result in net training costs from the company’s perspective, even in the €300 apprentice wage scenario (Table 6). Again, Model 2 yields the highest net costs with €5,000, while Model 3 comes relatively close to the break-even point (€800).
Higher net costs

50
Results of the cost-benefit simulations
As with other occupations that result in higher net costs in our simulations, external hiring costs here are also high. For this occupation, they average around 9 months’ skilled worker pay. Hiring expenditure comes mainly from an initial loss in productivity (47%) and disruption costs (33%) during the adaptation period, as discussed above. This means that training is worthwhile if apprentice pay is kept low or the loyalty of apprentices is high, thus saving hiring costs.
Table 6: Net training costs in euros – Técnico en Electromecánica de Vehículos Automóviles
Wage Model 1 Model 2 Model 3 Hiring costs
€300 3,735 5,064 779 9 months’ skilled worker pay
€530 12,015 10,584 9,059
Source: own calculations
Sensitivity analysis of apprentice productivity
The changes in net training costs from changes in apprentice productivity levels are relatively modest. A 10 percentage point decrease in apprentice productivity in skilled tasks compared to a skilled worker results in an increase in net training costs of about €500 for all baseline models (Figure 16). Skill requirements in the automobile sector are such that apprentices are relatively unproductive at the beginning of their training, and companies tend not to assign many skilled tasks to apprentices in the first year of training (apprentices must accumulate the necessary human capital before they can perform skilled tasks effectively). This means that changes to the productivity parameter at the beginning of training have a minimal effect on overall net costs.
Saved hiring costs
Modest effects
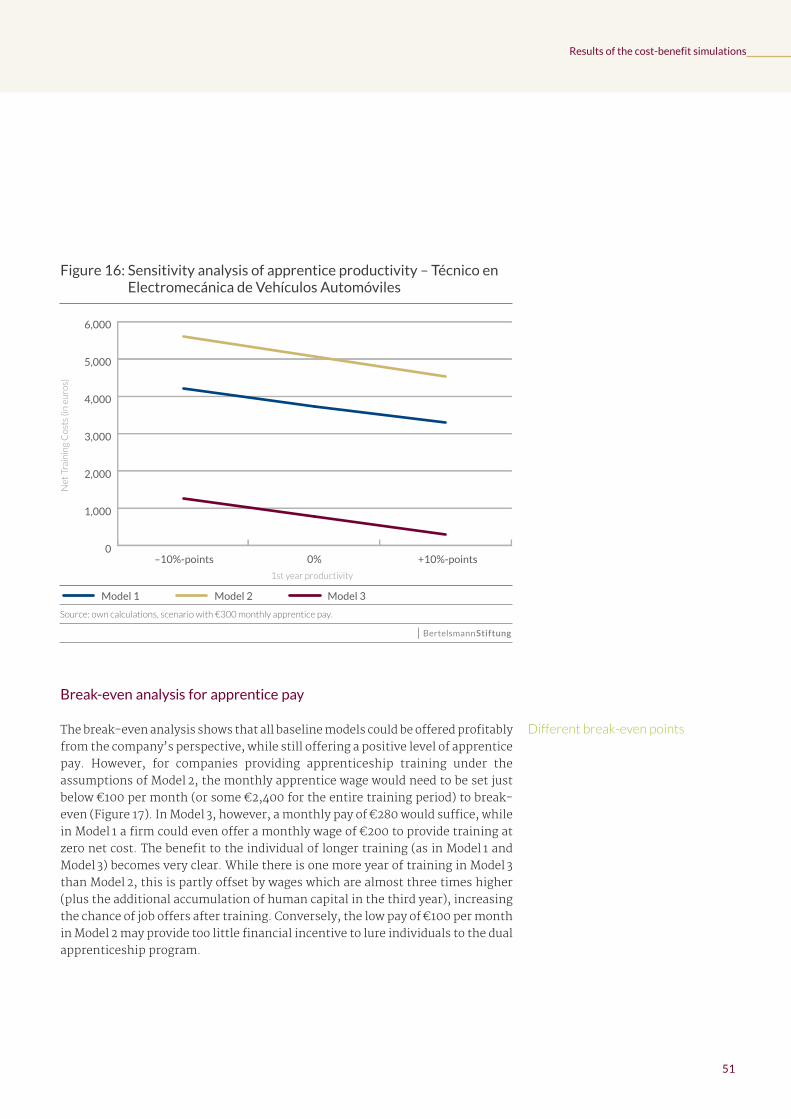
51
Results of the cost-benefit simulations
Figure 16: Sensitivity analysis of apprentice productivity – Técnico en Electromecánica de Vehículos Automóviles
Source: own calculations, scenario with €300 monthly apprentice pay.
0
1,000
2,000
3,000
4,000
5,000
6,000Model 3
Model 2
Model 1
+10%-points0% –10%-points
Net
Tra
inin
g C
ost
s (in
eu
ros)
1st year productivity
Model 3Model 2Model 1
Break-even analysis for apprentice pay
The break-even analysis shows that all baseline models could be offered profitably from the company’s perspective, while still offering a positive level of apprentice pay. However, for companies providing apprenticeship training under the assumptions of Model 2, the monthly apprentice wage would need to be set just below €100 per month (or some €2,400 for the entire training period) to break-even (Figure 17). In Model 3, however, a monthly pay of €280 would suffice, while in Model 1 a firm could even offer a monthly wage of €200 to provide training at zero net cost. The benefit to the individual of longer training (as in Model 1 and Model 3) becomes very clear. While there is one more year of training in Model 3 than Model 2, this is partly offset by wages which are almost three times higher (plus the additional accumulation of human capital in the third year), increasing the chance of job offers after training. Conversely, the low pay of €100 per month in Model 2 may provide too little financial incentive to lure individuals to the dual apprenticeship program.
Different break-even points
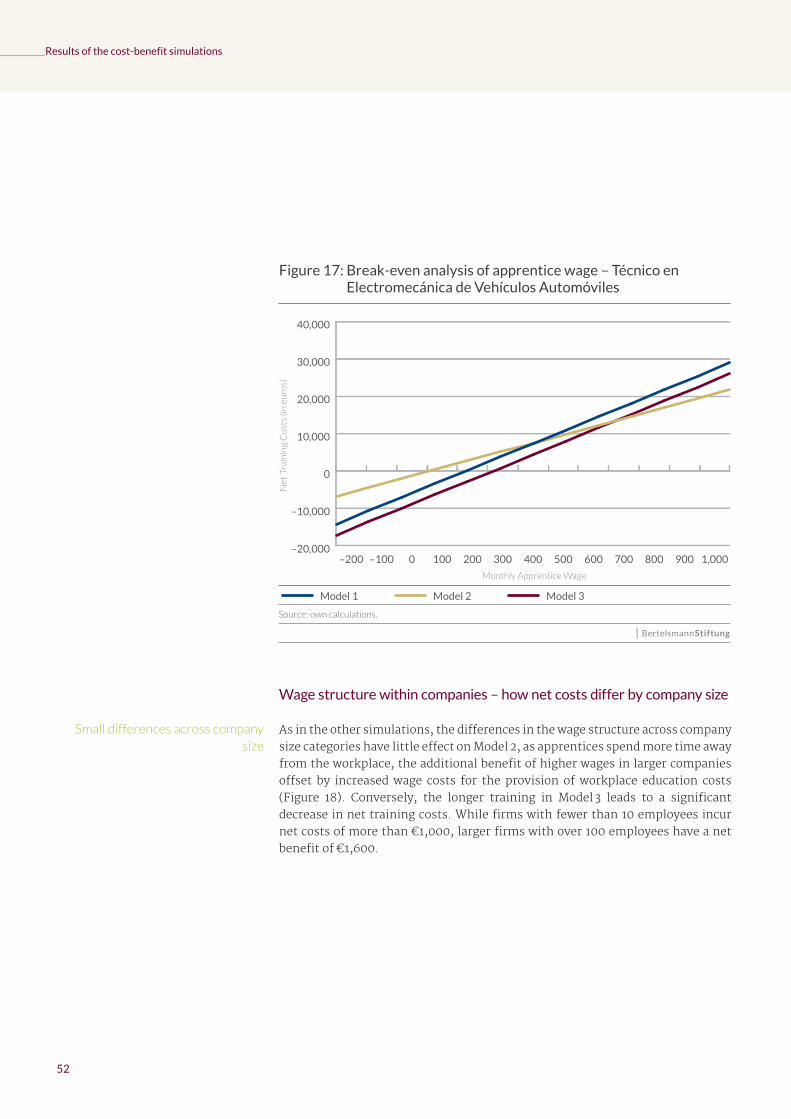
52
Results of the cost-benefit simulations
Figure 17: Break-even analysis of apprentice wage – Técnico en Electromecánica de Vehículos Automóviles
Source: own calculations.
–20,000
–10,000
0
10,000
20,000
30,000
40,000Model 3
Model 2
Model 1
1,0009008007006005004003002001000–100–200
Net
Tra
inin
g C
ost
s (in
eu
ros)
Monthly Apprentice Wage
Model 3Model 2Model 1
Wage structure within companies – how net costs differ by company size
As in the other simulations, the differences in the wage structure across company size categories have little effect on Model 2, as apprentices spend more time away from the workplace, the additional benefit of higher wages in larger companies offset by increased wage costs for the provision of workplace education costs (Figure 18). Conversely, the longer training in Model 3 leads to a significant decrease in net training costs. While firms with fewer than 10 employees incur net costs of more than €1,000, larger firms with over 100 employees have a net benefit of €1,600.
Small differences across company size
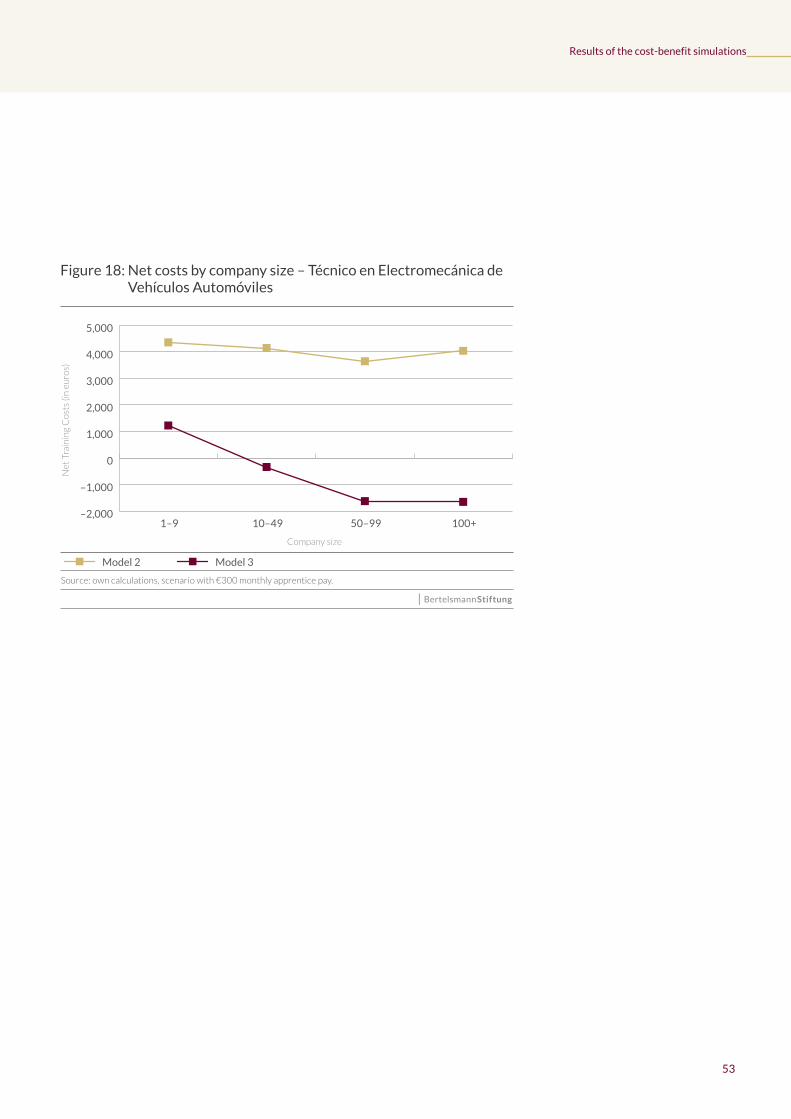
53
Results of the cost-benefit simulations
Figure 18: Net costs by company size – Técnico en Electromecánica de Vehículos Automóviles
Source: own calculations, scenario with €300 monthly apprentice pay.
Net
Tra
inin
g C
ost
s (in
eu
ros)
Company size
–2,000
–1,000
0
1,000
2,000
3,000
4,000
5,000Model 3
Model 2
100+ 50–99 10–49 1–9
Model 3Model 2

54
Results of the cost-benefit simulations
III. Retail industry
This section presents the results for the retail industry, focusing on the occupation of retail sales expert (Técnico Superior en Gestión de Ventas y Espacios Comerciales). The other retail occupation, store clerk, was analyzed in detail in Chapter 5.1.
1. Occupation “Técnico Superior en Gestión de Ventas y Espacios Comerciales”
Net training costs for apprentices and hiring costs for skilled workers
In the €300 apprentice wage scenario, both Model 1 and Model 3 result in net benefits of €2,500 and €7,600, respectively (Table 7). Conversely, Model 2 falls short of the break-even point.
The survey of companies’ experience hiring skilled workers from the external labor market reveals surprisingly high hiring costs, equivalent to around 15 months’ skilled worker pay. On average, about 50% of these costs come from external courses. However it remains unclear if these figures are representative for Spain. Most of the companies that participated in the workshops and responded to the survey are active nationwide, and highly engaged in improving staff skills. Smaller firms may therefore face lower costs when hiring from the external labor market. That firms offering apprenticeships based on the schemes in Model 1 or Model 3 can realize significant benefits, however, shows that additional post-training benefits from retaining apprentices are not necessary for companies to offer apprenticeship training in the retail sector – as long as apprentice pay is set at a reasonable level.
Table 7: Net training costs in euros – Técnico Superior en Gestión de Ventas y Espacios Comerciales
Wage Model 1 Model 2 Model 3 Hiring costs
€300 –2,501 –132 –7,597 15 months’ skilled worker pay
€530 5,779 5,388 683
Source: own calculations
Sensitivity analysis of apprentice productivity
The sensitivity analysis regarding the productivity parameter of apprentices indicates a relatively moderate effect. Nonetheless, decreasing the productivity in skilled tasks of an apprentice relative to a skilled worker by 10 percentage points turns a minimal net benefit in Model 2 into a minimal net cost of €500 (Figure 19). However, even though this changes training from a net investment into a
Benefits in low wage scenarios
High hiring costs
Moderate effects
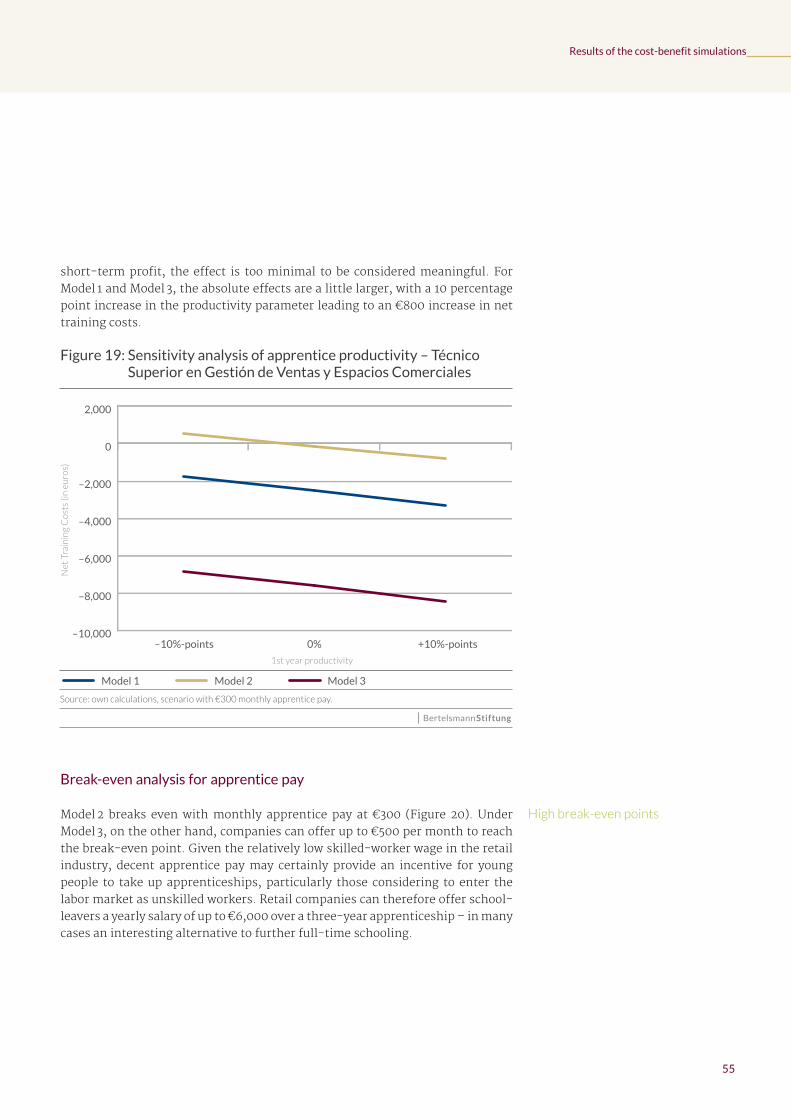
55
Results of the cost-benefit simulations
short-term profit, the effect is too minimal to be considered meaningful. For Model 1 and Model 3, the absolute effects are a little larger, with a 10 percentage point increase in the productivity parameter leading to an €800 increase in net training costs.
Figure 19: Sensitivity analysis of apprentice productivity – Técnico Superior en Gestión de Ventas y Espacios Comerciales
Source: own calculations, scenario with €300 monthly apprentice pay.
–10,000
–8,000
–6,000
–4,000
–2,000
0
2,000Model 3
Model 2
Model 1
+10%-points0% –10%-points
Net
Tra
inin
g C
ost
s (in
eu
ros)
1st year productivity
Model 3Model 2Model 1
Break-even analysis for apprentice pay
Model 2 breaks even with monthly apprentice pay at €300 (Figure 20). Under Model 3, on the other hand, companies can offer up to €500 per month to reach the break-even point. Given the relatively low skilled-worker wage in the retail industry, decent apprentice pay may certainly provide an incentive for young people to take up apprenticeships, particularly those considering to enter the labor market as unskilled workers. Retail companies can therefore offer school-leavers a yearly salary of up to €6,000 over a three-year apprenticeship – in many cases an interesting alternative to further full-time schooling.
High break-even points
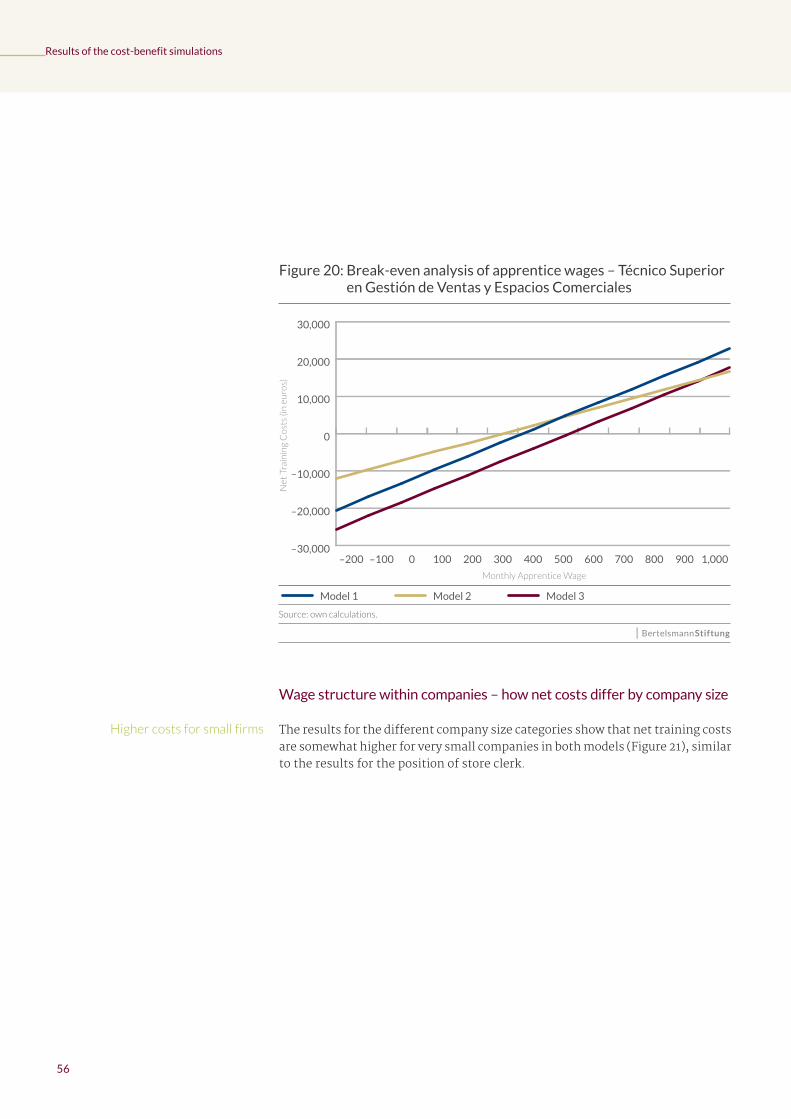
56
Results of the cost-benefit simulations
Figure 20: Break-even analysis of apprentice wages – Técnico Superior en Gestión de Ventas y Espacios Comerciales
Source: own calculations.
–30,000
–20,000
–10,000
0
10,000
20,000
30,000
1,0009008007006005004003002001000–100–200
Net
Tra
inin
g C
ost
s (in
eu
ros)
Monthly Apprentice Wage
Model 3Model 2Model 1
Wage structure within companies – how net costs differ by company size
The results for the different company size categories show that net training costs are somewhat higher for very small companies in both models (Figure 21), similar to the results for the position of store clerk.
Higher costs for small firms
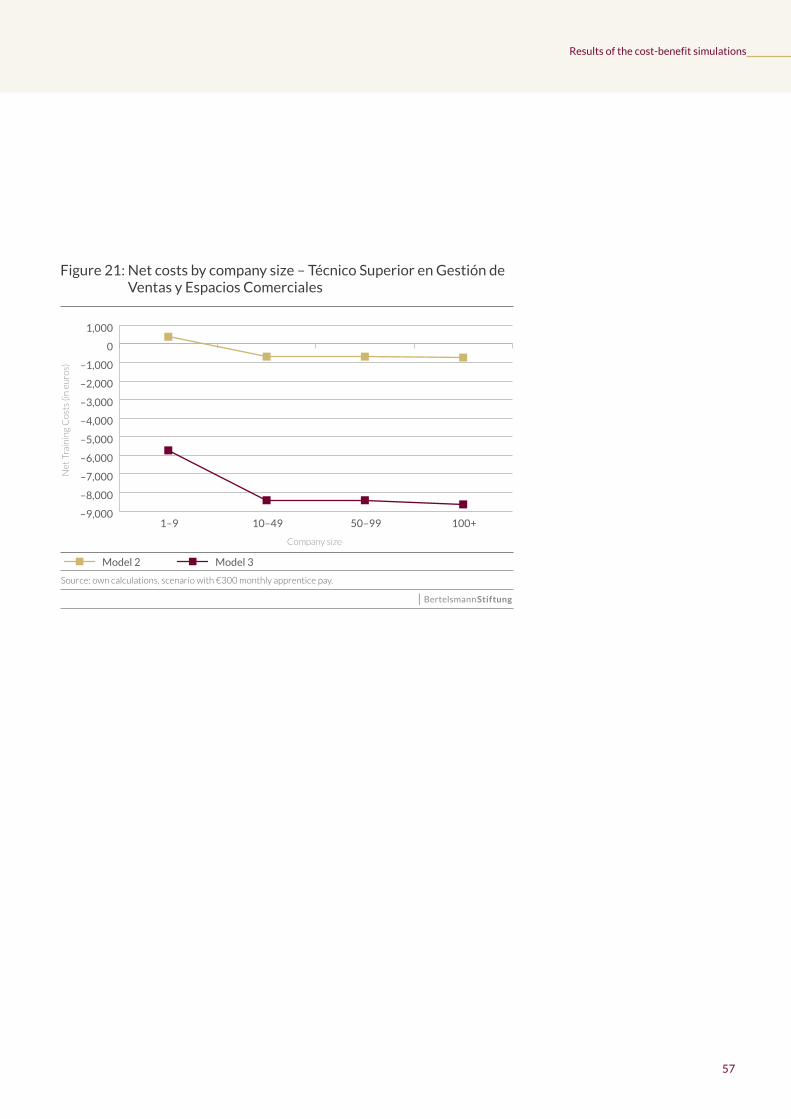
57
Results of the cost-benefit simulations
Figure 21: Net costs by company size – Técnico Superior en Gestión de Ventas y Espacios Comerciales
Source: own calculations, scenario with €300 monthly apprentice pay.
Net
Tra
inin
g C
ost
s (in
eu
ros)
Company size
–9,000
–8,000
–7,000
–6,000
–5,000
–4,000
–3,000
–2,000
–1,000
0
1,000Model 3
Model 2
100+ 50–99 10–49 1–9
Model 3Model 2

58
Results of the cost-benefit simulations
IV. Banking industry
For the banking industry, we focus on the occupation of bank clerk (Técnico en Gestión Administrativa).
1. Occupation “Técnico en Gestión Administrativa”
Net training costs for apprentices and hiring costs for skilled workers
The simulations of net training costs for bank clerks indicate pronounced differences between the different baseline models. In particular, while Model 1 sees the bank generating a small net benefit of almost €400, Model 2 results in net training costs of €4,000, while Model 3 yields a net benefit of €4,000 (Table 8). Model 2 is particularly costly in this occupation due to the high formal educational requirements of the Spanish training curriculum. In our simulations for Model 2 this means higher costs for banks, because they have to provide 650 hours’ formal education in the workplace.
Table 8: Net training costs in euros – Técnico en Gestión AdministrativaWage Model 1 Model 2 Model 3 Hiring costs
€300 –370 4,112 –4,165 6 months’ skilled worker pay
€530 7,910 9,632 4,115
Source: own calculations
Given the high skill requirements for the occupation of bank clerk, the average hiring costs reported by banks during the workshops reveals moderate hiring costs, equivalent to around 6 months’ skilled worker pay. However, these costs may be specific to current conditions in the Spanish labor market. Many university graduates fail to find positions commensurate with their educational attainments and are willing to accept jobs which fall short of their expectations. Banks may therefore have an oversupply of (over-)qualified applicants, which in turn results in lower hiring costs.17 The composition of hiring costs is divided almost equally between productivity loss during the adaptation period (33%), search costs (29%) and external courses (29%), with the remainder attributed to disruption costs.
Sensitivity analysis of apprentice productivity
The sensitivity analysis on the relative productivity parameter of apprentices at the beginning of their apprenticeships reveals above-average effects. A 10 percentage point increase in the relative productivity in skilled tasks of an
17 Muehlemann and Strupler Leiser (2015) show that in Switzerland, too, hiring costs for skilled workers depend on the labor market environment.
Differences across models
Low hiring costs
Above-average effects
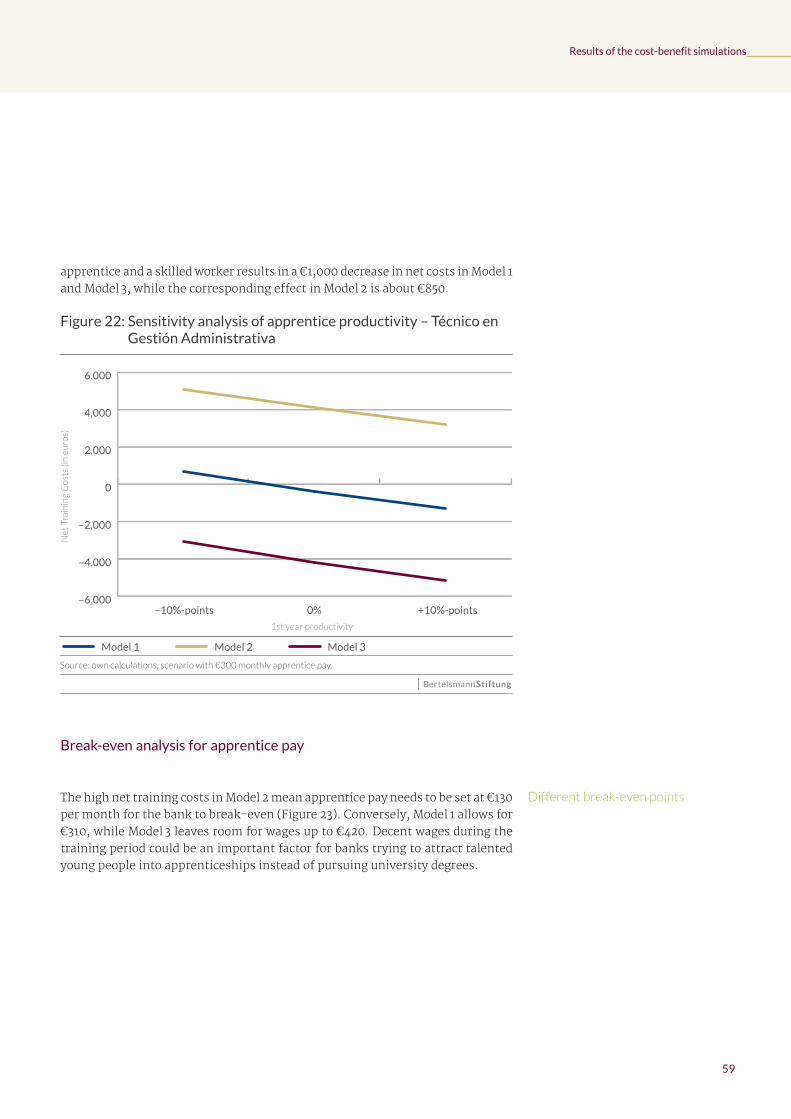
59
Results of the cost-benefit simulations
apprentice and a skilled worker results in a €1,000 decrease in net costs in Model 1 and Model 3, while the corresponding effect in Model 2 is about €850.
Figure 22: Sensitivity analysis of apprentice productivity – Técnico en Gestión Administrativa
Source: own calculations, scenario with €300 monthly apprentice pay.
–6,000
–4,000
–2,000
0
2,000
4,000
6,000Model 3
Model 2
Model 1
+10%-points0% –10%-points
Net
Tra
inin
g C
ost
s (in
eu
ros)
1st year productivity
Model 3Model 2Model 1
Break-even analysis for apprentice pay
The high net training costs in Model 2 mean apprentice pay needs to be set at €130 per month for the bank to break-even (Figure 23). Conversely, Model 1 allows for €310, while Model 3 leaves room for wages up to €420. Decent wages during the training period could be an important factor for banks trying to attract talented young people into apprenticeships instead of pursuing university degrees.
Different break-even points
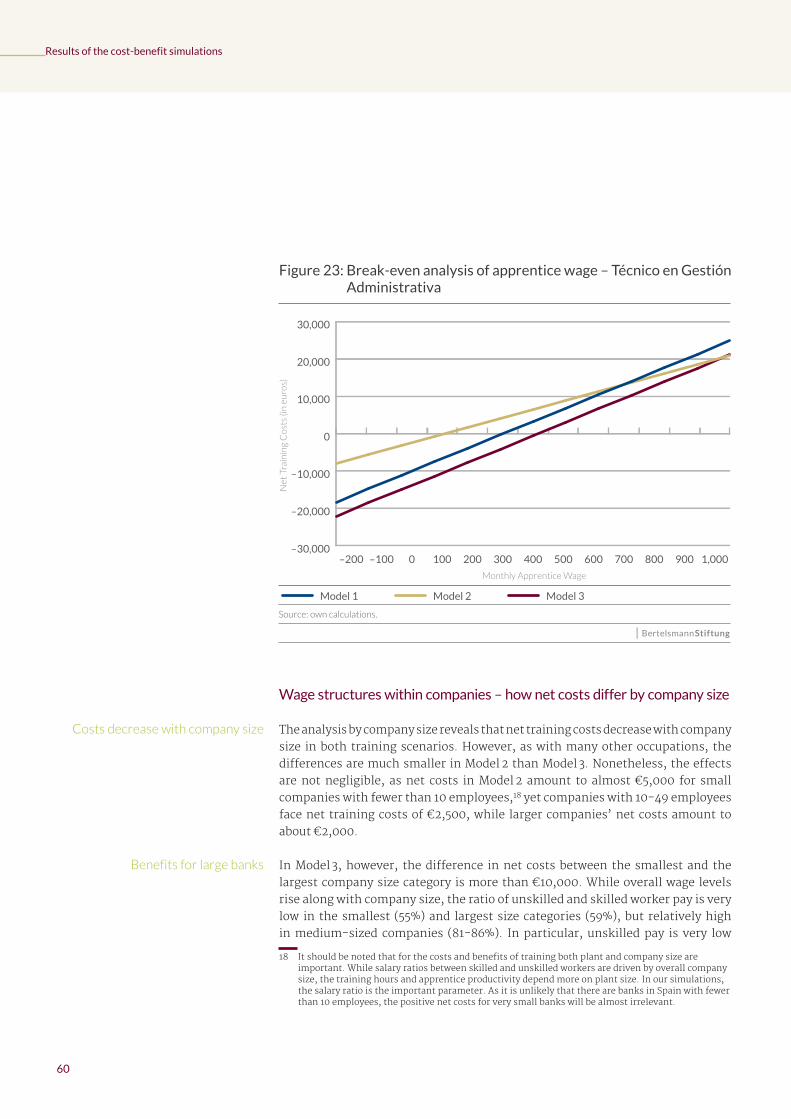
60
Results of the cost-benefit simulations
Figure 23: Break-even analysis of apprentice wage – Técnico en Gestión Administrativa
Source: own calculations.
–30,000
–20,000
–10,000
0
10,000
20,000
30,000Model 3
Model 2
Model 1
1,0009008007006005004003002001000–100–200
Net
Tra
inin
g C
ost
s (in
eu
ros)
Monthly Apprentice Wage
Model 3Model 2Model 1
Wage structures within companies – how net costs differ by company size
The analysis by company size reveals that net training costs decrease with company size in both training scenarios. However, as with many other occupations, the differences are much smaller in Model 2 than Model 3. Nonetheless, the effects are not negligible, as net costs in Model 2 amount to almost €5,000 for small companies with fewer than 10 employees,18 yet companies with 10-49 employees face net training costs of €2,500, while larger companies’ net costs amount to about €2,000.
In Model 3, however, the difference in net costs between the smallest and the largest company size category is more than €10,000. While overall wage levels rise along with company size, the ratio of unskilled and skilled worker pay is very low in the smallest (55%) and largest size categories (59%), but relatively high in medium-sized companies (81-86%). In particular, unskilled pay is very low
18 It should be noted that for the costs and benefits of training both plant and company size are important. While salary ratios between skilled and unskilled workers are driven by overall company size, the training hours and apprentice productivity depend more on plant size. In our simulations, the salary ratio is the important parameter. As it is unlikely that there are banks in Spain with fewer than 10 employees, the positive net costs for very small banks will be almost irrelevant.
Costs decrease with company size
Benefits for large banks
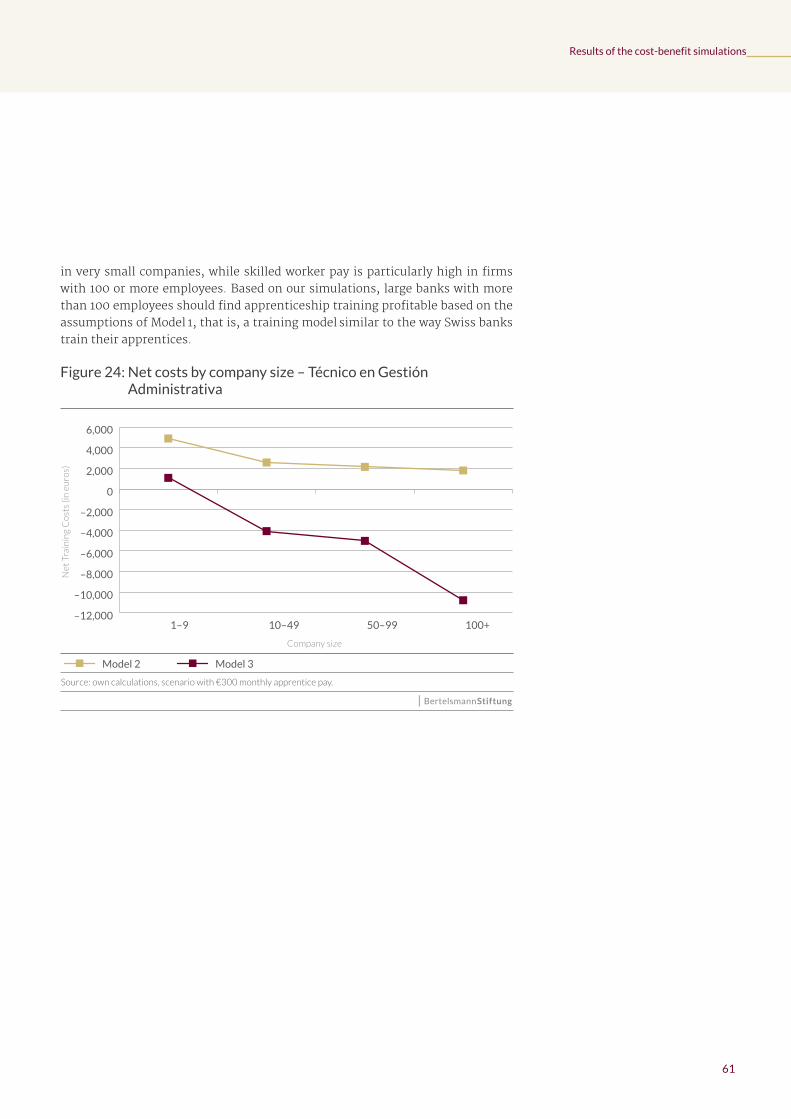
61
Results of the cost-benefit simulations
in very small companies, while skilled worker pay is particularly high in firms with 100 or more employees. Based on our simulations, large banks with more than 100 employees should find apprenticeship training profitable based on the assumptions of Model 1, that is, a training model similar to the way Swiss banks train their apprentices.
Figure 24: Net costs by company size – Técnico en Gestión Administrativa
Source: own calculations, scenario with €300 monthly apprentice pay.
Net
Tra
inin
g C
ost
s (in
eu
ros)
Company size
–12,000
–10,000
–8,000
–6,000
–4,000
–2,000
0
2,000
4,000
6,000
100+ 50–99 10–49 1–9
Model 3Model 2
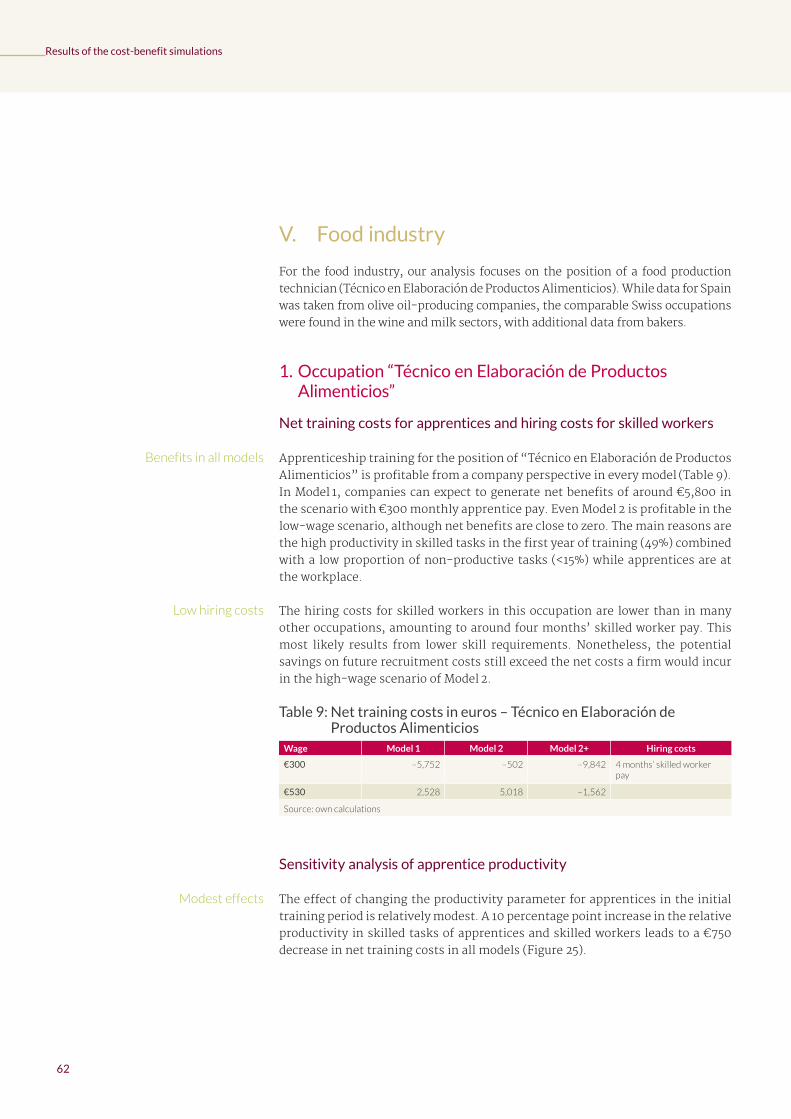
62
Results of the cost-benefit simulations
V. Food industry
For the food industry, our analysis focuses on the position of a food production technician (Técnico en Elaboración de Productos Alimenticios). While data for Spain was taken from olive oil-producing companies, the comparable Swiss occupations were found in the wine and milk sectors, with additional data from bakers.
1. Occupation “Técnico en Elaboración de Productos Alimenticios”
Net training costs for apprentices and hiring costs for skilled workers
Apprenticeship training for the position of “Técnico en Elaboración de Productos Alimenticios” is profitable from a company perspective in every model (Table 9). In Model 1, companies can expect to generate net benefits of around €5,800 in the scenario with €300 monthly apprentice pay. Even Model 2 is profitable in the low-wage scenario, although net benefits are close to zero. The main reasons are the high productivity in skilled tasks in the first year of training (49%) combined with a low proportion of non-productive tasks (<15%) while apprentices are at the workplace.
The hiring costs for skilled workers in this occupation are lower than in many other occupations, amounting to around four months’ skilled worker pay. This most likely results from lower skill requirements. Nonetheless, the potential savings on future recruitment costs still exceed the net costs a firm would incur in the high-wage scenario of Model 2.
Table 9: Net training costs in euros – Técnico en Elaboración de Productos Alimenticios
Wage Model 1 Model 2 Model 2+ Hiring costs
€300 –5,752 –502 –9,842 4 months’ skilled worker pay
€530 2,528 5,018 –1,562
Source: own calculations
Sensitivity analysis of apprentice productivity
The effect of changing the productivity parameter for apprentices in the initial training period is relatively modest. A 10 percentage point increase in the relative productivity in skilled tasks of apprentices and skilled workers leads to a €750 decrease in net training costs in all models (Figure 25).
Benefits in all models
Low hiring costs
Modest effects
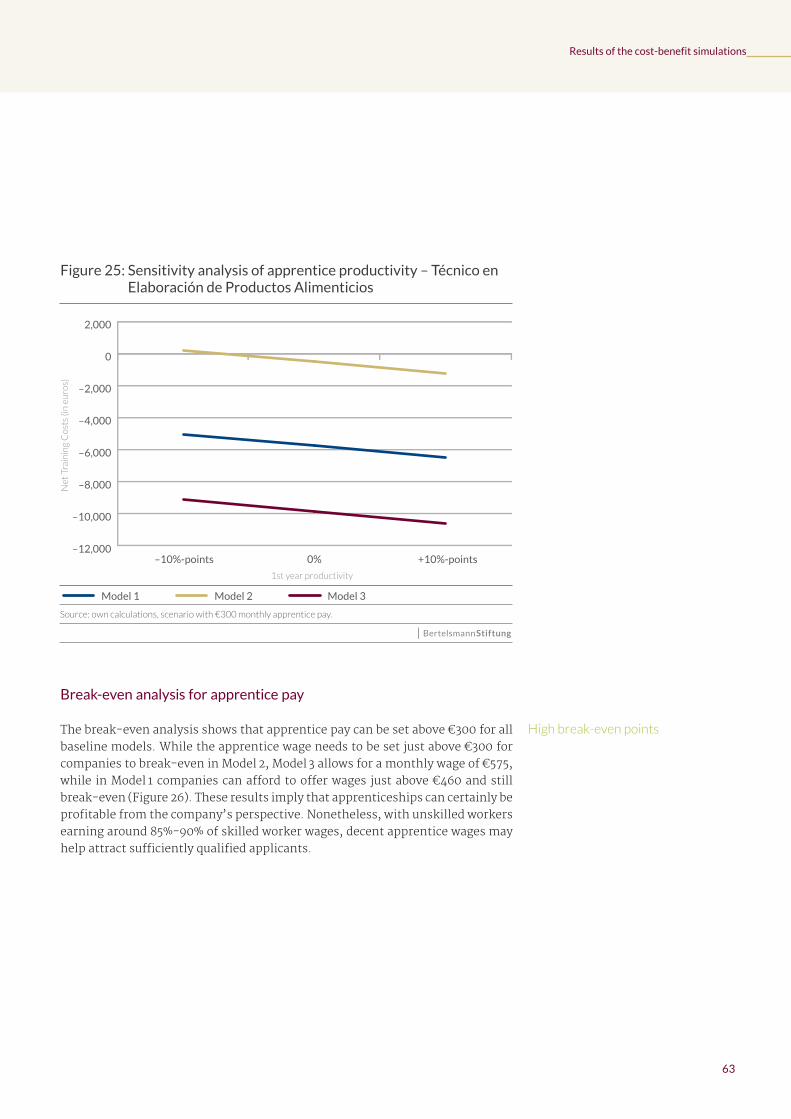
63
Results of the cost-benefit simulations
Figure 25: Sensitivity analysis of apprentice productivity – Técnico en Elaboración de Productos Alimenticios
Source: own calculations, scenario with €300 monthly apprentice pay.
–12,000
–10,000
–8,000
–6,000
–4,000
–2,000
0
2,000Model 3
Model 2
Model 1
+10%-points0% –10%-points
Net
Tra
inin
g C
ost
s (in
eu
ros)
1st year productivity
Model 3Model 2Model 1
Break-even analysis for apprentice pay
The break-even analysis shows that apprentice pay can be set above €300 for all baseline models. While the apprentice wage needs to be set just above €300 for companies to break-even in Model 2, Model 3 allows for a monthly wage of €575, while in Model 1 companies can afford to offer wages just above €460 and still break-even (Figure 26). These results imply that apprenticeships can certainly be profitable from the company’s perspective. Nonetheless, with unskilled workers earning around 85%-90% of skilled worker wages, decent apprentice wages may help attract sufficiently qualified applicants.
High break-even points
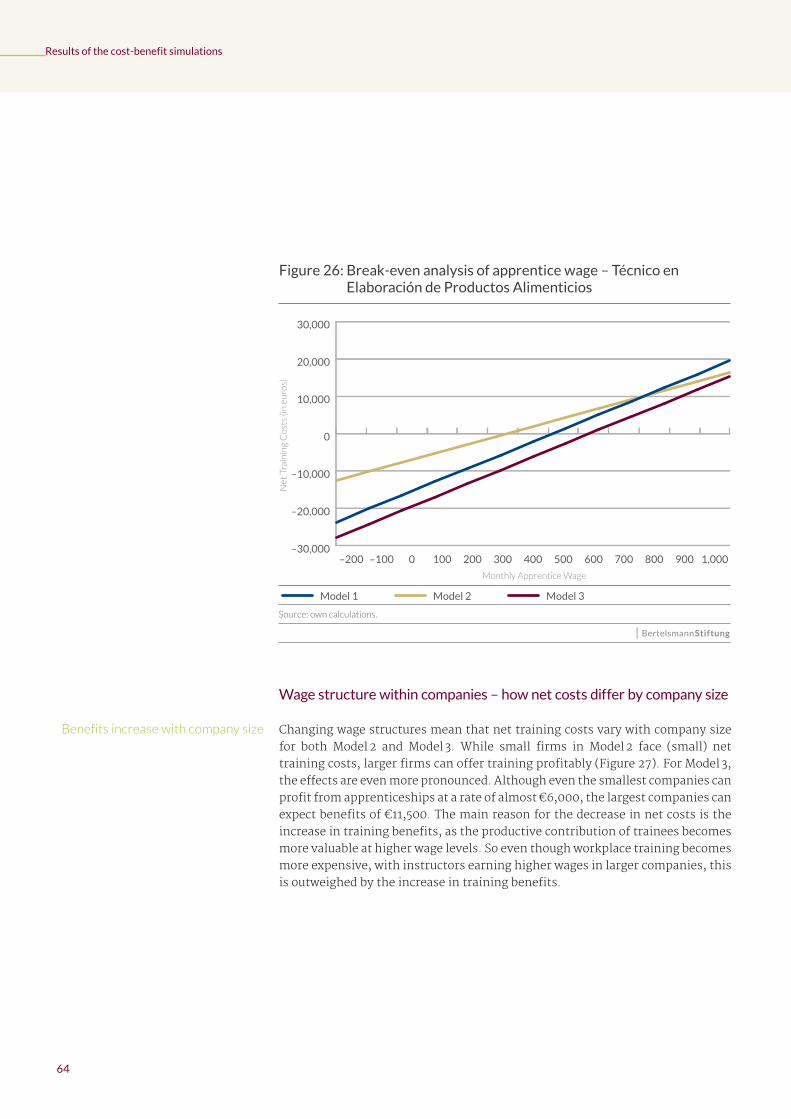
64
Results of the cost-benefit simulations
Figure 26: Break-even analysis of apprentice wage – Técnico en Elaboración de Productos Alimenticios
Source: own calculations.
–30,000
–20,000
–10,000
0
10,000
20,000
30,000Model 3
Model 2
Model 1
1,0009008007006005004003002001000–100–200
Net
Tra
inin
g C
ost
s (in
eu
ros)
Monthly Apprentice Wage
Model 3Model 2Model 1
Wage structure within companies – how net costs differ by company size
Changing wage structures mean that net training costs vary with company size for both Model 2 and Model 3. While small firms in Model 2 face (small) net training costs, larger firms can offer training profitably (Figure 27). For Model 3, the effects are even more pronounced. Although even the smallest companies can profit from apprenticeships at a rate of almost €6,000, the largest companies can expect benefits of €11,500. The main reason for the decrease in net costs is the increase in training benefits, as the productive contribution of trainees becomes more valuable at higher wage levels. So even though workplace training becomes more expensive, with instructors earning higher wages in larger companies, this is outweighed by the increase in training benefits.
Benefits increase with company size
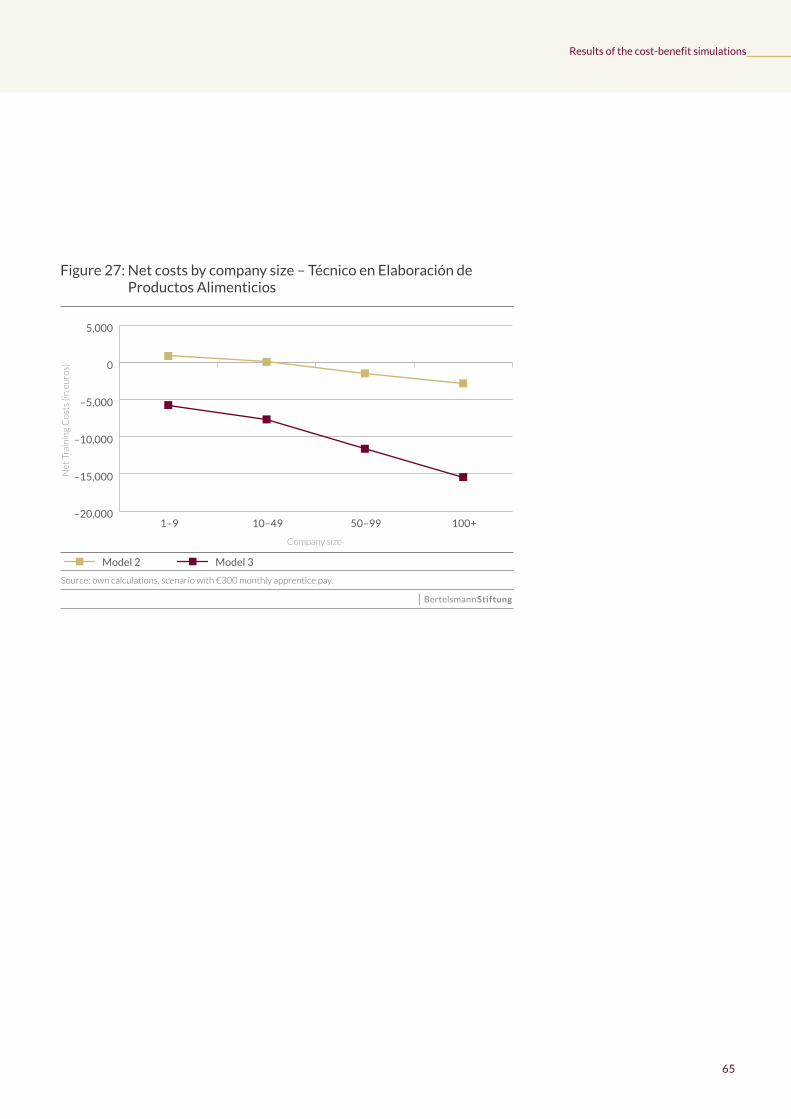
65
Results of the cost-benefit simulations
Figure 27: Net costs by company size – Técnico en Elaboración de Productos Alimenticios
Source: own calculations, scenario with €300 monthly apprentice pay.
Net
Tra
inin
g C
ost
s (in
eu
ros)
Company size
–20,000
–15,000
–10,000
–5,000
0
5,000Model 3
Model 2
100+ 50–99 10–49 1–9
Model 3Model 2

66
Results of the cost-benefit simulations
VI. Hotel industry
Our analysis of the hotel industry focuses on the positions of hotel management specialist (Técnico Superior en Gestión de Alojamientos Turísticos) and “Técnico en Servicios en Restauración.” The latter has a training plan for which there is no real parallel in Switzerland. We therefore simulate the net costs for cooks working in hotels or restaurants, assuming the training plan of the “Técnico en Servicios en Restauración” could be rearranged to include the cooking skills necessary. This assumption should not affect our results, as all the training plans considered here have a similar proportions of formal vocational teaching and workplace experience.
1. Occupation “Técnico Superior en Gestión de Alojamientos Turísticos”
Net training costs for apprentices and hiring costs for skilled workers
The position of hotel management specialist is the most profitable of the 10 occupations in terms of net benefits from the company perspective. In Model 1, a firm can generate a net benefit of €8,000 in the scenario with apprentice wages of €300 (Table 10). In Model 3 companies can even expect a net benefit of €13,000. Model 2 is profitable in the low-wage scenario, yet companies would be liable for net costs of almost €3,000 for a monthly wage of €530. Most notably, apprentices spend very little time on unproductive tasks in the workplace (<10%). Moreover, apprentices carry out skilled tasks for 45% of their time in the workplace at a relative productivity level of >50%. Thus the position of hotel management specialist can be characterized as having lower skill requirements than other occupations, so that apprentices can be substituted for other types of workers early on. Nonetheless, the skill premium in this occupation is about 25%, meaning that workers with vocational qualifications will earn 25% more compared to workers without post-compulsory education. This means that both individuals and companies benefit from a dual apprenticeship program.
Table 10: Net training costs in euros – Técnico Superior en Gestión de Alojamientos Turísticos
Wage Model 1 Model 2 Model 3 Hiring costs
€300 –7,956 –2,689 –13,047 5 months’ skilled worker pay
€530 324 2,831 –4,767
Source: own calculations
Highest benefits from training
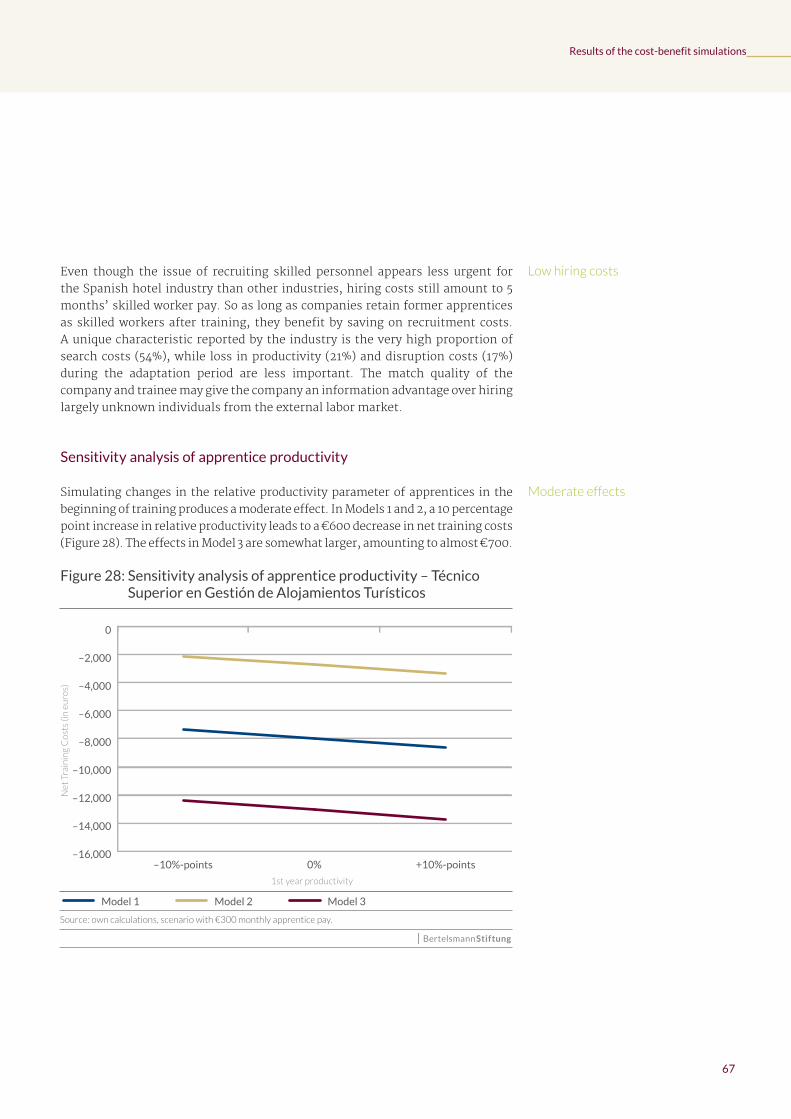
67
Results of the cost-benefit simulations
Even though the issue of recruiting skilled personnel appears less urgent for the Spanish hotel industry than other industries, hiring costs still amount to 5 months’ skilled worker pay. So as long as companies retain former apprentices as skilled workers after training, they benefit by saving on recruitment costs. A unique characteristic reported by the industry is the very high proportion of search costs (54%), while loss in productivity (21%) and disruption costs (17%) during the adaptation period are less important. The match quality of the company and trainee may give the company an information advantage over hiring largely unknown individuals from the external labor market.
Sensitivity analysis of apprentice productivity
Simulating changes in the relative productivity parameter of apprentices in the beginning of training produces a moderate effect. In Models 1 and 2, a 10 percentage point increase in relative productivity leads to a €600 decrease in net training costs (Figure 28). The effects in Model 3 are somewhat larger, amounting to almost €700.
Figure 28: Sensitivity analysis of apprentice productivity – Técnico Superior en Gestión de Alojamientos Turísticos
Source: own calculations, scenario with €300 monthly apprentice pay.
–16,000
–14,000
–12,000
–10,000
–8,000
–6,000
–4,000
–2,000
0Model 3
Model 2
Model 1
+10%-points0%–10%-points
Net
Tra
inin
g C
ost
s (in
eu
ros)
1st year productivity
Model 3Model 2Model 1
Low hiring costs
Moderate effects
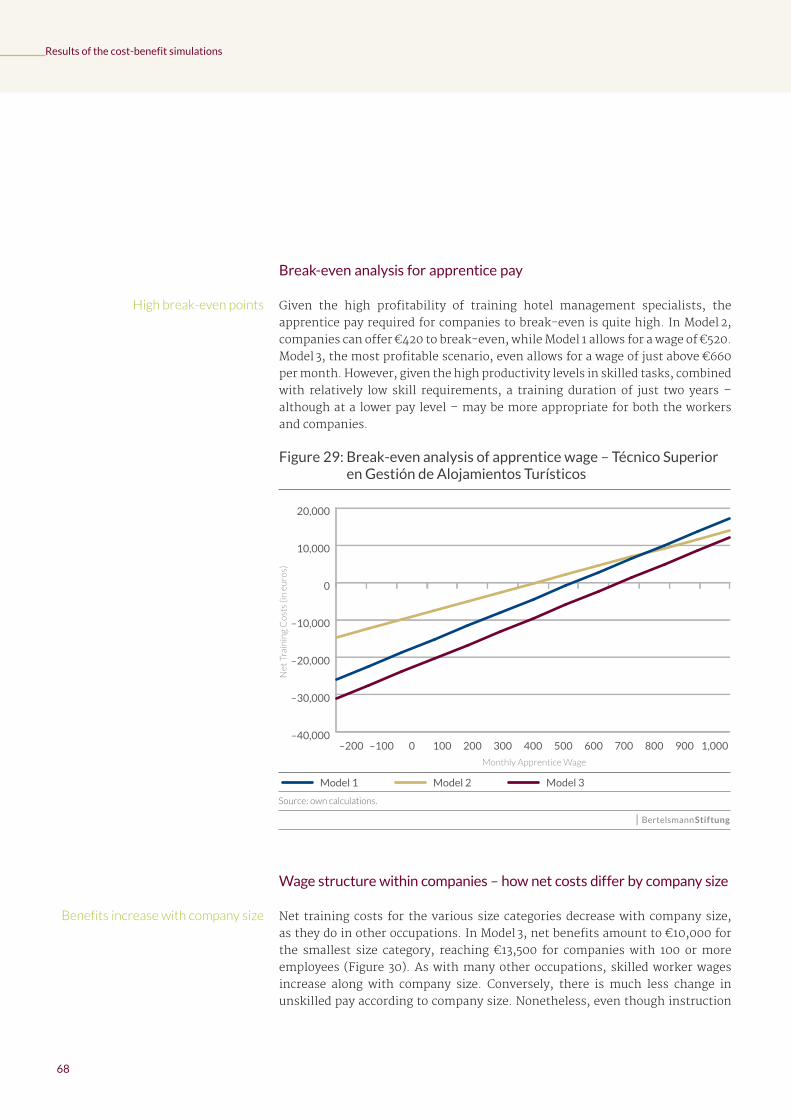
68
Results of the cost-benefit simulations
Break-even analysis for apprentice pay
Given the high profitability of training hotel management specialists, the apprentice pay required for companies to break-even is quite high. In Model 2, companies can offer €420 to break-even, while Model 1 allows for a wage of €520. Model 3, the most profitable scenario, even allows for a wage of just above €660 per month. However, given the high productivity levels in skilled tasks, combined with relatively low skill requirements, a training duration of just two years – although at a lower pay level – may be more appropriate for both the workers and companies.
Figure 29: Break-even analysis of apprentice wage – Técnico Superior en Gestión de Alojamientos Turísticos
Source: own calculations.
–40,000
–30,000
–20,000
–10,000
0
10,000
20,000Model 3
Model 2
Model 1
1,0009008007006005004003002001000–100–200
Net
Tra
inin
g C
ost
s (in
eu
ros)
Monthly Apprentice Wage
Model 3Model 2Model 1
Wage structure within companies – how net costs differ by company size
Net training costs for the various size categories decrease with company size, as they do in other occupations. In Model 3, net benefits amount to €10,000 for the smallest size category, reaching €13,500 for companies with 100 or more employees (Figure 30). As with many other occupations, skilled worker wages increase along with company size. Conversely, there is much less change in unskilled pay according to company size. Nonetheless, even though instruction
High break-even points
Benefits increase with company size
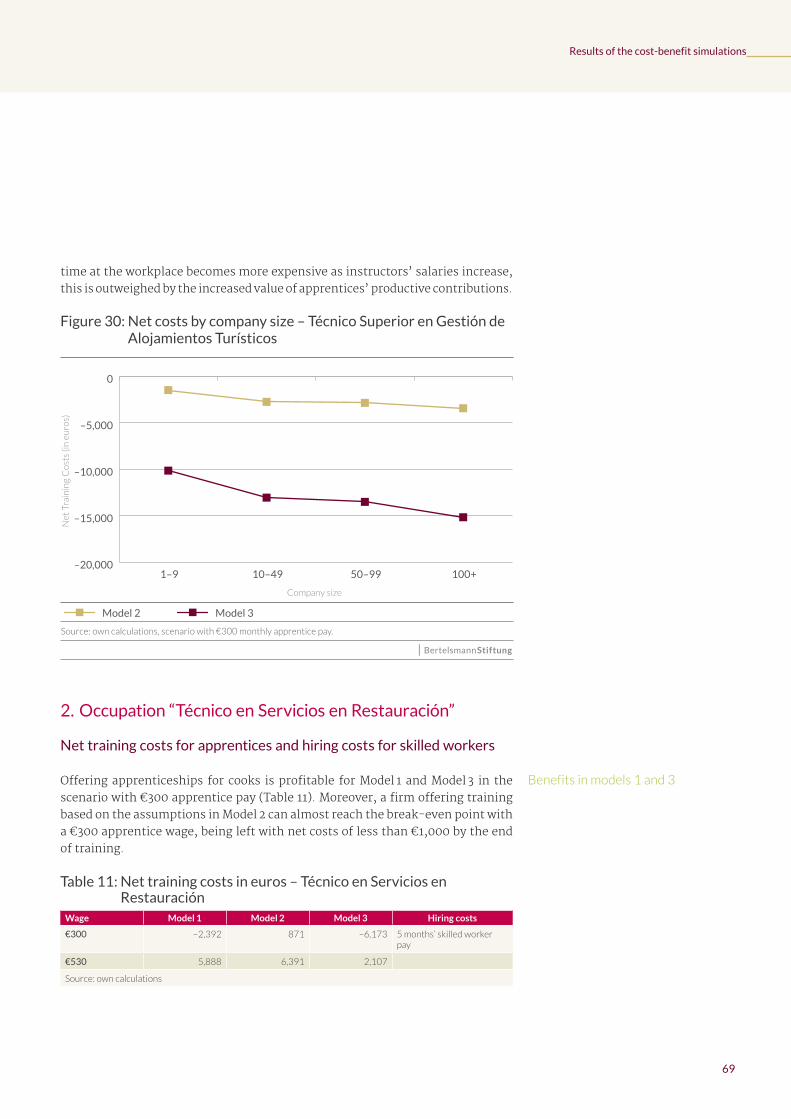
69
Results of the cost-benefit simulations
time at the workplace becomes more expensive as instructors’ salaries increase, this is outweighed by the increased value of apprentices’ productive contributions.
Figure 30: Net costs by company size – Técnico Superior en Gestión de Alojamientos Turísticos
Source: own calculations, scenario with €300 monthly apprentice pay.
Net
Tra
inin
g C
ost
s (in
eu
ros)
Company size
–20,000
–15,000
–10,000
–5,000
0Model 3
Model 2
100+ 50–99 10–49 1–9
Model 3Model 2
2. Occupation “Técnico en Servicios en Restauración”
Net training costs for apprentices and hiring costs for skilled workers
Offering apprenticeships for cooks is profitable for Model 1 and Model 3 in the scenario with €300 apprentice pay (Table 11). Moreover, a firm offering training based on the assumptions in Model 2 can almost reach the break-even point with a €300 apprentice wage, being left with net costs of less than €1,000 by the end of training.
Table 11: Net training costs in euros – Técnico en Servicios en Restauración
Wage Model 1 Model 2 Model 3 Hiring costs
€300 –2,392 871 –6,173 5 months’ skilled worker pay
€530 5,888 6,391 2,107
Source: own calculations
Benefits in models 1 and 3

70
Results of the cost-benefit simulations
Net training costs are considerably higher than for the first occupation in the hotel industry (hotel management specialist), mainly because of the lower initial relative productivity of apprentices in skilled tasks (37% vs. 53%), and a higher share of unproductive tasks (15% vs. 8%) at the workplace. Moreover, both skilled and unskilled cooks are paid less, thereby reducing the value of an apprentice’s productive contribution. Here training would be profitable in Model 1 with low wages, or Model 3 with slightly higher wages and a longer duration. It is impossible to say which of the two models would work better. In Switzerland apprentice pay is usually linked to the level of skilled wages, meaning that low-paying occupations also pay lower apprentices wages and vice versa. However, occupations with unusual working hours (such as restaurants) or hard physical labor (construction industry) are exceptions to this rule as they have to pay high apprentice wages to attract young people into these occupation.
The hiring costs are very similar to the previously investigated occupation, the equivalent of around 5 months’ wages. Moreover, search costs account for more than half of total hiring costs; skill requirements may not be particularly high, but finding people with the right motivation and dedication can be difficult.
Sensitivity analysis of apprentice productivity
The impact of changes in productivity assumptions is very much in line with the first occupation in the hotel industry, as discussed above. A 10 percentage point increase in the relative productivity in skilled tasks of an apprentice and a skilled worker results in a €500 decrease in net costs in all baseline models (Figure 31).
Differences within the hotel industry
Hiring costs
Moderate effects
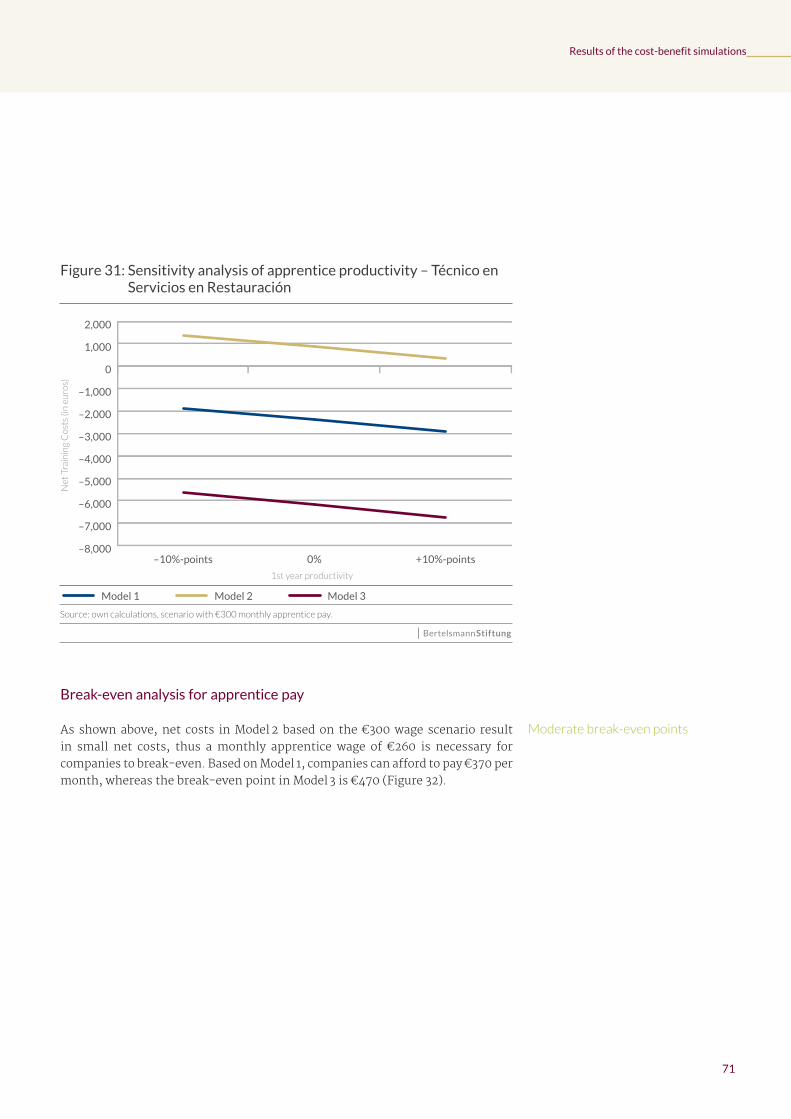
71
Results of the cost-benefit simulations
Figure 31: Sensitivity analysis of apprentice productivity – Técnico en Servicios en Restauración
Source: own calculations, scenario with €300 monthly apprentice pay.
–8,000
–7,000
–6,000
–5,000
–4,000
–3,000
–2,000
–1,000
0
1,000
2,000Model 3
Model 2
Model 1
+10%-points0%–10%-points
Net
Tra
inin
g C
ost
s (in
eu
ros)
1st year productivity
Model 3Model 2Model 1
Break-even analysis for apprentice pay
As shown above, net costs in Model 2 based on the €300 wage scenario result in small net costs, thus a monthly apprentice wage of €260 is necessary for companies to break-even. Based on Model 1, companies can afford to pay €370 per month, whereas the break-even point in Model 3 is €470 (Figure 32).
Moderate break-even points
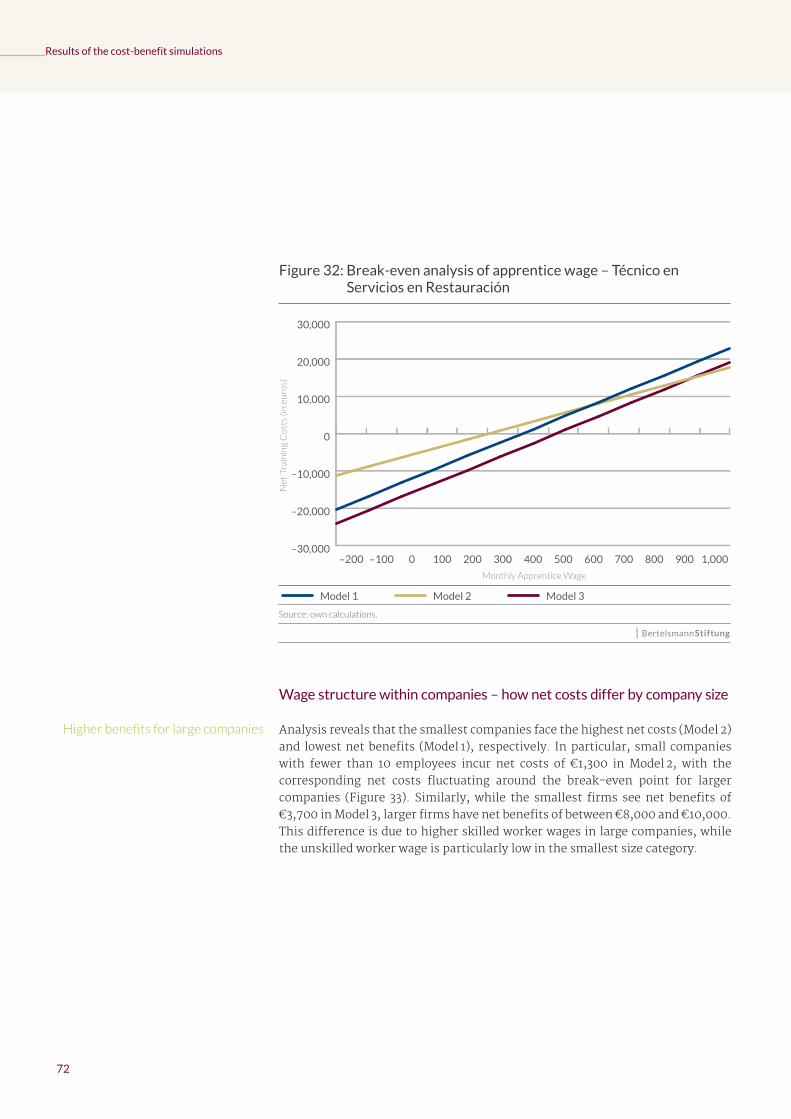
72
Results of the cost-benefit simulations
Figure 32: Break-even analysis of apprentice wage – Técnico en Servicios en Restauración
Source: own calculations.
–30,000
–20,000
–10,000
0
10,000
20,000
30,000Model 3
Model 2
Model 1
1,0009008007006005004003002001000–100–200
Net
Tra
inin
g C
ost
s (in
eu
ros)
Monthly Apprentice Wage
Model 3Model 2Model 1
Wage structure within companies – how net costs differ by company size
Analysis reveals that the smallest companies face the highest net costs (Model 2) and lowest net benefits (Model 1), respectively. In particular, small companies with fewer than 10 employees incur net costs of €1,300 in Model 2, with the corresponding net costs fluctuating around the break-even point for larger companies (Figure 33). Similarly, while the smallest firms see net benefits of €3,700 in Model 3, larger firms have net benefits of between €8,000 and €10,000. This difference is due to higher skilled worker wages in large companies, while the unskilled worker wage is particularly low in the smallest size category.
Higher benefits for large companies
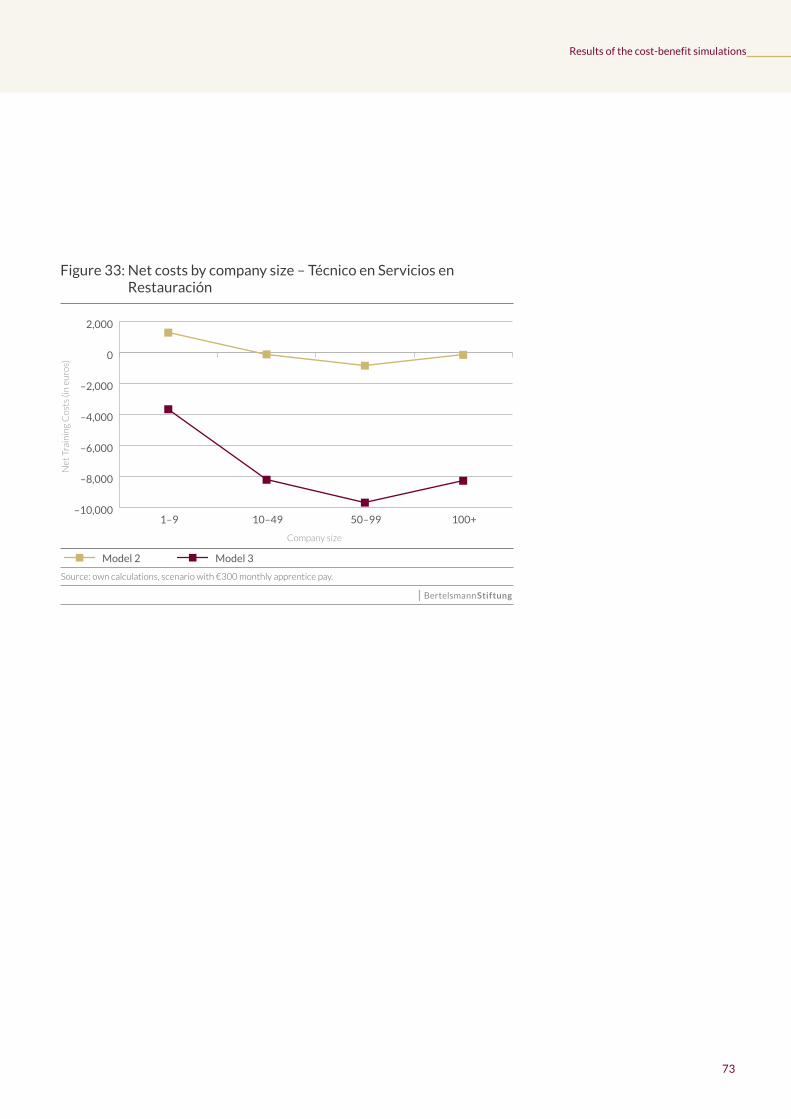
73
Results of the cost-benefit simulations
Figure 33: Net costs by company size – Técnico en Servicios en Restauración
Source: own calculations, scenario with €300 monthly apprentice pay.
Net
Tra
inin
g C
ost
s (in
eu
ros)
Company size
–10,000
–8,000
–6,000
–4,000
–2,000
0
2,000Model 3
Model 2
100+ 50–99 10–49 1–9
Model 3Model 2
74
1. Overall results
Table 12 provides a summary of the net cost simulations for all occupations and scenarios and the potential savings in hiring costs. Net costs equivalent to one month’s salary for a skilled worker or more are in red. Net costs or benefits within a bandwidth of +/- €3,000 are in light green. Depending on the potential deviations from our assumptions, these outcomes should all be around the break-even point, and where the model results in net costs, these should be easily offset by benefits that accrue after training. Finally, outcomes with simulated net benefits exceeding €3,000 are in dark green, clearly indicating that this training model would be profitable for the average company. The potentially saved hiring costs (column HC in Table 12) are shown in dark green when these extra benefits exceed three months’ wages for a skilled worker. We make the very conservative assumption that a firm is only able to retain a third of its trained apprentices (which corresponds to the Swiss average), and we multiply this result by the saved hiring costs calculated from data provided by the Spanish companies that participated in our workshops. Saved hiring costs between two and three months’ wages for a skilled worker are in light green, below two months’ wages in red. In this case, companies appear to experience little difficulty in hiring from the labor market are therefore unlikely to benefit in a way that would justify considerable net training costs.
Looking at the results, three major patterns emerge. First, at least one model or specification leads to expected net training benefits in every occupation. Second, there is a correlation between the expected saved hiring costs and the number of simulation models for an occupation that lead to net costs (or benefits). The more red there is on the net cost side of the simulations, the more likely the saved hiring cost side will be green. In the chemical and automobile industries, where companies reported the highest recruiting costs overall, one of the two training occupations has more scenarios resulting in net costs than net benefits. However, this may result from the demanding training for these occupations in terms of time, including (non-productive) practice, but the training ultimately creates skills that are very difficult to find on the external labor market. Conversely, in the food industry and hospitality sector, there are low external hiring costs and most scenarios result in net benefits. In other words, training in these sectors and occupations has to be cost-neutral by the end of the training period on average, as companies cannot expect substantial post-training benefits. Somewhere in between is the position of bank clerk. Training bank clerks with high apprentice wages would not be profitable for banks, and because of current labor market conditions, with numerously readily employable graduates from universities and schools, banks prefer to employ directly from the educational system and provide new employees with short in-house training programs rather than long-term, formal training plans. This situation could change again if labor market conditions change.
Representation of the results
Three main results
7 Summary analyses of the results
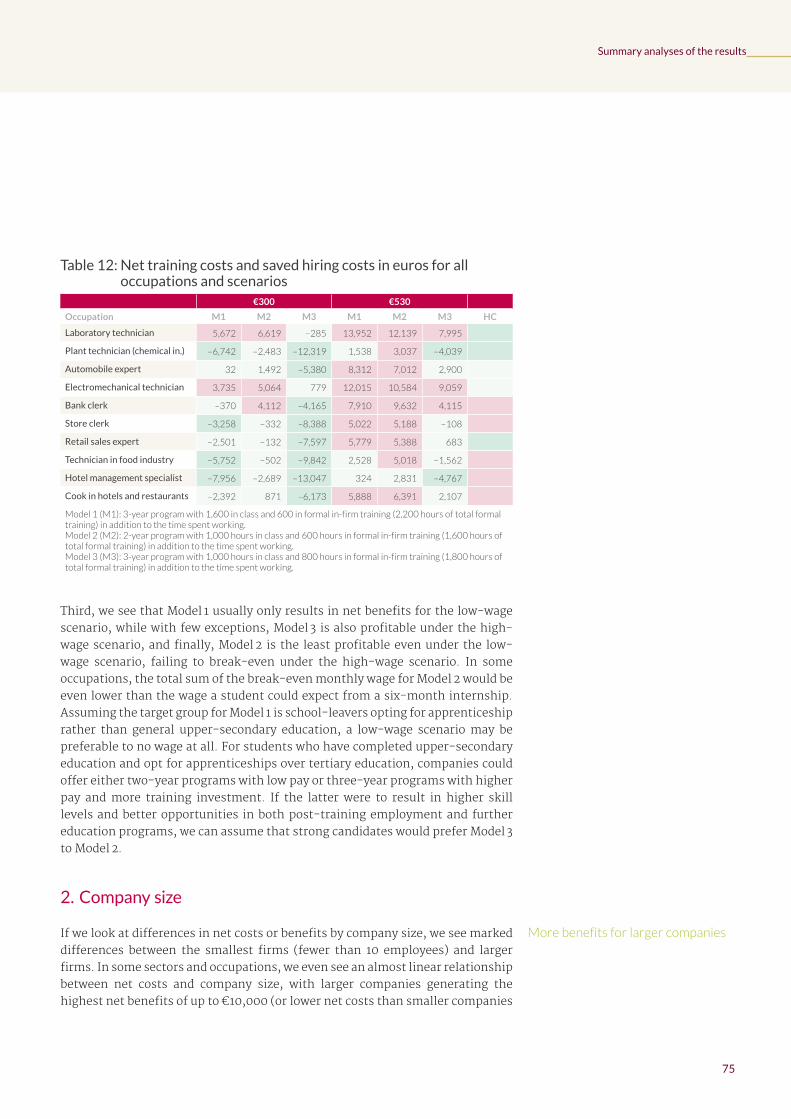
75
Summary analyses of the results
Table 12: Net training costs and saved hiring costs in euros for all occupations and scenarios
€300 €530
Occupation M1 M2 M3 M1 M2 M3 HC
Laboratory technician 5,672 6,619 –285 13,952 12,139 7,995
Plant technician (chemical in.) –6,742 –2,483 –12,319 1,538 3,037 –4,039
Automobile expert 32 1,492 –5,380 8,312 7,012 2,900
Electromechanical technician 3,735 5,064 779 12,015 10,584 9,059
Bank clerk –370 4,112 –4,165 7,910 9,632 4,115
Store clerk –3,258 –332 –8,388 5,022 5,188 –108
Retail sales expert –2,501 –132 –7,597 5,779 5,388 683
Technician in food industry –5,752 –502 –9,842 2,528 5,018 –1,562
Hotel management specialist –7,956 –2,689 –13,047 324 2,831 –4,767
Cook in hotels and restaurants –2,392 871 –6,173 5,888 6,391 2,107
Model 1 (M1): 3-year program with 1,600 in class and 600 in formal in-firm training (2,200 hours of total formal training) in addition to the time spent working.Model 2 (M2): 2-year program with 1,000 hours in class and 600 hours in formal in-firm training (1,600 hours of total formal training) in addition to the time spent working.Model 3 (M3): 3-year program with 1,000 hours in class and 800 hours in formal in-firm training (1,800 hours of total formal training) in addition to the time spent working.
Third, we see that Model 1 usually only results in net benefits for the low-wage scenario, while with few exceptions, Model 3 is also profitable under the high-wage scenario, and finally, Model 2 is the least profitable even under the low-wage scenario, failing to break-even under the high-wage scenario. In some occupations, the total sum of the break-even monthly wage for Model 2 would be even lower than the wage a student could expect from a six-month internship. Assuming the target group for Model 1 is school-leavers opting for apprenticeship rather than general upper-secondary education, a low-wage scenario may be preferable to no wage at all. For students who have completed upper-secondary education and opt for apprenticeships over tertiary education, companies could offer either two-year programs with low pay or three-year programs with higher pay and more training investment. If the latter were to result in higher skill levels and better opportunities in both post-training employment and further education programs, we can assume that strong candidates would prefer Model 3 to Model 2.
2. Company size
If we look at differences in net costs or benefits by company size, we see marked differences between the smallest firms (fewer than 10 employees) and larger firms. In some sectors and occupations, we even see an almost linear relationship between net costs and company size, with larger companies generating the highest net benefits of up to €10,000 (or lower net costs than smaller companies
More benefits for larger companies

76
Summary analyses of the results
in some occupations). The overall pattern is such that, other things being equal, very small firms can expect smaller net training benefits or may even have to bear net costs, while larger firms can expect net benefits. This pattern is hardly surprising and leads to a situation in which medium-sized and larger companies are more likely to offer training than very small companies, a scenario which can be observed in the German-speaking countries. However, a situation in which large firms dominate training opportunities might be problematic, especially in sectors with predominantly small businesses and in rural regions with few large employers and a higher demand for education options beyond general education. Moreover, small businesses have extra costs not fully covered by these simulations, and fewer opportunities to realize post-training benefits than large companies. Small companies rarely have sufficient vacancies through natural fluctuations to realize the extra savings on hiring costs. On the cost side, large companies with numerous apprentices have the possibility of economies of scale on their side and reduced training costs where older apprentices are assigned to tutor younger apprentices. Finally, every company must make initial investments such as training in-firm tutors or rearranging work processes. In large companies, these costs can be distributed over several apprentices, making the cost per apprentice lower than in small firms, where these investments sometimes have to be made to train a single apprentice. Taken together, the situation faced by very small firms might justify special measures and incentives which target them specifically, such as access to training pools and technical assistance with the training of tutors.

77
In this study, we simulated the potential outcomes for companies in the hypothetical situation of Spanish firms adopting apprenticeship-training models that follow current Spanish training regulations but use dual training models similar to that seen in Switzerland. We also assumed that Spanish companies would apply training strategies similar to comparable Swiss companies and that apprentices in Spanish companies would receive the same amount of training and become equally productive over the course of the training period.
We not only assume in our calculations but also strongly recommend that companies pay apprentices a monthly salary for the entire duration of the training program, irrespective of whether the apprentice spends more time at school or the workplace in any given month. This approach would change the nature of the relationship between companies and apprentices considerably (as described in Chapter 4) and ultimately lead to increased attractiveness of apprenticeships for both companies and candidates.
Based on the outcomes calculated for the different model specifications used in this study, we can draw six major conclusions:
1. There are at least one or two scenarios (models) for each of the analyzed occupations that result in an average net benefit by the end of the training period. Therefore, all companies (especially small companies) unable to retain their apprentices after training or who would risk losing them to competing firms on the labor market would have their investments covered under these scenarios. This means the threat of poaching should no longer adversely affect companies’ training decisions.
2. Some occupations require higher levels of training than other occupations and consequently higher training investments. In some cases, these higher investments can be recouped by lowering apprentices’ wages or prolonging the training period. In other cases, however, this would make apprenticeship training less attractive and less feasible. However, as our calculations of potentially saved hiring costs show, not all occupations require a net benefit at the end of the training period to be attractive for employers. In some cases, labor market conditions are such that the cost of hiring from the external labor market is so high that even training with substantial net costs is less costly than hiring already trained workers from the education system or from competitors.
3. Considering three-year programs would allow firms to (i) substantially extend training content, which may be necessary for younger apprentices who have yet to complete upper-secondary education, or (ii) increase apprentice pay, something which could make these programs more attractive to talented youths who view apprenticeships as an alternative to university. The three-
Assumptions of the study
Recommendation: monthly salary
Major conclusions
Vocational training can be beneficial
Benefits despite net costs
Advantages of three-year programs
8 Conclusions and recommendations based on the analyses

78
Conclusions and recommendations based on the analyses
year programs studied here also have the advantage that they could replace the current, predominantly school-based solutions with new models that would retain school-based instruction, complemented with more company-based training. Additionally, we would expect the proposed three-year programs to not only be more attractive for companies but also for potential school drop-outs after compulsory schooling or students who decline tertiary education after having received their upper-secondary qualification; thus, we could expect a growth in job opportunities for vocational education teachers to parallel the growth of the dual training system. Moreover, particularly in our high-training scenario (Model 1), apprentices spend the same amount of time in vocational school as they do currently, so demand for teachers in vocational schools would actually increase. The demand for vocational teachers under Model 2 and Model 3 depends on the expansion of the sector, but one must consider that in each model, the demand for in-house trainers and teachers would increase and provide new job opportunities for vocational teachers in the private sector.
4. Simplifying our results, we find that two-year programs have the most difficulties in reconciling the requirements of training plans, as apprentices spend much of their time in vocational schools. There is relatively little time for apprentices to acquire skills and integrate themselves into the company’s production process, thereby making it difficult for companies to break-even by the end of the training period. Three-year programs should therefore be an option as well – particularly because they are the standard in countries with long traditions of successful apprenticeship programs.
5. Independent of the economic sector or occupation, very small firms tend to have the highest net training costs, and in some cases, conditions militate against training. Thus, if very small businesses are to be involved in apprenticeship training, special actions might prove necessary. These, however, should be targeted, precise and means-tested.
6. As expected, the outcomes vary significantly by occupation and company size, even given the same model specifications. Thus, we recommend that apprenticeship training systems should always provide companies in different economic sectors or different occupations a degree of freedom in altering important parameters, such as the duration of training, the number of training hours or apprentices’ wages. Occupation- or sector-specific training programs do not necessarily result in a fragmented system in which each training firm has its own training model, as long as there are overarching governing principles that all employers must follow. A general framework for the whole system is crucial to guaranteeing minimum training quality and transparency for both prospective apprentices and the employers that subsequently hire graduate apprentices. However, some degree of freedom
Disadvantages of two-year programs
Highest costs for small firms
Adapt training to sector/company

79
Conclusions and recommendations based on the analyses
within the general framework is necessary to adapt to occupation- and sector-specific requirements and allow a sufficient number of companies to train apprentices profitably.
Many of the recommendations that we base on our simulations are choice sets, meaning that they should not simply show whether apprenticeship training is profitable for companies, but instead stimulate discussion about the future of apprenticeship in Spain. This discussion may lead to new training arrangements that make apprenticeship training more attractive for companies that have not yet considered such programs, thereby offering economically viable and attractive educational alternatives for the youth of Spain.
Stimulate discussion, make training attractive

80
Blatter, Marc; Muehlemann, Samuel; Schenker, Samuel; Wolter, Stefan C. (2015). Hiring costs for skilled workers and the supply of firm-provided training, Oxford Economic Papers, doi: 10.1093/oep/gpv050.
Dionisius, Regina; Muehlemann, Samuel; Pfeifer, Harald; Walden, Guenther; Wenzelmann, Felix; Wolter, Stefan C. (2009). Cost and benefit of apprenticeship training: A comparison of Germany and Switzerland, Applied Economics Quarterly, 55(1), 7-36.
Jansen, Anika; Strupler Leiser, Mirjam; Wenzelmann, Felix; Wolter, Stefan C. (2015). Labor market deregulation and apprenticeship training profitability - a comparison of German and Swiss employers, European Journal of Industrial Relations, forthcoming.
Muehlemann, Samuel; Braendli, Romy; Wolter Stefan C. (2013). Invest in the best or compensate the weak? An empirical analysis of the heterogeneity of a firm’s provision of human Capital, Evidence Based Human Resource Management, 1(1), 80-95.
Muehlemann, Samuel; Pfeifer, Harald; Walden, Guenter; Wenzelmann, Felix; Wolter, Stefan C. (2010). The Financing of Apprenticeship Training in the Light of Labor Market Regulations, Labour Economics, 17(5), 799-809.
Muehlemann, Samuel; Strupler Leiser, Mirjam (2015). Ten facts you need to know about hiring. Leading House Working Paper No. 111, University of Zurich, Zurich.
Muehlemann, Samuel; Wolter, Stefan C. (2014). Return on investment of apprenticeship systems for enterprises: Evidence from cost-benefit analyses, IZA Journal of Labor Policy, 3:25.
Muehlemann, Samuel; Wolter, Stefan C.; Fuhrer, Marc; Wueest, Adrian (2007). Lehrlingsausbildung - ökonomisch betrachtet. Rüegger Verlag, Zürich/Chur.
Schweri, Juerg; Muehlemann, Samuel; Pescio, Yasmina; Walther, Belinda; Wolter, Stefan C.; Zuercher, Lukas (2003). Kosten und Nutzen der Lehrlings-ausbildung aus der Sicht der Betriebe, Chur; Zürich: Rüegger Verlag.
SERI (2015). Vocational and professional education and training in Switzerland. Facts and figures 2015. Berne: Swiss State Secretariat for Education, Research and Innovation (http://www.sbfi.admin.ch/dokumentation/00335/00400/index.html?lang=en).
Strupler, Mirjam; Wolter, Stefan C. (2012). Die duale Lehre eine Erfolgsgeschichte - auch für Betriebe. Ergebnisse der dritten Kosten-Nutzen-Erhebung der Lehrlingsausbildung aus der Sicht der Betriebe, Glarus/Chur: Rüegger Verlag.
Wolter, Stefan C.; Muehlemann, Samuel; Schweri, Jürg (2006). Why some firms train apprentices and many others not, German Economic Review, 7(3): 249-264.
Wolter, Stefan C.; Ryan, Paul (2011). Apprenticeship, in: Hanushek, E.A., Machin, S. and Woessmann, L. (Eds.): Handbook of Economics of Education, Volume 3, Elsevier, S. 521-576.
Bibliography

81
List of Figures
Figure 1: Gross costs, productivity, and net training costs by year of training – Técnico en Actividades Comerciales 31
Figure 2: Composition of training benefits by year of training – Técnico en Actividades Comerciales 32
Figure 3: Composition of gross training costs – Técnico en Actividades Comerciales 33Figure 4: Sensitivity analysis of apprentice productivity – Técnico en Actividades Comerciales 34Figure 5: Break-even analysis of apprentice wage – Técnico en Actividades Comerciales 35Figure 6: Net costs by company size – Técnico en Actividades Comerciales 37Figure 7: Sensitivity analysis of apprentice productivity – Técnico Superior en Laboratorio
de Análisis y de Control de Calidad 39Figure 8: Break-even analysis of apprentice wage – Técnico Superior en Laboratorio de
Análisis y de Control de Calidad 40Figure 9: Net costs by company size – Técnico Superior en Laboratorio de Análisis y de
Control de Calidad 41Figure 10: Sensitivity analysis of apprentice productivity – Técnico en Planta Química 43Figure 11: Break-even analysis of apprentice wage – Técnico en Planta Química 44Figure 12: Net costs by company size – Técnico en Planta Química 45Figure 13: Sensitivity analysis of apprentice productivity – Técnico Superior en Automoción 47Figure 14: Break-even analysis of apprentice wages – Técnico Superior en Automoción 48Figure 15: Net costs by company size – Técnico Superior en Automoción 49Figure 16: Sensitivity analysis of apprentice productivity – Técnico en Electromecánica de
Vehículos Automóviles 51Figure 17: Break-even analysis of apprentice wage – Técnico en Electromecánica de Vehículos
Automóviles 52Figure 18: Net costs by company size – Técnico en Electromecánica de Vehículos Automóviles 53Figure 19: Sensitivity analysis of apprentice productivity – Técnico Superior en Gestión
de Ventas y Espacios Comerciales 55Figure 20: Break-even analysis of apprentice wages – Técnico Superior en Gestión de
Ventas y Espacios Comerciales 56Figure 21: Net costs by company size – Técnico Superior en Gestión de Ventas y Espacios
Comerciales 57Figure 22: Sensitivity analysis of apprentice productivity – Técnico en Gestión Administrativa 59Figure 23: Break-even analysis of apprentice wage – Técnico en Gestión Administrativa 60Figure 24: Net costs by company size – Técnico en Gestión Administrativa 61Figure 25: Sensitivity analysis of apprentice productivity – Técnico en Elaboración de
Productos Alimenticios 63Figure 26: Break-even analysis of apprentice wage – Técnico en Elaboración de Productos
Alimenticios 64Figure 27: Net costs by company size – Técnico en Elaboración de Productos Alimenticios 65Figure 28: Sensitivity analysis of apprentice productivity – Técnico Superior en Gestión de
Alojamientos Turísticos 67
List of Figures and Tables

82
List of Figures and Tables
Figure 29: Break-even analysis of apprentice wage – Técnico Superior en Gestión de Alojamientos Turísticos 68
Figure 30: Net costs by company size – Técnico Superior en Gestión de Alojamientos Turísticos 69
Figure 31: Sensitivity analysis of apprentice productivity – Técnico en Servicios en Restauración 71
Figure 32: Break-even analysis of apprentice wage – Técnico en Servicios en Restauración 72Figure 33: Net costs by company size – Técnico en Servicios en Restauración 73
List of Tables
Table 1: Assumptions of the baseline simulation models for net training costs in Spain 23Table 2: Net training costs in euros – Técnico en Actividades Comerciales 29Table 3: Net training costs in euros – Técnico Superior en Laboratorio de Análisis y de Control
de Calidad 38Table 4: Net training costs in euros – Técnico en Planta Química 42Table 5: Net training costs in euros – Técnico Superior en Automoción 46Table 6: Net training costs in euros – Técnico en Electromecánica de Vehículos Automóviles 50Table 7: Net training costs in euros – Técnico Superior en Gestión de Ventas y Espacios
Comerciales 54Table 8: Net training costs in euros – Técnico en Gestión Administrativa 58Table 9: Net training costs in euros – Técnico en Elaboración de Productos Alimenticios 62Table 10: Net training costs in euros – Técnico Superior en Gestión de Alojamientos Turísticos 66Table 11: Net training costs in euros – Técnico en Servicios en Restauración 69Table 12: Net training costs and saved hiring costs in euros for all occupations and scenarios 75

83
Prof. Dr. Stefan C. Wolter studied economics and psychology at the University of Berne, where he heads the Centre for Research in Economics of Education. Since 1999, Prof. Wolter serves as Managing Director of the Swiss Coordination Center for Research in Education. In addition, since 2011, he chairs the OECD expert group on Vocational Education and Training, and has been since 1999 a member of the OECD Governing Board of the Centre for Educational Research and Innovation (CERI) and member of the OECD Education Policy Committee since 2000.
Prof. Wolter’s main areas of research include labor economics and economics of education.
Prof. Dr. Samuel Mühlemann studied economics at the University of British Columbia and at the University of Bern, where he worked as deputy head of the Centre for Research in Economics of Education from 2011 until March 2014. Since April 2014, he holds a professor post at the Institute for Human Resource Education and Management at the Ludwig-Maximilians-Universität München. He has been a visiting scholar at, among others, the University of California in Berkeley and King’s College in London.
Prof. Mühlemann’s main areas of research include economics of education, labor economics, industrial relations, personnel economics and regional economics.
About the authors

84
Bertelsmann Stiftung
The Bertelsmann Stiftung promotes social change through project work that focuses on ensuring society’s long-term viability. Working with a wide range of partners, the Stiftung aims to identify early on social problems and challenges and develop effective solutions. As an initiator and driver of necessary reforms, we draw on knowledge and expertise to stimulate productive dialogue on the most pressing issues of our day and provide policymakers with new insight.
The Bertelsmann Stiftung addresses various topics in education, including career guidance in schools, school-to-work transitions and Germany’s dual vocational training system. The Stiftung initiates and moderates discussions on these issues, provides professional insight by way of expert opinions, and supports the exchange of ideas on the international level. If you would like to learn more about our activities or need additional copies of this study, please contact:
Clemens WielandSenior Project ManagerLearning for Life ProgramPhone +49 5241 [email protected]
About us

85
About us
Fundación Bertelsmann
Founded in 1995 by Reinhard Mohn, the Fundación Bertelsmann is a foundation that operates in Spain. It aims to contribute to the creation of a sustainable society by encouraging social change and effective reform, since it is this that will determine a society’s viability.
In collaboration with a wide range of partners, the Fundación examines social inequalities, identifying the issues in need of most urgent attention. To help diminish these inequalities, we initiate and implement projects for specific situations that are transferable to others.
As part of its “For youth employment” project, the Fundación Bertelsmann focuses on:• Promoting valuable, coordinated career guidance.• Creating an Alliance for Dual Vocational Education and Training.
The economic crisis in Spain has had a much greater impact on employment than in other European countries, with a youth unemployment rate that far exceeds the European average.
The importance of these facts has led us to focus our efforts on promoting employment. We strive to develop initiatives that provide youth access to the labor market. The Fundación combines these activities with studies and public debates addressing the challenges faced by the current generation. If you would like to learn more about our activities or need additional copies of the Spanish translation of this study, please contact:
Clara BassolsDirector Fundación BertelsmannPhone +34 [email protected]

86
• A. RAYMOND TECNIACERO, SAU• AEQT – Associació Empresarial Quimica de Tarragona• AEST – Associació d’Empreses de Serveis de Tarragona• AgroFoods & Commerce, S.L • Aldi Supermercados• Almirall• Asesa• Banco Santander• Bankia• BASF• Bayer• Borges Mediterranean Group, SL• CaixaBank• Caja de Ingenieros • Cámara de Comercio Alemana para España - AHK• Catalonia Hoteles• CIAC – Clúster de la Indústria d’Automoció de Catalunya• COMEXI• Condis• Consell de Cambres de Catalunya• Deutsche Bank• Diputació de Barcelona• DOGA Grup Empresarial, S.L.• Dow Chemical• Ercros• Ficosa• Foment del Treball• Fundació BCN Formació Professional• Fundació Princesa de Girona• Fundación EXIT• Generalitat de Catalunya - Departament d’Ensenyament• Gramer• Gremi d’hotels de Barcelona• Grupo Barceló• H10 Hoteles• Herramientas Preziss• IESE Business School• JYSK DBL IBERIA, SLU• Krikos21• La Casa del Libro• Leroy Merlin• Lidl
Workshop participants

87
Workshop participants
• L’Olivera Cooperativa• Mango• Messer Group• Nestlé• Olis Duran• Repsol• Rücker Lypsa• Seat• Sekisui• Sercotel• SIGMA• Sol Meliá• Td de AIE• Zoller Iberica

88
© 2015 Bertelsmann StiftungBertelsmann StiftungCarl-Bertelsmann-Straße 25633311 GüterslohGermanyPhone +49 5241 81-0Fax +49 5241 81-81999www.bertelsmann-stiftung.de
Responsible for contentClemens Wieland
Production editorEduard Lezcano Margarit
Copyedit Barbara Serfozo, PhD
Cover photoMiquel Taverna
PhotosFrancisco Belil: Miquel TavernaProfessor Mühlemann: Shoey SindelClemens Wieland: Kai Uwe OesterhelwegProfessor Wolter: privat
Graphic designNicole Meyerholz
Imprint


Address | Contact
Bertelsmann Stiftung
Carl-Bertelsmann-Straße 256
33311 Gütersloh | Germany
Phone +49 5241 81-0
Fax +49 5241 81-81999
Clemens Wieland
Senior Project Manager
Program Learning for Life
Phone +49 5241 81-81352
www.bertelsmann-stiftung.de