Embed Size (px)
Citation preview
Long-Run Stockholder Consumption Risk and Asset Returns
Malloy, Moskowitz and Vissing-Jørgensen
Outline
• Introduction – Equity premium puzzle – Recent contribution – Contribution of this paper
• Long-Run Risk Model – Recursive utility function & Non iid consumption growth – SDF and Euler equation
• Data – Household-level consumption data – Aggregation of the data
• Estimation Result – Stockholder, Top stockholder, Nonstockholder – Results with factor-mimicking portfolio
• Conclusion 1

2
INTRODUCTION
3
Motivation
• C-CAPM with CRRA utility function and iid (or short memory) consumption growth are unable to generate a high equity premium or low risk-free rate
• We need tremendously high risk aversion coefficient in order to explain the actual U.S. equity premium.
Equity Premium Puzzle (Mehra and Prescott(1985))
Motivation
• A number of solutions have been proposed, but still a puzzle. – habit preference, rare disaster, transaction cost, liquidity…
GOAL Explain the cross-sectional variation of risk premium by consumption-based asset pricing model with plausible risk aversion coefficient.
4
Recent Contribution
• Long-Run Risk Model (Bansal and Yaron (2004) etc.) – Recursive utility function with non iid consumption growth
– Asset returns are affected by the long-term future consumption risk.
• Limited Stock Market Participation Model (Vissing-Jørgensen (2002) etc.) – Not all of the consumers take part in the capital markets.
– Stockholders bear a disproportionate amount of aggregate consumption risk relative to nonstockholders.
5
Contribution of this paper
• Malloy, Moskowitz and Vissing-Jørgensen (2009, henceforth MMV) intersects the recent literature on the long-run risk model and the limited stock market participation.
• MMV show that the long-run consumption risk of households who hold financial assets is particularly relevant for asset pricing. – Their structural estimate of the risk aversion coefficient implied
by the premium for stockholders is around 15, and for the wealthiest third of the stockholders is around 10.
– On the other hand, the implied risk aversion coefficient for nonstockholders is ranging from about 50 to 100
6
7
Long-Run Risk Model
Long-Run Risk Model
• Recursive Utility Function
• Non iid Consumption Growth Process – Long-run component in consumption growth
process
8
Why Recursive Utility Function ?
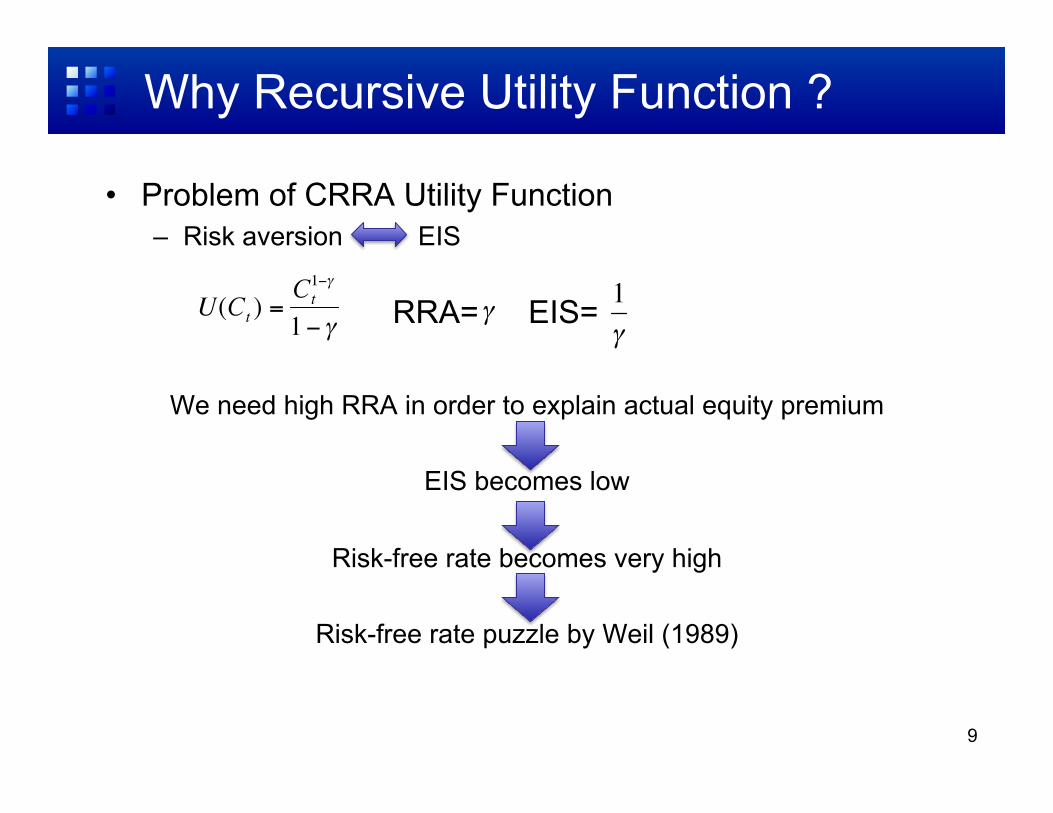
• Problem of CRRA Utility Function – Risk aversion EIS
We need high RRA in order to explain actual equity premium
EIS becomes low
Risk-free rate becomes very high
Risk-free rate puzzle by Weil (1989)
9
RRA= EIS=
Recursive Utility Function
10
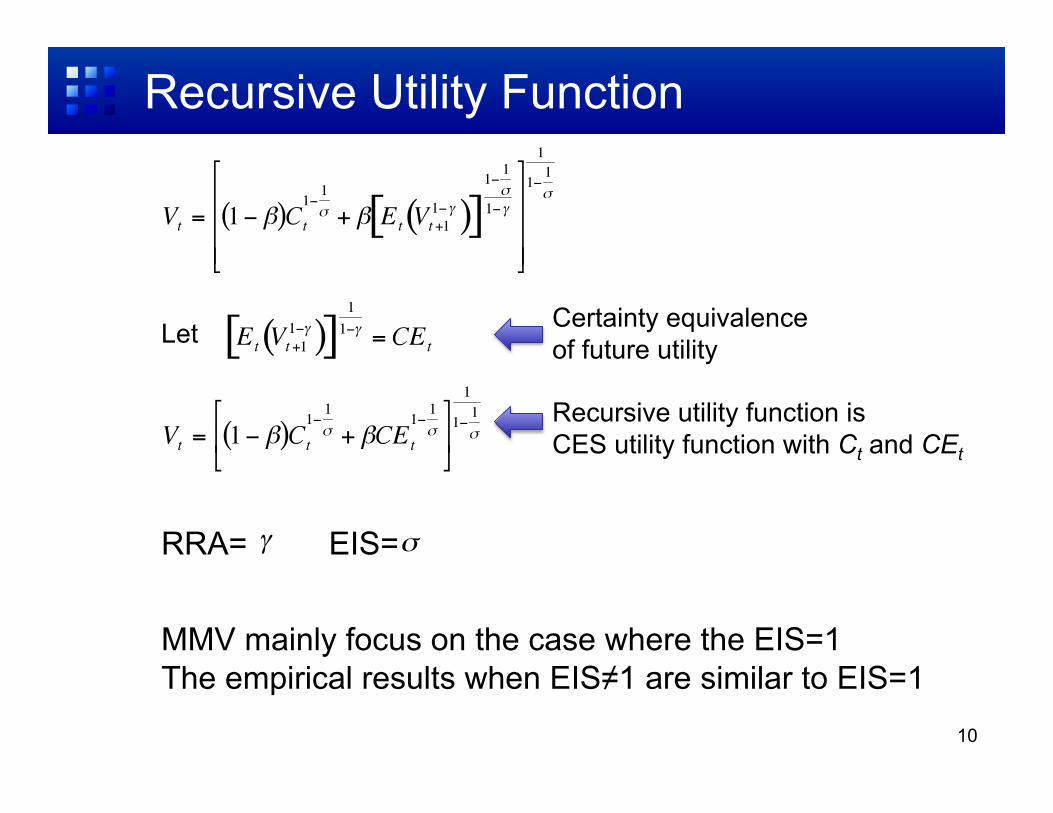
Certainty equivalence of future utility
Let
Recursive utility function is CES utility function with Ct and CEt
RRA= EIS=
MMV mainly focus on the case where the EIS=1 The empirical results when EIS≠1 are similar to EIS=1
Non iid Consumption Growth Process
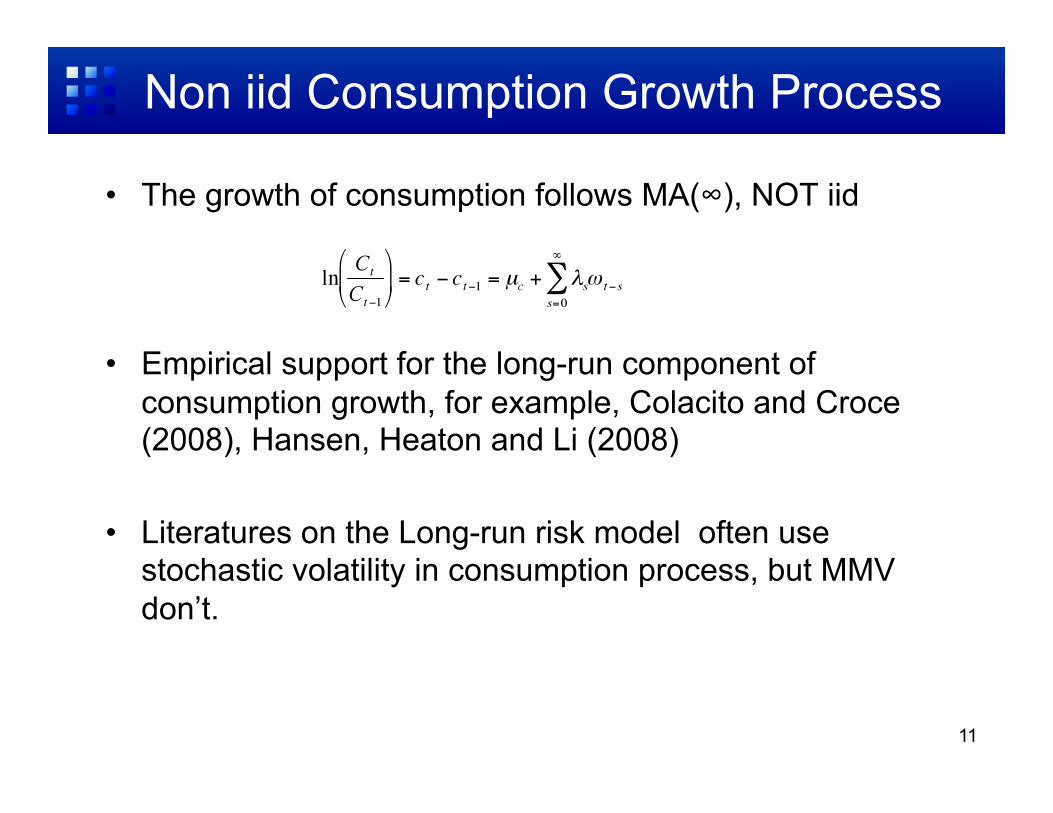
• The growth of consumption follows MA(∞), NOT iid
• Empirical support for the long-run component of consumption growth, for example, Colacito and Croce (2008), Hansen, Heaton and Li (2008)
• Literatures on the Long-run risk model often use stochastic volatility in consumption process, but MMV don’t.
11
SDF and Euler Equation
12
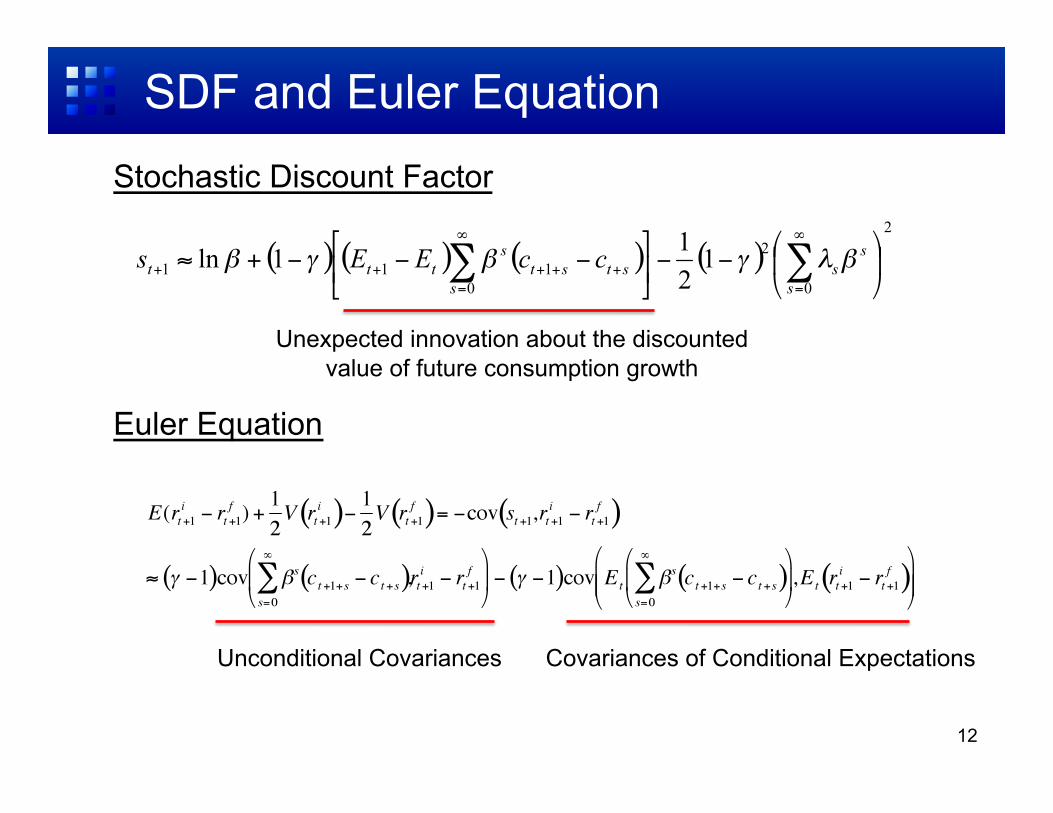
Unexpected innovation about the discounted value of future consumption growth
Unconditional Covariances Covariances of Conditional Expectations
Stochastic Discount Factor
Euler Equation
SDF and Euler Equation
13
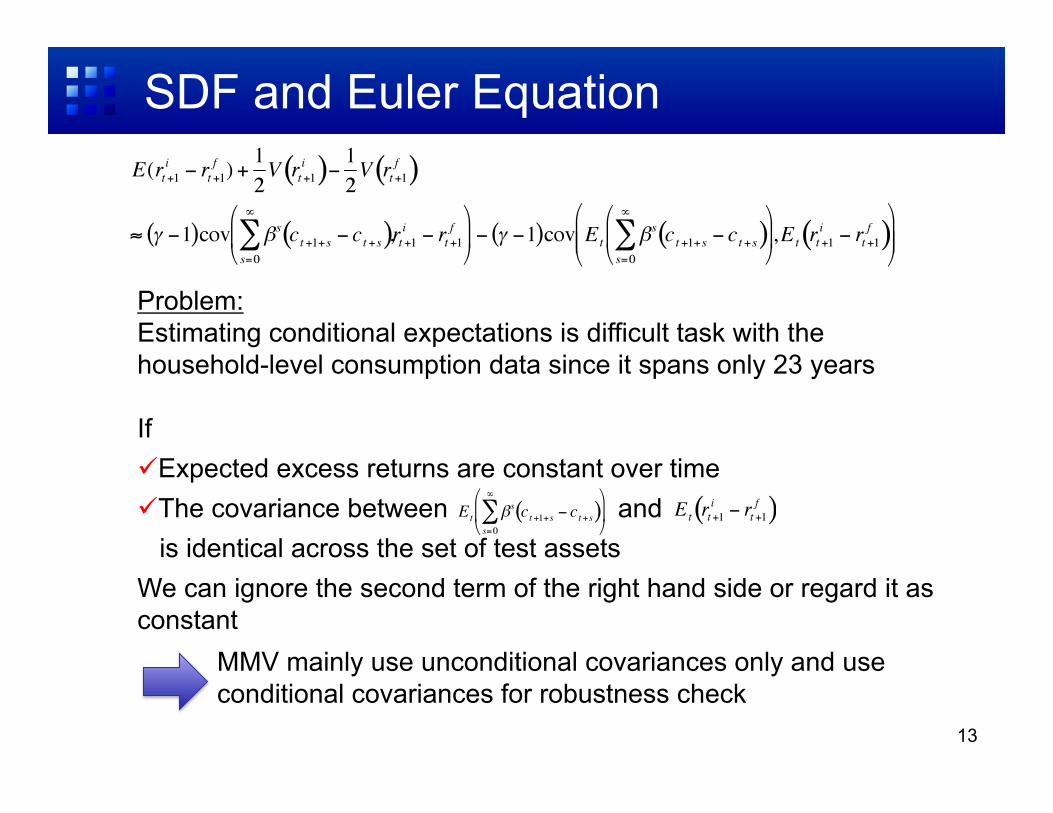
Problem: Estimating conditional expectations is difficult task with the household-level consumption data since it spans only 23 years
If Expected excess returns are constant over time The covariance between and is identical across the set of test assets We can ignore the second term of the right hand side or regard it as constant
MMV mainly use unconditional covariances only and use conditional covariances for robustness check
14
DATA
Data
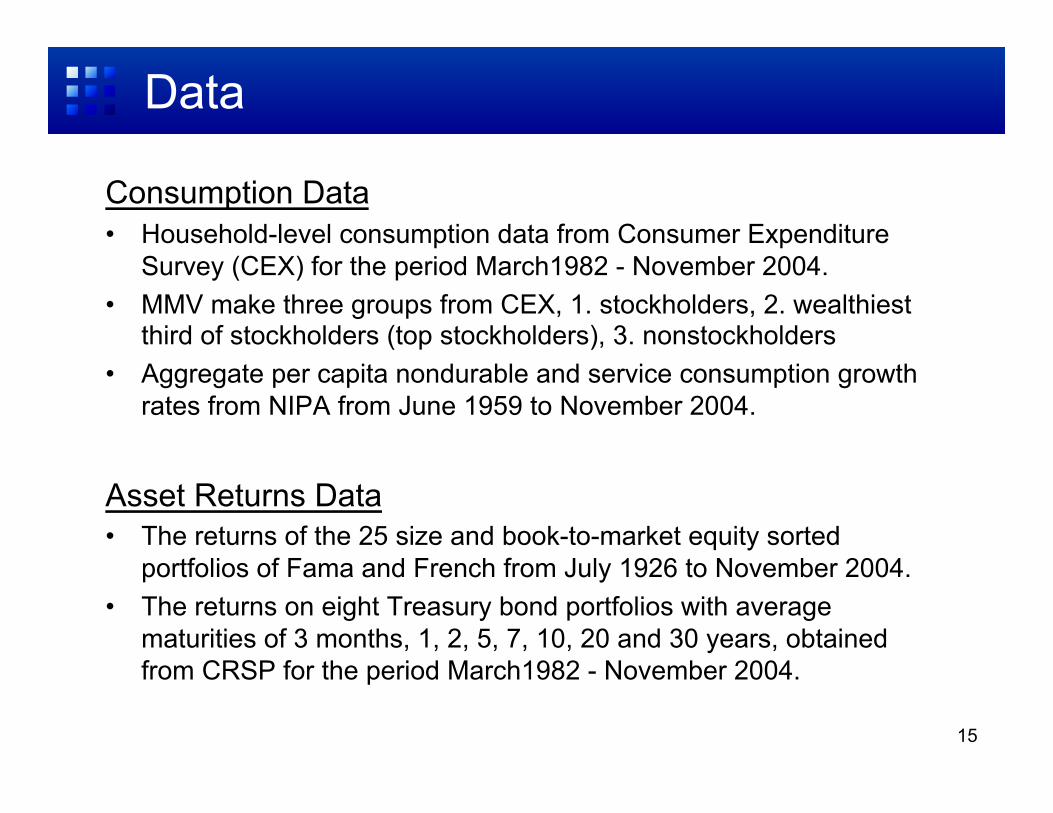
Consumption Data • Household-level consumption data from Consumer Expenditure
Survey (CEX) for the period March1982 - November 2004. • MMV make three groups from CEX, 1. stockholders, 2. wealthiest
third of stockholders (top stockholders), 3. nonstockholders • Aggregate per capita nondurable and service consumption growth
rates from NIPA from June 1959 to November 2004.
Asset Returns Data • The returns of the 25 size and book-to-market equity sorted
portfolios of Fama and French from July 1926 to November 2004. • The returns on eight Treasury bond portfolios with average
maturities of 3 months, 1, 2, 5, 7, 10, 20 and 30 years, obtained from CRSP for the period March1982 - November 2004.
15
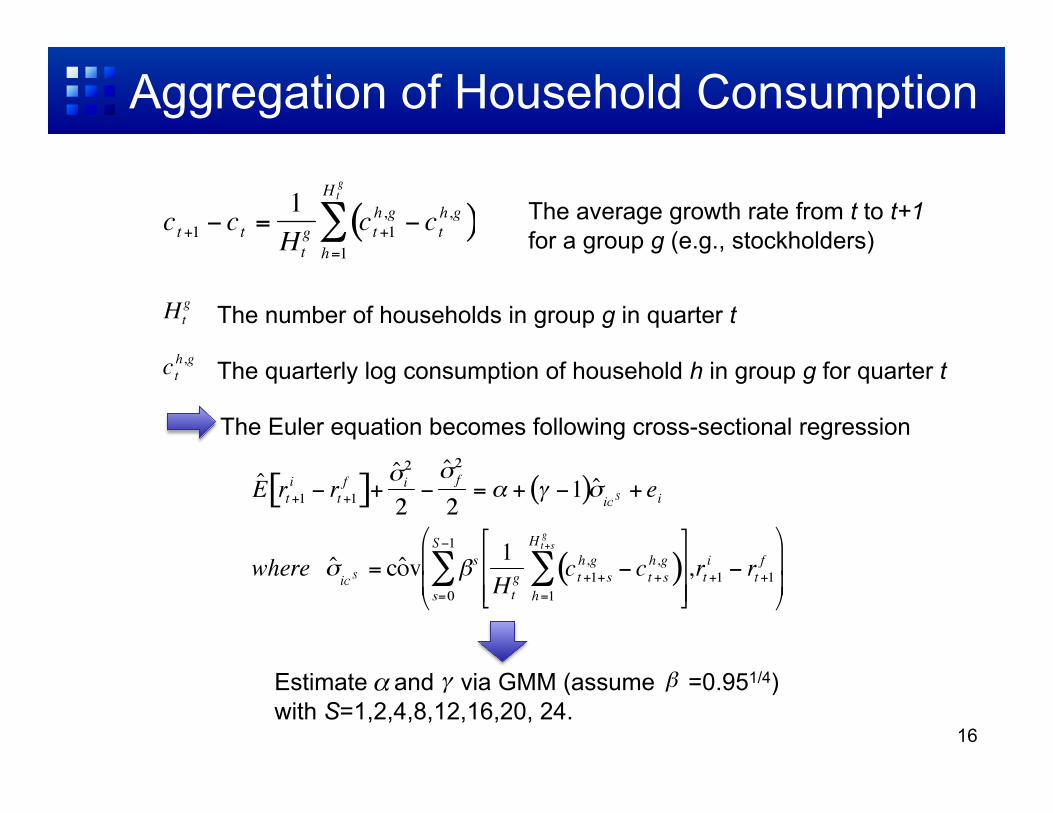
Aggregation of Household Consumption
16
The quarterly log consumption of household h in group g for quarter t
The number of households in group g in quarter t
The average growth rate from t to t+1 for a group g (e.g., stockholders)
The Euler equation becomes following cross-sectional regression
Estimate and via GMM (assume =0.951/4) with S=1,2,4,8,12,16,20, 24.
17
ESTIMATION RESULTS
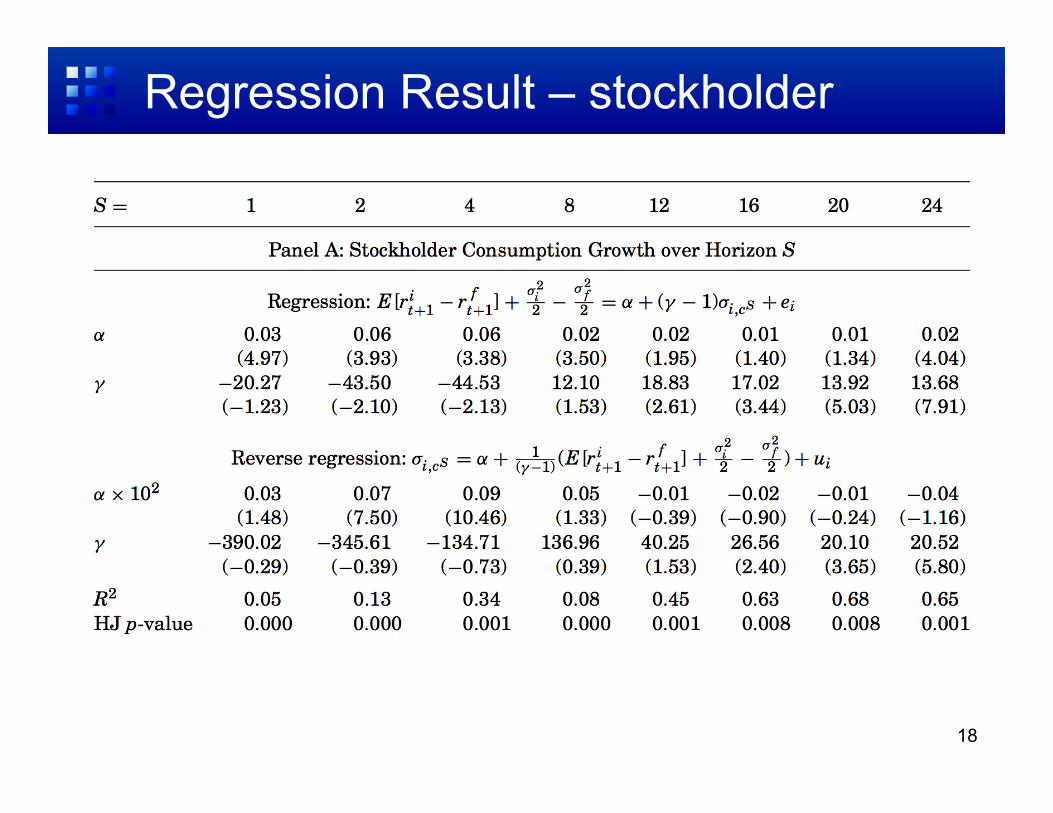
Regression Result – stockholder
18
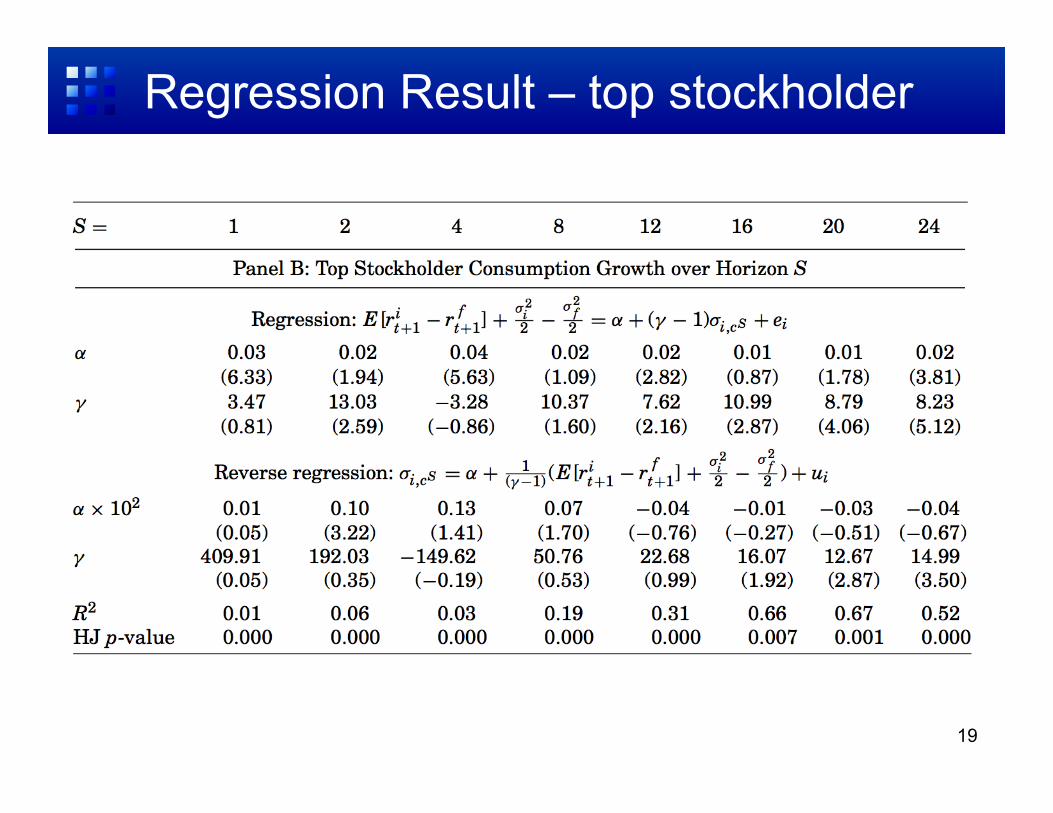
Regression Result – top stockholder
19
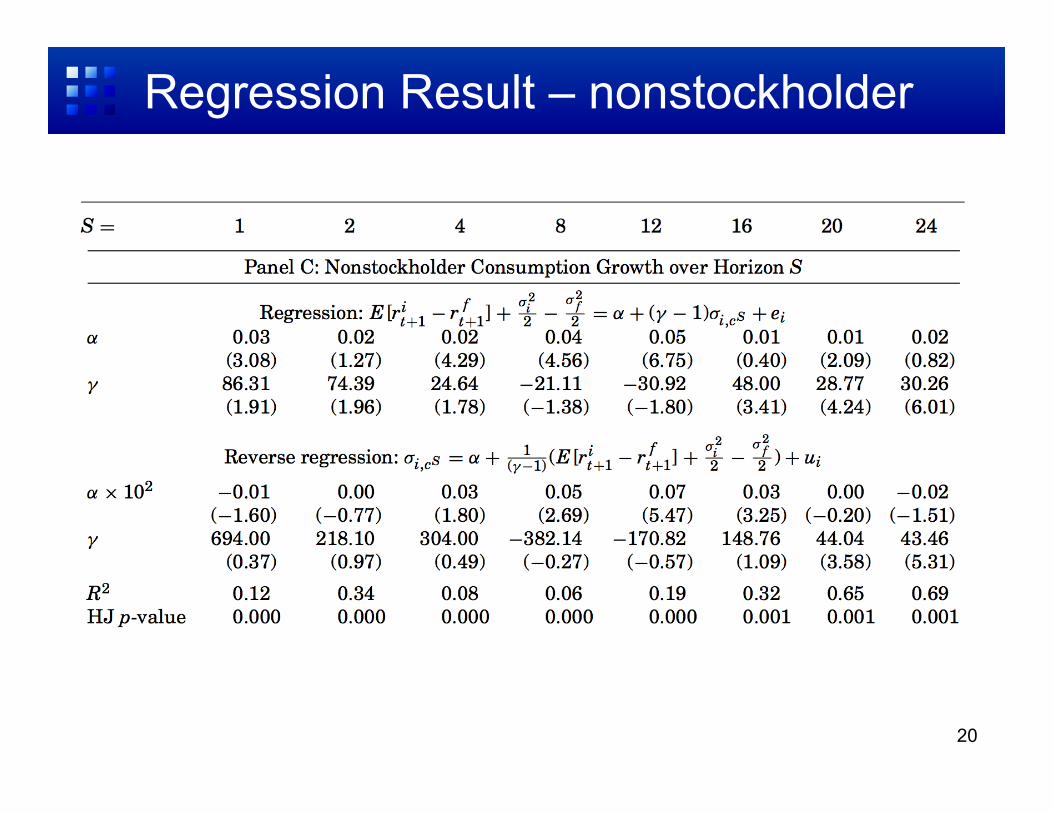
Regression Result – nonstockholder
20
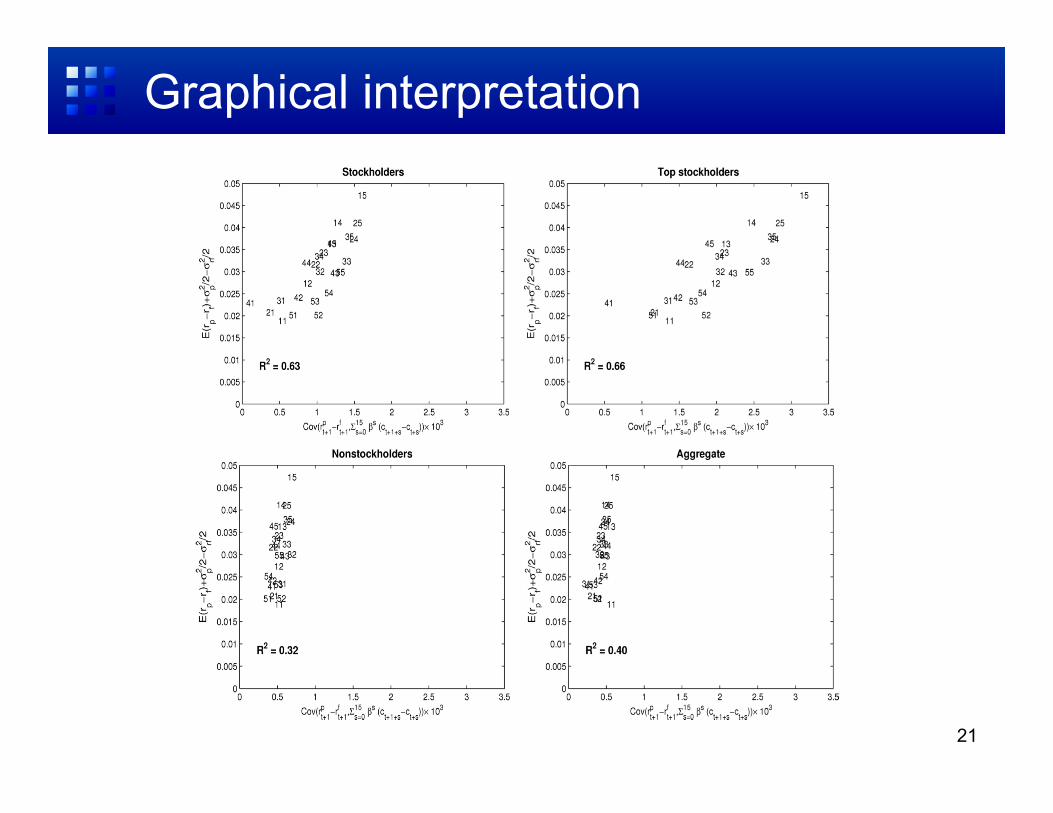
Graphical interpretation
21
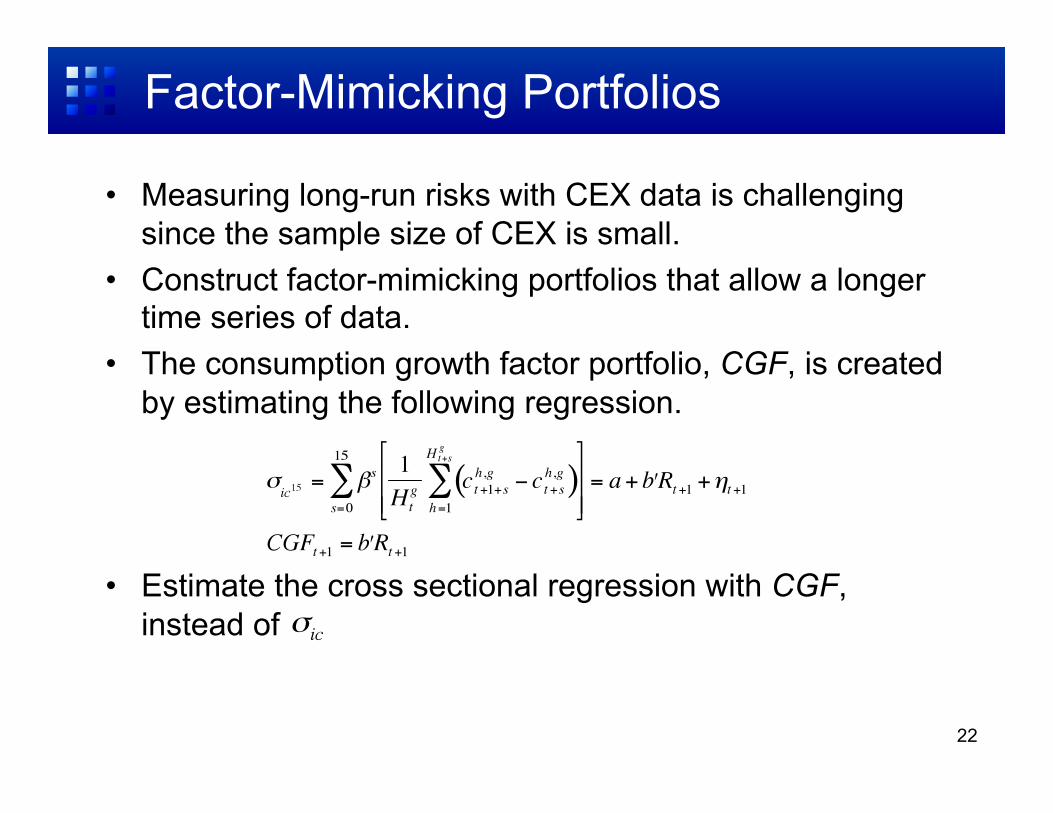
Factor-Mimicking Portfolios
• Measuring long-run risks with CEX data is challenging since the sample size of CEX is small.
• Construct factor-mimicking portfolios that allow a longer time series of data.
• The consumption growth factor portfolio, CGF, is created by estimating the following regression.
• Estimate the cross sectional regression with CGF, instead of
22
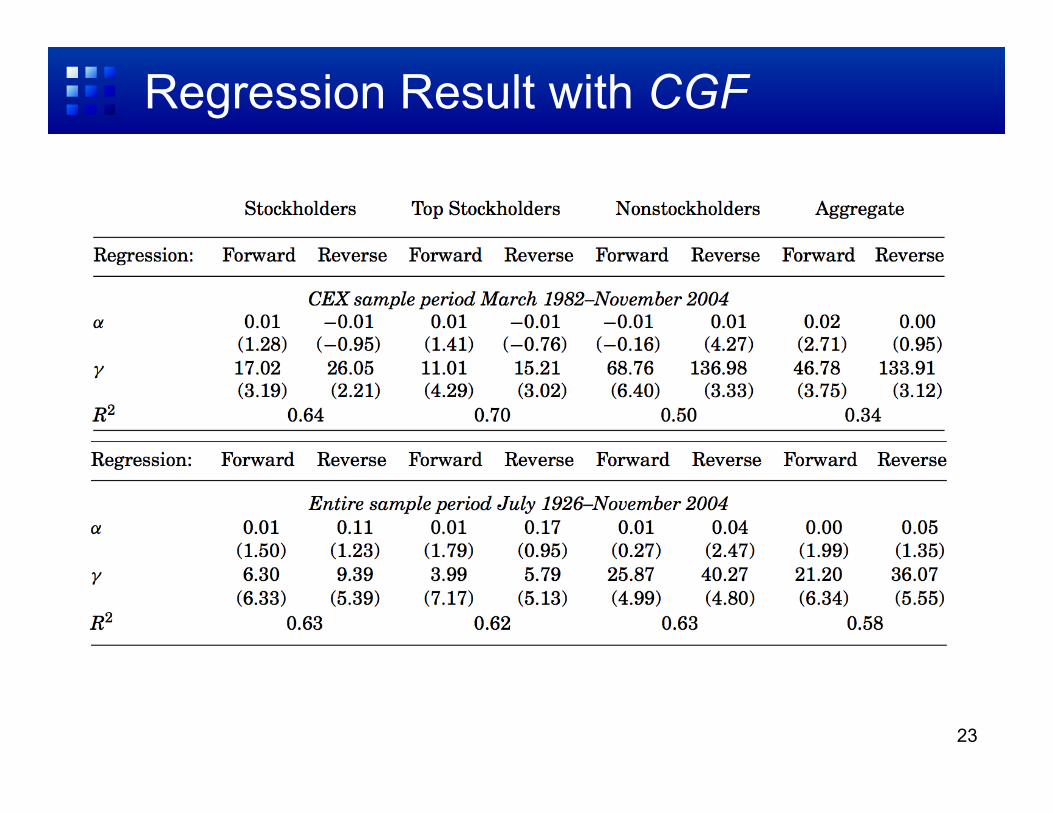
Regression Result with CGF
23
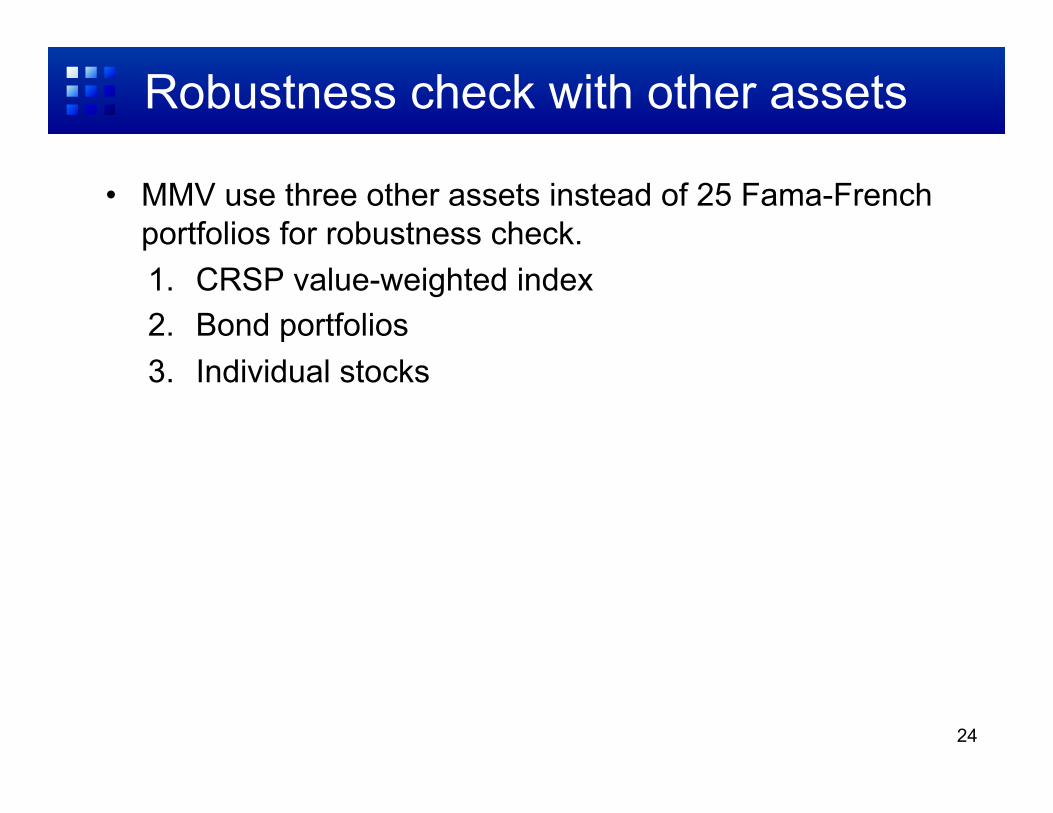
Robustness check with other assets
• MMV use three other assets instead of 25 Fama-French portfolios for robustness check. 1. CRSP value-weighted index 2. Bond portfolios 3. Individual stocks
24
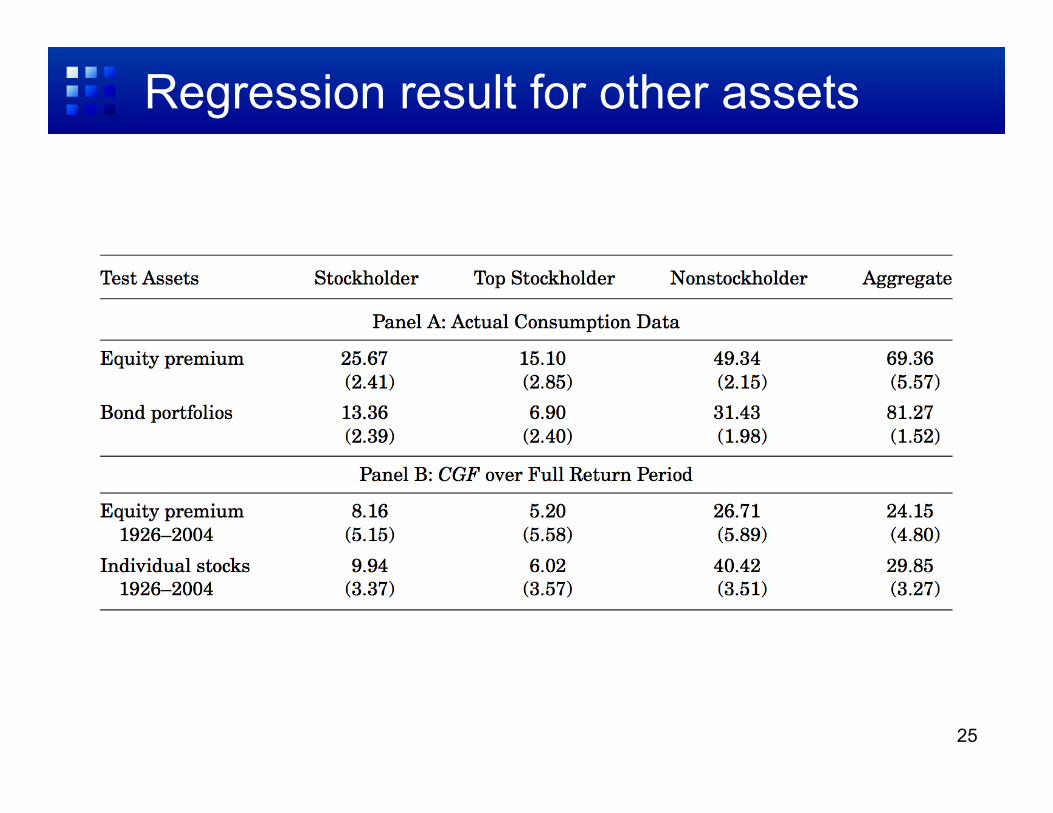
Regression result for other assets
25
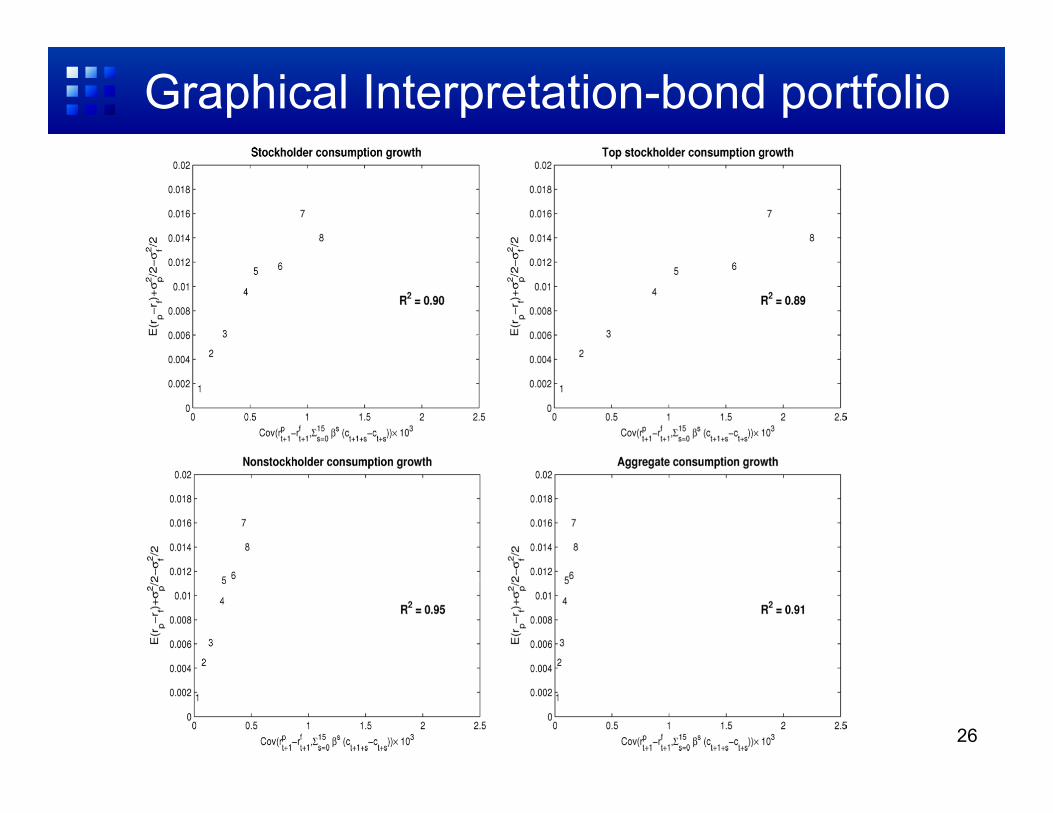
Graphical Interpretation-bond portfolio
26
Conclusion
• Long-run stockholder consumption risk captures the return premia associated with size and value portfolios, the aggregate stock market, bond portfolios, and the entire cross-section of stocks with a moderate risk aversion coefficient of about 10 for the wealthiest stockholders.
• There are still open questions – How do these long-run patterns emerge as an equilibrium
outcome ? – Why stockholders take on more of the aggregate consumption
risk ?
• These research will improve our knowledge of what is driving these long-run relationship.
27