Embed Size (px)
Citation preview
Long-Run Corporate Tax Avoidance
Scott Dyreng University of North Carolina
Michelle Hanlon
University of Michigan
Edward L. Maydew University of North Carolina
October 7, 2005
Preliminary. Please do not quote.
Abstract How prevalent is long-run corporate tax avoidance? Surprisingly, there appears to be no published academic work addressing this basic question. We define tax avoidance based on the ability to sustain a cash effective tax rate (the ratio of cash taxes paid to pretax income) below the statutory tax rate. It is important to note that avoiding taxes does not imply that a firm has done anything improper. There are numerous provisions in the tax code that allow or encourage firms to reduce their taxes. We investigate the extent to which firms are able to engage in corporate tax avoidance over periods as long as ten years. We find that 437 firms, comprising 22 percent of our sample, were able to sustain a cash effective tax rate of less than 20 percent over a ten year period. An initial examination of the characteristics of successful long-run tax avoiders shows that they are spread across industries but cluster somewhat in certain industries such as oil and gas extraction, insurance, and real estate. Other characteristics associated with long-run tax avoidance include having large firm size, being incorporated in a tax haven, having high ratios of property, plant and equipment to assets, being intangible intensive, and being highly levered.
1
Long-Run Corporate Tax Avoidance
1. Introduction
Are firms able to avoid corporate income taxes successfully over long periods of time? If
so, how prevalent is long-run tax avoidance? What are the characteristics of firms that
successfully avoid income taxes over long periods? Surprisingly, we are aware of no published
academic research that directly addresses these basic questions. Prior tax research has made
great strides in understanding how taxes affect specific decisions that firms make (e.g., how
much leverage to use, Graham, 2000). Much less is known about firms’ overall tax avoidance
over short periods, let alone their ability to avoid taxes over long periods of time.1
Corporate tax avoidance has received much attention throughout the last twenty-five
years. For example, evidence of corporate tax avoidance led to the Tax Reform Act of 1986, the
largest overhaul of the U.S. tax code in history. More recently, a number of commentators have
perceived resurgence in corporate tax avoidance activities (e.g., Bankman, 2004). Researchers
have employed a number of approaches to shed light on tax avoidance, including examining
book-tax differences for the aggregate corporate sector (U.S. Treasury, 1999), in publicly-traded
firms (Plesko, 2000; Manzon and Plesko, 2002; Desai, 2003; Yin, 2003; Hanlon and Shevlin,
2005; and Hanlon, Kelley and Shevlin, 2005) and using tabulated tax return data (Mills et al.,
2002; Plesko, 2002; Plesko, 2004). What is common to these prior studies is that they focus on
annual measures of avoidance. Thus, we do not know if the same firms are avoiding taxes year
after year or whether tax avoidance is more of a transitory phenomena based on a particular set
of circumstances (e.g., divesting a line of business in a tax-favored manner).
1 Shackelford and Shevlin (2001) review tax research including research on the role of taxes in decision-making. A sampling of studies of short-run tax avoidance or particular tax avoidance strategies includes: Graham and Tucker (2005), Edwards (2005), Rego (2003), Engel, Erickson and Maydew (1999), Erickson (1998), Mills, Erickson and Maydew (1996), and Matsunaga, Shevlin and Shores (1992).
2
The primary research question that we ask is: how prevalent is long-run corporate tax
avoidance? We define tax avoidance as the ability to pay a low amount of cash taxes (as
opposed to GAAP tax expense that one would find in a firm’s tax footnote) relative to corporate
earnings. Thus, we define the cash effective tax rate (hereafter the CASH ETR) as the ratio of
cash taxes paid to pretax financial accounting income. We measure the CASH ETR for firms
over periods ranging from one to ten years (i.e., the ten year measure is the sum of cash taxes
paid over ten years divided by the sum of pre-tax book income over those same ten years) and
label these multi-year rates as long-run cash effective tax rates.
Our examination of long-run cash effective tax rates reveals 437 publicly-traded firms,
representing approximately 22 percent of our sample, that have CASH ETRs below 20 percent
during a period when the statutory U.S. corporate tax rate has been 35 percent. Recall that these
are not one-year anomalies; the CASH ETRs referred to above are measured over a ten year
period.2 This evidence suggests that a significant fraction of publicly-traded firms appear to
have the ability to avoid corporate income taxes over long periods of time. It is important to
emphasize that our measure of tax avoidance does not imply that firms are engaging in anything
improper. There are numerous provisions in the tax code that allow or encourage firms to
reduce their taxes.
As a rough benchmark of the economic magnitude of tax avoidance, we estimate that had
these successful long-run tax avoiders been subject to the statutory tax rate on their financial
accounting income they would have paid in aggregate $453 billion in taxes over the prior 10
years. Instead, these firms received tax refunds in aggregate totaling $205 billion, according to
the cash tax paid number disclosed in their financial statements. To put that number in
2 We chose a ten-year period so that our data period begins after the implementation for Statement of Financial Accounting No. 109, Accounting for Income Taxes, which facilitate comparison with GAAP effective tax rates. In addition, the corporate statutory tax rate is stable during the post SFAS 109 at 35 percent.

3
perspective, total federal income taxes for the entire corporate sector totaled $1.9 trillion during
that same period.
While some firms are successful at long-run tax avoidance, the average ten-year CASH
ETR for our sample of firms is 29.9%, suggesting that tax avoidance is concentrated in a subset
of corporations. We take a first step at examining the characteristics and attributes of successful
long-run tax avoiders to determine what distinguishes them from the rest of the population of
publicly-traded firms. We find that successful tax avoiding firms come from a variety of
industries, though there is some clustering in certain industries such as oil and gas extraction
(SIC 13), insurance (SIC 63), and real estate (SIC 65). Low long-run CASH ETRs are associated
with being a large firm, being incorporated in a tax haven, having a high ratio of fixed assets to
total assets, being highly levered, having a lot of intangible assets, and reporting large special
items. Employee stock option intensity is also included as a control variable and is significant in
the predicted direction -- the higher the option exercises of the firm the lower the CASH ETR. In
the end, however, the observable factors are only able to explain a fraction (at most 22.6%) of
the cross-sectional variation in long-run cash effective tax rates, suggesting there is plenty of
room for future research on the determinants of successful tax avoidance, not to mention the
consequences of successful tax avoidance.
For comparison, we also compute firms’ effective tax rates as measured under Generally
Accepted Accounting Principles (GAAP). GAAP effective tax rates are reported in the tax
footnote and are the ratio of tax expense to pretax income, both measured on continuing
operations. There are two main advantages of our approach relative to using annual effective tax
rates measured under (GAAP). The first advantage of our approach is that it focuses on the long-
run tax avoidance ability of the firm. It takes years for the IRS to audit large corporate returns,

4
challenge positions, and if necessary litigate them. Years after taking a position on its tax return,
the firm may have to pay additional taxes. This, as well as other factors, can cause annual
effective tax rates to be highly variable and not reflect the long-run tax avoidance ability of the
firm.
The second advantage of our measure of tax avoidance is that it is based on the cash taxes
paid by the firm rather than the more conventional GAAP measure of tax expense. It is well-
known that GAAP tax expense and cash tax paid can be very different numbers even over long
horizons (Hanlon, 2003; McGill and Outslay, 2004). Moreover, whole classes of tax avoidance
activities have no effect on GAAP effective tax rates (e.g., a strategy that accelerates tax
deductions on equipment can reduce cash taxes in the early years but have no effect on GAAP
effective tax rates). Moreover, there can be large swings in single-year GAAP effective tax rates
that have nothing to do with tax avoidance (e.g., changes in financial accounting tax reserves and
valuation allowances that affect the firms’ tax expense but not their actual taxes paid). Indeed,
there is some evidence that firms use the valuation allowance as an earnings management device
(Miller and Skinner, 1998; Dhaliwal, Gleason and Mills, 2004).
The paper proceeds as follows. Section 2 provides a definition of tax avoidance and
discusses prior related research. Section 3 describes our measure of tax avoidance in detail and
discusses the advantages of our measure over traditional effective tax rates from firms’ financial
statements. Section 4 provides a description of our sample, tests and results while section 5
provides a caveat to the study. Section 6 concludes.

5
2. Background
2.1. Tax Avoidance Distinguished from Tax Shelters and Tax Aggressiveness
Avoiding taxes does not imply anything improper. Indeed, firms (and individuals) can
avoid Federal income taxes through means as simple as holding municipal bonds that generate
tax-exempt interest income. Even in more complicated settings, the courts have long ruled that
there is nothing wrong with reducing one’s taxes as long as it is in compliance with the tax code.
An often-cited quote in this regard comes from the famous tax case of Helvering v. Gregory, in
which Judge Learned Hand wrote: “Any one may so arrange his affairs that his taxes shall be as
low as possible; he is not bound to choose that pattern which will best pay the Treasury; there is
not even a patriotic duty to increase one's taxes.”3
Moreover, this is not a paper about tax shelters or aggressive tax planning per se.4
Though used frequently, at this time neither “tax shelter” nor “aggressive tax planning” has a
well-accepted definition. The term “tax shelter” in particular has different meanings to different
users. Some people appear use the term tax shelter to refer to any tax planning that saves taxes.
Others use the term to refer to tax planning that both saves taxes but in ways counter to what
Congress intended, while still others use the term to refer to tax planning that involves no
substantial non-tax “business purpose” or has no non-tax “economic substance.” “Tax
aggressive” most often is used to describe taking a position on a tax return that is in the grey area
between legal and illegal. It is not uncommon for complex corporate transactions to fall
somewhere in the grey area or to have grey area aspects to them. To be sure, our measures of
tax avoidance will capture and reflect sheltering and aggressive tax planning but they will also
reflect activities and situations that many experts would not consider tax shelters such as
3 Helvering v. Gregory, 69 F.2d 809. 4 Neither is this a paper about tax evasion, which is commonly defined as tax reduction through illegal means.

6
obtaining a tax credit for research and development expenditures or investing in tax-exempt
municipal bonds.5 Rather, our paper examines the net effect of a firm’s traits and decisions on
its long-run tax avoidance. Specifically, we define tax avoidance as the ability to pay a low
amount of tax per dollar of reported pre-tax financial accounting income.
2.2. Research Related to Tax Avoidance
There are three lines of research that are highly relevant for this paper. The first consists
of studies that have examined specific instances of tax planning or tax shelters. These papers
include Graham and Tucker (2005), Engel, Erickson and Maydew (1999), Erickson, Goolsbee
and Maydew (2003), Seida and Wempe (2004), and Desai and Hines (2002), to name a few. The
second examines variation in annual effective tax rates. These papers include Rego (2003),
Mills, Erickson and Maydew (1998) and Collins and Shackelford (1995). The third area of
research investigates the causes and consequences of book-tax differences. These papers include
Hanlon (2005), Mills (1998), Guenther, Maydew and Nutter (1997), Manzon and Plesko (2002)
and others.
The studies that examine specific instances of tax planning are useful to us for two
reasons. First, those studies provide information about typical tax planning strategies, which is
helpful for thinking about how tax planning would impact various measures of effective tax
rates. Second, they provide information about the characteristics of firms likely to engage in tax
planning. We draw on this information later in the paper when we conduct preliminary tests to
determine the characteristics of successful long-run tax avoiding firms.
5 Even municipal bonds can be subject to IRS scrutiny. In particular, there can be questions of whether the firm is engaging in tax arbitrage in which tax-exempt investments are financed with debt that generates tax deductible interest expense. See Erickson, Goolsbee and Maydew (2003).
7
There is a small set of research that examines variation in annual effective tax rates. For
example, Rego (2003) examines the tax avoidance activities of U.S. multinational corporations
by regressing effective tax rates (defined as the income taxes currently payable divided by pre-
tax accounting income) on independent variables such as size, pre-tax income, the extent of
foreign operations, whether the firm is a multinational corporation, interactions of multinational
and size and income, location of the firm and industry indicators. Rego (2003) finds that larger
firms have higher effective tax rates and firms with higher pre-tax income have lower effective
tax rates, ceteris paribus. Rego (2003) also finds that multinational corporations are able to
avoid more taxes than domestic only corporations. Mills, Erickson and Maydew (1998) examine
firms’ investments in tax planning and as part of their analyses they investigate the returns to
firms’ investments. They regress the firm’s ETR (defined as the three year sum of current taxes
to the three year sum of pre-tax book income) on independent variables including 1) the
investment in tax planning (i.e., sum of tax department salaries and outside tax fees), 2) firm
size, 3) an indicator variable set equal to one if the firm has foreign assets, 4) a leverage variable
(the firm’s long-term debt divided by total assets), 5) the level of fixed assets, and 6) the
inventory intensity of the firm. They find that the greater the investment in tax planning and the
higher the leverage the lower the firm’s effective tax rate. They also find that foreign assets are
associated with higher effective tax rates.
Finally, our paper is related to the extensive literature on book-tax differences. Firms
successful at long-term tax avoidance are likely, though not necessarily, also firms that are able
to sustain large differences between GAAP income and taxable income. Book-tax differences
and tax avoidance are not exactly the same because tax avoidance can take place in many forms,
8
including generating tax credits and shifting income to low tax jurisdictions. Nevertheless, we
expect an association between tax avoidance and book-tax differences.
We note that just as we are aware of no prior study of long-run tax avoidance, we are
aware of no study of long-run book-tax differences. There have been a number of studies that
investigate causes and consequences of book-tax differences. For example, Manzon and Plesko
(2002) examine the relation between financial accounting income and taxable income measures
over time. They identify a set of variables that they argue explain a large percentage of the
variation in the book-tax spread across firms. Conceptually, these explanatory items are 1)
demand for tax-favored investment and financing (using profitability, the presence of NOLs, and
the change in sales as proxies), 2) direct sources of investment related timing differences (using
property plant and equipment and other assets which are systematically written off and post-
retirement benefits as proxies), 3) permanent differences (using pre-1993 goodwill as a proxy)
and 4) noise factors (using the change in NOLs, the extent of foreign operations, size, and lagged
spread as proxies). They find in a fixed effects regression these variables explain 28% of the
spread (and 69% of the adjusted spread, calculated by adjusting the spread between book and
taxable incomes by items that are deductible for tax purposes and by income that is not taxable).
However, Manzon and Plesko (2002) use annual data and do not investigate the long-run tax
avoidance ability of the firm.
Other studies use the unexplained portion of the book-tax difference as a measure of
potential tax sheltering. Desai and Dharmapala (2005) investigate whether firms with greater
equity incentives engage in more tax avoidance activities. They measure tax avoidance as the
residual from a regression of book-tax differences (estimated by grossing up current Federal tax
expense to obtain an estimate of taxable income and then subtracting this from the firm’s

9
domestic financial statement income) on a firm’s total accruals (their proxy for earnings
management activities). However, rather than include numerous variables which may explain
tax avoidance activities, Desai and Dharmapala (2005) include only their measures of incentive
compensation and governance variables and estimate firm fixed effects models to attempt to
control for other factors in their analysis.
Frank et al. (2005) use an estimate of a firm’s permanent differences as a measure of tax
reporting aggressiveness in their investigation of whether firms are simultaneously aggressive for
tax reporting and financial reporting. Some of the variables that they include as independent
variables are 1) a measure of intangibles, 2) one year lagged permanent differences, 3) one year
lagged market to book ratio for the firm, and 4) the long term debt of the company. The residual
from a regression of permanent differences on these variables (and others) is their measure of
“discretionary permanent differences.” By estimating residuals in this manner, Frank et al.
(2005) focus on measuring the part of tax aggressiveness that cannot be explained by observable
firm characteristics, whereas we are trying to investigate what firm characteristics are associated
with tax avoidance—more in the spirit of Manzon and Plesko above.
Finally, we note that many recent papers provide evidence consistent with book-tax
differences also containing information about financial accounting earnings quality (i.e., earnings
management) and not just tax aggressiveness (see Mills and Newberry, 2001; Phillips, Pincus
and Rego 2003; Hanlon 2005). We discuss the implications of earnings management for our
measure of long-run tax avoidance, the CASH ETR, below.
10
3. Measures of Tax Avoidance
3.1. Problems with Traditional Effective Tax Rates
We begin with the traditional GAAP effective tax rate and then modify it to better fit the
goal of our study.6 To understand the modifications it is important to first understand what the
effective tax rate does and does not capture. The effective tax rate, which firms are required to
disclose in the footnotes to their financial statements, is the ratio of tax expense to pretax income.
Thus, the traditional effective tax rate for a given firm i for year t (ETRit) is given by:
it
itit IncomePretax
enseexpTaxETR = (1)
Both tax expense and pretax income are based on GAAP. In Compustat, Pretax Income
is data item 170 and Tax Expense is data item 16. Under Statement of Financial Accounting
Standards 109, Accounting for Income Taxes, tax expense is composed of the sum of current tax
expense and deferred tax expense. In terms of measuring a firm’s tax avoidance, using GAAP
tax expense presents a number of problems.
The first and most obvious is that the GAAP tax expense measure includes both current
and deferred taxes. Deferred taxes represent the future tax effects from current transactions.
Thus, these are future taxes to be paid (or refunded) not taxes paid in the current period.
However, even using only the current tax expense portion of the tax expense from the
financial statements presents considerable challenges. First, because the current tax expense is a
financial accounting, accrual-based measure of an expense it does not represent the actual taxes
paid during the period. For example, if a firm takes a tax position on its return that may hold up
under IRS scrutiny in the future, under certain conditions firms will accrue an the expense for
6 We use the effective tax rate as our beginning and comparison rate to our measure because this is the highlighted rate in the financial statements. We recognize, of course, that many researchers are aware of the problems with this measure in estimating current tax liabilities.
11
those taxes even though it is not paying them currently and may never pay them. This overstates
the current tax expense relative to the actual taxes paid by the firm.7
A second problem arises because of the accounting for the tax benefits of stock options.
During our sample period, there was no financial accounting expense for the granting of stock
options required. For tax purposes, however, firms were entitled to a deduction for the
difference between the market value of the stock and the strike price of the option when the
employees exercised the options. Thus, for tax purposes there was a deduction for employee
stock options but no expense for financial accounting—a permanent difference. However, under
the accounting rules the tax benefits for the deduction were added directly to equity rather than
accounted for as a book-tax difference that would reduce the current tax expense. As a result,
the current tax expense was overstated relative to the taxes actually paid for firms with stock
option deductions.8
3.2. Building a Better Effective Tax Rate
To overcome the limitations of traditional effective tax rates, we make two key
modifications. First, we measure effective tax rates over periods ranging from one year to ten
years. This is not the same as simply averaging a series of single-year effective tax rates. Such
averaging would still tend to overweight the effects of years with unusually large or small (even
negative) effective tax rates. Instead, we sum a firm’s total taxes over five and ten year periods
and divide that by the sum of its total pretax income over the same five and ten year periods.
7 This is known in the industry as the “tax cushion” or the tax contingency reserve. Practice regarding when and how to record tax cushions has varied across firms, leading to a recent FASB Exposure Draft on “Uncertain Tax Positions.” 8 See Hanlon (2003) for a more complete discussion of these and other issues. We note that the tax credit issue mentioned there is not a problem here because we are not measuring taxable income but a ratio of taxes paid relative to financial accounting income.
12
This produces an effective tax rate which we believe more closely tracks the firm’s tax burden
over the long-run.
Our second improvement is that we measure effective taxes using cash taxes paid rather
than GAAP tax expense. As discussed in the prior section, GAAP tax expense can differ in a
number of ways from actual taxes paid. Cash effective tax rates are not affected by changes in
estimates such as the valuation allowance or tax cushion. Finally, CASH ETRs take into
account the tax benefits of employee stock options, whereas traditional effective tax rates (using
total tax expense or only current tax expense) do not. In the empirical section of the paper, we
compare the properties of cash effective tax rates with those of traditional effective tax rates.
We recognize that using cash taxes paid over one year periods introduces other problems
not present when using current tax expense. The cash taxes paid can include payments to the
IRS upon settling an audit which may be for several years ago. In addition, the cash taxes paid
includes actual taxes paid during the year rather than taxes paid on the year’s income. However,
because our focus is on successful long-term tax avoidance we intend for these items to be
included, and in the long-run they are not problematic. For example, because we want to
examine successful long-run tax avoidance, the inclusion of payments to the IRS in subsequent
periods is appropriate—if the firm has to pay the IRS back taxes they were not successful in
avoiding the tax. In addition, the timing of the estimates versus the tax due for the year is not an
issue since we are summing the taxes paid over a period of five or ten years rather than focusing
on one year rates.
Our resulting cash effective tax rate for firm i measured over the period t=1 to N (CASH
ETRi) is:
13
∑
∑
1
1N
tit
N
tit
i
IncometaxPre
PaidTaxCashETRCASH
=
== (2)
We vary N from one year to as long as ten years. Cash tax paid is Compustat data item 317.
Cash tax paid can be found in the financial statements as a supplemental disclosure at the bottom
of the statement of cash flows or in the notes to the financial statements. Though firms are
required to disclose cash tax paid, it is sometimes missing in Compustat. In those cases (8.25
percent of the firm years), we use current tax expense rather than lose the firm from the sample.
The tenor of our results is not affected if we restrict the sample to only those observations that
have an unbroken string of cash tax paid on Compustat for the years in question, though the
resulting sample is smaller9
4. Empirical Evidence
4.1. Sample Selection
We impose minimal requirements on our sample in order to maximize our coverage. We
begin with all firm years on Compustat during the years 1995 – 2004 that report ten years of non-
missing cash taxes paid or non-missing current tax expense and non-missing pre-tax income.10
This produces 35,720 firm-year observations, corresponding to 3,572 firms. Next, we remove
observations that pertain to entities not taxed as corporations (e.g., limited partnerships, REITs,
9 We have also experimented with building time value of money considerations into our cash effective tax rate measures, in the same spirit that Shevlin (1990) and Graham (1996) incorporate time value of money into their estimates of marginal tax rates. Specifically, we assigned each firm an arbitrary discount rate of 10 percent and re-estimated (2) by discounting the amounts in both the numerator and denominator values back to year 1. 10 We also require some data in 1994 when running the tests in tables 4 and 5. This requirement eliminates an additional 211 firms, as noted in sub-section 4.4.
14
Trusts), which reduces the sample to 33,540 observations (3,354 firms).11 We also remove
utilities (SIC 49) from our sample as they are typically rate-regulated and may face different
incentives to avoid taxes than do firms that are not rate-regulated, reducing our sample to 31,080
observations (3,108 firms). Finally, we remove foreign firms except those that are foreign by
virtue of being incorporated in a tax haven. For example, DiamlerChrysler (Germany) and
Nortel (Canada) are excluded from the sample whereas Carnival (Panama) and Tyco (Bermuda)
are included in the sample. We define tax haven countries as the union of the countries
identified by the Office of Economic Cooperation and Development (OECD) as havens and
those countries identified as havens in Hines (2004) for which Compustat has a country of
incorporation code.12 Imposing this last requirement results in a sample of 29,090 firm-years,
corresponding to 2,909 unique firms that have an unbroken string of cash taxes paid or current
tax expense and pretax income.
Most of our tests require firms to have positive aggregate pretax income over the ten year
period. This requirement reduces the sample to 19,470 firm years, corresponding to 1,947 firms.
We primarily focus on these 1,947 firms to improve comparability across effective tax rate
measures (so we aren’t both changing the measure and the sample), and to enhance interpretation
of the effective tax rate measure (giving a meaningful effective tax rate number). However, to
aide in the illustration of our effective tax rate measures, we also retain a sample of all firm years
including those that do not have ten consecutive years of non-missing data for the effective tax
rate variables. This full sample is analyzed in table 1, and compared with our balanced
(restricted) sample in table 2. The remainders of the tests utilize firms in our balanced sample.
11 Specifically, we omit firms with names ending in “-LP” containing “TRUST” and firms with six digit CUSIPs ending in “Y” or “Z.” 12 The Compustat industrial file, from which we draw our sample, does not have country codes for all of the tax haven countries identified from these two sources. Thus, a haven firm is one identified by the OECD or Hines (2004) and with a Compustat country code.
15
While there are only 1,947 firms that have meaningful effective tax rate data for the ten
year period, these firms represent 83 percent of the total market capitalization of all Compustat
firms as of the end of our sample period (the year 2004). Moreover, the sample of firms that
have ten years of Compustat data is tilted towards mature firms that also tend to be the heaviest
taxpayers among corporations. In fact, the 1,947 firms that have continuous data since 1995
reported $129 billion in current federal income taxes in 2004, representing 56 percent of all
corporate taxes collected by the IRS that year (a figure that includes taxes paid by privately held
firms).13
4.2. The Distribution of Effective Tax Rates
Table 1 presents distributional characteristics of traditional effective tax rates and cash
effective tax rates, each measured over periods ranging from one year to ten years for a sample
of all Compustat firm years with non-missing ETR data in any one year. ETR1 refers to a
traditional effective tax rate (ETR from equation (1)) measured over a one-year period. ETR5
and ETR10 refer to the same but measured over a five year and ten year period, respectively.
CASH ETR refers to cash effective tax rates as given in equation (2). The underlying sample in
table 1 is allowed to vary across columns to illustrate issues related aggregation of data across
time. Table 2 presents the same measures as table 1, but the panel is balanced across time, and is
composed of the firms that have non-missing data over the ten year period (29,090 firms-year
observations representing 2,909 firms).
Table 1, Panels A and B demonstrates the frequency of non-meaningful effective tax
rates. Effective tax rates are hard to interpret when the denominator (pretax income) is negative
13 For this calculation we use current federal income taxes because we are comparing to IRS data, which obviously do not include taxes paid to foreign governments or U.S. states. Our other tests generally strive to include all income taxes paid regardless of the jurisdiction to which they are paid.

16
and researchers often classify such observations as undefined. Across all 70,469 firm-years in
the full sample, only 38,422 have positive pretax income. Thus, for a typical year about 45
percent of the sample would have an undefined effective tax rate if it were based on a single year
of data. The frequency of negative denominators declines as the aggregation period lengthens,
though not as sharply as one might expect. Over a five-year period, approximately 42 percent of
firms report negative pretax income. Surprisingly, 33 percent of firms have an aggregate pretax
income that is negative even when measured over a ten year period.
As noted earlier, table 2 requires that firms have ten years of consecutive tax data.
Repeating the same tests shows that the stricter data requirements effectively reduce the number
of negative pre-tax income firm-years. As with table 1, a surprising finding in table 2, panel B is
that the percentage of firms with negative pre-tax income fails to drop as the aggregation period
increases. This could be due to firms reporting a loss in any one year being likely to report
losses in other years so that their ten year average remains negative. It is also possible that firm
has a very bad year, perhaps due to a massive write-down, such that the losses they report in the
years they report a loss are so large it wipes out their earnings in their profitable years.
Even when pretax income is positive, non-meaningful effective tax rates can arise when
taxes paid are negative (causing a negative effective tax rates) or are so high as to exceed pretax
income (causing an effective tax rate greater than 100 percent). The frequency of effective tax
rates that fall outside the band from 0 to 1 range from nearly eight percent for one-year effective
tax rates to around five percent for ten-year cash effective tax rates. In order to make the
effective tax rates more interpretable, we reset any value greater than 1 to 1 and any value less
than zero to zero.

17
Panel C in table 2 examines the distribution (winsorized at 0 and 1) of effective tax rates,
both cash and traditional, with positive denominators. Several observations are noteworthy here.
First, CASH ETRs are consistently lower than traditional effective tax rates for each of the
measurement periods at both the means and medians. For example, the mean ETR1 is 32.8
percent balanced sample, whereas the mean CASH ETR1 is 25.1 percent.
Second, for both traditional and cash effective tax rates, the mean increases as the
measurement period lengthens. For example, the mean cash effective tax rate increases from
25.1 percent over a one-year period, to 29.0 percent over a five-year period, to 29.8 percent over
a ten year period. The same pattern holds at the medians. Interestingly, by ten years, the cash
effective tax rate is still several percentage points below the federal statutory tax rate of 35
percent during this period.
Third, there is significant variation around the mean and median effective tax rates. At
the 5th percentile CASH ETR1 is zero and at the 25th percentile, CASH ETR1 is only 10.3 percent.
Such low effective tax rates are not as easy to sustain for longer time periods. Over ten year
periods, the CASH ETR at the 5th percentile is 6.6 percent and at the 25th percentile it is 21.0
percent. In addition, even over a ten year period, both the mean and median of the cash tax
measure indicate that a significant number of firms do not pay taxes at the statutory tax rate.
Thus, there appears to be evidence that some firms are successful a tax avoidance even over
relatively long periods of time.
Finally, we note a small set of firms that appear to face unusually heavy tax burdens in
both samples. It would not be uncommon for a firm to face a combined federal and state tax
rate of approximately 40 percent. Moreover, if the firm did business in high tax foreign
jurisdictions the rate could be even higher. However, even at the 75th percentile firms appear to

18
be paying only about 37 percent of pretax income in taxes to all jurisdictions. Only when
reaching the highest percentiles of the distribution does CASH ETR10 surpass what one might
consider a reasonable range for the statutory rate.
Focusing on the balanced panel, Figure 1 presents histograms of cash effective tax rates
over one, five and ten year measurement periods for firms with positive denominators. It is clear
that the distribution tightens as the measurement period increases. With a one-year measurement
period, cash effective tax rates are fairly evenly spread across tax rate categories ranging from
zero to 40 percent. Only about 20 percent of the sample has one-year cash effective tax rates
between 30 and 40 percent. With a ten-year measurement period slightly over 30 percent of the
sample has cash effective tax rates between 30 and 40 percent.
Figure 2 focuses on those firms that are successful at long-run tax avoidance, those with
ten year cash effective tax rates of 20 percent or less. There are 437 such firms and they
comprise approximately 22 percent of the sample with meaningful CASH ETR10 (untabulated).
Figure 1 shows these 437 firms as the shaded blocks and for convenience we refer to these firms
as the “long-run tax avoiders.” Figure 2 takes the 437 long-run tax avoiders and examines the
distribution of their one-year cash effective tax rates. This figure shows that over 50 percent of
the meaningful firm year CASH ETRs are less than 10 percent of pretax income. In fact,
approximately 75 percent of all firm year CASH ETR observations fall in the range we consider
as denoting a successful tax avoider (rate < 20%).
While these firms do appear to be consistently successful at avoiding taxes, the fact that
in approximately 25% of years these firms will appear to have a rate greater than 20% (and in
approximately 13% of the years have an annual cash effective tax rate of greater than 30%)
demonstrates the risks of measuring effective tax rates calculated over just one year. Using
19
annual CASH ETR observations would result in the misclassification of successful avoider firms
as non-avoider firms somewhere between 13 percent to 25 percent of the time.
Figure 3 examines how quickly firms with extreme one-year cash effective tax rates
mean revert. We split firm-years into seven groups based on their one-year cash effective tax
rates. The graphs on the left (right) side include firms that report unusually low (high) cash
effective tax rates in year 0 (meaning firms in the lowest decile in any year from 1995-2000).
The pattern that emerges is that firms with unusually low cash effective tax rates in a given year
mean revert much more slowly than do firms with unusually high cash effective tax rates. Of the
firms that were in the lowest group of year 0 cash effective tax rates, over 40 percent are still in
the lowest group as of year +4. By contrast, only about 9.84 percent of the firms that were in the
highest cash effective tax rate group in year 0 were still in that group by year +4.
4.3. Industries and Firms with Consistently Low Effective Tax Rates
There is some evidence of industries that have consistently low cash effective tax rates.
Table 3 presents industry average cash effective tax rates for measurement periods ranging from
one to ten years, calculated by taking the mean of the effective tax rate measures across firms
within a given industry. The ten two digit sic code industries with the lowest mean ten-year cash
effective tax rates are presented in table 3. The industry with the lowest cash effective tax rate is
SIC 40, railroad transportation, with an average ten-year cash effective tax rate of just 15%. This
industry represents less than one percent of the total sample but 2.3 percent of the long-run tax
avoiders. Other low tax industries are oil and gas extraction (CASH ETR10 = 17.3%), real estate
(CASH ETR10 = 21.4%), trucking and warehousing (CASH ETR10 = 22.3%), amusement and
recreation services (CASH ETR10 = 22.4%), insurance carriers (CASH ETR10 = 24.2%),

20
Automotive Dealers and service stations (CASH ETR10 = 24.6%), petroleum and coal products
(CASH ETR10 = 24.6%), non-depository institutions (CASH ETR10 = 27.4%), and water
transportation (CASH ETR10 = 28.1%).
However, considering that the mean CASH ETR10 rate across the entire sample is 29.8
percent (table 2), many of these low tax industries do not appear all that out of the ordinary.
Only two industries, railroads (SIC 40) and oil and gas extraction (SIC 13) have average ten-year
cash effective tax rates lower than 20 percent. Collectively, these ten industries constitute 16
percent of the total sample and 36 percent of the long-run tax avoiders. In short, there is some
evidence of industry clustering of long-run tax avoiders, but there is also plenty of firm-specific
variation (i.e., 64 percent of long-run tax avoiders come from industries that have average
sixteen year cash effective tax rates that exceed 28.1 percent).
To get a sense of the identities of long-run tax avoiders, we sort firms by market value as
of the end of 2004 and then rank the largest 100 firms by CASH ETR. Table 4 reports data for
the 25 firms from this group of 100 with the lowest ten-year CASH ETRs. We focus on the 100
largest firms so that readers will be familiar with the firms.
For comparison, we also present the traditional effective tax rates for these firms also
measured over the same ten year period. The traditional effective tax rates are much higher than
the cash effective tax rates. For firms that are heavy issuers of employee stock options this is
understandable. The tax benefit from employee stock options was reported outside of tax
expense during this period and as a result, the GAAP tax expense far overstated the actual tax
burden faced by a firm with large use of employee stock options. However, stock options do not
appear to be able to explain the entire difference between the cash effective tax rates and the
traditional effective tax rates. All of the firms on this list have cash effective tax rates lower than

21
15 percent, but only Carnival and Hartford Financial Services Group have traditional effective
tax rates that are less than 15 percent.
Also of interest is the comparison between rankings based on CASH ETR10 and ETR10.
Table 4 illustrates that less than half of the top twenty five would have made the list if ETR10
were used. Several of those not making the list would have been far from the top twenty five,
including Dell (ranked 34th), Cendant (ranked 39th), Qualcomm (ranked 68th), and Occidental
Petroleum (ranked 90th). While General Electric (ranked 15th in terms of ETR10) and Devon
Energy (ranked 25th) would have fallen in the upper quartile of the most successful tax avoiders,
they both exhibit a large a disparity of over 15% between ETR10 and CASH ETR10.
For some of these firms the source of the low CASH ETR can be discerned from
examining their SEC filings. Among the largest corporations, Carnival is clearly the leader in
long-run tax avoidance, with a ten-year cash effective tax rate of 0.7 percent. For example, in
FYE 2004 Carnival reported approximately $1.9 billion of pretax income but just $47 million of
tax expense, for a GAAP effective tax rate of approximately 2.5 percent. Carnival’s actual cash
tax paid in 2004 was $8 million, for a 2004 cash effective tax ate of approximately 0.4 percent.
How does Carnival achieve such tax savings? Carnival is headquartered in Miami but is
incorporated in Panama, a country classified as a tax haven by the OECD.14 Under Section 883
of the Internal Revenue Code, income derived by a foreign corporation from the international
operation of ships or aircraft is, under certain conditions, excluded from U.S. taxation. As a
Panamanian corporation, Carnival is a foreign corporation for U.S. tax purposes. Not all of
14 In 2003, Carnival and the former parent of Princes Cruise lines engaged in a sort-of synthetic merger to form a “dual listed company” (not to be confused with cross-listing). This was a highly complex transaction but can be briefly described as follows. In the dual listed company structure, both parent companies are tied together contractually and through amendments to their corporate charters, but continue to have separate boards of directors and remain incorporated in their respective countries (Panama for the historic Carnival parent, England and Wales for the historic Princess parent).
22
Carnival’s income is exempt under Section 883; it is subject to U.S. tax on non-shipping income
such as the operation of hotels.
Tyco also achieves tax savings from being incorporated in a tax haven, in its case
Bermuda, rather than being incorporated in the U.S. Tyco is not able to avoid taxes to the extent
of Carnival, however. In FYE 2004, Tyco reported approximately $4.159 billion of income from
continuing operations before taxes and minority interest, approximately $1.14 billion of GAAP
tax expense, and $550 million of cash income taxes paid, net of refunds. Thus, Tyco’s GAAP
effective tax rate for 2004 was approximately 27.4 percent, whereas its cash effective tax rate
was approximately 13.2 percent.
The tax advantage of being incorporated outside the U.S. is two-fold. First, it removes
non-U.S. income from the U.S. tax system. U.S. incorporated multinationals eventually face
U.S. tax on their worldwide income and have to rely on foreign tax credits to mitigate double-
taxation. Companies with income in low-tax foreign countries find that particularly onerous, as
the U.S. approach to taxation results in foreign earnings being taxed at the greater of the foreign
rate and the U.S. rate. By incorporating in a tax haven, firms avoid having to subject their
foreign income to U.S. corporate income taxes. Second, some have alleged that firms
incorporated in tax havens are able to shift income from high tax jurisdictions to low- or no-tax
jurisdictions through transfer pricing, inter-company debt, and transfers of intangible assets.
These issues are discussed in detail by Desai and Hines (2002) among others.
The firms on this list illustrate that there are many potential causes of a low cash effective
tax rates. A cluster of companies like Dell, Microsoft and Cisco are likely on the list at least in
part due to heavy use of employee stock options during this period. Because employee stock

23
options were generally not expensed for financial reporting purposes during this period but did
generate tax deductions, they tend to reduce CASH ETRs.
Boeing, one of the United States’ largest exporters, experienced tax savings due to a
combination of factors, including tax provisions that Congress enacted that are favorable to
exporters (i.e., the FSC and ETI provisions, since repealed under pressure due to perceived
conflicts with GATT), tax credits for engaging in research and development, and charitable
contributions.
Hartford Financial Services Group, an insurance company, has investments that generate
large amounts of tax-exempt interest income as well as dividend income from other companies,
which is subject to the dividends received deduction. Other insurance companies on the list
include American International Group, St. Paul Travelers, and Allstate. In sum, an examination
of individual companies shows there are many paths to low long-run cash effective tax rates.
Some of these may be firm-specific and idiosyncratic. The next section examines whether there
are general factors associated with long-run tax avoidance across a broad set of firms.
4.4. Explaining Cross-Sectional Variation in Long-Term Tax Avoidance
In this section, we present a first step at explaining the characteristics associated with
long-run tax avoidance. Table 4 presents descriptive statistics for variables that we use in the
regression analysis. We draw many of these variables directly or indirectly from prior studies
that have examined variation in one-year effective tax rates. We hasten to add that these tests are
merely exploratory and cannot be used to infer causality as the variables are endogenously
determined.

24
The factors we use to explain the cross-sectional variation in CASH ETR10, our measure
of long-term tax avoidance are: (1) property, plant and equipment, (2) estimated employee stock
option expense, (3) intangible assets, (3) incorporation in a tax haven, (4) foreign pretax income,
(5) foreign assets, (6) leverage, (7) advertising expense (8) an indicator for net operating loss at
the beginning of the sample period, (9) the change in the net operating loss balance, (10) special
items, (11) equity in earnings, (12) research and development expense, and (13) size. We
hypothesize these factors are either directly related to long term tax avoidance through
provisions in the tax code that make them tax favored activities (or proxies for such activities), or
indirectly related through a business structure which allows for more efficient tax avoidance.
Property, plant and equipment is included in our analysis for two reasons. First, Mills et
al. (1998) argue that capital intensive firms potentially have more avenues for tax planning.
These avenues include decisions of whether an asset is purchased or leased, timing of purchases
and dispositions of assets. Second, to the extent fixed assets are purchased at a greater rate than
they are disposed, book-tax differences will arise do to favorable depreciation rates for tax
purposes. Although aggregating over ten years will mitigate a great portion of these temporary
differences, we nevertheless expect the change in the level of property plant and equipment to be
associated negatively associated with tax avoidance. We measure property plant and equipment
as the average level of property plant and equipment over the sample period (((PP&E in
1994/Assets in 1994 + PP&E in 2004/Assets in 2004)/2); Compustat data item #8)
Stock options generate a tax deduction for the firm equal to the intrinsic value of the
option on the date of exercise. This deduction reduces cash payments for income taxes. We
estimate a firm’s stock option expense using data from Execucomp assuming all option holders
exercise on a schedule similar to the executives listed in the Execucomp database, that the value
25
of non-executive exercises is proportional to the executive exercises, and that the proportion of
exercises during the year by executives versus non-executive employees is the same as the
proportion of new grants to executives versus non-executive employees. Specifically, we gross
up the value of executives’ exercises (Execucomp variable SOPTEXER) by the percentage of
total options granted that were granted to the executives (Execucomp variable PCTTOTOP).
Thus, if executives exercise options with an intrinsic value of $100, and were granted 50% of the
options granted in the current year, we assume the total intrinsic value for all options exercised is
$200.15 Based on this calculation, we expect option expense (EST_OPT_EXPENSE) to be
negatively related to the cash effective tax rate.
We include the average level of intangible assets (INTANGIBLES) as a proxy for a firm’s
ability to easily shift income (Grubert and Slemrod (1998) and Hanlon, Mills and Slemrod
(2005). A firm without physical assets can more easily locate income in a jurisdiction that is tax-
favored, without the burdens that would accompany a firm with fixed assets. Thus, we expect
the average level of intangibles to be inversely related to the rate of cash taxes paid. We measure
INTANGIBLES as the average level of booked intangibles over the sample period
(((INTANGIBLES in 1994/Assets in 1994 + INTANGIBLES in 2004/Assets in 2004)/2);
Compustat data item #33).
We include an indicator variable for firms that are incorporated in a tax haven country
(HAVEN), defined as countries identified as havens by the Organization for Economic Co-
operation and Development (OECD) or those listed in Hines (2004). We expect firms that are
located in haven countries to be more proficient at sheltering income from taxes, and therefore
expect a negative coefficient on HAVEN.
15 We follow Desai (2003) in this estimation procedure. We recognize that this method is merely an estimate and is based on several underlying assumptions.
26
We include average foreign income (Compustat data item # 273) divided by average total
assets (data item # 6) (FI) as proxy for the extent to which a firm’s income is not earned in the
United States. While the United States taxes worldwide income, a variety of provisions in the
tax code and treaties with foreign countries allow firms to defer the repatriation of earnings, or
effectively offset tax liabilities from low tax countries with excess taxes paid in high tax
countries. In addition, Rego (2003) uses a measure of foreign income to predict one year world
wide effective tax rates, and finds a significant, negative coefficient on the variable. Similar to
Rego (2003), we expect firms with more foreign income to be have more tax avoidance
opportunities, and therefore predict a negative coefficient on FI.
Rego (2003) also predicts that a greater foreign presence results in a greater ability to
avoid taxes. She utilizes foreign assets as a proxy for the extent of a firm’s foreign operations.
She also includes a quadratic term, and finds that ETRs are decreasing at a decreasing rate with
respect to foreign operations. Following Rego (2003), we also include foreign assets as both a
linear (FOR_ASSETS) and quadratic term (FOR_ASSETS2) in our analysis. Total foreign assets
are estimated by summing the AT variable from the Compustat business segment files across all
non-US segments. We compute these variables as the average ratio of foreign assets to total
assets over our sample period (foreign assets in 1994/total assets in 1994 + foreign assets in
2004/total assets in 2004)/2).
Following Mills, Erickson and Maydew (1998), we include leverage (LEV) as a proxy for
financial sophistication. If leverage is a good proxy for financial sophistication, we predict a
negative coefficient. We compute leverage as the average long-term debt to total asset ratio over
our sample period (data9 in 1994/data6 in 1994 +data9 in 2004/data6 in 2004)/2).
27
Anecdotal evidence suggests firms that are more visible in the public eye are less likely
to engage in aggressive tax positions. We include average advertising expense (ADVERTISING;
Compustat data item #45) over the ten year period, scaled by average total assets(Compustat data
item #6) as a proxy for public visibility, and predict a positive coefficient.
We also control for net operating losses. Firms are drawn into our sample period with a
variety of conditions that may make taxes paid during the period vary, regardless of tax
avoidance activities during the period. In particular, if a firm has a net operating loss
carryforward balance at the beginning of the sample period, it will have opportunity to utilize
that deduction in a future period. This balance, however, is a result of actions taken outside the
sample period. To capture this effect we include an indicator variable for whether a firm has an
operating loss carryforward (Compustat data item #52) at the beginning of the sample period
(NOL_DUMMY), and expect firms with such a balance to pay lower rates of taxes in the sample
period. Therefore, we predict a negative coefficient on NOL_DUMMY. We also measure the
change in the operating loss balance. A decreasing operating loss over the sample period would
indicate the firm has utilized some of the deductions during the sample period to avoid taxes.
Thus we include a variable that captures the change in the net operating loss balance (NOL) and
expect to find a positive coefficient (calculated as ((data52 in 2004 – data52 in 1994)/(data6 in
2004-data6 in 1994))).
Special items are included in the pre-tax earnings we used in the denominator of our
dependent variable, CASH ETR10. Special items typically generate a book-tax difference. This
difference can be either temporary or permanent. If a negative (positive) permanent difference,
the special item would decrease (increase) book income but not taxable income resulting in a
high (low) CASH ETR. If the difference is a negative (positive) temporary difference (such as
28
severance pay and restructuring charges), it would decrease financial accounting income in a
year prior to when the deduction could be taken. If all differences were temporary and our time
period captured all expenses for financial accounting and deductions for taxable income (i.e,
captured the reversals) we would expect no effect from special items on our variable. However,
because some of these items are permanent in nature and our time period will not capture all
reversals we predict a negative relation (i.e., the more negative the special item the higher the
CASH ETR).
We include equity in earnings (EQUITY_EARN) to control for the book-tax difference
that is created by including earnings consolidated using the equity method for book purposes.
Entities owned 20% or more and 50% or less are accounting for using the equity method of
accounting for financial accounting. In this case the proportion of earnings of the subsidiary
attributable to the parent are included in the income of the parent. For tax purposes, however,
these earnings are not included in taxable income and instead only dividends received are
included and are subject to the dividends received deduction. As a result, we expect that the
greater the equity earnings the lower the CASH ETR because the denominator will increase but
the cash taxes paid will not increase proportionately.
We include average research and development expense (R&D; Compustat data item #46,
reset it to zero if missing) scaled by average total assets (Compustat data item #6) as a proxy for
the level of intangibles which may allow the firm more opportunities to engage in tax planning
(Grubert and Slemrod 1998 and Hanlon, Mills and Slemrod 2005) as well as to take into account
the effect of any potential R&D tax credit which may lower the CASH ETR10.16 We expect the
coefficient on R&D to be negative.
16 However, the full effect of the tax credit may not be captured since the credit calculation is based on incremental research and developmental expenditures and is not a simple calculation.

29
Finally, we include the log of average total assets (SIZE) as a proxy for size. Prior
research (Rego (2003), Mills et al. (1998)) finds that firms enjoy economies of scale in the tax
planning arena. Therefore, we expect (SIZE) to be negatively related to CASH ETR10.
After computing each of the variables mentioned above, 211 firms are lost due to missing
data in 1994 (needed to compute the beginning of the period values). This reduces our sample
from 1,947 firms to 1,736 firms.
Table 6 presents the regression results. The dependent variable in each regression is the
ten year cash effective tax rate.17 While many of the variables can explain cross-sectional
variation in the ten year effective tax rates, there is much left to be explained (the highest R2
across the models is 22.6%).
Several patterns emerge in the data. There is consistent evidence that fixed asset
intensive firms (as measured by the variable PP&E) have lower cash effective tax rates. Using
model 8’s coefficient, a ten percent increase in the proportion of the firm’s assets that are
comprised of property, plant and equipment translates into a 1.1 percent lower cash effective tax
rate. This is consistent with the tax laws favoring investments in tangible assets through rapid
depreciation.
As expected, estimated option expense is negative and significant. The coefficient in
model 8 suggests that increasing options expense by 10% of assets (which would be a very large
increase in employee stock options) would result in a decreased cash effective tax rate of nearly
8%.
Firms with more intangible assets appear more successful at avoiding cash taxes over the
long run. In particular, a 10% increase in intangible assets would result in a decrease in the rate
of cash taxes paid just over one percent. 17 We de-mean all variables to aid in the interpretation of the industy fixed effects.

30
Firms that report foreign income in their financial statements do not appear to have lower
cash effective tax rates than other firms. However, firms locating in haven countries have on
average a cash effective tax rate nearly 7% lower than other firms (per model 8). Conversely,
the presence of foreign assets (as opposed to foreign income) is associated with higher income
taxes, although the effect is increasing at a decreasing rate as the quadratic term loads negatively
and significant. Taking these three findings together suggests that merely having foreign
operations is not associated with tax avoidance, but reporting foreign income that is out of
proportion with foreign assets is associated with tax avoidance. In addition, foreign operations
located in a tax haven country particularly enhance the firm’s ability to avoid cash tax payments.
Interestingly, the results on FOR_ASSET and FOR_ASSET2 are opposite of what Rego
(2003) finds. This difference could be due a variety of factors that set our analysis apart from
Rego (2003). In particular, our dependent variable is measured over ten years and uses cash tax
paid, not current tax expense. Additionally, while we include many of the same explanatory
variables as Rego, we also have variables that Rego doesn’t include, including
EST_OPT_EXPENSE, LEV, and INTANGIBLES, among others.
The data indicate that large firms appear better able to avoid taxes than smaller firms.
The coefficient on the log of the firm’s assets, SIZE, is negative and significant across each of
the specifications. We also find that the presence of special items is associated with lower cash
effective tax rates.
The presence of an NOL carryforward balance at the beginning of the period,
NOL_DUMMY is associated with lower cash effective tax rates, consistent with firms using up a
carryforward which reduces their tax rate during those years. The change in the NOL
carryforward, NOL, is positively associated with cash effective tax rates, indicating that a
31
decrease in an NOL decreases taxes during the period (the firm is applying the NOL
carryforward) and an increase in an NOL increases tax rates consistent with firms with an
increasing NOL not being able to utilize the carryforward during the period (perhaps because of
IRC §382).
Models 2, 4, 6, and 8 contain industry fixed effects; only those industries with significant
coefficients are presented for the sake of brevity. The coefficients on the industry fixed effects
can be interpreted as the incremental mean effect of factors constant within an industry, over and
above the sample mean effective cash tax rate. SIC 67, holding and other investment offices,
and SIC 65, real estate, are the two industries with the lowest cash effective tax rates in the
presence of the other explanatory variables. These results are generally consistent with table 3,
which showed the 10 industries with the lowest effective tax rates. However, only three of the
10 industries in table 3 have significant fixed effects (SIC 13, oil and gas extraction; SIC 63,
insurance carriers; and SIC 65, real estate). None of the other 7 industries on the list have
significant fixed effects, suggesting that their low tax status is not due to industry per se, but
rather due to other factors associated with industry that are captured by the other explanatory
variables.
Several industries show up as being heavily taxed. Among the most heavily taxed are
Those are SIC 27, printing and publishing, and SIC 48, communication, and SIC 31, leather and
leather products.
While completely understanding a firm’s tax position would require a case study of the
firm, and would likely require private information as well, this analysis demonstrates the ability
to tease out some general patterns from the publicly-available data.

32
5. Caveats
It is important to note that we are measuring explicit taxes and not implicit taxes (in the
sense of Scholes et al., 2005). Explicit taxes are taxes paid directly to a taxing authority.
Implicit taxes are taxes indirectly paid to issuers of tax favored assets by accepting a lower
pretax rate of return. The canonical example of implicit taxes involves municipal bonds, which
are exempt from federal income taxes. It is well documented that municipal bonds have lower
pretax returns than fully taxable corporate bonds of equivalent risk and duration (Chalmers,
1998; Poterba, 1986).
Say, for example, that corporate bonds yield a pretax return of 10 percent and otherwise
similar municipal bonds yield a pretax return (and after-tax, as they are tax exempt) of 6.5
percent. Then the municipal bonds are said to bear an implicit tax of 3.5 percent or equivalently
be subject to an implicit tax at a rate of 35 percent [(10% − 6.5%) / 10%].18 Consider two firms
that each owns a single asset. The first firm owns corporate bonds, does no tax planning, and
pays tax at the 35 percent corporate tax rate. That firm would have an effective tax rate of 35
percent by our measure. The second firm own municipal bonds and does no other tax planning.
That firm would have an effective tax rate of zero by our measure and in fact would be a
successful avoider of explicit taxes, though it would bear a 35 percent implicit tax burden. In
terms of maximizing after-tax shareholder wealth, however, both firms would be in the same
position. This means that while we can measure explicit tax avoidance, we cannot and do not
claim that tax avoidance directly translates into shareholder wealth, because avoiding explicit
taxes can, in some cases, result in an increase in implicit taxes.
18 In practice, the yield spread between municipal bonds and fully taxable but otherwise similar corporate bonds is smaller than would be implied by statutory tax rates, a condition known as the “muni bond puzzle.” For discussions of the muni bond puzzle, see Chalmers (1998) and Poterba (1986).
33
There is no reason to expect that implicit taxes are limited to municipal bonds and, in
fact, there is some evidence of implicit taxes in other tax-favored investments such as preferred
stock (Erickson and Maydew, 1998) in ESOPs (Shackelford, 1991), and research and
development expenditures (Berger, 1993). Apart from a few documented cases of implicit taxes,
however, we know little about them because they are so difficult to measure. Essentially, to
directly measure implicit taxes one has to find settings whether two assets have different tax
treatments but are otherwise identical. Such settings are exceedingly rare. Another approach is
to attempt to indirectly measure implicit taxes by controlling for risk and other priced non-tax
differences between assets, but the resulting implicit tax estimates are only as good as our ability
to precisely measure how risk and other attributes map into expected returns.19
6. Conclusions
Despite decades of tax research, little is known about firms’ ability to avoid income taxes
over long periods of time. The purpose of this study is to shed some initial evidence on this
question. We find a significant fraction of firms that appear to be able to successfully avoid
large portions of the corporate income tax over sustained periods of time. Using a ten-year
measure of tax avoidance we find 437 firms, comprising 22 percent of our sample, which are
able to maintain a cash effective tax rate of 20 percent or less. At the same time, the mean firm
is not much of a tax avoider, with a ten-year cash effective tax rate of approximately 30 percent.
This suggests that tax avoidance is concentrated in a subset of long-run tax avoiders.
19 Nevertheless, one avenue of future research that we are exploring is whether there is evidence of implicit taxes at the firm-level that are inversely related to the explicit taxes that we document in this paper. It is possible that firms that show up as successful long-run tax avoiding firms do so at the expense of sacrificing pretax rates of return; that is they may bear implicit taxes that partially or fully offset the reductions they have achieved in their explicit taxes.
34
Industry explains a modest amount of long-run tax avoidance. While we find some
evidence of industry clustering of long-run tax avoiders (e.g., oil and gas extraction, insurance
and real estate), those industries only account for a fraction of all long-run tax avoiders. Low
long-run cash effective tax rates are associated with being a large firm, being incorporated in a
tax haven, having a high ratio of property, plant and equipment to assets, being intangible
intensive, and being highly levered. Controlling for employee stock option use also helps to
explain variation on cash effective tax rates.
There are a number of unanswered questions regarding long-run tax avoidance. First, is
long-run tax avoidance valued by the market? There are reasons why it might not be. Under
certain conditions, avoidance of explicit taxes comes at the price of bearing implicit taxes –
reductions in pretax rates of return. Implicit taxes are notoriously difficult to measure, so
examining this possibility may not be feasible. Second, what causes firms from the same
industry that otherwise look fairly similar to diverge when it comes to apparent tax avoidance?
Third, do firms that exhibit long-run tax avoidance appear to suffer any tax consequences such as
increased litigation for alleged tax shelters? Finally, is there any connection between long-run
tax avoidance and symptoms of governance breakdowns such as accounting fraud, as would be
suggested by Desai and Dharmapala (2005)?

35
References
Bankman, Joseph. “The Tax Shelter Battle.” The Crisis in Tax Administration, edited by Henry J. Aaron and Joel Slemrod. Washington, D.C.: The Brookings Institution (2004).
Berger, Philip G. 1993. "Explicit and Implicit Tax Effects of the R&D Tax Credit." Journal of Accounting Research 31(2):131-171.
Chalmers, John M. R. 1998. "Default Risk Cannot Explain the Muni Puzzle: Evidence from Municipal Bonds That are Secured by U.S. Treasury Obligations." Review of Financial Studies 11(2):281-308.
Collins, Julie H., Douglas A. Shackelford. 1995. "Corporate domicile and average effective tax rates: The cases of Canada, Japan, the United Kingdom, and the United States." International Tax and Public Finance (Historical Archive) 2(1):55-83.
Desai, Mihir, A. 2003. “The corporate profit base, tax sheltering activity, and the changing nature of employee compensation.” Working paper, Harvard University.
Desai, Mihir A., Dhammika Dharmapala. "Corporate tax avoidance and high-powered incentives." Journal of Financial Economics In Press, Corrected Proof.
Desai, Mihir A., James R. Hines Jr. 2002. "Expectations and expatriations: Tracing the causes and consequences of corporate inversions." National Tax Journal 55(3):409.
Dhaliwal, Dan S., Cristi A. Gleason and Lillian F. Mills. 2004. "Last-Chance Earnings Management: Using the Tax Expense to Meet Analysts' Forecasts." Contemporary Accounting Research 21(2):431-459.
Edwards, Courtney. 2005. "Do Employee Stock Options Encourage Tax Sheltering?" Working Paper, University of North Carolina.
Engel, Ellen, Merle Erickson and Edward Maydew. 1999. "Debt-equity hybrid securities." Journal of Accounting Research 37(2):249.
Ericksen, Merle M., Edward L. Maydew. 1998. "Implicit taxes in high dividend yield stocks." Accounting Review 73(4):435.
Erickson, Merle. 1998. "Research Reports: The Effect of Taxes on the Structure of Corporate Acquisitions." Journal of Accounting Research 36(2):279-298.

36
Erickson, Merle, Austan Goolsbee and Edward Maydew. 2003. "How prevalent is tax arbitrage? Evidence from the market for municipal bonds." National Tax Journal 56(1):259.
Frank, Mary M., Luann J. Lynch and Sonja O. Rego. 2005. "Does Aggressive Financial Reporting Accompany Aggressive Tax Reporting (and Vice Versa)?" Working Paper, University of Iowa.
Freidman, J. 2003. “The Decline of Corporate Tax Revenues” Center on Budget and Policy Priorities, Washington, D.C. (October 24).
Graham, John R. 2000. "How Big Are the Tax Benefits of Debt?" Journal of Finance 55(5):1901.
Graham, John R. 1996. "Debt and the marginal tax rate." Journal of Financial Economics 41(1):41-73.
Graham, John, Alan L. Tucker. 2005. "Tax Shelters and Corporate Debt Policy." Working Paper, Duke University.
Grubert, Harry, Joel Slemrod. 1998. "The Effect of Taxes on Investment and Income Shifting to Puerto Rico." Review of Economics and Statistics 80(3):365-373.
Guenther, David A., Edward L. Maydew and Sarah E. Nutter. 1997. "Financial reporting, tax costs, and book-tax conformity." Journal of Accounting and Economics 23(3):225-248.
Hanlon, Michelle. 2005. "The Persistence and Pricing of Earnings, Accruals, and Cash Flows When Firms Have Large Book-Tax Differences." The Accounting Review 80(1):137.
Hanlon, Michelle. 2003. "What Can We Infer about a Firm's Taxable Income from Its Financial Statements?" National Tax Journal 56(4):831-863.
Hanlon, Michelle, Stacie Kelley, and T. Shevlin. 2005. “Evidence on the Information Loss of Conforming Book Income and Taxable Income,”forthcoming at The Journal of Law and Economics.
Hanlon, Michelle and Terry Shevlin. 2005. “Book-Tax Conformity for Corporate Income: An
Introduction to the Issues,” forthcoming, Tax Policy and the Economy No. 18, 2005, edited by James M. Poterba. National Bureau of Economic Research, Cambridge, MA.
Hanlon, Michelle, Lillian Mills and Joel Slemrod. 2005. "An Empirical Examination of Corporate Tax Noncompliance." working paper presented at the conference on Taxing Corporate Income in the 21st Century.
37
Hines Jr., James R. 2004. "Do Tax Havens Flourish?" NBER Working Paper No. W10936.
Manzon, Gil B., George A. Plesko. 2002. "The Relation Between Financial and Tax Reporting Measures of Income." Tax Law Review 55(2):175.
McGill, Gary A., Edmund Outslay. 2004. "Lost in Translation: Detecting Tax Shelter Activity in Financial Statements." National Tax Journal 57(3):739-756.
Miller, Gregory S., Douglas J. Skinner. 1998. "Determinants of the valuation allowance for deferred tax assets under SFAS No. 109." Accounting Review 73(2):213.
Mills, Lillian F. 1998. "Book-Tax Differences and Internal Revenue Service Adjustments." Journal of Accounting Research 36(2):343-356.
Mills, Lillian F., Kaye J. Newberry. 2001. "The Influence of Tax and Nontax Costs on Book-Tax Reporting Differences: Public and Private Firms." Journal of the American Taxation Association 23(1):1-19.
Mills, Lillian, Merle M. Erickson and Edward L. Maydew. 1998. "Investments in Tax Planning." Journal of the American Taxation Association 20(1):1.
Phillips, John, Morton Pincus and Sonja O. Rego. 2003. "Earnings Management: New Evidence Based on Deferred Tax Expense." Accounting Review 78(2):491.
Plesko, G. (2000). “Book-Tax Differences and the Measurement of Corporate Income.” In Proceedings of the Ninety-Second Annual Conference on Taxation, 1999. National Tax Association. Washington, D.C.: 171-176.
Plesko, G. (2002). “Reconciling Corporation Book and Tax Net Income, Tax Years 1996-1998.”
SOI Bulletin 21 No. 4 (spring): 1-16.
Plesko, George A. 2003. "An evaluation of alternative measures of corporate tax rates." Journal of Accounting and Economics 35(2):201-226.
Plesko, G. (2004). “Corporate Tax Avoidance and the Properties of Corporate Earnings.” Forthcoming, National Tax Journal, September.
Plesko, George A. 2003. "An evaluation of alternative measures of corporate tax rates." Journal of Accounting and Economics 35(2):201-226.
Poterba, James M. 1986. "Explaining the Yield Spread between Taxable and Tax-exempt Bonds: The Role of Expected Tax Policy." Studies in State and Local Public Finance:5.

38
Rego, Sonja O. 2003. "Tax-Avoidance Activities of U.S. Multinational Corporations." Contemporary Accounting Research 20(4):805-833.
Scholes, M., M. Wolfson, M. Erickson, E. Maydew, and T. Shevlin. 2002. Taxes and Business Strategy: A Planning Approach, Second edition, Prentice Hall, Upper Saddle River, NJ.
Seida, Jim A., William F. Wempe. 2004. "Effective Tax Rate Changes and Earnings Stripping Following Corporate Inversion." National Tax Journal 57(4):805-828.
Shackelford, Douglas A. 1991. "The market for tax benefits : Evidence from leveraged ESOPs." Journal of Accounting and Economics 14(2):117-145.
Shackelford, Douglas A., Terry Shevlin. 2001. "Empirical tax research in accounting." Journal of Accounting and Economics 31(1-3):321-387.
Shevlin, Terry. 1990. "Estimating Corporate Marginal Tax Rates with Asymmetric Tax Treatment of Gains and Losses." Journal of the American Taxation Association 11(2):51.
U.S. Department of the Treasury. (1999). “The Problem of Corporate Tax Shelters: Discussion, Analysis and Legislative Proposals.” Washington, D.C.
Yin, G. (2003). “How Much Tax Do Large Public Corporations Pay?: Estimating the Effective
Tax Rates of the S&P 500.” Virginia Law Review December, Vol. 89.
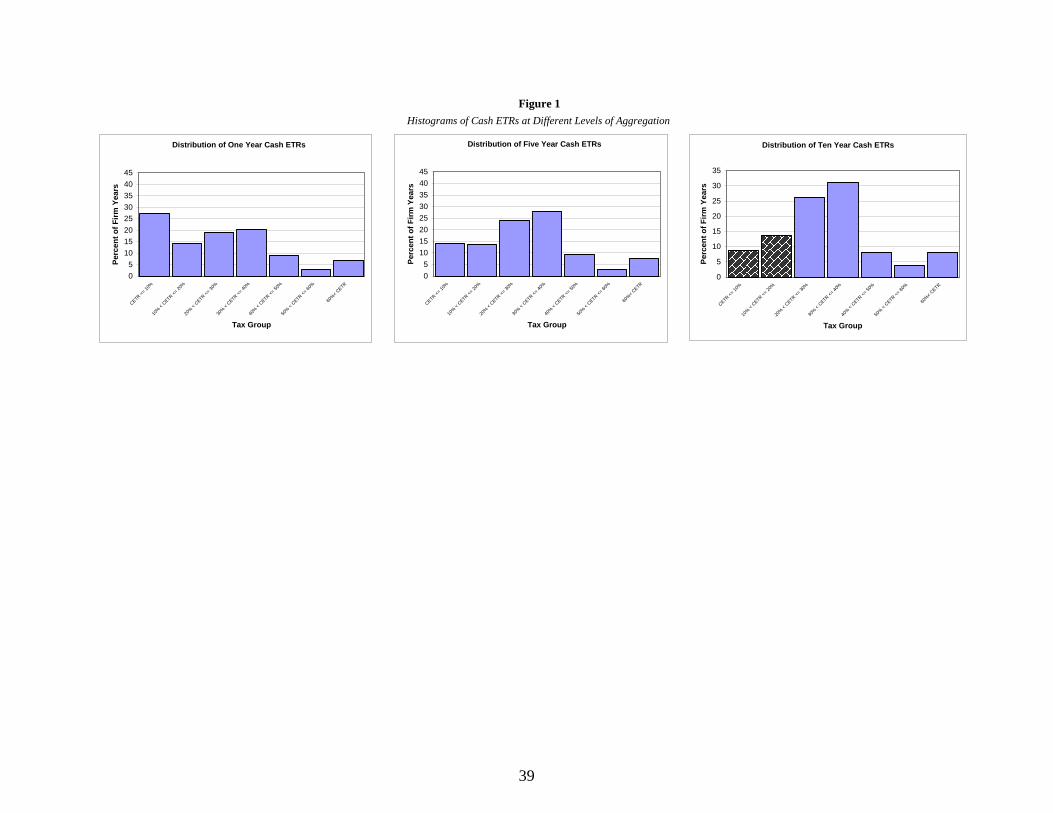
39
Figure 1Histograms of Cash ETRs at Different Levels of Aggregation
Distribution of Five Year Cash ETRs
05
1015202530354045
CETR <= 10
%10
% < CETR <=
20%
.20% < C
ETR <= 30
%30
% < CETR <=
40%
40% < C
ETR <= 50
%50
% < CETR <=
60%
60%< C
ETR
Tax Group
Perc
ent o
f Firm
Yea
rs
Distribution of One Year Cash ETRs
05
1015202530354045
CETR <=
10%
10% < C
ETR <= 20
%.20
% < CETR <=
30%
30% < C
ETR <= 40
%40
% < CETR <=
50%
50% < C
ETR <= 60
%
60%< C
ETR
Tax Group
Perc
ent o
f Firm
Yea
rs
Distribution of Ten Year Cash ETRs
0
5
10
15
20
25
30
35
CETR <= 10
%10
% < CETR <=
20%
.20% < C
ETR <= 30
%30
% < CETR <=
40%
40% < C
ETR <= 50
%50
% < CETR <=
60%
60%< C
ETR
Tax Group
Perc
ent o
f Firm
Yea
rs

40
Figure 2Histograms of Cash ETRs at Different Levels of Aggregation
Distribution of One Year Cash ETRsSubsample of f irms w ith Ten Year Cash ETR <= 20%
0
10
20
30
40
50
60
Tax Group
Perc
ent o
f Firm
Yea
rs
Distribution of Ten Year Cash ETRs
0
10
20
30
40
50
60
70
80
Tax Group
Perc
ent o
f Firm
Yea
rs

41
Figure 3Y
ear
+4Y
ear
+2Y
ear
+3Yearly Cash ETRs after realizing an observation in an extreme tax group in year 0
Yea
r 0
Yea
r +1
100
0 0 0 0 0 00
20
40
60
80
100
1 2 3 4 5 6 7
Tax Group
Perc
ent o
f Sam
ple
0
20
40
60
80
100
1 2 3 4 5 6 7
Tax Group
Perc
ent o
f Sam
ple
0
20
40
60
80
100
1 2 3 4 5 6 7
Tax Group
Perc
ent o
f Sam
ple
0
20
40
60
80
100
1 2 3 4 5 6 7
Tax Group
Perc
ent o
f Sam
ple
0 0 0 0 0 0
100
0
20
40
60
80
100
1 2 3 4 5 6 7
Tax Group
Perc
ent o
f Sam
ple
0
20
40
60
80
100
1 2 3 4 5 6 7
Tax GroupPe
rcen
t of S
ampl
e
0
20
40
60
80
100
1 2 3 4 5 6 7
Tax Group
Perc
ent o
f Sam
ple
0
20
40
60
80
100
1 2 3 4 5 6 7
Tax Group
Perc
ent o
f Sam
ple
0
20
40
60
80
100
1 2 3 4 5 6 7
Tax Group
Perc
ent o
f Sam
ple
0
20
40
60
80
100
1 2 3 4 5 6 7
Tax Group
Perc
ent o
f Sam
ple
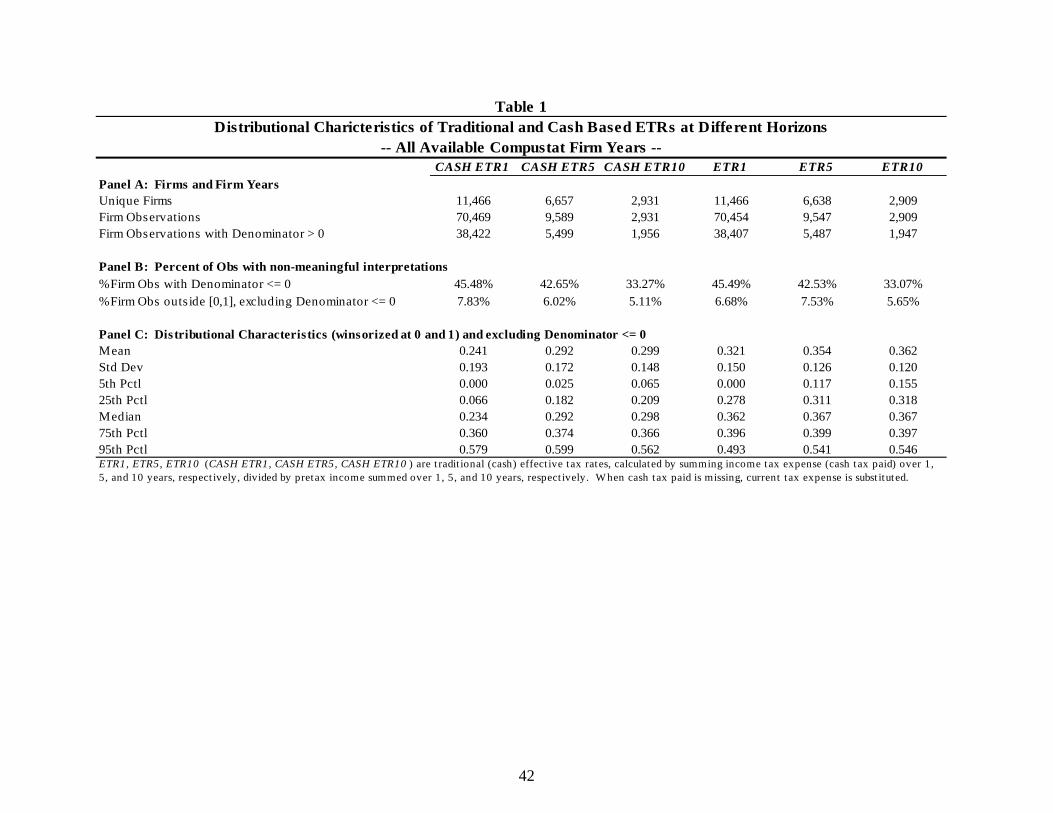
42
CASH ETR1 CASH ETR5 CASH ETR10 ETR1 ETR5 ETR10Panel A: Firms and Firm YearsUnique Firms 11,466 6,657 2,931 11,466 6,638 2,909Firm Observations 70,469 9,589 2,931 70,454 9,547 2,909Firm Observations with Denominator > 0 38,422 5,499 1,956 38,407 5,487 1,947
Panel B: Percent of Obs with non-meaningful interpretations%Firm Obs with Denominator <= 0 45.48% 42.65% 33.27% 45.49% 42.53% 33.07%%Firm Obs outs ide [0,1], excluding Denominator <= 0 7.83% 6.02% 5.11% 6.68% 7.53% 5.65%
Panel C: Distributional Characteristics (winsorized at 0 and 1) and excluding Denominator <= 0Mean 0.241 0.292 0.299 0.321 0.354 0.362Std Dev 0.193 0.172 0.148 0.150 0.126 0.1205th Pctl 0.000 0.025 0.065 0.000 0.117 0.15525th Pctl 0.066 0.182 0.209 0.278 0.311 0.318Median 0.234 0.292 0.298 0.362 0.367 0.36775th Pctl 0.360 0.374 0.366 0.396 0.399 0.39795th Pctl 0.579 0.599 0.562 0.493 0.541 0.546ETR1, ETR5, ETR10 (CASH ETR1, CASH ETR5, CASH ETR10 ) are t radit ional (cash) effect ive tax rates, calculated by summing income tax expense (cash tax paid) over 1, 5, and 10 years, respect ively, divided by pretax income summed over 1, 5, and 10 years, respect ively. W hen cash tax paid is missing, current tax expense is subst ituted.
Distributional Charicteristics of Traditional and Cash Based ETRs at Different HorizonsTable 1
-- All Available Compustat Firm Years --
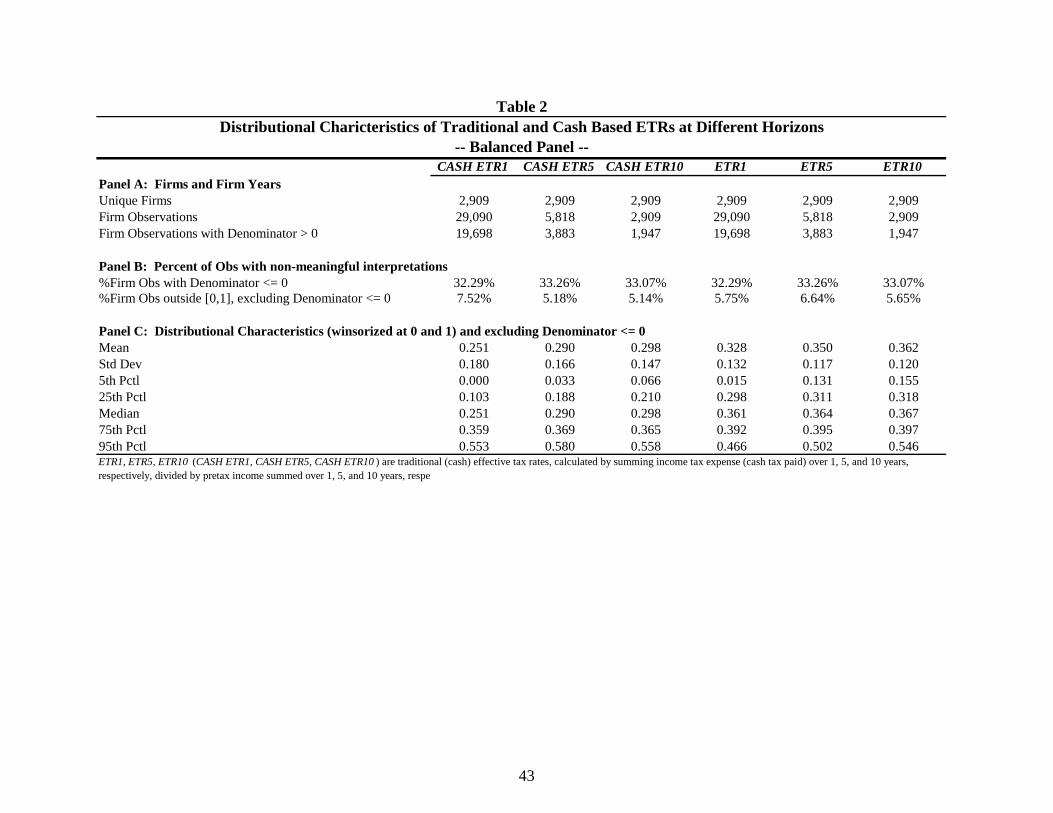
43
CASH ETR1 CASH ETR5 CASH ETR10 ETR1 ETR5 ETR10Panel A: Firms and Firm YearsUnique Firms 2,909 2,909 2,909 2,909 2,909 2,909Firm Observations 29,090 5,818 2,909 29,090 5,818 2,909Firm Observations with Denominator > 0 19,698 3,883 1,947 19,698 3,883 1,947
Panel B: Percent of Obs with non-meaningful interpretations%Firm Obs with Denominator <= 0 32.29% 33.26% 33.07% 32.29% 33.26% 33.07%%Firm Obs outside [0,1], excluding Denominator <= 0 7.52% 5.18% 5.14% 5.75% 6.64% 5.65%
Panel C: Distributional Characteristics (winsorized at 0 and 1) and excluding Denominator <= 0Mean 0.251 0.290 0.298 0.328 0.350 0.362Std Dev 0.180 0.166 0.147 0.132 0.117 0.1205th Pctl 0.000 0.033 0.066 0.015 0.131 0.15525th Pctl 0.103 0.188 0.210 0.298 0.311 0.318Median 0.251 0.290 0.298 0.361 0.364 0.36775th Pctl 0.359 0.369 0.365 0.392 0.395 0.39795th Pctl 0.553 0.580 0.558 0.466 0.502 0.546ETR1, ETR5, ETR10 (CASH ETR1, CASH ETR5, CASH ETR10 ) are traditional (cash) effective tax rates, calculated by summing income tax expense (cash tax paid) over 1, 5, and 10 years, respectively, divided by pretax income summed over 1, 5, and 10 years, respe
-- Balanced Panel --
Table 2Distributional Charicteristics of Traditional and Cash Based ETRs at Different Horizons

44
Rank SIC Industry CASH ETR10 % Sample %LowTax1 40 RAILROAD TRANSPORTATION 0.150 0.668 2.320
(13)
2 13 OIL AND GAS EXTRACTION 0.173 3.544 12.113(69)
3 65 REAL ESTATE 0.214 0.976 2.577(19)
4 42 TRUCKING AND WAREHOUSING 0.223 1.181 2.320(23)
5 79 AMUSEMENT & RECREATION SERVICES 0.224 1.027 2.062(20)
6 63 INSURANCE CARRIERS 0.242 5.187 8.505(101)
7 55 AUTOMOTIVE DEALERS & SERVICE STATIONS 0.246 0.514 0.773(10)
8 29 PETROLEUM AND COAL PRODUCTS 0.246 0.770 1.289(15)
9 61 NONDEPOSITORY INSTITUTIONS 0.274 1.695 2.320(33)
10 44 WATER TRANSPORTATION 0.281 0.565 1.546(11)
SUM of 10 Lowest Ten Year Mean Cash ETR Industries 16.127 35.825
Mean Industry CASH ETR10Table 3
CASH ETR10 is defined in Table 1. Industries are two digit sic code subheadings. The 10 lowest ten year mean CASH ETR10 industries are presented. If an industry has fewer than 10 valid observations for CASH ETR10, the firms in that industry are placed
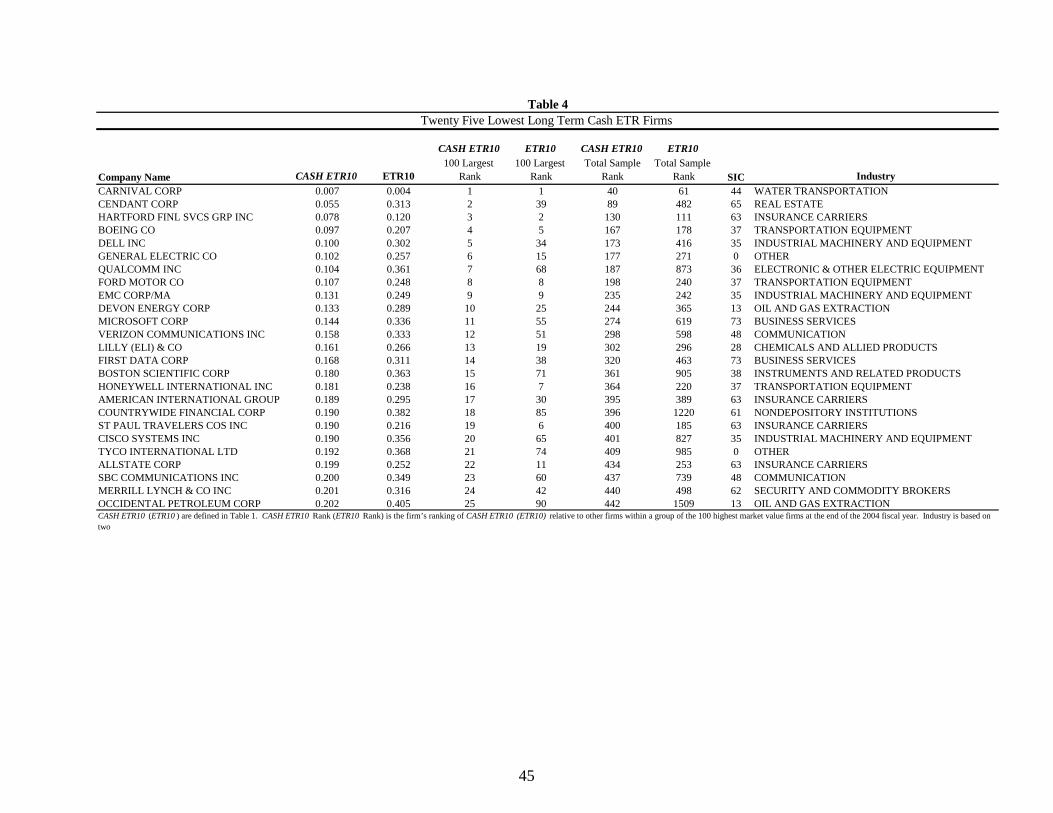
45
CASH ETR10 ETR10 CASH ETR10 ETR10
Company Name CASH ETR10 ETR10100 Largest
Rank100 Largest
RankTotal Sample
RankTotal Sample
Rank SIC IndustryCARNIVAL CORP 0.007 0.004 1 1 40 61 44 WATER TRANSPORTATIONCENDANT CORP 0.055 0.313 2 39 89 482 65 REAL ESTATEHARTFORD FINL SVCS GRP INC 0.078 0.120 3 2 130 111 63 INSURANCE CARRIERSBOEING CO 0.097 0.207 4 5 167 178 37 TRANSPORTATION EQUIPMENTDELL INC 0.100 0.302 5 34 173 416 35 INDUSTRIAL MACHINERY AND EQUIPMENTGENERAL ELECTRIC CO 0.102 0.257 6 15 177 271 0 OTHERQUALCOMM INC 0.104 0.361 7 68 187 873 36 ELECTRONIC & OTHER ELECTRIC EQUIPMENTFORD MOTOR CO 0.107 0.248 8 8 198 240 37 TRANSPORTATION EQUIPMENTEMC CORP/MA 0.131 0.249 9 9 235 242 35 INDUSTRIAL MACHINERY AND EQUIPMENTDEVON ENERGY CORP 0.133 0.289 10 25 244 365 13 OIL AND GAS EXTRACTIONMICROSOFT CORP 0.144 0.336 11 55 274 619 73 BUSINESS SERVICESVERIZON COMMUNICATIONS INC 0.158 0.333 12 51 298 598 48 COMMUNICATIONLILLY (ELI) & CO 0.161 0.266 13 19 302 296 28 CHEMICALS AND ALLIED PRODUCTSFIRST DATA CORP 0.168 0.311 14 38 320 463 73 BUSINESS SERVICESBOSTON SCIENTIFIC CORP 0.180 0.363 15 71 361 905 38 INSTRUMENTS AND RELATED PRODUCTSHONEYWELL INTERNATIONAL INC 0.181 0.238 16 7 364 220 37 TRANSPORTATION EQUIPMENTAMERICAN INTERNATIONAL GROUP 0.189 0.295 17 30 395 389 63 INSURANCE CARRIERSCOUNTRYWIDE FINANCIAL CORP 0.190 0.382 18 85 396 1220 61 NONDEPOSITORY INSTITUTIONSST PAUL TRAVELERS COS INC 0.190 0.216 19 6 400 185 63 INSURANCE CARRIERSCISCO SYSTEMS INC 0.190 0.356 20 65 401 827 35 INDUSTRIAL MACHINERY AND EQUIPMENTTYCO INTERNATIONAL LTD 0.192 0.368 21 74 409 985 0 OTHERALLSTATE CORP 0.199 0.252 22 11 434 253 63 INSURANCE CARRIERSSBC COMMUNICATIONS INC 0.200 0.349 23 60 437 739 48 COMMUNICATIONMERRILL LYNCH & CO INC 0.201 0.316 24 42 440 498 62 SECURITY AND COMMODITY BROKERSOCCIDENTAL PETROLEUM CORP 0.202 0.405 25 90 442 1509 13 OIL AND GAS EXTRACTION
Twenty Five Lowest Long Term Cash ETR Firms Table 4
CASH ETR10 (ETR10 ) are defined in Table 1. CASH ETR10 Rank (ETR10 Rank) is the firm’s ranking of CASH ETR10 (ETR10) relative to other firms within a group of the 100 highest market value firms at the end of the 2004 fiscal year. Industry is based on two
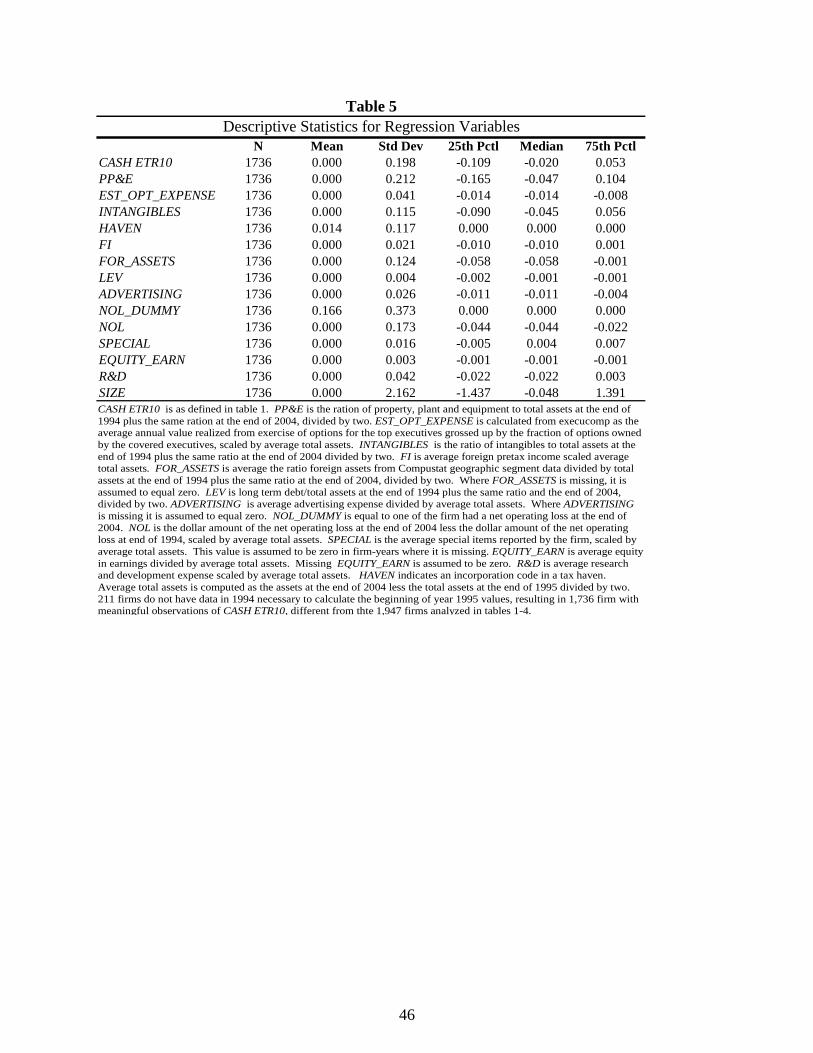
46
N Mean Std Dev 25th Pctl Median 75th PctlCASH ETR10 1736 0.000 0.198 -0.109 -0.020 0.053PP&E 1736 0.000 0.212 -0.165 -0.047 0.104EST_OPT_EXPENSE 1736 0.000 0.041 -0.014 -0.014 -0.008INTANGIBLES 1736 0.000 0.115 -0.090 -0.045 0.056HAVEN 1736 0.014 0.117 0.000 0.000 0.000FI 1736 0.000 0.021 -0.010 -0.010 0.001FOR_ASSETS 1736 0.000 0.124 -0.058 -0.058 -0.001LEV 1736 0.000 0.004 -0.002 -0.001 -0.001ADVERTISING 1736 0.000 0.026 -0.011 -0.011 -0.004NOL_DUMMY 1736 0.166 0.373 0.000 0.000 0.000NOL 1736 0.000 0.173 -0.044 -0.044 -0.022SPECIAL 1736 0.000 0.016 -0.005 0.004 0.007EQUITY_EARN 1736 0.000 0.003 -0.001 -0.001 -0.001R&D 1736 0.000 0.042 -0.022 -0.022 0.003SIZE 1736 0.000 2.162 -1.437 -0.048 1.391
Descriptive Statistics for Regression VariablesTable 5
CASH ETR10 is as defined in table 1. PP&E is the ration of property, plant and equipment to total assets at the end of 1994 plus the same ration at the end of 2004, divided by two. EST_OPT_EXPENSE is calculated from execucomp as the average annual value realized from exercise of options for the top executives grossed up by the fraction of options owned by the covered executives, scaled by average total assets. INTANGIBLES is the ratio of intangibles to total assets at the end of 1994 plus the same ratio at the end of 2004 divided by two. FI is average foreign pretax income scaled average total assets. FOR_ASSETS is average the ratio foreign assets from Compustat geographic segment data divided by total assets at the end of 1994 plus the same ratio at the end of 2004, divided by two. Where FOR_ASSETS is missing, it is assumed to equal zero. LEV is long term debt/total assets at the end of 1994 plus the same ratio and the end of 2004, divided by two. ADVERTISING is average advertising expense divided by average total assets. Where ADVERTISING is missing it is assumed to equal zero. NOL_DUMMY is equal to one of the firm had a net operating loss at the end of 2004. NOL is the dollar amount of the net operating loss at the end of 2004 less the dollar amount of the net operating loss at end of 1994, scaled by average total assets. SPECIAL is the average special items reported by the firm, scaled by average total assets. This value is assumed to be zero in firm-years where it is missing. EQUITY_EARN is average equity in earnings divided by average total assets. Missing EQUITY_EARN is assumed to be zero. R&D is average research and development expense scaled by average total assets. HAVEN indicates an incorporation code in a tax haven. Average total assets is computed as the assets at the end of 2004 less the total assets at the end of 1995 divided by two. 211 firms do not have data in 1994 necessary to calculate the beginning of year 1995 values, resulting in 1,736 firm with meaningful observations of CASH ETR10, different from thte 1,947 firms analyzed in tables 1-4.

47
PredictionINTERCEPT ( 0 ) 0.004 N/A 0.011 ** N/A 0.012 ** N/A 0.013 ** N/APP&E ( - ) -0.121 *** -0.109 *** -0.121 *** -0.112 *** -0.120 *** -0.112 *** -0.121 *** -0.114 ***EST_OPT_EXPENSE ( - ) -0.698 *** -0.813 *** -0.680 *** -0.795 *** -0.663 *** -0.790 *** -0.671 *** -0.795 ***INTANGIBLES ( - ) -0.013 -0.107 ** -0.017 -0.109 ** -0.016 -0.109 ** -0.015 -0.107 **HAVEN ( - ) -0.084 ** -0.068 *FI ( - ) -0.272 -0.072 -0.245 -0.055FOR_ASSETS ( - ) 0.087 ** 0.084 ** 0.251 *** 0.256 *** 0.283 *** 0.263 *** 0.279 *** 0.262 ***FOR_ASSETS 2 ( + ) -0.454 ** -0.464 ** -0.491 ** -0.472 ** -0.471 ** -0.461 **LEV ( - ) -3.827 *** -3.582 *** -3.829 *** -3.587 *** -3.832 *** -3.587 *** -3.821 *** -3.581 ***ADVERTISING ( + ) 0.142 -0.083 0.131 -0.100 0.147 -0.094 0.140 -0.094NOL_DUMMY ( - ) -0.025 ** -0.022 * -0.027 ** -0.023 ** -0.026 ** -0.023 * -0.026 ** -0.023 **NOL ( + ) 0.112 *** 0.103 *** 0.111 *** 0.102 *** 0.111 *** 0.102 *** 0.111 *** 0.102 ***SPECIAL ( - ) -3.330 *** -3.181 *** -3.315 *** -3.176 *** -3.332 *** -3.180 *** -3.311 *** -3.167 ***EQUITY_EARN ( - ) -0.439 -1.485 -0.537 -1.580 -0.536 -1.582 -0.526 -1.583R&D ( - ) 0.091 0.209 0.043 0.180 0.068 0.183 0.066 0.179SIZE ( - ) -0.015 *** -0.014 *** -0.016 *** -0.015 *** -0.016 *** -0.015 *** -0.016 *** -0.015 ***SIC 0 OTHER 0.042 ** 0.050 ** 0.050 ** 0.052 **SIC 13 OIL AND GAS EXTRACTION -0.093 *** -0.084 *** -0.083 *** -0.081 ***SIC 26 PAPER AND ALLIED PRODUCTS 0.064 * 0.070 * 0.070 * 0.070 *SIC 27 PRINTING AND PUBLISHING 0.136 *** 0.145 *** 0.145 *** 0.145 ***SIC 31 LEATHER AND LEATHER PRODUCTS 0.078 0.083 * 0.082 * 0.082 *SIC 38 INSTRUMENTS AND RELATED PRODUCTS -0.039 ** -0.035 ** -0.034 * -0.034 *SIC 48 COMMUNICATION 0.113 *** 0.125 *** 0.125 *** 0.127 ***SIC 50 WHOLESALE TRADE - DURABLE GOODS 0.059 ** 0.067 *** 0.067 *** 0.066 ***SIC 56 APPAREL AND ACCESSORY STORES 0.060 * 0.070 ** 0.070 ** 0.070 **SIC 62 SECURITY AND COMMODITY BROKERS 0.117 *** 0.125 *** 0.124 *** 0.124 ***SIC 63 INSURANCE CARRIERS -0.076 *** -0.065 *** -0.065 *** -0.062 ***SIC 65 REAL ESTATE -0.092 ** -0.084 * -0.084 * -0.083 *SIC 67 HOLDING AND OTHER INVESTMENT OFFICES -0.152 *** -0.143 *** -0.143 *** -0.143 ***SIC 73 BUSINESS SERVICES 0.048 *** 0.054 *** 0.054 *** 0.054 ***INDUSTRY FIXED EFFECTS NO YES NO YES NO YES NO YESN 1,736 1,736 1,736 1,736 1,736 1,736 1,736 1,736 Rsquare 15.9% 22.2% 16.1% 22.4% 16.1% 22.4% 16.4% 22.6%
Model 2Model 1
***,**, and * represent statistical significance at the 1%, 5%, and 10% level, respectively. All variables are defined as in Table 5. CASH ETR10 is the dependent variable. All variables are de-meaned so as enhance interpretation. Fixed effects are two
Regression AnalysisTable 6
Model 7 Model 8Model 6Model 3 Model 4 Model 5