Embed Size (px)
Citation preview
1
Long-Lived Television Programs as Capital Assets
By Rachel Soloveichik
Abstract
In 2007, I estimate that studios and networks released long-lived television
programs worth $26.7 billion. Those long-lived television programs were first shown on
TV in 2007 and will be broadcast for decades to come. Because of their long working
life, the international guidelines for national accounts recommends that countries classify
production of television and other entertainment, literary and artistic originals as an
investment activity and then depreciate those television originals over time. However,
BEA did not capitalize this category of intangible assets until the July 2013 benchmark
revision. In order to change the national accounts, I collected data on television
production from 1949 to 2010. I then calculated how GDP statistics change when
television programs are classified as capital assets.
To preview, my empirical results are:
1) Long-lived US television programs accounted for approximately one third of total
television viewership in 2007. The viewership share for long-lived television programs
has been steady since 1949.
2) Nominal investment in long-lived television has been growing at 5.6% per year from
1990 to 2010, 0.9% faster than overall GDP. Accordingly, average nominal GDP growth
rises slightly when long-lived television is counted as a capital asset
3) Thanks to computer technology, real prices for television investment have been almost
flat over the past two decades.
The views expressed here are those of the author and do not represent the Bureau of Economic Analysis or Department of Commerce. Email: [email protected]
2
Introduction
Television was first invented in the 1920s (Sterling and Kittross 1978). However,
the Great Depression and World War 2 delayed widespread adoption. In 1946, only
0.02% of household had television. Television spread rapidly in the post-war era. 65%
of households owned a television by 1955 and 93% owned a television by 1965.
Despite the widespread ownership, television programs did not earn much money
at first. In 1960, there was no cable television and broadcast television earned only $1.1
billion, 0.2% of nominal GDP. In 1972, the FCC allowed cable companies to serve
major cities. Since that decision, cable television has grown rapidly. By 2007, cable
networks earned $39 billion, more than broadcast networks. In total, television networks
earned $71.3 billion, 0.51% of nominal GDP.
In 2007, I estimate television studios, broadcast networks, cable networks and
independent producers created long-lived television programs worth $26.7 billion. This
value includes domestic television licensing, foreign television licensing, DVD sales and
merchandise licensing. In the national income and product accounts (NIPAs), this $26.7
billion of television production could either be treated as a current expense or it could be
treated as an investment. If long-lived television programs have a useful life of less than
one year, then the production costs for television programs should be treated as a current
expense. In that case, the final revenue from the sale of television programs is all that
matters for gross domestic product (GDP), and production costs for television programs
are an expense in the same way that broadcasting is an expense. Up until July 2013,
BEA used this method to account for television production.
3
In contrast, items with a useful lifespan of more than one year are generally
classified as capital assets. If television programs have a long useful life, then the
production costs for television programs should be treated as a capital investment. In that
case, the capital investment in television programs is added to GDP as part of private
investment and added to the pre-existing capital stock of long-lived television programs
to get the total capital stock of television programs. This capital stock of television
programs then returns a flow of value to its owner, and that flow is counted in GDP as
part of capital services. GDP counts both the flow of value and the initial investment.
As a result, GDP is always higher when a good is changed method 1) to method 2).
Finally, the total capital stock of television programs is depreciated, which is known as
consumption of fixed capital. In addition to the well-known GDP, BEA also estimates
net domestic production. Net domestic production equals GDP minus consumption of
fixed capital. Because net domestic production does not include the cost of maintaining
the capital stock, it is generally viewed as a better long-term measure of the total
sustainable output of an economy.
My research on capitalizing television programs is part of a broader initiative by
the BEA to improve the treatment of intangible assets in the national income and product
accounts. Other researchers at the BEA have developed a satellite account measuring the
annual investment and capital value of R & D (Robbins and Moylan 2007), educational
investments (Fraumeni, Reinsdorf, Robinson and Williams 2008) and the role of
intangible assets in foreign direct investment (Bridgman 2008). And I have also
estimated annual investment and capital value of other entertainment capital such as
books, theatrical movies and original music.
4
This paper will consist of four sections. In section 1, I describe my data on
nominal revenue and nominal investment for television. I calculate television investment
back to 1949, when the industry started earning advertising revenue. In section 2, I
describe my price indexes and calculate the real value of long-lived television production
back to 1949. In section 3, I estimate the depreciation schedule for television programs.
I then use that depreciation schedule to calculate capital stock of television programs
from 1949 to 2009. In section 4, I explore capitalizing television formats like soap
operas where the individual episodes are short-lived but the show itself is long-lived. At
the present time, BEA does not plan to count television format as entertainment originals
in the national income and product accounts. Nevertheless, I include preliminary results
for academic discussion.
1. Nominal Production
Total Revenue Earned by the Television Industry
The 2007 Economic Census is the primary dataset used in this paper. In 2007,
cable networks earned $21.6 billion in advertising and $15.5 billion in licensing.
Broadcast networks earned $17.3 billion from national airtime, $12.3 billion from local
airtime and $1.9 billion from network compensation (syndicated advertising). Public
television stations spent $1.8 billion on programming. Finally, I estimate that studios and
networks earned $2.1 billion from DVDs of television programs, $1.9 billion from
merchandise licensing and $7.3 billion of foreign television licensing for long-lived
television.
5
I use a variety of datasets to measure television revenue from 1949 to 2010. The
Service Annual Survey (SAS) provides cable revenue from 1998 to 2010, national
broadcast and local broadcast advertising revenue from 1998 to 2010, public broadcast
spending from 2005 to 2010 and DVD sales from 2005 to 2010. The Annual Survey of
Communication Services (ASCS) provides cable revenue from 1989 to 1997 and
broadcast advertising from 1990 to 1997. The Corporation for Public Broadcasting (CPB)
provides data on spending for public television from its start in 1969 until 2004. For
syndicated advertising, I use data from Kantar that gives the ratio of syndicated
advertising to national advertising back to 1995. Before 1995, I assume that syndicated
advertising tracks national advertising. For television DVDs, I estimated the market
share for television programs (vs. theatrical movies) and then multiplied that market
share by consumer spending data from BEA’s Table 2.4.5U. Finally, I use licensing data
from the EPM licensing sourcebook to estimate merchandising revenue. I was not able to
find any data on foreign licensing over time. However, data from “World Television”
(Straubhaar 2007) suggest that the ratio of foreign licensing to domestic licensing has
been relatively steady since the 1960’s.
The Economic Census and other government datasets only track advertising
revenue from outside companies. Television networks also devote a substantial amount
of airtime to promoting their own programs. In this paper, I will count that foregone
advertising revenue in network revenue as if networks had sold the airtime to outside
companies. Later in the paper, I will count unpaid airtime value together with paid
advertising expenditures. So, including the value of unpaid airtime has little impact on
long-lived television revenue minus sales costs. However, it does impact my
6
depreciation rate because existing shows are often used to promote new shows. In order
to do this, BEA purchased a special dataset from Kantar Media that tracks both paid
airtime and unpaid airtime from 1995 to 2010. Based on that dataset, I calculate the ratio
of unpaid airtime to paid airtime by channel type and year. I then multiply that ratio by
the advertising revenue totals calculated earlier to get the implicit value of unpaid airtime
by channel type and year.
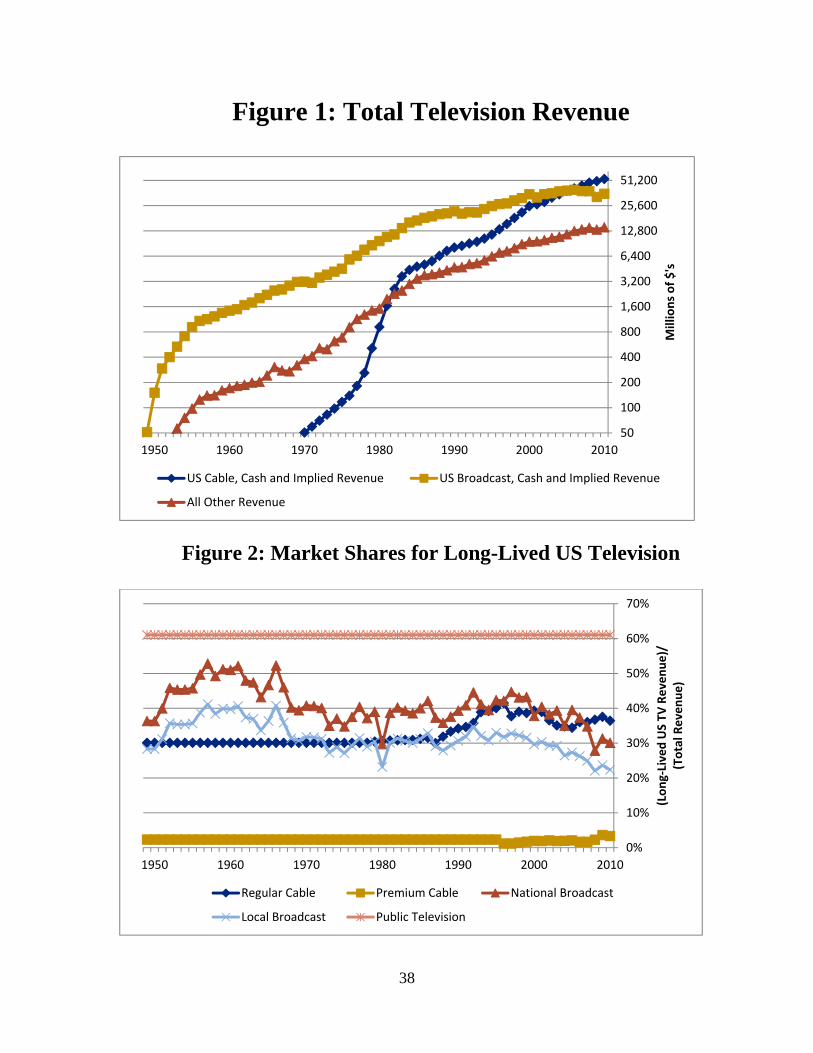
Figure 1 shows total revenue from US television by category from 1949 to 2010.
Table 2 shows the same data with more detailed categories. The most important result
from Figure 1 and Table 2 is that cable television has been growing faster than broadcast.
Until the 1970’s cable networks were virtually non-existent. They then grew rapidly over
the next 35 years. By 2010, cable networks earned 50% more than broadcast networks
Revenue from Long-Lived US Television
Because this project is focused on the United States national accounts, I will
restrict my sample to US television programs. Even if a television program is filmed
abroad, it is still included in my analysis if a US corporation or resident originally owned
the copyright. A small number of television shows are co-produced by a US studio and
non-US studio. In that case, I count the show as 50% US.1 My data on production
studios and country of ownership are taken from the website IMDB.com. That dataset is
described in more detail in the paper “Theatrical Movies as a Capital Asset” (Soloveichik
2013a).
In this paper, I will study only long-lived television programs. These television
programs are called ‘stock’ programs by the OECD (Handbook on Deriving Capital 1I do not know how studios account for joint production in the Economic Census.
7
Measure of Intellectual Property Production 2010). The OECD defines ‘stock’ programs
as genres with a useful lifespan of more than one year. The OECD also defines ‘flow’
programs as short-lived genres. These ‘flow’ programs are explicitly rejected from the
category ‘artistic originals’. I also exclude theatrical movies shown on television because
that television revenue has already been counted in the theatrical movie asset category
(Soloveichik 2013a). On the other hand, I include television movies and direct-to-DVD
movies in the long-lived television asset category. These movies are often very similar to
pre-existing television programs and they are frequently shown on channels that rarely
show theatrical movies (e.g. Cartoon Network, Disney).
Kantar Media provided the main dataset to measure market shares for long-lived
US television. BEA purchased a special dataset that gives advertising revenue by
program name, program genre, channel type, paid vs. unpaid airtime and quarter from
1995 to 2010. For example, the dataset might report that “Friends” earned $1 million of
paid airtime and $0.3 million of unpaid airtime in 1995 Q1. I determined that the
following genres are long-lived: animation, children’s educational, documentaries,
documentary/salute/tribute, drama/adventure, feature film, instruction/advice, mini
show,2 science fiction, situation comedy, unclassified, unknown and western. I then
matched a sample of program names to IMDB’s dataset to identify theatrical movies and
2 Mini-show, mini-series, unclassified and unknown contain a very diverse collection of shows. I looked up each title in my sample to determine what percentage of shows were actually long-lived. For the rest of the genres, I assume 100% are long-lived. Kantar’s actual dataset uses abbreviations for some genres. The long-lived genres were identified using schedule information from Tribune Media Service (TMS). First, I identified the IMDB series title for all programs in the TMS data and then calculated what percentage of episodes were more than one year old. Next, I matched those same IMDB series titles to the Kantar program names. I then calculated what percentage of revenue for each genre is likely to come from episodes more than one year old. Finally, I classified a genre as “long-lived” if a substantial portion of revenue comes from episodes more than one year old. The two genres which were near the dividing line are ‘news documentaries’, which I chose to put in the long-lived category and ‘slice-of-life’ (reality shows), which I chose to put in the short-lived category.
8
foreign television. My sample covers 96% of advertising revenue tracked in Kantar3 and
Kantar Media tracks almost all advertising shown on television. Accordingly, the
quarterly variation seen in my numbers are primarily caused by changes in the market
share for long-lived US television – not just sampling error.
Kantar Media only tracks advertising revenue, so it is not representative of total
cable network revenue. Furthermore, Kantar does not include channels with little
advertising revenue like Disney or Fox Sports Net. In order to make the Kantar data
more representative, I created my own adjustment factor. First, I used schedule data from
Tribune Media Services (TMS) and viewership information from Nielsen to calculate the
market share for long-lived US television on each cable channel tracked in Nielsen’s
database. I then matched the market shares by channel to SNL Kagan data on advertising
revenue and licensing revenue for each channel from 1984 to 2006. I then compared the
market share for long-lived television based on advertising revenue with the market share
for long-lived television based on total revenue.4 I also use the SNL Kagan data to
calculate long-lived market shares from 1984 to 1994, before the Kantar data is available.
These calculations assume that individual channels have kept their character over time.
Kantar Media does not track premium cable, public broadcast, DVDs of television
programs or foreign licensing. I used the TMS schedules and Nielsen viewership data
described earlier to estimate the market shares for long-lived US television on premium
cable and public broadcast. I used DVD sales data from The-numbers.com to estimate
3I could not match all of the program names, so actual coverage is slightly lower. For many unmatched names, I used alternative datasets to measure some information about the program. 4In the actual spreadsheet, I create 14 adjustment factors for live fiction by seven different distributors and other long-lived by seven different distributors. Kantar does not cover every cable channel, and the coverage was worse early in the sample. I adjust for the missing channels too. After 2006, I do not have Kagan data on channel revenue. I assume the adjustment factor is fixed from 2006 to 2010.
9
the market share for long-lived US television on DVDs. The data from The-
numbers.com only goes back to 2006. Before then, I use my best judgment to estimate
the market share for television programs on DVD. Finally, I assume that 100% of all
foreign licensing revenue earned by television studios is for long-lived television
programs.5 The foreign licensing for theatrical movie has already been counted in the
paper “Theatrical Movies as a Capital Asset” (Soloveichik 2013a).
Before 1995, I use viewership data from Nielsen’s ‘Pocketpiece’ survey to
calculate market shares for long-lived television on broadcast networks. That survey
reported the number of programs and their average rating for the last two weeks by genre.
Because of budget limitations, BEA was not able to purchase all the ‘Pocketpiece’
reports. But we did get the complete set for 1995 and a sample from 1950 to 1994. In
order to get a consistent time series, I benchmarked the 1995 Nielsen Pocketpiece data to
the Kantar market share data from 1995.
Figure 2 shows the market share for long-lived television by category from 1949
to 2010. The most important result is premium cable networks show far less long-lived
television than regular cable networks. The SAS combines both premium cable networks
and regular cable networks into single industry, NAICS 5152. Accordingly, I cannot
calculate the average market share for long-lived television on cable networks without
knowing the relative weights for premium cable and regular cable. I assume that all
regular cable channels earn all advertising revenue for NAICS 5152. For licensing, I use
consumer spending to estimate weights. Cable distributors (NAICS 5175) earn
approximately 80% of their revenue from basic cable packages. If licensing payments
5Major international sporting events like the Olympics or the World Cup can bring in significant foreign licensing if they are held in the US. However, they account for a relatively small portion of total licensing. Furthermore, that licensing revenue might be reported in the sports industry rather than television.
10
are proportional to consumer spending, then premium cable networks account for 20% of
licensing revenue and 6% of total cable network revenue.6 Using that split, long-lived
US television accounts for 34% of cable network revenue.
Since 2000, reality shows and other short-lived programs have become a bigger
revenue source for broadcast networks. Therefore, it might seem that broadcast networks
are investing a lower percentage of their revenue on long-lived television programs.
However, broadcast television shows are now earning more money from cable licensing
and other non-broadcast revenue. The net effect is a relatively steady ratio of investment
to revenue. After 2010, BEA does not have Kantar data providing precise market shares
for long-lived US television. In order to calculate annual investment, BEA will assume
that the ratio of investment to revenue is fixed at the 2010 values.
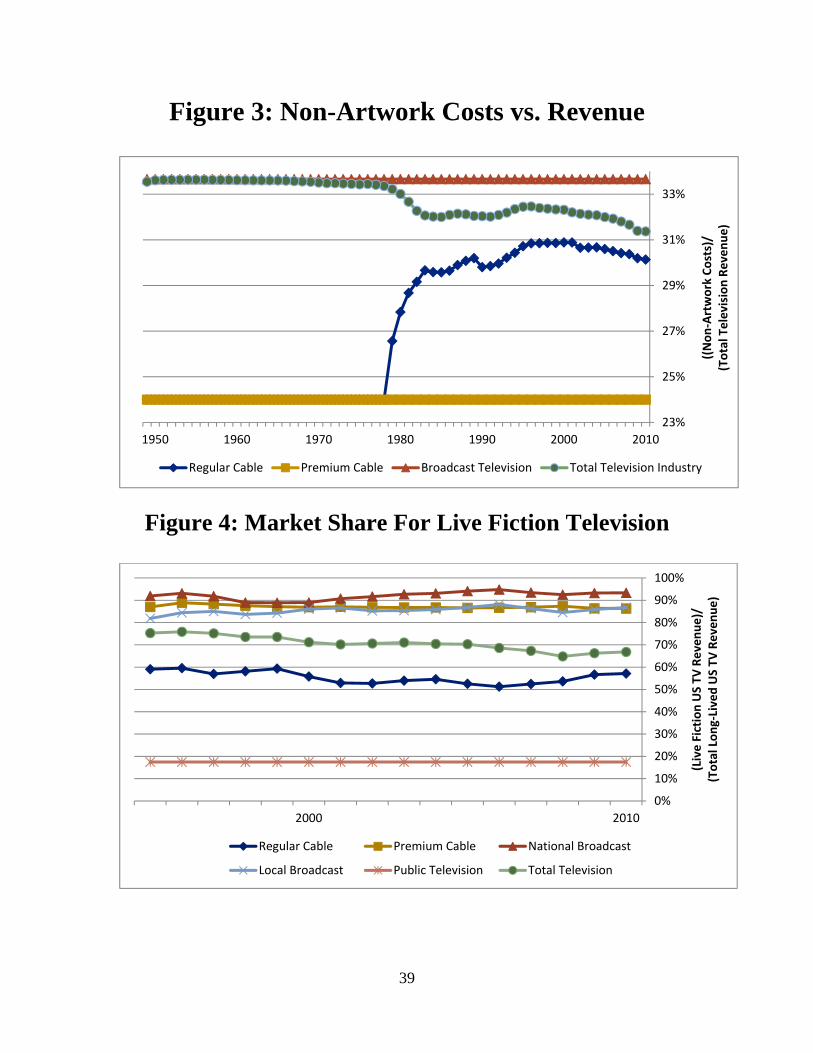
Non-Artwork Costs for Long-Lived Television
Of course, television network revenue from long-lived television programs is not
the same as licensing revenue. Television networks spend money on physical costs like
broadcast towers7 or DVD stamping. Television networks also spend time and money
negotiating with potential advertisers like General Motors and cable distributors like
Comcast. Finally, television networks spend a considerable amount of unpaid airtime
6On the other hand, there is suggestive evidence that premium cable channels earn higher licensing payments. The 2007 Economic Census reports that theatrical movies earned $22 billion in licensing revenue. I calculate that approximately $14 billion of that licensing revenue was for television airing. I also calculate that cable distributors earned approximately $21 billion from theatrical movies. Even assuming that premium networks charge no mark-up over studio licensing fees, that still yields a distributor mark-up of only 50%. In contrast, the aggregate cable distribution industry charges consumers 300% more than they pay cable networks for licensing content. However, these numbers may reflect problems with the classifications in the Economic Census or within-company pricing details. 7 In addition to the physical costs of running broadcast towers, television networks also require broadcast spectrum licenses. These spectrum licenses could be considered an intangible asset and capitalized in the national accounts. However, that is a separate problem from long-lived television considered in this paper.

11
promoting their new shows. Earlier in this section, I counted that unpaid airtime when
measuring total network revenue. In order to be consistent, I subtract that unpaid sales
time as an advertising cost.
My primary dataset for network costs is an SNL Kagan report from 2000. In that
report, they estimated the licensing fees paid and the net ad revenue earned by the top
400 programs for the 1998-1999 season. Based on that data, I calculate that studios paid
83 cents in licensing for every dollar of ad revenue. Licensing rates were similar for
short-lived programs like news and long-lived programs like sit-coms. I assume that
broadcast networks and cable networks spend 17 cents on non-artwork costs for every
dollar in advertising revenue. Public broadcasters do not sell advertising explicitly, but
they do raise money from corporations, governments and the public. I assume that they
also spend 17 cents on non-artwork costs for every dollar they receive in donations. I
have not been able to find any data on cable network costs for negotiating prices with
cable distributors. However, I believe that it is cheaper to negotiate with a few cable
distributors than thousands of individual advertisers. I will assume that cable networks
spend 5 cents on contract negotiations for every dollar they receive in licensing
payments. Finally, I assume that television networks spend 15 cents stamping DVDs for
every dollar in revenue.
My primary dataset on advertising costs is Kantar Media. BEA purchased a
special dataset from Kantar Media that gives the value of unpaid airtime by the program
of airing and program promoted. This dataset is separate from the Kantar data on
advertising revenue described earlier. Between 2008 to 2010, long-lived television
programs received 14 cents in unpaid airtime for every dollar they earned in paid airtime.
12
Kantar Media also reports that television networks spent 4 cents on paid advertising for
every dollar in revenue they earn. Finally, I add in 2 cents of overhead for the 18 cents of
paid advertising described earlier. In order not to mislead with false precision, I round
the advertising budget to 20% of licensing fees for all long-lived television.
It might seem surprising that advertising overhead is only 10% of total television
advertising. For books, music and miscellaneous artwork, marketing overhead is much
larger amount (Soloveichik 2013b, c and d). The difference is driven by the timing of
television production compared to all of those other artworks. For other entertainment
originals, they are first produced and then marketed. In contrast, new television episodes
are being filmed even as the network markets existing episodes. Because of the timing
overlap, market research like Nielsen’s viewership data is used both to sell existing
episodes and to determine which shows should be continued. Therefore, I count market
research as part of television investment rather than part of advertising.
Figure 3 shows the non-artwork costs relative to US television revenue from 1949
to 2010. The most important result from Figure 3 is that broadcast networks have higher
costs than cable networks. Over the past few decades, cable networks have grown faster
than broadcast networks. Accordingly, non-artwork costs fell since 1980. But this effect
is small. Regular cable networks earn more than half of their licensing revenue from
advertising. Therefore, they still must spend time and money serving thousands of
individual companies who want air time. Only premium cable networks are free to
concentrate on cable distributors.
13
Live Fiction Programs vs. Other Long-Lived Television
Later in this paper, I will create two separate price indexes: one for live fiction
programs like sitcoms and one for other long-lived programs like animated cartoons or
documentaries. In order to create a combined price index for long-lived television, I need
to know the market shares for each sub-category of television. Once again, Kantar Media
was my primary dataset for splitting the two sub-categories. All programs classified as
animated, instructional, documentaries, etc. were put in other long-lived. I also classified
programs as other long-lived if they are marked as animated in the IMDB dataset.
Finally, I hand-checked programs in ambiguous genres like childrens or mini-series.
Figure 4 shows the relative share for live fiction programs by category from 1995
to 2010. The most important result is that regular cable and public television have much
less live fiction than another other category. This result is consistent with everyday
experience. Regular cable has entire channels devoted to non-fiction programs like
cooking, nature documentaries and other programs without actors. Public television has
cartoons for children in the morning and educational programming for adults in the
evening. Within each market type, live fiction shares have been relatively steady over
time. Going forward, BEA will assume that the ratio of live fiction to total long-lived
revenue is fixed for each market type until additional information becomes available.
Long-Lived Television Investment by Original Distributors
Four separate industries produce long-lived television: television studios (NAICS
5121), television broadcasters (NAICS 5151), cable networks (NAICS 5152) and
14
independent producers and artists (NAICS 7115).8 I have not been able to find any data
that tracks industry of ownership for individual programs. I will use the industry of the
first distributor as a proxy for industry of ownership. In particular, I assume:
a) Shows that premiere on for-profit broadcast networks are owned 50% by
television studios and 50% by television broadcasters.
b) Shows that premiere on public television are owned 100% by public broadcasters.
c) Shows that premiere on regular cable or premium cable are owned by cable
networks.
d) Shows that premiere as direct-to-DVD are owned 100% by television studios.
e) Shows that premiere on syndicated television are 100% owned by independent
producers and artists.
f) Merchandise licensing, foreign licensing and U.S. owned shows that premiere on
foreign television programs are distributed between industries proportionally to
the rest of investment. Based on NAICS 5121, I calculate that these revenue
sources account for approximately one third of total television revenue.
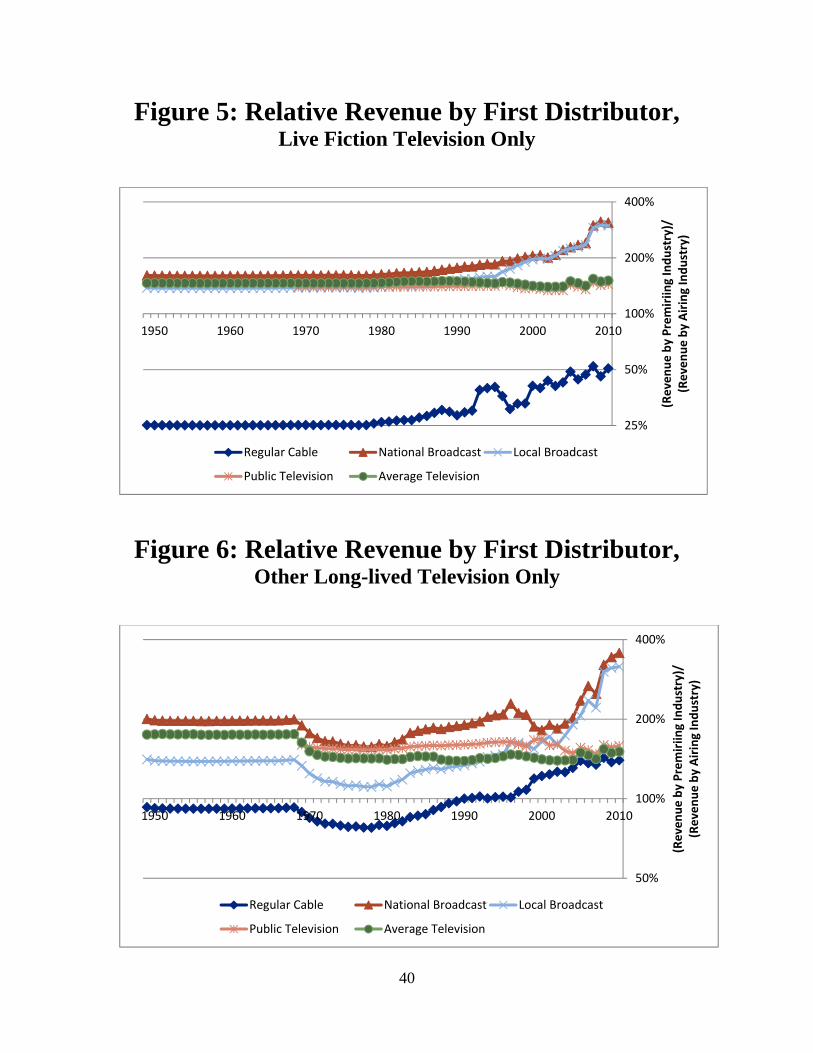
Figures 5 and 6 compare revenue based on original distributor with current
distributor. The most important result from both figures is that total revenue from US
television programs is significantly higher than US television revenue.9 In other words,
US television studios are big exporters. US television studios also earn money from
8 In recent years, Internet broadcasters like Youtube have started producing their own content. A very small percentage of those shows have moved to cable networks or DVD. In addition, other programs like theatrical plays or exercise shows are sometimes sold on DVD. I ignore those minor industries 9 Figure 2 strips out foreign television as well as theatrical movies and short-lived programs. However, for-profit broadcasters and cable networks show very little foreign television, so the graph would not change if imports were included.
15
merchandise licensing and all other operating revenue. Between 2003 and 2010, I use
SAS and the 2007 Economic Census to determine the annual ratio of foreign licensing to
domestic licensing. Before then, I do not have good data on historical export rates or
licensing rates. In the book ‘World Television’ Straubhaar (2007) analyzes broadcast
schedules for a sample of countries back to the 1960’s. He finds that the market share for
US shows abroad has been roughly constant. Based on that data, I assume that foreign
licensing is fixed at the average for 2003-2010.
The second noteworthy result from Figures 5 and 6 is that for-profit broadcast
networks premiere more shows than they air. In other words, cable networks re-run
programs that premiere on for-profit broadcast. The reverse is rarely true: for-profit
broadcast networks almost never show programs that premiere on cable or public
broadcast. As a result, I calculate that investment by for-profit broadcast networks is
larger and investment by cable networks is smaller than one might think based on their
direct revenue alone.
Unlike theatrical movies, I cannot calculate real investment directly. In my paper
on theatrical movies, I used IMDB data on real movie inputs to estimate real movie
investment from 1915 to 2004 (Soloveichik 2013a). I then multiplied by my price index
to calculate nominal investment directly. Unfortunately, the IMDB data on television
inputs is much worse. For live fiction, IMDB does track individual episodes. However,
their coverage is pretty spotty for historical production. For other long-lived television,
IMDB has minimal data on individual episodes.
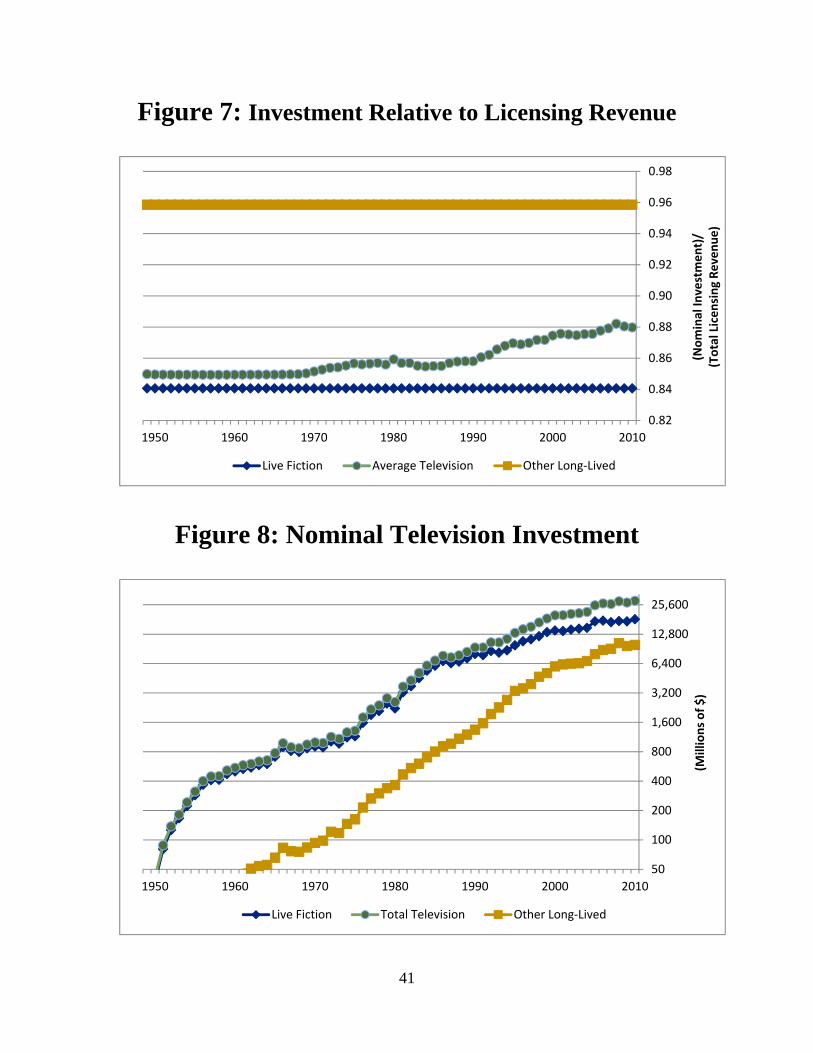
Instead, I will calculate television investment from licensing revenue. I assume
that the ratio of nominal investment to nominal licensing revenue is constant from 1949
16
to 2010. However, I do allow live fiction programs and other long-lived programs to
have different ratios. Real investment in other long-lived programs has been growing
much faster than real investment in live fiction programs. Because of the fast growth,
there are relatively few older programs in the ‘other long-lived’ category. Accordingly,
ratio of new investment to existing licensing revenue is slightly higher for that category.
Figure 7 shows my estimates of investment relative to licensing revenue. 10 I
calculate that average investment relative to revenue has risen over time. This rise is
related to the drop in live fiction television shown in Figure 4. Over the past few
decades, live fiction has dropped from more than 90% of television investment in 1970 to
only 67% in 2010. This decrease in live fiction television is related to the rise of public
television in 1970’s and then cable networks in the 1990’s and 2000’s. Both network
types show less live fiction than for-profit broadcast networks like Fox or ABC.
Figure 8 shows nominal television investment from 1949 to 2010.11 I find that
television investment grew very quickly during the 1950’s and 1980’s. The first growth
spurt was caused by spread of broadcast television after World War 2. The second
growth spurt was caused by the spread of cable television during the 1980’s. During
those two growth spurts, the ratio of nominal television investment to nominal GDP grew
rapidly. After the growth spurts, the ratio of nominal television investment to nominal
10 It is possible that the numbers in Figure 7 underestimate investment early in the period. The television industry was very new in the 1950’s – so it had very few re-runs to show. On the other hand, some early television sitcoms and dramas were performed live and never recorded. The net effect on television investment relative to revenue is uncertain. 11 The numbers if Figure 8 are not precisely the same as the television investment numbers that will be released in the 2013 benchmark revision of the national income and product accounts. The benchmark numbers are based on an earlier estimate of television investment I made in April of 2012. Since then, I have changed a few of the minor assumptions in my calculations. Because of the changes, my investment and capital stock numbers are not precisely equal. However, changing one time series for television investment would have required recalculating many other time series as well. For simplicity, we kept the preliminary numbers in the benchmark calculations.
17
GDP remained steady at the earlier high. Accordingly, re-classifying long-lived
television programs as capital assets boosts GDP growth slightly during the 1950’s and
1980’s.
2. Price Indexes and Real Production
Creating an Input-Based Price Index
It is difficult to develop a price index for long-lived television programs shows.
Each program is a unique artistic creation, so I can never compare the cost of producing
two identical television episodes at different times. In this paper, I use input prices to
calculate production costs for the television industry. The input-based index assumes that
each actor, each non-actor, each filming location and each special effects company
produces the same amount of entertainment capital over time. This price index assumes
zero multifactor productivity growth since 194912 and omitted inputs grow at the same
rate as inputs tracked. However, the television industry has benefited from better video
cameras and faster computers to edit the raw footage. The better video cameras and
faster computers are part of the huge technology progress in the computer and electronic
product industry.
In a previous paper on theatrical movies (Soloveichik 2013a), I used IMDB data
on real movie inputs to calibrate my input-based price index. Unfortunately, IMDB does
not contain useful data on real television inputs. Furthermore, I have not been able to
locate any other data sources that track real television inputs over time. Accordingly, I
12Multi-factor productivity could rise if directors learned better production techniques over time. Alternatively, it could fall if early television shows used up all the good storylines.
18
cannot calibrate my input-based price index precisely. Instead, I will use my best
judgment to develop two separate price indexes.
Price Index for Live Fiction Shows
My first price index tracks live fiction shows. The main input to these shows is a
live performance with professional actors and elaborate studio sets. Television studios
also use video cameras to record the live performance and computers to edit the resulting
footage. These same inputs are used to create theatrical movies. Furthermore, many
workers alternate between television shows and theatrical movies. Therefore, it seems
reasonable to assume that live fiction television prices track theatrical movie prices.13
My paper “Theatrical Movies as a Capital Asset” describes the IMDB data used
to construct a price index for theatrical movie investment. Based on that IMDB data, I
created an input-based price index that uses three pre-existing price indexes: a) Live
performance prices are taken from BEA’s table 2.4.4U (line 211); b) Video camera prices
are taken from BLS’s producer price index (PPI) for photographic and photocopying
equipment (PCU333316333316); c) Computer prices are taken from BLS’s PPI for
computers (PCU334111334111). Since 2000, I give live performances a 70% weight,
video cameras a 15% weight and computers a 15% weight. Before 1990, I assume
computer usage was negligible. Based on that assumption, I give live performances an
85% weight and video cameras a 15% weight. Between 1990 and 2000, I assume that
computers were gradually introduced into television studios.
13 In general, theatrical movies are much more expensive per hour of final footage. However, I only need the ratio of television costs to movie costs to remain steady over time.
19
Price Index for Other Long-Lived Programs
This category includes both animated fiction shows and non-fiction shows like
documentaries. Both of these genres rely less on live performances and more on
computers. The substitution is clearest for animated programs, which use computer
animated characters instead of actors and costume designers. However, documentaries
also substitute computers for live performances. Most documentaries start out with a
video of pre-existing places of scientific, historical or social interest. Because
documentaries show a real place, they do not need elaborate sets like live fiction
television. Furthermore, documentaries generally hire a few narrators rather than a cast
of paid actors. However, documentaries need a large amount of videotape and then
careful splicing to create a coherent narrative. For example, an animal documentary
might film a monkey colony for weeks and then pick out half an hour of footage. This
type of show would have been prohibitively expensive in 1970, when video cameras were
delicate and computer editing was impossible.
For my other long-lived price index, I use the same input series described earlier
for theatrical movies. But live performance prices only have a 60% weight and
computers have a 15% weight. Just like before, video cameras have a 15% weight.
Furthermore, I assume that computers were first introduced in 1985 and reached their
current level by 1995. At first glance it seems a little surprising that live performances are
counted as heavily as they are. But animated shows still need writers to create the script
and graphic designers to translate ideas into film. Documentaries still need narrators to
transform raw footage into a coherent storyline. All of these jobs require highly skilled
creative workers. Those same workers have wages that track live performance prices
20
Price Indexes and Real Production
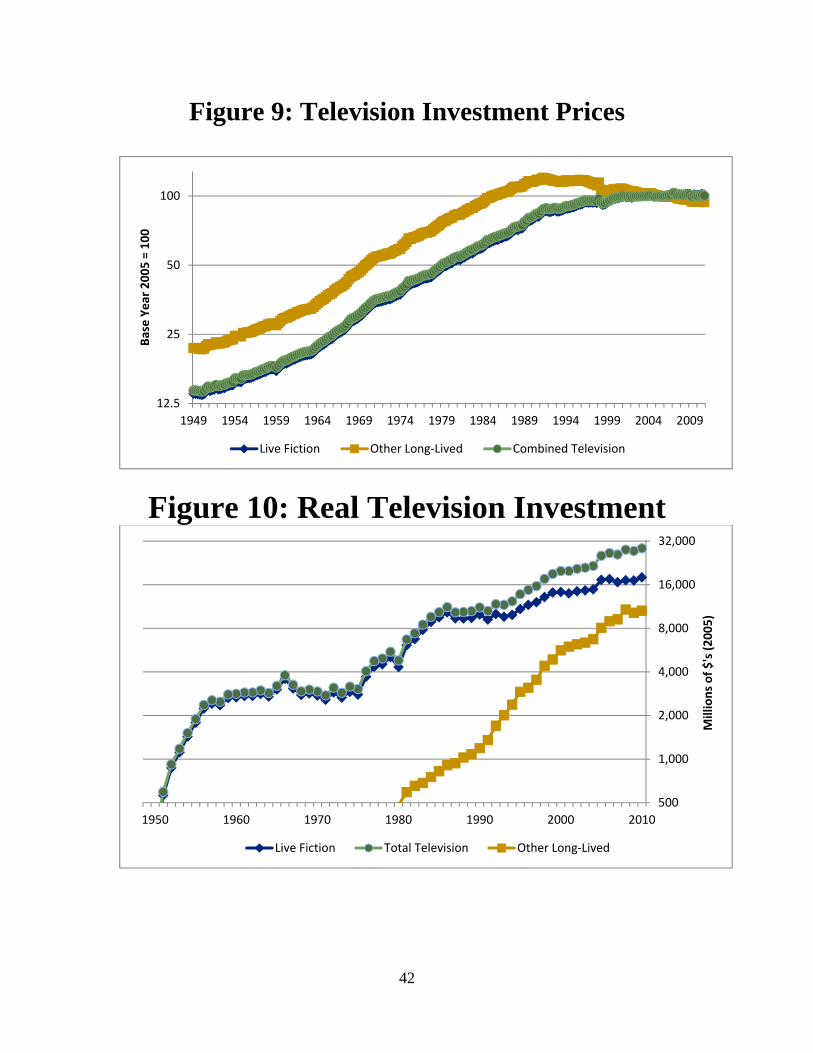
Figure 9 shows price indexes from 1949 to 2010. The most important result is
that prices for other long-lived television dropped even as prices for live fiction television
rose. This drop in relative prices may explain why studios have chosen to create so many
animated shows and non-fiction shows in recent years. Although not studied in this
paper, reality shows have also benefited from cheaper computer editing in recent years.
This relative price drop may explain why broadcast networks have switched from long-
lived live fiction series to short-lived reality shows.
Figure 10 shows real production from 1949 to 2010. The general trends are very
similar to the nominal investment numbers shown in Figure 8. Figure 10 may
underestimate real production during recessions and overestimate real production in
booms. The price indexes in Figure 9 are very smooth. I also assume that investment is a
fixed percentage of revenue. At the same time, nominal advertising revenue is very
sensitive to the overall economy. Accordingly, I calculate that real production drops
during recession. It is possible that real investment is smooth – but television production
prices drop during recessions. After all, actors and other production workers have limited
outside options. They may be willing to accept lower wages during recessions.
However, this argument is very speculative because I do not have direct data on
television production inputs or budgets. In the national accounts, I will use the smooth
investment prices given in Figure 9.
21
Alternative Price Indexes for Television
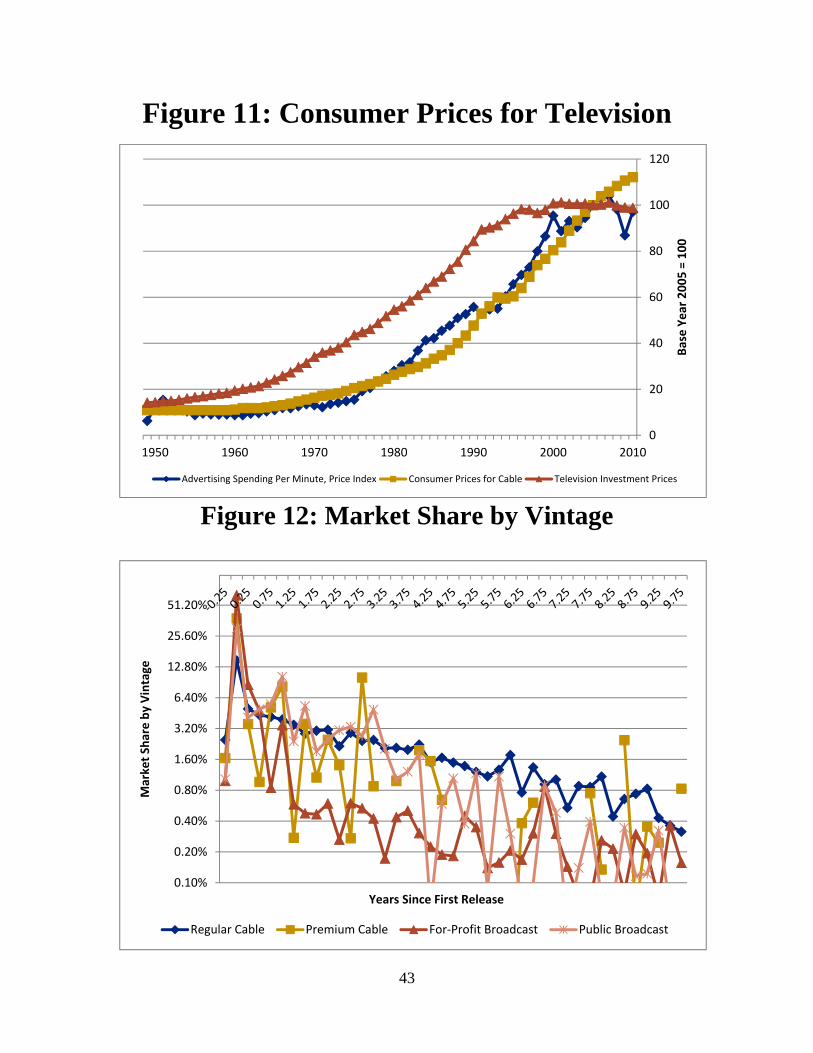
Consumption-based prices for television might offer another potential price index.
BEA produces a consumption-based price index for cable television (line 219 of Table
2.4.4U). In addition to out-of-pocket spending on cable, consumers also pay an implicit
price for ad-supported television. In 2010, consumers watched 23 cents of ads for every
hour of ‘free’ television.14 In comparison, consumers only watched 3 cents worth of ads
per hour in 1950.
Figure 11 compares my investment price index with consumption-based prices for
cable and implicit consumption-based prices for advertising supported television. I find
that both price measures track each other reasonably well in the long-term. But neither
price measure tracks the television investment price. I believe that different trends are
caused by quality improvements in television over time. These quality improvements are
not necessarily captured in BLS’s existing price index for cable or my implicit price
index for advertising supported television.
Even if the consumption-based price indexes were adjusted for quality, they still
might not be useful investment price indexes. Based on the Kantar data, I calculate that
long-lived television programs account for only one third of advertising revenue. Based
on licensing data from SNL Kagan, I calculate that long-lived television accounts for less
than 25% of consumer spending on cable. The rest of revenue comes from theatrical
movies shown on television and short-lived television programs like sports, news, etc. It
is entirely possible that sports licensing prices have not tracked long-lived television
investment prices. After all, the NFL has a monopoly on football games and can charge
what the market will bear. In contrast, there are usually multiple television studios
competing to offer long-lived television programs.
14 This includes regular cable ads and public television spending (i.e., corporate sponsors are ads). The American Time Use Survey excludes young children, so total viewership is slightly understated.

22
3: Depreciation Schedules and Capital Stock
In this paper, I define the value of a television episode as the expected present
value of future revenues minus future costs.15 I define the depreciation schedule as the
rate at which a television episode declines in value over time. There are many possible
reasons why a television original might decrease in value over time. For example, all
consumers in a target market might have already watched the show and are now sick of
it. In this paper, I will not attempt to distinguish between obsolescence of the special
effect technology, physical depreciation of the recording itself, or any other reason why
consumers stop watching an old show. I will simply attempt to estimate the schedule at
which studios earn revenue from television episodes and the costs associated with those
revenues.
Tribune Media Services Schedule Information
Tribune Media Services (TMS) provided the main dataset to measure
depreciation. For ten randomly selected days, BEA purchased a complete schedule of
shows on regular cable, premium cable, broadcast television and public television. TMS
generously included schedules for one day before and one day after for cable television
and two days before and two days after for broadcast television. In total, I have 30 days
of data on cable television and 50 days of data on broadcast television. I then matched
TMS’s data with IMDB data and other online resources to determine the original airing
date for each episode shown. In most cases it was relatively straightforward to determine
15 I discount future revenues at 7% real. Furthermore, I assume that television prices will continue to grow slower than the PCE deflator. The depreciation schedule changes if I use a different discount rate.

23
the original airing date. However, a few episodes could not be found, had ambiguous
release dates or the online resources reported release dates well after the TMS reported an
airing.16 I dropped those observations from the sample.
The final TMS sample is not completely representative. I had a much easier time
matching live fiction programs than other long-lived programs. It was also harder to
match older episodes because they were less likely to be in on-line resources. I suspect
that my depreciation schedules would be slightly different if I could somehow match
every single episode. But most unmatched episodes were on small cable channels, and so
they earned relatively little money. Therefore, they had little effect on aggregate
depreciation rates.
Nielsen Ratings Data
BEA purchased a special dataset from Nielsen that gives ratings for every
program on ten randomly selected days. I then matched the ratings data with TMS’s
schedule information to get ratings data by airing date. The Nielsen data includes for-
profit broadcast networks, the top regular cable networks and the top premium cable
networks. Unfortunately, Nielsen does not track public television viewership. Also,
BEA did not purchase ratings data for local broadcast television. I will impute
viewership for shows not covered in Nielsen’s sample. I also impute viewership for the
TMS days not tracked in Nielsen’s ratings data.
I use Nielsen viewership data as a proxy for licensing revenue. On average,
premium cable channels earn more per viewer-minute than regular cable channels and
16 It is relatively common for online resources to give release dates a few weeks after the TMS airing. In that circumstance, I just rounded the release date down to the TMS date.
24
broadcast channels earn even less. Holding constant the channel type, I assume that
revenue is proportional to viewership.
As a robustness check, BEA also purchased Nielsen viewership data by
demographics. In general, advertisers pay higher rates for young adult viewers. So,
average advertising revenue could change over time even while total viewership is
constant. In fact, the Nielsen data report similar ages and genders for re-runs and original
airings. Accordingly, adjusting for viewership demographics would have little impact.
For simplicity I will use the total number of viewers in my depreciation schedules.
I found that most powerful predictor of viewership is time of day. On weekdays,
television viewership is low throughout the day and then increases during the evening.
On weekends, television viewership is higher during the day but still peaks in the
evening. Average viewership is also higher on channels with higher average viewership.
Nielsen ratings are also correlated with the age for individual episodes. On for-
profit broadcast networks, ratings are 75% higher for episodes released in the past year.
In contrast, cable ratings do not change much with age. This may be related to different
types of viewers or different types of shows on cable vs. broadcast. Because Nielsen
does not track public television, I do not know how viewership changes with episode
age.17 For simplicity, I impute viewership based only on time of day.
In order to use the complete TMS sample, I impute viewership revenue for every
episode. My imputations are based on time of day, channel and the age of the individual
episode. In practice, the depreciation curve would be very similar if I used only time of
day and channel. Most programs shown on broadcast television are relatively new, so the
17It is also unclear whether public spending on a program is correlated with viewership. PBS donors might prefer to spend money on educational programming that attracts few viewers.
25
lower ratings for those few re-runs are not influential. Cable television shows a lot of re-
runs, but those re-runs earn similar ratings to original airings.
Calibrating the Nielsen Ratings Data to Kantar’s Revenue by Genre
Nielsen viewership is not a perfect proxy for licensing revenue. According to
SNL Kagan, ESPN and other sports channels earn more licensing revenue per viewer
minute than other cable channels. Furthermore, I was forced to drop some episodes in
the TMS data because I could not identify their original airing dates. In order to get a
more representative sample, I will calibrate my depreciation schedules against the Kantar
data. In section 1, I estimated revenue for long-lived television programs by channel
type, production method, original distributor and quarter. Based on that revenue data, I
calculate that cable networks earn 50% more per viewer from live fiction than other long-
lived television. Accordingly, I weight live fiction viewers higher when calculating my
depreciation schedule.
Figure 12 shows market share by vintage for each television category. The most
obvious result is that all channel types have a very high market share in the quarter of
first release. This is partially because the quarter of first release always has at least one
airing (by definition). But new shows are also more likely to be on prime-time, more
likely to be on popular networks and more likely to be supported by advertising. Looking
past the first quarter, we can see a clear difference between the channel types. Older
shows have a very low market share on premium cable and for-profit broadcast. In
contrast, regular cable and public television have significant market shares for re-runs.

26
By chance, half of the randomly selected dates in the TMS schedule were in fall.
Broadcast networks typically start their new season in September. Accordingly, the fall
has fewer re-runs than the rest of the year. I use the quarterly Kantar data to correct for
this bias. Even though it does not have episode information, Kantar reports the series
title for each program in the sample. For each series in my dataset, I calculate real
quarterly investment in new episodes. I then regress real quarterly revenue on past
investment. Based on that regression, I believe that the TMS schedule includes 50%
more newly released episodes, 80% fewer episodes in their second quarter of life, 58%
more episodes in their third quarter and 13% fewer episodes in their fourth quarter or
later. I adjust the market share data in Figure 12 to match.
Sales Costs by Vintage
In section 1, I estimated that networks spend 20 cents promoting their new shows
for every dollar of revenue those shows earn. Unfortunately, I do not have any data on
advertising for individual television episodes. Kantar Media does track promos by
program name – but the program name only identifies the series. Even if Kantar did
track specific promotions, many of them are too general to identify an individual episode.
Paid airtime is even more aggregated. I will assume that all promotions for on-going
television series are for new episodes. Comparing the Kantar promo data to the Kantar
advertising data, I find that studios spend approximately 17 cents promoting new shows
for every dollar of revenue they earn. In contrast, studios only spend 1.1 cents promoting
completed series for every dollar of revenue earned.18 For every dollar of new
18 I restrict the sample to live action fiction because IMDB tracks episodes for that genre much better. Results are similar if I include other long-lived television as well.
27
investment, I calculate that studios spend 18.7 cents on advertising in the first quarter and
1.3% of revenue for every quarter thereafter.
In section 1, I estimated that networks spend 17 cents on customer service for
every dollar of advertising revenue and 5 cents on customer service for every dollar of
licensing revenue. Broadcast networks are much more likely to air new episodes than
cable networks. Furthermore, broadcast networks get virtually all of their revenue from
advertising. Accordingly, new television shows have higher physical costs. However,
the difference is small. In the release quarter, I estimate that networks spend 16 cents on
physical costs for every dollar of revenue. After the first year, networks spend 13 cents
on physical costs per dollar of revenue.
Calculating Depreciation Schedules
The market share data in Figure 12 is not enough to calculate a depreciation
schedule. The television industry has been growing rapidly since 1950, and so the low
market share for 1950’s shows partially reflects the low production during that decade. I
use the real investment numbers in Figure 10 to calculate quarterly service:
Servicest = (Real Quarterly Revenuet)/(Real Investment)19
I then calculate the net present value (NPV) of television revenue from initial
release until the episode fully depreciates:
Real NPV0 = Revenue0 – Sales Costs0 +NPV1/(1+r)
Real NPV1 = Revenue1 – Sales Costs1 +NPV2/(1+r)
19 In practice, the problem is somewhat circular. I need to know depreciation schedules to calculate the ratio (investment)/(licensing revenue). I start out by assuming that investment is proportional to revenue. Based on that, I calculate an initial depreciation schedule. I then adjust that depreciation schedule for higher investment ratios on other long-lived programs.
28
……
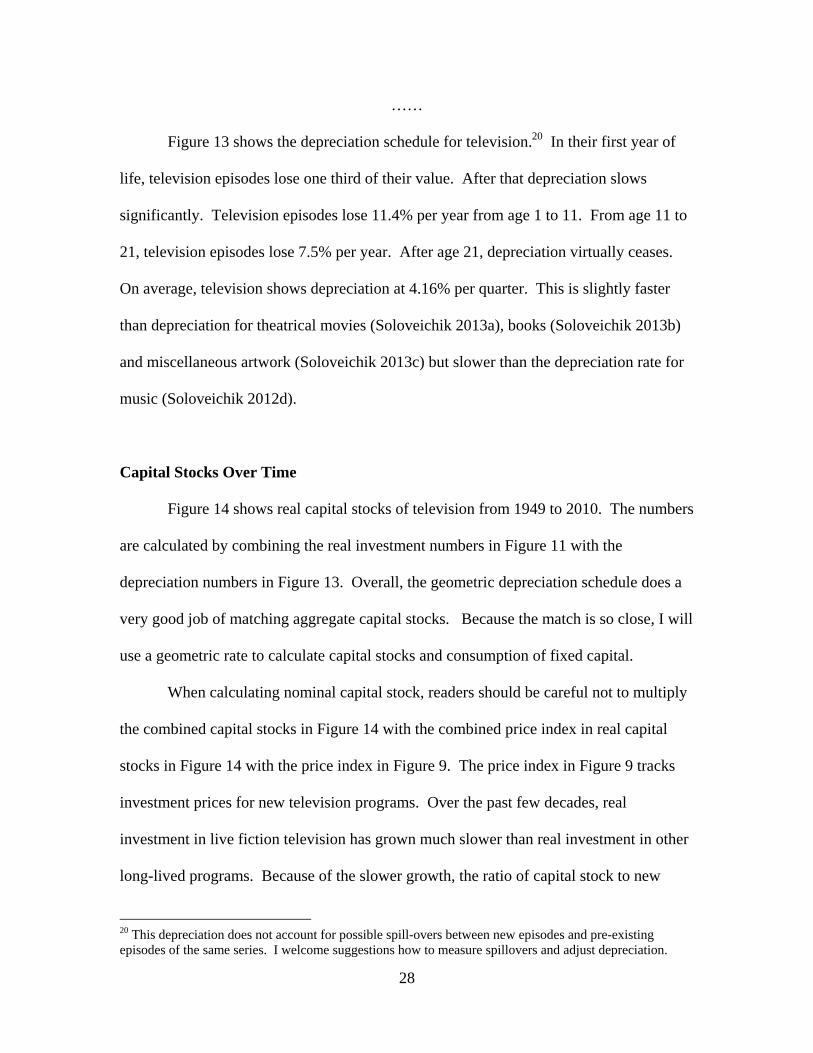
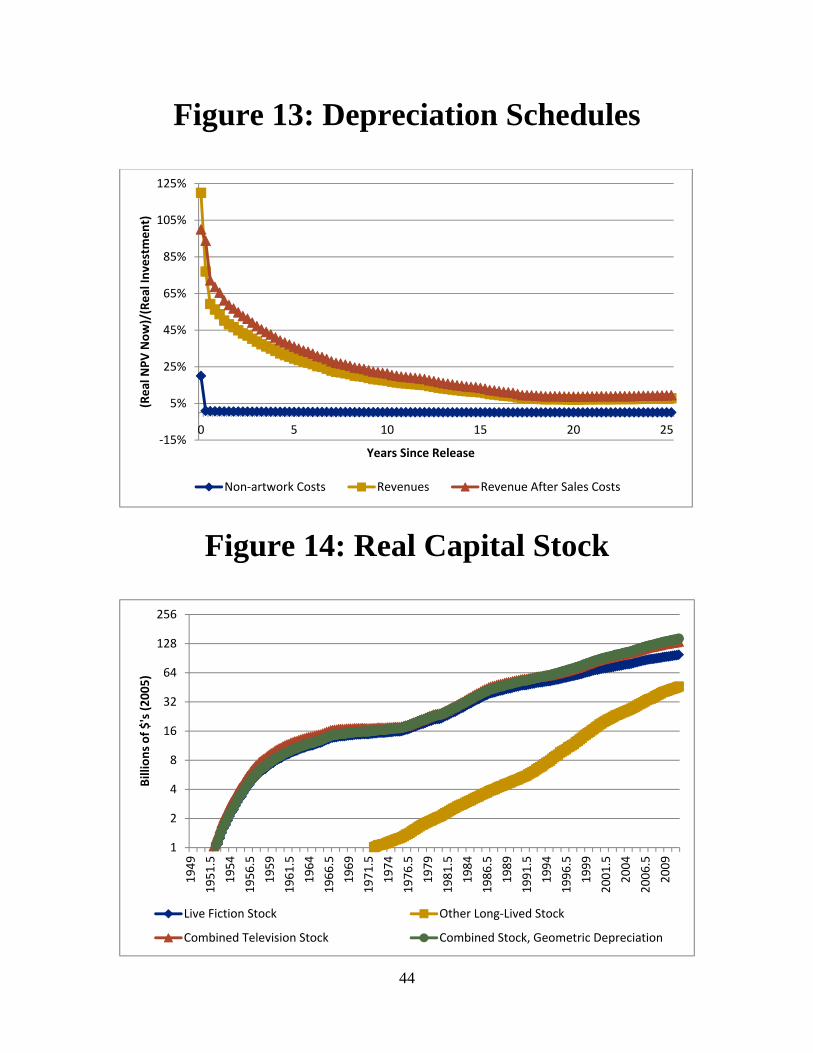
Figure 13 shows the depreciation schedule for television.20 In their first year of
life, television episodes lose one third of their value. After that depreciation slows
significantly. Television episodes lose 11.4% per year from age 1 to 11. From age 11 to
21, television episodes lose 7.5% per year. After age 21, depreciation virtually ceases.
On average, television shows depreciation at 4.16% per quarter. This is slightly faster
than depreciation for theatrical movies (Soloveichik 2013a), books (Soloveichik 2013b)
and miscellaneous artwork (Soloveichik 2013c) but slower than the depreciation rate for
music (Soloveichik 2012d).
Capital Stocks Over Time
Figure 14 shows real capital stocks of television from 1949 to 2010. The numbers
are calculated by combining the real investment numbers in Figure 11 with the
depreciation numbers in Figure 13. Overall, the geometric depreciation schedule does a
very good job of matching aggregate capital stocks. Because the match is so close, I will
use a geometric rate to calculate capital stocks and consumption of fixed capital.
When calculating nominal capital stock, readers should be careful not to multiply
the combined capital stocks in Figure 14 with the combined price index in real capital
stocks in Figure 14 with the price index in Figure 9. The price index in Figure 9 tracks
investment prices for new television programs. Over the past few decades, real
investment in live fiction television has grown much slower than real investment in other
long-lived programs. Because of the slower growth, the ratio of capital stock to new
20 This depreciation does not account for possible spill-overs between new episodes and pre-existing episodes of the same series. I welcome suggestions how to measure spillovers and adjust depreciation.
29
investment is higher for live fiction. Accordingly, the pre-existing capital stock of
television consists of mostly live fiction and capital stock prices track live fiction prices
very closely.
Section 4: Valuing Television Format Rights
What Are Long-Lived Format Rights?
In this paper, I only value individual television episodes as capital assets. This is
consistent with the handbook on intellectual property (OECD 2010). However, another
researcher might count format rights as an entertainment original. For example, an
individual reality show might be shown live and never replayed. Because the episodes
are so short-lived, they are not counted as capital assets. On the other hand, the reality
show re-uses the same storyline and rules for multiple seasons. Soap operas also re-use
the same storyline day after day to produce new episodes
Early radio shows often used long-lived formats as an input to production. For
example, a radio soap opera used the same characters and storyline for years. After
television was invented, many popular radio programs switched to television. I will treat
this switch as a transfer of artistic capital from the radio industry to the television
industry. Therefore, aggregate growth in long-lived formats is much lower than growth
in the television industry during the 1950s.
The results in this section are very preliminary. At the present time, BEA is not
planning to classify long-lived format rights as entertainment originals. As a result, none
30
of the estimates reported in this section will be included in the national income and
product accounts. Nevertheless, I present these numbers for interested researchers.
Nominal Revenue from Long-Lived Television Formats
Soap operas, game shows and reality television are the main genres with long-
lived formats and short-lived individual episodes. I use Kantar’s advertising data to track
the market share for long-lived format revenue by television type. This data in described
in section 1.21 Based on the TMS schedule data, I believe that premium cable and public
television show very few soap operas, game shows or reality television. I will set their
revenue equal to zero for simplicity. Before 1995, I use Nielsen’s Pocketpiece reports to
track long-lived format revenue.
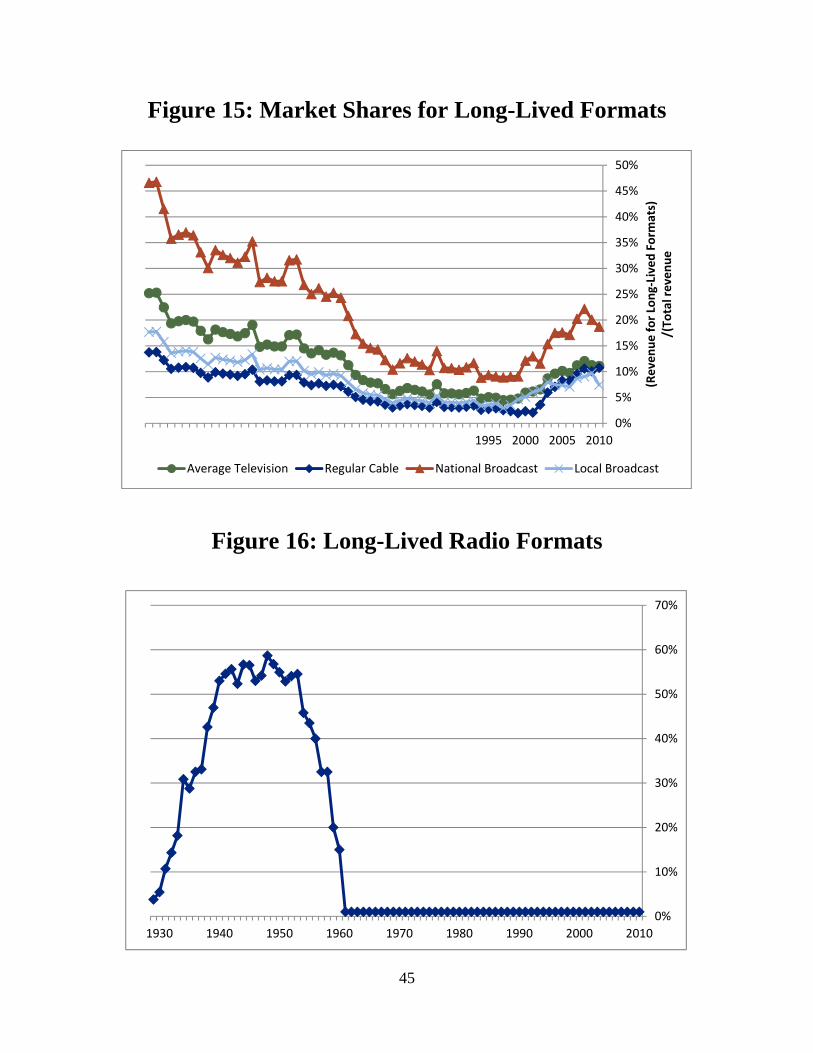
Figure 15 shows the market share for long-lived formats from 1949 to 2010.
Overall, long-lived formats have a U-shaped market share. Soap operas, variety shows
and game shows were popular during the 1950’s and 1960’s. Their market share
gradually diminished until 2000. After 2000, reality shows started becoming more
popular. I do not know whether these trends are caused by technology changes or just
shifts in consumer taste. Regardless, the U-shaped curve is far more volatile than the
steady market share for long-lived television shown in Figure 2.
Nominal Revenue from Long-Lived Radio Formats
The handbook on intellectual property (OECD 2010) recommends that long-lived
radio programs be treated in the exact same way as long-lived television shows. Unlike
21 In section 1, I adjusted the long-lived revenue share for differences between the Kantar advertising data and Kagan’s data on total revenue. I use the same adjustment factors here.
31
television, it is very rare for radio episodes to re-run. Modern radio shows are almost
exclusively music, news or other short-lived genres. Before 1950, radio shows often
played dramas, sit-coms or other long-lived genres. However, audio recording
technology was not good enough for re-runs to be feasible (Sterling and Kittross 1978).22
Instead, radio dramas were broadcast live every episode. Because radio re-runs are so
uncommon, I do not count any long-lived radio episodes as capital assets.
Even though individual radio episodes are never long-lived, radio formats might
be long-lived. Before 1950, radio soap operas and game shows were common. If a
researcher chooses to capitalize long-lived television formats, they might also choose to
capitalized long-lived radio formats as well. I used ratings data from the book “Stay
Tuned” (Sterling and Kittross, 1978 and 2002) to calculate the market share for long-
lived formats from 1929 to 1961. By 1961, radio soap operas had virtually disappeared.
I assume that long-lived formats accounted for 1% of radio revenue after 1961.
Figure 16 shows the market share for long-lived formats. When radio was first
invented, long-lived formats were very rare. Radio soap operas grew rapidly in the
1930’s and 1940’s and then peaked in 1949. During the 1950’s, most radio soap operas
transitioned to television. This transition could be considered a transfer of intangible
capital from radio networks to television networks. In most cases, the transfer occurred
within a company – so there are no explicit payments.
22 Movies and records were both popular before 1950. However, the combination of recording distortions and radio broadcast distortions was too much. Many stations did record shows for archival purposes. In a few cases, these recorded shows have been digitally improved and sold on CD in recent years.

32
Nominal Investment, Prices, Depreciation and Capital Stock
Only a portion of the revenue shown in Figure 15 and 16 can be attributed to the
long-lived format. In addition to normal broadcast costs, studios must also pay their
actors, writers and other people who produce each individual episode. Because
individual episodes are short-lived, those costs must be subtracted from revenue. I have
not been able to locate any data that value of long-lived formats alone. I was also unable
to measure prices for long-lived formats. Because I am so uncertain, I will not present
any estimates of nominal investment, prices, depreciation or capital stock.
Even though I cannot measure depreciation precisely, I believe that long-lived
formats have a very low depreciation rate. Many soap operas have lasted from the 1930’s
until the 2000’s. Furthermore, game shows like “Wheel of Fortune” or “Jeopardy” have
been continuing for decades. Reality shows are newer, so we cannot observe their
eventual lifespan. But successful reality shows like “American Idol” have already lasted
a decade. One explanation for the long lifespan might be the ability to transition new
people into an existing format. For example, soap operas frequently replace actors
without changing the character at all. This allows the show to continue even after
individual actors move to other projects or die.
Conclusion
In this paper, I constructed estimates of investment, prices, depreciation and
capital stocks of long-lived television programs. This change helps bring the NIPAs in
33
line with SNA 2008, which recommended that entertainment originals be treated as
capital assets.
I find that investment in television programs has been growing rapidly over time.
In 1960, studios spent $0.6 billion producing long-lived television episodes, 0.11% of
nominal GDP. By 2010, long-lived television had grown to $28.3 billion, 0.20% of
nominal GDP. On average, nominal GDP growth increases by 0.0018% per year when
long-lived television programs are classified as a capital asset. I also found that real
prices for television investment have been flat since 1990.

34
Table 1: List of Datasets Used and How They Are Used
Dataset Description of Dataset Used to Create
2007 Economic Census
The Economic Census is conducted every 5 years by the Census Department. It surveys businesses in the United States.
Nominal Television Production
2004-2008 Service Annual
Survey
The Service Annual Survey is conducted every year by the Census Department. It surveys businesses in the service sector. However, it is less detailed than the Economic Census.
Nominal Television Production, Real Television Production & Depreciation Schedules
IMDB.com and other on-line
sources
IMDB provides the nationality of the producing studio and the distributing company. I also used Wikipedia, tvrage.com and other sources to locating distributors for some shows
Industry split for television production, US market shares
Tribune Media Service data
This is a dataset of American movies shown on US television stations. The dataset records the name of the movie, the date it was shown and the channel it is shown on.
Television Licensing Revenue Schedule & Depreciation Schedule
Nielsen Ratings data
This is a dataset of viewership for national broadcast and national cable channels on ten randomly selected days.
Market Share for Long-Lived television programs; Depreciation Schedule
Kantar Media Services data
This is a dataset that tracks advertising spending by product in the US. BEA purchased a special dataset that gives advertising by channel type, program genre and program name. I then matched those program names to IMDB data to identify theatrical movies, non-US television and distributors
Market Share for Long-Lived Television, Industry Split for Television and other figures
35
Table 2: Television Revenue by Category 1949-2010
Cash Revenue Earned, Millions of Current $’s Value of Unpaid Airtime
Regular Cable
Licensing and Airtime
Premium Cable
Licensing
National Broad‐cast
Local Broad‐cast
Syndication
Public Broad‐cast
TV Programs on DVD
Foreign Licensing
Merchandise Licensing and Other Misc. Revenue
Regular Cable
National Broad‐cast
Local Broad‐cast
2010 44,818 3,348 16,337 10,959 1,761 1,665 1,999 7,575 2,856 4,964 3,081 3,2272009 42,045 2,973 14,478 9,731 1,640 1,604 2,032 7,280 2,347 4,960 2,777 3,8302008 40,652 2,846 16,773 12,294 1,786 1,838 2,363 7,302 2,442 4,626 3,237 3,8232007 37,568 2,408 16,538 12,651 1,843 1,723 2,409 7,319 1,882 4,277 3,240 3,8582006 34,380 2,050 17,250 12,877 1,943 1,793 2,050 7,164 1,746 4,647 3,954 3,5622005 31,881 1,950 17,030 12,118 2,010 1,516 1,602 6,650 1,862 4,598 3,948 3,4802004 28,625 1,947 17,055 11,993 1,887 1,556 1,477 6,097 1,769 4,303 3,702 3,1922003 25,867 1,828 15,935 11,288 1,685 1,513 1,270 5,884 1,888 4,172 3,547 3,4572002 22,754 1,963 16,410 10,887 1,535 1,459 1,147 5,569 1,750 3,606 3,340 2,8922001 20,722 1,969 14,428 10,054 1,556 1,582 985 5,311 1,719 3,829 3,070 2,9302000 19,746 1,837 15,369 11,742 1,522 1,582 829 5,262 1,852 3,601 3,214 3,0481999 16,670 1,784 13,908 10,628 1,458 1,412 676 4,864 1,938 2,787 2,763 2,7071998 14,055 1,784 12,444 10,551 1,292 1,235 507 4,320 1,894 2,376 2,604 2,6021997 11,682 1,727 11,544 9,672 1,185 1,240 385 3,855 1,872 2,045 2,443 2,3601996 9,842 1,693 11,271 9,374 1,121 1,284 348 3,616 1,804 1,825 2,392 2,5141995 8,360 1,777 10,726 8,702 1,238 1,164 322 3,372 1,498 1,416 2,274 2,3671994 7,295 1,878 9,900 8,016 1,142 1,096 306 2,928 1,373 1,174 2,099 2,1801993 6,296 2,235 8,995 7,327 1,040 1,055 275 2,709 1,241 974 1,907 1,9931992 5,579 2,655 9,083 7,296 1,045 1,042 251 2,725 1,137 822 1,926 1,9841991 4,861 2,928 8,769 7,019 1,007 1,018 245 2,417 1,046 701 1,859 1,909
36
Regular Cable
Licensing and Airtime
Premium Cable
Licensing
National Broad‐cast
Local Broad‐cast
Syndication
Public Broad‐cast
TV Programs on DVD
Foreign Licensing
Merchandise Licensing and Other Misc. Revenue
Regular Cable
National Broad‐cast
Local Broad‐cast
1990 4,238 3,270 9,558 7,244 1,074 975 250 2,399 1,077 606 2,026 1,9701989 3,449 3,409 8,986 6,893 1,015 927 241 2,132 1,033 532 1,905 1,8751988 2,836 3,191 8,832 6,697 993 870 228 1,946 1,024 428 1,872 1,8211987 2,259 2,985 8,240 6,413 936 813 206 1,837 1,039 329 1,747 1,7441986 1,760 3,072 7,941 6,155 900 649 178 1,894 1,068 244 1,684 1,6741985 1,454 3,148 7,395 5,671 835 612 143 1,667 1,030 199 1,568 1,5421984 1,232 2,990 7,229 5,153 794 559 99 1,510 811 169 1,533 1,4011983 1,055 2,477 6,095 4,532 680 557 69 1,322 539 147 1,292 1,2331982 761 1,748 4,818 4,097 567 699 47 1,145 392 95 1,021 1,1141981 545 1,031 4,805 3,517 533 659 31 1,022 257 61 1,019 9571980 374 507 4,368 3,069 477 618 22 732 147 34 926 8351979 259 236 3,928 2,697 425 489 15 795 143 15 833 7341978 173 87 3,424 2,448 376 485 9 678 116 0 726 6661977 151 30 2,917 2,069 320 419 4 617 103 0 618 5631976 128 11 2,464 2,022 286 319 0 508 85 0 522 5501975 115 2 1,963 1,524 223 252 0 373 62 0 416 4141974 97 0 1,811 1,406 205 203 0 357 60 0 384 3821973 83 0 1,663 1,293 189 142 0 304 51 0 353 3521972 70 0 1,496 1,237 174 142 0 318 53 0 317 3371971 60 0 1,289 1,075 150 94 0 273 46 0 273 2921970 51 0 1,274 1,159 154 61 0 273 46 0 270 3151969 39 0 1,270 1,155 154 20 0 256 43 0 269 3141968 30 0 1,145 1,041 139 0 0 232 39 0 243 283
37
Regular Cable
Licensing and Airtime
Premium Cable
Licensing
National Broad‐cast
Local Broad‐cast
Syndication
Public Broad‐cast
TV Programs on DVD
Foreign Licensing
Merchandise Licensing and Other Misc. Revenue
Regular Cable
National Broad‐cast
Local Broad‐cast
1967 23 0 1,031 937 125 0 0 238 40 0 219 2551966 18 0 1,000 910 121 0 0 261 44 0 212 2471965 14 0 891 810 108 0 0 207 35 0 189 2201964 12 0 811 738 98 0 0 175 29 0 172 2011963 10 0 720 655 87 0 0 170 29 0 153 1781962 9 0 672 611 81 0 0 161 27 0 142 1661961 8 0 599 545 73 0 0 156 26 0 127 1481960 7 0 576 524 70 0 0 146 25 0 122 1431959 5 0 542 493 66 0 0 138 23 0 115 1341958 4 0 491 447 60 0 0 120 20 0 104 1221957 3 0 456 414 55 0 0 119 20 0 97 1131956 3 0 434 395 53 0 0 107 18 0 92 1071955 2 0 367 333 44 0 0 84 14 0 78 911954 2 0 287 261 35 0 0 65 11 0 61 711953 1 0 215 195 26 0 0 49 8 0 46 531952 1 0 161 146 19 0 0 37 6 0 34 401951 1 0 118 107 14 0 0 24 4 0 25 291950 1 0 61 55 7 0 0 11 2 0 13 151949 1 0 21 19 2 0 0 4 1 0 4 5
38
Figure 1: Total Television Revenue
Figure 2: Market Shares for Long-Lived US Television
50
100
200
400
800
1,600
3,200
6,400
12,800
25,600
51,200
2010200019901980197019601950
Millions of $'s
US Cable, Cash and Implied Revenue US Broadcast, Cash and Implied Revenue
All Other Revenue
0%
10%
20%
30%
40%
50%
60%
70%
2010200019901980197019601950
(Long‐Lived US TV
Revenue)/
(Total R
evenue)
Regular Cable Premium Cable National Broadcast
Local Broadcast Public Television
39
Figure 3: Non-Artwork Costs vs. Revenue
Figure 4: Market Share For Live Fiction Television
23%
25%
27%
29%
31%
33%
2010200019901980197019601950
((Non‐Artwork Costs)/
(Total Television Revenue)
Regular Cable Premium Cable Broadcast Television Total Television Industry
0%
10%
20%
30%
40%
50%
60%
70%
80%
90%
100%
20102000
(Live Fiction US TV
Revenue)/
(Total Long‐Lived US TV
Revenue)
Regular Cable Premium Cable National Broadcast
Local Broadcast Public Television Total Television
40
Figure 5: Relative Revenue by First Distributor, Live Fiction Television Only
Figure 6: Relative Revenue by First Distributor, Other Long-lived Television Only
25%
50%
100%
200%
400%
2010200019901980197019601950
(Revenue by Premiriin
g Industry)/
(Revenue by Airing Industry)
Regular Cable National Broadcast Local Broadcast
Public Television Average Television
50%
100%
200%
400%
2010200019901980197019601950
(Revenue by Premiriin
g Industry)/
(Revenue by Airing Industry)
Regular Cable National Broadcast Local Broadcast
Public Television Average Television
41
Figure 7: Investment Relative to Licensing Revenue
Figure 8: Nominal Television Investment
0.82
0.84
0.86
0.88
0.90
0.92
0.94
0.96
0.98
2010200019901980197019601950
(Nominal In
vestment)/
(Total Licensing Revenue)
Live Fiction Average Television Other Long‐Lived
50
100
200
400
800
1,600
3,200
6,400
12,800
25,600
2010200019901980197019601950
(Millions of $)
Live Fiction Total Television Other Long‐Lived
42
Figure 9: Television Investment Prices
Figure 10: Real Television Investment
12.5
25
50
100
1949 1954 1959 1964 1969 1974 1979 1984 1989 1994 1999 2004 2009
Base Year 2005 = 100
Live Fiction Other Long‐Lived Combined Television
500
1,000
2,000
4,000
8,000
16,000
32,000
2010200019901980197019601950
Millions of $'s (2005)
Live Fiction Total Television Other Long‐Lived
43
Figure 11: Consumer Prices for Television
Figure 12: Market Share by Vintage
0
20
40
60
80
100
120
2010200019901980197019601950
Base Year 2005 = 100
Advertising Spending Per Minute, Price Index Consumer Prices for Cable Television Investment Prices
0.10%
0.20%
0.40%
0.80%
1.60%
3.20%
6.40%
12.80%
25.60%
51.20%
Market Share by Vintage
Years Since First Release
Regular Cable Premium Cable For‐Profit Broadcast Public Broadcast
44
Figure 13: Depreciation Schedules
Figure 14: Real Capital Stock
‐15%
5%
25%
45%
65%
85%
105%
125%
0 5 10 15 20 25
(Real NPV Now)/(Real In
vestment)
Years Since Release
Non‐artwork Costs Revenues Revenue After Sales Costs
1
2
4
8
16
32
64
128
256
1949
1951.5
1954
1956.5
1959
1961.5
1964
1966.5
1969
1971.5
1974
1976.5
1979
1981.5
1984
1986.5
1989
1991.5
1994
1996.5
1999
2001.5
2004
2006.5
2009
Billions of $'s (2005)
Live Fiction Stock Other Long‐Lived Stock
Combined Television Stock Combined Stock, Geometric Depreciation
45
Figure 15: Market Shares for Long-Lived Formats
Figure 16: Long-Lived Radio Formats
0%
5%
10%
15%
20%
25%
30%
35%
40%
45%
50%
2010200520001995
(Revenue for Long‐Lived Form
ats)
/(To
tal revenue
Average Television Regular Cable National Broadcast Local Broadcast
0%
10%
20%
30%
40%
50%
60%
70%
201020001990198019701960195019401930

46
Bibliography
Bridgman, Benjamin. (2008). Do Intangible Assets Explain High U.S. Foreign Direct
Investment Returns? BEA Working Paper 2008-06
Epstein, Edward Jay. (2005a). The Big Picture: Money and Power in Hollywood.
Random House
Fraumeni, Barbara, Robinson, Brooks, Reinsdorf, Marshall and Williams, Matthew.
(2008). Price and Real Output Measures for the Education Function of Government:
Exploratory Estimates for Primary and Secondary Education. NBER Working Paper
14099.
Kantar Media (1995-2010), special data purchases, http://www.kantarmedia.com
Hausman, Jerry (2003) “Sources of Bias and Solutions to Bias in the Consumer Price
Index” Journal of Economic Perspectives 17, pages 23-44
Nielsen Ratings data (2003-2008), special data purchases http://www.nielsen.com
OECD. (2010). Handbook on Deriving Capital Measures for Intellectual Property
Production. www.oecd.org/std/na/44312350.pdf
Paul Kagan Associates. (1996, 2000 and 2006). Economic of Basic Cable Networks.
Paul Kagan Associates. (1987). Kagan Census of Cable and Pay TV
Paul Kagan Associates. (1999). Broadcast Financial Record
Robbins, Carol and Moylan, Carol. (2007). Research and Development Satellite Account
Update. Survey of Current Business October 2007, 16-27

47
Schankerman, Mark and Pakes, Ariel. (1986). Estimates of the value of patent rights in
European countries during the post-1950 period. The Economic Journal 95 (384). 1052-
1076
Soloveichik, Rachel. (2013a). Theatrical Movies as Capital Assets. manuscript
Soloveichik, Rachel. (2013b). Music Originals As Capital Assets. manuscript
Soloveichik, Rachel. (2013c). Books As Capital Assets. manuscript
Soloveichik, Rachel. (2013d). Miscellaneous Artwork As Capital Assets. manuscript
Sterling, Christopher and Kittross, John. (1978 and 2002). Stay Tuned: A History of
American Broadcasting Wadsworth Publishing Company
Straubhaar, Joseph. (2007). World Television: From Global to Local. Sage Publications
Tribune Media Services, special data purchase http://www.tribunemediaservices.com/
United Nations Statistics Division. (2008). Updated System of National Accounts 2008.
Accessed May 20, 2013. http://unstats.un.org/unsd/nationalaccount/sna2008.asp
Vogel, Harold. (2004). Entertainment Industry Economics. Cambridge University Press