Embed Size (px)
Citation preview
knig
htfra
nk.c
om/r
esea
rch
London Residential ReviewQ2 2021
Transactions surge in March
Rental declines bottom out
Latest five-year forecast
1 Prime London property market most active in five years (Jan 2016 =100)n POL n PCL
Source: Knight Frank Research
3.5%
Smallest annual decline in prime
central London prices in March 2021
since the start of the pandemic
2%
Forecast increase in prime central
London prices in 2021, revised down
from 3% due to enduring international
travel restrictions
83%
Decline in passenger numbers at
Heathrow airport in the year to March
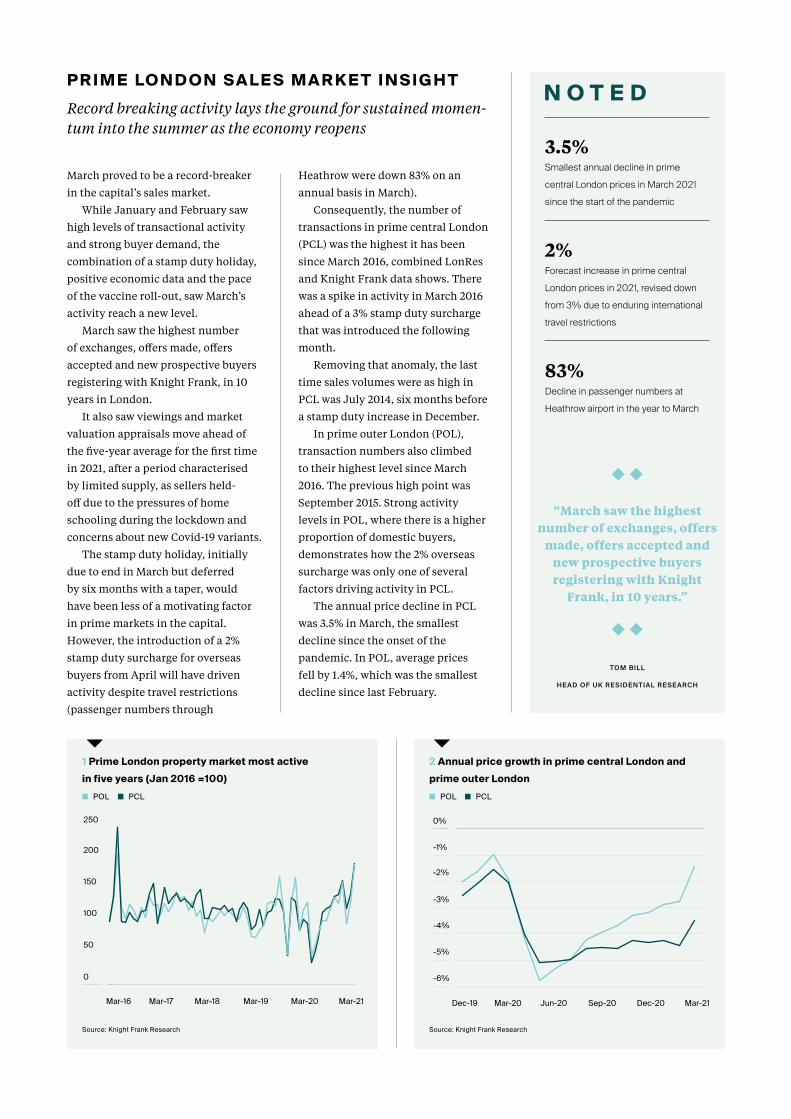
P R I M E LO N D O N SA L E S M A R K E T I N S I G H T Record breaking activity lays the ground for sustained momen-tum into the summer as the economy reopens
March proved to be a record-breaker
in the capital’s sales market.
While January and February saw
high levels of transactional activity
and strong buyer demand, the
combination of a stamp duty holiday,
positive economic data and the pace
of the vaccine roll-out, saw March’s
activity reach a new level.
March saw the highest number
of exchanges, offers made, offers
accepted and new prospective buyers
registering with Knight Frank, in 10
years in London.
It also saw viewings and market
valuation appraisals move ahead of
the five-year average for the first time
in 2021, after a period characterised
by limited supply, as sellers held-
off due to the pressures of home
schooling during the lockdown and
concerns about new Covid-19 variants.
The stamp duty holiday, initially
due to end in March but deferred
by six months with a taper, would
have been less of a motivating factor
in prime markets in the capital.
However, the introduction of a 2%
stamp duty surcharge for overseas
buyers from April will have driven
activity despite travel restrictions
(passenger numbers through
Heathrow were down 83% on an
annual basis in March).
Consequently, the number of
transactions in prime central London
(PCL) was the highest it has been
since March 2016, combined LonRes
and Knight Frank data shows. There
was a spike in activity in March 2016
ahead of a 3% stamp duty surcharge
that was introduced the following
month.
Removing that anomaly, the last
time sales volumes were as high in
PCL was July 2014, six months before
a stamp duty increase in December.
In prime outer London (POL),
transaction numbers also climbed
to their highest level since March
2016. The previous high point was
September 2015. Strong activity
levels in POL, where there is a higher
proportion of domestic buyers,
demonstrates how the 2% overseas
surcharge was only one of several
factors driving activity in PCL.
The annual price decline in PCL
was 3.5% in March, the smallest
decline since the onset of the
pandemic. In POL, average prices
fell by 1.4%, which was the smallest
decline since last February.
0
50
100
150
200
250
Mar-16 Mar-17 Mar-18 Mar-19 Mar-20 Mar-21
2 Annual price growth in prime central London and prime outer Londonn POL n PCL
Source: Knight Frank Research
“March saw the highest number of exchanges, offers
made, offers accepted and new prospective buyers registering with Knight
Frank, in 10 years.”
TOM BILL
HEAD OF UK RESIDENTIAL RESEARCH
-6%
-5%
-4%
-3%
-2%
-1%
0%
Dec-19 Mar-20 Jun-20 Sep-20 Dec-20 Mar-21
9 M A R Y L E B O N E3 - M O N T H C H A N G E
S A L E S R E N T S
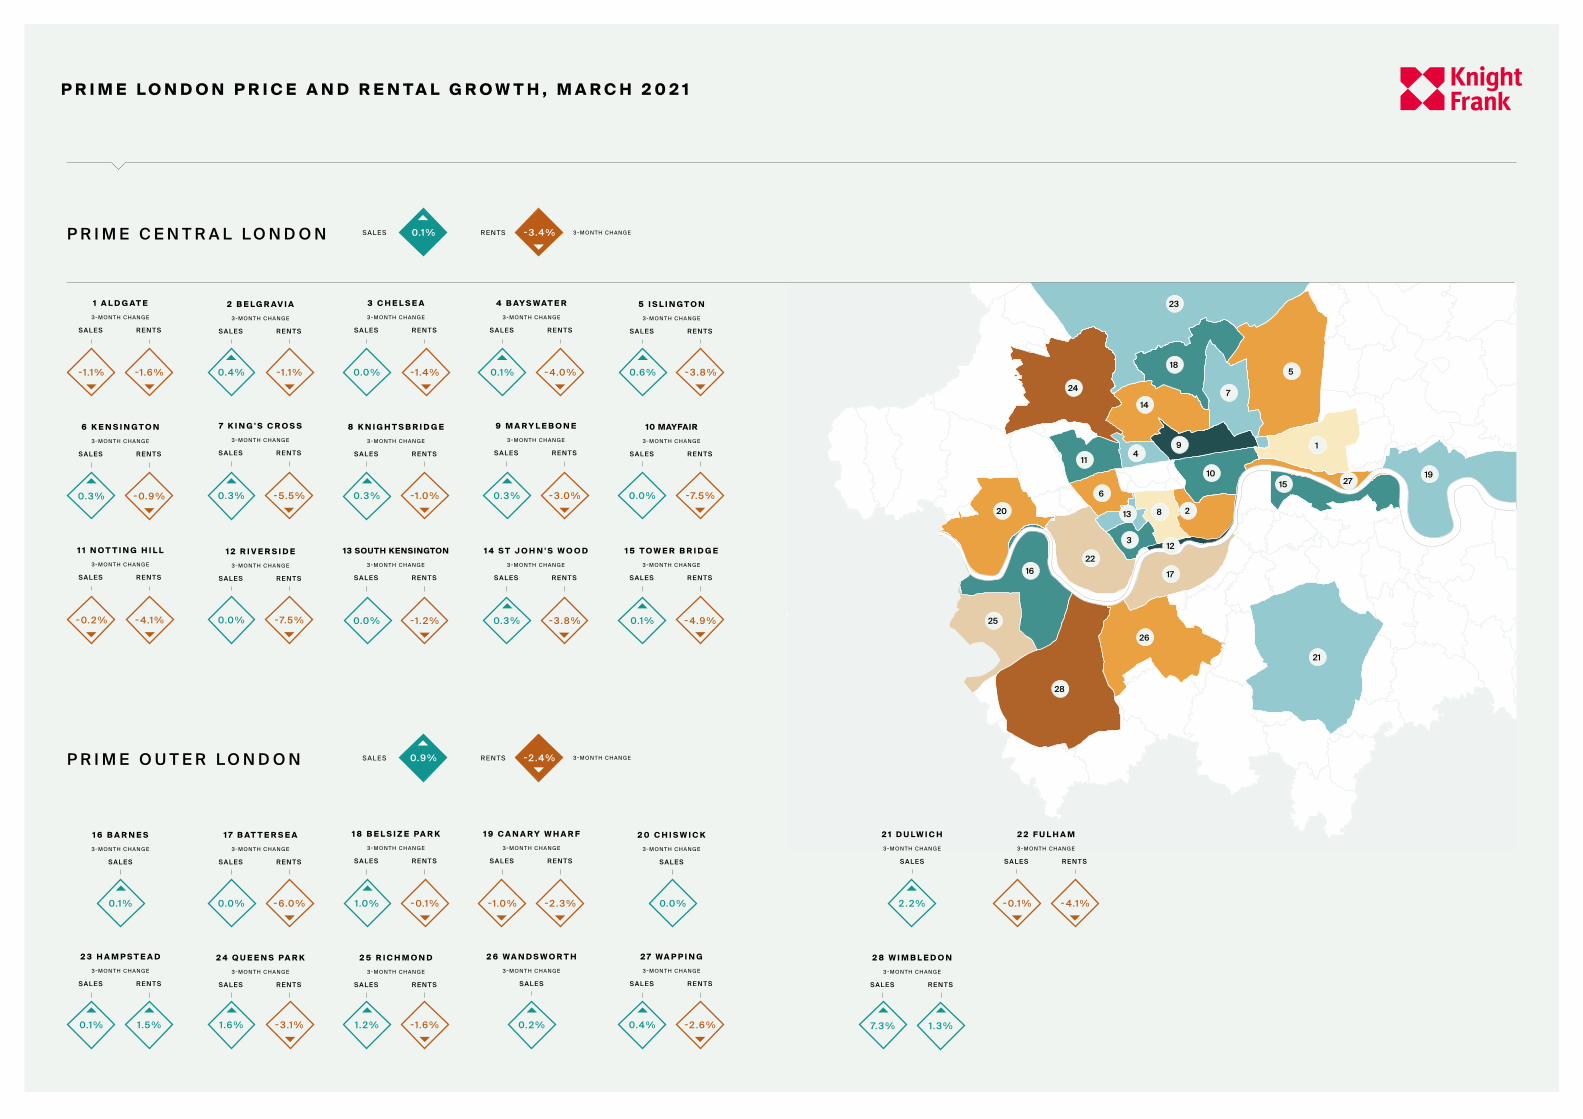
- 3.0 %-1.0 %
1 A L D G AT E3 - M O N T H C H A N G E
S A L E S R E N T S
1 6 B A R N E S3 - M O N T H C H A N G E
S A L E S
7 K I N G ' S C R O S S3 - M O N T H C H A N G E
S A L E S R E N T S
2 3 H A M P S T E A D3 - M O N T H C H A N G E
S A L E S R E N T S
13 SOUTH KENSINGTON3 - M O N T H C H A N G E
S A L E S R E N T S
6 K E N S I N G T O N3 - M O N T H C H A N G E
S A L E S R E N T S
2 B E L G R AV I A3 - M O N T H C H A N G E
S A L E S R E N T S
1 7 B AT T E R S E A3 - M O N T H C H A N G E
S A L E S R E N T S
8 K N I G H T S B R I D G E3 - M O N T H C H A N G E
S A L E S R E N T S
2 4 Q U E E N S PA R K3 - M O N T H C H A N G E
S A L E S R E N T S
2 1 D U L W I C H3 - M O N T H C H A N G E
S A L E S
1 4 S T J O H N ' S W O O D3 - M O N T H C H A N G E
S A L E S R E N T S
3 C H E L S E A3 - M O N T H C H A N G E
S A L E S R E N T S
1 8 B E L S I Z E PA R K3 - M O N T H C H A N G E
S A L E S R E N T S
2 5 R I C H M O N D3 - M O N T H C H A N G E
S A L E S R E N T S
2 2 F U L H A M3 - M O N T H C H A N G E
S A L E S R E N T S
1 5 T O W E R B R I D G E3 - M O N T H C H A N G E
S A L E S R E N T S
4 B AY S W AT E R3 - M O N T H C H A N G E
S A L E S R E N T S
1 9 C A N A R Y W H A R F3 - M O N T H C H A N G E
S A L E S R E N T S
10 MAYFAIR3 - M O N T H C H A N G E
S A L E S R E N T S
2 6 W A N D S W O R T H3 - M O N T H C H A N G E
S A L E S
2 8 W I M B L E D O N3 - M O N T H C H A N G E
S A L E S R E N T S
5 I S L I N G T O N3 - M O N T H C H A N G E
S A L E S R E N T S
2 0 C H I S W I C K3 - M O N T H C H A N G E
S A L E S
1 1 N O T T I N G H I L L3 - M O N T H C H A N G E
S A L E S R E N T S
2 7 W A P P I N G3 - M O N T H C H A N G E
S A L E S R E N T S
P R I M E C E N T R A L L O N D O N S A L E S R E N TS 3 - M O N T H C H A N G E
3 - M O N T H C H A N G ES A L E S R E N TS
0.1 %
0.9 %
- 3.4 %
P R I M E O U T E R L O N D O N
1 2 R I V E R S I D E3 - M O N T H C H A N G E
S A L E S R E N T S
P R I M E L O N D O N P R I C E A N D R E N T A L G R O W T H , M A R C H 2 0 2 1
23
24
518
714
1
19
21
26
28
16
20
22
6
114
9
28
3
13
17
25
12
271510
-1.1 % -1.6 %
0.3 % - 5.5 %
0.0 % -1. 2 %
0.4 % -1.1 %
0.3 %
0.3 % - 3.8 %
0.0 % -1.4 %
0.3 %
0.1 % - 4.9 %
0.1 % - 4.0 %
0.0 % -7.5 %
0.6 % - 3.8 %
0.3 % - 0.9 %
0.0 % -7.5 %- 0. 2 % - 4.1 %
0.1 % 0.0 %
0. 2 %
1.0 %0.0 % - 0.1 %- 6.0 % -1.0 % -2 .3 % 2 . 2 % - 0.1 %
0.1 % 7.3 % 1.3 %
-2 .4 %
- 4.1 %
1.5 % 1.6 % - 3.1 % 1. 2 % 0.4 %-1.6 % -2 .6 %
P R I M E LO N D O N L E T T I N G S M A R K E T I N S I G H T Rental declines may have bottomed out as demand grows faster than supply for the first time since the start of the pandemic
Average rents in prime central
London declined 14.3% in the year
to March, continuing a pattern
established over the course of the
pandemic.
While supply has spiked due to
the closure of the short-let market,
demand has been curtailed by
international travel restrictions. There
are signs that is beginning to change.
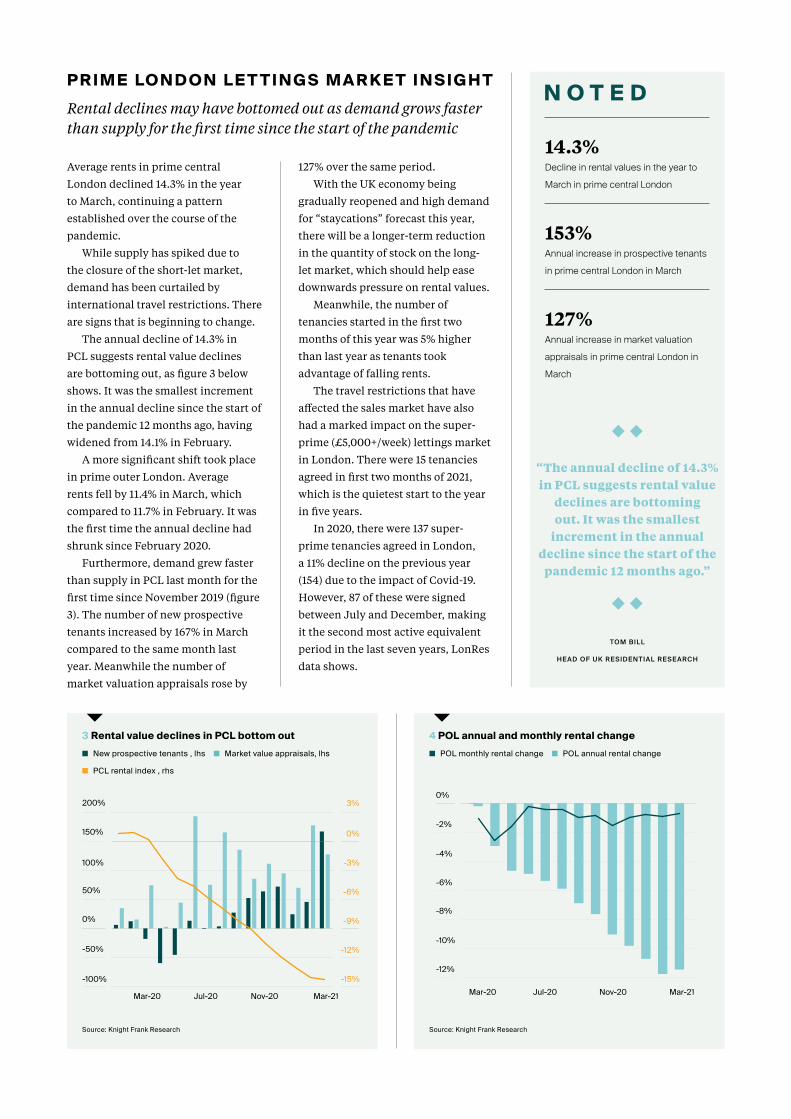
The annual decline of 14.3% in
PCL suggests rental value declines
are bottoming out, as figure 3 below
shows. It was the smallest increment
in the annual decline since the start of
the pandemic 12 months ago, having
widened from 14.1% in February.
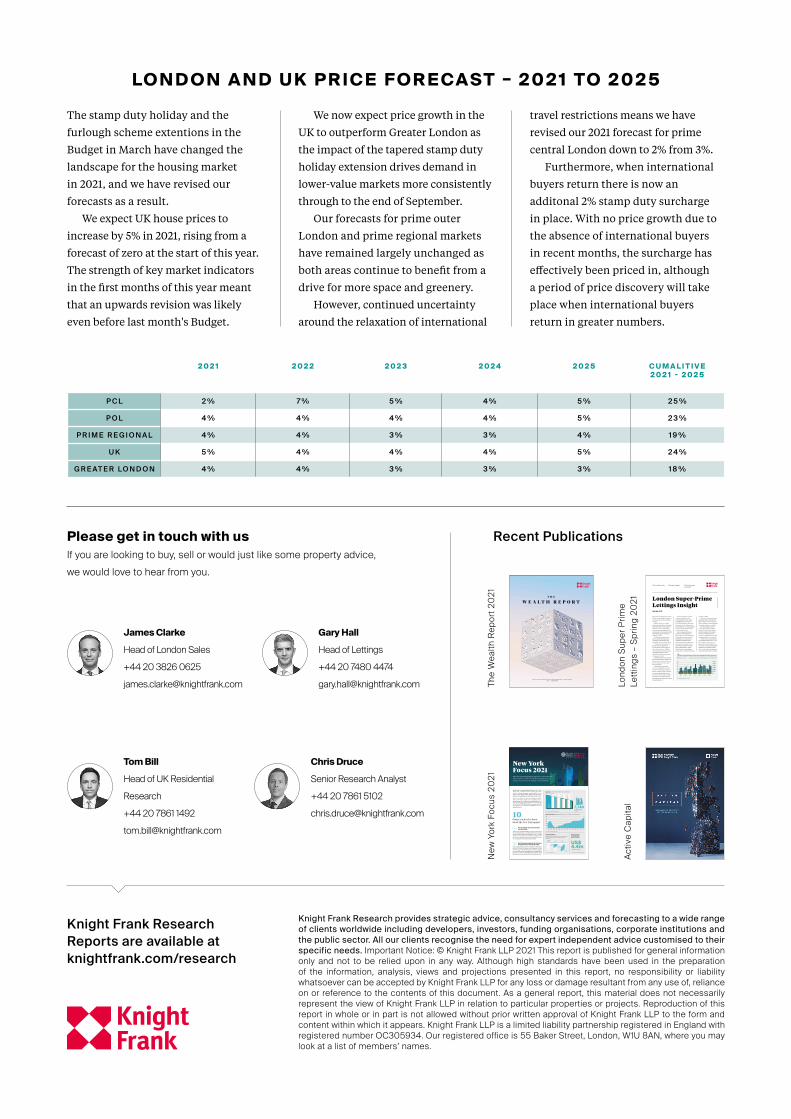
A more significant shift took place
in prime outer London. Average
rents fell by 11.4% in March, which
compared to 11.7% in February. It was
the first time the annual decline had
shrunk since February 2020.
Furthermore, demand grew faster
than supply in PCL last month for the
first time since November 2019 (figure
3). The number of new prospective
tenants increased by 167% in March
compared to the same month last
year. Meanwhile the number of
market valuation appraisals rose by
127% over the same period.
With the UK economy being
gradually reopened and high demand
for “staycations” forecast this year,
there will be a longer-term reduction
in the quantity of stock on the long-
let market, which should help ease
downwards pressure on rental values.
Meanwhile, the number of
tenancies started in the first two
months of this year was 5% higher
than last year as tenants took
advantage of falling rents.
The travel restrictions that have
affected the sales market have also
had a marked impact on the super-
prime (£5,000+/week) lettings market
in London. There were 15 tenancies
agreed in first two months of 2021,
which is the quietest start to the year
in five years.
In 2020, there were 137 super-
prime tenancies agreed in London,
a 11% decline on the previous year
(154) due to the impact of Covid-19.
However, 87 of these were signed
between July and December, making
it the second most active equivalent
period in the last seven years, LonRes
data shows.
4 POL annual and monthly rental changen POL monthly rental change n POL annual rental change
Source: Knight Frank Research
-12%
-10%
-8%
-6%
-4%
-2%
0%
Mar-20 Jul-20 Nov-20 Mar-21
14.3%
Decline in rental values in the year to
March in prime central London
153%
Annual increase in prospective tenants
in prime central London in March
127%
Annual increase in market valuation
appraisals in prime central London in
March
3 Rental value declines in PCL bottom outn New prospective tenants , lhs n Market value appraisals, lhs
n PCL rental index , rhs
Source: Knight Frank Research
-100%
-50%
0%
50%
100%
150%
200%
Mar-20 Jul-20 Nov-20 Mar-21
-15%
-12%
-9%
-6%
-3%
0%
3%
“The annual decline of 14.3% in PCL suggests rental value
declines are bottoming out. It was the smallest
increment in the annual decline since the start of the
pandemic 12 months ago.”
TOM BILL
HEAD OF UK RESIDENTIAL RESEARCH
2 0 2 1 2 0 2 2 2 0 2 3 2 0 2 4 2 0 2 5 C U M A L I T I V E2 0 2 1 - 2 0 2 5
P C L 2 % 7 % 5 % 4 % 5 % 2 5 %
P O L 4 % 4 % 4 % 4 % 5 % 2 3 %
P R I M E R E G I O N A L 4 % 4 % 3 % 3 % 4 % 1 9 %
U K 5 % 4 % 4 % 4 % 5 % 2 4 %
G R E AT E R LO N D O N 4 % 4 % 3 % 3 % 3 % 1 8 %
Please get in touch with usIf you are looking to buy, sell or would just like some property advice, we would love to hear from you.
James Clarke
Head of London Sales
+44 20 3826 0625
Gary Hall
Head of Lettings
+44 20 7480 4474
Tom Bill
Head of UK Residential
Research
+44 20 7861 1492
Knight Frank Research provides strategic advice, consultancy services and forecasting to a wide range of clients worldwide including developers, investors, funding organisations, corporate institutions and the public sector. All our clients recognise the need for expert independent advice customised to their specific needs. Important Notice: © Knight Frank LLP 2021 This report is published for general information only and not to be relied upon in any way. Although high standards have been used in the preparation of the information, analysis, views and projections presented in this report, no responsibility or liability whatsoever can be accepted by Knight Frank LLP for any loss or damage resultant from any use of, reliance on or reference to the contents of this document. As a general report, this material does not necessarily represent the view of Knight Frank LLP in relation to particular properties or projects. Reproduction of this report in whole or in part is not allowed without prior written approval of Knight Frank LLP to the form and content within which it appears. Knight Frank LLP is a limited liability partnership registered in England with registered number OC305934. Our registered office is 55 Baker Street, London, W1U 8AN, where you may look at a list of members’ names.
Knight Frank Research Reports are available atknightfrank.com/research
Recent Publications
Activ
e C
apita
lLo
ndon
Sup
er P
rime
Le
tting
s –
Sprin
g 20
21
P 1 N E W Y O R K F O C U S 2 0 2 1
(US$1.8m in the UK)
UHNWIs living inNew York
US$4.4m
7,743
0
100
200
300
400
500
Feb21
Jan21
Dec20
Nov20
Oct20
Sep20
Aug20
Jul20
Jun20
May20
Apr20
Mar20
Feb20
Jan20
1 2 3 4 5
New
Yor
k7,7
43
Lond
on
6,6
11
Los
Ang
eles
5,5
07
Toky
o5
,23
5
Ho
ng K
ong
SA
R5,
04
2
about the New York market
New York is home to more UHNWIs than any other city(UHNWI (US$30 mn+)
Manhattan Condos: Signed contracts up 55% in February 2021 year-on-year
How much do youneed to join the top 1% in the US?
Currency matters The one-year discount in Manhattan property values takingaccount of price and currency changes in the year to31 March 2021
-5.1%
£ €US$
-8.1%
-13%
Source: Knight Frank Research Source: Knight Frank Wealth Sizing Model
Source: Knight Frank Wealth Sizing Model
Source: Miller Samuel/Douglas Elliman
1
The US remains the world’s number one wealth hub
There are now 180,060 UHNWIs in the US, accounting for 35% of the global total….and New York is home to more UHNWIs than any other city worldwide (7,743). US wealth advisors were amongst the most optimistic globally with 58% citing an increase in their clients’ wealth and a further 42% seeing their wealth remain stable in 2020.
2
New York and London tie for first place in Knight Frank’s City Wealth Index
When it comes to where UHNWIs want to live, work and do business, New York and London are level-pegging at the top of the rankings. New York leads the investment category due to the high number of top global firms headquartered in the city as well as strong domestic investment, whilst London excels in terms of inward investment from overseas.
Knight Frank’s annual flagship publication, The Wealth Report 2021, is packed with data and insight on how wealth is influencing property markets globally. A new series of focus reports delves deeper into the data to explore what the findings mean for some of our key cities.
In this first edition, we assess the importance of New York to the world’s wealthy, how its prime market is faring against the backdrop of a global pandemic and draw on the findings of The Attitudes Survey which sits at the heart of The Wealth Report to gauge where US ultra-high-net-worth individuals (UHNWIs) think future opportunities lie.
10 things you need to know about the New York market
What does The Wealth Report 2021 tells us about who lives, works and invests in the city and how do perspectives on property investment in the US differ to those globally?
New York Focus 2021
t h e g l o b a l p e rs p e c t i v e o n p r i m e p ro p e rt y & i n v e stm e n t2 0 2 1 — 1 5 T H E D I T I O N
New
Yor
k Fo
cus
2021
The
Wea
lth R
epor
t 202
1
LO N D O N A N D U K P R I C E F O R E CA ST – 2 0 2 1 TO 2 0 2 5
The stamp duty holiday and the
furlough scheme extentions in the
Budget in March have changed the
landscape for the housing market
in 2021, and we have revised our
forecasts as a result.
We expect UK house prices to
increase by 5% in 2021, rising from a
forecast of zero at the start of this year.
The strength of key market indicators
in the first months of this year meant
that an upwards revision was likely
even before last month's Budget.
We now expect price growth in the
UK to outperform Greater London as
the impact of the tapered stamp duty
holiday extension drives demand in
lower-value markets more consistently
through to the end of September.
Our forecasts for prime outer
London and prime regional markets
have remained largely unchanged as
both areas continue to benefit from a
drive for more space and greenery.
However, continued uncertainty
around the relaxation of international
travel restrictions means we have
revised our 2021 forecast for prime
central London down to 2% from 3%.
Furthermore, when international
buyers return there is now an
additonal 2% stamp duty surcharge
in place. With no price growth due to
the absence of international buyers
in recent months, the surcharge has
effectively been priced in, although
a period of price discovery will take
place when international buyers
return in greater numbers.
Chris Druce
Senior Research Analyst
+44 20 7861 5102
knig
htfra
nk.c
om/r
esea
rch
There were 137 super-prime tenancies
(£5,000+/week) agreed in London last
year, an 11% decline on the previous
year (154).
However, there was a marked
increase between the first and second
half of the year due to the impact of
Covid-19. In total, 87 super-prime
tenancies were agreed between July
and December, the second most active
such period in the last seven years,
LonRes data shows.
It underlines how demand has
not been dented by the pandemic,
according to Tom Smith, head of
super-prime lettings at Knight Frank.
“A big driver in recent years has
been the rates of stamp duty in
the sales market and it is still a big
motivation for tenants,” said Tom.
“That rationale is still there and will
arguably grow with the extra 2%
surcharge that overseas buyers will
have to pay from April.”
There were 15 tenancies agreed in
first two months of 2021, which is the
quietest start to the year in five years,
due to the impact of international
travel restrictions.
“Some people went away for
Christmas and decided not to come
back for the re-opening of schools in
March,” said Tom. “Easter is not very
far away and people didn’t want to
quarantine twice in quick succession.
So, there are still children learning
remotely but after Easter that pent-up
demand will release.”
London Super-Prime Lettings InsightSpring 2021
The search for space Shortage of supply
Post-Easter surge in demand
There has also been an uptick
in interest from US tenants in
recent months due to the change
of administration, said Tom. "It
hasn't come through in the number
of tenancies yet, but I detect rising
interest from the US as questions grow
over the tax landscape for high-net
worth individuals there."
One issue prospective tenants
may face is a supply shortage, as
figure 4 shows. A fall in listings in the
final quarter of last year was partly
attributable to a second national
lockdown in November but the
growing strength of the super-prime
sales market was another factor, as
more owners decided to sell rather
than let their properties. Supply
should increase to some degree in
coming weeks as lockdown restrictions
are lifted, said Tom.
“We are now having conversations
with owners who say they would be
open to either a sale or a letting and
some strong offers are coming through
in the sales market now,” said Tom.
The lack of supply is more of
an issue in locations like Chelsea,
Notting Hill and St Johns Wood, in
particular properties with gardens
and close to a good school. The
relative lack of properties in the NW
postcode underlines this (figure 4).
“I think tenants are still prepared
to rent without outdoor space,” said
Tom. “People are not necessarily
planning for future lockdowns now.
What some are doing is splitting their
portfolio between London and the
Country and are therefore happier to
forgo some outdoor space in London.”
1 London super-prime lettings volumes and achieved rental values (quarterly)
n Total tenancies agreed n Average weekly achieved rent (£) n Maximum achieved weekly rent (£)
Source: Knight Frank Research / LonRes
0
10
20
30
40
50
60
£0
£10,000
£20,000
£30,000
£40,000
£50,000
£60,000
2014 2015 2016 2017 2018 2019 2020