Embed Size (px)
Citation preview

LONDON BOROUGH OF TOWER HAMLETS
ANNUAL FINANCIAL REPORT 2016-17

ANNUAL FINANCIAL REPORT 2016-17
CONTENTS
Page
Narrative Report
Overview by the Corporate Director of Resources 1
Review of the Year
The Statement of Accounts 2
The Accounting Statements 7
Movement in Reserves Statement 8
Comprehensive Income and Expenditure Statement 9
Balance Sheet 10
Cash Flow Statement 11
Notes to the Core Financial Statements
Statement of Accounting Policies 12
Housing Revenue Account 69
Statement of Movement on the Housing Revenue Account Balance 70 Notes to the Housing Revenue Account 71 Collection Fund 75
Pension Fund Accounts 78
Auditor’s Report 95
Statement of Responsibilities 100
Annual Governance Statement 101
Glossary and Abbreviations 115
Narrative Report
Overview by Zena Cooke Corporate Director of Resources
I am pleased to introduce Tower Hamlets Council’s Statement of Accounts for 2016/17, which reports our financial results for the year.
The accounts have been compiled in accordance with International Financial Reporting Standards, the Code of Practice on Local Authority Accounting in the United Kingdom 2016/17, and the Service Reporting Code of Practice. These constitute “proper accounting practice” with which councils must comply by statute. The Council also produces a summary of the accounts, which is less detailed than the full statement. This has been produced following consultation with stakeholders and is available from the Council’s website at www.towerhamlets.gov.uk
Although the UK economy has shown signs of improvement, on-going reductions in main stream government grant funding and a continuing upward trend in the demand for key front line services in adult social care, children’s services and housing have collectively created a challenging financial environment for the Council.
Through sound financial management the Council’s spend for the year is in line with the revenue budget with a slight underspend of £0.7million. The Council reviewed its reserves and has agreed to earmark reserves for key priorities. This included the transfer of general fund balances for priorities such as the New Civic Centre and IT and Transformation programmes.
After these transfers, the Council’s general fund balance is £31.7m. This is considered adequate reserve balance for the stable financial management of the Council considering the challenges it faces in the coming years.
This solid financial base has helped to underpin the delivery of the Council’s key objectives, namely: improving the condition of social housing; increasing the supply of affordable social housing (particularly family sized housing); maintaining the provision of services for young people; delivering programmes of skills development, employment and enterprise activity; maintaining support to vulnerable adults; minimising the impact on resident household budgets and; protecting investment in activity that promotes community safety.
Key achievements in 2016/17 include:
• Delivering over 1,000 affordable homes, including stock which arefamily sized for social rent
• Placed over 2,200 households in new accommodation• Increasing educational attainment at early years, key stage 2, GCSE
and A Level• Over ¼ million people attended community events organised in the
Borough• Over 6,000 children participated in the holiday childcare scheme• Provision of over 4.9 million free school meals to school children in the
borough
1

• Nearly 80,000 meals provided to older residents • Over 1,400 tonnes of waste collected each week • Making our borough greener, including a programme of tree planting in
streets, parks and open spaces. Many of the key policy objectives have been delivered in conjunction with the Council’s strategic partners including; the Police, NHS Tower Hamlets, Jobcentre Plus and the Voluntary and Community sector (VCS). This joined up approach to the provision of services for our residents is fundamental to improving the outcomes for service users and is overseen by the Local Strategic Partnership Executive. The Council has continued to invest in its infrastructure with nearly £82 million spent on its capital programme. The main areas of investment were in housing and schools, with £43.9 million of improvement works spent through the housing capital programme and £11.4 million spent on school improvements. During 2016/17, the Government appointed Commissioners completed their review work as they were satisfied that governance processes had improved following the implementation of improvement plans delivery of quality services that are valued by residents. Looking forward the Council will continue to face significant financial challenges. The Medium Term Financial Plan agreed by Full Council in March 2017 includes a £58m million savings programme in the years to 2020. This forms the basis of a balanced budget over the next three years, Major external challenges include the potential impact of government welfare reforms and changes to the way in which local authority services are funded. The impact of Brexit on the Borough is still to be quantified. The Council is currently reviewing the Medium Term Financial Plan with a view to developing longer term strategies to deliver savings. Whilst the strength of the Council’s balance sheet will enable it to effectively manage those risks in the short term, over the longer term there will need to be a further, more fundamental review of the way in which local services are delivered. Review of the Year Revenue Income and Expenditure The Council’s expenditure is reported in line with the Directorate structure in place as at the 31st March. Overall, the Council’s Directorate spend was underspent by £0.73 million against the General Fund budget of £361.984 after the planned transfer to earmarked reserves. The HRA account showed an additional surplus of some £9.1 million against budget, this was mainly due to a void property levy of £8.4m not being payable.
2

The Council’s gross expenditure on services, excluding accounting adjustments, was £1.2 billion (£1.4 billion in 2015/16). An analysis by directorate is shown in the following diagram. Note that these expenditure figures are per the Council’s management accounts spend and do not include the effect of technical accounting entries that appear in the Comprehensive Income and Expenditure Account.
Revenue Funding Government grants and subsidies continue to be the main sources of revenue funding (£0.75 billion). The main specific grant continues to be the Dedicated Schools Grant which can only be used to fund the education services and is largely ‘passported’ directly to the schools. An analysis of all the funding sources is shown in the diagram below.
46%
14%
11%
6%
23% 0%
Analysis of Gross Revenue Expenditure by Service Area
Childrens £546m
Health, Adults and Communities £164.3m
Place £134.3m
Housing Revenue Account £64.2m
Housing Benefits £271m
Central Services & Corporate Costs £0.02m
Total Gross Revenue Expenditure = £1,179.8m
3

Capital Investment The Council has continued to make considerable capital investment in its capital assets. The following table sets out the broad categories of investment during the year with the main areas of spending being on housing and schools. .
Investment shown as being in ‘non-Council assets’ includes £3.2 million of expenditure on schools not owned by the Council and £3.3 million of expenditure on leaseholder properties.
6%10%
10%
7%
26%
24%
6%
11%
Analysis of Revenue Funding Sources
Revenue Support Grant £68.7m
NNDR £117.9m
Other Government Grant Funding £114.5m
Council Tax £78.0m
Schools Grant Funding £300.7m
Housing Benefits Subsidy £269m
HRA Rents £71m
Fees and Charges £126.9m
Total Gross Revenue Funding = £1,146.7m
53.7%
13.9%
12.3%
4.6%
15.5%
Analysis of Capital Expenditure
Council Housing £43.9m
Schools £11.4m
Other Council Assets £10.1m
Infrastructure Assets £3.7m
Non Council Assets £12.7m
Total Capital Expenditure = £81.8m
4

The table below shows the sources of funding for the capital programme. The majority of this funding was from capital grants and contributions. In addition, £25.6 million was also used from earmarked reserves which were set aside for capital investment.
Borrowing At the year end the Council had outstanding borrowings of £86.3 million (£88.2 million 2015/16). This was reduced by PWLB loans that matured during the year. Pensions The Council offers retirement pensions to its staff under a statutory scheme and also makes contributions on their behalf. Although the pension benefits are not payable until employees retire, the Council has a commitment to make the payments and must account for them in the year in which the future entitlements are earned. This commitment is compared with the pension fund assets (investments) and the net amount is included in the accounts as the Council’s pension net surplus or liability. At the end of 2016/17 there was a net liability of £619 million (£516 million 2015/16). Although this sum has a significant impact on the net worth of the Council as shown in its Balance Sheet the deficit will be addressed by increased contributions to the scheme in future years. These increased contributions have been reflected in the Council’s Medium Term Financial Plan. Though pension investments increased in value by around £250m in the year, the IAS19 deficit increased as at 31 March 2017 compared to the value reported at 31 March 2016. This is principally due to the impact of financial
38.6%
2.6%17.8%
9.7%
31.3%
Analysis of Capital Financing
Capital Grants and Contributions £31.7m
Borrowing £2.1m
Major Repairs Reserve £14.5m
Capital Receipts £7.9m
Revenue budgets and reserves £25.6m
Total Capital Financing = £81.8m
5
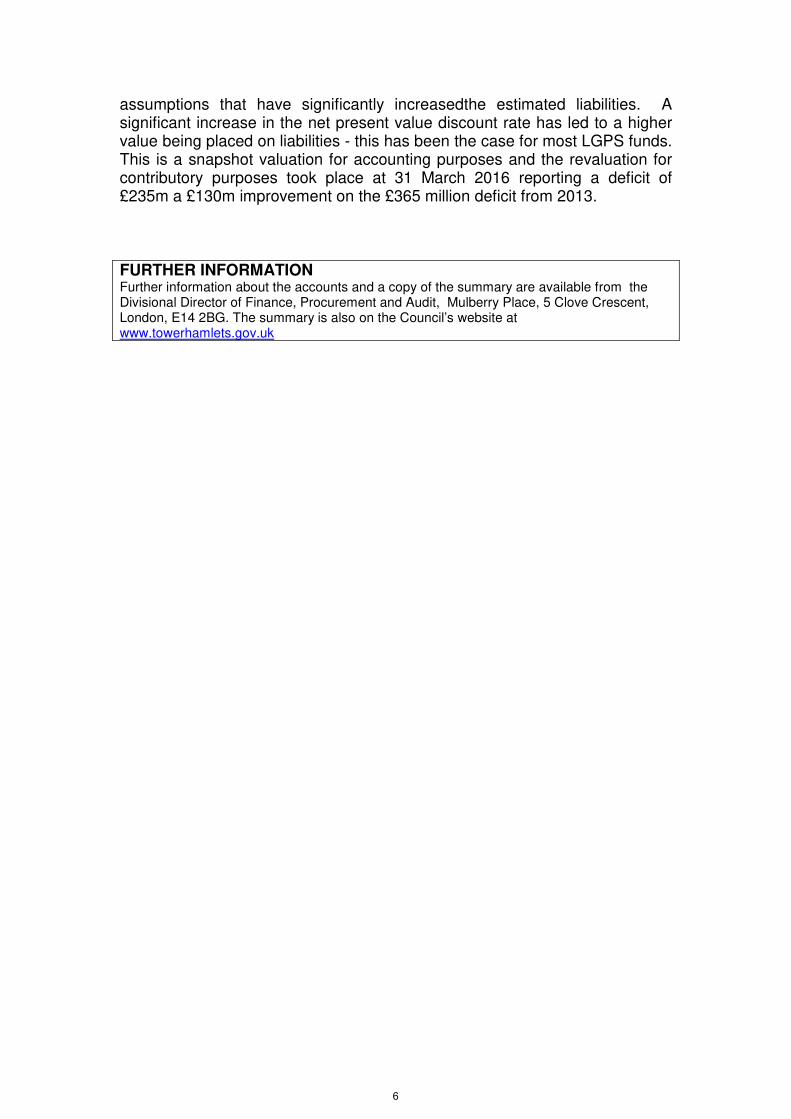
assumptions that have significantly increasedthe estimated liabilities. A significant increase in the net present value discount rate has led to a higher value being placed on liabilities - this has been the case for most LGPS funds. This is a snapshot valuation for accounting purposes and the revaluation for contributory purposes took place at 31 March 2016 reporting a deficit of £235m a £130m improvement on the £365 million deficit from 2013. FURTHER INFORMATION Further information about the accounts and a copy of the summary are available from the Divisional Director of Finance, Procurement and Audit, Mulberry Place, 5 Clove Crescent, London, E14 2BG. The summary is also on the Council’s website at www.towerhamlets.gov.uk
6

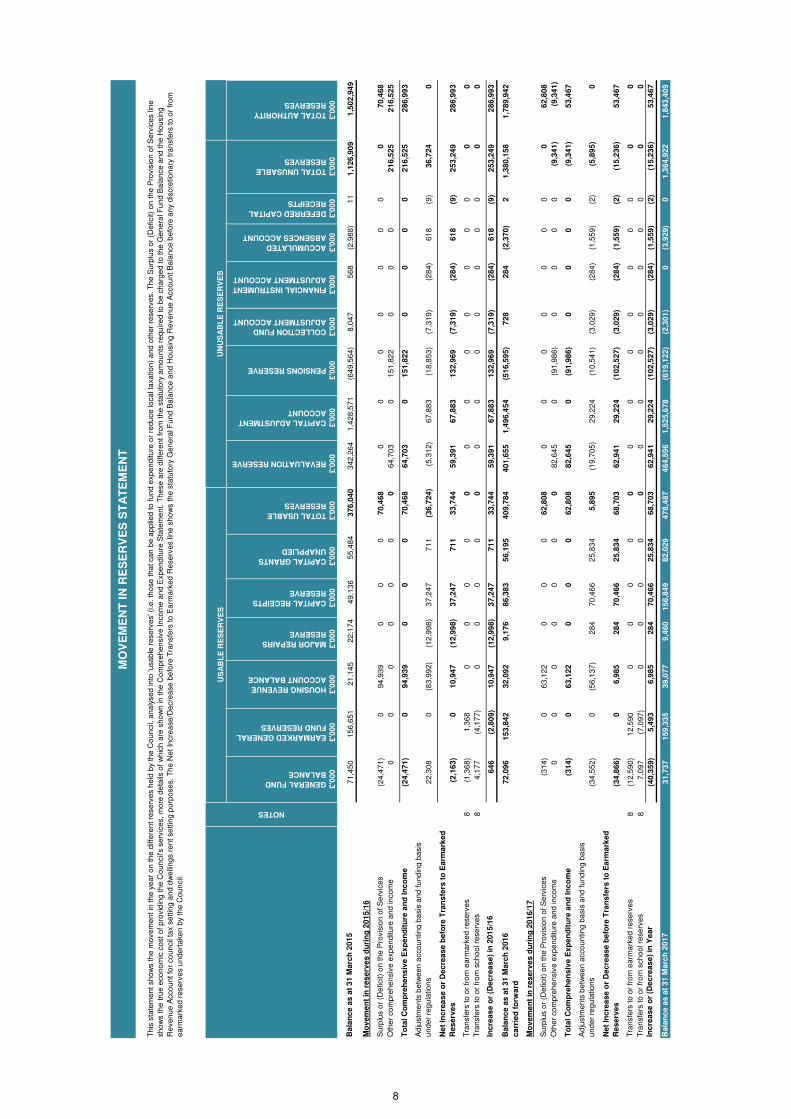
THE ACCOUNTING STATEMENTS These comprise: The Statement of Accounting Policies on which the figures in the accounts are based. The Core Financial Statements: The Movement in Reserves Statement, as well as showing reserve movements during the year, it also splits reserves between 'usable reserves' (i.e. those that can be applied to fund expenditure or reduce local taxation) and other reserves. The Surplus or (Deficit) on the Provision of Services line shows the true economic cost of providing the Council's services, more details of which are shown in the Comprehensive Income and Expenditure Statement. The Comprehensive Income and Expenditure Account which reports the net cost for the year of all the functions for which the Council is responsible and demonstrates how the cost has been financed from general Government grants and income from local taxpayers. It brings together income and expenditure relating to all the Council’s functions in three distinct sections, each divided by a sub-total, to give the net deficit or surplus for the year. The Balance Sheet which shows the Council’s financial position at the year-end - its balances and reserves and its long-term indebtedness, and the fixed and net current assets employed in its operational activities together with summarised information on the fixed assets held. The Cash Flow Statement which summarises the inflows and outflows of cash arising from transactions with third parties for revenue and capital purposes. Cash is defined as cash in hand and deposits repayable on demand less overdrafts repayable on demand. Notes to the Core Financial Statements The Housing Revenue Account (HRA) which reflects a statutory obligation to maintain a revenue account for local authority housing provision in accordance with Part 6 of the Local Government and Housing Act 1989, and details the credit and debit items required to be taken into account in determining the surplus or deficit on the HRA for the year. It is accompanied by the Statement of Movement on the HRA Balance and appropriate Notes. The Collection Fund which shows the transactions of the Council in relation to non-domestic rates and Council Tax and illustrates the way these have been distributed between Tower Hamlets Council and the Greater London Authority. It reflects the statutory requirement for billing authorities such as the Council to maintain a separate account. The Pension Fund Accounts which provide information about the financial position, performance and the financial adaptability of the statutory pension fund. They show the results for the fund for the year and the disposition of its assets at the period end. We try to produce the statements in a form that is understandable to most stakeholders. However, they include some technical terms which are explained in the Glossary.
7
GENERAL FUND
BALANCE
EARMARKED GENERAL
FUND RESERVES
HOUSING REVENUE
ACCOUNT BALANCE
MAJOR REPAIRS
RESERVE
CAPITAL RECEIPTS
RESERVE
CAPITAL GRANTS
UNAPPLIED
TOTAL USABLE
RESERVES
REVALUATION RESERVE
CAPITAL ADJUSTMENT
ACCOUNT
PENSIONS RESERVE
COLLECTION FUND
ADJUSTMENT ACCOUNT
FINANCIAL INSTRUMENT
ADJUSTMENT ACCOUNT
ACCUMULATED
ABSENCES ACCOUNT
DEFERRED CAPITAL
RECEIPTS
TOTAL UNUSABLE
RESERVES
TOTAL AUTHORITY
RESERVES
£'0
00
£'0
00
£'0
00
£'0
00
£'0
00
£'0
00
£'0
00
£'0
00
£'0
00
£'0
00
£'0
00
£'0
00
£'0
00
£'0
00
£'0
00
£'0
00
Ba
lan
ce
as
at
31
Ma
rch
20
15
71
,45
01
56
,65
12
1,1
45
22
,17
44
9,1
36
55
,48
43
76
,04
03
42
,26
41
,42
8,5
71
(64
9,5
64
)8
,04
75
68
(2,9
88
)1
11
,12
6,9
09
1,5
02
,94
9
Mo
ve
me
nt
in r
es
erv
es
du
rin
g 2
01
5/1
6
Su
rplu
s o
r (D
efic
it) o
n th
e P
rovis
ion
of S
erv
ice
s
(24
,47
1)
09
4,9
39
00
07
0,4
68
00
00
00
00
70
,46
8
Oth
er
co
mp
reh
en
siv
e e
xp
en
ditu
re a
nd
inco
me
00
00
00
06
4,7
03
01
51
,82
20
00
21
6,5
25
21
6,5
25
To
tal C
om
pre
he
ns
ive
Ex
pe
nd
itu
re a
nd
In
co
me
(24
,47
1)
09
4,9
39
00
07
0,4
68
64
,70
30
15
1,8
22
00
00
21
6,5
25
28
6,9
93
Ad
justm
en
ts b
etw
ee
n a
cco
un
ting
ba
sis
an
d fu
nd
ing
ba
sis
un
de
r re
gu
latio
ns
22
,30
80
(83
,99
2)
(12
,99
8)
37
,24
77
11
(36
,72
4)
(5,3
12
)6
7,8
83
(18
,85
3)
(7,3
19
)(2
84
)6
18
(9)
36
,72
40
Ne
t In
cre
as
e o
r D
ec
rea
se
be
fore
Tra
ns
fers
to
Ea
rma
rke
d
Re
se
rve
s(2
,16
3)
01
0,9
47
(12
,99
8)
37
,24
77
11
33
,74
45
9,3
91
67
,88
31
32
,96
9(7
,31
9)
(28
4)
61
8(9
)2
53
,24
92
86
,99
3
Tra
nsfe
rs to
or
fro
m e
arm
ark
ed
re
se
rve
s8
(1,3
68
)1
,36
80
00
00
00
00
00
00
0
Tra
nsfe
rs to
or
fro
m s
ch
oo
l re
se
rve
s8
4,1
77
(4,1
77
)0
00
00
00
00
00
00
0
Inc
rea
se
or
(De
cre
as
e)
in 2
01
5/1
66
46
(2,8
09
)1
0,9
47
(12
,99
8)
37
,24
77
11
33
,74
45
9,3
91
67
,88
31
32
,96
9(7
,31
9)
(28
4)
61
8(9
)2
53
,24
92
86
,99
3
Ba
lan
ce
as
at
31
Ma
rch
20
16
72
,09
61
53
,84
23
2,0
92
9,1
76
86
,38
35
6,1
95
40
9,7
84
40
1,6
55
1,4
96
,45
4(5
16
,59
5)
72
82
84
(2,3
70
)2
1,3
80
,15
81
,78
9,9
42
ca
rrie
d f
orw
ard
Mo
ve
me
nt
in r
es
erv
es
du
rin
g 2
01
6/1
7
Su
rplu
s o
r (D
efic
it) o
n th
e P
rovis
ion
of S
erv
ice
s
(31
4)
06
3,1
22
00
06
2,8
08
00
00
00
00
62
,80
8
Oth
er
co
mp
reh
en
siv
e e
xp
en
ditu
re a
nd
inco
me
00
00
00
08
2,6
45
0(9
1,9
86
)0
00
0(9
,34
1)
(9,3
41
)
To
tal C
om
pre
he
ns
ive
Ex
pe
nd
itu
re a
nd
In
co
me
(31
4)
06
3,1
22
00
06
2,8
08
82
,64
50
(91
,98
6)
00
00
(9,3
41
)5
3,4
67
Ad
justm
en
ts b
etw
ee
n a
cco
un
ting
ba
sis
an
d fu
nd
ing
ba
sis
un
de
r re
gu
latio
ns
(34
,55
2)
0(5
6,1
37
)2
84
70
,46
62
5,8
34
5,8
95
(19
,70
5)
29
,22
4(1
0,5
41
)(3
,02
9)
(28
4)
(1,5
59
)(2
)(5
,89
5)
0
Ne
t In
cre
as
e o
r D
ec
rea
se
be
fore
Tra
ns
fers
to
Ea
rma
rke
d
Re
se
rve
s(3
4,8
66
)0
6,9
85
28
47
0,4
66
25
,83
46
8,7
03
62
,94
12
9,2
24
(10
2,5
27
)(3
,02
9)
(28
4)
(1,5
59
)(2
)(1
5,2
36
)5
3,4
67
Tra
nsfe
rs to
or
fro
m e
arm
ark
ed
re
se
rve
s8
(12
,59
0)
12
,59
00
00
00
00
00
00
00
0
Tra
nsfe
rs to
or
fro
m s
ch
oo
l re
se
rve
s8
7,0
97
(7,0
97
)0
00
00
00
00
00
00
0In
cre
as
e o
r (D
ec
rea
se
) in
Ye
ar
(40
,35
9)
5,4
93
6,9
85
28
47
0,4
66
25
,83
46
8,7
03
62
,94
12
9,2
24
(10
2,5
27
)(3
,02
9)
(28
4)
(1,5
59
)(2
)(1
5,2
36
)5
3,4
67
Ba
lan
ce
as
at
31
Ma
rch
20
17
31
,73
71
59
,33
53
9,0
77
9,4
60
15
6,8
49
82
,02
94
78
,48
74
64
,59
61
,52
5,6
78
(61
9,1
22
)(2
,30
1)
0(3
,92
9)
01
,36
4,9
22
1,8
43
,40
9
MO
VE
ME
NT
IN
RE
SE
RV
ES
ST
AT
EM
EN
T
Th
is s
tate
me
nt sh
ow
s th
e m
ove
me
nt in
th
e y
ea
r o
n th
e d
iffe
ren
t re
se
rve
s h
eld
by
the
Co
un
cil,
an
aly
se
d in
to 'u
sa
ble
re
se
rve
s' (
i.e. th
ose
th
at ca
n b
e a
pp
lied
to
fu
nd
exp
en
ditu
re o
r re
du
ce
loca
l ta
xa
tion
) a
nd
oth
er
rese
rve
s. T
he
Su
rplu
s o
r (D
efic
it) o
n th
e P
rovis
ion
of S
erv
ice
s li
ne
sh
ow
s th
e tru
e e
co
no
mic
co
st o
f p
rovid
ing
th
e C
ou
ncil'
s s
erv
ice
s, m
ore
de
tails
of w
hic
h a
re s
ho
wn
in th
e C
om
pre
he
nsiv
e In
co
me
an
d E
xp
en
ditu
re S
tate
me
nt. T
he
se
are
diff
ere
nt fr
om
th
e s
tatu
tory
am
ou
nts
re
qu
ire
d to
be
ch
arg
ed
to
th
e G
en
era
l Fu
nd
Ba
lan
ce
an
d th
e H
ou
sin
g
Re
ve
nu
e A
cco
un
t fo
r co
un
cil
tax s
ettin
g a
nd
dw
elli
ng
s r
en
t se
ttin
g p
urp
ose
s. T
he
Ne
t In
cre
ase
/De
cre
ase
be
fore
Tra
nsfe
rs to
Ea
rma
rke
d R
ese
rve
s li
ne
sh
ow
s th
e s
tatu
tory
Ge
ne
ral F
un
d B
ala
nce
an
d H
ou
sin
g R
eve
nu
e A
cco
un
t B
ala
nce
be
fore
an
y d
iscre
tion
ary
tra
nsfe
rs to
or
fro
m
ea
rma
rke
d r
ese
rve
s u
nd
ert
ake
n b
y th
e C
ou
ncil.
NOTES
US
AB
LE
RE
SE
RV
ES
UN
US
AB
LE
RE
SE
RV
ES
8
Gross Gross Net Gross Gross Net
Expenditure Income Expenditure Expenditure Income Expenditure
£'000 £'000 £'000 £'000 £'000 £'000
Continuing Operations
578,410 465,940 112,470 Children´s Services 554,767 439,884 114,883
163,120 66,549 96,571 Health, Adults and Communities 168,107 64,494 103,613
144,775 79,340 65,435 Place 141,027 74,304 66,723
13,940 1,132 12,808 Governance 12,256 2,473 9,783
33,985 92,177 (58,192) Local Authority Housing (Housing Revenue Account) 64,209 91,545 (27,336)
303,443 281,975 21,468 Resources 294,998 275,378 19,620
12,520 2,419 10,101 Corporate Cost and Central Items 14,388 745 13,643
1,250,193 989,532 260,661 NET COST OF SERVICES 1,249,752 948,823 300,929
(13,150) Other Operating Expenditure 9 (38,985)
26,783 Financing and Investment Income and Expenditure 10 26,422
(344,762) Taxation and Non-Specific Grant Income 11 (351,174)
(70,468) (SURPLUS) OR DEFICIT ON THE PROVISION OF SERVICES (62,808)
Other Comprehensive Income and Expenditure
(64,703) (Surplus)/Deficit on revaluation of non-current assets (82,645)
(151,822) Actuarial (gains) or losses on pension assets and liabilities 91,986
(216,525) OTHER COMPREHENSIVE INCOME AND EXPENDITURE 9,341
(286,993) TOTAL COMPREHENSIVE INCOME AND EXPENDITURE (53,467)
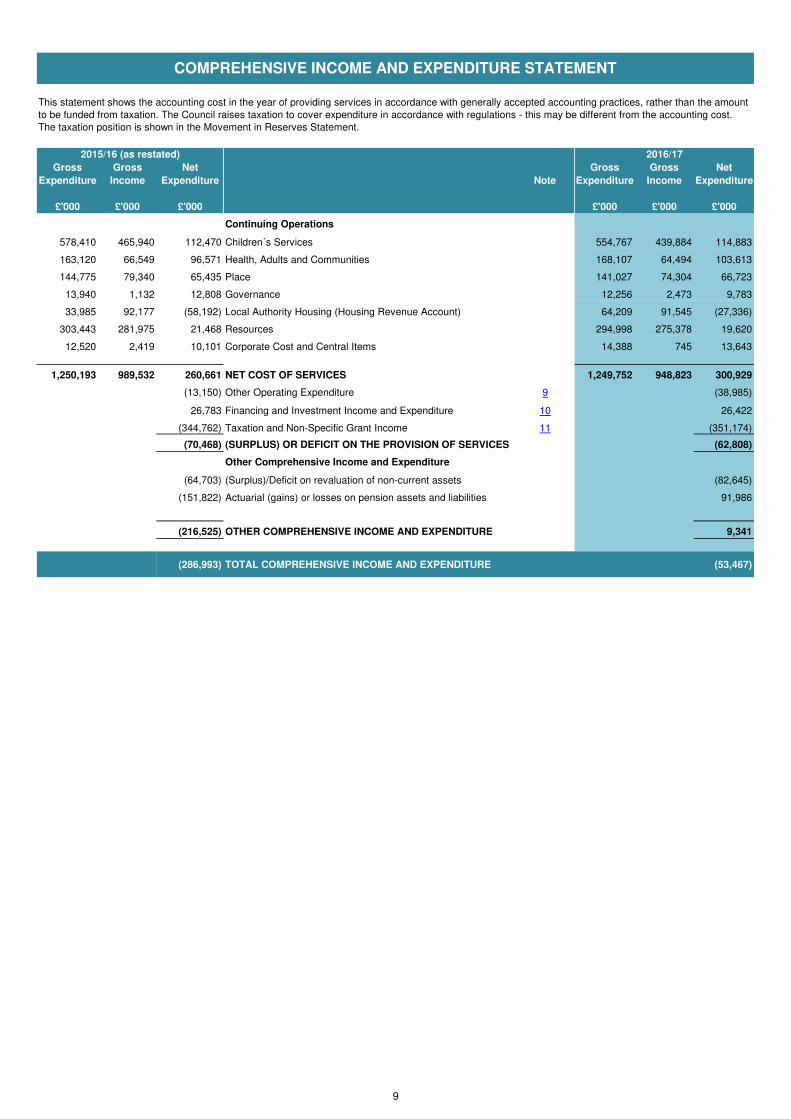
COMPREHENSIVE INCOME AND EXPENDITURE STATEMENT
This statement shows the accounting cost in the year of providing services in accordance with generally accepted accounting practices, rather than the amount
to be funded from taxation. The Council raises taxation to cover expenditure in accordance with regulations - this may be different from the accounting cost.
The taxation position is shown in the Movement in Reserves Statement.
2015/16 (as restated) 2016/17
Note
9
31 March Notes 31 March
2016 2017
£'000 £'000
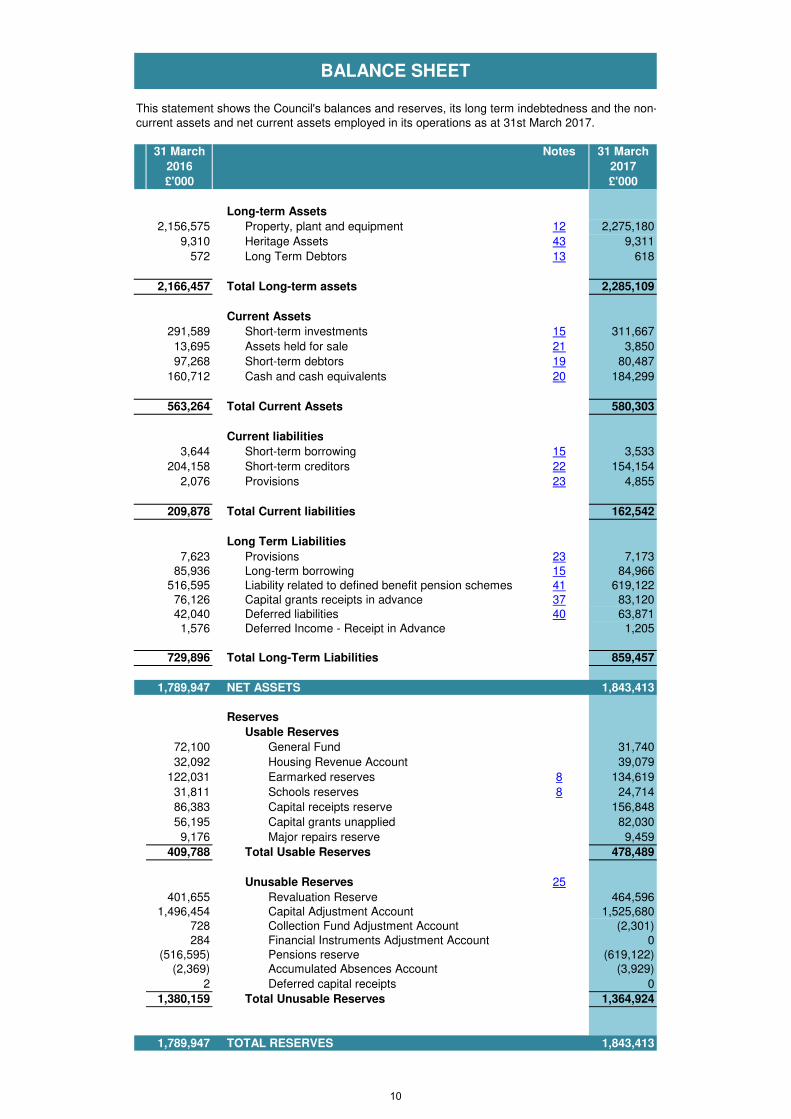
Long-term Assets
2,156,575 Property, plant and equipment 12 2,275,180
9,310 Heritage Assets 43 9,311
572 Long Term Debtors 13 618
2,166,457 Total Long-term assets 2,285,109
Current Assets
291,589 Short-term investments 15 311,667
13,695 Assets held for sale 21 3,850
97,268 Short-term debtors 19 80,487
160,712 Cash and cash equivalents 20 184,299
563,264 Total Current Assets 580,303
Current liabilities
3,644 Short-term borrowing 15 3,533
204,158 Short-term creditors 22 154,154
2,076 Provisions 23 4,855
209,878 Total Current liabilities 162,542
Long Term Liabilities
7,623 Provisions 23 7,173
85,936 Long-term borrowing 15 84,966
516,595 Liability related to defined benefit pension schemes 41 619,122
76,126 Capital grants receipts in advance 37 83,120
42,040 Deferred liabilities 40 63,871
1,576 Deferred Income - Receipt in Advance 1,205
729,896 Total Long-Term Liabilities 859,457
1,789,947 NET ASSETS 1,843,413
Reserves
Usable Reserves
72,100 General Fund 31,740
32,092 Housing Revenue Account 39,079
122,031 Earmarked reserves 8 134,619
31,811 Schools reserves 8 24,714
86,383 Capital receipts reserve 156,848
56,195 Capital grants unapplied 82,030
9,176 Major repairs reserve 9,459
409,788 Total Usable Reserves 478,489
Unusable Reserves 25
401,655 Revaluation Reserve 464,596
1,496,454 Capital Adjustment Account 1,525,680
728 Collection Fund Adjustment Account (2,301)
284 Financial Instruments Adjustment Account 0
(516,595) Pensions reserve (619,122)
(2,369) Accumulated Absences Account (3,929)
2 Deferred capital receipts 0
1,380,159 Total Unusable Reserves 1,364,924
1,789,947 TOTAL RESERVES 1,843,413
BALANCE SHEET
This statement shows the Council's balances and reserves, its long term indebtedness and the non-
current assets and net current assets employed in its operations as at 31st March 2017.
10

2015/16 Notes 2016/17
£'000 £'000
70,468 Net surplus or (deficit) on the provision of services 62,808
52,405 Adjustments to net surplus or deficit on the provision of services for non cash movements 26A 44,145
(55,854)
Adjustments for items included in the net surplus or deficit on the provision of services that
are investing and financing activities 26A (92,215)
67,019 Net cash flows from Operating Activities 14,738
(105,756) Investing Activities 27 9,777
(2,907) Financing Activities 28 (928)
(41,645) Net increase or decrease in cash and cash equivalents 23,587
202,357 Cash and cash equivalents at the beginning of the reporting period 160,712160,712 Cash and cash equivalents at the end of the reporting period 20 184,299
CASH FLOW STATEMENT
The Cash Flow Statement shows the changes in cash and cash equivalents of the authority during the reporting period. The
statement shows how the authority generates and uses cash and cash equivalents by classifying cash flows as operating, investing
and financing activities. The amount of net cash flows arising from operating activities is a key indicator of the extent to which the
operations of the authority are funded by way of taxation and grant income or from the recipients of services provided by the
authority. Investing activities represent the extent to which cash outflows have been made for resources which are intended to
contribute to the authority’s future service delivery. Cash flows arising from financing activities are useful in predicting claims on
future cash flows by providers of capital (i.e. borrowing) to the authority.
11

1. Accounting Policies ….
1. General Principles
The Statement of Accounts summarises the Council’s transactions for the 2016/17 financial year and its position at the year-end of 31st March 2017. The Council is required to prepare an annual Statement of Accounts by the Accounts and Audit Regulations 2015 which require the document to be prepared in accordance with proper accounting practices.
These practices primarily comprise the Code of Practice on Local Authority Accounting in the United Kingdom 2016/17 and the Service Reporting Code of Practice (SeRCOP) 2016/17, supported by International Financial Reporting Standards (IFRS) and statutory guidance issued under section 21(2) of the Local Government Act 2003.
The accounting convention adopted in the Statement of Accounts is principally historical cost, modified by the revaluation of certain categories of long-term assets and financial instruments.
This is to ensure that the Statement of Accounts gives a true and fair view of the financial position of the Council for the year ending 31st March 2017 and to ensure it is compliant with relevant statutory accounting requirements issued by the International Accounting Standards Board (IASB). Expenditure and income are reported in accordance with a total cost basis of accounting. Gross total cost includes all expenditure attributable to the service/activity, including employee costs, expenditure relating to premises and transport, supplies and services, third party payments, transfer payments, support services and depreciation. No categories of income are considered to be abatements of expenditure, and movements to and from reserves are excluded from total cost.
The accounting concepts of ‘materiality’, ‘accruals’, ‘going concern’ and ‘primacy of legislative requirements’ have been considered in the application of accounting policies. In this regard the:
• Materiality concept means that information is included where the information is ofsuch significance as to justify its inclusion.
• Accruals concept requires the non-cash effects of transactions to be included in thefinancial statement for the year in which they occur, not in the period in which thecash is paid or received.
• Going concern concept assumes that the Council will continue in operationalexistence for the foreseeable future
• Primacy of Legislation - local authorities derive their power from statute and theirfinancial and accounting framework is closely controlled by legislation. Where there isconflict between a legal requirement and an accounting standard, the legalrequirement will take precedence.
2. Accruals of Income and Expenditure
Activity is accounted for in the year that it takes place, not simply when cash payments are made or received. In particular:
• Revenue from the sale of goods is recognised when the Council transfers thesignificant risks and rewards of ownership to the purchaser and it is probable thateconomic benefits or service potential associated with the transaction will flow to theCouncil.
• Revenue from the provision of services is recognised when the Council can measurereliably the percentage of completion of the transaction and it is probable thateconomic benefits or service potential associated with the transaction will flow to theCouncil. This includes the accounting for fees, charges and rents due from
12

customers; these are accounted for as income at the date the Council provides the relevant goods or services.
• Supplies are recorded as expenditure when they are consumed – where there is a gap between the date supplies are received and their consumption; they are carried as inventories on the Balance Sheet if material.
• Expenses in relation to services received (including services provided by employees) are recorded as expenditure when the services are received rather than when payments are made.
• Interest receivable on investments and payable on borrowings is accounted for respectively as income and expenditure on the basis of the effective interest rate for the relevant financial instrument rather than the cash flows fixed or determined by the contract.
• Where revenue and expenditure have been recognised but cash has not been received or paid, a debtor or creditor for the relevant amount is recorded in the Balance Sheet. Where debts may not be settled, the balance of debtors is written down and a charge made to revenue for the income that might not be collected.
• Exceptionally, income in respect of adults in residential care under the National Assistance Act 1948 is accounted for on a cash basis, although the amount involved is not material to the presentation of the accounts.
• The Council operates a de minimis of £10,000 below which items of income and expenditure are not required to be accrued.
3. Cash and Cash Equivalents Cash is represented by cash in hand and deposits with financial institutions repayable without penalty on notice. Cash equivalents are investments that mature no more than three months or less from the date of acquisition and that are readily convertible to known amounts of cash with insignificant risk of change in value. In the Cash Flow Statement, cash and cash equivalents are shown net of bank overdrafts that are repayable on demand within the short-term and form an integral part of the Council’s cash management. 4. Exceptional Items When items of income and expense are material, their nature and amount is disclosed separately, either on the face of the Comprehensive Income and Expenditure Statement or in the notes to the accounts, depending on how significant the items are to an understanding of the Council’s financial performance. 5. Prior Period Adjustments, Changes in Accounting Policies and
Estimates and Errors
Prior period adjustments may arise as a result of a change in accounting policies or to correct a material error. Changes in accounting estimates are accounted for prospectively, i.e. in the current and future years affected by the change and do not give rise to a prior period adjustment. Changes in accounting policies are only made when required by proper accounting practices or the change provides more reliable or relevant information about the effect of transactions, other events and conditions on the Council’s financial position or financial performance. Where a change is made, it is applied retrospectively (unless stated otherwise or not material) by adjusting opening balances and comparative amounts for the prior period as if the new policy had always been applied.
13

6. Accounting Standards not yet adopted Under the Code of Practice on Local Authority Accounting in the United Kingdom 2016/17 (the Code), the Council is required to disclose information setting out the impact of an accounting change required by a new accounting standard that has been issued but not yet adopted by the code. There are no new standards in the 2017/18 code which are likely to have a material effect on upon the accounts.
7. Charges to Revenue for Long-term Assets
Service revenue accounts, support services and trading accounts are debited with the following amounts to record the cost of holding long-term assets during the year:
• Depreciation attributable to the assets used by the relevant service
• Revaluation losses (general fall in prices across the board) and impairment losses (fall in price specific to an asset) on tangible non-current assets used by the service where there are no accumulated gains in the Revaluation Reserve against which the losses can be written off
The Council is not required to raise Council Tax to fund depreciation, revaluation, impairment losses or amortisations. However, it is required to make an annual provision from revenue to contribute towards the reduction in its overall borrowing requirement (equal to an amount calculated on a prudent basis determined by the Council in accordance with statutory guidance). Depreciation, revaluation and impairment losses and amortisations are therefore replaced by the contribution in the General Fund Balance (Minimum Revenue Provision), by way of an adjusting transaction with the Capital Adjustment Account in the Movement in Reserves Statement for the difference between the two. The Minimum Revenue Provision (MRP) relating to non-housing assets has been calculated for 2016/17 in accordance with Option 1 (the Regulatory Method) set out in the statutory guidance on MRP. 8. Employee Benefits a. Benefits Payable during Employment Short-term employee benefits are those due to be settled within 12 months of the year-end. They include such benefits as wages and salaries, paid annual leave and paid sick leave, bonuses and non-monetary benefits for current employees and are recognised as an expense for services in the year in which employees render service to the Council. If material, an accrual is made for the cost of holiday entitlements (or any form of leave, e.g. time off in lieu) earned by employees but not taken before the year-end which employees can carry forward into the next financial year. The accrual is made at the wage and salary rates applicable in the following accounting year, being the period in which the employee takes the benefit. The accrual is charged to Surplus or Deficit on the Provision of Services, but then reversed out through the Movement in Reserves Statement so that holiday benefits are charged to revenue in the financial year in which the holiday absence occurs. b. Termination Benefits Termination benefits are amounts payable as a result of a decision by the Council to terminate an officer’s employment before the normal retirement date or an officer’s decision to accept voluntary redundancy and are charged on an accruals basis to the appropriate
14

service line in the Comprehensive Income and Expenditure Statement when the Council is demonstrably committed to the termination of the employment of an officer or group of officers or making an offer to encourage voluntary redundancy and a reliable estimate can be made of the cost. Where termination benefits involve the enhancement of pensions, statutory provisions require the General Fund balance to be charged with the amount payable by the Council to the pension fund or pensioner in the year, not the amount calculated according to the relevant accounting standards. In the Movement in Reserves Statement, appropriations are required to and from the Pensions Reserve to remove the notional debits and credits for pension enhancement termination benefits and replace them with debits for the cash paid to the pension fund and pensioners and any such amounts payable but unpaid at the year-end.
c. Post-Employment Benefits
Employees of the Council are members of three separate pension schemes:
• The Local Government Pension Scheme, administered by the Council
• The Local Government Pension Scheme, administered by the London Pensions Fund Authority
• The Teachers’ Pension Scheme, administered by Capita Teachers’ Pensions on behalf of the Department for Education (DfE).
All the schemes provide defined benefits to members (retirement lump sums and pensions), earned as employees work for the Council. However, the arrangements for the Teachers’ scheme mean that liabilities for these benefits cannot be identified to the Council. The scheme is therefore accounted for as if it were a defined contributions scheme – no liability for future payments of benefits is recognised in the Balance Sheet. The Children’s and Education Services line in the Comprehensive Income and Expenditure Statement is charged with the employer’s contributions payable to Teachers’ Pensions in the year. The DfE set the teacher’s pension contribution rate.
The Local Government Pension Scheme
The Local Government scheme is a defined benefits scheme. The Council’s wholly owned subsidiary, Tower Hamlets Homes Limited (THH), is a Local Government Pension Scheme Employer in accordance with the Local Government Pension Scheme (Amendment) Regulations 2002. The Council has indemnified THH in respect of all liabilities that have arisen or may arise from its pension obligations.
The liabilities of the pension scheme attributable to the Council are included in the Balance Sheet on an actuarial basis using the projected unit method – an assessment of the future payments that will be made in relation to retirement benefits earned to date by employees, based on assumptions about mortality rates, employee turnover rates, etc. and estimates of projected earnings for current employees.
Council liabilities are discounted to their value at current prices, using a discount rate derived from corporate bond yields (as measured by the yield on iBoxxSterling Corporates Index, AA over 15 years) as at 31st March 2017.
Assets attributable to the Council are included in the Balance Sheet at their fair value. Quoted or unitised securities are valued at current bid price; unquoted securities on the basis of professional estimate; and property at market value.
The change in the net pension liability is analysed into seven components:
15

• current service cost – the increase in liabilities as a result of years of service earned this year, allocated in the Comprehensive Income and Expenditure Statement to the revenue accounts of services for which the employees worked.
• past service cost – the increase in liabilities arising from current year decisions the effect of which relates to years of service earned in earlier years, debited to the Surplus or Deficit on the Provision of Services as part of Non Distributed Costs within the Comprehensive Income and Expenditure Statement.
• interest cost – the expected increase in the present value of liabilities during the year as they move one year closer to being paid, debited to Financing and Investment Income and Expenditure in the Comprehensive Income and Expenditure Statement.
• expected rate of return (on assets) – the annual investment return on the fund assets attributable to the Council, based on an average of the expected long-term return, credited to Financing and Investment Income and Expenditure in the Comprehensive Income and Expenditure Statement.
• gains and losses on settlements and curtailments – the result of actions to relieve the Council of liabilities or events that reduce the expected future service or accrual of benefits of employees, credited or debited to the Surplus or Deficit on the Provision of Services as part of Non Distributed Costs within the Comprehensive Income and Expenditure Statement.
• actuarial gains and losses – changes in the net pensions liability that arise because events have not coincided with assumptions made at the last actuarial valuation or because the actuaries have updated their assumptions, debited to the Pensions Reserve.
• contributions paid to the pension funds – cash paid as employer’s contributions to the pension funds.
In relation to retirement benefits, statutory provisions require the General Fund balance to be charged with the amount payable by the Council to the pension fund in the year, not the amount calculated according to the relevant accounting standards. In the Movement of Reserves Statement, this means that there are appropriations to and from the Pensions Reserve to remove the notional debits and credits for retirement benefits and replace them with debits for the cash paid to the pension funds and any amounts payable to the funds but unpaid at the year-end. The negative balance that arises on the Pensions Reserve thereby measures the beneficial impact to the General Fund of being required to account for retirement benefits on the basis of cash flows rather than as benefits are earned by employees as calculated under IAS19.
Discretionary Benefits
The Council also has restricted powers to make discretionary awards of retirement benefits in the event of early retirements. Any liabilities estimated to arise as a result of an award to any member of staff (including teachers) are accrued in the year of the decision to make the award and accounted for using the same policies as are applied to the Local Government Pension Scheme. 9. Events after the Balance Sheet date Events after the Balance Sheet date are those events, both favourable and unfavourable, that occur between the end of the reporting period and the date when the Statement of Accounts is authorised for issue. Two types of events can be identified: a. those that provide evidence of conditions that existed at the end of the reporting
period – the Statement of Accounts is adjusted to reflect such material events
16

b. those that are indicative of conditions that arose after the reporting period – the Statement of Accounts is not adjusted to reflect such events, but where a category of events would have a material effect, disclosure is made in the notes of the nature of the events and their estimated financial effect, or a statement that an estimate cannot be reliably made.
Events after the Balance Sheet date are reflected up to the date when the Statement of Accounts is authorised for issue. 10. Financial Instruments
a. Financial Liabilities
Financial liabilities are recognised on the Balance Sheet when the Council becomes a party to the contractual provisions of a financial instrument and are initially measured at fair value and are carried at their amortised cost. Annual charges to the Financing and Investment Income and Expenditure line in the Comprehensive Income and Expenditure Statement for interest payable are based on the carrying amount of the liability, multiplied by the effective rate of interest for the instrument. The effective interest rate is the rate that exactly discounts estimated future cash payments over the life of the instrument to the amount at which it was originally recognised. For most of the borrowings that the Council has, this means that the amount presented in the Balance Sheet is the outstanding principal repayable (plus accrued interest); and interest charged to the Comprehensive Income and Expenditure Statement is the amount payable for the year according to the loan agreement. Gains and losses on the repurchase or early settlement of borrowing are credited and debited to the Financing and Investment Income and Expenditure line in the Comprehensive Income and Expenditure Statement in the year of repurchase/settlement. However, where repurchase has taken place as part of a restructuring of the loan portfolio that involves the modification or exchange of existing instruments, the premium or discount is respectively deducted from or added to the amortised cost of the new or modified loan and the write-down to the Comprehensive Income and Expenditure Statement is spread over the life of the loan by an adjustment to the effective interest rate. Where premia and discounts have been charged to the Comprehensive Income and Expenditure Statement, regulations allow the impact on the General Fund Balance to be spread over future years. The Council has a policy of spreading the gain or loss over the term that was remaining on the loan against which the premium was payable or discount receivable when it was repaid. The reconciliation of amounts charged to the Comprehensive Income and Expenditure Statement to the net charge required against the General Fund Balance is managed by a transfer to or from the Financial Instruments Adjustment Account in the Movement in Reserves Statement.
b. Financial Assets
Financial assets are classified into two types:
• loans and receivables – assets that have fixed or determinable payments but are not quoted in an active market
• available-for-sale assets – assets that have a quoted market price and/or do not have fixed or determinable payments
17

Loans and Receivables
Loans and receivables are recognised on the Balance Sheet when the Council becomes a party to the contractual provisions of a financial instrument and are initially measured at fair value and carried at their amortised cost. Annual credits to the Financing and Investment line in the Comprehensive Income and Expenditure Statement for interest receivable are based on the carrying amount of the asset multiplied by the effective rate of interest for the instrument. For most of the loans that the Council has made, this means that the amount presented in the Balance Sheet is the outstanding principal receivable (plus accrued interest) and interest credited to the Comprehensive Income and Expenditure Statement is the amount receivable for the year in the loan agreement.
Where assets are identified as impaired because of a likelihood arising from a past event that payments due under the contract will not be made, the asset is written down and a charge made to the relevant service (for receivables specific to that service) or the Financing and Investment Income and Expenditure line in the Comprehensive Income and Expenditure Statement.
Any gains and losses that arise on the derecognition of the asset are credited / debited to the Financing and Investment Income and Expenditure line in the Comprehensive Income and Expenditure Statement. 11. Foreign Currency Translation
Where the Council has entered into a transaction denominated in a foreign currency, the transaction is converted into sterling at the exchange rate applicable on the date the transaction was effective. 12. Government Grants and Contributions
Whether paid on account, by instalments or in arrears, government grants and third party contributions and donations are recognised as due to the Council when there is reasonable assurance that:
• the Council will comply with the conditions attached to the payments, and
• the grants or contributions will be received. Amounts recognised as due to the Council are not credited to the Comprehensive Income and Expenditure Statement until conditions attached to the grant or contribution have been satisfied. Conditions are stipulations that specify that the future economic benefits or service potential embodied in the asset acquired using the grant or contribution are required to be consumed by the recipient as specified, or future economic benefits or service potential must be returned to the transferor. Monies advanced as grants and contributions for which conditions have not been satisfied are carried in the Balance Sheet as creditors (revenue grants) or Capital Grants Receipts in Advance account (capital grants). When conditions are satisfied, the grant or contribution is credited to the relevant service line (attributable revenue grants and contributions) or Taxation and Non-Specific Grant Income (non-ring-fenced revenue grants and all capital grants) in the Comprehensive Income and Expenditure Statement. Unapplied revenue grants without repayment conditions are shown as earmarked reserves. Where capital grants are credited to the Comprehensive Income and Expenditure Statement, they are reversed out of the General Fund Balance in the Movement in Reserves Statement. Where the grant has yet to be used to finance capital expenditure, it is posted to the Capital Grants Unapplied reserve. Where it has been applied, it is posted to the Capital Adjustment
18

Account. Amounts in the Capital Grants Unapplied reserve are transferred to the Capital Adjustment Account once they have been applied to fund capital expenditure. 13. Heritage assets The Code of Practice on Local Authority Accounting in the United Kingdom requires material heritage assets held by the Council to be disclosed. The Council does not actively acquire or dispose of heritage assets as part of its normal day-to-day business. Where the Council holds heritage assets, these have usually been donated. Where the Council does acquire or dispose of a heritage asset, treatment of each asset will be considered on a case by case basis. The value of heritage assets currently held in the Balance Sheet as part of long-term assets is £9.3 million at 31 March 2017. This valuation is based on valuations for art and museum collections where the asset has a material value. The council holds information on the value of an item of material value within the art collection (one painting), two public sculptures and civic regalia (value held for insurance purposes). Valuations are made by what is considered to be the most appropriate/relevant method in terms of the specific heritage asset without being overly onerous. For example this may include reference to sale proceeds of similar items by same artist to demonstrate values are clearly under materiality values. There is no requirement for valuations to be carried out or certified by external valuers nor is there any prescribed minimum period between valuations. The Council has four heritage assets that have material values, these values are reviewed periodically, however the real value would only be established upon sale as valuations on assets of this nature are subjective. Where the Council has information on the cost or value of a heritage asset the Council includes that value in its balance sheet. Where this information is not available and the historical cost information cannot be obtained the asset is excluded from the balance sheet. Heritage assets (other than operational heritage assets) shall normally be included in the balance sheet at their current value where material. The Council has a materiality threshold of £50,000 for considering heritage assets for valuation. Where it is not practical to obtain a valuation at a reasonable cost heritage assets are valued at cost where known. Most heritage assets owned by the council have an historical interest to the Borough, but would not have material market value. Operational heritage assets (i.e. those that in addition to being held for their heritage characteristics are also used for other activities or provide other services) are accounted for as operational assets and valued in the same way as other assets of that type. Depreciation is not required on heritage assets with indefinite lives. However where there is evidence of physical deterioration to a material heritage asset or doubts arise to its authenticity the value of the asset would be reviewed. 14. Interests in Companies and Other Entities The Council has an interest in Tower Hamlets Homes which is a wholly owned subsidiary of the Council but is not considered material and does not require group accounts to be prepared (a summary of this interest can be found in note 44). The Council, as part of the Government’s Building Schools for the Future (BSF) initiative, also has a ten percent shareholding in the delivery company Tower Hamlets Local Education Partnership Ltd. but has determined that the interest is outside the group accounts requirement. In the Council’s
19

own single-entity accounts, interests in companies and other entities are recorded as financial assets at cost, less any provision for losses.
15. Inventories and Long Term Contracts Inventories (stocks) are included in the Balance Sheet at the lower of cost and net realisable value. Where material, the council would select a valuation process appropriate for the asset. Long term contracts are accounted for on the basis of charging the Surplus or Deficit on the Provision of Services with the value of works and services received under the contract during the financial year.
16. Leases
Leases are classified as finance leases where the terms of the lease transfer substantially all the risks and rewards incidental to ownership of the property, plant or equipment from the lessor to the lessee. All other leases are classified as operating leases.
The Council as a Lessee
The Council has reviewed its leases in detail and has determined that, except for PFI agreements, there are a small number of finance leases with immaterial asset values, so the agreement costs are charged to revenue. For finance leases (including the PFI assets), the accounting policy is as follows;
a. Finance Leases The Council accounts for leases as finance leases when substantially all the risks and rewards relating to the leased property transfer to the Council. Rentals payable are apportioned between:
• a charge for the acquisition of the interest in the property, plant or equipment (recognised as a liability in the Balance Sheet at the start of the lease, matched with a tangible property, plant or equipment asset – the liability is written down as the rent becomes payable), and
• A finance charge (debited to the Financing and Investment Income and Expenditure line in the Comprehensive Income and Expenditure Statement).
Property, Plant and Equipment recognised under finance leases is accounted for using the policies applied generally to such assets, subject to depreciation being charged over the lease term if this is shorter than the asset’s estimated useful life (where ownership of the asset does not transfer to the council at the end of the lease period).
b. Operating Leases
Leases that do not meet the definition of finance leases as described above are accounted for as operating leases. Rentals payable are charged to the relevant service revenue account within the Comprehensive Income and Expenditure Statement on an equalised basis over the term of the lease, to reflect the economic benefits consumed over the life of the lease, irrespective of fluctuations in annual payments. The Council as a Lessor The council has some operating leases as a lessor; the accounting policy is as follows:
20
Operating Leases
Where the Council grants an operating lease over a property or an item of plant or equipment, the asset is retained in the Balance Sheet. Rental income is credited to the Other Operating Expenditure line in the Comprehensive Income and Expenditure Statement. Credits are made on a straight-line basis over the life of the lease, even if this does not match the pattern of payments (e.g. there is a premium paid at the commencement of the lease). Initial direct costs incurred in negotiating and arranging the lease are added to the carrying amount of the relevant asset and charged as an expense over the lease term on the same basis as rental income.
17. Overheads and Support Services
The costs of overheads and support services are charged to those services that benefit from the supply or service in accordance with the costing principles of the CIPFA Service Reporting Code of Practice 2016/17 (SeRCOP). The total absorption costing principle is used – the full cost of overheads and support services is shared between users in proportion to the benefits received.
18. Property, Plant and Equipment Assets that have physical substance and are held for use in the production or supply of goods or services, for rental to others, or for administrative purposes and that are expected to be used during more than one financial year are classified as Property, Plant and Equipment.
Recognition Expenditure on the acquisition, creation or enhancement of Property, Plant and Equipment is capitalised on an accruals basis, provided that it is probable that the future economic benefits or service potential associated with the item will flow to the Council and the cost of the item can be measured reliably. Expenditure that maintains but does not add to an asset’s potential to deliver future economic benefits or service potential (i.e. repairs and maintenance) is charged as an expense when it is incurred. The de minimus level above which expenditure on tangible property, plant and equipment assets is classified as capital is £50,000 except where the expenditure is financed by grants or contributions; or where lesser amounts on the same asset accumulate above that level.
Measurement Assets are initially measured at cost, comprising:
• the purchase price
• any costs attributable to bringing the asset to the location and condition necessary forit to be capable of operating in the manner intended by management
The Council does not capitalise borrowing costs incurred whilst assets are under construction. The cost of assets acquired other than by purchase is deemed to be its current value, unless the acquisition does not have commercial substance (i.e. it will not lead to a variation in the cash flows of the Council). In the latter case, where an asset is acquired via an exchange, the cost of the acquisition is the carrying amount of the asset given up by the Council.
Assets are then carried in the Balance Sheet using the following measurement bases:
• infrastructure, community assets and assets under construction – depreciatedhistorical cost.
• dwellings – current value, determined using the basis of existing use value for socialhousing (EUV-SH).
21

• All other assets – fair value, determined as the amount that would be paid for the asset in its existing use (existing use value – EUV). Where there is no market-based evidence of current value because of the specialist nature of an asset, depreciated replacement cost (DRC) is used as an estimate of current value. Where non-property assets that have short useful lives or low values (or both), depreciated historical cost basis is used as a proxy for current value – this is commonly used as a basis for valuing vehicles, plant and equipment.
Assets included in the Balance Sheet at current value are revalued sufficiently regularly to ensure that their carrying amount is not materially different from their current value at the year-end, but as a minimum every five years. Increases in valuations are matched by credits to the Revaluation Reserve to recognise unrealised gains. Gains are credited to the Comprehensive Income and Expenditure Statement where they arise from the reversal of a loss previously charged to a service. Where decreases in value are identified, they are accounted for by:
• Where there is a balance of revaluation gains for the asset in the Revaluation Reserve, the carrying amount of the asset is written down against that balance (up to the amount of the accumulated gains)
• Where there is no balance in the Revaluation Reserve or an insufficient balance, the carrying amount of the asset is written down against the relevant service line(s) in the Comprehensive Income and Expenditure Statement.
The Revaluation Reserve contains revaluation gains recognised since 1st April 2007 only, the date of its formal implementation. Gains arising before that date have been consolidated into the Capital Adjustment Account. Impairment Assets are assessed at each year-end as to whether there is any indication that an asset may be impaired. Where indications exist and any possible differences are estimated to be material, the recoverable amount of the asset is estimated and, where this is less than the carrying amount of the asset, an impairment loss is recognised for the shortfall. Where impairment losses are identified, they are accounted for by:
• Where there is a balance of revaluation gains for the asset in the Revaluation Reserve, the carrying amount of the asset is written down against that balance (up to the amount of the accumulated gains)
• Where there is no balance in the Revaluation Reserve or an insufficient balance, the carrying amount of the asset is written down against the relevant service line(s) in the Comprehensive Income and Expenditure Statement.
Where an impairment loss is reversed subsequently, the reversal is credited to the relevant service line(s) in the Comprehensive Income and Expenditure Statement, up to the amount of the original loss, adjusted for depreciation that would have been charged if the loss had not been recognised. Depreciation Depreciation is provided for on all Property, Plant and Equipment assets by the systematic allocation of their depreciable amounts over their useful lives. An exception is made for assets without a determinable finite useful life (i.e. freehold land and certain Community Assets) and assets that are not yet available for use (i.e. assets under construction). Deprecation is calculated on the following bases:
• dwellings - equivalent to the Major Repairs Allowance payable by the Government which has been used as an appropriate proxy for depreciation
• other buildings – straight-line allocation over the useful life of the property as estimated by the valuer
22

• vehicles, plant, furniture and equipment – a percentage of the value of each classof assets in the Balance Sheet, as advised by a suitably qualified officer. Forequipment, over five years
• infrastructure – straight-line allocation over 40 years
Revaluation gains are also depreciated, with an amount equal to the difference between current value depreciation charged on assets and the depreciation that would have been chargeable based on their historical cost being transferred each year from the Revaluation Reserve to the Capital Adjustment Account.
Where an item of Property, Plant and Equipment asset has major components whose cost is significant in relation to the total cost of the item, the components are depreciated separately if they have a materially different remaining life from the underlying asset.
Any assets with a depreciable value below £1 million are not considered material for containing separate components. Separate components will be considered in an asset with a value greater than £1 million if the component has a value of greater than 25% of the asset and the remaining life of the asset is materially different from the underlying asset.
Disposals and Non-Current Assets Held for Sale When it becomes probable that the carrying amount of an asset will be recovered principally through a sale transaction rather than through its continuing use, it is reclassified as an Asset Held for Sale. The asset is revalued immediately before reclassification and then carried at the lower of this amount and fair value less costs to sell. Where there is a subsequent decrease to fair value less costs to sell, the loss is posted to the Other Operating Expenditure line in the Comprehensive Income and Expenditure Statement. Gains in fair value are recognised only up to the amount of any previous losses recognised in the Surplus or Deficit on Provision of Services. Depreciation is not charged on Assets Held for Sale. If assets no longer meet the criteria to be classified as Assets Held for Sale, they are reclassified back to long-term assets and valued at the lower of their carrying amount before they were classified as held for sale; adjusted for depreciation, amortisation or revaluations that would have been recognised had they not been classified as Held for Sale, and their recoverable amount at the date of the decision not to sell. Assets that are to be abandoned or scrapped are not reclassified as Assets Held for Sale.
When an asset is disposed of or decommissioned, the carrying amount of the asset in the Balance Sheet (whether Property, Plant and Equipment or Assets Held for Sale) is written off to the Other Operating Expenditure line in the Comprehensive Income and Expenditure Statement as part of the gain or loss on disposal. Receipts from disposals (if any) are credited to the same line in the Comprehensive Income and Expenditure Statement also as part of the gain or loss on disposal (i.e. netted off against the carrying value of the asset at the time of disposal). Any revaluation gains accumulated for the asset in the Revaluation Reserve are transferred to the Capital Adjustment Account.
Amounts received for a disposal in excess of £10,000 are categorised as capital receipts. A proportion of receipts relating to housing disposals (75% for dwellings, 50% for land and other assets, net of statutory deductions and allowances) is payable to the Government. The balance of receipts is required to be credited to the Capital Receipts Reserve, and can then only be used for new capital investment or set aside to reduce the Council’s underlying need to borrow (the capital financing requirement). Receipts are appropriated to the Reserve from the General Fund Balance in the Movement in Reserves Statement.
The written-off value of disposals is not a charge against Council Tax, as the cost of long-term assets is fully provided for under separate arrangements for capital financing. Amounts are appropriated to the Capital Adjustment Account from the General Fund Balance in the Movement in Reserves Statement.
23

19. Private Finance Initiative (PFI) and Similar Contracts PFI contracts are agreements to receive services, where the responsibility for making available the property, plant and equipment long-term assets needed to provide services passes to the PFI contractor. As the Council is deemed to control the services that are provided under its PFI schemes, and as ownership of the property, plant and equipment will pass to the Council at the end of the contracts for no additional charge, the Council carries the assets used under the contracts on its Balance Sheet as part of Property, Plant and Equipment.The Council is party to two PFI contracts in respect of schools which terminate in 2027 and 2029. The original recognition of these long-term assets at current value (based on the cost to purchase the property, plant and equipment) was balanced by the recognition of a liability for amounts due to the scheme operator to pay for capital investment. Non-current assets recognised on the Balance Sheet are revalued and depreciated in the same way as property, plant and equipment owned by the Council. The amounts payable to the PFI operators each year are analysed into five elements:
• fair value of the services received during the year – debited to the relevant service in the Comprehensive Income and Expenditure Statement
• finance cost – an interest charge on the outstanding Balance Sheet liability, debited to the Financing and Investment Income and Expenditure line in the Comprehensive Income and Expenditure Statement
• contingent rent – increases in the amount to be paid for the property arising during the contract, debited to the Financing and Investment Income and Expenditure line in the Comprehensive Income and Expenditure Statement
• payment towards liability – applied to write down the Balance Sheet liability towards the PFI operator (the profile of write-downs is calculated using the same principles as for a finance lease).
• lifecycle replacement costs – recognised as long-term assets on the Balance Sheet if capital in nature
MRP policy for PFI schemes - a minimum revenue provision is charged based on a share of the charge paid within the above contracts - this represents repayment of the contract liability for the long-term assets within the contract. There is also a third PFI contract for the Barkantine Heat and Power scheme. This concession agreement is a user pay arrangement where the end user pays the operator for the combined heat and power (CHP) services rendered. The Council receives a profit share but pays no unitary charge for the service. As the Council does not pay for this scheme, there is no MRP chargeable.The assets of the CHP scheme are included on the council’s balance sheet with a deferred income balance, both of which are written down over the term of the contract.
20. Provisions, Contingent Liabilities and Contingent Assets
a. Provisions
Provisions are made where an event has taken place that gives the Council an obligation that probably requires settlement by a transfer of economic benefits or service potential and a reliable estimate can be made of the amount of the obligation. For instance, if the Council were to be involved in a court case that could eventually result in the making of a settlement or the payment of compensation.
24
Provisions are charged to the appropriate service revenue account in the year that the Council becomes aware of the obligation, based on the best estimate at the balance sheet date of the expenditure required to settle the obligation, taking into account relevant risks and uncertainties. When payments are eventually made, they are charged to the provision carried in the Balance Sheet. Estimated settlements are reviewed at the end of each financial year. Where it becomes more likely than not that a transfer of economic benefits will not be required (or a lower settlement than anticipated is made), the provision is reversed and credited back to the relevant service account.
Where some or all of the payment required to settle an obligation is expected to be met by another party (e.g. from an insurance claim), this is only recognised as income in the relevant revenue account if it is virtually certain that reimbursement will be received if the Council settles the obligation.
b. Contingent Liabilities A contingent liability arises where an event has taken place that gives the Council a possible obligation whose existence will only be confirmed by the occurrence or otherwise of uncertain future events not wholly within the control of the Council. Contingent liabilities also arise in circumstances where a provision would otherwise be made but either it is not probable that an outflow of resources will be required or the amount of the obligation cannot be measured reliably. Contingent liabilities are not recognised in the Balance Sheet but disclosed in note 30 to the accounts.
c. Contingent Assets A contingent asset arises where an event has taken place that gives the Council a possible asset whose existence will only be confirmed by the occurrence or otherwise of uncertain future events not wholly within the control of the Council. Contingent assets are not recognised in the Balance Sheet but disclosed in a note to the accounts where it is probable that there will be an inflow of economic benefits or service potential.
21. Reserves
The Council sets aside specific amounts as reserves for future policy purposes or to cover contingencies. Reserves are created by appropriating amounts out of the General Fund Balance in the Movement of Reserves Statement. When expenditure to be financed from a reserve is incurred it is charged to the relevant service revenue account in that year to score against the Surplus or Deficit on the Provision of Services in the Comprehensive Income and Expenditure Statement. The reserve is then appropriated back into the General Fund Balance statement so that there is no net charge against Council Tax for the expenditure.
Certain reserves are kept to manage the accounting processes for long-term assets, financial instruments, retirement and employment benefits and do not represent usable resources for the Council – these reserves are explained in the relevant policies.
The Council treats transfers from the insurance reserve as above the line income to services rather than below the line transfers between reserves. This is a deviation from the Accounting Code of Practice but does not have a material effect on the financial statements.
25
22. Revenue Expenditure Funded from Capital under Statute (REFCUS)
Expenditure incurred during the year that may be capitalised under statutory provisions but does not result in the creation of long-term assets has been charged as expenditure to the relevant service revenue account in the year. Where the Council has determined to meet the cost of this expenditure from existing capital resources or by borrowing, a transfer in the Movement of Reserves Statement from the General Fund Balance to the Capital Adjustment Account then reverses out the amounts charged so there is no impact on the level of Council Tax.
23. Fair value measurement
The authority measures some of its non-financial assets such as surplus assets and asset held for sale and some of its financial instruments such as equity shareholdings at fair value at each reporting date. Fair value is the price that would be received to sell an asset or paid to transfer a liability in an orderly transaction between market participants at the measurement date. The fair value measurement assumes that the transaction to sell the asset or transfer the liability takes place either:
a) in the principal market for the asset or liability, or
b) in the absence of a principal market, in the most advantageous market for the asset or liability.
The authority measures the fair value of an asset or liability using the assumptions that market participants would use when pricing the asset or liability, assuming that market participants act in their economic best interest.
When measuring the fair value of a non-financial asset, the authority takes into account a market participant’s ability to generate economic benefits by using the asset in its highest and best use or by selling it to another market participant that would use the asset in its highest and best use.
The authority uses valuation techniques that are appropriate in the circumstances and for which sufficient data is available, maximising the use of relevant observable inputs and minimising the use of unobservable inputs.
Inputs to the valuation techniques in respect of assets and liabilities for which fair value is measured or disclosed in the authority’s financial statements are categorised within the fair value hierarchy, as follows:
Level 1 – quoted prices (unadjusted) in active markets for identical assets or liabilities that the authority can access at the measurement date
Level 2 – inputs other than quoted prices included within Level 1 that are observable for the asset or liability, either directly or indirectly
Level 3 – unobservable inputs for the asset or liability.
24. Value added Tax (VAT)
VAT payable is included as an expense only to the extent that it is not recoverable from Her Majesty’s Revenue and Customs. VAT receivable is excluded from income. 25. Collection Fund The Council is required by statute to maintain a separate fund for the collection and distribution of amounts due in respect of Council Tax, Business Rate Supplements (BRS) and Non-Domestic Rates (NDR). This account receives income on behalf of the Council, Central Government and its other preceptor the Greater London Authority (GLA).
26

Collection Fund income for the year is the Council’s accrued income for the year and not the amount required to be transferred from the Collection Fund under regulation. The difference between the amount included in the Comprehensive Income and Expenditure Statement and the amount required by regulation to be credited to the General Fund is taken to the Collection Fund Adjustment Account and included within the Movement of Reserves Statement.
The cash collected by the Council from Council Tax, BRS & NDR debtors belongs proportionately to the billing authority, Central Government and the preceptors. This results in a debtor / creditor position between the Council, Central Government and preceptors for the difference between the cash collected from Council Tax, BRS & NDR debtors and the precept paid over during the year. The Balance Sheet includes the Council’s share of Council Tax & NNDR arrears and impairment for bad debts, Council Tax & NDR over payments and prepayments and the debtor/ creditor from the preceptors. The Council’s share of net cash collected from Council Tax & NDR debtors in the year is included within the Cash Flow Statement. The difference between the major preceptors’ share of net cash collected and amounts paid to the precepting authorities is included in the net cash-flows for financing activities. The amount included in the Council’s Balance Sheet is the amount of cash collected from NNDR taxpayers (less the amount retained in respect of a cost of collection allowance) that has not yet been paid to the Central Government & GLA or has been overpaid to the Central Government & GLA on the Balance Sheet date. There are a number of NDR appeals outstanding that date back to 2005. These are to be heard by the Government’s external Valuation Office. A provision has been raised based on an estimate of the income from a lower valuation 26. Carbon Reduction Commitment Scheme The Council is required to participate in the Carbon Reduction Commitment (CRC) Energy Efficiency Scheme. This scheme is currently in its second phase which commenced on 1 April 2014. The authority is required to purchase and surrender allowances, currently retrospectively, on the basis of emissions i.e. carbon dioxide produced as energy is used. As carbon dioxide is emitted (i.e. as energy is used), a liability and an expense are recognised. The liability will be discharged by surrendering allowances. The liability is measured at the best estimate of the expenditure required to meet the obligation, normally at the current market price of the number of allowances required to meet the liability at the reporting date. The cost to the Council is recognised and reported in the costs of the Council’s services and is apportioned to services on the basis of energy consumption.
27. Community Infrastructure Levy
The Authority has elected to charge a Community Infrastructure Levy (CIL). The levy will be charged on new builds (chargeable developments for the Authority) with appropriate planning consent. The Council charges for and collects the levy, which is a planning charge. The income from the levy will be used to fund a number of infrastructure projects (these include transport, flood defences and schools) to support the development of the area. CIL is received without outstanding conditions; it is therefore recognised at the commencement date of the chargeable development in the Comprehensive Income and Expenditure Statement in accordance with the accounting policy for government grants and contributions set out above. CIL charges will be largely used to fund capital expenditure. However, a small proportion of the charges may be used to fund revenue expenditure.
27

28. Schools
The Code of Practice on Local Authority Accounting in the United Kingdom confirms that the balance of control for local authority maintained schools (i.e. those categories of school identified in the School Standards and Framework Act 1998, as amended) lies with the local authority. The Code also stipulates that those schools’ assets, liabilities, reserves and cash flows are recognised in the local authority financial statements (and not the Group Accounts). Therefore schools’ transactions, cash flows and balances are recognised in each of the financial statements of the authority as if they were the transactions, cash flows and balances of the authority.
28

2
3
4
Current Year Items
5
The Statement of Accounts contains estimated figures that are based on assumptions made by the Council about the
future or events that are otherwise uncertain. Estimates are made taking into account historical experience, current
trends and other relevant factors. However, because balances cannot be determined with certainty, actual results could
be materially different from the assumptions and estimates.
The items in the Council's Balance Sheet at 31st March 2017 for which there is a significant risk of material adjustment
in the forthcoming financial year are as follows:
Property, Plant and Equipment - Assets are depreciated over useful lives that are dependent on assumptions about
the level of repairs and maintenance that will be incurred in relation to individual assets. The current economic climate
makes it uncertain that the Council will be able to sustain its current spending on repairs and maintenance, bringing
into doubt the useful lives assigned to assets.
Restated Accounting Statements
The Comprehensive Income and Expenditure Statement was restated to 2015/16 to record expenditure in line with the
Council Directorate structure as at 31st March 2017. The Expenditure and Funding Analysis is a new reporting
requirement for 2016/17 - comparatives for 2015/16 have also been included.
Assumptions Made About the Future and Other Major Sources of Estimation
Uncertainty
Valuations at 1st April 2016 and 31st March 2017 have been used to construct the balance sheet.
There are no financial post balance sheet events that are not mentioned elsewhere in these Accounts.
Material Items of Income and Expense
Actuarial gain on pension fund - there was a £102.0 million actuarial loss on the pension fund mainly due to an
decrease in the discount factor used to calculate the net present value of future pension payments.
Events After the Balance Sheet Date
Revaluation of HRA dwellings - The valuation of property, plant and equipment as at 1st April 2016 resulted in an
increase in the value of dwellings of £99.7m, of which £11.4m was credited to HRA gross expenditure as a reversal of
previous revaluation losses. The remaining £88.3 was credited to the revaluation reserve and is shown as part of other
comprehensive income and expenditure.
Pensions Liability - Estimation of the net liability to pay pensions depends on a number of complex judgements
relating to the discount rate used, the rate at which salaries are projected to increase, changes in retirement ages,
mortality rates and expected returns on pension fund investments. A firm of consulting actuaries is engaged to provide
the Council with expert advice about the assumptions to be applied.
The assumptions interact in complex ways within the IAS19 calculation basis. During 2016/17, the Council’s actuaries
advised that the net pensions liability had increased by over £100 million to £619 million mainly as a result of a higher
discount factor used to calculate the net present value of future pension payments. This is despite the value of the
pension fund increasing in value by over £200 million in the year due to rising investment values.
If the useful life of assets is reduced, depreciation increases and the carrying amount of the assets falls. It is estimated
that the annual depreciation charge for buildings would increase by approximately £1.3 million for every year that useful
lives had to be reduced.
Heritage Assets - In valuing material heritage assets, valuations have been obtained from independent Valuers where
practicable. Where a value has been given between a certain band, then the mid-point valuation is used. However,
because of their unique nature the value of heritage assets is difficult to predict. There is a risk that the value of
heritage assets is incorrectly stated, but this would only become apparent if the asset is sold. Most heritage items have
been given a nil value in the Accounts as their values are significantly below the materiality threshold - any risk is the
assets' value is understated.
NNDR Appeals - There are approximately 6,200 NNDR (Business Rates) appeals that are yet to be heard by the
Government's Valuation Tribunal. Of these 3,467 will not result in a reduction in rateable value and 1,936 are
considered speculative. Provision has been made for the remaining appeals.
29

6 Ex
pe
nd
itu
reA
dju
stm
en
tsN
et
Ex
pe
nd
itu
reA
dju
stm
en
tsN
et
Ch
arg
ea
ble
to
be
twe
en
E
xp
en
dit
ure
Ch
arg
ea
ble
to
be
twe
en
E
xp
en
dit
ure
GF
an
d H
RA
fu
nd
ing
an
d
in t
he
CIE
SG
F a
nd
HR
A
fun
din
g a
nd
in
th
e C
IES
ba
lan
ce
sa
cc
ou
nti
ng
ba
lan
ce
sa
cc
ou
nti
ng
ba
sis
ba
sis
£'0
00
£'0
00
£'0
00
£'0
00
£'0
00
£'0
00
10
3,5
32
8,9
38
11
2,4
70
Ch
ildre
n´s
Se
rvic
es
10
6,7
39
8,1
44
11
4,8
83
13
6,4
63
(39
,89
2)
96
,57
1H
ea
lth
, A
du
lts a
nd
Co
mm
un
itie
s1
36
,68
4(3
3,0
71
)1
03
,61
3
62
,02
73
,40
86
5,4
35
Pla
ce
68
,76
3(2
,04
0)
66
,72
3
11
,98
58
23
12
,80
8G
ove
rna
nce
10
,56
4(7
81
)9
,78
3
(10
,94
8)
(47
,24
4)
(58
,19
2)
Lo
ca
l A
uth
ori
ty H
ou
sin
g (
Ho
usin
g R
eve
nu
e A
cco
un
t)(6
,98
8)
(20
,34
8)
(27
,33
6)
17
,84
73
,62
12
1,4
68
Re
so
urc
es
19
,22
04
00
19
,62
0
(48
,97
4)
59
,07
51
0,1
01
Co
rpo
rate
Co
st
an
d C
en
tra
l It
em
s1
9,2
79
(5,6
36
)1
3,6
43
27
1,9
32
(11
,27
1)
26
0,6
61
NE
T C
OS
T O
F S
ER
VIC
ES
35
4,2
61
(53
,33
2)
30
0,9
29
(28
3,5
21
)(4
7,6
08
)(3
31
,12
9)
Oth
er
Inco
me
an
d E
xp
en
ditu
re(3
20
,88
8)
(42
,84
9)
(36
3,7
37
)
(11
,58
9)
(58
,87
9)
(70
,46
8)
(SU
RP
LU
S)
OR
DE
FIC
IT O
N T
HE
PR
OV
ISIO
N O
F S
ER
VIC
ES
33
,37
3(9
6,1
81
)(6
2,8
08
)
(92
,60
3)
Op
en
ing
Ge
ne
ral
Fu
nd
an
d H
RA
ba
lan
ce
s(1
04
,19
2)
(11
,58
9)
Le
ss D
eficit/(
Su
rplu
s)
on
Ge
ne
ral F
un
d a
nd
HR
A B
ala
nce
in
Ye
ar
33
,37
3
(10
4,1
92
)C
LO
SIN
G G
EN
ER
AL
FU
ND
AN
D H
RA
BA
LA
NC
ES
(70
,81
9)
Th
is s
tate
me
nt
sh
ow
s t
he
re
co
ncili
atio
n b
etw
ee
n t
he
ne
t e
xp
en
ditu
re in
th
e C
om
pre
he
nsiv
e I
nco
me
an
d E
xp
en
ditu
re A
cco
un
t a
nd
th
e e
xp
en
ditu
re c
ha
rge
ab
le t
o t
he
Ge
ne
ral F
un
d a
nd
Ho
usin
g R
eve
nu
e A
cco
un
t b
ala
nce
s.
20
15
/16
20
16
/17
EX
PE
ND
ITU
RE
AN
D F
UN
DIN
G A
NA
LY
SIS
30

6a A
dju
stm
en
tsT
ran
sfe
rsN
et
Ch
an
ge
Oth
er
To
tal
Ad
justm
en
tsT
ran
sfe
rsN
et
Ch
an
ge
Oth
er
To
tal
for
Cap
ital
to/f
rom
for
Pen
sio
ns
Ad
justm
en
tsA
dju
stm
en
tsfo
r C
ap
ital
to/f
rom
for
Pen
sio
ns
Ad
justm
en
tsA
dju
stm
en
ts
Pu
rpo
ses
Earm
ark
ed
Ad
justm
en
tsP
urp
oses
Earm
ark
ed
Ad
justm
en
ts
Reserv
es
Reserv
es
£'0
00
£'0
00
£'0
00
£'0
00
£'0
00
£'0
00
£'0
00
£'0
00
£'0
00
218
3,4
74
12,8
68
(7,6
22)
8,9
38
Child
ren´s
Serv
ices
298
1,0
47
9,4
48
(2,6
49)
8,1
44
01,2
16
1,8
07
(42,9
15)
(39,8
92)
Health,
Adults a
nd C
om
munitie
s0
2,2
24
1,7
87
(37,0
82)
(33,0
71)
714
(2,1
54)
4,0
01
847
3,4
08
Pla
ce
1,5
62
1,8
94
3,2
29
(8,7
25)
(2,0
40)
0375
(225)
673
823
Govern
ance
061
(722)
(120)
(781)
(44,1
98)
0(3
3)
(3,0
13)
(47,2
44)
Local A
uth
ority
Housin
g (
Housin
g R
evenue A
ccount)
(13,8
19)
0(3
,040)
(3,4
89)
(20,3
48)
(667)
3,1
49
789
351
3,6
21
Resourc
es
(494)
273
608
13
400
22,9
38
(8,7
11)
(20,8
63)
65,7
11
59,0
75
Corp
ora
te C
ost
and C
entr
al It
em
s18,9
85
(14,0
58)
(18,6
70)
8,1
07
(5,6
36)
(20,9
95)
(2,6
51)
(1,6
56)
14,0
31
(11,2
71)
NE
T C
OS
T O
F S
ER
VIC
ES
6,5
32
(8,5
59)
(7,3
60)
(43,9
45)
(53,3
32)
(63,8
29)
(7,8
41)
20,5
09
3,5
53
(47,6
08)
Oth
er
incom
e a
nd e
xpenditure
fro
m t
he E
xpenditure
and F
undin
g A
naly
sis
(90,9
61)
(16,5
10)
17,9
01
46,7
21
(42,8
49)
(84,8
24)
(10,4
92)
18,8
53
17,5
84
(58,8
79)
(84,4
29)
(25,0
69)
10,5
41
2,7
76
(96,1
81)
Ad
justm
en
ts f
or
Cap
ital
Pu
rpo
ses
Tra
nsfe
rs t
o/f
rom
Earm
ark
ed
Reserv
es
Net
Ch
an
ge f
or
Pen
sio
ns A
dju
stm
en
ts
Oth
er
Ad
justm
en
ts
NO
TE
TO
TH
E E
XP
EN
DIT
UR
E A
ND
FU
ND
ING
AN
AL
YS
IS
This
colu
mn inclu
des t
he f
ollo
win
g a
dju
stm
ents
:
Oth
er
diffe
rences b
etw
een a
mounts
debited/c
redited t
o t
he C
om
pre
hensiv
e I
ncom
e a
nd E
xpenditure
Sta
tem
ent
and a
mounts
paya
ble
/receiv
able
to b
e r
ecog
nis
ed u
nder
sta
tute
:
• O
ther
incom
e a
nd e
xpenditure
– a
dju
sts
for
capital dis
posals
with a
tra
nsfe
r of
incom
e o
n d
isposal of
assets
and t
he a
mounts
writt
en o
ff f
or
those a
ssets
and a
lso a
dju
sts
for
the s
hare
of
housin
g c
apital re
ceip
ts p
aid
to c
entr
al g
overn
ment
under
a
poolin
g a
rrang
em
ent.
Capital g
rants
are
adju
ste
d f
or
incom
e n
ot
charg
eable
under
genera
lly a
ccepte
d a
ccounting
pra
ctices.T
he T
axation a
nd N
on S
pecific
Gra
nt
Incom
e a
nd E
xpenditure
lin
e is c
redited w
ith c
apital g
rants
receiv
able
in t
he y
ear
without
conditio
ns o
r fo
r w
hic
h c
onditio
ns w
ere
satisfied in t
he y
ear.
This
colu
mn s
how
s t
he n
et
chang
e f
or
the r
em
oval of
pensio
n c
ontr
ibutions a
nd t
he a
dditio
n o
f IA
S 1
9 E
mplo
yee B
enefits
pensio
n r
ela
ted e
xpenditure
and incom
e:
•
Serv
ices -
this
repre
sents
the r
em
oval of
the e
mplo
yer
pensio
n c
ontr
ibutions m
ade b
y th
e a
uth
ority
as a
llow
ed b
y sta
tute
and t
he r
epla
cem
ent
with c
urr
ent
serv
ice c
osts
and p
ast
serv
ice c
osts
DIF
FE
RE
NC
E B
ET
WE
EN
SU
RP
LU
S O
R D
EF
ICIT
AN
D T
HE
CO
MP
RE
HE
NS
IVE
INC
OM
E A
ND
EX
PE
ND
ITU
RE
ST
AT
EM
EN
T S
UR
PL
US
OR
DE
FIC
IT O
N T
HE
PR
OV
ISIO
N O
F S
ER
VIC
ES
This
sta
tem
ent
show
s t
he a
dju
stm
ents
fro
m t
he n
et
charg
eable
am
ounts
to t
he G
enera
l F
und a
nd H
ousin
g R
evenue A
ccount
to a
rriv
e a
t th
e C
om
pre
hensiv
e I
ncom
e a
nd E
xpenditure
Sta
tem
ent
am
ounts
:
2015/1
6
2016/1
7
•
Oth
er
incom
e a
nd e
xpenditure
– t
his
colu
mn r
epre
sents
the d
iffere
nce b
etw
een w
hat
is c
harg
eable
under
sta
tuto
ry r
eg
ula
tions f
or
council
tax a
nd N
DR
that
was p
roje
cte
d t
o b
e r
eceiv
ed a
t th
e s
tart
of
the y
ear
and t
he incom
e r
ecog
nis
ed u
nder
genera
lly
accepte
d a
ccounting
pra
ctices in t
he C
ode.
This
is a
tim
ing
diffe
rence a
s a
ny
diffe
rence w
ill b
e b
roug
ht
forw
ard
in f
utu
re S
urp
luses o
r D
eficits o
n t
he C
olle
ction F
und.
This
colu
mn a
dju
sts
for
the a
pplic
ation o
f earm
ark
ed r
eserv
es a
gain
st
expenditure
and t
he t
ransfe
r of
any
bala
nces t
o e
arm
ark
ed r
eserv
es w
hic
h a
re n
ot
inclu
ded in t
he C
om
pre
hensiv
e I
ncom
e a
nd E
xpenditure
Sta
tem
ent
as t
hey
are
not
charg
eable
under
genera
lly a
ccepte
d a
ccounting
pra
ctices.
•
Oth
er
incom
e a
nd e
xpenditure
– t
he n
et
inte
rest
on t
he d
efined b
enefit
liabili
ty is c
harg
ed t
o F
inancin
g a
nd I
nvestm
ent
Incom
e a
nd E
xpenditure
.
• S
erv
ices –
depre
cia
tion a
nd im
pairm
ent
and r
evalu
ation g
ain
s a
nd losses a
re a
dded b
ack in a
s t
hese a
re n
ot
in t
he n
et
charg
eable
am
ounts
but
are
charg
eable
under
genera
lly a
ccepte
d a
ccounting
pra
ctices.
Capital expenditure
fin
anced b
y re
venue a
nd
sta
tuto
ry c
harg
es f
or
capital financin
g (
Min
imum
Revenue P
rovis
ion)
are
rem
oved a
s t
hese is n
ot
charg
eable
to t
he C
om
pre
hensiv
e I
ncom
e a
nd E
xpenditure
Sta
tem
ent
•
Serv
ices –
adju
stm
ents
in t
his
colu
mn inclu
de t
he t
imin
g d
iffe
rences f
or
pre
mia
and d
iscounts
; in
tere
st
payable
, in
tere
st
receiv
able
, le
vie
s a
nd t
radin
g a
ccount
surp
lus/d
eficit m
oved o
ut
of
serv
ice e
xpenditure
to b
e r
ecog
nis
ed a
s p
art
of
Oth
er
Incom
e
and E
xpenditure
within
the S
urp
lus o
r D
eficit o
n t
he P
rovis
ion o
f S
erv
ices;
recog
nis
ing
the a
ccru
al of
em
plo
yee a
nnual le
ave in t
he C
om
pre
hensiv
e I
ncom
e a
nd E
xpenditure
Sta
tem
ent;
als
o a
dju
sting
revenue g
rants
to inclu
de t
hose r
eceiv
able
without
conditio
ns o
r fo
r w
hic
h c
onditio
ns w
ere
satisfied t
hro
ug
hout
the y
ear.
31

7
GE
NE
RA
L F
UN
D
BA
LA
NC
E
EA
RM
AR
KE
D G
EN
ER
AL
FU
ND
RE
SE
RV
ES
*
HO
US
ING
RE
VE
NU
E
AC
CO
UN
T B
AL
AN
CE
MA
JO
R R
EP
AIR
S
RE
SE
RV
E
CA
PIT
AL
RE
CE
IPT
S
RE
SE
RV
E
CA
PIT
AL
GR
AN
TS
UN
AP
PL
IED
TO
TA
L U
SA
BL
E
RE
SE
RV
ES
TO
TA
L U
NU
SA
BL
E
RE
SE
RV
ES
TO
TA
L A
UT
HO
RIT
Y
RE
SE
RV
ES
£'000 £'000 £'000 £'000 £'000 £'000 £'000 £'000 £'000
Adjustments involving the Capital Adjustment Account
Reversal of items debited or credited to the Comprehensive I&E
Charges for depreciation and impairment of non current assets 24,398 0 0 14,801 0 0 39,199 (39,199) 0
Revaluation losses on PPE (charged to SDPS) (425) 0 (11,370) 0 0 0 (11,795) 11,795 0
Capital grants and contributions applied (5,917) 0 (6,164) 0 0 (19,510) (31,591) 31,591 0
Revenue expenditure funded from capital under statute 9,333 0 3,341 0 0 0 12,674 (12,674) 0Amounts of non current assets written off on disposal or sale as
part of the gain/loss on disposal to the CIES 8,338 0 29,313 0 0 0 37,651 (37,651) 0
Statutory provision for the financing of capital investment (7,096) 0 (504) 0 0 0 (7,600) 7,600 0
Capital expenditure charged against the General Fund and
HRA balances (20,340) 0 (5,287) 0 0 0 (25,627) 25,627 0
Adjustments involving the Capital Receipts Reserve
Transfer of sale proceeds credited as part of the gain/loss on
disposal to the CIES (17,953) 0 (56,039) 0 73,992 0 0 0 0
Use of the Capital Receipts Reserve to finance new capital
expenditure 0 0 0 0 (7,913) 0 (7,913) 7,913 0
Contribution from the Capital Receipts Reserve to finance the
payments to the Government capital receipts pool 1,755 0 0 0 (1,755) 0 0 0 0
Unattached capital receipts (1,853) 0 (4,287) 0 6,140 0 0 0 0
Deferred Capital Receipts 0 0 0 0 2 0 2 (2) 0
Adjustment involving the Major Repairs Reserve
Use of the Major Repairs Reserve to finance new capital
expenditure 0 0 0 (14,517) 0 0 (14,517) 14,517 0
Amount by which finance costs charged to the CIES are
different from finance costs chargeable in the year in
accordance with statutory requirements 102 0 182 0 0 0 284 (284) 0
Adjustment involving the Pensions Reserve
Reversal of items relating to retirement benefits debited or
credited to the CIES 55,294 0 1,203 0 0 0 56,497 (56,497) 0
Employer's pensions contributions and direct payments to
pensioners payable in the year (42,915) 0 (3,041) 0 0 0 (45,956) 45,956 0
Amount by which council tax credited to the CIES is different
from council tax income calculated in accordance with statutory
requirements 3,029 0 0 0 0 0 3,029 (3,029) 0
Other adjustments include
Adjustments involving the Capital Grants Unapplied Account
Capital grants and contributions unapplied credited to CIES
when receivable (41,860) 0 (3,484) 0 0 45,344 0 0 0
Depreciation of non-current asset revaluation gains 0 0 0 0 0 0 0 0 0
Revaluation gains written out on disposal 0 0 0 0 0 0 0 0 0
Amount by which officer remuneration charged to the CIES on
an accruals basis is different from remuneration chargeable in
the year in accordance with statutory requirements 1,559 0 0 0 0 0 1,559 (1,559) 0
(34,552) 0 (56,137) 284 70,466 25,834 5,895 (5,895) 0
Adjustments involving the Accumulated Absences Account
Total Adjustments
Inclusion of items not debited or credited to the Comprehensive
Adjustments involving the Financial Instruments Adjustment
Account
Adjustments involving the Collection Fund Adjustment Account
Adjustment between the Capital Adjustment Account and the
Revaluation Reserve
This note details the adjustments that are made to the total comprehensive income and expenditure recognised by the Council in the year in accordance with ADJUSTMENTS BETWEEN ACCOUNTING BASIS AND FUNDING BASIS UNDER REGULATIONS
2016/17
USABLE RESERVES
UNUSABLE
RESERVES
32

7
GE
NE
RA
L F
UN
D
BA
LA
NC
E
EA
RM
AR
KE
D G
EN
ER
AL
FU
ND
RE
SE
RV
ES
*
HO
US
ING
RE
VE
NU
E
AC
CO
UN
T B
AL
AN
CE
MA
JO
R R
EP
AIR
S
RE
SE
RV
E
CA
PIT
AL
RE
CE
IPT
S
RE
SE
RV
E
CA
PIT
AL
GR
AN
TS
UN
AP
PL
IED
TO
TA
L U
SA
BL
E
RE
SE
RV
ES
TO
TA
L U
NU
SA
BL
E
RE
SE
RV
ES
TO
TA
L A
UT
HO
RIT
Y
RE
SE
RV
ES
£'000 £'000 £'000 £'000 £'000 £'000 £'000 £'000 £'000
Adjustments involving the Capital Adjustment Account
Reversal of items debited or credited to the Comprehensive I&E
Charges for depreciation and impairment of non current assets 24,159 0 0 15,321 0 0 39,480 (39,480) 0
Revaluation losses on PPE (charged to SDPS) 4,717 0 (40,892) 0 0 0 (36,175) 36,175 0
Capital grants and contributions applied (6,097) 0 (9,903) 0 0 (41,073) (57,073) 57,073 0
Revenue expenditure funded from capital under statute 9,533 0 1,365 0 0 0 10,898 (10,898) 0Amounts of non current assets written off on disposal or sale as
part of the gain/loss on disposal to the CIES 4 0 23,221 0 0 0 23,225 (23,225) 0
Statutory provision for the financing of capital investment (7,084) 0 (82) 0 0 0 (7,166) 7,166 0
Capital expenditure charged against the General Fund and HRA
balances (1,929) 0 (4,671) 0 0 0 (6,600) 6,600 0
Adjustments involving the Capital Receipts Reserve
Transfer of sale proceeds credited as part of the gain/loss on
disposal to the CIES (82) 0 (36,063) 0 36,145 0 0 0 0
Use of the Capital Receipts Reserve to finance new capital
expenditure 0 0 0 0 (841) 0 (841) 841 0
Contribution from the Capital Receipts Reserve to finance the
payments to the Government capital receipts pool 1,774 0 0 0 (1,774) 0 0 0 0
Unattached capital receipts (1,897) 0 (1,811) 0 3,708 0 0 0 0
Deferred Capital Receipts 0 0 0 0 9 0 9 (9) 0
Adjustment involving the Major Repairs Reserve
Use of the Major Repairs Reserve to finance new capital
expenditure 0 0 0 (28,319) 0 0 (28,319) 28,319 0
Amount by which finance costs charged to the CIES are different
from finance costs chargeable in the year in accordance with
statutory requirements 102 0 182 0 0 0 284 (284) 0
Adjustment involving the Pensions Reserve
Reversal of items relating to retirement benefits debited or
credited to the CIES 60,306 0 4,093 0 0 0 64,399 (64,399) 0
Employer's pensions contributions and direct payments to
pensioners payable in the year (42,713) 0 (2,833) 0 0 0 (45,546) 45,546 0
Amount by which council tax credited to the CIES is different from
council tax income calculated in accordance with statutory
requirements 7,319 0 0 0 0 0 7,319 (7,319) 0
Amount by which amounts charged for Equal Pay claims to the
CIES are different from the cost of settlements chargeable in the
year in accordance with statutory requirements 0 0 0 0 0 0 0 0 0
Other adjustments include
Adjustments involving the Capital Grants Unapplied Account
Capital grants and contributions unapplied credited to CIES when
receivable (25,186) 0 (16,598) 0 0 41,784 0 0 0
Depreciation of non-current asset revaluation gains 0 0 0 0 0 0 0 0 0
Revaluation gains written out on disposal 0 0 0 0 0 0 0 0 0
0 0 0 0 0 0 0 0 0
Amount by which officer remuneration charged to the CIES on an
accruals basis is different from remuneration chargeable in the
year in accordance with statutory requirements (618) 0 0 0 0 0 (618) 618 0
22,308 0 (83,992) (12,998) 37,247 711 (36,724) 36,724 0
This note details the adjustments that are made to the total comprehensive income and expenditure recognised by the Council in the year in accordance with
Inclusion of items not debited or credited to the Comprehensive
Adjustments involving the Accumulated Absences Account
ADJUSTMENTS BETWEEN ACCOUNTING BASIS AND FUNDING BASIS UNDER REGULATIONS
USABLE RESERVES
UNUSABLE
RESERVES
Total Adjustments
2015/16
Adjustments involving the Unequal Pay Back Pay Adjustment
Account
Adjustment between the Capital Adjustment Account and the
Revaluation Reserve
Adjustments involving the Financial Instruments Adjustment
Account
Adjustments involving the Collection Fund Adjustment Account
Transfers from General Fund (as directed by Secretary of State)
33

8
BALANCE AT
1 APRIL 2015
£000
TRANSFERS
OUT 2015/16
£000
TRANSFERS
IN 2015/16
£000
BALANCE AT
31 MARCH
2016 £000
TRANSFERS
OUT 2016/17
£000
TRANSFERS IN
2016/17 £000
REALLOCATIO
NS 2016-17
£000
BALANCE AT
31 MARCH
2017 £000
GENERAL FUND
General Fund Reserve 71,456 0 644 72,100 (40,360) 0 0 31,740
EARMARKED RESERVES
1 Transformation 16,917 (1,936) 9,047 24,028 (8,194) 0 9,166 25,000
2 Severance 15,000 (4,152) 1,152 12,000 (1,176) 0 (10,824) 0
3 ICT / Finance Systems 2,510 0 0 2,510 (1,932) 25,000 (2,510) 23,068
4 ICT Refresh 1,549 (218) 0 1,331 0 0 (1,331) 0
5 Olympic Legacy Schemes 651 (651) 0 0 0 0 0 0
6 Education Grant Reduction 1,333 0 1,110 2,443 (370) 0 (2,073) 0
7 Employment and other Corporate Initiatives 13,845 (4,471) 3,859 13,233 (3,765) 0 (9,468) 0
8 Other 3,534 (2,334) 0 1,200 0 116 (354) 962
9 Homelessness 2,214 (559) 0 1,655 (496) 0 (1,159) 0
10 Parking Control 1,919 0 1,376 3,295 0 0 0 3,295
11 Building Control 0 0 0 0 0 0 373 373
12 Land Charges 0 0 0 0 0 0 749 749
13 Place (formerly Development & Renewal) Other 4,554 (113) 1,440 5,881 (1,551) 0 (4,330) 0
14 Communities, Localities & Culture 1,837 (190) 1,013 2,660 (413) 0 (2,247) 0
15 Children, Schools & Families 2,181 (1,610) 667 1,238 (160) 0 (1,078) 0
16 Adults, Health & Wellbeing 1,938 (328) 1,092 2,702 (1,402) 0 (1,300) 0
17 Law, Probity & Governance & Resources 564 0 60 624 0 0 (624) 0
18 Insurance 23,065 (1,005) 0 22,060 (1,289) 0 0 20,771
19 Schools Balances 35,988 (4,177) 0 31,811 (7,097) 0 0 24,714
20 CSF - Early Intervention 2,462 (2,244) 0 218 (218) 0 0 0
21 Housing Revenue Account (HRA) 20,145 1,000 10,947 32,092 6,987 0 0 39,079
22 Housing Revenue Account - Future Housing Supply 1,000 (1,000) 0 0 0 0 0 0
23 Capital Programme (General Fund) 24,588 (288) 651 24,951 (19,305) 0 (5,646) 0
24 New Civic Centre 0 0 0 0 0 20,000 0 20,000
25 New Homes Bonus 0 0 0 0 0 7,258 0 7,258
26 Free School Meals 0 0 0 0 0 0 6,000 6,000
27 Mayor's Investment Priorities 0 0 0 0 0 0 10,000 10,000
28 Risk Reserve 0 0 0 0 0 0 10,500 10,500
29 Revenue Grants 0 0 0 0 0 487 1,156 1,643
30 Mayor's Tackling Poverty Reserve 0 0 0 0 0 0 5,000 5,000
Earmarked Reserve Total 177,794 (24,276) 32,414 185,932 (40,381) 52,861 0 198,412
(177,794)
Total Usable Reserve Total 249,250 (24,276) 33,058 258,032 (80,741) 52,861 0 230,152
Corporate Reserves
1
2
3 & 4
5
6
7
8 Other - mainstream grants fund.*
9
10 Parking control reserve.
11 Building Control reserve created from Building Control
service revenue.
12 Reserve created from Land Charges revenue.
13-17
18
19 Reserves held by schools under the scheme of delegation.
20 Reserve created from grant for Children, School & Families early intervention schemes.
21
23
24
25
26 Reserve to fund free school meals programme.
27 Reserve to fund Mayor's Investment Priority schemes.
28 Risk Reserve to manage funding of risks arising.
29 Unspent revenue grants without repayment conditions.
30
Reserve to contribute towards funding of new Civic Centre.
Unspent New Homes Bonus receipts to be used to fund housing schemes.
Contribution toward funding of welfare reform programme.
An earmarked Housing Revenue Account reserve to fund housing projects.
TRANSFERS TO / FROM EARMARKED RESERVES
This note sets out the amounts set aside from the General Fund and HRA balances in earmarked reserves to provide financing for future expenditure plans and the amounts posted
back from earmarked reserves to meet General Fund and HRA expenditure in 2016/17.
The Council is self insured for most liability and property risks below £1 million. The level of the reserve is reviewed annually and where appropriate an amount transferred to
the Insurance Provision.
Reserve created to support the delivery of the Council's transformation programme.
A review has been conducted of the Council's reserves to re-allocate them towards the Council's priorities. These priorities cover the transformation programme, ICT systems
improvements, the New Civic Centre, housing, free school meals, welfare reform and the Mayor's Priorities. Reserves marked * have been reallocated to these priorities. In addition
£40.36m of the general fund balance has been earmarked for these priorities.
A reserve to mitigate the impact of the increased cost of managing homelessness.*
Reserve for employment, business support and corporate initiatives.*
The reserve balance on the ring-fenced Housing Revenue Account to be used for the provision of social housing in the Borough.
Reserve for potential severance / redundancy payments*.
Reserve to support the planned investment in Council's finance systems.
Reserve created from grant income to support initiatives related to the Olympics programme.*
Reserve to mitigate the impact of reductions to education improvement grant funding.*
Reserves held for service specific initiatives.*
34

9
2015/16 2016/17
£'000 Note £'000
Levies
237 - Lee Valley Regional Park Authority 239
180 - Environment Agency 190
1,286 - London Pensions Fund Authority 1,312
1,703 Total Levies 1,7411,774 Payments to Housing Capital Receipts Pool 1,755
(12,919) Net (gain)/loss on disposal of non-current assets (36,341)
(3,708) Unattached capital receipts (6,140)
(13,150) Total (38,985)
10
2015/16 2016/17
£'000 £'000
9,761 Interest payable and similar charges 10,939
20,509 Pensions interest cost and expected return on pensions assets 17,901
(3,131) Interest receivable and similar income 15 (2,519)
(356) Surplus or deficit of trading operations 29 101
26,783 Total 26,422
11
2015/16 2016/17
£'000 £'000
(71,793) Council Tax income (78,043)
(112,493) Non domestic rates (117,870)
(111,500) Non-ringfenced Government grants 37 (105,025)
(48,976) Capital grants and contributions 37 (50,236)
(344,762) Total (351,174)
Financing and Investment Income and
Expenditure
Taxation and Non Specific Grant Income
Other Operating Expenditure
Of 635 grant payments made during 2016/17, 5 grant payments totalling £78,997.57 were paid in
error by the Council as appropriate premises rental agreements were not in place at the time of
payment. As the Commissioners required appropriate premises agreements to be in place before
payment was made, this expenditure is considered unlawful. These payments represent 2.7% of all
£2.9m grants payments in the financial year and 2.6% of the number of payments processed. The
£78,997.57 of expenditure is included within the Comprehensive Income and Expenditure
Statement. The approval process has been strengthened and work continues to address grants
related premises issues. Progress has been reported to the Commissioners’ public decision making
meetings and since 17 January 2017, to the Grants Determination (Cabinet) Sub Committee.
35

12
CO
UN
CIL
DW
EL
LIN
GS
OT
HE
R L
AN
D
AN
D
BU
ILD
ING
S
VE
HIC
LE
S,
PL
AN
T,
FU
RN
ITU
RE
&
EQ
UIP
ME
NT
INF
RA
-
ST
RU
CT
UR
E
AS
SE
TS
CO
MM
UN
ITY
AS
SE
TS
SU
RP
LU
S
AS
SE
TS
AS
SE
TS
UN
DE
R
CO
NS
TR
UC
TIO
N
TO
TA
L
PR
OP
ER
TY
,
PL
AN
T A
ND
EQ
UIP
ME
NT
PF
I A
SS
ET
S
INC
LU
DE
D I
N
PR
OP
ER
TY
,
PL
AN
T A
ND
EQ
UIP
ME
NT
£'0
00
£'0
00
£'0
00
£'0
00
£'0
00
£'0
00
£'0
00
£'0
00
£'0
00
Co
st
or
Valu
ati
on
At
1 A
pril 2016
1,2
44,3
94
971,5
42
24,4
28
153,8
03
53,8
91
11,8
85
10,7
05
2,4
70,6
48
250,6
25
Additio
ns
36,4
47
31,9
00
263
3,7
43
523
020,8
12
93,6
88
6,7
59
Revalu
ation
incre
ases/(
decre
ases)
recognis
ed
in t
he R
evalu
ation R
eserv
e74,8
82
(10,0
50)
00
00
064,8
32
0
Revalu
ation
Incre
ases/(
decre
ases)
recognis
ed
in t
he S
urp
lus/D
eficit o
n t
he
pro
vis
ion o
f serv
ices
11,3
70
(346)
00
00
011,0
24
0
Dere
cognitio
n -
Dis
posals
(24,6
01)
00
00
(742)
0(2
5,3
43)
0
Dere
cognitio
n -
Oth
er
0(7
13)
00
00
0(7
13)
0A
ssets
Recla
ssifie
d (
to)/
from
Held
for
Sale
00
00
0(3
,568)
0(3
,568)
0
Oth
er
Recla
ssific
ation o
f A
ssets
00
00
00
00
0
At
31 M
arc
h 2
017
1,3
42,4
92
992,3
33
24,6
91
157,5
46
54,4
14
7, 5
75
31,5
17
2,6
10,5
68
257,3
84
Accu
mu
late
d D
ep
recia
tio
n a
nd
Im
pair
men
t
At
1 A
pril 2016
151,9
63
95,1
90
21,1
21
46,2
20
5(4
26)
0314,0
73
17,2
50
Depre
cia
tion c
harg
e13,5
25
21,4
85
666
3,7
20
00
039,3
96
6,5
32
Depre
cia
tion w
ritt
en o
ut
to t
he
Revalu
ation R
eserv
e(1
3,4
65)
(4,3
49)
00
00
0(1
7,8
14)
0D
ere
cognitio
n -
Dis
posals
(278)
00
00
00
(278)
0
Dere
cognitio
n -
Oth
er
011
00
00
011
0
Assets
recla
ssifie
d (
to)/
from
Held
for
Sale
00
00
00
00
0
Oth
er
Recla
ssific
ation o
f A
ssets
00
00
00
00
0
At
31 M
arc
h 2
017
151,7
45
112,3
37
21,7
87
49,9
40
5(4
26)
0335,3
88
23,7
82
Net
Bo
ok V
alu
e
At
31 M
arc
h 2
017
1,1
90,7
47
879,9
96
2,9
04
107,6
06
54,4
09
8,0
01
31,5
17
2,2
75,1
80
233,6
02
At
31 M
arc
h 2
016
1,0
92,4
31
876,3
52
3,3
07
107,5
83
53,8
86
12,3
11
10,7
05
2,1
56,5
75
233,3
75
PR
OP
ER
TY
, P
LA
NT
AN
D E
QU
IPM
EN
T
MO
VE
ME
NT
S I
N 2
016/1
7
36

12
CO
UN
CIL
DW
EL
LIN
GS
OT
HE
R
LA
ND
AN
D
BU
ILD
ING
S
VE
HIC
LE
S,
PL
AN
T,
FU
RN
ITU
RE
&
EQ
UIP
ME
NT
INF
RA
ST
RU
CT
UR
E
AS
SE
TS
CO
MM
UN
ITY
AS
SE
TS
SU
RP
LU
S
AS
SE
TS
AS
SE
TS
UN
DE
R
CO
NS
TR
UC
TIO
N
TO
TA
L
PR
OP
ER
TY
,
PL
AN
T A
ND
EQ
UIP
ME
NT
PF
I A
SS
ET
S
INC
LU
DE
D I
N
PR
OP
ER
TY
,
PL
AN
T A
ND
EQ
UIP
ME
NT
£'0
00
£'0
00
£'0
00
£'0
00
£'0
00
£'0
00
£'0
00
£'0
00
£'0
00
Co
st
or
Valu
ati
on
At
1 A
pril 2015
1,1
25,6
13
958,4
46
24,1
76
149,0
30
53,5
77
24,8
73
2,8
40
2,3
38,5
55
278,0
21
Additio
ns
60,2
44
11,8
02
252
4,7
73
253
710,7
41
88,0
72
6,3
02
Revalu
ation
incre
ases/(
decre
ases)
recognis
ed
in t
he R
evalu
ation R
eserv
e35,8
52
2,0
46
00
05,8
96
043,7
94
(176)
Revalu
ation
Incre
ases/(
decre
ases)
recognis
ed
in t
he S
urp
lus/D
eficit o
n t
he
pro
vis
ion o
f serv
ices
40,8
92
980
00
0(4
,322)
037,5
50
(29)
Dere
cognitio
n -
Dis
posals
(22,2
13)
(440)
00
00
0(2
2,6
53)
0
Dere
cognitio
n -
Oth
er
0(4
18)
00
00
0(4
18)
0
Assets
Recla
ssifie
d (
to)/
from
Held
for
Sale
0(2
23)
00
0(1
4,0
29)
0(1
4,2
52)
0
Oth
er
Recla
ssific
ation o
f A
ssets
4,0
06
(651)
00
61
(540)
(2,8
76)
0(3
3,4
93)
At
31 M
arc
h 2
016
1,2
44,3
94
971,5
42
24,4
28
153,8
03
53,8
91
11,8
85
10,7
05
2,4
70,6
48
250,6
25
Accu
mu
late
d D
ep
recia
tio
n a
nd
Im
pair
men
t
At
1 A
pril 2015
152,1
34
80,0
36
20,1
77
42,6
19
0966
0295,9
32
14,4
24
Depre
cia
tion c
harg
e13,7
53
21,2
22
944
3,6
01
0157
039,6
77
5,9
71
Depre
cia
tion w
ritt
en o
ut
to t
he
Revalu
ation R
eserv
e(1
3,6
35)
(6,0
60)
00
0(1
,214)
0(2
0,9
09)
(134)
Dere
cognitio
n -
Dis
posals
(289)
00
00
00
(289)
0
Dere
cognitio
n -
Oth
er
00
00
00
00
0
Assets
recla
ssifie
d (
to)/
from
Held
for
Sale
0(3
)0
00
(335)
0(3
38)
0
Oth
er
Recla
ssific
ation o
f A
ssets
0(5
)0
05
00
0(3
,011)
At
31 M
arc
h 2
016
151,9
63
95,1
90
21,1
21
46,2
20
5(4
26)
0314,0
73
17,2
50
Net
Bo
ok V
alu
e
At
31 M
arc
h 2
016
1,0
92,4
31
876,3
52
3,3
07
107,5
83
53,8
86
12,3
11
10,7
05
2,1
56,5
75
233,3
75
At
31 M
arc
h 2
015
973,4
79
878,4
10
3,9
99
106,4
11
53,5
77
23,9
07
2,8
40
2,0
42,6
23
263,5
97
PR
OP
ER
TY
, P
LA
NT
AN
D E
QU
IPM
EN
T (
co
nti
nu
ed
)
CO
MP
AR
AT
IVE
MO
VE
ME
NT
S I
N
2015/1
6
37
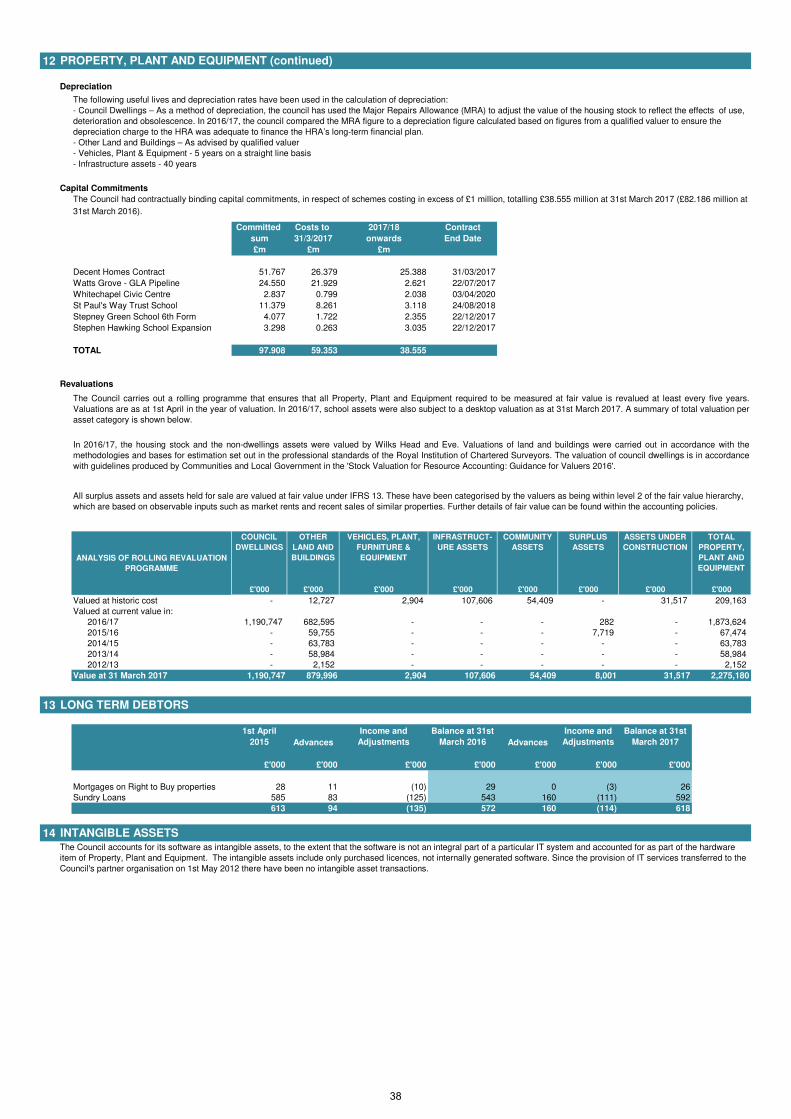
12
Depreciation
Capital Commitments
Committed Costs to 2017/18 Contract
sum 31/3/2017 onwards End Date
£m £m £m
Decent Homes Contract 51.767 26.379 25.388 31/03/2017
Watts Grove - GLA Pipeline 24.550 21.929 2.621 22/07/2017
Whitechapel Civic Centre 2.837 0.799 2.038 03/04/2020
St Paul's Way Trust School 11.379 8.261 3.118 24/08/2018
Stepney Green School 6th Form 4.077 1.722 2.355 22/12/2017
Stephen Hawking School Expansion 3.298 0.263 3.035 22/12/2017
TOTAL 97.908 59.353 38.555
Revaluations
COUNCIL
DWELLINGS
OTHER
LAND AND
BUILDINGS
VEHICLES, PLANT,
FURNITURE &
EQUIPMENT
INFRASTRUCT-
URE ASSETS
COMMUNITY
ASSETS
SURPLUS
ASSETS
ASSETS UNDER
CONSTRUCTION
TOTAL
PROPERTY,
PLANT AND
EQUIPMENT
£'000 £'000 £'000 £'000 £'000 £'000 £'000 £'000
Valued at historic cost - 12,727 2,904 107,606 54,409 - 31,517 209,163
Valued at current value in:
2016/17 1,190,747 682,595 - - - 282 - 1,873,624
2015/16 - 59,755 - - - 7,719 - 67,474
2014/15 - 63,783 - - - - - 63,783
2013/14 - 58,984 - - - - - 58,984
2012/13 - 2,152 - - - - - 2,152
Value at 31 March 2017 1,190,747 879,996 2,904 107,606 54,409 8,001 31,517 2,275,180
13Balance at
1st April
2015 Advances
Income and
Adjustments
Balance at 31st
March 2016 Advances
Income and
Adjustments
Balance at 31st
March 2017
£'000 £'000 £'000 £'000 £'000 £'000 £'000
Mortgages on Right to Buy properties 28 11 (10) 29 0 (3) 26
Sundry Loans 585 83 (125) 543 160 (111) 592
613 94 (135) 572 160 (114) 618
14The Council accounts for its software as intangible assets, to the extent that the software is not an integral part of a particular IT system and accounted for as part of the hardware
item of Property, Plant and Equipment. The intangible assets include only purchased licences, not internally generated software. Since the provision of IT services transferred to the
Council's partner organisation on 1st May 2012 there have been no intangible asset transactions.
The Council had contractually binding capital commitments, in respect of schemes costing in excess of £1 million, totalling £38.555 million at 31st March 2017 (£82.186 million at
31st March 2016).
The Council carries out a rolling programme that ensures that all Property, Plant and Equipment required to be measured at fair value is revalued at least every five years.
Valuations are as at 1st April in the year of valuation. In 2016/17, school assets were also subject to a desktop valuation as at 31st March 2017. A summary of total valuation per
asset category is shown below.
LONG TERM DEBTORS
PROPERTY, PLANT AND EQUIPMENT (continued)
The following useful lives and depreciation rates have been used in the calculation of depreciation:
- Council Dwellings – As a method of depreciation, the council has used the Major Repairs Allowance (MRA) to adjust the value of the housing stock to reflect the effects of use,
deterioration and obsolescence. In 2016/17, the council compared the MRA figure to a depreciation figure calculated based on figures from a qualified valuer to ensure the
depreciation charge to the HRA was adequate to finance the HRA’s long-term financial plan.
- Other Land and Buildings – As advised by qualified valuer
- Vehicles, Plant & Equipment - 5 years on a straight line basis
- Infrastructure assets - 40 years
ANALYSIS OF ROLLING REVALUATION
PROGRAMME
INTANGIBLE ASSETS
In 2016/17, the housing stock and the non-dwellings assets were valued by Wilks Head and Eve. Valuations of land and buildings were carried out in accordance with the
methodologies and bases for estimation set out in the professional standards of the Royal Institution of Chartered Surveyors. The valuation of council dwellings is in accordance
with guidelines produced by Communities and Local Government in the 'Stock Valuation for Resource Accounting: Guidance for Valuers 2016'.
All surplus assets and assets held for sale are valued at fair value under IFRS 13. These have been categorised by the valuers as being within level 2 of the fair value hierarchy,
which are based on observable inputs such as market rents and recent sales of similar properties. Further details of fair value can be found within the accounting policies.
38

15 FINANCIAL INSTRUMENT NOTES
1
2
31 March 31 March 31 March 31 March 31 March 31 March
2016 2017 2016 2017 2016 2017
£'000 £'000 £'000 £'000 £'000 £'000
Financial Liabilities
Borrowings at amortised cost 85,936 84,966 2,267 1,310 88,203 86,276
Deferred Liabilities (PFI and Finance Leases) 42,040 63,871 1,377 2,223 43,417 66,094
0 0 49,681 40,292 49,681 40,292
Total Liabilities 127,976 148,837 53,325 43,825 181,301 192,662
Financial Assets
Loans and receivables 0 0 291,589 311,667 291,589 311,667
0 0 25,560 7,701 25,560 7,701
Cash held at bank and cash equivalents 0 0 160,712 184,299 160,712 184,299
Total Financial Assets 0 0 477,861 503,667 477,861 503,667
NOTES
7. In addition to the above financial liabilities, the Council has contingent liabilities for warranties provided to landlords. Details are outlined in
note 30 to the accounts. The Council has also provided an assurance that it will meet the pension liabilities of Tower Hamlets Homes in the
event the ALMO is unable to fund the liabilities arising from its pension obligations.
Creditors - Financial Liabilities carried at contract
amount
3. The Authority's investment portfolio consists of fixed term deposits, callable deposits, stepped deposits, collar/structured deposits,
certificates of deposits, call accounts and money market funds.
Current Total
1. Market loans of £77.5 million have been included in long term borrowing. At 31st March 2016, these were all LOBO (lender's option,
borrower's option) loans, however during 2016/17 £17.5m of these loans had the interest rate change option removed at the request of the
lender.
Financial Instrument Categories
4. The terms of the stepped deposits of £5m from 30.04.2015 - 29.04.2018 are from 30.04.2015 - 29.04.2016 to earn interest rate of 0.90%;
from 30.04.2016 - 29.04.2017 to earn interest rate of 1.25% and from 30.04.2017 - 30.04.2018 to earn interest rate of 1.79%.
5. Balances in the money market funds at 31 March 2017 are shown under 'cash and cash equivalent' in the balance sheet. Cash equivalents
are highly liquid deposits which are readily convertible into cash at short notice. They include £136.9 million (£89.8 million as at 31st March
2016) of short-term deposits with banks and building societies excluded from loans and receivables.
2. Included in loans and receivables is £10m of deposits due to be settled within 1 and 3 years as at 31 March 2017.
Compliance
6. The above long term figures are based on paragraph B9, Module 7 of the 2016/17 code of practice guidance notes which states an
instrument will be held for its full term unless the Council has a specified intention to repay/call in early or reliable experience of similar
instruments being derecognised before the full term.
Local authorities are required to comply with the requirements of the Code of Practice on Local Authority Accounting in the United Kingdom,
issued by the Chartered Institute of Public Finance and Accountancy / LASAAC Joint Committee. This requires the disclosure of financial
instruments at amortised cost and fair value.
These accounting standards have meant that most financial instruments (whether borrowing or investment) have to be valued on an amortised
cost basis using the effective interest rate (EIR) method.
In these disclosure notes, financial instruments are also required to be shown at fair value. Fair value is defined as the amount for which an
asset could be exchanged or a liability settled, assuming that the transaction was negotiated between parties knowledgeable about the market
in which they are dealing and willing to buy/sell at an appropriate price, with no other motive in their negotiations other than to secure a fair
price.
The Council has:
Adopted the CIPFA‘s Treasury Management in the Public Services: Code of Practice.
Set treasury management indicators to control key financial instrument risks in accordance with CIPFA’s Prudential Code.
Types of Financial Instruments
Amortised Cost
Fair Value
Long-Term
Debtors - financial assets carried at contract
amounts
39

16 FINANCIAL INSTRUMENTS (continued)
Gains and Losses on Financial Instruments
Financial Liabilities
measured at
amortised cost
Financial
Assets Loans
and
receivables
Financial
Liabilities
measured at
amortised cost
Financial Assets
Loans and
receivables
£'000 £'000 £'000 £'000
Interest expense 9,761 0 10,939 0
Interest income 0 3,131 0 2,519
TOTAL INTEREST AND INVESTMENT INCOME 9,761 3,131 10,939 2,519
31 March 2016 31 March 2016 31 March 2017 31 March 2017
Carrying amount Fair value
Carrying
amount Fair value
£'000 £'000 £'000 £'000
10,375 13,019 8,458 10,871
Market Loans - Fixed Interest 0 0 17,577 29,278
Market Loans - Lender's option, borrower's option loans 77,828 132,814 60,241 93,89543,417 43,417 66,092 66,092
49,681 49,681 40,292 40,292181,301 238,931 192,660 240,428
31 March 2016 31 March 2016 31 March 2017 31 March 2017
Carrying amount Fair value
Carrying
amount Fair value
£'000 £'000 £'000 £'000
Fixed term deposits with banks and building societies 291,589 318,842 311,660 312,237
Equity Shares (not quoted in an active market) 7 7 7 7
25,560 25,560 7,701 7,701
Cash held at Bank 68,398 68,398 47,448 47,448
Cash equivalents (deposits with banks and other financial institutions) 92,314 92,314 136,851 136,851477,868 505,121 503,667 504,244
The fair value is higher than the carrying amount because the Council's portfolio of investments includes a number of fixed rate loans where the
interest rate receivable is higher than the rates available for similar loans at the Balance Sheet date.
Public Works Loans Board
The fair values are as follows:
The commitment to pay interest below current market rates reduces the amount that the Council would have to pay if the lender requested or agreed
to early repayment of the loans. Fair value is more than the carrying amount because the Council’s portfolio of loans includes a number of fixed rate
loans where the interest rate payable is higher than the rates available for similar loans at the Balance Sheet date.
Fair Value of Liabilities Carried at Amortised Cost
Deferred liabilities - (PFI/Finance Leases)
Fair Value of Assets Carried at Amortised Cost
Creditors - Financial Liabilities carried at contract amount
Debtors - financial assets carried at contract amounts
Financial Assets
Financial Liabilities
The gains and losses recognised in the Income and Expenditure Account in relation to financial instruments are made up as follows:
2015/16 2016/17
The fair value of an instrument is determined by calculating the Net Present Value (NPV) of future cash flows, which provides an estimate of the value
of payments in the future in today's terms.
The discount rate used in the NPV calculation is the rate applicable in the market on the date of valuation for an instrument with the same structure,
terms and remaining duration. For debt, this will be the new borrowing rate since premature repayment rates include a margin which represents the
lender's profit as a result of rescheduling the loan; this is not included in the fair value calculation since any motivation other than securing a fair price
should be ignored. The rates quoted in this valuation were obtained by the Council's treasury management consultants from the market on 31st
March, using bid prices where applicable.
The fair value of each class of financial assets and liabilities which are carried in the balance sheet at amortised cost is disclosed below:
Methods and Assumptions in valuation technique
• Fair values for all instruments in the portfolio have been calculated, but only those which are materially different from the carrying value are
disclosed.
The calculations are made with the following assumptions:
• The fair value of trade and other receivables is taken to be the invoiced or billed amount.
• The PWLB liabilities have been calculated by reference to the "Premature Redemption" set of rates in force on the 31st March 2017.
• For other market debt and investments the discount rate used is the rate available for an instrument with the same terms from a comparable
lender.
• Interpolation techniques have been used between available rates where the exact maturity period was not available.
• No early repayment or impairment is recognised.
40

15 FINANCIAL INSTRUMENTS (continued)
1. Credit Risk
Amounts at
31 March
2016
Historical experience
of default
Historical
experience
adjusted for market
conditions as at 31
March 2016
Estimated
maximum
exposure to
default and non-
collection
£'000 % % £'000
Cash & cash equivalents deposits 97,888 0% 0% 0%
Money Market Funds 62,824 0% 0% 0%
1 - 3 months 0 0% 0% 0%
3 - 6 months 50,142 0% 0% 0%
6 - 12 months 135,729 0% 0% 0%
Over 12 months 105,718 0% 0% 0%
TOTAL 452,301 0% 0% 0%
Amounts at
31 March
2017
Historical experience
of default
Historical
experience
adjusted for market
conditions as at 31
March 2017
Estimated
maximum
exposure to
default and non-
collection
£'000 % % £'000
Cash & cash equivalents deposits 142,485 0% 0% 0%
Money Market Funds 41,814 0% 0% 0%
1 - 3 months 0 0% 0% 0%
3 - 6 months 55,023 0% 0% 0%
6 - 12 months 211,409 0% 0% 0%
Over 12 months 45,228 0% 0% 0%
TOTAL 495,959 0% 0% 0%
The Council does not generally allow credit for customers, such that £4.0 million of the £52.6 million balance (2015/16 - £3.7 million
of the £64.0 million) is past its due date for payment, but not impaired. The past due amount can be analysed by age as follows:
Nature and extent of risks arising from Financial Instruments
Credit risk is the possibility that other parties may not pay amounts due to the Council. This risk arises from the short-term lending
of surplus funds to banks, building societies and other local authorities as well as credit exposures to the Council’s customers. The
Council invests primarily on the basis of prudence and then the level of returns. It is the policy of the Council to place deposits only
with a limited number of high quality banks and building societies whose credit rating is independently assessed as sufficiently
secure by the Council’s treasury advisers and to restrict lending to a prudent maximum amount for each institution or those
underwritten by the Government. The Council has a policy of limiting deposits with institutions to a maximum of £10 million for
financial institutions and £70 million for government backed borrowing, in any one transaction. The authority's minimum credit rating
criteria is as detailed in the Treasury Management Strategy.
The following maturity profile summarises the Council’s potential maximum exposure to credit risk, based on past experience and
current market conditions. No credit limits were exceeded during the financial year and the Council expects full repayment on the
due date of deposits placed with its counterparties.
No credit limits were exceeded during the reporting period and the Council does not expect any losses from non-performance by any
of its counterparties in relation to deposits and bonds.
The Council’s management of treasury risks actively works to minimise the Council’s exposure to the unpredictability of financial
markets and to protect the financial resources available to fund services. Risk management is carried out by a central treasury team
under policies approved by the Council in the annual treasury management strategy report. The Council has fully adopted and
implemented CIPFA’s Code of Treasury Management Practices and has written principles for overall risk management as well as
written policies and procedures covering specific areas such as credit risk, liquidity risk and market risk. The treasury management
team have also fully implemented the Government's national investment guidance.
Fixed term deposits with banks and other financial
institutions:
Fixed term deposits with banks and other financial
institutions:
41

15 FINANCIAL INSTRUMENTS (continued)
Credit Risk
31 March
2016
31 March
2017
£'000 £'000
Three to six months 570 344
Six months to one year 626 401
More than one year 2,553 721
TOTAL 3,749 1,466
2. Liquidity Risk
The maturity structure of financial liabilities is as follows (at nominal value):
Loans outstanding
31 March
2016
31 March
2017
£'000 £'000
10,375 8,458
77,828 77,818
PFI / Finance Leases 43,417 66,092
TOTAL 131,620 152,368
3,643 3,532
3,157 4,090
8,885 12,804
27,354 28,152
88,581 103,790
TOTAL 131,620 152,368
3. Market Risk
Interest rate risk
The current interest rate risk for the Council is summarised below:
The Council has a number of strategies for managing interest rate risk. The policy is to keep variable rate
borrowings to a minimum. During periods of falling interest rates, and where economic circumstances make it
favourable, fixed rate loans will be repaid early to limit exposure to losses.
Between 2 and 5 years
Between 5 and 10 years
More than 10 years
In the more than 10 years category, there are £60 million of Lender's Option, Borrower's Option (LOBO) market
loans. The Council uses money market funds to provide liquidity.
• The fair value of fixed rate financial liabilities will rise if interest rates fall. This will not impact on the Balance
Sheet for the majority of liabilities held at amortised cost, but will impact on the disclosure note for fair value.
The Council is exposed to interest rate risk in two different ways - the uncertainty of interest paid/received on
variable rate instruments and the effect of fluctuations in interest rates on the fair value of an instrument.
• Decreases in interest rates will affect interest earned on variable rate investments, potentially reducing income
credited to the Comprehensive Income and Expenditure Account.
• Increases in interest rates will affect interest paid on variable rate borrowings, potentially increasing interest
expense charged to the Comprehensive Income and Expenditure Account.• The fair value of fixed rate financial assets will fall if interest rates rise. This will not impact on the Balance
Sheet for the majority of assets held at amortised cost, but will impact on the disclosure note for fair value. It
would have a negative effect on the Balance Sheet for those assets held at fair value in the Balance Sheet, which
would also be reflected in the Movement in Reserves Statement.
Between 1 and 2 years
Nature and extent of risks arising from Financial Instruments (Continued)
Public Works Loans Board
Market debt
Less than 1 year
The Council has access to a facility to borrow from the Public Works Loans Board. As a result there is no
significant risk that the Council will be unable to raise finance to meets its commitments under financial
instruments. The Council has safeguards in place to ensure that a significant proportion of its borrowing does not
mature for repayment at any one time in the future to reduce the financial impact of re-borrowing at a time of
unfavourable interest rates. The Council’s policy is to ensure that not more than 20% of loans are due to mature
within any financial year through a combination of prudent planning of new loans taken out and, where it is
economic to do so, making early repayments.
42

15 FINANCIAL INSTRUMENTS (continued)
2015/16 2016/17
£'000 £'000
Increase in interest payable on variable rate borrowings 645 600
Increase in interest receivable on variable rate investments (3,000) (3,000)(2,355) (2,400)
2015/16 2016/17
£'000 £'000
Decrease in fair value of fixed rate investments 508 1,016
Decrease in fair value of fixed rate borrowing liabilities 1,458 2931,966 1,309
The impact of a 1% fall in interest rates would be as above but with the movements being reversed.
2015/16 2016/17
£'000 £'000
The Tower Hamlets Local Education Partnership 7 7Total 7 7
16
17
Nature and extent of risks arising from Financial Instruments (Continued)
Impact on Income and Expenditure Account
The treasury management strategy assesses interest rate exposure - this feeds into the setting of the annual budget.
According to this assessment, at 31st March 2017, if interest rates had been 1% higher with all other variables held
constant, the financial effect would be :
Interest Rate Risk
Equity Shares (not quoted on an active market)
Paragraph 4.7.4.2(1) of the Code requires disclosure by class of assets of the amounts for impairment losses and
impairment reversals charged to the Surplus or Deficit on the Provision of Services and to Other Comprehensive
Income and Expenditure. These disclosures are consolidated in note 12 reconciling the movement over the year in the
Property, Plant and Equipment and Intangible Asset balances. An impairment review was carried out by qualified
valuers at 31st March 2016 and concluded that there was no significant impairment to report.
The Council does not have any construction contracts (work in progress) where the construction work is undertaken for
the Council's customers.
IMPAIRMENT LOSSES
Impact on Income and Expenditure Account
CONSTRUCTION CONTRACTS
Fair Value Movements
43

18 HERITAGE ASSETS
Balance
at 31st
March
2015
2015/16
Acquisitions
2015/16
Disposals
2015/16
Revaluation
Balance
at 31st
March
2016
2016/17
Acquisitions
2016/17
Disposals
2016/17
Revaluation
Balance
at 31st
March
2017
£'000 £'000 £'000 £'000 £'000 £'000 £'000 £'000 £'000
(a) 8,910 0 0 0 8,910 0 0 0 8,910
(b) 389 0 0 0 389 0 0 0 389
(c) 0 0 0 0 0 0 0 0 0
(d) 11 0 0 0 11 1 0 0 12
9,310 0 0 0 9,310 1 0 0 9,311
(a)
(b)
(c)
(d)
- Public Art (Middlesex Street)
A new capital scheme started in 2012/13 to create a piece of public art funded by section 106 contributions from developments in the area. The agreed budget for the
scheme is £250k and is not yet completed. The asset is shown at historical cost, which is 2012/13 expenditure.
These comprise the Mayor's chain and other civic regalia. These were valued by the auctioneers Bonhams in January 2012.
Tower Hamlets Local History Library & Archives holds an extensive and unique collection of books, pamphlets, maps, photographs, press cuttings and ephemera,
deeds, archives, audio-visual material, oral histories and sound recordings, digital records, and a range of other sources, all of which reflect and provide evidence of
the history of the borough.
It was not considered appropriate or practicable to place a value on these items due to their unique nature. It is highly unlikely that any of these assets would ever be
sold as the council has a legal obligation to maintain its archives.
These collections are preserved and made publicly available at the library on Bancroft Road and increasingly through the web and a range of exhibitions
and outreach projects. The library & archives continues to proactively collect resources which illustrate and provide evidence of the activities and experiences of
residents, organisations and businesses active in the borough, including the local authority.
The council also has a collection of 75 other paintings which are held at the local history library. These paintings are of local scenes and past local dignitaries so
intrinsic value is in local interest rather than realisable value.
TOTAL HERITAGE ASSETS
The council holds a number of works of art. The council has three works of art with a material value - the council has received indications of value on these assets
from art experts at auction houses.
There are 109 works of art across the borough for which the council has a duty of care. These include sculptures, statues, murals, memorials and other works. The
majority of these reflect the history of the borough. It was not cost effective to obtain formal valuations for these immaterial items, however public data is available of
sale proceeds of similar works by the same artists - none of these values are considered material. The estimated value of these assets has not changed since 2010.
The Council holds a number of heritage assets. These include civic regalia, works of art across the borough and collections at Tower Hamlets Local History Library and
Archive (Bancroft Library). These are held as part of increasing the knowledge and understanding of the area's history.
Value of Heritage Assets held by Council
- Works of art
- Civic Regalia
- Local History Library and Archive Collections
The Council has held these heritage assets for a number of years pre-dating 2010. These assets are held at an estimate of current value on the balance sheet, except
for the local history collection which is not included on the balance sheet as valuations are not available due to the unique nature of the assets. The council has a
materiality threshold of £50,000 per asset. There are only four heritage assets above this threshold - civic regalia, two sculptures and one painting. The council has held
these assets for a number of years. It was not practicable or cost effective to obtain valuations prior to 2010.
It is assumed that these material heritage assets have an indefinite lifespan, therefore depreciation is not charged on these assets. If evidence was received that
required the value of the heritage assets to be impaired, this reduction would be charged to the revaluation reserve. The Council does not have any heritage assets
buildings.
44

19 DEBTORS
31 March 2016 31 March 2017
£'000 £'000
Central government bodies 23,835 21,669
Other local authorities 7,107 3,320
Other entities and individuals 63,583 52,661
Payments in advance 2,743 2,837
Total 97,268 80,487
20 CASH AND CASH EQUIVALENTS
31 March 2016 31 March 2017
£'000 £'000
Cash held by the Council 68,398 47,448
92,314 136,851
160,712 184,299
21 ASSETS HELD FOR SALE
2015/16 2016/17 2015/16 2016/17
£000 £000 £000 £000
Value at 1st April 225 13,695 0 0
Assets newly classified as held for sale:
13,914 3,850 0 0
Revaluation losses 0 (1,550) 0 0
Revaluation gains 0 0 0 0
Assets declassified as held for sale:
0 (282) 0 0
Assets sold (444) (11,863) 0 0
Value at 31st March 13,695 3,850 0 0
22 CREDITORS 31 March 2016 31 March 2017
£000 £000
Central government bodies 30,025 29,330
Other local authorities 21,946 8,871
Other entities and individuals 87,001 61,174
Accruals 49,681 40,292
Receipts in advance 15,505 14,487
Total 204,158 154,154
Property, Plant and Equipment
Short-term deposits with banks and building societies
Total Cash and Cash Equivalents
The balance of Cash and Cash Equivalents is made up of the following elements:
As at the 31st March 2017, the Council has one property which is classified as an Asset Held for Sale.
Current Non Current
Property, Plant and Equipment
45
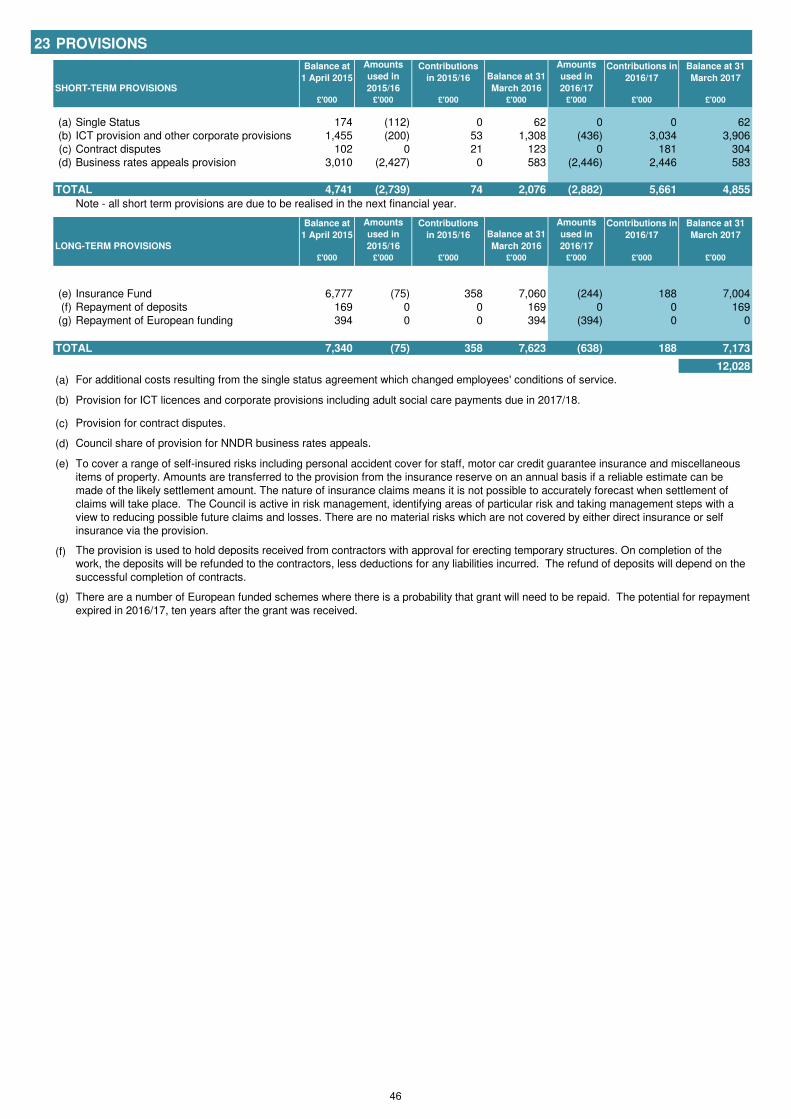
23 PROVISIONS
SHORT-TERM PROVISIONS
£'000 £'000 £'000 £'000 £'000 £'000 £'000
(a) Single Status 174 (112) 0 62 0 0 62
(b) ICT provision and other corporate provisions 1,455 (200) 53 1,308 (436) 3,034 3,906
(c) Contract disputes 102 0 21 123 0 181 304
(d) Business rates appeals provision 3,010 (2,427) 0 583 (2,446) 2,446 583
TOTAL 4,741 (2,739) 74 2,076 (2,882) 5,661 4,855
Note - all short term provisions are due to be realised in the next financial year.
LONG-TERM PROVISIONS
£'000 £'000 £'000 £'000 £'000 £'000 £'000
(e) Insurance Fund 6,777 (75) 358 7,060 (244) 188 7,004
(f) Repayment of deposits 169 0 0 169 0 0 169
(g) Repayment of European funding 394 0 0 394 (394) 0 0
TOTAL 7,340 (75) 358 7,623 (638) 188 7,173
12,028
(a)
(b)
(c)
(d)
(e)
(f)
(g) There are a number of European funded schemes where there is a probability that grant will need to be repaid. The potential for repayment
expired in 2016/17, ten years after the grant was received.
The provision is used to hold deposits received from contractors with approval for erecting temporary structures. On completion of the
work, the deposits will be refunded to the contractors, less deductions for any liabilities incurred. The refund of deposits will depend on the
successful completion of contracts.
To cover a range of self-insured risks including personal accident cover for staff, motor car credit guarantee insurance and miscellaneous
items of property. Amounts are transferred to the provision from the insurance reserve on an annual basis if a reliable estimate can be
made of the likely settlement amount. The nature of insurance claims means it is not possible to accurately forecast when settlement of
claims will take place. The Council is active in risk management, identifying areas of particular risk and taking management steps with a
view to reducing possible future claims and losses. There are no material risks which are not covered by either direct insurance or self
insurance via the provision.
Council share of provision for NNDR business rates appeals.
For additional costs resulting from the single status agreement which changed employees' conditions of service.
Provision for ICT licences and corporate provisions including adult social care payments due in 2017/18.
Provision for contract disputes.
Balance at
1 April 2015
Balance at 31
March 2017
Amounts
used in
2015/16
Contributions
in 2015/16 Balance at 31
March 2016
Contributions in
2016/17
Amounts
used in
2016/17
Amounts
used in
2016/17
Contributions in
2016/17
Balance at 31
March 2017
Balance at
1 April 2015
Amounts
used in
2015/16
Contributions
in 2015/16 Balance at 31
March 2016
46

24 USABLE RESERVES
25
31 March 2016
£'000
401,655 Revaluation Reserve 464,596
1,496,454 Capital Adjustment Account 1,525,680
284 Financial Instruments Adjustment Account 0
(516,595) Pensions Reserve (619,122)
728 Collection Fund Adjustment Account (2,301)
(2,370) Accumulating Compensated Absences Adjustment Account (3,929)
2 Deferred Capital Receipts 0
Total Unusable Reserves 1,364,923
Revaluation Reserve
342,265 Balance at 1 April 401,655
106,896 Upward revaluation of assets 102,462
(42,193)
Downward revaluation of assets and impairment losses not charged to the
Surplus/Deficit on the Provision of Services (19,817)
64,703
Surplus or deficit on revaluation of non-current assets not posted to the
Surplus or Deficit on the Provision of Services 82,645
(3,735)
Difference between current value depreciation and historical cost
depreciation (4,046)
(1,577) Accumulated gains on assets sold or scrapped (15,659)
(5,312) Amount written off to the Capital Adjustment Account (19,705)
401,655 Balance at 31 March 464,596
Movements in the Council’s usable reserves are detailed in the Movement in Reserves Statement and note 7.
The Revaluation Reserve contains the gains made by the Council arising from increases in the value of its Property, Plant and
Equipment. The balance is reduced when assets with accumulated gains are:
• revalued downwards or impaired and the gains are lost
• used in the provision of services and the gains are consumed through depreciation, or
• disposed of and the gains are realised.
The Reserve contains only revaluation gains accumulated since 1 April 2007, the date that the Reserve was created.
Accumulated gains arising before that date are consolidated into the balance on the Capital Adjustment Account.
UNUSABLE RESERVES
31 March 2015
£'000
1,380,159
2015/16
£'000
2016/17
£'000
47

25 UNUSABLE RESERVES
Capital Adjustment Account
2015/16
£'000
1,428,571 Balance at 1 April 1,496,454
Reversal of items relating to capital expenditure debited or credited to the
Comprehensive Income and Expenditure Statement:
(39,480) Charges for depreciation and impairment of non current assets (39,199)
36,175 Revaluation losses and reversals on Property, Plant and Equipment 11,795
(10,898) Revenue expenditure funded from capital under statute (12,674)
(23,225)
Amounts of non current assets written off on disposal or sale as part of the
gain/loss on disposal to the Comprehensive Income and Expenditure
Statement
(37,651)
(37,428) (77,729)
5,312 Adjusting amounts written out of the Revaluation Reserve 19,705
(32,116)Net written out amount of the cost of non current assets consumed in the
year(58,025)
Capital financing applied in the year:
841 Use of the Capital Receipts Reserve to finance new capital expenditure 7,913
28,319 Use of the Major Repairs Reserve to finance new capital expenditure 14,517
57,073Application of grants and contributions to capital financing from the Capital
Grants Unapplied Account31,591
7,167Statutory provision for the financing of capital investment charged against
the General Fund and HRA balances7,601
6,600 Capital expenditure charged against the General Fund and HRA balances 25,627
100,000 87,250
1,496,454 Balance at 31 March 1,525,680
£'000
2016/17
The Capital Adjustment Account absorbs the timing differences arising from the different arrangements for accounting for
the consumption of non-current assets and for financing the acquisition, construction or enhancement of those assets
under statutory provisions. The Account is debited with the cost of acquisition, construction or enhancement as
depreciation, impairment losses and amortisations are charged to the Comprehensive Income and Expenditure Statement
(with reconciling postings from the Revaluation Reserve to convert current value figures to a historical cost basis). The
Account is credited with the amounts set aside by the Council as finance for the costs of acquisition, construction and
enhancement.
The Account contains accumulated gains and losses on Investment Properties and gains recognised on donated assets
that have yet to be consumed by the Council.
The Account also contains revaluation gains accumulated on Property, Plant and Equipment before 1 April 2007, the date
that the Revaluation Reserve was created to hold such gains.
Note 7 provides details of the source of all the transactions posted to the Account, apart from those involving the
Revaluation Reserve.
48

25 UNUSABLE RESERVES (continued)
Financial Instruments Adjustment Account
2015/16 2016/17
£'000 £'000
568 Balance at 1 April 284
(284)
Amount by which finance costs charged to the Comprehensive Income and Expenditure
Statement are different from finance costs chargeable in the year in accordance with
statutory requirements (284)
284 Balance at 31 March 0
Pensions Reserve
2015/16 2016/17
£'000 £'000
(649,564) Balance at 1 April (516,595)
151,822 Actuarial gains or losses on pensions assets and liabilities (91,986)
(64,399)
Reversal of items relating to retirement benefits debited or credited to the Surplus or
Deficit on the Provision of Services in the Comprehensive Income and Expenditure
Statement
(56,497)
45,546Employer’s pensions contributions and direct payments to pensioners payable in the
year45,956
(516,595) Balance at 31 March (619,122)
The Financial Instruments Adjustment Account absorbs the timing differences arising from the different arrangements
for accounting for income and expenses relating to certain financial instruments and for bearing losses or benefiting
from gains per statutory provisions. The Council uses the Account to manage premiums paid on the early redemption
of loans. Premiums are debited to the Comprehensive Income and Expenditure Statement when they are incurred,
but reversed out of the General Fund Balance to the Account in the Movement in Reserves Statement. Over time, the
expense is posted back to the General Fund Balance in accordance with statutory arrangements for spreading the
burden on council tax. In the Council’s case, this period is the unexpired term that was outstanding on the loans when
they were redeemed. As a result, the balance on the Account was charged to the General Fund over 10 years with
the final charge in 2016/17.
The Pensions Reserve absorbs the timing differences arising from the different arrangements for accounting for post
employment benefits and for funding benefits in accordance with statutory provisions. The Council accounts for post
employment benefits in the Comprehensive Income and Expenditure Statement as the benefits are earned by
employees accruing years of service, updating the liabilities recognised to reflect inflation, changing assumptions and
investment returns on any resources set aside to meet the costs. However, statutory arrangements require benefits
earned to be financed as the Council makes employer’s contributions to pension funds or eventually pays any
pensions for which it is directly responsible. The debit balance on the Pensions Reserve therefore shows a
substantial shortfall in the benefits earned by past and current employees and the resources the Council has set
aside to meet them. The statutory arrangements will ensure that funding will have been set aside by the time the
49

25 UNUSABLE RESERVES
Collection Fund Adjustment Account
2015/16 2016/17
£'000 £'0008,047 Balance at 1 April 728
(7,319) (3,029)
728 Balance at 31 March (2,301)
Accumulated Absences Account
2015/16 2016/17£'000 £'000
(2,988) Balance at 1 April (2,370)
2,988 Settlement or cancellation of accrual made at the end of the preceding year 2,370
(2,370) Amounts accrued at the end of the current year (3,929)
618
Amount by which officer remuneration charged to the Comprehensive Income
and Expenditure Statement on an accruals basis is different from
remuneration chargeable in the year in accordance with statutory (1,559)
(2,370) Balance at 31 March (3,929)
Deferred Capital Receipts
2015/16 2016/17
£'000 £'00011 Balance at 1 April 2
(9) Transfer to the Capital Receipts Reserve upon receipt of cash (2)
2 Balance at 31 March 0
The Collection Fund Adjustment Account manages the differences arising from the recognition of council tax income
in the Comprehensive Income and Expenditure Statement as it falls due from council tax payers compared with the
statutory arrangements for paying across amounts to the General Fund from the Collection Fund.
The Accumulated Absences Account absorbs the differences that would otherwise arise on the General Fund Balance
from accruing for compensated absences earned but not taken in the year e.g. annual leave entitlement carried
forward at 31st March. Statutory arrangements require that the impact on the General Fund Balance is neutralised by
transfers to or from the Account.
The Deferred Capital Receipts Reserve holds the gains recognised on the disposal of non-current assets but for which
cash settlement has yet to take place. Under statutory arrangements, the Council does not treat these gains as usable
for financing new capital expenditure until they are backed by cash receipts. When the deferred cash settlement
eventually takes place, amounts are transferred to the Capital Receipts Reserve.
Amount by which council tax income credited to the Comprehensive Income and
Expenditure Statement is different from council tax income calculated for the year in
accordance with statutory requirements
50

26a NOTE A TO THE CASH FLOW STATEMENT
2015/16
£'000
70,468 Net Surplus or (Deficit) on the Provision of Services 62,808
Adjust net surplus or (deficit) on the provision of services for non cash movements
39,480 Depreciation 39,199
(36,175) Impairment and downward valuations (11,795)
(2,168) Adjustments for effective interest rates 338
Increase/Decrease in Interest Creditors
(6,469) Increase/Decrease in Creditors (50,850)
18,022 Increase/Decrease in Debtors 16,732
18,873 Pension Liability 10,541
(2,382) Contributions to/(from) Provisions 2,329
23,225
Carrying amount of non-current assets sold (property, plant and equipment, investment
property and intangible assets) 37,651
52,406 44,145
(16,001) Capital Grants credited to surplus or deficit on the provision of services (12,082)
0 Proceeds from the sale of short and long term investments
Premiums or Discounts on the repayment of financial liabilities
(39,853)
Proceeds from the sale of property plant and equipment, investment property and intangible
assets (80,133)
(55,854) (92,215)
67,020 Net cash flows from operating activities 14,738
26b CASH FLOW STATEMENT - OPERATING ACTIVITIES
The cash flows for operating activities include the following items:
2015/16 2016/17
£'000 £'000
1,621 Interest received 2,519
(10,419) Interest paid (8,090)
(8,798) (5,571)
27 CASH FLOW STATEMENT - INVESTING ACTIVITIES
2015/16 2016/17
£'000 £'000
(86,126) Purchase of property, plant and equipment, investment property and intangible assets (70,455)
(75,841) Purchase of short-term and long-term investments (20,078)
36,154
Proceeds from the sale of property, plant and equipment, investment property and intangible
assets 73,995
Proceeds from short-term and long-term investments
20,056 Other receipts from investing activities 26,315
(105,757) Net cash flows from investing activities 9,777
28 CASH FLOW STATEMENT - FINANCING ACTIVITIES
2015/16 2016/17
£'000 £'000
(1,572) Billing Authorities - Council Tax and NNDR adjustments 0
(964)
Cash payments for the reduction of the outstanding liabilities relating to finance leases and
on-balance sheet PFI contracts (557)
(371) Repayments of short- and long-term borrowing (371)
(2,907) Net cash flows from financing activities (928)
2016/17
£'000
Adjust for items included in the net surplus or deficit on the provision of services that
are investing or financing activities
51

29 TRADING OPERATIONS
The following services are reported as trading activities
Expenditure Income Surplus/ Expenditure Income Surplus/ Balance
(Deficit) (Deficit) 31/03/2017
£'000 £'000 £'000 £'000 £'000 £'000 £'000
2,125 2,481 356 2,520 2,419 (101) 767
2,125 2,481 356 2,520 2,419 (101) 767
30 CONTINGENT LIABILITIES
Housing Transfers to Registered Social Landlords
30a CONTINGENT ASSETS
33
31 POOLED BUDGETS
ICES BCF
£'000 £'000
The Council 1,167 9,015
Barts and the London Trust health services 813 0
Clinical Commissioning Group (CCG) 0 12,448
1,980 21,463
Expenditure 1,980 19,195
0 2,268
ICES BCF
£'000 £'000
The Council 812 9,092
Barts and the London Trust health services 836 0
Clinical Commissioning Group (CCG) 0 12,357
1,648 21,449
Expenditure 1,680 20,329
(32) 1,120
32
2015/16 2016/17
£'000 £'000
788 882
788 882
Note - The number of Members in Tower Hamlets was reduced to 45 from the May 2014 election.
Income
2015/16
Over recent years the Council has entered into development agreements to develop sites as part of its regeneration of the Ocean Estate and Blackwall Reach
areas. In the event of any of the individual sites achieving overall profit for the development partners, an overage payment may become due to the Council. Any
subsequent use of overage receipts arising from the Ocean Estate scheme must contribute towards the development of new affordable homes as agreed with
the Greater London Authority.
Regeneration Schemes
(a) Integrated Community Equipment Service (ICES)
(b) Better Care Fund (BCF)
Leisure Contracts
The Council has agreement in principle to recover over £1million of leisure contract payments made in 2016/17. This is awaiting ratification as at the balance
sheet date.
Total
Surplus/Deficit for the year
Surplus/(Deficit) for the year
MEMBERS' ALLOWANCES
The Council paid the following amounts to Members of the council during the year.
A summary memorandum Income and Expenditure Account for each pooled budget is shown below. The Council's contribution to each pool is included in the
Adult Social Care gross expenditure figure disclosed in the Comprehensive Income and Expenditure Account.
The purpose of the arrangements for ICES and BCF is to work collaboratively with health providers in the Borough, to deliver efficient, joined up health and social
care services to residents.
Allowances
Income
2016/17
Under the terms of a Section 75 Agreement (National Health Service Act 2006), the Council entered into two Pooled Budget and Lead Commissioning
agreements with the Primary Care Trust. The Council will manage and deliver statutory functions, alongside the Clinical Commissioning Group, in respect of the
following:
Death of Child In Mile End Park
Between March 1998 and March 2016 the Council transferred tenanted and leasehold properties to other landlords - 7,457 to Poplar Housing and Regeneration
Community Association; 2,392 to Tower Hamlets Community Housing; 970 to Swan Housing Association; 3,537 to East End Homes; 2,079 to Toynbee Island
Homes; 238 to Bethnal Green and Victoria Park Housing Association and 106 to Spitalfields Housing Association. The Council has given warranties to provide
the funders of those landlords with a level of comfort in relation to their loans, which represents a potential liability to the Council. The amount of the potential
liability cannot be determined with any certainty at present.
In 2015, a child died in Mile End Park. A coroners hearing is to consider the cause of death pending further investigations. Provision has been made within the
insurance provision to meet the maximum potential insurance liability. At this time, it is uncertain if further liabilities will be raised against the Council.
2016/172015/16
TOTAL TRADING ACCOUNTS
Street Trading
52
52

33
Salary, Fees
and
Allowances Expenses
Compen-
sation for
Loss of
Office
Pension
Contrib-
ution Other Total
£ £ £ £ £ £
Mr W Tuckley - Chief Executive 1 86,503 0 0 13,448 0 99,951
Mr S Halsey - Head of Paid Service & Corporate Director CLC 2 94,540 0 0 13,712 0 108,252
Total Head of Paid Service 181,043 0 0 27,160 0 208,203
Corporate Directors
Adults Services (Interim) 3 62,792 0 0 9,921 0 72,713
Childrens Services 4 6,682 0 0 0 0 6,682
Childrens Services (Interim) 5 115,600 0 0 0 0 115,600
Communites, Localities and Culture 6 62,361 0 0 9,634 0 71,995
Development and Renewal 138,086 0 0 21,331 0 159,417
Education, Health and Wellbeing 7 79,172 0 147,940 6,525 0 233,637
Law, Probity & Governance 8 64,612 0 0 9,947 0 74,559
Public Health 100,472 0 0 14,755 0 115,227
Resources 9 80,996 0 0 12,476 0 93,472
Resources (Acting) 10 41,486 0 0 6,390 0 47,876
Other
Monitoring Officers 11 41,715 0 0 0 0 41,715
975,017 0 147,940 118,139 0 1,241,096
1 Commenced 19/10/2015
2 Head of paid service role ended 18/10/2015
3 Commenced 01/07/2015
4 Commenced 14/03/2016
5 From 14/07/2015 to 11/03/2016
6 From 19/10/2015
7 Left 13/07/2015
8 Commenced 17/09/2015
9 Commenced 03/08/2015
10 Acting up ended 02/08/2015
11 Monitoring Officer role within Director for Law Probity & Governance post from 17/09/2015. Cost of monitoring officers until 16/09/2015 shown
Salary, Fees
and
Allowances Expenses
Compen-
sation for
Loss of
Office
Pension
Contribu-
tion Other Total
£ £ £ £ £ £
Mr W Tuckley - Chief Executive 196,926 0 0 30,623 110 227,659
Total Head of Paid Service 196,926 0 0 30,623 110 227,659
Corporate Directors
Childrens Services 139,568 0 0 0 0 139,568
Communites, Localities and Culture 1 34,090 0 236,777 109,386 0 380,253
Health, Adults & Community 2 116,938 0 0 18,005 0 134,943
Law, Probity & Governance 3 80,605 0 0 14,450 0 95,055
Mr G White - Law, Probity & Governance & Monitoring Officer (Interim) 4 111,978 7 0 0 0 111,985
Place (formerly Development & Renewal) 5 139,467 0 0 21,545 0 161,012
Public Health 101,562 0 0 14,523 0 116,085
Resources 126,162 0 0 19,443 0 145,605
1,047,296 7 236,777 227,975 110 1,512,165
1 Left 30/06/2016
2 Post title Director of Adult Services until 08/01/2017
3 Left 27/11/2016
4 Commenced 15/08/2016
6 Post title Director of Development & Renewal until 08/01/2017
2015/16 2016/17
Teaching
Staff
Includes
Teaching
Redund-
ancies
Other
Staff
Includes
Other Staff
Redund-
ancies Total Staff
Teaching
Staff
Includes
Teaching
Redund-
ancies Other Staff
Includes
Other Staff
Redund-
ancies Total Staff
246 (1) 117 (17) 363 199 0 110 (4) 309
159 0 48 (6) 207 156 (3) 50 (7) 206
53 0 53 (9) 106 70 (2) 45 (6) 115
36 0 24 (2) 60 36 (1) 26 (2) 62
35 0 27 (6) 62 34 (1) 24 0 58
20 (1) 13 (1) 33 18 0 15 (3) 33
17 (2) 4 0 21 15 (3) 8 (1) 23
4 0 6 (3) 10 8 0 2 (1) 10
6 0 2 (1) 8 3 0 2 0 5
7 0 4 (3) 11 5 (1) 3 (2) 8
2 0 7 (1) 9 3 0 3 0 6
3 0 4 (2) 7 4 0 4 (2) 8
2 0 1 0 3 2 0 3 (2) 5
0 0 0 0 0 1 0 0 0 1
0 0 1 (1) 1 0 0 0 0 0
1 0 0 0 1 2 0 0 0 2
1 0 0 0 1 1 (1) 0 0 1
2 0 0 0 2 0 0 0 0 0
0 0 0 0 0 0 0 1 (1) 1
0 0 1 (1) 1 1 0 0 0 1
1 0 0 0 1 1 0 1 (1) 2
0 0 2 (2) 2 0 0 0 0 0
0 0 0 0 0 0 0 2 (2) 2
0 0 1 (1) 1 0 0 0 0 0
0 0 0 0 0 0 0 1 (1) 1
0 0 0 0 0 0 0 1 (1) 1
595 (4) 315 (56) 910 559 (12) 301 (36) 860
230,000 - 234,999
The Council's other employees receiving more than £50,000 remuneration for the year (excluding employer's pension contribution) were paid the following
amounts:
65,000 - 69,999
OFFICERS' REMUNERATION
125,000 - 129,999
70,000 - 74,999
75,000 - 79,999
80,000 - 84,999
85,000 - 89,999
90,000 - 94,999
95,000 - 99,999
100,000 - 104,999
105,000 - 109,999
110,000 - 114,999
115,000 - 119,999
160,000 - 164,999
130,000 - 134,999
140,000 - 144,999
145,000 - 149,999
150,000 - 154,999
180,000 - 184,999
185,000 - 189,999
190,000 - 194,999
The remuneration paid to the Council’s senior employees is as follows:
amounts:*
2015/16
2016/17
50,000 - 54,999
55,000 - 59,999
60,000 - 64,999
Remuneration band
(£)
155,000 - 159,999
120,000 - 124,999
53

2015/16 2016/17 2015/16 2016/17 2015/16 2016/17 2015/16 2016/17
3 0 109 78 112 78 981 667
20,001 - 40,000 1 0 55 40 56 40 1,649 1,137
40,001 - 60,000 0 0 30 25 30 25 1,434 1,233
60,001 - 80,000 0 0 18 5 18 5 1,205 320
80,001 - 100,000 0 0 9 6 9 6 813 554
100,001 - 150,000 0 0 11 10 11 10 1,352 1,207
150,001 - 200,000 0 0 3 0 3 0 494 0
200,001 - 250,000 0 0 1 0 1 0 226 0
300,001 - 350,000 0 0 0 1 0 1 0 339
4 0 236 165 240 165 8,154 5,457
34 CAPITAL EXPENDITURE AND CAPITAL FINANCING
The following table shows how capital expenditure was financed in the year.
2015/16 2016/17
£'000 £'000
Expenditure
82,081 69,070
0 0
Heritage Assets 0 1
10,898 12,674
92,979 81,745
Sources of Finance
Borrowing 145 2,096
Capital Grants and Contributions 57,073 31,591
Capital Receipts 841 7,913
Major Repairs Reserve 28,319 14,517
Direct Revenue Funding 6,600 25,627
92,978 81,744
2015/16 2016/17
£'000 £'000
Opening Capital Financing Requirement 263,618 262,588
Capital investment
88,072 93,689
0 0
Heritage Assets 0 1
10,898 12,674
Sources of finance
(57,073) (31,591)
(841) (7,913)
(28,319) (14,517)
(6,600) (25,627)
(7,084) (7,097)
(83) (504)
Closing Capital Financing Requirement 262,588 281,703
Explanation of movements in year
(7,166) (7,599)
145 2,096
5,991 24,618
Increase/(decrease) in Capital Financing Requirement (1,030) 19,115
Increase in underlying need to borrow (unsupported by government financial assistance)
Assets acquired under finance leases
TOTAL
Revenue Expenditure Funded from Capital Under Statute
• HRA Revenue Provision for Debt Repayment on Finance Lease Principal
Revenue Expenditure Funded from Capital under Statute
Intangible Assets
Property, Plant and Equipment
Major repairs reserve
Capital receipts
Decrease in underlying need to borrow (supported by government financial assistance)
Exit Package cost band
(£)
Sums set aside from revenue:
Capital grants and contributions
• Minimum Revenue Provision1
• Direct revenue contributions
Exit Payments
Total cost of exit
packages in each band
(£000)
The number of exit payments with total cost per band and total cost of the compulsory and other redundancies are set out in the table
below:
0 - 20,000
Number of compulsory
redundancies
Number of other
departures agreed
Total number of exit
packages by cost band
Total
The total amount of capital expenditure incurred in the year is shown in the table below (including the value of assets acquired
under finance leases and PFI contracts), together with the resources that have been used to finance it. Where capital expenditure
is to be financed in future years by charges to revenue as assets are used by the Council, the expenditure results in an increase
in the Capital Financing Requirement (CFR), a measure of the capital expenditure incurred historically by the Council that has yet
to be financed. The CFR is analysed in the second part of this note.
Property, Plant and Equipment
The above table includes any compensation for loss of office payments included within the senior officer remuneration note on previous
page.
Intangible Assets
TOTAL
54

35
2015/16 2016/17
£'000 £'000
210 210
20 2
20 23
46 53
Total 296 288
36
Notes DSG Receivable for 2015/16
Central
Expenditure
Individual
Schools
Budget Total
£'000 £'000 £'000
A DSG for 2015/16 before Academy Recoupment 44,933 276,075 321,008
B Academy figure Recouped 2015/16 0 (22,350) (22,350)
C Total DSG after Academy Recoupment 2015/16 44,933 253,726 298,659
D Brought forward from 2014/15 7,913
E Carry forward to 2016/17 agreed in advance 0 0 0
F Agreed initial budgeted distribution in 2015/16 52,845 253,726 306,571
G In-year adjustments 0 0
H Final budget distribution for 2015/16 52,845 253,726 306,571
I Less actual central expenditure (49,980) 0 (49,980)
J Less actual ISB deployed to schools 0 (254,334) (254,334)
K Council contribution for 2015/16 3,818 0 3,818
L Carry forward to 2016/17 6,683 (608) 6,075
A DSG figure as issued by DfE in July 2014.
B
C Total DSG after Academy Recoupment 2015/16.
D Figure brought forward from 2014/15.
E
F
G
H Budgeted distribution of DSG at year end.
I Actual amount of central expenditure items in 2015/16.
J
K
L
Notes DSG Receivable for 2016/17
Central
Expenditure
Individual
Schools
Budget Total
£'000 £'000 £'000
A DSG for 2016/17 before Academy Recoupment 30,684 295,847 326,531
B Academy figure Recouped 2016/17 (30,745) (30,745)
C Total DSG after Academy Recoupment 2016/17 30,684 265,102 295,786
D Brought forward from 2015/16 6,074 6,075
E Carry forward to 2017/18 agreed in advance 0 0 0
F Agreed initial budgeted distribution in 2016/17 36,758 265,102 301,860
G In-year adjustments 0 0 0
H Final budget distribution for 2016/17 36,758 265,102 301,860
I Less actual central expenditure (35,103) 0 (35,103)
J Less actual ISB deployed to schools 0 (265,102) (265,102)
K Council contribution for 2016/17 0 0 0
L Carry forward to 2017/18 1,655 0 1,655
A DSG figure as issued by DfE in March 2017.
B
C Total DSG after Academy Recoupment 2016/17.
D Figure brought forward from 2015/16.
E
F
G
H Budgeted distribution of DSG at year end.
I Actual amount of central expenditure items in 2016/17.
J
K
L
The fees payable to the external auditors for other services comprise £6.5k for Pooling of Housing Capital Receipts & Teachers Pensions
and other Audit work: £28k for consideration of objection to accounts relating to the use of LOBO loans (including legal fees to date); and
£18k for 2015/16 additional work and testing.
Amount of ISB distributed to schools.
Changes to Initial distribution in 2015/16.
Budgeted distribution of DSG, adjusted for carry forward, as agreed with the schools forum.
The amount which the Council decided after consultation with the schools forum to carry forward to 2016/17 rather than distribute
in 2015/16.
Addition fees payable to external Audit for inquiries relating to previous year
Contribution from the Council in 2015/16 which substituted for DSG in funding the Schools Budget
EXTERNAL AUDIT COSTS
DEDICATED SCHOOLS GRANT
The Council has incurred the following costs in relation to the audit of the Statement of Accounts, certification of grant claims and statutory
inspections and to non-audit services provided by the Council’s external auditors - KPMG LLP.
The Council's expenditure on schools is funded by grant monies provided by the Department for Children, Schools and Families - the
Dedicated Schools Grant (DSG). DSG is ring-fenced and can only be applied to meet expenditure properly included in the Schools Budget.
The Schools Budget includes elements for a restricted range of services provided on an authority-wide basis and for the Individual Schools
Budget, which is divided into a budget share for each school. Over and underspends on the two elements are required to be accounted for
separately.
Fees payable to appointed external auditor with regard to external audit services carried out by the
appointed auditor for the year
Fees payable to appointed external auditor for the certification of grant claims and returns for the year
Fees payable in respect of other services provided by external auditors during the year
.Academy figure Recouped 2015/16
Contribution from the Council in 2016/17 which substituted for DSG in funding the Schools Budget.
Difference between budgeted distributions and actuals plus carry forward agreed in advance.
Difference between budgeted distributions and actuals plus carry forward agreed in advance.
Academy figure Recouped 2016/17.
The amount which the Council decided after consultation with the schools forum to carry forward to 2016/17 rather than distribute
in 2016/17.
Budgeted distribution of DSG, adjusted for carry forward, as agreed with the schools forum.
Changes to Initial distribution in 2016/17.
Amount of ISB distributed to schools.
55

37 GRANT INCOME
2015/16 2016/17
Restated 1
£'000 £'000
Non-Ringfenced Government Grants
Business Rate Related Grants (7,972) (7,486)
Council Tax Freeze Grant (901) 0
Council Tax Related Grants (96) 0
Local Service Support Grant (88) 0
New Homes Bonus (18,143) (28,875)
Revenue Support Grant (Formula Grant) (84,300) (68,664)
Total Non-Ringfenced Government Grants (111,500) (105,025)
Capital Grants and Contributions
Non-conditional grants:
Schools-funded Capital Programme (1,815) (1,824)
Transport for London Funding (2,315) (2,895)
Major Works Contributions (cash received) (3,328) (3,236)
Capital Maintenance Grant (3,126) (3,165)
Basic Needs/New Pupil Places (6,459) (11,477)
Decent Homes Backlog Funding (13,270) 0
Community Infrastructure Levy (CIL) (6,832) (18,165)
Other Non-Conditional Grants Received (99) (1,071)
Conditional grants:
Energy Efficiency Grant (Fuel Poverty Fund) (2,254) 0
Building the Pipeline Housing Grant (5,828) 0
National Affordable Housing Programme 0 (6,163)
Other Conditional Grants Applied 245 (346)
Developers' Contributions (capital) (3,895) (1,894)
Total Capital Grants and Contributions (48,976) (50,236)
Credited to Services
Capital Grants funding REFCUS (6,615) (4,397)
Developers' Contributions (capital) funding REFCUS (2,192) (2,793)
Developers' Contributions (revenue) (4,491) (2,117)
Dedicated Schools Grant (300,087) (300,651)
Education Services Grant (4,153) (3,751)
PFI Credits (8,148) (7,922)
School Sixth Form Grant (17,660) (16,448)
Pupil Premium Grant (24,606) (22,231)
Public Health Grant (34,017) (36,883)
Reception Baseline Assessment (3,229) (3,009)
Housing Benefit Subsidy (273,497) (270,375)
Other Revenue Grants (16,430) (16,601)
Total Credited to Services (695,125) (687,178)
Total Grant Income in Comprehensive Income & Expenditure Account (855,601) (842,439)
Receipt in Advance Grant Balances31st March
2016
31st March
2017£'000 £'000
Capital Grants Receipts in Advance
Developers' Contributions (capital) 61,788 74,350
Major Works Invoices 6,028 6,123
National Affordable Housing Programme 6,163 0
New Homes Bonus London Enterprise Panel (LEP) - capital element 1,000 1,000
Other conditional capital grants and contributions 1,147 1,647
Total Capital Grants Receipts in Advance 76,126 83,120
Revenue Grants Receipts in Advance
Developers' Contributions (revenue) 6,029 8,151
Dedicated Schools Grant 6,115 1,655
PFI Credits 2,541 4,001
New Homes Bonus London Enterprise Panel (LEP) - revenue element 5,685 4,355
Housing Benefit Subsidy 18,726 31,929
Other conditional revenue grants 5,744 1,206
Total Revenue Grants Receipts in Advance 44,840 51,297
Total Grant Receipt in Advance Balances 120,966 134,417
1 2015/16 figures restated to include Dedicated Schools Grant, Education Services Grant and Benefit Subsidy and to show receipt in advance
balances for revenue grants with conditions
The Council credited the following grants, contributions and donations to the Comprehensive Income and
Expenditure Statement in 2016/17:
Credited to Taxation and Non Specific Grant Income
The Council has received a number of grants, contributions and donations that have yet to be recognised as
income as they have conditions attached to them that will require the monies or property to be returned to the
giver. The balances at the year-end are as follows:
56

38 RELATED PARTIES
Central Government
Partnerships
NDC (New Deal for the Community)
CCG (Clinical Commissioning Group)
Pension Fund
Subsidiary
Membership of and relationship with other organisations
Organisations Councillor Relationship With Organisation
Payments
by the
Council over
£10k 2015/16
Payments
by the
Council
over £10k
2016/17
Amounts
due to
Orgs. >
£10k at
31/03/17
£'000 £'000 £'000
Aldgate and Allhallows Barking Foundation S Islam Council Representative
D Jones Council Representative
Balagonji Educational Trust S Ali
Bangladesh Football Association A Begum Husband - Trustee 28
Bangladesh Youth Movement A Khan Employee 41 39
Bengali Educational Society S Islam Treasurer
Betar Bangla S Islam Member 13
Bromley By Bow Centre H Uddin Employee 994 961 153
Central Foundation Girls School M M Miah Governor 30
Culloden Bangladeshi Parents Association A M O Ahmed Member 13 15
Community Martial Arts Trust A Miah Employee
Developmental Council of Banglahdeshis in the UK K U Ahmed Joint Treasurer
Docklands Sailing & Watersports Centre D Chesterton Member 13
Department for Work and Pensions O Rahman Employee
East London Foundation Trust A W Gibbs Council Representative 3,557 3,549 220
Eastside Books Ltd D Jones Director of bookshop that supplies books to LBTH schools
East End Homes A Cregan Council Representative 758 622 21
G Robanni Member
Gateway Housing Association H Uddin Employer has a Working Relationship with this Organisation 69 46 11
Golapgonj Education Trust A M O Ahmed Trustee
S Khatun Member
Green Candle Dance Company P Golds Council Representative 40 52
Hermitage Primary School M Alam Governor
Ian Mikardo High School D Hassell Governor
Island Homes Housing Association M Miah Resident Board Member - receives a monthly allowance
Island Neighbourhood Project M Miah Employee 11
Island Sports Trust P Golds
Isle of Dogs Community Foundation D J Edgar Council Representative
John Scurr Primary School S Islam Governor
Leaside Regeneration Ltd D J Edgar Council Representative
Lee Valley Regional Park Authority D Jones Council Representative 237+
London Councils C Harrisson Pensions CIV Joint Committee 1,143 923 287
London Education Trust M A Mustaqim
London Legacy Development Corporation R Blake Council Representative 186
J Biggs Member
Mile End Park Partnership Board D Jones Council Representative
Mulberry Girls School D Jones Governor 12 29 26
National Housing Federation J Pierce Employee
National Union of Teachers D Hassell Member
Norton Folgate Almshouses Charity J Pierce Council Representative
Old Ford Housing Association M Francis Board Director 90 153 16
Old Palace School M Miah Governor
Olga Primary School C Harrisson Governor 34 12 20
Poplar Bangladeshi Project A M O Ahmed Member 11
Poplar Harca A M O Ahmed 5,819 4,220 1,034
Rich Mix Cultural Foundation D Jones Director 711 11
A Begum Council Representative
Solander Gardens Community & Education H Miah Secretary
Spitalfields Housing Association Ltd A Mukit* Board Member
A Begum Family Member- Trustee
St Katherine & Shadwell Trust S Haque Deputy
The Council has partnership arrangements with the following organisations:
The Council oversees the administration of the pension fund. The Pension Fund can borrow from the Council. The Pension Fund accounts are presented on later pages to this Statement.
Where a Member has involvement with an external organisation, the Council discloses details of the relationship. In addition, if the Council makes material payments to the organisation, then
details of amounts over £10,000 are disclosed.
Tower Hamlets Homes is a wholly owned subsidiary of London Borough of Tower Hamlets. Details of Tower Hamlets Homes are within note 44.
The Council is required to disclose material transactions with related parties – bodies or individuals that have the potential to control or influence the council or to be controlled or influenced by
the council. Disclosure of these transactions allows readers to assess the extent to which the council might have been constrained in its ability to operate independently or might have secured
the ability to limit another party’s ability to bargain freely with the Council.
Central government has effective control over the general operations of the Council– it is responsible for providing the statutory framework within which the council operates, provides the
majority of its funding in the form of grants and prescribes the terms of many of the transactions that the Council has with other parties (e.g. council tax bills, housing benefits). Grants
received from central government departments and other grant making bodies are set out in the subjective analysis in Note 37 on reporting for resources allocation decisions. Grant receipts
outstanding at 31 March 2017 are within the creditors note.
57
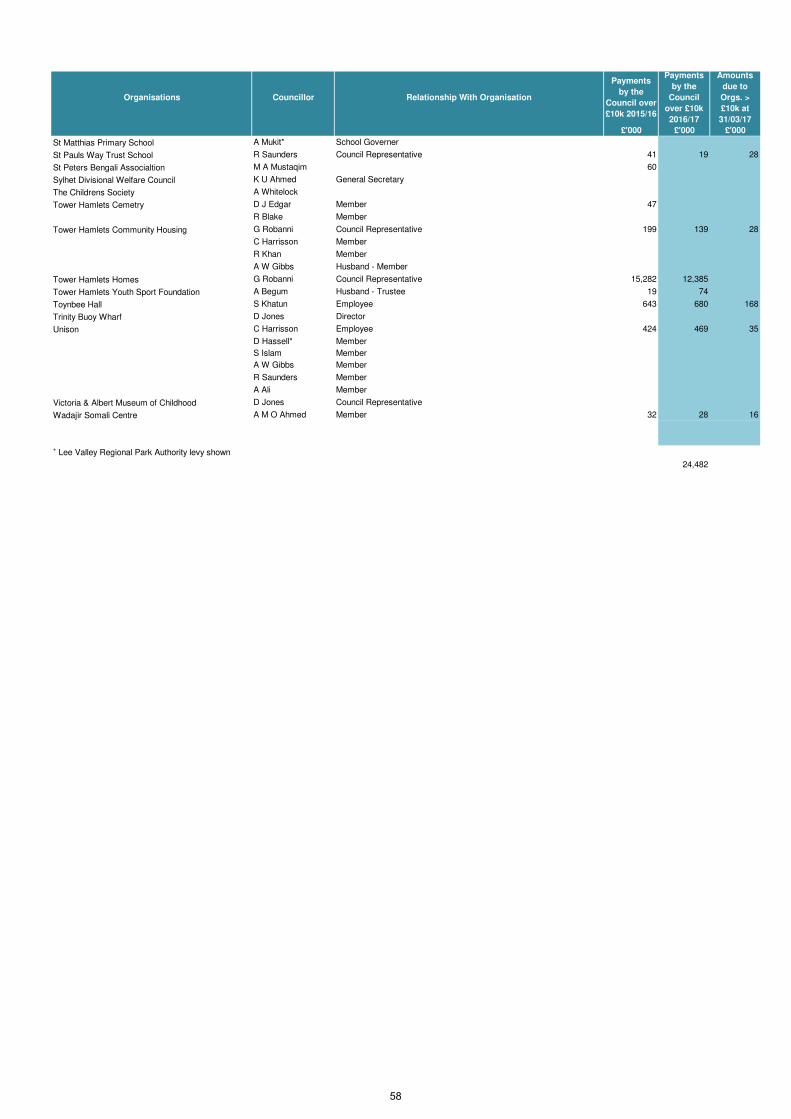
Organisations Councillor Relationship With Organisation
Payments
by the
Council over
£10k 2015/16
Payments
by the
Council
over £10k
2016/17
Amounts
due to
Orgs. >
£10k at
31/03/17
£'000 £'000 £'000
St Matthias Primary School A Mukit* School Governer
St Pauls Way Trust School R Saunders Council Representative 41 19 28
St Peters Bengali Associaltion M A Mustaqim 60
Sylhet Divisional Welfare Council K U Ahmed General Secretary
The Childrens Society A Whitelock
Tower Hamlets Cemetry D J Edgar Member 47
R Blake Member
Tower Hamlets Community Housing G Robanni Council Representative 199 139 28
C Harrisson Member
R Khan Member
A W Gibbs Husband - Member
Tower Hamlets Homes G Robanni Council Representative 15,282 12,385
Tower Hamlets Youth Sport Foundation A Begum Husband - Trustee 19 74
Toynbee Hall S Khatun Employee 643 680 168
Trinity Buoy Wharf D Jones Director
Unison C Harrisson Employee 424 469 35
D Hassell* Member
S Islam Member
A W Gibbs Member
R Saunders Member
A Ali Member
Victoria & Albert Museum of Childhood D Jones Council Representative
Wadajir Somali Centre A M O Ahmed Member 32 28 16
+ Lee Valley Regional Park Authority levy shown
24,482
58
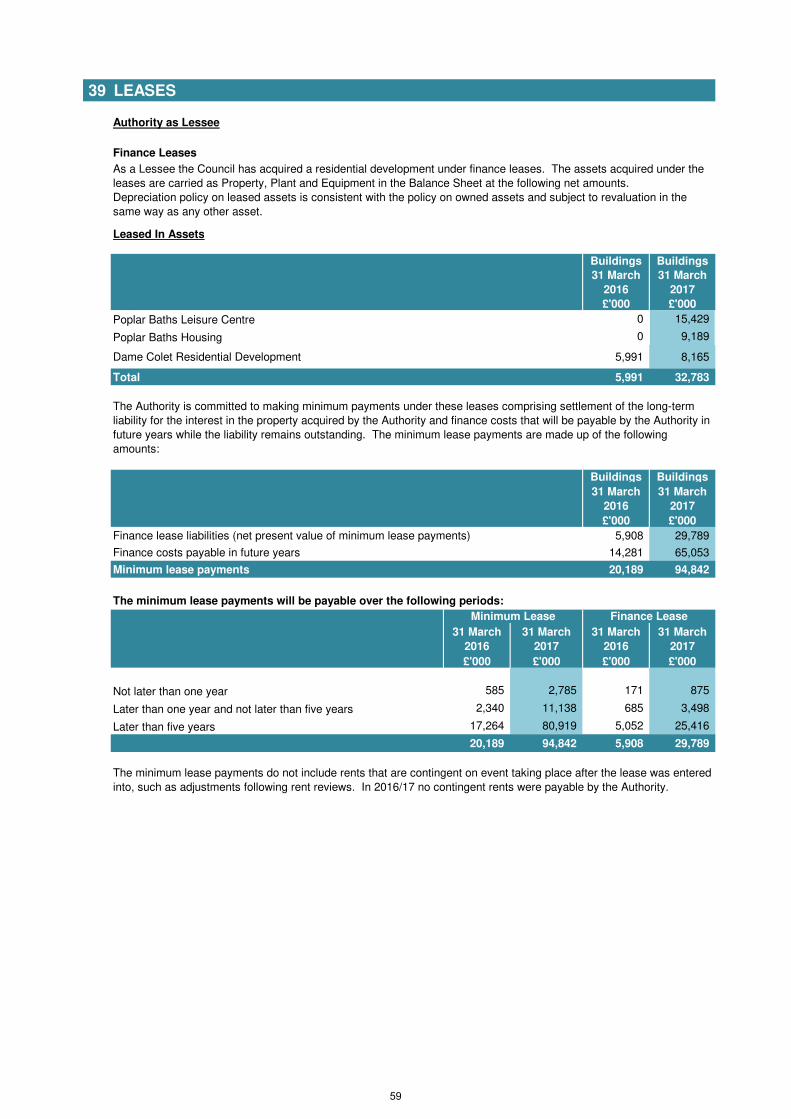
39 LEASES
Authority as Lessee
Finance Leases
Leased In Assets
Buildings Buildings
31 March
2016
31 March
2017
£'000 £'000
Poplar Baths Leisure Centre 0 15,429
Poplar Baths Housing 0 9,189
Dame Colet Residential Development 5,991 8,165
Total 5,991 32,783
Buildings Buildings
31 March
2016
31 March
2017
£'000 £'000
Finance lease liabilities (net present value of minimum lease payments) 5,908 29,789
Finance costs payable in future years 14,281 65,053
Minimum lease payments 20,189 94,842
The minimum lease payments will be payable over the following periods:
31 March
2016
31 March
2017
31 March
2016
31 March
2017
£'000 £'000 £'000 £'000
Not later than one year 585 2,785 171 875
Later than one year and not later than five years 2,340 11,138 685 3,498
Later than five years 17,264 80,919 5,052 25,416
20,189 94,842 5,908 29,789
The minimum lease payments do not include rents that are contingent on event taking place after the lease was entered
into, such as adjustments following rent reviews. In 2016/17 no contingent rents were payable by the Authority.
As a Lessee the Council has acquired a residential development under finance leases. The assets acquired under the
leases are carried as Property, Plant and Equipment in the Balance Sheet at the following net amounts.
Depreciation policy on leased assets is consistent with the policy on owned assets and subject to revaluation in the
same way as any other asset.
Minimum Lease Finance Lease
The Authority is committed to making minimum payments under these leases comprising settlement of the long-term
liability for the interest in the property acquired by the Authority and finance costs that will be payable by the Authority in
future years while the liability remains outstanding. The minimum lease payments are made up of the following
amounts:
59
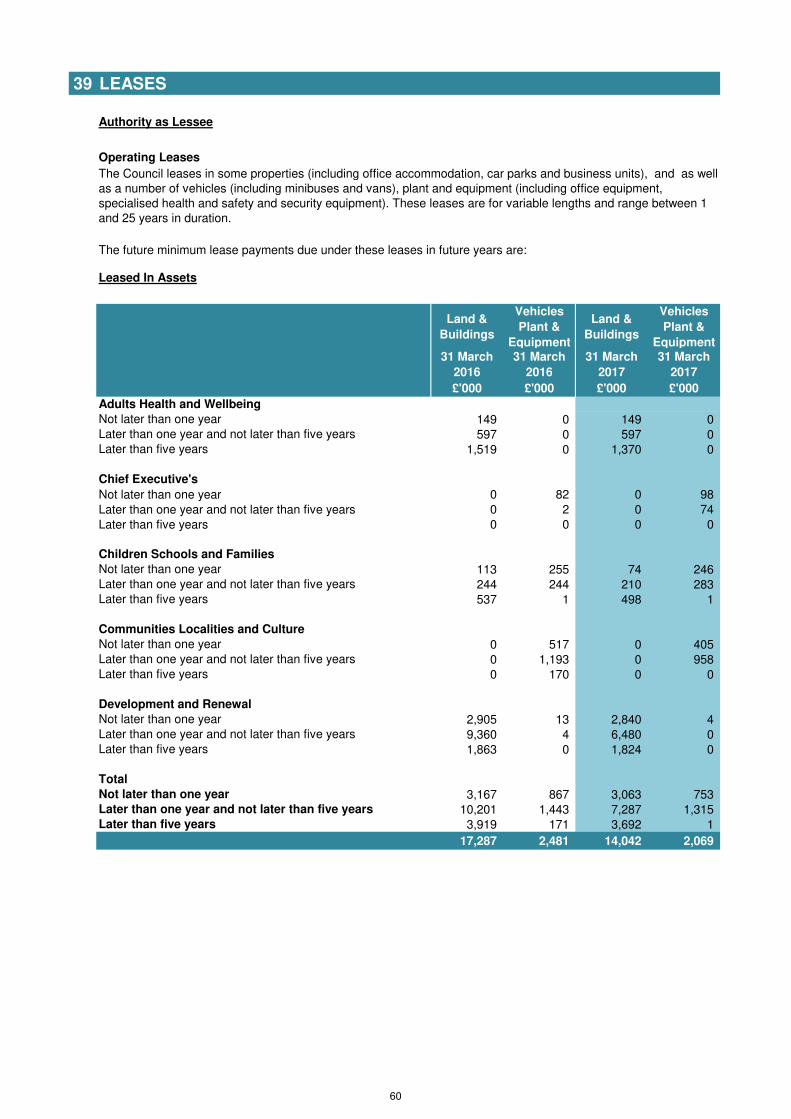
39 LEASES
Authority as Lessee
Operating Leases
Leased In Assets
Land &
Buildings
Vehicles
Plant &
Equipment
Land &
Buildings
Vehicles
Plant &
Equipment31 March
2016
31 March
2016
31 March
2017
31 March
2017
£'000 £'000 £'000 £'000
149 0 149 0
597 0 597 0
1,519 0 1,370 0
Chief Executive's
Not later than one year 0 82 0 98
Later than one year and not later than five years 0 2 0 74
Later than five years 0 0 0 0
113 255 74 246
244 244 210 283
537 1 498 1
0 517 0 405
0 1,193 0 958
0 170 0 0
2,905 13 2,840 4
9,360 4 6,480 0
1,863 0 1,824 0
3,167 867 3,063 753
10,201 1,443 7,287 1,315
3,919 171 3,692 1
17,287 2,481 14,042 2,069
The Council leases in some properties (including office accommodation, car parks and business units), and as well
as a number of vehicles (including minibuses and vans), plant and equipment (including office equipment,
specialised health and safety and security equipment). These leases are for variable lengths and range between 1
and 25 years in duration.
The future minimum lease payments due under these leases in future years are:
Later than five years
Total
Not later than one year
Later than one year and not later than five years
Later than five years
Later than one year and not later than five years
Later than five years
Development and Renewal
Not later than one year
Later than one year and not later than five years
Not later than one year
Later than one year and not later than five years
Later than five years
Communities Localities and Culture
Not later than one year
Children Schools and Families
Adults Health and Wellbeing
Not later than one year
Later than one year and not later than five years
Later than five years
60

39 LEASES (continued)
Land &
Buildings
Vehicles
Plant &
Equipment
Land &
Buildings
Vehicles
Plant &
Equipment31st March
2016
31st March
2016
31st March
2017
31st March
2017
£'000 £'000 £'000 £'000
149 0 149 0
Minimum Lease Payments 0 166 0 55
0 751 0 533
240 369 113 287
2,905 13 2,840 13
3,294 1,299 3,102 888
Authority as Lessor
Finance Leases
As a Lessor the Council has no finance leases to report .
Operating Leases
31st March
2016
31st March
2017£'000 £'000
(3,469) (3,320)
(10,618) (10,700)
(15,736) (19,286)
(29,823) (33,306)
Chief Executive's
The expenditure charged to the Services line in the Comprehensive Income and Expenditure Statement during the
year in relation to these leases was:
The Council leases out property and equipment under operating leases for economic development purposes to
provide suitable affordable accommodation for local businesses.
Adults Health and Wellbeing
Minimum Lease Payments
Communities Localities and Culture
Development and Renewal
Minimum Lease Payments
Minimum Lease Payments
Children Schools and Families
Minimum Lease Payments
Not later than one year
Later than one year and not later than five years
Total
Minimum Lease Payments
Later than five years
The future minimum lease payments receivable under non-cancellable leases in future years are:
As the primary purpose of holding these assets is to provide support to the community, rather than generating financial
gain for the Council, these assets are not considered as investment properties.
61

40
Mulberry Grouped Barkantine
School Schools Energy Total
£'000 £'000 £'000 £'000
Asset value at 31 March 2016 29,804 201,326 2,244 233,374
Depreciation (760) (5,591) (181) (6,532)
Revaluations 0 0 0 0
Enhancements 0 6,760 0 6,760
Derecognition 0 0 0 0
Asset value at 31 March 2017 29,044 202,495 2,063 233,602
Mulberry Group Barkantine
School Schools Energy Total
£'000 £'000 £'000 £'000Liabilities at 31 March 2016 6,228 29,107 2,175 37,510
Repayments/Amortisation of deferred liability (302) (706) (198) (1,206)
Liabilities at 31 March 2017 5,926 28,401 1,977 36,304
Consisting of:
Long term liability 5,592 27,585 1,779 34,957
Short-term liability 333 817 198 1,348
5,925 28,402 1,977 36,305
Mulberry Group Barkantine
School Schools Energy Total
£'000 £'000 £'000 £'000Liability
Within 1 year 333 817 198 1,348
Within 2 - 5 years 1,360 6,150 791 8,301
Within 6 - 10 years 2,812 18,816 988 22,616
Within 11 - 15 years 1,420 2,619 0 4,039
5,925 28,402 1,977 36,304
Interest
Within 1 year 665 4,469 0 5,134
Within 2 - 5 years 2,282 16,196 0 18,478
Within 6 - 10 years 1,808 11,898 0 13,706
Within 11 - 15 years 243 412 0 655
4,998 32,975 0 37,973
Service Charges
Within 1 year 673 1,709 0 2,382
Within 2 - 5 years 2,694 11,721 0 14,415
Within 6 - 10 years 3,367 13,701 0 17,068
Within 11 - 15 years 1,347 1,104 0 2,451
8,081 28,235 0 36,316
Payments due under PFI schemes
Liability value at 31 March 2017
A third PFI contract was entered into in relation to the Barkantine Estate Combined Heat and Power scheme.
There are no unitary payments made under this scheme as it is classed as a user pay arrangement. An asset was
brought onto the balance sheet in 2010/11, matched by a deferred income balance and contract ends in 2026.
PRIVATE FINANCE INITIATIVES AND SIMILAR CONTRACTS
The Council is party to two Private Finance Initiative (PFI) schemes in respect of the design, construction,
maintenance and servicing of 28 schools - the Mulberry and Group Schools schemes - until the years 2029 and
2027 respectively. Prior to 2010/11 the assets involved were treated as "off balance sheet" in accordance with
International Financial Reporting Standards the assets are included on the Council's Balance Sheet, matched by a
finance lease liability.
Movement on PFI Assets
Movement on PFI Liabilities
62

41 PENSIONS SCHEMES - DEFINED BENEFIT
Participation in pensions schemes
- The Local Government Pension Scheme, administered by the London Pensions Fund Authority
Transactions Relating to Retirement Benefits
2015/16 2016/17 2015/16 2016/17 2015/16 2016/17
£'000 £'000 £'000 £'000 £'000 £'000
42,358 37,301 385 274 42,743 37,575
1,147 918 0 103 1,147 1,021
43,505 38,219 385 377 43,890 38,596
(32,439) (35,790) (1,587) (1,667) (34,026) (37,457)
Interest cost on defined benefit obligation 52,532 53,333 2,003 2,025 54,535 55,358
20,093 17,543 416 358 20,509 17,901
63,598 55,762 801 735 64,399 56,497
Changes in demographic assumptions 0 (25,190) 0 (1,744) 0 (26,934)
Changes in financial assumptions (149,342) 290,196 (4,424) 10,217 (153,766) 300,413
Other experience (22,390) (27,267) (10) (2,375) (22,400) (29,642)
Return on plan assets excluding amounts included in net interest 29,352 (140,952) 2,104 (9,091) 31,456 (150,043)
(142,380) 96,787 (2,330) (2,993) (144,710) 93,794
(63,598) (55,762) (801) (735) (64,399) (56,497)
44,753 45,136 793 820 45,546 45,956
The TPS is an unfunded defined benefit final salary scheme meaning that there are no investment assets built up to meet the pensions liabilities, and
cash has to be generated to meet pensions payments as they eventually fall due. It does, however, use a notional fund as the basis for calculating the
employers' contribution rate paid by local education authorities (LEAs) of which the Council is one. It is not possible for the Council to identify a share of
the underlying liabilities in the scheme attributable to its own employees and it is therefore accounted for on the same basis as a defined contribution
scheme. This means that contributions are included on the basis of the actual amount paid into the scheme.
The cost of LGPS retirement benefits is recognised in the Net Cost of Services when the benefits are earned by employees rather than when the benefits
are eventually paid as pensions. However, the charge required to be made against Council Tax is based on the cash payable in the year. The real cost of
retirement benefits is therefore reversed out in the Movement in Reserves Statement for the General Fund Balance. The following transactions have
been made in the Comprehensive Income and Expenditure Account and Movement in Reserves Statement during the year:
The Council LPFA Total
Comprehensive Income and Expenditure Account
Cost of Services
As part of the terms and conditions of employment of its employees, the Council offers retirement benefits. Although these benefits will not be payable
until employees retire, the Council has a commitment to make the payments which needs to be disclosed at the time the employees earn their future
entitlement.
The Council participates in three pensions schemes:
- The Local Government Pension Scheme (LGPS) administered by the Council
- The Teachers’ Pension Scheme (TPS), administered by Capita Teachers’ Pensions on behalf of the Department for Children, Schools and
Families (DCSF).
The LGP schemes are funded defined benefit final salary schemes, meaning that the Council and employees pay contributions into a fund, calculated at
a level intended to balance the pensions liabilities with investment assets.
Total Net Interest
Net Charge to the Comprehensive Income and
Expenditure Account
Remeasurement of the Scheme Liabilities
Current service costs
Impact of settlements and curtailments
Total Service Cost
Interest income on plan assets
Total remeasurements recognised in Comprehensive Income and
Expenditure Statement
Movement in Reserves Statement - General Fund BalanceReversal of net charges made for retirement benefits in accordance with IAS
19
In addition to the recognised gains and losses included in the Comprehensive Income and Expenditure Account, actuarial losses of £92.0 million
(£151.822 million in 2015/16) were included in the Actuarial gains or losses on pension assets and liabilities within Other Comprehensive Income and
Expenditure on the face of the Comprehensive Income and Expenditure Account. The cumulative amount of actuarial losses recognised is £459.934
million.
Actual amount charged against the
General Fund Balance for pensions in the year
In 2016/17 the Council paid £12.794 million into the Teachers Pension Scheme, representing 16.5% of pensionable pay. The figures for 2015/16 were
£12.659 million and 14.1% respectively. In addition, the Council is responsible for all pension payments and annual increases in respect of added years it
has awarded. In 2016/17 and 2015/16 there were no added year payments by the Council.
6363

41 PENSION SCHEME (continued)
Assets and Liabilities in Relation to Retirement Benefits
2015/16 2016/17 2015/16 2016/17 2015/16 2016/17
£'000 £'000 £'000 £'000 £'000 £'000
1st April (1,777,605) (1,663,196) (68,409) (63,016) (1,846,014) (1,726,212)
In-year adjustment to exclude/(incorporate) THH deficit 4,466 37,914 0 0 4,466 37,914
Current service cost (42,358) (37,301) (385) (274) (42,743) (37,575)
Interest cost (52,532) (53,333) (2,003) (2,025) (54,535) (55,358)
Contributions (9,626) (9,763) (78) (63) (9,704) (9,826)
Actuarial gains / (losses) 171,732 (237,739) 4,434 (6,718) 176,166 (244,457)
Benefits paid 43,874 52,488 3,425 3,547 47,299 56,035
Past service costs 0 0 0 (103) 0 (103)
Losses on curtailments (1,147) (918) 0 0 (1,147) (918)
31st March (1,663,196) (1,911,848) (63,016) (68,652) (1,726,212) (1,980,500)
Reconciliation of fair value of the scheme assets (LGPS):
2015/16 2016/17 2015/16 2016/17 2015/16 2016/17
£'000 £'000 £'000 £'000 £'000 £'000
1st April 1,139,418 1,155,656 57,032 53,961 1,196,450 1,209,617
In-year adjustment to exclude/(incorporate) THH deficit 2,646 (36,106) 0 0 2,646 (36,106)
Expected rate of return 32,439 35,790 1,587 1,667 34,026 37,457
Actuarial (losses) / gains (29,352) 140,952 (2,104) 9,711 (31,456) 150,663
Contributions 0 0
Members contributions 9,626 9,763 78 63 9,704 9,826 Employer contributions 44,753 45,136 793 820 45,546 45,956
Benefits paid (43,874) (52,488) (3,425) (3,547) (47,299) (56,035)
31st March 1,155,656 1,298,703 53,961 62,675 1,209,617 1,361,378
Scheme history
2012/13 2013/14 2014/15 2015/16 2016/17
£'000 £'000 £'000 £'000 £'000
Present value of liabilities:
The Council (1,453,831) (1,503,100) (1,777,605) (1,663,196) (1,911,848)
LPFA (67,336) (61,951) (68,409) (63,016) (68,652)
Fair value of assets
The Council 947,684 1,012,951 1,139,418 1,155,656 1,298,703
LPFA 50,521 56,154 57,032 53,961 62,675
Deficit in the scheme
The Council (506,147) (490,149) (638,187) (507,540) (613,145)
LPFA (16,815) (5,797) (11,377) (9,055) (5,977)
(522,962) (495,946) (649,564) (516,595) (619,122)
The contributions expected to be made by the Council in the year to 31st March 2018 are £43.440 million to the Council's scheme and £0.179 million
to the LPFA scheme (per actuary's reports).
The expected return on scheme assets is determined by considering the expected returns available on the assets underlying the current investment
policy. Expected yields on fixed interest investments are based on gross redemption yields as at the balance sheet date. Expected returns on equity
investments reflect long-term real rates of return experienced in the respective markets.
Total deficit in the schemes
LPFA Total
The liabilities show the underlying commitments that the Council has in the long run to pay retirement benefits. Whilst the total deficit in the schemes of
£619.1 million has a significant impact on the net worth of the Council as recorded in the balance sheet, statutory arrangements for funding the deficit
mean that the financial position of the Council remains healthy - the deficit will be made good by increased contributions over the remaining working life
of employees, as assessed by the schemes' actuary.
LPFA TotalThe Council
The Council
Reconciliation of present value of scheme liabilities (LGPS):
64
64

41 PENSION SCHEME (continued)
Basis for estimating assets and liabilities
2015/16 2016/17 2015/16 2016/17
Long-term expected rate of return on assets in the scheme 1 4.3% 4.3% 4.0% 4.0%
Mortality assumptions:
Longevity at 65 for current pensioners:
Men 22.2 years 22.1 years 21.2 years 20.6 years
Women 24.2 years 24.1 years 24.5 years 23.6 years
Longevity at 65 for future pensioners:
Men 24.3 years 23.9 years 23.6 years 23.0 years
Women 26.4 years 25.8 years 26.9 years 25.9 years
Rate of inflation 2.9% 2.4%
Rate of increase in salaries 3.7% 2.2% 3.8% 3.9%
Rate of increase in pensions 2.2% 2.4% 2.0% 2.4%
Rate for discounting scheme liabilities 3.5% 2.5% 3.3% 2.3%
50%* 50%*
1 The expected rates of return are set equal to the discount rate.
* Pre-April 2008 service - 75% for post-April 2008 service
Major categories of assets as a proportion of total assets
The categories of assets are as follows.
2015/16 2016/17 2015/16 2016/17
Equities 64% 73% 46% 59%
Bonds 17% 17% 0% 0%
Property 11% 9% 4% 5%
Infrastructure 0% 0% 5% 5%
Commodities 0% 0% 0% 0%
Cash 5% 1% 13% 9%
Cash flow matching 0% 0% 10% 0%
Target return portfolio/other 3% 0% 22% 22%
History of experience gains and losses
2012/13 2013/14 2014/15 2015/16 2016/17
% % % % %
The Council
6.10 0.05 6.96 -2.87 11.73
9.89 -2.20 11.94 -11.25 13.11
London Pensions Fund Authority
4.52 13.47 0.00 -0.04 0.15
12.05 -5.45 10.35 -7.04 9.79
The Council LPFA
Liabilities have been assessed on an actuarial basis using the projected unit method - an estimate of the pensions that will be payable in
future years dependent on assumptions about mortality rates, salary levels etc. Both schemes have been assessed by independent
actuaries, based on the following main assumptions. Hymans Robertson LLP provide the LBTH report, Barnett Waddingham the LPFA
report.
Take-up of option to convert annual pension into retirement lump sum
Experience gains and (losses) on assets
Experience gains and (losses) on liabilities
The Council
Experience gains and (losses) on liabilities
LPFA
The actuarial gains and losses identified as movements on the Pension Reserve in 2015/16 can be analysed into the following
categories, measured as a percentage of assets or liabilities at 31st March 2017:
Experience gains and (losses) on assets
65
65

42 Income and Expenditure Analysed by Nature
2015/16 2016/17
£'000 £'000
Expenditure:
472,587 Employee benefits expenses 477,114
721,639 Other service expenses 708,597
42,585 Support service recharges 21,544
13,025 Depreciation, amortisation and impairment 42,596
30,270 Interest payments 28,840
1,703 Precepts and levies 1,741
1,774 Payments to housing capital receipts pool 1,755
(16,627) Gains and losses on disposal of non-current assets (42,481)
1,266,956 TOTAL EXPENDITURE 1,239,706
Income:
(309,983) Fees, charges and other service income (286,235)
(3,131) Interest and investment income (2,519)
(184,286) Income from council tax and non-domestic rates (195,913)
(840,024) Government grants and contributions (817,847)
(1,337,424) TOTAL INCOME (1,302,514)
(70,468) SURPLUS OR DEFICIT ON THE PROVISION OF SERVICES (62,808)
The Council's expenditure and income as shown in the Comprehensive Income and Expenditure Statement is analysed
as follows:
66

43 TRUST FUNDS
Balance at
1/4/2015
2015/16
Expenditure
2015/16
Income
Balance at
31/3/2015
2016/17
Expenditure
2016/17
Income
Balance at
31/3/2016
£'000 £'000 £'000 £'000 £'000 £'000 £'000
(a) 3,643 2,875 2,697 3,465 2,683 2,737 3,519
(b) 67 9 68 126 10 92 208
(c) 101 3 0 98 0 0 98
(d) 160 0 0 160 0 0 160
(e) 14 0 142 156 6 28 178
3,985 2,887 2,907 4,005 2,699 2,857 4,163
(a)
(b)
(c)
(d)
(e)
Welfare Savings / Client Financial Affairs
Social Services Trust Funds - sundry other
The Council acts as trustee for a number of Trust Funds, the principal ones being shown below. It should be noted that the Council's Balance Sheet does not
include all Trust Fund assets and liabilities and so does not comply fully with relevant accounting standards, although the amounts involved are not material.
Sundry Other includes funds representing a number of miscellaneous deposits.
Tower Hamlets Further Education Trust
Globe Town Picture Fund
Sundry Other
TOTAL TRUST FUNDS
The fund represents monies held by Social Services on behalf of deputyship and appointeeship service users. It is held to protect the service users
monies and to finance the purchase of goods and services on behalf of residents.
These Funds represent monies held by the Council on behalf of residents of the borough in various social care trust funds.
The Council also holds a number of deposits relating to Trust Funds administered by the Council. The funds are held in an interest bearing account maintained
by the Council. The account is excluded from the financial statements relating to the Council. The relevant Trusts and transactions during the financial year
ended 31st March 2017 may be summarised as follows:
This was established by the Council in conjunction with Canary Wharf Limited with the objective of "the advancement of education and training for the
residents of the London Borough of Tower Hamlets". The Council is the sole Trustee and the Trust is registered with the Charities Commission (No.
1002772). Accounts relating to the Trust have been deposited with the Charities Commissioners.
This Fund was established with the proceeds of the sale of a painting by the Council.
67

44 TOWER HAMLETS HOMES
Number Voting Rights
Council nominees 4 4
Housing tenants and leaseholders 3 3
Independent 3 3
Total 10 10
2015/16 2016/17 2015/16 2016/17 2015/16 2016/17
£'000 £'000 £'000 £'000 £'000 £'000
Non-current assets - equipment 3,307 2,904 83 68 3,390 2,972
Inventories 0 0 0 0 0 0
Short-term debtors 97,268 80,487 (617) (865) 96,651 79,622
Cash and cash equivalents 160,712 184,299 7,744 7,820 168,456 192,119
Short-term creditors 204,158 154,154 2,508 3,065 206,666 157,219
Pensions liability 516,595 619,122 0 0 516,595 619,122
Pensions reserve (516,595) (619,122) 0 0 (516,595) (619,122)
Income and Expenditure Reserve 0 0 4,702 3,958 4,702 3,958
The Group Balance Sheet reflects the following consolidated balances after eliminating intra-group transactions (transactions
between Tower Hamlets Homes and the Council).
The Council THH TOTAL
The Council's Arms Length Management Organisation (ALMO), Tower Hamlets Homes Limited ("THH"), was incorporated on
16 May 2007 and commenced trading on 7 July 2008. It is a wholly owned subsidiary of the Council responsible for the
management, maintenance and modernisation of the Council's housing stock. The stock remains in the ownership of the
Council and rents are collected by THH on behalf of the Council.
Below is a summary of Tower Hamlet's Homes Balance Sheet alongside the Council's.
It should be noted that, although Board members have voting rights at Board meetings, the Council is the sole member of the
company and therefore has 100% of the voting rights at the company's Annual General Meeting.
THH is a private company limited by guarantee with no share capital. The composition of the board of the company and the
associated voting rights are as follows.
The Council undertakes, in the event of the company's being wound up, to contribute such amounts as may be required for the
payment of the debts and liabilities of the company, provided this does not exceed £1. After the satisfaction of all the debts and
liabilities, the remaining assets would revert to the Council. THH is an admitted body to the Council's local government pension
fund. The full pension obligation and related deficit together with current and past services costs for THH employees passed to
the company when it began trading. Should THH cease trading then the full pension obligation and related deficit or surplus
would pass back to the Council as an integral part of the general business transfer.
In previous years, the Council produced Group Accounts to incorporate THH, however as the assets and liabilities of THH are
not material compared to the Council, a summary of the ALMO's accounts are provided for information. A copy of THH's
accounts is available from the company's registered office at Tower Hamlets Homes Limited, Jack Dash House, 2 Lawn Close,
London E14 9YQ or from Companies House, Cardiff.
68

Note 2015/16 2016/17
£'000 £'000
EXPENDITURE
Repairs and maintenance 19,807 18,726
Supervision and management 37,990 33,503
Rents, rates, taxes and other charges 2,821 2,528
Depreciation of non-current assets 6
On dwellings 13,754 13,525
On other assets 1,570 1,276
Revaluation losses (and reversals) (42,267) (9,049)
Debt management costs 73 73
Movement in the allowance for bad debts (1,128) 287
Sums directed by the Secretary of State that are expenditure in accordance with the Code 1,365 3,341
TOTAL EXPENDITURE 33,985 64,210
INCOME
Gross rental income
Dwelling rents 68,116 66,802
Non dwelling rents 4,253 4,188
Charges for services and facilities 19,693 20,440
Contributions towards expenditure 115 115
TOTAL INCOME 92,177 91,545
(58,192) (27,335)
HRA services share of Corporate and Democratic Core 157 157
NET COST OF HRA SERVICES (58,035) (27,178)
HRA share of operating income and expenditure
included in the whole authority Income and
Expenditure Account
(Gain)/loss on sale of HRA non-current assets (12,841) (26,726)
Unattached capital receipts (1,811) (4,287)
Interest payable and similar charges 12 3,516 4,059
Interest and investment income (560) (545)
Pensions interest cost and expected return on pension assets 7 1,293 1,203
Capital grants and contributions receivable (26,501) (9,648)
DEFICIT / (SURPLUS) FOR THE YEAR ON HRA SERVICES (94,939) (63,122)
The Housing Revenue Account (HRA) deals with the provision and maintenance of council housing by the Council acting as
Landlord. It also shows income from rents and Government grant. There is a statutory requirement to keep this account separate
from other Council activities (including other housing activities).
HOUSING REVENUE ACCOUNT
INCOME AND EXPENDITURE ACCOUNT
NET COST OF HRA SERVICES AS INCLUDED IN THE WHOLE AUTHORITY INCOME
AND EXPENDITURE ACCOUNT
69

STATEMENT OF MOVEMENT ON THE HOUSING REVENUE ACCOUNT BALANCE
Note
£'000 £'000 £'000 £'000
Balance on the Statutory HRA Brought Forward (21,144) (32,092)
(94,939) (63,123)
83,991 56,136
Decrease (Increase) in the HRA Balance (10,948) (6,987)
Transfers to or (from) reserves 0 0
2,811 (4,176)
Balance on the Statutory HRA Carried Forward (32,092) (39,079)
1 Brought forward balance corrected as per balance sheet
2016/17
Net additional amount required by statute to be credited to the HRA balance for the year 1
Deficit / (Surplus) for the year on the HRA Income and Expenditure Account
The Housing Revenue Account (HRA) Income and Expenditure Account discloses the income received and expenditure incurred in
providing council dwellings to tenants for the year. However, the Council is required to raise council rents based on the balance on
the Statutory Housing Revenue Account.
This reconciliation statement summarises the differences between the outturn on the HRA Income and Expenditure Account and the
balance on the Statutory HRA.
2015/16 1
70

1. NOTE TO THE STATEMENT OF MOVEMENT ON THE HRA BALANCE
£'000 £'000 £'000 £'000
Items included in the HRA Income and Expenditure Account but excluded from
the movement on HRA balance for the year
Revenue expenditure funded from capital under statute (1,365) (3,341)
Capital grants and contributions 26,501 9,648
Gain or loss on sale of HRA non-current assets 12,841 26,726
Unattached capital receipts 1,811 4,287
Reversal of revaluation losses on non-current assets 40,892 11,370
Difference between amounts charged to the Income & Expenditure Account for
premia and discounts and the charge for the year determined in accordance with
statute (182) (182)
Net charges made for retirement benefits in accordance with IAS19 (1,260) 1,837
Transfers from General Fund (as directed by Secretary of State) 0 79,238 0 50,345
Items not included in the HRA Income and Expenditure Account but included
in the movement on HRA balance for the year
Capital expenditure financed from revenue 4,671 5,287
Transfer to / from Capital Adjustment Account 82 504
Other adjustments (transfer to capital receipts reserve) 0 4,753 0 5,791
Net additional amount required by statute to be debited to the HRA Balance for the year 83,991 56,136
2016/17
NOTES TO THE HOUSING REVENUE ACCOUNT INCOME AND EXPENDITURE ACCOUNT
2015/16
71

2 HOUSING STOCK
2015/16 2016/17
259 2576,994 6,829
3,849 3,834
782 772
TOTAL AT 31st
MARCH 11,884 11,692
3 NON-CURRENT ASSETS
The balance sheet values of assets within the Council's HRA were as follows:
2015/16 2016/17
£'000 £'000
1,092,431 1,190,747
Other Land and Buildings 65,248 63,329
Surplus Assets Not Held for Sale 0 282
Assets Under Construction 10,705 31,517
Assets Held for Sale 6,178 0
TOTAL 1,174,562 1,285,875
Dwellings Other land Surplus Assets Assets Under Assets Held TOTAL
and buildings not held for sale Construction For Sale
£'000 £'000 £'000 £'000 £'000 £'000
Total value at 1st
April 2015 973,479 57,087 1,690 2,840 225 1,035,321
Additions, disposals, transfers and revaluations 118,952 8,161 (1,690) 7,865 5,953 139,241
Total value at 31st
March 2016 1,092,431 65,248 0 10,705 6,178 1,174,562
Additions, disposals, transfers and revaluations 98,316 (1,919) 282 20,812 (6,178) 111,313
TOTAL VALUE AT 31st
MARCH 2017 1,190,747 63,329 282 31,517 0 1,285,875
4 MAJOR REPAIRS RESERVE
2015/16 2016/17
£'000 £'000
Balance at 1st
April 22,174 9,176
Transfer from Capital Adjustment Account - depreciation 15,321 14,801
(28,319) (14,517)
Balance at 31st
March 9,176 9,460
The type and number of dwellings in the Council's housing stock at 31st March were as follows:
Low-rise flats (1-2 storeys)Medium-rise flats (3-5 storeys)
High-rise flats (6 or more storeys)
Financing of capital expenditure
Dwellings
The vacant possession value of dwellings within the Council's HRA was £4,660 million in 2016/17 (£4,154 million in 2015/16). The difference
between the vacant possession value and the balance sheet value shows the economic cost to the Government of providing council housing
at less than open market rents.
The balance sheet values of the land, houses and other property within the Housing Revenue Account are as follows:
Houses and bungalows
72

5 CAPITAL TRANSACTIONS
(i) Capital expenditure and financing
Dwellings Other Total Dwellings Other Total
£'000 £'000 £'000 £'000 £'000 £'000
Expenditure 64,994 1,365 66,359 53,070 7,531 60,601
Sources of finance
Borrowing 0 0 0 9,189 0 9,189
Capital Receipts 720 0 720 4,839 1,257 6,096
Capital Grants and Contributions 32,649 0 32,649 6,413 0 6,413
Major Repairs Reserve 26,954 1,365 28,319 11,176 3,341 14,517
Direct Revenue Financing 4,671 0 4,671 21,453 2,933 24,386
TOTAL CAPITAL FINANCING 64,994 1,365 66,359 53,070 7,531 60,601
(ii) Capital Receipts
2015/16 2016/17
£'000 £'000
Dwellings 32,444 42,098
Other land and buildings 3,791 14,552
TOTAL CAPITAL RECEIPTS 36,235 56,650
6 DEPRECIATION
2015/16 2016/17
£'000 £'000
Dwellings 13,754 13,525
Other Land and Buildings 1,567 1,276
TOTAL DEPRECIATION 15,321 14,801
2016/172015/16
Capital receipts (gross) in 2016/17 from the disposal of non-current assets within the HRA amounted to £56.650 million
(£36.235 million in 2015/16) as follows:
The total depreciation charge for the year was £14.801 million (£15.321 million in 2015/16), made up of £13.525 million
(£13.754 million in 2015/16) in respect of council houses and £1.276 million (£1.567 million in 2015/16) in respect of other
HRA assets. In the case of council housing, assets have been depreciated by an amount equivalent to the Major Repairs
Allowance, as this is the amount (based on a 30-year life cycle costing) which the Government estimates the Council needed
to spend this year to keep the housing stock in its current state. It is therefore considered an appropriate measure of
depreciation. An analysis of the depreciation charges is set out below.
73

7 PENSION COSTS
2015/16 2016/17 2015/16 2016/17 2015/16 2016/17
Income and Expenditure Account £'000 £'000 £'000 £'000 £'000 £'000
2,726 0 0 0 2,726 0
3,381 3,656 0 0 3,381 3,656
Settlements / Curtailments 74 0 0 0 74 0
(2,088) (2,453) 0 0 (2,088) (2,453)
Expenditure Account 4,093 1,203 0 0 4,093 1,203
Statement of Movement in the HRA Balance
(4,093) (1,203) 0 0 (4,093) (1,203)
Employer's contribution to scheme 2,557 3,040 0 0 2,557 3,040
8 RENT ARREARS
2015/16 2016/17
£'000 £'000
4,121 4,421
6.0 6.6
3,079 3,337
9 TRANSFERS FROM GENERAL FUND (AS DIRECTED BY SECRETARY OF STATE)
10 ITEM 8 INTEREST ADJUSTMENT
in accordance with IAS19
Interest cost
These figures represent the cost of pensions attributable to the HRA. Further details of the treatment of pensions costs are shown in note 41 of the Core
Financial Statements, together with details of the assumptions made in calculating the figures included in this note. The following transactions have been made in
the account for the year.
The Council LPFA Total
Net Cost of Services
Current service costs
Net Operating Expenditure
Expected return on assets in the scheme
Net Charge to the Income and
Reversal of net charges made for retirement benefits
Capital works on non-current assets within the council's HRA are partly funded by borrowing. The total interest cost of borrowing is allocated between HRA and
General Fund in accordance with the Item 8 Credit and Item 8 Debit (General) Determination for the year, as specified in Schedule 4 of the Local Government and
Housing Act 1989. These are included within the interest figures shown on the HRA Income and Expenditure Account.
Arrears as % of rent receivable
Provision made for bad debts
Authorities are allowed to transfer sums to the HRA from another revenue account on the basis of directions issued by the Government. No sums were transferred
during 2016/17.
Gross rent arrears at 31st March
74

Note 2015/16 2015/16 2016/17 2016/17
£'000 £'000 £'000 £'000
INCOMECouncil Tax (net of benefits) 2 97,503 104,615
Transfers from General Fund - Council Tax Benefits 97,503 104,615
Distribution of prior year deficit on Collection Fund 0
National Non-Domestic Rates 3 377,998 407,671
- Transitional Protection 41 378,039 (755) 406,916
Business Rate Supplement 11,513 12,529
TOTAL INCOME 487,055 524,060
EXPENDITURE
Council Tax
Precepts and demands
London Borough of Tower Hamlets 69,814 76,885
Greater London Authority 23,258 93,072 23,044 99,929
Increase in provision for Council Tax bad debts 5 1,793 3,181
Distribution of prior year Council Tax surplus on Collection Fund 2,556 1,863National Non-Domestic Rates
NNDR Estimated surplus for 2013/14 applied in 2015/16 (95) 0
National Non-Domestic Rates
Interest 34 48
Transitional Protection 0 0
Cost of collection allowance 965 999 963 1,011
National Non-Domestic Rates Precepts & Demands
London Borough of Tower Hamlets 114,738 118,182
DCLG 191,230 196,969
Greater London Authority 76,492 382,460 78,788 393,939
Distribution of Prior Year Surplus on NNDR Collection Fund
London Borough of Tower Hamlets 4,922 2,598
DCLG 8,045 1,013
Greater London Authority 3,218 16,185 405 4,016
Business Rate Supplement 4
Payment to Greater London Authority * 12,263 11,880
Cost of collection allowance 19 12,282 15 11,895
National Non-Domestic Rates Provision For Bad Debt
London Borough of Tower Hamlets 619 1,456
DCLG 1,032 2,426
Greater London Authority 413 2,064 971 4,853
National Non-Domestic Rates Provision For Appeals
London Borough of Tower Hamlets 0 2,446
DCLG 0 4,076
Greater London Authority 0 0 1,630 8,152
TOTAL EXPENDITURE 511,316 528,839
INCREASE/(DECREASE) IN FUND BALANCE (24,261) (4,779)
BRS Debtor/(Creditor) 700 (634)
COLLECTION FUND BALANCE (Deficit)/Surplus for the year (23,561) (5,413)
Balance at the beginning of the year 15,862 (5,851)
LBTH estimated surplus for 2013/14 B/Fwd to apply in future years 1,848 0
BALANCE AT END OF YEAR 1 (5,851) (11,264)
* BRS payment includes 69k on account of 2014/15 arrears
COLLECTION FUND
75

1. GENERAL
2. COUNCIL TAX
Band Market Value in Fraction of
April 1991 Band D
A Up to £40,000 6/9
B Over £40,001 and up to £52,000 7/9
C Over £52,001 and up to £68,000 8/9
D Over £68,001 and up to £88,000 9/9
E Over £88,001 and up to £120,000 11/9
F Over £120,001 and up to £160,000 13/9
G Over £160,001 and up to £320,000 15/9
H Over £320,001 18/9
2015/16 2015/16 2016/17 2016/17
Band No. of Council No. of Council
Properties Tax Base Properties Tax Base
A 3,527 515 3,517 488
B 25,903 16,741 25,820 16,841
C 36,875 29,260 37,390 29,812
D 24,461 21,939 25,277 22,831
E 18,293 20,077 18,967 20,950
F 8,470 10,987 8,805 11,500
G 3,280 4,966 3,350 5,112
H 507 938 537 998
Total 121,316 105,423 123,663 108,532
Band D Tax
Amount to be
raised Band D Tax
Amount to be
raised
Increase /
(Decrease)
£ £'000 £ £'000 £ %
Tower Hamlets 885.52 69,814 920.85 76,885 35.33 3.99%
Greater London Authority 295.00 23,258 276.00 23,044 -19.00 -6.44%
TOTAL 1,180.52 93,072 1,196.85 99,929 16.33 1.36%
NOTES TO THE COLLECTION FUND
2015/16 2016/17
The Collection Fund accounts for all transactions in respect of Council Tax and National Non-Domestic Rates (also known as NNDR or Business
Rates) and Community Charge (prior to 1st April 1993). Although the account is kept separate from the Income and Expenditure Account, the
Collection Fund balance is included in the Council's Balance Sheet.
The Council Tax surplus on the Fund (£2.337m) is attributable to the Council (£1.778m) and the Greater London Authority (£0.559m). The latter
amount is carried as a creditor in the Council's Balance Sheet.
When the 2015/16 Council Tax was set the position was as follows:
The Council Tax is made up of amounts for the Greater London Authority as well as the Council. The Band D tax and total amount to be raised in the
last 2 years was as follows:
Council Tax is a tax payable depending on the nature and degree of occupation of the residential property concerned. It is subject to a system of
personal discounts. For the purpose of calculating the individual tax, all domestic properties were valued by the Inland Revenue as at 1st April 1991
and placed in one of eight bands. By law the tax for each Band is set as a fraction of Band D.
Under the NNDR collection arrangements, there was a deficit of £5.053m in 2016/17 (a deficit of £23.574m during 2015/16). Back-dated NNDR
charges have been raised in 2016/17 to recover the 2015/16 deficit. Of this deficit , £1.516m (30%) is attributable to the Council, £1.011m (20%) to
the GLA and £2.526m (50%) to the CLG.
76

3. NATIONAL NON-DOMESTIC RATES (NNDR)
4. CROSSRAIL BUSINESS RATE SUPPLEMENT
2015/16 2016/17
£'000 £'000
12,345 Non Domestic Rates Due 14,096
Less Allowances and Other Adjustments
832 Mandatory & Discretionary Relief 868
0 Provision for Bad Debts 0
19 Cost of Collection 15
11,494 Collectable from Business Rate Supplement Payers 13,213
5. PROVISION FOR IRRECOVERABLE COUNCIL TAX DEBTS
NNDR, or business rates, collected by local authorities are the way that those who occupy non-domestic property
contribute towards the cost of local services. Under the business rates retention arrangements introduced from
1st April 2013, authorities keep a proportion of the business rates paid locally. NNDR due is calculated by
multiplying a national uniform rate (set by the Government) by the rateable value of the property. The national
uniform rate in 2016/17 was 49.7p in the £ (49.3p in the £ in 2015/16). The total rateable value in the borough as
at 31 March 2017 was £875.2 million (£865.2 million at 31 March 2016). A periodic revaluation of business
properties took place in April 2010. At March 2017 there were around 6,200 NNDR appeals that are yet to be
heard by the Government's Valuation tribunal. Of these 3,467 will not result in a reduction in rateable value and
1,936 are considered speculative. Provision has been made for the remaining appeals
The Greater London Authority (GLA) introduced a business rate supplement (BRS) in April 2010 to finance £4.1
billion of the costs of the £15.9 billion Crossrail project. Details on the progress of the project so far and the
proposed policies for the BRS in the 2016/17 financial year are set out below.
The Crossrail BRS will be used to finance £3.5 billion worth of GLA borrowing and the repayment of this sum after
Crossrail is completed. A further £0.6 billion of BRS revenues will be used to finance the construction works
directly.
The Crossrail BRS multiplier for 2016/17 is 2p per pound of rateable value. Reliefs for the Crossrail BRS will apply
on the same basis and at the same percentage rate as for your National Non Domestic Rates (NNDR) bill,
although no transitional relief is provided for the BRS.
www.london.gov.uk/crossrail-brs
Contributions are made to or from the Collection Fund Income and Expenditure Account to a provision for bad
debts. For 2016/17 the Council Tax bad debt provision was increased by £3.181 million (£1.793 million in
2015/16) and £1.269 million of irrecoverable debts were written off (£1.621 million in 2015/16).
77

PENSION FUND ACCOUNT Note 2015/16 2016/17
£'000 £'000
Contributions
From employers
Normal 3 26,812 28,524
Augmentation 3 1,697 1,288
Deficit funding 3 20,500 22,000
From members 3 10,951 11,151
Transfers in
Transfers in from other pension funds 4 2,166 2,195
Benefits
Pensions 4 (39,103) (39,485)
Lump sum benefits 4 (13,158) (12,341)
Payments to and on account of leavers
Refunds of contributions (169) (259)
State scheme premiums (196) (29)
Transfers out to other pension funds (4,092) (3,517)
Administrative expenses 13,14b (1,038) (972)
NET ADDITIONS FROM DEALINGS WITH MEMBERS 4,370 8,555
RETURN ON INVESTMENTS 2015/16 2016/17
£'000 £'000
Investment income 11 14,349 17,776
Taxes on Income (409) (363)
Change in market value of investments
Realised 1,321 415,494
Unrealised 10 (28,625) (197,036)
Investment management expenses 13 (3,076) (2,879)
NET RETURN ON INVESTMENTS (16,440) 232,992
Net increase in the Fund during the year (12,070) 241,548
Add: Opening net assets of the scheme 1,138,199 1,126,129
CLOSING NET ASSETS OF THE SCHEME 1,126,129 1,367,677
NET ASSETS STATEMENT AS AT 31ST MARCH 2016 2017
£'000 £'000
Investments Assets
Equities 214,617 247,485
Pooled Investment Vehicles
Unit TrustsUnit Trusts 572,275 971,562
PropertyProperty 129,933 133,609
Other 54,607 0
971,432 1,352,656
Cash deposits 6 5,647 4,096
Other investment balances 5 1,973 1,673
Investments Liabilities
Other investment balances 5 (35) (45)
Current Assets 5 149,054 19,847
Current Liabilities 5 (1,942) (10,550)
TOTAL NET ASSETS 1,126,129 1,367,677
PENSION FUND ACCOUNTS
DEALINGS WITH MEMBERS, EMPLOYERS AND OTHERS DIRECTLY
INVOLVED IN THE SCHEME
78

1. INTRODUCTION
2. ACCOUNTING POLICIES
(a) Accounts
(b) Basis of preparation
(c)
Contribution Income
Normal contributions, both from the members and from the employer, are accounted for on an accruals basis at the
percentage rate recommended by the actuary in the payroll period to which it relates. Any amount due in the year but
unpaid will be classified as a current asset.
Employer deficit contributions are accounted for in accordance with the agreement under which they are paid.
(d) Investments
(i)
(ii)
(iii)
(iv)
(v)
(vi)
(e)
(i)
(ii)
(iii)
(iv)
NOTES TO THE PENSION FUND ACCOUNTS
The Council is the administering authority for the Pension Fund and has executive responsibility for it. The Council delegates its responsibility
for administering the Fund to the Pensions Committee which is responsible for considering all pension matters and discharging the
obligations and duties of the Council under the Superannuation Act 1972 and other statutes relating to investment issues. The Committee
meets quarterly to determine investment policy objectives, appoint investment managers, monitor investment performance and make
representations to the Government on any proposed changes to the Local Government Pension Scheme. The Committee is required to
obtain proper advice on the investment strategy of the Fund for which it has established an Investment Panel which includes professional
investment advisors. The Panel meets quarterly to determine the general investment strategy, monitor the performance of the Fund and
individual managers and consider technical reports on investment issues. The Fund employs six specialist investment managers with
mandates corresponding to the principal asset classes.
The day to day administration of the Fund and the operation of the management arrangements and administration of the investment portfolio
is delegated to the Corporate Director of Resources.
The Fund is operated as a funded, defined benefits scheme which provides for the payment of benefits to former employees of the London
Borough of Tower Hamlets and those of bodies admitted to the Fund. These individuals are referred to as "members". The benefits include
not only retirement pensions, but also widows' pensions, death grants and lump sum payments in certain circumstances. The Fund is
financed by contributions from members, employers and from interest and dividend receipts and gains on the Fund's investments.
The objective of the Pension Fund's financial statements is to provide information about the financial position, performance and financial
adaptability of the Fund. They show the results of the stewardship of management - that is the accountability of management for the
resources entrusted to it - and the disposition of its assets at the period end.
The accounts summarise the transactions and net assets of the Pension Fund and comply in all material respects with Chapter 2
("Recommended Accounting Practice") of the Statement of Recommended Practice (Financial Reports of Pensions Schemes) 2007
and the Code of Practice on Local Authority Accounting issued by the Chartered Institute of Public Finance and Accountancy (CIPFA).
Except where otherwise stated, the accounts have been prepared on an accruals basis, that is income and expenditure are recognised
as earned or incurred, not as received or paid.
The financial statements of the Fund do not take account of liabilities to pay pensions and other benefits after 31st March 2017. The
actuarial present value of promised retirement benefits, valued on an IAS19 basis is disclosed in note 12 of the Accounts as permitted
under IAS26.
The Fund is administered in accordance with the Local Government Pension Scheme Regulations 2013 (as amended), the Local
Government Scheme (Trainsitional Provisions, Savings and Amendment) Regulations 2014 (as amended) and the Local Government
Pension Scheme (Management and Investment of Funds) Regulations 2016.
The Fund does not hold any direct property holdings and therefore does not employ a separate property valuer.
Investments designated in foreign currencies are valued in sterling at the exchange rates ruling on 31st March 2017. Where the
Council has entered into a transaction denominated in a foreign currency, the transaction is converted into sterling at the exchange
rate applicable on the date the transaction was effective.
Investment Income
Cash is represented by deposits held with financial institutions repayable on demand without penalty.
Fund Account - Revenue Recognition
Interest income is recognised in the Fund account as it accrues.
Dividend income is recognised in the Fund account on an accruals basis. Any amount not received by the end of the reporting period
is disclosed in the net asset statement as a current financial asset.
Distributions from pooled funds are re-invested and as such are recognised in the change in market value.
Changes in the net market value of investments held at any time during the year are recognised as income and comprise all realised
and unrealised gains/losses.
Pooled investment vehicles are valued at bid price, middle market price or single price at close of trading on 31st March 2017.
Property unit trusts are shown by reference to bid price at close of business on 31st March 2017.
Investments are shown in the Net Assets Statement at market value on the following bases.
Listed securities are shown by reference to bid price at the close of business on 31st March 2017.
79

2 ACCOUNTING POLICIES Cont…
Fund account - expense items
(f) Management Expenses
Administrative Expenses
Oversight & Governance Costs
Investment Management Expenses
(g) Benefits Payable
Net assets statement
Financial Assets
(h)
(i)
(ii)
2.a CRITICAL JUDGEMENTS IN APPLYING ACCOUNTING POLICIES
Fund managers' fees are paid in accordance with the terms of each individual management agreement. The fees are
based mainly on a percentage of the value of funds under their management and increase or reduce as the value of the
investments change.
Pensions and lump sums payable include all amounts known to be due as at the end of the financial year. Any amounts
due but unpaid are disclosed in the net assets statement as current liabilities.
Financial assets are included in the net assets statement on a fair value basis as at the reporting date. A financial asset is
recognised in the net assets statement on the date the fund becomes party to the contractual acquisition of the asset.
From this date any gains or losses arising from changes in the fair value of the assets are recognised by the fund.
The values of investments as shown in the net assets statement have been determined as follows:
NOTES TO THE PENSION FUND ACCOUNTS
Staff costs of the pensions of the pensions administration team are charged direct to the fund. Associated management,
accommodation and other overheads are apportioned to this activity and charged as expenses to the fund.
Staff costs relating to oversight and governance are charged direct to the fund. Associated management,
accommodation and other overheads are apportioned to this activity and charged as expenses to the fund.
The Code of Practice does not require any breakdown of pension fund administrative expenses. However in the interests
of greater transparency, the Council discloses its pension fund management expenses in accordance with the CIPFA
guidance on accounting for LGPS management costs.
Market-quoted investments
Fixed interest securities
Fixed Interest Securities – are recorded at net market value based on their bid price.
Market quoted investments – the value of an investment for which there is a readily available market price is determined
by the bid price ruling on the final day of the accounting period.
The Statement of Accounts contains estimated figures that are based on assumptions made by the authority about the future or
that are otherwise uncertain. Estimates are made taking into account historical experience, current trends and other relevant
factors. However, because balances cannot be determined with certainty, actual results could be materially different from
assumptions and estimates.
There is just one item in the pension fund account notes (specifically note 12 - Actuarial Position) for which there is a significant
risk of material adjustment in the forthcoming financial year.
Pensions Liability - Estimation of the net liability to pay pensions depends on a number of complex judgements relating to the
discount rate used, the rate at which salaries are projected to increase, changes in retirement ages, mortality rates and
expected returns on pension fund investments. A firm of consulting actuaries is engaged to provide the Council with expert
advice about the assumptions to be applied.
The assumptions interact in complex ways. During 2016/17, the Council’s actuaries advised that the net pensions liability had
increased by £107.4 million to £612.4 million as a result of falling bond yields.
80

3. CONTRIBUTIONS
2015/16 2016/17
£'000 £'000
Members normal contributions
Council 9,673 9,835
Admitted bodies 184 157
Scheduled body 1,094 1,159
Total members 10,951 11,151
Employers
Normal contributions
Council 22,105 22,655
Admitted bodies 887 1,992
Scheduled bodies 3,820 3,877
Deficit funding contributions
Council 20,500 22,000
Other contributions
Council 1,697 1,288
Total employers 49,009 51,812
Total contributions 59,960 62,963
4. BENEFITS, REFUNDS OF CONTRIBUTIONS AND TRANSFER VALUES
Council
Admitted
Bodies
Scheduled
Bodies Total Council
Admitted
Bodies
Scheduled
Bodies Total
£'000 £'000 £'000 £'000 £'000 £'000 £'000 £'000
Pensions (37,467) (585) (1,051) (39,103) (37,650) (679) (1,156) (39,485)
Lump sum retirement benefits (10,828) (441) (425) (11,694) (9,688) (300) (839) (10,827)
Lump sum death benefits (1,080) (175) (208) (1,463) (1,514) 0 0 (1,514)
Total Pensions and Benefits (49,375) (1,201) (1,684) (52,260) (48,852) (979) (1,995) (51,826)
Transfer Values Received (Individual) 2,166 0 0 2,166 2,195 0 0 2,195
Transfer Values Paid (Individual) (4,092) 0 0 (4,092) (3,517) 0 0 (3,517)
Total (51,301) (1,201) (1,684) (54,186) (50,174) (979) (1,995) (53,148)
Benefits payable and refunds of contributions have been brought into the accounts on the basis of all valid claims approved during the year. Benefits
are index linked to keep pace with inflation based on the consumer price index.
Transfers out/in are those sums paid to, or received from, other pension schemes and relate to the period of previous pensionable employment.
Transfer values are brought into the accounts on a cash basis. Benefits payable are analysed below.
2015/16 2016/17
Contributions represent the total amounts receivable from the employing authority in respect of its own contributions and those of its pensionable
employees. Employees pay contributions based on the level of pay they receive, with contribution rates set between 5.5% and 12.5% dependent on
pensionable pay. The employer's contributions are made at a rate determined by the Fund's actuary necessary to maintain the Fund in a state of
solvency, having regard to existing and future liabilities. The Primary Contribution Rates used during the financial year ending the 31 March 2017
range from 15.8% to 41.4% of pensionable pay. The Council paid an agreed additional monetary contribution of £22.0m to recover the deficit.
Contributions shown in the revenue statement may be categorised as follows:-
Note: The Council is required to operate an Additional Voluntary Contribution (AVC) scheme for employees. In 2016/17 employees made contributions
of £12,699.25 (£10,870.28 in 2015/16) into the AVC Scheme operated by Aviva (Norwich Union) and £6,542.88 to Equitable Life (£6,434.33 in
2015/16). The contributions are not included in the Pension Fund Accounts in accordance with regulation 4(1)(b) of the Local Government Pension
Scheme (Management and Investment of Funds) Regulations 2009 but are deducted from salaries and remitted directly to the provider.
Employer deficit funding contributions are accounted for on the due dates on which they are payable under the schedule of contributions set by the
scheme actuary or on receipt if earlier than the due date.
81

5. DEBTORS AND CREDITORS
2015/16 2016/17
£'000 £'000
Debtors
Other Investment Balances
Investment sales 805 0
Dividends receivable 649 961
Tax recoverable 519 712
1,973 1,673
Current Assets
Contributions due from admitted bodies 237 241
London Borough of Tower Hamlets 457 1,176
694 1,417
Total Debtors 2,667 3,090
Creditors
Other Investment Balances
Investment purchases 35 45
Current Liabilities
Unpaid benefits 1,271 1,664
Administrative expenses 671 747
London Borough of Tower Hamlets Pension 0 3,940
HMRC Creditor Income Tax Deducted 0 4,199
1,942 10,550
Total Creditors 1,977 10,595
Net Debtors 690 (7,505)
6. CASH
The deposits held by fund managers can be further analysed as follows:
2015/16 2016/17
£'000 £'000
Aberdeen: Private Equity Portfolio 10 0
GMO 3,702 1,075
Schroders: Multi Asset Portfolio 0 0
Schroders: Property Portfolio 1,934 3,021
London Borough of Tower Hamlets Pension Fund 148,359 18,428
TOTAL CASH 154,005 22,524
7. TAXATION£'000 £'000
UK Income Tax
Value Added Tax
Overseas Tax
8. INVESTMENT STRATEGY STATEMENT
The Council, as the Administering Authority of the Pension Fund, is required to prepare, maintain and publish the Investment Strategy
Statement (ISS), this replaced the Statement of Investment Principles from 1st April 2016. The Local Government Pension Scheme
(Management and Investment of Funds) Regulations 2016 require administering authorities to formulate and to publish a statement of its
investment strategy, in accordance with guidance issued from time to time by the Secretary of State.
This ISS is designed to be a living document and is an important governance tool for the Fund. This document sets out the investment
strategy of the Fund, provides transparency in relation to how the Fund investments are managed, acts as a risk register, and has been
designed to be informative but reader focused.
Investment income is subject to UK tax which the Fund cannot recover under current tax legislation, except for tax deducted at source from
Property unit trusts.
As Tower Hamlets Council is the Administering Authority for the Fund, VAT input tax is recoverable on all Fund activities.
Taxation agreements exist between the UK and certain other European countries whereby a proportion of the tax deducted locally from
investment earnings may be reclaimed. The proportion reclaimable and the timescale involved varies from country to country.
Unless otherwise stated, all transactions are accounted for on an accruals basis. The following amounts were debtors or creditors of the
Pension Fund as at 31st March.
82

9. MEMBERSHIP OF THE FUND
2016 2017
London Borough of Tower Hamlets
Active Members 6,365 6,605
Pensioners 4,352 4,536
Deferred Pensioners 6,770 7,076
Dependants 1,018 1,030
18,505 19,247
Admitted & Scheduled Bodies
Active Members 657 651
Pensioners 247 275
Deferred Pensioners 375 406
Dependants 26 29
1,305 1,361
Admitted Bodies
Agilysis
City Gateway
East End Homes
Gateway Housing Association (formerly Bethnal Green and Victoria Park Housing Association)
Greenwich Leisure Limited
One Housing Group (formerly Island Homes)
Swan Housing Association
Tower Hamlets Community Housing
Vibrance (formerly Redbridge Community Housing Limited)
Scheduled Bodies
Bethnal Green Academy
Canary Wharf College
Culloden Primary School
London Enterprise Academy
Old Ford Primary School
Sir William Burrough School
Solebay Academy
St. Pauls Way Community School
Tower Hamlets Homes Limited
Wapping High School
10. INVESTMENTS
The Fund employs nine specialist investment managers with mandates corresponding to the principal asset classes.
Manager Mandate
GMO UK Ltd. Global Equity
Goldman Sachs Asset Management Absolute Return Fund
Insight Investment Management (Global) Ltd Absolute Return Fund
Legal & General Investment Management UK Equity / Index Linked Gilts
London LGPS CIV Pooled
Schroders Asset Management Property Fund Property
The value of the Fund, by manager, as at 31st March was as follows:
£ million % £ million %
Baillee Gifford Life Ltd - Equities 209.9 21.4 0.0 - GMO UK Ltd. 248.4 25.4 326.9 24.1 Goldman Sachs Asset Management Property Fund 0.0 - 77.9 5.7 Insight Investment Management (Global) Ltd 0.0 - 71.7 5.3 Legal & General Investment Management - Equities 217.3 22.2 265.9 19.6 Legal & General Investment Management 60.6 6.2 74.0 5.4 Ruffer LLP 54.6 5.6 0.0 - Schroders Asset Management Property Fund 131.9 13.5 136.7 10.1 London CIV 56.3 5.8 405.2 29.8
2016 2017
The following table sets out the membership of the Fund at 31st March:
The following bodies have been admitted into the Fund:
83

10. INVESTMENTS (continued)
Market Value
as at
1 Apr 2016
Purchases Sales Change in
Market Value
Market Value
as at
31 Mar 2017
£'000 £'000 £'000 £'000 £'000
Equities 214,616 222,584 (183,549) 42,463 296,114
Pooled Investments 626,883 804,730 (273,727) (234,953) 922,932
Pooled Property Investments 129,933 19,897 (11,675) (4,545) 133,610
971,432 1,047,211 (468,951) (197,035) 1,352,656
Other Investment Balances
Cash Deposits 5,647 0 0 0 4,096Amounts receivable for sales of investments
Investment income due 1,973 0 0 0 1,673
Amounts payable for purchases of investments (35) 0 0 0 (45)Net Investment Assets 7,585 5,724
Market Value
as at
1 Apr 2015
Purchases Sales Change in
Market Value
Market Value
as at
31 Mar 2016
£'000 £'000 £'000 £'000 £'000
Bonds 99,631 0 (98,701) (930) 0
Equities 270,637 244,815 (256,368) (16,288) 242,796
Pooled Investments 604,115 67,622 (50,020) (23,014) 598,703
Pooled Property Investments 116,945 10,359 (8,978) 11,607 129,933
1,091,328 322,796 (414,067) (28,625) 971,432
Other Investment Balances
Cash Deposits 5,414 0 0 0 5,647
Investment income due 978 0 0 0 1,973
Amounts payable for purchases of investments (223) 0 0 0 (35)
Net Investment Assets 6,169 7,585
The movement in the opening and closing value of investments during the year, together with related direct transaction costs, were as
follows:
84

10. INVESTMENTS (continued)
Market
Value as at
1 Apr 2016
Market Value
as at
31 Mar 2017
£'000 £'000
Equities
UK
Quoted 16,023 21,564
Overseas
Quoted 198,593 225,922
214,616 247,486
Pooled Funds - Additional Analysis
UK
Fixed Income Unit Trust 60,630 73,978
Unit Trusts 538,072 820,774
Overseas
Unit Trusts 28,181 76,809
626,883 971,561
Pooled Property Investments 129,934 133,609
129,934 133,609
Cash Deposits 5,647 4,096
Investment Income Due 1,973 1,673
7,620 5,769
Total Investment Assets 979,053 1,358,425
Investment Liabilities
Amounts Payable for Purchases (35) (45)
Total Investment Liabilities (35) (45)
Net Investment Assets 979,018 1,358,380
The market value per investment manager is as follows:
£'000 % £'000 %
Baillie Gifford 209,888 21.6% 0 0.0%
GMO UK Ltd 242,796 25.0% 324,295 24.0%
Insight Investment Management (Global) Ltd 0 0.0% 71,743 5.3%
Legal & General 277,864 28.6% 339,865 25.0%
London LGPS CIV 56,344 5.8% 405,215 30.0%
Goldman Sachs Asset Management 0.0% 77,929 5.8%
Ruffer 54,606 5.6% 0 0.0%
Schroders Asset Management Property Fund 129,934 13.4% 133,609 9.9%
971,432 100.0% 1,352,656 100.0%
A further analysis of investments assets is as follows.
Market Value 31 Mar 2016 Market Value 31 Mar 2017
85

11. INVESTMENT INCOME
2015/16 2016/17
£'000 £'000
Dividends from overseas equities 8,660 11,917
Dividends from UK equities 0 89
Net rents from properties 4,733 5,002
Interest on cash deposits 387 130
Foreign tax 160 275
TOTAL 13,940 17,413
2015/16 2016/17
£'000 £'000
Withholding tax - equities 360 286
Withholding tax - pooled 49 77
TOTAL 409 363
12 ACTUARIAL POSITION
£m
2017/18 15.00
2018/19 15.00
2019/20 15.00
Investment income is broken down as follows.
The basis of valuing the Fund's assets (see note 2) is compatible with the basis of placing a value on members' benefits as both
are related to market conditions at the valuation date.
The Local Government Pension Scheme Regulations require a triennial revaluation of the Fund to assess the adequacy of the
Fund's investments and contributions in relation to its overall and future obligations. The contribution rate required for benefits
accruing in the future is assessed by considering the benefits that accrue over the course of the three years to the next valuation.
The employer's contribution rate is determined by the Actuary as part of the revaluation exercise.
The 2016 statutory triennial revaluation of the Pension Fund completed by the Actuary (Hymans Robertson) in the year estimated
the deficit on the Fund to be £235 million and the funding level to be 82.8%. This compares to a deficit at the previous revaluation
in 2013 of £365 million and a corresponding funding level of 71.8%.
The Actuary has determined that the deficit can be recovered over a period of 20 years and the agreed contributions to recover the
deficit for the term of the revaluation is as set out below :-
The FSS requires that the Fund operates the same target funding level of all on-going employers of 100% of its accrued liabilities
valued on the on-going basis, to be achieved over a 20 year period (a period equivalent to the expected future working lifetime of
the remaining scheme members). The valuation of the Fund as at 31st March 2016 determined that this would require a
contribution (additional to the future contribution rate) of 9.1% of members' pensionable pay equivalent to £15.0 million per annum.
The Council, as Administering Authority, prepares a Funding Strategy Statement (FSS) in respect of the Fund in collaboration with
the Fund's Actuary and after consultation with the employers and investment advisors. The Actuary is required to have regard to
this statement when carrying out the valuation. The FSS includes the Fund's funding policy, the objectives of which are:
- to ensure the long-term solvency of the Fund
- to ensure that sufficient funds are available to meet all benefits as they fall due for payment
- not to restrain unnecessarily the investment strategy of the Fund so that the Council can seek to maximise investment returns
(and hence minimise the cost of the benefits) for an appropriate level of risk.
TAXES ON INVESTMENT INCOME
86

12. ACTUARIAL POSITION (continued)
Financial Assumptions Nominal
Price inflation (CPI) 2.1%
Pay increases 2.0%
Funding basis discount rate 4.2%
Longevity (in years) Male Female
22.1 24.1
23.9 25.8
Assumptions
To assess the value of the employer's liabilities the actuary rolls forward the values from the liabilities calculated from the funding valuation
as at 31 March 2016 using financial assumptions that comply with IAS 19
Demographic assumptions
The demographic assumptions used are consistent with those used for the funding valuation as at March 2016
Average future life expectancies at age 65 years Males Females
Current pensioners 22.1 24.1
Future pensioners 23.9 25.8
Financial assumptions
Year ended
31st March
2016
31st March
2017
Pension increase rate 2.2% 2.4%
Salary increase rate 3.7% 2.2%
Discount rate 3.5% 2.5%
13. MANAGEMENT EXPENSES
2015/16 2016/17
£'000 £'000
Administration costs 910 789
Investment management expenses 3,076 2,879
Oversight & governance 107 1834,093 3,851
14. INVESTMENT EXPENSES
2015/16 2016/17£'000 £'000
Management fees 2,901 2,722Custody fees 29 35Transaction Costs 146 122
3,076 2,879
14b. EXTERNAL AUDIT FEE
2015/16 2016/17£'000 £'000
Audit Fee 21 2121 21
Average future life expectancy at age 65 for a non-pensioner
aged 45 at the valuation date
IAS 26 requires the present value of the Fund's promised retirement benefits to be disclosed and for this purpose the actuarial assumptions
and methodology should be based on IAS19.
The actuarial present value of promised retirement benefits calculated in line with IAS19 assumptions is estimated to be £1,983 million
(£1,659 million in 2015/16). This includes both vested and non-vested benefits.
Actuarial Value of Promised Retirement Benefits
In accordance with the funding policy, the Actuary determines the employer contribution requirement for future service for the Fund as a
whole, and for employers who continue to admit new members. The cost of future service benefits is assessed, taking into account
expected future salary increases. In order to place a current value on future benefit cashflows the Actuary "discounts" the future cashflows
to the valuation date at a suitable rate. The Actuary adopts a "gilt-based" valuation which uses the yield on suitably dated Government
bonds as the discount rate. This is then uplifted to the "funding basis discount rate" taking into account the Fund's current and expected
future investment strategy to reflect the percentage by which the Fund is anticipated to "outperform" the yield on Government bonds. The
contribution rate required to meet the expected cost of future service benefits is derived as this value less expected member contributions
expressed as a percentage of the value of members' pensionable pay. This is known as the "Projected Unit method". The future
contribution rate for 2016/17 was 19.9%.
In addition, the Actuary compares the value of the Fund's assets with the estimated cost of members' past service. The ratio of the asset
value to the estimated cost of members' past service benefits is known as the "funding level". If the funding level is more than 100% there
is a "surplus"; if it less than 100% there is a "shortfall". The next valuation will be as at 31st March 2016 and the recommendations
implemented from 1st April 2017.
Although the funding shortfall is significant, it should be noted that current legislation provides that the level of members' basic pension
entitlement and contributions are not affected by the financial position of the Fund. It is the Council's responsibility to ensure that pension
entitlements are fully funded and that the impact on Council Tax is minimised. It should also be recognised that the Council is a long-term
investor both because a high proportion of pension benefits do not become payable until far in the future and the Council has a relatively
secure long-term income stream.
The latest full triennial actuarial valuation of the Fund's liabilities in accordance with IAS26 took place at 31st March 2016. The main
actuarial assumptions used in revaluation and applied during the intervaluation period were as follows:
Average future life expectancy for a pensioner aged 65 at
the valuation date
The investment management expenses above includes transaction costs of £160,000 (£74,000 in 2015/16). Costs
are also incurred through the bid/offer spread on investment sales and purchases and these are reflected in the
costs of purhcases and proceeds from sales of investments.
87

15. RISK MANAGEMENT
Nature and extent of risks arising from financial instruments
Risk and Risk Management
Credit risk
Liquidity risk
Market risk
Interest rate risk
Interest Rate RiskAs At 31st March
2016
As At 31st March
2017
Asset Type £'000 £'000
Cash and cash equivalents 5,647 4,096
Cash balances 149,053 19,846
Fixed interest securities 60,630 73,978
Total 215,330 97,920
Interest Rate Risk - Sensitivity Analysis
+100 BPS -100 BPS
Asset Type £'000 £'000
Cash and cash equivalents 4,096 41 (41)
Cash balances 19,846 198 (198)
Fixed interest securities 73,978 (740) 740
Total change in net assets available 97,920 (501) 501
Interest Rate Risk - Sensitivity Analysis
+100 BPS -100 BPS
Asset Type £'000 £'000
Cash and cash equivalents 5,647 56 (56)
Cash balances 149,053 1,491 (1,491)
Fixed interest securities 60,630 (606) 606
Total change in net assets available 215,330 941 (941)
Interest rate risk - sensitivity analysis
The Fund currently operates two bank accounts. One is held by the Fund’s custodian (State Street Bank) and holds
cash relating to the investment activities and the other is the LBTH Pension Fund bank account and this is used to
hold cash relating to member activities.
Carrying Amount As
At 31st March 2017
Change in year in net assets available
The fund's primary long-term risk is that the fund's assets will fall short of its liabilities. The aim of investment risk
management is to minimise the risk of a reduction in the value of the fund and to maximise the opportunity for gains
across the whole portfolio. The fund achieves this through asset diversification to reduce exposure to market risk and
credit risk to an acceptable level.
Interest rates can vary and can affect both income to the fund and the value of net assets available to pay benefits. A
100 basis point (BPS) movement in interest rates is consistent with the level of sensitivity applied as part of the fund's
risk management strategy. The table below shows the effect of a +/- 100 BPS change in interest rates.
Should the Fund have insufficient money available to meet its commitments it may, under Regulation 5.2 borrow cash
for up to 90 days. If there was a longer term shortfall then the Fund’s assets could be sold to provide additional cash.
A significant proportion of the Fund is made up of readily realisable assets.
Credit risk is the risk that a counter party to a financial instrument may fail to pay amounts due to the Pension fund.
The market value of investments generally reflect an assessment of credit in their pricing and consequently the risk of
loss is implicitly provided for in the carrying value of the fund's financial assets and liabilities. The fund carries out a
review of its investment managers annual internal control reports to ensure that managers are diligent in their
selection and use of counterparties and brokers. Deposits are made with banks and financial institutions that are
rated independently and meet the Council's credit criteria.
The Council only invests money with institutions with a minimum Fitch credit rating of A+ or higher.
This is the risk that the Fund might not have the cash flow required in order to meet its financial obligations when they
become due. Over the years contributions have tended to be greater than benefits and this has ensured that
sufficient cash has been available to meet payments.
Carrying Amount As
At 31st March 2016
This is the risk that fair value or future cash flows of a financial instrument will fluctuate because of changes in market
prices. Market risk comprises; interest rate risk, currency risk and other price risk. The Fund mitigates these risks as
follows:
Cash deposits held in the Pension Fund bank account are invested in accordance with the Council’s approved
Treasury Management Strategy.
The Fund holds a percentage of its portfolio in fixed interest securities to mitigate this risk should interest rates fall.
The Fund's direct exposure to interest rate movements as at 31st March 2016 and 31st March 2017 is set out below.
Change in year in net assets available
to pay benefits
88

15. RISK MANAGEMENT (continued)Currency risk
Currency Exposure - Asset Type As At 31st March
2016
As At 31st March
2017
Asset Type £'000 £'000
Overseas quoted securities 230,423 306,252
Overseas unit trusts 3,574 0
Cash 0 0
Total overseas assets 233,997 306,252
Currency Exposure - Sensitivity Analysis
+8.8% -8.8%
Asset Type £'000 £'000 £'000
Overseas quoted securities 306,252 333,202 279,302
Overseas unit trusts 0 0 0
Cash 0 0 0
Total change in net assets available 306,252 333,202 279,302
Currency Exposure - Sensitivity Analysis
+6.8% -6.8%
Asset Type £'000 £'000
Overseas quoted securities 230,423 246,092 214,754
Overseas unit trusts 3,574 3,817 3,331
Cash 0 0 0
Total change in net assets available 233,997 249,909 218,085
Other Price risk
Price Risk - sensitivity analysis
Asset Type
UK equities 7.9%
Global equity 11.0%
Total fixed interest 4.9%
Alternatives 6.0%
Cash 0.0%
Pooled Property Investments 2.1%
The Fund invests in financial instruments denominated in currencies other than Sterling and as a result is exposed to exchange rate
risk. This is the risk that the fair value of future cash flows of a financial instrument will fluctuate because of changes in foreign
exchange rates. To alleviate this risk the Fund allows investment managers to use derivative contracts, in accordance with the contract
conditions:
Following analysis of historical data in consultation with the fund's investment advisors, the Council considers the likely volatility
associated with foreign exchange rate movements to be 8.8%. This analysis assumes all other variables, in particular interest rates,
remain constant.
Carrying Amount
As At 31st March
2017
Change in year in net assets available to
pay benefits
Carrying Amount
As At 31st March
2016
Change in year in net assets available to
pay benefits
To mitigate the risk of a loss owing to a fall in market prices the Fund maintains a diverse portfolio of investments. Diversification
ensures that the Fund has a balance of investments that offer different levels of risk and return.
The Fund employs a number of investment managers, with differing but complementary styles, to mitigate the risk of underperformance
of any single manager and to ensure that any fall in market prices should not affect the Fund as a whole.
Manager performance and asset allocation policy is regularly reviewed by the Pensions Investment Panel. The Fund also uses certain
derivative instruments as part of efficient portfolio management.
Other price risk - sensitivity analysis
Potential price changes are determined based on the observed historical volatility of asset class returns. 'Riskier' assets such as
equities will display greater potential volatility than bonds. The potential volatilities are consistent with a one standard deviation
movement in the change in value of the assets over the latest three years.
Following analysis of historical data and expected investment return movement during the financial year, in consultation with the Fund's
investment advisors, the Council has determined that the following movements in market price risk are reasonably possible for the
2016/17 reporting period. This analysis assumes that all other variables, in particular foreign currency exchange rates and interest
rates remain the same.
Potential Market Movements (+/-)
The following table summarises the Fund's currency exposure as at 31 March 2017 and as at the previous year end.
89
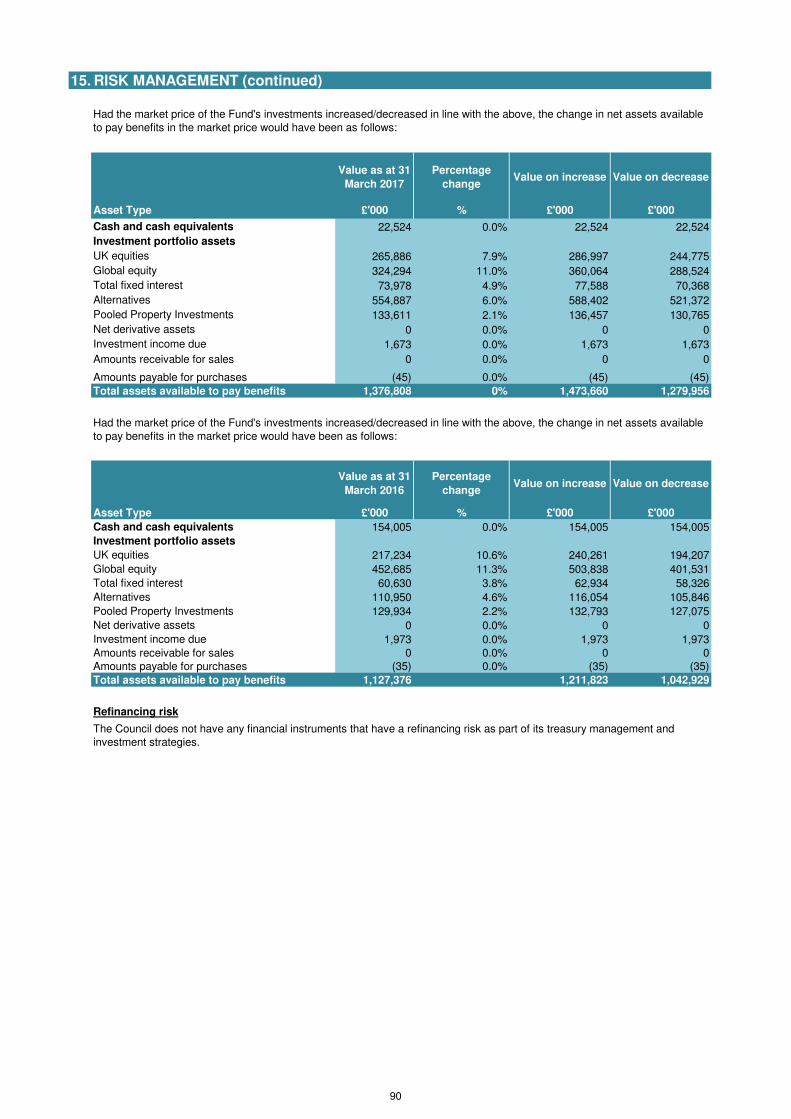
15. RISK MANAGEMENT (continued)
Value as at 31
March 2017
Percentage
changeValue on increase Value on decrease
Asset Type £'000 % £'000 £'000
Cash and cash equivalents 22,524 0.0% 22,524 22,524
Investment portfolio assets
UK equities 265,886 7.9% 286,997 244,775
Global equity 324,294 11.0% 360,064 288,524
Total fixed interest 73,978 4.9% 77,588 70,368
Alternatives 554,887 6.0% 588,402 521,372
Pooled Property Investments 133,611 2.1% 136,457 130,765
Net derivative assets 0 0.0% 0 0
Investment income due 1,673 0.0% 1,673 1,673
Amounts receivable for sales 0 0.0% 0 0
Amounts payable for purchases (45) 0.0% (45) (45)
Total assets available to pay benefits 1,376,808 0% 1,473,660 1,279,956
Value as at 31
March 2016
Percentage
changeValue on increase Value on decrease
Asset Type £'000 % £'000 £'000
Cash and cash equivalents 154,005 0.0% 154,005 154,005
Investment portfolio assets
UK equities 217,234 10.6% 240,261 194,207
Global equity 452,685 11.3% 503,838 401,531
Total fixed interest 60,630 3.8% 62,934 58,326
Alternatives 110,950 4.6% 116,054 105,846
Pooled Property Investments 129,934 2.2% 132,793 127,075
Net derivative assets 0 0.0% 0 0
Investment income due 1,973 0.0% 1,973 1,973
Amounts receivable for sales 0 0.0% 0 0
Amounts payable for purchases (35) 0.0% (35) (35)
Total assets available to pay benefits 1,127,376 1,211,823 1,042,929
Refinancing risk
Had the market price of the Fund's investments increased/decreased in line with the above, the change in net assets available
to pay benefits in the market price would have been as follows:
The Council does not have any financial instruments that have a refinancing risk as part of its treasury management and
investment strategies.
Had the market price of the Fund's investments increased/decreased in line with the above, the change in net assets available
to pay benefits in the market price would have been as follows:
90

16. VALUATION OF FINANCIAL INSTRUMENTS CARRIED AT FAIR VALUE
IFRS7 requires the Fund to classify fair value instruments using a three-level hierarchy.
The three levels are summarised as follows:
Level 2 - inputs other than quoted prices for identical assets or liabilities in active markets
Level 1 Level 2 Level 3 Total
£'000 £'000 £'000 £'000
Equities 247,485 0 0 247,485
Pooled Funds
Unit Trusts 971,562 0 0 971,562
Property Unit Trust 133,609 0 0 133,609
Other 0 0 0 0
Derivative Contracts
Forward Foreign Exchange Contracts 0 0 0 0
Cash and bank Deposits 23,701 0 0 23,701
Current Assets 1,914 0 0 1,914
Current Liabilities (10,595) 0 0 (10,595)
1,367,677 0 0 1,367,677
During the year ended 31st March 2017 there were no transfers between the levels of the fair value hierarchy.
The equivalents at 31st March 2016 were as follows:Level 1 Level 2 Level 3 Total
£'000 £'000 £'000 £'000
Equities 214,617 0 0 214,617
Pooled Funds
Unit Trusts 572,275 0 0 572,275
Property Unit Trust 129,933 0 0 129,933
Other 54,607 0 0 54,607
Derivative Contracts
Forward Foreign Exchange Contracts 0 0 0 0
Cash and bank Deposits 154,464 0 0 154,464
Current Assets 2,210 0 0 2,210
Current Liabilities (1,977) 0 0 (1,977)
1,126,129 0 0 1,126,129
Fair Value Hierarchy
The following sets out the Fund's assets and liabilities according to the fair value hierarchy as at 31st March 2017.
Level 1 - inputs that reflect quoted prices for identical assets or liabilities in active markets. Products classified as level
1 comprise quoted equities, quoted fixed securities, quoted index-linked securities and unit trusts
Level 3 - inputs that are not based on observable data. Such instruments would include unquoted equity investments
and hedge fund of funds.
91

16. FINANCIAL INSTRUMENTS DISCLOSURES
Net gains and losses on financial istruments
2015/16 2016/17
£'000 £'000
Financial Assets
Loans and receivables 398 148
Financial assets at fair value through profit or loss (27,304) 218,459
Total Financial Assets (26,906) 218,607
Financial Liabilities
Payables
Financial liabilities at fair value through profit or loss 0 0
Total Financial Liabilities 0 0
Long-term
92

17. CURRENT ASSETS
2015/16 2016/17
£'000 £'000
Contributions due - employees
Contributions due - employers 236 241
Sundry debtors 458 1,177
Cash balances 148,359 18,428
149,053 19,846
Analysis of debtors 2015/16 2016/17
£'000 £'000
149,053 19,846
149,053 19,846
18. CURRENT LIABILITIES
2015/16 2016/17
£'000 £'000
Sundry creditors 671 4,687
HMRC creditor 4,199
Benefits payable 1,271 1,664
1,942 10,550
Analysis of creditors 2015/16 2016/17
£'000 £'000
Other entities and individuals 1,942 10,550
1,942 10,550
Other entities and individuals
93

19. RELATED PARTY TRANSACTIONS
2015/16 2016/17
Fund Administration Expenses £'000 £'000
Payroll / HR Support 494 494
Corporate Finance 175 175
669 669
Employees holding key positions in the financial management of the fund as at 31st March 2017 include:
Service Head - Finance and Procurement
The financial value of their relationship with the fund is as set out below
2015/16 2016/17
£'000 £'000
Short term benefits 19 30
Long term/post retirement benefits 4 13
20. CONTINGENT LIABILITIES
21. CONTINGENT ASSETS
22. IMPAIRMENT LOSSES
During 2016/17 impairment losses were nil (impairment losses in 2015/16 were also nil).
The Council has a subsidiary company, Tower Hamlets Homes, who are within the Fund. During the year the Fund received
contribution payments totalling £3.3m (£3.4m 2015/16) from this company.
The London Borough of Tower Hamlets Pension Fund is administered by The London Borough of Tower Hamlets.
In accordance with IAS24 'Related Party Disclosure', material transactions with related parties not disclosed elsewhere in the
financial statements are detailed below.
The Council incurred costs of £669k (£669k 2015/16) relating to administration of the Fund and has been reimbursed by the
Fund for these expenses. The Council contributed £22.0m (£20.5m 2015/16) to the Fund in respect of back funding. All
monies owing to and from the Fund were paid in the year.
During the year no Committee Members or Council Chief Officers with direct responsibility for pension fund issues, have
undertaken any declarable transactions with the Pension Fund, other than administrative services undertaken by the Council
on behalf of the Pension Fund.
The pension fund cash held by London Borough of Tower Hamlets is invested on the money markets by the treasury
management operations of the Council. During the year to 31st March 2017, the Fund held an average investment of £26.1m
(£48.1m 31st March 2016), earning interest of £148k (£398k in 2015/16).
Compensation of key management - It was not practical to include costs relating to key management personnel within the
Pension Fund Accounts, principally as they are charged to the Council's Accounts and have not been charged to the Pension
Fund. All costs are disclosed within note 33 of the Council's main accounts.
There are no contingent liabilities as at 31/03/2017.
Admitted body employers in the Fund hold insurance bonds to guard against the possibility of not being able to meet their
pension obligations. These bonds are drawn in favour of the pension fund and payment will only be triggered in event of
employer default.
Fund administration expenses payable to the administrating authority are as set out in the table below.
Key Management Personnel
Chief Accountant
Governance
Each member of the pension fund committee is required to declare their interests at each meeting of the Committee. These
are recorded as part of the public record of each meeting. For 2016/17 there were no Members of the Pension Fund
Committee who had involvement with other organisations.
94

95
Independent auditor’s report to the members of the London Borough of Tower
Hamlets
We have audited the financial statements of the London Borough of Tower Hamlets for the year ended 31
March 2017 on pages 8 to 94. The financial reporting framework that has been applied in their preparation
is applicable law and the CIPFA/LASAAC Code of Practice on Local Authority Accounting in the United
Kingdom 2016/17.
This report is made solely to the members of the Authority, as a body, in accordance with Part 5 of the Local
Audit and Accountability Act 2014. Our audit work has been undertaken so that we might state to the
members of the Authority, as a body, those matters we are required to state to them in an auditor’s report
and for no other purpose. To the fullest extent permitted by law, we do not accept or assume responsibility
to anyone other than the members of the Authority, as a body, for our audit work, for this report, or for the
opinions we have formed.
Respective responsibilities of the Corporate Director of Resources and auditor
As explained more fully in the Statement of the Corporate Director of Resources’ Responsibilities, the
Corporate Director of Resources is responsible for the preparation of the Statement of Accounts, which
includes the financial statements, in accordance with proper practices as set out in the CIPFA/LASAAC Code
of Practice on Local Authority Accounting in the United Kingdom, and for being satisfied that they give a true
and fair view. Our responsibility is to audit, and express an opinion on, the financial statements in
accordance with applicable law and International Standards on Auditing (UK and Ireland). Those standards
require us to comply with the Auditing Practices Board’s Ethical Standards for Auditors.
Scope of the audit of the financial statements
An audit involves obtaining evidence about the amounts and disclosures in the financial statements
sufficient to give reasonable assurance that the financial statements are free from material misstatement,
whether caused by fraud or error. This includes an assessment of whether the accounting policies are
appropriate to the Authority’s and the Pension Fund’s circumstances and have been consistently applied and
adequately disclosed; the reasonableness of significant accounting estimates made by the Corporate
Director of Resources; and the overall presentation of the financial statements.
In addition, we read all the financial and non-financial information in the Narrative Report to identify
material inconsistencies with the audited financial statements and to identify any information that is
apparently materially incorrect based on, or materially inconsistent with, the knowledge acquired by us in
the course of performing the audit. If we become aware of any apparent material misstatements or
inconsistencies we consider the implications for our report.
Opinion on financial statements
In our opinion the financial statements:
• give a true and fair view of the financial position of the Authority as at 31 March 2017 and of the
Authority’s expenditure and income for the year then ended;

96
• give a true and fair view of the financial transactions of the Pension Fund during the year ended 31
March 2017 and the amount and disposition of the Fund's assets and liabilities as at 31 March 2017
other than liabilities to pay pensions and other benefits after the end of the scheme year; and
• have been prepared properly in accordance with the CIPFA/LASAAC Code of Practice on Local Authority
Accounting in the United Kingdom 2016/17.
Matters on which we are required to report by exception
The Code of Audit Practice requires us to report to you if:
• the Annual Governance Statement set out on pages 101 to 114 does not reflect compliance with
‘Delivering Good Governance in Local Government: a Framework’ (CIPFA/SOLACE 2016 Edition); or
• the information given in the Narrative Report for the financial year for which the financial statements
are prepared is not consistent with the financial statements; or
• any matters have been reported in the public interest under Section 24 of the Local Audit and
Accountability Act 2014 in the course of, or at the conclusion of, the audit; or
• any recommendations have been made under Section 24 of the Local Audit and Accountability Act 2014;
or
• any other special powers of the auditor have been exercised under the Local Audit and Accountability
Act 2014.
We have nothing to report in respect of these matters.
Conclusion on the London Borough of Tower Hamlets’ arrangements for securing
economy, efficiency and effectiveness in the use of resources
Authority’s responsibilities
The Authority is responsible for putting in place proper arrangements to secure economy, efficiency and
effectiveness in its use of resources, to ensure proper stewardship and governance, and to review regularly
the adequacy and effectiveness of these arrangements.
Auditor’s responsibilities
We are required under Section 20(1) (c) of the Local Audit and Accountability Act 2014 to satisfy ourselves
that the Authority has made proper arrangements for securing economy, efficiency and effectiveness in its
use of resources. The Code of Audit Practice issued by the Comptroller and Auditor General (C&AG) requires
us to report to you our conclusion relating to proper arrangements.
We report if significant matters have come to our attention which prevent us from concluding that the
Authority has put in place proper arrangements for securing economy, efficiency and effectiveness in its use
of resources. We are not required to consider, nor have we considered, whether all aspects of the
Authority’s arrangements for securing economy, efficiency and effectiveness in its use of resources are
operating effectively.

97
Scope of the review of arrangements for securing economy, efficiency and effectiveness in the use of
resources
We have undertaken our review in accordance with the Code of Audit Practice, having regard to the
guidance on the specified criterion issued by C&AG in November 2016, as to whether London Borough of
Tower Hamlets had proper arrangements to ensure it took properly informed decisions and deployed
resources to achieve planned and sustainable outcomes for taxpayers and local people. The C&AG
determined this criterion as that necessary for us to consider under the Code of Audit Practice in satisfying
ourselves whether London Borough of Tower Hamlets put in place proper arrangements for securing
economy, efficiency and effectiveness in its use of resources for the year ended 31 March 2017.
We planned our work in accordance with the Code of Audit Practice. Based on our risk assessment, we
undertook such work as we considered necessary to form a view on whether, in all significant respects,
London Borough of Tower Hamlets had put in place proper arrangements to secure economy, efficiency and
effectiveness in its use of resources.
Basis for qualified conclusion
In considering whether the Authority has made proper arrangements to secure economy, efficiency and
effectiveness in its use of resources we have reviewed the progress made against the findings of the Best
Value Inspection of the London Borough of Tower Hamlets Report (the Report) produced by
PricewaterhouseCoopers LLP (PwC) for the Department for Communities and Local Government (DCLG)
dated 16 October 2014 and published on 4 November 2014, as well as the evidence gathered from our own
audit work.
The DCLG instructed PwC to cover specific matters as part of the Best Value Inspection. The report
concluded that the Authority had not achieved the best value duty with regard to the following areas:
• The Authority’s payment of grants and connected decisions;
• The disposal of property and the granting of leasehold interests; and
• Spending on publicity.
The Report also commented that the Authority’s corporate governance arrangements did not appear to be
capable of preventing or responding appropriately to failures of the best value duty in the areas highlighted
above. Subsequently the Secretary of State for Communities and Local Government appointed independent
Commissioners to undertake an executive decision-making role in relation to all grant decisions, and to
oversee the work of the Authority in these areas of operation. The Commissioners played a consultative role
in the development of plans to deal with weaknesses in the processes for entering into contracts identified
in the report, but were not able to issue binding directions to the Authority except in circumstances where
they fail to adopt recommendations of the statutory officers.
These matters, taken together with comments within the Mayoral election judgment (as set out in the High
Court of Justice, Queen’s Bench Division, in the matter of the Representation of the People Act 1983, and in
the matter of a Mayoral election for the London Borough of Tower Hamlets held on 22 May 2014) and other
matters raised with us as auditors, indicated that governance processes were not operating effectively for
the periods covered by these inspections and judgments.
The Authority developed and published comprehensive action plans including a programme of cultural
change (the “BV Action Plans”) to address the findings of the reports detailed above. During the course of
being delivered at the Council, in September 2016 and February 2017.

98
In their February 2017 letter to the Secretary of State for Communities and Local Government the
Commissioners set out their endorsement of the progress that had been made in all areas of the Direction
regime. In particular the Commissioners welcomed the Authority’s appreciation not only of what has been
done, but also what remains to be done to fulfil the expectations for the Directions. The Authority was clear
in its February 2017 submission to the Secretary of State for Communities and Local Government that it
would take some twelve months to complete the work required. The Authority has developed this work into
a Best Value Improvement Plan (“BV Improvement Plan”) under five areas: elections; communications;
property; grants; and organisational culture.
In March 2017 the Secretary of State for Communities and Local Government decided to end the 2014
Directions and not to extend the appointment of the Commissioners beyond 31 March 2017 in recognition
of the Authority’s progress. In light of the remaining work, identified in the BV Improvement Plan, the
Secretary of State for Communities and Local Government has made three new Directions, in force until 30
September 2018, which require the Authority to set up a Best Value Improvement Board (with cross party
and independent membership); submit quarterly progress reports on the BV Improvement Plan to the
Secretary of State for Communities and Local Government; and set up an independent review of
achievement of the BV Improvement Plan with a report to the Secretary of State for Communities and Local
Government by 1 August 2018.
We have considered the extent to which the Authority’s BV Action Plans were implemented during 2016/17.
The reports submitted to the Authority’s Cabinet meetings in September 2016 and March 2017 clearly show
that while progress was meaningful, there remain a significant number of actions that were not completed
within 2016/17. Whilst we note the progress made further time is required to fully implement and embed
the improvements required under the BV Improvement Plan.
An Ofsted inspection undertaken in January and February 2017, which reported in April 2017, rated the
Authority’s services for children in need of help and protection, children looked after and care leavers and
the local safeguarding children board inadequate overall with some features requiring improvement. The
Ofsted report raised concerns in relation to poor frontline practice and ineffective, complacent and
sometimes resistant management practices which enabled non-compliance with basic standards (including
legal requirements) and in some cases left children at risk of harm. The report also highlighted the need for
stronger leadership, management and governance to ensure there is robust performance management and
scrutiny of children’s social care.
The Authority has established a Children’s Services Improvement Board led by an Independent Chair and an
Improvement Plan was submitted to the Department for Education in July 2017. Ofsted will be carrying out
quarterly monitoring visits to ensure that its recommendations are being robustly addressed.
In October 2015, in relation to our audit for the year ended 31 March 2014, we raised a recommendation
under section 11(3) of the Audit Commission Act 1998 that the Authority should undertake a detailed review
of its governance processes to satisfy itself that they were appropriate and operating effectively. This
reflected our view that the Authority needed to ensure that its governance processes were appropriate in a
wider sense for the Authority as a whole and as part of its programme of cultural change and not just the
areas referred to in the BV Inspection report. This governance review is being undertaken in conjunction
with the other actions currently being undertaken including the programme of cultural change. We are
satisfied that the issues referred to have been incorporated into the Authority’s BV Implementation Plan
relating to organisational culture.

99
Having considered the findings and conclusions of the above inspections together with the results of our
audit work, we have concluded that the Authority did not have proper arrangements in place to meet the
requirements of the sub-criteria relating to ‘informed decision making’ and ‘working with partners and other
third parties’.
Qualified conclusion
On the basis of our work, having regard to the guidance issued by the C&AG in November 2016, with the
exception of the matters reported in the basis for qualified conclusion paragraph above, we are satisfied
that, in all significant respects, London Borough of Tower Hamlets put in place proper arrangements to
secure economy, efficiency and effectiveness in its use of resources for the year ended 31 March 2017.
Delay in certification of completion of the audit
Due to matters brought to our attention by local authority electors and work on the WGA Return not
being completed by the 29 September 2017
We cannot formally conclude the audit and issue an audit certificate until we have completed our
consideration of one matter brought to our attention by a local authority elector under the Audit
Commission Act 1998, relating to the year ending 31 March 2014; and one matter brought to our attention
by a local authority elector under the Local Audit and Accountability Act 2014, relating to the year ending 31
March 2017. We are satisfied that this work does not have a material effect on the financial statements or
on our conclusion on arrangements to secure value for money.
In addition we have not yet completed the work necessary to issue our assurance statement in respect of
the Authority’s Whole of Government Accounts consolidation pack. We are satisfied that this work does not
have a material effect on the financial statements or on our value for money conclusion.
Andrew Sayers
for and on behalf of KPMG LLP, Statutory Auditor
Chartered Accountants
15 Canada Square, London, E14 5GL
29 September 2017

STATEMENT OF RESPONSIBILITIES FOR THE STATEMENT OF ACCOUNTS
The Council’s responsibilities The Council is required:
• To make arrangements for the proper administration of its financial affairs and to secure that one of its officers has the responsibility for the administration of those affairs. In this Council, that officer is the Corporate Director of Resources.
• To manage its affairs to secure economic, efficient and effective use of resources and safeguard its assets.
• To consider and approve the Statement of Accounts. Audit Committee Certificate of Approval The Statement of Accounts for the year ended 2016/17 will be approved by the Council’s Audit Committee on 27
th September 2017.
Cllr Candida Ronald Chair of the Audit Committee The responsibilities of the Corporate Director of Resources The Corporate Director of Resources is responsible for the preparation of the Council’s Statement of Accounts in accordance with proper practices as set out in the CIPFA/LASAAC Code of Practice on Local Authority Accounting in the United Kingdom (“the Code of Practice”). In preparing this Statement of Accounts, the Corporate Director of Resources has:
• Selected suitable accounting policies and then applied them consistently
• Made judgements and estimates that were reasonable and prudent
• Complied with the Code of Practice. The Corporate Director of Resources has also:
• Kept proper accounting records which were up to date
• Taken reasonable steps for the prevention and detection of fraud and other irregularities. Certificate of the Corporate Director or Resources I certify that the Statement of Accounts 2016/17 presents a true and fair view of the financial position of the Council in accordance with the CIPFA/LASAAC Code of Practice on Local Authority Accounting in the United Kingdom (“the Code of Practice”) as at 31
st March 2017 and its income and expenditure
for the year ended 31 March 2017.
Zena Cooke Corporate Director of Resources 27
th September 2017

101

102

103

104

105

106

107

108

109

110

111
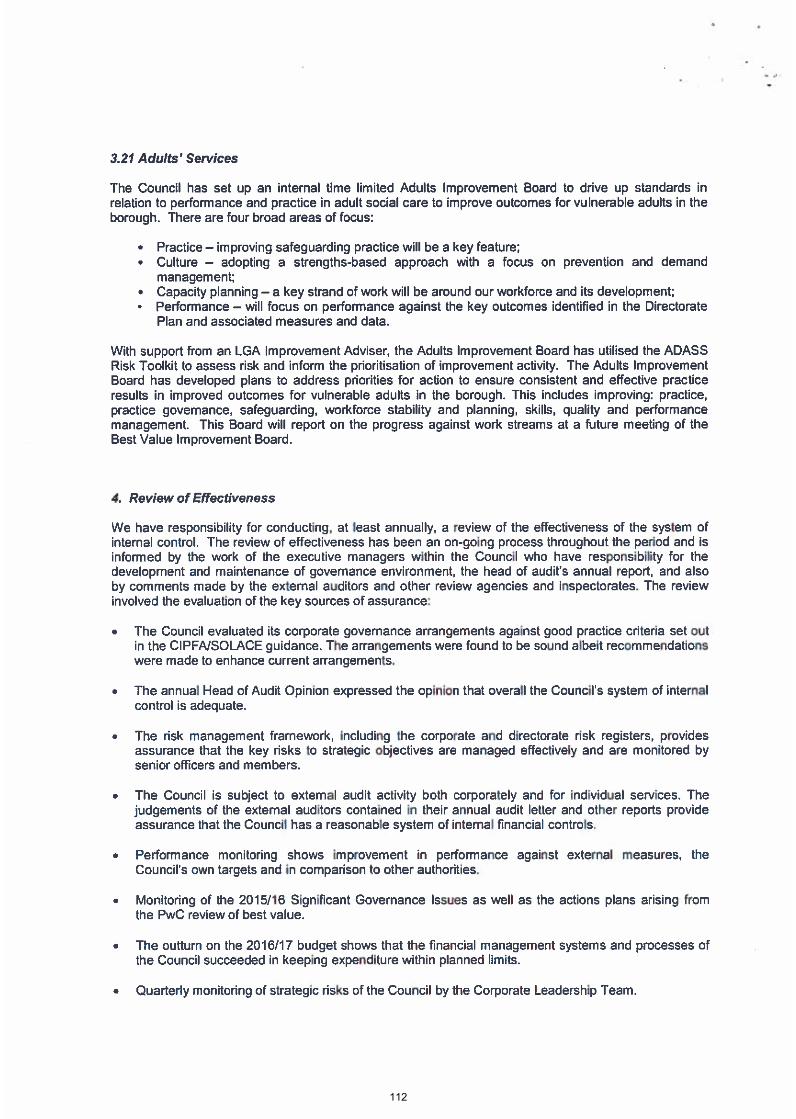
112

113

114

GLOSSARY OF FINANCIAL TERMS AND ABBREVIATIONS The following terms and abbreviations, while not being exhaustive, may provide assistance in understanding the Statement of Accounts.
FINANCIAL TERMS Accounting period – The period of time covered by the Council’s accounts. The Council’s financial year is from the period 1
st April to the following 31
st March.
Accounting policies – The specific principles, bases, conventions, rules, and practices, applied by the Council, in preparing and presenting the financial statements. Accounting standards – A set of rules explaining how accounts are to be kept. (See ‘International Financial Reporting Standards’) Accrual – The recognition of income and expenditure in the year that they occur and not when any cash is received or paid. Accumulated Absences Account – This account represents the value of leave rolled over from one financial year to another. This reserve account is used to avoid reducing general fund reserves. Actuary – An independent adviser to the Council on the financial position of the Pension Fund. Actuarial Valuation – Every three years the Actuary reviews the assets and liabilities of the Pension Fund and reports to the Council on the fund’s financial position and recommended employers’ contribution rates. The most recent valuation was in 2013. Agency services – Services provided by or for another local authority or public body where the cost of carrying out the service is reimbursed. Arm’s Length Management Organisation (ALMO) – Arm's length management organisation. An organisation set up to manage all or part of a local authority's housing stock. Ownership of the stock remains with the local authority. Amortisation – The writing off of an intangible asset or loan balance to the Comprehensive Income and Expenditure Statement over an appropriate period of time. Amortised Cost – The carrying value of an intangible asset or liability in the balance sheet, which has been written up or down via the Comprehensive Income and Expenditure Statement. Asset – Something valuable that the Council owns, benefits from, or has use of, in generating income. Balance Sheet – A statement of all the assets, liabilities and other balances of the Council at the end of an accounting period. Benchmarking - the analysis of selected activities and processes, and their comparison with similar analyses for other organisations. Billing Authority – Refers to a local authority that is responsible for the collection of tax, both on behalf of itself and local authorities in its area. Budget – A forecast of future expenditure plans for the Council. Detailed revenue budgets are prepared for each year and it is on the basis of these figures that the Council Tax is set. Budgets are revised throughout the year for changes as necessary.
115

Business Rate Supplement – The Business Rate Supplements Act 2009 enables levying authorities - county councils, unitary district councils and, in London, the Greater London Authority - to levy a supplement on the Business Rate to support additional projects aimed at economic development of the area. Capital Adjustment Account – Represents amounts set aside from revenue resources or capital receipts to finance expenditure on property, plant, and equipment (PPE) or for the repayment of external loans, or certain other capital financing transactions. Capital Expenditure – Expenditure on the acquisition of property, plant, and equipment (PPE) or expenditure which adds to the value of an existing item of PPE. Capital Financing Requirement – Represents the Council’s underlying need to borrow for a capital purpose. Capital Grants Receipts in Advance – Balances of capital grants and contributions that have conditions which may require future repayment if not spent. Capital Grants Unapplied – Grant balances that will be used for future capital expenditure. Capital Receipt – Income received from the sale of PPE such as land or buildings. Capital Receipts Reserve – Represents proceeds from the sale of PPE available to meet future capital investment. Carrying Value – In relation to the value of assets, the value is based on the original cost of the asset less any depreciation, amortisation or impairment costs made against the asset. It is the amount to be recognised on the Balance Sheet. Cash Equivalents – Highly liquid and safe investments that can easily be converted into cash. Chartered Institute of Public Finance and Accountancy (CIPFA) – A professional accountancy body, that specialises in the Public Sector. It promotes best practice by issuing guidelines and Codes of Practice. Collection Fund – A statutory account which receives Council Tax and Non-Domestic Rates to cover the costs of services provided by the Council and its precepting authorities. Collection Fund Adjustment Account – The Collection Fund Adjustment Account represents the Council’s share of the Collection Fund Surplus/Deficit. Community Assets - Assets that a local authority intends to hold in perpetuity, that have no determinable useful life and that may have restrictions on their disposal. Examples of Community Assets are parks and historic buildings. Comprehensive Income and Expenditure Statement - A statement showing the expenditure and income of the Council’s services during the year, and demonstrating how costs have been financed from general Government grants and income from local taxpayers. Contingent Liability - Where possible “one-off” future liabilities or losses are identified, but the level of uncertainty is such that the establishment of a provision is not appropriate. Corporate and Democratic Core (CDC) - This includes corporate policy making, activities that relate to the corporate management of the Council and all other member-based activities. Under the terms of SeRCOP, all support costs are allocated to services except for CDC and Non Distributed Costs. Consumer Price Index (CPI) – Measures the average change in retail prices of a basket of goods and services purchased by most UK households, to provide an indication of the rate of inflation. The CPI includes some financial services in the basket of goods not included in the RPI. Creditors - Amount of money owed by the Council for goods and services received. Also referred to as, Payables.
116

Current Assets - Any asset expected to last or be in use for less than one year is considered a current asset. Examples are stock, cash and debtors. Current Liability - An amount which will become payable or could be called in within the next accounting period. Examples are creditors and Short Term Borrowing. Debtors - Amount of money owed to the Council by individuals, and organisations. Also referred to as, Receivables. Dedicated Schools Grant – Grant monies provided by the Department of Education ring-fenced to schools budgets. This is a ring-fenced grant. Deferred Capital Receipts - Income that is received in instalments over agreed periods of time. They arise from mortgages on sales of Council houses and repayments from loans. Deferred Income – Receipt in Advance – This represents a receipt received as part of entering into a building lease. The credit is being released over the term of the lease. Deferred Liabilities – These are future payments that the Council is contractually obliged to pay in future years. These liabilities relate to Private Finance Initiative (PFI) schemes. Defined Benefit Scheme - A pension scheme which defines benefits independently of the contributions payable. Benefits are not directly related to the investments of the Pension Fund. Depreciation - The measure of the wearing out, consumption or other reduction in the useful economic life of PPE, whether arising from use, passage of time or obsolescence through technological or other changes. Direct Revenue Funding (DRF) – The use of revenue monies to pay for capital expenditure. Also referred to as Revenue Contributions to Capital Outlay (RCCO). Earmarked Reserves - Amounts set aside for a specific purpose to meet future commitments or potential liabilities, for which it is not appropriate to establish provisions. Fair Value - It is the price that would be received to sell an asset or paid to transfer a liability in an orderly transaction between market participants at the measurement date. Fees and Charges – Income receivable as payment for goods or services provided. These charges are reviewed annually as part of the annual budget process. Finance Lease - A lease that transfers substantially all of the risks and rewards of ownership of an asset to the lessee. Financial Instrument - Any contract that gives rise to a financial asset of one entity and a financial liability or equity instrument of another. Financial Instrument Adjustment Account - This represents the balance of deferred discounts relating to the premature redemption of Public Works Loans Board (PWLB) debt. General Fund (GF) - The Council’s main revenue account from which the cost of providing most of the Council’s services is met. Greater London Authority (GLA) – A strategic Local Authority with a capital-wide role. Gross Spending – the total cost of providing services before any income such as government grants, fees and charges are deducted. Group Accounts – Where a Council has a material interest in a separate entity, the entity’s assets and liabilities may need to be incorporated within the council’s group accounts. If the council controls an entity, it is a subsidiary (as in the case of Tower Hamlets Homes for the Council). Heritage asset – An asset with historical, artistic, scientific, technological, geo-physical and/or environmental qualities that is held and maintained principally for its contribution to knowledge and culture.
117

Historic Cost – The actual cost of an asset in terms of past consideration as opposed to current value. Housing Revenue Account (HRA) - A statutory account maintained separately from the General Fund for the recording of income and expenditure relating to the provision of council housing. Impairment – A reduction in the valuation of PPE caused either by a change in the market price of the asset or damage/deterioration of the asset in excess of depreciation. Infrastructure Assets – Inalienable assets, expenditure on which is only recoverable by continued use of the asset created. There is no prospect of sale or alternative use. Examples include roads, bridges, and tunnels. Intangible Assets – Non-financial long-term assets that do not have physical substance but are identifiable and controlled by the Council i.e. purchased software licences. Interest Rate Risk – The uncertainty of interest paid/received on variable rate instruments and the effect of fluctuations in interest rates on the fair value of an instrument. International Financial Reporting Standards (IFRS) – The set of international accounting standards issued by the International Accounting Standards Board (IASB). Local Authorities are required to produce accounts based on IFRS. Inventories – The values of, stocks held and work in progress that have not been completed. Investment Properties – Those properties that are held solely to earn rentals and/or for capital appreciation, rather than for the delivery of services. Liability – A liability is where the Council owes payment to an individual or another organisation. Levy – Payments to bodies such as the Environment Agency. The cost of these bodies is funded by local authorities in the area concerned based on their Council Tax base and is met from the General Fund. Long-Term Assets – Assets that yield benefit to the Council and the services it provides for a period of more than one year. Long-Term Liability – An amount which by arrangement is payable beyond the next year at some point in the future or to be paid off by an annual sum over a period of time. Major Repairs Reserve – Represents the funds available to meet capital investment in council housing Materiality - the level (usually expressed in financial terms but not usually expressly stated) below which accountants, auditors, or their clients or employers, consider risks or problems not to be significant. Medium Term Financial Plan (MTFP) – The Council’s strategic plan surrounding its finances for the next 3 years. Minimum Revenue Provision (MRP) – The amount that has to be charged to revenue to provide for the redemption of debt. Not applicable to the HRA. Movement in Reserves Statement – A summary of the Council’s reserves at the balance sheet date split between usable and unusable reserves. National Non-Domestic Rates (NNDR) Pool - Non-Domestic Rates are collected by the Council. From 1
st April 2013 the Council keeps 30%, gives the GLA 20% and the other 50% is passed over to
the DCLG. Net Book Value – The amount at which PPE is included in the balance sheet after depreciation has been provided for.
118

Net Realisable Value – The open market value of the asset less the expenses to be incurred in realising the asset. Non Current Assets Held for Sale – Items of PPE whose carrying amount is to be recovered principally through a sale rather than continued use by the Council. Operating Lease – A lease other than a finance lease - a lease which permits the use of the asset without substantially transferring the risks and rewards of ownership. Outturn – The actual level of expenditure and income for the year. Precept – The charge made by the Greater London Authority (the precepting authority) on the Council to finance its net expenditure. Private Finance Initiative (PFI) – Instead of providing and owning the assets needed for their services, public authorities arrange for private sector bodies (usually formed from consortia) to provide and own them. These other bodies’ then make the assets available under operating leases to enable public authorities to deliver the services required. Projected Unit Method – Actuarial valuation method whose key feature is to assess future service cost; the Actuary calculates the employer’s contribution rate, which will meet the cost of benefits accruing in the year after the valuation date. Property, Plant, and Equipment (PPE) – The land and building assets under the council’s control or ownership. Assets under the control or owned by the Council that have a physical existence and are expected to be used for a period exceeding one year form PPE. Important components of PPE include land and land improvements, buildings, plant and machinery, vehicles and equipment where material. Provisions – Amounts set aside for liabilities and losses, which are certain or very likely to occur but where the exact amount or timing of the payment are uncertain. Public Works Loans Board (PWLB) – Central Government agency which funds much of local government borrowing. Registered Social Landlord – A not-for-profit organisation which owns and manages social housing. Reserves – Amounts set aside, which do not fall within the definition of a provision, to fund items of anticipated expenditure. These include general reserves or balances which every Council must maintain as a matter of prudence. Retail Price Index (RPI) – Measures the average change in retail prices of a basket of goods and services purchased by most UK households, to provide an indication of the rate of inflation. The RPI includes mortgage interest payments and council tax in the basket of goods not included in the CPI. Revaluation Reserve – Represents the increase in value of the Council’s land and building assets from 1st April 2007. Revenue Expenditure – The day-to-day expenditure of the Council - salaries, goods and services and capital financing charges. Revenue Expenditure Funded from Capital Under Statute (REFCUS) – Expenditure incurred during the year that may be capitalised under statutory provisions but does not result in the creation of long-term assets, that has been charged as expenditure to the relevant service revenue account in the year Revenue Support Grant – General grant paid by the Government to local authorities. Right To Buy (RTB) - The council is legally required to sell council homes to tenants, at a discount, where the tenant wishes to buy their home. The money received from the sale is a capital receipt, some of which will be retained by the council to spend on capital expenditure, while the remainder must be paid over to the DCLG under pooling arrangements.
119

Ring-Fenced Grant – A grant that can only be spent on a specific purpose, such as the Dedicated Schools Grant. Service Level Agreements - agreements between operational units, which state the price and specifications of the support service by one to another. Service Reporting Code of Practice (SeRCOP) – CIPFA’s accounting recommendations for local authorities that legally constitute proper accounting practice, below the statement of accounts level. Soft Loan – Loans given at less than market/commercial rates to community or not-for-profit organisations. Supplementary Business Rates (SBR/BRS) – Locally raised business rates for local projects. London Councils are levying a SBR for the Cross-rail project. Support Services – Activities of a professional, technical and administrative nature which are not Council services in their own right, but support main front line services such as finance, information technology and human resources. Surplus Assets – Those assets which are not being used to deliver services, but do not meet the criteria to be classified as either Investment Properties or Non Current Assets Held for Sale. Unusable Reserves – These represent reserve balances that cannot be spent as part of an organisation’s medium term financial plan. An example is the revaluation reserve. Usable Reserves – These represent reserve balances that can be spent as part of an organisation’s medium term financial plan. Any organisation has to review reserve levels to ensure long-term financial stability. General fund and Housing Revenue Account reserves are usable reserves. Value for money (VFM) – This term is used to describe the relationship between the economy, efficiency, and effectiveness (known as the ‘three Es’) of a service, function or activity. Value for money is high when there is an optimum balance between all three.
120

Abbreviations used in Accounts
AGS - Annual Governance Statement
ALMO - Arm’s Length Management Organisation (Tower Hamlets Homes)
BSF - Building Schools for the Future
CAA - Capital Adjustment Account
CDC - Corporate and Democratic Core
CFR - Capital Financing Requirement
CIES - Comprehensive Income and Expenditure Statement
CIL - Community Infrastructure Levy
CIPFA - Chartered Institute of Public Finance and Accountancy
CCG - Clinical Commissioning Group
CPI - Consumer Price Index
CRR - Capital Receipts Reserve
DCLG - Department of Communities and Local Government
DEFRA - Department for Environment, Food and Rural Affairs
DfE - Department for Education
DRF - Direct Revenue Funding
DSG - Dedicated Schools Grant
DWP - Department for Work and Pensions
EIR - Effective Interest Rate
GAAP - Generally Accepted Accounting Principles
GF - General Fund
GLA - Greater London Authority
HRA - Housing Revenue Account
IAS - International Accounting Standard
IFRS - International Financial Reporting Standards
LABGI - Local Authority Business Growth Incentive
LAML - London Authorities Mutual Limited
LASAAC - Local Authority (Scotland) Accounts Advisory Committee
LATS - Landfill Allowance Trading Scheme
LBTH - London Borough of Tower Hamlets
LGPS - Local Government Pension Scheme
LOBO - Lender’s Option – Borrower’s option
LPFA - London Pensions Fund Authority
MRA - Major Repairs Allowance
MRP - Minimum Revenue Provision
MTFP - Medium Term Financial Plan
NBV - Net Book Value
NCS - Net Cost of Services
NDC - Non Distributed Costs
(N)NDR - (National) Non-Domestic Rates
121

NPV - Net Present Value
NRV - Net Realisable Value
PBC - Prepared By Client
PFI - Private Finance Initiative
PPA - Prior Period Adjustment
PPE - Property, Plant and Equipment
PWLB - Public Works Loans Board
RCCO - Revenue Contributions to Capital Outlay
REFCUS - Revenue Expenditure Funded by Capital Under Statute
RICS - Royal Institute of Chartered Surveyors
RPI - Retail Price Index
RR - Revaluation reserve
RSG - Revenue Support Grant
RTB - Right To Buy
SBR - Supplementary Business Rates
SDPS - Surplus or Deficit on the Provision of Services
SeRCOP - Service Reporting Code of Practice
SLAs - Service Level Agreements
SORP - Statement of Recommended Practice (now Code of Practice on Local Authority Accounting)
TH - Tower Hamlets
THH - Tower Hamlets Homes
VFM - Value For Money
WDA - Waste Disposal Authority
WGA - Whole of Government Accounts
122