Embed Size (px)
Citation preview
LONDON BOROUGH OF TOWER HAMLETS
ANNUAL FINANCIAL REPORT 2011-12
ANNUAL FINANCIAL REPORT 2011-12
CONTENTS
Page
Explanatory Foreword Foreword by the Corporate Director of Resources
1
Review of the Year The Statement of Accounts
3
The Accounting Statements 6
Movement in Reserves Statement 7
Comprehensive Income and Expenditure Account 8
Balance Sheet 9
Cash Flow Statement 10
Notes to the Core Financial Statements 11
Statement of Accounting Policies 11
Housing Revenue Account 68
Statement of Movement on the Housing Revenue Account Balance 69
Notes to the Housing Revenue Account 70
Collection Fund 74
Group Accounts 77
Pension Fund Accounts 84
Auditor’s Report (to be provided)
Statement of Responsibilities 97
Glossary and Abbreviations 98
Annual Governance Statement (separate agenda item 6.2) 105
EXPLANATORY FOREWORD Overview by the Corporate Director of Resources I am pleased to introduce Tower Hamlets Council’s Statement of Accounts for 2011/12, which reports our financial results for the year. The accounts have been compiled in accordance with International Financial Reporting Standards, the Code of Practice on Local Authority Accounting in the United Kingdom 2011/12, and the Best Value Code of Practice.These constitute “proper accounting practice” with which councils must comply by statute. The Council also produce a summary of the accounts, which is less detailed than the full statement. This has been produced following consultation with stakeholders and is available from the Council’s website at www.towerhamlets.gov.uk The general economic climate in the UK, on-going reductions in main stream government grant funding and a continuing upward trend in the demand for key front line serves in adult social care, children’s services and housing have collectively created a challenging financial environment for the Council. Indeed, the resultant pressures on the Council’s budget from inflation, demographic growth and the impact of new legislation, required it to achieve budget savings for the year of £30million; a reduction of some 10% compared to 2010/11. However, through strong financial management the revenue budget for the year was under spent by £0.6 million (0.2%) and the level of general reserves increased by £3.6 million to £25.8 million (in line with the Medium Term Financial Plan). The Council’s Value for Money assessment continues to be positive, so the overall financial position remains sound. This solid financial base has helped to underpin the delivery of the Council’s key policy objectives and specifically the Mayor’ priorities, namely: improving the condition of social housing; increasing the supply of affordable social housing (particularly family sized housing); maintaining the provision of services for young people; delivering programmes of skills development, employment and enterprise activity; maintaining support to vulnerable adults; minimising the impact on resident household budgets and; protecting investment in activity that promotes community safety. Key achievements in 2011/12 include:
• Delivering more than 2,000 affordable homes
• Improving street and environment cleanliness, including a reduction in litter, detritus, graffiti and fly-posting
• Reducing the number of young people not in education, employment or training
• Raising educational attainment – Tower Hamlets now performs better than the national average at GCSE level
• Supporting independent living – including increasing the number of social care users receiving self-directed support
1
Many of the key policy objectives have been delivered in conjunction with the Council’s main strategic partners; Police, NHS Tower Hamlets, Jobcentre Plus and Tower Hamlets Council for Voluntary Services. This joined up approach to the provision of services for our residents is fundamental to improving the outcomes for service users and is overseen by the Local Strategic Partnership Executive, chaired by the Mayor. The Council has continued to invest in its infrastructure with over £160 million spent on its capital programme. The main areas of investment were in housing and schools, with £28 million of improvement works through the housing programme and £84 million through the Building Schools for the future programme. However, other major projects included Victoria Park and the High Street 2012 scheme. Looking forward the Council will continue to face significant financial challenges. The 2012-2015 Medium Term Financial Plan agreed by Full Council in February 2012 includes a £60 million savings programme, and whilst this forms the basis of a balanced budget over the next three years, there remain a number of major financial risks. Chief among these are the potential impact of government welfare reform and changes to the way in which local authority services are funded. Whilst the strength of the Council’s balance sheet will enable it to effectively manage those risks in the short term, over the longer term they may require a further, more fundamental review of the way in which local services are delivered. Introduction to the Statement of Accounts This is the second year in which the Council’s Statement of Accounts has been prepared on an International Financial Reporting (IFRS) basis. The main change in disclosures within the Accounts relate to the reporting of ‘heritage’ assets. These are assets which have historical or artistic qualities that are held and maintained principally for their contribution to knowledge and culture. The overall value of the Council’s heritage assets has been estimated at £5 million and is shown separately on the balance sheet with an accompanying note. The Council’s expenditure and income are defined either as revenue or capital. Revenue is spending on, or income from, the day to day running of services whilst capital expenditure (and its financing) relates to investment in items (assets) that provide a benefit for more than one year; this mainly includes land, buildings, vehicles and equipment. The Council’s net revenue budget requirement is funded by government Formula Grant and Council Tax. This revenue budget is referred to as General Fund income and expenditure and covers all of the Council’s main services except the management and maintenance of its social housing stock; this is accounted for separately through the Housing Revenue Account and is primarily funded by rent and service charge income.
2
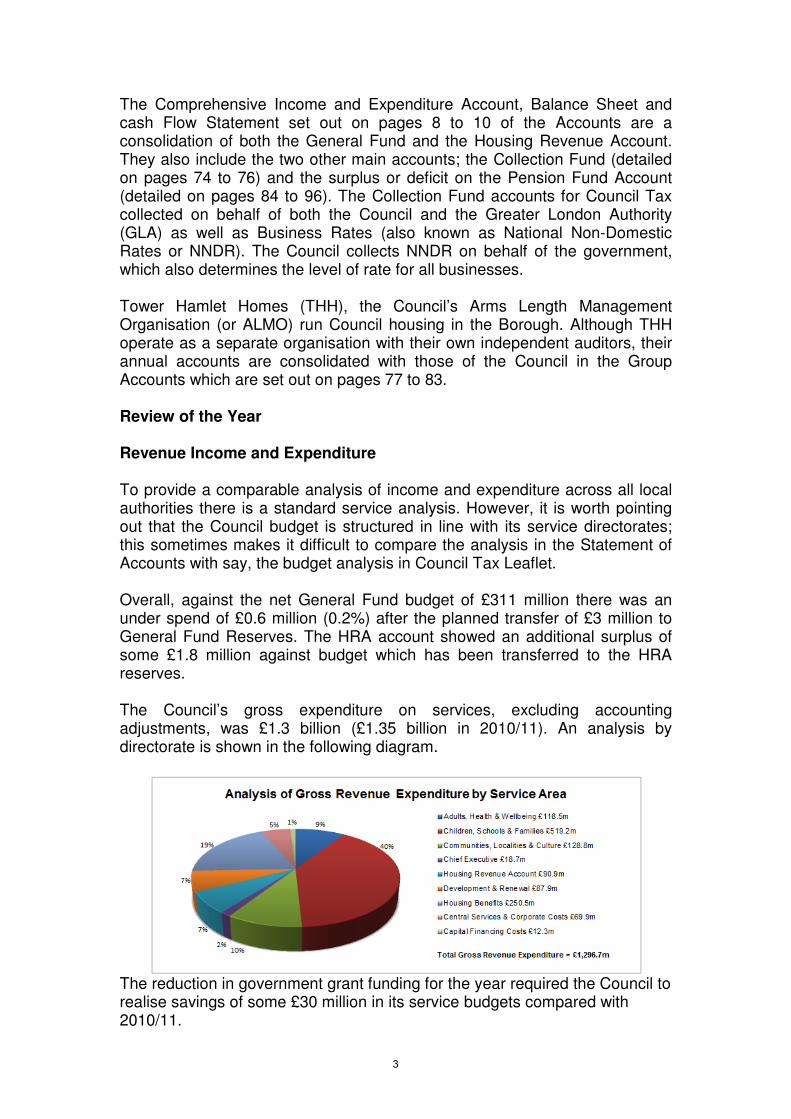
The Comprehensive Income and Expenditure Account, Balance Sheet and cash Flow Statement set out on pages 8 to 10 of the Accounts are a consolidation of both the General Fund and the Housing Revenue Account. They also include the two other main accounts; the Collection Fund (detailed on pages 74 to 76) and the surplus or deficit on the Pension Fund Account (detailed on pages 84 to 96). The Collection Fund accounts for Council Tax collected on behalf of both the Council and the Greater London Authority (GLA) as well as Business Rates (also known as National Non-Domestic Rates or NNDR). The Council collects NNDR on behalf of the government, which also determines the level of rate for all businesses. Tower Hamlet Homes (THH), the Council’s Arms Length Management Organisation (or ALMO) run Council housing in the Borough. Although THH operate as a separate organisation with their own independent auditors, their annual accounts are consolidated with those of the Council in the Group Accounts which are set out on pages 77 to 83. Review of the Year Revenue Income and Expenditure To provide a comparable analysis of income and expenditure across all local authorities there is a standard service analysis. However, it is worth pointing out that the Council budget is structured in line with its service directorates; this sometimes makes it difficult to compare the analysis in the Statement of Accounts with say, the budget analysis in Council Tax Leaflet. Overall, against the net General Fund budget of £311 million there was an under spend of £0.6 million (0.2%) after the planned transfer of £3 million to General Fund Reserves. The HRA account showed an additional surplus of some £1.8 million against budget which has been transferred to the HRA reserves. The Council’s gross expenditure on services, excluding accounting adjustments, was £1.3 billion (£1.35 billion in 2010/11). An analysis by directorate is shown in the following diagram.
The reduction in government grant funding for the year required the Council to realise savings of some £30 million in its service budgets compared with 2010/11.
3
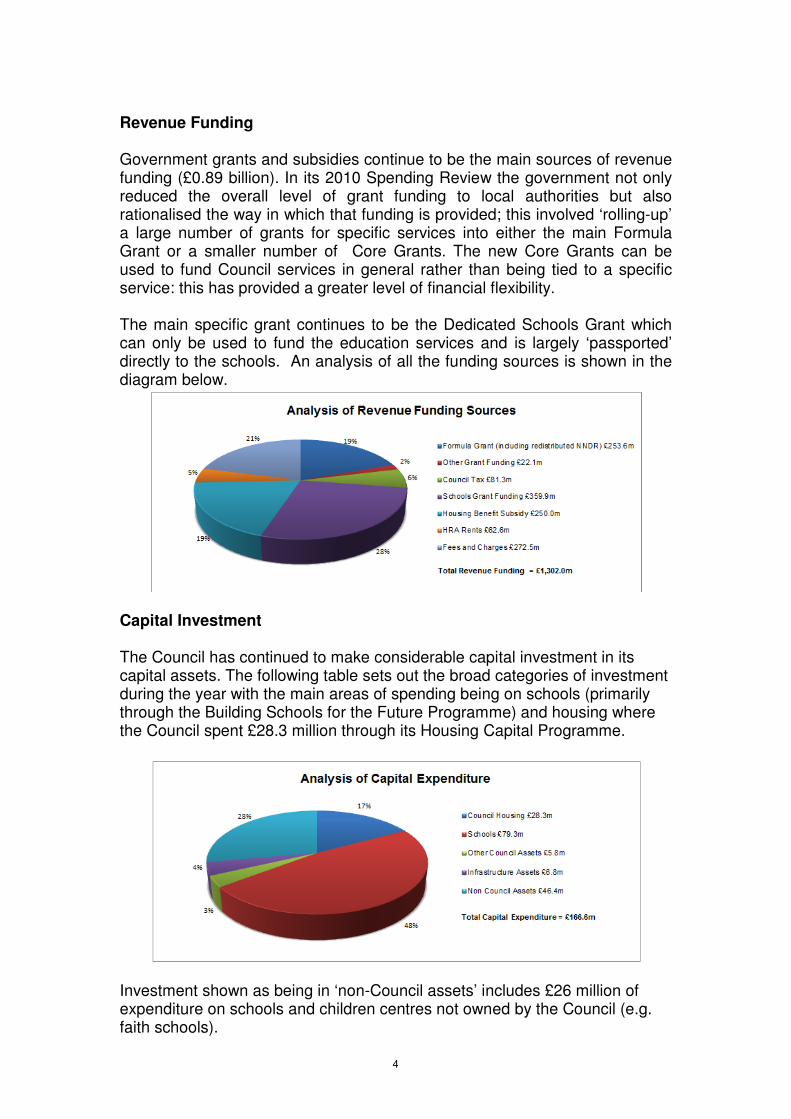
Revenue Funding Government grants and subsidies continue to be the main sources of revenue funding (£0.89 billion). In its 2010 Spending Review the government not only reduced the overall level of grant funding to local authorities but also rationalised the way in which that funding is provided; this involved ‘rolling-up’ a large number of grants for specific services into either the main Formula Grant or a smaller number of Core Grants. The new Core Grants can be used to fund Council services in general rather than being tied to a specific service: this has provided a greater level of financial flexibility. The main specific grant continues to be the Dedicated Schools Grant which can only be used to fund the education services and is largely ‘passported’ directly to the schools. An analysis of all the funding sources is shown in the diagram below.
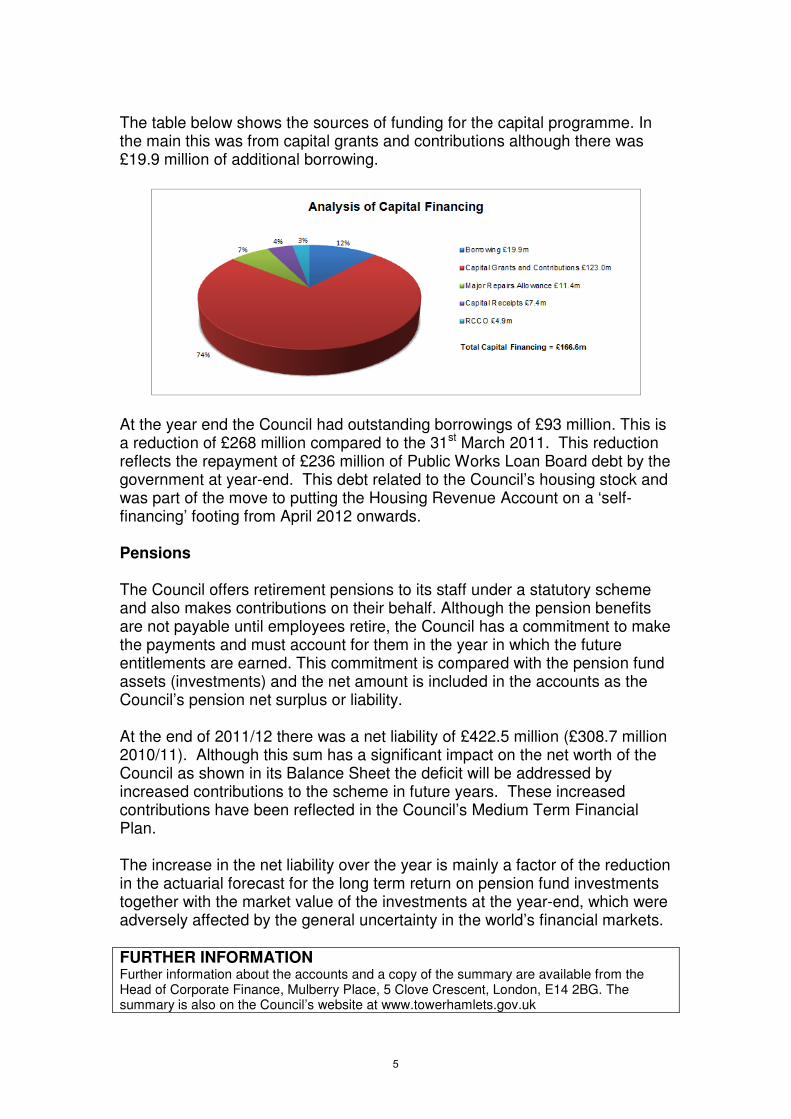
Capital Investment The Council has continued to make considerable capital investment in its capital assets. The following table sets out the broad categories of investment during the year with the main areas of spending being on schools (primarily through the Building Schools for the Future Programme) and housing where the Council spent £28.3 million through its Housing Capital Programme.
Investment shown as being in ‘non-Council assets’ includes £26 million of expenditure on schools and children centres not owned by the Council (e.g. faith schools).
4
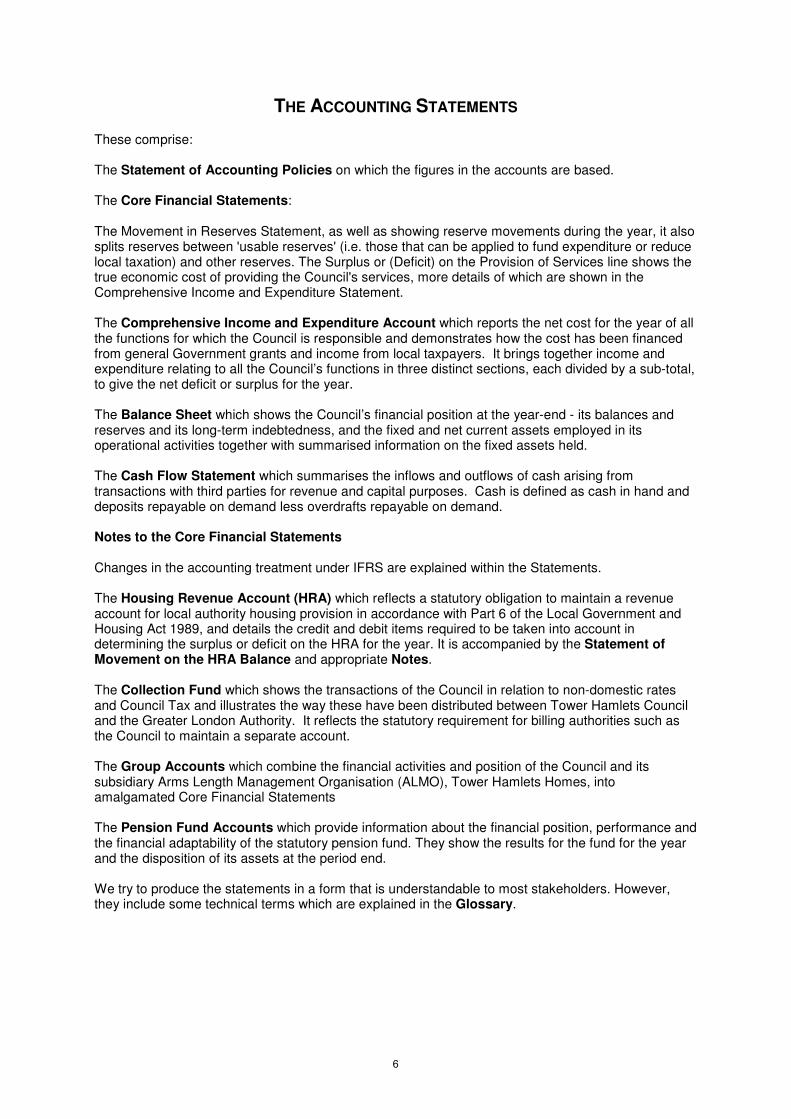
The table below shows the sources of funding for the capital programme. In the main this was from capital grants and contributions although there was £19.9 million of additional borrowing.
At the year end the Council had outstanding borrowings of £93 million. This is a reduction of £268 million compared to the 31st March 2011. This reduction reflects the repayment of £236 million of Public Works Loan Board debt by the government at year-end. This debt related to the Council’s housing stock and was part of the move to putting the Housing Revenue Account on a ‘self-financing’ footing from April 2012 onwards. Pensions The Council offers retirement pensions to its staff under a statutory scheme and also makes contributions on their behalf. Although the pension benefits are not payable until employees retire, the Council has a commitment to make the payments and must account for them in the year in which the future entitlements are earned. This commitment is compared with the pension fund assets (investments) and the net amount is included in the accounts as the Council’s pension net surplus or liability. At the end of 2011/12 there was a net liability of £422.5 million (£308.7 million 2010/11). Although this sum has a significant impact on the net worth of the Council as shown in its Balance Sheet the deficit will be addressed by increased contributions to the scheme in future years. These increased contributions have been reflected in the Council’s Medium Term Financial Plan. The increase in the net liability over the year is mainly a factor of the reduction in the actuarial forecast for the long term return on pension fund investments together with the market value of the investments at the year-end, which were adversely affected by the general uncertainty in the world’s financial markets. FURTHER INFORMATION Further information about the accounts and a copy of the summary are available from the Head of Corporate Finance, Mulberry Place, 5 Clove Crescent, London, E14 2BG. The summary is also on the Council’s website at www.towerhamlets.gov.uk
5
THE ACCOUNTING STATEMENTS These comprise: The Statement of Accounting Policies on which the figures in the accounts are based. The Core Financial Statements: The Movement in Reserves Statement, as well as showing reserve movements during the year, it also splits reserves between 'usable reserves' (i.e. those that can be applied to fund expenditure or reduce local taxation) and other reserves. The Surplus or (Deficit) on the Provision of Services line shows the true economic cost of providing the Council's services, more details of which are shown in the Comprehensive Income and Expenditure Statement. The Comprehensive Income and Expenditure Account which reports the net cost for the year of all the functions for which the Council is responsible and demonstrates how the cost has been financed from general Government grants and income from local taxpayers. It brings together income and expenditure relating to all the Council’s functions in three distinct sections, each divided by a sub-total, to give the net deficit or surplus for the year. The Balance Sheet which shows the Council’s financial position at the year-end - its balances and reserves and its long-term indebtedness, and the fixed and net current assets employed in its operational activities together with summarised information on the fixed assets held. The Cash Flow Statement which summarises the inflows and outflows of cash arising from transactions with third parties for revenue and capital purposes. Cash is defined as cash in hand and deposits repayable on demand less overdrafts repayable on demand. Notes to the Core Financial Statements Changes in the accounting treatment under IFRS are explained within the Statements. The Housing Revenue Account (HRA) which reflects a statutory obligation to maintain a revenue account for local authority housing provision in accordance with Part 6 of the Local Government and Housing Act 1989, and details the credit and debit items required to be taken into account in determining the surplus or deficit on the HRA for the year. It is accompanied by the Statement of Movement on the HRA Balance and appropriate Notes. The Collection Fund which shows the transactions of the Council in relation to non-domestic rates and Council Tax and illustrates the way these have been distributed between Tower Hamlets Council and the Greater London Authority. It reflects the statutory requirement for billing authorities such as the Council to maintain a separate account. The Group Accounts which combine the financial activities and position of the Council and its subsidiary Arms Length Management Organisation (ALMO), Tower Hamlets Homes, into amalgamated Core Financial Statements The Pension Fund Accounts which provide information about the financial position, performance and the financial adaptability of the statutory pension fund. They show the results for the fund for the year and the disposition of its assets at the period end. We try to produce the statements in a form that is understandable to most stakeholders. However, they include some technical terms which are explained in the Glossary.
6
GE
NE
RA
L F
UN
D
BA
LA
NC
E
EA
RM
AR
KE
D G
EN
ER
AL
FU
ND
RE
SE
RV
ES
*
HO
US
ING
RE
VE
NU
E
AC
CO
UN
T B
AL
AN
CE
MA
JO
R R
EP
AIR
S
RE
SE
RV
E
CA
PIT
AL
RE
CE
IPT
S
RE
SE
RV
E
DE
FE
RR
ED
CA
PIT
AL
RE
CE
IPT
S
CA
PIT
AL
GR
AN
TS
UN
AP
PL
IED
TO
TA
L U
SA
BL
E
RE
SE
RV
ES
RE
VA
LU
AT
ION
RE
SE
RV
E
CA
PIT
AL
AD
JU
ST
ME
NT
AC
CO
UN
T
PE
NS
ION
S R
ES
ER
VE
CO
LL
EC
TIO
N F
UN
D
AD
JU
ST
ME
NT
AC
CO
UN
T
FIN
AN
CIA
L IN
ST
RU
ME
NT
AD
JU
ST
ME
NT
AC
CO
UN
T
AC
CU
MU
LA
TE
D
AB
SE
NC
ES
AC
CO
UN
T
TO
TA
L U
NU
SA
BL
E
RE
SE
RV
ES
TO
TA
L A
UT
HO
RIT
Y
RE
SE
RV
ES
£'000 £'000 £'000 £'000 £'000 £'000 £'000 £'000 £'000 £'000 £'000 £'000 £'000 £'000 £'000 £'000
Balance as at 31 March 2010 27,133 104,054 12,978 1,074 16,310 298 16,499 178,346 514,696 1,105,581 (689,923) 3,902 764 (4,210) 930,810 1,109,156
Movement in reserves during 2010/11
Surplus or (Deficit) on the Provision of Services 163,715 (291,458) (127,743) 0 (127,743)
Other comprehensive expenditure and income 0 31,762 259,963 291,725 291,725
Total Comprehensive Expenditure and Income 163,715 0 (291,458) 0 0 0 0 (127,743) 31,762 0 259,963 0 0 0 291,725 163,982
Adjustments between accounting basis and funding basis
under regulations 6 (162,168) 0 291,266 5,272 8,115 (57) 3,251 145,679 (12,936) (253,174) 121,270 (748) 121 (210) (145,677) 2
Net Increase or Decrease before Transfers to Earmarked
Reserves 1,547 0 (192) 5,272 8,115 (57) 3,251 17,936 18,826 (253,174) 381,233 (748) 121 (210) 146,048 163,984
Transfers to or from earmarked reserves 7 (1,042) 1,042 0 0 0
Transfers to or from school reserves (4,258) 4,258
Increase or (Decrease) in 2010/11 (3,753) 5,300 (192) 5,272 8,115 (57) 3,251 17,936 18,826 (253,174) 381,233 (748) 121 (210) 146,048 163,984
Balance as at 31 March 2011 23,380 109,354 12,786 6,346 24,425 241 19,750 196,282 533,522 852,407 (308,690) 3,154 885 (4,420) 1,076,858 1,273,140
carried forward
Movement in reserves during 2011/12
Surplus or (Deficit) on the Provision of Services (34,864) 256,111 221,247 0 221,247
Other comprehensive expenditure and income 0 13,701 (116,236) (102,533) (102,533)
Total Comprehensive Expenditure and Income (34,864) 0 256,111 0 0 0 0 221,247 13,701 0 (116,236) 0 0 0 (102,533) 118,714
Adjustments between accounting basis and funding basis
under regulations 6 52,225 0 (254,319) 1,639 3,183 (85) 30,406 (166,951) (49,489) 216,053 2,380 (3,130) 74 1,065 166,953 0
Net Increase or Decrease before Transfers to Earmarked
Reserves 17,361 0 1,792 1,639 3,183 (85) 30,406 54,296 (35,788) 216,053 (113,856) (3,130) 74 1,065 64,420 118,714
Transfers to or from earmarked reserves 7 (11,394) 11,394 0 0 0
Transfers to or from school reserves (2,413) 2,413Increase or (Decrease) in Year 3,554 13,807 1,792 1,639 3,183 (85) 30,406 54,296 (35,788) 216,053 (113,856) (3,130) 74 1,065 64,420 118,714
Balance as at 31 March 2012 26,934 123,161 14,578 7,985 27,608 156 50,156 250,578 497,734 1,068,460 (422,546) 24 959 (3,355) 1,141,276 1,391,854
MOVEMENT IN RESERVES STATEMENT
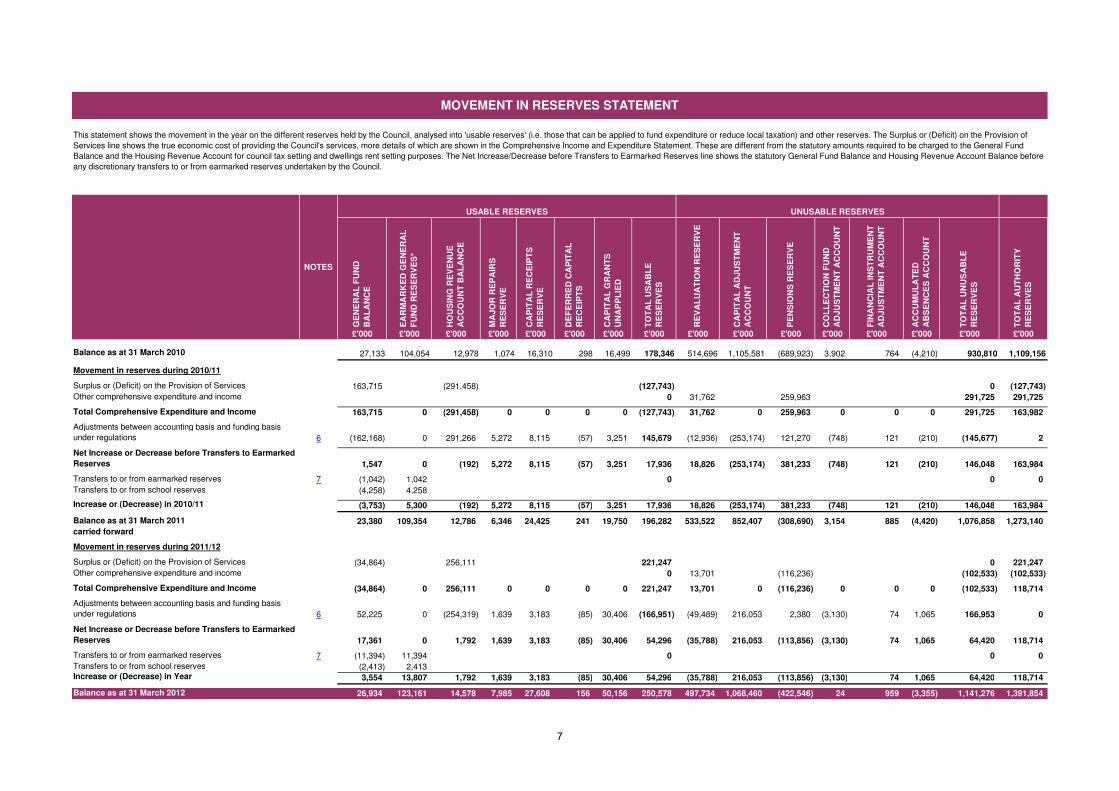
This statement shows the movement in the year on the different reserves held by the Council, analysed into 'usable reserves' (i.e. those that can be applied to fund expenditure or reduce local taxation) and other reserves. The Surplus or (Deficit) on the Provision of
Services line shows the true economic cost of providing the Council's services, more details of which are shown in the Comprehensive Income and Expenditure Statement. These are different from the statutory amounts required to be charged to the General Fund
Balance and the Housing Revenue Account for council tax setting and dwellings rent setting purposes. The Net Increase/Decrease before Transfers to Earmarked Reserves line shows the statutory General Fund Balance and Housing Revenue Account Balance before
any discretionary transfers to or from earmarked reserves undertaken by the Council.
USABLE RESERVES UNUSABLE RESERVES
NOTES
7
Gross Gross Net Gross Gross Net
Expenditure Income Expenditure Expenditure Income Expenditure
£'000 £'000 £'000 £'000 £'000 £'000
Continuing Operations
27,813 6,375 21,438 Cultural and Related Services 29,790 6,859 22,931
49,313 36,879 12,434 Central Services 47,938 38,760 9,178
522,938 420,975 101,963 Children's and Education Services 529,192 437,468 91,724
56,891 14,417 42,474 Environment and Regulatory Services 41,568 9,471 32,097
30,220 19,449 10,771 Highways and Transport Services 31,709 20,704 11,005
375,395 89,701 285,694 Local Authority Housing (Housing Revenue Account)1
66,921 90,718 (23,797)
296,010 272,252 23,758 Other Housing Services 305,846 285,696 20,150
29,226 10,371 18,855 Planning Services 30,045 19,648 10,397
121,561 26,329 95,232 Adult Social Care 116,743 29,626 87,117
13,754 1,118 12,636 Corporate and Democratic Core 14,981 2,897 12,084
7,393 134,032 (126,639) Non-distributed Costs3
14,954 343 14,611
1,530,514 1,031,898 498,616 NET COST OF SERVICES 1,229,687 942,190 287,497
18,202 Other Operating Expenditure 8 130,450
46,623 Financing and Investment Income and Expenditure2
9 107,916
(435,698) Taxation and Non-Specific Grant Income2
10 (747,110)
127,743 (SURPLUS) OR DEFICIT ON THE PROVISION OF SERVICES (221,247)
Other Comprehensive Income and Expenditure
(31,761) Surplus on revaluation of non-current assets (13,701)
(259,963) Actuarial (gains) or losses on pension assets and liabilities 116,236
(291,724) OTHER COMPREHENSIVE INCOME AND EXPENDITURE 102,535
(163,981) TOTAL COMPREHENSIVE INCOME AND EXPENDITURE (118,712)
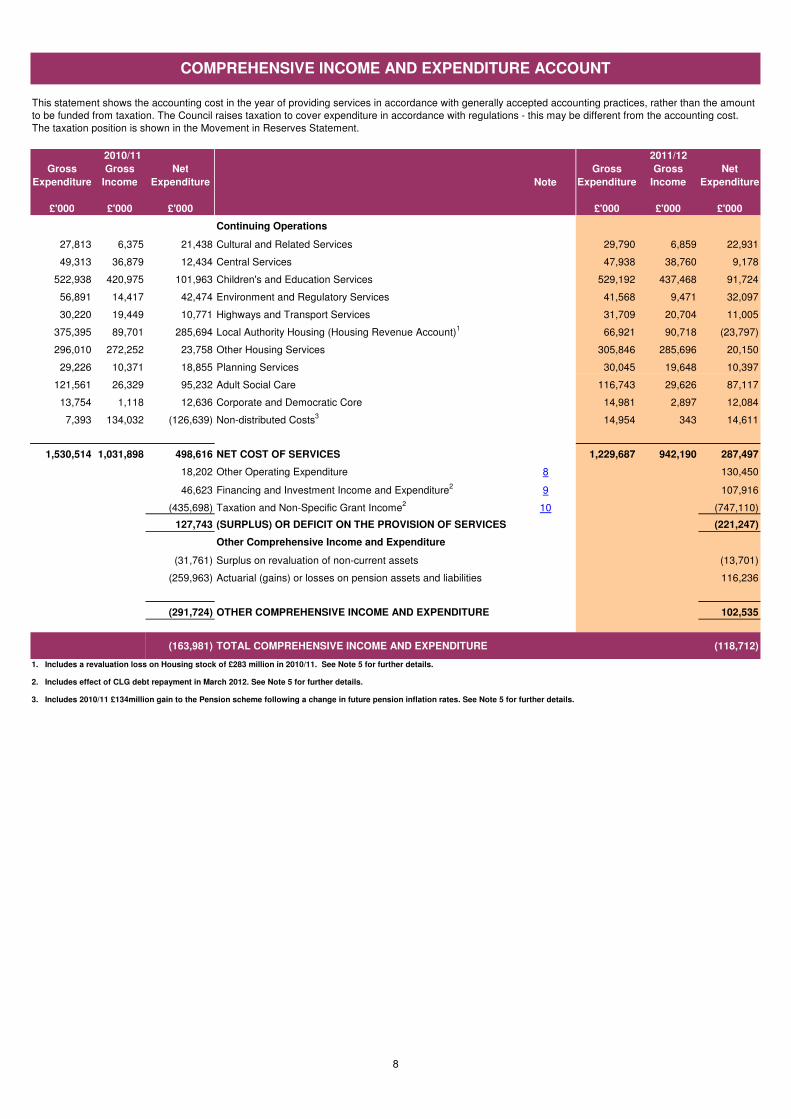
1. Includes a revaluation loss on Housing stock of £283 million in 2010/11. See Note 5 for further details.
2. Includes effect of CLG debt repayment in March 2012. See Note 5 for further details.
3. Includes 2010/11 £134million gain to the Pension scheme following a change in future pension inflation rates. See Note 5 for further details.
COMPREHENSIVE INCOME AND EXPENDITURE ACCOUNT
This statement shows the accounting cost in the year of providing services in accordance with generally accepted accounting practices, rather than the amount
to be funded from taxation. The Council raises taxation to cover expenditure in accordance with regulations - this may be different from the accounting cost.
The taxation position is shown in the Movement in Reserves Statement.
2010/11 2011/12
Note
8
1 April 31 March Notes 31 March
2010 2011 2012
£'000 £'000 £'000
Long-term Assets
2,109,420 1,896,553 Property, plant and equipment 12 1,850,505
0 0 Investment properties 13 0
4,799 4,799 Heritage Assets 43 4,799
0 0 Intangible Assets 14 0
0 0 Assets held for sale 20 0
0 0 Long-term investments 15 0
1,067 1,008 Long Term Debtors 13 768
2,115,286 1,902,360 Total Long-term assets 1,856,072
Current Assets
40,818 100,929 Short-term investments 15 131,603
0 0 Assets held for sale 21 945
531 821 Inventories 16 517
88,620 90,431 Short-term debtors 19 74,557
81,700 136,563 Cash and cash equivalents 20 126,283
211,669 328,744 Total Current Assets 333,905
Current liabilities
15,324 35,485 Short-term borrowing 15 66,766
96,519 130,688 Short-term creditors 22 146,245
1,003 855 Provisions 23 1,594
4,207 4,418 Provisions for accumulated absences 23 3,355
117,053 171,446 Total Current liabilities 217,960
Long Term Liabilities
Long-term creditors
10,213 12,014 Provisions 23 13,088
302,475 325,533 Long-term borrowing 15 25,979
689,924 308,691 Liability related to defined benefit pension schemes 422,546
50,030 90,474 Capital grants receipts in advance 37 72,255
38,287 41,090 Deferred liabilities 40 40,299
9,817 8,717 Deferred Income - Receipt in Advance 5,996
1,100,746 786,519 Total Long-Term Liabilities 580,163
1,109,156 1,273,139 NET ASSETS 1,391,854
Reserves
Usable Reserves
27,134 23,380 General Fund 26,934
12,978 12,786 Housing Revenue Account 14,578
84,942 85,984 Earmarked reserves 8 97,378
19,111 23,370 Schools reserves 8 25,783
16,309 24,424 Capital receipts reserve 27,608
298 241 Deferred capital receipts 156
16,500 19,751 Capital grants unapplied 50,156
1,074 6,346 Major repairs reserve 7,985
178,346 196,282 Total Usable Reserves 250,578
Unusable Reserves 25
514,696 533,521 Revaluation Reserve 497,734
1,105,580 852,406 Capital Adjustment Account 1,068,460
3,902 3,154 Collection Fund Adjustment Account 24
764 885 Financial Instruments Adjustment Account 959
(689,924) (308,691) Pensions reserve (422,546)
(4,208) (4,418) Accumulated Absences Account (3,355)
930,810 1,076,857 Total Unusable Reserves 1,141,276
1,109,156 1,273,139 TOTAL RESERVES 1,391,854
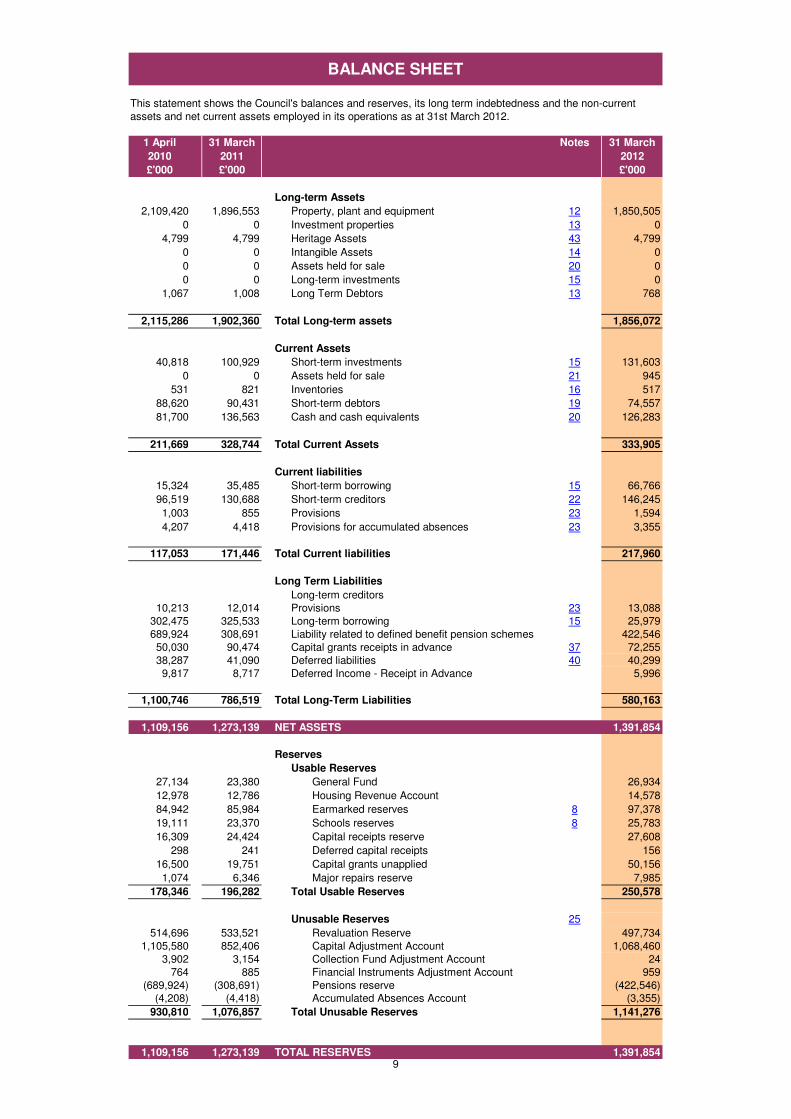
BALANCE SHEET
This statement shows the Council's balances and reserves, its long term indebtedness and the non-current
assets and net current assets employed in its operations as at 31st March 2012.
9
2010/11 Notes 2011/12
£'000 £'000
(127,743) Net surplus or (deficit) on the provision of services 221,256
272,277 Adjustments to net surplus or deficit on the provision of services for non cash movements 26A 206,293
(119,569)
Adjustments for items included in the net surplus or deficit on the provision of services that
are investing and financing activities 26A (163,976)
24,965 Net cash flows from Operating Activities 26A 263,573
(13,002) Investing Activities 26C (5,287)
42,900 Financing Activities 26D (268,566)
54,863 Net increase or decrease in cash and cash equivalents (10,280)
81,700 Cash and cash equivalents at the beginning of the reporting period 136,563
136,563 Cash and cash equivalents at the end of the reporting period 19 126,283
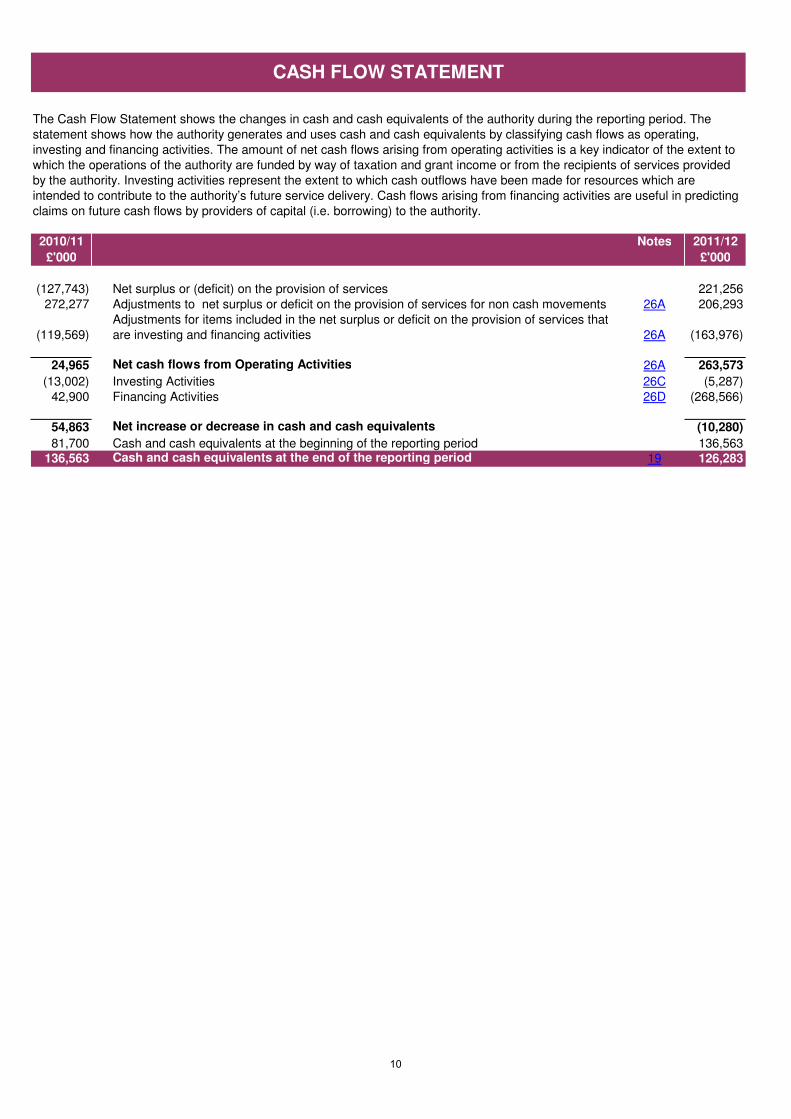
CASH FLOW STATEMENT
The Cash Flow Statement shows the changes in cash and cash equivalents of the authority during the reporting period. The
statement shows how the authority generates and uses cash and cash equivalents by classifying cash flows as operating,
investing and financing activities. The amount of net cash flows arising from operating activities is a key indicator of the extent to
which the operations of the authority are funded by way of taxation and grant income or from the recipients of services provided
by the authority. Investing activities represent the extent to which cash outflows have been made for resources which are
intended to contribute to the authority’s future service delivery. Cash flows arising from financing activities are useful in predicting
claims on future cash flows by providers of capital (i.e. borrowing) to the authority.
10
NOTE 1. STATEMENT OF ACCOUNTING POLICIES
1. General Principles The Statement of Accounts summarises the Authority’s transactions for the 2011/12 financial year and its position at the year-end of 31st March 2012. The Authority is required to prepare an annual Statement of Accounts by the Accounts and Audit Regulations 2011 which require the document to be prepared in accordance with proper accounting practices. These practices primarily comprise the Code of Practice on Local Authority Accounting in the United Kingdom 2011/12 and the Best Value Accounting Code of Practice 2011/12, supported by International Financial Reporting Standards (IFRS) and statutory guidance issued under section 12 of the 2003 Act. The accounting convention adopted in the Statement of Accounts is principally historical cost, modified by the revaluation of certain categories of long-term assets and financial instruments. This is to ensure that the Statement of Accounts gives a true and fair view of the financial position of the Council including the group accounts for the year ending 31st March 2012 and to ensure it is compliant with relevant statutory accounting requirements issued by the International Accounting Standards Board (IASB). Expenditure and income are reported in accordance with a total cost basis of accounting. Gross total cost includes all expenditure attributable to the service/activity, including employee costs, expenditure relating to premises and transport, supplies and services, third party payments, transfer payments, support services and depreciation. No categories of income are considered to be abatements of expenditure, and movements to and from reserves are excluded from total cost. The accounting concepts of ‘materiality’, ‘accruals’, ‘going concern’ and ‘primacy of legislative requirements’ have been considered in the application of accounting policies. In this regard the:
• Materiality concept means that information is included where the information is of such significance as to justify its inclusion.
• Accruals concept requires the non-cash effects of transactions to be included in the financial statement for the year in which they occur, not in the period in which the cash is paid or received.
• Going concern concept assumes that the Council will continue in operational existence for the foreseeable future
• Primacy of Legislation - local authorities derive their power from statute and their financial and accounting framework is closely controlled by legislation. Where there is conflict between a legal requirement and an accounting standard, the legal requirement will take precedence.
2. Accruals of Income and Expenditure Activity is accounted for in the year that it takes place, not simply when cash payments are made or received. In particular:
11
• Revenue from the sale of goods is recognised when the Authority transfers the significant risks and rewards of ownership to the purchaser and it is probable that economic benefits or service potential associated with the transaction will flow to the Authority.
• Revenue from the provision of services is recognised when the Authority can measure reliably the percentage of completion of the transaction and it is probable that economic benefits or service potential associated with the transaction will flow to the Authority. This includes the accounting of fees, charges and rents due from customers; these are accounted for as income at the date the Council provides the relevant goods or services.
• Supplies are recorded as expenditure when they are consumed – where there is a gap between the date supplies are received and their consumption; they are carried as inventories on the Balance Sheet.
• Expenses in relation to services received (including services provided by employees) are recorded as expenditure when the services are received rather than when payments are made.
• Interest receivable on investments and payable on borrowings is accounted for respectively as income and expenditure on the basis of the effective interest rate for the relevant financial instrument rather than the cash flows fixed or determined by the contract.
• Where revenue and expenditure have been recognised but cash has not been received or paid, a debtor or creditor for the relevant amount is recorded in the Balance Sheet. Where debts may not be settled, the balance of debtors is written down and a charge made to revenue for the income that might not be collected.
• Exceptionally, income in respect of adults in residential care under the National Assistance Act 1948 is accounted for on a cash basis, although the amount involved is not material to the presentation of the accounts.
• The Council operates a de minimus of £5,000 below which items of income and expenditure are not normally accrued for.
3. Cash and Cash Equivalents Cash is represented by cash in hand and deposits with financial institutions repayable without penalty on notice. Cash equivalents are investments that mature no more than three months or less from the date of acquisition and that are readily convertible to known amounts of cash with insignificant risk of change in value. In the Cash Flow Statement, cash and cash equivalents are shown net of bank overdrafts that are repayable on demand within the short-term and form an integral part of the Authority’s cash management. 4. Exceptional Items When items of income and expense are material, their nature and amount is disclosed separately, either on the face of the Comprehensive Income and Expenditure Statement or in the notes to the accounts, depending on how significant the items are to an understanding of the Authority’s financial performance. 5. Prior Period Adjustments, Changes in Accounting Policies and
Estimates and Errors
Prior period adjustments may arise as a result of a change in accounting policies or to correct a material error. Changes in accounting estimates are accounted for prospectively, i.e. in the current and future years affected by the change and do not give rise to a prior period adjustment.
12
Changes in accounting policies are only made when required by proper accounting practices or the change provides more reliable or relevant information about the effect of transactions, other events and conditions on the Authority’s financial position or financial performance. Where a change is made, it is applied retrospectively (unless stated otherwise or not material) by adjusting opening balances and comparative amounts for the prior period as if the new policy had always been applied. Changes in Accounting Policy: Heritage Assets - For 2011/12, the adoption of FRS 30 Heritage Assets in the Code is a change of accounting policy. This requires the publication of a Balance Sheet as at the beginning of the earliest comparative period (i.e. a third Balance Sheet) in the 2011/12 financial statements where the restatement for the measurement of heritage assets is material. In addition, the disclosures required by section 4.10.4 of the Code shall be provided for the comparative year in the 2011/12 financial statements. Other changes – other changes adopted in the 2011/12 Code did not require additional disclosure for the 2010/11 or 2011/12 financial statements. The impact to accounting policies of future changes to legislation or accounting standards has to be disclosed, these are disclosed below. 5a. The following Accounting Standards have been issued but have not been
adopted Changes to IFRS7 - Financial Instrument disclosures that require information of the
transfer of financial assets within the financial statements will be included within the 2012/13 financial statements where appropriate and material.
6. Charges to Revenue for Long-term Assets
Service revenue accounts, support services and trading accounts are debited with the following amounts to record the cost of holding long-term assets during the year:
• Depreciation attributable to the assets used by the relevant service
• Re revaluation and impairment losses on assets used by the service where there are no accumulated gains in the Revaluation Reserve against which the losses can be written off
• amortisation of intangible long-term assets attributable to the service
The Council is not required to raise Council Tax to fund depreciation, revaluation, impairment losses or amortisations. However, it is required to make an annual provision from revenue to contribute towards the reduction in its overall borrowing requirement (equal to an amount calculated on a prudent basis determined by the Council in accordance with statutory guidance). Depreciation, revaluation and impairment losses and amortisations are therefore replaced by the contribution in the General Fund Balance (Minimum Revenue Provision), by way of an adjusting transaction with the Capital Adjustment Account in the Movement in Reserves Statement for the difference between the two.
13
7. Employee Benefits a. Benefits Payable during Employment
Short-term employee benefits are those due to be settled within 12 months of the year-end. They include such benefits as wages and salaries, paid annual leave and paid sick leave, bonuses and non-monetary benefits for current employees and are recognised as an expense for services in the year in which employees render service to the Authority. If material, an accrual is made for the cost of holiday entitlements (or any form of leave, e.g. time off in lieu) earned by employees but not taken before the year-end which employees can carry forward into the next financial year. The accrual is made at the wage and salary rates applicable in the following accounting year, being the period in which the employee takes the benefit. The accrual is charged to Surplus or Deficit on the Provision of Services, but then reversed out through the Movement in Reserves Statement so that holiday benefits are charged to revenue in the financial year in which the holiday absence occurs.
b. Termination Benefits
Termination benefits are amounts payable as a result of a decision by the Authority to terminate an officer’s employment before the normal retirement date or an officer’s decision to accept voluntary redundancy and are charged on an accruals basis to the Non Distributed Costs line in the Comprehensive Income and Expenditure Statement when the Authority is demonstrably committed to the termination of the employment of an officer or group of officers or making an offer to encourage voluntary redundancy and a reliable estimate can be made of the cost.
Where termination benefits involve the enhancement of pensions, statutory provisions require the General Fund balance to be charged with the amount payable by the Authority to the pension fund or pensioner in the year, not the amount calculated according to the relevant accounting standards. In the Movement in Reserves Statement, appropriations are required to and from the Pensions Reserve to remove the notional debits and credits for pension enhancement termination benefits and replace them with debits for the cash paid to the pension fund and pensioners and any such amounts payable but unpaid at the year-end.
c. Post-Employment Benefits
Employees of the Council are members of three separate pension schemes:
• The Local Government Pension Scheme, administered by the Council
• The Local Government Pension Scheme, administered by the London Pensions Fund Authority
• The Teachers’ Pension Scheme, administered by Capita Teachers’ Pensions on behalf of the Department for Education (DfE).
All the schemes provide defined benefits to members (retirement lump sums and pensions), earned as employees work for the Council.
However, the arrangements for the Teachers’ scheme mean that liabilities for these benefits cannot be identified to the Council. The scheme is therefore accounted for as if it were a defined contributions scheme – no liability for future payments of benefits is recognised in the Balance Sheet. The Children’s and Education Services line in the Comprehensive Income and Expenditure Statement is charged with the employer’s
14
contributions payable to Teachers’ Pensions in the year. The DfE set the teacher’s pension contribution rate.
The Local Government Pension Scheme
The Local Government scheme is a defined benefits scheme. The Council’s wholly owned subsidiary, Tower Hamlets Homes Limited (THH), is a Local Government Pension Scheme Employer in accordance with the Local Government Pension Scheme (Amendment) Regulations 2002. The Council has indemnified THH in respect of all liabilities that have arisen or may arise from its pension obligations.
The liabilities of the pension scheme attributable to the Council are included in the Balance Sheet on an actuarial basis using the projected unit method – an assessment of the future payments that will be made in relation to retirement benefits earned to date by employees, based on assumptions about mortality rates, employee turnover rates, etc. and estimates of projected earnings for current employees.
Council liabilities are discounted to their value at current prices, using a discount rate derived from corporate bond yields (as measured by the yield on iboxx Sterling Corporates Index, AA over 15 years) as at 31st March 2012.
Assets attributable to the Council are included in the Balance Sheet at their fair value. Quoted or unitised securities are valued at current bid price; unquoted securities on the basis of professional estimate; and property at market value.
The change in the net pension liability is analysed into seven components:
• current service cost – the increase in liabilities as a result of years of service earned this year, allocated in the Comprehensive Income and Expenditure Statement to the revenue accounts of services for which the employees worked.
• past service cost – the increase in liabilities arising from current year decisions the effect of which relates to years of service earned in earlier years, debited to the Surplus or Deficit on the Provision of Services as part of Non Distributed Costs within the Comprehensive Income and Expenditure Statement.
• interest cost – the expected increase in the present value of liabilities during the year as they move one year closer to being paid, debited to Financing and Investment Income and Expenditure in the Comprehensive Income and Expenditure Statement.
• expected return on assets – the annual investment return on the fund assets attributable to the Council, based on an average of the expected long-term return, credited to Financing and Investment Income and Expenditure in the Comprehensive Income and Expenditure Statement.
• gains and losses on settlements and curtailments – the result of actions to relieve the Council of liabilities or events that reduce the expected future service or accrual of benefits of employees, credited or debited to the Surplus or Deficit on the Provision of Services as part of Non Distributed Costs within the Comprehensive Income and Expenditure Statement.
• actuarial gains and losses – changes in the net pensions liability that arise because events have not coincided with assumptions made at the last actuarial valuation or because the actuaries have updated their assumptions, debited to the Pensions Reserve.
• contributions paid to the pension funds – cash paid as employer’s contributions to the pension funds.
In relation to retirement benefits, statutory provisions require the General Fund balance to be charged with the amount payable by the Council to the pension fund in the year, not the
15
amount calculated according to the relevant accounting standards. In the Movement of Reserves Statement, this means that there are appropriations to and from the Pensions Reserve to remove the notional debits and credits for retirement benefits and replace them with debits for the cash paid to the pension funds and any amounts payable to the funds but unpaid at the year-end. The negative balance that arises on the Pensions Reserve thereby measures the beneficial impact to the General Fund of being required to account for retirement benefits on the basis of cash flows rather than as benefits are earned by employees as calculated under IAS19.
Discretionary Benefits
The Council also has restricted powers to make discretionary awards of retirement benefits in the event of early retirements. Any liabilities estimated to arise as a result of an award to any member of staff (including teachers) are accrued in the year of the decision to make the award and accounted for using the same policies as are applied to the Local Government Pension Scheme. 8. Events after the Balance Sheet date Events after the Balance Sheet date are those events, both favourable and unfavourable, that occur between the end of the reporting period and the date when the Statement of Accounts is authorised for issue. Two types of events can be identified: a. those that provide evidence of conditions that existed at the end of the reporting
period – the Statement of Accounts is adjusted to reflect such material events b. those that are indicative of conditions that arose after the reporting period – the
Statement of Accounts is not adjusted to reflect such events, but where a category of events would have a material effect, disclosure is made in the notes of the nature of the events and their estimated financial effect, or a statement that an estimate cannot be reliably made.
Events taking place after the date of authorisation for issue are not reflected in the Statement of Accounts. Events after the Balance Sheet date are reflected up to the date when the Statement of Accounts is authorised for issue (these will be added as matters arise). 9. Financial Instruments
a. Financial Liabilities Financial liabilities are recognised on the Balance Sheet when the Authority becomes a party to the contractual provisions of a financial instrument and are initially measured at fair value and are carried at their amortised cost. Annual charges to the Financing and Investment Income and Expenditure line in the Comprehensive Income and Expenditure Statement for interest payable are based on the carrying amount of the liability, multiplied by the effective rate of interest for the instrument. The effective interest rate is the rate that exactly discounts estimated future cash payments over the life of the instrument to the amount at which it was originally recognised. For most of the borrowings that the Authority has, this means that the amount presented in the Balance Sheet is the outstanding principal repayable (plus accrued interest); and interest charged to the Comprehensive Income and Expenditure Statement is the amount payable for the year according to the loan agreement. Gains and losses on the repurchase or early settlement of borrowing are credited and debited to the Financing and Investment Income and Expenditure line in the Comprehensive Income and Expenditure Statement in the year of repurchase/settlement. However, where
16
repurchase has taken place as part of a restructuring of the loan portfolio that involves the modification or exchange of existing instruments, the premium or discount is respectively deducted from or added to the amortised cost of the new or modified loan and the write-down to the Comprehensive Income and Expenditure Statement is spread over the life of the loan by an adjustment to the effective interest rate. Where premia and discounts have been charged to the Comprehensive Income and Expenditure Statement, regulations allow the impact on the General Fund Balance to be spread over future years. The Council has a policy of spreading the gain or loss over the term that was remaining on the loan against which the premium was payable or discount receivable when it was repaid. The reconciliation of amounts charged to the Comprehensive Income and Expenditure Statement to the net charge required against the General Fund Balance is managed by a transfer to or from the Financial Instruments Adjustment Account in the Movement in Reserves Statement.
b. Financial Assets
Financial assets are classified into two types:
• loans and receivables – assets that have fixed or determinable payments but are not quoted in an active market
• available-for-sale assets – assets that have a quoted market price and/or do not have fixed or determinable payments
Loans and Receivables
Loans and receivables are recognised on the Balance Sheet when the Council becomes a party to the contractual provisions of a financial instrument and are initially measured at fair value and carried at their amortised cost. Annual credits to the Financing and Investment line in the Comprehensive Income and Expenditure Statement for interest receivable are based on the carrying amount of the asset multiplied by the effective rate of interest for the instrument. For most of the loans that the Council has made, this means that the amount presented in the Balance Sheet is the outstanding principal receivable (plus accrued interest) and interest credited to the Comprehensive Income and Expenditure Statement is the amount receivable for the year in the loan agreement.
Where assets are identified as impaired because of a likelihood arising from a past event that payments due under the contract will not be made, the asset is written down and a charge made to the relevant service (for receivables specific to that service) or the Financing and Investment Income and Expenditure line in the Comprehensive Income and Expenditure Statement.
Any gains and losses that arise on the derecognition of the asset are credited / debited to the Financing and Investment Income and Expenditure line in the Comprehensive Income and Expenditure Statement. 10. Foreign Currency Translation
Where the Authority has entered into a transaction denominated in a foreign currency, the transaction is converted into sterling at the exchange rate applicable on the date the transaction was effective.
11. Government Grants and Contributions
17
Whether paid on account, by instalments or in arrears, government grants and third party contributions and donations are recognised as due to the Authority when there is reasonable assurance that:
• the Authority will comply with the conditions attached to the payments, and
• the grants or contributions will be received. Amounts recognised as due to the Council are not credited to the Comprehensive Income and Expenditure Statement until conditions attached to the grant or contribution have been satisfied. Conditions are stipulations that specify that the future economic benefits or service potential embodied in the asset acquired using the grant or contribution are required to be consumed by the recipient as specified, or future economic benefits or service potential must be returned to the transferor. Monies advanced as grants and contributions for which conditions have not been satisfied are carried in the Balance Sheet as creditors (revenue grants) or Capital Grants Receipts in Advance account (capital grants). When conditions are satisfied, the grant or contribution is credited to the relevant service line (attributable revenue grants and contributions) or Taxation and Non-Specific Grant Income (non-ringfenced revenue grants and all capital grants) in the Comprehensive Income and Expenditure Statement. Unapplied revenue grants without repayment conditions are shown as earmarked reserves. Where capital grants are credited to the Comprehensive Income and Expenditure Statement, they are reversed out of the General Fund Balance in the Movement in Reserves Statement. Where the grant has yet to be used to finance capital expenditure, it is posted to the Capital Grants Unapplied reserve. Where it has been applied, it is posted to the Capital Adjustment Account. Amounts in the Capital Grants Unapplied reserve are transferred to the Capital Adjustment Account once they have been applied to fund capital expenditure. Where a repayment of grants or contributions becomes repayable where the grant or contribution has previously been recognised in the Comprehensive Income and Expenditure Statement the repayment is recognised as an expense in the Comprehensive Income and Expenditure Statement. Government grants and contributions may be received subject to a condition that it is returned to the transferor if a specified future event does or does not occur. A return obligation does not arise until such time as it is expected that the condition will be breached and a liability is not recognised until that time. Such conditions do not prevent the grant, contribution or donated asset being recognised as income in the Comprehensive Income and Expenditure Statement. 12. Heritage assets The Code of Practice on Local Authority Accounting in the United Kingdom 2011/12 introduced a change in accounting policy in relation to the treatment of heritage assets held by the Council, which has been adopted by the Council for the financial statements. The value of heritage assets currently held in the Balance Sheet as part of long-term assets is £4.8 million at 31 March 2012. This valuation is based on valuations for art and museum collections where the asset has a material value. The authority holds information on the value of an item of material value within the art collection (one painting), two public statues and civic regalia (value held for insurance purposes). Where the Council has information on the cost or value of a heritage asset the Council includes that value in its 2011/12 balance sheet. Where this information is not available and
18
the historical cost information cannot be obtained the asset is excluded from the balance sheet. Operational heritage assets (i.e. those that in addition to being held for their heritage characteristics are also used for other activities or provide other services) are accounted for as operational assets and valued in the same way as other assets of that type. Heritage assets (other than operational heritage assets) shall normally be included in the balance sheet at their current value where material. The Council has a materiality threshold of £50,000 for considering heritage assets for valuation. Where it is not practical to obtain a valuation at a reasonable cost heritage assets are valued at cost where known. Most heritage assets owned by the council have an historical interest to the Borough, but would not have material market value. Due to the nature of these assets, it is unlikely the Council will look to sell these assets. Valuations are made by any method that is appropriate, including reference to sale proceeds of similar items by same artist to demonstrate values are clearly under materiality values. There is no requirement for valuations to be carried out or certified by external valuers nor is there any prescribed minimum period between valuations. The Council has four heritage assets that have material values, these values are reviewed periodically, however the real value would only be established upon sale as valuations on assets of this nature are subjective. Depreciation is not required on heritage assets with indefinite lives. However where there is evidence of physical deterioration to a material heritage asset or doubts arise to its authenticity the value of the asset would be reviewed.
13. Intangible Long Term Assets
Expenditure on non-monetary assets that do not have physical substance but are controlled by the Authority as a result of past events (e.g. software licences) is capitalised when it is expected that future economic benefits or service potential will flow from the intangible asset to the Authority. Internally generated assets are capitalised where it is demonstrable that the project is technically feasible and is intended to be completed (with adequate resources being available) and the Authority will be able to generate future economic benefits or deliver service potential by being able to sell or use the asset. Expenditure is capitalised where it can be measured reliably as attributable to the asset and is restricted to that incurred during the development phase (research expenditure cannot be capitalised). Annual software licence fees are charged to capital and amortised in that year Expenditure on the development of websites is not capitalised if the website is solely or primarily intended to promote or advertise the Authority’s goods or services. Intangible assets are measured initially at cost. Amounts are only revalued where the fair value of the assets held by the Authority can be determined by reference to an active market. In practice, no intangible asset held by the Authority meets this criterion, and they are therefore carried at amortised cost. The depreciable amount of an intangible asset is amortised over its useful life to the relevant service line(s) in the Comprehensive Income and Expenditure Statement. An asset is tested for impairment whenever there is an indication that the asset might be impaired – any losses recognised are posted to the relevant service line(s) in the Comprehensive Income and Expenditure Statement. Any gain or loss arising
19
on the disposal or abandonment of an intangible asset is posted to the Other Operating Expenditure line in the Comprehensive Income and Expenditure Statement. Where expenditure on intangible assets qualifies as capital expenditure for statutory purposes, amortisation, impairment losses and disposal gains and losses are not permitted to have an impact on the General Fund Balance. The gains and losses are therefore reversed out of the General Fund Balance in the Movement in Reserves Statement and posted to the Capital Adjustment Account and (for any sale proceeds greater than £10,000) the Capital Receipts Reserve.
14. Interests in Companies and Other Entities The Council has a material interest in Tower Hamlets Homes which is a wholly owned subsidiary of the Council and which requires group accounts to be prepared. The Council, as part of the Government’s Building Schools for the Future (BSF) initiative, also has a ten percent shareholding in the delivery company Tower Hamlets Local Education Partnership Ltd. but has determined that the interest is outside the group accounts requirement. In the Council’s own single-entity accounts, interests in companies and other entities are recorded as financial assets at cost, less any provision for losses.
15. Inventories and Long Term Contracts Inventories (stocks) are included in the Balance Sheet at the lower of cost and net realisable value. Where material, the council would select a valuation process appropriate for the asset. Long term contracts are accounted for on the basis of charging the Surplus or Deficit on the Provision of Services with the value of works and services received under the contract during the financial year. 16. Jointly Controlled Operations and Jointly Controlled Assets
Jointly controlled operations are activities undertaken by the Authority in conjunction with other venturers that involve the use of the assets and resources of the venturers rather than the establishment of a separate entity. The Authority recognises on its Balance Sheet the assets that it controls and the liabilities that it incurs and debits and credits the Comprehensive Income and Expenditure Statement with the expenditure it incurs and the share of income it earns from the activity of the operation. Jointly controlled assets are items of property, plant or equipment that are jointly controlled by the Authority and other venturers, with the assets being used to obtain benefits for the venturers. The joint venture does not involve the establishment of a separate entity. The Authority accounts for only its share of the jointly controlled assets, the liabilities and expenses that it incurs on its own behalf or jointly with others in respect of its interest in the joint venture and income that it earns from the venture.
17. Leases
Leases are classified as finance leases where the terms of the lease transfer substantially all the risks and rewards incidental to ownership of the property, plant or equipment from the lessor to the lessee. All other leases are classified as operating leases.
The Authority as a Lessee
20
The Council has reviewed in detail its leases and has determined that, except for PFI agreements, there are a small number of finance leases with immaterial asset values, so the agreement costs are charged to revenue. For finance leases (including the PFI assets), the accounting policy is as follows;
a. Finance Leases The Council accounts for leases as finance leases when substantially all the risks and rewards relating to the leased property transfer to the Council. Rentals payable are apportioned between:
• a charge for the acquisition of the interest in the property, plant or equipment (recognised as a liability in the Balance Sheet at the start of the lease, matched with a tangible property, plant or equipment asset – the liability is written down as the rent becomes payable), and
• A finance charge (debited to the Financing and Investment Income and Expenditure line in the Comprehensive Income and Expenditure Statement).
Property, Plant and Equipment recognised under finance leases is accounted for using the policies applied generally to such assets, subject to depreciation being charged over the lease term if this is shorter than the asset’s estimated useful life (where ownership of the asset does not transfer to the authority at the end of the lease period).
b. Operating Leases
Leases that do not meet the definition of finance leases as described above are accounted for as operating leases. Rentals payable are charged to the relevant service revenue account within the Comprehensive Income and Expenditure Statement on an equalised basis over the term of the lease, to reflect the economic benefits consumed over the life of the lease, irrespective of fluctuations in annual payments. The Authority as a Lessor The council has some operating leases as a lessor; the accounting policy is as follows: Operating Leases Where the Authority grants an operating lease over a property or an item of plant or equipment, the asset is retained in the Balance Sheet. Rental income is credited to the Other Operating Expenditure line in the Comprehensive Income and Expenditure Statement. Credits are made on a straight-line basis over the life of the lease, even if this does not match the pattern of payments (e.g. there is a premium paid at the commencement of the lease). Initial direct costs incurred in negotiating and arranging the lease are added to the carrying amount of the relevant asset and charged as an expense over the lease term on the same basis as rental income.
18. Overheads and Support Services
The costs of overheads and support services are charged to those services that benefit from the supply or service in accordance with the costing principles of the CIPFA Service Reporting Code of Practice 2011/12 (SeRCOP). The total absorption costing principle is used – the full cost of overheads and support services is shared between users in proportion to the benefits received, with the exception of:
• Corporate and Democratic Core – costs relating to the Council’s status as a multi-functional, democratic organisation.
21
• Non Distributed Costs – costs not attributable to services such as depreciation and impairment losses chargeable on non-operational properties.
These two cost categories are defined in SeRCOP and accounted for as separate headings in the Comprehensive Income and Expenditure Statement, as part of Net Expenditure on Continuing Services.
19. Property, Plant and Equipment
Assets that have physical substance and are held for use in the production or supply of goods or services, for rental to others, or for administrative purposes and that are expected to be used during more than one financial year are classified as Property, Plant and Equipment. Recognition Expenditure on the acquisition, creation or enhancement of Property, Plant and Equipment is capitalised on an accruals basis, provided that it is probable that the future economic benefits or service potential associated with the item will flow to the Council and the cost of the item can be measured reliably. Expenditure that maintains but does not add to an asset’s potential to deliver future economic benefits or service potential (i.e. repairs and maintenance) is charged as an expense when it is incurred. The de minimis level above which expenditure on tangible property, plant and equipment assets is classified as capital is £50,000 except where the expenditure is financed by grants or contributions; or where lesser amounts on the same asset accumulate above that level. Measurement Assets are initially measured at cost, comprising:
• the purchase price
• any costs attributable to bringing the asset to the location and condition necessary for it to be capable of operating in the manner intended by management
• The initial estimate of the costs of dismantling and removing the item and restoring the site on which it is located.
The Authority does not capitalise borrowing costs incurred whilst assets are under construction. The cost of assets acquired other than by purchase is deemed to be its fair value, unless the acquisition does not have commercial substance (i.e. it will not lead to a variation in the cash flows of the Authority). In the latter case, where an asset is acquired via an exchange, the cost of the acquisition is the carrying amount of the asset given up by the Authority. Donated assets are measured initially at fair value. The difference between fair value and any consideration paid is credited to the Taxation and Non-Specific Grant Income line of the Comprehensive Income and Expenditure Statement, unless the donation has been made conditionally. Until conditions are satisfied, the gain is held in the Donated Assets Account. Where gains are credited to the Comprehensive Income and Expenditure Statement, they are reversed out of the General Fund Balance to the Capital Adjustment Account in the Movement in Reserves Statement. Assets are then carried in the Balance Sheet using the following measurement bases:
• infrastructure, community assets and assets under construction – depreciated historical cost.
• dwellings – fair value, determined using the basis of existing use value for social housing (EUV-SH).
• All other assets – fair value, determined as the amount that would be paid for the asset in its existing use (existing use value – EUV).
22
Where there is no market-based evidence of fair value because of the specialist nature of an asset, depreciated replacement cost (DRC) is used as an estimate of fair value. Where non-property assets that have short useful lives or low values (or both), depreciated historical cost basis is used as a proxy for fair value – this is commonly used as a basis for valuing vehicles, plant and equipment.
Assets included in the Balance Sheet at fair value are revalued sufficiently regularly to ensure that their carrying amount is not materially different from their fair value at the year-end, but as a minimum every five years. Increases in valuations are matched by credits to the Revaluation Reserve to recognise unrealised gains. Exceptionally, gains might be credited to the Comprehensive Income and Expenditure Statement where they arise from the reversal of a loss previously charged to a service. Where decreases in value are identified, they are accounted for by:
• Where there is a balance of revaluation gains for the asset in the Revaluation Reserve, the carrying amount of the asset is written down against that balance (up to the amount of the accumulated gains)
• Where there is no balance in the Revaluation Reserve or an insufficient balance, the carrying amount of the asset is written down against the relevant service line(s) in the Comprehensive Income and Expenditure Statement.
The Revaluation Reserve contains revaluation gains recognised since 1st April 2007 only, the date of its formal implementation. Gains arising before that date have been consolidated into the Capital Adjustment Account. Impairment Assets are assessed at each year-end as to whether there is any indication that an asset may be impaired. Where indications exist and any possible differences are estimated to be material, the recoverable amount of the asset is estimated and, where this is less than the carrying amount of the asset, an impairment loss is recognised for the shortfall. Where impairment losses are identified, they are accounted for by:
• Where there is a balance of revaluation gains for the asset in the Revaluation Reserve, the carrying amount of the asset is written down against that balance (up to the amount of the accumulated gains)
• Where there is no balance in the Revaluation Reserve or an insufficient balance, the carrying amount of the asset is written down against the relevant service line(s) in the Comprehensive Income and Expenditure Statement.
Where an impairment loss is reversed subsequently, the reversal is credited to the relevant service line(s) in the Comprehensive Income and Expenditure Statement, up to the amount of the original loss, adjusted for depreciation that would have been charged if the loss had not been recognised. Depreciation Depreciation is provided for on all Property, Plant and Equipment assets by the systematic allocation of their depreciable amounts over their useful lives. An exception is made for assets without a determinable finite useful life (i.e. freehold land and certain Community Assets) and assets that are not yet available for use (i.e. assets under construction). Deprecation is calculated on the following bases:
• dwellings - equivalent to the Major Repairs Allowance payable by the Government which has been used as an appropriate proxy for depreciation
• other buildings – straight-line allocation over the useful life of the property as estimated by the valuer
• vehicles, plant, furniture and equipment – a percentage of the value of each class of assets in the Balance Sheet, as advised by a suitably qualified officer. For equipment, over five years
23
• infrastructure – straight-line allocation over 40 years Revaluation gains are also depreciated, with an amount equal to the difference between current value depreciation charged on assets and the depreciation that would have been chargeable based on their historical cost being transferred each year from the Revaluation Reserve to the Capital Adjustment Account. Where an item of Property, Plant and Equipment asset has major components whose cost is significant in relation to the total cost of the item, the components are depreciated separately if they have a materially different remaining life from the underlying asset. Any assets with a value below £0.5 million are not considered material for containing separate components. Separate components will be considered in an asset with a value greater than £0.5 million if the component has a value of greater than 25% of the asset and the remaining life of the asset is materially different from the underlying asset. Disposals and Non-Current Assets Held for Sale When it becomes probable that the carrying amount of an asset will be recovered principally through a sale transaction rather than through its continuing use, it is reclassified as an Asset Held for Sale. The asset is revalued immediately before reclassification and then carried at the lower of this amount and fair value less costs to sell. Where there is a subsequent decrease to fair value less costs to sell, the loss is posted to the Other Operating Expenditure line in the Comprehensive Income and Expenditure Statement. Gains in fair value are recognised only up to the amount of any previous losses recognised in the Surplus or Deficit on Provision of Services. Depreciation is not charged on Assets Held for Sale. If assets no longer meet the criteria to be classified as Assets Held for Sale, they are reclassified back to long-term assets and valued at the lower of their carrying amount before they were classified as held for sale; adjusted for depreciation, amortisation or revaluations that would have been recognised had they not been classified as Held for Sale, and their recoverable amount at the date of the decision not to sell. Assets that are to be abandoned or scrapped are not reclassified as Assets Held for Sale. When an asset is disposed of or decommissioned, the carrying amount of the asset in the Balance Sheet (whether Property, Plant and Equipment or Assets Held for Sale) is written off to the Other Operating Expenditure line in the Comprehensive Income and Expenditure Statement as part of the gain or loss on disposal. Receipts from disposals (if any) are credited to the same line in the Comprehensive Income and Expenditure Statement also as part of the gain or loss on disposal (i.e. netted off against the carrying value of the asset at the time of disposal). Any revaluation gains accumulated for the asset in the Revaluation Reserve are transferred to the Capital Adjustment Account. Amounts received for a disposal in excess of £10,000 are categorised as capital receipts. A proportion of receipts relating to housing disposals (75% for dwellings, 50% for land and other assets, net of statutory deductions and allowances) is payable to the Government. The balance of receipts is required to be credited to the Capital Receipts Reserve, and can then only be used for new capital investment or set aside to reduce the Authority’s underlying need to borrow (the capital financing requirement). Receipts are appropriated to the Reserve from the General Fund Balance in the Movement in Reserves Statement. The written-off value of disposals is not a charge against Council Tax, as the cost of long-term assets is fully provided for under separate arrangements for capital financing. Amounts are appropriated to the Capital Adjustment Account from the General Fund Balance in the Movement in Reserves Statement.
24
20. Private Finance Initiative (PFI) and Similar Contracts PFI contracts are agreements to receive services, where the responsibility for making available the property, plant and equipment long-term assets needed to provide services passes to the PFI contractor. As the Authority is deemed to control the services that are provided under its PFI schemes, and as ownership of the property, plant and equipment will pass to the Authority at the end of the contracts for no additional charge, the Authority carries the assets used under the contracts on its Balance Sheet as part of Property, Plant and Equipment. The Council is party to two PFI contracts in respect of schools which terminate in 2027 and 2029. The original recognition of these long-term assets at fair value (based on the cost to purchase the property, plant and equipment) was balanced by the recognition of a liability for amounts due to the scheme operator to pay for capital investment. Non current assets recognised on the Balance Sheet are revalued and depreciated in the same way as property, plant and equipment owned by the Authority. The amounts payable to the PFI operators each year are analysed into five elements:
• fair value of the services received during the year – debited to the relevant service in the Comprehensive Income and Expenditure Statement
• finance cost – an interest charge on the outstanding Balance Sheet liability, debited to the Financing and Investment Income and Expenditure line in the Comprehensive Income and Expenditure Statement
• contingent rent – increases in the amount to be paid for the property arising during the contract, debited to the Financing and Investment Income and Expenditure line in the Comprehensive Income and Expenditure Statement
• payment towards liability – applied to write down the Balance Sheet liability towards the PFI operator (the profile of write-downs is calculated using the same principles as for a finance lease).
• lifecycle replacement costs – recognised as long-term assets on the Balance Sheet if capital in nature
MRP policy for PFI schemes - a minimum revenue provision is charged based on a share of the charge paid within the contract - this represents repayment of the contract liability for the long-term assets within the contract. There is also a contract for the Barkantine Heat and Power scheme. This concession agreement is a user pay arrangement where the end user pays the operator for the combined heat and power (CHP) services rendered. The Council receives a profit share but pays no unitary charge for the service. The assets of the CHP scheme are included on the council’s balance sheet with a deferred income balance (from 2010/11), both of which are written down over the term of the contract.
21. Provisions, Contingent Liabilities and Contingent Assets
a. Provisions
Provisions are made where an event has taken place that gives the Council an obligation that probably requires settlement by a transfer of economic benefits or service potential and a reliable estimate can be made of the amount of the obligation. For instance, if the Council were to be involved in a court case that could eventually result in the making of a settlement or the payment of compensation.
Provisions are charged to the appropriate service revenue account in the year that the Council becomes aware of the obligation, based on the best estimate at the balance sheet
25
date of the expenditure required to settle the obligation, taking into account relevant risks and uncertainties. When payments are eventually made, they are charged to the provision carried in the Balance Sheet. Estimated settlements are reviewed at the end of each financial year. Where it becomes more likely than not that a transfer of economic benefits will not be required (or a lower settlement than anticipated is made), the provision is reversed and credited back to the relevant service account.
Where some or all of the payment required to settle an obligation is expected to be met by another party (e.g. from an insurance claim), this is only recognised as income in the relevant revenue account if it is virtually certain that reimbursement will be received if the Council settles the obligation.
b. Contingent Liabilities A contingent liability arises where an event has taken place that gives the Council a possible obligation whose existence will only be confirmed by the occurrence or otherwise of uncertain future events not wholly within the control of the authority. Contingent liabilities also arise in circumstances where a provision would otherwise be made but either it is not probable that an outflow of resources will be required or the amount of the obligation cannot be measured reliably. Contingent liabilities are not recognised in the Balance Sheet but disclosed in note 45 to the accounts.
c. Contingent Assets A contingent asset arises where an event has taken place that gives the authority a possible asset whose existence will only be confirmed by the occurrence or otherwise of uncertain future events not wholly within the control of the authority. Contingent assets are not recognised in the Balance Sheet but disclosed in a note to the accounts where it is probable that there will be an inflow of economic benefits or service potential.
22. Reserves
The Council sets aside specific amounts as reserves for future policy purposes or to cover contingencies. Reserves are created by appropriating amounts out of the General Fund Balance in the Movement of Reserves Statement. When expenditure to be financed from a reserve is incurred it is charged to the relevant service revenue account in that year to score against the Surplus or Deficit on the Provision of Services in the Comprehensive Income and Expenditure Statement. The reserve is then appropriated back into the General Fund Balance statement so that there is no net charge against Council Tax for the expenditure.
Certain reserves are kept to manage the accounting processes for long-term assets, financial instruments, retirement and employment benefits and do not represent usable resources for the Council – these reserves are explained in the relevant policies.
23. Revenue Expenditure Funded from Capital under Statute (REFCUS)
Expenditure incurred during the year that may be capitalised under statutory provisions but does not result in the creation of long-term assets has been charged as expenditure to the relevant service revenue account in the year. Where the Council has determined to meet the cost of this expenditure from existing capital resources or by borrowing, a transfer in the
26
Movement of Reserves Statement from the General Fund Balance to the Capital Adjustment Account then reverses out the amounts charged so there is no impact on the level of Council Tax.
24. VAT
VAT payable is included as an expense only to the extent that it is not recoverable from Her Majesty’s Revenue and Customs. VAT receivable is excluded from income. 25. Collection Fund The Council is required by statute to maintain a separate fund for the collection and distribution of amounts due in respect of Council Tax and National Non-Domestic Rates (NNDR). This account receives income on behalf of the Council and its other preceptor, the Greater London Authority (GLA). Council Tax income for the year is the Council’s accrued income for the year and not the amount required to be transferred from the Collection Fund under regulation. The difference between the amount included in the Comprehensive Income and Expenditure Statement and the amount required by regulation to be credited to the General Fund is taken to the Collection Fund Adjustment Account and included within the Movement of Reserves Statement.
The cash collected by the Council from Council Tax debtors belongs proportionately to the billing authority and the preceptor. This results in a debtor / creditor position between the Council and preceptor for the difference between the cash collected from Council Tax debtors and the precept paid over during the year. The Balance Sheet includes the Council’s share of Council Tax arrears and impairment for bad debts, Council Tax over payments and prepayments and the debtor/ creditor from the preceptor. The Council’s share of net cash collected from Council Tax debtors in the year is included within the Cash Flow Statement. The difference between the major preceptors’ share of net cash collected and amounts paid to the precepting authorities is included in the net cash-flows for financing activities. The amount included in the Council’s Balance Sheet is the amount of cash collected from NNDR taxpayers (less the amount retained in respect of a cost of collection allowance) that has not yet been paid to the Government or has been overpaid to the Government on the Balance Sheet date. 26. Carbon Reduction Commitment Scheme The authority is required to participate in the Carbon Reduction Commitment (CRC) Energy Efficiency Scheme. This scheme is currently in its introductory phase which will last until 31 March 2014. The authority is required to purchase and surrender allowances, currently retrospectively, on the basis of emissions i.e. carbon dioxide produced as energy is used. As carbon dioxide is emitted (i.e. as energy is used), a liability and an expense are recognised. The liability will be discharged by surrendering allowances. The liability is measured at the best estimate of the expenditure required to meet the obligation, normally at the current market price of the number of allowances required to meet the liability at the reporting date. The cost to the authority is recognised and reported in the costs of the authority’s services and is apportioned to services on the basis of energy consumption.
27
NOTE 2. CRITICAL JUDGEMENTS IN APPLYING ACCOUNTING POLICIES
In applying the accounting policies set out in note 1, the Authority has had to make certain judgments about complex transactions or those involving uncertainty about future events. The critical judgements made in the Statement of Accounts are:
• The Council is accounted for on a going concern basis this is supported by the Council’s medium term financial plan which shows a balanced budget over the next three years as well as an appropriate level of reserves having regard to the financial risks facing the Council in terms of future levels of government funding and increasing service demand.
• Assets have been valued at an appropriate level - property is regularly reviewed to identify possible impairment and there is a rolling five-year valuation programme.
• All assets are reflected in the Council’s balance sheet – the Council maintains a comprehensive asset register and contracts have been reviewed to identify potential embedded service concessions or embedded leases.
• The Pension Fund deficit can be managed within the constraints of the medium term financial plan - the Council’s pension fund investment strategy and funding level is closely monitored in conjunction with the Fund’s Advisors and Actuary and appropriate provision is included in the accounts to ensure that pension liabilities can be met over the longer term.
• The level of creditors shown in the accounts properly reflects the level of such liabilities - the Council has an effective purchase ledger system and associated internal control procedures to ensure that all creditors are recognised in the accounts with an appropriate value based on the expected value of goods ordered and received in the old financial year but not paid.
28
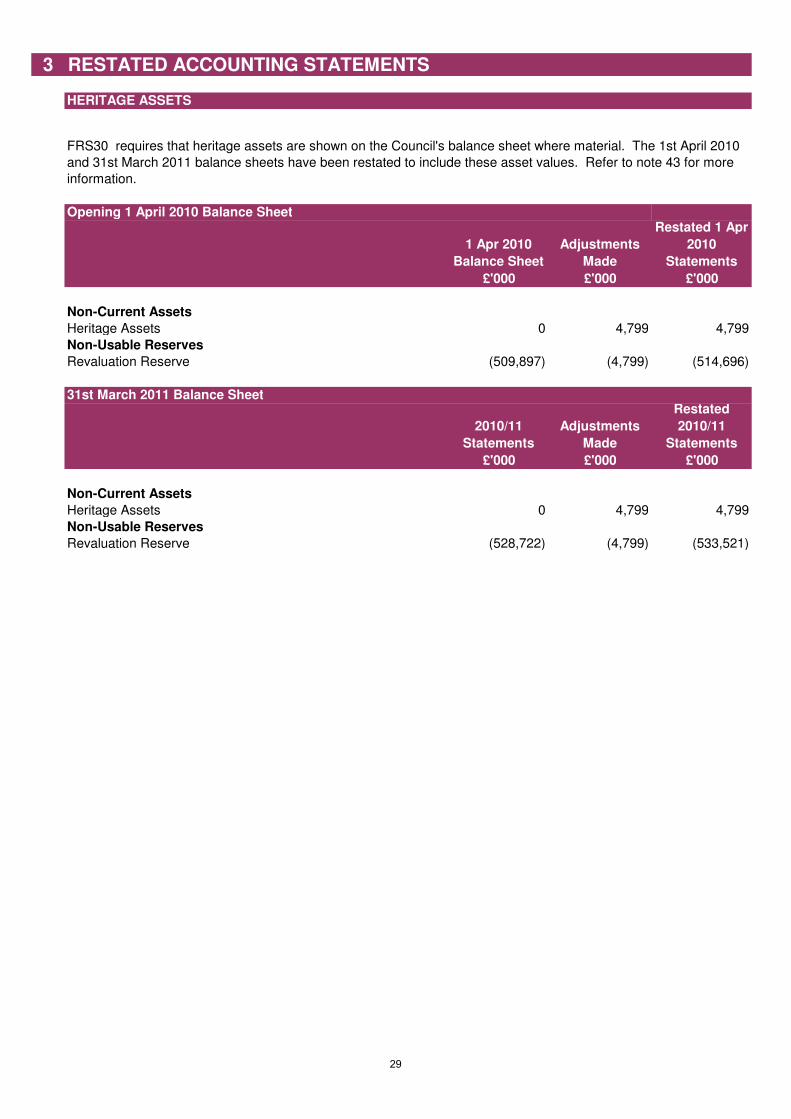
3 RESTATED ACCOUNTING STATEMENTS
HERITAGE ASSETS
Opening 1 April 2010 Balance Sheet
1 Apr 2010
Balance Sheet
Adjustments
Made
Restated 1 Apr
2010
Statements
£'000 £'000 £'000
Non-Current Assets
Heritage Assets 0 4,799 4,799
Non-Usable Reserves
Revaluation Reserve (509,897) (4,799) (514,696)
31st March 2011 Balance Sheet
2010/11
Statements
Adjustments
Made
Restated
2010/11
Statements
£'000 £'000 £'000
Non-Current Assets
Heritage Assets 0 4,799 4,799
Non-Usable Reserves
Revaluation Reserve (528,722) (4,799) (533,521)
FRS30 requires that heritage assets are shown on the Council's balance sheet where material. The 1st April 2010
and 31st March 2011 balance sheets have been restated to include these asset values. Refer to note 43 for more
information.
29
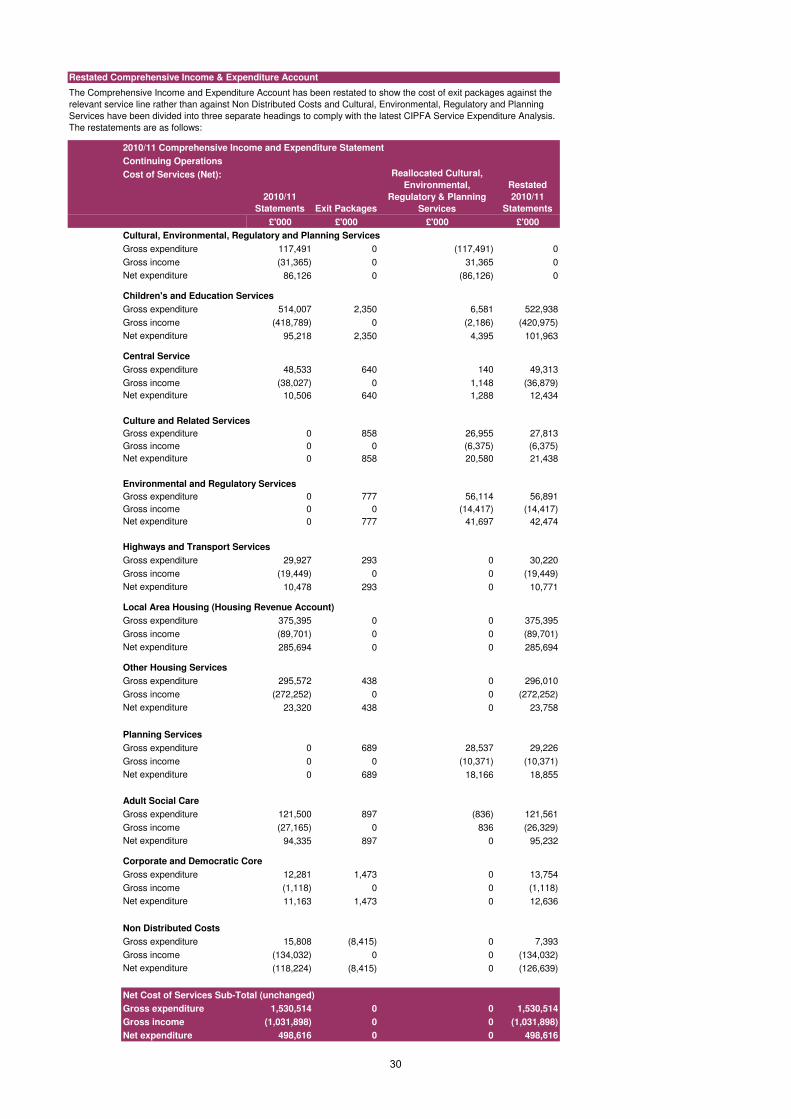
2010/11 Comprehensive Income and Expenditure Statement
Continuing Operations
Cost of Services (Net):
2010/11
Statements Exit Packages
Restated
2010/11
Statements
£'000 £'000 £'000 £'000
Cultural, Environmental, Regulatory and Planning Services
Gross expenditure 117,491 0 (117,491) 0
Gross income (31,365) 0 31,365 0
Net expenditure 86,126 0 (86,126) 0
Children's and Education Services
Gross expenditure 514,007 2,350 6,581 522,938
Gross income (418,789) 0 (2,186) (420,975)
Net expenditure 95,218 2,350 4,395 101,963
Central Service
Gross expenditure 48,533 640 140 49,313
Gross income (38,027) 0 1,148 (36,879)
Net expenditure 10,506 640 1,288 12,434
Culture and Related Services
Gross expenditure 0 858 26,955 27,813
Gross income 0 0 (6,375) (6,375)
Net expenditure 0 858 20,580 21,438
Environmental and Regulatory Services
Gross expenditure 0 777 56,114 56,891
Gross income 0 0 (14,417) (14,417)
Net expenditure 0 777 41,697 42,474
Highways and Transport Services
Gross expenditure 29,927 293 0 30,220
Gross income (19,449) 0 0 (19,449)
Net expenditure 10,478 293 0 10,771
Local Area Housing (Housing Revenue Account)
Gross expenditure 375,395 0 0 375,395
Gross income (89,701) 0 0 (89,701)
Net expenditure 285,694 0 0 285,694
Other Housing Services
Gross expenditure 295,572 438 0 296,010
Gross income (272,252) 0 0 (272,252)
Net expenditure 23,320 438 0 23,758
Planning Services
Gross expenditure 0 689 28,537 29,226
Gross income 0 0 (10,371) (10,371)
Net expenditure 0 689 18,166 18,855
Adult Social Care
Gross expenditure 121,500 897 (836) 121,561
Gross income (27,165) 0 836 (26,329)
Net expenditure 94,335 897 0 95,232
Corporate and Democratic Core
Gross expenditure 12,281 1,473 0 13,754
Gross income (1,118) 0 0 (1,118)
Net expenditure 11,163 1,473 0 12,636
Non Distributed Costs
Gross expenditure 15,808 (8,415) 0 7,393
Gross income (134,032) 0 0 (134,032)
Net expenditure (118,224) (8,415) 0 (126,639)
Net Cost of Services Sub-Total (unchanged)
Gross expenditure 1,530,514 0 0 1,530,514
Gross income (1,031,898) 0 0 (1,031,898)
Net expenditure 498,616 0 0 498,616
Restated Comprehensive Income & Expenditure Account
The Comprehensive Income and Expenditure Account has been restated to show the cost of exit packages against the
relevant service line rather than against Non Distributed Costs and Cultural, Environmental, Regulatory and Planning
Services have been divided into three separate headings to comply with the latest CIPFA Service Expenditure Analysis.
The restatements are as follows:
Reallocated Cultural,
Environmental,
Regulatory & Planning
Services
30
4
5
6
Assumptions Made About the Future and Other Major Sources of Estimation
Uncertainty
The Statement of Accounts contains estimated figures that are based on assumptions made by the Authority about
the future or that are otherwise uncertain. Estimates are made taking into account historical experience, current
trends and other relevant factors. However, because balances cannot be determined with certainty, actual results
could be materially different from the assumptions and estimates.
The items in the Council's Balance Sheet at 31st March 2012 for which there is a significant risk of material
adjustment in the forthcoming financial year are as follows:
Property, Plant and Equipment - Assets are depreciated over useful lives that are dependent on assumptions
about the level of repairs and maintenance that will be incurred in relation to individual assets. The current economic
climate makes it uncertain that the Authority will be able to sustain its current spending on repairs and maintenance,
bringing into doubt the useful lives assigned to assets.
Pensions Liability - Estimation of the net liability to pay pensions depends on a number of complex judgements
relating to the discount rate used, the rate at which salaries are projected to increase, changes in retirement ages,
mortality rates and expected returns on pension fund investments. A firm of consulting actuaries is engaged to
provide the Authority with expert advice about the assumptions to be applied.
The assumptions interact in complex ways. During 2011/12, the Authority’s actuaries advised that the net pensions
liability had increased by £114 million, partly as a result of investment returns and bond yields being lower than
expected.
If the useful life of assets is reduced, depreciation increases and the carrying amount of the assets falls. It is
estimated that the annual depreciation charge for buildings would increase by approximately £1 million for every year
that useful lives had to be reduced.
Creditors - creditors are raised based on the value of goods received in the old financial year where payment has
not been made to the supplier. The value of year-end creditor is based on the expected value of the order to be
paid, however there is the possibility that the final amount payable might vary. At 31st March 2012, the value of
these creditors was £5.2 million.
Heritage Assets - In valuing material heritage assets, valuations have been obtained from independent valuers.
Where a value has been given between a certain band, then the mid-point valuation is used. However, because of
their unique nature the value of heritage assets is difficult to predict. There is a risk that the value of heritage assets
is incorrectly stated, but this would only become apparent if the asset is sold. As most heritage items have been
given a nil value as the assets have values significantly below the materiality threshold, any risk is that assets' value
is understated. Also, as the assets are a record of the Borough's heritage, it is unlikely that they will be sold.
Debtors - The Council has a balance of £46m sundry debtors at 31st March 2012. A bad debt provision equating to
25% exists. If collection levels were to deteriorate, then an increase of the provision by 10% would equate to £1.1m.
No post balance sheet events have been identified that would require the accounts to be restated.
Material Items of Income and Expense
Due to a change in valuation guidance, £283m of revaluation loss was charged to the Comprehensive Income and
Expenditure Account in 2010/11. However this was not a real charge to the General Fund in accordance with statute
and as such is reversed out the Capital Adjustment Account. Further details are in Note 3 to the Housing Revenue
Account.
Projected pension liabilities reduced in 2010/11 following the Government announcement that the Consumer Price
Index rather than the Retail Price Index will be used as the basis for future increases to public sector pensions in
payment and deferment. The 2010/11 gain to the pension scheme was estimated at £134 million and shown within
Non Distributed Costs within the Comprehensive Income & Expenditure Account for 2010/11. More details are in
note 41 to the Accounts.
Events After the Balance Sheet Date
Communities & Local Government (CLG) Debt Repayment - In March 2012, the CLG repaid a total of £236.2
million of PWLB loans used to finance housing as part of a nationwide debt re-allocation programme under the new
HRA Self-Financing arrangements which come into effect from 1st April 2012. The debt repayment included the
notional payment of a £76.3 million debt premium from early repayment.
31
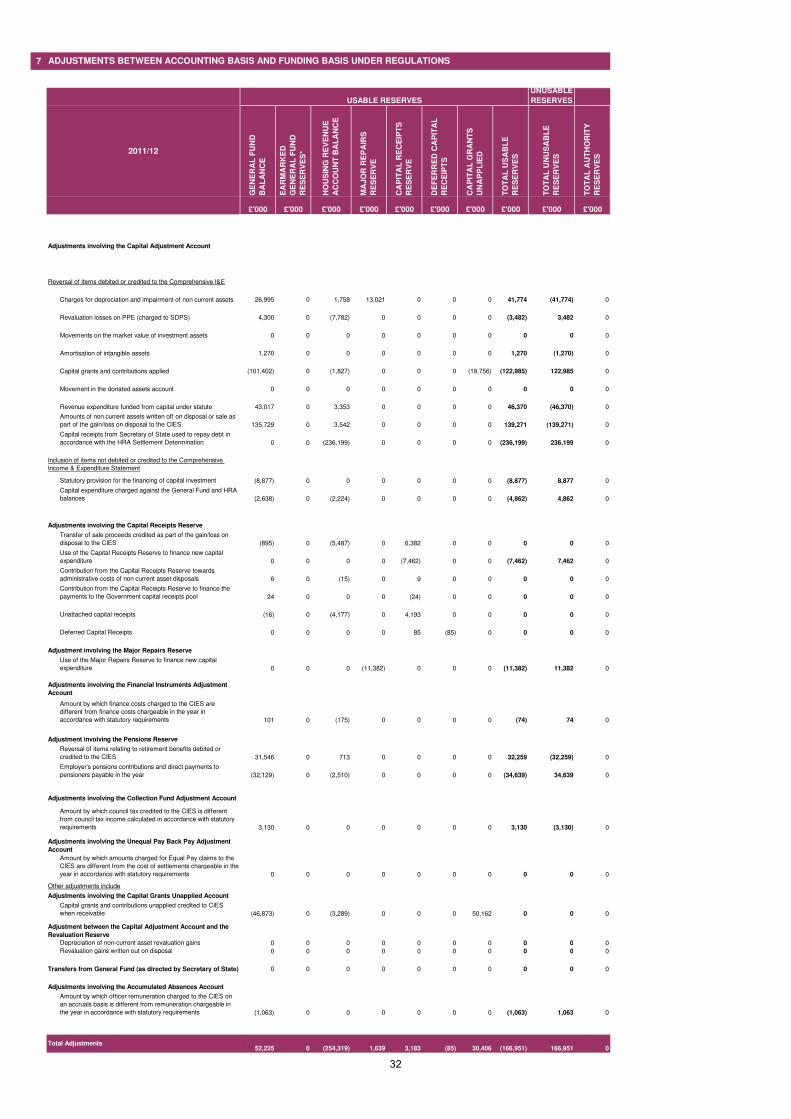
7
GE
NE
RA
L F
UN
D
BA
LA
NC
E
EA
RM
AR
KE
D
GE
NE
RA
L F
UN
D
RE
SE
RV
ES
*
HO
US
ING
RE
VE
NU
E
AC
CO
UN
T B
AL
AN
CE
MA
JO
R R
EP
AIR
S
RE
SE
RV
E
CA
PIT
AL
RE
CE
IPT
S
RE
SE
RV
E
DE
FE
RR
ED
CA
PIT
AL
RE
CE
IPT
S
CA
PIT
AL
GR
AN
TS
UN
AP
PL
IED
TO
TA
L U
SA
BL
E
RE
SE
RV
ES
TO
TA
L U
NU
SA
BL
E
RE
SE
RV
ES
TO
TA
L A
UT
HO
RIT
Y
RE
SE
RV
ES
£'000 £'000 £'000 £'000 £'000 £'000 £'000 £'000 £'000 £'000
Adjustments involving the Capital Adjustment Account
Reversal of items debited or credited to the Comprehensive I&E
Charges for depreciation and impairment of non current assets 26,995 0 1,758 13,021 0 0 0 41,774 (41,774) 0
Revaluation losses on PPE (charged to SDPS) 4,300 0 (7,782) 0 0 0 0 (3,482) 3,482 0
Movements on the market value of investment assets 0 0 0 0 0 0 0 0 0 0
Amortisation of intangible assets 1,270 0 0 0 0 0 0 1,270 (1,270) 0
Capital grants and contributions applied (101,402) 0 (1,827) 0 0 0 (19,756) (122,985) 122,985 0
Movement in the donated assets account 0 0 0 0 0 0 0 0 0 0
Revenue expenditure funded from capital under statute 43,017 0 3,353 0 0 0 0 46,370 (46,370) 0
Amounts of non current assets written off on disposal or sale as
part of the gain/loss on disposal to the CIES 135,729 0 3,542 0 0 0 0 139,271 (139,271) 0
Capital receipts from Secretary of State used to repay debt in
accordance with the HRA Settlement Determination 0 0 (236,199) 0 0 0 0 (236,199) 236,199 0
Statutory provision for the financing of capital investment (8,877) 0 0 0 0 0 0 (8,877) 8,877 0
Capital expenditure charged against the General Fund and HRA
balances (2,638) 0 (2,224) 0 0 0 0 (4,862) 4,862 0
Adjustments involving the Capital Receipts Reserve
Transfer of sale proceeds credited as part of the gain/loss on
disposal to the CIES (895) 0 (5,487) 0 6,382 0 0 0 0 0
Use of the Capital Receipts Reserve to finance new capital
expenditure 0 0 0 0 (7,462) 0 0 (7,462) 7,462 0
Contribution from the Capital Receipts Reserve towards
administrative costs of non current asset disposals 6 0 (15) 0 9 0 0 0 0 0
Contribution from the Capital Receipts Reserve to finance the
payments to the Government capital receipts pool 24 0 0 0 (24) 0 0 0 0 0
Unattached capital receipts (16) 0 (4,177) 0 4,193 0 0 0 0 0
Deferred Capital Receipts 0 0 0 0 85 (85) 0 0 0 0
Adjustment involving the Major Repairs Reserve
Use of the Major Repairs Reserve to finance new capital
expenditure 0 0 0 (11,382) 0 0 0 (11,382) 11,382 0
Amount by which finance costs charged to the CIES are
different from finance costs chargeable in the year in
accordance with statutory requirements 101 0 (175) 0 0 0 0 (74) 74 0
Adjustment involving the Pensions Reserve
Reversal of items relating to retirement benefits debited or
credited to the CIES 31,546 0 713 0 0 0 0 32,259 (32,259) 0
Employer's pensions contributions and direct payments to
pensioners payable in the year (32,129) 0 (2,510) 0 0 0 0 (34,639) 34,639 0
Amount by which council tax credited to the CIES is different
from council tax income calculated in accordance with statutory
requirements 3,130 0 0 0 0 0 0 3,130 (3,130) 0
Amount by which amounts charged for Equal Pay claims to the
CIES are different from the cost of settlements chargeable in the
year in accordance with statutory requirements 0 0 0 0 0 0 0 0 0 0
Other adjustments include
Adjustments involving the Capital Grants Unapplied Account
Capital grants and contributions unapplied credited to CIES
when receivable (46,873) 0 (3,289) 0 0 0 50,162 0 0 0
Depreciation of non-current asset revaluation gains 0 0 0 0 0 0 0 0 0 0
Revaluation gains written out on disposal 0 0 0 0 0 0 0 0 0 0
0 0 0 0 0 0 0 0 0 0
Amount by which officer remuneration charged to the CIES on
an accruals basis is different from remuneration chargeable in
the year in accordance with statutory requirements (1,063) 0 0 0 0 0 0 (1,063) 1,063 0
52,225 0 (254,319) 1,639 3,183 (85) 30,406 (166,951) 166,951 0
Inclusion of items not debited or credited to the Comprehensive
Income & Expenditure Statement
UNUSABLE
RESERVES
Adjustments involving the Accumulated Absences Account
ADJUSTMENTS BETWEEN ACCOUNTING BASIS AND FUNDING BASIS UNDER REGULATIONS
Total Adjustments
2011/12
USABLE RESERVES
Adjustments involving the Unequal Pay Back Pay Adjustment
Account
Adjustment between the Capital Adjustment Account and the
Revaluation Reserve
Adjustments involving the Financial Instruments Adjustment
Account
Adjustments involving the Collection Fund Adjustment Account
Transfers from General Fund (as directed by Secretary of State)
32
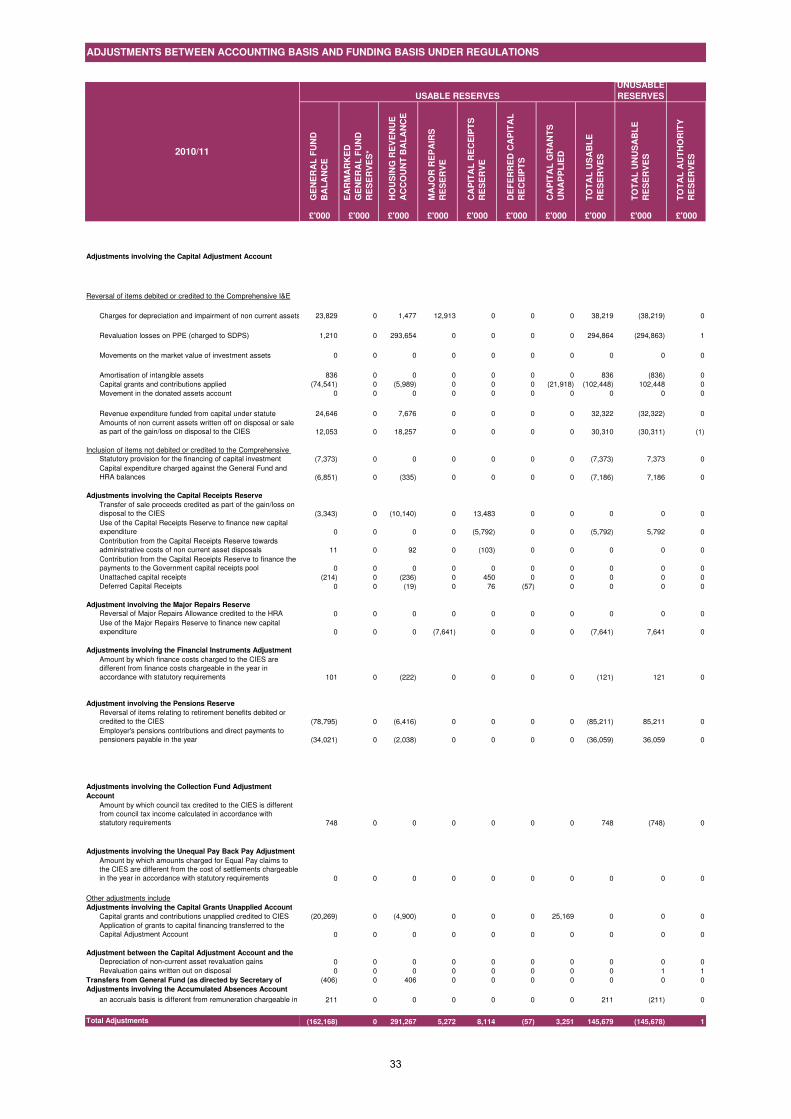
GE
NE
RA
L F
UN
D
BA
LA
NC
E
EA
RM
AR
KE
D
GE
NE
RA
L F
UN
D
RE
SE
RV
ES
*
HO
US
ING
RE
VE
NU
E
AC
CO
UN
T B
AL
AN
CE
MA
JO
R R
EP
AIR
S
RE
SE
RV
E
CA
PIT
AL
RE
CE
IPT
S
RE
SE
RV
E
DE
FE
RR
ED
CA
PIT
AL
RE
CE
IPT
S
CA
PIT
AL
GR
AN
TS
UN
AP
PL
IED
TO
TA
L U
SA
BL
E
RE
SE
RV
ES
TO
TA
L U
NU
SA
BL
E
RE
SE
RV
ES
TO
TA
L A
UT
HO
RIT
Y
RE
SE
RV
ES
£'000 £'000 £'000 £'000 £'000 £'000 £'000 £'000 £'000 £'000
Adjustments involving the Capital Adjustment Account
Reversal of items debited or credited to the Comprehensive I&E
Charges for depreciation and impairment of non current assets 23,829 0 1,477 12,913 0 0 0 38,219 (38,219) 0
Revaluation losses on PPE (charged to SDPS) 1,210 0 293,654 0 0 0 0 294,864 (294,863) 1
Movements on the market value of investment assets 0 0 0 0 0 0 0 0 0 0
Amortisation of intangible assets 836 0 0 0 0 0 0 836 (836) 0
Capital grants and contributions applied (74,541) 0 (5,989) 0 0 0 (21,918) (102,448) 102,448 0
Movement in the donated assets account 0 0 0 0 0 0 0 0 0 0
Revenue expenditure funded from capital under statute 24,646 0 7,676 0 0 0 0 32,322 (32,322) 0
Amounts of non current assets written off on disposal or sale
as part of the gain/loss on disposal to the CIES 12,053 0 18,257 0 0 0 0 30,310 (30,311) (1)
Statutory provision for the financing of capital investment (7,373) 0 0 0 0 0 0 (7,373) 7,373 0
Capital expenditure charged against the General Fund and
HRA balances (6,851) 0 (335) 0 0 0 0 (7,186) 7,186 0
Adjustments involving the Capital Receipts Reserve
Transfer of sale proceeds credited as part of the gain/loss on
disposal to the CIES (3,343) 0 (10,140) 0 13,483 0 0 0 0 0
Use of the Capital Receipts Reserve to finance new capital
expenditure 0 0 0 0 (5,792) 0 0 (5,792) 5,792 0
Contribution from the Capital Receipts Reserve towards
administrative costs of non current asset disposals 11 0 92 0 (103) 0 0 0 0 0
Contribution from the Capital Receipts Reserve to finance the
payments to the Government capital receipts pool 0 0 0 0 0 0 0 0 0 0
Unattached capital receipts (214) 0 (236) 0 450 0 0 0 0 0
Deferred Capital Receipts 0 0 (19) 0 76 (57) 0 0 0 0
Adjustment involving the Major Repairs Reserve
Reversal of Major Repairs Allowance credited to the HRA 0 0 0 0 0 0 0 0 0 0
Use of the Major Repairs Reserve to finance new capital
expenditure 0 0 0 (7,641) 0 0 0 (7,641) 7,641 0
Amount by which finance costs charged to the CIES are
different from finance costs chargeable in the year in
accordance with statutory requirements 101 0 (222) 0 0 0 0 (121) 121 0
Adjustment involving the Pensions Reserve
Reversal of items relating to retirement benefits debited or
credited to the CIES (78,795) 0 (6,416) 0 0 0 0 (85,211) 85,211 0
Employer's pensions contributions and direct payments to
pensioners payable in the year (34,021) 0 (2,038) 0 0 0 0 (36,059) 36,059 0
Amount by which council tax credited to the CIES is different
from council tax income calculated in accordance with
statutory requirements 748 0 0 0 0 0 0 748 (748) 0
Amount by which amounts charged for Equal Pay claims to
the CIES are different from the cost of settlements chargeable
in the year in accordance with statutory requirements 0 0 0 0 0 0 0 0 0 0
Other adjustments include
Adjustments involving the Capital Grants Unapplied Account
Capital grants and contributions unapplied credited to CIES (20,269) 0 (4,900) 0 0 0 25,169 0 0 0
Application of grants to capital financing transferred to the
Capital Adjustment Account 0 0 0 0 0 0 0 0 0 0
Depreciation of non-current asset revaluation gains 0 0 0 0 0 0 0 0 0 0
Revaluation gains written out on disposal 0 0 0 0 0 0 0 0 1 1
(406) 0 406 0 0 0 0 0 0 0
Amount by which officer remuneration charged to the CIES on
an accruals basis is different from remuneration chargeable in 211 0 0 0 0 0 0 211 (211) 0
(162,168) 0 291,267 5,272 8,114 (57) 3,251 145,679 (145,678) 1
Adjustments involving the Accumulated Absences Account
Total Adjustments
ADJUSTMENTS BETWEEN ACCOUNTING BASIS AND FUNDING BASIS UNDER REGULATIONS
2010/11
USABLE RESERVES
UNUSABLE
RESERVES
Inclusion of items not debited or credited to the Comprehensive
Adjustments involving the Financial Instruments Adjustment
Adjustments involving the Collection Fund Adjustment
Account
Adjustments involving the Unequal Pay Back Pay Adjustment
Adjustment between the Capital Adjustment Account and the
Transfers from General Fund (as directed by Secretary of
33
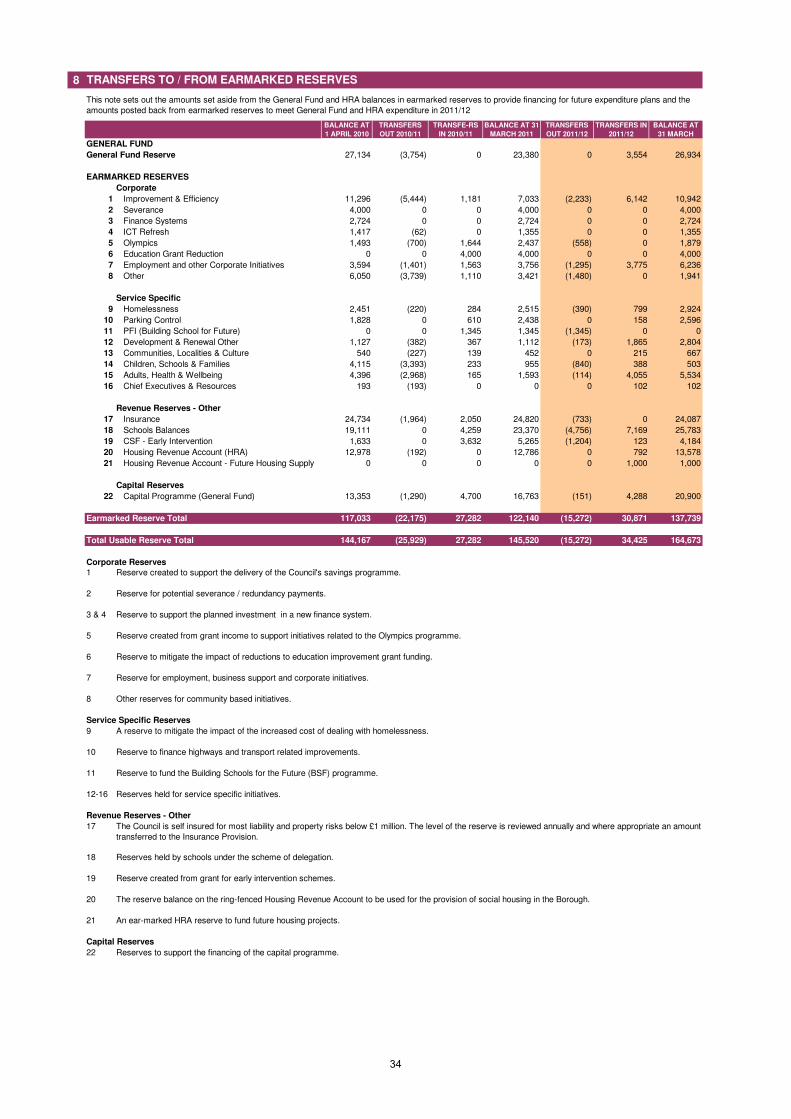
8
BALANCE AT
1 APRIL 2010
TRANSFERS
OUT 2010/11
TRANSFE-RS
IN 2010/11
BALANCE AT 31
MARCH 2011
TRANSFERS
OUT 2011/12
TRANSFERS IN
2011/12
BALANCE AT
31 MARCH
GENERAL FUND
General Fund Reserve 27,134 (3,754) 0 23,380 0 3,554 26,934
EARMARKED RESERVES
Corporate
1 Improvement & Efficiency 11,296 (5,444) 1,181 7,033 (2,233) 6,142 10,942
2 Severance 4,000 0 0 4,000 0 0 4,000
3 Finance Systems 2,724 0 0 2,724 0 0 2,724
4 ICT Refresh 1,417 (62) 0 1,355 0 0 1,355
5 Olympics 1,493 (700) 1,644 2,437 (558) 0 1,879
6 Education Grant Reduction 0 0 4,000 4,000 0 0 4,000
7 Employment and other Corporate Initiatives 3,594 (1,401) 1,563 3,756 (1,295) 3,775 6,236
8 Other 6,050 (3,739) 1,110 3,421 (1,480) 0 1,941
Service Specific
9 Homelessness 2,451 (220) 284 2,515 (390) 799 2,924
10 Parking Control 1,828 0 610 2,438 0 158 2,596
11 PFI (Building School for Future) 0 0 1,345 1,345 (1,345) 0 0
12 Development & Renewal Other 1,127 (382) 367 1,112 (173) 1,865 2,804
13 Communities, Localities & Culture 540 (227) 139 452 0 215 667
14 Children, Schools & Families 4,115 (3,393) 233 955 (840) 388 503
15 Adults, Health & Wellbeing 4,396 (2,968) 165 1,593 (114) 4,055 5,534
16 Chief Executives & Resources 193 (193) 0 0 0 102 102
Revenue Reserves - Other
17 Insurance 24,734 (1,964) 2,050 24,820 (733) 0 24,087
18 Schools Balances 19,111 0 4,259 23,370 (4,756) 7,169 25,783
19 CSF - Early Intervention 1,633 0 3,632 5,265 (1,204) 123 4,184
20 Housing Revenue Account (HRA) 12,978 (192) 0 12,786 0 792 13,578
21 Housing Revenue Account - Future Housing Supply 0 0 0 0 0 1,000 1,000
Capital Reserves
22 Capital Programme (General Fund) 13,353 (1,290) 4,700 16,763 (151) 4,288 20,900
Earmarked Reserve Total 117,033 (22,175) 27,282 122,140 (15,272) 30,871 137,739
0 117,033 0 0 122,140
Total Usable Reserve Total 144,167 (25,929) 27,282 145,520 (15,272) 34,425 164,673
Corporate Reserves
1
2
3 & 4
5
6
7
8
9
10
11
12-16
17
18 Reserves held by schools under the scheme of delegation.
19 Reserve created from grant for early intervention schemes.
20
21
Capital Reserves
22
Reserve to mitigate the impact of reductions to education improvement grant funding.
Revenue Reserves - Other
Reserve to fund the Building Schools for the Future (BSF) programme.
A reserve to mitigate the impact of the increased cost of dealing with homelessness.
Reserve for employment, business support and corporate initiatives.
Other reserves for community based initiatives.
Reserve to finance highways and transport related improvements.
An ear-marked HRA reserve to fund future housing projects.
Reserves to support the financing of the capital programme.
Reserves held for service specific initiatives.
TRANSFERS TO / FROM EARMARKED RESERVES
This note sets out the amounts set aside from the General Fund and HRA balances in earmarked reserves to provide financing for future expenditure plans and the
amounts posted back from earmarked reserves to meet General Fund and HRA expenditure in 2011/12
The Council is self insured for most liability and property risks below £1 million. The level of the reserve is reviewed annually and where appropriate an amount
transferred to the Insurance Provision.
Reserve created to support the delivery of the Council's savings programme.
Service Specific Reserves
The reserve balance on the ring-fenced Housing Revenue Account to be used for the provision of social housing in the Borough.
Reserve for potential severance / redundancy payments.
Reserve to support the planned investment in a new finance system.
Reserve created from grant income to support initiatives related to the Olympics programme.
34
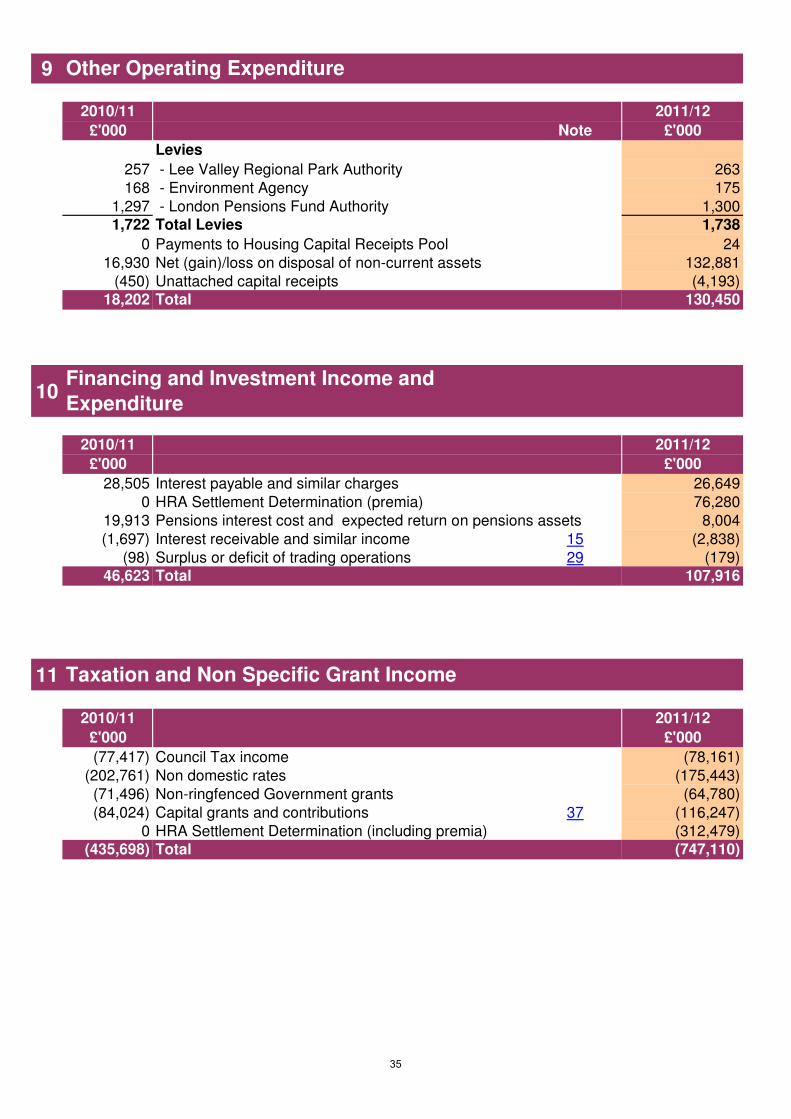
9
2010/11 2011/12
£'000 Note £'000
Levies
257 - Lee Valley Regional Park Authority 263
168 - Environment Agency 175
1,297 - London Pensions Fund Authority 1,300
1,722 Total Levies 1,738
0 Payments to Housing Capital Receipts Pool 24
16,930 Net (gain)/loss on disposal of non-current assets 132,881
(450) Unattached capital receipts (4,193)
18,202 Total 130,450
10
2010/11 2011/12
£'000 £'000
28,505 Interest payable and similar charges 26,649
0 HRA Settlement Determination (premia) 76,280
19,913 Pensions interest cost and expected return on pensions assets 8,004
(1,697) Interest receivable and similar income 15 (2,838)
(98) Surplus or deficit of trading operations 29 (179)
46,623 Total 107,916
11
2010/11 2011/12
£'000 £'000
(77,417) Council Tax income (78,161)
(202,761) Non domestic rates (175,443)
(71,496) Non-ringfenced Government grants (64,780)
(84,024) Capital grants and contributions 37 (116,247)
0 HRA Settlement Determination (including premia) (312,479)
(435,698) Total (747,110)
Financing and Investment Income and
Expenditure
Taxation and Non Specific Grant Income
Other Operating Expenditure
35
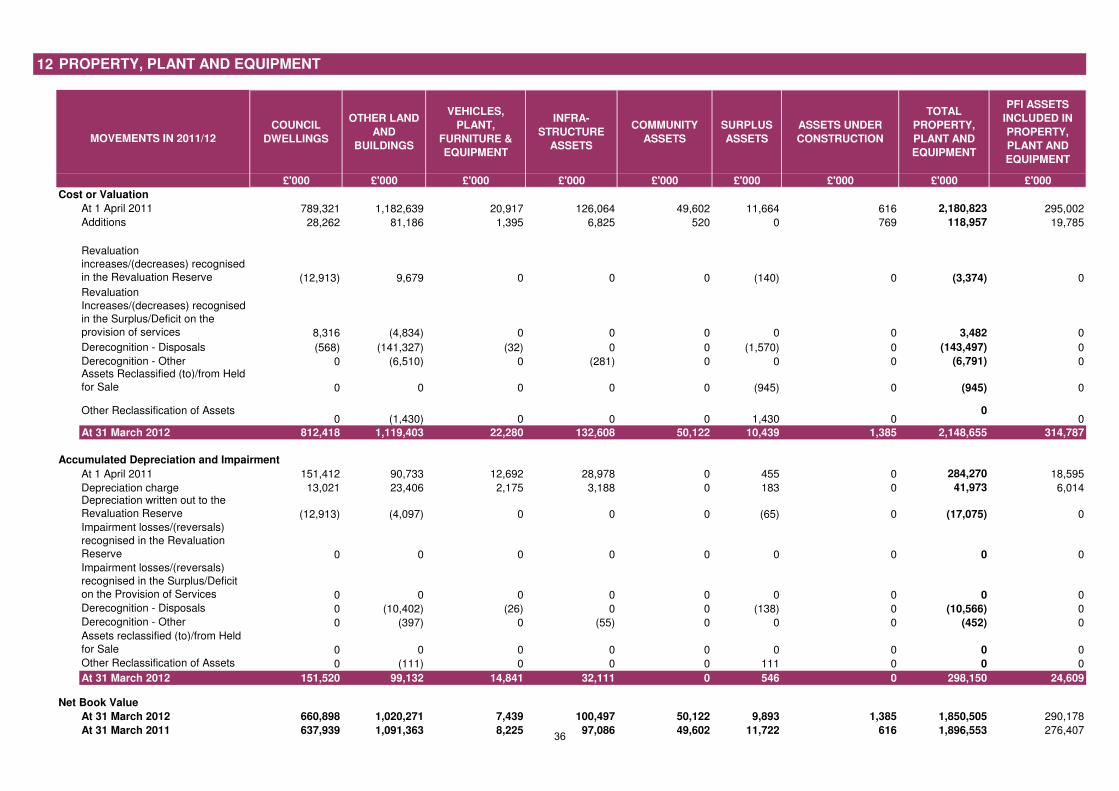
12
COUNCIL
DWELLINGS
OTHER LAND
AND
BUILDINGS
VEHICLES,
PLANT,
FURNITURE &
EQUIPMENT
INFRA-
STRUCTURE
ASSETS
COMMUNITY
ASSETS
SURPLUS
ASSETS
ASSETS UNDER
CONSTRUCTION
TOTAL
PROPERTY,
PLANT AND
EQUIPMENT
PFI ASSETS
INCLUDED IN
PROPERTY,
PLANT AND
EQUIPMENT
£'000 £'000 £'000 £'000 £'000 £'000 £'000 £'000 £'000
Cost or Valuation
At 1 April 2011 789,321 1,182,639 20,917 126,064 49,602 11,664 616 2,180,823 295,002
Additions 28,262 81,186 1,395 6,825 520 0 769 118,957 19,785
Revaluation
increases/(decreases) recognised
in the Revaluation Reserve (12,913) 9,679 0 0 0 (140) 0 (3,374) 0
Revaluation
Increases/(decreases) recognised
in the Surplus/Deficit on the
provision of services 8,316 (4,834) 0 0 0 0 0 3,482 0
Derecognition - Disposals (568) (141,327) (32) 0 0 (1,570) 0 (143,497) 0
Derecognition - Other 0 (6,510) 0 (281) 0 0 0 (6,791) 0Assets Reclassified (to)/from Held
for Sale 0 0 0 0 0 (945) 0 (945) 0
Other Reclassification of Assets0 (1,430) 0 0 0 1,430 0
00
At 31 March 2012 812,418 1,119,403 22,280 132,608 50,122 10,439 1,385 2,148,655 314,787
Accumulated Depreciation and Impairment
At 1 April 2011 151,412 90,733 12,692 28,978 0 455 0 284,270 18,595
Depreciation charge 13,021 23,406 2,175 3,188 0 183 0 41,973 6,014Depreciation written out to the
Revaluation Reserve (12,913) (4,097) 0 0 0 (65) 0 (17,075) 0
Impairment losses/(reversals)
recognised in the Revaluation
Reserve 0 0 0 0 0 0 0 0 0
Impairment losses/(reversals)
recognised in the Surplus/Deficit
on the Provision of Services 0 0 0 0 0 0 0 0 0
Derecognition - Disposals 0 (10,402) (26) 0 0 (138) 0 (10,566) 0
Derecognition - Other 0 (397) 0 (55) 0 0 0 (452) 0
Assets reclassified (to)/from Held
for Sale 0 0 0 0 0 0 0 0 0
Other Reclassification of Assets 0 (111) 0 0 0 111 0 0 0
At 31 March 2012 151,520 99,132 14,841 32,111 0 546 0 298,150 24,609
Net Book Value
At 31 March 2012 660,898 1,020,271 7,439 100,497 50,122 9,893 1,385 1,850,505 290,178
At 31 March 2011 637,939 1,091,363 8,225 97,086 49,602 11,722 616 1,896,553 276,407
PROPERTY, PLANT AND EQUIPMENT
MOVEMENTS IN 2011/12
36
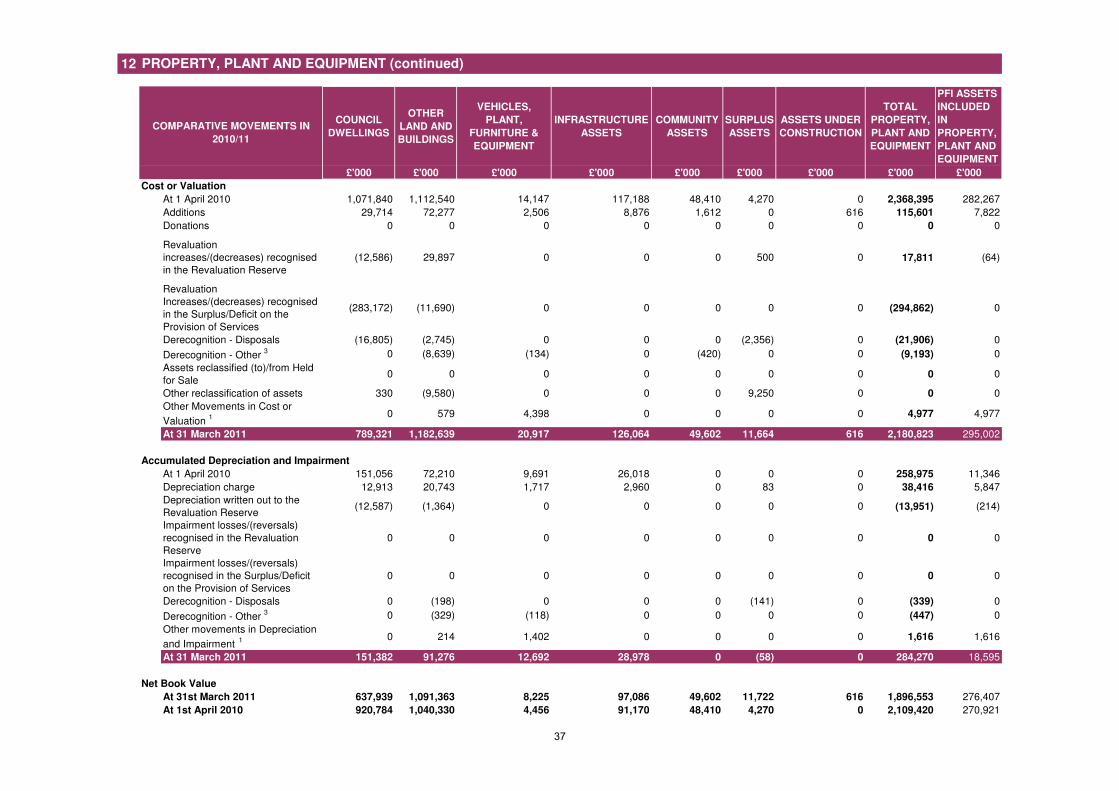
12
COUNCIL
DWELLINGS
OTHER
LAND AND
BUILDINGS
VEHICLES,
PLANT,
FURNITURE &
EQUIPMENT
INFRASTRUCTURE
ASSETS
COMMUNITY
ASSETS
SURPLUS
ASSETS
ASSETS UNDER
CONSTRUCTION
TOTAL
PROPERTY,
PLANT AND
EQUIPMENT
PFI ASSETS
INCLUDED
IN
PROPERTY,
PLANT AND
EQUIPMENT
£'000 £'000 £'000 £'000 £'000 £'000 £'000 £'000 £'000
Cost or Valuation
At 1 April 2010 1,071,840 1,112,540 14,147 117,188 48,410 4,270 0 2,368,395 282,267
Additions 29,714 72,277 2,506 8,876 1,612 0 616 115,601 7,822
Donations 0 0 0 0 0 0 0 0 0
Revaluation
increases/(decreases) recognised
in the Revaluation Reserve
(12,586) 29,897 0 0 0 500 0 17,811 (64)
Revaluation
Increases/(decreases) recognised
in the Surplus/Deficit on the
Provision of Services
(283,172) (11,690) 0 0 0 0 0 (294,862) 0
Derecognition - Disposals (16,805) (2,745) 0 0 0 (2,356) 0 (21,906) 0
Derecognition - Other 3 0 (8,639) (134) 0 (420) 0 0 (9,193) 0
Assets reclassified (to)/from Held
for Sale0 0 0 0 0 0 0 0 0
Other reclassification of assets 330 (9,580) 0 0 0 9,250 0 0 0
Other Movements in Cost or
Valuation 1 0 579 4,398 0 0 0 0 4,977 4,977
At 31 March 2011 789,321 1,182,639 20,917 126,064 49,602 11,664 616 2,180,823 295,002
Accumulated Depreciation and Impairment
At 1 April 2010 151,056 72,210 9,691 26,018 0 0 0 258,975 11,346
Depreciation charge 12,913 20,743 1,717 2,960 0 83 0 38,416 5,847
Depreciation written out to the
Revaluation Reserve(12,587) (1,364) 0 0 0 0 0 (13,951) (214)
Impairment losses/(reversals)
recognised in the Revaluation
Reserve
0 0 0 0 0 0 0 0 0
Impairment losses/(reversals)
recognised in the Surplus/Deficit
on the Provision of Services
0 0 0 0 0 0 0 0 0
Derecognition - Disposals 0 (198) 0 0 0 (141) 0 (339) 0
Derecognition - Other 3 0 (329) (118) 0 0 0 0 (447) 0
Other movements in Depreciation
and Impairment 1 0 214 1,402 0 0 0 0 1,616 1,616
At 31 March 2011 151,382 91,276 12,692 28,978 0 (58) 0 284,270 18,595
Net Book Value
At 31st March 2011 637,939 1,091,363 8,225 97,086 49,602 11,722 616 1,896,553 276,407
At 1st April 2010 920,784 1,040,330 4,456 91,170 48,410 4,270 0 2,109,420 270,921
COMPARATIVE MOVEMENTS IN
2010/11
PROPERTY, PLANT AND EQUIPMENT (continued)
37
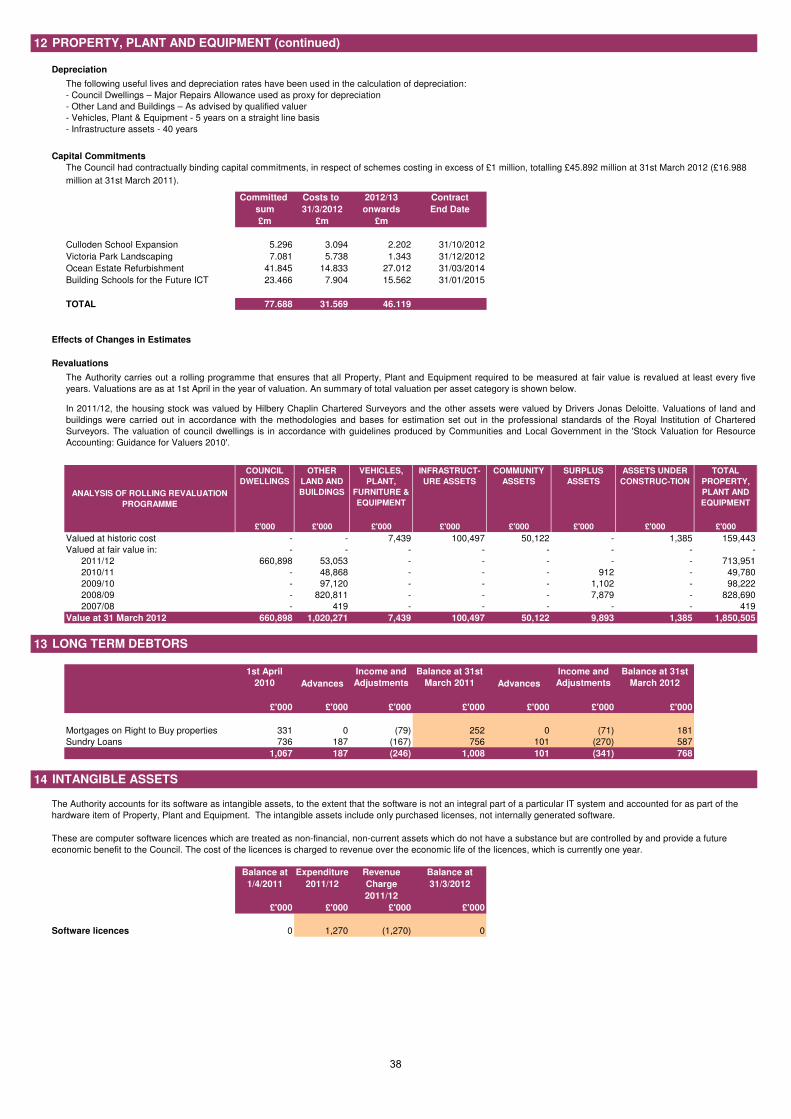
12
Depreciation
Capital Commitments
Committed Costs to 2012/13 Contract
sum 31/3/2012 onwards End Date
£m £m £m
Culloden School Expansion 5.296 3.094 2.202 31/10/2012
Victoria Park Landscaping 7.081 5.738 1.343 31/12/2012
Ocean Estate Refurbishment 41.845 14.833 27.012 31/03/2014
Building Schools for the Future ICT 23.466 7.904 15.562 31/01/2015
TOTAL 77.688 31.569 46.119
Effects of Changes in Estimates
Revaluations
COUNCIL
DWELLINGS
OTHER
LAND AND
BUILDINGS
VEHICLES,
PLANT,
FURNITURE &
EQUIPMENT
INFRASTRUCT-
URE ASSETS
COMMUNITY
ASSETS
SURPLUS
ASSETS
ASSETS UNDER
CONSTRUC-TION
TOTAL
PROPERTY,
PLANT AND
EQUIPMENT
£'000 £'000 £'000 £'000 £'000 £'000 £'000 £'000
Valued at historic cost - - 7,439 100,497 50,122 - 1,385 159,443
Valued at fair value in: - - - - - - - -
2011/12 660,898 53,053 - - - - - 713,951
2010/11 - 48,868 - - - 912 - 49,780
2009/10 - 97,120 - - - 1,102 - 98,222
2008/09 - 820,811 - - - 7,879 - 828,690
2007/08 - 419 - - - - - 419
Value at 31 March 2012 660,898 1,020,271 7,439 100,497 50,122 9,893 1,385 1,850,505
13
Balance at
1st April
2010 Advances
Income and
Adjustments
Balance at 31st
March 2011 Advances
Income and
Adjustments
Balance at 31st
March 2012
£'000 £'000 £'000 £'000 £'000 £'000 £'000
Mortgages on Right to Buy properties 331 0 (79) 252 0 (71) 181
Sundry Loans 736 187 (167) 756 101 (270) 587
1,067 187 (246) 1,008 101 (341) 768
14
Balance at Expenditure Revenue Balance at
1/4/2011 2011/12 Charge 31/3/2012
2011/12
£'000 £'000 £'000 £'000
Software licences 0 1,270 (1,270) 0
These are computer software licences which are treated as non-financial, non-current assets which do not have a substance but are controlled by and provide a future
economic benefit to the Council. The cost of the licences is charged to revenue over the economic life of the licences, which is currently one year.
LONG TERM DEBTORS
The Authority accounts for its software as intangible assets, to the extent that the software is not an integral part of a particular IT system and accounted for as part of the
hardware item of Property, Plant and Equipment. The intangible assets include only purchased licenses, not internally generated software.
The Council had contractually binding capital commitments, in respect of schemes costing in excess of £1 million, totalling £45.892 million at 31st March 2012 (£16.988
million at 31st March 2011).
The Authority carries out a rolling programme that ensures that all Property, Plant and Equipment required to be measured at fair value is revalued at least every five
years. Valuations are as at 1st April in the year of valuation. An summary of total valuation per asset category is shown below.
PROPERTY, PLANT AND EQUIPMENT (continued)
The following useful lives and depreciation rates have been used in the calculation of depreciation:
- Council Dwellings – Major Repairs Allowance used as proxy for depreciation
- Other Land and Buildings – As advised by qualified valuer
- Vehicles, Plant & Equipment - 5 years on a straight line basis
- Infrastructure assets - 40 years
ANALYSIS OF ROLLING REVALUATION
PROGRAMME
INTANGIBLE ASSETS
In 2011/12, the housing stock was valued by Hilbery Chaplin Chartered Surveyors and the other assets were valued by Drivers Jonas Deloitte. Valuations of land and
buildings were carried out in accordance with the methodologies and bases for estimation set out in the professional standards of the Royal Institution of Chartered
Surveyors. The valuation of council dwellings is in accordance with guidelines produced by Communities and Local Government in the 'Stock Valuation for Resource
Accounting: Guidance for Valuers 2010'.
38
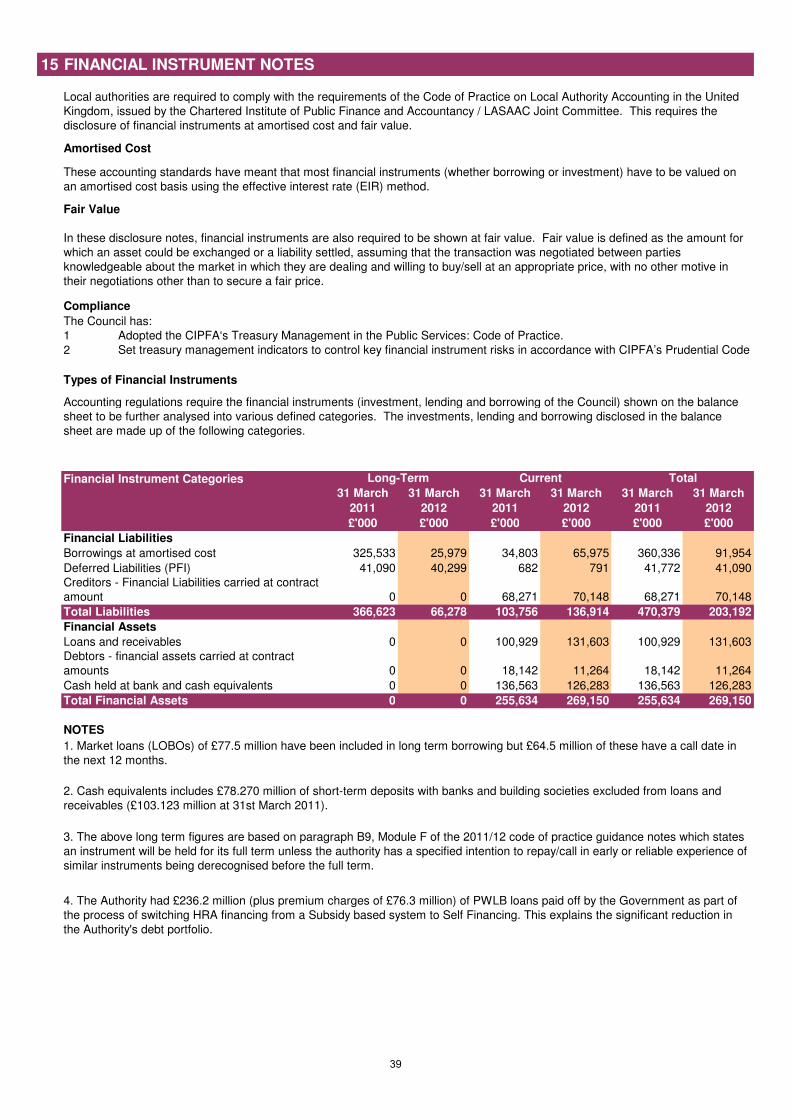
15 FINANCIAL INSTRUMENT NOTES
1
2
31 March 31 March 31 March 31 March 31 March 31 March
2011 2012 2011 2012 2011 2012
£'000 £'000 £'000 £'000 £'000 £'000
Financial Liabilities
Borrowings at amortised cost 325,533 25,979 34,803 65,975 360,336 91,954
Deferred Liabilities (PFI) 41,090 40,299 682 791 41,772 41,090
0 0 68,271 70,148 68,271 70,148
Total Liabilities 366,623 66,278 103,756 136,914 470,379 203,192
Financial Assets
Loans and receivables 0 0 100,929 131,603 100,929 131,603
0 0 18,142 11,264 18,142 11,264
Cash held at bank and cash equivalents 0 0 136,563 126,283 136,563 126,283
Total Financial Assets 0 0 255,634 269,150 255,634 269,150
NOTES
4. The Authority had £236.2 million (plus premium charges of £76.3 million) of PWLB loans paid off by the Government as part of
the process of switching HRA financing from a Subsidy based system to Self Financing. This explains the significant reduction in
the Authority's debt portfolio.
Creditors - Financial Liabilities carried at contract
amount
2. Cash equivalents includes £78.270 million of short-term deposits with banks and building societies excluded from loans and
receivables (£103.123 million at 31st March 2011).
Current Total
1. Market loans (LOBOs) of £77.5 million have been included in long term borrowing but £64.5 million of these have a call date in
the next 12 months.
Financial Instrument Categories
Compliance
3. The above long term figures are based on paragraph B9, Module F of the 2011/12 code of practice guidance notes which states
an instrument will be held for its full term unless the authority has a specified intention to repay/call in early or reliable experience of
similar instruments being derecognised before the full term.
Local authorities are required to comply with the requirements of the Code of Practice on Local Authority Accounting in the United
Kingdom, issued by the Chartered Institute of Public Finance and Accountancy / LASAAC Joint Committee. This requires the
disclosure of financial instruments at amortised cost and fair value.
These accounting standards have meant that most financial instruments (whether borrowing or investment) have to be valued on
an amortised cost basis using the effective interest rate (EIR) method.
In these disclosure notes, financial instruments are also required to be shown at fair value. Fair value is defined as the amount for
which an asset could be exchanged or a liability settled, assuming that the transaction was negotiated between parties
knowledgeable about the market in which they are dealing and willing to buy/sell at an appropriate price, with no other motive in
their negotiations other than to secure a fair price.
Accounting regulations require the financial instruments (investment, lending and borrowing of the Council) shown on the balance
sheet to be further analysed into various defined categories. The investments, lending and borrowing disclosed in the balance
sheet are made up of the following categories.
The Council has:
Adopted the CIPFA‘s Treasury Management in the Public Services: Code of Practice.
Set treasury management indicators to control key financial instrument risks in accordance with CIPFA’s Prudential Code
Types of Financial Instruments
Amortised Cost
Fair Value
Long-Term
Debtors - financial assets carried at contract
amounts
39
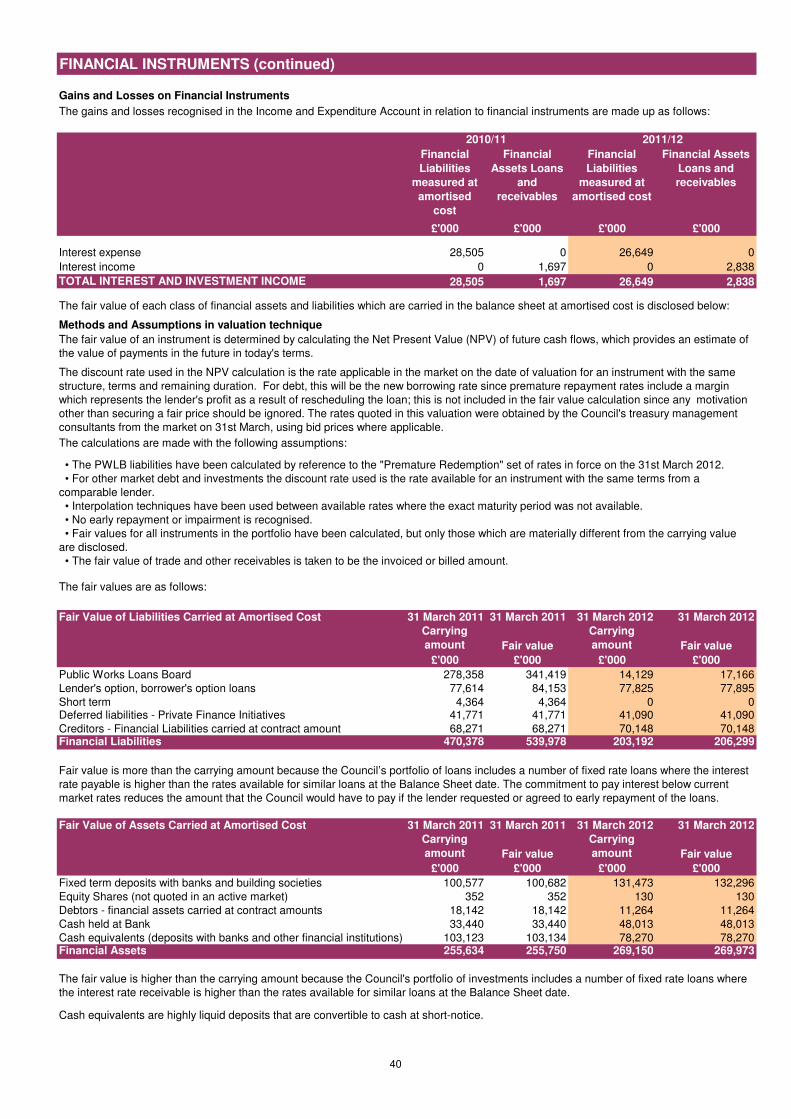
16 FINANCIAL INSTRUMENTS (continued)
Gains and Losses on Financial Instruments
Financial
Liabilities
measured at
amortised
cost
Financial
Assets Loans
and
receivables
Financial
Liabilities
measured at
amortised cost
Financial Assets
Loans and
receivables
£'000 £'000 £'000 £'000
Interest expense 28,505 0 26,649 0
Interest income 0 1,697 0 2,838
TOTAL INTEREST AND INVESTMENT INCOME 28,505 1,697 26,649 2,838
31 March 2011 31 March 2011 31 March 2012 31 March 2012
Carrying
amount Fair value
Carrying
amount Fair value
£'000 £'000 £'000 £'000
278,358 341,419 14,129 17,166
Lender's option, borrower's option loans 77,614 84,153 77,825 77,895
Short term 4,364 4,364 0 041,771 41,771 41,090 41,090
68,271 68,271 70,148 70,148Financial Liabilities 470,378 539,978 203,192 206,299
31 March 2011 31 March 2011 31 March 2012 31 March 2012
Carrying
amount Fair value
Carrying
amount Fair value
£'000 £'000 £'000 £'000
Fixed term deposits with banks and building societies 100,577 100,682 131,473 132,296
Equity Shares (not quoted in an active market) 352 352 130 130
18,142 18,142 11,264 11,264
Cash held at Bank 33,440 33,440 48,013 48,013
Cash equivalents (deposits with banks and other financial institutions) 103,123 103,134 78,270 78,270Financial Assets 255,634 255,750 269,150 269,973
The fair value is higher than the carrying amount because the Council's portfolio of investments includes a number of fixed rate loans where
the interest rate receivable is higher than the rates available for similar loans at the Balance Sheet date.
Public Works Loans Board
The fair values are as follows:
Fair value is more than the carrying amount because the Council’s portfolio of loans includes a number of fixed rate loans where the interest
rate payable is higher than the rates available for similar loans at the Balance Sheet date. The commitment to pay interest below current
market rates reduces the amount that the Council would have to pay if the lender requested or agreed to early repayment of the loans.
Fair Value of Liabilities Carried at Amortised Cost
Deferred liabilities - Private Finance Initiatives
Fair Value of Assets Carried at Amortised Cost
Creditors - Financial Liabilities carried at contract amount
Debtors - financial assets carried at contract amounts
Cash equivalents are highly liquid deposits that are convertible to cash at short-notice.
The gains and losses recognised in the Income and Expenditure Account in relation to financial instruments are made up as follows:
2010/11 2011/12
The fair value of an instrument is determined by calculating the Net Present Value (NPV) of future cash flows, which provides an estimate of
the value of payments in the future in today's terms.
The discount rate used in the NPV calculation is the rate applicable in the market on the date of valuation for an instrument with the same
structure, terms and remaining duration. For debt, this will be the new borrowing rate since premature repayment rates include a margin
which represents the lender's profit as a result of rescheduling the loan; this is not included in the fair value calculation since any motivation
other than securing a fair price should be ignored. The rates quoted in this valuation were obtained by the Council's treasury management
consultants from the market on 31st March, using bid prices where applicable.
The fair value of each class of financial assets and liabilities which are carried in the balance sheet at amortised cost is disclosed below:
Methods and Assumptions in valuation technique
• Fair values for all instruments in the portfolio have been calculated, but only those which are materially different from the carrying value
are disclosed.
The calculations are made with the following assumptions:
• The fair value of trade and other receivables is taken to be the invoiced or billed amount.
• The PWLB liabilities have been calculated by reference to the "Premature Redemption" set of rates in force on the 31st March 2012.
• For other market debt and investments the discount rate used is the rate available for an instrument with the same terms from a
comparable lender.
• Interpolation techniques have been used between available rates where the exact maturity period was not available.
• No early repayment or impairment is recognised.
40
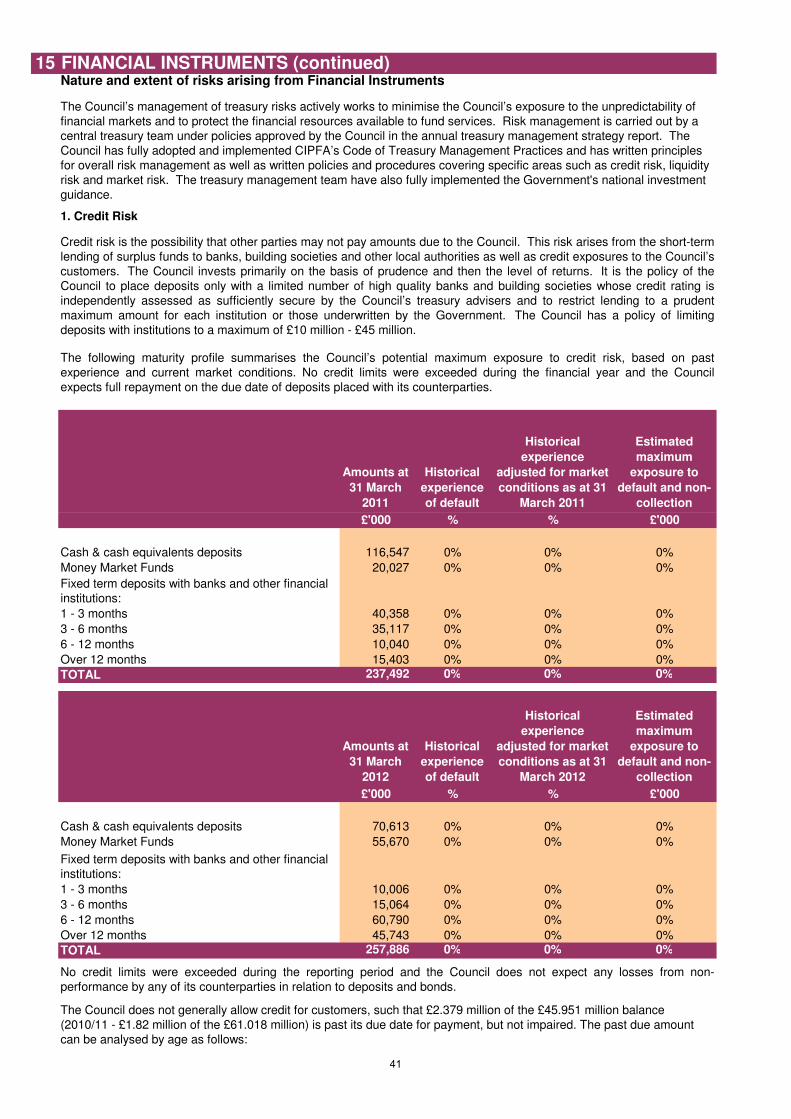
15 FINANCIAL INSTRUMENTS (continued)
1. Credit Risk
Amounts at
31 March
2011
Historical
experience
of default
Historical
experience
adjusted for market
conditions as at 31
March 2011
Estimated
maximum
exposure to
default and non-
collection
£'000 % % £'000
Cash & cash equivalents deposits 116,547 0% 0% 0%
Money Market Funds 20,027 0% 0% 0%
1 - 3 months 40,358 0% 0% 0%
3 - 6 months 35,117 0% 0% 0%
6 - 12 months 10,040 0% 0% 0%
Over 12 months 15,403 0% 0% 0%
TOTAL 237,492 0% 0% 0%
Amounts at
31 March
2012
Historical
experience
of default
Historical
experience
adjusted for market
conditions as at 31
March 2012
Estimated
maximum
exposure to
default and non-
collection
£'000 % % £'000
Cash & cash equivalents deposits 70,613 0% 0% 0%
Money Market Funds 55,670 0% 0% 0%
1 - 3 months 10,006 0% 0% 0%
3 - 6 months 15,064 0% 0% 0%
6 - 12 months 60,790 0% 0% 0%
Over 12 months 45,743 0% 0% 0%
TOTAL 257,886 0% 0% 0%
The Council does not generally allow credit for customers, such that £2.379 million of the £45.951 million balance
(2010/11 - £1.82 million of the £61.018 million) is past its due date for payment, but not impaired. The past due amount
can be analysed by age as follows:
Nature and extent of risks arising from Financial Instruments
Credit risk is the possibility that other parties may not pay amounts due to the Council. This risk arises from the short-term
lending of surplus funds to banks, building societies and other local authorities as well as credit exposures to the Council’s
customers. The Council invests primarily on the basis of prudence and then the level of returns. It is the policy of the
Council to place deposits only with a limited number of high quality banks and building societies whose credit rating is
independently assessed as sufficiently secure by the Council’s treasury advisers and to restrict lending to a prudent
maximum amount for each institution or those underwritten by the Government. The Council has a policy of limiting
deposits with institutions to a maximum of £10 million - £45 million.
The following maturity profile summarises the Council’s potential maximum exposure to credit risk, based on past
experience and current market conditions. No credit limits were exceeded during the financial year and the Council
expects full repayment on the due date of deposits placed with its counterparties.
No credit limits were exceeded during the reporting period and the Council does not expect any losses from non-
performance by any of its counterparties in relation to deposits and bonds.
The Council’s management of treasury risks actively works to minimise the Council’s exposure to the unpredictability of
financial markets and to protect the financial resources available to fund services. Risk management is carried out by a
central treasury team under policies approved by the Council in the annual treasury management strategy report. The
Council has fully adopted and implemented CIPFA’s Code of Treasury Management Practices and has written principles
for overall risk management as well as written policies and procedures covering specific areas such as credit risk, liquidity
risk and market risk. The treasury management team have also fully implemented the Government's national investment
guidance.
Fixed term deposits with banks and other financial
institutions:
Fixed term deposits with banks and other financial
institutions:
41
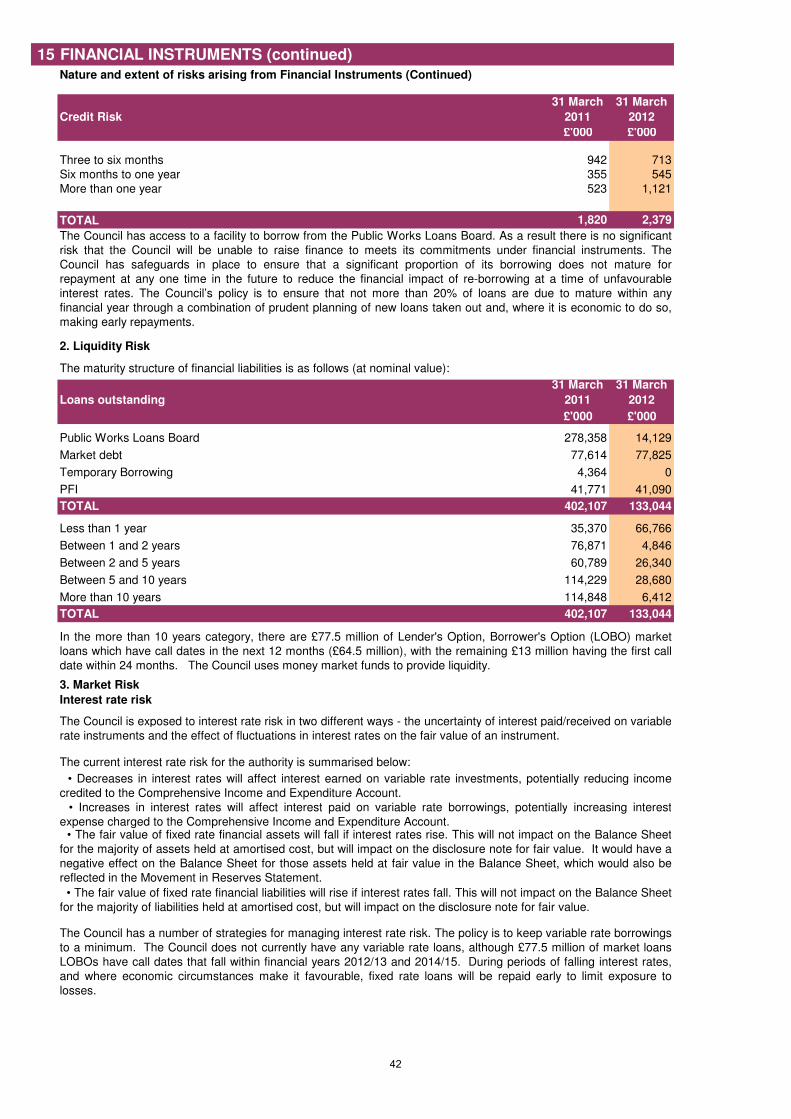
15 FINANCIAL INSTRUMENTS (continued)
Credit Risk
31 March
2011
31 March
2012
£'000 £'000
Three to six months 942 713
Six months to one year 355 545
More than one year 523 1,121
TOTAL 1,820 2,379
2. Liquidity Risk
The maturity structure of financial liabilities is as follows (at nominal value):
Loans outstanding
31 March
2011
31 March
2012
£'000 £'000
278,358 14,129
77,614 77,825
Temporary Borrowing 4,364 0
PFI 41,771 41,090
TOTAL 402,107 133,044
35,370 66,766
76,871 4,846
60,789 26,340
114,229 28,680
114,848 6,412
TOTAL 402,107 133,044
3. Market Risk
Interest rate risk
The current interest rate risk for the authority is summarised below:
The Council has a number of strategies for managing interest rate risk. The policy is to keep variable rate borrowings
to a minimum. The Council does not currently have any variable rate loans, although £77.5 million of market loans
LOBOs have call dates that fall within financial years 2012/13 and 2014/15. During periods of falling interest rates,
and where economic circumstances make it favourable, fixed rate loans will be repaid early to limit exposure to
losses.
Between 2 and 5 years
Between 5 and 10 years
More than 10 years
In the more than 10 years category, there are £77.5 million of Lender's Option, Borrower's Option (LOBO) market
loans which have call dates in the next 12 months (£64.5 million), with the remaining £13 million having the first call
date within 24 months. The Council uses money market funds to provide liquidity.
• The fair value of fixed rate financial liabilities will rise if interest rates fall. This will not impact on the Balance Sheet
for the majority of liabilities held at amortised cost, but will impact on the disclosure note for fair value.
The Council is exposed to interest rate risk in two different ways - the uncertainty of interest paid/received on variable
rate instruments and the effect of fluctuations in interest rates on the fair value of an instrument.
• Decreases in interest rates will affect interest earned on variable rate investments, potentially reducing income
credited to the Comprehensive Income and Expenditure Account.
• Increases in interest rates will affect interest paid on variable rate borrowings, potentially increasing interest
expense charged to the Comprehensive Income and Expenditure Account.• The fair value of fixed rate financial assets will fall if interest rates rise. This will not impact on the Balance Sheet
for the majority of assets held at amortised cost, but will impact on the disclosure note for fair value. It would have a
negative effect on the Balance Sheet for those assets held at fair value in the Balance Sheet, which would also be
reflected in the Movement in Reserves Statement.
Between 1 and 2 years
Nature and extent of risks arising from Financial Instruments (Continued)
The Council has access to a facility to borrow from the Public Works Loans Board. As a result there is no significant
risk that the Council will be unable to raise finance to meets its commitments under financial instruments. The
Council has safeguards in place to ensure that a significant proportion of its borrowing does not mature for
repayment at any one time in the future to reduce the financial impact of re-borrowing at a time of unfavourable
interest rates. The Council’s policy is to ensure that not more than 20% of loans are due to mature within any
financial year through a combination of prudent planning of new loans taken out and, where it is economic to do so,
making early repayments.
Public Works Loans Board
Market debt
Less than 1 year
42
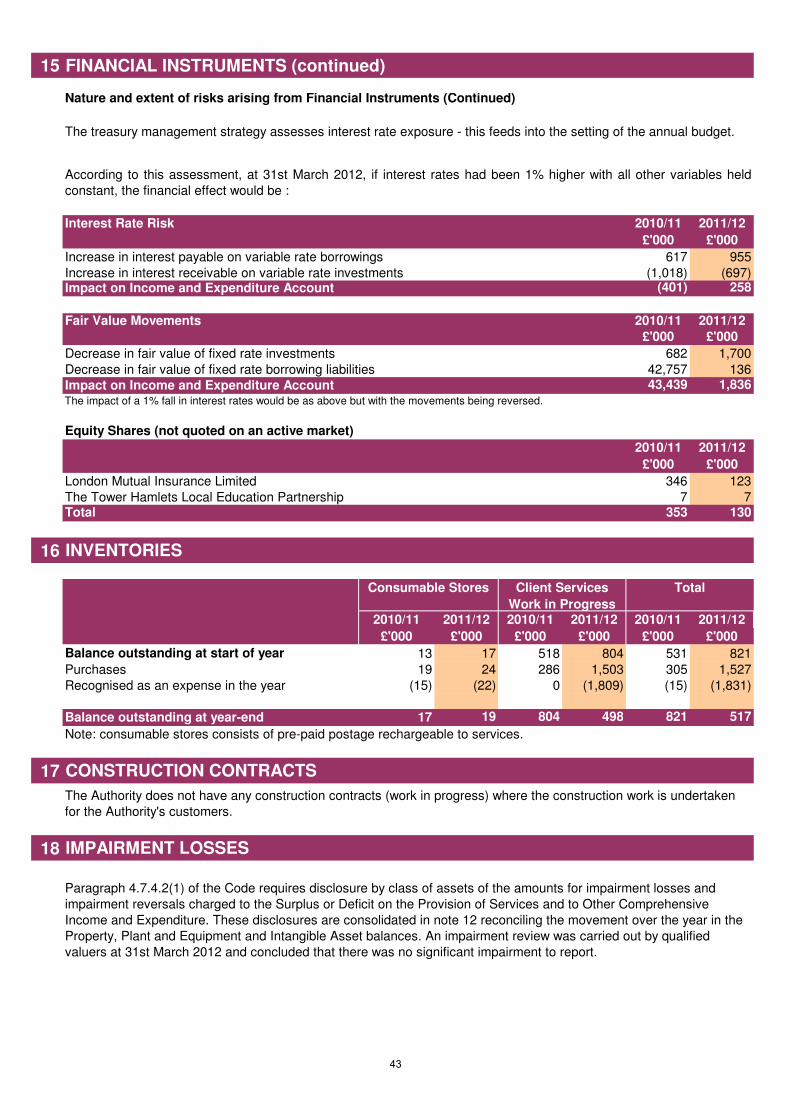
15 FINANCIAL INSTRUMENTS (continued)
2010/11 2011/12
£'000 £'000
Increase in interest payable on variable rate borrowings 617 955
Increase in interest receivable on variable rate investments (1,018) (697)(401) 258
2010/11 2011/12
£'000 £'000
Decrease in fair value of fixed rate investments 682 1,700
Decrease in fair value of fixed rate borrowing liabilities 42,757 13643,439 1,836
The impact of a 1% fall in interest rates would be as above but with the movements being reversed.
2010/11 2011/12
£'000 £'000
London Mutual Insurance Limited 346 123
The Tower Hamlets Local Education Partnership 7 7Total 353 130
16
2010/11 2011/12 2010/11 2011/12 2010/11 2011/12
£'000 £'000 £'000 £'000 £'000 £'000
Balance outstanding at start of year 13 17 518 804 531 821
Purchases 19 24 286 1,503 305 1,527
Recognised as an expense in the year (15) (22) 0 (1,809) (15) (1,831)
Balance outstanding at year-end 17 19 804 498 821 517
Note: consumable stores consists of pre-paid postage rechargeable to services.
17
18
Nature and extent of risks arising from Financial Instruments (Continued)
TotalConsumable Stores Client Services
Work in Progress
Impact on Income and Expenditure Account
The treasury management strategy assesses interest rate exposure - this feeds into the setting of the annual budget.
According to this assessment, at 31st March 2012, if interest rates had been 1% higher with all other variables held
constant, the financial effect would be :
Interest Rate Risk
Equity Shares (not quoted on an active market)
Paragraph 4.7.4.2(1) of the Code requires disclosure by class of assets of the amounts for impairment losses and
impairment reversals charged to the Surplus or Deficit on the Provision of Services and to Other Comprehensive
Income and Expenditure. These disclosures are consolidated in note 12 reconciling the movement over the year in the
Property, Plant and Equipment and Intangible Asset balances. An impairment review was carried out by qualified
valuers at 31st March 2012 and concluded that there was no significant impairment to report.
The Authority does not have any construction contracts (work in progress) where the construction work is undertaken
for the Authority's customers.
IMPAIRMENT LOSSES
Impact on Income and Expenditure Account
CONSTRUCTION CONTRACTS
INVENTORIES
Fair Value Movements
43
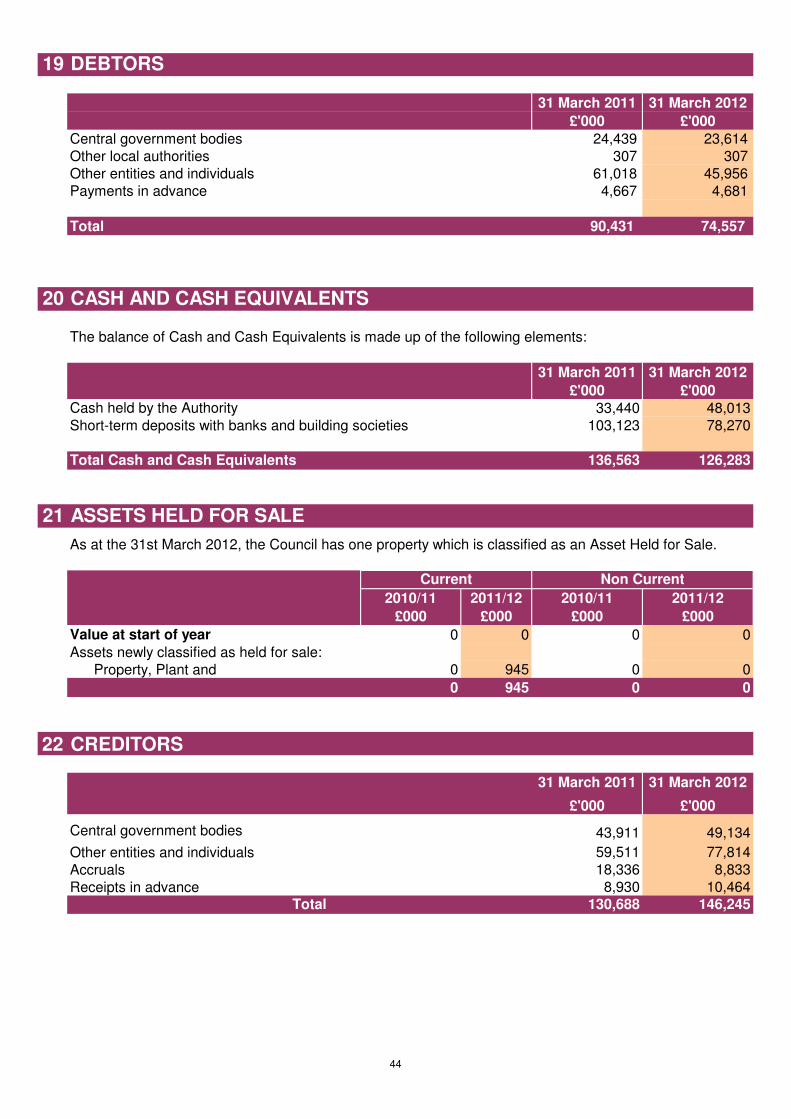
19 DEBTORS
31 March 2011 31 March 2012
£'000 £'000
Central government bodies 24,439 23,614
Other local authorities 307 307
Other entities and individuals 61,018 45,956
Payments in advance 4,667 4,681
Total 90,431 74,557
20 CASH AND CASH EQUIVALENTS
31 March 2011 31 March 2012
£'000 £'000
Cash held by the Authority 33,440 48,013
103,123 78,270
136,563 126,283
21 ASSETS HELD FOR SALE
2010/11 2011/12 2010/11 2011/12
£000 £000 £000 £000
Value at start of year 0 0 0 0
Assets newly classified as held for sale:
Property, Plant and 0 945 0 0
0 945 0 0
22 CREDITORS
31 March 2011 31 March 2012
£'000 £'000
Central government bodies 43,911 49,134
Other entities and individuals 59,511 77,814
Accruals 18,336 8,833
Receipts in advance 8,930 10,464
Total 130,688 146,245
Short-term deposits with banks and building societies
Total Cash and Cash Equivalents
The balance of Cash and Cash Equivalents is made up of the following elements:
As at the 31st March 2012, the Council has one property which is classified as an Asset Held for Sale.
Current Non Current
44
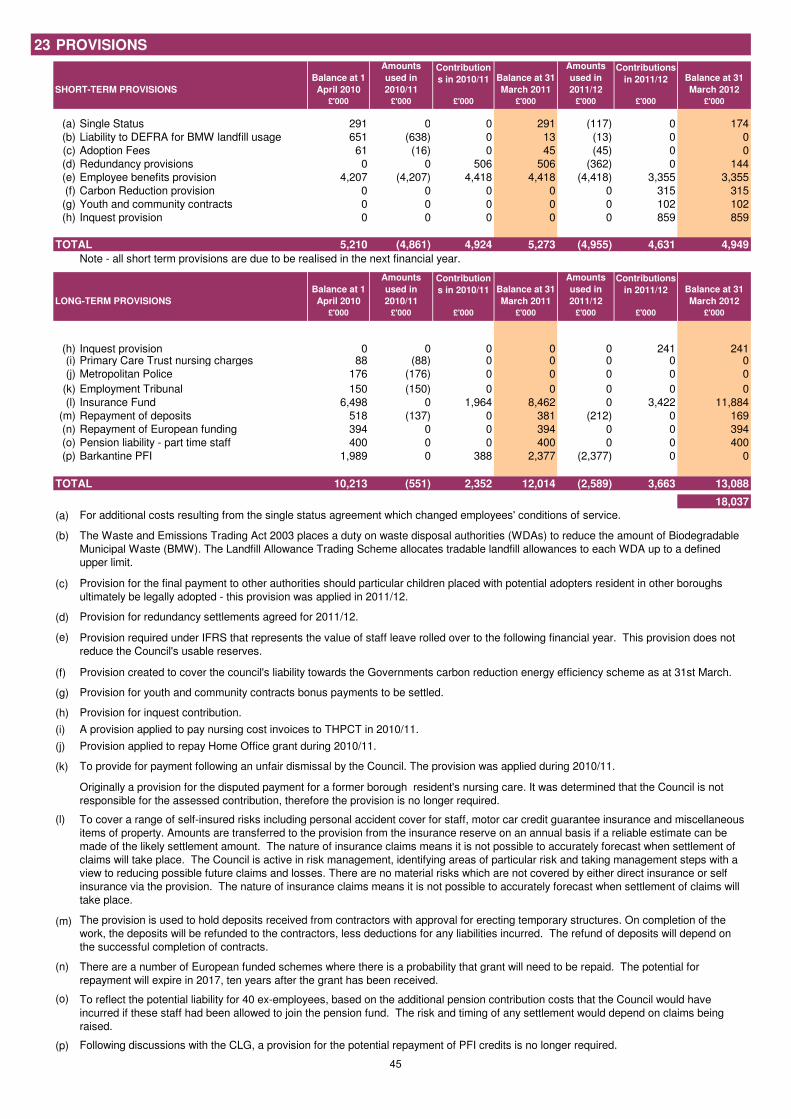
23 PROVISIONS
SHORT-TERM PROVISIONS
£'000 £'000 £'000 £'000 £'000 £'000 £'000
(a) Single Status 291 0 0 291 (117) 0 174
(b) Liability to DEFRA for BMW landfill usage 651 (638) 0 13 (13) 0 0
(c) Adoption Fees 61 (16) 0 45 (45) 0 0
(d) Redundancy provisions 0 0 506 506 (362) 0 144
(e) Employee benefits provision 4,207 (4,207) 4,418 4,418 (4,418) 3,355 3,355
(f) Carbon Reduction provision 0 0 0 0 0 315 315
(g) Youth and community contracts 0 0 0 0 0 102 102
(h) Inquest provision 0 0 0 0 0 859 859
TOTAL 5,210 (4,861) 4,924 5,273 (4,955) 4,631 4,949
Note - all short term provisions are due to be realised in the next financial year.
LONG-TERM PROVISIONS
£'000 £'000 £'000 £'000 £'000 £'000 £'000
(h) Inquest provision 0 0 0 0 0 241 241(i) Primary Care Trust nursing charges 88 (88) 0 0 0 0 0
(j) Metropolitan Police 176 (176) 0 0 0 0 0
(k) Employment Tribunal 150 (150) 0 0 0 0 0
(l) Insurance Fund 6,498 0 1,964 8,462 0 3,422 11,884
(m) Repayment of deposits 518 (137) 0 381 (212) 0 169
(n) Repayment of European funding 394 0 0 394 0 0 394
(o) Pension liability - part time staff 400 0 0 400 0 0 400
(p) Barkantine PFI 1,989 0 388 2,377 (2,377) 0 0
TOTAL 10,213 (551) 2,352 12,014 (2,589) 3,663 13,088
18,037
(a)
(b)
(c)
(d)
(e)
(f)
(g)
(h)
(i)
(j)
(k)
(l)
(m)
(n)
(o)
(p)
Provision required under IFRS that represents the value of staff leave rolled over to the following financial year. This provision does not
reduce the Council's usable reserves.
Following discussions with the CLG, a provision for the potential repayment of PFI credits is no longer required.
There are a number of European funded schemes where there is a probability that grant will need to be repaid. The potential for
repayment will expire in 2017, ten years after the grant has been received.
To reflect the potential liability for 40 ex-employees, based on the additional pension contribution costs that the Council would have
incurred if these staff had been allowed to join the pension fund. The risk and timing of any settlement would depend on claims being
raised.
The provision is used to hold deposits received from contractors with approval for erecting temporary structures. On completion of the
work, the deposits will be refunded to the contractors, less deductions for any liabilities incurred. The refund of deposits will depend on
the successful completion of contracts.
Originally a provision for the disputed payment for a former borough resident's nursing care. It was determined that the Council is not
responsible for the assessed contribution, therefore the provision is no longer required.
To cover a range of self-insured risks including personal accident cover for staff, motor car credit guarantee insurance and miscellaneous
items of property. Amounts are transferred to the provision from the insurance reserve on an annual basis if a reliable estimate can be
made of the likely settlement amount. The nature of insurance claims means it is not possible to accurately forecast when settlement of
claims will take place. The Council is active in risk management, identifying areas of particular risk and taking management steps with a
view to reducing possible future claims and losses. There are no material risks which are not covered by either direct insurance or self
insurance via the provision. The nature of insurance claims means it is not possible to accurately forecast when settlement of claims will
take place.
Provision for inquest contribution.
Provision applied to repay Home Office grant during 2010/11.
A provision applied to pay nursing cost invoices to THPCT in 2010/11.
For additional costs resulting from the single status agreement which changed employees' conditions of service.
The Waste and Emissions Trading Act 2003 places a duty on waste disposal authorities (WDAs) to reduce the amount of Biodegradable
Municipal Waste (BMW). The Landfill Allowance Trading Scheme allocates tradable landfill allowances to each WDA up to a defined
upper limit.
Provision for youth and community contracts bonus payments to be settled.
To provide for payment following an unfair dismissal by the Council. The provision was applied during 2010/11.
Provision created to cover the council's liability towards the Governments carbon reduction energy efficiency scheme as at 31st March.
Provision for the final payment to other authorities should particular children placed with potential adopters resident in other boroughs
ultimately be legally adopted - this provision was applied in 2011/12.
Provision for redundancy settlements agreed for 2011/12.
Balance at 1
April 2010
Balance at 31
March 2012
Amounts
used in
2010/11
Contribution
s in 2010/11 Balance at 31
March 2011
Contributions
in 2011/12
Amounts
used in
2011/12
Amounts
used in
2011/12
Contributions
in 2011/12 Balance at 31
March 2012
Balance at 1
April 2010
Amounts
used in
2010/11
Contribution
s in 2010/11 Balance at 31
March 2011
45
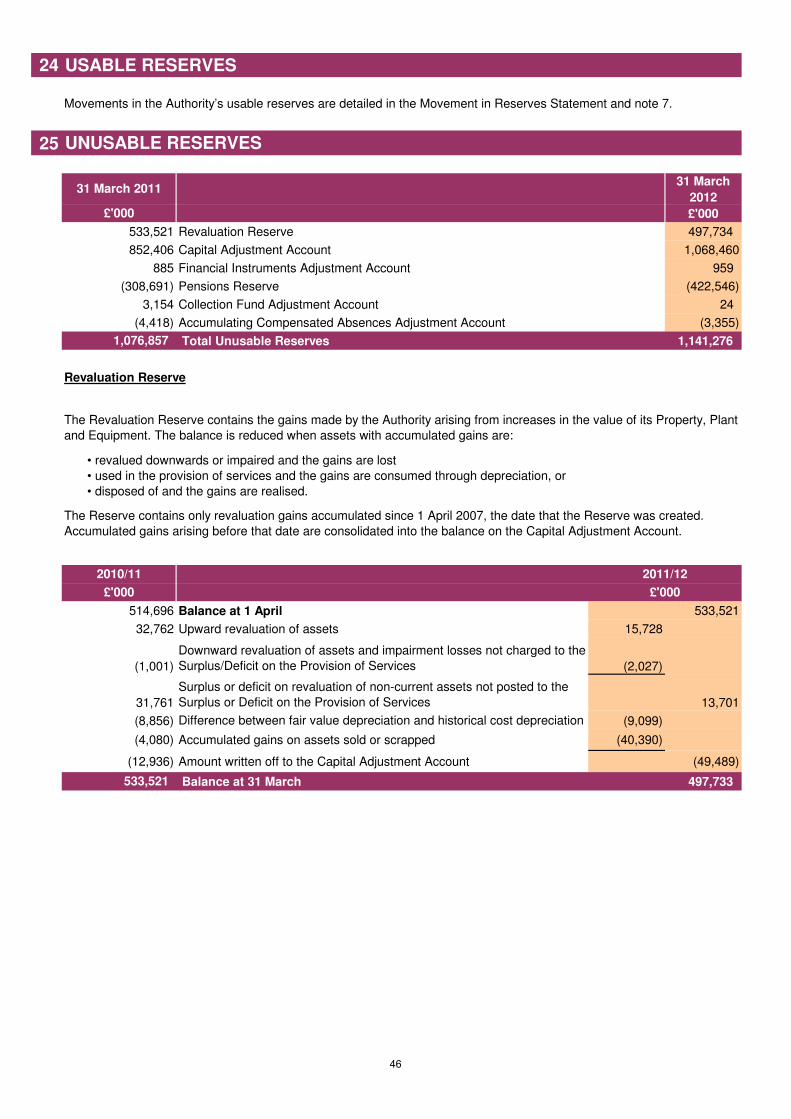
24 USABLE RESERVES
25
31 March
2012
£'000
533,521 Revaluation Reserve 497,734
852,406 Capital Adjustment Account 1,068,460
885 Financial Instruments Adjustment Account 959
(308,691) Pensions Reserve (422,546)
3,154 Collection Fund Adjustment Account 24
(4,418) Accumulating Compensated Absences Adjustment Account (3,355)
Total Unusable Reserves 1,141,276
Revaluation Reserve
514,696 Balance at 1 April 533,521
32,762 Upward revaluation of assets 15,728
(1,001)
Downward revaluation of assets and impairment losses not charged to the
Surplus/Deficit on the Provision of Services (2,027)
31,761
Surplus or deficit on revaluation of non-current assets not posted to the
Surplus or Deficit on the Provision of Services 13,701
(8,856) Difference between fair value depreciation and historical cost depreciation (9,099)
(4,080) Accumulated gains on assets sold or scrapped (40,390)
(12,936) Amount written off to the Capital Adjustment Account (49,489)
Balance at 31 March 497,733 533,521
Movements in the Authority’s usable reserves are detailed in the Movement in Reserves Statement and note 7.
The Revaluation Reserve contains the gains made by the Authority arising from increases in the value of its Property, Plant
and Equipment. The balance is reduced when assets with accumulated gains are:
• revalued downwards or impaired and the gains are lost
• used in the provision of services and the gains are consumed through depreciation, or
• disposed of and the gains are realised.
The Reserve contains only revaluation gains accumulated since 1 April 2007, the date that the Reserve was created.
Accumulated gains arising before that date are consolidated into the balance on the Capital Adjustment Account.
UNUSABLE RESERVES
31 March 2011
£'000
1,076,857
2010/11
£'000
2011/12
£'000
46
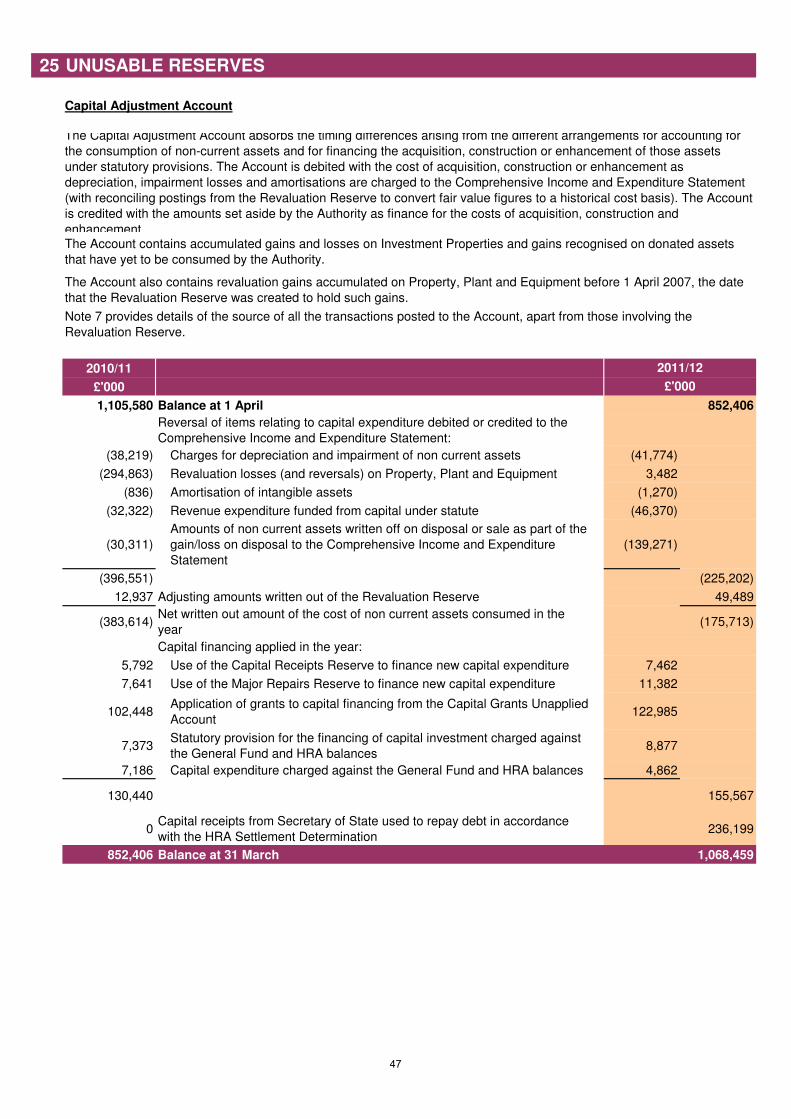
25 UNUSABLE RESERVES
Capital Adjustment Account
2010/11
£'000
1,105,580 Balance at 1 April 852,406
Reversal of items relating to capital expenditure debited or credited to the
Comprehensive Income and Expenditure Statement:
(38,219) Charges for depreciation and impairment of non current assets (41,774)
(294,863) Revaluation losses (and reversals) on Property, Plant and Equipment 3,482
(836) Amortisation of intangible assets (1,270)
(32,322) Revenue expenditure funded from capital under statute (46,370)
(30,311)
Amounts of non current assets written off on disposal or sale as part of the
gain/loss on disposal to the Comprehensive Income and Expenditure
Statement
(139,271)
(396,551) (225,202)
12,937 Adjusting amounts written out of the Revaluation Reserve 49,489
(383,614)Net written out amount of the cost of non current assets consumed in the
year(175,713)
Capital financing applied in the year:
5,792 Use of the Capital Receipts Reserve to finance new capital expenditure 7,462
7,641 Use of the Major Repairs Reserve to finance new capital expenditure 11,382
102,448Application of grants to capital financing from the Capital Grants Unapplied
Account122,985
7,373Statutory provision for the financing of capital investment charged against
the General Fund and HRA balances8,877
7,186 Capital expenditure charged against the General Fund and HRA balances 4,862
130,440 155,567
0Capital receipts from Secretary of State used to repay debt in accordance
with the HRA Settlement Determination236,199
852,406 Balance at 31 March 1,068,459
£'000
2011/12
The Capital Adjustment Account absorbs the timing differences arising from the different arrangements for accounting for
the consumption of non-current assets and for financing the acquisition, construction or enhancement of those assets
under statutory provisions. The Account is debited with the cost of acquisition, construction or enhancement as
depreciation, impairment losses and amortisations are charged to the Comprehensive Income and Expenditure Statement
(with reconciling postings from the Revaluation Reserve to convert fair value figures to a historical cost basis). The Account
is credited with the amounts set aside by the Authority as finance for the costs of acquisition, construction and
enhancement.The Account contains accumulated gains and losses on Investment Properties and gains recognised on donated assets
that have yet to be consumed by the Authority.
The Account also contains revaluation gains accumulated on Property, Plant and Equipment before 1 April 2007, the date
that the Revaluation Reserve was created to hold such gains.
Note 7 provides details of the source of all the transactions posted to the Account, apart from those involving the
Revaluation Reserve.
47
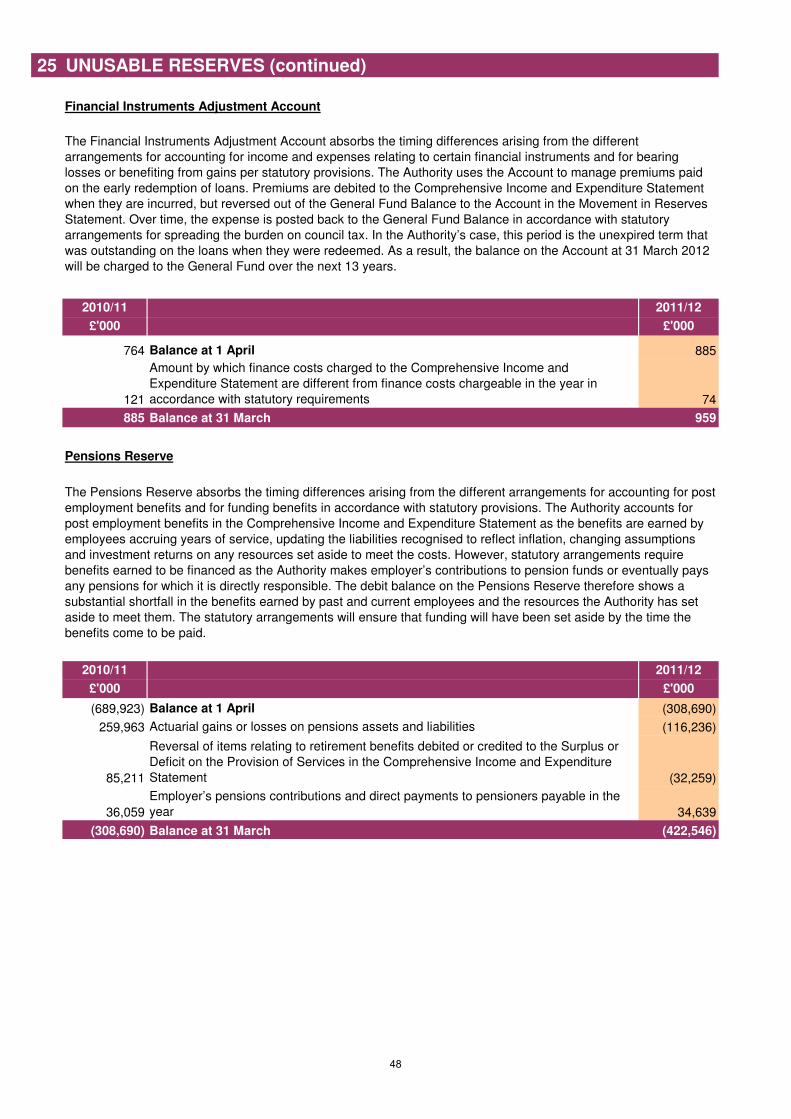
25 UNUSABLE RESERVES (continued)
Financial Instruments Adjustment Account
2010/11 2011/12
£'000 £'000
764 Balance at 1 April 885
121
Amount by which finance costs charged to the Comprehensive Income and
Expenditure Statement are different from finance costs chargeable in the year in
accordance with statutory requirements 74
885 Balance at 31 March 959
Pensions Reserve
2010/11 2011/12
£'000 £'000
(689,923) Balance at 1 April (308,690)
259,963 Actuarial gains or losses on pensions assets and liabilities (116,236)
85,211
Reversal of items relating to retirement benefits debited or credited to the Surplus or
Deficit on the Provision of Services in the Comprehensive Income and Expenditure
Statement (32,259)
36,059
Employer’s pensions contributions and direct payments to pensioners payable in the
year 34,639
(308,690) Balance at 31 March (422,546)
The Financial Instruments Adjustment Account absorbs the timing differences arising from the different
arrangements for accounting for income and expenses relating to certain financial instruments and for bearing
losses or benefiting from gains per statutory provisions. The Authority uses the Account to manage premiums paid
on the early redemption of loans. Premiums are debited to the Comprehensive Income and Expenditure Statement
when they are incurred, but reversed out of the General Fund Balance to the Account in the Movement in Reserves
Statement. Over time, the expense is posted back to the General Fund Balance in accordance with statutory
arrangements for spreading the burden on council tax. In the Authority’s case, this period is the unexpired term that
was outstanding on the loans when they were redeemed. As a result, the balance on the Account at 31 March 2012
will be charged to the General Fund over the next 13 years.
The Pensions Reserve absorbs the timing differences arising from the different arrangements for accounting for post
employment benefits and for funding benefits in accordance with statutory provisions. The Authority accounts for
post employment benefits in the Comprehensive Income and Expenditure Statement as the benefits are earned by
employees accruing years of service, updating the liabilities recognised to reflect inflation, changing assumptions
and investment returns on any resources set aside to meet the costs. However, statutory arrangements require
benefits earned to be financed as the Authority makes employer’s contributions to pension funds or eventually pays
any pensions for which it is directly responsible. The debit balance on the Pensions Reserve therefore shows a
substantial shortfall in the benefits earned by past and current employees and the resources the Authority has set
aside to meet them. The statutory arrangements will ensure that funding will have been set aside by the time the
benefits come to be paid.
48
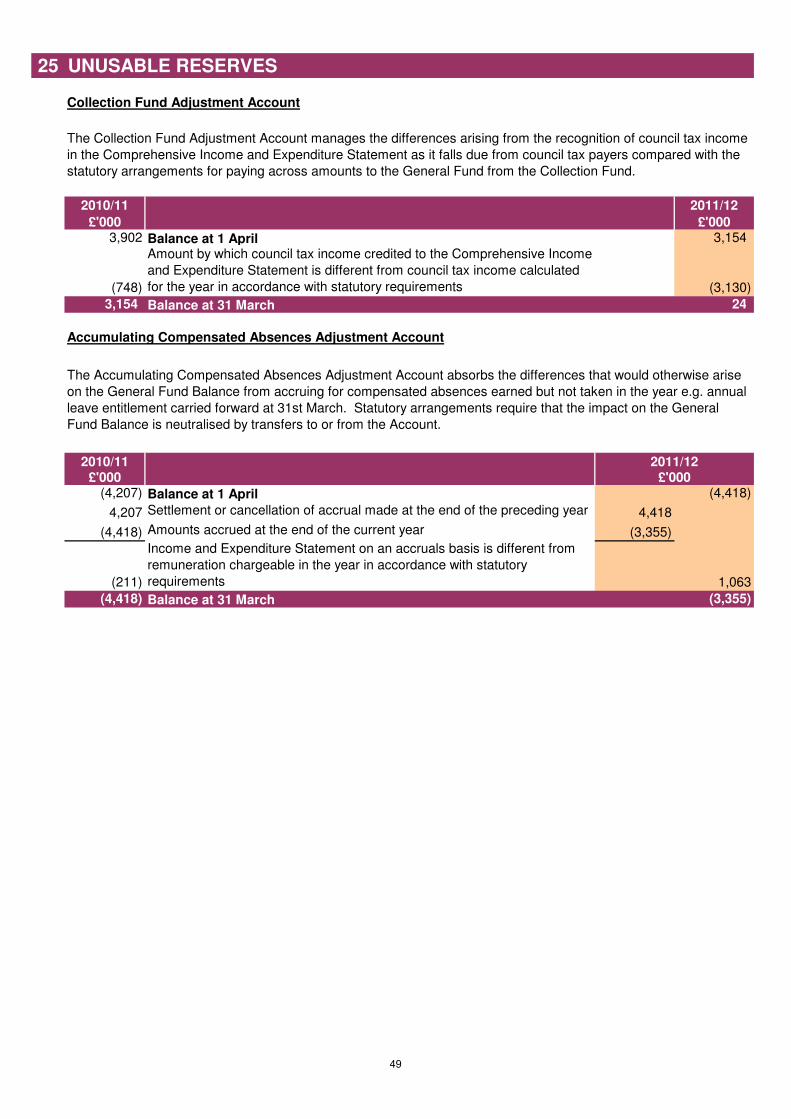
25 UNUSABLE RESERVES
Collection Fund Adjustment Account
2010/11 2011/12
£'000 £'0003,902 Balance at 1 April 3,154
(748)
Amount by which council tax income credited to the Comprehensive Income
and Expenditure Statement is different from council tax income calculated
for the year in accordance with statutory requirements (3,130)
3,154 Balance at 31 March 24
Accumulating Compensated Absences Adjustment Account
2010/11£'000
(4,207) Balance at 1 April (4,418)
4,207 Settlement or cancellation of accrual made at the end of the preceding year 4,418
(4,418) Amounts accrued at the end of the current year (3,355)
(211)
Income and Expenditure Statement on an accruals basis is different from
remuneration chargeable in the year in accordance with statutory
requirements 1,063
(4,418) Balance at 31 March (3,355)
The Collection Fund Adjustment Account manages the differences arising from the recognition of council tax income
in the Comprehensive Income and Expenditure Statement as it falls due from council tax payers compared with the
statutory arrangements for paying across amounts to the General Fund from the Collection Fund.
The Accumulating Compensated Absences Adjustment Account absorbs the differences that would otherwise arise
on the General Fund Balance from accruing for compensated absences earned but not taken in the year e.g. annual
leave entitlement carried forward at 31st March. Statutory arrangements require that the impact on the General
Fund Balance is neutralised by transfers to or from the Account.
2011/12£'000
49
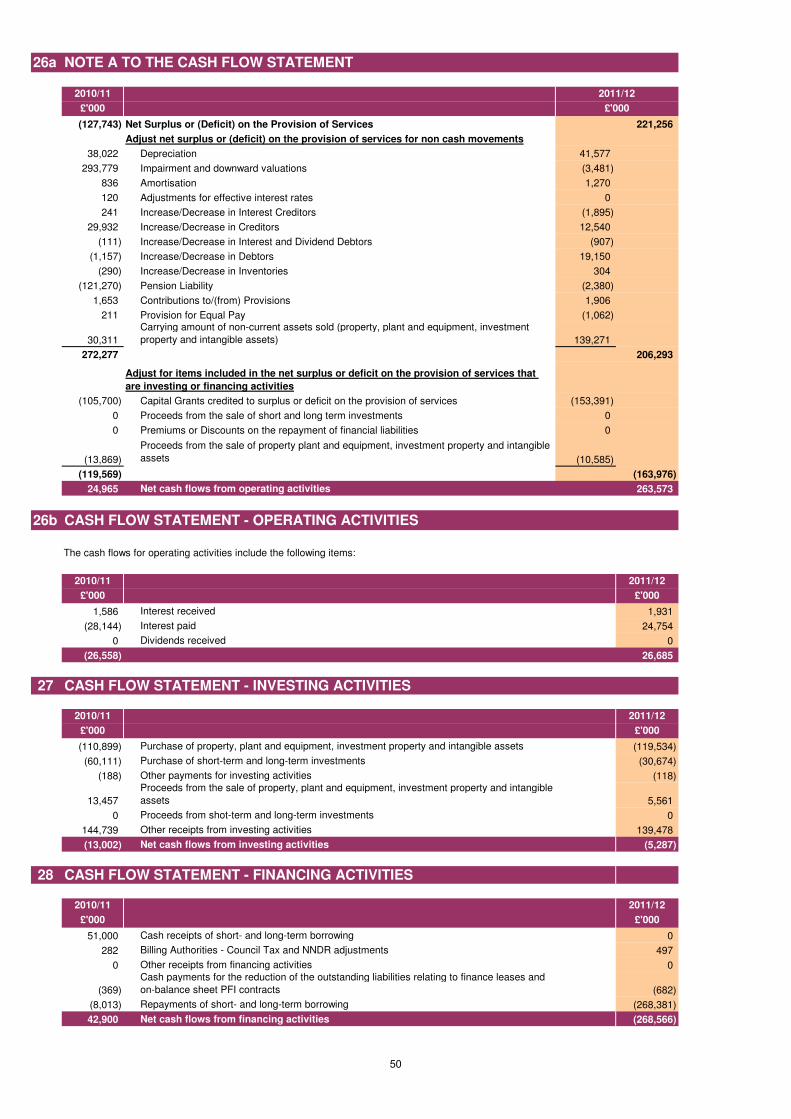
26a NOTE A TO THE CASH FLOW STATEMENT
2010/11
£'000
(127,743) Net Surplus or (Deficit) on the Provision of Services 221,256
Adjust net surplus or (deficit) on the provision of services for non cash movements
38,022 Depreciation 41,577
293,779 Impairment and downward valuations (3,481)
836 Amortisation 1,270
120 Adjustments for effective interest rates 0
241 Increase/Decrease in Interest Creditors (1,895)
29,932 Increase/Decrease in Creditors 12,540
(111) Increase/Decrease in Interest and Dividend Debtors (907)
(1,157) Increase/Decrease in Debtors 19,150
(290) Increase/Decrease in Inventories 304
(121,270) Pension Liability (2,380)
1,653 Contributions to/(from) Provisions 1,906
211 Provision for Equal Pay (1,062)
30,311
Carrying amount of non-current assets sold (property, plant and equipment, investment
property and intangible assets) 139,271
272,277 206,293
(105,700) Capital Grants credited to surplus or deficit on the provision of services (153,391)
0 Proceeds from the sale of short and long term investments 0
0 Premiums or Discounts on the repayment of financial liabilities 0
(13,869)
Proceeds from the sale of property plant and equipment, investment property and intangible
assets (10,585)
(119,569) (163,976)
24,965 Net cash flows from operating activities 263,573
26b CASH FLOW STATEMENT - OPERATING ACTIVITIES
The cash flows for operating activities include the following items:
2010/11 2011/12
£'000 £'000
1,586 Interest received 1,931
(28,144) Interest paid 24,754
0 Dividends received 0
(26,558) 26,685
27 CASH FLOW STATEMENT - INVESTING ACTIVITIES
2010/11 2011/12
£'000 £'000
(110,899) Purchase of property, plant and equipment, investment property and intangible assets (119,534)
(60,111) Purchase of short-term and long-term investments (30,674)
(188) Other payments for investing activities (118)
13,457
Proceeds from the sale of property, plant and equipment, investment property and intangible
assets 5,561
0 Proceeds from shot-term and long-term investments 0
144,739 Other receipts from investing activities 139,478
(13,002) Net cash flows from investing activities (5,287)
28 CASH FLOW STATEMENT - FINANCING ACTIVITIES
2010/11 2011/12
£'000 £'000
51,000 Cash receipts of short- and long-term borrowing 0
282 Billing Authorities - Council Tax and NNDR adjustments 497
0 Other receipts from financing activities 0
(369)
Cash payments for the reduction of the outstanding liabilities relating to finance leases and
on-balance sheet PFI contracts (682)
(8,013) Repayments of short- and long-term borrowing (268,381)
42,900 Net cash flows from financing activities (268,566)
2011/12
£'000
Adjust for items included in the net surplus or deficit on the provision of services that
are investing or financing activities
50
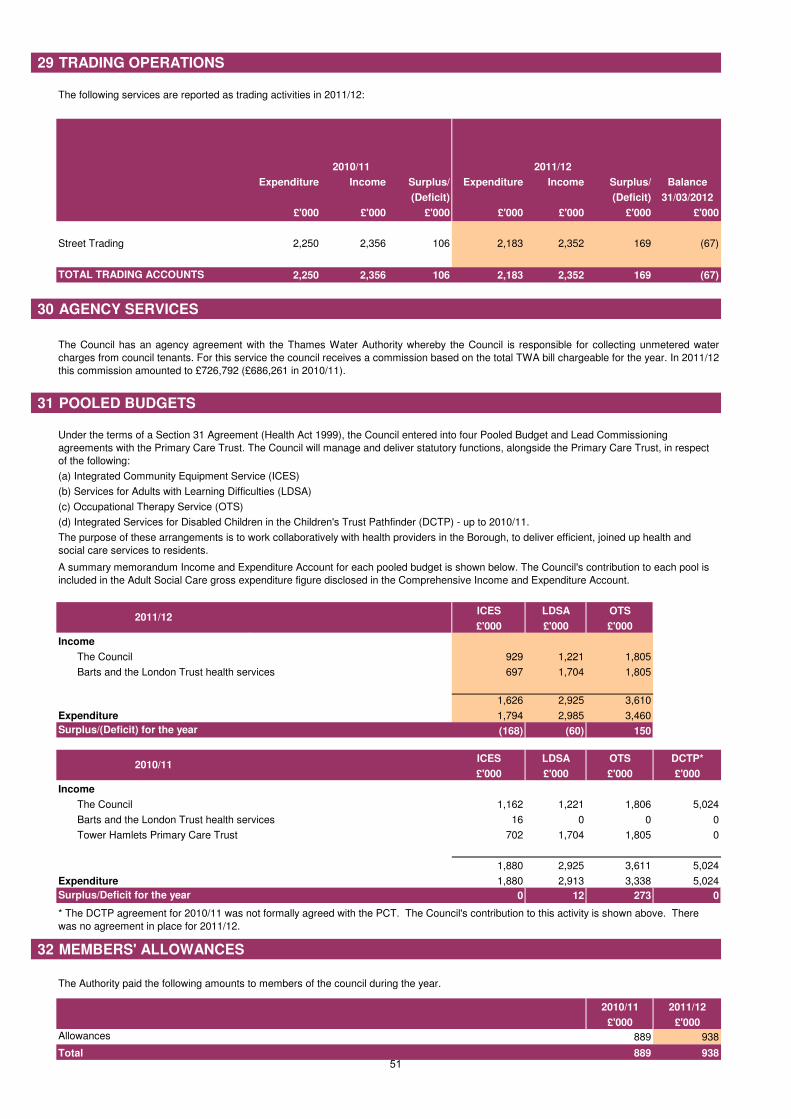
29 TRADING OPERATIONS
The following services are reported as trading activities in 2011/12:
Expenditure Income Surplus/ Expenditure Income Surplus/ Balance
(Deficit) (Deficit) 31/03/2012
£'000 £'000 £'000 £'000 £'000 £'000 £'000
2,250 2,356 106 2,183 2,352 169 (67)
2,250 2,356 106 2,183 2,352 169 (67)
30 AGENCY SERVICES
31 POOLED BUDGETS
ICES LDSA OTS
£'000 £'000 £'000
The Council 929 1,221 1,805
Barts and the London Trust health services 697 1,704 1,805
1,626 2,925 3,610
Expenditure 1,794 2,985 3,460
(168) (60) 150
ICES LDSA OTS DCTP*
£'000 £'000 £'000 £'000
The Council 1,162 1,221 1,806 5,024
Barts and the London Trust health services 16 0 0 0
Tower Hamlets Primary Care Trust 702 1,704 1,805 0
1,880 2,925 3,611 5,024
Expenditure 1,880 2,913 3,338 5,024
0 12 273 0
32
2010/11 2011/12
£'000 £'000
889 938
889 938
Allowances
Total
The Council has an agency agreement with the Thames Water Authority whereby the Council is responsible for collecting unmetered water
charges from council tenants. For this service the council receives a commission based on the total TWA bill chargeable for the year. In 2011/12
this commission amounted to £726,792 (£686,261 in 2010/11).
The purpose of these arrangements is to work collaboratively with health providers in the Borough, to deliver efficient, joined up health and
social care services to residents.
A summary memorandum Income and Expenditure Account for each pooled budget is shown below. The Council's contribution to each pool is
included in the Adult Social Care gross expenditure figure disclosed in the Comprehensive Income and Expenditure Account.
The Authority paid the following amounts to members of the council during the year.
Surplus/Deficit for the year
Surplus/(Deficit) for the year
MEMBERS' ALLOWANCES
(c) Occupational Therapy Service (OTS)
* The DCTP agreement for 2010/11 was not formally agreed with the PCT. The Council's contribution to this activity is shown above. There
was no agreement in place for 2011/12.
2010/11 2011/12
Income
2010/11
Income
2011/12
Under the terms of a Section 31 Agreement (Health Act 1999), the Council entered into four Pooled Budget and Lead Commissioning
agreements with the Primary Care Trust. The Council will manage and deliver statutory functions, alongside the Primary Care Trust, in respect
of the following:
(a) Integrated Community Equipment Service (ICES)
(b) Services for Adults with Learning Difficulties (LDSA)
(d) Integrated Services for Disabled Children in the Children's Trust Pathfinder (DCTP) - up to 2010/11.
TOTAL TRADING ACCOUNTS
Street Trading
51
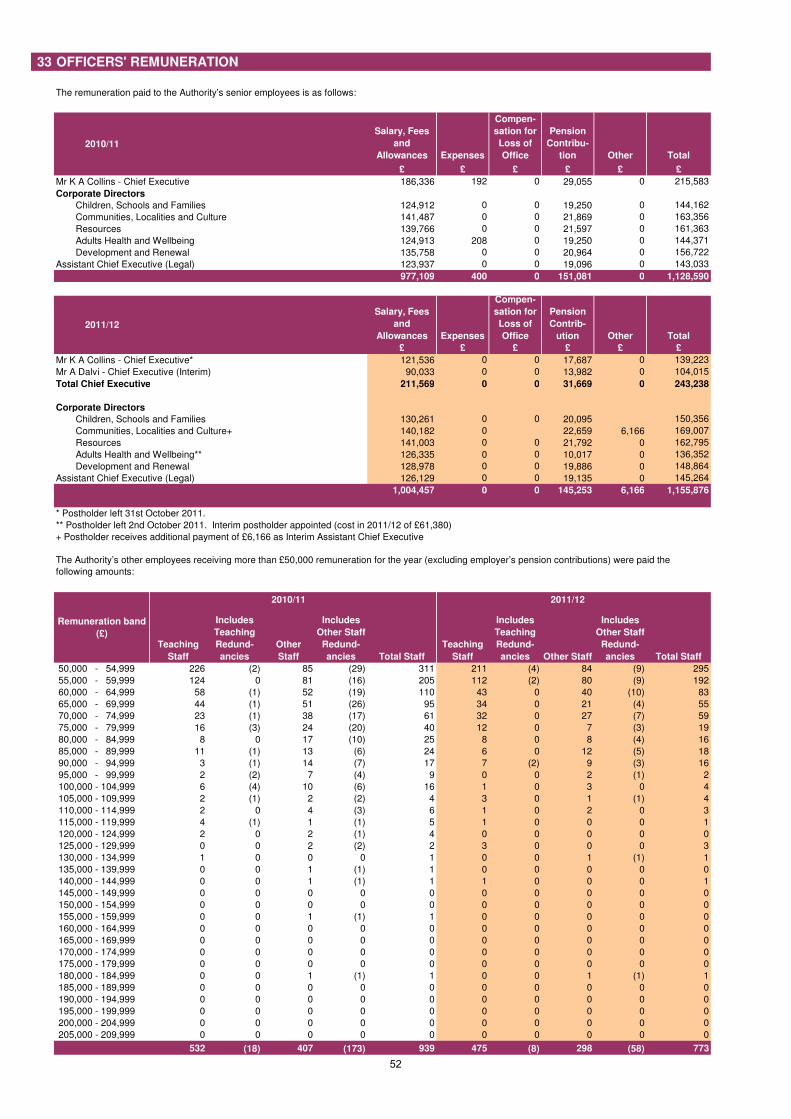
33
Salary, Fees
and
Allowances Expenses
Compen-
sation for
Loss of
Office
Pension
Contribu-
tion Other Total
£ £ £ £ £ £
Mr K A Collins - Chief Executive 186,336 192 0 29,055 0 215,583
Corporate Directors
Children, Schools and Families 124,912 0 0 19,250 0 144,162
Communities, Localities and Culture 141,487 0 0 21,869 0 163,356
Resources 139,766 0 0 21,597 0 161,363
Adults Health and Wellbeing 124,913 208 0 19,250 0 144,371
Development and Renewal 135,758 0 0 20,964 0 156,722
Assistant Chief Executive (Legal) 123,937 0 0 19,096 0 143,033
977,109 400 0 151,081 0 1,128,590
Salary, Fees
and
Allowances Expenses
Compen-
sation for
Loss of
Office
Pension
Contrib-
ution Other Total
£ £ £ £ £ £
Mr K A Collins - Chief Executive* 121,536 0 0 17,687 0 139,223
Mr A Dalvi - Chief Executive (Interim) 90,033 0 0 13,982 0 104,015
Total Chief Executive 211,569 0 0 31,669 0 243,238
Corporate Directors
Children, Schools and Families 130,261 0 0 20,095 150,356
Communities, Localities and Culture+ 140,182 0 22,659 6,166 169,007
Resources 141,003 0 0 21,792 0 162,795
Adults Health and Wellbeing** 126,335 0 0 10,017 0 136,352
Development and Renewal 128,978 0 0 19,886 0 148,864
Assistant Chief Executive (Legal) 126,129 0 0 19,135 0 145,264
1,004,457 0 0 145,253 6,166 1,155,876
2010/11 2011/12
Teaching
Staff
Includes
Teaching
Redund-
ancies
Other
Staff
Includes
Other Staff
Redund-
ancies Total Staff
Teaching
Staff
Includes
Teaching
Redund-
ancies Other Staff
Includes
Other Staff
Redund-
ancies Total Staff
226 (2) 85 (29) 311 211 (4) 84 (9) 295
124 0 81 (16) 205 112 (2) 80 (9) 192
58 (1) 52 (19) 110 43 0 40 (10) 83
44 (1) 51 (26) 95 34 0 21 (4) 55
23 (1) 38 (17) 61 32 0 27 (7) 59
16 (3) 24 (20) 40 12 0 7 (3) 19
8 0 17 (10) 25 8 0 8 (4) 16
11 (1) 13 (6) 24 6 0 12 (5) 18
3 (1) 14 (7) 17 7 (2) 9 (3) 16
2 (2) 7 (4) 9 0 0 2 (1) 2
6 (4) 10 (6) 16 1 0 3 0 4
2 (1) 2 (2) 4 3 0 1 (1) 4
2 0 4 (3) 6 1 0 2 0 3
4 (1) 1 (1) 5 1 0 0 0 1
2 0 2 (1) 4 0 0 0 0 0
0 0 2 (2) 2 3 0 0 0 3
1 0 0 0 1 0 0 1 (1) 1
0 0 1 (1) 1 0 0 0 0 0
0 0 1 (1) 1 1 0 0 0 1
0 0 0 0 0 0 0 0 0 0
0 0 0 0 0 0 0 0 0 0
0 0 1 (1) 1 0 0 0 0 0
0 0 0 0 0 0 0 0 0 0
0 0 0 0 0 0 0 0 0 0
0 0 0 0 0 0 0 0 0 0
0 0 0 0 0 0 0 0 0 0
0 0 1 (1) 1 0 0 1 (1) 1
0 0 0 0 0 0 0 0 0 0
0 0 0 0 0 0 0 0 0 0
0 0 0 0 0 0 0 0 0 0
0 0 0 0 0 0 0 0 0 0
0 0 0 0 0 0 0 0 0 0
532 (18) 407 (173) 939 475 (8) 298 (58) 773
OFFICERS' REMUNERATION
190,000 - 194,999
195,000 - 199,999
200,000 - 204,999
205,000 - 209,999
170,000 - 174,999
175,000 - 179,999
180,000 - 184,999
185,000 - 189,999
140,000 - 144,999
145,000 - 149,999
150,000 - 154,999
155,000 - 159,999
160,000 - 164,999
165,000 - 169,999
135,000 - 139,999
80,000 - 84,999
85,000 - 89,999
90,000 - 94,999
95,000 - 99,999
100,000 - 104,999
105,000 - 109,999
110,000 - 114,999
115,000 - 119,999
120,000 - 124,999
125,000 - 129,999
130,000 - 134,999
75,000 - 79,999
Remuneration band
(£)
2011/12
The remuneration paid to the Authority’s senior employees is as follows:
2010/11
The Authority’s other employees receiving more than £50,000 remuneration for the year (excluding employer’s pension contributions) were paid the
following amounts:
+ Postholder receives additional payment of £6,166 as Interim Assistant Chief Executive
** Postholder left 2nd October 2011. Interim postholder appointed (cost in 2011/12 of £61,380)
50,000 - 54,999
55,000 - 59,999
60,000 - 64,999
65,000 - 69,999
70,000 - 74,999
* Postholder left 31st October 2011.
52
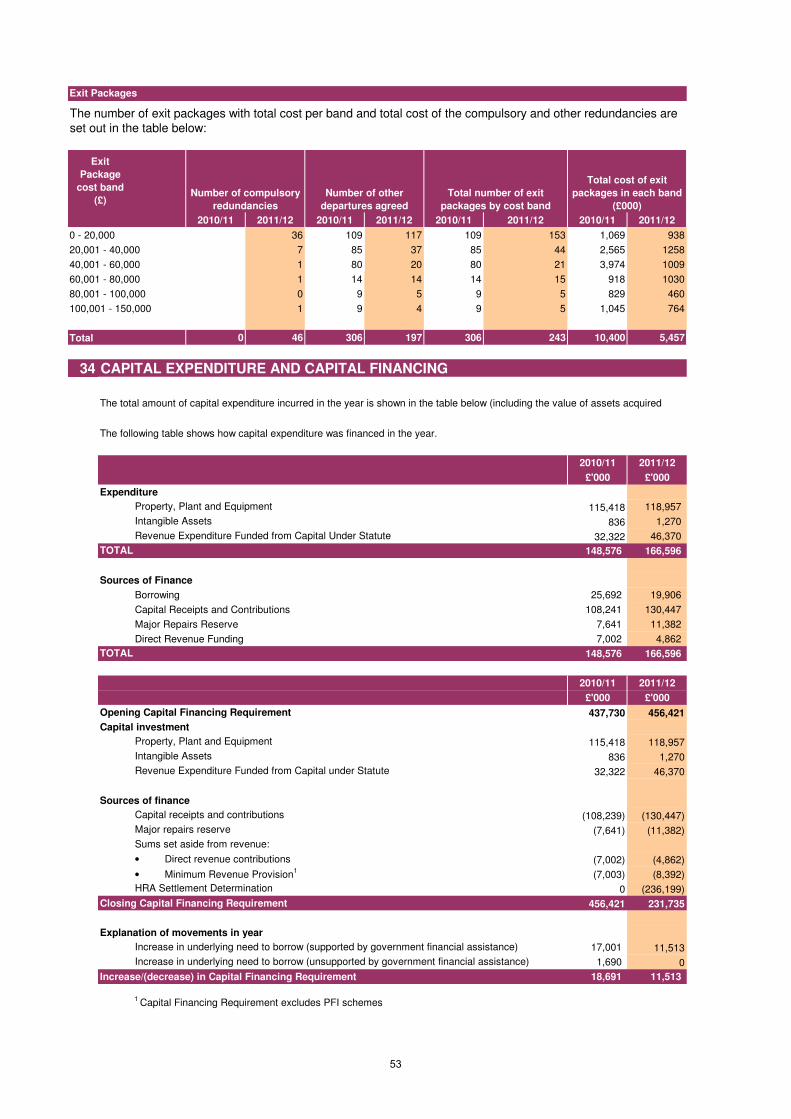
2010/11 2011/12 2010/11 2011/12 2010/11 2011/12 2010/11 2011/12
36 109 117 109 153 1,069 938
20,001 - 40,000 7 85 37 85 44 2,565 1258
40,001 - 60,000 1 80 20 80 21 3,974 1009
60,001 - 80,000 1 14 14 14 15 918 1030
80,001 - 100,000 0 9 5 9 5 829 460
100,001 - 150,000 1 9 4 9 5 1,045 764
0 46 306 197 306 243 10,400 5,457
34 CAPITAL EXPENDITURE AND CAPITAL FINANCING
The following table shows how capital expenditure was financed in the year.
2010/11 2011/12
£'000 £'000
Expenditure
115,418 118,957
836 1,270
32,322 46,370
148,576 166,596
Sources of Finance
Borrowing 25,692 19,906
Capital Receipts and Contributions 108,241 130,447
Major Repairs Reserve 7,641 11,382
Direct Revenue Funding 7,002 4,862
148,576 166,596
2010/11 2011/12
£'000 £'000
Opening Capital Financing Requirement 437,730 456,421
Capital investment
115,418 118,957
836 1,270
32,322 46,370
Sources of finance
(108,239) (130,447)
(7,641) (11,382)
(7,002) (4,862)
(7,003) (8,392)
0 (236,199)
Closing Capital Financing Requirement 456,421 231,735
Explanation of movements in year
17,001 11,513
1,690 0
Increase/(decrease) in Capital Financing Requirement 18,691 11,513
1 Capital Financing Requirement excludes PFI schemes
Intangible Assets
Revenue Expenditure Funded from Capital Under Statute
TOTAL
TOTAL
Increase in underlying need to borrow (supported by government financial assistance)
Increase in underlying need to borrow (unsupported by government financial assistance)
Revenue Expenditure Funded from Capital under Statute
Intangible Assets
Property, Plant and Equipment
Major repairs reserve
Capital receipts and contributions
• Minimum Revenue Provision1
• Direct revenue contributions
Sums set aside from revenue:
Exit Packages
HRA Settlement Determination
Total cost of exit
packages in each band
(£000)
The number of exit packages with total cost per band and total cost of the compulsory and other redundancies are
set out in the table below:
Exit
Package
cost band
(£)
0 - 20,000
Number of compulsory
redundancies
Number of other
departures agreed
Total number of exit
packages by cost band
Total
The total amount of capital expenditure incurred in the year is shown in the table below (including the value of assets acquired
under finance leases and PFI/PP contracts), together with the resources that have been used to finance it. Where capital
Property, Plant and Equipment
53
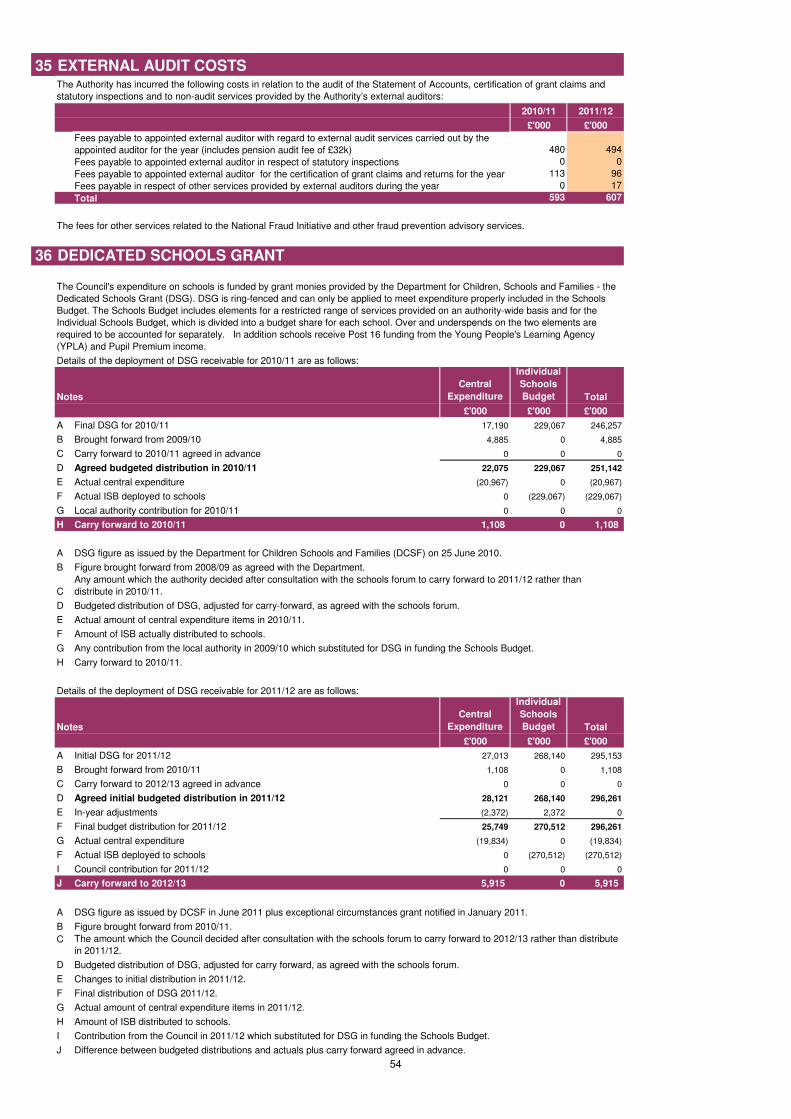
35
2010/11 2011/12
£'000 £'000
480 494
0 0
113 96
0 17
Total 593 607
The fees for other services related to the National Fraud Initiative and other fraud prevention advisory services.
36
Details of the deployment of DSG receivable for 2010/11 are as follows:
Notes
Central
Expenditure
Individual
Schools
Budget Total
£'000 £'000 £'000
A Final DSG for 2010/11 17,190 229,067 246,257
B Brought forward from 2009/10 4,885 0 4,885
C Carry forward to 2010/11 agreed in advance 0 0 0
D Agreed budgeted distribution in 2010/11 22,075 229,067 251,142
E Actual central expenditure (20,967) 0 (20,967)
F Actual ISB deployed to schools 0 (229,067) (229,067)
G Local authority contribution for 2010/11 0 0 0
H Carry forward to 2010/11 1,108 0 1,108
A
B
C
D
E
F
G
H
Details of the deployment of DSG receivable for 2011/12 are as follows:
Notes
Central
Expenditure
Individual
Schools
Budget Total
£'000 £'000 £'000
A Initial DSG for 2011/12 27,013 268,140 295,153
B Brought forward from 2010/11 1,108 0 1,108
C Carry forward to 2012/13 agreed in advance 0 0 0
D Agreed initial budgeted distribution in 2011/12 28,121 268,140 296,261
E In-year adjustments (2,372) 2,372 0
F Final budget distribution for 2011/12 25,749 270,512 296,261
G Actual central expenditure (19,834) 0 (19,834)
F Actual ISB deployed to schools 0 (270,512) (270,512)
I Council contribution for 2011/12 0 0 0
J Carry forward to 2012/13 5,915 0 5,915
A
B
C
D
E Changes to initial distribution in 2011/12.
F Final distribution of DSG 2011/12.
G
H
I
J
Fees payable to appointed external auditor for the certification of grant claims and returns for the year
Fees payable in respect of other services provided by external auditors during the year
Fees payable to appointed external auditor in respect of statutory inspections
Actual amount of central expenditure items in 2011/12.
Figure brought forward from 2010/11.
The amount which the Council decided after consultation with the schools forum to carry forward to 2012/13 rather than distribute
in 2011/12.
Budgeted distribution of DSG, adjusted for carry forward, as agreed with the schools forum.
DSG figure as issued by DCSF in June 2011 plus exceptional circumstances grant notified in January 2011.
Amount of ISB distributed to schools.
Contribution from the Council in 2011/12 which substituted for DSG in funding the Schools Budget.
Difference between budgeted distributions and actuals plus carry forward agreed in advance.
EXTERNAL AUDIT COSTS
DEDICATED SCHOOLS GRANT
Any contribution from the local authority in 2009/10 which substituted for DSG in funding the Schools Budget.
Carry forward to 2010/11.
Any amount which the authority decided after consultation with the schools forum to carry forward to 2011/12 rather than
distribute in 2010/11.
Budgeted distribution of DSG, adjusted for carry-forward, as agreed with the schools forum.
Actual amount of central expenditure items in 2010/11.
Amount of ISB actually distributed to schools.
The Authority has incurred the following costs in relation to the audit of the Statement of Accounts, certification of grant claims and
statutory inspections and to non-audit services provided by the Authority’s external auditors:
The Council's expenditure on schools is funded by grant monies provided by the Department for Children, Schools and Families - the
Dedicated Schools Grant (DSG). DSG is ring-fenced and can only be applied to meet expenditure properly included in the Schools
Budget. The Schools Budget includes elements for a restricted range of services provided on an authority-wide basis and for the
Individual Schools Budget, which is divided into a budget share for each school. Over and underspends on the two elements are
required to be accounted for separately. In addition schools receive Post 16 funding from the Young People's Learning Agency
(YPLA) and Pupil Premium income.
DSG figure as issued by the Department for Children Schools and Families (DCSF) on 25 June 2010.
Figure brought forward from 2008/09 as agreed with the Department.
Fees payable to appointed external auditor with regard to external audit services carried out by the
appointed auditor for the year (includes pension audit fee of £32k)
54
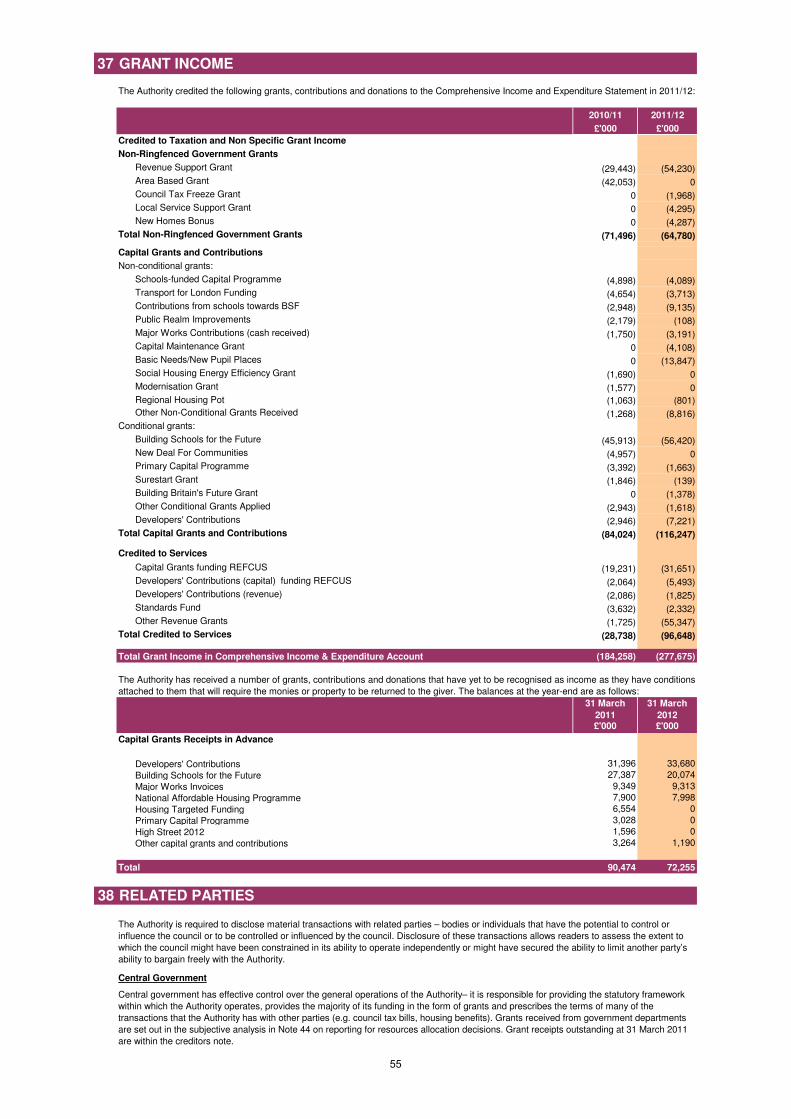
37 GRANT INCOME
2010/11 2011/12
£'000 £'000
Non-Ringfenced Government Grants
Revenue Support Grant (29,443) (54,230)
Area Based Grant (42,053) 0
Council Tax Freeze Grant 0 (1,968)
Local Service Support Grant 0 (4,295)
New Homes Bonus 0 (4,287)
Total Non-Ringfenced Government Grants (71,496) (64,780)
Capital Grants and Contributions
Non-conditional grants:
Schools-funded Capital Programme (4,898) (4,089)
Transport for London Funding (4,654) (3,713)
Contributions from schools towards BSF (2,948) (9,135)
Public Realm Improvements (2,179) (108)
Major Works Contributions (cash received) (1,750) (3,191)
Capital Maintenance Grant 0 (4,108)
Basic Needs/New Pupil Places 0 (13,847)
Social Housing Energy Efficiency Grant (1,690) 0
Modernisation Grant (1,577) 0
Regional Housing Pot (1,063) (801)
Other Non-Conditional Grants Received (1,268) (8,816)
Conditional grants:
Building Schools for the Future (45,913) (56,420)
New Deal For Communities (4,957) 0
Primary Capital Programme (3,392) (1,663)
Surestart Grant (1,846) (139)
Building Britain's Future Grant 0 (1,378)
Other Conditional Grants Applied (2,943) (1,618)
Developers' Contributions (2,946) (7,221)
Total Capital Grants and Contributions (84,024) (116,247)
Credited to Services
Capital Grants funding REFCUS (19,231) (31,651)
Developers' Contributions (capital) funding REFCUS (2,064) (5,493)
Developers' Contributions (revenue) (2,086) (1,825)
Standards Fund (3,632) (2,332)
Other Revenue Grants (1,725) (55,347)
Total Credited to Services (28,738) (96,648)
Total Grant Income in Comprehensive Income & Expenditure Account (184,258) (277,675)
31 March
2011
31 March
2012£'000 £'000
Capital Grants Receipts in Advance
Developers' Contributions 31,396 33,680
Building Schools for the Future 27,387 20,074
Major Works Invoices 9,349 9,313
National Affordable Housing Programme 7,900 7,998
Housing Targeted Funding 6,554 0
Primary Capital Programme 3,028 0
High Street 2012 1,596 0
Other capital grants and contributions 3,264 1,190
Total 90,474 72,255
38
Central Government
The Authority credited the following grants, contributions and donations to the Comprehensive Income and Expenditure Statement in 2011/12:
Central government has effective control over the general operations of the Authority– it is responsible for providing the statutory framework
within which the Authority operates, provides the majority of its funding in the form of grants and prescribes the terms of many of the
transactions that the Authority has with other parties (e.g. council tax bills, housing benefits). Grants received from government departments
are set out in the subjective analysis in Note 44 on reporting for resources allocation decisions. Grant receipts outstanding at 31 March 2011
are within the creditors note.
Credited to Taxation and Non Specific Grant Income
The Authority has received a number of grants, contributions and donations that have yet to be recognised as income as they have conditions
attached to them that will require the monies or property to be returned to the giver. The balances at the year-end are as follows:
The Authority is required to disclose material transactions with related parties – bodies or individuals that have the potential to control or
influence the council or to be controlled or influenced by the council. Disclosure of these transactions allows readers to assess the extent to
which the council might have been constrained in its ability to operate independently or might have secured the ability to limit another party’s
ability to bargain freely with the Authority.
RELATED PARTIES
55
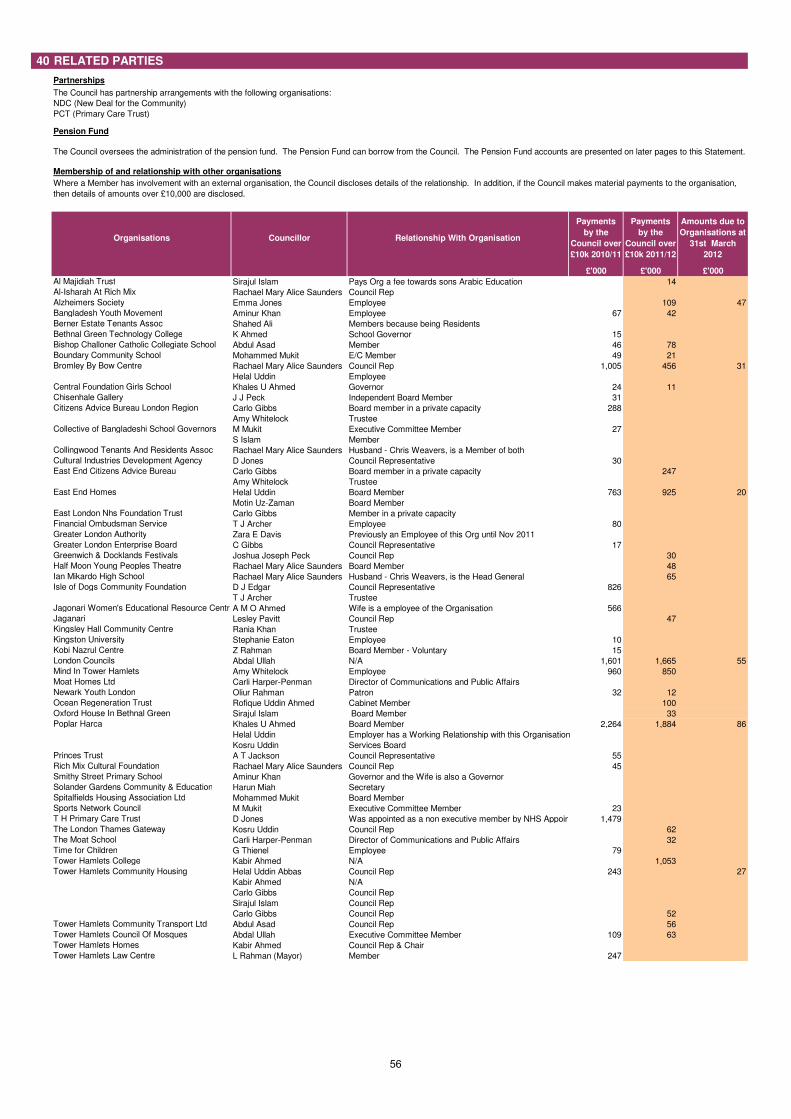
40 RELATED PARTIES
Partnerships
NDC (New Deal for the Community)
PCT (Primary Care Trust)
Pension Fund
Membership of and relationship with other organisations
Organisations Councillor Relationship With Organisation
Payments
by the
Council over
£10k 2010/11
Payments
by the
Council over
£10k 2011/12
Amounts due to
Organisations at
31st March
2012
£'000 £'000 £'000
Al Majidiah Trust Sirajul Islam Pays Org a fee towards sons Arabic Education 14
Al-Isharah At Rich Mix Rachael Mary Alice Saunders Council Rep
Alzheimers Society Emma Jones Employee 109 47
Bangladesh Youth Movement Aminur Khan Employee 67 42
Berner Estate Tenants Assoc Shahed Ali Members because being Residents
Bethnal Green Technology College K Ahmed School Governor 15
Bishop Challoner Catholic Collegiate School Abdul Asad Member 46 78
Boundary Community School Mohammed Mukit E/C Member 49 21
Bromley By Bow Centre Rachael Mary Alice Saunders Council Rep 1,005 456 31
Helal Uddin Employee
Central Foundation Girls School Khales U Ahmed Governor 24 11
Chisenhale Gallery J J Peck Independent Board Member 31
Citizens Advice Bureau London Region Carlo Gibbs Board member in a private capacity 288
Amy Whitelock Trustee
Collective of Bangladeshi School Governors M Mukit Executive Committee Member 27
S Islam Member
Collingwood Tenants And Residents Assoc Rachael Mary Alice Saunders Husband - Chris Weavers, is a Member of both
Cultural Industries Development Agency D Jones Council Representative 30
East End Citizens Advice Bureau Carlo Gibbs Board member in a private capacity 247
Amy Whitelock Trustee
East End Homes Helal Uddin Board Member 763 925 20
Motin Uz-Zaman Board Member
East London Nhs Foundation Trust Carlo Gibbs Member in a private capacity
Financial Ombudsman Service T J Archer Employee 80
Greater London Authority Zara E Davis Previously an Employee of this Org until Nov 2011
Greater London Enterprise Board C Gibbs Council Representative 17
Greenwich & Docklands Festivals Joshua Joseph Peck Council Rep 30
Half Moon Young Peoples Theatre Rachael Mary Alice Saunders Board Member 48
Ian Mikardo High School Rachael Mary Alice Saunders Husband - Chris Weavers, is the Head General 65
Isle of Dogs Community Foundation D J Edgar Council Representative 826
T J Archer Trustee
Jagonari Women's Educational Resource CentreA M O Ahmed Wife is a employee of the Organisation 566
Jaganari Lesley Pavitt Council Rep 47
Kingsley Hall Community Centre Rania Khan Trustee
Kingston University Stephanie Eaton Employee 10
Kobi Nazrul Centre Z Rahman Board Member - Voluntary 15
London Councils Abdal Ullah N/A 1,601 1,665 55
Mind In Tower Hamlets Amy Whitelock Employee 960 850
Moat Homes Ltd Carli Harper-Penman Director of Communications and Public Affairs
Newark Youth London Oliur Rahman Patron 32 12
Ocean Regeneration Trust Rofique Uddin Ahmed Cabinet Member 100
Oxford House In Bethnal Green Sirajul Islam Board Member 33
Poplar Harca Khales U Ahmed Board Member 2,264 1,884 86
Helal Uddin Employer has a Working Relationship with this Organisation
Kosru Uddin Services Board
Princes Trust A T Jackson Council Representative 55
Rich Mix Cultural Foundation Rachael Mary Alice Saunders Council Rep 45
Smithy Street Primary School Aminur Khan Governor and the Wife is also a Governor
Solander Gardens Community & Education Harun Miah Secretary
Spitalfields Housing Association Ltd Mohammed Mukit Board Member
Sports Network Council M Mukit Executive Committee Member 23
T H Primary Care Trust D Jones Was appointed as a non executive member by NHS Appointments 1,479
The London Thames Gateway Kosru Uddin Council Rep 62
The Moat School Carli Harper-Penman Director of Communications and Public Affairs 32
Time for Children G Thienel Employee 79
Tower Hamlets College Kabir Ahmed N/A 1,053
Tower Hamlets Community Housing Helal Uddin Abbas Council Rep 243 27
Kabir Ahmed N/A
Carlo Gibbs Council Rep
Sirajul Islam Council Rep
Carlo Gibbs Council Rep 52
Tower Hamlets Community Transport Ltd Abdul Asad Council Rep 56
Tower Hamlets Council Of Mosques Abdal Ullah Executive Committee Member 109 63
Tower Hamlets Homes Kabir Ahmed Council Rep & Chair
Tower Hamlets Law Centre L Rahman (Mayor) Member 247
The Council has partnership arrangements with the following organisations:
The Council oversees the administration of the pension fund. The Pension Fund can borrow from the Council. The Pension Fund accounts are presented on later pages to this Statement.
Where a Member has involvement with an external organisation, the Council discloses details of the relationship. In addition, if the Council makes material payments to the organisation,
then details of amounts over £10,000 are disclosed.
56
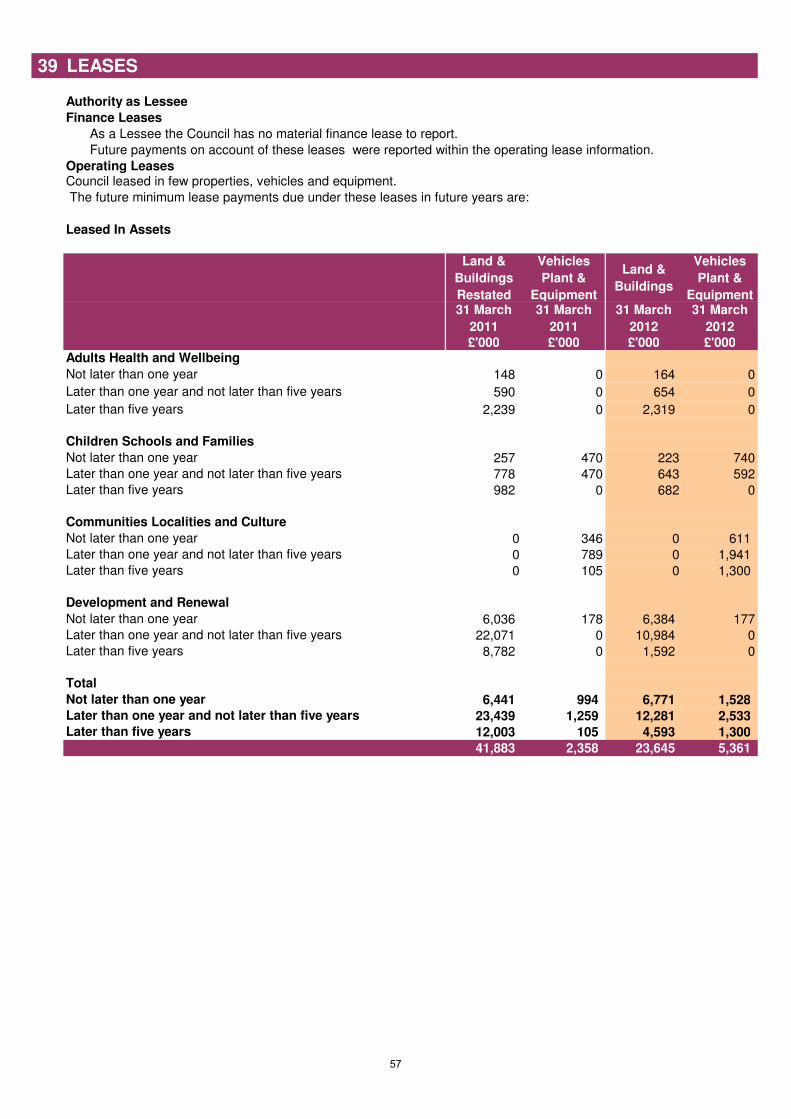
39 LEASES
Authority as Lessee
Finance Leases
As a Lessee the Council has no material finance lease to report.
Future payments on account of these leases were reported within the operating lease information.
Operating Leases
The future minimum lease payments due under these leases in future years are:
Leased In Assets
Land &
Buildings
Restated
Vehicles
Plant &
Equipment
Land &
Buildings
Vehicles
Plant &
Equipment31 March
2011
31 March
2011
31 March
2012
31 March
2012
£'000 £'000 £'000 £'000
148 0 164 0
590 0 654 0
2,239 0 2,319 0
257 470 223 740
778 470 643 592
982 0 682 0
0 346 0 611
0 789 0 1,941
0 105 0 1,300
6,036 178 6,384 177
22,071 0 10,984 0
8,782 0 1,592 0
6,441 994 6,771 1,528
23,439 1,259 12,281 2,533
12,003 105 4,593 1,300
41,883 2,358 23,645 5,361
Later than five years
Total
Not later than one year
Later than five years
Development and Renewal
Not later than one year
Later than one year and not later than five years
Later than one year and not later than five years
Later than five years
Later than one year and not later than five years
Later than five years
Children Schools and Families
Not later than one year
Later than one year and not later than five years
Later than five years
Communities Localities and Culture
Not later than one year
Later than one year and not later than five years
Adults Health and Wellbeing
Not later than one year
Council leased in few properties, vehicles and equipment.
57
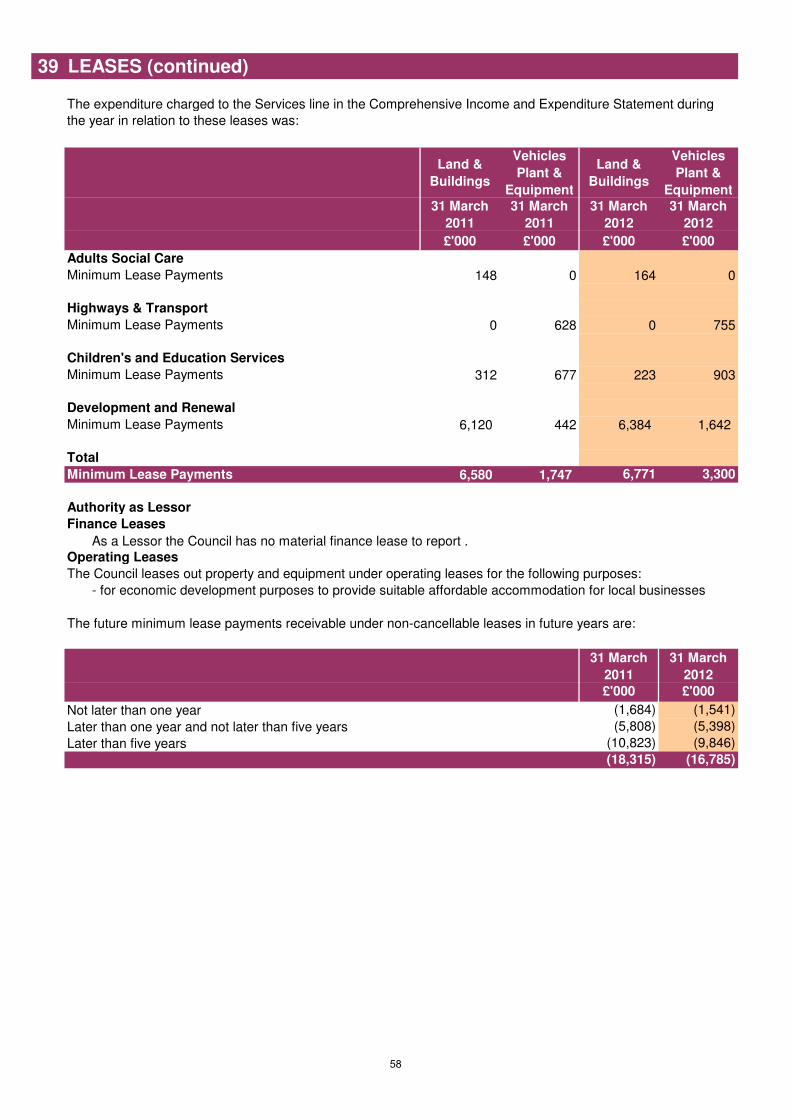
39 LEASES (continued)
Land &
Buildings
Vehicles
Plant &
Equipment
Land &
Buildings
Vehicles
Plant &
Equipment
31 March
2011
31 March
2011
31 March
2012
31 March
2012
£'000 £'000 £'000 £'000
148 0 164 0
0 628 0 755
312 677 223 903
6,120 442 6,384 1,642
6,580 1,747 6,771 3,300
Authority as Lessor
Finance Leases
As a Lessor the Council has no material finance lease to report .
Operating Leases
31 March
2011
31 March
2012
£'000 £'000
(1,684) (1,541)
(5,808) (5,398)
(10,823) (9,846)
(18,315) (16,785)
The expenditure charged to the Services line in the Comprehensive Income and Expenditure Statement during
the year in relation to these leases was:
The Council leases out property and equipment under operating leases for the following purposes:
- for economic development purposes to provide suitable affordable accommodation for local businesses
Adults Social Care
Minimum Lease Payments
Highways & Transport
Development and Renewal
Minimum Lease Payments
Minimum Lease Payments
Children's and Education Services
Minimum Lease Payments
Not later than one year
Later than one year and not later than five years
Total
Minimum Lease Payments
Later than five years
The future minimum lease payments receivable under non-cancellable leases in future years are:
58
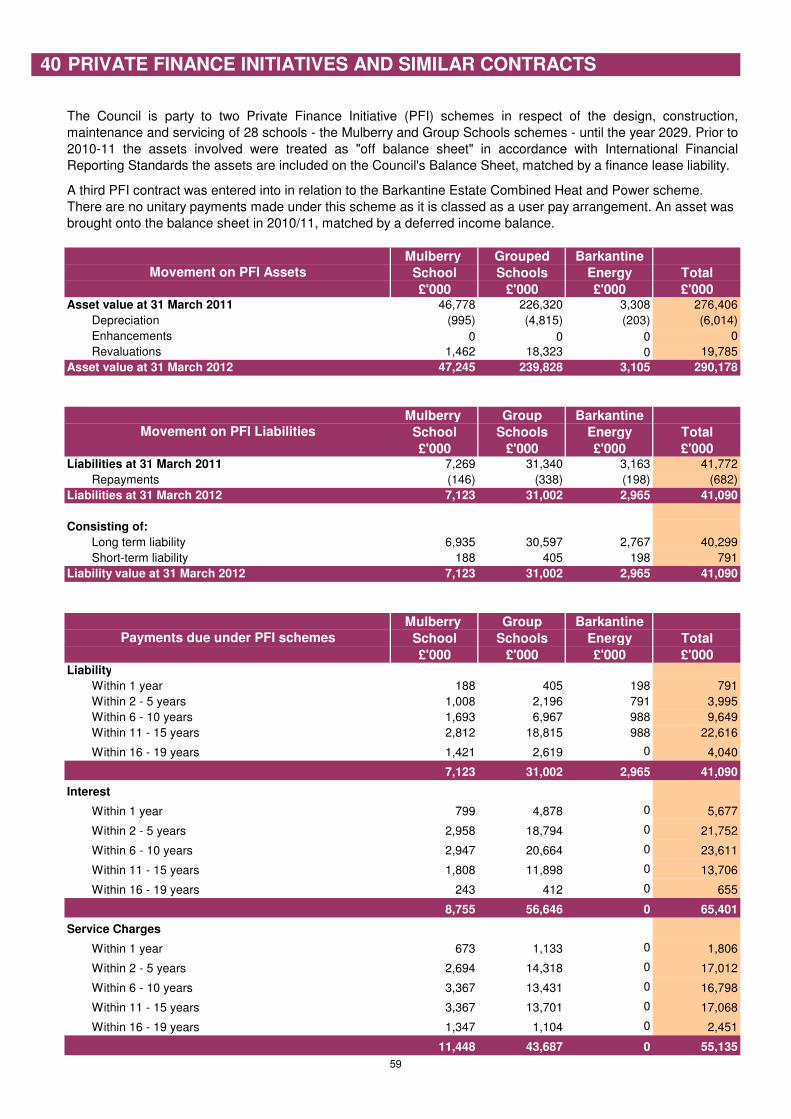
40
Mulberry Grouped Barkantine
School Schools Energy Total
£'000 £'000 £'000 £'000Asset value at 31 March 2011 46,778 226,320 3,308 276,406
Depreciation (995) (4,815) (203) (6,014)
Enhancements 0 0 0 0
Revaluations 1,462 18,323 0 19,785
Asset value at 31 March 2012 47,245 239,828 3,105 290,178
Mulberry Group Barkantine
School Schools Energy Total
£'000 £'000 £'000 £'000Liabilities at 31 March 2011 7,269 31,340 3,163 41,772
Repayments (146) (338) (198) (682)
Liabilities at 31 March 2012 7,123 31,002 2,965 41,090
Consisting of:
Long term liability 6,935 30,597 2,767 40,299
Short-term liability 188 405 198 791
7,123 31,002 2,965 41,090
Mulberry Group Barkantine
School Schools Energy Total
£'000 £'000 £'000 £'000Liability
Within 1 year 188 405 198 791
Within 2 - 5 years 1,008 2,196 791 3,995
Within 6 - 10 years 1,693 6,967 988 9,649
Within 11 - 15 years 2,812 18,815 988 22,616
Within 16 - 19 years 1,421 2,619 0 4,040
7,123 31,002 2,965 41,090
Interest
Within 1 year 799 4,878 0 5,677
Within 2 - 5 years 2,958 18,794 0 21,752
Within 6 - 10 years 2,947 20,664 0 23,611
Within 11 - 15 years 1,808 11,898 0 13,706
Within 16 - 19 years 243 412 0 655
8,755 56,646 0 65,401
Service Charges
Within 1 year 673 1,133 0 1,806
Within 2 - 5 years 2,694 14,318 0 17,012
Within 6 - 10 years 3,367 13,431 0 16,798
Within 11 - 15 years 3,367 13,701 0 17,068
Within 16 - 19 years 1,347 1,104 0 2,451
11,448 43,687 0 55,135
Payments due under PFI schemes
Liability value at 31 March 2012
A third PFI contract was entered into in relation to the Barkantine Estate Combined Heat and Power scheme.
There are no unitary payments made under this scheme as it is classed as a user pay arrangement. An asset was
brought onto the balance sheet in 2010/11, matched by a deferred income balance.
PRIVATE FINANCE INITIATIVES AND SIMILAR CONTRACTS
The Council is party to two Private Finance Initiative (PFI) schemes in respect of the design, construction,
maintenance and servicing of 28 schools - the Mulberry and Group Schools schemes - until the year 2029. Prior to
2010-11 the assets involved were treated as "off balance sheet" in accordance with International Financial
Reporting Standards the assets are included on the Council's Balance Sheet, matched by a finance lease liability.
Movement on PFI Assets
Movement on PFI Liabilities
59
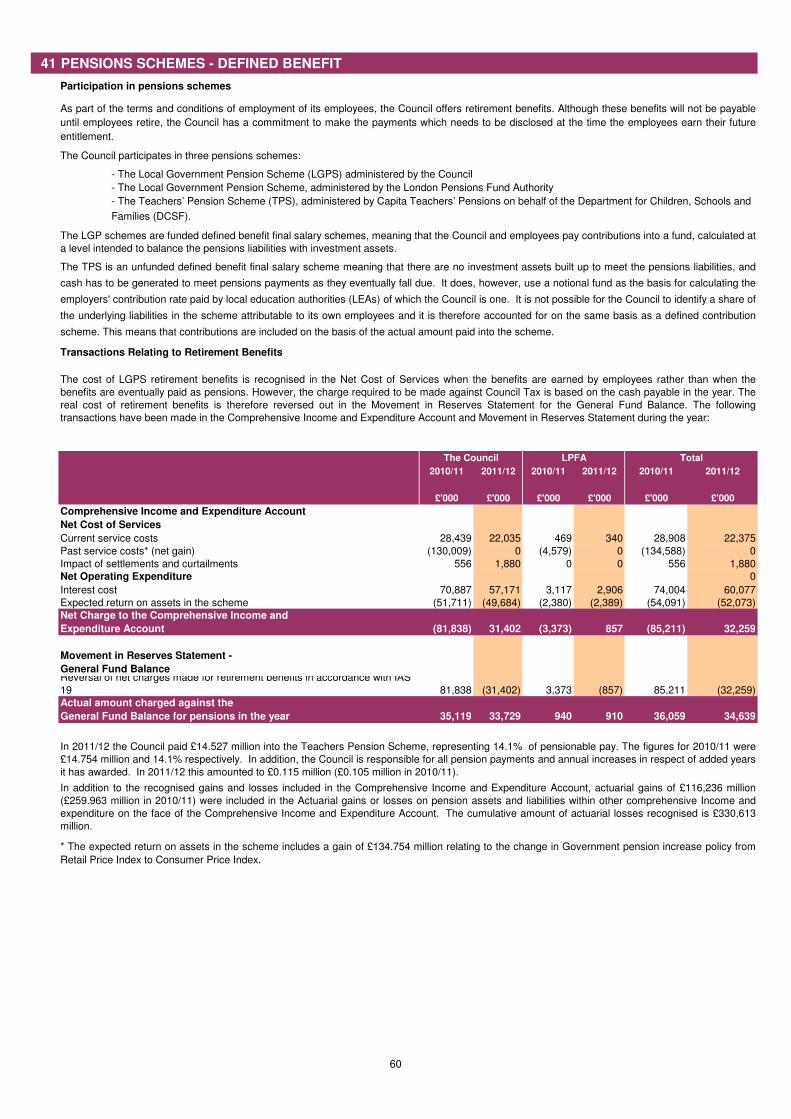
41 PENSIONS SCHEMES - DEFINED BENEFIT
Participation in pensions schemes
- The Local Government Pension Scheme, administered by the London Pensions Fund Authority
Transactions Relating to Retirement Benefits
2010/11 2011/12 2010/11 2011/12 2010/11 2011/12
£'000 £'000 £'000 £'000 £'000 £'000
28,439 22,035 469 340 28,908 22,375
Past service costs* (net gain) (130,009) 0 (4,579) 0 (134,588) 0
556 1,880 0 0 556 1,880
0
70,887 57,171 3,117 2,906 74,004 60,077
(51,711) (49,684) (2,380) (2,389) (54,091) (52,073)
(81,838) 31,402 (3,373) 857 (85,211) 32,259
81,838 (31,402) 3,373 (857) 85,211 (32,259)
35,119 33,729 940 910 36,059 34,639
The TPS is an unfunded defined benefit final salary scheme meaning that there are no investment assets built up to meet the pensions liabilities, and
cash has to be generated to meet pensions payments as they eventually fall due. It does, however, use a notional fund as the basis for calculating the
employers' contribution rate paid by local education authorities (LEAs) of which the Council is one. It is not possible for the Council to identify a share of
the underlying liabilities in the scheme attributable to its own employees and it is therefore accounted for on the same basis as a defined contribution
scheme. This means that contributions are included on the basis of the actual amount paid into the scheme.
The cost of LGPS retirement benefits is recognised in the Net Cost of Services when the benefits are earned by employees rather than when the
benefits are eventually paid as pensions. However, the charge required to be made against Council Tax is based on the cash payable in the year. The
real cost of retirement benefits is therefore reversed out in the Movement in Reserves Statement for the General Fund Balance. The following
transactions have been made in the Comprehensive Income and Expenditure Account and Movement in Reserves Statement during the year:
The Council LPFA Total
Comprehensive Income and Expenditure Account
Net Cost of Services
* The expected return on assets in the scheme includes a gain of £134.754 million relating to the change in Government pension increase policy from
Retail Price Index to Consumer Price Index.
As part of the terms and conditions of employment of its employees, the Council offers retirement benefits. Although these benefits will not be payable
until employees retire, the Council has a commitment to make the payments which needs to be disclosed at the time the employees earn their future
entitlement.
The Council participates in three pensions schemes:
- The Local Government Pension Scheme (LGPS) administered by the Council
- The Teachers’ Pension Scheme (TPS), administered by Capita Teachers’ Pensions on behalf of the Department for Children, Schools and
Families (DCSF).
The LGP schemes are funded defined benefit final salary schemes, meaning that the Council and employees pay contributions into a fund, calculated at
a level intended to balance the pensions liabilities with investment assets.
Expected return on assets in the scheme
Net Charge to the Comprehensive Income and
Expenditure Account
Movement in Reserves Statement -
Current service costs
Impact of settlements and curtailments
Net Operating Expenditure
Interest cost
General Fund BalanceReversal of net charges made for retirement benefits in accordance with IAS
19
In addition to the recognised gains and losses included in the Comprehensive Income and Expenditure Account, actuarial gains of £116,236 million
(£259.963 million in 2010/11) were included in the Actuarial gains or losses on pension assets and liabilities within other comprehensive Income and
expenditure on the face of the Comprehensive Income and Expenditure Account. The cumulative amount of actuarial losses recognised is £330,613
million.
Actual amount charged against the
General Fund Balance for pensions in the year
In 2011/12 the Council paid £14.527 million into the Teachers Pension Scheme, representing 14.1% of pensionable pay. The figures for 2010/11 were
£14.754 million and 14.1% respectively. In addition, the Council is responsible for all pension payments and annual increases in respect of added years
it has awarded. In 2011/12 this amounted to £0.115 million (£0.105 million in 2010/11).
60
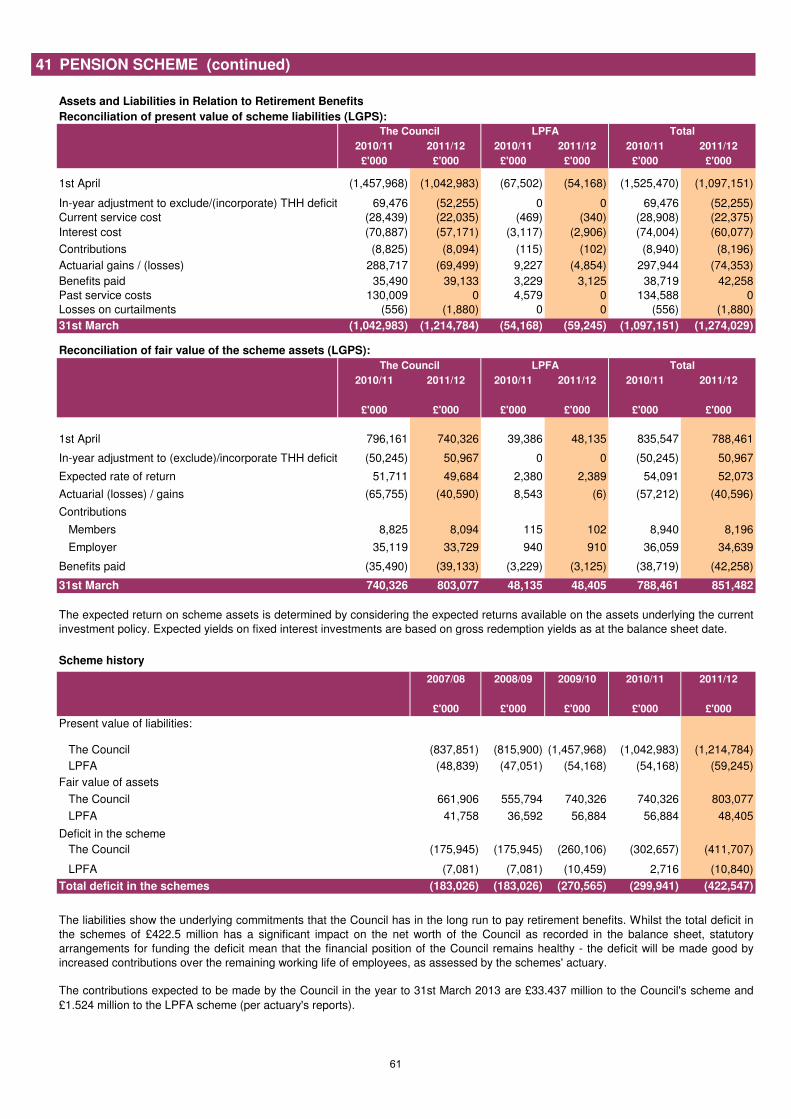
41 PENSION SCHEME (continued)
Assets and Liabilities in Relation to Retirement Benefits
2010/11 2011/12 2010/11 2011/12 2010/11 2011/12
£'000 £'000 £'000 £'000 £'000 £'000
1st April (1,457,968) (1,042,983) (67,502) (54,168) (1,525,470) (1,097,151)
In-year adjustment to exclude/(incorporate) THH deficit 69,476 (52,255) 0 0 69,476 (52,255)
Current service cost (28,439) (22,035) (469) (340) (28,908) (22,375)
Interest cost (70,887) (57,171) (3,117) (2,906) (74,004) (60,077)
Contributions (8,825) (8,094) (115) (102) (8,940) (8,196)
Actuarial gains / (losses) 288,717 (69,499) 9,227 (4,854) 297,944 (74,353)
Benefits paid 35,490 39,133 3,229 3,125 38,719 42,258
Past service costs 130,009 0 4,579 0 134,588 0
Losses on curtailments (556) (1,880) 0 0 (556) (1,880)
31st March (1,042,983) (1,214,784) (54,168) (59,245) (1,097,151) (1,274,029)
Reconciliation of fair value of the scheme assets (LGPS):
2010/11 2011/12 2010/11 2011/12 2010/11 2011/12
£'000 £'000 £'000 £'000 £'000 £'000
1st April 796,161 740,326 39,386 48,135 835,547 788,461
In-year adjustment to (exclude)/incorporate THH deficit (50,245) 50,967 0 0 (50,245) 50,967
Expected rate of return 51,711 49,684 2,380 2,389 54,091 52,073
Actuarial (losses) / gains (65,755) (40,590) 8,543 (6) (57,212) (40,596)
Contributions
Members 8,825 8,094 115 102 8,940 8,196
Employer 35,119 33,729 940 910 36,059 34,639
Benefits paid (35,490) (39,133) (3,229) (3,125) (38,719) (42,258)
31st March 740,326 803,077 48,135 48,405 788,461 851,482
Scheme history
2007/08 2008/09 2009/10 2010/11 2011/12
£'000 £'000 £'000 £'000 £'000
Present value of liabilities:
The Council (837,851) (815,900) (1,457,968) (1,042,983) (1,214,784)
LPFA (48,839) (47,051) (54,168) (54,168) (59,245)
Fair value of assets
The Council 661,906 555,794 740,326 740,326 803,077
LPFA 41,758 36,592 56,884 56,884 48,405
Deficit in the scheme
The Council (175,945) (175,945) (260,106) (302,657) (411,707)
LPFA (7,081) (7,081) (10,459) 2,716 (10,840)
(183,026) (183,026) (270,565) (299,941) (422,547)
The contributions expected to be made by the Council in the year to 31st March 2013 are £33.437 million to the Council's scheme and
£1.524 million to the LPFA scheme (per actuary's reports).
The expected return on scheme assets is determined by considering the expected returns available on the assets underlying the current
investment policy. Expected yields on fixed interest investments are based on gross redemption yields as at the balance sheet date.
Total deficit in the schemes
LPFA Total
The liabilities show the underlying commitments that the Council has in the long run to pay retirement benefits. Whilst the total deficit in
the schemes of £422.5 million has a significant impact on the net worth of the Council as recorded in the balance sheet, statutory
arrangements for funding the deficit mean that the financial position of the Council remains healthy - the deficit will be made good by
increased contributions over the remaining working life of employees, as assessed by the schemes' actuary.
LPFA TotalThe Council
The Council
Reconciliation of present value of scheme liabilities (LGPS):
61
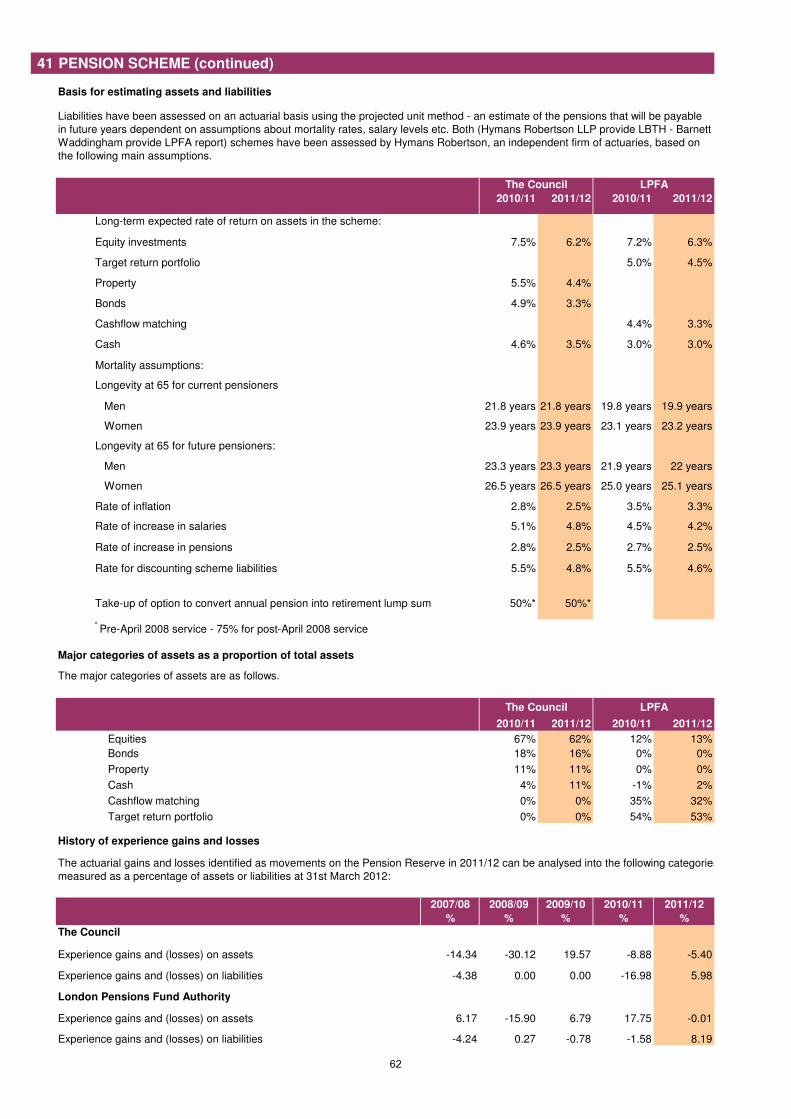
41 PENSION SCHEME (continued)
Basis for estimating assets and liabilities
2010/11 2011/12 2010/11 2011/12
Long-term expected rate of return on assets in the scheme:
Equity investments 7.5% 6.2% 7.2% 6.3%
Target return portfolio 5.0% 4.5%
Property 5.5% 4.4%
Bonds 4.9% 3.3%
Cashflow matching 4.4% 3.3%
Cash 4.6% 3.5% 3.0% 3.0%
Mortality assumptions:
Longevity at 65 for current pensioners:
Men 21.8 years 21.8 years 19.8 years 19.9 years
Women 23.9 years 23.9 years 23.1 years 23.2 years
Longevity at 65 for future pensioners:
Men 23.3 years 23.3 years 21.9 years 22 years
Women 26.5 years 26.5 years 25.0 years 25.1 years
Rate of inflation 2.8% 2.5% 3.5% 3.3%
Rate of increase in salaries 5.1% 4.8% 4.5% 4.2%
Rate of increase in pensions 2.8% 2.5% 2.7% 2.5%
Rate for discounting scheme liabilities 5.5% 4.8% 5.5% 4.6%
50%* 50%*
* Pre-April 2008 service - 75% for post-April 2008 service
Major categories of assets as a proportion of total assets
The major categories of assets are as follows.
2010/11 2011/12 2010/11 2011/12
Equities 67% 62% 12% 13%
Bonds 18% 16% 0% 0%
Property 11% 11% 0% 0%
Cash 4% 11% -1% 2%
Cashflow matching 0% 0% 35% 32%
Target return portfolio 0% 0% 54% 53%
History of experience gains and losses
2007/08 2008/09 2009/10 2010/11 2011/12
% % % % %
The Council
-14.34 -30.12 19.57 -8.88 -5.40
-4.38 0.00 0.00 -16.98 5.98
London Pensions Fund Authority
6.17 -15.90 6.79 17.75 -0.01
-4.24 0.27 -0.78 -1.58 8.19
The Council LPFA
Liabilities have been assessed on an actuarial basis using the projected unit method - an estimate of the pensions that will be payable
in future years dependent on assumptions about mortality rates, salary levels etc. Both (Hymans Robertson LLP provide LBTH - Barnett
Waddingham provide LPFA report) schemes have been assessed by Hymans Robertson, an independent firm of actuaries, based on
the following main assumptions.
Take-up of option to convert annual pension into retirement lump sum
Experience gains and (losses) on assets
Experience gains and (losses) on liabilities
The Council
Experience gains and (losses) on liabilities
LPFA
The actuarial gains and losses identified as movements on the Pension Reserve in 2011/12 can be analysed into the following categories,
measured as a percentage of assets or liabilities at 31st March 2012:
Experience gains and (losses) on assets
62
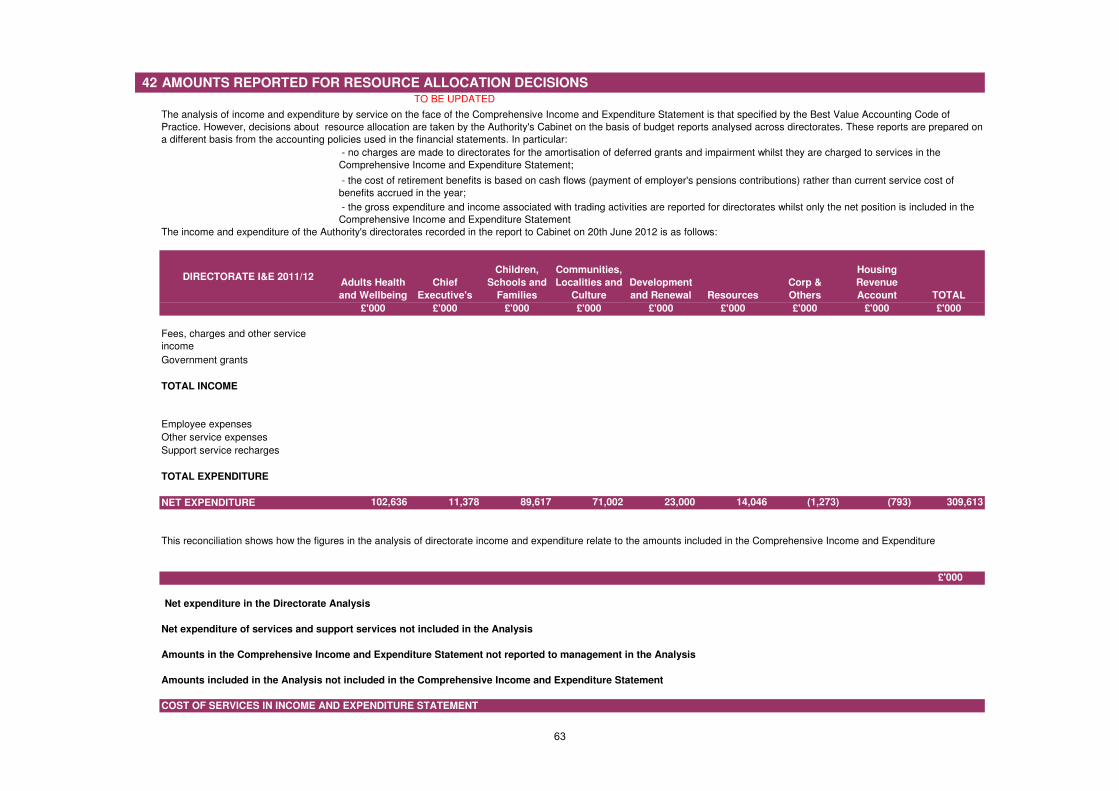
42 AMOUNTS REPORTED FOR RESOURCE ALLOCATION DECISIONSTO BE UPDATED
The income and expenditure of the Authority's directorates recorded in the report to Cabinet on 20th June 2012 is as follows:
DIRECTORATE I&E 2011/12Adults Health
and Wellbeing
Chief
Executive's
Children,
Schools and
Families
Communities,
Localities and
Culture
Development
and Renewal Resources
Corp &
Others
Housing
Revenue
Account TOTAL
£'000 £'000 £'000 £'000 £'000 £'000 £'000 £'000 £'000
Fees, charges and other service
income 0 0 0 0 0 0 0 0 0
Government grants 0 0 0 0 0 0 0 0 0
TOTAL INCOME 0 0 0 0 0 0 0 0 0
Employee expenses 102,636 11,378 89,617 71,002 23,000 14,046 (1,273) (793) 309,613
Other service expenses 0 0 0 0 0 0 0 0 0
Support service recharges 0 0 0 0 0 0 0 0 0
0
TOTAL EXPENDITURE 102,636 11,378 89,617 71,002 23,000 14,046 (1,273) (793) 309,613
NET EXPENDITURE 102,636 11,378 89,617 71,002 23,000 14,046 (1,273) (793) 309,613
£'000
Net expenditure in the Directorate Analysis 309,613
Net expenditure of services and support services not included in the Analysis 293,123
Amounts in the Comprehensive Income and Expenditure Statement not reported to management in the Analysis (17,357)
Amounts included in the Analysis not included in the Comprehensive Income and Expenditure Statement 3,255
COST OF SERVICES IN INCOME AND EXPENDITURE STATEMENT
- the gross expenditure and income associated with trading activities are reported for directorates whilst only the net position is included in the
Comprehensive Income and Expenditure Statement
This reconciliation shows how the figures in the analysis of directorate income and expenditure relate to the amounts included in the Comprehensive Income and Expenditure
The analysis of income and expenditure by service on the face of the Comprehensive Income and Expenditure Statement is that specified by the Best Value Accounting Code of
Practice. However, decisions about resource allocation are taken by the Authority's Cabinet on the basis of budget reports analysed across directorates. These reports are prepared on
a different basis from the accounting policies used in the financial statements. In particular:
- no charges are made to directorates for the amortisation of deferred grants and impairment whilst they are charged to services in the
Comprehensive Income and Expenditure Statement;
- the cost of retirement benefits is based on cash flows (payment of employer's pensions contributions) rather than current service cost of
benefits accrued in the year;
63
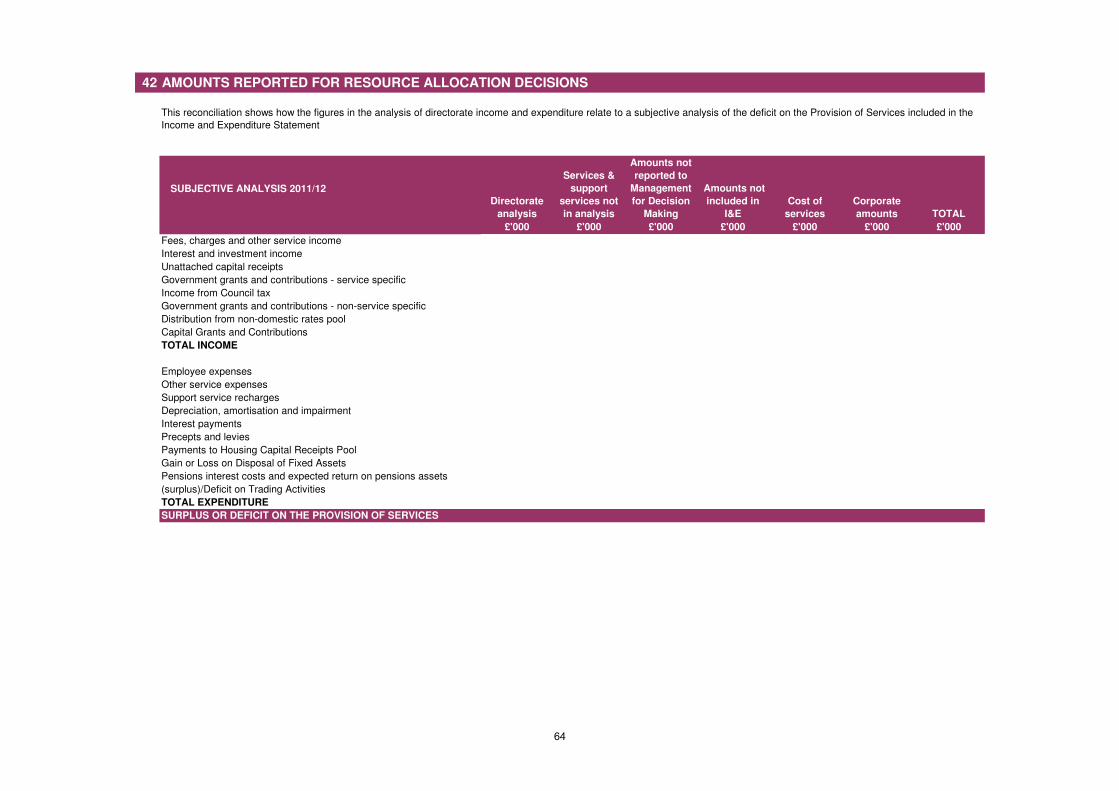
42 AMOUNTS REPORTED FOR RESOURCE ALLOCATION DECISIONS
SUBJECTIVE ANALYSIS 2011/12
Directorate
analysis
Services &
support
services not
in analysis
Amounts not
reported to
Management
for Decision
Making
Amounts not
included in
I&E
Cost of
services
Corporate
amounts TOTAL
£'000 £'000 £'000 £'000 £'000 £'000 £'000
Fees, charges and other service income 0 (91,622) (21,898) 0 (113,520) (113,520)
Interest and investment income 0 0 (2,838) (2,838)
Unattached capital receipts 0 (4,193) (4,193)
Government grants and contributions - service specific 0 (2,517) (2,517) (2,517)
Income from Council tax 0 (78,161) (78,161)
Government grants and contributions - non-service specific 0 0 0
Distribution from non-domestic rates pool 0 (175,443) (175,443)
Capital Grants and Contributions (116,247) (116,247)
TOTAL INCOME 0 (94,139) (21,898) 0 (116,037) (376,882) (492,919)
Employee expenses 309,613 (4,482) 0 0 305,131 0 305,131
Other service expenses 0 32,322 6,512 3,255 42,089 42,089
Support service recharges 0 (71,480) 0 0 (71,480) (71,480)
Depreciation, amortisation and impairment 294,864 0 294,864 294,864
Interest payments 0 26,649 26,649
Precepts and levies 0 1,738 1,738
Payments to Housing Capital Receipts Pool 0 0 24 24
Gain or Loss on Disposal of Fixed Assets 0 132,881 132,881
Pensions interest costs and expected return on pensions assets 0 8,004 8,004
(surplus)/Deficit on Trading Activities 0 (179) (179)
TOTAL EXPENDITURE 309,613 251,224 6,512 3,255 570,604 169,117 739,721
SURPLUS OR DEFICIT ON THE PROVISION OF SERVICES
This reconciliation shows how the figures in the analysis of directorate income and expenditure relate to a subjective analysis of the deficit on the Provision of Services included in the
Income and Expenditure Statement
64
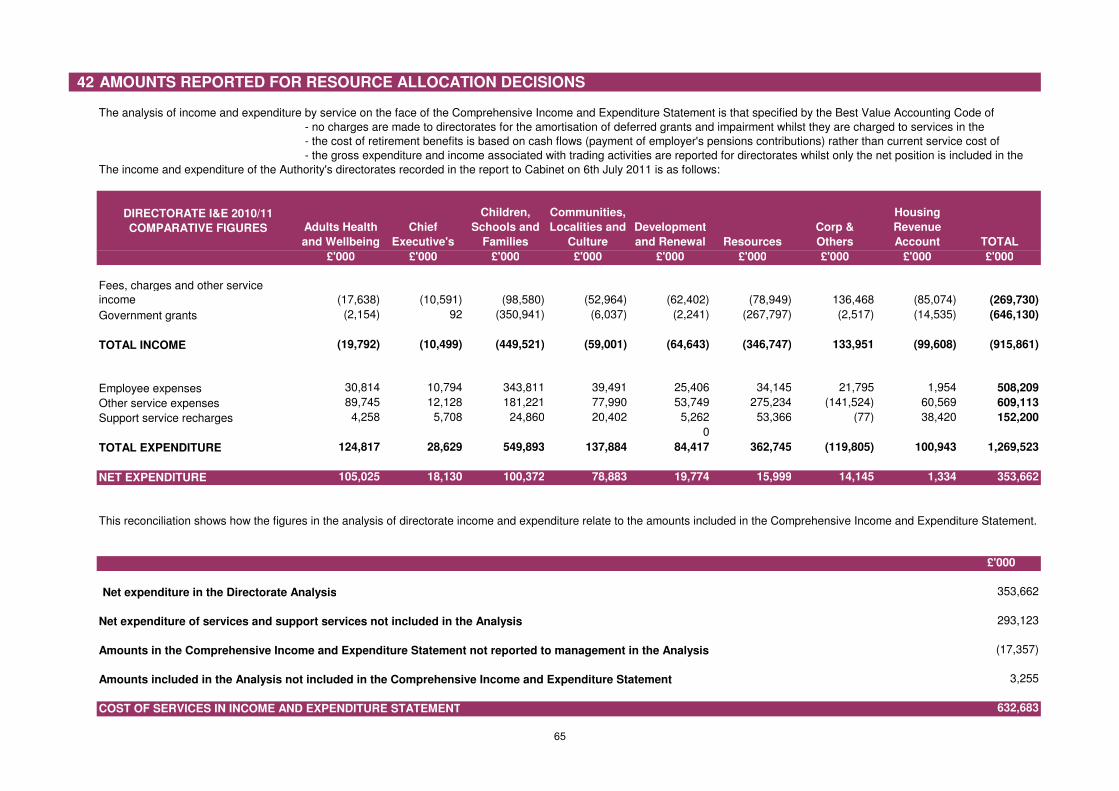
42 AMOUNTS REPORTED FOR RESOURCE ALLOCATION DECISIONS
The income and expenditure of the Authority's directorates recorded in the report to Cabinet on 6th July 2011 is as follows:
DIRECTORATE I&E 2010/11
COMPARATIVE FIGURES Adults Health
and Wellbeing
Chief
Executive's
Children,
Schools and
Families
Communities,
Localities and
Culture
Development
and Renewal Resources
Corp &
Others
Housing
Revenue
Account TOTAL
£'000 £'000 £'000 £'000 £'000 £'000 £'000 £'000 £'000
Fees, charges and other service
income (17,638) (10,591) (98,580) (52,964) (62,402) (78,949) 136,468 (85,074) (269,730)
Government grants (2,154) 92 (350,941) (6,037) (2,241) (267,797) (2,517) (14,535) (646,130)
TOTAL INCOME (19,792) (10,499) (449,521) (59,001) (64,643) (346,747) 133,951 (99,608) (915,861)
Employee expenses 30,814 10,794 343,811 39,491 25,406 34,145 21,795 1,954 508,209
Other service expenses 89,745 12,128 181,221 77,990 53,749 275,234 (141,524) 60,569 609,113
Support service recharges 4,258 5,708 24,860 20,402 5,262 53,366 (77) 38,420 152,200
0
TOTAL EXPENDITURE 124,817 28,629 549,893 137,884 84,417 362,745 (119,805) 100,943 1,269,523
NET EXPENDITURE 105,025 18,130 100,372 78,883 19,774 15,999 14,145 1,334 353,662
£'000
Net expenditure in the Directorate Analysis 353,662
Net expenditure of services and support services not included in the Analysis 293,123
Amounts in the Comprehensive Income and Expenditure Statement not reported to management in the Analysis (17,357)
Amounts included in the Analysis not included in the Comprehensive Income and Expenditure Statement 3,255
COST OF SERVICES IN INCOME AND EXPENDITURE STATEMENT 632,683
The analysis of income and expenditure by service on the face of the Comprehensive Income and Expenditure Statement is that specified by the Best Value Accounting Code of
- no charges are made to directorates for the amortisation of deferred grants and impairment whilst they are charged to services in the
- the cost of retirement benefits is based on cash flows (payment of employer's pensions contributions) rather than current service cost of
- the gross expenditure and income associated with trading activities are reported for directorates whilst only the net position is included in the
This reconciliation shows how the figures in the analysis of directorate income and expenditure relate to the amounts included in the Comprehensive Income and Expenditure Statement.
65
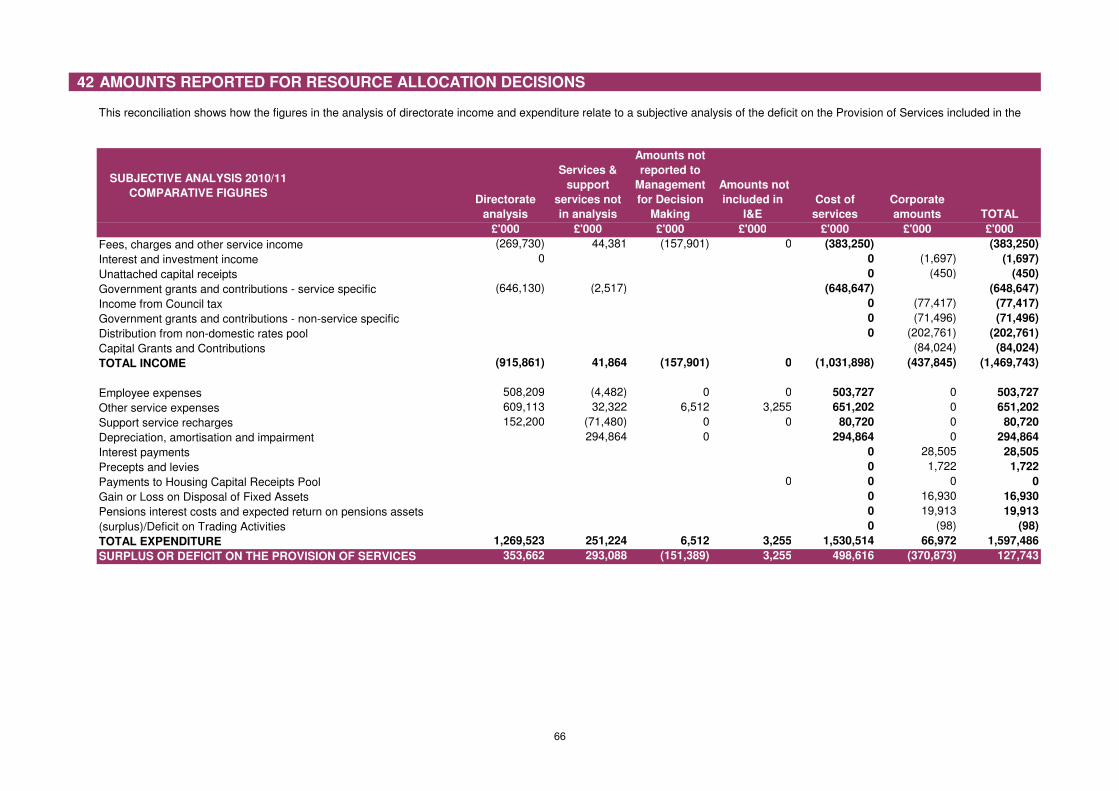
42 AMOUNTS REPORTED FOR RESOURCE ALLOCATION DECISIONS
SUBJECTIVE ANALYSIS 2010/11
COMPARATIVE FIGURESDirectorate
analysis
Services &
support
services not
in analysis
Amounts not
reported to
Management
for Decision
Making
Amounts not
included in
I&E
Cost of
services
Corporate
amounts TOTAL
£'000 £'000 £'000 £'000 £'000 £'000 £'000
Fees, charges and other service income (269,730) 44,381 (157,901) 0 (383,250) (383,250)
Interest and investment income 0 0 (1,697) (1,697)
Unattached capital receipts 0 (450) (450)
Government grants and contributions - service specific (646,130) (2,517) (648,647) (648,647)
Income from Council tax 0 (77,417) (77,417)
Government grants and contributions - non-service specific 0 (71,496) (71,496)
Distribution from non-domestic rates pool 0 (202,761) (202,761)
Capital Grants and Contributions (84,024) (84,024)
TOTAL INCOME (915,861) 41,864 (157,901) 0 (1,031,898) (437,845) (1,469,743)
Employee expenses 508,209 (4,482) 0 0 503,727 0 503,727
Other service expenses 609,113 32,322 6,512 3,255 651,202 0 651,202
Support service recharges 152,200 (71,480) 0 0 80,720 0 80,720
Depreciation, amortisation and impairment 294,864 0 294,864 0 294,864
Interest payments 0 28,505 28,505
Precepts and levies 0 1,722 1,722
Payments to Housing Capital Receipts Pool 0 0 0 0
Gain or Loss on Disposal of Fixed Assets 0 16,930 16,930
Pensions interest costs and expected return on pensions assets 0 19,913 19,913
(surplus)/Deficit on Trading Activities 0 (98) (98)
TOTAL EXPENDITURE 1,269,523 251,224 6,512 3,255 1,530,514 66,972 1,597,486
SURPLUS OR DEFICIT ON THE PROVISION OF SERVICES 353,662 293,088 (151,389) 3,255 498,616 (370,873) 127,743
This reconciliation shows how the figures in the analysis of directorate income and expenditure relate to a subjective analysis of the deficit on the Provision of Services included in the
66
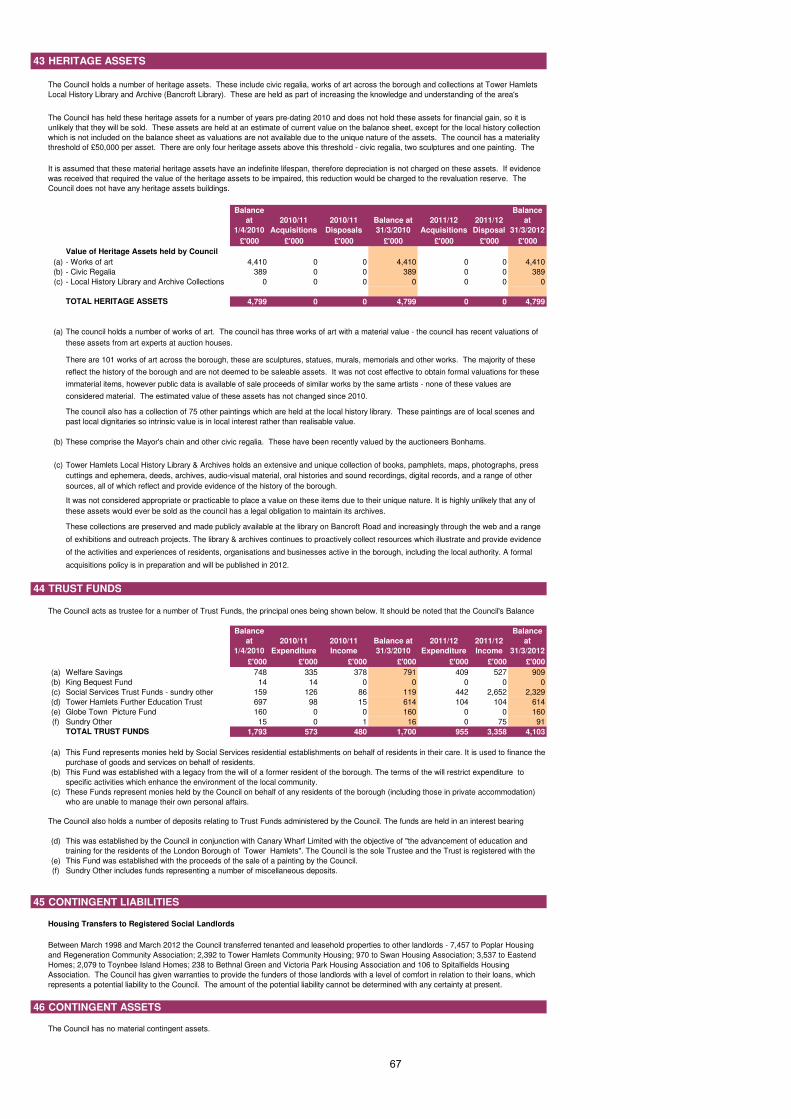
43 HERITAGE ASSETS
Balance
at
1/4/2010
2010/11
Acquisitions
2010/11
Disposals
Balance at
31/3/2010
2011/12
Acquisitions
2011/12
Disposal
Balance
at
31/3/2012
£'000 £'000 £'000 £'000 £'000 £'000 £'000
(a) 4,410 0 0 4,410 0 0 4,410
(b) 389 0 0 389 0 0 389
(c) 0 0 0 0 0 0 0
4,799 0 0 4,799 0 0 4,799
(a)
(b)
(c)
44 TRUST FUNDS
Balance
at
1/4/2010
2010/11
Expenditure
2010/11
Income
Balance at
31/3/2010
2011/12
Expenditure
2011/12
Income
Balance
at
31/3/2012
£'000 £'000 £'000 £'000 £'000 £'000 £'000
(a) 748 335 378 791 409 527 909
(b) 14 14 0 0 0 0 0
(c) 159 126 86 119 442 2,652 2,329
(d) 697 98 15 614 104 104 614
(e) 160 0 0 160 0 0 160
(f) 15 0 1 16 0 75 91
1,793 573 480 1,700 955 3,358 4,103
(a)
(b)
(c)
(d)
(e)
(f)
45 CONTINGENT LIABILITIES
Housing Transfers to Registered Social Landlords
46 CONTINGENT ASSETS
The Council has no material contingent assets.
This Fund was established with a legacy from the will of a former resident of the borough. The terms of the will restrict expenditure to
specific activities which enhance the environment of the local community.
These Funds represent monies held by the Council on behalf of any residents of the borough (including those in private accommodation)
who are unable to manage their own personal affairs.
Between March 1998 and March 2012 the Council transferred tenanted and leasehold properties to other landlords - 7,457 to Poplar Housing
and Regeneration Community Association; 2,392 to Tower Hamlets Community Housing; 970 to Swan Housing Association; 3,537 to Eastend
Homes; 2,079 to Toynbee Island Homes; 238 to Bethnal Green and Victoria Park Housing Association and 106 to Spitalfields Housing
Association. The Council has given warranties to provide the funders of those landlords with a level of comfort in relation to their loans, which
represents a potential liability to the Council. The amount of the potential liability cannot be determined with any certainty at present.
The Council also holds a number of deposits relating to Trust Funds administered by the Council. The funds are held in an interest bearing
This was established by the Council in conjunction with Canary Wharf Limited with the objective of "the advancement of education and
training for the residents of the London Borough of Tower Hamlets". The Council is the sole Trustee and the Trust is registered with the
This Fund was established with the proceeds of the sale of a painting by the Council.
Sundry Other includes funds representing a number of miscellaneous deposits.
Tower Hamlets Further Education Trust
Globe Town Picture Fund
Sundry Other
TOTAL TRUST FUNDS
This Fund represents monies held by Social Services residential establishments on behalf of residents in their care. It is used to finance the
purchase of goods and services on behalf of residents.
These comprise the Mayor's chain and other civic regalia. These have been recently valued by the auctioneers Bonhams.
Tower Hamlets Local History Library & Archives holds an extensive and unique collection of books, pamphlets, maps, photographs, press
cuttings and ephemera, deeds, archives, audio-visual material, oral histories and sound recordings, digital records, and a range of other
sources, all of which reflect and provide evidence of the history of the borough.
Welfare Savings
King Bequest Fund
Social Services Trust Funds - sundry other
It was not considered appropriate or practicable to place a value on these items due to their unique nature. It is highly unlikely that any of
these assets would ever be sold as the council has a legal obligation to maintain its archives.
These collections are preserved and made publicly available at the library on Bancroft Road and increasingly through the web and a range
of exhibitions and outreach projects. The library & archives continues to proactively collect resources which illustrate and provide evidence
of the activities and experiences of residents, organisations and businesses active in the borough, including the local authority. A formal
acquisitions policy is in preparation and will be published in 2012.
The Council acts as trustee for a number of Trust Funds, the principal ones being shown below. It should be noted that the Council's Balance
The Council holds a number of heritage assets. These include civic regalia, works of art across the borough and collections at Tower Hamlets
Local History Library and Archive (Bancroft Library). These are held as part of increasing the knowledge and understanding of the area's
history.
Value of Heritage Assets held by Council
- Works of art
- Civic Regalia
- Local History Library and Archive Collections
The Council has held these heritage assets for a number of years pre-dating 2010 and does not hold these assets for financial gain, so it is
unlikely that they will be sold. These assets are held at an estimate of current value on the balance sheet, except for the local history collection
which is not included on the balance sheet as valuations are not available due to the unique nature of the assets. The council has a materiality
threshold of £50,000 per asset. There are only four heritage assets above this threshold - civic regalia, two sculptures and one painting. The
council has held these assets for a number of years. It was not practicable or cost effective to obtain valuations prior to 2010.
It is assumed that these material heritage assets have an indefinite lifespan, therefore depreciation is not charged on these assets. If evidence
was received that required the value of the heritage assets to be impaired, this reduction would be charged to the revaluation reserve. The
Council does not have any heritage assets buildings.
The council also has a collection of 75 other paintings which are held at the local history library. These paintings are of local scenes and
past local dignitaries so intrinsic value is in local interest rather than realisable value.
TOTAL HERITAGE ASSETS
The council holds a number of works of art. The council has three works of art with a material value - the council has recent valuations of
these assets from art experts at auction houses.
There are 101 works of art across the borough, these are sculptures, statues, murals, memorials and other works. The majority of these
reflect the history of the borough and are not deemed to be saleable assets. It was not cost effective to obtain formal valuations for these
immaterial items, however public data is available of sale proceeds of similar works by the same artists - none of these values are
considered material. The estimated value of these assets has not changed since 2010.
67
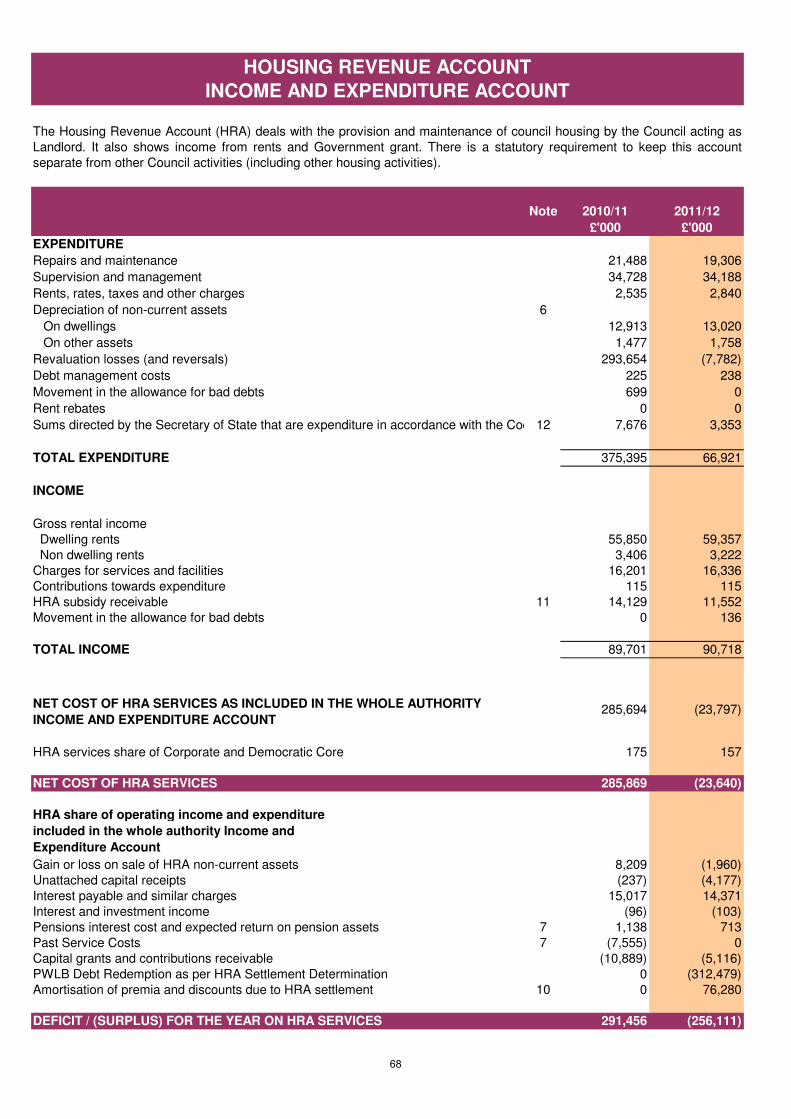
Note 2010/11 2011/12
£'000 £'000
EXPENDITURE
Repairs and maintenance 21,488 19,306
Supervision and management 34,728 34,188
Rents, rates, taxes and other charges 2,535 2,840
Depreciation of non-current assets 6
On dwellings 12,913 13,020
On other assets 1,477 1,758
Revaluation losses (and reversals) 293,654 (7,782)
Debt management costs 225 238
Movement in the allowance for bad debts 699 0
Rent rebates 0 0
Sums directed by the Secretary of State that are expenditure in accordance with the Code12 7,676 3,353
TOTAL EXPENDITURE 375,395 66,921
INCOME
Gross rental income
Dwelling rents 55,850 59,357
Non dwelling rents 3,406 3,222
Charges for services and facilities 16,201 16,336
Contributions towards expenditure 115 115
HRA subsidy receivable 11 14,129 11,552
Movement in the allowance for bad debts 0 136
TOTAL INCOME 89,701 90,718
285,694 (23,797)
HRA services share of Corporate and Democratic Core 175 157
NET COST OF HRA SERVICES 285,869 (23,640)
HRA share of operating income and expenditure
included in the whole authority Income and
Expenditure Account
Gain or loss on sale of HRA non-current assets 8,209 (1,960)
Unattached capital receipts (237) (4,177)
Interest payable and similar charges 15,017 14,371
Interest and investment income (96) (103)
Pensions interest cost and expected return on pension assets 7 1,138 713
Past Service Costs 7 (7,555) 0
Capital grants and contributions receivable (10,889) (5,116)
PWLB Debt Redemption as per HRA Settlement Determination 0 (312,479)
Amortisation of premia and discounts due to HRA settlement 10 0 76,280
DEFICIT / (SURPLUS) FOR THE YEAR ON HRA SERVICES 291,456 (256,111)
The Housing Revenue Account (HRA) deals with the provision and maintenance of council housing by the Council acting as
Landlord. It also shows income from rents and Government grant. There is a statutory requirement to keep this account
separate from other Council activities (including other housing activities).
HOUSING REVENUE ACCOUNT
INCOME AND EXPENDITURE ACCOUNT
NET COST OF HRA SERVICES AS INCLUDED IN THE WHOLE AUTHORITY
INCOME AND EXPENDITURE ACCOUNT
68
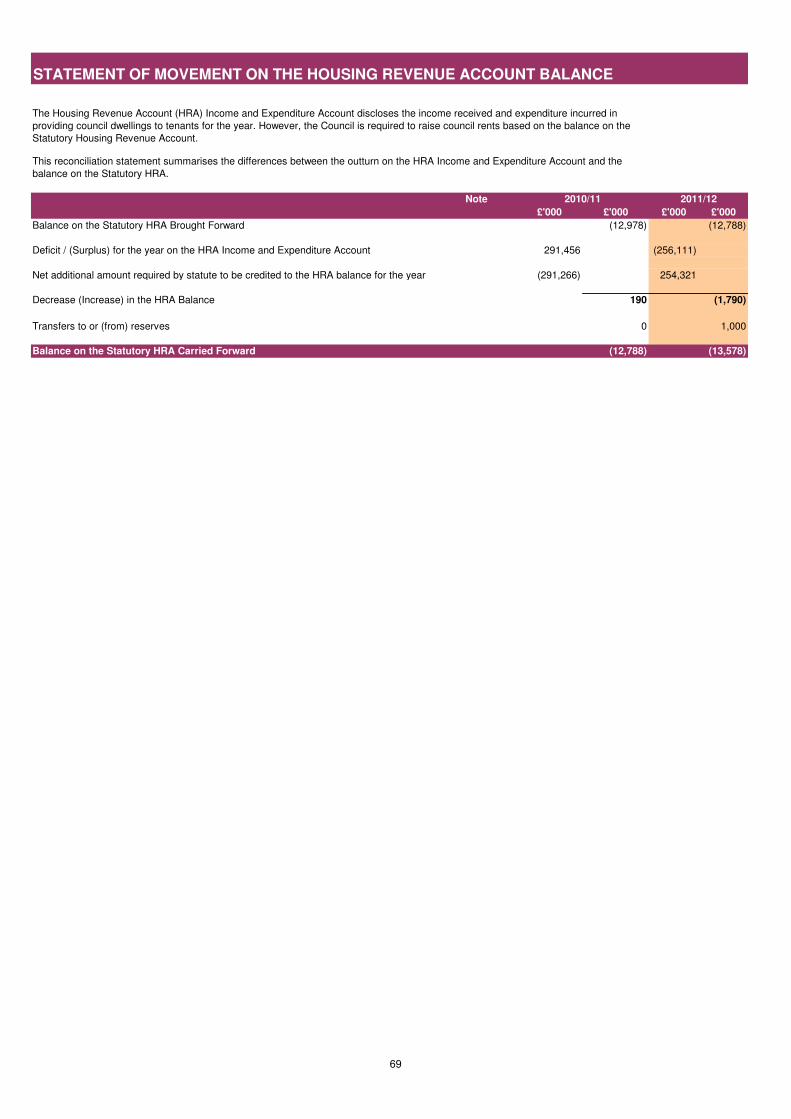
STATEMENT OF MOVEMENT ON THE HOUSING REVENUE ACCOUNT BALANCE
Note
£'000 £'000 £'000 £'000
Balance on the Statutory HRA Brought Forward (12,978) (12,788)
291,456 (256,111)
(291,266) 254,321
Decrease (Increase) in the HRA Balance 190 (1,790)
Transfers to or (from) reserves 0 1,000
Balance on the Statutory HRA Carried Forward (12,788) (13,578)
2011/12
Net additional amount required by statute to be credited to the HRA balance for the year 1
Deficit / (Surplus) for the year on the HRA Income and Expenditure Account
The Housing Revenue Account (HRA) Income and Expenditure Account discloses the income received and expenditure incurred in
providing council dwellings to tenants for the year. However, the Council is required to raise council rents based on the balance on the
Statutory Housing Revenue Account.
This reconciliation statement summarises the differences between the outturn on the HRA Income and Expenditure Account and the
balance on the Statutory HRA.
2010/11
69
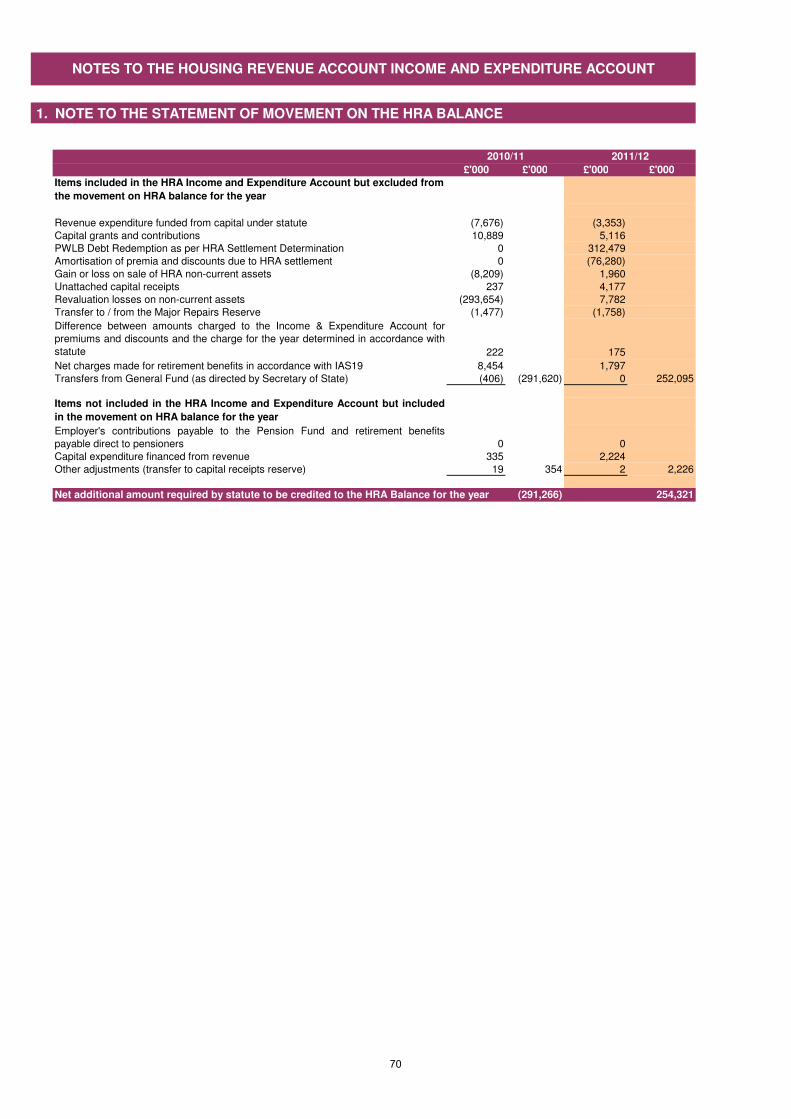
1. NOTE TO THE STATEMENT OF MOVEMENT ON THE HRA BALANCE
£'000 £'000 £'000 £'000
Items included in the HRA Income and Expenditure Account but excluded from
the movement on HRA balance for the year
Revenue expenditure funded from capital under statute (7,676) (3,353)
Capital grants and contributions 10,889 5,116
PWLB Debt Redemption as per HRA Settlement Determination 0 312,479
Amortisation of premia and discounts due to HRA settlement 0 (76,280)
Gain or loss on sale of HRA non-current assets (8,209) 1,960
Unattached capital receipts 237 4,177
Revaluation losses on non-current assets (293,654) 7,782
Transfer to / from the Major Repairs Reserve (1,477) (1,758)
Difference between amounts charged to the Income & Expenditure Account for
premiums and discounts and the charge for the year determined in accordance with
statute 222 175
Net charges made for retirement benefits in accordance with IAS19 8,454 1,797
Transfers from General Fund (as directed by Secretary of State) (406) (291,620) 0 252,095
Items not included in the HRA Income and Expenditure Account but included
in the movement on HRA balance for the year
Employer's contributions payable to the Pension Fund and retirement benefits
payable direct to pensioners 0 0
Capital expenditure financed from revenue 335 2,224
Other adjustments (transfer to capital receipts reserve) 19 354 2 2,226
Net additional amount required by statute to be credited to the HRA Balance for the year (291,266) 254,321
2011/12
NOTES TO THE HOUSING REVENUE ACCOUNT INCOME AND EXPENDITURE ACCOUNT
2010/11
70
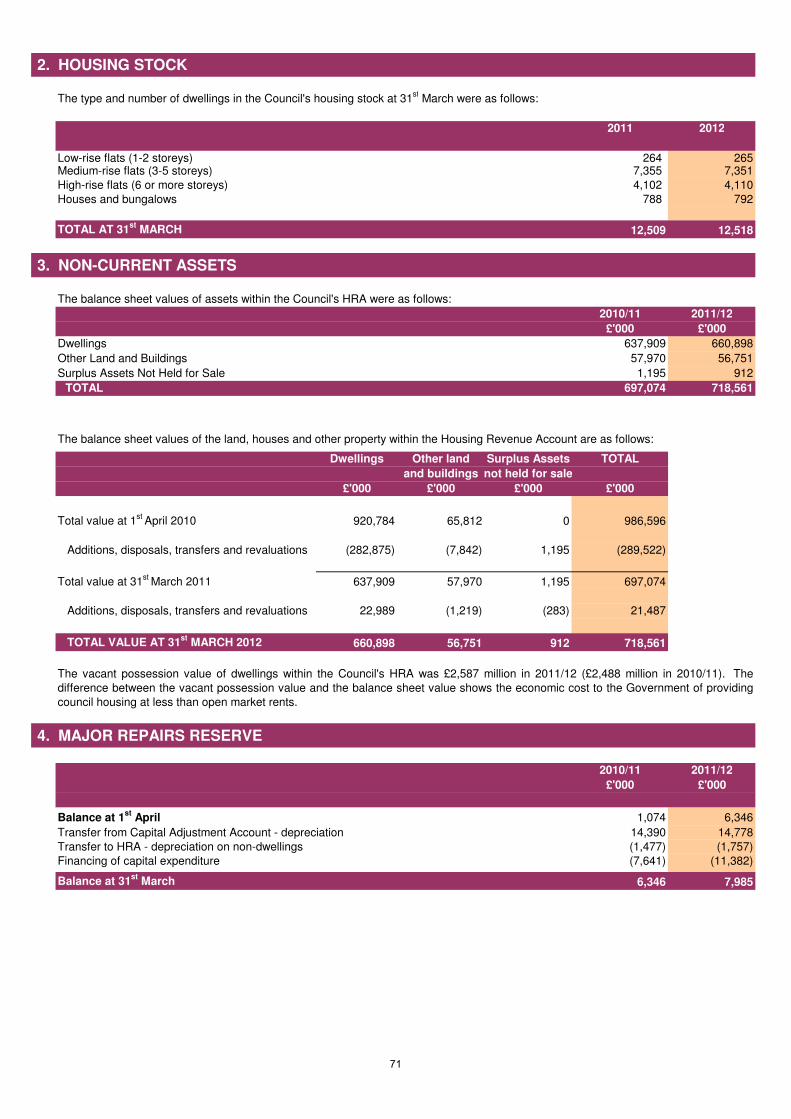
2. HOUSING STOCK
2011 2012
264 2657,355 7,351
4,102 4,110
788 792
TOTAL AT 31st
MARCH 12,509 12,518
3. NON-CURRENT ASSETS
The balance sheet values of assets within the Council's HRA were as follows:
2010/11 2011/12
£'000 £'000
637,909 660,898
Other Land and Buildings 57,970 56,751
Surplus Assets Not Held for Sale 1,195 912
TOTAL 697,074 718,561
Dwellings Other land Surplus Assets TOTAL
and buildings not held for sale
£'000 £'000 £'000 £'000
Total value at 1st
April 2010 920,784 65,812 0 986,596
Additions, disposals, transfers and revaluations (282,875) (7,842) 1,195 (289,522)
Total value at 31st
March 2011 637,909 57,970 1,195 697,074
Additions, disposals, transfers and revaluations 22,989 (1,219) (283) 21,487
TOTAL VALUE AT 31st
MARCH 2012 660,898 56,751 912 718,561
4. MAJOR REPAIRS RESERVE
2010/11 2011/12
£'000 £'000
1,074 6,346
Transfer from Capital Adjustment Account - depreciation 14,390 14,778
(1,477) (1,757)
(7,641) (11,382)
Balance at 31st
March 6,346 7,985
Houses and bungalows
The type and number of dwellings in the Council's housing stock at 31st March were as follows:
Low-rise flats (1-2 storeys)Medium-rise flats (3-5 storeys)
High-rise flats (6 or more storeys)
Balance at 1st
April
Transfer to HRA - depreciation on non-dwellings
Financing of capital expenditure
Dwellings
The vacant possession value of dwellings within the Council's HRA was £2,587 million in 2011/12 (£2,488 million in 2010/11). The
difference between the vacant possession value and the balance sheet value shows the economic cost to the Government of providing
council housing at less than open market rents.
The balance sheet values of the land, houses and other property within the Housing Revenue Account are as follows:
71
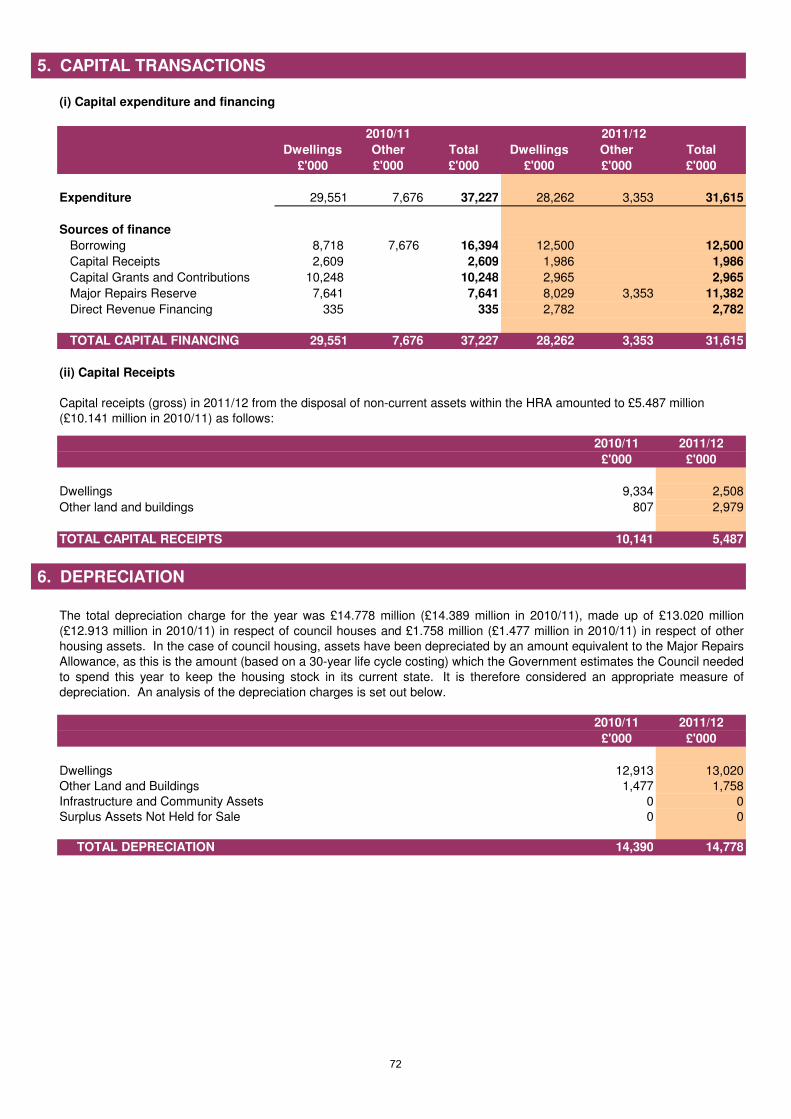
5. CAPITAL TRANSACTIONS
(i) Capital expenditure and financing
Dwellings Other Total Dwellings Other Total
£'000 £'000 £'000 £'000 £'000 £'000
Expenditure 29,551 7,676 37,227 28,262 3,353 31,615
Sources of finance
Borrowing 8,718 7,676 16,394 12,500 12,500
Capital Receipts 2,609 2,609 1,986 1,986
Capital Grants and Contributions 10,248 10,248 2,965 2,965
Major Repairs Reserve 7,641 7,641 8,029 3,353 11,382
Direct Revenue Financing 335 335 2,782 2,782
TOTAL CAPITAL FINANCING 29,551 7,676 37,227 28,262 3,353 31,615
(ii) Capital Receipts
2010/11 2011/12
£'000 £'000
Dwellings 9,334 2,508
Other land and buildings 807 2,979
TOTAL CAPITAL RECEIPTS 10,141 5,487
6. DEPRECIATION
2010/11 2011/12
£'000 £'000
Dwellings 12,913 13,020
Other Land and Buildings 1,477 1,758
Infrastructure and Community Assets 0 0
Surplus Assets Not Held for Sale 0 0
TOTAL DEPRECIATION 14,390 14,778
2011/122010/11
Capital receipts (gross) in 2011/12 from the disposal of non-current assets within the HRA amounted to £5.487 million
(£10.141 million in 2010/11) as follows:
The total depreciation charge for the year was £14.778 million (£14.389 million in 2010/11), made up of £13.020 million
(£12.913 million in 2010/11) in respect of council houses and £1.758 million (£1.477 million in 2010/11) in respect of other
housing assets. In the case of council housing, assets have been depreciated by an amount equivalent to the Major Repairs
Allowance, as this is the amount (based on a 30-year life cycle costing) which the Government estimates the Council needed
to spend this year to keep the housing stock in its current state. It is therefore considered an appropriate measure of
depreciation. An analysis of the depreciation charges is set out below.
72
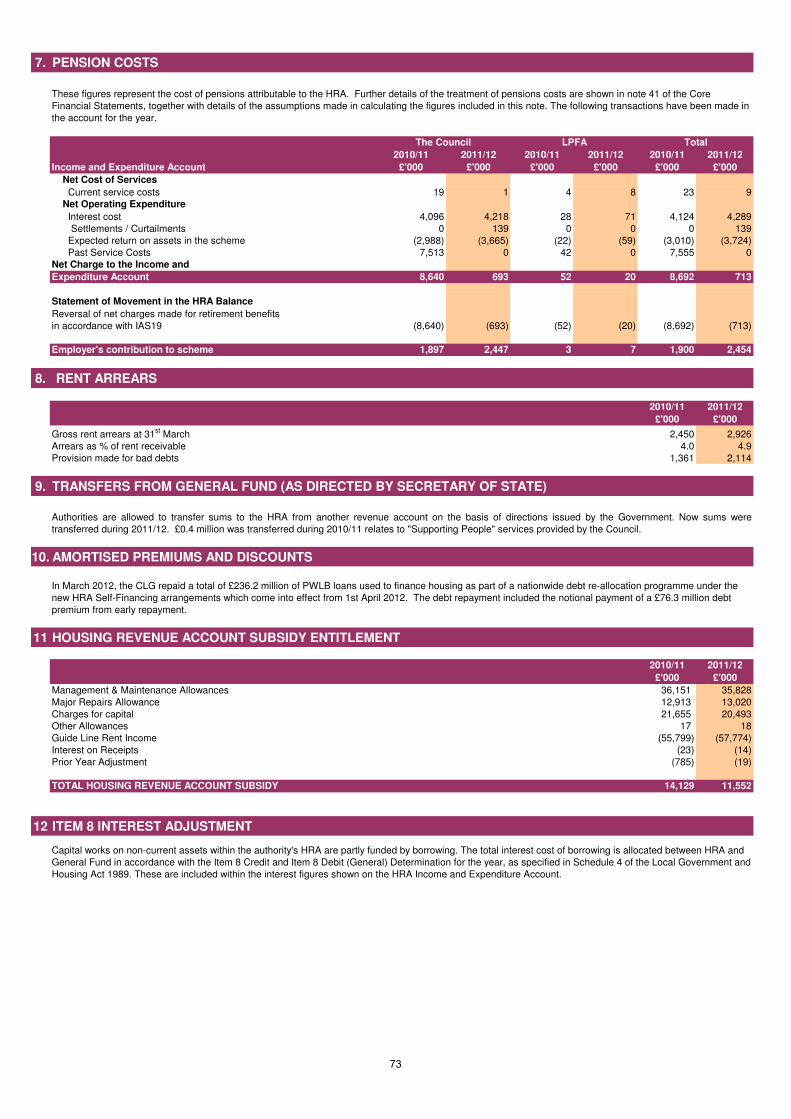
7. PENSION COSTS
2010/11 2011/12 2010/11 2011/12 2010/11 2011/12
Income and Expenditure Account £'000 £'000 £'000 £'000 £'000 £'000
19 1 4 8 23 9
4,096 4,218 28 71 4,124 4,289
Settlements / Curtailments 0 139 0 0 0 139
(2,988) (3,665) (22) (59) (3,010) (3,724)
7,513 0 42 0 7,555 0
Expenditure Account 8,640 693 52 20 8,692 713
Statement of Movement in the HRA Balance
(8,640) (693) (52) (20) (8,692) (713)
Employer's contribution to scheme 1,897 2,447 3 7 1,900 2,454
8. RENT ARREARS
2010/11 2011/12
£'000 £'000
2,450 2,926
4.0 4.9
1,361 2,114
9. TRANSFERS FROM GENERAL FUND (AS DIRECTED BY SECRETARY OF STATE)
10. AMORTISED PREMIUMS AND DISCOUNTS
11 HOUSING REVENUE ACCOUNT SUBSIDY ENTITLEMENT
2010/11 2011/12
£'000 £'000
Management & Maintenance Allowances 36,151 35,828
Major Repairs Allowance 12,913 13,020
Charges for capital 21,655 20,493
Other Allowances 17 18
Guide Line Rent Income (55,799) (57,774)
Interest on Receipts (23) (14)
Prior Year Adjustment (785) (19)
TOTAL HOUSING REVENUE ACCOUNT SUBSIDY 14,129 11,552
12 ITEM 8 INTEREST ADJUSTMENT
Interest cost
These figures represent the cost of pensions attributable to the HRA. Further details of the treatment of pensions costs are shown in note 41 of the Core
Financial Statements, together with details of the assumptions made in calculating the figures included in this note. The following transactions have been made in
the account for the year.
The Council LPFA Total
Net Cost of Services
Current service costs
Net Operating Expenditure
Gross rent arrears at 31st March
Expected return on assets in the scheme
Past Service Costs
Net Charge to the Income and
Reversal of net charges made for retirement benefits
in accordance with IAS19
Capital works on non-current assets within the authority's HRA are partly funded by borrowing. The total interest cost of borrowing is allocated between HRA and
General Fund in accordance with the Item 8 Credit and Item 8 Debit (General) Determination for the year, as specified in Schedule 4 of the Local Government and
Housing Act 1989. These are included within the interest figures shown on the HRA Income and Expenditure Account.
Arrears as % of rent receivable
Provision made for bad debts
Authorities are allowed to transfer sums to the HRA from another revenue account on the basis of directions issued by the Government. Now sums were
transferred during 2011/12. £0.4 million was transferred during 2010/11 relates to "Supporting People" services provided by the Council.
In March 2012, the CLG repaid a total of £236.2 million of PWLB loans used to finance housing as part of a nationwide debt re-allocation programme under the
new HRA Self-Financing arrangements which come into effect from 1st April 2012. The debt repayment included the notional payment of a £76.3 million debt
premium from early repayment.
73
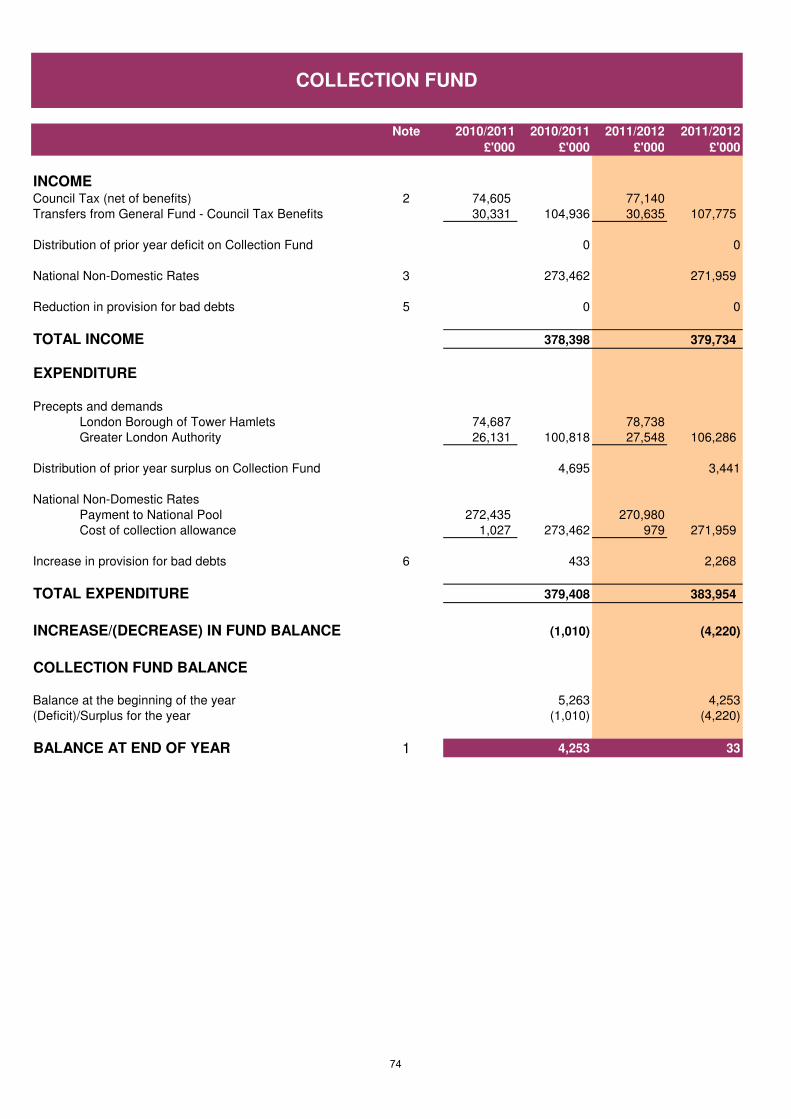
Note 2010/2011 2010/2011 2011/2012 2011/2012
£'000 £'000 £'000 £'000
INCOMECouncil Tax (net of benefits) 2 74,605 77,140
Transfers from General Fund - Council Tax Benefits 30,331 104,936 30,635 107,775
Distribution of prior year deficit on Collection Fund 0 0
National Non-Domestic Rates 3 273,462 271,959
Reduction in provision for bad debts 5 0 0
TOTAL INCOME 378,398 379,734
EXPENDITURE
Precepts and demands
London Borough of Tower Hamlets 74,687 78,738
Greater London Authority 26,131 100,818 27,548 106,286
Distribution of prior year surplus on Collection Fund 4,695 3,441
National Non-Domestic Rates
Payment to National Pool 272,435 270,980
Cost of collection allowance 1,027 273,462 979 271,959
Increase in provision for bad debts 6 433 2,268
TOTAL EXPENDITURE 379,408 383,954
INCREASE/(DECREASE) IN FUND BALANCE (1,010) (4,220)
COLLECTION FUND BALANCE
Balance at the beginning of the year 5,263 4,253
(Deficit)/Surplus for the year (1,010) (4,220)
BALANCE AT END OF YEAR 1 4,253 33
COLLECTION FUND
74
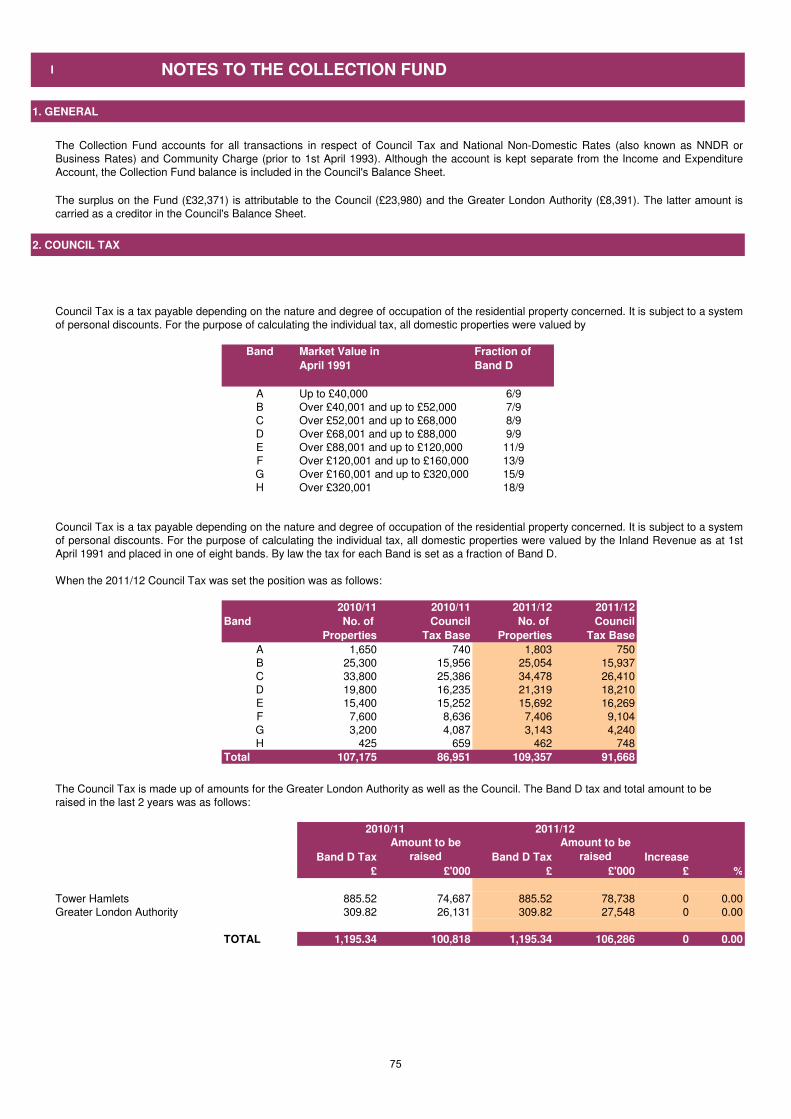
NOTES TO THE INCOME & EXPENDITURE ACCOUNT
1. GENERAL
2. COUNCIL TAX
Band Market Value in Fraction of
April 1991 Band D
A Up to £40,000 6/9
B Over £40,001 and up to £52,000 7/9
C Over £52,001 and up to £68,000 8/9
D Over £68,001 and up to £88,000 9/9
E Over £88,001 and up to £120,000 11/9
F Over £120,001 and up to £160,000 13/9
G Over £160,001 and up to £320,000 15/9
H Over £320,001 18/9
2010/11 2010/11 2011/12 2011/12
Band No. of Council No. of Council
Properties Tax Base Properties Tax Base
A 1,650 740 1,803 750
B 25,300 15,956 25,054 15,937
C 33,800 25,386 34,478 26,410
D 19,800 16,235 21,319 18,210
E 15,400 15,252 15,692 16,269
F 7,600 8,636 7,406 9,104
G 3,200 4,087 3,143 4,240
H 425 659 462 748
Total 107,175 86,951 109,357 91,668
Band D Tax
Amount to be
raised Band D Tax
Amount to be
raised Increase
£ £'000 £ £'000 £ %
Tower Hamlets 885.52 74,687 885.52 78,738 0 0.00
Greater London Authority 309.82 26,131 309.82 27,548 0 0.00
TOTAL 1,195.34 100,818 1,195.34 106,286 0 0.00
NOTES TO THE COLLECTION FUND
2010/11 2011/12
The Collection Fund accounts for all transactions in respect of Council Tax and National Non-Domestic Rates (also known as NNDR or
Business Rates) and Community Charge (prior to 1st April 1993). Although the account is kept separate from the Income and Expenditure
Account, the Collection Fund balance is included in the Council's Balance Sheet.
The surplus on the Fund (£32,371) is attributable to the Council (£23,980) and the Greater London Authority (£8,391). The latter amount is
carried as a creditor in the Council's Balance Sheet.
Council Tax is a tax payable depending on the nature and degree of occupation of the residential property concerned. It is subject to a system
of personal discounts. For the purpose of calculating the individual tax, all domestic properties were valued by
When the 2011/12 Council Tax was set the position was as follows:
The Council Tax is made up of amounts for the Greater London Authority as well as the Council. The Band D tax and total amount to be
raised in the last 2 years was as follows:
Council Tax is a tax payable depending on the nature and degree of occupation of the residential property concerned. It is subject to a system
of personal discounts. For the purpose of calculating the individual tax, all domestic properties were valued by the Inland Revenue as at 1st
April 1991 and placed in one of eight bands. By law the tax for each Band is set as a fraction of Band D.
75
3. NATIONAL NON-DOMESTIC RATES (NNDR)
4. CROSSRAIL BUSINESS RATE SUPPLEMENT
5. ADJUSTMENTS FOR PRIOR YEARS' COMMUNITY CHARGE
6. PROVISION FOR IRRECOVERABLE COUNCIL TAX DEBTS
Under the arrangements for National Non-Domestic Rates the Council collects business rates for its area which it pays to
the Government. The Government then redistributes the total NNDR back to local authorities on the basis of a fixed
amount per head of population. NNDR due is calculated by multiplying a national uniform rate(set by the Government) by
the rateable value of the property. The national uniform rate in 2011/12 was 43.4p in the £ (41.4p in the £ in 2010/11).
The total rateable value in the borough as at 31 March 2012 was £812.1 million (£817.1 million at 31 March 2011). A
periodic revaluation of business properties took place in April 2010.
The Greater London Authority (GLA) introduced a business rate supplement (BRS) on 1 April 2010 to finance £4.1 billion
of the costs of the £15.9 billion Crossrail project. Details on the progress of the project so far and the proposed policies
for the BRS in the 2011/12 financial year are set out below.
The Crossrail BRS will be used to finance £3.5 billion worth of borrowing by the GLA and the repayment of this sum after
the end of the Crossrail construction works. £800m of this was borrowed by the GLA in 2010/11 with a further £700m
scheduled to be drawn down in 2011/12. A further £600 million will be applied to fund the Crossrail construction and
financing costs. The GLA has already paid over £1 billion towards the project using revenues financed by the BRS. The
GLA expects the Crossrail BRS will run for a period of between 24 and 31 years until its borrowing is repaid.
The Crossrail BRS multiplier for 2011/12 was 2p per pound of rateable value. Reliefs for the Crossrail BRS applied on
the same basis and at the same percentage rate as for the National Non Domestic Rates (NNDR) bills although no
transitional relief was provided for the BRS.
www.london.gov.uk/crossrail-brs
Although Council Tax replaced Community Charge on 1st April 1993 the Council continues to account for residual
adjustments to the Community Charges raised in earlier years in the Collection Fund.
Contributions are made to or from the Collection Fund Income and Expenditure Account to a provision for bad debts. For
2011/12 the Council Tax bad debt provision was increased by £2.268 million (increased by £0.433 million in 2010/11)
and £1.884 million of irrecoverable debts were written off (£1.081 million in 2010/11).
76
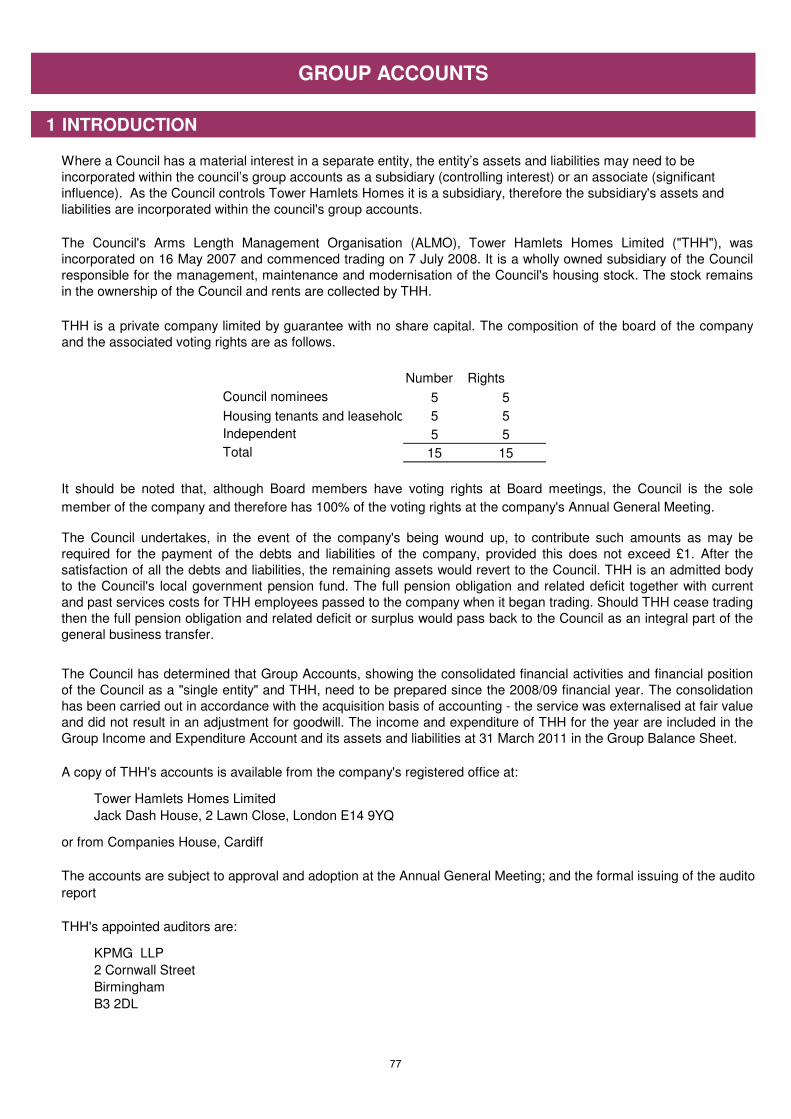
1 INTRODUCTION
Number Rights
Council nominees 5 5
Housing tenants and leaseholders 5 5
Independent 5 5
Total 15 15
Tower Hamlets Homes Limited
Jack Dash House, 2 Lawn Close, London E14 9YQ
or from Companies House, Cardiff
The accounts are subject to approval and adoption at the Annual General Meeting; and the formal issuing of the auditors'
report
THH's appointed auditors are:
KPMG LLP
2 Cornwall Street
Birmingham
B3 2DL
GROUP ACCOUNTS
A copy of THH's accounts is available from the company's registered office at:
The Council's Arms Length Management Organisation (ALMO), Tower Hamlets Homes Limited ("THH"), was
incorporated on 16 May 2007 and commenced trading on 7 July 2008. It is a wholly owned subsidiary of the Council
responsible for the management, maintenance and modernisation of the Council's housing stock. The stock remains
in the ownership of the Council and rents are collected by THH.
The Council has determined that Group Accounts, showing the consolidated financial activities and financial position
of the Council as a "single entity" and THH, need to be prepared since the 2008/09 financial year. The consolidation
has been carried out in accordance with the acquisition basis of accounting - the service was externalised at fair value
and did not result in an adjustment for goodwill. The income and expenditure of THH for the year are included in the
Group Income and Expenditure Account and its assets and liabilities at 31 March 2011 in the Group Balance Sheet.
The Council undertakes, in the event of the company's being wound up, to contribute such amounts as may be
required for the payment of the debts and liabilities of the company, provided this does not exceed £1. After the
satisfaction of all the debts and liabilities, the remaining assets would revert to the Council. THH is an admitted body
to the Council's local government pension fund. The full pension obligation and related deficit together with current
and past services costs for THH employees passed to the company when it began trading. Should THH cease trading
then the full pension obligation and related deficit or surplus would pass back to the Council as an integral part of the
general business transfer.
THH is a private company limited by guarantee with no share capital. The composition of the board of the company
and the associated voting rights are as follows.
It should be noted that, although Board members have voting rights at Board meetings, the Council is the sole
member of the company and therefore has 100% of the voting rights at the company's Annual General Meeting.
Where a Council has a material interest in a separate entity, the entity’s assets and liabilities may need to be
incorporated within the council’s group accounts as a subsidiary (controlling interest) or an associate (significant
influence). As the Council controls Tower Hamlets Homes it is a subsidiary, therefore the subsidiary's assets and
liabilities are incorporated within the council's group accounts.
77
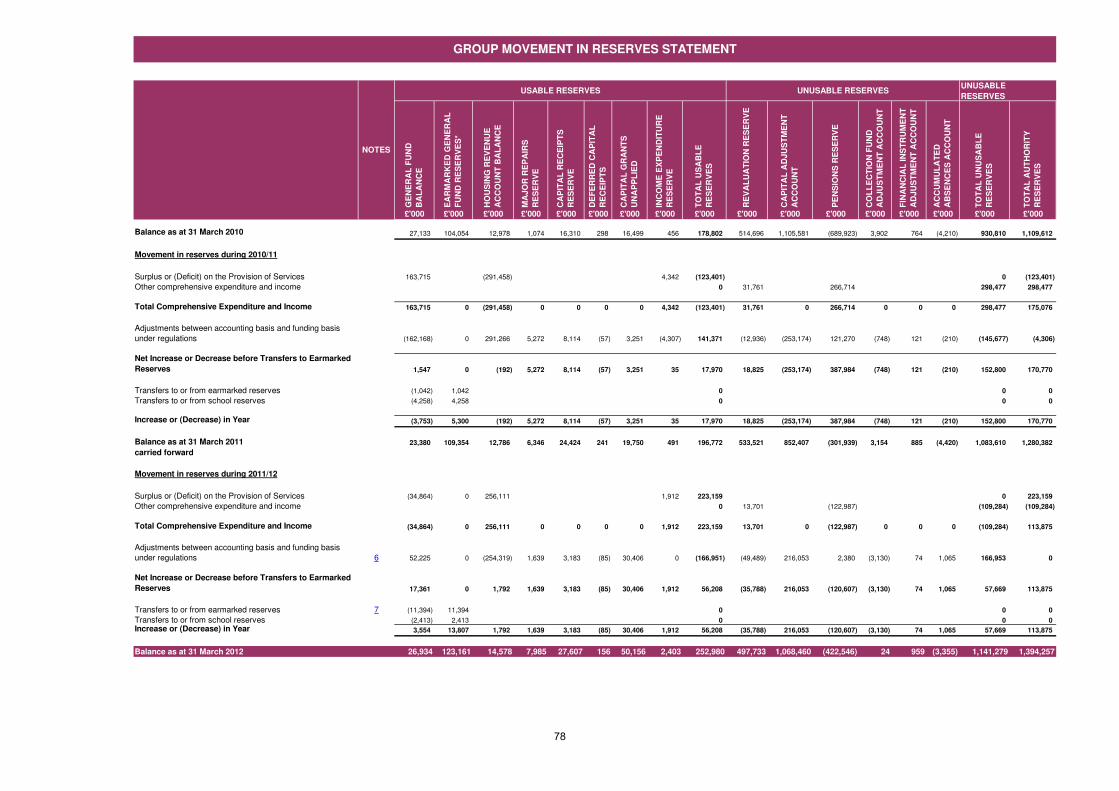
UNUSABLE
RESERVES
GE
NE
RA
L F
UN
D
BA
LA
NC
E
EA
RM
AR
KE
D G
EN
ER
AL
FU
ND
RE
SE
RV
ES
*
HO
US
ING
RE
VE
NU
E
AC
CO
UN
T B
AL
AN
CE
MA
JO
R R
EP
AIR
S
RE
SE
RV
E
CA
PIT
AL
RE
CE
IPT
S
RE
SE
RV
E
DE
FE
RR
ED
CA
PIT
AL
RE
CE
IPT
S
CA
PIT
AL
GR
AN
TS
UN
AP
PL
IED
INC
OM
E E
XP
EN
DIT
UR
E
RE
SE
RV
E
TO
TA
L U
SA
BL
E
RE
SE
RV
ES
RE
VA
LU
AT
ION
RE
SE
RV
E
CA
PIT
AL
AD
JU
ST
ME
NT
AC
CO
UN
T
PE
NS
ION
S R
ES
ER
VE
CO
LL
EC
TIO
N F
UN
D
AD
JU
ST
ME
NT
AC
CO
UN
T
FIN
AN
CIA
L IN
ST
RU
ME
NT
AD
JU
ST
ME
NT
AC
CO
UN
T
AC
CU
MU
LA
TE
D
AB
SE
NC
ES
AC
CO
UN
T
TO
TA
L U
NU
SA
BL
E
RE
SE
RV
ES
TO
TA
L A
UT
HO
RIT
Y
RE
SE
RV
ES
£'000 £'000 £'000 £'000 £'000 £'000 £'000 £'000 £'000 £'000 £'000 £'000 £'000 £'000 £'000 £'000 £'000
Balance as at 31 March 2010 27,133 104,054 12,978 1,074 16,310 298 16,499 456 178,802 514,696 1,105,581 (689,923) 3,902 764 (4,210) 930,810 1,109,612
Movement in reserves during 2010/11
Surplus or (Deficit) on the Provision of Services 163,715 (291,458) 4,342 (123,401) 0 (123,401)
Other comprehensive expenditure and income 0 31,761 266,714 298,477 298,477
Total Comprehensive Expenditure and Income 163,715 0 (291,458) 0 0 0 0 4,342 (123,401) 31,761 0 266,714 0 0 0 298,477 175,076
Adjustments between accounting basis and funding basis
under regulations (162,168) 0 291,266 5,272 8,114 (57) 3,251 (4,307) 141,371 (12,936) (253,174) 121,270 (748) 121 (210) (145,677) (4,306)
Net Increase or Decrease before Transfers to Earmarked
Reserves 1,547 0 (192) 5,272 8,114 (57) 3,251 35 17,970 18,825 (253,174) 387,984 (748) 121 (210) 152,800 170,770
Transfers to or from earmarked reserves (1,042) 1,042 0 0 0
Transfers to or from school reserves (4,258) 4,258 0 0 0
Increase or (Decrease) in Year (3,753) 5,300 (192) 5,272 8,114 (57) 3,251 35 17,970 18,825 (253,174) 387,984 (748) 121 (210) 152,800 170,770
Balance as at 31 March 2011 23,380 109,354 12,786 6,346 24,424 241 19,750 491 196,772 533,521 852,407 (301,939) 3,154 885 (4,420) 1,083,610 1,280,382
carried forward
Movement in reserves during 2011/12
Surplus or (Deficit) on the Provision of Services (34,864) 0 256,111 1,912 223,159 0 223,159
Other comprehensive expenditure and income 0 13,701 (122,987) (109,284) (109,284)
Total Comprehensive Expenditure and Income (34,864) 0 256,111 0 0 0 0 1,912 223,159 13,701 0 (122,987) 0 0 0 (109,284) 113,875
Adjustments between accounting basis and funding basis
under regulations 6 52,225 0 (254,319) 1,639 3,183 (85) 30,406 0 (166,951) (49,489) 216,053 2,380 (3,130) 74 1,065 166,953 0
Net Increase or Decrease before Transfers to Earmarked
Reserves 17,361 0 1,792 1,639 3,183 (85) 30,406 1,912 56,208 (35,788) 216,053 (120,607) (3,130) 74 1,065 57,669 113,875
Transfers to or from earmarked reserves 7 (11,394) 11,394 0 0 0
Transfers to or from school reserves (2,413) 2,413 0 0 0
Increase or (Decrease) in Year 3,554 13,807 1,792 1,639 3,183 (85) 30,406 1,912 56,208 (35,788) 216,053 (120,607) (3,130) 74 1,065 57,669 113,875
Balance as at 31 March 2012 26,934 123,161 14,578 7,985 27,607 156 50,156 2,403 252,980 497,733 1,068,460 (422,546) 24 959 (3,355) 1,141,279 1,394,257
GROUP MOVEMENT IN RESERVES STATEMENT
USABLE RESERVES
NOTES
UNUSABLE RESERVES
78
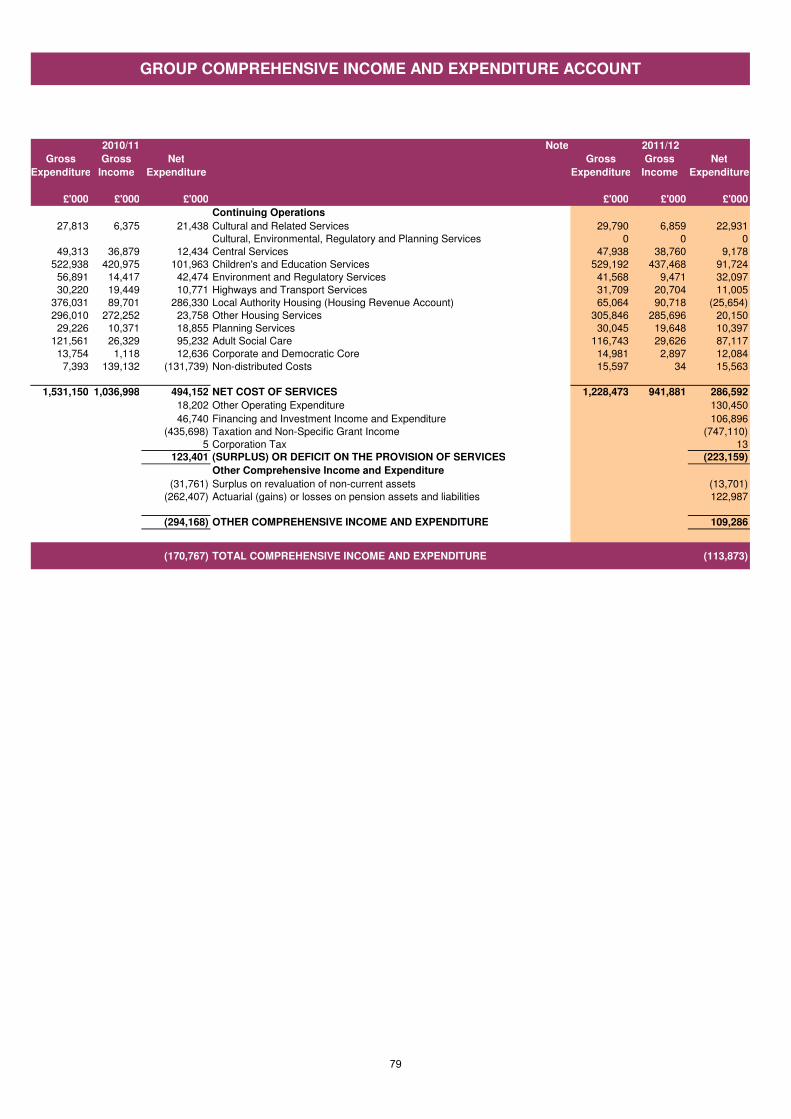
Note
Gross Gross Net Gross Gross Net
Expenditure Income Expenditure Expenditure Income Expenditure
£'000 £'000 £'000 £'000 £'000 £'000
Continuing Operations
27,813 6,375 21,438 Cultural and Related Services 29,790 6,859 22,931
Cultural, Environmental, Regulatory and Planning Services 0 0 0
49,313 36,879 12,434 Central Services 47,938 38,760 9,178
522,938 420,975 101,963 Children's and Education Services 529,192 437,468 91,724
56,891 14,417 42,474 Environment and Regulatory Services 41,568 9,471 32,097
30,220 19,449 10,771 Highways and Transport Services 31,709 20,704 11,005
376,031 89,701 286,330 Local Authority Housing (Housing Revenue Account) 65,064 90,718 (25,654)
296,010 272,252 23,758 Other Housing Services 305,846 285,696 20,150
29,226 10,371 18,855 Planning Services 30,045 19,648 10,397
121,561 26,329 95,232 Adult Social Care 116,743 29,626 87,117
13,754 1,118 12,636 Corporate and Democratic Core 14,981 2,897 12,084
7,393 139,132 (131,739) Non-distributed Costs 15,597 34 15,563
1,531,150 1,036,998 494,152 NET COST OF SERVICES 1,228,473 941,881 286,592
18,202 Other Operating Expenditure 130,450
46,740 Financing and Investment Income and Expenditure 106,896
(435,698) Taxation and Non-Specific Grant Income (747,110)
5 Corporation Tax 13
123,401 (SURPLUS) OR DEFICIT ON THE PROVISION OF SERVICES (223,159)
Other Comprehensive Income and Expenditure
(31,761) Surplus on revaluation of non-current assets (13,701)
(262,407) Actuarial (gains) or losses on pension assets and liabilities 122,987
(294,168) OTHER COMPREHENSIVE INCOME AND EXPENDITURE 109,286
(170,767) TOTAL COMPREHENSIVE INCOME AND EXPENDITURE (113,873)
GROUP COMPREHENSIVE INCOME AND EXPENDITURE ACCOUNT
2010/11 2011/12
79
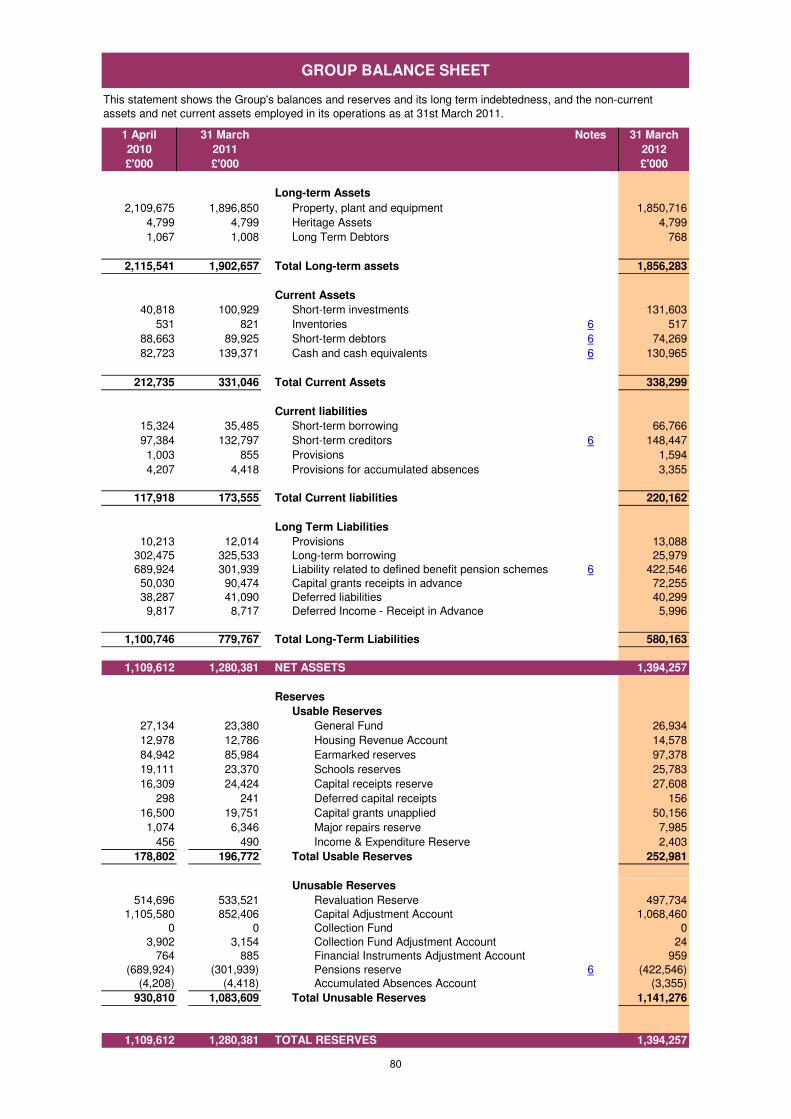
1 April 31 March Notes 31 March
2010 2011 2012
£'000 £'000 £'000
Long-term Assets
2,109,675 1,896,850 Property, plant and equipment 1,850,716
4,799 4,799 Heritage Assets 4,799
1,067 1,008 Long Term Debtors 768
2,115,541 1,902,657 Total Long-term assets 1,856,283
Current Assets
40,818 100,929 Short-term investments 131,603
531 821 Inventories 6 517
88,663 89,925 Short-term debtors 6 74,269
82,723 139,371 Cash and cash equivalents 6 130,965
212,735 331,046 Total Current Assets 338,299
Current liabilities
15,324 35,485 Short-term borrowing 66,766
97,384 132,797 Short-term creditors 6 148,447
1,003 855 Provisions 1,594
4,207 4,418 Provisions for accumulated absences 3,355
117,918 173,555 Total Current liabilities 220,162
Long Term Liabilities
10,213 12,014 Provisions 13,088
302,475 325,533 Long-term borrowing 25,979
689,924 301,939 Liability related to defined benefit pension schemes 6 422,546
50,030 90,474 Capital grants receipts in advance 72,255
38,287 41,090 Deferred liabilities 40,299
9,817 8,717 Deferred Income - Receipt in Advance 5,996
1,100,746 779,767 Total Long-Term Liabilities 580,163
1,109,612 1,280,381 NET ASSETS 1,394,257
Reserves
Usable Reserves
27,134 23,380 General Fund 26,934
12,978 12,786 Housing Revenue Account 14,578
84,942 85,984 Earmarked reserves 97,378
19,111 23,370 Schools reserves 25,783
16,309 24,424 Capital receipts reserve 27,608
298 241 Deferred capital receipts 156
16,500 19,751 Capital grants unapplied 50,156
1,074 6,346 Major repairs reserve 7,985
456 490 Income & Expenditure Reserve 2,403
178,802 196,772 Total Usable Reserves 252,981
Unusable Reserves
514,696 533,521 Revaluation Reserve 497,734
1,105,580 852,406 Capital Adjustment Account 1,068,460
0 0 Collection Fund 0
3,902 3,154 Collection Fund Adjustment Account 24
764 885 Financial Instruments Adjustment Account 959
(689,924) (301,939) Pensions reserve 6 (422,546)
(4,208) (4,418) Accumulated Absences Account (3,355)
930,810 1,083,609 Total Unusable Reserves 1,141,276
1,109,612 1,280,381 TOTAL RESERVES 1,394,257
This statement shows the Group's balances and reserves and its long term indebtedness, and the non-current
assets and net current assets employed in its operations as at 31st March 2011.
GROUP BALANCE SHEET
80
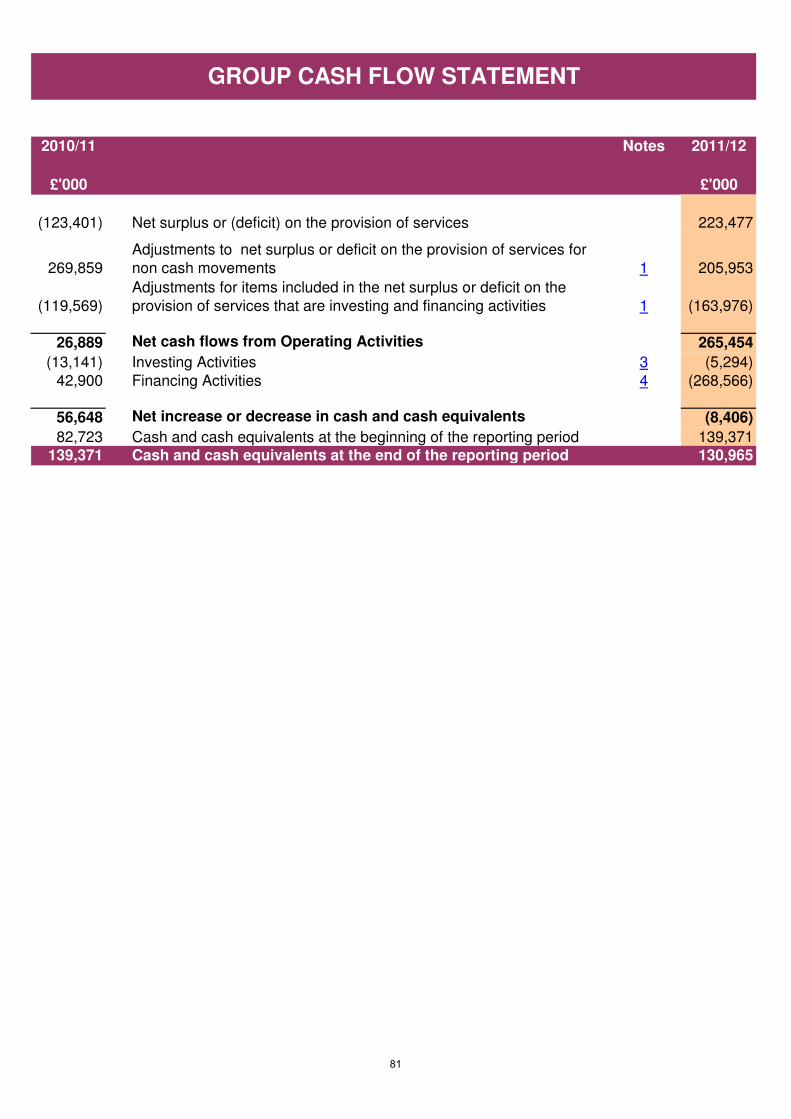
2010/11 Notes 2011/12
£'000 £'000
(123,401) Net surplus or (deficit) on the provision of services 223,477
269,859
Adjustments to net surplus or deficit on the provision of services for
non cash movements 1 205,953
(119,569)
Adjustments for items included in the net surplus or deficit on the
provision of services that are investing and financing activities 1 (163,976)
26,889 Net cash flows from Operating Activities 265,454
(13,141) Investing Activities 3 (5,294)
42,900 Financing Activities 4 (268,566)
56,648 Net increase or decrease in cash and cash equivalents (8,406)
82,723 Cash and cash equivalents at the beginning of the reporting period 139,371
139,371 Cash and cash equivalents at the end of the reporting period 130,965
GROUP CASH FLOW STATEMENT
81
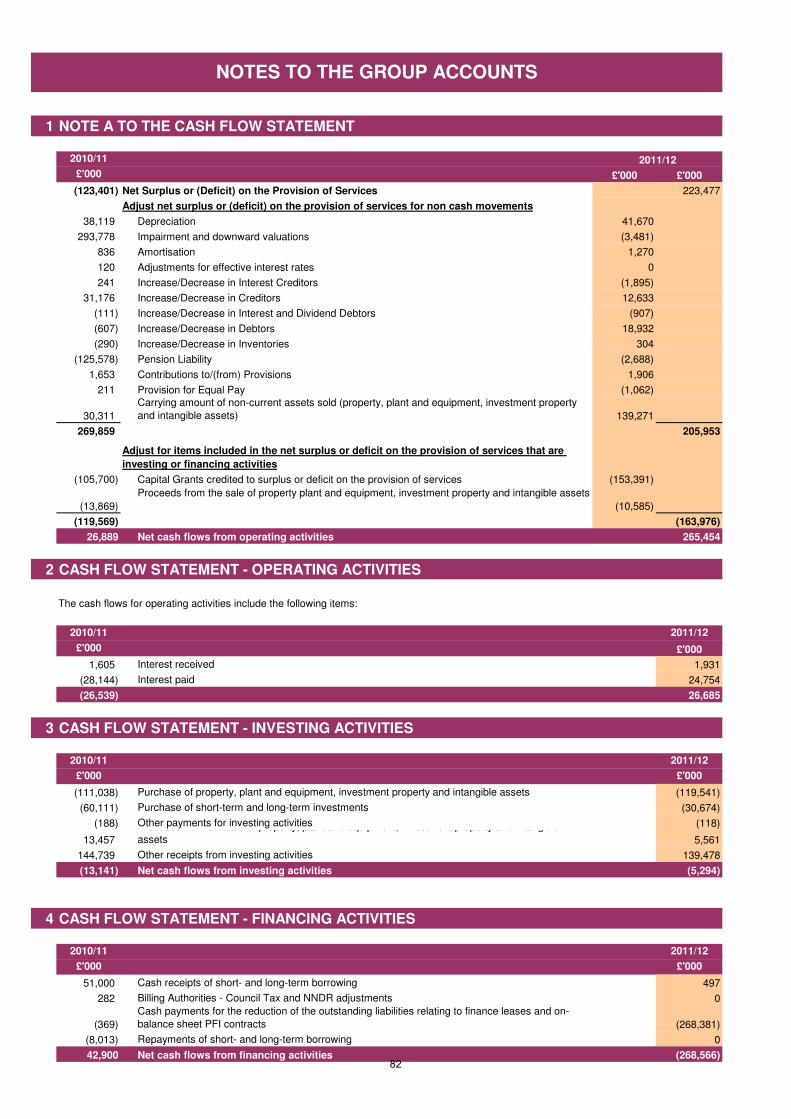
1 NOTE A TO THE CASH FLOW STATEMENT
2010/11
£'000 £'000 £'000
(123,401) Net Surplus or (Deficit) on the Provision of Services 223,477
Adjust net surplus or (deficit) on the provision of services for non cash movements
38,119 Depreciation 41,670
293,778 Impairment and downward valuations (3,481)
836 Amortisation 1,270
120 Adjustments for effective interest rates 0
241 Increase/Decrease in Interest Creditors (1,895)
31,176 Increase/Decrease in Creditors 12,633
(111) Increase/Decrease in Interest and Dividend Debtors (907)
(607) Increase/Decrease in Debtors 18,932
(290) Increase/Decrease in Inventories 304
(125,578) Pension Liability (2,688)
1,653 Contributions to/(from) Provisions 1,906
211 Provision for Equal Pay (1,062)
30,311
Carrying amount of non-current assets sold (property, plant and equipment, investment property
and intangible assets) 139,271
269,859 205,953
(105,700) Capital Grants credited to surplus or deficit on the provision of services (153,391)
(13,869)
Proceeds from the sale of property plant and equipment, investment property and intangible assets
(10,585)
(119,569) (163,976)
26,889 Net cash flows from operating activities 265,454
2 CASH FLOW STATEMENT - OPERATING ACTIVITIES
2010/11 2011/12
£'000 £'000
1,605 Interest received 1,931
(28,144) Interest paid 24,754
(26,539) 26,685
3 CASH FLOW STATEMENT - INVESTING ACTIVITIES
2010/11 2011/12
£'000 £'000
(111,038) Purchase of property, plant and equipment, investment property and intangible assets (119,541)
(60,111) Purchase of short-term and long-term investments (30,674)
(188) Other payments for investing activities (118)
13,457
Proceeds from the sale of property, plant and equipment, investment property and intangible
assets 5,561
144,739 Other receipts from investing activities 139,478
(13,141) Net cash flows from investing activities (5,294)
4 CASH FLOW STATEMENT - FINANCING ACTIVITIES
2010/11 2011/12
£'000 £'000
51,000 Cash receipts of short- and long-term borrowing 497
282 Billing Authorities - Council Tax and NNDR adjustments 0
(369)
Cash payments for the reduction of the outstanding liabilities relating to finance leases and on-
balance sheet PFI contracts (268,381)
(8,013) Repayments of short- and long-term borrowing 0
42,900 Net cash flows from financing activities (268,566)
The cash flows for operating activities include the following items:
NOTES TO THE GROUP ACCOUNTS
2011/12
Adjust for items included in the net surplus or deficit on the provision of services that are
investing or financing activities
82
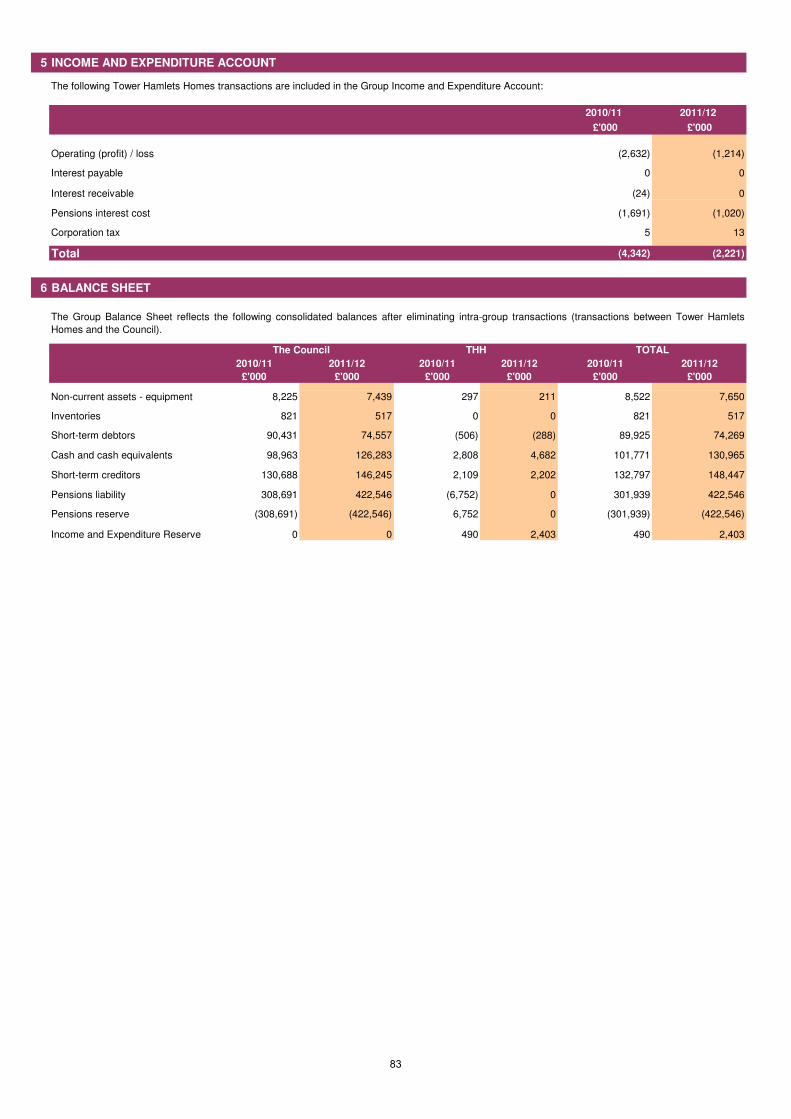
5 INCOME AND EXPENDITURE ACCOUNT
The following Tower Hamlets Homes transactions are included in the Group Income and Expenditure Account:
2010/11 2011/12
£'000 £'000
Operating (profit) / loss (2,632) (1,214)
Interest payable 0 0
Interest receivable (24) 0
Pensions interest cost (1,691) (1,020)
Corporation tax 5 13
Total (4,342) (2,221)
6 BALANCE SHEET
2010/11 2011/12 2010/11 2011/12 2010/11 2011/12
£'000 £'000 £'000 £'000 £'000 £'000
Non-current assets - equipment 8,225 7,439 297 211 8,522 7,650
Inventories 821 517 0 0 821 517
Short-term debtors 90,431 74,557 (506) (288) 89,925 74,269
Cash and cash equivalents 98,963 126,283 2,808 4,682 101,771 130,965
Short-term creditors 130,688 146,245 2,109 2,202 132,797 148,447
Pensions liability 308,691 422,546 (6,752) 0 301,939 422,546
Pensions reserve (308,691) (422,546) 6,752 0 (301,939) (422,546)
Income and Expenditure Reserve 0 0 490 2,403 490 2,403
The Group Balance Sheet reflects the following consolidated balances after eliminating intra-group transactions (transactions between Tower Hamlets
Homes and the Council).
The Council THH TOTAL
83
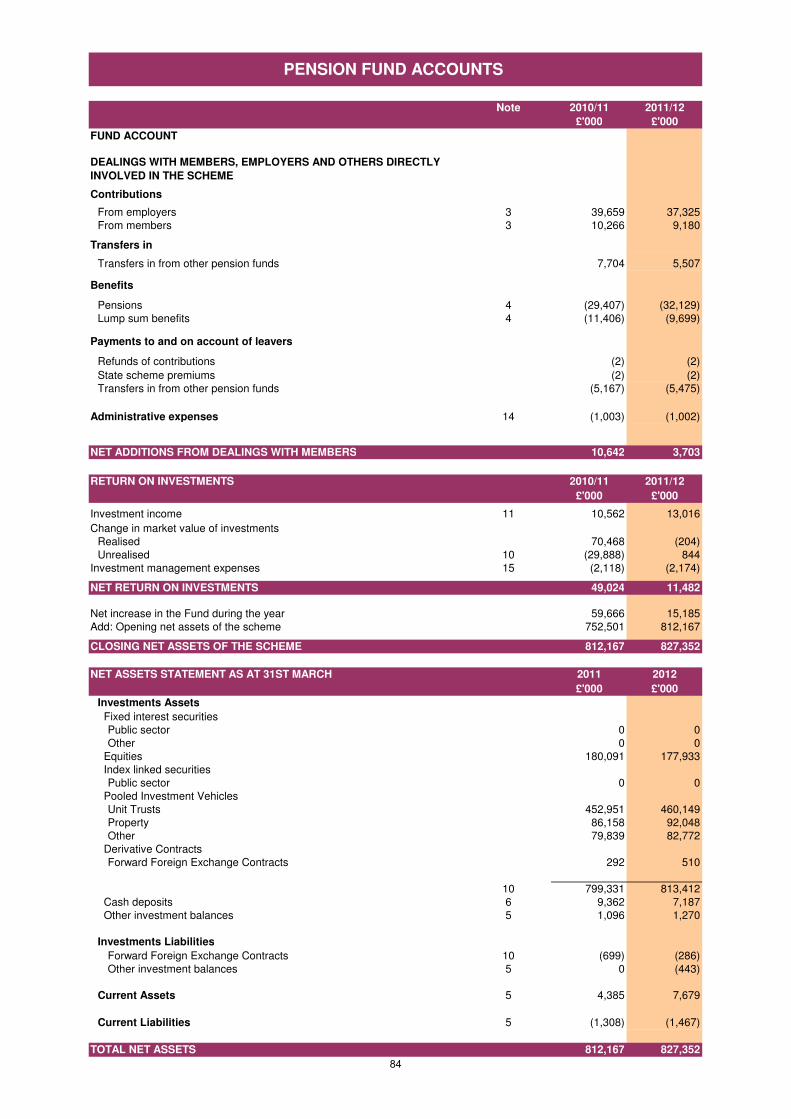
Note 2010/11 2011/12
£'000 £'000
Contributions
From employers 3 39,659 37,325
From members 3 10,266 9,180
Transfers in
Transfers in from other pension funds 7,704 5,507
Benefits
Pensions 4 (29,407) (32,129)
Lump sum benefits 4 (11,406) (9,699)
Payments to and on account of leavers
Refunds of contributions (2) (2)
State scheme premiums (2) (2)
Transfers in from other pension funds (5,167) (5,475)
Administrative expenses 14 (1,003) (1,002)
NET ADDITIONS FROM DEALINGS WITH MEMBERS 10,642 3,703
RETURN ON INVESTMENTS 2010/11 2011/12
£'000 £'000
Investment income 11 10,562 13,016
Change in market value of investments
Realised 70,468 (204)
Unrealised 10 (29,888) 844
Investment management expenses 15 (2,118) (2,174)
NET RETURN ON INVESTMENTS 49,024 11,482
Net increase in the Fund during the year 59,666 15,185
Add: Opening net assets of the scheme 752,501 812,167
CLOSING NET ASSETS OF THE SCHEME 812,167 827,352
NET ASSETS STATEMENT AS AT 31ST MARCH 2011 2012
£'000 £'000
Investments Assets
Fixed interest securities
Public sector 0 0
Other 0 0
Equities 180,091 177,933
Index linked securities
Public sector 0 0
Pooled Investment Vehicles
Unit TrustsUnit Trusts 452,951 460,149
PropertyProperty 86,158 92,048
Other 79,839 82,772
Derivative Contracts
Forward Foreign Exchange Contracts 292 510
10 799,331 813,412
Cash deposits 6 9,362 7,187
Other investment balances 5 1,096 1,270
Investments Liabilities
Forward Foreign Exchange Contracts 10 (699) (286)
Other investment balances 5 0 (443)
Current Assets 5 4,385 7,679
Current Liabilities 5 (1,308) (1,467)
TOTAL NET ASSETS 812,167 827,352
PENSION FUND ACCOUNTS
FUND ACCOUNT
DEALINGS WITH MEMBERS, EMPLOYERS AND OTHERS DIRECTLY
INVOLVED IN THE SCHEME
84
1. INTRODUCTION
2. ACCOUNTING POLICIES
(a) Accounts
(b) Basis of preparation
(c)
(d) Investments
(i)
(ii)
(iii)
(iv)
(v)
(vi)
(e)
NOTES TO THE PENSION FUND ACCOUNTS
The Council is the administering authority for the Pension Fund and has executive responsibility for it. The Council delegates
its responsibility for administering the Fund to the Pensions Committee which is responsible for considering all pension
matters and discharging the obligations and duties of the Council under the Superannuation Act 1972 and other statutes
relating to investment issues. The Committee meets quarterly to determine investment policy objectives, appoint investment
managers, monitor investment performance and make representations to the Government on any proposed changes to the
Local Government Pension Scheme. The Committee is required to obtain proper advice on the investment strategy of the
Fund for which it has established an Investment Panel which includes professional investment advisors. The Panel meets
quarterly to determine the general investment strategy, monitor the performance of the Fund and individual managers and
consider technical reports on investment issues. The Fund employs eight specialist investment managers with mandates
corresponding to the principal asset classes.
The day to day administration of the Fund and the operation of the management arrangements and administration of the
investment portfolio is delegated to the Corporate Director of Resources.
The Fund is operated as a funded, defined benefits scheme which provides for the payment of benefits to former employees
of the London Borough of Tower Hamlets and those of bodies admitted to the Fund. These individuals are referred to as
"members". The benefits include not only retirement pensions, but also widows' pensions, death grants and lump sum
payments in certain circumstances. The Fund is financed by contributions from members, employers and from interest and
dividend receipts and gains on the Fund's investments.
The objective of the Pension Fund's financial statements is to provide information about the financial position, performance
and financial adaptability of the Fund. They show the results of the stewardship of management - that is the accountability of
management for the resources entrusted to it - and the disposition of its assets at the period end.
Pooled investment vehicles are valued at bid price, middle market price or single price at close of trading on 31st
March 2012.
Property unit trusts are shown by reference to bid price at close of business on 31st March 2012.
Investments are shown in the Net Assets Statement at market value on the following bases.
Listed securities are shown by reference to bid price at the close of business on 31st March 2012.
The accounts summarise the transactions and net assets of the Pension Fund and comply in all material respects with
Chapter 2 ("Recommended Accounting Practice") of the Statement of Recommended Practice (Financial Reports of
Pensions Schemes) 2007 and the Code of Practice on Local Authority Accounting issued by the Chartered Institute of
Public Finance and Accountancy (CIPFA).
Except where otherwise stated, the accounts have been prepared on an accruals basis, that is income and
expenditure are recognised as earned or incurred, not as received or paid.
The financial statements of the Fund do not take account of liabilities to pay pensions and other benefits after 31st
March 2012. The actuarial present value of promised retirement benefits, valued on an IAS19 basis is disclosed in
note 13 of the Accounts.
The Fund is administered in accordance with the LGPS (Benefits, Membership and Contributions) Regulations 2007
(as amended), the LGPS (Administration) Regulations 2008 (as amended) and the LGPS (Management and
Investment of Funds) Regulations 2009.
The Fund does not hold any direct property holdings and therefore does not employ a separate property valuer.
Investments designated in foreign currencies are valued in sterling at the exchange rates ruling on 31st March 2012.
Where the Authority has entered into a transaction denominated in a foreign currency, the transaction is converted into
sterling at the exchange rate applicable on the date the transaction was effective.
Foreign exchange contracts are recognised in the net asset statement at their fair value. The amounts included in the
accounts represent unrealised gains or losses on forward contracts.
Management Expenses
Fund managers' fees are paid in accordance with the terms of each individual management agreement. The fees are
based mainly on a percentage of the value of funds under their management and increase or reduce as the value of
the investments change.
85
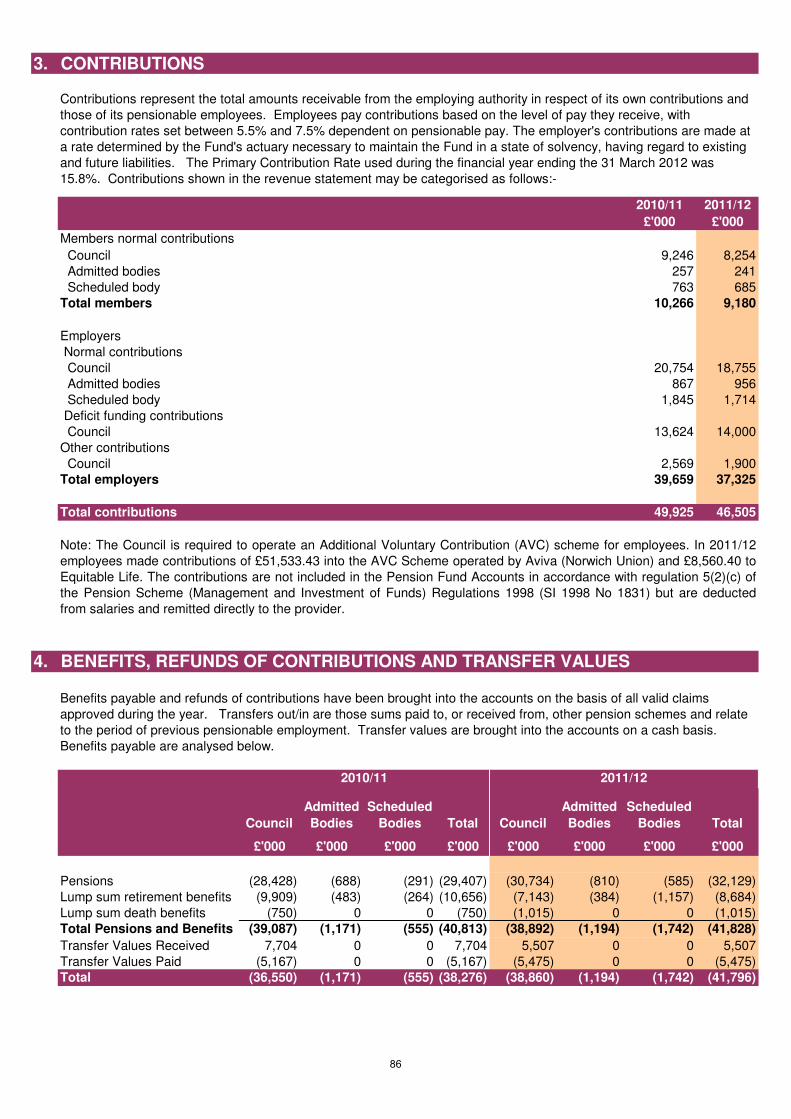
3. CONTRIBUTIONS
2010/11 2011/12
£'000 £'000
Members normal contributions
Council 9,246 8,254
Admitted bodies 257 241
Scheduled body 763 685
Total members 10,266 9,180
Employers
Normal contributions
Council 20,754 18,755
Admitted bodies 867 956
Scheduled body 1,845 1,714
Deficit funding contributions
Council 13,624 14,000
Other contributions
Council 2,569 1,900
Total employers 39,659 37,325
Total contributions 49,925 46,505
4. BENEFITS, REFUNDS OF CONTRIBUTIONS AND TRANSFER VALUES
Council
Admitted
Bodies
Scheduled
Bodies Total Council
Admitted
Bodies
Scheduled
Bodies Total
£'000 £'000 £'000 £'000 £'000 £'000 £'000 £'000
Pensions (28,428) (688) (291) (29,407) (30,734) (810) (585) (32,129)
Lump sum retirement benefits (9,909) (483) (264) (10,656) (7,143) (384) (1,157) (8,684)
Lump sum death benefits (750) 0 0 (750) (1,015) 0 0 (1,015)
Total Pensions and Benefits (39,087) (1,171) (555) (40,813) (38,892) (1,194) (1,742) (41,828)
Transfer Values Received 7,704 0 0 7,704 5,507 0 0 5,507
Transfer Values Paid (5,167) 0 0 (5,167) (5,475) 0 0 (5,475)
Total (36,550) (1,171) (555) (38,276) (38,860) (1,194) (1,742) (41,796)
Benefits payable and refunds of contributions have been brought into the accounts on the basis of all valid claims
approved during the year. Transfers out/in are those sums paid to, or received from, other pension schemes and relate
to the period of previous pensionable employment. Transfer values are brought into the accounts on a cash basis.
Benefits payable are analysed below.
2010/11 2011/12
Contributions represent the total amounts receivable from the employing authority in respect of its own contributions and
those of its pensionable employees. Employees pay contributions based on the level of pay they receive, with
contribution rates set between 5.5% and 7.5% dependent on pensionable pay. The employer's contributions are made at
a rate determined by the Fund's actuary necessary to maintain the Fund in a state of solvency, having regard to existing
and future liabilities. The Primary Contribution Rate used during the financial year ending the 31 March 2012 was
15.8%. Contributions shown in the revenue statement may be categorised as follows:-
Note: The Council is required to operate an Additional Voluntary Contribution (AVC) scheme for employees. In 2011/12
employees made contributions of £51,533.43 into the AVC Scheme operated by Aviva (Norwich Union) and £8,560.40 to
Equitable Life. The contributions are not included in the Pension Fund Accounts in accordance with regulation 5(2)(c) of
the Pension Scheme (Management and Investment of Funds) Regulations 1998 (SI 1998 No 1831) but are deducted
from salaries and remitted directly to the provider.
86
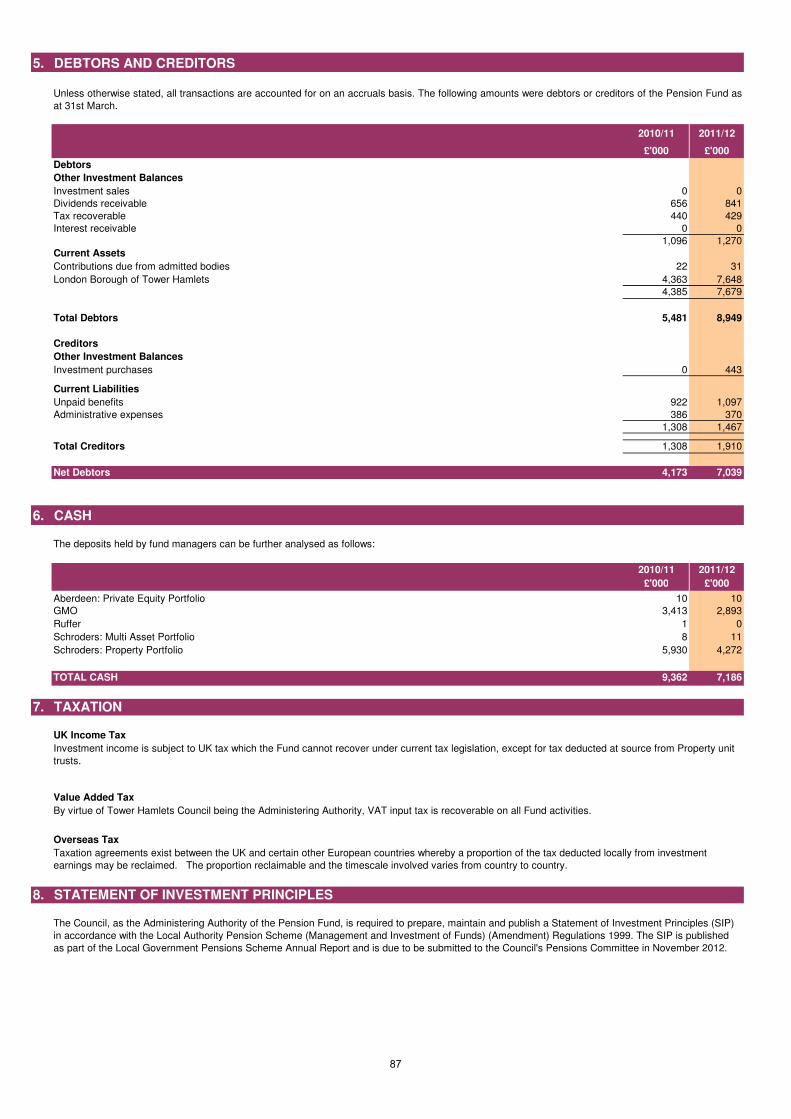
5. DEBTORS AND CREDITORS
2010/11 2011/12
£'000 £'000
Debtors
Other Investment Balances
Investment sales 0 0
Dividends receivable 656 841
Tax recoverable 440 429
Interest receivable 0 0
1,096 1,270
Current Assets
Contributions due from admitted bodies 22 31
London Borough of Tower Hamlets 4,363 7,648
4,385 7,679
Total Debtors 5,481 8,949
Creditors
Other Investment Balances
Investment purchases 0 443
Current Liabilities
Unpaid benefits 922 1,097
Administrative expenses 386 370
1,308 1,467
Total Creditors 1,308 1,910
Net Debtors 4,173 7,039
6. CASH
The deposits held by fund managers can be further analysed as follows:
2010/11 2011/12
£'000 £'000
Aberdeen: Private Equity Portfolio 10 10
GMO 3,413 2,893
Ruffer 1 0
Schroders: Multi Asset Portfolio 8 11
Schroders: Property Portfolio 5,930 4,272
TOTAL CASH 9,362 7,186
7. TAXATION£'000 £'000
UK Income Tax
Value Added Tax
Overseas Tax
8. STATEMENT OF INVESTMENT PRINCIPLES
The Council, as the Administering Authority of the Pension Fund, is required to prepare, maintain and publish a Statement of Investment Principles (SIP)
in accordance with the Local Authority Pension Scheme (Management and Investment of Funds) (Amendment) Regulations 1999. The SIP is published
as part of the Local Government Pensions Scheme Annual Report and is due to be submitted to the Council's Pensions Committee in November 2012.
Investment income is subject to UK tax which the Fund cannot recover under current tax legislation, except for tax deducted at source from Property unit
trusts.
By virtue of Tower Hamlets Council being the Administering Authority, VAT input tax is recoverable on all Fund activities.
Taxation agreements exist between the UK and certain other European countries whereby a proportion of the tax deducted locally from investment
earnings may be reclaimed. The proportion reclaimable and the timescale involved varies from country to country.
Unless otherwise stated, all transactions are accounted for on an accruals basis. The following amounts were debtors or creditors of the Pension Fund as
at 31st March.
87
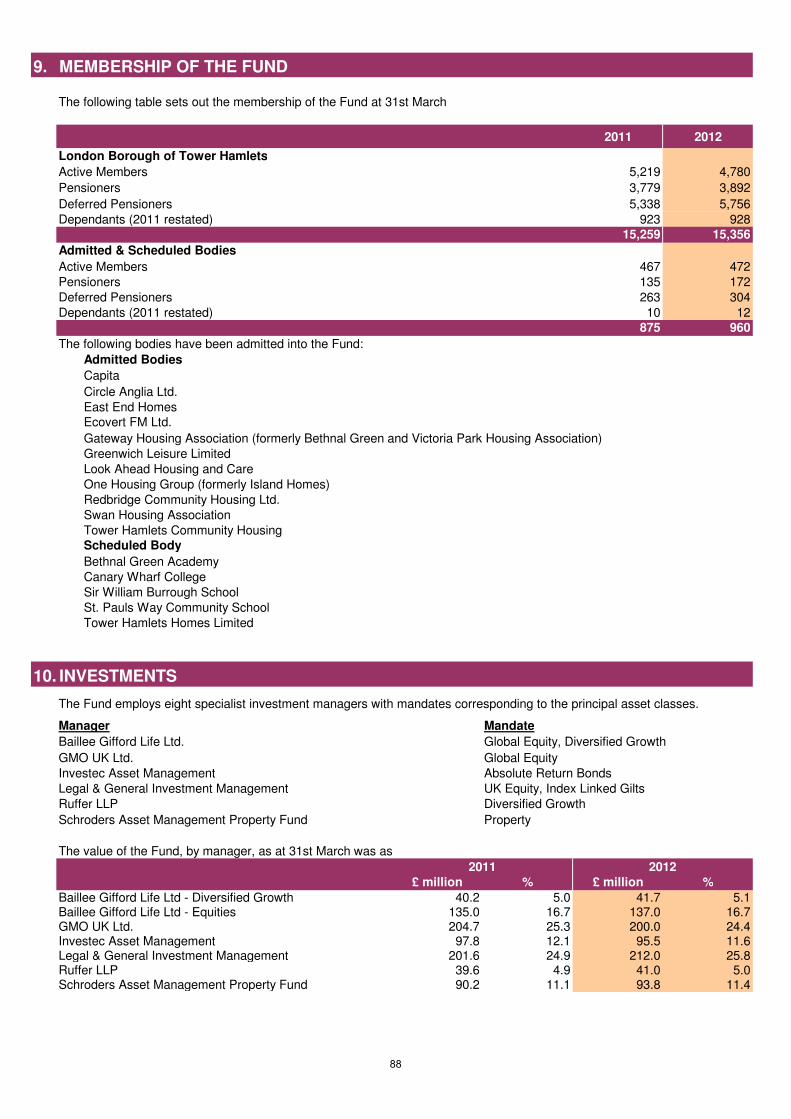
9. MEMBERSHIP OF THE FUND
2011 2012
London Borough of Tower Hamlets
Active Members 5,219 4,780
Pensioners 3,779 3,892
Deferred Pensioners 5,338 5,756
Dependants (2011 restated) 923 928
15,259 15,356
Admitted & Scheduled Bodies
Active Members 467 472
Pensioners 135 172
Deferred Pensioners 263 304
Dependants (2011 restated) 10 12
875 960
Admitted Bodies
Capita
Circle Anglia Ltd.
East End Homes
Ecovert FM Ltd.
Gateway Housing Association (formerly Bethnal Green and Victoria Park Housing Association)
Greenwich Leisure Limited
Look Ahead Housing and Care
One Housing Group (formerly Island Homes)
Redbridge Community Housing Ltd.
Swan Housing Association
Tower Hamlets Community Housing
Scheduled Body
Bethnal Green Academy
Canary Wharf College
Sir William Burrough School
St. Pauls Way Community School
Tower Hamlets Homes Limited
10. INVESTMENTS
The Fund employs eight specialist investment managers with mandates corresponding to the principal asset classes.
Manager Mandate
Baillee Gifford Life Ltd. Global Equity, Diversified Growth
GMO UK Ltd. Global Equity
Investec Asset Management Absolute Return Bonds
Legal & General Investment Management UK Equity, Index Linked Gilts
Ruffer LLP Diversified Growth
Schroders Asset Management Property Fund Property
£ million % £ million %
Baillee Gifford Life Ltd - Diversified Growth 40.2 5.0 41.7 5.1Baillee Gifford Life Ltd - Equities 135.0 16.7 137.0 16.7GMO UK Ltd. 204.7 25.3 200.0 24.4Investec Asset Management 97.8 12.1 95.5 11.6Legal & General Investment Management 201.6 24.9 212.0 25.8Ruffer LLP 39.6 4.9 41.0 5.0Schroders Asset Management Property Fund 90.2 11.1 93.8 11.4
2011 2012
The following table sets out the membership of the Fund at 31st March
The following bodies have been admitted into the Fund:
The value of the Fund, by manager, as at 31st March was as follows.
88
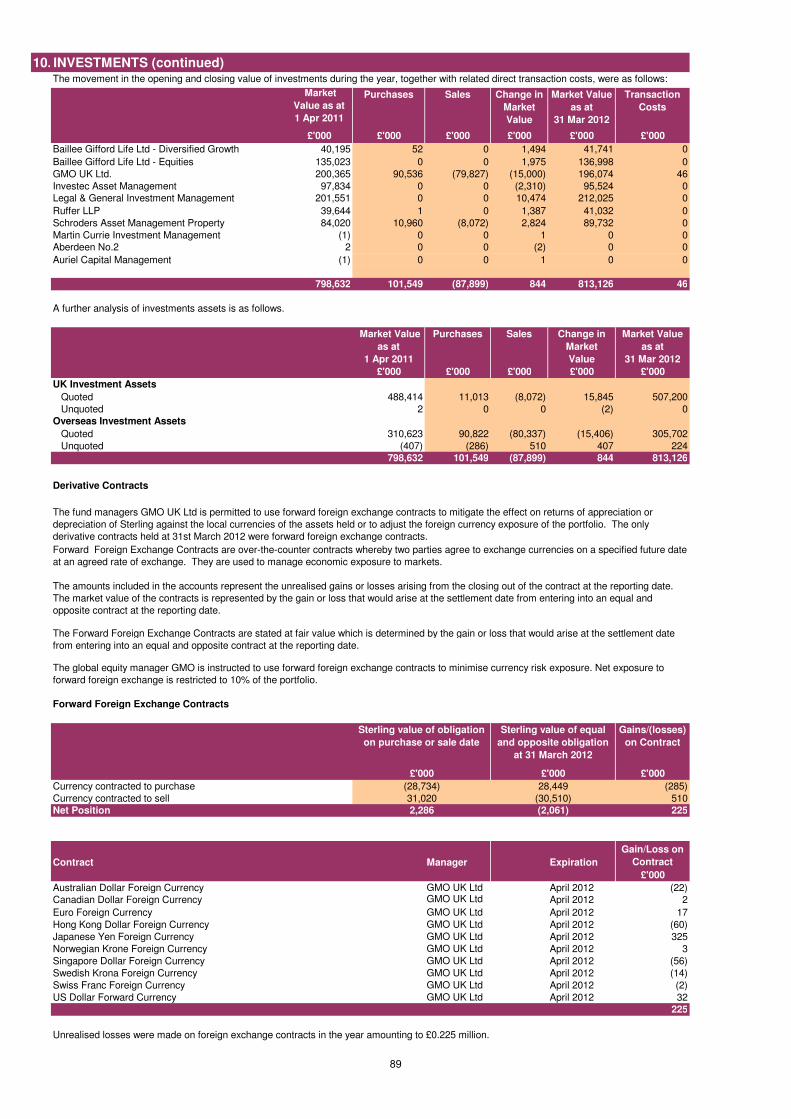
10. INVESTMENTS (continued)
Market
Value as at
1 Apr 2011
Purchases Sales Change in
Market
Value
Market Value
as at
31 Mar 2012
Transaction
Costs
£'000 £'000 £'000 £'000 £'000 £'000
Baillee Gifford Life Ltd - Diversified Growth 40,195 52 0 1,494 41,741 0
Baillee Gifford Life Ltd - Equities 135,023 0 0 1,975 136,998 0
GMO UK Ltd. 200,365 90,536 (79,827) (15,000) 196,074 46
Investec Asset Management 97,834 0 0 (2,310) 95,524 0
Legal & General Investment Management 201,551 0 0 10,474 212,025 0
Ruffer LLP 39,644 1 0 1,387 41,032 0
Schroders Asset Management Property 84,020 10,960 (8,072) 2,824 89,732 0
Martin Currie Investment Management (1) 0 0 1 0 0
Aberdeen No.2 2 0 0 (2) 0 0
Auriel Capital Management (1) 0 0 1 0 0
798,632 101,549 (87,899) 844 813,126 46
Market Value
as at
1 Apr 2011
Purchases Sales Change in
Market
Value
Market Value
as at
31 Mar 2012
£'000 £'000 £'000 £'000 £'000
UK Investment Assets
Quoted 488,414 11,013 (8,072) 15,845 507,200
Unquoted 2 0 0 (2) 0
Overseas Investment Assets
Quoted 310,623 90,822 (80,337) (15,406) 305,702
Unquoted (407) (286) 510 407 224
798,632 101,549 (87,899) 844 813,126
Derivative Contracts
Forward Foreign Exchange Contracts
Gains/(losses)
on Contract
£'000
(285)
510
Net Position 225
Contract Manager Expiration
Gain/Loss on
Contract
£'000
GMO UK Ltd April 2012 (22)GMO UK Ltd April 2012 2
GMO UK Ltd April 2012 17
GMO UK Ltd April 2012 (60)
GMO UK Ltd April 2012 325
GMO UK Ltd April 2012 3
GMO UK Ltd April 2012 (56)
GMO UK Ltd April 2012 (14)
GMO UK Ltd April 2012 (2)
GMO UK Ltd April 2012 32
225
The movement in the opening and closing value of investments during the year, together with related direct transaction costs, were as follows:
Sterling value of obligation
on purchase or sale date
Sterling value of equal
and opposite obligation
at 31 March 2012
Currency contracted to sell
Australian Dollar Foreign Currency
Canadian Dollar Foreign Currency
A further analysis of investments assets is as follows.
(28,734)
31,020
2,286
£'000 £'000
(30,510)
28,449
(2,061)
Swedish Krona Foreign Currency
Swiss Franc Foreign Currency
US Dollar Forward Currency
Unrealised losses were made on foreign exchange contracts in the year amounting to £0.225 million.
The fund managers GMO UK Ltd is permitted to use forward foreign exchange contracts to mitigate the effect on returns of appreciation or
depreciation of Sterling against the local currencies of the assets held or to adjust the foreign currency exposure of the portfolio. The only
derivative contracts held at 31st March 2012 were forward foreign exchange contracts.
Forward Foreign Exchange Contracts are over-the-counter contracts whereby two parties agree to exchange currencies on a specified future date
at an agreed rate of exchange. They are used to manage economic exposure to markets.
The amounts included in the accounts represent the unrealised gains or losses arising from the closing out of the contract at the reporting date.
The market value of the contracts is represented by the gain or loss that would arise at the settlement date from entering into an equal and
opposite contract at the reporting date.
The Forward Foreign Exchange Contracts are stated at fair value which is determined by the gain or loss that would arise at the settlement date
from entering into an equal and opposite contract at the reporting date.
The global equity manager GMO is instructed to use forward foreign exchange contracts to minimise currency risk exposure. Net exposure to
forward foreign exchange is restricted to 10% of the portfolio.
Euro Foreign Currency
Hong Kong Dollar Foreign Currency
Japanese Yen Foreign Currency
Norwegian Krone Foreign Currency
Singapore Dollar Foreign Currency
Currency contracted to purchase
89
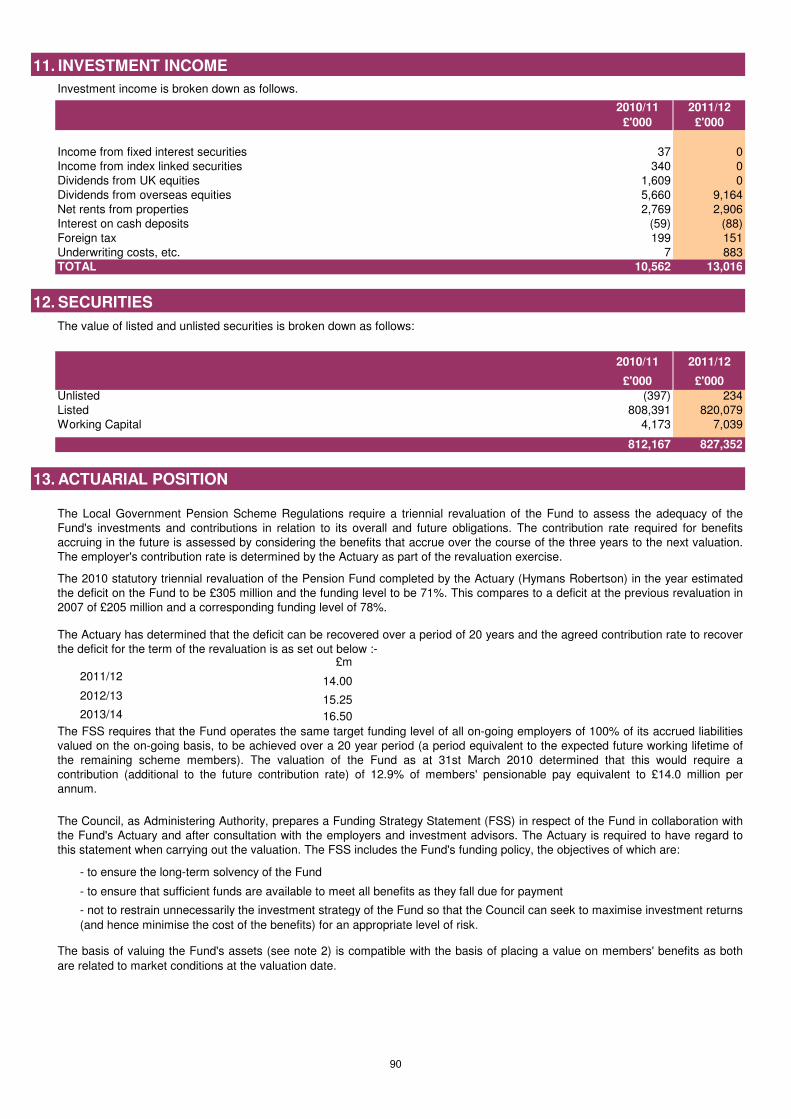
11. INVESTMENT INCOME
2010/11 2011/12
£'000 £'000
Income from fixed interest securities 37 0
Income from index linked securities 340 0
Dividends from UK equities 1,609 0
Dividends from overseas equities 5,660 9,164
Net rents from properties 2,769 2,906
Interest on cash deposits (59) (88)
Foreign tax 199 151
Underwriting costs, etc. 7 883
TOTAL 10,562 13,016
12. SECURITIES
2010/11 2011/12
£'000 £'000
Unlisted (397) 234
Listed 808,391 820,079
Working Capital 4,173 7,039
812,167 827,352
13. ACTUARIAL POSITION
£m
2011/12 14.00
2012/13 15.25
2013/14 16.50
Investment income is broken down as follows.
The value of listed and unlisted securities is broken down as follows:
The basis of valuing the Fund's assets (see note 2) is compatible with the basis of placing a value on members' benefits as both
are related to market conditions at the valuation date.
The Local Government Pension Scheme Regulations require a triennial revaluation of the Fund to assess the adequacy of the
Fund's investments and contributions in relation to its overall and future obligations. The contribution rate required for benefits
accruing in the future is assessed by considering the benefits that accrue over the course of the three years to the next valuation.
The employer's contribution rate is determined by the Actuary as part of the revaluation exercise.
The 2010 statutory triennial revaluation of the Pension Fund completed by the Actuary (Hymans Robertson) in the year estimated
the deficit on the Fund to be £305 million and the funding level to be 71%. This compares to a deficit at the previous revaluation in
2007 of £205 million and a corresponding funding level of 78%.
The Actuary has determined that the deficit can be recovered over a period of 20 years and the agreed contribution rate to recover
the deficit for the term of the revaluation is as set out below :-
The FSS requires that the Fund operates the same target funding level of all on-going employers of 100% of its accrued liabilities
valued on the on-going basis, to be achieved over a 20 year period (a period equivalent to the expected future working lifetime of
the remaining scheme members). The valuation of the Fund as at 31st March 2010 determined that this would require a
contribution (additional to the future contribution rate) of 12.9% of members' pensionable pay equivalent to £14.0 million per
annum.
The Council, as Administering Authority, prepares a Funding Strategy Statement (FSS) in respect of the Fund in collaboration with
the Fund's Actuary and after consultation with the employers and investment advisors. The Actuary is required to have regard to
this statement when carrying out the valuation. The FSS includes the Fund's funding policy, the objectives of which are:
- to ensure the long-term solvency of the Fund
- to ensure that sufficient funds are available to meet all benefits as they fall due for payment
- not to restrain unnecessarily the investment strategy of the Fund so that the Council can seek to maximise investment returns
(and hence minimise the cost of the benefits) for an appropriate level of risk.
90
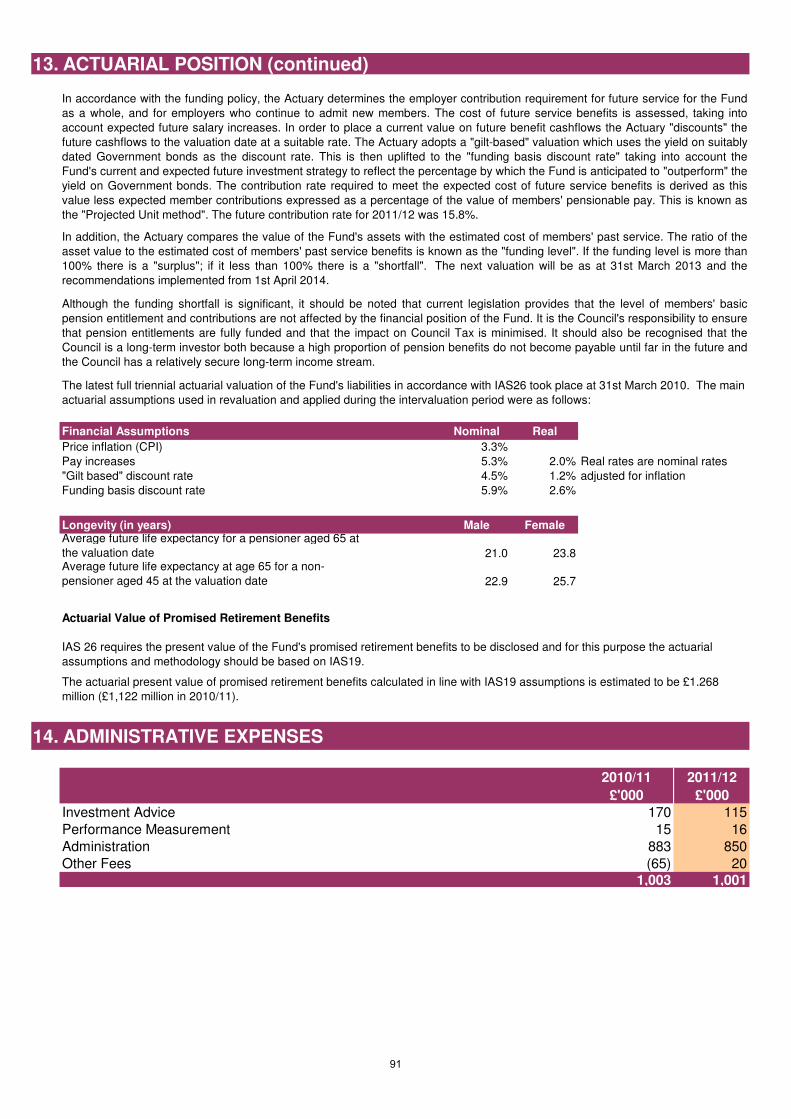
13. ACTUARIAL POSITION (continued)
Financial Assumptions Nominal Real
Price inflation (CPI) 3.3%
Pay increases 5.3% 2.0% Real rates are nominal rates
"Gilt based" discount rate 4.5% 1.2% adjusted for inflation
Funding basis discount rate 5.9% 2.6%
Longevity (in years) Male Female
21.0 23.8
22.9 25.7
14. ADMINISTRATIVE EXPENSES
2010/11 2011/12
£'000 £'000
Investment Advice 170 115
Performance Measurement 15 16
Administration 883 850
Other Fees (65) 201,003 1,001
Average future life expectancy at age 65 for a non-
pensioner aged 45 at the valuation date
IAS 26 requires the present value of the Fund's promised retirement benefits to be disclosed and for this purpose the actuarial
assumptions and methodology should be based on IAS19.
The actuarial present value of promised retirement benefits calculated in line with IAS19 assumptions is estimated to be £1.268
million (£1,122 million in 2010/11).
Actuarial Value of Promised Retirement Benefits
In accordance with the funding policy, the Actuary determines the employer contribution requirement for future service for the Fund
as a whole, and for employers who continue to admit new members. The cost of future service benefits is assessed, taking into
account expected future salary increases. In order to place a current value on future benefit cashflows the Actuary "discounts" the
future cashflows to the valuation date at a suitable rate. The Actuary adopts a "gilt-based" valuation which uses the yield on suitably
dated Government bonds as the discount rate. This is then uplifted to the "funding basis discount rate" taking into account the
Fund's current and expected future investment strategy to reflect the percentage by which the Fund is anticipated to "outperform" the
yield on Government bonds. The contribution rate required to meet the expected cost of future service benefits is derived as this
value less expected member contributions expressed as a percentage of the value of members' pensionable pay. This is known as
the "Projected Unit method". The future contribution rate for 2011/12 was 15.8%.
In addition, the Actuary compares the value of the Fund's assets with the estimated cost of members' past service. The ratio of the
asset value to the estimated cost of members' past service benefits is known as the "funding level". If the funding level is more than
100% there is a "surplus"; if it less than 100% there is a "shortfall". The next valuation will be as at 31st March 2013 and the
recommendations implemented from 1st April 2014.
Although the funding shortfall is significant, it should be noted that current legislation provides that the level of members' basic
pension entitlement and contributions are not affected by the financial position of the Fund. It is the Council's responsibility to ensure
that pension entitlements are fully funded and that the impact on Council Tax is minimised. It should also be recognised that the
Council is a long-term investor both because a high proportion of pension benefits do not become payable until far in the future and
the Council has a relatively secure long-term income stream.
The latest full triennial actuarial valuation of the Fund's liabilities in accordance with IAS26 took place at 31st March 2010. The main
actuarial assumptions used in revaluation and applied during the intervaluation period were as follows:
Average future life expectancy for a pensioner aged 65 at
the valuation date
91
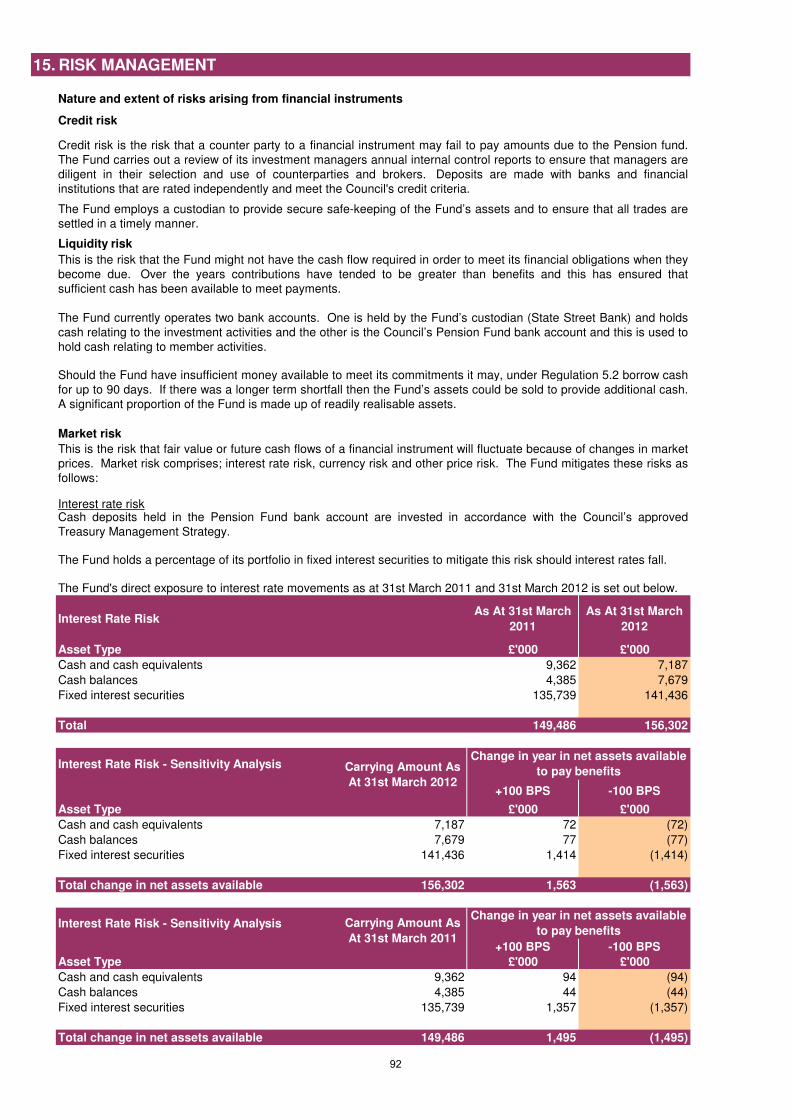
15. RISK MANAGEMENT
Nature and extent of risks arising from financial instruments
Credit risk
Liquidity risk
Market risk
Interest rate risk
Interest Rate RiskAs At 31st March
2011
As At 31st March
2012
Asset Type £'000 £'000
Cash and cash equivalents 9,362 7,187
Cash balances 4,385 7,679
Fixed interest securities 135,739 141,436
Total 149,486 156,302
Interest Rate Risk - Sensitivity Analysis
+100 BPS -100 BPS
Asset Type £'000 £'000
Cash and cash equivalents 7,187 72 (72)
Cash balances 7,679 77 (77)
Fixed interest securities 141,436 1,414 (1,414)
Total change in net assets available 156,302 1,563 (1,563)
Interest Rate Risk - Sensitivity Analysis
+100 BPS -100 BPS
Asset Type £'000 £'000
Cash and cash equivalents 9,362 94 (94)
Cash balances 4,385 44 (44)
Fixed interest securities 135,739 1,357 (1,357)
Total change in net assets available 149,486 1,495 (1,495)
Change in year in net assets available
to pay benefits
Carrying Amount As
At 31st March 2012
Carrying Amount As
At 31st March 2011
This is the risk that fair value or future cash flows of a financial instrument will fluctuate because of changes in market
prices. Market risk comprises; interest rate risk, currency risk and other price risk. The Fund mitigates these risks as
follows:
Cash deposits held in the Pension Fund bank account are invested in accordance with the Council’s approved
Treasury Management Strategy.
The Fund holds a percentage of its portfolio in fixed interest securities to mitigate this risk should interest rates fall.
The Fund's direct exposure to interest rate movements as at 31st March 2011 and 31st March 2012 is set out below.
Change in year in net assets available
to pay benefits
Should the Fund have insufficient money available to meet its commitments it may, under Regulation 5.2 borrow cash
for up to 90 days. If there was a longer term shortfall then the Fund’s assets could be sold to provide additional cash.
A significant proportion of the Fund is made up of readily realisable assets.
Credit risk is the risk that a counter party to a financial instrument may fail to pay amounts due to the Pension fund.
The Fund carries out a review of its investment managers annual internal control reports to ensure that managers are
diligent in their selection and use of counterparties and brokers. Deposits are made with banks and financial
institutions that are rated independently and meet the Council's credit criteria.
The Fund employs a custodian to provide secure safe-keeping of the Fund’s assets and to ensure that all trades are
settled in a timely manner.
This is the risk that the Fund might not have the cash flow required in order to meet its financial obligations when they
become due. Over the years contributions have tended to be greater than benefits and this has ensured that
sufficient cash has been available to meet payments.
The Fund currently operates two bank accounts. One is held by the Fund’s custodian (State Street Bank) and holds
cash relating to the investment activities and the other is the Council’s Pension Fund bank account and this is used to
hold cash relating to member activities.
92
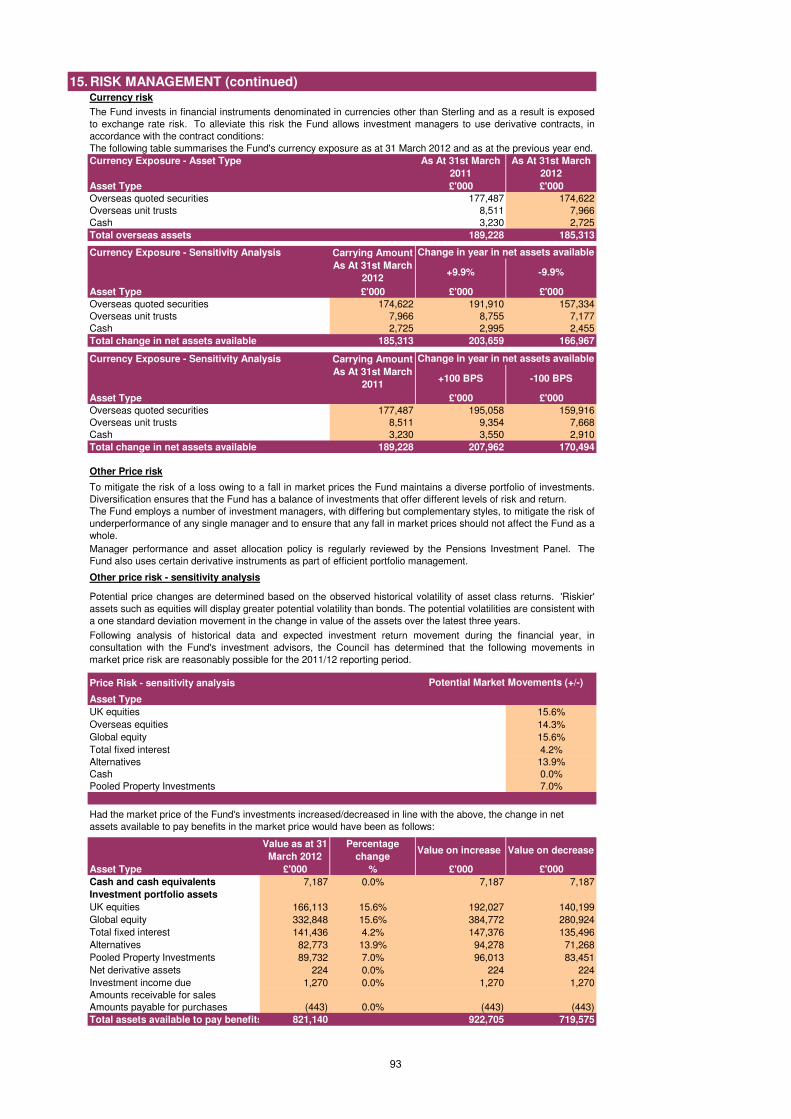
15. RISK MANAGEMENT (continued)Currency risk
Currency Exposure - Asset Type As At 31st March
2011
As At 31st March
2012
Asset Type £'000 £'000
Overseas quoted securities 177,487 174,622
Overseas unit trusts 8,511 7,966
Cash 3,230 2,725
Total overseas assets 189,228 185,313
Currency Exposure - Sensitivity Analysis
+9.9% -9.9%
Asset Type £'000 £'000 £'000
Overseas quoted securities 174,622 191,910 157,334
Overseas unit trusts 7,966 8,755 7,177
Cash 2,725 2,995 2,455
Total change in net assets available 185,313 203,659 166,967
Currency Exposure - Sensitivity Analysis
+100 BPS -100 BPS
Asset Type £'000 £'000
Overseas quoted securities 177,487 195,058 159,916
Overseas unit trusts 8,511 9,354 7,668
Cash 3,230 3,550 2,910
Total change in net assets available 189,228 207,962 170,494
Other Price risk
Price Risk - sensitivity analysis
Asset Type
UK equities 15.6%
Overseas equities 14.3%
Global equity 15.6%
Total fixed interest 4.2%
Alternatives 13.9%
Cash 0.0%
Pooled Property Investments 7.0%
Value as at 31
March 2012
Percentage
changeValue on increase Value on decrease
Asset Type £'000 % £'000 £'000
Cash and cash equivalents 7,187 0.0% 7,187 7,187
Investment portfolio assets
UK equities 166,113 15.6% 192,027 140,199
Global equity 332,848 15.6% 384,772 280,924
Total fixed interest 141,436 4.2% 147,376 135,496
Alternatives 82,773 13.9% 94,278 71,268
Pooled Property Investments 89,732 7.0% 96,013 83,451
Net derivative assets 224 0.0% 224 224
Investment income due 1,270 0.0% 1,270 1,270
Amounts receivable for sales
Amounts payable for purchases (443) 0.0% (443) (443)
Total assets available to pay benefits 821,140 922,705 719,575
The Fund invests in financial instruments denominated in currencies other than Sterling and as a result is exposed
to exchange rate risk. To alleviate this risk the Fund allows investment managers to use derivative contracts, in
accordance with the contract conditions:
The following table summarises the Fund's currency exposure as at 31 March 2012 and as at the previous year end.
Carrying Amount
As At 31st March
2012
Change in year in net assets available
Had the market price of the Fund's investments increased/decreased in line with the above, the change in net
assets available to pay benefits in the market price would have been as follows:
Carrying Amount
As At 31st March
2011
Change in year in net assets available
To mitigate the risk of a loss owing to a fall in market prices the Fund maintains a diverse portfolio of investments.
Diversification ensures that the Fund has a balance of investments that offer different levels of risk and return.
The Fund employs a number of investment managers, with differing but complementary styles, to mitigate the risk of
underperformance of any single manager and to ensure that any fall in market prices should not affect the Fund as a
whole.
Manager performance and asset allocation policy is regularly reviewed by the Pensions Investment Panel. The
Fund also uses certain derivative instruments as part of efficient portfolio management.
Other price risk - sensitivity analysis
Potential price changes are determined based on the observed historical volatility of asset class returns. 'Riskier'
assets such as equities will display greater potential volatility than bonds. The potential volatilities are consistent with
a one standard deviation movement in the change in value of the assets over the latest three years.
Following analysis of historical data and expected investment return movement during the financial year, in
consultation with the Fund's investment advisors, the Council has determined that the following movements in
market price risk are reasonably possible for the 2011/12 reporting period.
Potential Market Movements (+/-)
93
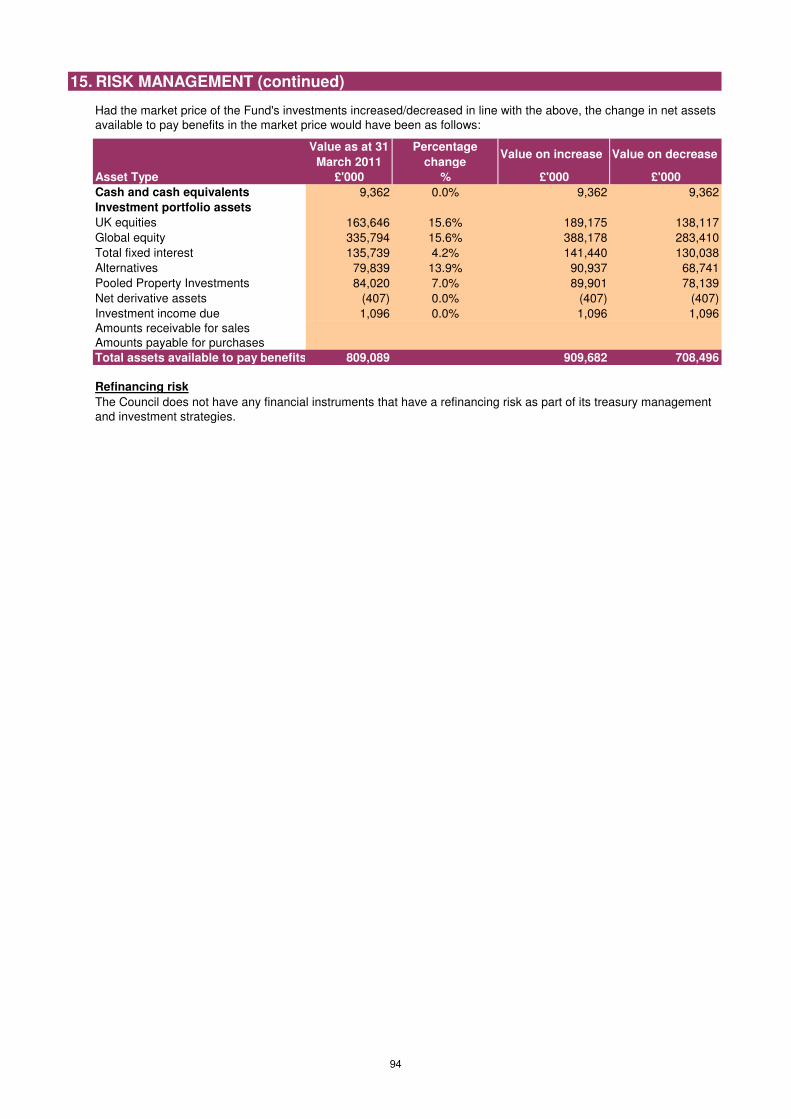
15. RISK MANAGEMENT (continued)
Value as at 31
March 2011
Percentage
changeValue on increase Value on decrease
Asset Type £'000 % £'000 £'000
Cash and cash equivalents 9,362 0.0% 9,362 9,362
Investment portfolio assets
UK equities 163,646 15.6% 189,175 138,117
Global equity 335,794 15.6% 388,178 283,410
Total fixed interest 135,739 4.2% 141,440 130,038
Alternatives 79,839 13.9% 90,937 68,741
Pooled Property Investments 84,020 7.0% 89,901 78,139
Net derivative assets (407) 0.0% (407) (407)
Investment income due 1,096 0.0% 1,096 1,096
Amounts receivable for sales
Amounts payable for purchases
Total assets available to pay benefits 809,089 909,682 708,496
Refinancing risk
Had the market price of the Fund's investments increased/decreased in line with the above, the change in net assets
available to pay benefits in the market price would have been as follows:
The Council does not have any financial instruments that have a refinancing risk as part of its treasury management
and investment strategies.
94
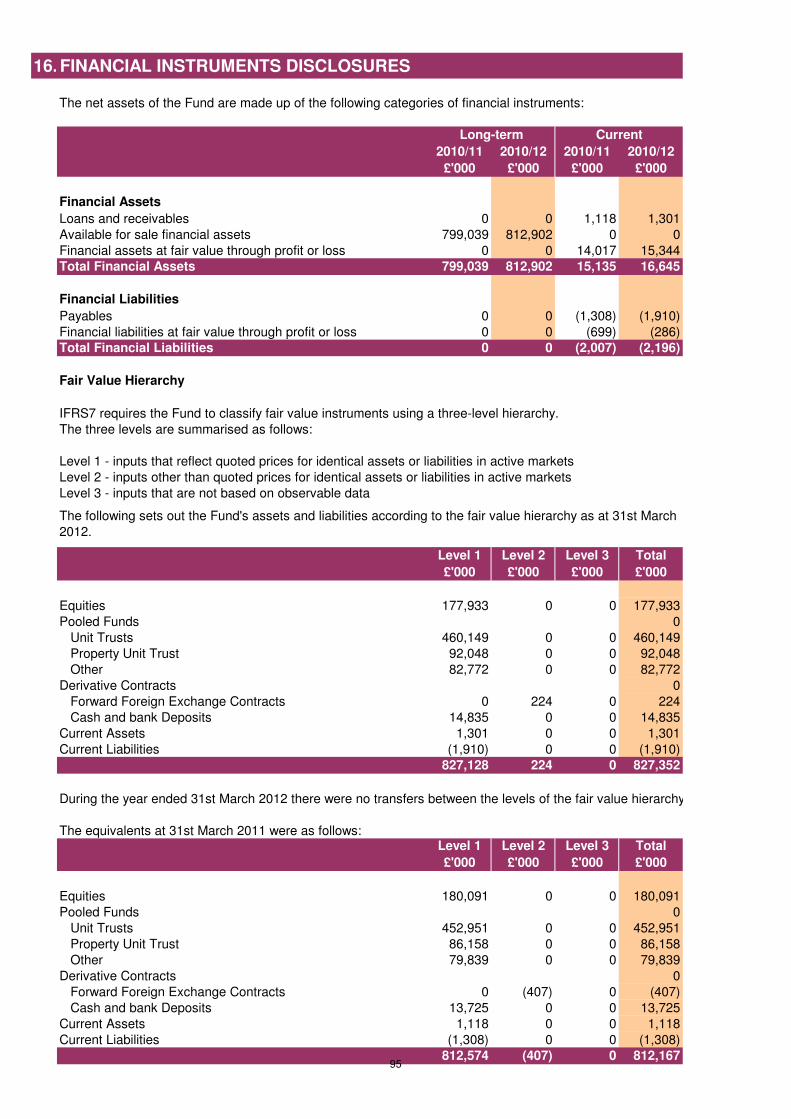
16.FINANCIAL INSTRUMENTS DISCLOSURES
The net assets of the Fund are made up of the following categories of financial instruments:
2010/11 2010/12 2010/11 2010/12
£'000 £'000 £'000 £'000
Financial Assets
Loans and receivables 0 0 1,118 1,301
Available for sale financial assets 799,039 812,902 0 0
Financial assets at fair value through profit or loss 0 0 14,017 15,344
Total Financial Assets 799,039 812,902 15,135 16,645
Financial Liabilities
Payables 0 0 (1,308) (1,910)
Financial liabilities at fair value through profit or loss 0 0 (699) (286)
Total Financial Liabilities 0 0 (2,007) (2,196)
IFRS7 requires the Fund to classify fair value instruments using a three-level hierarchy.
The three levels are summarised as follows:
Level 1 - inputs that reflect quoted prices for identical assets or liabilities in active markets
Level 2 - inputs other than quoted prices for identical assets or liabilities in active markets
Level 3 - inputs that are not based on observable data
Level 1 Level 2 Level 3 Total
£'000 £'000 £'000 £'000
Equities 177,933 0 0 177,933
Pooled Funds 0
Unit Trusts 460,149 0 0 460,149
Property Unit Trust 92,048 0 0 92,048
Other 82,772 0 0 82,772
Derivative Contracts 0
Forward Foreign Exchange Contracts 0 224 0 224
Cash and bank Deposits 14,835 0 0 14,835
Current Assets 1,301 0 0 1,301
Current Liabilities (1,910) 0 0 (1,910)
827,128 224 0 827,352
During the year ended 31st March 2012 there were no transfers between the levels of the fair value hierarchy.
The equivalents at 31st March 2011 were as follows:Level 1 Level 2 Level 3 Total
£'000 £'000 £'000 £'000
Equities 180,091 0 0 180,091
Pooled Funds 0
Unit Trusts 452,951 0 0 452,951
Property Unit Trust 86,158 0 0 86,158
Other 79,839 0 0 79,839
Derivative Contracts 0
Forward Foreign Exchange Contracts 0 (407) 0 (407)
Cash and bank Deposits 13,725 0 0 13,725
Current Assets 1,118 0 0 1,118
Current Liabilities (1,308) 0 0 (1,308)
812,574 (407) 0 812,167
Long-term Current
Fair Value Hierarchy
The following sets out the Fund's assets and liabilities according to the fair value hierarchy as at 31st March
2012.
95
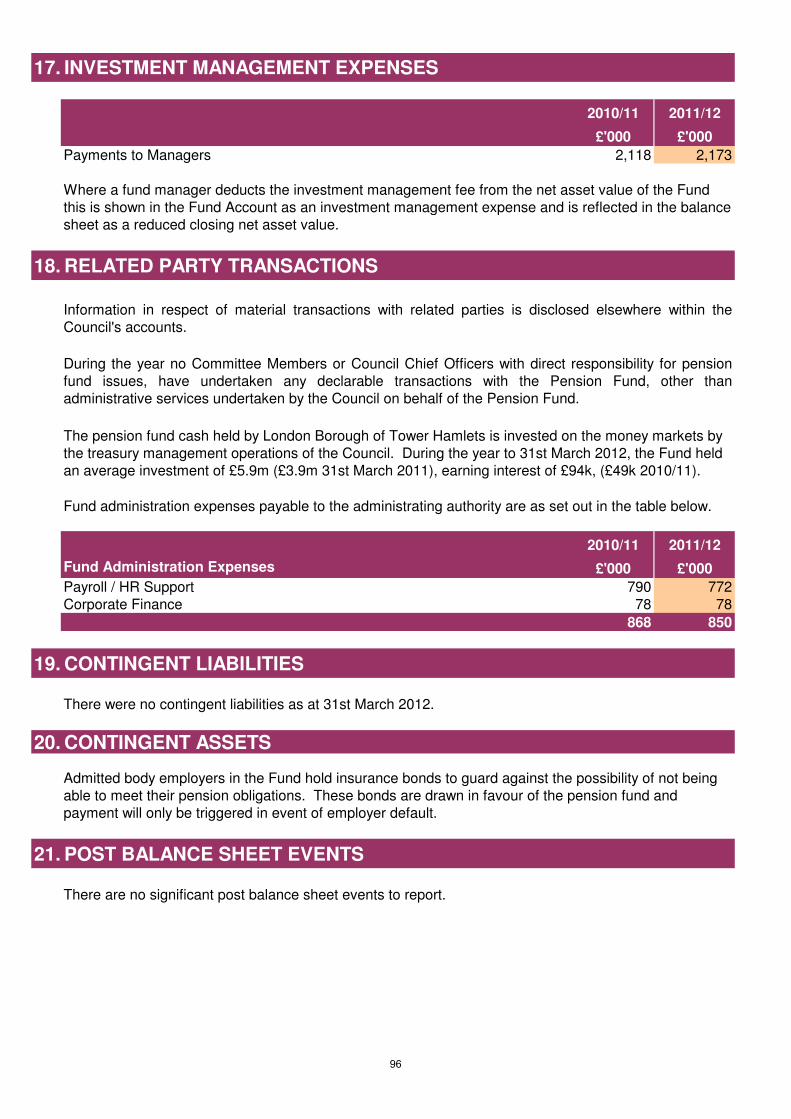
17. INVESTMENT MANAGEMENT EXPENSES
2010/11 2011/12
£'000 £'000
Payments to Managers 2,118 2,173
18. RELATED PARTY TRANSACTIONS
2010/11 2011/12
Fund Administration Expenses £'000 £'000
Payroll / HR Support 790 772
Corporate Finance 78 78
868 850
19. CONTINGENT LIABILITIES
20. CONTINGENT ASSETS
21. POST BALANCE SHEET EVENTS
There are no significant post balance sheet events to report.
Admitted body employers in the Fund hold insurance bonds to guard against the possibility of not being
able to meet their pension obligations. These bonds are drawn in favour of the pension fund and
payment will only be triggered in event of employer default.
Where a fund manager deducts the investment management fee from the net asset value of the Fund
this is shown in the Fund Account as an investment management expense and is reflected in the balance
sheet as a reduced closing net asset value.
There were no contingent liabilities as at 31st March 2012.
Information in respect of material transactions with related parties is disclosed elsewhere within the
Council's accounts.
During the year no Committee Members or Council Chief Officers with direct responsibility for pension
fund issues, have undertaken any declarable transactions with the Pension Fund, other than
administrative services undertaken by the Council on behalf of the Pension Fund.
The pension fund cash held by London Borough of Tower Hamlets is invested on the money markets by
the treasury management operations of the Council. During the year to 31st March 2012, the Fund held
an average investment of £5.9m (£3.9m 31st March 2011), earning interest of £94k, (£49k 2010/11).
Fund administration expenses payable to the administrating authority are as set out in the table below.
96
STATEMENT OF RESPONSIBILITIES FOR THE STATEMENT OF ACCOUNTS
The Council’s responsibilities The Council is required:
• To make arrangements for the proper administration of its financial affairs and to secure that one of its officers has the responsibility for the administration of those affairs. In this Council, that officer is the Corporate Director of Resources.
• To manage its affairs to secure economic, efficient and effective use of resources and safeguard its assets.
• To consider and approve the Statement of Accounts. The Statement of Accounts for 2011/12 will be considered for approval by the Council’s Audit Committee during September 2012. Chair of Committee The responsibilities of the Corporate Director of Resources The Corporate Director of Resources is responsible for the preparation of the Council’s Statement of Accounts in accordance with proper practices as set out in the CIPFA/LASAAC Code of Practice on Local Authority Accounting in the United Kingdom (“the Code of Practice”). In preparing this Statement of Accounts, the Corporate Director of Resources has:
• Selected suitable accounting policies and then applied them consistently
• Made judgements and estimates that were reasonable and prudent
• Complied with the Code of Practice. The Corporate Director of Resources has also:
• Kept proper accounting records which were up to date
• Taken reasonable steps for the prevention and detection of fraud and other irregularities. I certify that the Statement of Accounts 2011/12 presents fairly the financial position of the Council at 31
st March 2012 and its income and expenditure for the year.
Chris Naylor ACA IPFA MACantab Corporate Director of Resources
97
GLOSSARY OF FINANCIAL TERMS AND ABBREVIATIONS The following terms and abbreviations, while not being exhaustive, may provide assistance in understanding the Statement of Accounts.
FINANCIAL TERMS Accounting period - The period of time covered by the Council’s accounts. The Council’s financial year is from the period 1
st April to the following 31
st March.
Accounting policies – The specific principles, bases, conventions, rules, and practices applied by the Council in preparing and presenting the financial statements. Accounting standards - A set of rules explaining how accounts are to be kept. (See ‘International Financial Reporting Standards’) Accrual - The recognition of income and expenditure in the year that they occur and not when any cash is received or paid. Accumulated Absences Account – This account represents the value of leave rolled over from one financial year to another. This reserve account is used to avoid reducing general fund reserves. Actuary - An independent adviser to the Council on the financial position of the Pension Fund. Actuarial Valuation - Every three years the Actuary reviews the assets and liabilities of the Pension Fund and reports to the Council on the fund’s financial position and recommended employers’ contribution rates. Agency services - Services provided by or for another local authority or public body where the cost of carrying out the service is reimbursed. Amortisation - The writing off of an intangible asset or loan balance to the Comprehensive Income and Expenditure Statement over an appropriate period of time. Amortised Cost - The carrying value of an asset or liability in the balance sheet, which has been written up or down via the Comprehensive Income and Expenditure Statement. Balance Sheet - A statement of all the assets, liabilities and other balances of the Council at the end of an accounting period. Billing Authority – Refers to a local authority that is responsible for the collection of tax, both on behalf of itself and local authorities in its area. Budget - A forecast of future expenditure plans for the Council. Detailed revenue budgets are prepared for each year and it is on the basis of these figures that the Council Tax is set. Budgets are revised throughout the year for changes as necessary. Capital Adjustment Account - Represents amounts set aside from revenue resources or capital receipts to finance expenditure on property, plant, and equipment (PPE) or for the repayment of external loans, or certain other capital financing transactions. Capital Expenditure - Expenditure on the acquisition of property, plant, and equipment (PPE) or expenditure which adds to the value of an existing item of PPE. Capital Financing Requirement - Represents the Council’s underlying need to borrow for a capital purpose.
98
Capital Grants Receipts in Advance – Balances of capital grants and contributions that have conditions which may require future repayment if not spent. Capital Grants Unapplied – Grant balances that will be used for future capital expenditure. Capital Receipt - Income received from the sale of PPE such as land or buildings. Capital Receipts Reserve - Represents proceeds from the sale of PPE available to meet future capital investment. Carrying Value - In relation to the value of financial instruments, it is the amount to be recognised on the Balance Sheet. Cash equivalents – Highly liquid, safe investments that can easily be converted into cash. Chartered Institute of Public Finance and Accountancy (CIPFA) – A professional accountancy body, specialising in the Public Sector. It promotes best practice by issuing guidelines and Codes of Practice. Collection Fund - A statutory account which receives Council Tax and Non-Domestic Rates to cover the costs of services provided by the Council and its precepting authorities. Collection Fund Adjustment Account - The Collection Fund Adjustment Account represents the Council’s share of the Collection Fund Surplus/Deficit. Community Assets - Assets that a local authority intends to hold in perpetuity, that have no determinable useful life and that may have restrictions on their disposal. Examples of Community Assets are parks and historic buildings. Comprehensive Income and Expenditure Statement - A statement showing the expenditure and income of the Council’s services during the year demonstrating how costs have been financed from general Government grants and income from local taxpayers. Contingent Liability - Where possible “one-off” future liabilities or losses are identified but the level of uncertainty is such that the establishment of a provision is not appropriate. Consumer Price Index (CPI) – Measures the average change in retail prices of a basket of goods and services purchased by most UK households, to provide an indication of the rate of inflation. The CPI includes some financial services in the basket of goods not included in the RPI. Creditors - Amount of money owed by the Council for goods and services received. Also referred to as Payables. Debtors - Amount of money owed to the Council by individuals, and organisations. Also referred to as Receivables. Dedicated Schools Grant – Grant monies provided by the Department of Education ring-fenced to schools budgets. Deferred Capital Receipts - The balance of outstanding mortgages granted mainly to purchasers of council houses. Deferred Income – Receipt in Advance – This represents a receipt received as part of entering into a building lease. The credit is being released over the term of the lease. Deferred Liabilities – These are future payments that the Council is contractually obliged to pay in future years. These liabilities relate to Private Finance Initiative (PFI) schemes. Defined Benefit Scheme - A pension scheme which defines benefits independently of the contributions payable. Benefits are not directly related to the investments of the Pension Fund. Depreciation - The measure of the wearing out, consumption or other reduction in the useful economic life of PPE, whether arising from use, passage of time or obsolescence through technological or other changes.
99
Earmarked Reserves - Amounts set aside for a specific purpose to meet future commitments or potential liabilities, for which it is not appropriate to establish provisions. Fair Value - In relation to the value of financial instruments, it is the amount for which an asset can be exchanged or a liability settled between knowledgeable and willing parties in an arms length transaction. Finance Lease - A lease that transfers substantially all of the risks and rewards of ownership of an asset to the lessee. Financial Instrument - Any contract that gives rise to a financial asset of one entity and a financial liability or equity instrument of another. Financial Instrument Adjustment Account - This represents the balance of deferred discounts relating to the premature redemption of Public Works Loans Board (PWLB) debt. General Fund (GF) - The Council’s main revenue account from which is met the cost of providing most of the Council’s services. Group Accounts – Where a Council has a material interest in a separate entity, the entity’s assets and liabilities may need to be incorporated within the council’s group accounts. If the council controls an entity, it is a subsidiary (as in the case of Tower Hamlets Homes for the Council). Heritage asset - An asset with historical, artistic, scientific, technological, geophysical or environmental qualities that is held and maintained principally for its contribution to knowledge and culture. Historic Cost - The actual cost of an asset in terms of past consideration as opposed to current value. Housing Revenue Account (HRA) - A statutory account maintained separately from the General Fund for the recording of income and expenditure relating to the provision of council housing. Impairment - A reduction in the valuation of PPE caused by consumption of economic benefits or by a general fall in prices. Infrastructure Assets – Inalienable assets, expenditure on which is only recoverable by continued use of the asset created. There is no prospect of sale or alternative use. Examples include roads, bridges, and tunnels. Intangible Assets - Non-financial long-term assets that do not have physical substance but are identifiable and controlled by the Council i.e. purchased software licences. Interest Rate Risk - The uncertainty of interest paid/received on variable rate instruments and the effect of fluctuations in interest rates on the fair value of an instrument. International Financial Reporting Standards (IFRS) – The set of international accounting standards issued by the International Accounting Standards Board (IASB). Local Authorities are required to produce accounts based on IFRS. Inventories – The value of stocks held and work in progress that have not been completed. Investment Properties – Those properties that are held solely to earn rentals and/or for capital appreciation, rather than for the delivery of services. Levy - Payments to bodies such as the Environment Agency. The cost of these bodies is funded by local authorities in the area concerned based on their Council Tax base and is met from the General Fund. Long-Term Assets - Assets that yield benefit to the Council and the services it provides for a period of more than one year.
100
Major Repairs Reserve - Represents the funds available to meet capital investment in council housing Minimum Revenue Provision (MRP) - The amount that has to be charged to revenue to provide for the redemption of debt. Not applicable to the HRA. Movement in Reserves Statement – A summary of the Council’s reserves at the balance sheet date split between usable and unusable reserves. National Non-Domestic Rates (NNDR) Pool - Non-Domestic Rates (Business Rates) are paid into a central pool controlled by Government. This money is then redistributed to councils on the basis of resident population. Net Book Value - The amount at which PPE is included in the balance sheet after depreciation has been provided for. Net Realisable Value - The open market value of the asset less the expenses to be incurred in realising the asset. Non Current Assets Held for Sale – Items of PPE whose carrying amount is to be recovered principally through a sale rather than continued use by the Council. Operating Lease - A lease other than a finance lease - a lease which permits the use of the asset without substantially transferring the risks and rewards of ownership. Outturn - The actual level of expenditure and income for the year. Precept - The charge made by the Greater London Authority on the Council to finance its net expenditure. Private Finance Initiative - Contracts whereby private sector suppliers provide services and/or capital investment in return for a unitary payment; subject to agreed performance targets. Projected Unit Method - Actuarial valuation method whose key feature is to assess future service cost; the Actuary calculates the employer’s contribution rate, which will meet the cost of benefits accruing in the year after the valuation date. Property, Plant, and Equipment – The land and building assets under the council’s control or ownership. Provisions - Amounts set aside for liabilities and losses, which are certain or very likely to occur but where the exact amount or timing of the payment are uncertain. Public Works Loans Board (PWLB) - Central Government agency which funds much of local government borrowing. Registered Social Landlord - A not-for-profit organisation which owns and manages social housing. Reserves - Amounts set aside which do not fall within the definition of a provision, to fund items of anticipated expenditure. These include general reserves or balances which every Council must maintain as a matter of prudence. Retail Price Index (RPI) – Measures the average change in retail prices of a basket of goods and services purchased by most UK households, to provide an indication of the rate of inflation. The RPI includes mortgage interest payments and council tax in the basket of goods not included in the CPI. Revaluation Reserve - Represents the increase in value of the Council’s land and building assets from 1st April 2007. Revenue Contributions to Capital Outlay (RCCO) - The use of revenue monies to pay for capital expenditure. Also referred to as Direct Revenue Financing (DRF). Revenue Expenditure - The day-to-day expenditure of the Council - salaries, goods and services and capital financing charges.
101
Revenue Support Grant - General grant paid by the Government to local authorities. Right to buy - The council is legally required to sell council homes to tenants, at a discount, where the tenant wishes to buy their home. The money received from the sale is a capital receipt, some of which will be retained by the council to spend on capital expenditure, while the remainder must be paid over to the DCLG under pooling arrangements. Soft Loan - Loans given at less than market/commercial rates to community or not-for-profit organisations. Supplementary Business Rates (SBR) – Locally raised business rates for local projects. London Councils are levying a SBR for the Cross-rail project. Support Services - Activities of a professional, technical and administrative nature which are not Council services in their own right, but support main front line services such as finance, information technology and human resources. Surplus Assets – Those assets which are not being used to deliver services, but do not meet the criteria to be classified as either Investment Properties or Non Current Assets Held for Sale. Unusable Reserves – These represent reserve balances that cannot be spent as part of an organisation’s medium term financial plan. An example is the revaluation reserve. Usable Reserves – These represent reserve balances that can be spent as part of an organisation’s medium term financial plan. Any organisation has to review reserve levels to ensure long-term financial stability. General fund and Housing Revenue Account reserves are usable reserves. Contrast to unusable reserves. Value for money (VFM) – This term is used to describe the relationship between the economy, efficiency, and effectiveness (known as the ‘three Es’) of a service, function or activity. Value for money is high when there is an optimum balance between all three.
102
Abbreviations used in Accounts
AGS Annual Governance Statement
ALMO Arm’s Length Management Organisation (Tower Hamlets Homes)
BSF Building Schools for the Future
CAA Capital Adjustment Account
CFR Capital Financing Requirement
CIES Comprehensive Income and Expenditure Statement
CIPFA Chartered Institute of Public Finance and Accountancy
CPI Consumer Price Index
DCLG Department of Communities and Local Government
DEFRA – Department for Environment, Food and Rural Affairs
DfE Department for Education
DSG Dedicated Schools Grant
DWP Department for Work and Pensions
EIR Effective Interest Rate
GAAP Generally Accepted Accounting Principles
GLA Greater London Authority
HRA Housing Revenue Account
IAS International Accounting Standard
IFRS International Financial Reporting Standards
LABGI Local Authority Business Growth Incentive
LAML London Authorities Mutual Limited
LASAAC Local Authority (Scotland) Accounts Advisory Committee
LATS Landfill Allowance Trading Scheme
LBTH London Borough of Tower Hamlets
LGPS Local Government Pension Scheme
LOBO Lender’s Option – Borrower’s option
LPFA London Pensions Fund Authority
MRA Major Repairs Allowance
MRP Minimum Revenue Provision
NCS Net Cost of Services
NPV Net Present Value
(N)NDR (National) Non-Domestic Rates
PCT Primary Care Trust
PFI Private Finance Initiative
PPA Prior Period Adjustment
PPE Property, Plant and Equipment
PWLB Public Works Loans Board
REFCUS Revenue Expenditure Funded by Capital Under Statute
RICS Royal Institute of Chartered Surveyors
RPI Retail Price Index
103

RSG Revenue Support Grant
SDPS Surplus or Deficit on the Provision of Services
SeRCOP Service Reporting Code of Practice
SORP Statement of Recommended Practice
TH Tower Hamlets
THH Tower Hamlets Homes
WDA Waste Disposal Authority
104