Embed Size (px)
Citation preview
Berkeley Evaluation and Assessment (BEA) 2
Logging On Page 3
Performance Analysis Tab Page 4
My Reports
Student Profiles Page 5
Focus Reports Page 9
Summary Reports Page 16
One-click Reports Page 25
My One-click Favorites Page 26
Easy-Analyze Page 27
GraphIt! Page 31
Ad hoc Reports
Custom View/Output Page 38
Performance Explorer Page 42
Logging Out Page 46
Logging On
Berkeley Evaluation and Assessment (BEA) 3
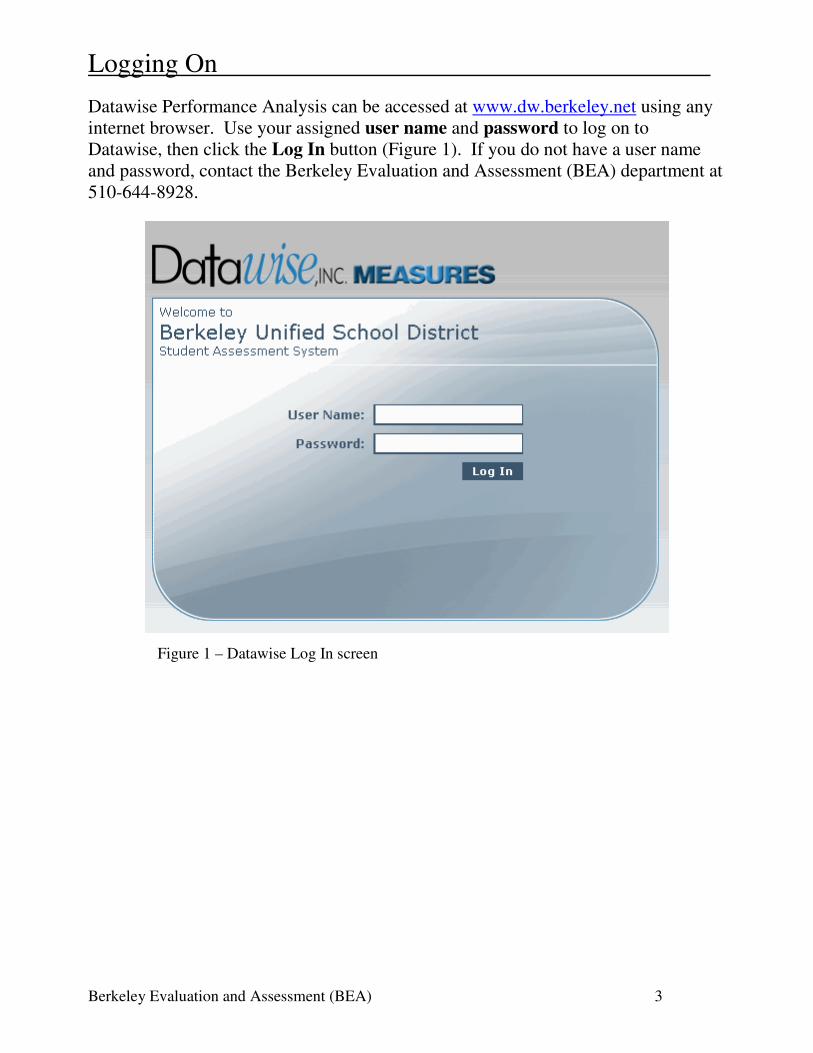
Datawise Performance Analysis can be accessed at www.dw.berkeley.net using any
internet browser. Use your assigned user name and password to log on to
Datawise, then click the Log In button (Figure 1). If you do not have a user name
and password, contact the Berkeley Evaluation and Assessment (BEA) department at
510-644-8928.
Figure 1 – Datawise Log In screen
Performance Analysis Tab
Berkeley Evaluation and Assessment (BEA) 4
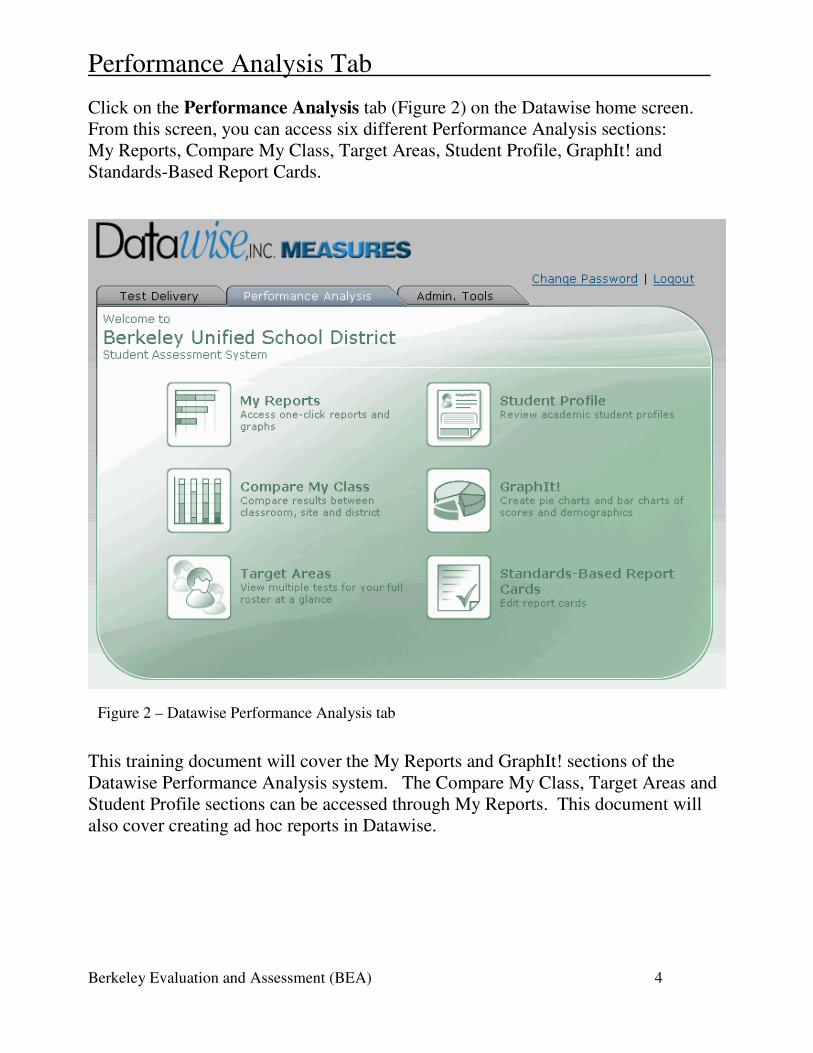
Click on the Performance Analysis tab (Figure 2) on the Datawise home screen.
From this screen, you can access six different Performance Analysis sections:
My Reports, Compare My Class, Target Areas, Student Profile, GraphIt! and
Standards-Based Report Cards.
This training document will cover the My Reports and GraphIt! sections of the
Datawise Performance Analysis system. The Compare My Class, Target Areas and
Student Profile sections can be accessed through My Reports. This document will
also cover creating ad hoc reports in Datawise.
Figure 2 – Datawise Performance Analysis tab
My Reports – Student Profiles
Berkeley Evaluation and Assessment (BEA) 5
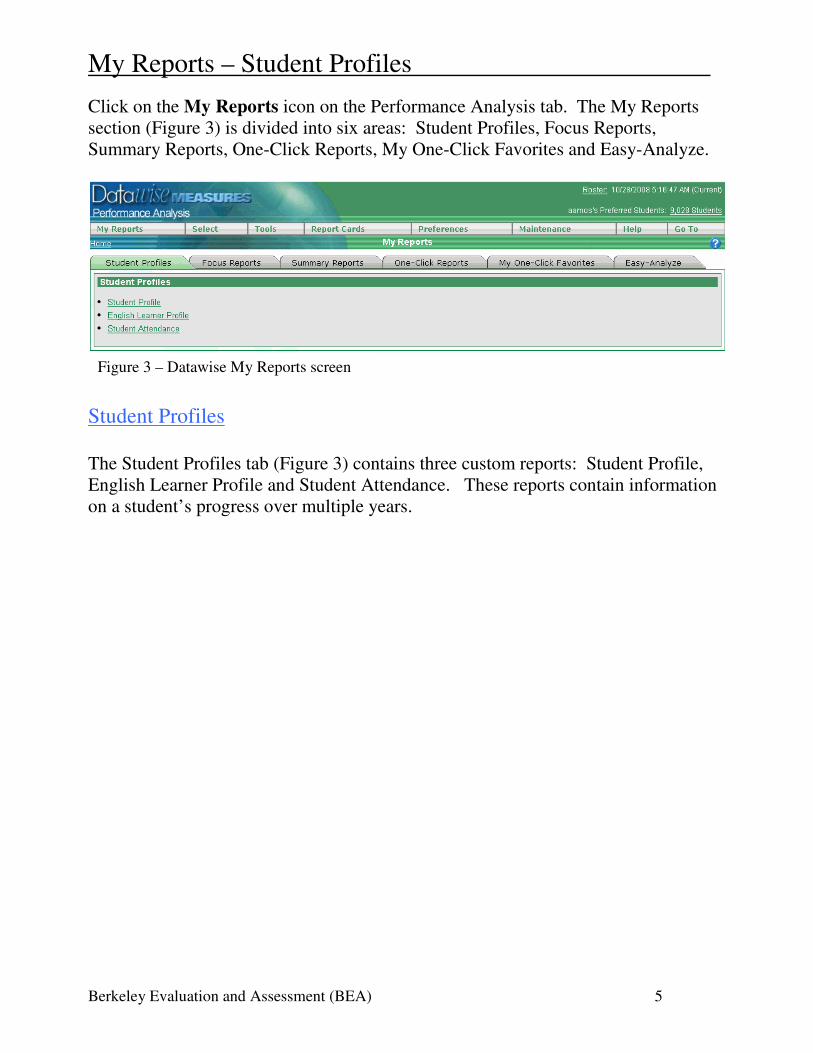
Click on the My Reports icon on the Performance Analysis tab. The My Reports
section (Figure 3) is divided into six areas: Student Profiles, Focus Reports,
Summary Reports, One-Click Reports, My One-Click Favorites and Easy-Analyze.
Student Profiles
The Student Profiles tab (Figure 3) contains three custom reports: Student Profile,
English Learner Profile and Student Attendance. These reports contain information
on a student’s progress over multiple years.
Figure 3 – Datawise My Reports screen
My Reports – Student Profiles
Berkeley Evaluation and Assessment (BEA) 6
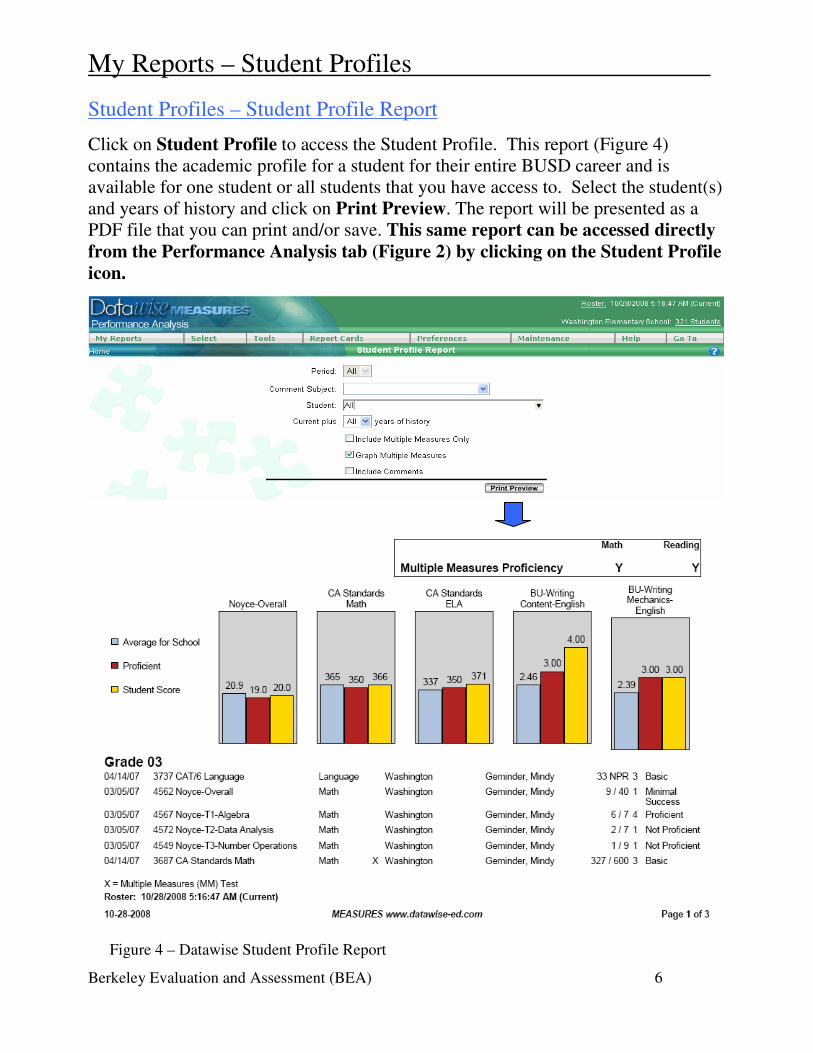
Student Profiles – Student Profile Report
Click on Student Profile to access the Student Profile. This report (Figure 4)
contains the academic profile for a student for their entire BUSD career and is
available for one student or all students that you have access to. Select the student(s)
and years of history and click on Print Preview. The report will be presented as a
PDF file that you can print and/or save. This same report can be accessed directly
from the Performance Analysis tab (Figure 2) by clicking on the Student Profile
icon.
Figure 4 – Datawise Student Profile Report
My Reports – Student Profiles
Berkeley Evaluation and Assessment (BEA) 7
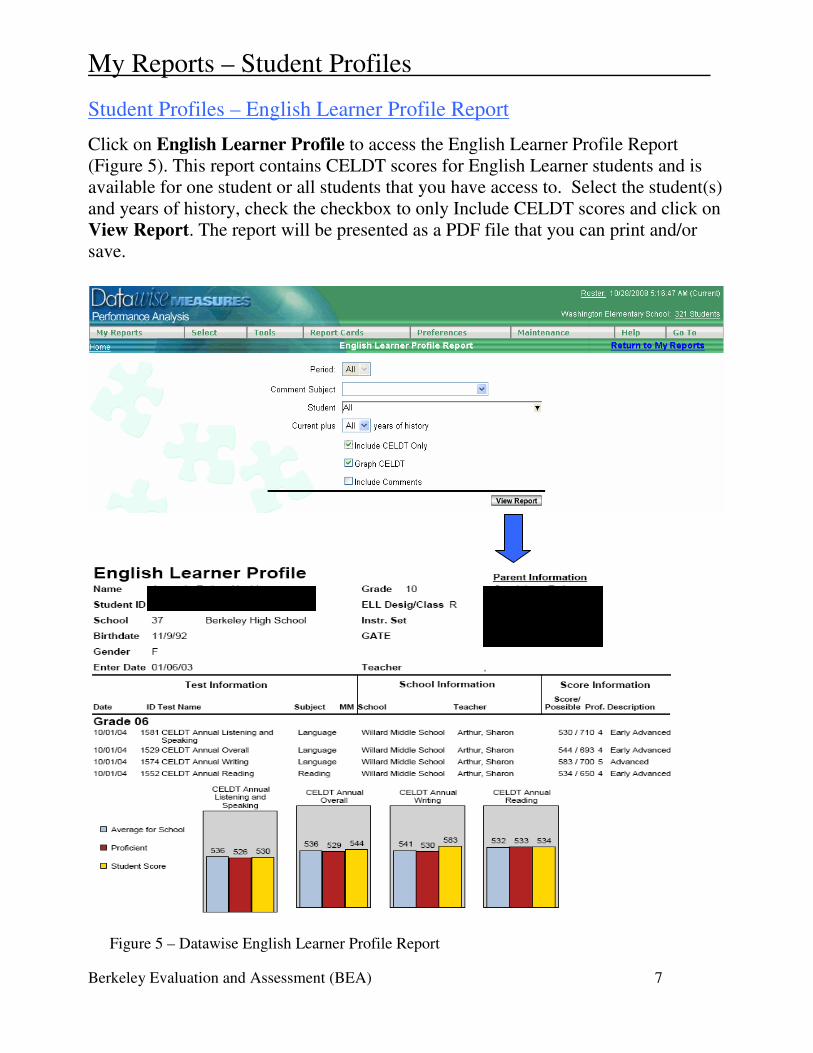
Student Profiles – English Learner Profile Report
Click on English Learner Profile to access the English Learner Profile Report
(Figure 5). This report contains CELDT scores for English Learner students and is
available for one student or all students that you have access to. Select the student(s)
and years of history, check the checkbox to only Include CELDT scores and click on
View Report. The report will be presented as a PDF file that you can print and/or
save.
Figure 5 – Datawise English Learner Profile Report
My Reports – Student Profiles
Berkeley Evaluation and Assessment (BEA) 8
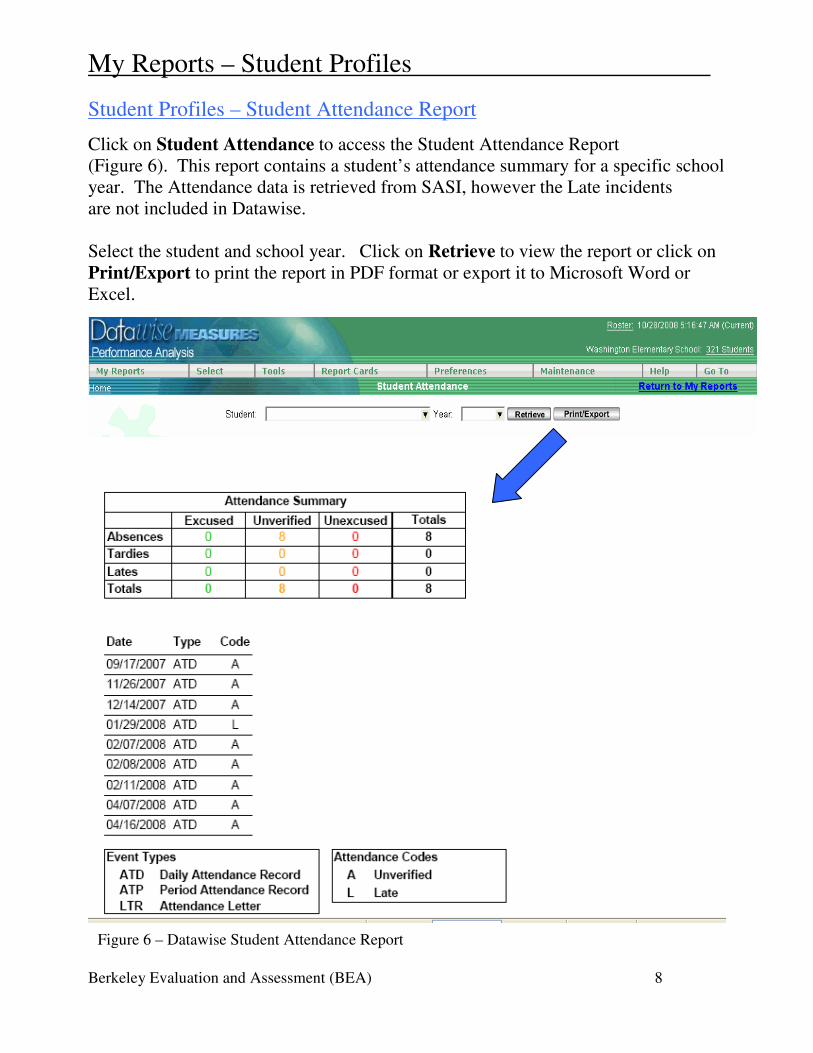
Student Profiles – Student Attendance Report
Click on Student Attendance to access the Student Attendance Report
(Figure 6). This report contains a student’s attendance summary for a specific school
year. The Attendance data is retrieved from SASI, however the Late incidents
are not included in Datawise.
Select the student and school year. Click on Retrieve to view the report or click on
Print/Export to print the report in PDF format or export it to Microsoft Word or
Excel.
Figure 6 – Datawise Student Attendance Report
My Reports – Focus Reports
Berkeley Evaluation and Assessment (BEA) 9
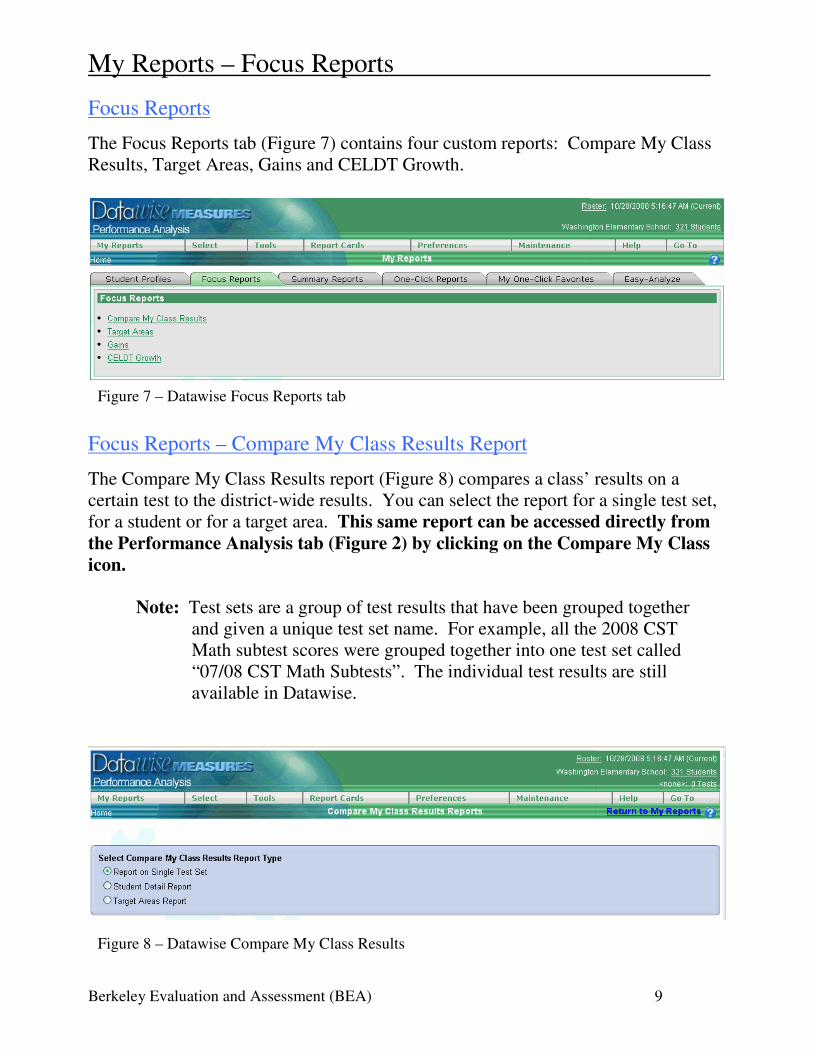
Focus Reports
The Focus Reports tab (Figure 7) contains four custom reports: Compare My Class
Results, Target Areas, Gains and CELDT Growth.
Focus Reports – Compare My Class Results Report
The Compare My Class Results report (Figure 8) compares a class’ results on a
certain test to the district-wide results. You can select the report for a single test set,
for a student or for a target area. This same report can be accessed directly from
the Performance Analysis tab (Figure 2) by clicking on the Compare My Class
icon.
Note: Test sets are a group of test results that have been grouped together
and given a unique test set name. For example, all the 2008 CST
Math subtest scores were grouped together into one test set called
“07/08 CST Math Subtests”. The individual test results are still
available in Datawise.
Figure 7 – Datawise Focus Reports tab
Figure 8 – Datawise Compare My Class Results
My Reports – Focus Reports
Berkeley Evaluation and Assessment (BEA) 10
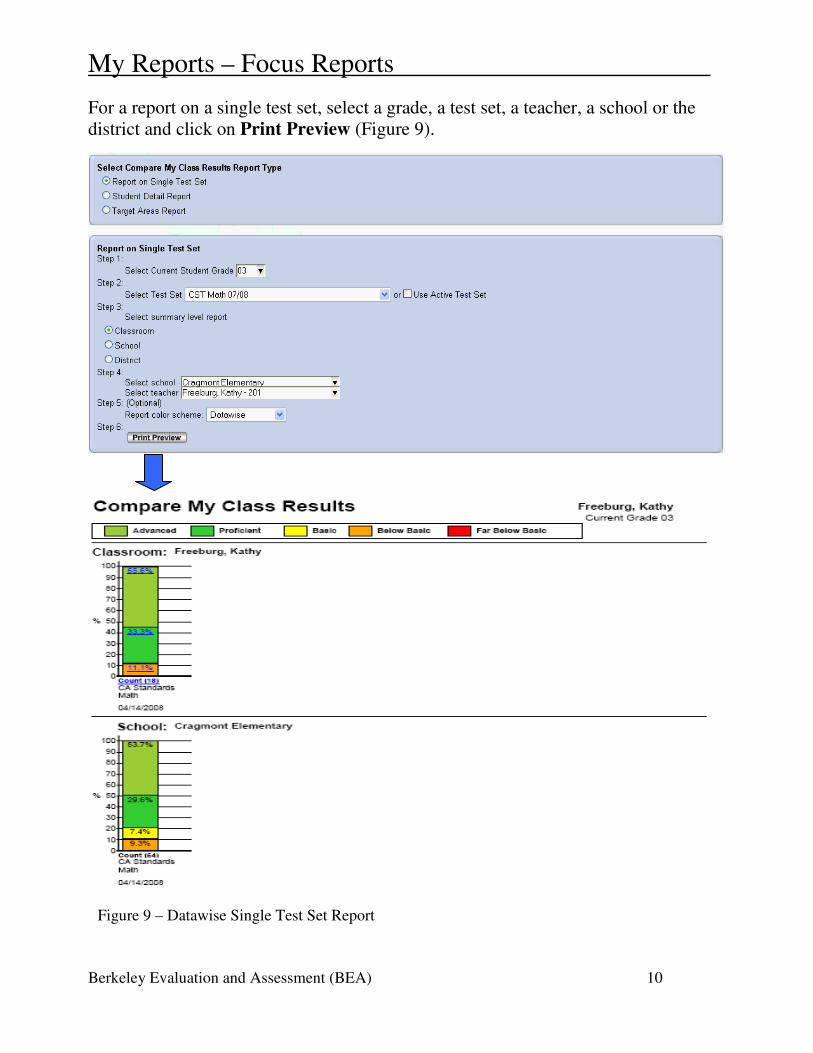
For a report on a single test set, select a grade, a test set, a teacher, a school or the
district and click on Print Preview (Figure 9).
Figure 9 – Datawise Single Test Set Report
My Reports – Focus Reports
Berkeley Evaluation and Assessment (BEA) 11
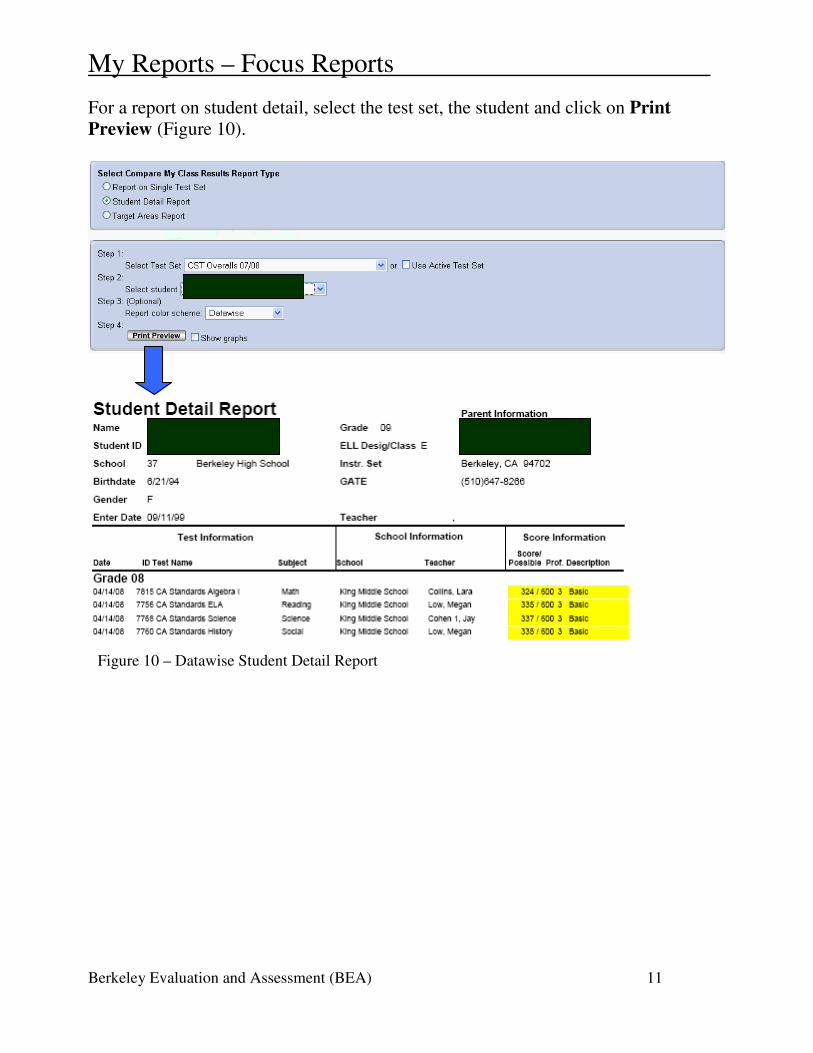
For a report on student detail, select the test set, the student and click on Print
Preview (Figure 10).
Figure 10 – Datawise Student Detail Report
My Reports – Focus Reports
Berkeley Evaluation and Assessment (BEA) 12
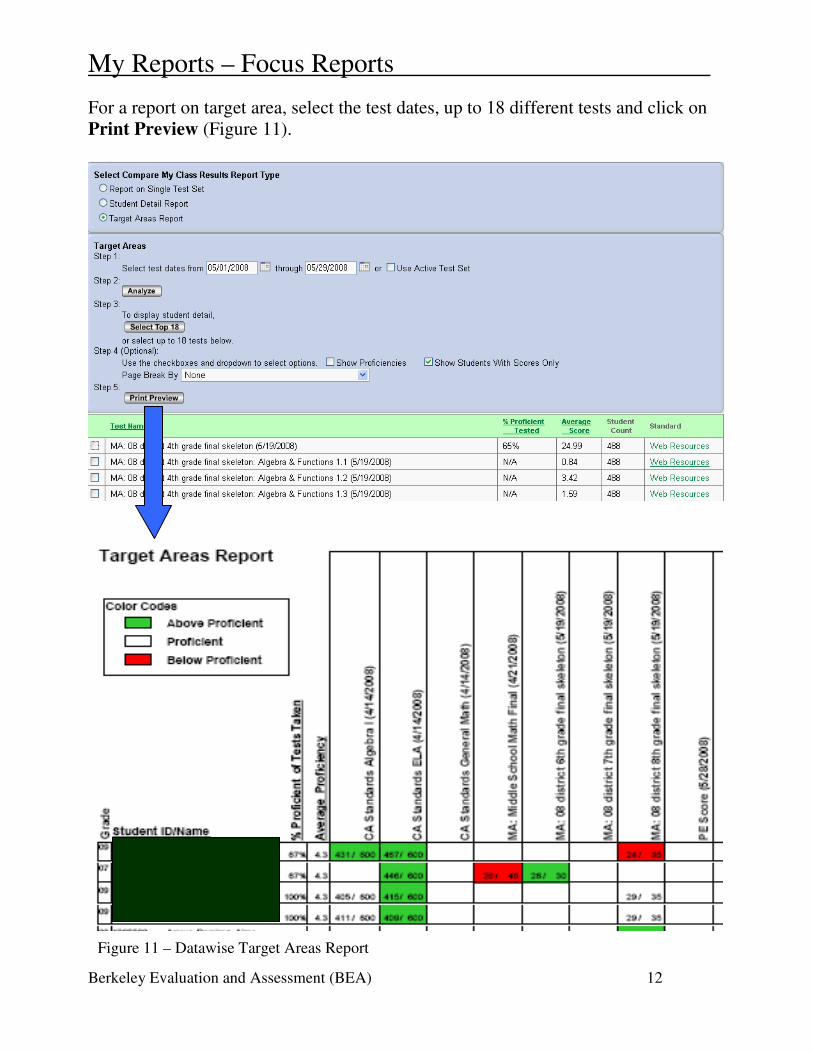
For a report on target area, select the test dates, up to 18 different tests and click on
Print Preview (Figure 11).
Figure 11 – Datawise Target Areas Report
My Reports – Focus Reports
Berkeley Evaluation and Assessment (BEA) 13
Focus Reports – Target Areas
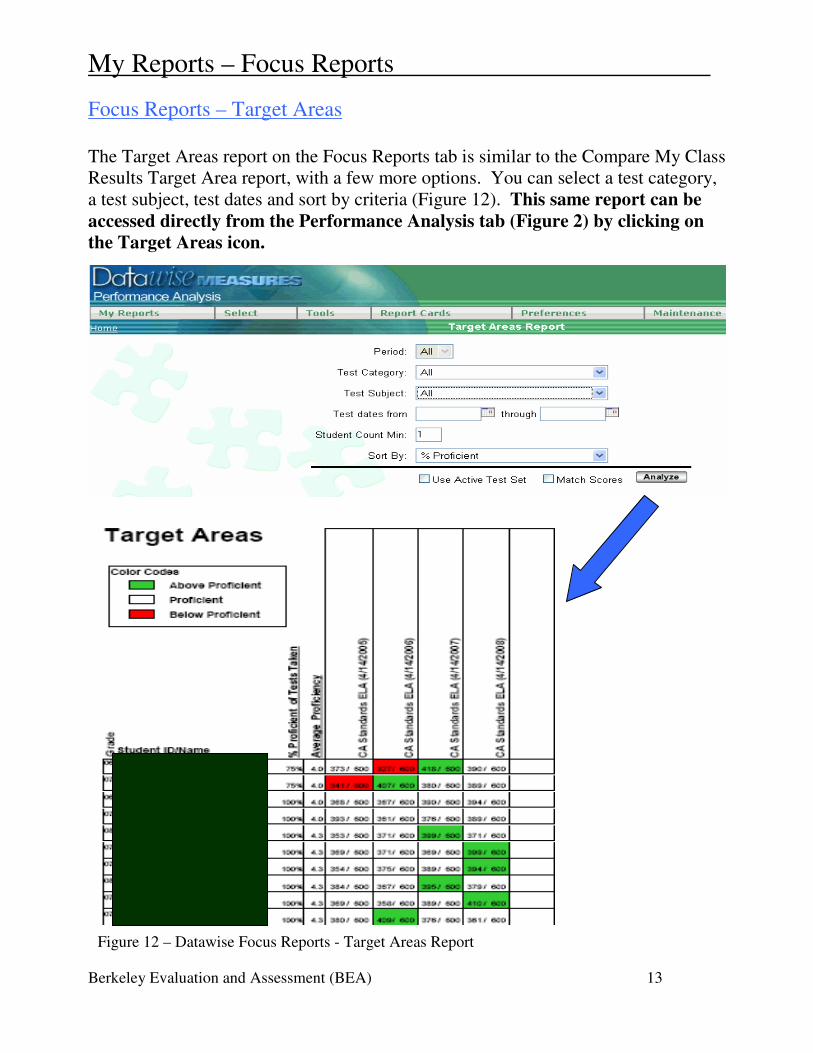
The Target Areas report on the Focus Reports tab is similar to the Compare My Class
Results Target Area report, with a few more options. You can select a test category,
a test subject, test dates and sort by criteria (Figure 12). This same report can be
accessed directly from the Performance Analysis tab (Figure 2) by clicking on
the Target Areas icon.
Figure 12 – Datawise Focus Reports - Target Areas Report
My Reports – Focus Reports
Berkeley Evaluation and Assessment (BEA) 14
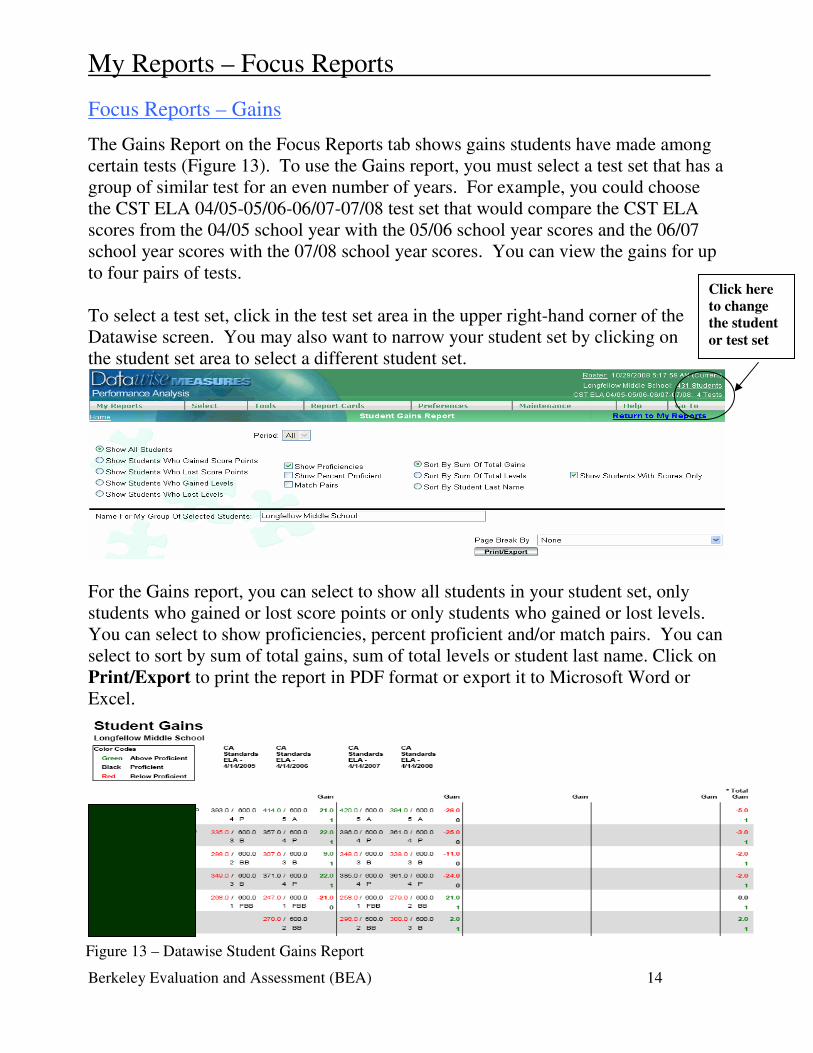
Focus Reports – Gains
The Gains Report on the Focus Reports tab shows gains students have made among
certain tests (Figure 13). To use the Gains report, you must select a test set that has a
group of similar test for an even number of years. For example, you could choose
the CST ELA 04/05-05/06-06/07-07/08 test set that would compare the CST ELA
scores from the 04/05 school year with the 05/06 school year scores and the 06/07
school year scores with the 07/08 school year scores. You can view the gains for up
to four pairs of tests.
To select a test set, click in the test set area in the upper right-hand corner of the
Datawise screen. You may also want to narrow your student set by clicking on
the student set area to select a different student set.
For the Gains report, you can select to show all students in your student set, only
students who gained or lost score points or only students who gained or lost levels.
You can select to show proficiencies, percent proficient and/or match pairs. You can
select to sort by sum of total gains, sum of total levels or student last name. Click on
Print/Export to print the report in PDF format or export it to Microsoft Word or
Excel.
Click here
to change
the student
or test set
Figure 13 – Datawise Student Gains Report
My Reports – Focus Reports
Berkeley Evaluation and Assessment (BEA) 15
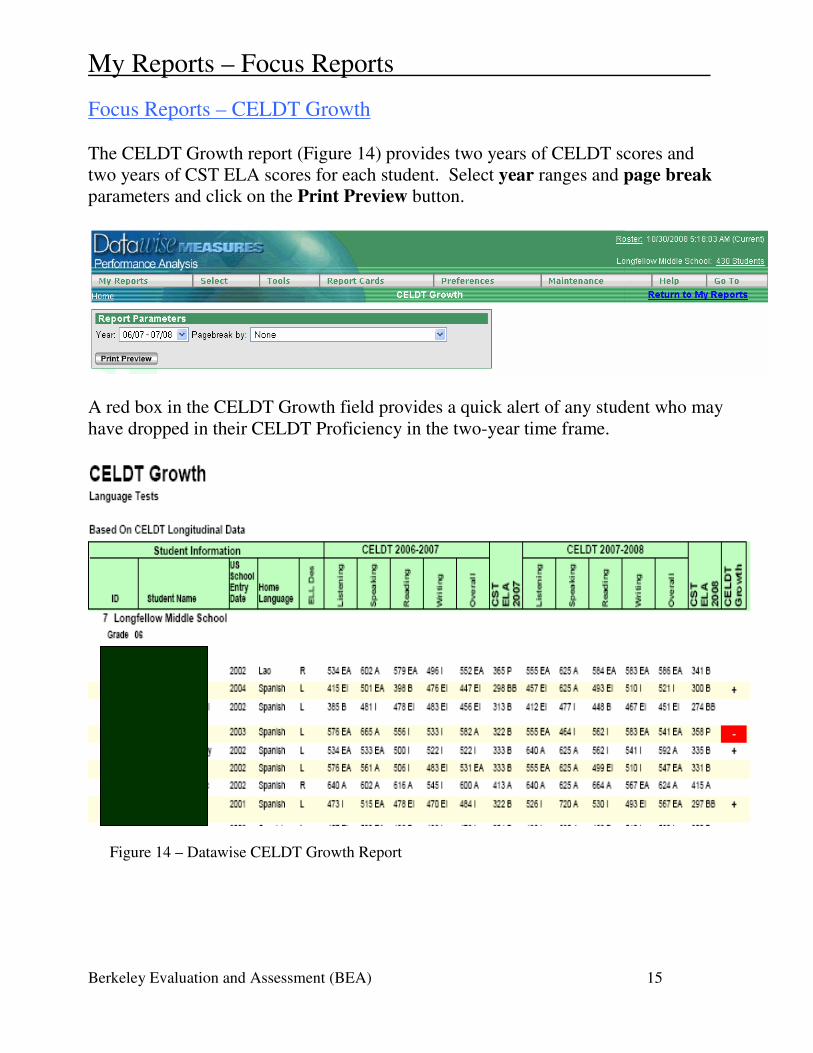
Focus Reports – CELDT Growth
The CELDT Growth report (Figure 14) provides two years of CELDT scores and
two years of CST ELA scores for each student. Select year ranges and page break
parameters and click on the Print Preview button.
A red box in the CELDT Growth field provides a quick alert of any student who may
have dropped in their CELDT Proficiency in the two-year time frame.
Figure 14 – Datawise CELDT Growth Report
My Reports – Summary Reports
Berkeley Evaluation and Assessment (BEA) 16
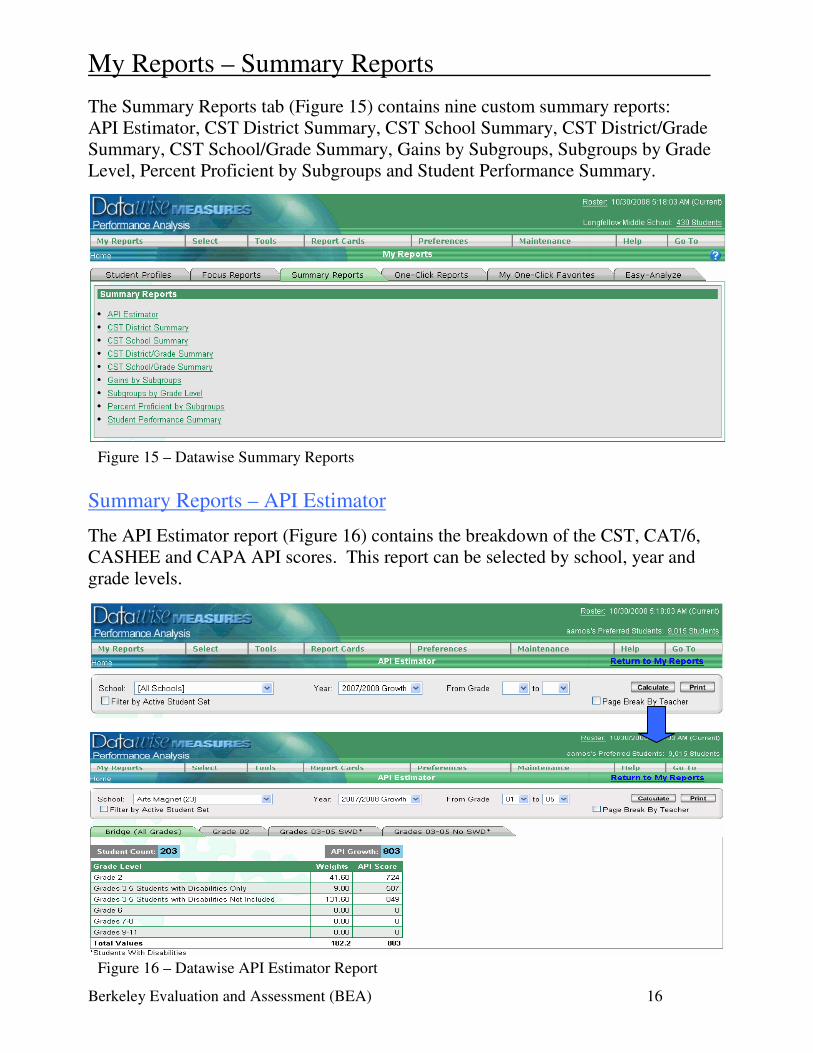
The Summary Reports tab (Figure 15) contains nine custom summary reports:
API Estimator, CST District Summary, CST School Summary, CST District/Grade
Summary, CST School/Grade Summary, Gains by Subgroups, Subgroups by Grade
Level, Percent Proficient by Subgroups and Student Performance Summary.
Summary Reports – API Estimator
The API Estimator report (Figure 16) contains the breakdown of the CST, CAT/6,
CASHEE and CAPA API scores. This report can be selected by school, year and
grade levels.
Figure 15 – Datawise Summary Reports
Figure 16 – Datawise API Estimator Report
My Reports – Summary Reports
Berkeley Evaluation and Assessment (BEA) 17
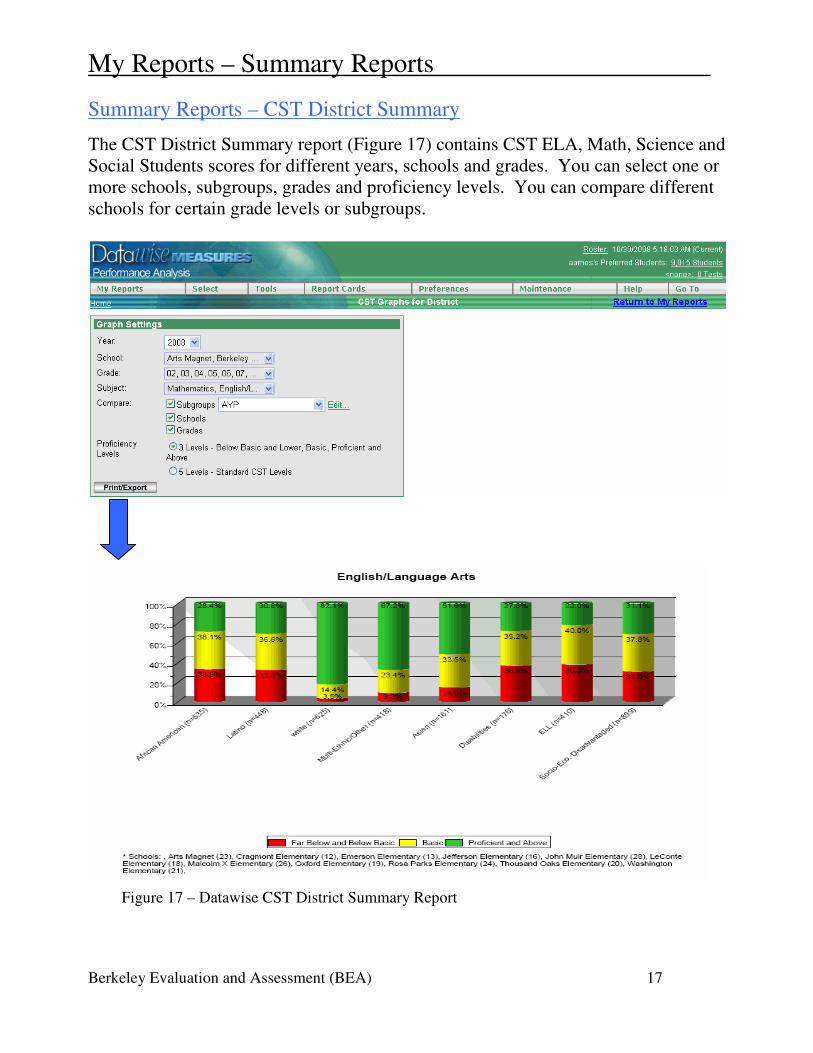
Summary Reports – CST District Summary
The CST District Summary report (Figure 17) contains CST ELA, Math, Science and
Social Students scores for different years, schools and grades. You can select one or
more schools, subgroups, grades and proficiency levels. You can compare different
schools for certain grade levels or subgroups.
Figure 17 – Datawise CST District Summary Report
My Reports – Summary Reports
Berkeley Evaluation and Assessment (BEA) 18
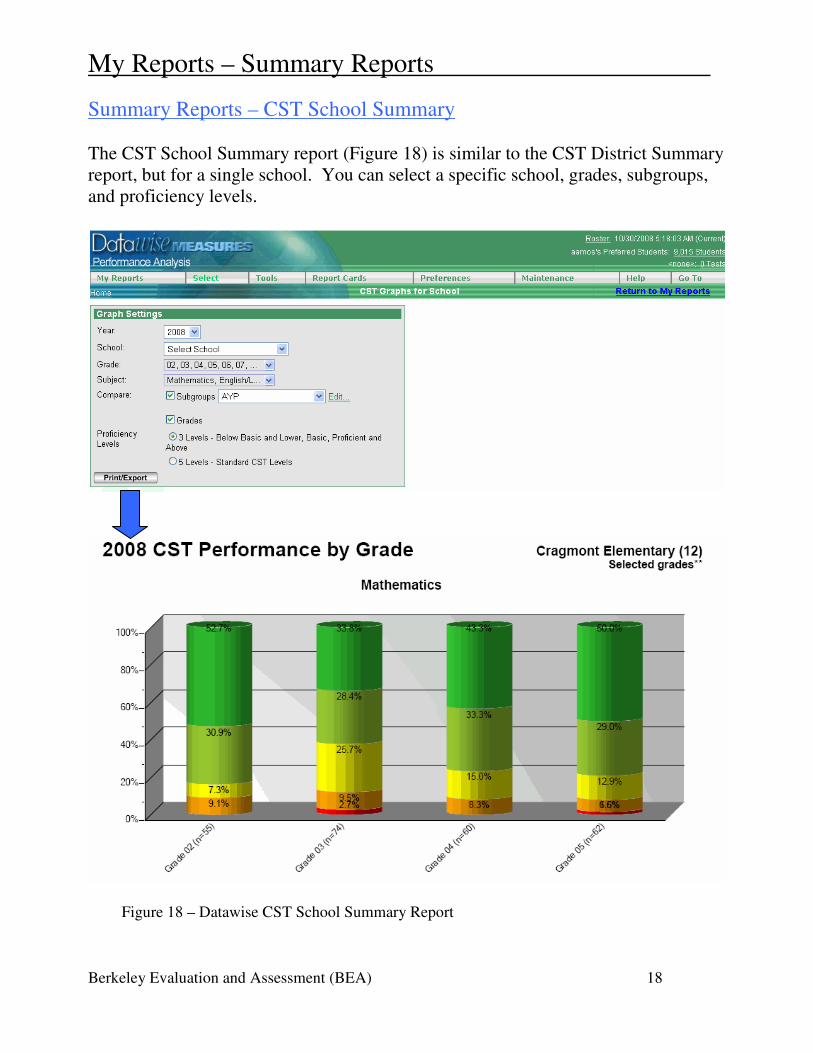
Summary Reports – CST School Summary
The CST School Summary report (Figure 18) is similar to the CST District Summary
report, but for a single school. You can select a specific school, grades, subgroups,
and proficiency levels.
Figure 18 – Datawise CST School Summary Report
My Reports – Summary Reports
Berkeley Evaluation and Assessment (BEA) 19
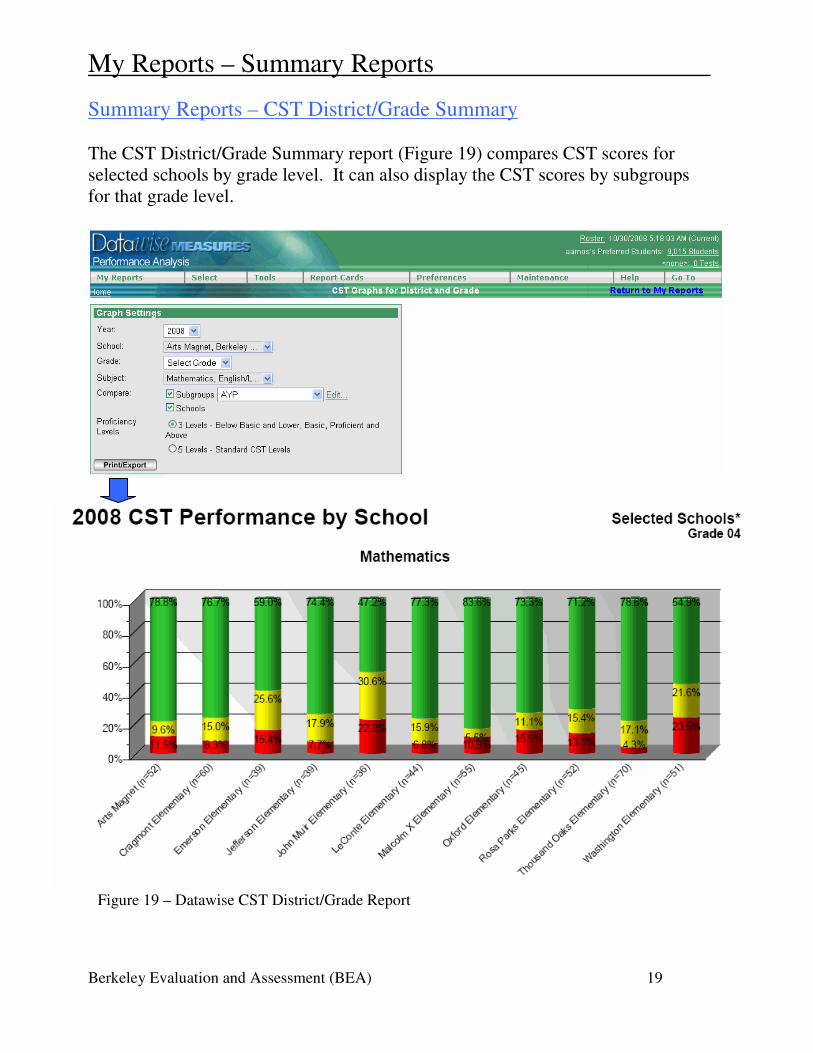
Summary Reports – CST District/Grade Summary
The CST District/Grade Summary report (Figure 19) compares CST scores for
selected schools by grade level. It can also display the CST scores by subgroups
for that grade level.
Figure 19 – Datawise CST District/Grade Report
My Reports – Summary Reports
Berkeley Evaluation and Assessment (BEA) 20
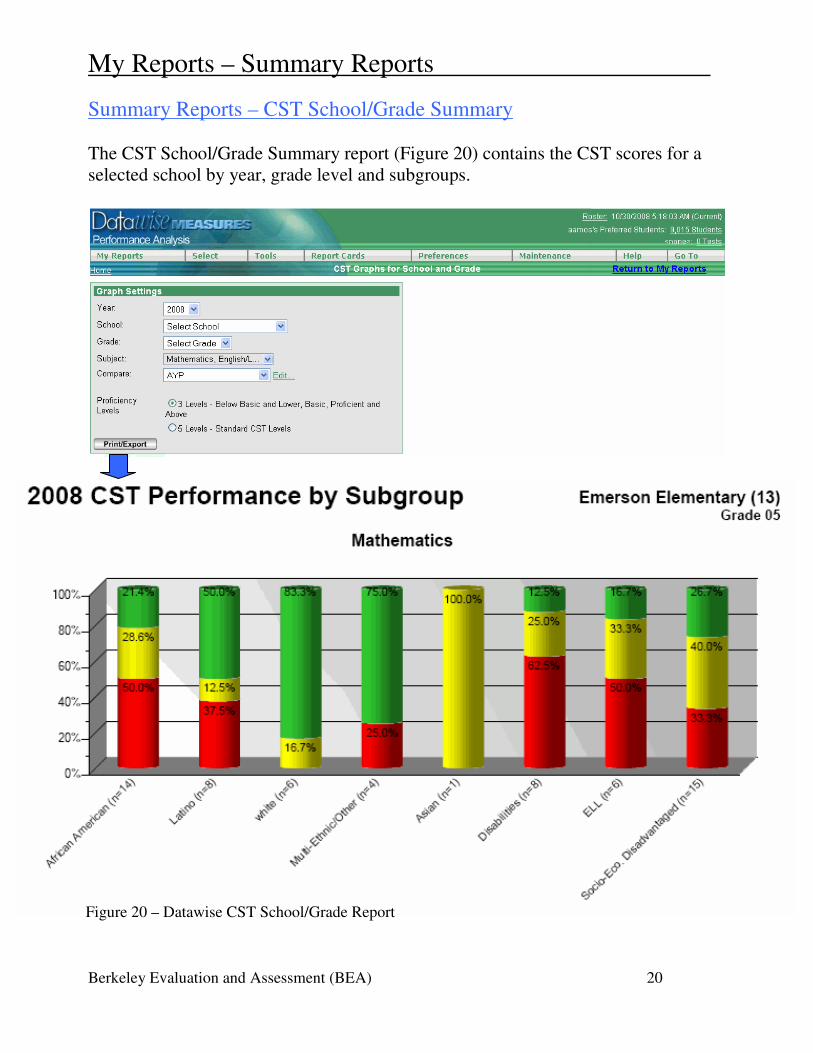
Summary Reports – CST School/Grade Summary
The CST School/Grade Summary report (Figure 20) contains the CST scores for a
selected school by year, grade level and subgroups.
Figure 20 – Datawise CST School/Grade Report
My Reports – Summary Reports
Berkeley Evaluation and Assessment (BEA) 21
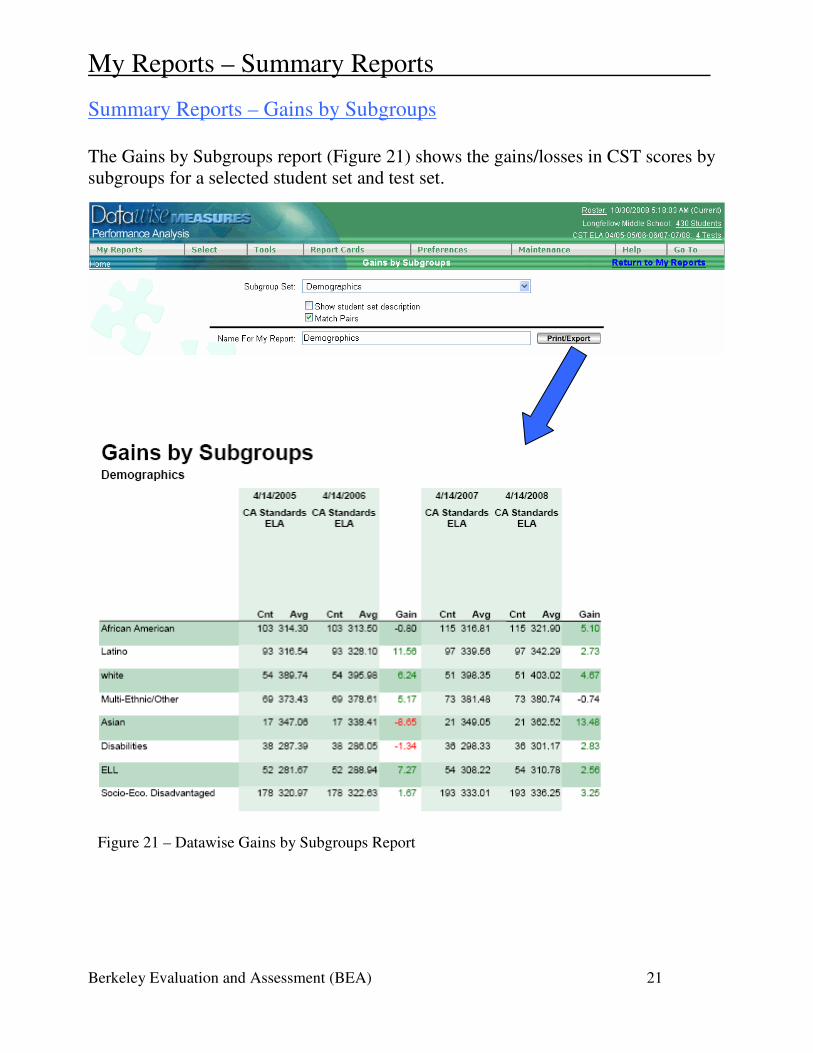
Summary Reports – Gains by Subgroups
The Gains by Subgroups report (Figure 21) shows the gains/losses in CST scores by
subgroups for a selected student set and test set.
Figure 21 – Datawise Gains by Subgroups Report
My Reports – Summary Reports
Berkeley Evaluation and Assessment (BEA) 22
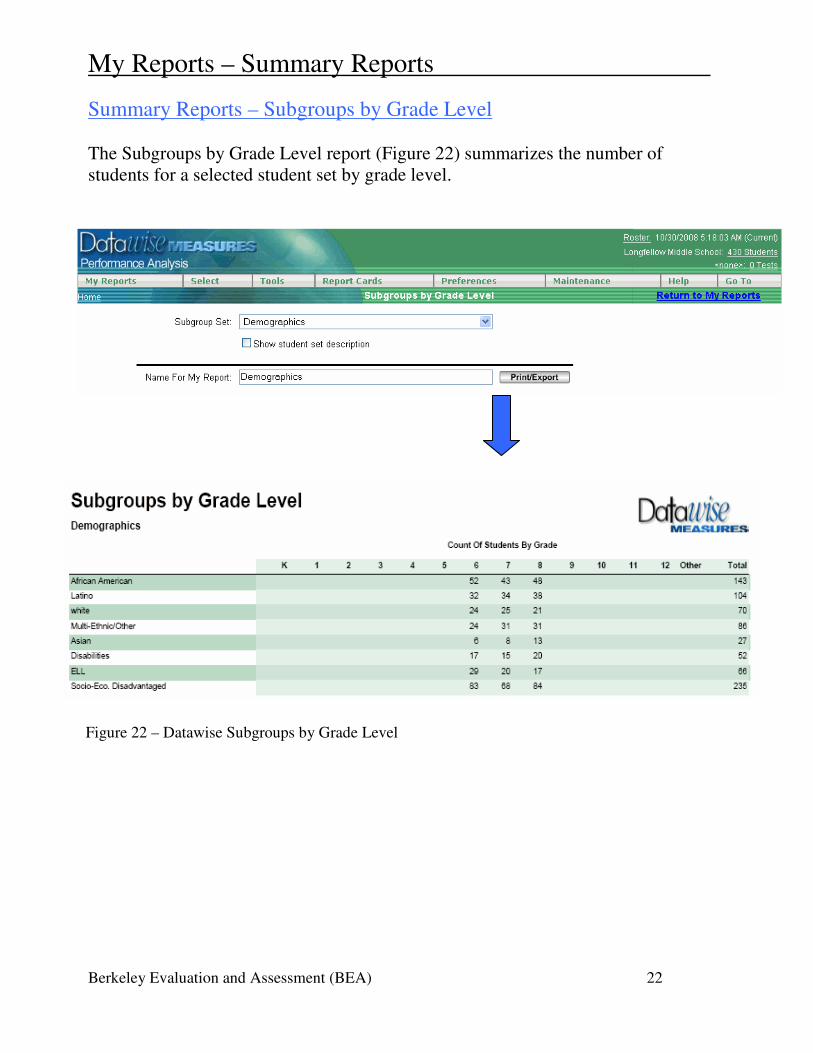
Summary Reports – Subgroups by Grade Level
The Subgroups by Grade Level report (Figure 22) summarizes the number of
students for a selected student set by grade level.
Figure 22 – Datawise Subgroups by Grade Level
My Reports – Summary Reports
Berkeley Evaluation and Assessment (BEA) 23
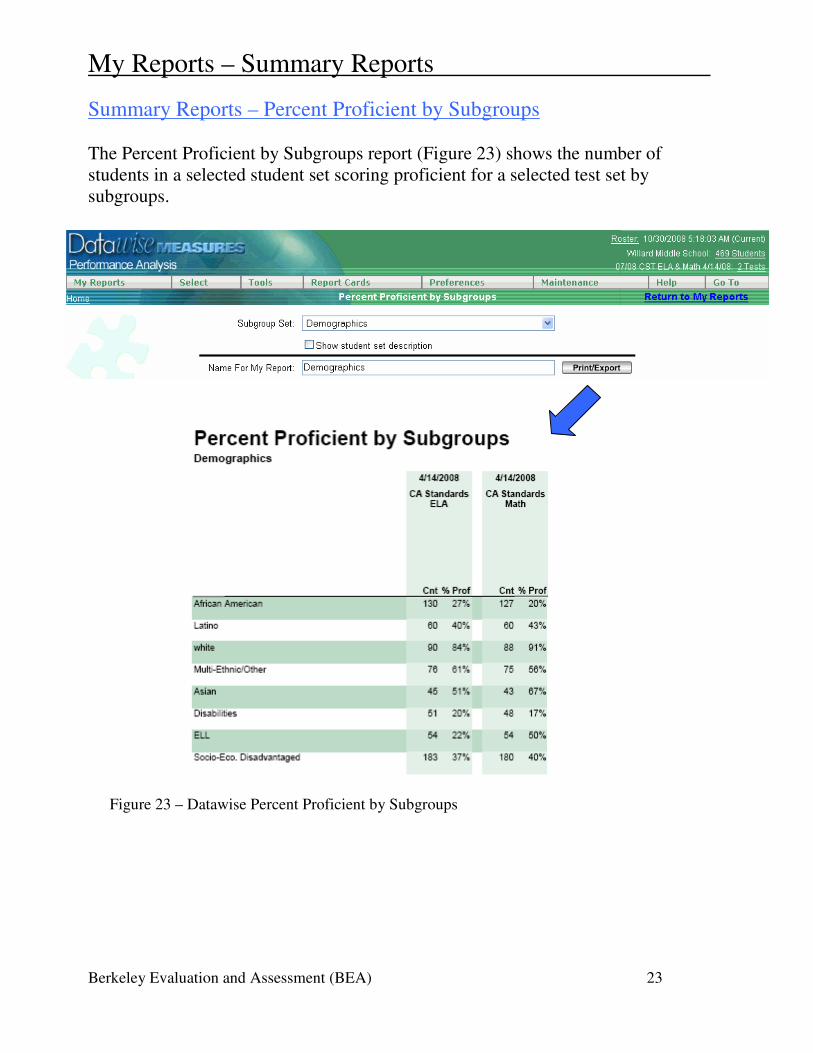
Summary Reports – Percent Proficient by Subgroups
The Percent Proficient by Subgroups report (Figure 23) shows the number of
students in a selected student set scoring proficient for a selected test set by
subgroups.
Figure 23 – Datawise Percent Proficient by Subgroups
My Reports – Summary Reports
Berkeley Evaluation and Assessment (BEA) 24
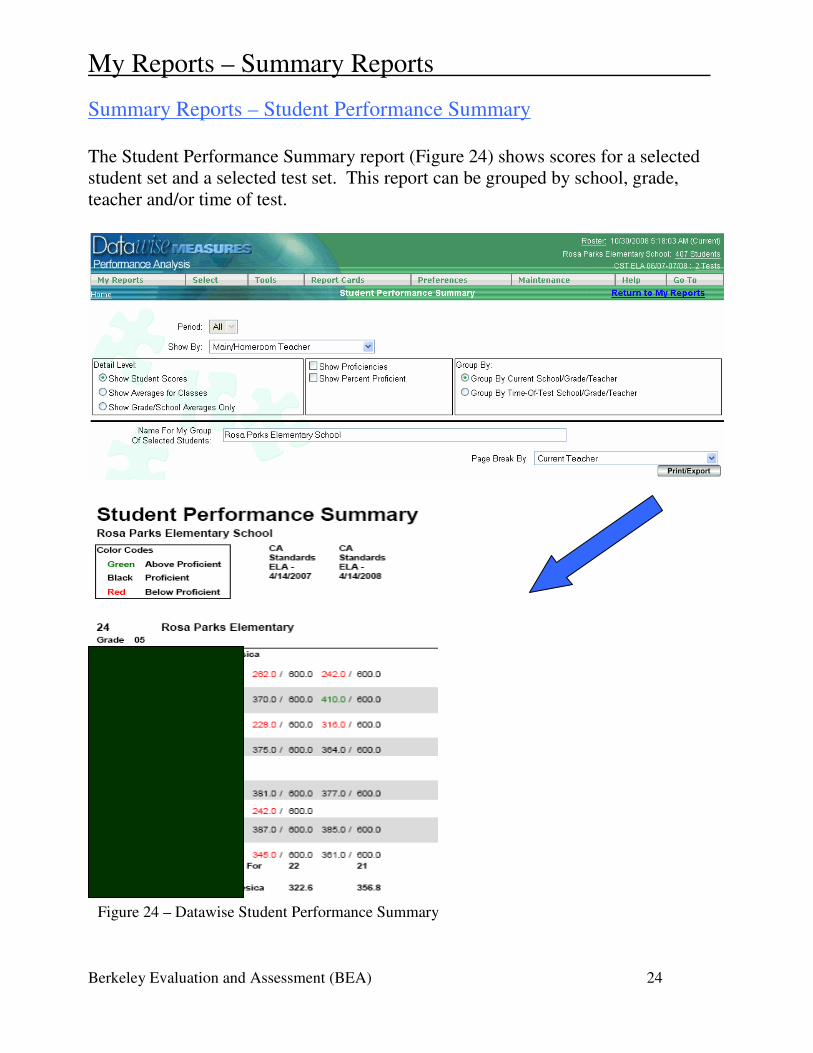
Summary Reports – Student Performance Summary
The Student Performance Summary report (Figure 24) shows scores for a selected
student set and a selected test set. This report can be grouped by school, grade,
teacher and/or time of test.
Figure 24 – Datawise Student Performance Summary
My Reports – One-Click Reports
Berkeley Evaluation and Assessment (BEA) 25
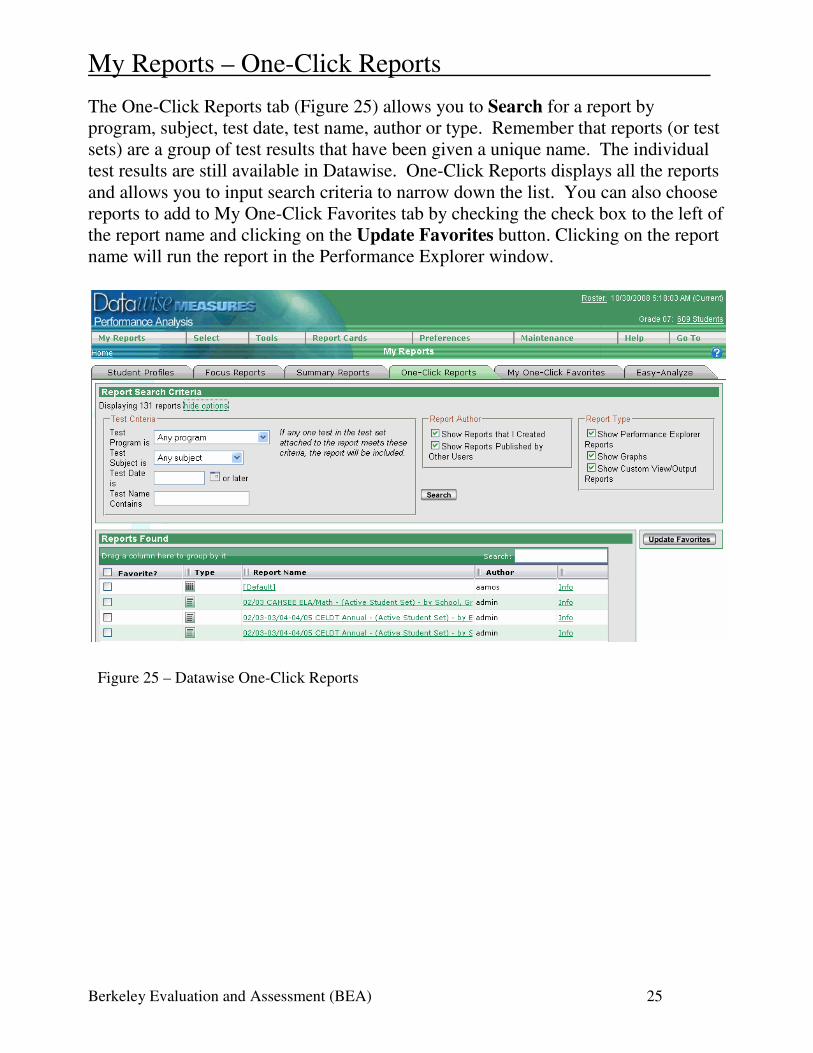
The One-Click Reports tab (Figure 25) allows you to Search for a report by
program, subject, test date, test name, author or type. Remember that reports (or test
sets) are a group of test results that have been given a unique name. The individual
test results are still available in Datawise. One-Click Reports displays all the reports
and allows you to input search criteria to narrow down the list. You can also choose
reports to add to My One-Click Favorites tab by checking the check box to the left of
the report name and clicking on the Update Favorites button. Clicking on the report
name will run the report in the Performance Explorer window.
Figure 25 – Datawise One-Click Reports
My Reports – My One-Click Favorites
Berkeley Evaluation and Assessment (BEA) 26
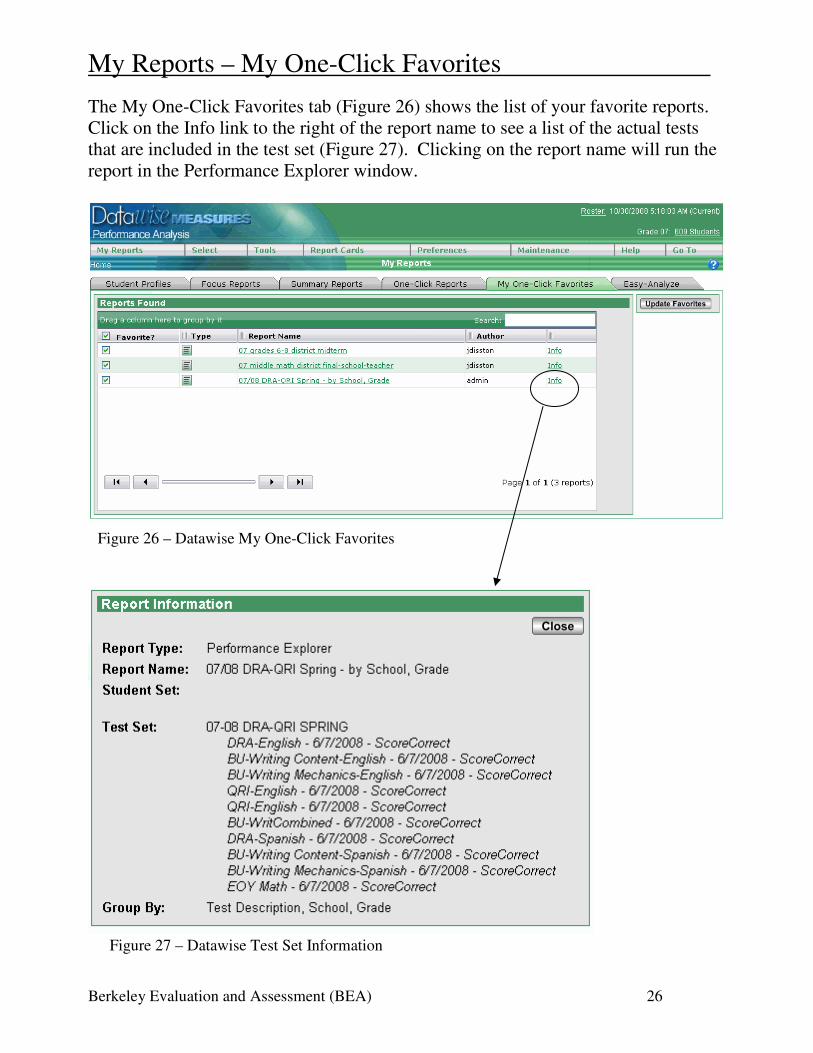
The My One-Click Favorites tab (Figure 26) shows the list of your favorite reports.
Click on the Info link to the right of the report name to see a list of the actual tests
that are included in the test set (Figure 27). Clicking on the report name will run the
report in the Performance Explorer window.
Figure 26 – Datawise My One-Click Favorites
Figure 27 – Datawise Test Set Information
My Reports – Easy-Analyze
Berkeley Evaluation and Assessment (BEA) 27
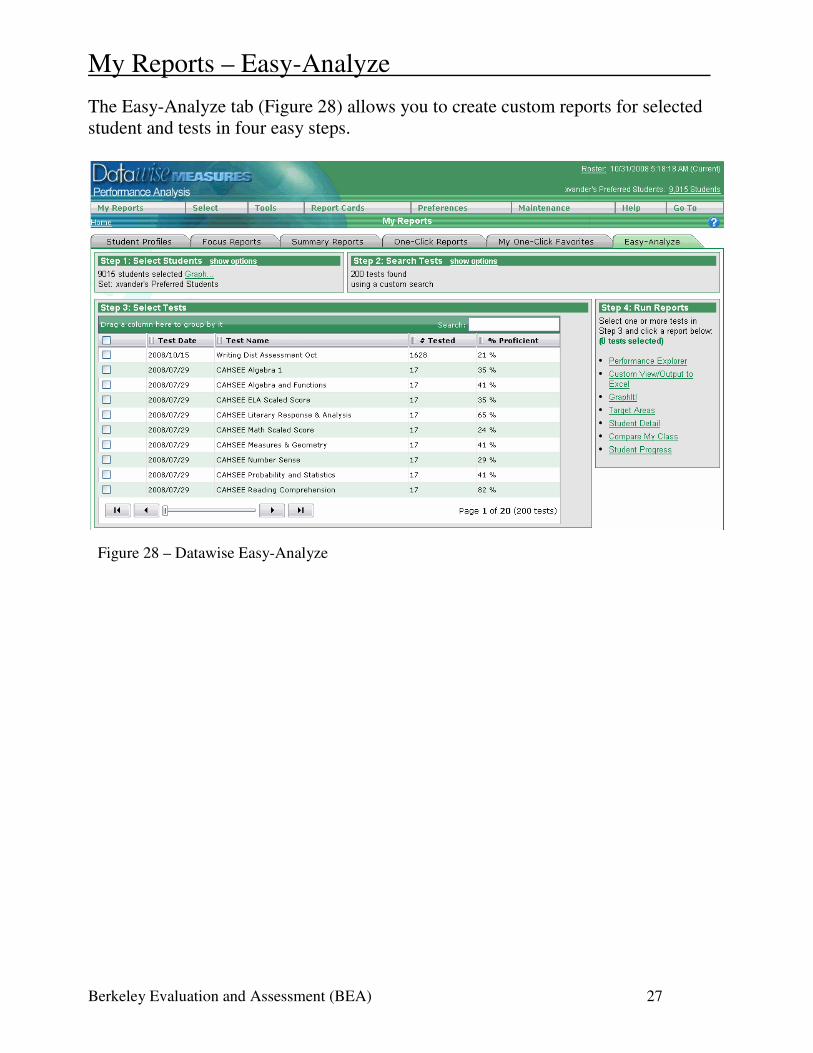
The Easy-Analyze tab (Figure 28) allows you to create custom reports for selected
student and tests in four easy steps.
Figure 28 – Datawise Easy-Analyze
My Reports – Easy-Analyze
Berkeley Evaluation and Assessment (BEA) 28
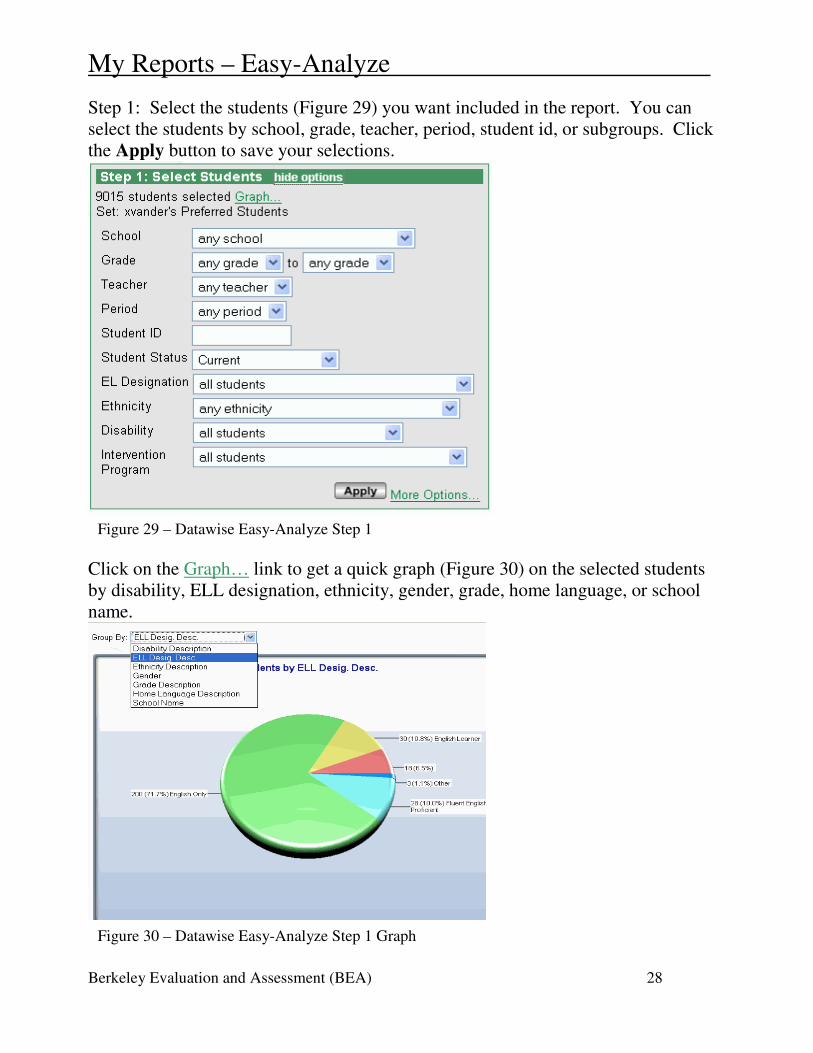
Step 1: Select the students (Figure 29) you want included in the report. You can
select the students by school, grade, teacher, period, student id, or subgroups. Click
the Apply button to save your selections.
Click on the Graph… link to get a quick graph (Figure 30) on the selected students
by disability, ELL designation, ethnicity, gender, grade, home language, or school
name.
Figure 29 – Datawise Easy-Analyze Step 1
Figure 30 – Datawise Easy-Analyze Step 1 Graph
My Reports – Easy-Analyze
Berkeley Evaluation and Assessment (BEA) 29
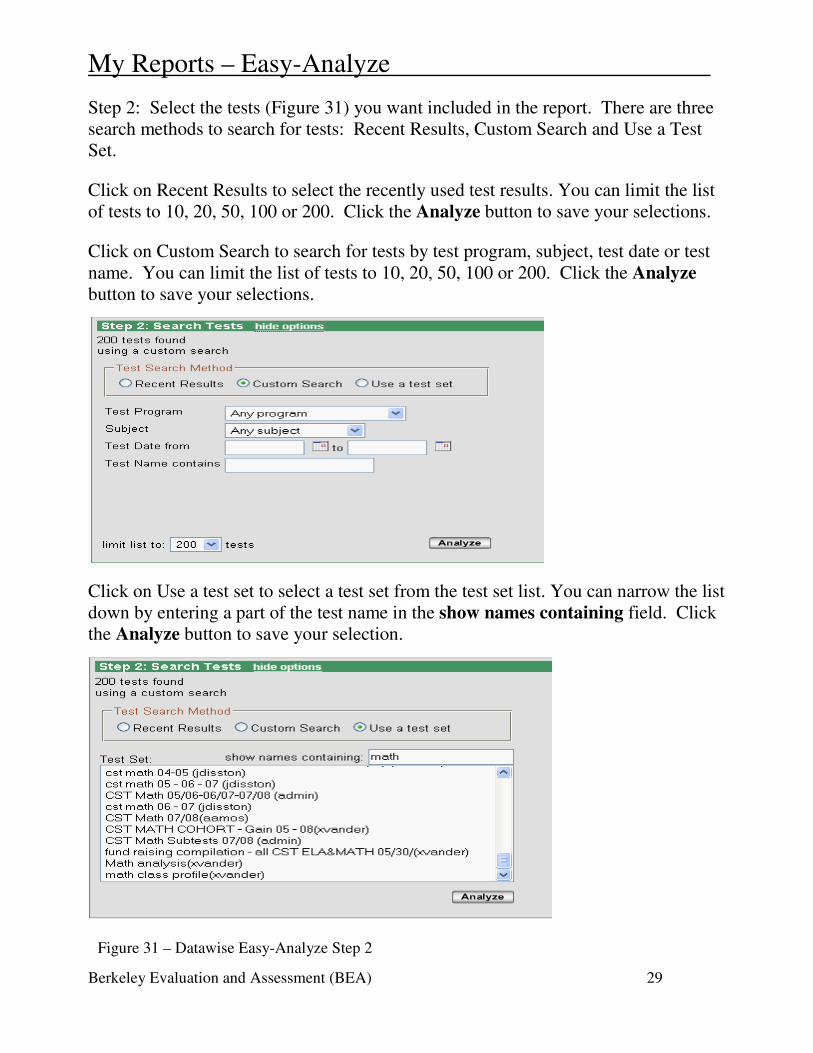
Step 2: Select the tests (Figure 31) you want included in the report. There are three
search methods to search for tests: Recent Results, Custom Search and Use a Test
Set.
Click on Recent Results to select the recently used test results. You can limit the list
of tests to 10, 20, 50, 100 or 200. Click the Analyze button to save your selections.
Click on Custom Search to search for tests by test program, subject, test date or test
name. You can limit the list of tests to 10, 20, 50, 100 or 200. Click the Analyze
button to save your selections.
Click on Use a test set to select a test set from the test set list. You can narrow the list
down by entering a part of the test name in the show names containing field. Click
the Analyze button to save your selection.
Figure 31 – Datawise Easy-Analyze Step 2
My Reports – Easy-Analyze
Berkeley Evaluation and Assessment (BEA) 30
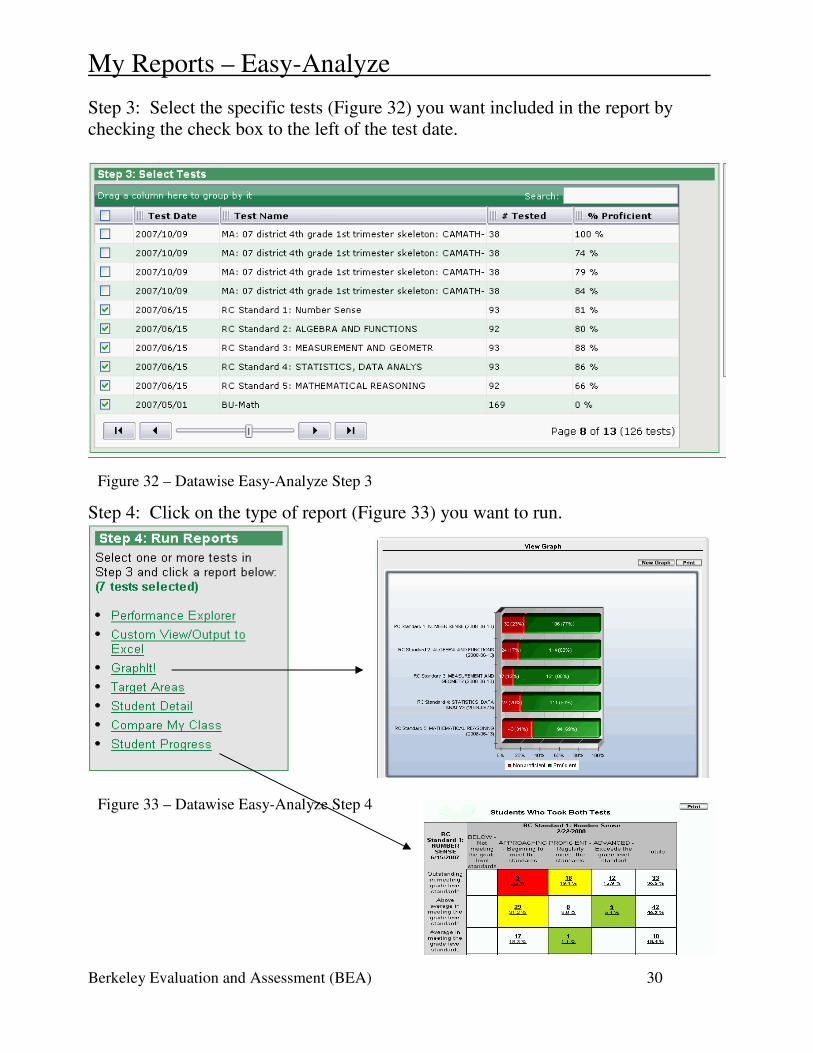
Step 3: Select the specific tests (Figure 32) you want included in the report by
checking the check box to the left of the test date.
Step 4: Click on the type of report (Figure 33) you want to run.
Figure 32 – Datawise Easy-Analyze Step 3
Figure 33 – Datawise Easy-Analyze Step 4
GraphIt!
Berkeley Evaluation and Assessment (BEA) 31
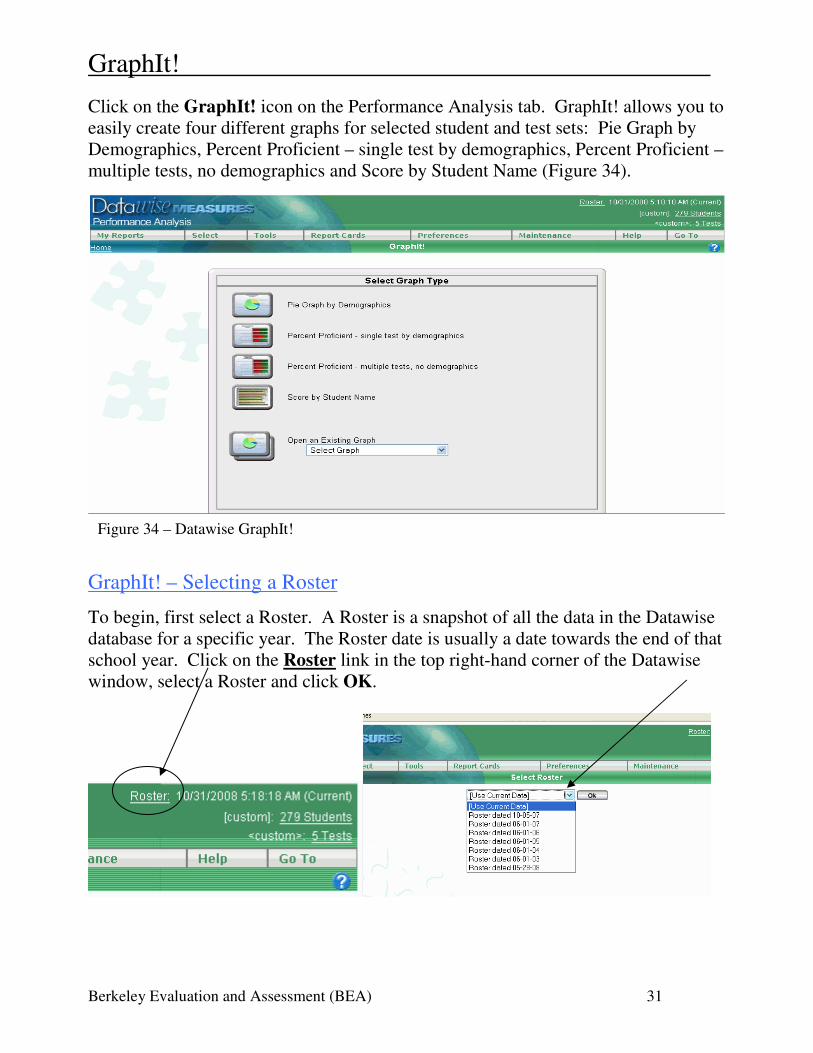
Click on the GraphIt! icon on the Performance Analysis tab. GraphIt! allows you to
easily create four different graphs for selected student and test sets: Pie Graph by
Demographics, Percent Proficient – single test by demographics, Percent Proficient –
multiple tests, no demographics and Score by Student Name (Figure 34).
GraphIt! – Selecting a Roster
To begin, first select a Roster. A Roster is a snapshot of all the data in the Datawise
database for a specific year. The Roster date is usually a date towards the end of that
school year. Click on the Roster link in the top right-hand corner of the Datawise
window, select a Roster and click OK.
Figure 34 – Datawise GraphIt!
GraphIt!
Berkeley Evaluation and Assessment (BEA) 32
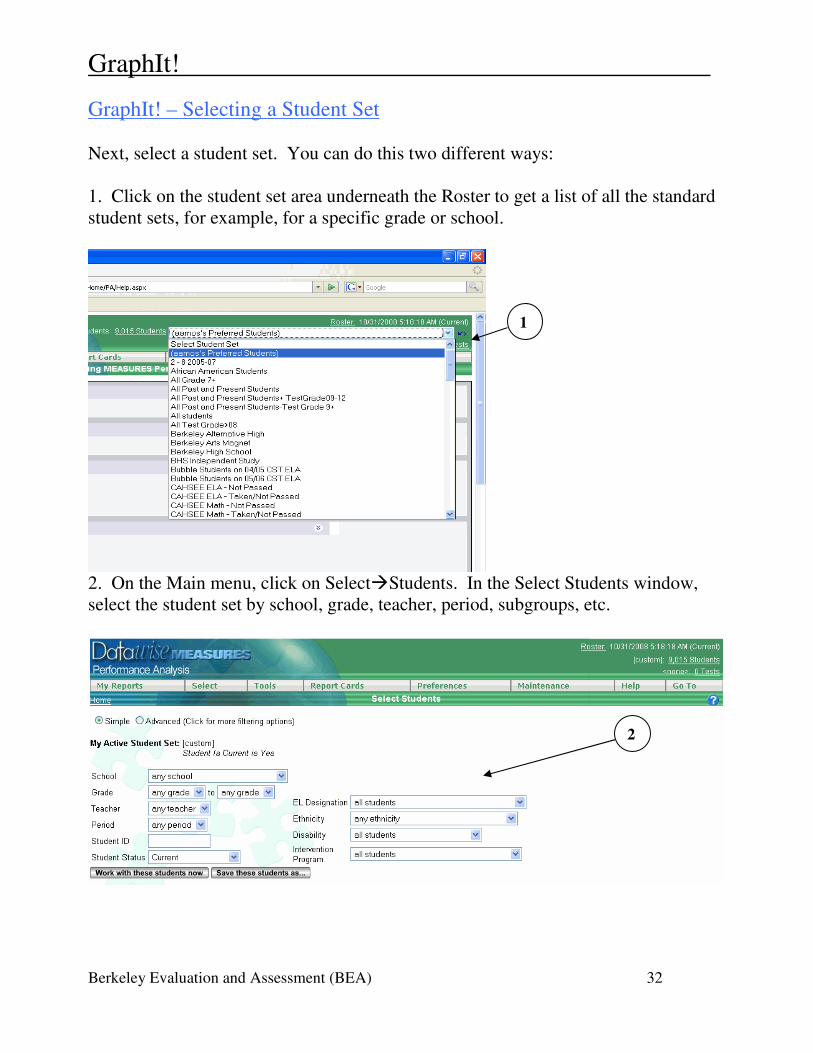
GraphIt! – Selecting a Student Set
Next, select a student set. You can do this two different ways:
1. Click on the student set area underneath the Roster to get a list of all the standard
student sets, for example, for a specific grade or school.
2. On the Main menu, click on Select�Students. In the Select Students window,
select the student set by school, grade, teacher, period, subgroups, etc.
1
2
GraphIt!
Berkeley Evaluation and Assessment (BEA) 33
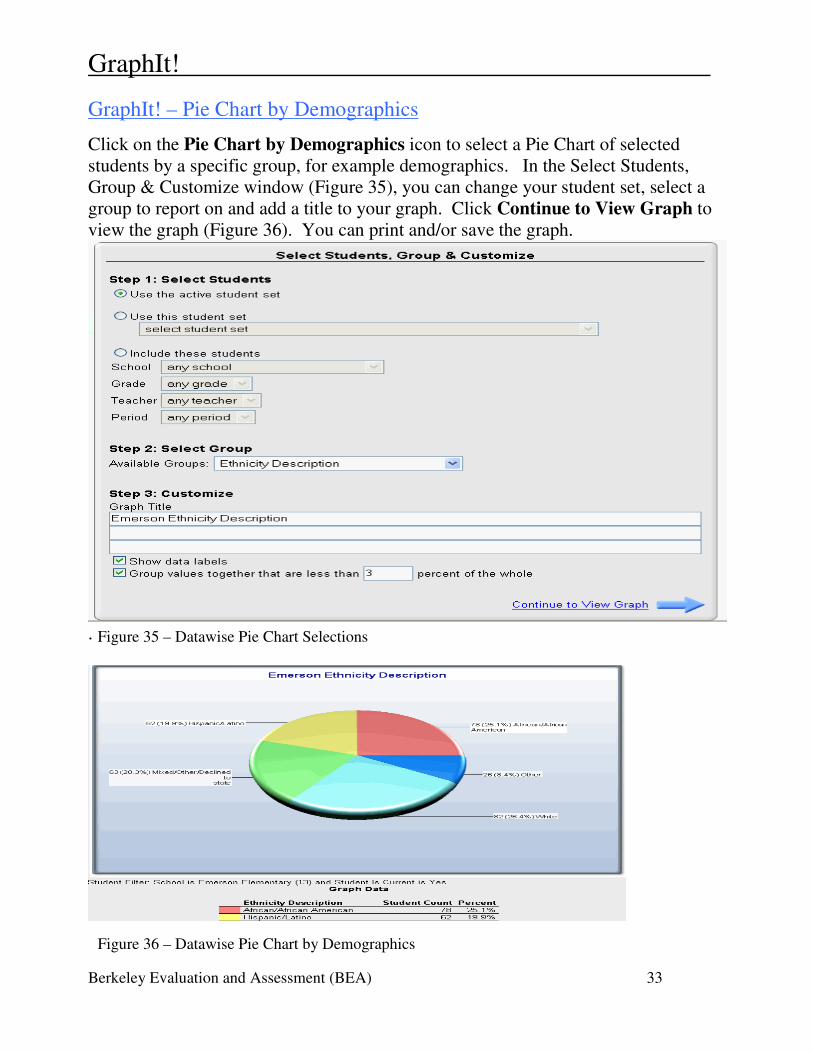
GraphIt! – Pie Chart by Demographics
Click on the Pie Chart by Demographics icon to select a Pie Chart of selected
students by a specific group, for example demographics. In the Select Students,
Group & Customize window (Figure 35), you can change your student set, select a
group to report on and add a title to your graph. Click Continue to View Graph to
view the graph (Figure 36). You can print and/or save the graph.
.
Figure 35 – Datawise Pie Chart Selections
Figure 36 – Datawise Pie Chart by Demographics
GraphIt!
Berkeley Evaluation and Assessment (BEA) 34
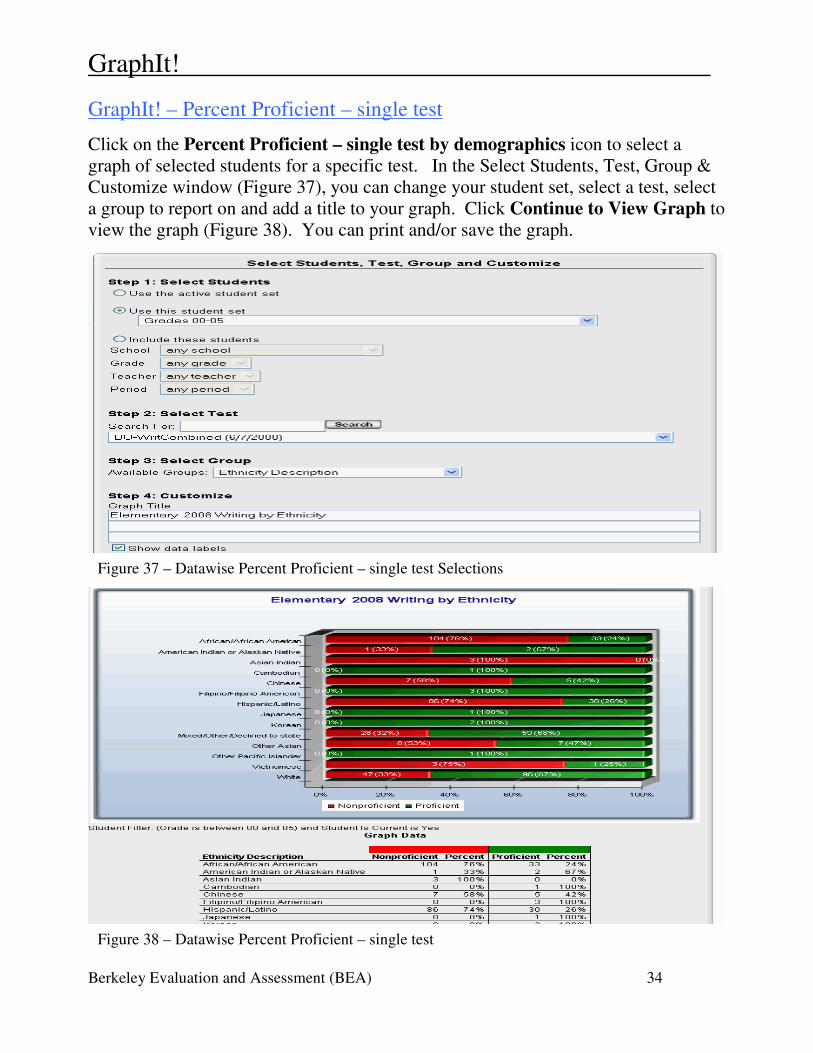
GraphIt! – Percent Proficient – single test
Click on the Percent Proficient – single test by demographics icon to select a
graph of selected students for a specific test. In the Select Students, Test, Group &
Customize window (Figure 37), you can change your student set, select a test, select
a group to report on and add a title to your graph. Click Continue to View Graph to
view the graph (Figure 38). You can print and/or save the graph.
Figure 37 – Datawise Percent Proficient – single test Selections
Figure 38 – Datawise Percent Proficient – single test
GraphIt!
Berkeley Evaluation and Assessment (BEA) 35
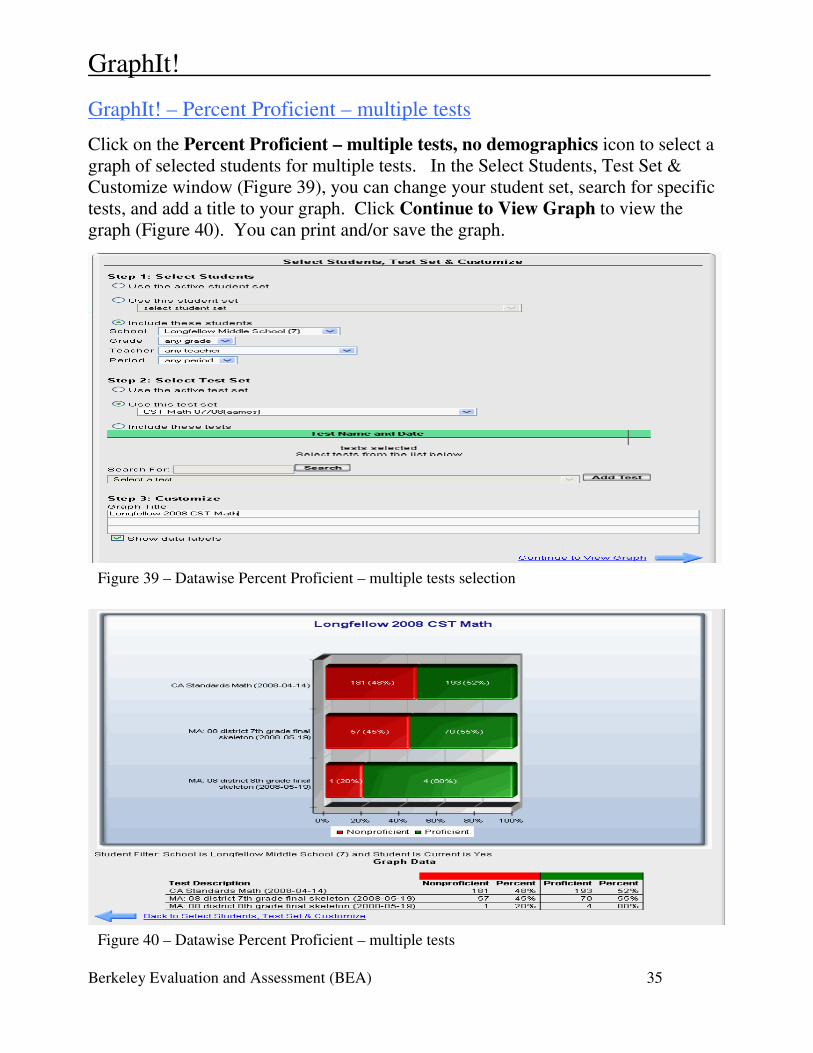
GraphIt! – Percent Proficient – multiple tests
Click on the Percent Proficient – multiple tests, no demographics icon to select a
graph of selected students for multiple tests. In the Select Students, Test Set &
Customize window (Figure 39), you can change your student set, search for specific
tests, and add a title to your graph. Click Continue to View Graph to view the
graph (Figure 40). You can print and/or save the graph.
Figure 39 – Datawise Percent Proficient – multiple tests selection
Figure 40 – Datawise Percent Proficient – multiple tests
GraphIt!
Berkeley Evaluation and Assessment (BEA) 36
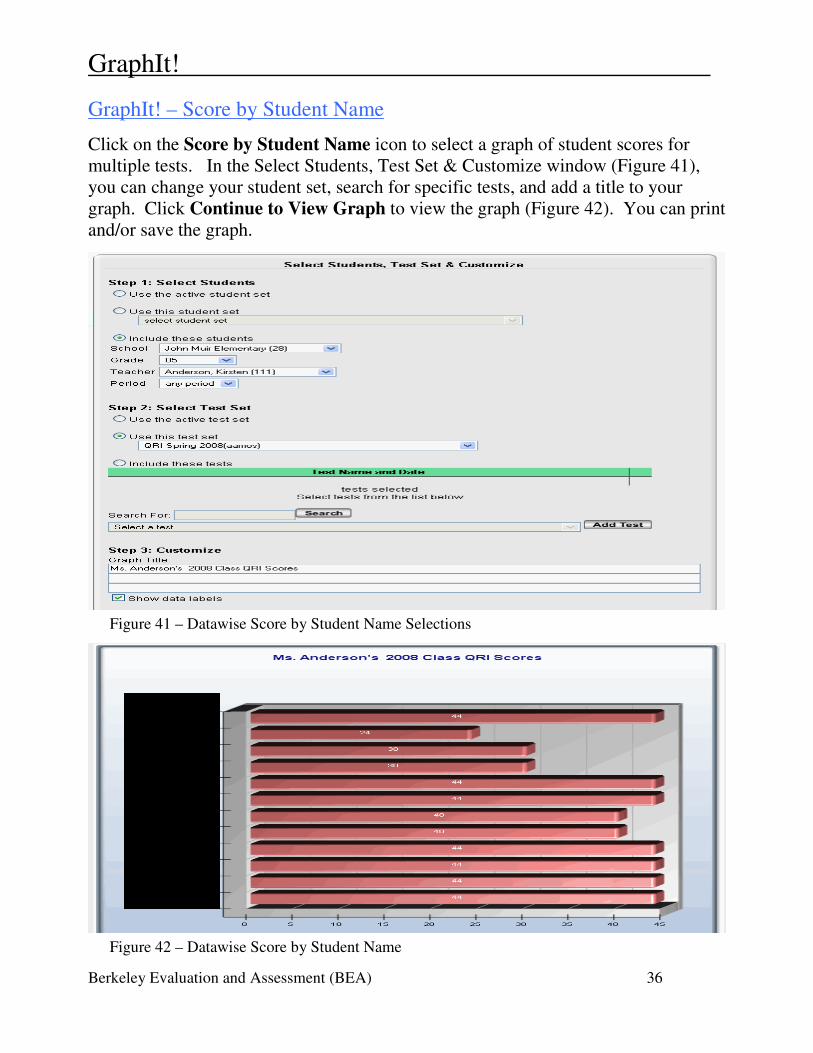
GraphIt! – Score by Student Name
Click on the Score by Student Name icon to select a graph of student scores for
multiple tests. In the Select Students, Test Set & Customize window (Figure 41),
you can change your student set, search for specific tests, and add a title to your
graph. Click Continue to View Graph to view the graph (Figure 42). You can print
and/or save the graph.
Figure 41 – Datawise Score by Student Name Selections
Figure 42 – Datawise Score by Student Name
GraphIt!
Berkeley Evaluation and Assessment (BEA) 37
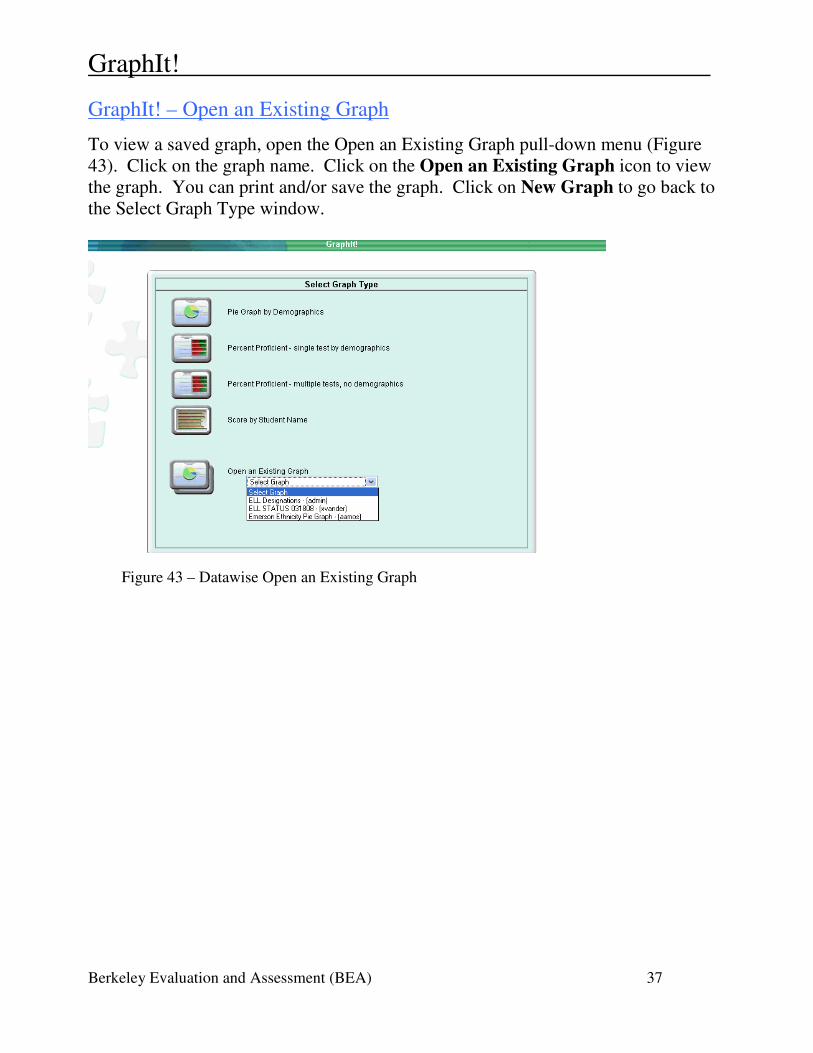
GraphIt! – Open an Existing Graph
To view a saved graph, open the Open an Existing Graph pull-down menu (Figure
43). Click on the graph name. Click on the Open an Existing Graph icon to view
the graph. You can print and/or save the graph. Click on New Graph to go back to
the Select Graph Type window.
Figure 43 – Datawise Open an Existing Graph
Ad hoc Reports
Berkeley Evaluation and Assessment (BEA) 38
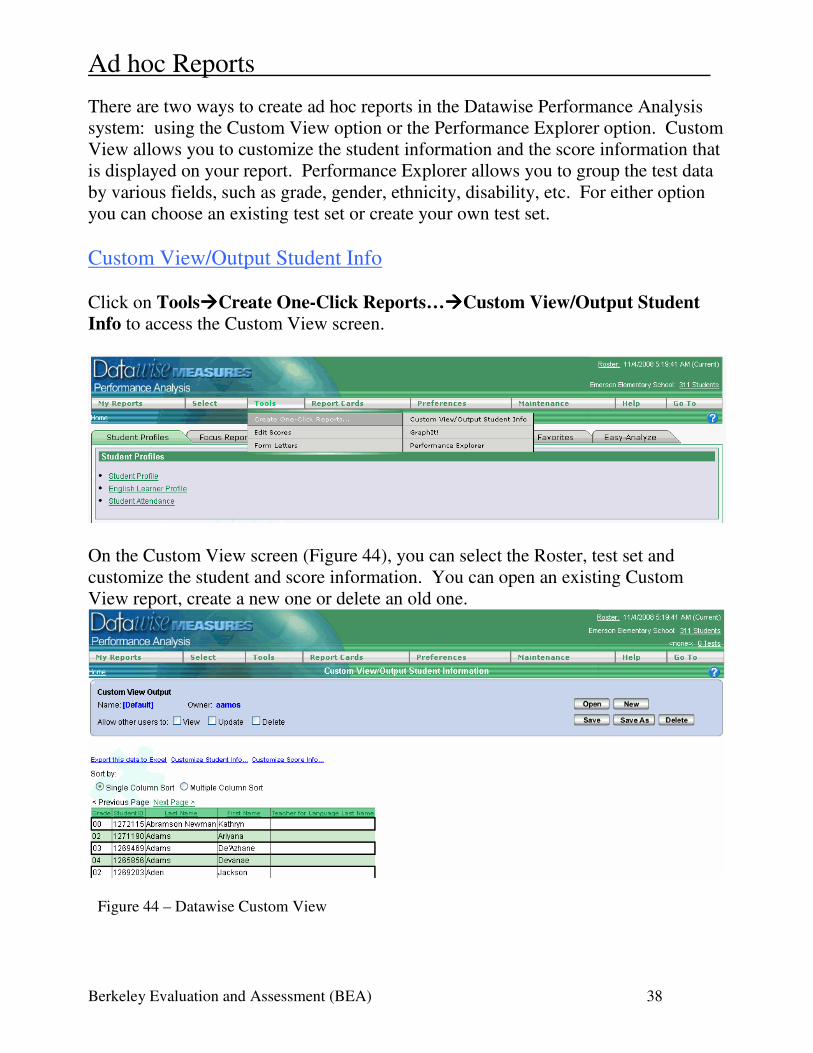
There are two ways to create ad hoc reports in the Datawise Performance Analysis
system: using the Custom View option or the Performance Explorer option. Custom
View allows you to customize the student information and the score information that
is displayed on your report. Performance Explorer allows you to group the test data
by various fields, such as grade, gender, ethnicity, disability, etc. For either option
you can choose an existing test set or create your own test set.
Custom View/Output Student Info
Click on Tools����Create One-Click Reports…����Custom View/Output Student
Info to access the Custom View screen.
On the Custom View screen (Figure 44), you can select the Roster, test set and
customize the student and score information. You can open an existing Custom
View report, create a new one or delete an old one.
Figure 44 – Datawise Custom View

Ad hoc Reports
Berkeley Evaluation and Assessment (BEA) 39
Custom View/Output Student Info (cont’d)
To customize the Student Info, click on the blue Customize Student Info… link.
In the Students window (Figure 45), you can choose which columns you want on
your ad hoc report.
To remove a column, check the checkbox to the left of the column name in the
Selected Columns area on the right-hand side of the Students window. To
select/unselect all the columns, check the checkbox to the left of Column Name.
Once you’ve checked the columns you want to remove, click on the <<Remove
button. Click on the Ok button to save your changes.
To add a column, check the checkbox to the left of the column name in the Available
Columns area on the left-hand side of the Students window. To select/unselect all
the columns, check the checkbox to the left of Column Name. Once you’ve
checked the columns you want to add, click on the Add>> button. Click on the Ok
button to save your changes.
Figure 45 – Datawise Custom View – Customize Student Information
Check here to
select/unselect all
the columns.
Click on the up and
down arrows to
reorder the columns.
Ad hoc Reports
Berkeley Evaluation and Assessment (BEA) 40
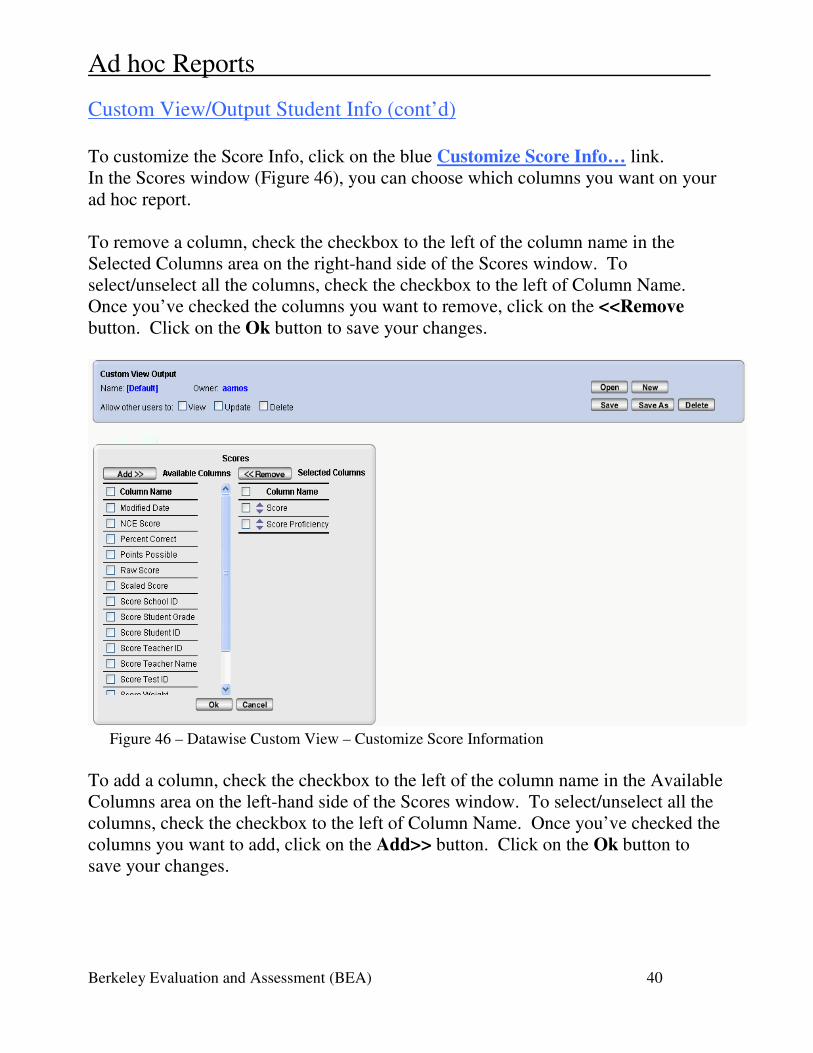
Custom View/Output Student Info (cont’d)
To customize the Score Info, click on the blue Customize Score Info… link.
In the Scores window (Figure 46), you can choose which columns you want on your
ad hoc report.
To remove a column, check the checkbox to the left of the column name in the
Selected Columns area on the right-hand side of the Scores window. To
select/unselect all the columns, check the checkbox to the left of Column Name.
Once you’ve checked the columns you want to remove, click on the <<Remove
button. Click on the Ok button to save your changes.
To add a column, check the checkbox to the left of the column name in the Available
Columns area on the left-hand side of the Scores window. To select/unselect all the
columns, check the checkbox to the left of Column Name. Once you’ve checked the
columns you want to add, click on the Add>> button. Click on the Ok button to
save your changes.
Figure 46 – Datawise Custom View – Customize Score Information
Ad hoc Reports
Berkeley Evaluation and Assessment (BEA) 41
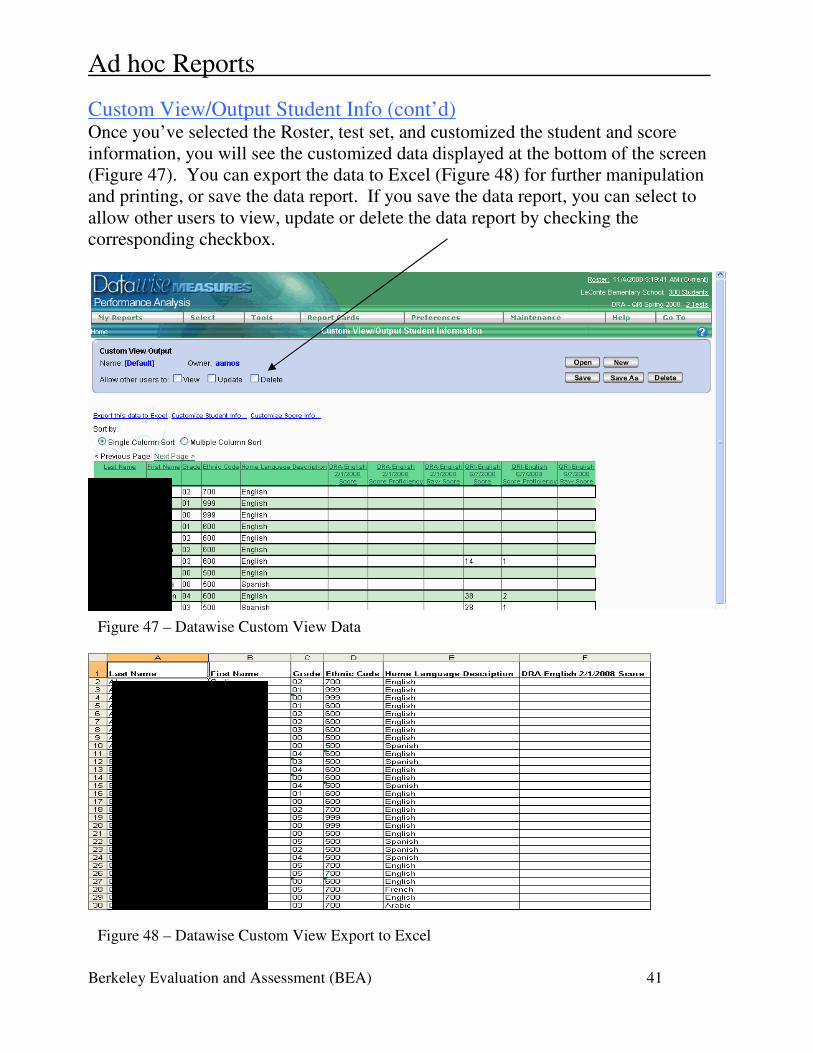
Custom View/Output Student Info (cont’d) Once you’ve selected the Roster, test set, and customized the student and score
information, you will see the customized data displayed at the bottom of the screen
(Figure 47). You can export the data to Excel (Figure 48) for further manipulation
and printing, or save the data report. If you save the data report, you can select to
allow other users to view, update or delete the data report by checking the
corresponding checkbox.
Figure 47 – Datawise Custom View Data
Figure 48 – Datawise Custom View Export to Excel
Ad hoc Reports
Berkeley Evaluation and Assessment (BEA) 42
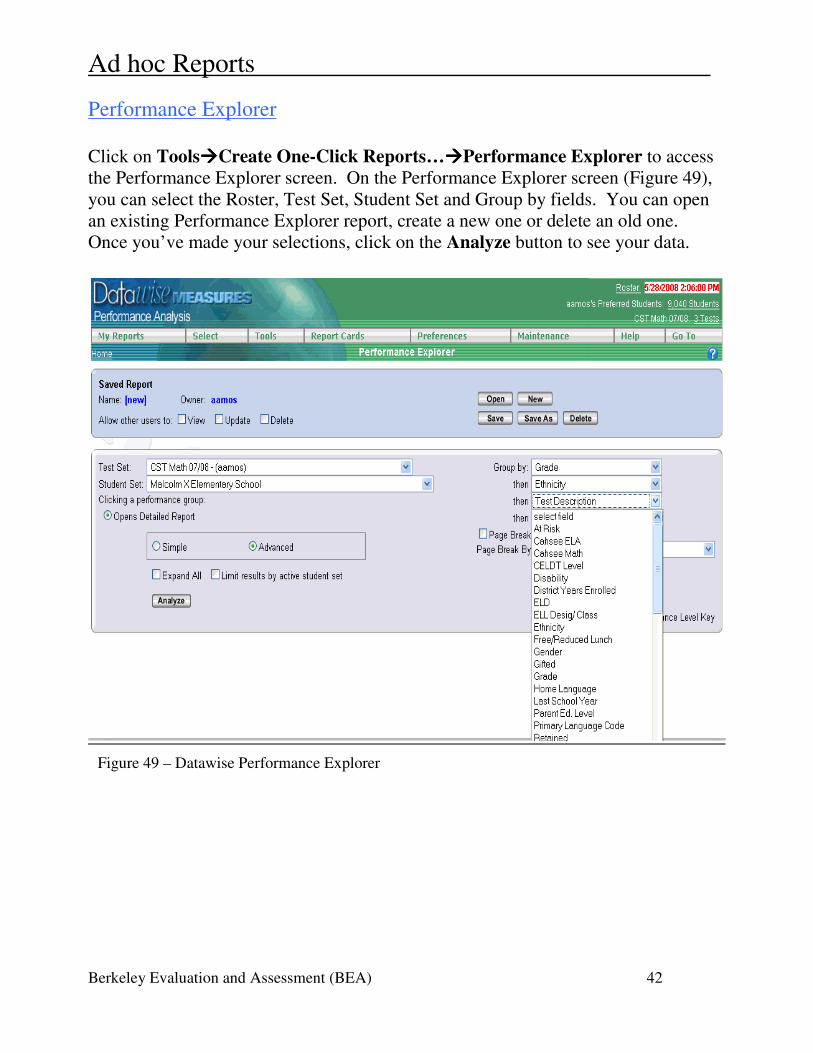
Performance Explorer
Click on Tools����Create One-Click Reports…����Performance Explorer to access
the Performance Explorer screen. On the Performance Explorer screen (Figure 49),
you can select the Roster, Test Set, Student Set and Group by fields. You can open
an existing Performance Explorer report, create a new one or delete an old one.
Once you’ve made your selections, click on the Analyze button to see your data.
Figure 49 – Datawise Performance Explorer
Ad hoc Reports
Berkeley Evaluation and Assessment (BEA) 43
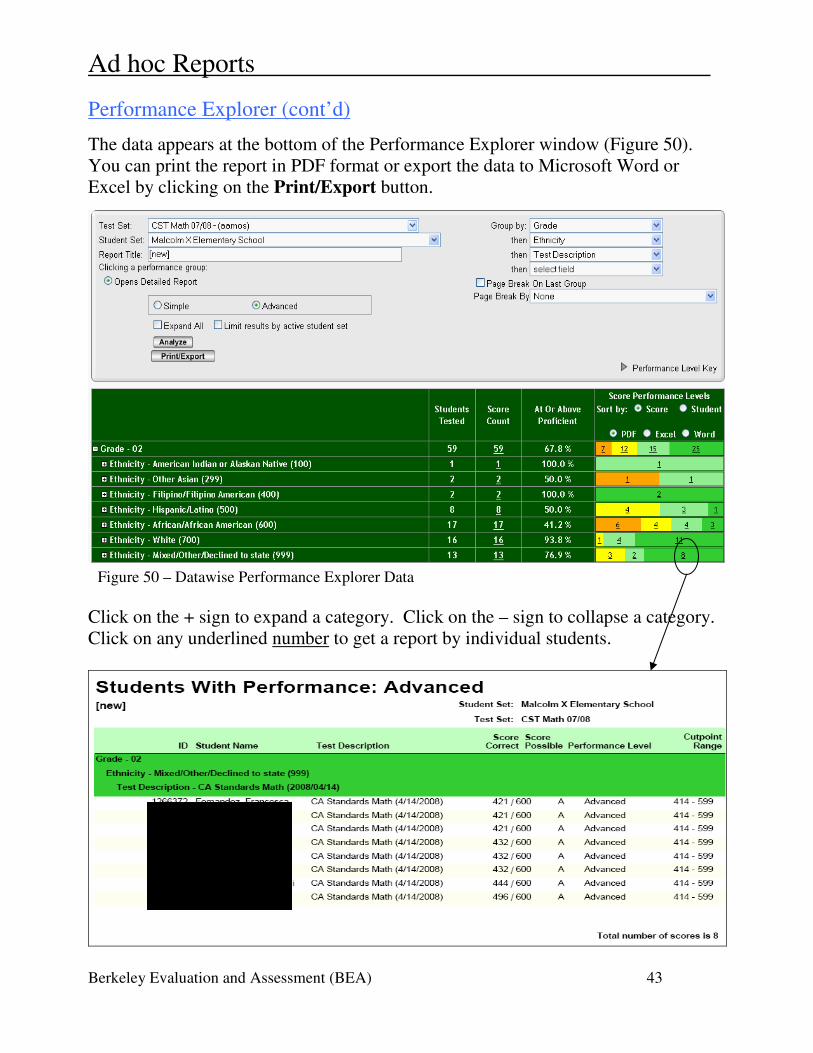
Performance Explorer (cont’d)
The data appears at the bottom of the Performance Explorer window (Figure 50).
You can print the report in PDF format or export the data to Microsoft Word or
Excel by clicking on the Print/Export button.
Click on the + sign to expand a category. Click on the – sign to collapse a category.
Click on any underlined number to get a report by individual students.
Figure 50 – Datawise Performance Explorer Data
Ad hoc Reports
Berkeley Evaluation and Assessment (BEA) 44
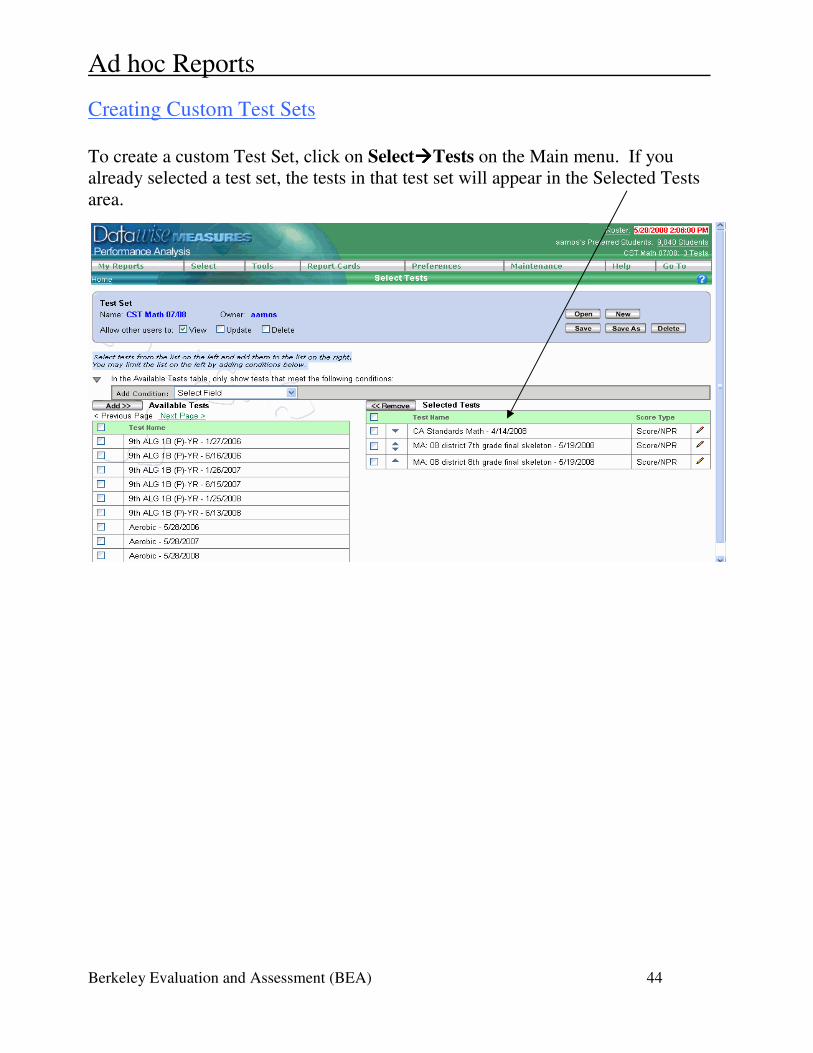
Creating Custom Test Sets
To create a custom Test Set, click on Select����Tests on the Main menu. If you
already selected a test set, the tests in that test set will appear in the Selected Tests
area.
Ad hoc Reports
Berkeley Evaluation and Assessment (BEA) 45
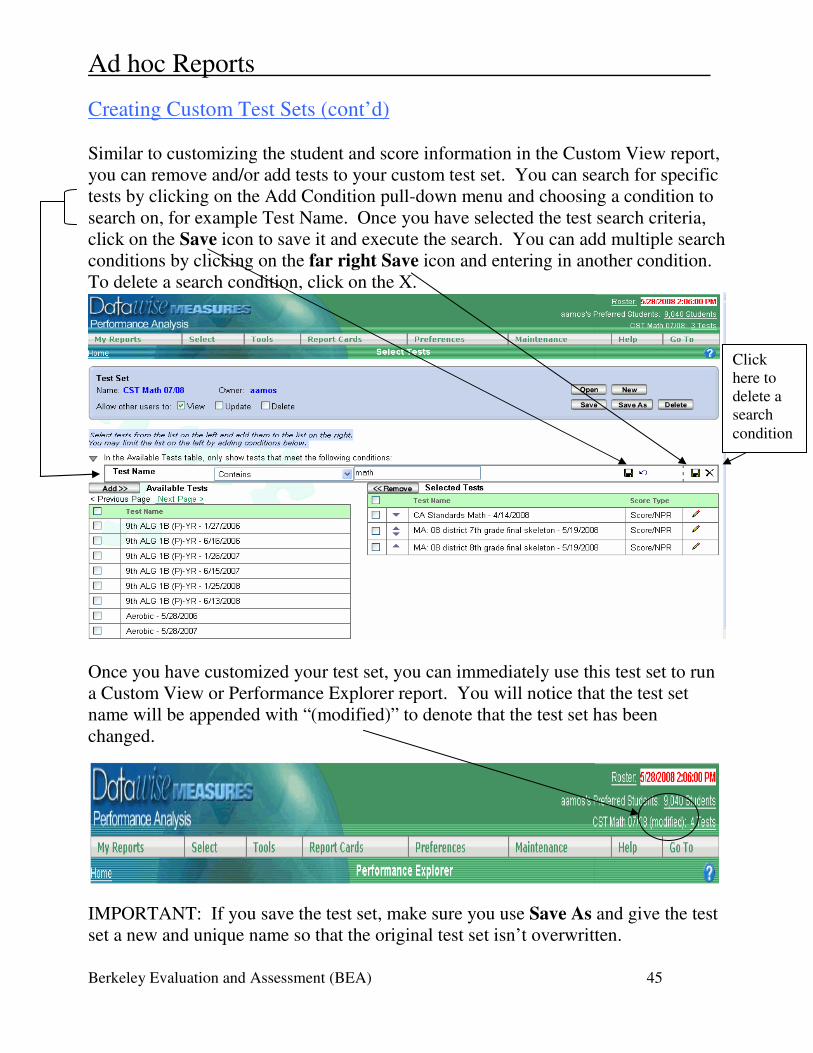
Creating Custom Test Sets (cont’d)
Similar to customizing the student and score information in the Custom View report,
you can remove and/or add tests to your custom test set. You can search for specific
tests by clicking on the Add Condition pull-down menu and choosing a condition to
search on, for example Test Name. Once you have selected the test search criteria,
click on the Save icon to save it and execute the search. You can add multiple search
conditions by clicking on the far right Save icon and entering in another condition.
To delete a search condition, click on the X.
Once you have customized your test set, you can immediately use this test set to run
a Custom View or Performance Explorer report. You will notice that the test set
name will be appended with “(modified)” to denote that the test set has been
changed.
IMPORTANT: If you save the test set, make sure you use Save As and give the test
set a new and unique name so that the original test set isn’t overwritten.
Click
here to
delete a
search
condition
Logging Out
Berkeley Evaluation and Assessment (BEA) 46
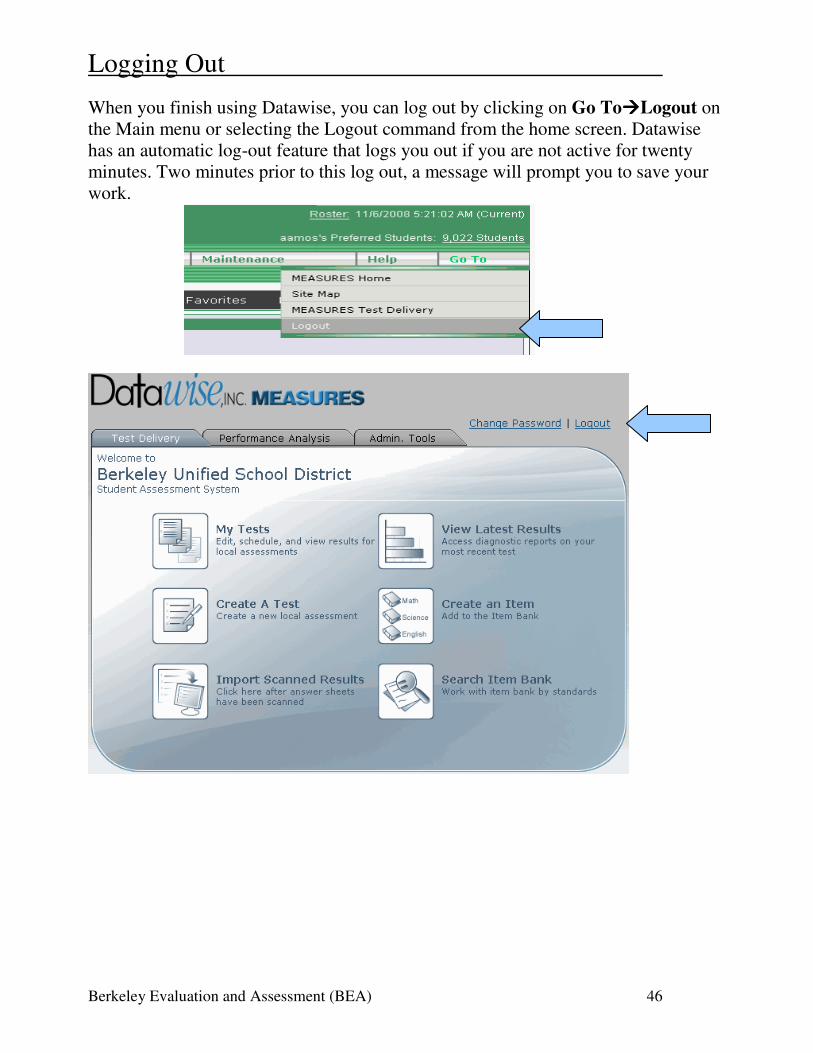
When you finish using Datawise, you can log out by clicking on Go To����Logout on
the Main menu or selecting the Logout command from the home screen. Datawise
has an automatic log-out feature that logs you out if you are not active for twenty
minutes. Two minutes prior to this log out, a message will prompt you to save your
work.